- Phân tích
- Tin tức và các công cụ
- Tin tức thị trường
- USD/JPY declines on soft US jobs data, eyes on Trump
USD/JPY declines on soft US jobs data, eyes on Trump
- USD/JPY retreats from six-day high as U.S. Initial Jobless Claims suggest labor market cooling.
- Bank of Japan meeting likely to see 25 basis point rate hike, contrasting with Fed's steady stance.
- Global markets await Trump's Davos comments, with trade policy rhetoric set to influence currencies.
The USD/JPY slides during the North American session after hitting a six-day high of 156.75, as labor market data revealed in the United States (US) came worse than expected. At the time of writing, the pair trades at 156.28, down 0.19%.
Japanese Yen appreciates ahead BoJ’s policy decision
The US Department of Labor revealed that Initial Jobless Claims for the week ended January 18 increased, to 223K, exceeding forecasts of 220K. Labor market strength and rising inflation figures had prompted the Federal Reserve from continuing to easing policy, alongside uncertainty regarding the new fiscal policy applied by the Trump administration.
Even though the Fed is expected to keep rates unchanged at the next week’s meeting, the Bank of Japan (BoJ) most likely raise rates by 25 basis points (bps), which would be the highest since 2007 at the January 23-24 meeting. Several senior BoJ officials expressed confidence on wage growth momentum.
In the meantime, the lack of economic data in the US and Japan would keep traders eyeing the US President Donald Trump appearance at the Davos World Economic Form (WEF). His trade policy rhetoric has sent waves across global financial makers,
USD/JPY Price Forecast: Technical outlook
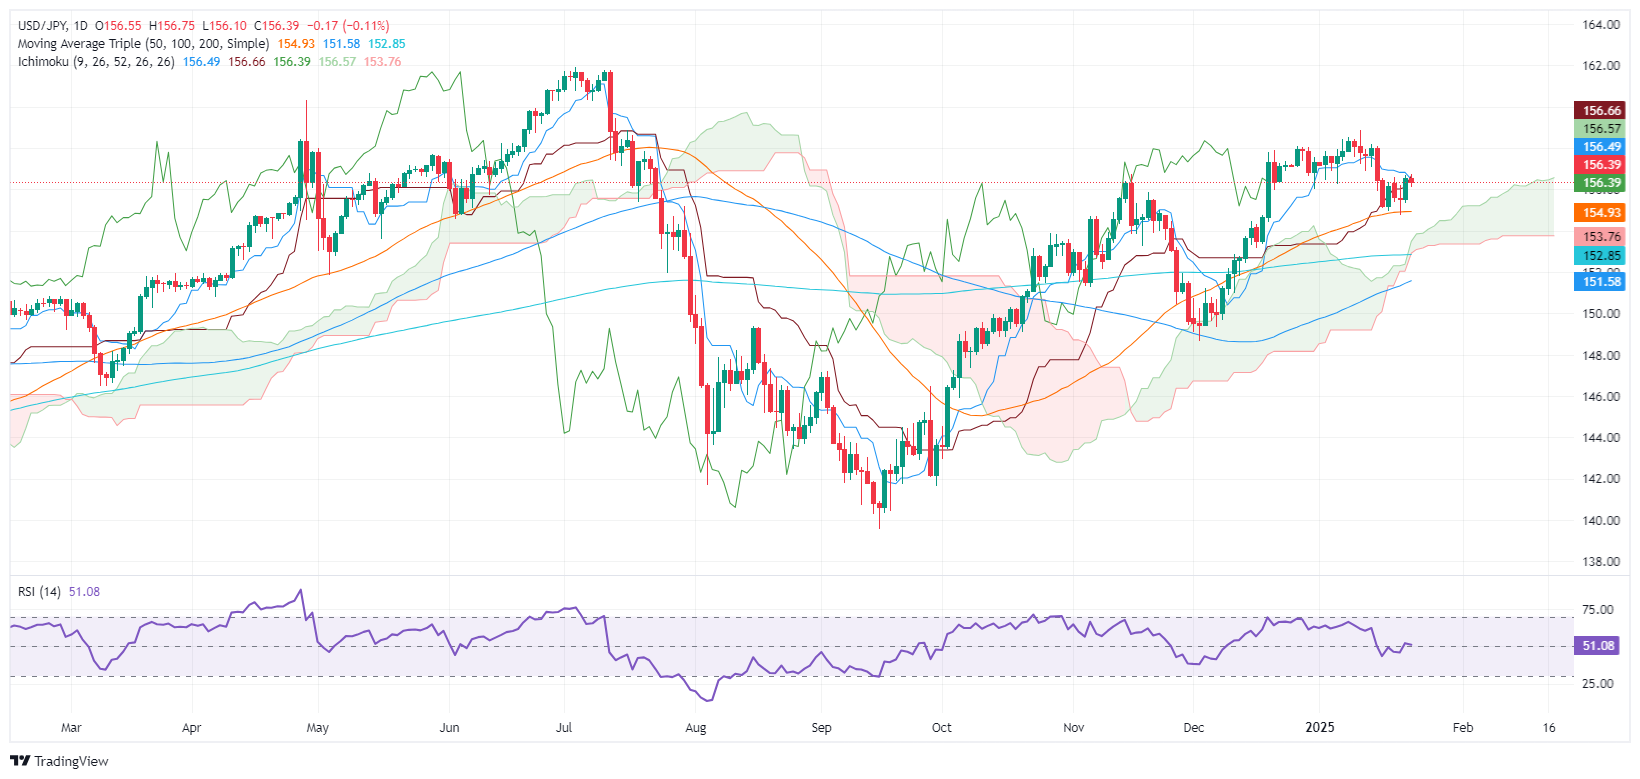
The USD/JPY has found stir resistance at the 157.00 figure with bulls unable to crack it since sliding below the latter on January 15. Momentum seems to favor sellers, as spot prices lie beneath the confluence of the Tenkan and Kijun-sen at the 156.64-156.48 range, which if broken, could pave the way for further downside. The next key support will be the January 22 low of 155.33, followed by January 21 swing low of 154.75.
Japanese Yen PRICE Today
The table below shows the percentage change of Japanese Yen (JPY) against listed major currencies today. Japanese Yen was the strongest against the Swiss Franc.
| USD | EUR | GBP | JPY | CAD | AUD | NZD | CHF | |
|---|---|---|---|---|---|---|---|---|
| USD | 0.17% | -0.00% | -0.09% | -0.04% | 0.05% | 0.08% | 0.27% | |
| EUR | -0.17% | -0.18% | -0.28% | -0.21% | -0.12% | -0.09% | 0.10% | |
| GBP | 0.00% | 0.18% | -0.10% | -0.03% | 0.06% | 0.09% | 0.28% | |
| JPY | 0.09% | 0.28% | 0.10% | 0.06% | 0.16% | 0.15% | 0.37% | |
| CAD | 0.04% | 0.21% | 0.03% | -0.06% | 0.10% | 0.12% | 0.31% | |
| AUD | -0.05% | 0.12% | -0.06% | -0.16% | -0.10% | 0.03% | 0.21% | |
| NZD | -0.08% | 0.09% | -0.09% | -0.15% | -0.12% | -0.03% | 0.19% | |
| CHF | -0.27% | -0.10% | -0.28% | -0.37% | -0.31% | -0.21% | -0.19% |
The heat map shows percentage changes of major currencies against each other. The base currency is picked from the left column, while the quote currency is picked from the top row. For example, if you pick the Japanese Yen from the left column and move along the horizontal line to the US Dollar, the percentage change displayed in the box will represent JPY (base)/USD (quote).


© 2000-2026. Bản quyền Teletrade.
Trang web này được quản lý bởi Teletrade D.J. LLC 2351 LLC 2022 (Euro House, Richmond Hill Road, Kingstown, VC0100, St. Vincent and the Grenadines).
Thông tin trên trang web không phải là cơ sở để đưa ra quyết định đầu tư và chỉ được cung cấp cho mục đích làm quen.
Giao dịch trên thị trường tài chính (đặc biệt là giao dịch sử dụng các công cụ biên) mở ra những cơ hội lớn và tạo điều kiện cho các nhà đầu tư sẵn sàng mạo hiểm để thu lợi nhuận, tuy nhiên nó mang trong mình nguy cơ rủi ro khá cao. Chính vì vậy trước khi tiến hành giao dịch cần phải xem xét mọi mặt vấn đề chấp nhận tiến hành giao dịch cụ thể xét theo quan điểm của nguồn lực tài chính sẵn có và mức độ am hiểu thị trường tài chính.
Sử dụng thông tin: sử dụng toàn bộ hay riêng biệt các dữ liệu trên trang web của công ty TeleTrade như một nguồn cung cấp thông tin nhất định. Việc sử dụng tư liệu từ trang web cần kèm theo liên kết đến trang teletrade.vn. Việc tự động thu thập số liệu cũng như thông tin từ trang web TeleTrade đều không được phép.
Xin vui lòng liên hệ với pr@teletrade.global nếu có câu hỏi.
ngân hàng