- Phân tích
- Tin tức và các công cụ
- Tin tức thị trường
- GBP/USD Price Forecast: Tests 1.2650 support near nine-day EMA
GBP/USD Price Forecast: Tests 1.2650 support near nine-day EMA
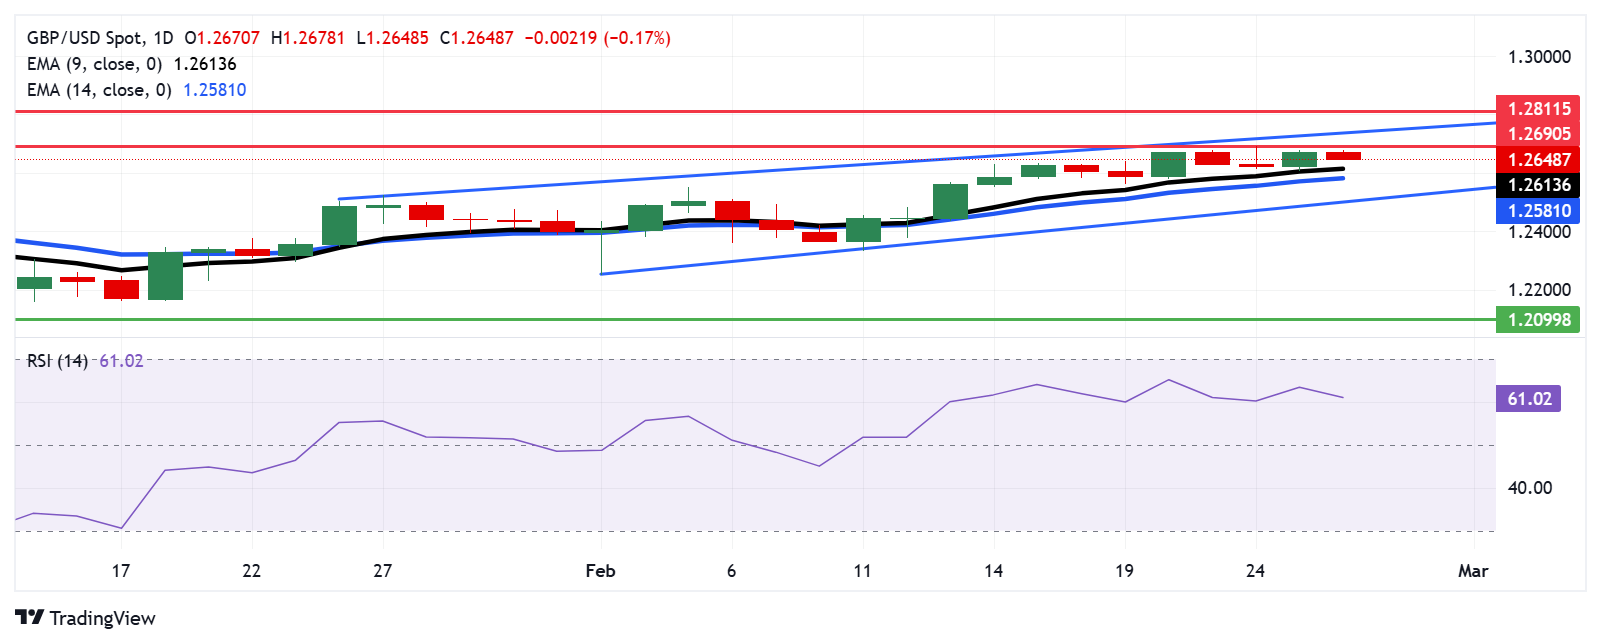
- The GBP/USD pair could target the nine-day EMA support at 1.2613.
- The 14-day RSI remains above the 50 level, indicating sustained bullish momentum.
- The initial resistance appears at the two-month high of 1.2690.
The GBP/USD pair gives up part of its recent gains from the prior session, hovering around 1.2650 during Wednesday’s Asian session. Despite this pullback, technical analysis of the daily chart indicates a sustained bullish outlook, as the pair remains within an ascending channel pattern.
The 14-day Relative Strength Index (RSI) stays above the 50 mark, reflecting strengthened bullish momentum. Additionally, the pair continues to trade above the nine- and 14-day Exponential Moving Averages (EMAs), highlighting robust short-term price dynamics and confirming the prevailing upward trend.
The GBP/USD pair faces immediate resistance at the two-month high of 1.2690, reached on February 24, followed by the ascending channel’s upper boundary around the 1.2750 level. A decisive break above this level could strengthen the bullish outlook, paving the way for a test of the three-month high at 1.2811, last seen on December 6.
On the downside, the GBP/USD pair may find immediate support at the nine-day EMA of 1.2613, followed by the 14-day EMA at 1.2581. A break below these levels could undermine short-term price momentum, pushing the pair toward the ascending channel’s lower boundary around the 1.2500 mark.
GBP/USD: Daily Chart
British Pound PRICE Today
The table below shows the percentage change of British Pound (GBP) against listed major currencies today. British Pound was the weakest against the US Dollar.
| USD | EUR | GBP | JPY | CAD | AUD | NZD | CHF | |
|---|---|---|---|---|---|---|---|---|
| USD | 0.11% | 0.17% | 0.30% | 0.08% | 0.26% | 0.19% | 0.10% | |
| EUR | -0.11% | 0.06% | 0.19% | -0.03% | 0.14% | 0.08% | -0.01% | |
| GBP | -0.17% | -0.06% | 0.11% | -0.08% | 0.09% | 0.03% | -0.06% | |
| JPY | -0.30% | -0.19% | -0.11% | -0.21% | -0.04% | -0.11% | -0.18% | |
| CAD | -0.08% | 0.03% | 0.08% | 0.21% | 0.17% | 0.10% | 0.03% | |
| AUD | -0.26% | -0.14% | -0.09% | 0.04% | -0.17% | -0.06% | -0.14% | |
| NZD | -0.19% | -0.08% | -0.03% | 0.11% | -0.10% | 0.06% | -0.08% | |
| CHF | -0.10% | 0.01% | 0.06% | 0.18% | -0.03% | 0.14% | 0.08% |
The heat map shows percentage changes of major currencies against each other. The base currency is picked from the left column, while the quote currency is picked from the top row. For example, if you pick the British Pound from the left column and move along the horizontal line to the US Dollar, the percentage change displayed in the box will represent GBP (base)/USD (quote).


© 2000-2026. Bản quyền Teletrade.
Trang web này được quản lý bởi Teletrade D.J. LLC 2351 LLC 2022 (Euro House, Richmond Hill Road, Kingstown, VC0100, St. Vincent and the Grenadines).
Thông tin trên trang web không phải là cơ sở để đưa ra quyết định đầu tư và chỉ được cung cấp cho mục đích làm quen.
Giao dịch trên thị trường tài chính (đặc biệt là giao dịch sử dụng các công cụ biên) mở ra những cơ hội lớn và tạo điều kiện cho các nhà đầu tư sẵn sàng mạo hiểm để thu lợi nhuận, tuy nhiên nó mang trong mình nguy cơ rủi ro khá cao. Chính vì vậy trước khi tiến hành giao dịch cần phải xem xét mọi mặt vấn đề chấp nhận tiến hành giao dịch cụ thể xét theo quan điểm của nguồn lực tài chính sẵn có và mức độ am hiểu thị trường tài chính.
Sử dụng thông tin: sử dụng toàn bộ hay riêng biệt các dữ liệu trên trang web của công ty TeleTrade như một nguồn cung cấp thông tin nhất định. Việc sử dụng tư liệu từ trang web cần kèm theo liên kết đến trang teletrade.vn. Việc tự động thu thập số liệu cũng như thông tin từ trang web TeleTrade đều không được phép.
Xin vui lòng liên hệ với pr@teletrade.global nếu có câu hỏi.
ngân hàng