- Phân tích
- Tin tức và các công cụ
- Tin tức thị trường
Tin tức thì trường
(raw materials / closing price /% change)
Oil 63.43 -3.09%
Gold 1,342.40 +0.38%
(index / closing price / change items /% change)
Nikkei -592.45 22682.08 -2.55%
TOPIX -40.46 1823.74 -2.17%
Hang Seng -356.56 32245.22 -1.09%
CSI 300 +2.92 4274.15 +0.07%
Euro Stoxx 50 -44.51 3478.77 -1.26%
FTSE 100 -108.45 7334.98 -1.46%
DAX -97.67 12687.49 -0.76%
CAC 40 -79.15 5285.83 -1.48%
DJIA -1175.21 24345.75 -4.60%
S&P 500 -113.19 2648.94 -4.10%
NASDAQ -273.42 6967.53 -3.78%
S&P/TSX -271.22 15334.81 -1.74%
(pare/closed(GMT +2)/change, %)
EUR/USD $1,2366 -0,77%
GBP/USD $1,3957 -1,18%
USD/CHF Chf0,93164 +0,05%
USD/JPY Y109,14 -0,90%
EUR/JPY Y134,96 -1,67%
GBP/JPY Y152,337 -2,08%
AUD/USD $0,7876 -0,63%
NZD/USD $0,7264 -0,49%
USD/CAD C$1,25394 +0,91%
00:30 Australia Retail Sales, M/M December 1.2% -0.2%
00:30 Australia Trade Balance December -0.628 0.25
03:30 Australia Announcement of the RBA decision on the discount rate 1.50% 1.5%
03:30 Australia RBA Rate Statement
07:00 Germany Factory Orders s.a. (MoM) December -0.4% 0.6%
09:00 Germany German Buba President Weidmann Speaks
13:30 Canada Trade balance, billions December -2.54 -2.3
13:30 U.S. International Trade, bln December -50.5 -52.1
13:50 U.S. FOMC Member James Bullard Speaks
15:00 Canada Ivey Purchasing Managers Index January 60.4 59.9
15:00 U.S. JOLTs Job Openings December 5.879 5.95
21:45 New Zealand Unemployment Rate Quarter IV 4.6% 4.7%
21:45 New Zealand Employment Change, q/q Quarter IV 2.2%
22:30 Australia AiG Performance of Construction Index January 52.8
Major US stock indices fell significantly, which was due to increased fears about inflation and higher bond yields.
Negligible impact on the course of trading also provided data on the United States. The research data in January indicate a continuation of business activity growth in the US services sector, although growth slowed for the third month and reached a nine-month low. Nevertheless, new orders continued to expand sharply, and the growth rate accelerated to the fastest since September last year. Seasonally adjusted final index of business activity in the US services sector from IHS Markit was 53.3 in January against 53.7 in December. The last value of the index showed that business activity among service providers has reached its weakest level since April 2017. The survey data linked the current recovery with more favorable economic conditions.
Meanwhile, the index of business activity in the US services sector, calculated by the Institute for Supply Management (ISM), rose in January to a level of 59.9 points compared to 55.9 points in December. Analysts predicted that the figure will rise to 56.5 points. Recall, the indicator is the result of a survey of about 400 firms from 60 sectors across the US. A value greater than 50 is usually considered an indicator of the growth of production activity.
All components of the DOW index finished trading in the red (30 of 30). Outsider were shares of Exxon Mobil Corporation (XOM, -5.41%).
All sectors of the S & P index showed a fall. The largest decrease was registered in the sector of industrial goods (-4.1%).
At closing:
DJIA -4.60% 24,345.75 -1175.21
Nasdaq -3.78% 6,967.53 -273.42
S & P -4.10% 2,648.94 -113.19
-
Govt of Canada says criteria for issuance of ultra-long bond not met, Govt will not issue ultra-long bonds this quarter
"The NMI registered 59.9 percent, which is 3.9 percentage points higher than the seasonally adjusted December reading of 56 percent. This represents continued growth in the non-manufacturing sector at a faster rate. The Non-Manufacturing Business Activity Index increased to 59.8 percent, 2 percentage points higher than the seasonally adjusted December reading of 57.8 percent, reflecting growth for the 102nd consecutive month, at a faster rate in January. The New Orders Index registered 62.7 percent, 8.2 percentage points higher than the seasonally adjusted reading of 54.5 percent in December. The Employment Index increased 5.3 percentage points in January to 61.6 percent from the seasonally adjusted December reading of 56.3 percent", says Anthony Nieves, Chair of the Institute for Supply Management (ISM).
DAX on daily time frame chart, we can see that the price has broken a support zone which have been quite important.
Also, we have moving averages crossed above the price which can give us signs of a possible new bearish movement.
Therefore, we can expect a further bearish movement by DAX near to 12276 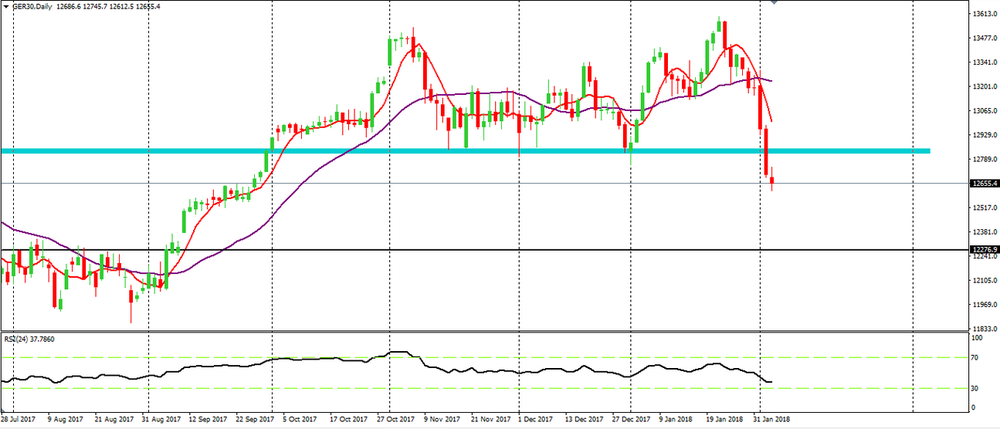
U.S. stock-index futures fell on Monday as bond yields continued to rise.
Global Stocks:
Nikkei 22,682.08 -592.45 -2.55%
Hang Seng 32,245.22 -356.56 -1.09%
Shanghai 3,487.38 +25.30 +0.73%
S&P/ASX 6,026.20 -95.20 -1.56%
FTSE 7,359.44 -83.99 -1.13%
CAC 5,295.26 -69.72 -1.30%
DAX 12,678.68 -106.48 -0.83%
Crude $65.11 (-0.52%)
Gold $1,340.20 (+0.22%)
-
Powell says Fed to work to make finregs effective, efficient
(company / ticker / price / change ($/%) / volume)
| 3M Co | MMM | 244.39 | -0.78(-0.32%) | 15231 |
| ALCOA INC. | AA | 48.75 | -0.34(-0.69%) | 9647 |
| ALTRIA GROUP INC. | MO | 68.9 | -0.50(-0.72%) | 9915 |
| Amazon.com Inc., NASDAQ | AMZN | 1,410.06 | -19.89(-1.39%) | 176597 |
| American Express Co | AXP | 96 | -0.68(-0.70%) | 3482 |
| Apple Inc. | AAPL | 159.75 | -0.75(-0.47%) | 828849 |
| AT&T Inc | T | 37.79 | -0.28(-0.74%) | 88342 |
| Barrick Gold Corporation, NYSE | ABX | 13.85 | 0.11(0.80%) | 13976 |
| Boeing Co | BA | 345 | -3.91(-1.12%) | 50211 |
| Caterpillar Inc | CAT | 155.2 | -2.29(-1.45%) | 30586 |
| Chevron Corp | CVX | 117.25 | -1.33(-1.12%) | 41916 |
| Cisco Systems Inc | CSCO | 40.99 | 0.06(0.15%) | 54550 |
| Citigroup Inc., NYSE | C | 75.64 | -1.38(-1.79%) | 55298 |
| Deere & Company, NYSE | DE | 163.1 | -1.86(-1.13%) | 1073 |
| Exxon Mobil Corp | XOM | 83.17 | -1.36(-1.61%) | 32321 |
| Facebook, Inc. | FB | 188.17 | -2.11(-1.11%) | 256337 |
| Ford Motor Co. | F | 10.65 | -0.06(-0.56%) | 97601 |
| Freeport-McMoRan Copper & Gold Inc., NYSE | FCX | 17.84 | -0.13(-0.72%) | 23759 |
| General Electric Co | GE | 15.53 | -0.11(-0.70%) | 362576 |
| General Motors Company, NYSE | GM | 40.94 | -0.06(-0.15%) | 56979 |
| Goldman Sachs | GS | 257.6 | -2.44(-0.94%) | 23531 |
| Google Inc. | GOOG | 1,096.00 | -15.90(-1.43%) | 32346 |
| Hewlett-Packard Co. | HPQ | 22.3 | -0.18(-0.80%) | 4357 |
| Home Depot Inc | HD | 190.5 | -3.47(-1.79%) | 16336 |
| HONEYWELL INTERNATIONAL INC. | HON | 154.57 | -2.08(-1.33%) | 3546 |
| Intel Corp | INTC | 46.32 | 0.17(0.37%) | 129779 |
| International Business Machines Co... | IBM | 158.1 | -0.93(-0.58%) | 25756 |
| Johnson & Johnson | JNJ | 136.11 | -1.57(-1.14%) | 10069 |
| JPMorgan Chase and Co | JPM | 112.98 | -1.30(-1.14%) | 49345 |
| McDonald's Corp | MCD | 168.2 | -1.18(-0.70%) | 12569 |
| Merck & Co Inc | MRK | 58.37 | -0.19(-0.32%) | 21472 |
| Microsoft Corp | MSFT | 90.68 | -1.10(-1.20%) | 251662 |
| Nike | NKE | 66.33 | -0.89(-1.32%) | 8975 |
| Pfizer Inc | PFE | 36.42 | -0.19(-0.52%) | 11300 |
| Procter & Gamble Co | PG | 83.81 | -0.44(-0.52%) | 10181 |
| Starbucks Corporation, NASDAQ | SBUX | 55.7 | -0.07(-0.13%) | 20994 |
| Tesla Motors, Inc., NASDAQ | TSLA | 339.1 | -4.65(-1.35%) | 72923 |
| The Coca-Cola Co | KO | 46.47 | -0.26(-0.56%) | 7099 |
| Twitter, Inc., NYSE | TWTR | 25.34 | -0.58(-2.24%) | 175355 |
| United Technologies Corp | UTX | 133.1 | -1.51(-1.12%) | 2634 |
| UnitedHealth Group Inc | UNH | 229.1 | -2.78(-1.20%) | 3510 |
| Verizon Communications Inc | VZ | 52.5 | -0.48(-0.91%) | 22225 |
| Visa | V | 118.5 | -2.41(-1.99%) | 76685 |
| Wal-Mart Stores Inc | WMT | 103 | -1.48(-1.42%) | 19618 |
| Walt Disney Co | DIS | 107.91 | -0.79(-0.73%) | 8777 |
| Yandex N.V., NASDAQ | YNDX | 38 | 0.13(0.34%) | 226 |
Alcoa (AA) target raised to $71 from $68 at JP Morgan
Boeing (BA) target raised to $415 from $395 at Berenberg
Amazon (AMZN) target raised to $1700 from $1360 at Nomura
Exxon Mobil (XOM) target lowered to $80 from $84 at Credit Suisse
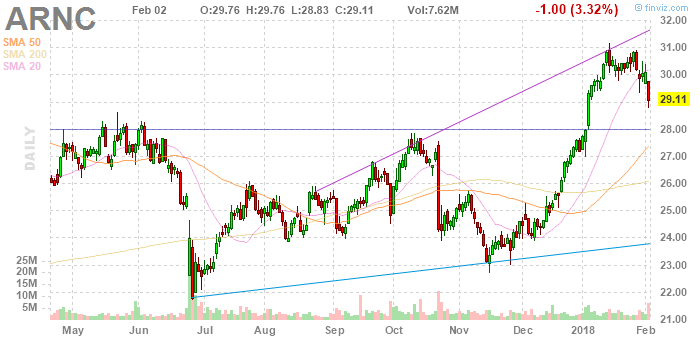
Arconic (ARNC) reported Q4 FY 2017 earnings of $0.31 per share (versus $0.12 in Q4 FY 2016), beating analysts' consensus estimate of $0.24.
The company's quarterly revenues amounted to $3.271 bln (+10.2% y/y), beating analysts' consensus estimate of $3.085 bln.
The company issued mixed guidance for FY 2018, projecting EPS of $1.45-1.55 (versus analysts' consensus estimate of $1.58) at revenues of $13.4-13.7 bln (versus analysts' consensus estimate of $13.05 bln).
ARNC fell to $28.80 (-1.06%) in pre-market trading.
February 5
Before the Open:
Arconic (ARNC). Consensus EPS $0.24, Consensus Revenues $3084.91 mln.
After the Close:
February 6
Before the Open:
General Motors (GM). Consensus EPS $1.43, Consensus Revenues $34279.69 mln.
After the Close:
Walt Disney (DIS). Consensus EPS $1.61, Consensus Revenues $15474.08 mln.
February 7
After the Close:
Tesla (TSLA). Consensus EPS -$3.15, Consensus Revenues $3260.65 mln.
February 8
Before the Open:
Twitter (TWTR). Consensus EPS $0.14, Consensus Revenues $686.13 mln.
After the Close:
American Intl (AIG). Consensus EPS $0.79, Consensus Revenues $12345.49 mln.
In December 2017 compared with November 2017, the seasonally adjusted volume of retail trade decreased by 1.1% in the euro area (EA19) and by 1.0% in the EU28, according to estimates from Eurostat, the statistical office of the European Union. In November, the retail trade volume rose by 2.0% in the euro area and by 2.1% in the EU28. In December 2017 compared with December 2016, the calendar adjusted retail sales index increased by 1.9% in the euro area and by 2.4% in the EU28. The average retail trade for the year 2017, compared with 2016, rose by 2.6% in both the euro area and EU28.
In February, economic momentum in the euro zone is weakening somewhat. The total index drops by one point to 31.9 points. While the situation may continue to improve, expectations have fallen to their lowest level since February 2017. Germany plays a major role in this process. The GroKo negotiations are not well received by investors. Expectations drop by more than 6 points! In the rest of the world, however, investors surveyed by sentix believe that the economic situation remains robust.
January data pointed to a slowdown in growth of services activity across the UK, which stemmed from relatively weak gains in new work. Job creation nonetheless picked up as companies retained positive expectations surrounding the outlook. Although the latest results revealed an easing of inflationary pressures, rates of increase in both input costs and output charges remained above their long-run trends.
Falling from 54.2 in December to 53.0 at the start of the year, the seasonally adjusted IHS Markit/CIPS UK Services PMI Business Activity Index indicated the slowest upturn in services output for 16 months. Growth was reportedly curtailed by the loss of existing clients and lingering concerns surrounding the UK's exit from the EU. Nonetheless, panellists mentioned that sustained rises in sales, acquisitions and new offerings underpinned output expansion.
The final IHS Markit Eurozone PMI Composite Output Index posted 58.8 in January, its highest level since June 2006 and above the earlier flash estimate of 58.6. The headline index has signalled expansion for 55 successive months.
Growth of manufacturing production continued to outpace that of service sector activity in January. Although easing over the month, the rate of expansion in manufacturing output stayed close to December's near-record high. The performance of the service sector continued to strengthen, with business activity growth accelerating to its best since August 2007.
Germany's service sector shifted into a higher gear at the start of 2018, as business activity growth accelerated to the fastest in nearly seven years and job creation also gathered pace, the latest PMI survey data from IHS Markit signalled.
The survey also showed a pick-up in inflationary pressures in January, with firms reacting to a sharp rise in costs by hiking prices charged to the greatest extent in nine-and-a-half years.
The seasonally adjusted final IHS Markit Germany Services PMI Business Activity Index rose to 57.3 in January, up from 55.8 in December (and also above the earlier 'flash' estimate of 57.0). It was the highest reading since March 2011.
Growth in the Spanish service sector picked up pace at the start of 2018, with sharper increases in activity and new business recorded. The rate of job creation remained elevated, while business confidence reached a seven-month high. On the price front, inflation of both input costs and output charges hit multi-year highs. The headline seasonally adjusted Business Activity Index rose to 56.9 in January from 54.6 in December. The steep rise in activity was the fastest since July 2017. Activity has increased continuously since November 2013.
-
2 pct inflation is global standard so appropriate target for BoJ
-
Japan hasn't exited deflation yet
The ANZ Commodity Price Index rose 0.7% m/m in January, a welcome change in direction following a 3-month slide.1 The lift was broad-based with meat, dairy, forestry and aluminium prices all lifting; the only fall was seen in milkfat products. The NZD continued to squeeze higher against major trading partners in January (NZD TWI up 1.8% m/m), pushing the NZD commodity price index down 2.9% m/m. Only aluminium prices managed to increase in local currency terms.
The Caixin China Composite PMI data (which covers both manufacturing and services) indicated that growth momentum across China picked up for the third straight month in January. Furthermore, the Composite Output Index rose to a seven-year high of 53.7, from 53.0 in December, to signal a solid pace of expansion.
January survey data signalled accelerated rates of activity growth across both the manufacturing and service sectors in China. The steeper pace of expansion was registered by services companies, which saw the most marked increase in activity since May 2012. This was highlighted by the seasonally adjusted Caixin China General Services Business Activity Index posting 54.7 at the start of 2018, up from 53.9 in December. At the same time, manufacturers signalled the quickest upturn in production levels since December 2016
European stocks dropped for a fifth straight session on Friday, with the German market leading the charge south after Deutsche Bank posted a bigger-than-expected loss in the fourth quarter. A continued rise in bond yields also weighed on European equities, sparking a pullout of money from stocks after solid U.S. labor market data stoked fears of rapidly rising inflation.
Dow futures fell more than 200 points Sunday, following steep losses on Wall Street last week. Dow Jones industrial average futures YMH8, -0.45% were last down 194 points, or 0.7%, after being down as much as 250 points earlier in Sunday trading. S&P 500 futures ESH8, -0.24% were last down 12.70 points, or 0.4%, and Nasdaq futures NQH8, -0.17% fell 23.75 points, or 0.4%, recovering somewhat from deeper losses earlier.
The global stock-market rout continued Monday in Asia, with indexes in Japan and Taiwan down more than 2% following heavy selling in the U.S. and Europe on Friday. "Everyone is getting cautious," said Hisao Matsuura, chief strategist at Nomura Japan. He said the continuing rise in global bond yields caught investors unaware, weighing on stocks.
EUR/USD
Resistance levels (open interest**, contracts)
$1.2582 (2161)
$1.2551 (2563)
$1.2526 (1505)
Price at time of writing this review: $1.2459
Support levels (open interest**, contracts):
$1.2377 (2173)
$1.2338 (3383)
$1.2294 (4413)
Comments:
- Overall open interest on the CALL options and PUT options with the expiration date February, 9 is 143669 contracts (according to data from February, 2) with the maximum number of contracts with strike price $1,1850 (7036);
GBP/USD
Resistance levels (open interest**, contracts)
$1.4293 (284)
$1.4260 (1285)
$1.4233 (764)
Price at time of writing this review: $1.4125
Support levels (open interest**, contracts):
$1.4069 (500)
$1.4041 (588)
$1.4009 (492)
Comments:
- Overall open interest on the CALL options with the expiration date February, 9 is 40955 contracts, with the maximum number of contracts with strike price $1,3600 (3462);
- Overall open interest on the PUT options with the expiration date February, 9 is 37591 contracts, with the maximum number of contracts with strike price $1,3400 (3038);
- The ratio of PUT/CALL was 0.92 versus 0.93 from the previous trading day according to data from February, 2
* - The Chicago Mercantile Exchange bulletin (CME) is used for the calculation.
** - Open interest takes into account the total number of option contracts that are open at the moment.


© 2000-2026. Bản quyền Teletrade.
Trang web này được quản lý bởi Teletrade D.J. LLC 2351 LLC 2022 (Euro House, Richmond Hill Road, Kingstown, VC0100, St. Vincent and the Grenadines).
Thông tin trên trang web không phải là cơ sở để đưa ra quyết định đầu tư và chỉ được cung cấp cho mục đích làm quen.
Giao dịch trên thị trường tài chính (đặc biệt là giao dịch sử dụng các công cụ biên) mở ra những cơ hội lớn và tạo điều kiện cho các nhà đầu tư sẵn sàng mạo hiểm để thu lợi nhuận, tuy nhiên nó mang trong mình nguy cơ rủi ro khá cao. Chính vì vậy trước khi tiến hành giao dịch cần phải xem xét mọi mặt vấn đề chấp nhận tiến hành giao dịch cụ thể xét theo quan điểm của nguồn lực tài chính sẵn có và mức độ am hiểu thị trường tài chính.
Sử dụng thông tin: sử dụng toàn bộ hay riêng biệt các dữ liệu trên trang web của công ty TeleTrade như một nguồn cung cấp thông tin nhất định. Việc sử dụng tư liệu từ trang web cần kèm theo liên kết đến trang teletrade.vn. Việc tự động thu thập số liệu cũng như thông tin từ trang web TeleTrade đều không được phép.
Xin vui lòng liên hệ với pr@teletrade.global nếu có câu hỏi.
ngân hàng