- Phân tích
- Tin tức và các công cụ
- Tin tức thị trường
Tin tức thì trường
| raw materials | closing price | % change |
| Oil | 62,20 | -0,34% |
| Gold | 1316,80 | +0,34% |
| index | closing price | change items | % change |
| Nikkei | -195,61 | 21480,90 | -0,90% |
| TOPIX | -16.66 | 1719,97 | -0,96% |
| Hang Seng | +11.79 | 31513,76 | +0,04% |
| CSI 300 | +17,83 | 4074,25 | +0,44% |
| Euro Stoxx 50 | -42.61 | 3394.79 | -1.24% |
| DAX | -172.56 | 12217.02 | -1.39% |
| CAC 40 | -59.91 | 5222.84 | -1.13% |
| DJIA | -335.60 | 24610.91 | -1.35% |
| S&P 500 | -39.09 | 2712.92 | -1.42% |
| NASDAQ | -137.75 | 7344.24 | -1.84% |
| Pare | Closed | % change |
| EUR/USD | $1,2334 | +0,37% |
| GBP/USD | $1,4025 | +0,58% |
| USD/CHF | Chf0,95125 | -0,12% |
| USD/JPY | Y106,02 | +0,01% |
| EUR/JPY | Y130,78 | +0,40% |
| GBP/JPY | Y148,702 | +0,60% |
| AUD/USD | $0,7713 | +0,01% |
| NZD/USD | $0,7239 | +0,31% |
| USD/CAD | C$1,30806 | -0,12% |
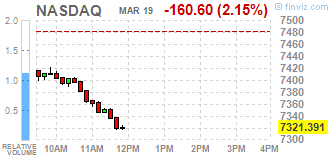
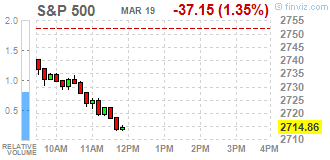
Major U.S. stock-indexes fell on Monday, as Facebook's (FB) stock tumbled 7% on reports that data of 50 million users were misused, roiling the whole technological sector.
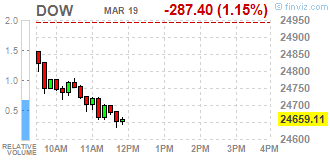
Most of Dow stocks in positive area (26 of 30). Top loser - Caterpillar Inc. (CAT, -2.85%). Top gainer - The Procter & Gamble Company (PG, +0.56%).
All S&P sectors in negative area. Top loser - Technology (-2.1%).
At the moment:
| Dow | 24678.00 | -287.00 | -1.15% |
| S&P 500 | 2720.00 | -36.00 | -1.31% |
| Nasdaq 100 | 6870.50 | -173.50 | -2.46% |
| Crude Oil | 61.83 | -0.58 | -0.93% |
| Gold | 1316.30 | +4.00 | +0.30% |
| U.S. 10yr | 2.85 | 0.00 | 0.00% |
U.S. stock-index futures were lower on Monday, with reports of Facebook's (FB; -4%) user data being misused weighing on social media stocks and investors awaiting this Wednesday's Fed decision.
Global Stocks:
Nikkei 21,480.90 -195.61 -0.90%
Hang Seng 31,513.76 +11.79 +0.04%
Shanghai 3,279.60 +9.72 +0.30%
S&P/ASX 5,959.40 +10.00 +0.17%
FTSE 7,073.76 -90.38 -1.26%
CAC 5,258.16 -24.59 -0.47%
DAX 12,302.04 -87.54 -0.71%
Crude $62.36 (-0.08%)
Gold $1,311.50 (-0.06%)
(company / ticker / price / change ($/%) / volume)
| ALTRIA GROUP INC. | MO | 63.01 | -0.18(-0.28%) | 275 |
| Amazon.com Inc., NASDAQ | AMZN | 1,556.52 | -15.16(-0.96%) | 61693 |
| American Express Co | AXP | 95.45 | -0.16(-0.17%) | 313 |
| AMERICAN INTERNATIONAL GROUP | AIG | 54.01 | -0.29(-0.53%) | 419 |
| Apple Inc. | AAPL | 177.11 | -0.91(-0.51%) | 215388 |
| AT&T Inc | T | 36.98 | -0.02(-0.05%) | 11573 |
| Boeing Co | BA | 328.06 | -2.41(-0.73%) | 13736 |
| Caterpillar Inc | CAT | 155.6 | -0.86(-0.55%) | 4333 |
| Chevron Corp | CVX | 114.88 | -0.52(-0.45%) | 1247 |
| Cisco Systems Inc | CSCO | 44.65 | -0.36(-0.80%) | 34696 |
| Citigroup Inc., NYSE | C | 73.3 | -0.17(-0.23%) | 25929 |
| Deere & Company, NYSE | DE | 162.9 | -0.98(-0.60%) | 257 |
| Exxon Mobil Corp | XOM | 74.85 | -0.27(-0.36%) | 7854 |
| Facebook, Inc. | FB | 177.45 | -7.64(-4.13%) | 1213413 |
| FedEx Corporation, NYSE | FDX | 250.13 | -1.90(-0.75%) | 974 |
| Ford Motor Co. | F | 11.12 | -0.03(-0.27%) | 35694 |
| Freeport-McMoRan Copper & Gold Inc., NYSE | FCX | 18.12 | -0.24(-1.31%) | 8835 |
| General Electric Co | GE | 14.26 | -0.05(-0.35%) | 47987 |
| General Motors Company, NYSE | GM | 37.83 | -0.11(-0.29%) | 2418 |
| Goldman Sachs | GS | 266.75 | -0.85(-0.32%) | 3107 |
| Google Inc. | GOOG | 1,123.94 | -11.79(-1.04%) | 6448 |
| Hewlett-Packard Co. | HPQ | 23.5 | -0.01(-0.04%) | 1449 |
| Home Depot Inc | HD | 178.2 | -0.76(-0.42%) | 1393 |
| Intel Corp | INTC | 50.79 | -0.38(-0.74%) | 90590 |
| International Business Machines Co... | IBM | 159.95 | -0.31(-0.19%) | 1633 |
| Johnson & Johnson | JNJ | 133.25 | -0.43(-0.32%) | 2260 |
| JPMorgan Chase and Co | JPM | 115.15 | -0.29(-0.25%) | 30669 |
| McDonald's Corp | MCD | 161.5 | -0.86(-0.53%) | 3809 |
| Microsoft Corp | MSFT | 93.68 | -0.92(-0.97%) | 57520 |
| Nike | NKE | 65.35 | -0.56(-0.85%) | 5809 |
| Pfizer Inc | PFE | 36.67 | -0.11(-0.30%) | 2209 |
| Procter & Gamble Co | PG | 78.83 | -0.14(-0.18%) | 1765 |
| Starbucks Corporation, NASDAQ | SBUX | 58.74 | -0.26(-0.44%) | 7396 |
| Tesla Motors, Inc., NASDAQ | TSLA | 316 | -5.35(-1.66%) | 72416 |
| The Coca-Cola Co | KO | 43.49 | 0.03(0.07%) | 1279 |
| Twitter, Inc., NYSE | TWTR | 35.31 | -0.27(-0.76%) | 109385 |
| United Technologies Corp | UTX | 127.75 | -0.58(-0.45%) | 1056 |
| UnitedHealth Group Inc | UNH | 226.5 | -1.36(-0.60%) | 540 |
| Verizon Communications Inc | VZ | 48.66 | 0.10(0.21%) | 450 |
| Visa | V | 123.63 | -0.90(-0.72%) | 4731 |
| Wal-Mart Stores Inc | WMT | 89.1 | -0.07(-0.08%) | 13690 |
| Walt Disney Co | DIS | 103 | 0.13(0.13%) | 4101 |
| Yandex N.V., NASDAQ | YNDX | 41.75 | -0.55(-1.30%) | 3136 |
NIKE (NKE) target raised to $77 at Telsey Advisory Group
The first estimate for euro area (EA19) exports of goods to the rest of the world in January 2018 was €178.6 billion, an increase of 9.1% compared with January 2017 (€163.7 bn). Imports from the rest of the world stood at €175.4 bn, a rise of 6.3% compared with January 2017 (€165.0 bn). As a result, the euro area recorded a €3.3 bn surplus in trade in goods with the rest of the world in January 2018, compared with a deficit of €1.4 bn in January 2017. Intra-euro area trade rose to €159.8 bn in January 2018, up by 8.8% compared with January 2017.
In 2017, euro area exports of goods to the rest of the world rose to €2 194.0 bn (an increase of 7.1% compared with 2016), while imports rose to €1 958.0 bn (an increase of 9.8% compared with 2016). As a result the euro area recorded a surplus of €236.0 bn, compared with +€265.3 bn in 2016. Intra-euro area trade rose to €1 844.1 bn in 2017, up by 7.6% compared with 2016.
In January 2018 the industrial production index seasonally adjusted decreased by 1.9% compared with the previous month. The percentage change of the average of the last three months with respect to the previous three months was +1.0%.
The calendar adjusted industrial production index increased by 4.0% compared with January 2017 (calendar working days being 22 versus 21 days in January 2017).
The unadjusted industrial production index increased by 7.3% compared with January 2017.
-
Deposits of domestic banks at 466.352 bln sfr in week ending march 16 versus 464.341 bln sfr a week earlier
| raw materials | closing price | % change |
| Oil | 62.16 | -0.29% |
| Gold | 1,313.50 | +0.09% |
| index | closing price | change items | % change |
| Nikkei | -127.44 | 21676.51 | -0,58% |
| TOPIX | -6.97 | 1736.63 | -0.40% |
| Hang Seng | -39.13 | 31501.97 | -0.12% |
| CSI 300 | -39.74 | 4056.42 | -0.97% |
| Euro Stoxx 50 | +23.27 | 3437.40 | +0.68% |
| DAX | +44.02 | 12389.58 | +0.36% |
| CAC 40 | +15.49 | 5282.75 | +0.29% |
| DJIA | +72.85 | 24946.51 | +0.29% |
| S&P 500 | +4.68 | 2752.01 | +0.17% |
| NASDAQ | +0.25 | 7481.99 | +0.00% |
| Pare | Closed | % change |
| EUR/USD | $1,2288 | -0,13% |
| GBP/USD | $1,3943 | +0,05% |
| USD/CHF | Chf0,95237 | +0,12% |
| USD/JPY | Y106,01 | -0,31% |
| EUR/JPY | Y130,25 | -0,45% |
| GBP/JPY | Y147,803 | -0,28% |
| AUD/USD | $0,7713 | -1,11% |
| NZD/USD | $0,7217 | -0,82% |
| USD/CAD | C$1,30961 | +0,37% |
EUR/USD
Resistance levels (open interest**, contracts)
$1.2467 (3284)
$1.2421 (2005)
$1.2375 (847)
Price at time of writing this review: $1.2265
Support levels (open interest**, contracts):
$1.2215 (3676)
$1.2176 (4047)
$1.2134 (5507)
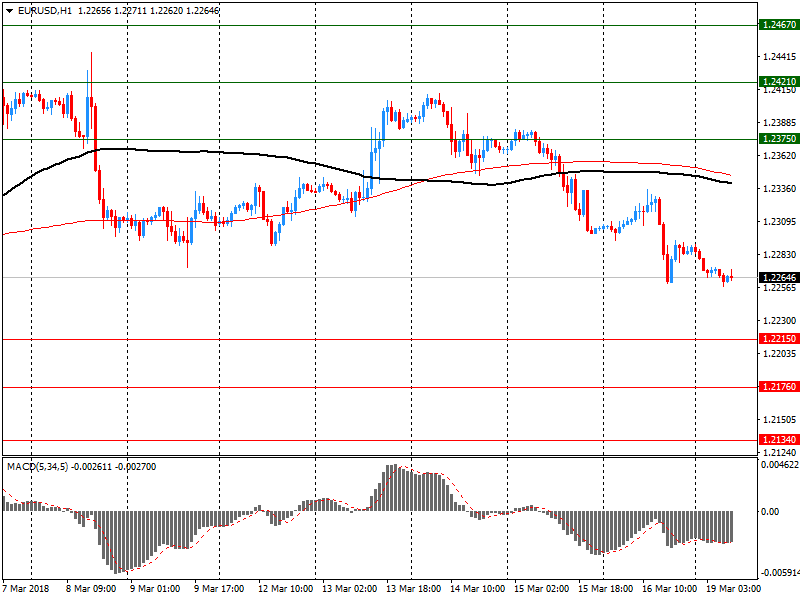
Comments:
- Overall open interest on the CALL options and PUT options with the expiration date April, 6 is 98441 contracts (according to data from March, 16) with the maximum number of contracts with strike price $1,2150 (5507);
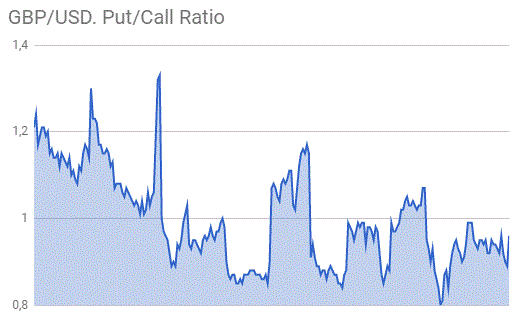
GBP/USD
Resistance levels (open interest**, contracts)
$1.4105 (2540)
$1.4062 (1722)
$1.4033 (307)
Price at time of writing this review: $1.3923
Support levels (open interest**, contracts):
$1.3891 (1318)
$1.3865 (1129)
$1.3834 (3339)
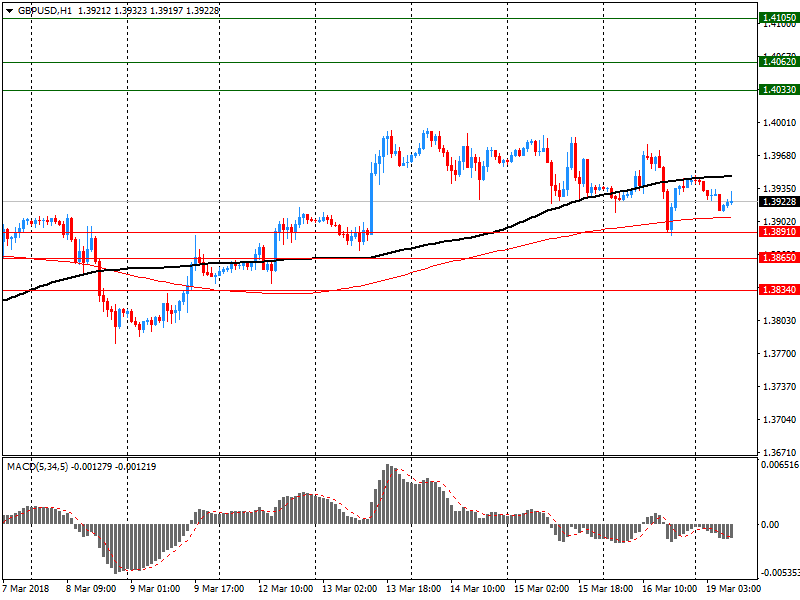
Comments:
- Overall open interest on the CALL options with the expiration date April, 6 is 31209 contracts, with the maximum number of contracts with strike price $1,4300 (2787);
- Overall open interest on the PUT options with the expiration date April, 6 is 29971 contracts, with the maximum number of contracts with strike price $1,3800 (3584);
- The ratio of PUT/CALL was 0.96 versus 0.96 from the previous trading day according to data from March,16
* - The Chicago Mercantile Exchange bulletin (CME) is used for the calculation.
** - Open interest takes into account the total number of option contracts that are open at the moment.


© 2000-2026. Bản quyền Teletrade.
Trang web này được quản lý bởi Teletrade D.J. LLC 2351 LLC 2022 (Euro House, Richmond Hill Road, Kingstown, VC0100, St. Vincent and the Grenadines).
Thông tin trên trang web không phải là cơ sở để đưa ra quyết định đầu tư và chỉ được cung cấp cho mục đích làm quen.
Giao dịch trên thị trường tài chính (đặc biệt là giao dịch sử dụng các công cụ biên) mở ra những cơ hội lớn và tạo điều kiện cho các nhà đầu tư sẵn sàng mạo hiểm để thu lợi nhuận, tuy nhiên nó mang trong mình nguy cơ rủi ro khá cao. Chính vì vậy trước khi tiến hành giao dịch cần phải xem xét mọi mặt vấn đề chấp nhận tiến hành giao dịch cụ thể xét theo quan điểm của nguồn lực tài chính sẵn có và mức độ am hiểu thị trường tài chính.
Sử dụng thông tin: sử dụng toàn bộ hay riêng biệt các dữ liệu trên trang web của công ty TeleTrade như một nguồn cung cấp thông tin nhất định. Việc sử dụng tư liệu từ trang web cần kèm theo liên kết đến trang teletrade.vn. Việc tự động thu thập số liệu cũng như thông tin từ trang web TeleTrade đều không được phép.
Xin vui lòng liên hệ với pr@teletrade.global nếu có câu hỏi.
ngân hàng