- Phân tích
- Tin tức và các công cụ
- Tin tức thị trường
Tin tức thì trường
| Time | Country | Event | Period | Previous value | Forecast |
|---|---|---|---|---|---|
| 01:30 | Australia | Trimmed Mean CPI q/q | Quarter I | 0.4% | 0.4% |
| 01:30 | Australia | CPI, q/q | Quarter I | 0.5% | 0.2% |
| 01:30 | Australia | CPI, y/y | Quarter I | 1.8% | 1.5% |
| 01:30 | Australia | Trimmed Mean CPI y/y | Quarter I | 1.8% | 1.7% |
| 04:30 | Japan | All Industry Activity Index, m/m | February | -0.2% | -0.1% |
| 05:00 | Japan | Leading Economic Index | February | 96.5 | 97.4 |
| 05:00 | Japan | Coincident Index | February | 98.1 | 98.8 |
| 08:00 | Germany | IFO - Current Assessment | April | 103.8 | 103.6 |
| 08:00 | Germany | IFO - Expectations | April | 95.6 | 96.1 |
| 08:00 | Germany | IFO - Business Climate | April | 99.6 | 99.9 |
| 08:00 | Switzerland | Credit Suisse ZEW Survey (Expectations) | April | -26.9 | |
| 08:30 | United Kingdom | PSNB, bln | March | 0.66 | 0.4 |
| 13:00 | Belgium | Business Climate | April | -0.7 | -0.8 |
| 14:00 | Canada | Bank of Canada Rate | 1.75% | 1.75% | |
| 14:00 | Canada | Bank of Canada Monetary Policy Report | |||
| 14:30 | U.S. | Crude Oil Inventories | April | -1.396 | -0.167 |
| 15:15 | Canada | BOC Press Conference |
Major US stock indices rose markedly, as the results of a number of the largest companies exceeded expectations lowered concerns about a decline in corporate segment profits.
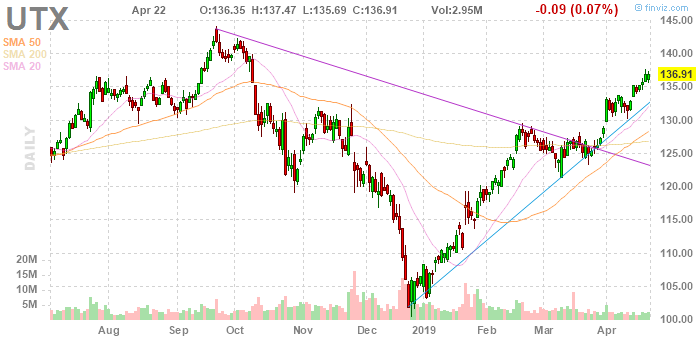
United Technologies (UTX) reported receiving adjusted earnings of $ 1.91 per share, which was $ 0.19 above the analysts' average forecast. The company's revenue also exceeded Wall Street forecasts, and it raised its forecast for key financial indicators for the entire year as a whole.
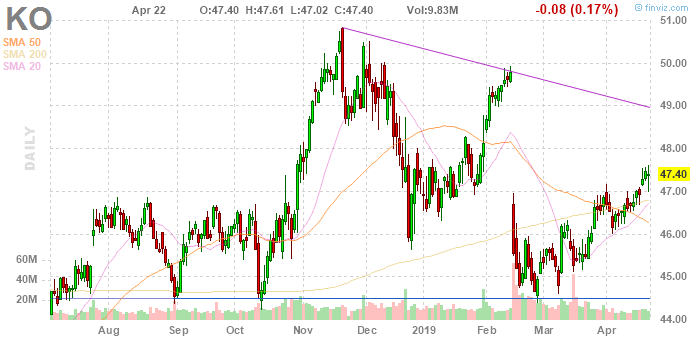
Profit Coca-Cola (KO) reached $ 0.48 per share, which was above the analysts' average forecast of $ 0.46. The company's quarterly revenue also exceeded market expectations, thanks to increased sales of water and new soft drinks.
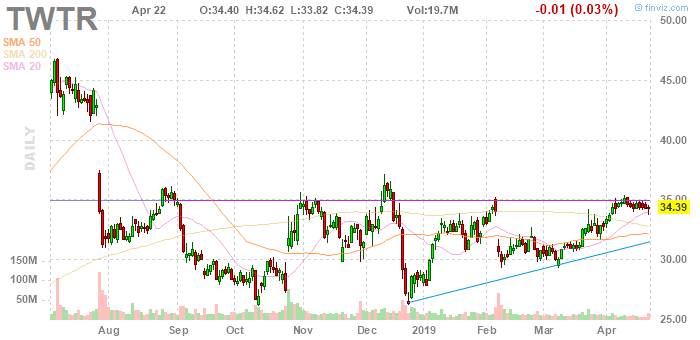
Twitter quarterly earnings (TWTR) for the reporting period reached $ 0.37 per share, which was well above the analysts' average forecast of $ 0.15. The company's revenue also exceeded forecasts.
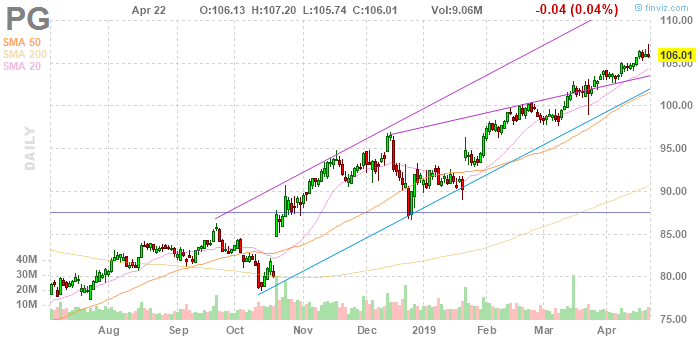
However, not all reports generated a positive reaction. Shares of Procter & Gamble (PG) fell by almost 3%, as the company's EBIT margin was lower than analysts had predicted, despite the fact that its quarterly results exceeded expectations.
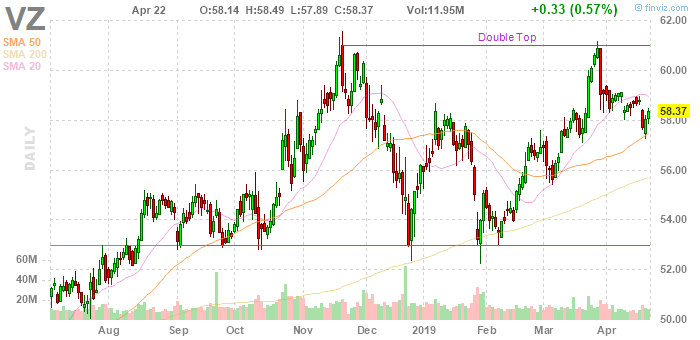
Verizon (VZ) shares lost 2.1% of the cost, as the US wireless carrier lost more telephone subscribers than analysts had expected.
The focus of market participants was also the report of the US Department of Commerce, which showed that sales of new homes in the US unexpectedly jumped in March to the highest level in more than a year. New home sales rose by 4.5% in March, to an annual level of 692,000, after a 5.9% increase in February, to a revised level of 662,000. Continuing growth surprised economists who expected sales to fall to 650,000 from 667,000. originally reported in the previous month. With an unexpected increase, sales of new homes reached the highest annual rate since November 2017 (712,000).
In addition, Wall Street closely followed the dynamics of oil prices, as they reached their highest level this year, amid growing fears about global supply. This happened after the day before the United States announced its intention to reduce Iran’s oil exports to zero.
Most of the components of DOW finished trading in positive territory (21 out of 30). The growth leader was United Technologies Corp. (UTX; + 2.24%). The Procter & Gamble Co. shares turned out to be an outsider. (PG; -2.92%).
Almost all sectors of the S & P recorded an increase. The exception is the base materials sector (-0.1%). The health sector grew the most (+ 1.6%).
At the time of closing:
Dow 26,650.90 +139.85 +0.53%
S & P 500 2,933.46 +25.49 +0.88%
Nasdaq 100 8,119.40 +104.14 +1.30%
| Time | Country | Event | Period | Previous value | Forecast |
|---|---|---|---|---|---|
| 01:30 | Australia | Trimmed Mean CPI q/q | Quarter I | 0.4% | 0.4% |
| 01:30 | Australia | CPI, q/q | Quarter I | 0.5% | 0.2% |
| 01:30 | Australia | CPI, y/y | Quarter I | 1.8% | 1.5% |
| 01:30 | Australia | Trimmed Mean CPI y/y | Quarter I | 1.8% | 1.7% |
| 04:30 | Japan | All Industry Activity Index, m/m | February | -0.2% | -0.1% |
| 05:00 | Japan | Leading Economic Index | February | 96.5 | 97.4 |
| 05:00 | Japan | Coincident Index | February | 98.1 | 98.8 |
| 08:00 | Germany | IFO - Current Assessment | April | 103.8 | 103.6 |
| 08:00 | Germany | IFO - Expectations | April | 95.6 | 96.1 |
| 08:00 | Germany | IFO - Business Climate | April | 99.6 | 99.9 |
| 08:00 | Switzerland | Credit Suisse ZEW Survey (Expectations) | April | -26.9 | |
| 08:30 | United Kingdom | PSNB, bln | March | 0.66 | 0.4 |
| 13:00 | Belgium | Business Climate | April | -0.7 | -0.8 |
| 14:00 | Canada | Bank of Canada Rate | 1.75% | 1.75% | |
| 14:00 | Canada | Bank of Canada Monetary Policy Report | |||
| 14:30 | U.S. | Crude Oil Inventories | April | -1.396 | -0.167 |
| 15:15 | Canada | BOC Press Conference |
The European Commission reported its preliminary estimates showed the consumer
confidence indicator for the Eurozone dropped 0.7 points to -7.9 in April from
the previous month.
Economists had expected the index to come in at -7.
Considering the European Union (EU) as a whole, consumer sentiment index declined
0.6 points to -7.7.
Despite these drops, both indicators remain well above their respective
long-term averages of -11.3 (Eurozone) and -10.4 (EU), the report said.
The U.S. Commerce Department announced on Tuesday that the sales of new
single-family homes increased 4.5 percent m-o-m to a seasonally adjusted annual
rate of 692, 000 units in March, as lower mortgage costs helped buyers afford
properties. That was the highest reading since November 2017.
Economists had forecast the sales pace of 650,000 last month.
February’s sales pace was revised down to 662,000 units from the
originally reported 667,000 units.
According to the report, new home sales in the South, the largest area,
rose 3.6 percent m-o-m in March to their highest level since July 2007. Sales
in the Midwest climbed 17.6 percent m-o-m, while sales in the West jumped 6.7
percent m-o-m. Meanwhile, sales in the Northeast declined 22.2 percent m-o-m.
In y-o-y terms, new home sales recorded a 3.0 percent advance in March.
Gulf oil producers are committed to market stability and have the capacity to raise output, but any decision to boost production has to be a measured one depending on demand, the sources told Reuters.
“The question is how fast and by how much will OPEC raise output. This still needs to be done after consultations with other countries,” one source said.
“It needs to be discussed and studied. There is an (OPEC) agreement that must be respected, we will not (raise output) immediately for sure.”
Another source said any decision to increase output must depend on demand.
“There must be actual impact on the market and a real demand from customers,” this source said, adding that any physical additional barrels by Gulf oil producers to compensate for a supply decrease from Iran are unlikely to be seen until June.
Saudi Arabia’s oil exports in May are not expected to be much higher than April, two sources said.
U.S. stock-index futures traded flat on Tuesday, as investors digested a fresh batch of earnings reports from some major U.S. companies.
Global Stocks:
Index/commodity | Last | Today's Change, points | Today's Change, % |
Nikkei | 22,259.74 | +41.84 | +0.19% |
Hang Seng | 29,963.24 | -0.02 | 0.00% |
Shanghai | 3,198.59 | -16.45 | -0.51% |
S&P/ASX | 6,319.40 | +59.60 | +0.95% |
FTSE | 7,492.15 | +32.27 | +0.43% |
CAC | 5,573.81 | -6.57 | -0.12% |
DAX | 12,200.47 | -21.92 | -0.18% |
Crude oil | $65.69 | +0.21% | |
Gold | $1,270.20 | -0.58% |
(company / ticker / price / change ($/%) / volume)
3M Co | MMM | 218.88 | 0.34(0.16%) | 497 |
ALCOA INC. | AA | 28.1 | -0.04(-0.14%) | 2454 |
Amazon.com Inc., NASDAQ | AMZN | 1,892.95 | 5.64(0.30%) | 45325 |
American Express Co | AXP | 112.5 | 0.17(0.15%) | 1070 |
Apple Inc. | AAPL | 204.1 | -0.43(-0.21%) | 170429 |
AT&T Inc | T | 32 | -0.08(-0.25%) | 89809 |
Boeing Co | BA | 376 | 0.83(0.22%) | 22837 |
Caterpillar Inc | CAT | 142.82 | 0.44(0.31%) | 2410 |
Chevron Corp | CVX | 122 | 0.10(0.08%) | 5150 |
Cisco Systems Inc | CSCO | 56.45 | 0.11(0.20%) | 8190 |
Exxon Mobil Corp | XOM | 83.25 | 0.35(0.42%) | 11026 |
Facebook, Inc. | FB | 183.13 | 1.69(0.93%) | 207694 |
Ford Motor Co. | F | 9.42 | 0.07(0.75%) | 100829 |
Freeport-McMoRan Copper & Gold Inc., NYSE | FCX | 13.6 | -0.05(-0.37%) | 41826 |
Goldman Sachs | GS | 203.93 | -0.67(-0.33%) | 729 |
Google Inc. | GOOG | 1,250.00 | 1.16(0.09%) | 1286 |
Hewlett-Packard Co. | HPQ | 19.95 | 0.07(0.35%) | 9353 |
Intel Corp | INTC | 58.83 | 0.01(0.02%) | 11224 |
International Business Machines Co... | IBM | 139.01 | 0.12(0.09%) | 2173 |
JPMorgan Chase and Co | JPM | 113.77 | 0.17(0.15%) | 2928 |
Microsoft Corp | MSFT | 124 | 0.24(0.19%) | 67560 |
Nike | NKE | 87.55 | 0.19(0.22%) | 325 |
Pfizer Inc | PFE | 39.13 | 0.15(0.38%) | 12028 |
Procter & Gamble Co | PG | 104 | -2.01(-1.90%) | 117627 |
Starbucks Corporation, NASDAQ | SBUX | 75.51 | 0.11(0.15%) | 270 |
Tesla Motors, Inc., NASDAQ | TSLA | 258.73 | -4.02(-1.53%) | 280811 |
The Coca-Cola Co | KO | 48.7 | 1.30(2.74%) | 334056 |
Twitter, Inc., NYSE | TWTR | 36.73 | 2.34(6.80%) | 6189823 |
United Technologies Corp | UTX | 140.75 | 3.84(2.80%) | 69271 |
UnitedHealth Group Inc | UNH | 228.21 | 1.10(0.48%) | 8147 |
Verizon Communications Inc | VZ | 58 | -0.37(-0.63%) | 166747 |
Visa | V | 161 | 0.60(0.37%) | 7327 |
Walt Disney Co | DIS | 133.08 | 1.40(1.06%) | 83503 |
Yandex N.V., NASDAQ | YNDX | 37.68 | 0.24(0.64%) | 7281 |
UnitedHealth (UNH) initiated with a Neutral at UBS; target $238
Walt Disney (DIS) target raised to $168 from $144 at BofA/Merrill; also added to US 1 List
Statistics Canada reported on Tuesday the wholesale sales rose 0.3
percent m-o-m in February, following an unrevised 0.6 percent m-o-m increase in
January.
Economists had forecast an advance of 0.1 percent m-o-m for February.
According to the
report, higher sales were recorded in two of seven subsectors, led by the motor
vehicle and motor vehicle parts and accessories subsector (+9.5 percent m-o-m).
Excluding this subsector, wholesale sales fell 1.5 percent m-o-m.
At the same time, wholesale
inventories edged down 0.1 percent m-o-m in February. Inventories were down in
four of seven subsectors, representing about 58 percent of total wholesale
inventories.
Analysts at TD Securities expect the U.S. new home sales to show a decline of 2.6% m-o-m to 650k for March, following two consecutive months with sequential gains that pulled sales near a year high of 667k in February.
- "Separately, the consensus expects the Richmond Fed manufacturing index to have stayed unchanged at 10 in April, suggesting further stabilization in the manufacturing outlook. Note that the combination of the ISM-adjusted versions of the NY Empire and Philly Fed surveys already suggests the ISM manufacturing index isn't likely to deviate much from current levels in April."
Verizon (VZ) reported Q1 FY 2019 earnings of $1.20 per share (versus $1.11 in Q1 FY 2018), beating analysts’ consensus of $1.16.
The company’s quarterly revenues amounted to $32.128 bln (+1.1% y/y), generally in line with analysts’ consensus estimate of $32.133 bln.
VZ rose to $58.80 (+0.74%) in pre-market trading.
- It will not achieve its dream of bringing Iran oil exports to zero
- We will act wholeheartedly to break U.S. sanctions
United Tech (UTX) reported Q1 FY 2019 earnings of $1.91 per share (versus $1.77 in Q1 FY 2018), beating analysts’ consensus of $1.72.
The company’s quarterly revenues amounted to $18.365 bln (+20.5% y/y), beating analysts’ consensus estimate of $18.011 bln.
The company also issued in-line guidance for FY 2019, projecting EPS of $7.80-8.00 (compared to its prior guidance of $7.70-8.00 and analysts’ consensus estimate of $7.91) and revenues of $75.5-77.0 bln (unchanged from its prior guidance and versus analysts’ consensus estimate of $77.07 bln).
UTX rose to $142.40 (+4.01%) in pre-market trading.
Procter & Gamble (PG) reported Q1 FY 2019 earnings of $1.06 per share (versus $1.00 in Q1 FY 2018), beating analysts’ consensus of $1.04.
The company’s quarterly revenues amounted to $16.462 bln (+1.1% y/y), generally in line with analysts’ consensus estimate of $16.366 bln.
PG fell to $105.60 (-0.39%) in pre-market trading.
Twitter (TWTR) reported Q1 FY 2019 earnings of $0.37 per share (versus $0.16 in Q1 FY 2018), beating analysts’ consensus of $0.15.
The company’s quarterly revenues amounted to $0.787 bln (+18.3% y/y), beating analysts’ consensus estimate of $0.775 bln.
The company also issued in-line guidance for Q2, projecting Q2 revenues of $0.770-0.830 bln versus analysts’ consensus estimate of $0.818 bln.
TWTR rose to $36.78 (+6.95%) in pre-market trading.
Coca-Cola (KO) reported Q1 FY 2019 earnings of $0.48 per share (versus $0.47 in Q1 FY 2018), beating analysts’ consensus of $0.46.
The company’s quarterly revenues amounted to $8.000 bln (+5.3% y/y), beating analysts’ consensus estimate of $7.886 bln.
The company also reaffirmed guidance for FY 2019, projecting EPS of $2.05-2.10 versus analysts’ consensus estimate of $2.09.
KO rose to $49.00 (+3.38%) in pre-market trading.
Richard Franulovich, the head of FX strategy at Westpac, notes that global growth appears to be stabilizing at the moment, and AUD and EUR have the strongest sensitivity to global growth.
- High-frequency data suggest that the global economy may be stabilizing. China’s credit aggregates and industrial production data for March were both notably stronger than expected, US retail sales surged in March, while the April German ZEW expectations sub-index finally returned to positive territory (i.e. optimists outweigh pessimists).
- A composite leading index for the global economy based on the OECD’s leading indicators is also stabilizing.
- The country breakdown of the OECD leading indicators also highlights that the recovery in the global leading index is very lopsided at this stage, with emerging markets showing strong gains while the major developed economies are yet to show any meaningful recovery signal.
- Regardless, some welcome stability in the global growth picture appears to be emerging with potentially important implications for FX markets if sustained.
- The biggest surprise is that EUR has morphed into a very cyclically sensitive currency in recent years, showing the second highest correlation with our composite global growth index among the G10. That is arguably a function of the region’s heavy dependence on external trade and the ratcheting up in global trade tensions in the last two years.
Analysts at Nordea Markets note the news from the German manufacturing industry has been simply dreadful.
- New manufacturing orders, as measured in terms of PMIs, have fallen to their lowest level since the global financial crisis and thus undershot even the Euro-area sovereign debt crisis lows. In the hard data, industrial production has so far recorded slightly better data, while the actual order data have been very weak.
- The temporary factors that hit the German car industry, such as the new emission test standards, have faded. However, the rebound in production has been rather modest and risks remain to the downside, not least because of the threat of US car tariffs on EU cars. We thus do not expect rebounding car production to boost the German economy notably this year.
- While the manufacturing industry is in recession, the rest of the economy is doing better. The services sector is still in growth territory and the same applies to construction. Overall, wages are still increasing, and employment is growing. While the weak manufacturing sector adds downside pressure on the economy as a whole, we do not expect the weakness to become serious enough to drag the entire economy into recession. Also, a slight boost from easier fiscal policy should act as a buffer against recession.
- This year will be very weak for the German economy, but growth will probably return to close to potential in 2020.
The People’s Bank of China (PBoC) is likely to pause to assess economic conditions before making any further moves to ease lenders’ reserve requirements after better-than-projected growth data reduced the urgency for action, policy insiders told Reuters.
Although the Chinese central bank's easing bias remains unchanged, it sees less room this year for cutting reserve requirement ratios (RRRs), as fiscal stimulus plays a bigger role in spurring growth, according to government advisers involved in internal policy discussions.
- Government focus is passing a withdrawal agreement bill
- Says that both sides must compromise in talks with Labour party
- Important to continue to work hard to find a way forward on Brexit
The U.S. push to reduce Iranian oil exports to zero will tighten crude markets significantly in the short term, but is unlikely to have a big effect on prices over a longer period, Barclays said in a note.
Washington this week demanded that buyers of Iranian oil stop purchases by May 1 or face sanctions.
“The announcement implies material upside risk to our current $70 per barrel average price forecast for Brent this year, compared with the year-to-date average of $65 per barrel. But (it) does not affect our view on longer-term prices materially,” Barclays said.
Barclays also said that the U.S. move increased the risk of conflict in the Middle East, including the potential closure of the strategic Strait of Hormuz.
According to the report from Eurostat, in 2018, the government deficit and debt of both the euro area (EA19) and the EU28 decreased in relative terms compared with 2017. In the euro area the government deficit to GDP ratio fell from 1.0% in 2017 to 0.5% in 2018, and in the EU28 from 1.0% to 0.6%. In the euro area the government debt to GDP ratio declined from 87.1% at the end of 2017 to 85.1% at the end of 2018, and in the EU28 from 81.7% to 80.0%.
In 2018, government expenditure in the euro area was equivalent to 46.8% of GDP and government revenue to 46.3%. The figures for the EU28 were 45.6% and 45.0% respectively. In both zones the government expenditure ratio decreased between 2017 and 2018, while the government revenue ratio increased.
Christin Tuxen, chief analyst at Danske Bank, explains that towards the end of last week, EUR/USD dropped back below 1.13 following another disappointing PMI reading out of the euro zone with US figures, also coming out on the weak side.
“Continued upward pressure on oil and continued support for equities helped to stabilise the cross though. We look for EUR/USD to stay close to 1.13 on 3M. Calendarwise, the next big movers are not until next week.”
British households reported the strongest growth in at least a decade in their earnings from work, a survey showed on Tuesday, suggesting that consumers and their spending can keep on supporting the economy during the Brexit crisis.
IHS Markit said growth in earnings from employment this month was the strongest since it began collecting data for its Household Finance Index in 2009. That helped push up the overall index to a three-month high of 44.0.
"Households also moderated their concerns over job security, supporting a more relaxed approach to overall spending. But appetite for making major purchases, such as cars and holidays, fell sharply again," Joe Hayes, an economist at IHS Markit, said.
Credit Agricole's head of G10 FX research and strategy, Valentin Marinov, said:
Current Fed pause will likely stretch on for few more quarters
Believes that the Fed tightening cycle has peaked
Fed likely to communicate such policy stance ahead of time
That will result in a weaker dollar alongside fading yield momentum
Any softening in policy stance by the Fed will be welcome by Trump
There shouldn't be any real scope for more conflict between Trump and the Fed
According to Karen Jones, analyst at Commerzbank, after the USD/JPY has held over cloud support at 111.13, it looks set to test tough overhead resistance, which includes the 112.13 March high, the 112.43 55 quarter moving average and the 112.72 2015-2019 downtrend.
“This is extremely tough resistance and should cap the topside. Failure at cloud support is needed to alleviate immediate upside pressure and will re-target the 109.70 recent low. The 109.70 low guards the 38.2% retracement at 109.06 and there is scope for the 50% retracement at 108.11. Above the 112.72 downtrend will target the 114.55 October 2018 high.”
The Societe Generale analysts offer a sneak peek at what to expect from Thursday’s Bank of Japan (BOJ) monetary policy announcement.
“The BoJ policy board will likely decide to maintain its current monetary easing framework at the April monetary policy meeting. In the new outlook report, the policy board will likely maintain its positive assessment of Japan's underlying economic strength, while continuing to be cautious of the recent weakness in economic data. However, the policy board will continue to indicate that once technical downward pressures fade, the economy and prices should return to a steady growth path. Furthermore, the new FY21 growth and CPI forecast will likely indicate that growth will continue to grow around the potential growth rate while prices will pick up toward the 2% target.”
The franc is headed for its worst month in almost two years, bringing relief to Swiss policy makers seeking a weaker currency in their quest to revive inflation.
The franc has lost more than 2% of its value against the euro this month, a depreciation not matched since July 2017. The drop is spurring a re-think among some analysts, who are looking to revise their currency forecasts given the collapse in market volatility that has failed to boost demand for haven currencies.
“The negativity centered on the global economy is a little bit overdone,” which is rubbing off on the franc, said Jeremy Stretch, the head of G10 currency strategy at CIBC. “The SNB will probably be able to sleep a little easier over the course of the next few months than perhaps they were doing so at the end of the first quarter.”
Options traders are also increasingly bearish on the franc, with one-year risk reversals against the euro turning the most pessimistic since May. The SNB has been pursuing a weaker currency to stoke inflation that is still holding below 1% even after years of negative interest rates.
Karen Jones, analyst at Commerzbank, suggests that the GBP/USD pair is on the defensive while capped by the 20 day ma at 1.3086 and has eased back to the 200 day ma at 1.2966.
“This is also the location of the 1.2966 20 week ma and the double Fibo retracement at 1.2900/1.2895, this is pretty solid support that is expected to hold the initial test. This guards the recent low at 1.2772. Above 1.3217 (25th January high) will introduce scope up to the 1.3351/82 resistance. The market recently reached 1.3382 before failing. Should 1.2900/1.2895 hold, our overall target remains the 1.3511 200 week ma. Below 1.2772 we would allow for losses to the 1.2669/62 15th January low and August low and possibly the 1.2609/78.6% retracement.”
With the U.S. and China seemingly nearing the conclusion of a trade deal, many experts have predicted that Washington could next turn up tensions with the European Union.
But it would be a mistake if the Trump administration decided to impose additional tariffs on European products because of such differences, according to Anthony Gardner, who served as American ambassador to the EU from 2014 to 2017.
“That would be a mistake, if that is the position that Washington is going to take. And the fundamental reason is that when you look at our common concerns — the U.S. and European concerns about China — we probably agree on 90%,” Gardner told.
Gardner said he regrets that the U.S., under the Trump administration, has seemingly chosen to view the EU as foe. He added that the two economies should work together even more, especially when it comes to tackling concerns about China’s trading practices.
Goldman Sachs expects the US decision to end waivers from sanctions on imports of Iranian oil to have a limited impact on prices, even though the timing of the halt is much more sudden than expected.
"While we acknowledge the near-term upside price risks, we reiterate our fundamentally derived Brent price trading range of $70-75 per barrel for the second quarter of 2019," the bank wrote in a note.
The bank still expects declining prices into 2020 due to better supplied markets next year and high uncertainties around whether the OPEC and fellow producers will continue to abide by their agreement to curb output to support prices after June.
Goldman Sachs sees Iranian production declining by 900,000 barrels per day (bpd) compared to the immediately available global spare capacity of 2 million bpd, which is set to grow further later this year.
According to Karen Jones, analyst at Commerzbank, EUR/USD pair has failed to make any impact on the 55 and 100 day MA at 1.1295/1.1344, and has eased lower.
“Attention has again shifted to the 1.1176 recent low. Intraday Elliott wave counts are negative and the DMI has a sell signal. Below 1.1185/75 (61.8% retracement) lies the 1.1110, the May 2017 low and the 1.0814/78.6% retracement. We suspect that the market is trying to base but needs to do more work (we note the 13 count on the weekly chart and this adds weight to the idea of a potential base). Initial resistance is the 100 day MA at 1.1344 and the resistance line at 1.1379 ahead of the 200 day MA at 1.1433.”
Banks should rather focus on costs instead
Don't see any monetary policy reason for tiered interest rates, but need to watch this issue closely
Economic growth will return in 2H 2019 if trade conflict is resolved
Missing transmission from wage costs to consumer prices is a bit puzzling
Businesses are apparently accepting narrower profit margins
But that cannot go on forever, at some point they will raise prices
Choice of next ECB president should be based on competence, not nationality
ECB does not expect a recession, but it is true that economic slowdown in Germany is stronger than expected
markets pricing in a rate hike by the ECB only in late 2020 is reflective of a different assessment shared by the governing council with regards to downside risks faced by the Eurozone.
Central bank values these expectations/pricing as an important input but they are not led by them.
EUR/USD
Resistance levels (open interest**, contracts)
$1.1410 (5026)
$1.1372 (3904)
$1.1327 (285)
Price at time of writing this review: $1.1250
Support levels (open interest**, contracts):
$1.1215 (1857)
$1.1194 (2890)
$1.1147 (2951)
Comments:
- Overall open interest on the CALL options and PUT options with the expiration date May, 3 is 77213 contracts (according to data from April, 22) with the maximum number of contracts with strike price $1,1500 (5761);
GBP/USD
Resistance levels (open interest**, contracts)
$1.3303 (2301)
$1.3208 (2240)
$1.3123 (1534)
Price at time of writing this review: $1.2986
Support levels (open interest**, contracts):
$1.2956 (1869)
$1.2924 (1607)
$1.2885 (1993)
Comments:
- Overall open interest on the CALL options with the expiration date May, 3 is 24283 contracts, with the maximum number of contracts with strike price $1,3500 (2435);
- Overall open interest on the PUT options with the expiration date May, 3 is 23136 contracts, with the maximum number of contracts with strike price $1,2750 (2369);
- The ratio of PUT/CALL was 0.95 versus 0.94 from the previous trading day according to data from April, 22
* - The Chicago Mercantile Exchange bulletin (CME) is used for the calculation.
** - Open interest takes into account the total number of option contracts that are open at the moment.
| Raw materials | Closed | Change, % |
|---|---|---|
| Brent | 73.52 | 2.7 |
| WTI | 65.6 | 2.34 |
| Silver | 14.98 | 0 |
| Gold | 1274.64 | -0.06 |
| Palladium | 1389.17 | -2.1 |
| Index | Change, points | Closed | Change, % |
|---|---|---|---|
| NIKKEI 225 | 17.34 | 22217.9 | 0.08 |
| KOSPI | 0.5 | 2216.65 | 0.02 |
| Dow Jones | -48.49 | 26511.05 | -0.18 |
| S&P 500 | 2.94 | 2907.97 | 0.1 |
| NASDAQ Composite | 17.21 | 8015.27 | 0.22 |
| Pare | Closed | Change, % |
|---|---|---|
| AUDUSD | 0.71363 | -0.16 |
| EURJPY | 125.993 | 0.17 |
| EURUSD | 1.12574 | 0.15 |
| GBPJPY | 145.281 | -0.04 |
| GBPUSD | 1.29804 | 0 |
| NZDUSD | 0.66793 | -0.03 |
| USDCAD | 1.33504 | -0.28 |
| USDCHF | 1.01503 | 0.09 |
| USDJPY | 111.914 | 0 |


© 2000-2026. Bản quyền Teletrade.
Trang web này được quản lý bởi Teletrade D.J. LLC 2351 LLC 2022 (Euro House, Richmond Hill Road, Kingstown, VC0100, St. Vincent and the Grenadines).
Thông tin trên trang web không phải là cơ sở để đưa ra quyết định đầu tư và chỉ được cung cấp cho mục đích làm quen.
Giao dịch trên thị trường tài chính (đặc biệt là giao dịch sử dụng các công cụ biên) mở ra những cơ hội lớn và tạo điều kiện cho các nhà đầu tư sẵn sàng mạo hiểm để thu lợi nhuận, tuy nhiên nó mang trong mình nguy cơ rủi ro khá cao. Chính vì vậy trước khi tiến hành giao dịch cần phải xem xét mọi mặt vấn đề chấp nhận tiến hành giao dịch cụ thể xét theo quan điểm của nguồn lực tài chính sẵn có và mức độ am hiểu thị trường tài chính.
Sử dụng thông tin: sử dụng toàn bộ hay riêng biệt các dữ liệu trên trang web của công ty TeleTrade như một nguồn cung cấp thông tin nhất định. Việc sử dụng tư liệu từ trang web cần kèm theo liên kết đến trang teletrade.vn. Việc tự động thu thập số liệu cũng như thông tin từ trang web TeleTrade đều không được phép.
Xin vui lòng liên hệ với pr@teletrade.global nếu có câu hỏi.
ngân hàng