- Phân tích
- Tin tức và các công cụ
- Tin tức thị trường
Tin tức thì trường
| Time | Country | Event | Period | Previous value | Forecast |
|---|---|---|---|---|---|
| 05:00 | Japan | Housing Starts, y/y | November | 0.3% | -0.4% |
| 05:00 | Japan | Construction Orders, y/y | November | -16.5% | |
| 09:00 | Eurozone | ECB Economic Bulletin | |||
| 09:00 | Switzerland | Credit Suisse ZEW Survey (Expectations) | December | -42.3 | |
| 13:30 | U.S. | Continuing Jobless Claims | December | 1688 | |
| 13:30 | U.S. | Initial Jobless Claims | December | 214 | 219 |
| 14:00 | U.S. | Housing Price Index, m/m | October | 0.2% | 0.3% |
| 15:00 | U.S. | New Home Sales | November | 0.544 | 0.56 |
| 15:00 | U.S. | Consumer confidence | December | 135.7 | 133.7 |
| 23:30 | Japan | Tokyo CPI ex Fresh Food, y/y | December | 1% | 0.9% |
| 23:30 | Japan | Tokyo Consumer Price Index, y/y | December | 0.8% | |
| 23:30 | Japan | Unemployment Rate | November | 2.4% | 2.4% |
| 23:50 | Japan | Retail sales, y/y | November | 3.5% | 2.2% |
| 23:50 | Japan | Industrial Production (MoM) | November | 2.9% | -1.9% |
| 23:50 | Japan | Industrial Production (YoY) | November | 4.2% |
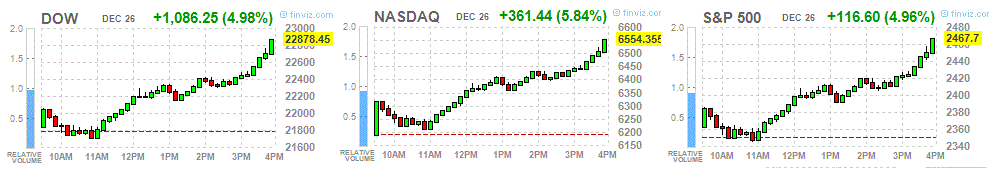
Major US stock indexes rose significantly, while the Dow index recorded its largest increase in points in history.
Growth was driven by shares of retailers that received support after the publication of data on purchases during the holiday season, which were the best in the last six years. According to a Mastercard report, sales during the holiday shopping season in the United States grew by 5.1%, exceeding $ 850 billion, as buyers were encouraged by a sustainable economy and early discounts.
However, investors' concerns have not gone away. President Donald Trump re-attacked the Fed at Christmas, accusing it of falling market. In addition, he stated that the partial closure of the federal government would last until his need for funds to build a wall at the border of the United States and Mexico was met.
The focus was also on the S & P / Case-Shiller report, which showed that the growth rate of housing prices in the US slowed down in October for the third month in a row. According to the report, the home price index from S & P / Case-Shiller among the 20 main cities in October, on an annualized basis, fell to 5% from 5.2% recorded in September (revised from 5.1%). Economists had forecast a decline to 4.9%.
All components of DOW finished trading in positive territory (30 out of 30). The growth leader was NIKE, Inc. (NKE + 6.63%).
All sectors of the S & P recorded an increase. The service sector grew the most (+ 4.8%).
At the time of closing:
Dow 22,878.45 +1086.25 +4.98%
S & P 500 2,467.70 +116.60 +4.96%
Nasdaq 100 6,554.36 +361.44 +5.84%
| Time | Country | Event | Period | Previous value | Forecast |
|---|---|---|---|---|---|
| 05:00 | Japan | Housing Starts, y/y | November | 0.3% | -0.4% |
| 05:00 | Japan | Construction Orders, y/y | November | -16.5% | |
| 09:00 | Eurozone | ECB Economic Bulletin | |||
| 09:00 | Switzerland | Credit Suisse ZEW Survey (Expectations) | December | -42.3 | |
| 13:30 | U.S. | Continuing Jobless Claims | December | 1688 | |
| 13:30 | U.S. | Initial Jobless Claims | December | 214 | 219 |
| 14:00 | U.S. | Housing Price Index, m/m | October | 0.2% | 0.3% |
| 15:00 | U.S. | New Home Sales | November | 0.544 | 0.56 |
| 15:00 | U.S. | Consumer confidence | December | 135.7 | 133.7 |
| 23:30 | Japan | Tokyo CPI ex Fresh Food, y/y | December | 1% | 0.9% |
| 23:30 | Japan | Tokyo Consumer Price Index, y/y | December | 0.8% | |
| 23:30 | Japan | Unemployment Rate | November | 2.4% | 2.4% |
| 23:50 | Japan | Retail sales, y/y | November | 3.5% | 2.2% |
| 23:50 | Japan | Industrial Production (MoM) | November | 2.9% | -1.9% |
| 23:50 | Japan | Industrial Production (YoY) | November | 4.2% |
U.S. stock-index futures surged on Wednesday, rebounding after a plunge on Christmas Eve.
Global Stocks:
Index/commodity | Last | Today's Change, points | Today's Change, % |
Nikkei | 19,327.06 | +171.32 | +0.89% |
Hang Seng | - | - | - |
Shanghai | 2,498.29 | -6.53 | -0.26% |
S&P/ASX | - | - | - |
FTSE | - | - | - |
CAC | - | - | - |
DAX | - | - | - |
Crude | $43.61 | +2.54% | |
Gold | $1,278.90 | +0.56% |
(company / ticker / price / change ($/%) / volume)
ALTRIA GROUP INC. | MO | 48 | -0.29(-0.60%) | 11533 |
Amazon.com Inc., NASDAQ | AMZN | 1,350.40 | -27.05(-1.96%) | 101336 |
American Express Co | AXP | 90.67 | -0.66(-0.72%) | 1106 |
Apple Inc. | AAPL | 149.3 | -1.43(-0.95%) | 362590 |
AT&T Inc | T | 28.24 | -0.07(-0.25%) | 127970 |
Barrick Gold Corporation, NYSE | ABX | 13.18 | 0.06(0.46%) | 34346 |
Boeing Co | BA | 301 | -3.55(-1.17%) | 29058 |
Caterpillar Inc | CAT | 118.11 | -1.96(-1.63%) | 5606 |
Chevron Corp | CVX | 103.69 | -0.52(-0.50%) | 740 |
Cisco Systems Inc | CSCO | 41.7 | -0.15(-0.36%) | 10144 |
Citigroup Inc., NYSE | C | 49.52 | -0.72(-1.43%) | 19963 |
Exxon Mobil Corp | XOM | 67.6 | -0.52(-0.76%) | 16042 |
Facebook, Inc. | FB | 123.21 | -1.74(-1.39%) | 135201 |
FedEx Corporation, NYSE | FDX | 157.7 | -0.30(-0.19%) | 977 |
Ford Motor Co. | F | 8.02 | -0.03(-0.37%) | 69358 |
Freeport-McMoRan Copper & Gold Inc., NYSE | FCX | 9.95 | -0.10(-1.00%) | 28700 |
General Electric Co | GE | 7.07 | -0.08(-1.12%) | 219578 |
General Motors Company, NYSE | GM | 32.8 | -0.18(-0.55%) | 4400 |
Goldman Sachs | GS | 158.5 | -1.55(-0.97%) | 8324 |
Google Inc. | GOOG | 972.93 | -6.61(-0.67%) | 6931 |
Home Depot Inc | HD | 160.99 | 0.51(0.32%) | 19937 |
HONEYWELL INTERNATIONAL INC. | HON | 127.57 | -1.87(-1.44%) | 722 |
Intel Corp | INTC | 44.68 | -0.16(-0.36%) | 41243 |
International Business Machines Co... | IBM | 110.3 | -0.64(-0.58%) | 8971 |
International Paper Company | IP | 39 | -0.12(-0.31%) | 2861 |
Johnson & Johnson | JNJ | 127.27 | -0.82(-0.64%) | 2761 |
JPMorgan Chase and Co | JPM | 93.07 | -1.10(-1.17%) | 11336 |
McDonald's Corp | MCD | 174 | -0.15(-0.09%) | 3753 |
Merck & Co Inc | MRK | 72.2 | -0.70(-0.96%) | 1160 |
Microsoft Corp | MSFT | 97.65 | -0.58(-0.59%) | 105323 |
Nike | NKE | 72 | -0.37(-0.51%) | 19009 |
Pfizer Inc | PFE | 41.77 | -0.16(-0.38%) | 1155 |
Procter & Gamble Co | PG | 90.82 | -0.15(-0.16%) | 1136 |
Tesla Motors, Inc., NASDAQ | TSLA | 311.8 | -7.97(-2.49%) | 53803 |
The Coca-Cola Co | KO | 47.4 | -0.17(-0.36%) | 450 |
Twitter, Inc., NYSE | TWTR | 26.82 | -0.49(-1.79%) | 85483 |
United Technologies Corp | UTX | 105.5 | -0.68(-0.64%) | 374 |
UnitedHealth Group Inc | UNH | 236.75 | -1.59(-0.67%) | 971 |
Verizon Communications Inc | VZ | 54.56 | -0.36(-0.66%) | 3744 |
Visa | V | 122.61 | -1.65(-1.33%) | 10345 |
Wal-Mart Stores Inc | WMT | 87.07 | -0.06(-0.07%) | 1709 |
Walt Disney Co | DIS | 103.85 | -0.37(-0.36%) | 4751 |
Yandex N.V., NASDAQ | YNDX | 26.75 | 0.31(1.17%) | 22958 |
Hewlett Packard (HPQ) initiated with Buy at Standpoint Research
Citigroup (C) upgraded from Hold to Buy at Standpoint Research
Caterpillar (CAT) upgraded from Sell to Accumulate at Standpoint Research
EUR/USD
Resistance levels (open interest**, contracts)
$1.1528 (1696)
$1.1513 (876)
$1.1498 (260)
Price at time of writing this review: $1.1407
Support levels (open interest**, contracts):
$1.1380 (3098)
$1.1339 (4617)
$1.1294 (5133)
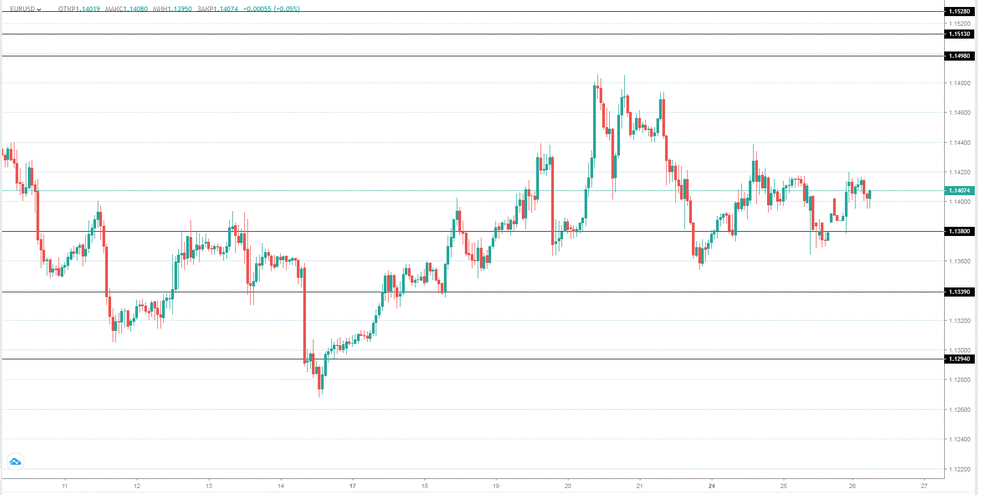
Comments:
- Overall open interest on the CALL options and PUT options with the expiration date January, 7 is 67702 contracts (according to data from December, 24) with the maximum number of contracts with strike price $1,1650 (5874);
GBP/USD
Resistance levels (open interest**, contracts)
$1.2829 (1506)
$1.2810 (575)
$1.2788 (227)
Price at time of writing this review: $1.2710
Support levels (open interest**, contracts):
$1.2660 (1478)
$1.2624 (2014)
$1.2583 (1890)
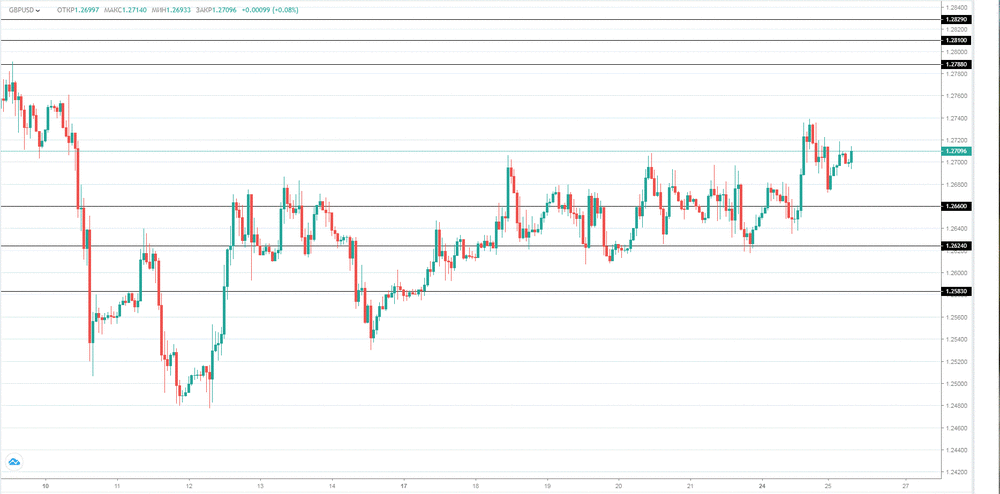
Comments:
- Overall open interest on the CALL options with the expiration date January, 7 is 36243 contracts, with the maximum number of contracts with strike price $1,3400 (3833);
- Overall open interest on the PUT options with the expiration date January, 7 is 33079 contracts, with the maximum number of contracts with strike price $1,2450 (2872);
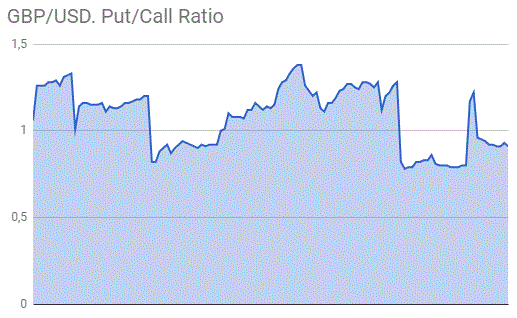
- The ratio of PUT/CALL was 0.91 versus 0.91 from the previous trading day according to data from December, 24
* - The Chicago Mercantile Exchange bulletin (CME) is used for the calculation.
** - Open interest takes into account the total number of option contracts that are open at the moment.
| Index | Change, points | Closed | Change, % |
|---|---|---|---|
| NIKKEI 225 | -1010.45 | 19155.74 | -5.01 |


© 2000-2026. Bản quyền Teletrade.
Trang web này được quản lý bởi Teletrade D.J. LLC 2351 LLC 2022 (Euro House, Richmond Hill Road, Kingstown, VC0100, St. Vincent and the Grenadines).
Thông tin trên trang web không phải là cơ sở để đưa ra quyết định đầu tư và chỉ được cung cấp cho mục đích làm quen.
Giao dịch trên thị trường tài chính (đặc biệt là giao dịch sử dụng các công cụ biên) mở ra những cơ hội lớn và tạo điều kiện cho các nhà đầu tư sẵn sàng mạo hiểm để thu lợi nhuận, tuy nhiên nó mang trong mình nguy cơ rủi ro khá cao. Chính vì vậy trước khi tiến hành giao dịch cần phải xem xét mọi mặt vấn đề chấp nhận tiến hành giao dịch cụ thể xét theo quan điểm của nguồn lực tài chính sẵn có và mức độ am hiểu thị trường tài chính.
Sử dụng thông tin: sử dụng toàn bộ hay riêng biệt các dữ liệu trên trang web của công ty TeleTrade như một nguồn cung cấp thông tin nhất định. Việc sử dụng tư liệu từ trang web cần kèm theo liên kết đến trang teletrade.vn. Việc tự động thu thập số liệu cũng như thông tin từ trang web TeleTrade đều không được phép.
Xin vui lòng liên hệ với pr@teletrade.global nếu có câu hỏi.
ngân hàng