- Analytics
- News and Tools
- Market News
Analytics, News, and Forecasts for CFD Markets: currency news — 07-06-2022.
The Japanese Gross Domestic Product released by the Cabinet Office has been released as follows:
- Q1 Revised real gdp -0.1%QoQ (prelim -0.2%, Reuters poll -0.3%).
- Revised Real GDP annualised -0.5% (prelim, poll -1.0%).
- Revised Capex -0.7% QoQ (prelim +0.5%, poll +0.3%).
- Revised private consumption +0.1% QoQ (prelim -0.0%).
- Revised net external demand contribution to GDP -0.4 pct point (prelim -0.4 pct point).
- Revised domestic demand contribution +0.3 pct point (prelim +0.2 pct point).
The yen is on the backfoot but the data will have little impact. USD/JPY is higher in the session regardless by 0.18% so far at 132.80.
About the Gross Domestic
The GDP released by the Cabinet Office shows the monetary value of all the goods, services and structures produced in Japan within a given period of time. GDP is a gross measure of market activity because it indicates the pace at which the Japanese economy is growing or decreasing. A high reading or a better than expected number is seen as positive for the JPY, while a low reading is negative.
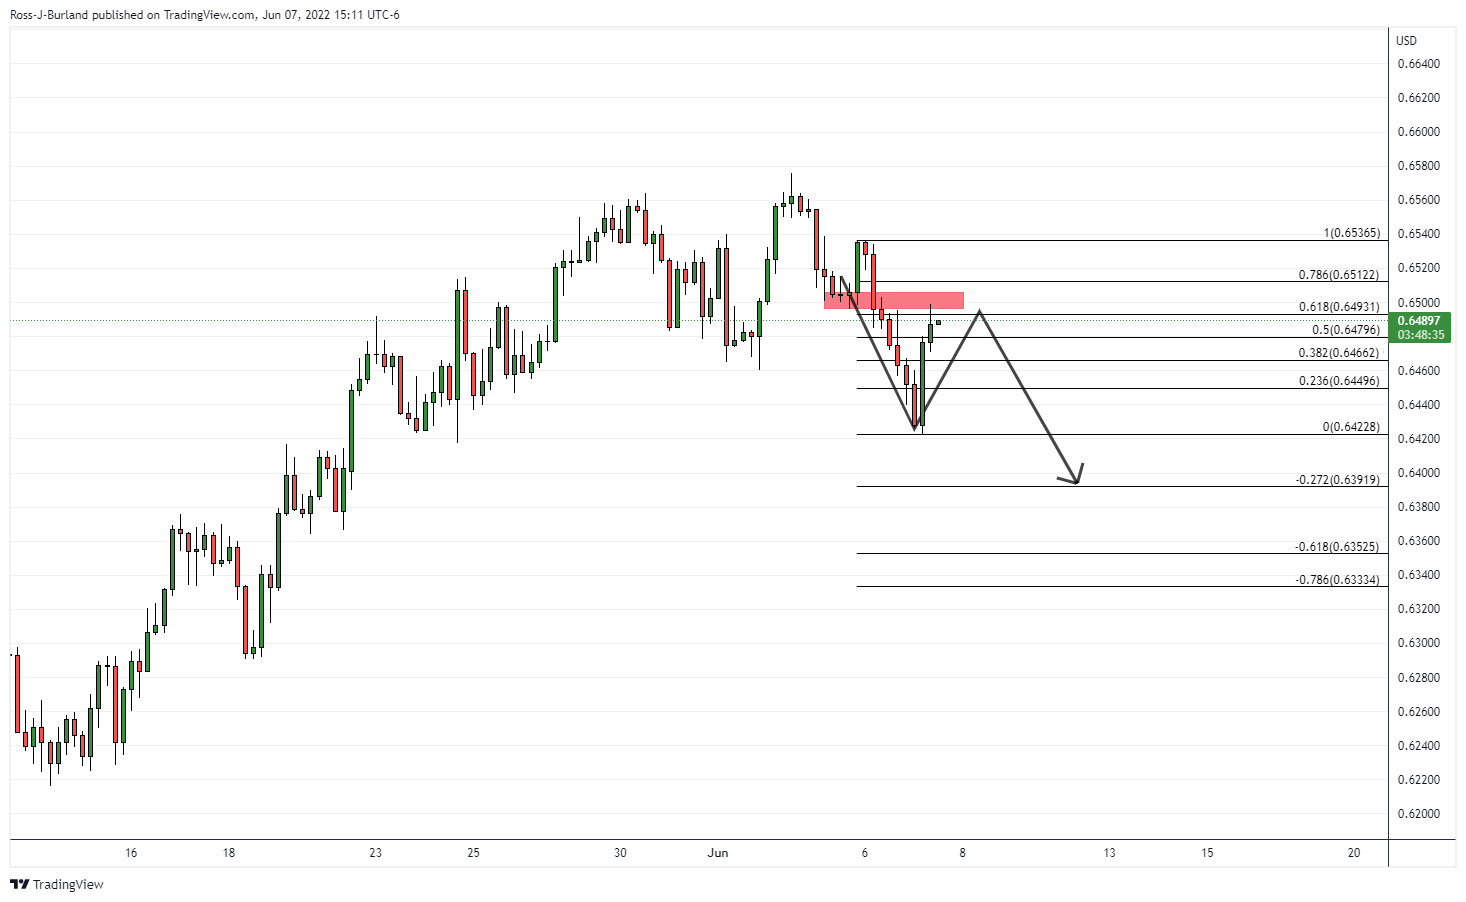
- AUD/JPY pauses seven-day uptrend around the highest levels since 2015.
- Overbought RSI, nearness to the bullish channel’s resistance challenge further upside.
- Sellers need clear break of 94.70 for entry.
AUD/JPY retreats to 96.00, after refreshing a seven-year high the previous day, as buyers take a breather inside the weekly ascending channel during Wednesday’s Asian session.
Also challenging the cross-currency pair’s further upside is the overbought RSI (14) and nearness of the quote to the stated bullish trend channel.
However, sellers may wait for a downside break of the April 2022 peak, near 95.75, to take fresh entries. Even so, a convergence of the channel’s support line and 21-SMA, around 94.70, appears a tough nut to crack for the AUD/JPY bears.
Should the quote drop below 91.60, the odds of its south-run to the 200-SMA level of 91.60 can’t be ruled out.
Alternatively, the aforementioned channel’s resistance line near 96.40 and the May 2015 peak of 97.30 are likely immediate hurdles for the AUD/JPY bulls to cross before eyeing the 100.00 psychological magnet.
Overall, AUD/JPY remains in a bullish trajectory but may witness a pullback.
AUD/JPY: Four-hour chart

Trend: Pullback expected
- Oil prices are trading back and forth around $118.00 as investors await a fresh trigger.
- Advancing odds of a demand recovery in China will keep bulls in the driving seat.
- The promise of pumping more oil by the OPEC+ is unable to offset the oil exports from Russia.
West Texas Intermediate (WTI), futures on NYMEX, has stretched its consolidation amid the unavailability of any potential trigger that could dictate direction to the oil investors. The oil prices have turned sideways towards $118.00 and are eyeing a potential catalyst as supply concerns are expected to drive the asset northwards.
Oil prices have witnessed a strong upside on expectations of a demand recovery in China. The Chinese administration has withdrawn lockdown curbs imposed on Shanghai and Beijing to contain the spread of the Covid-19. This has resumed the regular usage of oil for transportation and economic activities, which will restore the former demand grades going forward.
On the supply front, the American Petroleum Institute (API) has reported an unexpected increase in the oil stockpiles by 1.845 million barrels. However, it will have a minimal impact on the oil prices as supply concerns are galloping on a broader note. The OPEC+ has promised to pump more oil into the global supply to neutralize the shortage of oil supply due to the prohibition of oil imports from Russia by various Western leaders.
Considering the bulk oil exports from Russia and the promise of adding 648,000 barrels of oil by the OPEC+, the oil cartel is unable to fix the oil shortage. Also, the market participants cannot rely on additional oil promises from the OPEC+ as a majority of the oil-producing countries are operating at full capacity, which leaves less room for more oil production.
- EUR/USD struggles to defend the recovery from weekly low.
- US Treasury yields snapped six-day uptrend before the latest inaction, stock futures retreat on mixed clues.
- Recession fears joined market’s consolidation before the key data/events triggered previous rebound.
- Final readings of Eurozone Q1 2022 GDP may entertain traders ahead of ECB, US inflation.
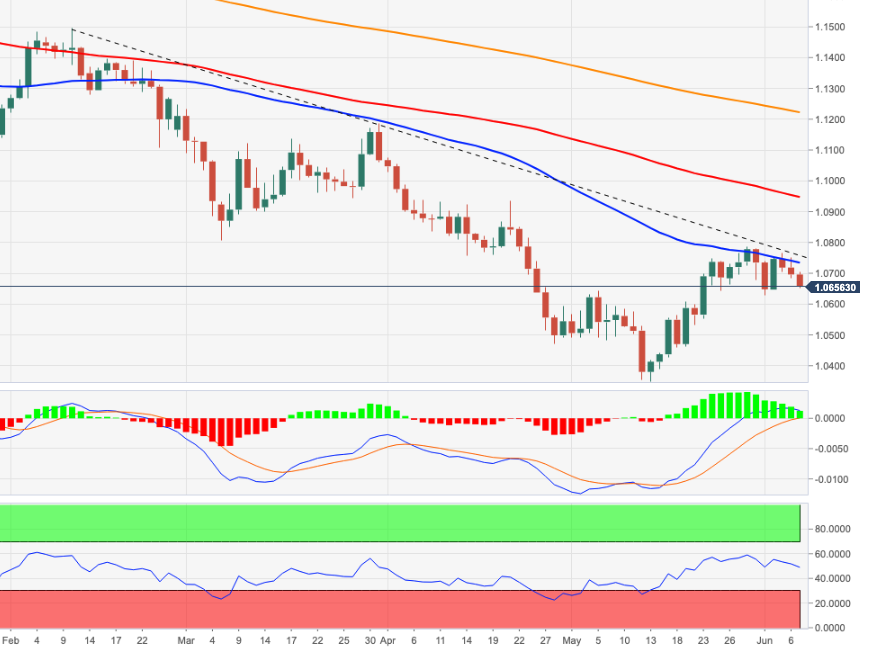
EUR/USD retreats to 1.0700, following the rebound from a weekly low, as the pair traders search for fresh clues amid the market’s indecision. That said, the major currency pair remains sluggish during Wednesday’s Asian session after snapping a two-day downtrend.
The pair’s latest inaction could be linked to the steady US Treasury yields and the downbeat US stock futures, as well as an absence of major data/events during the quiet session. That said, the US 10-year Treasury bond yields drop back below 3.0%, steady at around 2.94 % by the press time, after posting the first daily loss in seven. Further, the S&P 500 Futures drop 0.15% intraday even if the Wall Street benchmarks closed in the positive territory for the last two days.
Tuesday’s downside in the US Treasury bond yields could be linked to the recession fears emanating from the faster monetary policy normalization by the major central banks. The fears grew on a comment from World Bank (WB) President David Malpass who warned that faster-than-expected tightening could push some countries into a debt crisis similar to the one seen in the 1980s.
Also exerting downside pressure on the bond coupons were comments from US Treasury Secretary Janet Yellen and hopes of faster economic recovery in China, both of which favor risk appetite. On Tuesday, US Treasury Secretary Yellen testified on the Fiscal Year 2023 Budget before the Senate Finance Committee while saying that the US economy faces challenges from "unacceptable levels of inflation", as well as headwinds from supply chain snags. The policymaker added, “An appropriate budget is needed to complement Fed’s actions to tame inflation without harming the labor market.”
On the other hand, a record monthly drop in the US trade deficit, down 19.1% to USD87.1bn for April, as well as Germany’s downbeat Factory Orders for April, challenges EUR/USD buyers. Furthermore, news that Ukraine failed to secure an agreement with Russia or Turkey also weighed on the market sentiment and paused the US dollar weakness. “Kyiv says it has not yet reached any agreement with Russia or Turkey to allow the safe passage of its grain ships in the Black Sea, injecting skepticism into a push by the U.N. to create a vital food corridor,” said Politico.
Above all, the market’s anxiety ahead of Thursday’s European Central Bank (ECB) meeting and the US Consumer Price Index (CPI) for May seems to challenge the EUR/USD traders. That said, today’s final readings of the Eurozone Q1 2022 GDP, expected to confirm the earlier forecasts of 0.3% QoQ growth, could offer intermediate clues.
Technical analysis
Despite the latest run-up from the monthly horizontal support around 1.0640, EUR/USD prices remain below 50-day EMA resistance, near 1.0735 by the press time, which in turn keeps sellers hopeful amid the receding bullish bias of the MACD.
“The strength of the economy is continuing to be reflected in the Crown accounts and shows New Zealand is well-positioned to support New Zealanders to manage the impacts of the challenging global economic environment,” said New Zealand Finance Minister (FinMin) Grant Robertson.
“For the ten months to the end of April, the Operating Balance before Gains and Losses (OBEGAL) deficit was $9.4 billion, $3.2 billion below that forecast in May's Budget 2022,” adds the policymaker on early Wednesday morning in Asia.
Key quotes
We know this is a difficult time for families and business who are doing it tough in the face of rising costs. But we face these pressures with record low unemployment, good growth levels, and lower debt than most as we look to secure our economic future.
Under the old debt measure, which looks through the variability created by the inclusion of the NZ Super Fund, net core Crown debt stood at 37.5 percent of GDP, $1.13 billion above forecast
Our economy has come through the Covid shock better than almost anywhere else. The economy is bigger than before the pandemic, unemployment is at a record low and exports are growing.
The recovery is gaining momentum and the easing of restrictions and opening up to skilled workers and tourists will help business and the economy rebuild.
2022 continues to be a challenging year for many New Zealanders facing the impact of global inflation and our resilience will continue to be tested. Nevertheless, our fiscal position is strong and our debt is substantially below most other nations.
Monetary policy is supporting fiscal policy. It was preferable to have temporary and target support.
FX reaction
NZD/USD fails to cheer the news as it retreats from 0.6500, taking rounds to 0.6490 by the press time.
Read: NZD/USD bulls face-off with bears and meet an important area of resistance
- USD/JPY is auctioning rangebound as investors await Japan’s GDP numbers.
- A subdued performance is expected from Japan’s GDP.
- This week the investing community is focusing on the US inflation as it will dictate the likely action by the Fed.
The USD/JPY pair is oscillating in a narrow range of 132.33-133.01 as investors are awaiting the release of the Gross Domestic Product (GDP) numbers by the Japanese Cabinet Office in the Asian session. The asset has remained stronger in the last two trading weeks after sensing a rebound near the round-level support of 127.00.
The uncertainty over the release of Japan's GDP has sidelined the market participants. A preliminary estimate for the quarterly GDP is -0.3% vs. the prior print of -0.2%. While the annualized GDP is expected to remain unchanged at -1%. A higher-than-expected GDP figure is going to strengthen the Japanese bulls.
Meanwhile, the US dollar index (DXY) is expected to register more downside amid an improvement in the risk appetite of investors. A round in the positive market sentiment has underpinned the risk-sensitive currencies and eventually has diminished the DXY’s appeal.
This week, the major event is the US Consumer Price Index (CPI), which will release on Friday. The annual US CPI figure is seen at 8.3%, similar to its previous print while the core CPI could trim to 5.9%. The deadly duo of the upbeat US Nonfarm Payrolls (NFP) and elevated inflationary pressures are bolstering the odds of an extreme hawkish stance by the Federal Reserve (Fed) in its monetary policy announcement next week. It is worth noting that the US economy reported the US NFP at 390k, much higher than the forecasts of 325k.
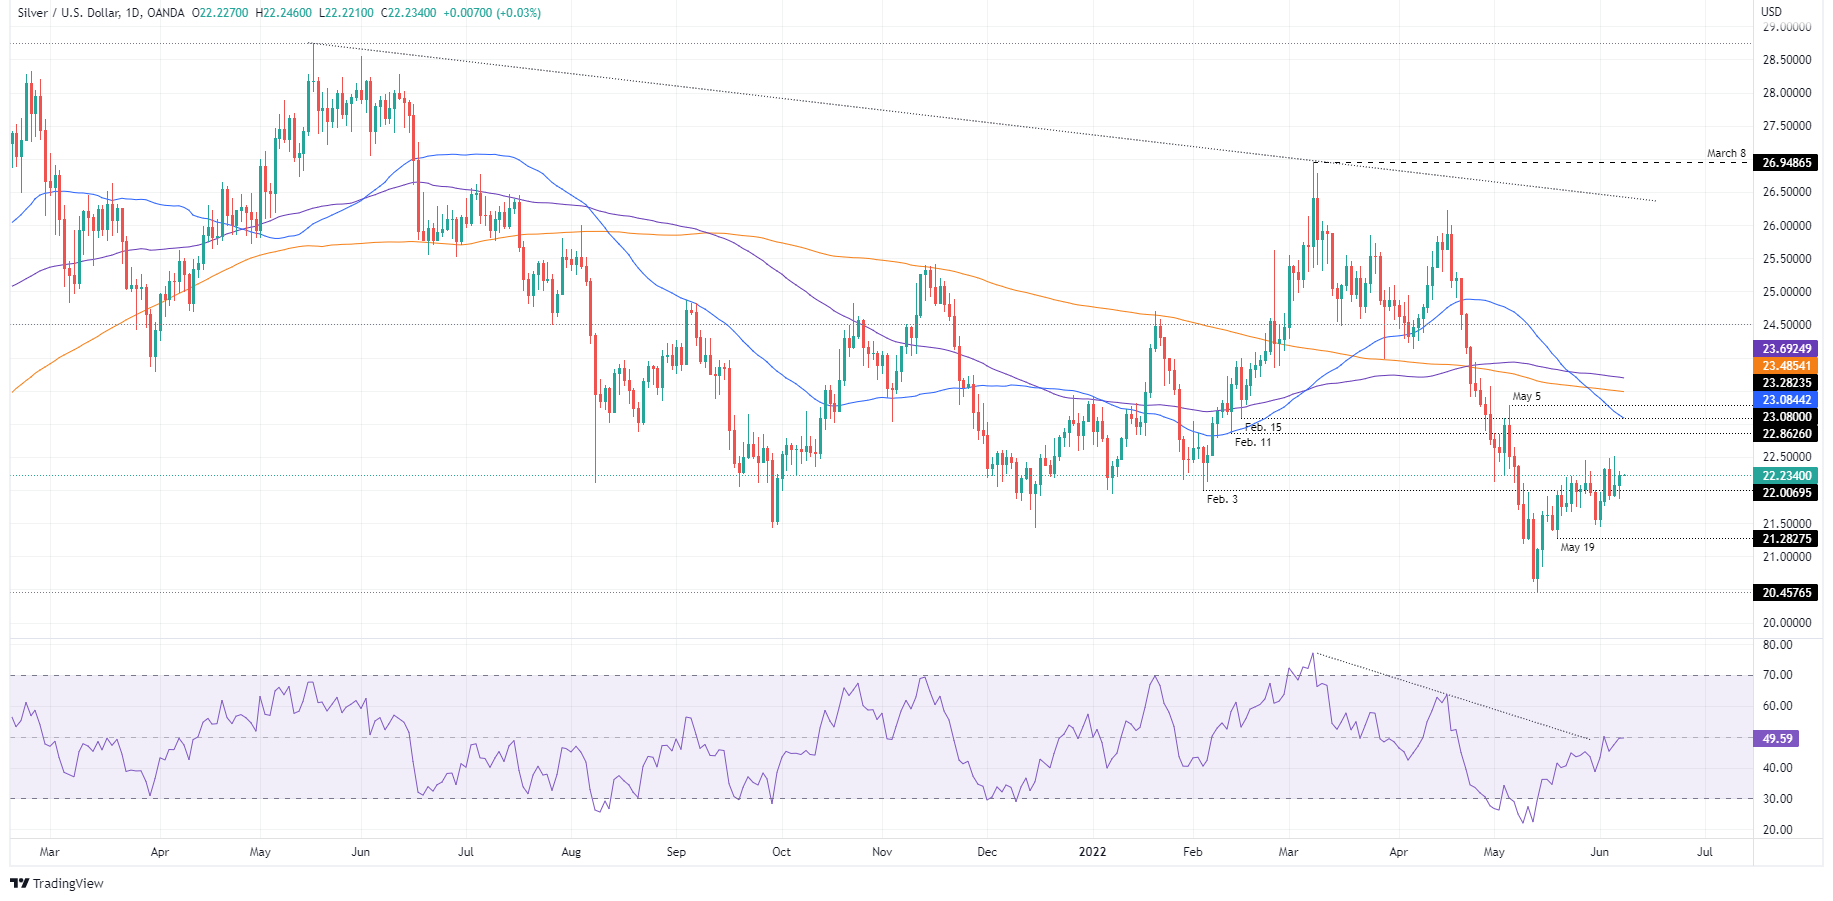
- Silver is recording gains of 1.43% in the week.
- The sentiment is mixed as the Asian session begins, US Treasury yields, and the greenback fall.
- US Treasury Secretary Yellen blames inflation on Russia’s invasion of Ukraine, though she recognized that inflation was not “transitory.”
- Silver Price Forecast (XAG/USD): Break above $22.50 to open the door towards $23.20s.
Silver (XAG/USD) records decent gains of 0.08%, as the Asian session begins, after Tuesday’s trading session when the white metal recorded gains of 0.70%. The XAG/USD is trading at $22.23 at the time of writing.
Asian equity futures are mixed ahead of Wednesday’s trading day. Wall Street finished with decent gains in choppy trading conditions, boosted by falling US Treasury yields and a softer US Dollar. The US 10-year benchmark note rate finished at 2.979%, below the 3% threshold, and the US Dollar Index, a gauge of the buck’s value, edges down 0.08%, sitting at 102.331.
In the commodities complex, XAG/USD benefitted from a soft greenback. It’s worth noting that precious metals rose in tandem, propelled by the factors above-mentioned.
Investors’ focus begins to shift towards Friday’s release of US inflation figures. Last week’s May Nonfarm Payrolls report showed that the US economy is far from slowing, despite the Q1 GDP contraction. Also, ISM PMIs, even though they slowed a tone, remain in expansionary territory.
Meanwhile, US Treasury Secretary Janet Yellen said that inflation is likely to stay high on Tuesday in an appearance with lawmakers. While Republicans blamed the US President Biden’s American Rescue Plan (ARP), Yellen said that “we’re seeing high inflation in almost all developed countries worldwide, and they have very different fiscal policies.” She added that Russia’s invasion of Ukraine is having an impact on energy and food prices globally.
Elsewhere the World Bank cut the 2022 global growth forecast to 2.9% from 4.1% in January and reported that growth in developed countries might slow down to 2.6%.
Silver Price Forecast (XAG/USD): Technical outlook
XAG/USD remains downward biased, as shown by the daily moving averages (DMAs). But, the correction from year-to-date lows near $20.40s to $22.50s might open the door for further gains, targeting the confluence of the 50-day moving average (DMA) and the February 11 daily low-turned-resistance at $23.08.
Therefore, the XAG/USD’s first resistance would be the June 6 daily high at $22.51. Breach of the latter would expose the confluence mentioned above at around $23.08. Once cleared, XAG/USD’s next supply zone would be the May 5 daily high at $23.28.
Key Technical Levels
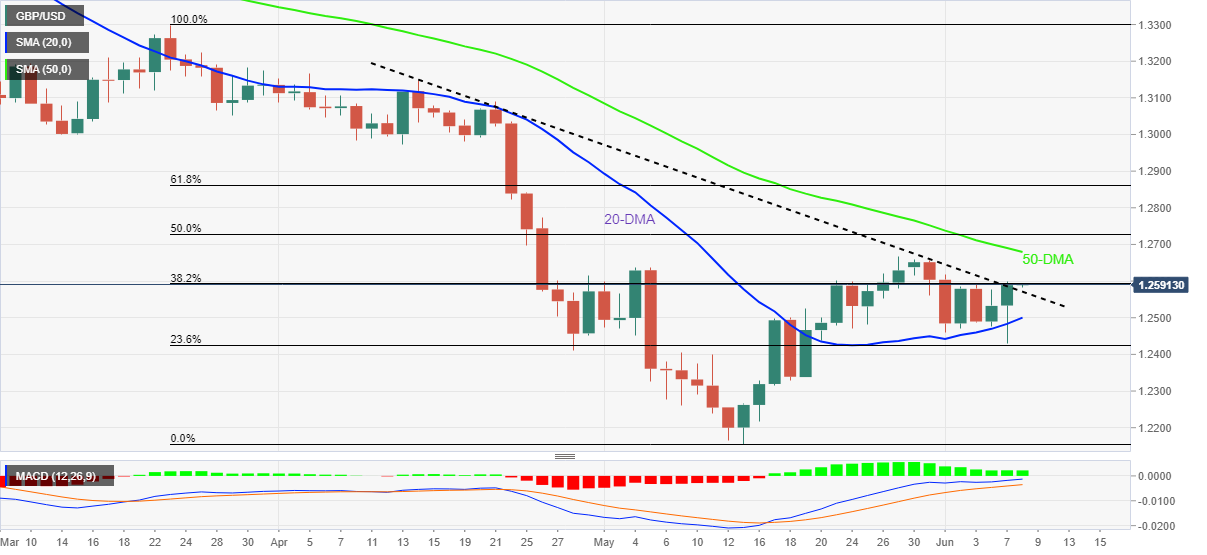
- GBP/USD grinds higher after staging notable rebound from three-week low.
- Bullish MACD signals, break of two-month-old resistance favor buyers.
- May’s peak, 50-DMA test upside momentum, sellers await 20-DMA breakdown.
GBP/USD holds onto the short-term key resistance break as bulls attack 1.2600 during Wednesday’s Asian session.
In doing so, the cable pair also cheers the clear recovery from the 20-DMA amid bullish MACD signals.
However, last month's top and the 50-DMA, respectively around 1.2665 and 1.2680, challenge the GBP/USD pair buyers before giving them control.
Following that, a run-up towards 61.8% Fibonacci retracement (Fibo.) of March-May downside, near 1.2860, will gain the market’s attention.
Alternatively, pullback moves may initially aim for the previous resistance line from mid-May, around 1.2560, a break of which can direct GBP/USD sellers towards the 20-DMA support near 1.2500.
Should the cable pair closed beneath the 20-DMA support, the odds of witnessing a downside move towards the 1.2400 round figure can’t be ruled out.
GBP/USD: Daily chart
Trend: Further upside expected
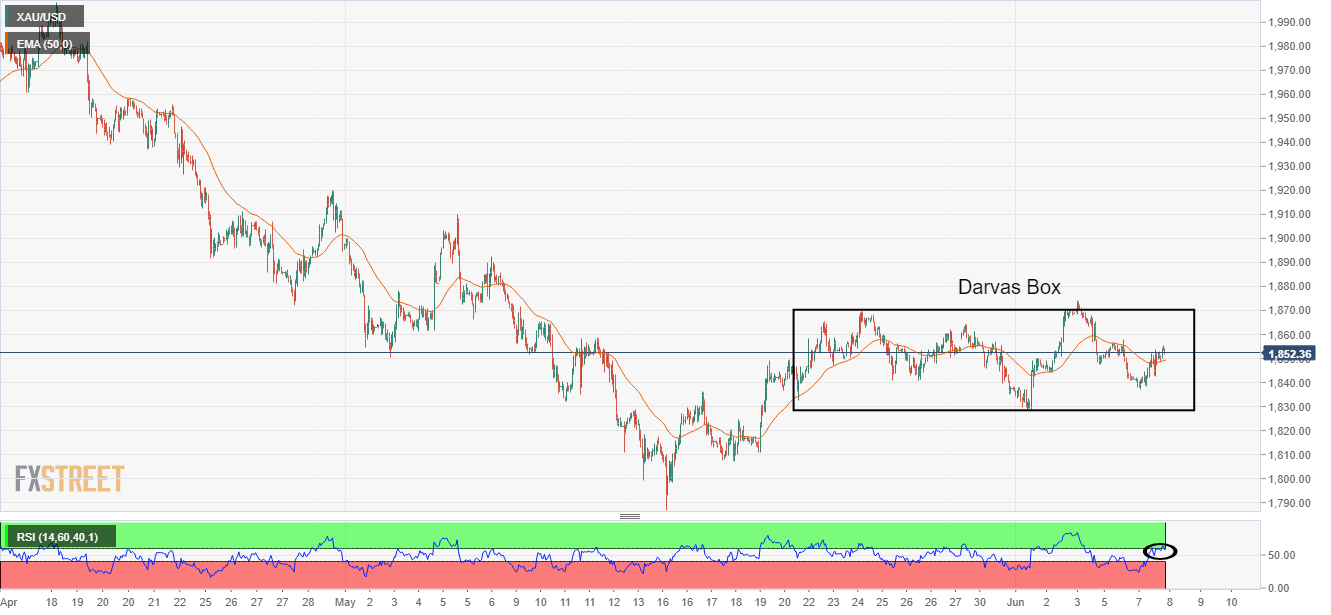
- Gold price is holding itself above $1,850.00 as investors ignored uncertainty ahead of the US inflation.
- The DXY has witnessed a decent sell-off which could drag the asset towards 102.00.
- Higher inflation and upbeat NFP will compel the fed to feature a bumper rate hike.
Gold price (XAU/USD) has displayed a minor correction after recording a high around $1,856.00 on Tuesday but is holding strongly above the crucial resistance of $1,850.00 as the US dollar index (DXY) has slipped sharply. The precious metal has been advancing higher gradually after hitting a low of $1,837.06 and is expected to extend gains if the bright metal oversteps Tuesday’s high at $1,855.64.
The DXY surrendered the majority of its gains recorded on Tuesday after failing to cross the critical barricade of 102.83. A rebound in the risk-on impulse after investors ignored the uncertainty ahead of the US inflation strengthened the risk-perceived currencies and the precious metal. The US Consumer Price Index (CPI) is expected to remain unchanged at 8.3% while the core CPI that doesn’t include food and energy prices may slip to 5.9% vs. the prior print of 6.2%.
The sustainability of the US inflation above 8% is going to put forward complications for the Federal Reserve (Fed). The Fed is going to dictate its monetary policy next week and elevated inflation along with the upbeat US Nonfarm Payrolls (NFP) will compel a rate hike decision.
Gold technical analysis
On an hourly scale, the gold price is oscillating in a wider range of $1,828.98-1,874.16 for a prolonged period. The precious metal is forming a Darvas Box chart pattern that signals a slippage in volatility followed by a breakout in the same. A 50-period Exponential Moving Average (EMA) at $1,849.74 is overlapping to the prices, which signals a rangebound move going forward.
Meanwhile, the Relative Strength Index (RSI) is struggling to enter into the bullish range of 60.00-80.00. An establishment in the same will strengthen the gold bulls.
Gold hourly chart
- The RBA has left the bulls in the driving seat ahead of key Us inflation data later this week and the Fed the following.
- A break of 0.7300 should lead to mitigation of the price imbalance between recent highs and potentially as far as 0.7450.
At 0.7233, AUD/USD has failed to make a higher high in the bullish cycle on a daily basis but it may have just picked up enough demand to see the bulls equipped enough to break beyond 0.7280 in the coming days. The Reserve Bank of Australia has put its peddle to the metal which could be the deciding factor in the battle between the bulls and the bears at this juncture.
The Reserve Bank of Australia's statement says explicitly that, “the Board expects to take further steps in the process of normalising monetary conditions in Australia over the months ahead.” The stronger language that had been set out in May suggests at least another 50bp increase is on the cards over the next few months, analysts at ANZ Bank argued. ''We think August, after the Q2 CPI print and a couple more employment reports. For July we’ve pencilled in a 25bp move at this stage, with 50bp clearly being a live option.''
However, the analysts also warned that Australians’ consumer confidence dropped 4.1% last week, to its lowest level since mid-August 2020. ''This most likely reflected cost-of-living concerns as inflation expectations rose to 5.7%, its highest weekly reading since early April. Consumers are especially pessimistic about the current economic outlook and their current financial circumstances.''
Meanwhile, there is little reason for the Fed to ease up anytime soon, as analysts at RBC Economics argued. ''With the US economy running hot, the Fed is moving “expeditiously” to a more neutral policy stance.''
The analysts there explained that the Fed's Chair Jerome Powell noted broad consensus on the committee that 50 bp hikes should be on the table at upcoming meetings—we’re with the market in thinking such moves are a virtual lock in June and July. ''We look for the Fed to revert to 25 bp hikes in September though it could continue with larger increments—a number of policymakers think front-loading hikes will put the committee in a better position later this year to evaluate the impact of tightening and assess whether more is needed.''
Markets will now look to this week's US inflation data to see if the dynamics there will offer anything to sway sentiment one way or the other, in the absence of Fed speakers this week. The date will be key to that assessment with the Fed wanting to see clear evidence that inflation is moving toward its 2% target before easing up on rate hikes.
AUD/USD technical analysis

The price has picked up demand at old resistance and that could carry the bulls through the overhead daily resistance in the coming days. A break of 0.7300 should lead to mitigation of the price imbalance between recent highs and potentially as far as 0.7450.
- USD/CAD stays pressured towards refreshing multi-day low after dropping the most in a week.
- US Treasury yields drowned on fears that tighter monetary policy will weigh on growth.
- Mixed data, hopes from US budget also underpinned market’s consolidation.
- Light calendar emphasizes on risk catalysts ahead of the key data/events.
USD/CAD holds lower ground near 1.2530 as bears cheer softer US dollar while ignoring inactive oil prices during Wednesday’s early Asian session. The Loonie pair’s latest weakness could be linked to the retreat in the US Treasury yields as markets brace for this week’s key data/events.
US Dollar Index (DXY) snapped two-day rebound while reversing from a fortnight high, around 102.30 at the latest, as the US 10-year Treasury yields drop back below 3.0% while positing the first daily loss in seven.
The retreat in the US Treasury bond yields could be linked to the recession fears emanating from the faster monetary policy normalization by the major central banks. The fears grew on comment from World Bank (WB) President David Malpass who warned that faster-than-expected tightening could push some countries into a debt crisis similar to the one seen in the 1980s.
It’s worth noting that a record monthly drop in the US trade deficit, down 19.1% to USD87.1bn for April, joined Canada’s mixed Ivey PMI for April and softer trade numbers, to also push the Bank of Canada (BOC) and the Fed towards more tightening. The same amplified growth fears and helped in the US bond market consolidation ahead of the US Consumer Price Index (CPI), as well as Canada’s jobs report, up for publishing on Friday.
Elsewhere, prices of Canada’s main export item, WTI crude oil couldn’t much cheer the US dollar weakness as the black gold dribbled around $120.00, mildly offered by the press time, on fears of softer energy demand, amid recession woes, as well as downbeat API data. That said, the weekly prints of the American Petroleum Institute’s (API) Crude Oil Stock data for the period ended on June 3 flashed an addition of 1. 845M barrels versus the previous contraction of 1.181M.
Amid these plays, the Wall Street benchmarks another positive daily close and exerted downside pressure on the US dollar’s safe-haven demand.
Considering the market’s consolidation ahead of Friday’s key data/events, the USD/CAD bears are likely to keep reins until the shift in the market sentiment trigger a corrective pullback from the multi-day low.
Technical analysis
A clear downside break of the 61.8% Fibonacci retracement (Fibo.) of October 2021 to May 2022 upside, around 1.2590, directs USD/CAD prices towards a seven-month-old support line near 1.2500.
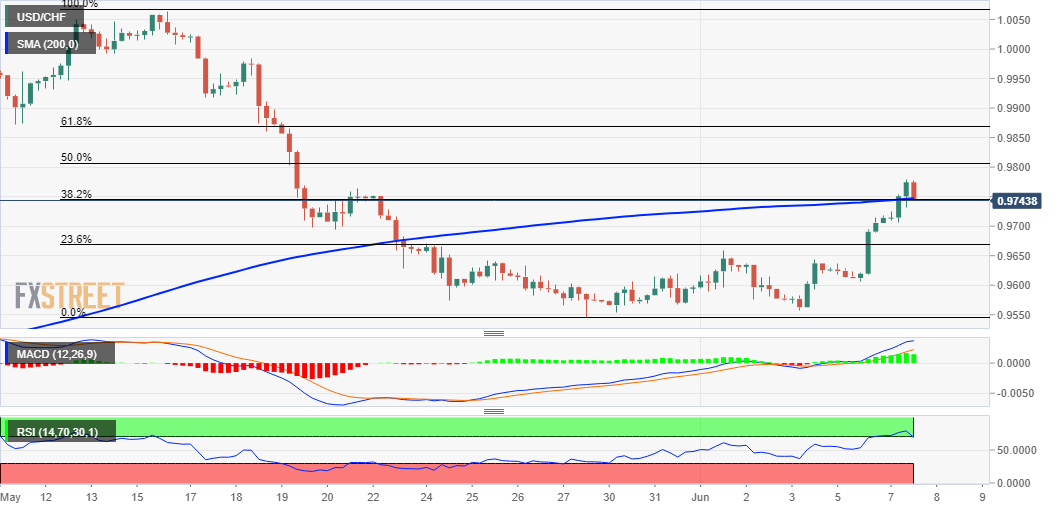
- USD/CHF is attempting a recovery after a downside move to near 0.9720.
- The US Inflation will dominate the FX domain despite an unchanged forecast at 8.3%.
- The Swiss docket will report the Unemployment Rate, which is seen at 2.2%.
The USD/CHF pair is finding bids around 0.9720 as the asset has displayed some signs of exhaustion in the downside move. On a broader note, the greenback bulls have remained stronger over the last week, however, profit-booking near 0.9779 brought a minor correction in the asset.
Going forward, the asset is likely to dance to the tunes of the US Inflation, which is due on Friday. As per the market consensus, the US Consumer Price Index (CPI) is seen unchanged at 8.3% on annual basis. The sustainability of the price pressures above 8% is a nightmare for US households as elevated inflation is dampening the paychecks. However, the annual core CPI is expected to drop to 5.9% from the prior print of 6.2%, which may bring some relief to the Federal Reserve (Fed).
Meanwhile, the US dollar index (DXY) is displaying a balanced market profile in a 102.26-102.35 range after a vertical downside move. It is worth noting that the correction in the USD/CHF pair is lower in comparison with the fall in the DXY, which signals that the Swiss franc bulls are also weak.
On the Swiss franc front, investors are focusing on the Unemployment Rate, which is due in the European session. The jobless rate is seen stable at 2.2% on monthly basis. The Swiss National Bank (SNB) is continued with its prudent monetary policy amid lower inflation levels and is expected to continue dedicating to the same till it finds a significant change in the economic catalysts.
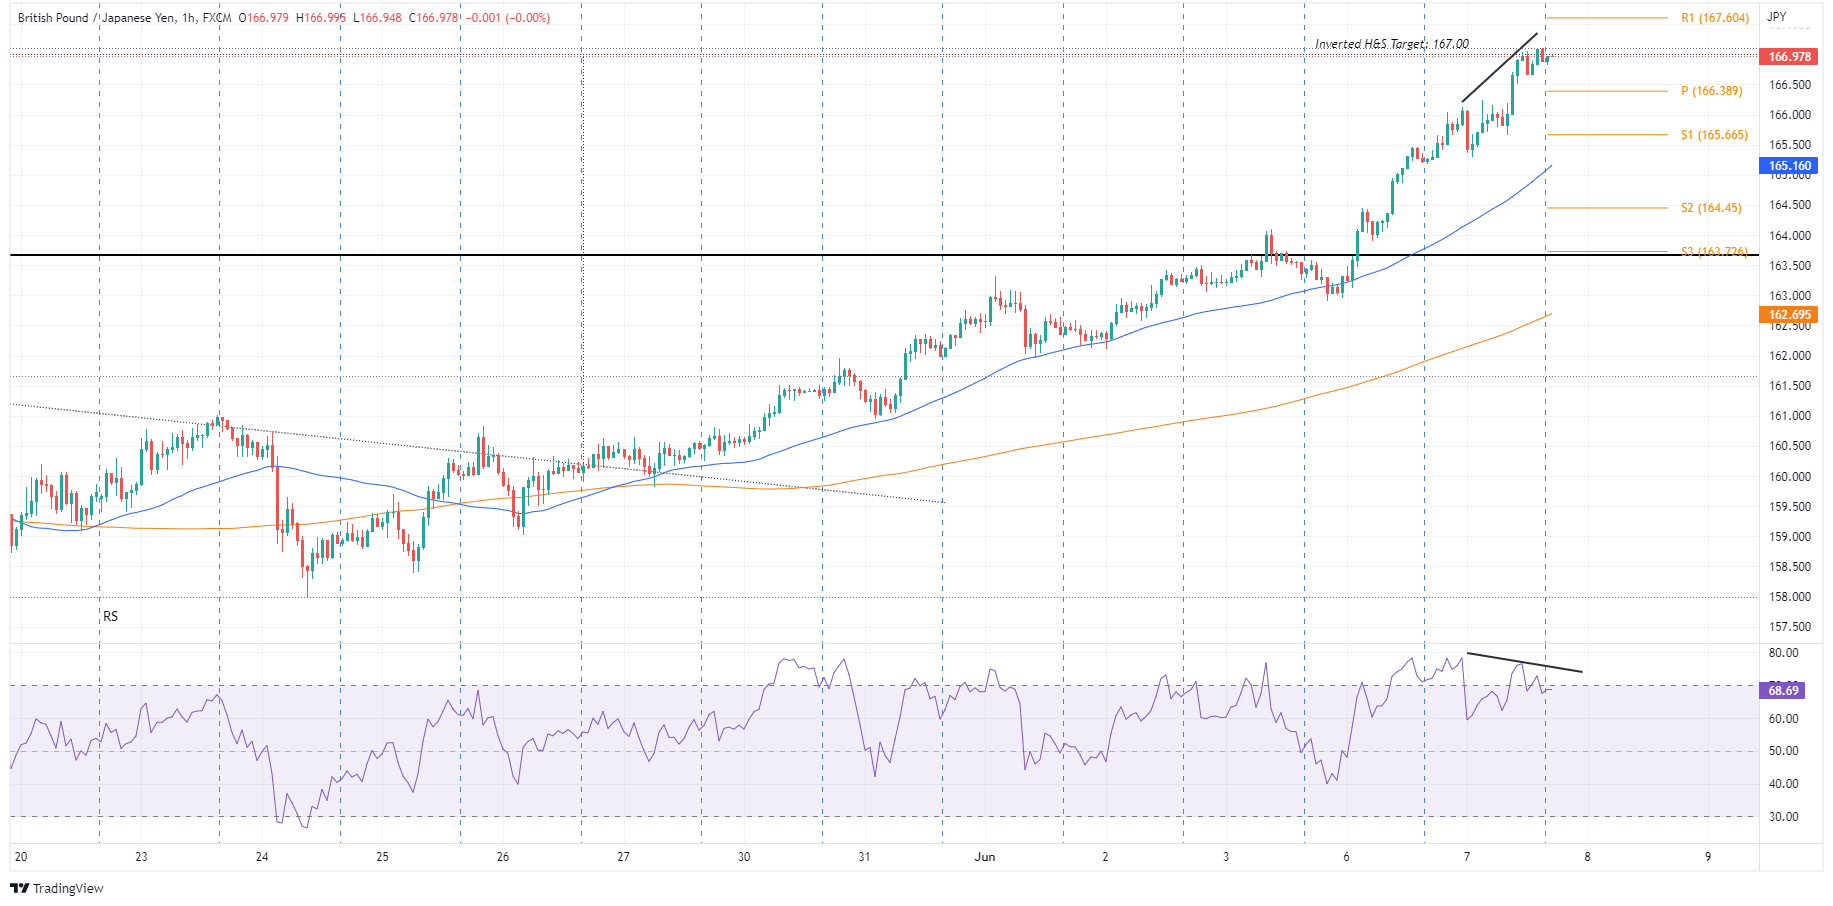
- On Tuesday, the GBP/JPY reached the inverted head-and-shoulders chart pattern at 167.00.
- GBP/JPY Price Forecast: A negative divergence in the 1-hour chart might open the door for a pullback towards 165.50.
The GBP/JPY rallied during the North American session and reached a fresh-seven-week high above 167.00 for the first time since April 18, though as Wall Street’s closed, the cross-pair retraced towards the high 166.90s. At the time of writing, the GBP/JPY is trading at 166.97.
US equities finished the session in an upbeat mood. UK political turmoil, alongside global central bank tightening conditions, keeps investors uneasy. In fact, the Reserve Bank of Australia (RBA) added its name to the list of central banks, hiking 0.50%, leaving the ECB, the BoJ, and the Swiss National Bank (SNB), behind.
On Monday, UK Prime Minister Boris Johnson achieved a victory on the no-confidence vote. Nevertheless, his position weakened, leaving it exposed after the party-gate on his office, despite Covid-19 restrictions, in 2020. The GBP rallied as a relief to the news, though a slowing economic outlook in the UK puts the stagflation scenario on the table.
On Tuesday, the GBP/JPY opened near the day’s lows, below the 165.50 mark, and began its uptrend. Towards fresh weekly highs. Once European traders got to their desks, the GBP/JPY corrected just above the daily lows and rallied sharply towards 167.00.
- Also read: GBP/JPY Price Analysis: An inverted head-and-shoulders targeting 167.00
GBP/JPY Price Forecast: Technical outlook
On Monday, I wrote a note about an inverted hammer in the daily chart. On Tuesday, the inverted head-and-shoulders target was fulfilled as the GBP/JPY reached a daily high at 167.00, and the next target on the upside would be the YTD high at 168.43. Nevertheless, the Relative Strength Index (RSI) is closing sharply towards overbought conditions, at 68.48, opening the door for consolidation before the uptrend continues.
The GBP/JPY 1-hour chart shows the cross is topping in the near term, confirmed by the RSI. Also, the GBP/JPY price action printed a series of successive higher-highs, but on a weaker momentum, as RSI edges lower, meaning a negative divergence looms. Hence, the GBP/JPY might be headed to the downside.
That said, the GBP/JPY first support would be the daily pivot at 166.38. Break below would expose the S1 daily pivot at 165.66, followed by the S2 pivot at 164.45.
Key Technical Levels
- NZD/USD bulls fly into a wall of resistance.
- Bears could be lurking and eager for a discount.
At 0.6490, NZD/USD is holding on to bullish territory but looking over the abyss following Monday's roller-coaster ride where the price fell to a low of 0.6422 in mid-day Asia trade. The bird is not airborne again but is up against four-hour resistance around 0.65 the figure.
''The bounce off overnight lows looks to have been courtesy of broad USD weakness as bond yields there slip back below 3%,'' analysts at ANZ Bank noted. As measured by the 10-year Treasury yield, US yields are falling on the second day of trade this week, down from the 3.062% highs to lows of 2.963%. Consequently, the greenback was dropping to the lows of the day near 102.26 at the time of writing, as measured by the US dollar index (DXY), vs. a basket of six currencies.
''There is no local data today, and the Kiwi is likely to continue to dance to a global beat, and it’s arguable that the greatest source of downside is USD weakness, whereas domestic factors (hard landing etc) appear to pose more downside risks,'' the analysts at ANZ Bank said.
In prior notes, the analysts explained that ''higher rates are helping the Kiwi (that’s evident in NZD/AUD) but it’s likely that the May MPS marked peak RBNZ ‘hawkish surprise’. It’s hard to see future MPSs being so hawkish relative to market expectations; that makes us more cautious than otherwise on the NZD’s prospects. Fears of a hard landing here also continue to percolate; that’s another potential NZD headwind.''
NZD/USD technical analysis
The price is meeting a key resistance area and if this were to hold, the bias will be on the downside again for a potential lower low within the broader bear trend.
- The EUR/USD remains almost flat in the week, though losing 0.09%.
- Sentiment remains positive, though the EUR/USD remains in choppy trading ahead of ECB’s decision and US inflation numbers.
- EUR/USD Price Forecast: To resume downwards if the major breaks below 1.0700.
EUR/USD pares some of Monday’s losses and tests the 50-day moving average (DMA) to the upside on Tuesday during the North American session. At 1.0709, the EUR/USD exchanges hands on top of the previously-mentioned DMA at the time of writing.
A positive mood and a weaker US Dollar lift the EUR/USD
US equities are trading with gains as Wall Street’s closing looms, reflecting Investors’ positive mood. Market players’ worries about elevated prices and the Federal Reserve’s tightening conditions eased. Consequently, US Treasury yields fell, underpinning the greenback, a tailwind for the EUR/USD.
The US 10-year Treasury yield pares Monday’s gains and loses six basis points, down at 2.981%. In the meantime, the US Dollar Index, a measure of the buck’s value, grinds lower some 0.10%, sitting at 102.302.
Data-wise, the Eurozone economic docket featured the S&P Global Construction PMI for the fourth largest economies in the block, alongside the Euro area figures. The readings were mixed, though they failed to trigger a reaction in the pair. Later in the week, the European Central Bank (ECB) monetary policy lurks. The ECB President Lagarde & Co. are expected to hold rates unchanged, though market players await forward guidance regarding the APP and signals that the bank would shift policy to normal.
Meanwhile, 10-year bond yield spreads across the Euro area began to widen. Greece and Italy spread have hit the 3.87% and 3.42% threshold, respectively,
The US economic docket featured the Trade Balance, which helped ease the deficit, narrowing the most in almost nine and half years in April, as exports bounced to a record high of $252.6 billion vs. March’s $244.1 billion.
Ahead of the week, Initial Jobless Claims, inflation figures, and Consumer confidence would give GBP/USD traders the current status of the US economy.
EUR/USD Price Forecast: Technical outlook
The EUR/USD has a downward bias, despite the major’s correcting from YTD lows around 1.0300s to 1.0780s. Also, EUR/USD traders pushed the pair near the 50-day moving average (DMA) at 1.0705, though a daily close below would exacerbate a move towards the June 1 swing low at 1.0627, as the first target.
The daily moving averages (DMAs) above the spot price have a downward slope. The Relative Strenght Index (RSI), albeit at bullish territory at 53, aims lower, meaning that selling pressure begins to mount in the pair.
The EUR/USD first support would be 1.0700. Break below would expose the June 1 low at 1.0627, followed by the May 20 daily low at 1.0532, and the May 19 low at 1.0460.
- The price is running into monthly resistance but prior highs near 102.80 will be eyed if the bulls stay with the course.
- The yen is suffering a central bank divergence blow and a potential paradigm shift.
At 95.89, AUD/JPY is strong and rising over 1% on the day following a surprise move and hawkishness from the Reserve Bank of Australia. AUD/JPY rallied to a high of 96.14 on the back of the RBA's rate hike and the statement that ays explicitly that, “the Board expects to take further steps in the process of normalising monetary conditions in Australia over the months ahead.” The stronger language that had been set out in May suggests at least another 50bp increase is on the cards over the next few months, analysts at ANZ Bank argued.
By contrast, the weakening trend in the yen has reasserted itself while the monetary policy divergences will continue to widen and that should lead to continued yen weakness, as analysts at Brown Brothers Harriman pointed out. ''Governor Kuroda walked back his comments yesterday regarding greater tolerance on the part of consumers to accept higher prices, noting 'I didn’t necessarily say it in an appropriate way.' Officials have the tricky task of explaining exactly why exiting years of deflation should be welcome. April leading and coincident indexes were also reported.''
As a consequence USD/JPY is trading at a new high for this cycle near 133 which has helped to elevate the Aussie/yen cross further. ''We maintain our long-standing target of the January 2002 high near 135.15,'' the analysts argued.
Meanwhile, historically, the yen's correlation to stock markets has been negative as it tends to benefit from risk-off tones, but since April of this year, that correlation to the S&P 500 has broken down as follows and instead, the DXY is picking up the flack:
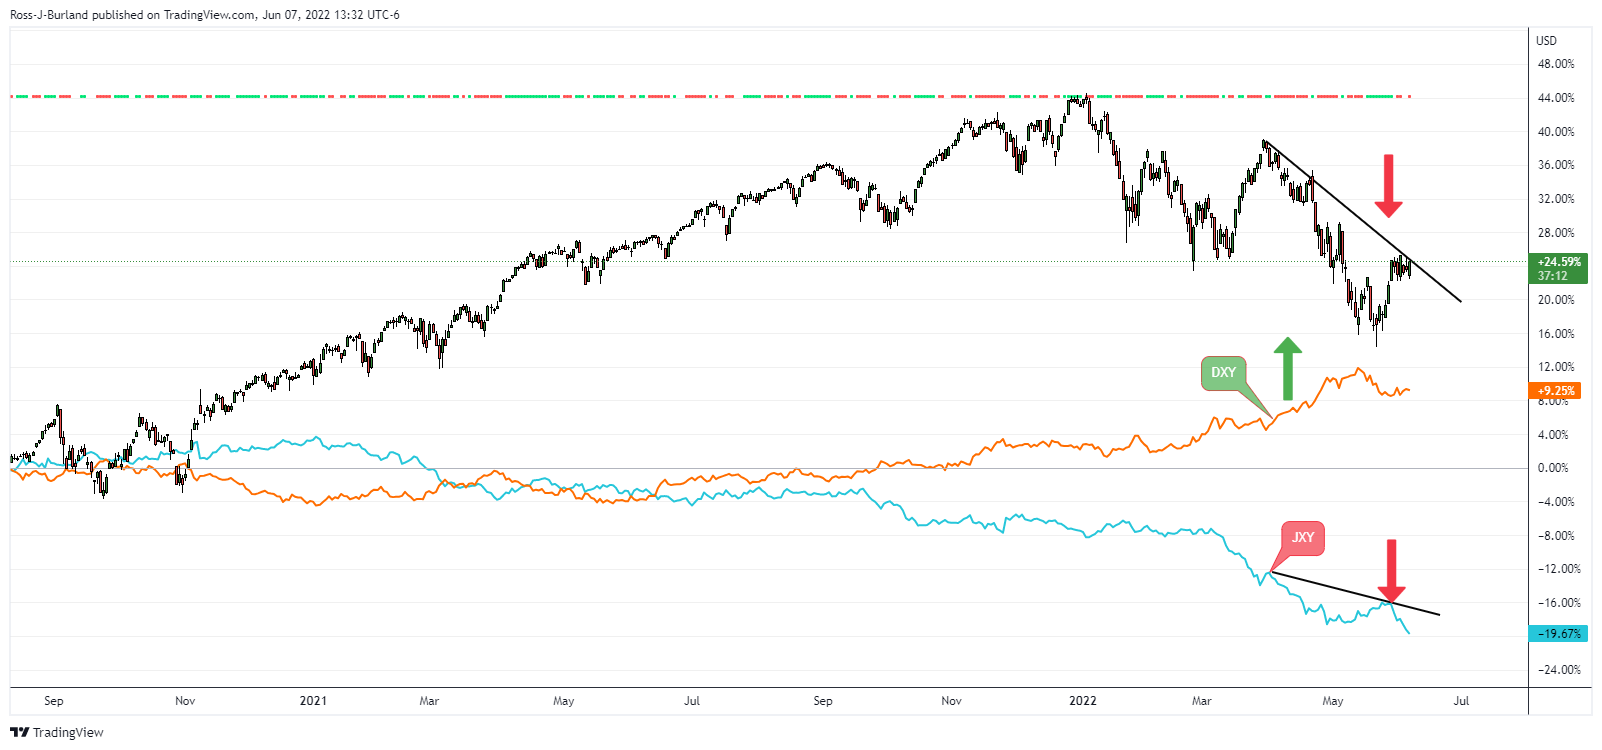
The indicator at the top is a trend bias indicator based on the strength of the US dollar. In this scenario, it is indicated that the S&P 500 is destined to move lower. Meanwhile, the JXY index that measures the yen vs. a basket of currencies is moving lower, despite this while the greenback's trend is bullish. Whether this is a paradigm shift or just a brief irregularity will be important for the direction of AUD/JPY, as historically, the pair has been regarded as the forex risk barometer.
If the yen continues to decouple from risk, then the AUD/JPY cross will more likely depend on the RBA and central bank divergences. The Bank of Japan is committed to conducting fixed-rate operations, which will be expected to keep this sharp Japanese yen depreciation going for the time to come which could expose a much higher level in AUD/JPY. After all, the BoJ’s efforts to anchor the yield target around 0% is more important to it than the cost of living and the central bank has made it clear that it firmly believes that higher yields would impose bigger costs on the economy more than FX depreciation.
AUD/JPY technical analysis
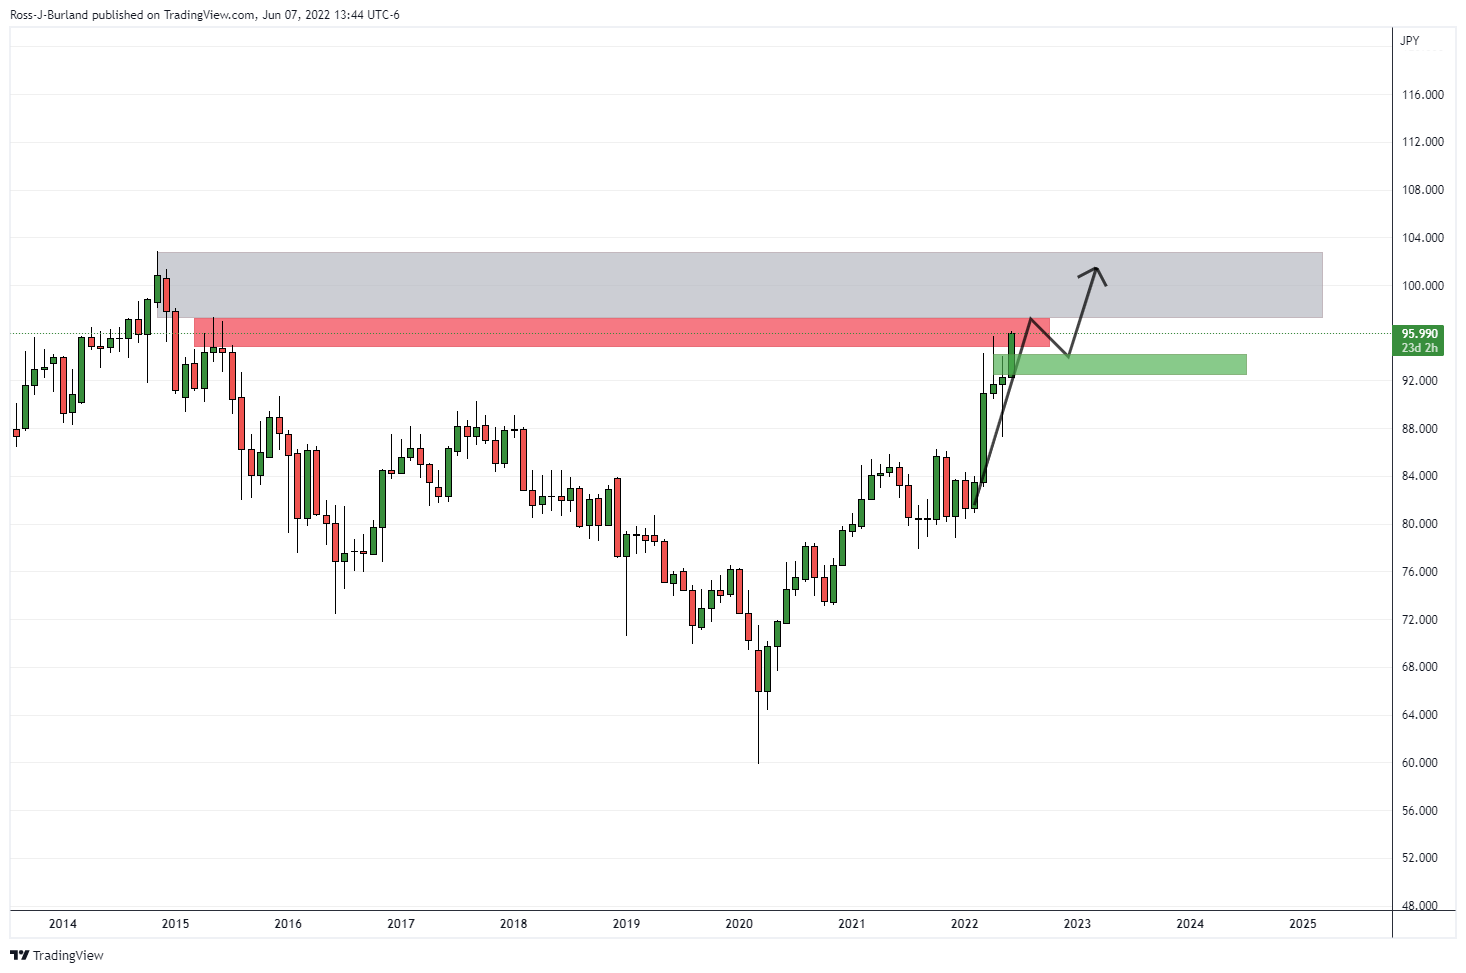
The price is running into resistance but following a restest of prior highs that could be expected to act as support, should the bulls commit, then the monthly highs near 102.80 will be eyed.
What you need to take care of on Wednesday, June 8:
Risk aversion was once again the main theme, although the dollar edged lower against its major rivals in the last trading session of the day. Lower US Treasury yields undermined demand for the greenback, as the 10-y note yields 2.97%, after peaking earlier in the day at 3.06%.
The World Bank lowered this year's global GDP forecast to 2.9% from 4.1%. WB President David Malpass warned that faster-than-expected tightening could push some countries into a debt crisis similar to the one seen in the 1980s. Malpass added that new energy and food production is imperative for Europe and the world, as it would help reduce prices and inflation expectations.
The EUR/USD pair recovered from a fresh weekly low of 1.0651 to end the day a few pips above 1.0700. The GBP/USD suffered an early knee-jerk and bottomed at 1.2429, but later recovered to end the day near 1.2590.
US Treasury Secretary Janet Yellen testified on the Fiscal Year 2023 Budget before the Senate Finance Committee. She said that the US economy faces challenges from "unacceptable levels of inflation", as well as headwinds from supply chain snags. An appropriate budget is needed to complement Fed’s actions to tame inflation without harming the labor market.
Wall Street managed to revert its negative tone and posted gains in the last hours of trading, helping mostly commodity-linked currencies. The AUD/USD pair is currently in the 0.7230 price zone, while USD/CAD trades around 1.2520, holding at its lowest in seven weeks.
The USD/JPY pair kept advancing, reaching a fresh multi-year high of 132.99 to end the day at 132.55. USD/CHF posted modest intraday gains to settle around 0.9722.
Weaker US government bond yields pushed XAUUSD higher. The bright metal changes hands at $1,855 a troy ounce. Crude oil prices, on the other hand, benefited from the positive tone of Wall Street, with WTI at $120.20 a barrel.
Markets’ volatility reflects uncertainty about the economic future amid fears aggressive quantitative tightening will provoke recessions among major economies.
Top 3 Crypto Price Prediction Bitcoin, Ethereum, Ripple: Crypto’s manipulation proves decentralization is a myth
Like this article? Help us with some feedback by answering this survey:
- The shared currency is climbing in the week by 1.17%.
- Market players’ sentiment turned positive, though it could fluctuate at anytime.
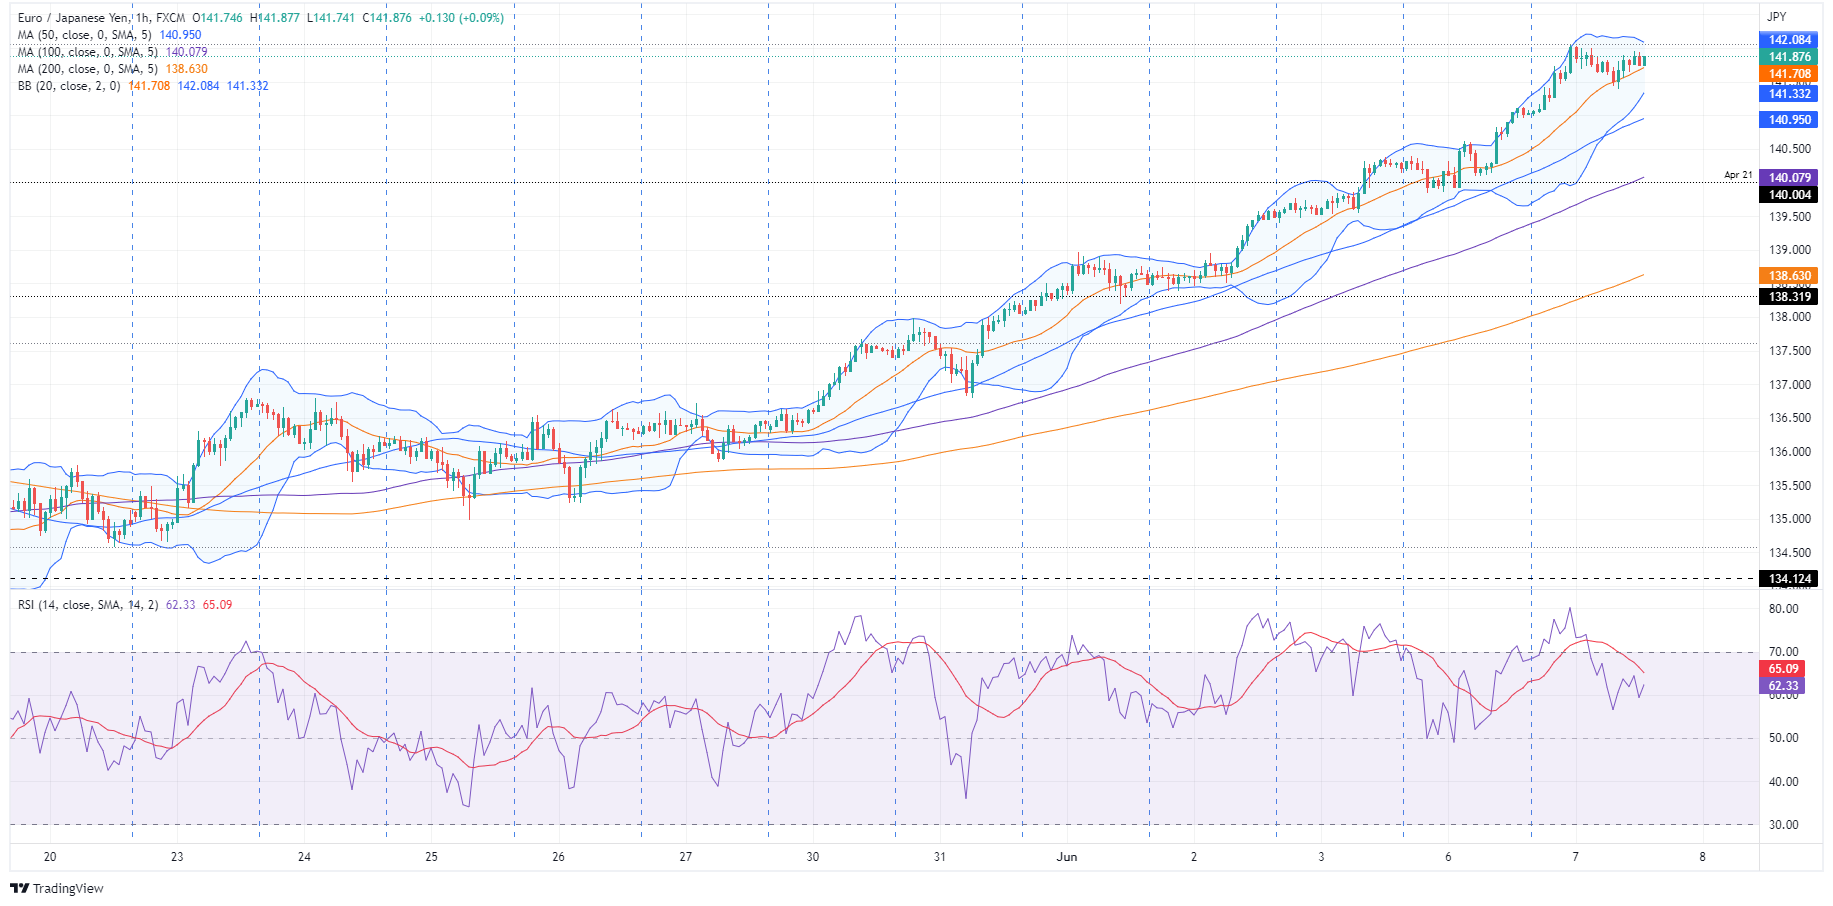
- EUR/JPY Price Forecast: Consolidating, but subject to mean reversion due to the size and speed of the rally; might fall to the 140.00s before resuming upwards.
The EUR/JPY is soaring to 7-year highs, to a level last seen in January 2015, at around 142.06, though the euro bulls are taking a breather as the EUR/JPY remains positive below the 142.00 mark. At 141.88, the EUR/JPY reflects investors’ mixed mood as US equities fluctuate.
Investors’ mood is fragile, fluctuating between positive/negative. Of late, US equities shrugged off worries of the global central bank tightening monetary conditions and the possibility of the US reaching a recession.
Tuesday’s EUR/JPY price action witnessed the cross-currency opening around 141.00. Through the end of the Asian-beginning of the European session, the EUR/JPY rallied sharply towards the 7-year high at 142.06, retreating later to the R1 daily pivot point at 141.50.
EUR/JPY Price Forecast: Technical outlook
From the EUR/JPY daily chart perspective, the cross is upward biased. However, the Bollinger’s band, alongside the Relative Strenght Index (RSI) shows that volatility has increased sharply. In fact, the EUR/JPY is in overbought territory, as shown by the RSI above 70, opening the door for a mean-reversion move before resuming the ongoing bias.
In the near-term, the EUR/JPY 1-hour chart depicts the cross consolidating in the high 141.00s, near the 142.00 area, forming a top that could evolve to a double-top chart pattern. Also, the EUR/JPY exerts pressure on the 20-hour simple moving average (SMA), which, once cleared, would send the EUR/JPY falling towards the 50-hour SMA at 140.94. A break below would expose the 100-hour SMA at 140.07.
Key Technical Levels
- Gold is trapped below a critical 4-hour resistance and moving sideways out of the daily trendline resistance.
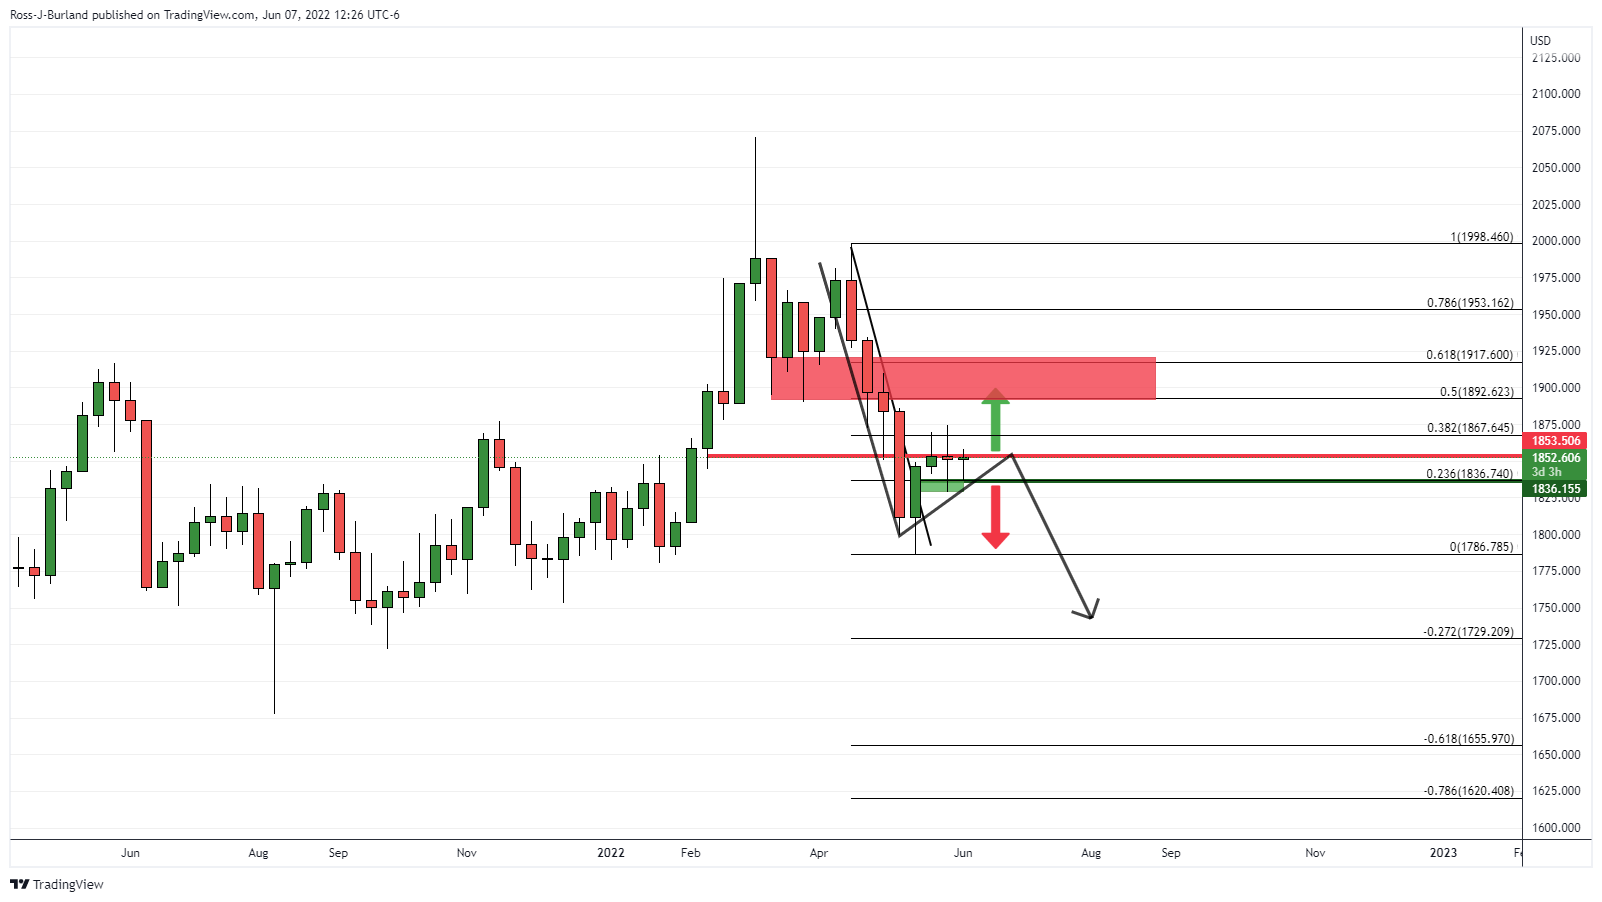
- The weekly chart's bias is to the downside and critical US inflation data and central bank meetings could be the catalyst.
At $1,850.06, the gold price is 0.45% higher and trading between a low of $1,837.06 and a high of $1,853.63 on the day so far. The markets are somewhat volatile as traders weigh the fickle outlooks for global growth, the latest of which comes from the World Bank.
''Global economic growth will likely lose momentum this year, with the Ukraine war, soaring inflation and rising interest rates threatening what is now considered a precarious recovery," the World Bank stated on Tuesday. It expects Real Gross Domestic Product to rise just 2.9% in 2022, significantly lower than a 4.1% rise previously projected in January. The US economy is expected to expand 2.5% this year, down 1.2 percentage points from the prior forecast.
Meanwhile, the US dollar climbed to a two-week high while on the back of rising US Treasury yields that had supported the greenback. However, as measured by the 10-year Treasury yield, they are falling on the second day of trade this week, down from the 3.062% highs to lows of 2.963%. Consequently, the greenback is dropping to the lows of the day near 102.30 at the time of writing, as measured by the US dollar index (DXY), vs. a basket of six currencies.
The lower yields and greenback are supporting the gold price that was already being boosted by the mounting inflation concerns. While the yellow metal yields little compared to bonds, it benefits from the safe-haven bids for the precious metals. The surprise 50-basis-point rate increase in Australia was the catalyst at the start of the day which has jolted the financial markets into a risk-off mode amid concerns over policy tightening ahead of a European Central Bank meeting this week.
The Reserve Bank of Australia's statement says explicitly that, “the Board expects to take further steps in the process of normalising monetary conditions in Australia over the months ahead.” The stronger language that had been set out in May suggests at least another 50bp increase is on the cards over the next few months, analysts at ANZ Bank argued.
However, whether the precious metal can continue to benefit in a straight line in such a hawkish environment is questionable. As authors at Reuters pointed out, ''although gold is considered a hedge against higher inflation, interest rate hikes remain a potential headwind since that translates into a higher opportunity cost of holding non-yielding bullion.''
In this regard, analysts at TD Securities said in a note that "the gap between gold and real rates may be attributed to both an undue rise in real rates given quantitative tightening, and to the still-massive amount of complacent length being held in gold, keeping the yellow metal's prices elevated."
Meanwhile, besides the ECB this week, traders will be looking to the US inflation data due Friday for clues on the Federal Reserve's interest rate hike trajectory. We are in a blackout period in terms of Fed speakers, so the data will be important ahead of the Federal Open Market Committee meeting on June 14-15 where another 50 basis points of rate hikes are currently being priced in.
Gold technical analysis
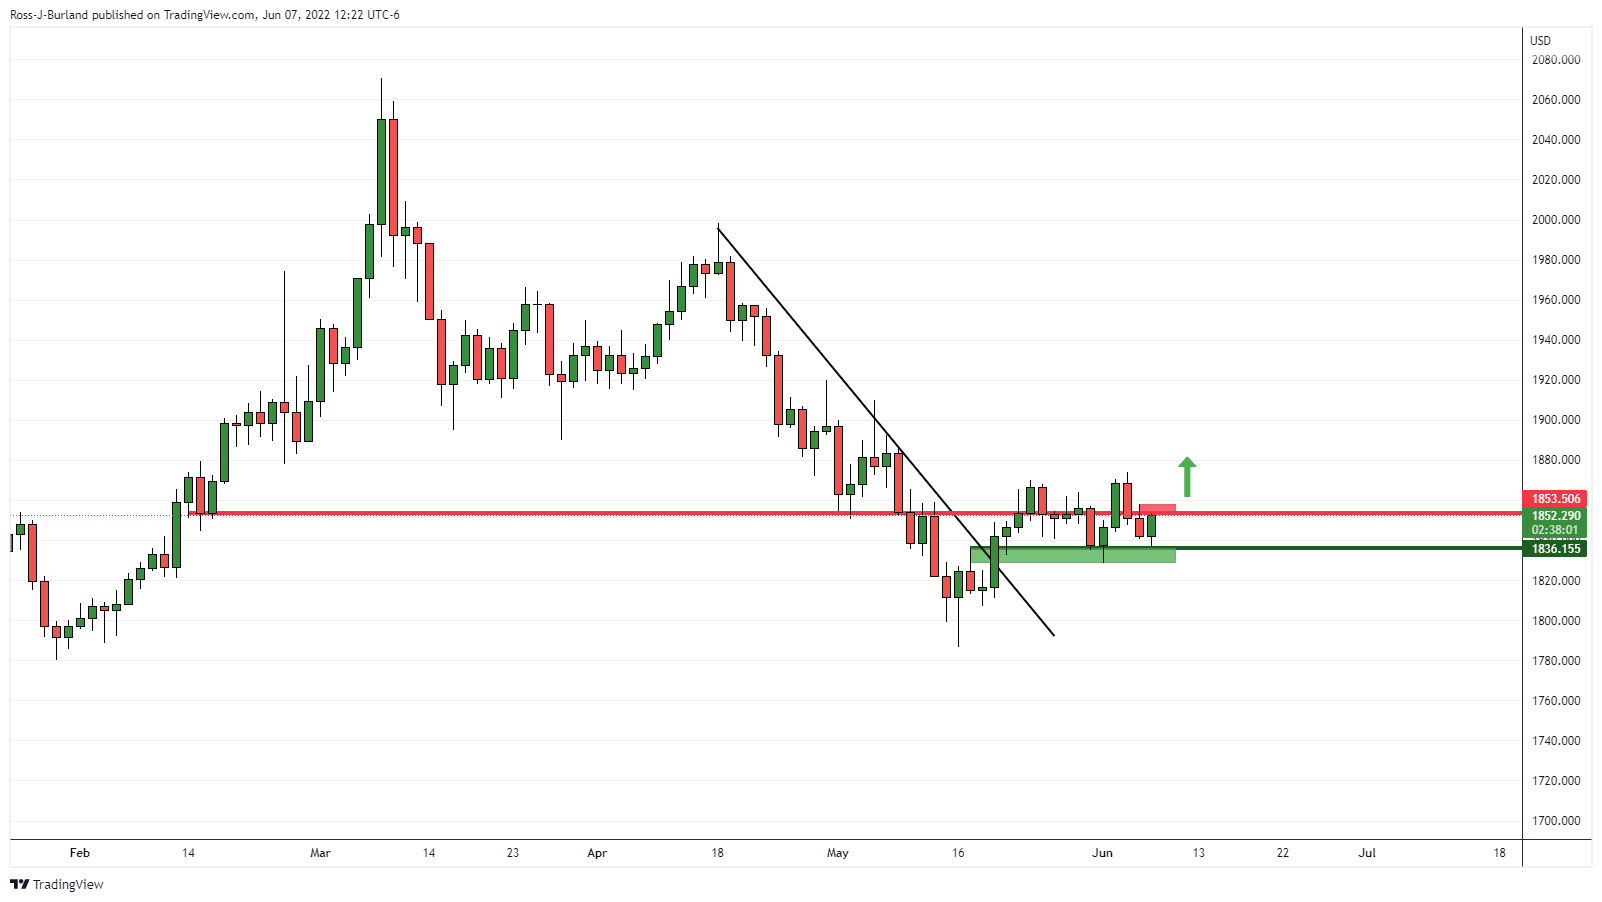
On the daily chart above, the gold price is bouncing around along a support structure but the price is yet to convince to the upside following a break of resistance when it moved out from beneath the daily dynamic trendline resistance.

On the 4-hour chart, the price needs to break this meanwhile resistance if the bulls are going to enjoy a spell of fresh air out of the consolidation phase with prospects of a bullish continuation and meaningful correction of the broader downtrend, as per the weekly chart below:
- The GBP/USD remains positive on the week, up by 0.82%.
- The UK Prime Minister Boris Johnson won a no-confidence vote, and the GBP reacted positively.
- The World Bank reduces the global economic growth from 4.1%.
- UK’s PMI remains in expansionary territory, showing the economy is slowing.
- The US Trad deficit narrowed the most in nearly 9 ½ years.
The British pound climbs for the second straight day amidst two days of a volatile trading session, courtesy of political issues, mainly the Boris Johnson no-confidence vote on Monday. At the time of writing, the GBP/USD is trading at 1.2593, gaining 0.54%.
UK’s PM Boris Johson to remain as Prime Minister, the GBP/USD edges up
So far, the GBP/USD remains buoyant, courtesy of Boris Johnson’s victory, although by a tight margin, spurred a brief relief rally on the pound. Also, falling US Treasury yields narrow the spread between the 10-year US and UK bond yields. However, the sentiment shifted negative, as European bourses closed with losses, while US equities showed some weakness, except for the Russell 2000, up by 0.53%.
After Wall Street opened, the World Bank lowered the global growth forecast to 2.9% from 4.1% in January. World Bank President David Malpass said that “the risks of stagflation, the Russo-Ukraine war, and lockdowns in China have been hammering growth and that a recession will be hard to avoid for many countries. Meanwhile, though global inflation is expected to moderate next year, it will likely remain above target in many economies.“
Worth noting that in the Asian session, the Reserve Bank of Australia (RBA) hiked rates by 0.50%, adding to the list of “aggressive” central banks.
In the meantime, the US Dollar Index, a gauge of the buck’s value vs. six peers, records minimal losses of 0.01%, sitting at 102.401, a tailwind for the GBP/USD.
Economic data: UK’s data boost the pound, and the US Trade deficit shrinks
The UK economic docket featured the S&P Global/CIPS UK Services and Composite PMIs indices. The Services rose by 53.4, higher than expected but trailed the 58.9 April’s reading. Composite rose by 53.1, showing that activity is slowing, meaning that the UK stagflationary scenario looms.
Earlier, UK Retail Sales shrank by 1.5% YoY, vs. a -1.70% a year before. Helen Dickinson, BRC’s CEO, said, “Sales continued to see declines as the cost-of-living crunch squeezed consumer demand. Higher value items, such as furniture and electronics, took the biggest hit as shoppers reconsidered major purchases during this difficult time.”
The US economic docket featured the Trade Balance, which showed that the deficit narrowed by the most in almost nine and half years in April, as exports jumped to a record high of $252.6 billion vs. March’s $244.1 billion. Late in the week ahead, Initial Jobless Claims, inflation figures, and Consumer confidence would give GBP/USD traders the current status of the US economy.
Key Technical Levels
The Reserve Bank of Australia (RBA) rose rates by 50 bps on Tuesday to 0.85%. Analysts at Wells Fargo expect the RBA to deliver another 50 bps rate hike in July to help tame inflation, before reverting to the more typical 25 bps increments in August, November, and December, which would bring the Cash Rate to 2.10% at the end of 2022. They expect the Australian dollar to soften against the US dollar over the medium-term as the RBA will still lag behind the Federal Reserve.
Key Quotes:
“The Australian economy has shown solid economic trends this year, including resilient growth and a tight labor market. Underlying inflation has also accelerated above the Reserve Bank of Australia's (RBA) medium-term target. We expect inflation to remain elevated in the coming quarters and see potential for wage growth to quicken as well.”
“Even with this series of steady monetary tightening, we expect that RBA rate hikes will still lag behind the Federal Reserve's and fall short of the tightening currently priced in by market participants. As a result, we expect the Australian dollar to soften against the U.S. dollar over the medium-term.”
“We forecast the AUD/USD exchange rate to reach 0.6900 by the end of 2022. That said, in our view the risks could be tilted toward less weakness in Australia's currency than we currently anticipate, as inflation pressures could lead the Australian dollar to experience a more gradual pace of depreciation than our base case forecast currently projects.”
- Outlook continues to favor the Mexican peso in the short term.
- Losses are limited while above 19.50.
- Immediate resistance levels at 19.60 and 19.72.
The USD/MXN keeps a bearish tone in the short-term. The downside remains limited by the 19.50 support area. A consolidation below the mentioned zone would expose last week’s low at 19.41 and below the next support area at 19.30.
So far during the current week, USD/MXN is moving sideways, consolidating between 19.50 and 19.60. If the dollar manages to rise and hold above 19.60 it could head to test the next significant barrier around 19.71.
A daily close above 19.75 would alleviate the bearish pressure and if the recovery extends above 19.82, the outlook should change to neutral, increasing the odds of a recovery toward 20.00.
Technical indicators in the short-term are starting to favor the upside. The daily RSI is moving slowly away from 30 while Momentum (still under 100) is moving north.
USD/MXN daily chart
-637902163660326713.png)
Data released on Tuesday in Canada showed the merchandise trade surplus narrowed from CAD 2.28 billion in March to CAD 1.50 billion in April, significantly below expectations. Analysts at the National Bank of Canada explained export growth moderated in April, partially due to a decline in energy exports. They added that in volume terms, exports remained 11.9% below their level in December 2019.
Key Quotes:
“Although the trade surplus narrowed in April, Canada’s international merchandise balance nonetheless remained in positive territory, and that for a tenth time in the past eleven months.”
“After two solid increases in February (+5.1%) and March (+7.8%), imports expanded at a more modest pace. In fact, they would have been down had it not been for price increases in several categories including energy products. On the exports side, the consumer goods segment was an important contributor as shipments of packaged seafood products soared 52.4%. This increase was due not only to the sharp increase in the price of crab, but also to a shift in the fishing season for this crustacean to earlier dates.”
“After reaching unprecedented highs in the previous three months, exports of energy products were down 0.9% in April, the result of planned shutdowns for maintenance in the Alberta oil sands. This decline was partly responsible for the slight drop in the trade surplus with the United States, the main buyer of Canadian energy products.”
- The USD/JPY continues extending its weekly gains to 1.29%.
- A risk-on mood, and high US Treasury yields, boost the USD/JPY.
- The BoJ to keep the ultraloose monetary policy stance, despite yen weakness.
- USD/JPY Price Forecast: To retreat towards 132.00, as bulls prepare an attack towards 135.16
The USD/JPY rallied for the third straight day and reached a 20-year high at 133.00, a level last seen in April of 2002, amidst an upbeat market mood and also propelled by higher US Treasury yields. Nevertheless, the USD/JPY is retreating towards 132.50 at the time of writing, up by 0.49%.
Upbeat sentiment and elevated US Treasury yields tailwind for the USD/JPY
The market sentiment is mixed, as European bourses edge down, while in the States, equities are rising. In the meantime, the US 10-year Treasury yield is below the 3% threshold, post-Monday jump, down seven bps, sitting at 2.974%.
Tuesday’s overnight session witnessed the Reserve Bank of Australia (RBA) adding its name to the list of global central banks, surprisingly hiking 50 bps, its overnight cash rate. The Central Bank said they would do “what is necessary” to tame inflation. So a scenario with higher yields, and a global economic slowdown, put the stagflation outlook on the table.
Earlier, the World Bank lowered the global growth forecast to 2.9% from 4.1% in January. World Bank President David Malpass said that the risks of stagflation, the Russo-Ukraine war, and lockdowns in China have been hammering growth and that a recession will be hard to avoid for many countries. Meanwhile, though global inflation is expected to moderate next year, it will likely remain above target in many economies.“
In the meantime, during the Asia session, the Japanese docket reported weaker than expected data, particularly household spending. The reading rose by -1.7% YoY vs. -0.6% estimated. With no wage pressures in the near future, the Bank of Japan (BoJ) made it clear to maintain its loose policy stance.
The monetary policy divergences will continue to widen, leading to continued yen weakness. Governor Kuroda walked back his comments yesterday regarding greater tolerance on the part of consumers to accept higher prices, noting, “I didn’t necessarily say it in an appropriate way.” Officials have the tricky task of explaining exactly why exiting years of deflation should be welcome. April leading and coincident indexes were also reported.
The US economic docket is absent, though on Thursday will feature the Initial Jobless Claims and Continuing claims. By Friday, US inflationary readings alongside Consumer Confidence would shed some light on the current economic conditions.
Therefore, the USD/JPY remains upward biased, pressured by higher US Treasury yields. The spread between both countries’ 2-year yields continues to widen, so USD/JPY traders could expect additional buying pressure unless Japanese authorities threaten to make verbal interventions or do intervene in the FX market.
USD/JPY Price Forecast: Technical outlook
The USD/JPY retreats from the 133.00 figure, eyeing to form an “inverted hammer” candlestick. Also, the Relative Strength Index (RSI) at 71 in the overbought territory might deter USD/JPY buyers from increasing or opening fresh longs positions due to the overextended price action. Due to increased volatility in the pair, the USD/JPY might be subject to a mean reversion move.
Therefore, using the Bollinger’s band indicator, a move towards the top band around 131.97 lurks as USD/JPY bulls take a breather before pushing towards the January 2002 high around 135.16.
That said, the USD/JPY first support would be the June 6 high at 132.01. Break below would expose the previously-mentioned band at 131.97.

Data released on Tuesday showed a reduction in April in the trade deficit from a record figure in March. Analysts at Wells Fargo, point out that real net exports were a significant drag on the headline rate of GDP growth in the first quarter, they look for them to make a modestly positive contribution to overall GDP growth in the second quarter.
Key Quotes:
“The U.S. deficit in international trade in goods and services, which plunged to an all-time record of $107.7 billion in March, rebounded to "only" $87.1 billion in April. The international trade data have been unusually volatile in recent months due to the distortions of the lingering pandemic and supply chain bottlenecks.”
“The GDP data for the first quarter showed that real exports of goods and services declined at an annualized rate of 5.4% while real imports jumped 18.3%. Consequently, real net exports sliced 3.2 percentage points from the headline GDP growth rate. Indeed, the 1.5% drop in real GDP in Q1 was due in large part to this marked deterioration in real net exports. Today's data showed that the real trade deficit narrowed considerably in April from its nosedive in March and has more or less returned to its level in the first two months of the year.·
“We look for real net exports to make a modest positive contribution to overall GDP growth in the second quarter. Indeed, we do not expect the negative GDP growth print in Q1 to be repeated in Q2-2022.”
- US dollar turns negative as risk sentiment improves.
- CAD is the top performer among commodity currencies.
- USD/CAD heads for the lowest close since April 20.
The USD/CAD is falling on Tuesday and recently hit a fresh daily low at 1.2539. A weaker US dollar pushed the pair further lower during the American session.
Resumes the decline?
A sudden improvement in risk sentiment boosted US stocks indices that turned positive in a few minutes. The Dow Jones is up 0.21% after rebounding 300 points. At the same time US yields extended the decline. The US 10-year yield fell to 2.96%, far from the recent high of 3.06%.
The combination of lower US yields and risk appetite weighed on the US dollar. The DXY erased all gains and as of writing, it trades at 102.35 (daily low) down 0.07%.
Economic data from Canada showed an unexpected reduction in the trade surplus in April due to imports rising more than exports, and the May Ivey PMI rose from 66.3 to 72.0.
The USD/CAD holds a bearish intraday bias and is looking at the June low at 1.2534. A break lower could trigger more losses to the 1.2500 area. Below the next level is 1.2465, with a daily close below suggesting more losses ahead.
On the upside, 1.2575 is again a resistance level to consider, followed by the 1.2610/15 area. While under 1.2615, the pair will hold a bearish/neutral outlook in the short term. Above 1.2615, the dollar could recover further toward 1.2680.
Technical levels
In the view of economists at Rabobank, the US is likely to avoid a recession this year. However, a recession seems inevitable in 2023.
The inevitable recession
“In the US, a recession seems difficult to avoid. Either the exogenous supply shocks are going to bring down business activity or the Fed’s response to high and persistent inflation is going to do the job.”
The timing of the recession will depend on whether it “is caused by exogenous or endogenous factors. Given the strong labor market and robust consumption and investment at the moment, we think that the endogenous will be decisive. This means it is more likely going to be the recession of 2023 rather than the recession of 2022.”
- NZD/USD has recovered from earlier session lows in the 0.6420 area as risk appetite improved since the US open.
- The pair, now trading closer to 0.6475, is likely to trading between in 21 & 50DMAs pre-release of US CPI.
The kiwi failed to emulate the upside seen in its Aussie counterpart in wake of a larger than expected rate hike from the RBA and was instead one of the worse G10 performers of the day. NZD/USD dropped as low as the 0.6420s, weighed amid a risk-off feel to broader macro trading conditions after major US retailer Target released downbeat guidance, sparking fresh fears about slowing US growth.
The downbeat tone to trade prior to the US open initially weighed most heavily on the G10 currencies with the thinnest liquidity conditions (like the kiwi). However, an improvement in sentiment that has seen US equities nearly recover back to flat has helped bring NZD/USD back from lows. The pair is now trading close to 0.6475, where it still admittedly trades lower by about 0.2% on the day.
Dip-buying ahead of the 21-Day Moving Average at 0.6420 also seemed to support the kiwi on Tuesday. Subject to risk appetite conditions, the pair is likely to now remain trapped between its 21DMA and 50DMA (around 0.6580) in the run-up to Friday’s US Consumer Price Inflation data release.
Analysts suspect that if the data shows US price pressures to have eased more than expected in May, the dollar will likely weaken significantly and risk assets (like the kiwi) will rally. In such a scenario, NZD/USD might be able to test the upper 0.6500s/muster a breakout into the 0.6600s (and to its highest levels since April).
- WTI has rebounded from session lows under $118 to closer to $120 despite a risk-off Wall Street open.
- Various themes are being cited as supporting prices and encouraging dip-buying as bulls eye a break towards March highs.
Oil prices have rebounded in recent trade despite a relatively risk-off open on Wall Street after major US retailer Target gave downbeat pre-market open guidance. Front-month WTI futures were last trading higher by a little over 50 cents near the $120 per barrel mark, around $2.0 higher versus earlier session lows under the $118 level.
For now, WTI prices have remained within this week’s ranges, but the bulls will no doubt be eyeing a test of Monday’s multi-week highs near the $121 level, against the backdrop of numerous supportive crude oil-related themes. Strong demand for refined products (petrol and diesel), as evidenced by still very solid refining margins, plus evidence of strong global demand in the form of Saudi Arabia upping the Official Selling Price of its benchmark Arab light crude oil to Asia customers to a $6.50 premium over Oman/Dubai prices are being cited by analysts as supportive.
Meanwhile, themes that were in focus last week, including the reopening of Shanghai and Beijing after months of lockdowns to contain Covid-19 and OPEC+’s underwhelming output hike guidance for July and August outlined last week are also being cited. Thus, the fundamental backdrop for crude oil markets remains bullish, hence why it shouldn’t be surprising to continue seeing WTI dips being bought into.
Since mid-May, WTI has found strong support at its 21-Day Moving Average on two occasions and the technical bullish trend looks very much still in play. In the next few weeks, many might expect WTI prices to return to multi-year highs printed back in March in the $130 area. In the more immediate future, US crude oil inventory data in the form of the latest weekly Private API report at 2030GMT will be in focus as another timely indicator of the health of US demand. The US Energy Information Agency (EIA) will also be releasing its monthly oil market report at 1600GMT which will provide oil traders with some commentary to scrutinize.
- USD/TRY prints fresh YTD highs near 16.80.
- The strong recovery in the dollar pushes spot higher.
- Turkey Treasury Cash Balance results come later.
The broad-based strong note in the greenback motivates USD/TRY to advance further and clock new 2022 highs in the vicinity of 16.80 on Tuesday.
USD/TRY: Next on the upside comes the all-time high past 18.00
USD/TRY adds to the positive start of the trading week and navigates the 16.70/80 band, or new YTD peaks, so far this year.
The move higher in the pair remains well underpinned by the bullish momentum around the greenback ahead of the FOMC gathering next week. Indeed, the better performance in the US dollar weigh on the risk complex and prop up outflows from the EM FX space and the rest of the dollar-denominated assets.
In the Turkish calendar, the Treasury Cash Balance for the month of May are due later in the session.
What to look for around TRY
USD/TRY keeps the underlying upside bias well and sound and now approaches the 17.00 neighbourhood, an area last traded back in December 2021.
So far, price action in the Turkish currency is expected to gyrate around the performance of energy prices, the broad risk appetite trends, the Fed’s rate path and the developments from the war in Ukraine.
Extra risks facing TRY also come from the domestic backyard, as inflation gives no signs of abating, real interest rates remain entrenched in negative figures and the political pressure to keep the CBRT biased towards low interest rates remain omnipresent.
Key events in Turkey this week: Unemployment Rate (Friday).
Eminent issues on the back boiler: FX intervention by the CBRT. Progress (or lack of it) of the government’s new scheme oriented to support the lira via protected time deposits. Constant government pressure on the CBRT vs. bank’s credibility/independence. Bouts of geopolitical concerns. Structural reforms. Upcoming Presidential/Parliamentary elections.
USD/TRY key levels
So far, the pair is gaining 1.14% at 16.7521 and faces the next up barrier at 16.7713 (2022 high June 7) seconded by 18.2582 (all-time high December 20) and then 19.00 (round level). On the flip side, a breach of 16.3136 (monthly low June 3) would aim to 16.1431 (low May 27) and finally 15.6684 (low May 23).
- USD/CHF shot to a nearly three-week high on Tuesday amid broad-based USD strength.
- The risk-off mood underpinned the safe-haven CHF and capped any meaningful upside.
- Acceptance above the 0.9745-0.9750 confluence supports prospects for additional gains.
The USD/CHF pair gained strong follow-through traction for the third successive day on Tuesday and shot to a nearly three-week high during the early North American session. The pair was last seen trading around the 0.9765-0.9770 region, up over 0.60% for the day.
The recent surge in the US Treasury bond yields continued lending support to the US dollar, which, in turn, was seen as a key factor that acted as a tailwind for the USD/CHF pair. Bulls seemed unaffected by a softer risk tone, which tends to benefit the safe-haven Swiss franc.
The momentum pushed spot prices through the 0.9745-0.9750 confluence hurdle, comprising 200-period SMA on the 4-hour chart and the 38.2 Fibonacci retracement level of the 1.0064-0.9545 downfall. This might have already set the stage for a further near-term appreciating move.
Given that oscillators on the daily chart have just started gaining positive traction, the USD/CHF pair seems poised to reclaim the 0.9800 mark. The said handle coincides with the 50% Fibo. level, which if cleared decisively would be seen as a fresh trigger for bullish traders.
The USD/CHF pair might then accelerate the upward trajectory towards testing the 61.8% Fibo., around the 0.9870 region en-route the next relevant barrier near the 0.9900 mark and the 0.9925-0.9930 area.
On the flip side, pullback below the 0.9750-0.9745 confluence resistance breakpoint might now be seen as a buying opportunity and remain limited near the 0.9720-0.9715 region. This is followed by the 0.9700 mark, which if broken might shift the bias in favour of bearish traders.
USD/CHF 4-hour chart
Key levels to watch
US Treasury Secretary Janet Yellen said in the pre-released version a Congressional testimony that the US economy faces challenges from "unacceptable levels of inflation", as well as headwinds from supply chain snags, reported Reuters on Tuesday. An appropriate budgetary stance is needed to compliment the Fed's actions to dampen inflation without undermining the strength of the labour market, she added.
Yellen said she is keenly focused on moving forward with the US proposal on a deal for global corporate tax reform and says that US President Joe Biden's budget suggests "smart, fiscally responsible investments" that will cut the deficit. The US economy is entering a transition from recovery to stable and steady growth, she noted.
The World Bank lowered its forecast for global growth in 2022 on Tuesday to 2.9% from their 4.1% estimate put out in January, Reuters reported. The World Bank said that the Ukraine war will reduce per capita income in developing economies by 5.0% from their pre-Covid-19 trend.
World Bank President David Malpass said that the risks of stagflation, the Russo-Ukraine war, and lockdowns in China have been hammering growth and that a recession will be hard to avoid for many countries. Meanwhile, though global inflation is expected to moderate next year, it will likely remain above target in many economies.
The World Bank lowered its forecast for growth in advanced economies to 2.6% in 2022 versus its estimate back in January of 3.8% and lowered its estimate for emerging economies to 3.4% from 6.6% back in January. The bank warned that it sees a real threat that faster than expected tightening of financial conditions could push some countries into the kind of debt crisis that was seen back in the 1980s.
Senior Economist at UOB Group Alvin Liew assesses the latest Nonfarm Payrolls figures released on Friday.
Key Takeaways
“The US economy added another 390,000 jobs in May while the unemployment rate stayed at 3.6%, unchanged since Mar. Wage growth continued but the pace slowed for the second straight month to 0.3% m/m, 5.2% y/y. Despite hiring challenges, some signs of weakness emerged such as the jump in those employed part-time for economic reasons and the dip in retail employment.”
“Notwithstanding those tentative signs of moderation, the overall US employment and wage gains in 2022 to date will anchor the Fed’s confidence in the labor market and keep them on the path to hike in clips of 50bps in Jun and Jul amidst on-going inflation.”
The GBP/USD pair once again fell below 1.25. Economists at Scotiabank note that cable needs to surpass the mid-1.25s in order to improve its outlook.
Recent price action is suggestive of a reversal of GBP May gains
“The decline to a fourteen-session low is signaling greater downward pressure than in recent declines under 1.25.”
“The pound’s daily low of 1.2431 stands as key support after ~1.2480, with the mid-1.24s also standing as a psychological floor.”
“We think the GBP will need to firm up past the mid-1.25s shortly and then push past 1.26 to improve its fate as recent price action is suggestive of a reversal of its May gains.”
USD/CAD is back to the high 1.25s. Economists at Scotiabank expect the pair to fall towards the 1.25 region again on a break under the 1.2585 mark.
Resistance aligns at 1.2630
“Intraday price action rather suggests a stall in the USD move higher, rather than an outright reversal at this point; we see intraday support at 1.2585 and resistance at 1.2630 for early trading.”
“A push back below 1.2585 should see the USD slip back to the low 1.25s again.”
“We continue to anticipate a drop in the USD to the Apr low around 1.24 following last week’s loss of retracement support at 1.2565.”
- EUR/USD remains on the defensive well below 1.0700.
- Immediately on the downside emerges the 1.0627 support.
EUR/USD comes under further downside pressure and extends the recent breakdown of the 1.0700 key support.
The current bearish move carries the potential to extend further and revisits the June low at 1.0627 (June 1) ahead of 1.0532 (low May 20). The RSI around 50 has still plenty of room to drop before entering the oversold territory.
In the longer run, the pair’s bearish view is expected to prevail as long as it trades below the 200-day SMA at 1.1220.
EUR/USD daily chart
- Silver fell below $22.00 on Tuesday but remained within recent ranges as traders eye upcoming US CPI data on Friday.
- Further evidence of slowing US inflation coupled with growing fears about US growth add upside risks to precious metals.
- Silver bulls are eyeing a break above $22.50 resistance and a push towards $23.00.
Spot silver (XAG/USD) slipped back below the $22.00 per troy ounce level in quiet trading conditions on Tuesday and was last trading lower by about 0.5% in the $21.90s but still within recent intra-day ranges. Just released US trade data showed the country’s deficit shrinking a little more than expected in April, and this didn’t impact broader market sentiment. Ahead, traders will be watching a speech from US Treasury Secretary Janet Yellen at 1400GMT, but the remainder of the session looks set to remain quiet.
Most XAG/USD traders likely expect the pair to remain stuck within recent $21.50-$22.50ish ranges ahead of this Friday’s US Consumer Price Inflation report, with the 21-Day Moving Average at $21.74 likely to offer some short-term support. Traders are on the lookout for fresh signs that US inflation (and perhaps also Fed hawkishness might have peaked) might have peaked, which could weigh on the US dollar and US yields in the short term.
Given the negative relationship precious metals have to yields and the buck, this could give silver a boost and any US CPI-inspired break above resistance at $22.50 could see silver extend upside towards $23.00 and the 50DMA just above it. A worsening US growth story further adds to the potential upside risks for precious metals, amid a potential increase in the bid for safe havens.
Krone’s losses are likely to have been exaggerated and have already been partially corrected, in the opinion of economists at Commerzbank. They expect the EUR/NOK pair to fall below 10 again.
NOK losses overdone
“Inflation in Norway surprised to the upside again in April, so the Norges Bank may not only raise the key rate again in June but could also raise the interest rate path. Moreover, krone's losses in May seem overdone. EUR/NOK should therefore fall below the 10 mark again. However, NOK upside potential is still limited, as the ECB will also start raising interest rates in July.”
“Next year, NOK could gain a little more ground against the euro. Although the ECB is also likely to raise its key rate again, Norges Bank will remain the comparatively more active central bank. In addition, high energy prices should tend to support the NOK.”
- Gold Price continues to trade above key support level.
- 10-year US T-bond yield edges lower following Monday's upsurge.
- Sellers could take action if XAUUSD breaks below $1,840.
Gold Price registered daily losses on Monday but managed to erase a portion of its losses on Tuesday. The recent price action, however, doesn't point to a buildup of bullish momentum. Nevertheless, the significant technical support that aligns at $1,840 stays intact for the time being, causing sellers to remain on the sidelines.
US T-bond yields retreat
Following the previous week's rally, the benchmark 10-year US Treasury bond yield pushed push higher on Monday and broke above the key 3% level. In the absence of high-impact macroeconomic data releases, the upbeat US jobs report allowed yields to continue to rise. According to the CME Group FedWatch Tool, the probability of the Fed hiking its policy rate by a total of 125 basis points in the next two meetings rose to 15% from 4% last week. With safe-haven flows dominating the financial markets on Tuesday, yields edge lower and help XAUUSD stage a recovery.
Also read: Gold Price Forecast: Bearish technical structure suggests more pain ahead.
Gold Price ignores US data
The data published by the US Census Bureau revealed on Tuesday that the goods and services deficit of the United States narrowed by $20.6 billion to $87.1 billion in April. During that period, exports rose by $8.5 billion to $252.6 billion, while imports declined by $12.1 billion to $339.7 billion. These figures triggered little to no market reaction and gold continued to fluctuate in its daily range.
Earlier in the day, the monthly report published by the People's Bank of China (PBOC) showed that China's gold reserves remained steady at 62.64 million fine troy ounces at the end of May. The value of China's gold reserves, however, declined to $115.18 billion at the end of May from $119.73 billion at the end of April. Last week, Bloomberg reported that India's gold reserves increased by 9.4% on a yearly basis to 760.4 in the year ended March.

Gold bars
Meanwhile, investors gear up for this week's key events and data releases. The European Central Bank will announce its policy decision on Thursday and the US Bureau of Labor Statistics will publish the Consumer Price Index (CPI) data on Friday. Although the US Federal Reserve uses the Personal Consumption Expenditures (PCE) Price Index as its preferred gauge of inflation, the CPI reading is likely to trigger a significant market reaction. Analysts expect the CPI to tick down to 8.2% in May from 8.3% in April. A stronger-than-forecast print should provide a boost to yields and weigh on XAUUSD and vice versa.
Gold Price technical outlook
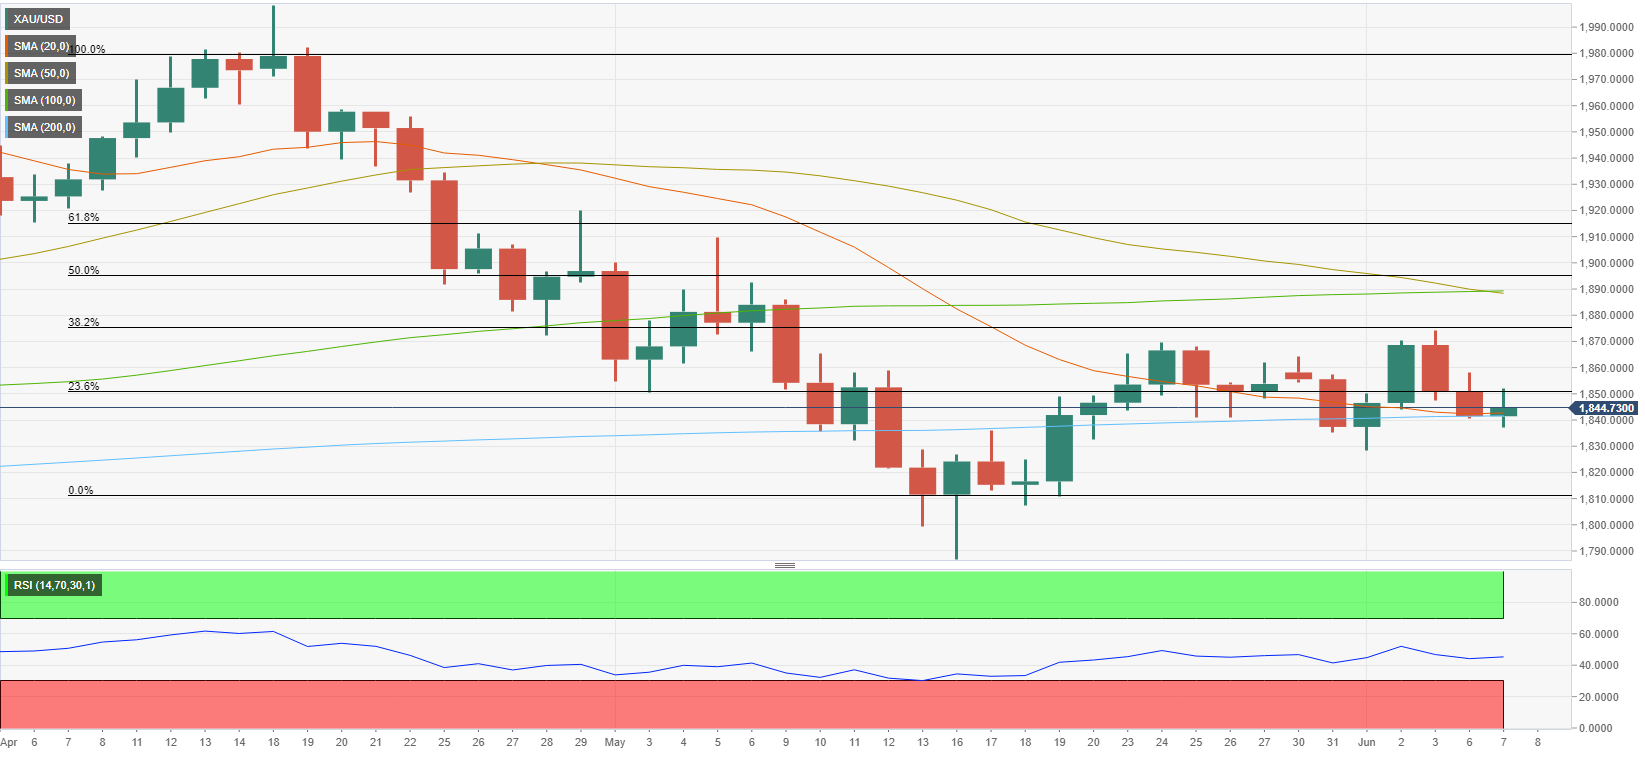
Gold Price continues to trade above the 200-day SMA, which is currently located at $1,840. When gold made a daily close below that level on May 31, it managed to reclaim it the next day. Hence, sellers might want to wait for a confirmation that $1,840 turned into resistance before taking action. In that scenario, $1,830 (static level) aligns as interim support ahead of $1,810 (the end-point of the latest downtrend) and $1,800 (psychological level).
On the other hand, $1,850 (Fibonacci 23.6% retracement) forms initial resistance. A daily close above that level could be seen as a bullish development and open the door for an extended rebound toward $1,874 (Fibonacci 38.2% retracement) and $1,890 (50-day SMA, 100-day SMA).
Gold Price at lower trend line
What's driving that gap between gold and real rates? The DKW model helps to address this question. Strategists at TD Securities conclude that the gap between gold and real rates may be attributed to an undue rise in real rates given quantitative tightening and the still-massive amount of complacent length being held in gold.
Residual rise in real rates could be partially attributable to quantitative tightening
“The DKW model highlights that TIPS liquidity premium may have overwhelmingly driven real rates over the past months, as quantitative easing likely created a scarcity of these assets. Today, quantitative tightening is now weighing on this liquidity premia as the market is left to absorb additional supply. In turn, the residual rise in real rates above what would otherwise be expected given gold prices could be partially attributable to quantitative tightening.”
“We see evidence that gold markets are hosting a massive amount of complacent length. While the war in Ukraine helped to send the bears packing, the fading of geopolitical risk premia across global assets hasn't seen this cohort of discretionary traders liquidate their length.”
“The gap between gold and real rates may be attributed to both an undue rise in real rates given quantitative tightening, and to the still-massive amount of complacent length being held in gold, keeping the yellow metal's prices elevated.”
USD/JPY is trading at a new high for this cycle near 133. Economists at TD Securities expect the pair to reach the 135 level.
MOF to note its discomfort with the currency's weakness
“The USD/JPY pair has demonstrated the capacity to make new multi-year highs despite what many believe to be a range-bound Treasury market. We view this as a significant technical development and it will not be long before the MOF will note its discomfort with the currency's weakness (not like they will do anything about it).
“135 marks the next major level for USD/JPY.”
Economist at UOB Group Ho Woei Chen, CFA, comments on the probable further tightening by the BoK in the next month.
Key Takeaways
“South Korea’s headline inflation is at a fresh 14-year high and more than double of the Bank of Korea’s (BOK) 2% target for three consecutive months. Core inflation (excluding agricultural products & oils) is above 4% for the first time since May 2009. The strong sequential gains suggest that the inflation risk remains to the upside.”
“This puts the BOK on track to continue raising interest rates and we reiterate our forecast for the central bank to hike by 25 bps at each of the three subsequent meetings in Jul, Aug and Oct before stopping at its last meeting this year in Nov.”
“The outlook for South Korea’s economy continues to be fortified by optimism from easing COVID restrictions, fiscal expansion and strong exports.”
- AUD/USD struggled to capitalize on a hawkish RBA-inspired intraday bullish spike.
- A softer risk tone, elevated US bond yields underpinned the USD and capped gains.
- The market focus will remain glued to the US consumer inflation figures on Friday.
The AUD/USD pair witnessed an intraday turnaround from the vicinity of mid-0.7200s and drifted into negative territory for the third successive day on Tuesday. The downward trajectory extended through the early North American session and dragged spot prices to a three-day low, around the 0.7155 region in the last hour.
The Australian dollar strengthened after the Reserve Bank of Australia (RBA) raised interest rates by 0.50% (more-than-expected) on Tuesday and indicated that further tightening is in the pipeline. The initial market reaction, however, turned out to be short-lived amid the prevalent bullish sentiment surrounding the US dollar.
Expectations that a more aggressive move by major central banks to constrain inflation could pose challenges to the global economic growth continued weighing on investors' sentiment. This was evident from a weaker tone around the equity markets, which, along with elevated US Treasury bond yields, underpinned the safe-haven buck.
Investors remain concerned that global supply chain disruption caused by the Russia-Ukraine war would push consumer prices even higher. This might force the US central bank to tighten its monetary policy at a faster pace, which, in turn, assisted the yield on the benchmark 10-year US government bond to hold steady above the 3.0% threshold.
Hence, the market focus will remain glued to the latest US consumer inflation figures, due for release on Friday. The US CPI report might influence the Fed's tightening path and the USD price dynamics. This, in turn, would provide a fresh impetus to the AUD/USD pair and help determine the next leg of a directional move.
In the meantime, the US bond yields will continue to play a key role in driving the USD demand amid absent top-tier US economic data on Tuesday. Apart from this, traders will take cues from the broader market risk in order to grab short-term opportunities around the AUD/USD pair.
Technical levels to watch
- DXY clinches new peaks in the boundaries of 103.00 on Tuesday.
- Interim hurdles come at Fibo levels ahead of the 2022 top.
DXY adds to the weekly recovery and already approaches the key 102.00 mark on Tuesday.
Considering the ongoing rebound, extra gains appear on the cards with immediate targets at the Fibo levels (of the mid May-late May sell-off) at 103.15, 103.58 and 104.21. Further north of these levels emerges the 2022 high around 105.00 printed on May 13.
As long as the 3-month line around 101.10 holds the downside, the near-term outlook for the index should remain constructive.
Looking at the longer run, the outlook for the dollar is seen bullish while above the 200-day SMA at 97.08.
DXY daily chart

According to the latest figures released on Tuesday by Statistics Canada, the Canadian Trade surplus shrunk to C$1.5B in April from C$2.28B a month earlier versus expectations for a rise to C$2.9B. The fall in Canada's headline trade surplus number masked a larger than expected increase in both Canadian imports and exports in April.
The former increased from C$61.67B (upwardly revised from C$61.14B) in March to C$62.81B in April versus the expected drop to C$58.11B, while exports increased from C$64.31B from C$63.95B a month earlier (upwardly revised from C$63.63B) versus expectations for a drop to C$61.76B.
Market Reaction
The loonie did not react to the latest Canadian trade figures.
According to the latest data from the Bureau of Economic Analysis and US Census Bureau, the US Goods and Services Trade deficit shrunk to $87.1B in April. That was a little smaller than the expected decrease to $89.5B from $109.80B in March.
The Goods trade deficit was $107.74B in April and the Services trade surplus was $20.66B. In total, exports were up 3.5% MoM versus March at $252.62B, while Imports were up 4.9% $339.7B.
The US trade deficit with China fell to $30.57B from $34B in March. Finally, the average price of US oil imports rose to $94.99 per barrel in April, up from $87.20 one month earlier.
Market Reaction
Currency markets did not react to the latest US trade data.
- USD/JPY gained traction for the third successive day and shot to a fresh two-decade high.
- The recent widening of the US-Japanese yield differential remained supportive of the move.
- A softer risk tone underpinned the safe-haven JPY and capped amid overbought conditions.
The USD/JPY pair stood tall near a two-decade high heading into the North American session and was last seen trading around the 132.80-132.85 region, up nearly 1.0% for the day.
The recent widening of the US-Japanese government bond yield differential assisted the USD/JPY pair to build on last week's strong positive move and gain traction for the third successive day on Tuesday. It is worth recalling that the Bank of Japan has promised to conduct unlimited bond purchase operations to defend its near-zero target for 10-year yields.
In contrast, the yield on the benchmark 10-year US government bond held steady above 3.0% amid concerns that global supply chain disruption caused by the Russia-Ukraine war would push consumer prices even higher. This might force the US central bank to tighten its monetary policy at a faster pace, which, in turn, acted as a tailwind for the US bond yields.
Meanwhile, elevated US Treasury bond yields underpinned the US dollar, which was seen as another factor that provided an additional lift to the USD/JPY pair. That said, a softer risk tone offered support to the safe-haven Japanese yen and held back traders from placing fresh bullish bets around the pair amid extremely overbought conditions on short-term charts.
The market sentiment remains fragile amid expectations that a more aggressive move by major central banks to constrain inflation could pose challenges to global economic growth. Apart from this, traders also seemed reluctant and might now prefer to wait on the sidelines ahead of the latest US consumer inflation figures, scheduled for release on Friday.
The fundamental backdrop seems tilted firmly in favour of bullish traders, though it would be prudent to wait for some near-term consolidation or modest pullback before positioning for any further gains. In the absence of top-tier US economic data on Tuesday, the US bond yields, the USD price dynamics and the broader market risk sentiment continue to influence the USD/JPY pair.
Technical levels to watch
- GBP/USD fell to close to three-week lows, but has since recovered back closer to 1.2500 as the 21DMA offers support.
- Sterling was little impacted after UK PM Johnson survived (although weakened) a no-confidence vote.
- Conditions might remain quite rangebound ahead of Friday’s key US CPI data.
GBP/USD recovered from a brief dip to fresh more than two-week lows on Tuesday and, in doing so, held above its 21-Day Moving Average at 1.2470, though was unable to recover back above the 1.2500 mark. The pair was last trading near 1.2490, down about 0.3% on the day, but still within recent intra-day ranges. Recent weakness seems to have more to do with broad US dollar strength as opposed to any UK-specific factors.
But that’s not to say there hasn’t been plenty going on politically in the UK this week. The ruling UK Conservative Patry held a confidence vote in UK PM Boris Johnson on Monday that saw him retain his position as party leader (and PM). However, amid a larger than expected rebellion by Conservative MPs against his leadership, political analysts said that Johnson’s authority has taken a blow.
The pound’s reaction to the developments was apathetic. Johnson doesn’t at present have a credible contender within the Conservative Party for his position as leader (or as an alternative PM) and even if Johnson had been ousted, the thinking is that any potential replacement probably would continue with similar policies.
FX strategists said the themes of the UK’s (weakening) economy and the outlook for BoE monetary policy will remain key drivers of GBP crosses. On which note, a survey on Tuesday showed UK shoppers cut spending in May by the most since early 2021, when the country had just gone back into strict lockdown to stem the spread of Covid-19.
A lack of BoE speak and notable UK data in the coming days means GBP/USD will likely take its cue more from the dollar side of the equation. The next few days are also quiet for the US economic calendar with the Fed in blackout ahead of next week’s meeting, with the main event being Friday’s US Consumer Price Inflation data.
GBP/USD traders should prepare for the pair to (probably) remain fairly rangebound near the 1.2500 level and 21DMA in the next few days, provided there are no significant swings in the market’s appetite for risk on unforeseeable fundamental developments.
- EUR/JPY extends the march above the 142.00 yardstick.
- Further upside now targets the 2015 high beyond 145.00.
EUR/JPY keeps the march north well in place for yet another session and prints new cycle highs past 142.00 the figure on Tuesday.
The cross briefly probed the area just above the 142.00 yardstick and opened the door to the continuation of the rally in the very near term. That said, there are no relevant hurdles until the 2015 high at 145.32 (January 2) ahead of the 2014 peak at 149.78 (December 8).
In the meantime, while above the 2-month support line near 135.75, the short-term outlook for the cross should remain bullish.
EUR/JPY daily chart
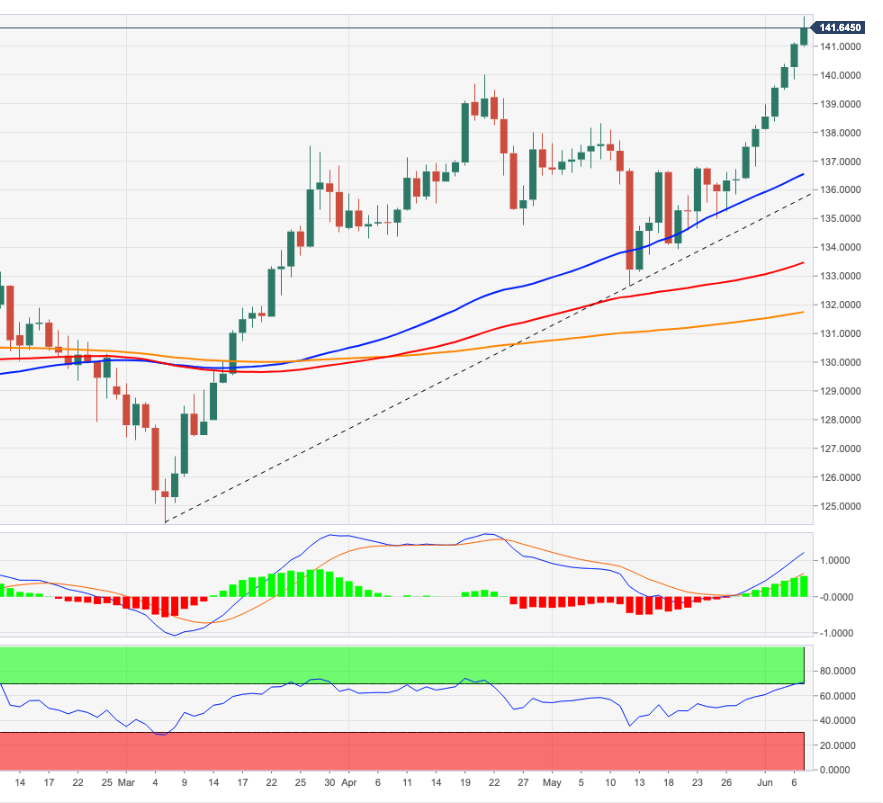
The Bank of Thailand is expected to keep the policy rate at 0.50% at its meeting on Wednesday, noted Economist at UOB Group Lee Sue Ann.
Key Quotes
“We expect BOT to inject a 25bps rate hike this year, possibly as early as 3Q22, in response to higher inflation risks and the faster-than-anticipated FOMC rate hike for the year ahead.”
“Notwithstanding the projected 25bps hike later this year, we continue to view the monetary policy stance of BOT to be accommodative, especially against the backdrop of potentially higher global interest rates.”
- A combination of factors dragged NZD/USD to over a two-week low on Tuesday.
- A softer risk tone undermined the risk-sensitive kiwi amid modest USD strength.
- Retreating US bond yields capped the USD gains and extended support to the pair.
The NZD/USD pair witnessed some selling for the third successive day on Tuesday and retreated further from its highest level since April 27, around the 0.6575 region touched last week. The pair maintained its bid tone through the first half of the European session and was last seen trading near a two-week low, just above mid-0.6400s.
A combination of factors assisted the US dollar to build on its recent bounce from over a one-month low, which, in turn, was seen as a key factor exerting some downward pressure on the NZD/USD pair. The market sentiment remains fragile amid concerns that a more aggressive move by major central banks to constrain inflation could pose challenges to global economic growth. This, along with the recent surge in the US Treasury bond yields continued lending support to the safe-haven greenback.
Investors seem worried that the global supply chain disruption caused by the Russia-Ukraine war could push consumer prices even higher and force the Fed to tighten its monetary policy at a faster pace. This, in turn, lifted the yield on the benchmark 10-year US government bond back above 3.0%. That said, the anti-risk flow acted as a headwind for the US bond yields, which held back the USD bulls from placing fresh bets and helped limit deeper losses for the NZD/USD pair, at least for now.
The fundamental backdrop, however, seems tilted in favour of bearish traders and supports prospects for further losses. That said, market participants might prefer to wait on the sidelines ahead of the crucial US CPI report on Friday, which might influence the Fed's tightening path and provide a fresh directional impetus to the NZD/USD pair. In the meantime, the US bond yields and the broader market risk sentiment would drive the USD demand, producing some trading opportunities around the pair.
Technical levels to watch
Japan's economy minister Daishiro Yamagiwa said on Tuesday that they are watching closely the potential impact of foreign exchange (FX) moves on the economy, as reported by Reuters.
Yamagiwa further added that he wouldn't want to comment on FX levels.
Earlier in the day, Bank of Japan (BOJ) Governor Haruhiko Kuroda argued that a weak yen would be beneficial for the Japanese economy as long as moves are not too sharp.
Market reaction
The USD/JPY pair showed no immediate reaction to these remarks and was last seen trading at 132.70, where it was up 0.6% on a daily basis.
- USD/CAD gained positive traction on Tuesday, though the uptick lacked follow-through buying.
- A softer tone around US bond yields held back the USD bulls from placing bets and capped gains.
- Retreating oil prices undermined the loonie and might continue to act as a tailwind for the major.
The USD/CAD pair retreated built on the overnight bounce from its lowest level since April 21 and gained some follow-through traction during the first half of trading on Tuesday. The momentum pushed spot prices to a three-day high, though ran out of stead near the 1.2615-1.2620 region.
The US dollar trimmed a part of its intraday gains amid a softer tone surrounding the US Treasury bond yields, which, in turn, acted as a headwind for the USD/CAD pair. That said, a combination of factors continued lending some support to the major and helped limit the downside, at least for now.
The market sentiment remains fragile amid concerns that a more aggressive move by major central banks to constrain inflation could pose challenges to global economic growth. This, along with the recent sharp rise in the US Treasury bond yields, underpinned demand for the safe-haven greenback.
The global supply chain disruption caused by the Russia-Ukraine war could push consumer prices higher and force the Fed to tighten its monetary policy at a faster pace. This, in turn, lifted the yield on the benchmark 10-year US government bond back above 3.0% and could offer support to the buck.
Hence, the market focus will remain on the release of the US CPI report on Friday. In the meantime, the ongoing pullback in crude oil prices from a nearly three-month top could weigh on the commodity-linked loonie and warrant caution before placing bearish bets around the USD/CAD pair.
Market participants now look forward to the release of trade balance data from the US and Canada, which might provide some impetus to the USD/CAD pair later during the early North American session. Traders will further take cues from the USD/oil price dynamics to grab short-term opportunities.
Technical levels to watch
Lee Sue Ann, Economist at UOB Group, suggests the Reserve Bank of India would keep the policy rate unchanged at its Wednesday’s event.
Key Quotes
“The decision to raise interest rates in an unscheduled policy move on 4 May was in view of higher inflationary pressures for the year ahead. Notably, inflation was 6.95% y/y in Mar 2022, and significantly above the central bank’s upper tolerance threshold of 6.0%.”
“We look for higher policy rates into the year ahead, expecting further 25bps rate hikes, each in 3Q22 and 4Q22, to bring the repo rate to 4.90% by year-end.”
- AUD/USD returns to the red, shaving off RBA surprise-led solid gains.
- RBA delivered a bold 50 bps rate hike in a strong move to rein in inflation.
- 200-DMA caps the upside amid risk-aversion and the dollar’s strength.
AUD/USD has entered a phase of consolidation below 0.7200 in the European session after witnessing good two-way businesses earlier in the Asian session.
The aussie wiped out the early Asian losses and jolted higher after the Reserve Bank of Australia (RBA) delivered a major surprise by hiking the key rates by 0.50% to 0.85% at its June monetary policy meeting, outpacing the market consensus of a 0.25% to 0.40% rate lift-off.
The bold move by the RBA was seen as pre-emptive to rein in inflation. Bulls, however, quickly faded the uptick, as risk-off flows seeped back on worries that the aggressive monetary policy by global central banks could stunt economic growth. The safe-haven US dollar found fresh demand, adding to the weight on the aussie.
The greenback remains broadly underpinned, preserving its Monday’s gains even though the US Treasury yields pull back, as the government bonds are sought out by investors in times of adverse market conditions.
The pair remains tied down to risk trends and the dollar price action amid a lack of significant US economic news later this Tuesday.
AUD/USD: Additional levels to consider
- EUR/USD loses further ground and revisits the 1.0660 region.
- The greenback extends the bid bias despite lower yields.
- Germany Construction PMI eased to 45.4 in May.
Sellers appear well in control of the sentiment around the European currency and drag EUR/USD back to the 1.0660 zone on Tuesday.
EUR/USD in multi-day lows
EUR/USD sheds ground for the third session in a row on Tuesday and pushes further south of the 1.0700 mark in the first half of the week, always in response to the selling pressure in the risk-associated universe.
Also reflecting the offered bias in the risk complex, US and German yields recede from recent tops, although they manage well to keep the trade in the upper end of the range.
In the domestic calendar, German Factory Orders contracted at a monthly 2.7% in April and the Construction PMI eased a tad to 45.4 in May. Across the Atlantic, Balance of Trade results and the Consumer Credit Change figures are due later in the NA session.
What to look for around EUR
EUR/USD continues to lose momentum and extends further the rejection from peaks beyond the 1.0700 mark in past sessions.
The pair’s recent multi-week recovery has been on the back of supportive ECB-speak, which continued to point at an initial rate hike as soon as in July, while the consensus view that the bond-purchase programme should end at some point in early Q3 has also lent legs to the European currency.
However, EUR/USD is still far away from exiting the woods and it is expected to remain at the mercy of dollar dynamics, geopolitical concerns and the Fed-ECB divergence, while higher German yields, persistent elevated inflation in the euro area and a decent pace of the economic recovery in the region are also supportive of an improvement in the mood around the euro.
Key events in the euro area this week: Germany Construction PMI (Tuesday) – Advanced EMU Q1 GDP Growth Rate (Wednesday) – ECB Interest Rate Decision (Thursday).
Eminent issues on the back boiler: Speculation of the start of the hiking cycle by the ECB as soon as this summer. Asymmetric economic recovery post-pandemic in the euro bloc. Impact of the war in Ukraine on the region’s growth prospects.
EUR/USD levels to watch
So far, spot is retreating 0.09% at 1.0686 and a breach of 1.0627 (monthly low June 1) would target 1.0532 (low May 20) en route to 1.0459 (low May 18). On the upside, the next resistance aligns at 1.0786 (monthly high May 30) seconded by 1.0936 (weekly high April 21) and finally 1.0945 (100-day SMA).
Gold remains pressured. In the view of strategists at Commerzbank, strong Nonfarm Payrolls report released on Friday has exacerbated the yellow metal’s downside potential.
Further US Fed rate hikes are likely
“Gold is being kept in check by the firm US dollar and rising bond yields. Yields on ten-year US Treasuries are currently above the 3% mark again. This has caused real interest rates to rise again too, making gold unattractive as a non-interest-bearing alternative investment.”
“Gold has found itself under pressure since last Friday, probably thanks in part to the robust US labour market. This is because 390K new jobs were created in the US in May, more than expected.”
“Since demand for labour remains unchanged at a high level, there is still a risk of a wage-price spiral, so we believe that further US Fed rate hikes are likely.”
If USD/CNH close above 6.6850 it would be indicative that the downside pressure could be over, commented FX Strategists at UOB Group Lee Sue Ann and Quek Ser Leang.
Key Quotes
24-hour view: “We highlighted yesterday that ‘the current movement is likely part of a consolidation phase’ and we expected USD to ‘trade between 6.6320 and 6.6720’. USD subsequently traded within a narrower range than expected (6.6373/6.6642) before closing largely unchanged at 6.6577 (+0.03%). Further consolidation appears likely even though the slightly firmed underlying tone suggests a higher range of 6.6420/6.6770.”
Next 1-3 weeks: “Last Friday (03 Jun, spot at 6.6350), we held the view that the risk for USD is on the downside but any weakness could be limited to a test of 6.5940. Since then, USD has not been able to make much headway on the downside. Downward momentum is beginning to wane and a break of 6.5850 (no change in ‘strong resistance’ level) would indicate that the downside risk has dissipated.”
- Gold gained some positive traction on Tuesday and snapped a two-day losing streak.
- A softer risk tone was seen as a key factor offering support to the safe-haven XAUUSD.
- Expectations of aggressive global central banks and modest USD strength capped gains.
Gold attracted some buying near the $1,837 region on Tuesday and for now, seems to have stalled the recent pullback from a nearly one-month high touched last week. The uptick allowed spot prices to snap a two-day losing streak and was sponsored by a softer risk tone, which tends to benefit the safe-haven precious metal. The market sentiment remains fragile amid concerns that a more aggressive move by major central banks to constrain inflation could pose challenges to global economic growth. That said, expectations for more interest rate hikes in the US and Europe held back traders from placing aggressive bullish bets around the non-yielding yellow metal.
Investors seem worried that the global supply chain disruption caused by the Russia-Ukraine war would continue to push consumer prices higher and force the Fed to tighten its monetary policy at a faster pace. The European Central Bank is also expected to join its global peers and hike interest rates to tamp down inflation. This, along with modest US dollar strength, might further contribute to keeping a lid on any meaningful upside for the dollar-denominated gold. The USD drew support from the recent strong rally in the US Treasury bond yields. In fact, the yield on the benchmark 10-year US government bond shot back above the 3.0% threshold amid worries about persistent inflation.
Hence, the focus will remain glued to the crucial US CPI report, scheduled for release on Friday, which will influence the Fed's policy tightening path. This will help determine the next leg of a directional move for the USD and gold. In the meantime, the US bond yields will continue to play a key role in driving the USD price dynamics amid absent top-tier US economic releases and provide some impetus to gold. Apart from this, traders will further take cues from the broader market risk sentiment to grab short-term opportunities around the XAUUSD.
Technical levels to watch
EUR/USD has steadied near 1.07 following Monday's drop. A four-hour close below 1.0680 could open the door for additional losses, FXStreet’s Eren Sengezer reports.
Additional losses are likely if 1.0680 support fails
“If safe-haven flows dominate the financial markets in the second half of the day, US T-bond yields could edge lower and limit the dollar's gains. Nevertheless, the greenback should be favoured against the euro as a safer alternative, not allowing EUR/USD to erase its losses.”
“Earlier in the day, the pair dropped below the Fibonacci 23.6% retracement level of the last uptrend at 1.0680 but managed to close above its on the four-hour chart. In case 1.0680 turns into resistance, 1.0660 (100-period SMA) aligns as the next support ahead of 1.0620 (Fibonacci 38.2% retracement) and 1.06 (200-period SMA).”
“On the upside, 1.07 (psychological level) forms interim resistance before 1.0720 (20-period SMA, 50-period SMA) and 1.0760 (static level).”
- UK Final Services PMI upwardly revised to 53.4 in May.
- GBP/USD keeps its recovery mode intact above 1.2500 on the upbeat data.
- Eyes on broader market sentiment and mid-tier US economic data.
The UK services sector activity expanded more than expected in May, the final report from IHS Markit confirmed this Tuesday.
The seasonally adjusted S&P Global/CIPS UK Services Purchasing Managers’ Index (PMI) was revised higher to 53.4 in May versus 51.8 expected and a 51.8 – last month’s flash reading.
Key points
Business activity expansion eases for second month running.
Input cost and prices charged inflation hit fresh record highs.
Growth projections lowest since October 2020.
Tim Moore, Economics Director at S&P Global Market Intelligence, which compiles the survey
“May data illustrate a worrying combination of slower growth and higher prices across the UK service sector. The latest round of input cost inflation was the steepest since this index began in July 1996, while the monthly loss of momentum for business activity expansion was a survey record outside of lockdown periods.”
"There were bright spots in customer-facing parts of the economy during May, buoyed by a rapid recovery in consumer spending on travel, leisure and entertainment.”
FX implications
GBP/USD is off the daily highs but defends 1.2500 on the upbeat UK data. The spot is down 0.17% on the day.
Eurozone’s investor sentiment fell less than expected in June; the latest data published by the Sentix research group showed on Tuesday.
The gauge came in at -15.8 in June from -22.6 in May vs. -20.0 expected. The index recovered from its lowest level since June 2020, as firms were not so negatively impacted by inflation and supply chain concerns as previously expected.
A current conditions index improved to -7.3 in June from -10.5 in May and an expectations index rose to -24.0 in June from -34.0 in May.
Key takeaways
"As impressive as the improvement in the situation and expectations values may appear at first glance, this is unlikely to mark a turnaround.”
“While consumers are already suffering from rising prices, many companies have been able to pass on their sharply rising costs to their customers and benefited from people rushing to buy goods and services before price increases.”
“However, this phase looks set to finish as end consumers will have to cut back at some point, and monetary policy could become more restrictive in the eurozone from July.”
EUR/USD reaction
The shared currency shows little reaction to the improvement in the Eurozone Sentix data. EUR/USD is almost unchanged on the day, currently struggling with its recovery at 1.0695.
EUR/CAD is soft after failing – again – in the mid-1.37s. A break under the April low at 1.3390 will add to downside pressure, economists at Scotiabank report.
Trend momentum signals are aligned bearishly for the EUR
“Trend momentum signals are aligned bearishly for the EUR and have picked up over the past week, suggesting that the slide is liable to have another good look at key support at 1.3390/95 at least before this move lower is complete.”
“A break under the base of the sideways range that has held for the past few weeks would suggest another, significant lurch lower for the cross towards the 1.30 area (note the 2015 low at 1.3025).”
British Prime Minister Boris Johnson has survived the no-confidence vote on Monday but 148 MPs voted against him. As highlighted by economists at MUFG Bank, UK political instability is not good for the pound.
A hollow victory for Boris
“The result of the confidence vote in PM Johnson last night was not a particularly favourable outcome for the prime minister. It was a victory of course – by 211 votes to 148 votes – but perhaps a hollow one.”
“The difficult economic outlook that lies ahead will be far more difficult to get through with a PM that lacks support. Difficult policies like altering the framework of the Northern Ireland Protocol that is integral to the relationship with the EU and the Withdrawal Agreement points to further divisions down the road.”
“We already have GBP forecasts that indicate underperformance and weaker GBP/USD levels than the current spot level through Q3 and the outcome of last night’s vote is consistent with our bearish GBP view.”
- Silver extended the overnight pullback from the $22.50 supply zone and edged lower on Tuesday.
- The 23.6% Fibo helped limit the downside, with bulls showing resilience below the $22.00 mark.
- Sustained strength beyond the 38.2% Fibo. is needed to support prospects for any further upside.
Silver extended the previous day's retracement slide from a one-month high, around the $22.45-$22.50 supply zone and witnessed some follow-through selling on Tuesday. The white metal remained depressed through the early European session and was last seen flirting with the daily low, around the $22.00 round-figure mark.
Looking at the broader picture, the XAG/USD, so far, has been struggling to make it through the 200-period SMA resistance on the 4-hour chart. The mentioned barrier, currently around the $22.30 area, should act as a pivotal point, which if cleared might be seen as a trigger for bulls and pave the way for further gains.
The XAG/USD could then surpass the $22.50 resistance zone, which coincides with the 38.2% Fibonacci retracement level of the $26.22-$20.46 downfall. The momentum could then allow bulls to reclaim the $23.00 mark and lift spot prices further to the next relevant hurdle near the $23.30 region, or the 50% Fibo. level.
On the flip side, any subsequent fall is likely to find some support near the 23.6% Fibo. level, around the $21.80-$21.75 region. Some follow-through selling, leading to a convincing break below the $21.50 area, would make the XAG/USD vulnerable to testing the $21.00 mark with some intermediate support near the $21.30 zone. The downward trajectory could further get extended and expose the YTD low, around the $20.45 region touched on May 13.
Silver 4-hour chart
-637901867692439334.png)
Key levels to watch
- DXY extends the upside to new 2-week highs near 102.70.
- US yields shed some ground following Monday’s strong advance.
- Balance of Trade, Consumer Credit Change next on tap.
The greenback, in terms of the US Dollar Index (DXY), clinches new 2-week highs in the 102.70 region on turnaround Tuesday.
US Dollar Index bolstered by yields, waits for CPI
The index advances for the third session in a row on the back of the soft note in the risk complex, while the recent strong bounce in US yields also collaborated with the dollar’s upside.
On the latter, yields in the short end of the curve advanced to multi-week highs past 2.75%, the belly surpassed the key 3.00% mark and the long end flirted with the 3.20% region, all in response to renewed speculation surrounding the Fed’s move on rates in the next couple of meetings.
In the US calendar, trade balance figures are due seconded by Consumer Credit Change.
What to look for around USD
The index regained the firm pace and reclaimed the area north of the key 102.00 yardstick in recent sessions.
The dollar’s weakness seen in mid-May came in response to the rising perception that inflation might have peaked in April, which in turn supports the idea that the Fed may not need to be as aggressive as market participants expect when it comes to raising the Fed Funds rates.
In the meantime, the Fed’s divergence vs. most of its G10 peers coupled with bouts of geopolitical effervescence, higher US yields and a potential “hard landing” of the US economy are all factors still supportive of a stronger dollar in the next months.
Key events in the US this week: Balance of Trade, Consumer Credit Change (Tuesday) – MBA Mortgage Applications, Wholesale Inventories (Wednesday) – Initial Claims (Thursday) – Inflation Rate, Flash Consumer Sentiment, Monthly Budget Statement (Friday).
Eminent issues on the back boiler: Powell’s “softish” landing… what does that mean? Escalating geopolitical effervescence vs. Russia and China. Fed’s more aggressive rate path this year and 2023. US-China trade conflict. Future of Biden’s Build Back Better plan.
US Dollar Index relevant levels
Now, the index is gaining 0.08% at 102.49 and a break above 102.83 (monthly high June 7) would open the door to 105.00 (2022 high May 13) and finally 105.63 (high December 11 2002). On the other hand, the next contention emerges at 101.52 (55-day SMA) followed by 101.29 (monthly low May 30) and then 99.81 (weekly low April 21).
GBP/CAD has dropped below support near 1.58. More softness lies ahead, economists at Scotiabank report.
Additional weakness in GBP/CAD in the near-to-medium term
“GBP/CAD retains a weak and vulnerable undertone, with the cross trading below the base of the May consolidation range at 1.5790.”
“The GBP has edged to a minor new long-term cycle low, below the 2017 low, at 1.5720 which points to additional weakness in the cross in the near-to-medium term.”
“Weekly price signals are bearish while short, medium and long-term trend momentum signals are aligned bearishly against the GBP at this point. This will limit the GBP’s ability to recover (to near 1.58 at most) and support the outlook for more GBP losses towards 1.55 and possibly the 2013 low around 1.52.”
Here is what you need to know on Tuesday, June 7:
With the benchmark 10-year US Treasury bond yield rising above 3% on Monday, the greenback gathered strength against its rivals at the start of the week. The US Dollar Index extended its rebound early Tuesday and climbed to its highest level in two weeks. Sentix Investor Confidence report from the euro area will be looked upon for fresh impetus during the first half of the day. Later in the session, April Goods Trade Balance and Consumer Credit Change data will be featured in the US economic docket.
US stock index futures are down between 0.5% and 0.8% in the early European session, pointing to a risk-averse market atmosphere.
During the Asian trading hours on Tuesday, the Reserve Bank of Australia (RBA) announced that it hiked its policy rate by 50 basis points to 0.85% following its policy meeting. Commenting on the policy decision, RBA Governor Phillip Lowe noted that inflation in Australia has increased significantly. "The board expects to take further steps in the process of normalising monetary conditions in Australia over the months ahead," Lowe added.
Although AUD/USD spiked to a daily high of 0.7243 with the initial reaction to the RBA's bigger-than-expected rate increase, it erased a large portion of its daily gains and returned to the 0.7200 area in the European morning.
GBP/USD managed to close in positive territory on Monday but came under renewed bearish pressure on Tuesday. The pair was last seen trading at its lowest level since May 19 below 1.2500. British Prime Minister Boris Johnson has survived the no-confidence vote on Monday but 148 MPs voted against him.
EUR/USD fluctuates in a narrow band below 1.0700 on Tuesday after having posted small losses on Monday. The data published by Germany's Destatis revealed that Factory Orders contracted by 2.7% on a monthly basis in April, missing the market expectation for an increase of 0.5% by a wide margin.
Pressured by rising US Treasury bond yields, gold edged lower at the start of the week and closed below $1,840. XAU/USD stages a modest rebound on Tuesday but continues to trade below $1,850.
Bank of Japan Governor Haruhiko Kuroda reiterated earlier in the day that a weak Japanese yen would be beneficial for the economy if fluctuations in exchange rates were not too sharp. USD/JPY extended its rally and reached its highest level in more than 20 years above 132.70.
Following Monday's recovery, Bitcoin turned south on Tuesday and was last seen losing nearly 6% on the day at $29,500. Ethereum lost its momentum before testing $2,000 and fell below $1,800 early Tuesday.
Further upside in USD/JPY could reach the 133.00 region in the near term, suggested FX Strategists at UOB Group Lee Sue Ann and Quek Ser Leang.
Key Quotes
24-hour view: “While we expected USD to advance yesterday, we were of the view that ‘the major resistance at 131.35 is unlikely to come into the picture’. We did not expect the rapid upward acceleration that easily cracked 131.35 as USD rocketed to a high of 132.01. USD extended its advance during early Asian hours and further USD strength would not be surprising. The next resistance is at 132.60 followed by 133.00. The latter level is likely out of reach for today. Support is at 131.75 followed by 131.40.”
Next 1-3 weeks: “Yesterday (06 Jun, spot at 130.70), we were of the view that further USD strength would not be surprising but it may take a while before USD could move above 131.35. However, USD surged and cracked 131.35 before surging to 132.01. USD extended its advance during early Asian hours and solid upward momentum suggests USD could continue to strengthen towards 133.00. Overall, only a break of 130.80 (‘strong support’ level was at 129.45 yesterday) would indicate that the USD strength that started early last week (see annotations in the chart below) has run its course.”
- USD/CHF shot to over a two-week high on Tuesday amid sustained USD buying.
- The recent surge in the US bond yields continued acting as a tailwind for the buck.
- A softer risk tone could underpin the safe-haven CHF and cap gains for the major.
The USD/CHF pair gained positive traction for the third successive day and climbed to over a two-week high during the first half of trading action on Tuesday. The pair maintained its bid tone through the early European session and was last seen hovering around the 0.9735-0.9740 region.
Investors remain concerned that the global supply chain disruption caused by the Russia-Ukraine war would continue to push consumer prices higher and force the Fed to tighten its monetary policy at a faster pace. This, in turn, pushed the yield on the benchmark 10-year US government bond back above the 3.0% threshold, which, in turn, offered some support to the US dollar and acted as a tailwind for the USD/CHF pair.
That said, a softer risk tone could underpin the safe-haven Swiss franc and keep a lid on any further appreciating move, at least for the time being. The market sentiment remains fragile amid worries that a more aggressive move by major central banks to constrain inflation could pose challenges to global economic growth. This warrants some caution before placing aggressive bullish bets around the USD/CHF pair.
Traders might also prefer to wait on the sidelines ahead of the crucial US consumer inflation report on Friday, which might influence the Fed's policy tightening path and the USD price dynamics. In the meantime, the US bond yields would drive the USD demand and provide some impetus to the USD/CHF pair. Apart from this, traders will take cues from the broader market risk sentiment in the absence of any top-tier US economic data.
Technical levels to watch
According to preliminary readings from CME Group for natural gas futures markets, open interest rose for the second session in a row on Monday, now by around 14.1K contracts. In the same line, volume remained choppy and this time went up by around 105.1K contracts.
Natural Gas sets sail to $10.00
Prices of natural gas navigated the area of cycle peaks well north of the $9.00 mark amidst rising interest and volume, introducing a potential continuation of the uptrend to the psychological $10.00 mark per MMBtu sooner rather than later.
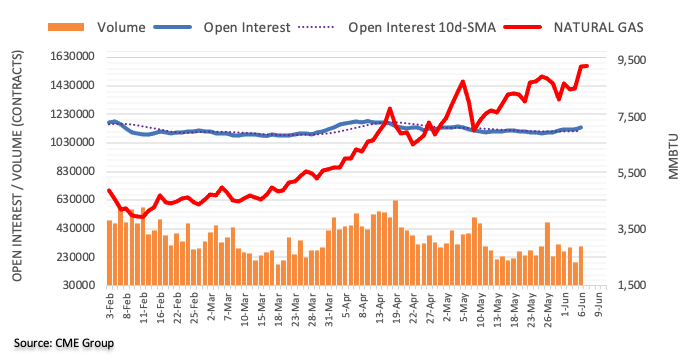
On Thursday, the European Central Bank (ECB) will deliver a key decision. Economists at Scotiabank expect the EUR/USD to edge lower towards the mid-1.06s region following the announcement.
Consensus-beating US CPI report could further EUR losses
“The bar for a hawkish surprise from the ECB this week is high as markets may be overestimating the speed and the volume of hikes that the bank will deploy this year. The EUR is more liable to weaken (towards the mid-1.06s and the figure area) than rally following this week’s decision; a consensus-beating US CPI report on Friday that bolsters Fed hike bets could further its losses.”
“For the EUR to resume its uptrend, and possibly break through 1.08, we think that Lagarde would have to clearly note that the ECB is ready to act more aggressively to contain inflation and expectations if necessary (code for a 50bps hike), providing backing for aggressive market expectations.”
Will earnings growth reaccelerate? While markets look forward to an acceleration in earnings growth and a subsequent rise in valuations over the next year, there are risks to this outlook, Mike Wilson, Chief Investment Officer and Chief US Equity Strategist for Morgan Stanley reports.
US stocks in the midst of a bear market rally
“Now, valuations have risen back to 17.5x earnings, despite a rising 10-year Treasury yield. In order for this to make sense, however, one must take the view that earnings growth will reaccelerate later this year. Time will tell, but we think S&P 500 earnings growth will slow further rather than reaccelerate.”
“The bear market rally that began a few weeks ago can continue for a few more weeks until the Fed makes it crystal clear they remain hawkish and earnings revisions fall well into negative territory. That combination should ultimately take the S&P 500 down towards our 3400 target by mid to late August.”
Czech National Bank's (CNB's) board gears up for a pre-emptive rate hike in June. Economists at Commerzbank expect the EUR/CZK to come under renewed upward pressure.
CNB to take a last stand to hike the base rate by a safe margin
“That the benchmark rate will likely be hiked by at least 75bp in June is now widely discounted by the markets, as it has been unambiguously signalled by a majority of board members; some may even have hinted (within their comments) that the balance at CNB need not decisively change in favour of dovish even after the July overhaul – prominent hawks will still be in place.”
“President Milos Zeman is planning to overhaul the board, in close consultation with incoming governor, Ales Michl. In fact, announcements along these lines from Zeman are now expected right after the 22 June CNB meeting. Given the controversy, we would not be surprised to see the constitutional mechanism for CNB appointments becoming a political hot topic for the next election.”
“For now, we recommend preparing for upward pressure on EUR/CZK and increased CZK volatility. It does not matter whether or not CNB will hike the rate by more than 75bp in June, the exchange rate will come under increasing pressure in the medium-term as soon as the central bank's reaction function becomes one-sided (i.e. lacks the ability to freely hike rates).”
In the opinion of FX Strategists at UOB Group Lee Sue Ann and Quek Ser Leang, NZD/USD is expected to trade between 0.6425 and 0.6580 in the next weeks.
Key Quotes
24-hour view: “Yesterday, we highlighted that NZD ‘could dip below the strong support at 0.6500 but is unlikely to threaten the next support at 0.6455’. Our view was not wrong as NZD dropped to a low of 0.6485 during NY hours. Downward momentum is beginning to build and NZD could weaken from here. However, the major support at 0.6425 is not expected to come under threat (there is another support at 0.6460). Resistance is at 0.6505 followed by 0.6530.”
Next 1-3 weeks: “There is no change in our view from yesterday (06 Jun, spot at 0.6515). As highlighted, the recent build-up in upward momentum has fizzled out and NZD is likely to trade sideways between 0.6425 and 0.6580 for now.”
The Reserve Bank of India (RBI) is widely expected to hike rates at its meeting ending on June 8, the question is by how much? Economists at TD Securities expect the RBI to hike 50 bp as it attempts to get back on the curve. Therefore, the Indian rupee is set to find some support from a 50 bp move, but high oil prices act as a headwind.
India’s broad basic balance worsening
“We think the tide has turned. After having maintained a dovish stance for a prolonged period, April saw a shift in tone followed by a 40bp inter-meeting hike in May. We expect the RBI to hike its policy repo rate by 50bp to 4.90% while maintaining an accommodative stance”
“INR is likely to gain some support from a 50bp hike from the RBI but the currency is also being buffeted by higher oil prices, which is exacerbating India's oil import bill and weighing on the country's current account balance at a time when equity portfolio outflows have intensified.”
“The weakness in the USD over recent weeks has made the job easier for the RBI, but we still expect a weaker bias in the currency in the weeks and months ahead as India's underlying basic balance position (CA+FDI+portfolio flows) remains under pressure, with INR likely to underperform its peers.”
See – RBI Preview: Forecasts from four major banks, strong rate hike
- EUR/GBP is displaying a minor correction after hitting a high of 0.8580.
- The ECB is expected to sound hawkish and turn the interest rate wheel on the upside.
- A weak majority of the confidence vote in favor of UK PM Boris Johnson is showing some signs of political instability.
The EUR/GBP pair is facing barricades around 0.8580 after a vertical upside move from Monday’s low at 0.8523. A struggle around the critical resistance is hoping for an initiative buying action as advancing odds of a hawkish monetary policy by the European Central Bank (ECB) is strengthening the shared currency bulls.
The ECB is expected to dictate a jumbo rate hike in its monetary policy meeting on Thursday as a hawkish tone is necessary to combat the soaring inflation. The eurozone inflation rate has advanced to 8.1% from the prior print of 7.4% on annual basis. Inflationary pressures are mounting sharply and are affecting the real income of the households in Europe. An inflation figure above 8% is itself a mess for ECB that is needed to fix sooner.
Apart from the ECB interest rate decision, investors will keep an eye on the eurozone Gross Domestic Product (GDP) numbers, which are due on Wednesday. The quarterly and annualized figures are expected to remain unchanged at 0.3% and 5.1% respectively.
Meanwhile, pound bulls are displaying some strength around 0.8580 as long liquidations have kicked in, however, the upside for the asset is intact. Rising concerns over UK PM Boris Johnson’s leadership are hurting the pound bulls. Although UK’s Johnson has won the confidence vote, the support of only 59% of his own lawmakers does show some political instability in the UK economy. This may keep the pound bulls on the tenterhooks.
- Sustained USD buying interest dragged GBP/USD to a near three-week low on Tuesday.
- A generally weaker risk tone, elevated US Treasury bond yields underpinned the buck.
- The downside seems limited as traders wait for the crucial US CPI report later this week.
The GBP/USD pair managed to recover a few pips from a near three-week low touched in the last hour and was last seen trading around the 1.2470 region, still down nearly 0.50% for the day.
Despite the fact that the UK Prime Minister Boris Johnson survived a vote of no confidence, the British pound, so far, has struggled to attract buyers and remains at the mercy of the US dollar. A generally softer risk tone, along with the recent strong rally in the US Treasury bond yields, continued acting as a tailwind for the buck and prompted fresh selling around the GBP/USD pair on Tuesday.
The market sentiment remains fragile amid concerns that a more aggressive move by major central banks to constrain inflation could pose challenges to global economic growth. Investors also seem worried that the global supply chain disruption caused by the Russia-Ukraine war would continue to push consumer prices higher and force the Fed to tighten its monetary policy at a faster pace.
This, in turn, lifted the yield on the benchmark 10-year US government bond beyond the 3.0% threshold for the first time in nearly four weeks and offered additional support to the greenback. Hence, the market focus will remain glued to the US CPI report on Friday, which might determine the Fed's policy tightening path and will play a key role in driving the near-term USD price dynamics.
In the meantime, the broader market risk sentiment and the US bond yields might influence the USD amid absent top-tier economic releases. This, in turn, should allow traders to grab short-term opportunities around the GBP/USD pair.
Technical levels to watch
Having won the vote of confidence by a 59% majority on Monday, UK PM Boris Johnson is set to address the Cabinet on Tuesday, Reuters reports, citing sources with knowledge of the matter.
Key takeaways
Will call for progress on easing cost of living, improving health care and policing and uniting the country.
Will set out new vision to Cabinet, including measures to reduce childcare costs for parents and a renewed drive to get more people onto the housing ladder.
Increased volatility has seen the EUR/USD trading from just under 1.04 and bouncing back all the way to 1.08. However, the euro remains in a delicate state, economists at the National Bank of Canada report.
A temporary reprieve?
“While the ECB cannot afford to be as aggressive as the Fed when it comes to normalization, rate increases are needed to send a signal that something is being done to tame inflation. The first hike could come as soon as July and the second half of the year could give some support to the euro.”
“We remain cautious as growth in the second quarter was likely held back by the geopolitical backdrop. Conditions in the Eurozone are likely to remain difficult for some time and could limit the central bank.”
USD/TRY takes the bids to 16.68, the highest level since late December 2021, as bulls track the options market signals to extend the previous day’s run-up during early Tuesday morning in Europe.
That said, one-month risk reversal (RR) on the USD/TRY pair, a spread between the calls and puts, reverses the previous day’s fall of -0.270 with 0.220 figures for Monday, per Reuters’ data on the options market.
In doing so, the weekly RR figure pares the biggest fall in five weeks. It’s worth noting that the weekly risk reversal was down to -0.620 by the end of Friday, after rising for the four consecutive weeks.
Also important to note is the monthly data as the call-put spread rallied the most since November 2021 in May, with 3.675 figures.
Have we entered into summer trading? Gold prices are anchored to the $1,850 range and strategists at TD Securities expect the yellow metal to trade close to this level.
Summer trading has officially begun
“XAU/USD is anchored to the $1,850 range, which previously housed substantial open interest in options markets, while quantitative tightening has begun and the market has discounted the Fed's aggressive path of rate hikes on the horizon.”
“Summer trading has officially begun, which suggests prices could remain range-bound near $1,850, but the set-up remains for additional liquidations on the horizon.”
FX option expiries for June 7 NY cut at 10:00 Eastern Time, via DTCC, can be found below.
- EUR/USD: EUR amounts
- 1.0600 1.13b
- 1.0650-60 (64m
- 1.0700 552m
- 1.0730-40 1.3b
- 1.0790-00 606m
- GBP/USD: GBP amounts
- 1.2400-10 557m
- 1.2525 215m
- USD/JPY: USD amounts
- 130.15 226m
- 131.00 451m
- 132.50 450m
- AUD/USD: AUD amounts
- 0.7200 415m
- 0.7220 454m
- USD/CAD: USD amounts
- 1.2695 610m
- NZD/USD: NZD amounts
- 0.6445 546m
The Canadian economy remains resilient. Therefore, economists at the National Bank of Canada expect the loonie to strengthen.
A red hot economy
“After a 15.7% surge in Q1 2022, Canada leads the G7 when it comes to growth in nominal GDP. With the economy firing on all cylinders, the Bank of Canada unsurprisingly opted to raise its overnight rate target 50 basis points on June 1. The odds of a 75-bp move in July are no longer trivial.”
“With the Canadian economy showing stronger momentum than the US economy, short-term interest spreads moved significantly in Canada's favour for the first time in six months. This should favour a further appreciation of the CAD against the greenback.”
“Aside from economic fundamentals, there are also technical elements that could favour CAD appreciation in the coming weeks as Canada’s bond market will be handing out more than $13 billion in coupon payments and redemption proceed.”
- EUR/JPY bulls take a breather around the highest levels since early 2015.
- Germany’s Factory Orders slumped to -2.7% in April, versus 0.5% forecasts.
- Firmer yields, hawkish ECB calls keep buyers hopeful near multi-year high.
- BOJ’s Kuroda also tried to talk down the cross but failed to impress sellers.
EUR/JPY pares intraday gains around 142.00, the highest level in seven years, after German data probed buyers during the initial hour of the European session on Tuesday. Even so, firmer US Treasury yields and hawkish expectations from Thursday’s ECB keep buyers in the driver’s seat.
Germany’s Factory Orders for April slowed down to -2.7% MoM and -6.2% YoY, versus -4.2% and -3.1% respective priors. On the contrary, Japan’s Coincident Index and Leading Economic Index for April flashed mixed numbers as the former eased below 97.5 forecast to 96.8 while the latter rose beyond 100.8 to 102.9.
Although the German data challenges the recent hawkish rhetoric among the European Central Bank (ECB) policymakers, record-high inflation in the bloc pushes the policymakers towards a rate hike. The same propels the regional currency Euro ahead of Thursday’s ECB.
On the other hand, strong yields weigh on the Japanese yen (JPY) even as the Bank of Japan (BOJ) Haruhiko Kuroda tried to limit the JPY weakness with statements like, “An exit will be discussed once the stable inflation goal has been met.”
It’s worth noting that the north-run in the Treasury yields could be linked to the global central banks’ rush towards tighter monetary policies. On Tuesday, the Reserve Bank of Australia (RBA) surprised markets with a higher-than-expected rate hike of 0.50%.
Amid these plays, the US 10-year Treasury yields rise for the seventh consecutive day to 3.045%, up 0.5 basis points (bps), whereas the US S&P 500 Futures drop 0.60% intraday by the press time.
Looking forward, the return of the full markets and the ECB’s reaction to the record-high inflation will be crucial for EUR/JPY traders.
Technical analysis
Although the overbought RSI conditions hint at the EUR/JPY pair’s further pullback, bulls keep reins until the quote stays beyond April’s peak of 140.00. That said, a four-month-old ascending trend channel directs the bulls towards 144.50 hurdle.
Reserve Bank of India (RBI) meets Wednesday, June 8 at 04:30 GMT and is expected to hike rates 50 bp to 4.90%. Here are the expectations as forecast by the economists and researchers of four major banks regarding the upcoming central bank's decision.
ANZ
“We expect the RBI to hike the repo rate by 50 bps to 4.90%, making another step to restoring the policy rate to its pre-pandemic 5.15%. There are risks that with the recent excise duty cut on fuel, the monetary policy committee may choose to hike by less than 50 bps, for example, by 40 bps. In any case, inflation is set to remain acute for the rest of FY23, perhaps north of 6% in all quarters.”
Standard Chartered
“India’s Monetary Policy Committee (MPC) is likely to hike the repo rate by another 40 bps to 4.80%. We acknowledge the risk of a 50bps hike if the MPC aims to reach the pre-pandemic repo rate level of 5.15% sooner. We expect policy guidance to be hawkish, with the MPC likely to sharply raise its FY23 (ending March 2023) CPI inflation forecast from 5.7% currently (our forecast: 6.6%). Meanwhile, a marginal downward revision to the MPC’s FY23 GDP growth forecast, to 7.0% from the current 7.2% is also likely (our forecast: 7%). With inflation likely to stay above 6% (the upper threshold of the 4 +/-2% target range), we expect rate increases at every meeting, taking the repo rate to 5.75% by end-FY23.”
TDS
“Inflation is surging, having hit 7.8% YoY in April, well above the RBI's 2-6% target range amid ongoing supply pressures. We think the RBI will need to step up its efforts given that real rates remain negative while inflation will likely remain elevated over the coming months. As such we expect a series of hikes ahead, with the repo rate likely to peak at 5.9% in Q1 23.”
SocGen
“We expect the RBI to raise the policy rate by 50bp (potentially in a range between 35-50bp) (taking the repo rate to 5.9%). Given earlier complacency on the transitoriness of inflation, the RBI now needs to engineer a growth slowdown to reduce the pace of passthrough of high input costs to output prices and prevent the high inflation scarring the economy over the long term. And, with the bank formally shifting the focus of monetary policy from supporting growth to containing inflation, we expect it to maintain an aggressive stance. This would mean the RBI intervening in the forex market to prevent stronger depreciation of the currency. Also, with government borrowing expected to be stepped up following the recent fuel tax cut, the RBI might also focus on yield containment to prevent a dislocation of the government’s fiscal position. We, therefore, see the possibility of the RBI announcing additional rounds of ‘operation twist’ and/or going the Bank Indonesia’s (BI) way by announcing some form of temporary debt monetisation scheme. There could also be a hike in the CRR to drain excess liquidity from the banking system.”
- AUD/USD has plunged to near 0.7170 as the DXY rebounds firmly ahead of the US inflation.
- A higher-than-expected hawkish RBA policy has failed to keep aussie bulls at elevated levels.
- RBA’s tightening policy may trigger recession fears in the Australian economy.
The AUD/USD pair has surrendered its entire intraday gains after hitting a high of 0.7248. An impulsive buying action was displayed by the aussie bulls after the Reserve Bank of Australia (RBA) dictated an interest rate hike by 50 basis points (bps). The asset reversed its recorded gains as investors turned cautious ahead of the US inflation and shifted their funds into the greenback.
Against the consensus of 25 bps, the RBA announced a hike by 50 bps in its Official Cash Rate (OCR). No wonder, a jumbo rate hike announced by the RBA is necessary for taming the inflationary pressures. However, the Australian payroll data for April was not much lucrative, which has triggered recession fears in the Australian economy.
The Australian labor department reported addition of 4k in April, significantly lower than the forecasts of 30k. An extreme policy tightening approach by the RBA will force the corporate to impose more filters on investment opportunities. This will lead to further slippage in the Employment Change.
Meanwhile, the US dollar index (DXY) has extended its gains and has overstepped its previous two week’s high at 102.73. Uncertainty over the release of Friday’s US Consumer Price Index (CPI) is supporting the DXY. A preliminary estimate for the annual US inflation is 8.2% against the prior print of 8.3%. A minor slippage in the US inflation is not going to exhaust the momentum of the DXY bulls but will bolster the odds of a consecutive jumbo rate hike by the Federal Reserve (Fed) next week.
Hawkish European Central Bank (ECB) rhetoric and rising German yields have seen EUR/USD recover from 1.0350 lows. In the view of Benjamin Wong Strategist at DBS Bank, there is a bias for an interim consolidation phase until the pair makes sustained gains over 1.0931, the Ichimoku cloud resistance.
Waiting for the fog to lift
“While the recovery from 1.0350 lows drowned out the voices of the EUR parity crowd, EUR has yet to push convincingly through 1.0931 that sites the Ichimoku cloud resistance.”
“Looking at the monthly charts, there remains no absolute affirmation that EUR’s decline from 1.2349 (January 2021 highs) has ended. EUR gained downside momentum when it sliced through support axing 1.0341-1.0636; as a first step to affirm a true bottom, EUR needs to break above and sustain gains over 1.0931 (Ichimoku cloud resistance).”
- NZD/USD remains on the back foot for third consecutive day as it refreshes multi-day low.
- RSI retreat, easing bullish bias of MACD favor sellers.
- 20-DMA, 23.6% Fibonacci retracement challenge further declines, bulls need to cross 0.6575 to retake controls.
NZD/USD holds lower ground near a two-week low of 0.6439, down 0.67% intraday around 0.6448 by the press time.
In doing so, the Kiwi pair justifies the previous day’s downside break of an upward sloping support line from May 13, now resistance around 0.6525.
Also keeping the NZD/USD bears hopeful is the quote’s reversal from the monthly horizontal area around 0.6565-75.
Furthermore, the receding bullish bias of the MACD signals and RSI (14) retreat, not oversold, adds strength to the pair’s downside targeting the 20-DMA support of 0.6424.
Additionally challenging to the NZD/USD bears is the 23.6% Fibonacci retracement of the April-May downside, near 0.6410, as well as the 0.6400 threshold.
In a case where NZD/USD drops below 0.6400, it becomes vulnerable to revisiting the yearly low of 0.6218.
Meanwhile, the corrective pullback may initially aim for the 0.6525 support-turned-resistance before targeting the 0.6565-75 resistance area.
However, a clear run-up beyond 0.6575 won’t hesitate to direct NZD/USD buyers towards the 61.8% Fibonacci retracement level of 0.6720.
NZD/USD: Daily chart
-637901790897369140.png)
Trend: Limited downside expected
- German Factory Orders fell 2.7% MoM in April.
- German Retail Sales arrived at -6.2% YoY in Apr vs. -3.1% previous.
- EUR/USD keeps range below 1.0700 amid dismal German data.
The German Factory Orders declined in April, suggesting that the manufacturing sector downturn in Europe’s economic powerhouse is deepening.
Contracts for goods ‘Made in Germany’ dropped by 2.7% on the month vs. 0.5% expected and -4.2% last, the latest data published by the Federal Statistics Office showed on Tuesday.
On an annualized basis, Germany’s Industrial Orders slumped 6.2% in the reported month vs. -3.1% previous.
FX implications
The shared currency remains unfazed by the disappointing German factory data.
At the time of writing, EUR/USD is down 0.26% on the day, trading at 1.0666.
CME Group’s flash data for crude oil futures markets saw open interest rise by around 4.2K contracts at the beginning of the week, extending at the same time the uptrend in place since May 25. Volume, in the same direction, increased by around 1.1K contracts, partially offsetting the previous day’s drop.
WTI: Underlying tone remains positive
Prices of the WTI clinched new tops near the $121.00 mark on Monday, although it closed the session slightly in the negative territory. The downtick, however, was in tandem with rising open interest and volume, opening the door to further retracement in the very near term. The extension and duration of the corrective downside, however, remains to be seen in the current context of tight supply conditions and rising demand.
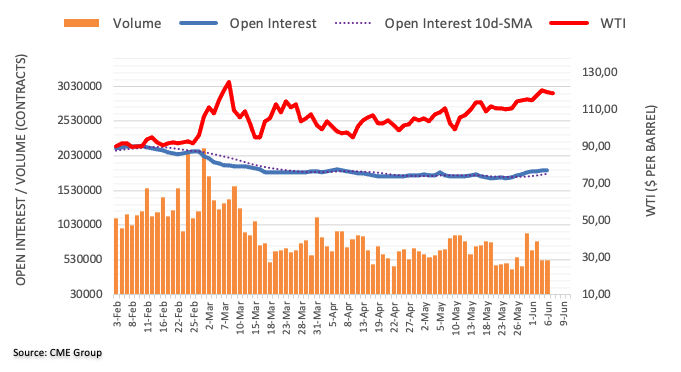
- USD/JPY rallies to the moon, challenges the 133.00 hurdle.
- The US dollar rises with the renewed uptick in the US Treasury yields.
- BOJ Kuroda’s intervention fails even though the pair is overbought on the daily chart.
USD/JPY is sitting at the highest level in 20 years just below the 133.00 barrier, as bulls take a breather before the next push higher.
The fresh leg up in the US dollar offered the much-needed boost to USD/JPY buyers, which drove the pair closer to the 133.00 mark. This comes as the US Treasury yields broke their Asian consolidation to the upside in early Europe.
Earlier this Tuesday, the major pulled back briefly after Bank of Japan (BOJ) Governor Haruhiko Kuroda intervened verbally, by noting that the “big yen decline in a short period of time is negative for the economy.”
Looking ahead, the further upside in the pair appears likely, as the dollar is likely to extend higher in tandem with the yields amid the return of recessionary fears. Major central banks are on an aggressive tightening cycle, raising concerns over a global economic slowdown.
Technically, USD/JPY’s daily chart shows that the previous week’s bullish wedge confirmation has allowed bulls to flex their muscles, embarking on a new uptrend.
The immediate upside hurdle is now aligned at the 133.50 psychological level, as the buying pressure around the spot remains unrelenting.
USD/JPY: Daily chart
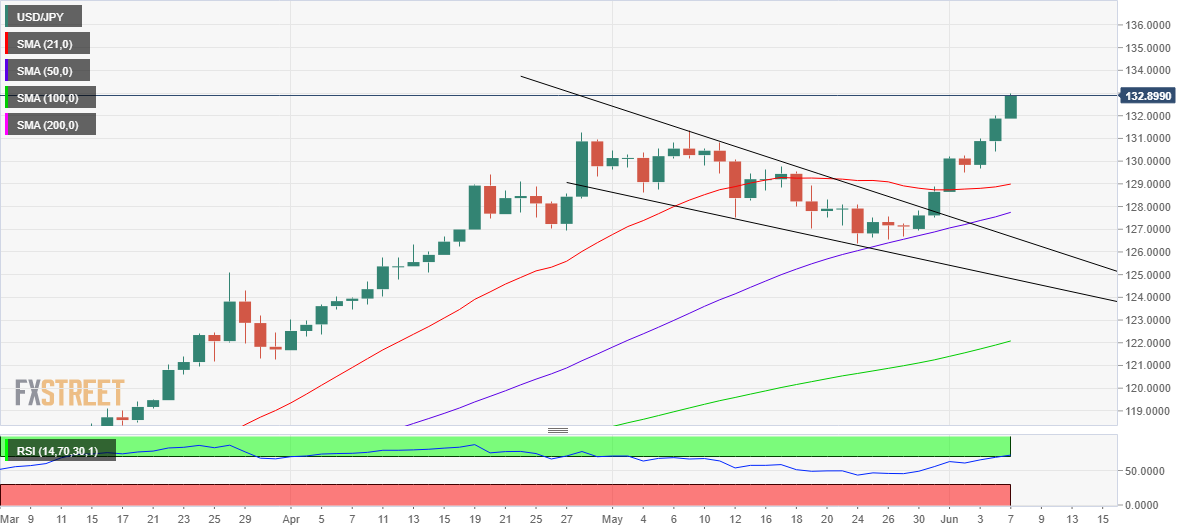
However, the 14-day Relative Strength Index (RSI) is peeking into the overbought territory, challenging the bullish commitments.
A correction could be in the offing, as the price has outpaced the pattern target measured at 132.77.
If a corrective decline kicks in, then the pair could retrace towards the 132.00 region, below which the daily low of 131.87 will come to the rescue of bulls.
Further south, Monday’s low of 130.43 will be on sellers’ radars.
USD/JPY: Additional levels to consider
- Gold retreats from intraday high while pausing two-day downtrend amid mixed clues.
- Firmer yields, USD weigh on the metal but market’s indecision test the bears.
- Options market flash bearish signals ahead of the key US inflation data, ECB.
Gold Price (XAUUSD) struggles to recall bulls as the metal eases back to $1,840, after a failed attempt to pause a two-day downtrend. Even so, the yellow metal remains unchanged on a daily basis heading into Tuesday’s European session.
Bears run out of steam amid sluggish markets
Even if the metal remains pressured around the weekly low, the buyers are confused amid mixed signals affecting the market’s risk appetite. Among them, the sluggish performance of Asia-Pacific shares joins the firmer US Treasury yields and downbeat S&P 500 Futures to portray the market’s mood.
Also read: Gold Price Forecast: Bearish technical structure suggests more pain ahead
Options market teases bears
Trader holding gold coin
Options market catalysts also exert downside pressure on the bullion. That said, the one-month risk reversal (RR) on the Gold Price, a spread between the calls and puts, dropped the most in a fortnight by the end of Monday, with the latest figures being -0.090, per Reuters’ data on the options market. In doing so, the XAUUSD RR also drop for the third consecutive week.
China’s optimism defends Gold Price
China Securities Journal (CSJ) praised the country’s virus control and policy stimulus while expecting economic improvement in the second half (H2) of 2022. Previously, Beijing’s ability to overcome the pandemic and citing preparations to recover from the economic loss with faster unlocks joined US President Joe Biden’s likely easy stand for China, as far as showing readiness to remove Trump-era tariffs, seemed to have favored sentiment and challenge XAUUSD bears.
US inflation, ECB remain in the spotlight
Friday’s strong US Nonfarm Payrolls (NFP) and the last dose of hawkish Fedspeak before the blackout norm have already bolstered the calls for the Fed’s 50 bps rate hike in September, to around 70% versus nearly 30% a week ago. The same highlights Friday’s US Consumer Price Index (CPI) data for May, expected 8.2% YoY versus 8.3% prior, to prove the market forecasts right and exert an additional downside burden on the Gold Price.
Additionally, the European Central Bank’s (ECB) monetary policy meeting, up for Thursday, is less likely to offer any rate change. However, the recently hawkish rhetoric among the policymakers highlights the need for the clues supporting the July rate hike, which in turn might favor the gold sellers.
Gold Price technical outlook
Gold bears run out of steam inside a bearish chart pattern, namely a rising wedge. However, downbeat RSI (14), not oversold, join the metal’s failures to cross the 100 and 200-SMAs to keep the sellers hopeful.
That said, a clear downside break of the $1,840 appears necessary to confirm the rising wedge breakdown and aim for the fresh 2022 low, currently around $1,780.
Also likely to challenge the XAUUSD bears are the multiple levels around $1,830, $1,800 and May’s bottom near $1,786.
Meanwhile, the 100 and 200-SMA, respectively near $1,845 and $1,862, restrict the short-term rebound of the Gold Price.
Additionally, the upper line of the stated wedge, near $1,885, also tests the gold buyers before giving them control.
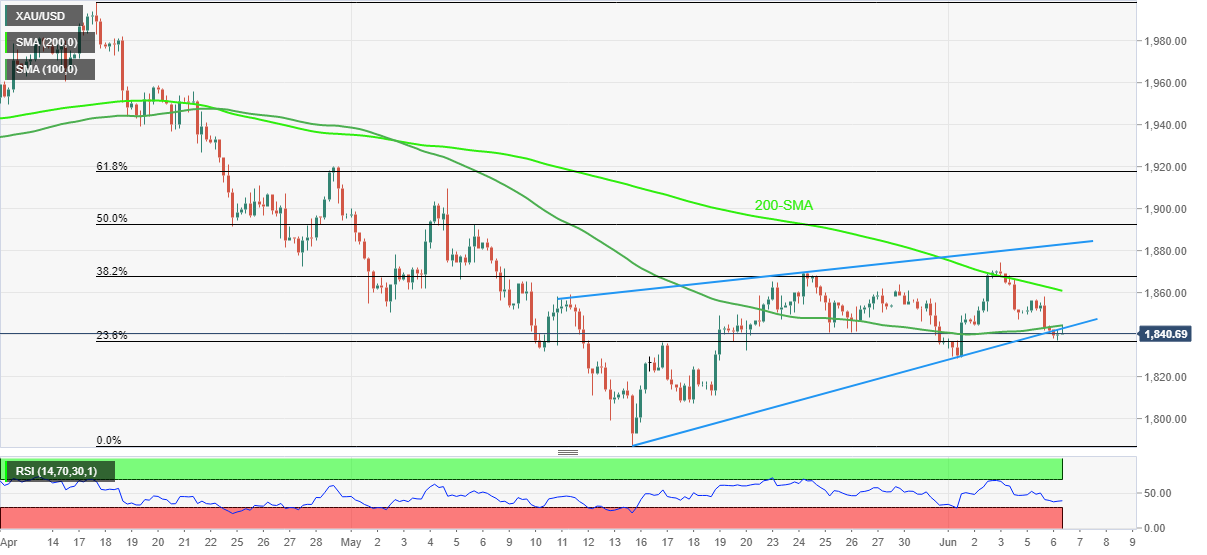
Gold gets rejected, but bulls could retry
Gold Price is licking its wounds near the $1,840 region this Tuesday. As FXStreet’s Dhwani Mehta notes, a bearish technical structure suggests more pain ahead.
XAU/USD challenges bullish commitments below 200-DMA once again
“Bears breached the $1842 key support, the confluence of the bearish 21-DMA and horizontal 200-DMA. Traders are now poised for a fresh downswing in XAUUSD once the 21 and 200-DMA bearish crossover gets validated.”
“A test of the previous week’s low of $1,829 remains well on the table should the bearish pressures intensify. Further south, the $1,820 round figure will come to the rescue of gold bulls.”
“Any recovery will need acceptance above the strong support now turned resistance at $1,842. The next upside target could be the $1,850 psychological barrier, above which Monday’s high of $1,858 could be challenged. Buyers will seek fresh opportunities above the latter to initiate a fresh upswing towards the previous week’s high of $1,870.”
GBP/USD remains side-lined between 1.2470 and 1.2670 for the time being suggested FX Strategists at UOB Group Lee Sue Ann and Quek Ser Leang.
Key Quotes
24-hour view: “Our expectations for GBP to ‘dip below 1.2470’ did not materialize as it rebounded from 1.2477 to 1.2577 before easing off to close at 1.2529 (+0.29%). The price actions appear to be part of a consolidation and GBP is likely to trade sideways for today, expected to be within a range of 1.2470/1.2570.”
Next 1-3 weeks: “Last Friday (03 Jun, spot at 1.2570), we highlighted that the sharp but short-lived swings have resulted in a mixed outlook and we expected GBP to trade between 1.2470 and 1.2670. There is no change in our view for now even though the underlying tone has softened and GBP could dip below the support at 1.2470. Looking ahead, GBP has to close below 1.2430 before a sustained decline is likely.”
- The black gold is juggling in a 40-pips range after a mild correction.
- China's reopening will spurt the economic activities and will eventually raise growth forecasts.
- OPEC+ has announced more output for July and August by 648k barrels.
West Texas Intermediate (WTI), futures on NYMEX, is displaying back and forth moves in a narrow range of $117.30-117.70 in the Asian session. The black gold is juggling after a minor pullback and is gearing for a continuation of the upside momentum as the reopening of China after a painful lockdown of two months in Shanghai and Beijing has bolstered the odds of a demand recovery.
Chinese administration loaded curbs on the movement of men, materials, and machines to contain the spread of the Covid-19. Zero tolerance on lockdown measures brought a slippage in the aggregate demand and eventually in the usage of oil. Now, the reopening of China after a severe lockdown has underpinned the oil bulls. It is worth noting that China is the largest importer of oil and a recovery in oil demand in China carries a significant impact on oil prices.
Meanwhile, supply constraints are expected to ease further as the OPEC+ has promised to pump more oil into the global oil supply. To fix the imbalance in the demand-supply mechanism, the OPEC+ has announced more output for July and August by 648k barrels.
An embargo on oil imports from Russia by the European Union (EU) has triggered a prolonged supply constraint scenario. Beyond some exceptions for Hungary, the EU will end its dependence on fossil fuels from Russia. A long-term prohibition of oil from Moscow will keep oil prices elevated unless otherwise, the world economy shifts to cleaner energy.
Considering advanced prints from CME Group for gold futures markets, open interest shrank for the second session in a row on Monday, this time by nearly 2K contracts. Volume followed suit and went down for the fourth consecutive session, now by around 8.6K contracts.
Gold appears supported around $1,840
Gold started the week on the back foot amidst shrinking open interest and volume. That said, the leg lower in the precious metal seems unsustainable at least in the very near term and the $1,840 region, where the 200-day SMA sits, continues to act as a strong support.
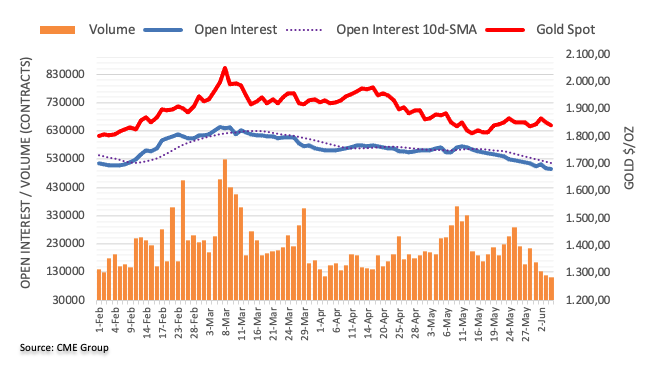
- USD/CAD picks up bids to refresh intraday high and extends the previous day’s bounce off six-week low.
- Risk-aversion wave weighs on commodity prices despite upbeat headlines from China.
- US dollar benefits from sour sentiment, strong yields ahead of the US inflation.
- Trade numbers from the US and Canada for April join May’s Canadian Ivey PMI to direct intraday moves.
USD/CAD stretches the week-start rebound from a 1.5-month low as it takes the bids to refresh intraday top around 1.2610 heading into Tuesday’s European session. In doing so, the Loonie pair justifies the US dollar’s strength, as well as downbeat prices of Canada’s main export item WTI crude oil.
That said, the US Dollar Index (DXY) rises for the third consecutive day, up 0.24% on a day near 102.65 by the press time, as the risk-off mood joins strong US Treasury yields to underpin the greenback’s upside momentum. That said, the US 10-year Treasury yields rise for the seventh consecutive day to 3.045%, up 0.5 basis points (bps) by the press time. It’s worth noting that the S&P 500 Futures drop 0.50% intraday to also portray the market’s sour sentiment.
The strength in the US Treasury yields could be linked to the recently escalating odds of a faster/heavier rate hike from the US Federal Reserve (Fed). Friday’s strong US Nonfarm Payrolls (NFP) and the last dose of hawkish Fedspeak before the blackout norm favored the US Treasury yields to snap a three-week downtrend by the end of Friday. As per the latest readings, market players anticipate around 70% chances of the Fed’s 0.50% rate hike in September versus nearly 30% odds favoring such an outcome a week ago.
On the other hand, upbeat headlines from China seems to battle the bears as China Securities Journal (CSJ) praised the country’s virus control and policy stimulus while expecting economic improvement in the second half (H2) of 2022. Previously, Beijing’s ability to overcome the pandemic and citing preparations to recover from the economic loss with faster unlocks joined US President Joe Biden’s likely easy stand for China, as far as showing readiness to remove Trump-era tariffs, seemed to have favored risk appetite.
Amid these plays, as well as the recently hiked OPEC+ output, WTI crude oil prices extend Monday’s pullback from a three-month high, down 0.30% intraday around $117.50 at the latest.
Moving on, Friday’s inflation data from the US and China, as well as the Canadian jobs report, will be important for the USD/CAD traders. On an intraday basis, the US/Canada trade data and Canada’s Ivey PMI for May will be important to watch for fresh impulses.
Technical analysis
Despite the latest rebound, a clear upside break of the previous support line from early April, around 1.2610 by the press time, appears necessary for the USD/CAD bulls to portray another battle with the 200-DMA hurdle surrounding 1.2660.
FX Strategists at UOB Group Lee Sue Ann and Quek Ser Leang noted EUR/USD is now seen navigating the 1.0625-1.0785 range.
Key Quotes
24-hour view: “We expected EUR to ‘consolidate and trade between 1.0690 and 1.0760’ yesterday. EUR subsequently traded between 1.0682 and 1.0751. The underlying tone has softened somewhat and EUR is likely to edge lower. However, a sustained drop below 1.0650 is unlikely (next support is at 1.0625). Resistance is at 1.0715 followed by 1.0745.”
Next 1-3 weeks: “Our latest narrative was from last Friday (03 Jun, spot at 1.0745) where EUR has to break above 1.0800 before further advance is likely. Yesterday, EUR dipped to a low of 1.0682. While our ‘strong support’ level at 1.0675 is not breached, the build-up in momentum has fizzled out. In other words, EUR does not appear to be ready to move above 1.0800 just yet. From here, EUR could trade between 1.0625 and 1.0785.”
- AUD/NZD crossed one-month-old horizontal hurdle on the RBA’s higher-than-expected rate hike.
- RBA beats market forecasts with 0.50% interest rate lift, cites inflation as the key cause for the bold move.
- The sustained upside can direct bulls towards May’s top, 2017 peak.
- Bears need validation from 200-SMA to retake control.
Alike other Aussie pairs, AUD/NZD also portrayed a stellar reaction to the RBA’s heavy rate hike while crossing the monthly hurdle. That said, the cross-currency pair rallied more than 60 pips to 1.1164 during the initial jump before retreating to 1.1142 amid Tuesday’s Asian session.
The Reserve Bank of Australia (RBA) crossed wide market expectations by lifting the benchmark interest rate by 50 basis points (bps) to 0.85%. The RBA Rate Statement, however, appears less lucrative for the AUD/USD bulls and seemed to have probed the quote after the initial knee-jerk reaction to the RBA’s rate hike.
Also read:
Given the strong fundamental push, as well as the quote’s ability to cross the immediate hurdle, AUD/NZD is likely to challenge the yearly top, marked in May, surrounding 1.1195.
Following that, a run-up towards the year 2017 peak around 1.1300 can’t be ruled out.
On the flip side, the resistance-turned-support line, near 1.1110, as well as the one-week-old rising trend line around 1.1070, challenges the AUD/NZD bears.
Even if the AUD/NZD bears manage to conquer the 1.1070 support, the 200-SMA level of 1.1000 will be a tough nut to crack for the pair sellers.
AUD/NZD: Four-hour chart
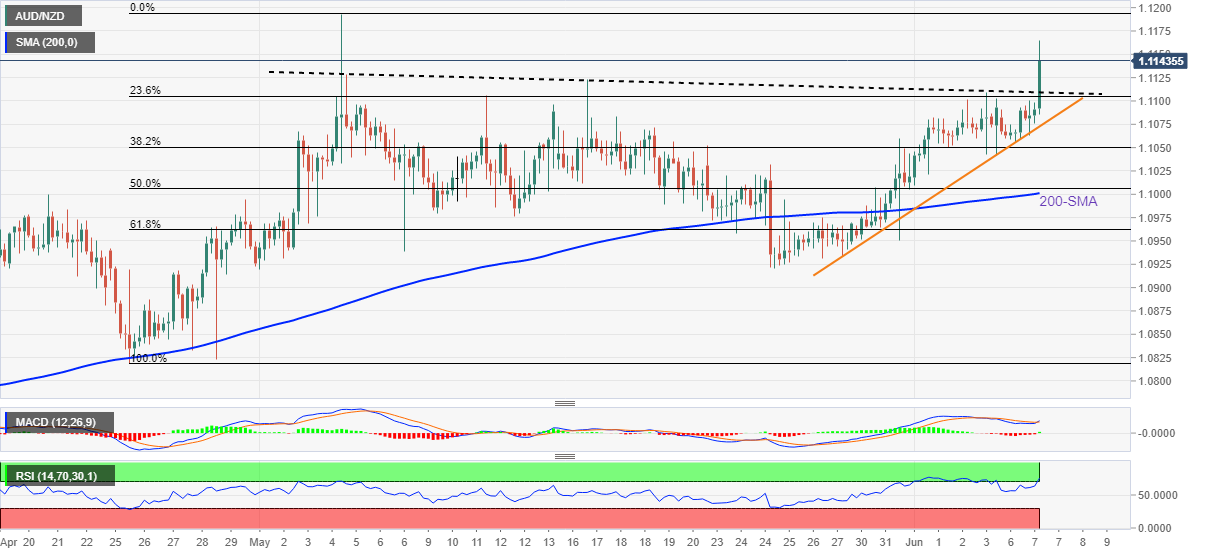
Trend: Further upside expected
- AUD/JPY has climbed above 96.00 on an extreme hawkish tone adopted by the RBA.
- The RBA has hiked its OCR by 50 bps to 0.85% vs. the forecasts of 25 bps.
- Japan’s economy will report the GDP numbers this week.
The AUD/JPY pair has firmly moved above 96.00 as the Reserve Bank of Australia (RBA) has dictated an extreme hawkish stance on interest rates. The RBA has elevated its interest rates by 50 basis points (bps). Officially, the Official Cash Rate (OCR) has increased to 0.85%.
A rate hike was highly expected as mounting price pressures in the Australian economy could be contained by deploying strict quantitative measures only. As per the market consensus, a rate hike by 25 bps was expected from the RBA, however, a half-of-a-percent rate hike has infused an adrenaline rush into the aussie bulls.
The Australian Bureau of Statistics reported the annual inflation rate at 5.1% for the first quarter of Calendar Year (CY) 2022. Also, the Australian economy added only 4k jobs in April vs. the forecast of 30k. Therefore, the market participants were considering a 25 bps rate hike only as a tight monetary policy could dampen the Australian labor market. Now, a rate hike by 50 bps may add vulnerability to the labor market.
It is worth noting that the RBA also elevated its interest rates by 25 bps for the first time in May since the pandemic of the Covid-19.
Meanwhile, the continuation of an ultra-loose monetary policy by the Bank OF Japan (BOJ) will keep haunting the yen bulls. This week, investors’ focus will remain on the Gross Domestic Product (GDP) numbers, which are due on Wednesday. The annualized GDP is seen as stable at -1%, however, the quarterly GDP could tumble to -0.3% against the prior print of -0.2%.
- AUD/USD rallied 60 pips as RBA surprised traders with higher-than-expected rate lift.
- RBA inflates benchmark interest rate to 0.85% from 0.35% during the latest meeting.
- Sour sentiment, firmer yields challenge upside momentum with eyes on US inflation.
- Second-tier US data, risk catalysts may offer intermediate directions.
AUD/USD portrays a stellar 60-pip upside reaction to the RBA’s latest rate surprise during early Tuesday morning in Europe. In doing so, the Aussie pair reverses the early-day losses with 0.60% intraday gains around 0.7240 by the press time.
The Reserve Bank of Australia (RBA) crossed wide market expectations by lifting the benchmark interest rate by 50 basis points (bps) to 0.85%. The RBA Rate Statement, however, appears less lucrative for the AUD/USD bulls and seemed to have probed the quote after the initial knee-jerk reaction to the RBA’s rate hike.
Also read: RBA: 50 bps hike will assist with the return of inflation to target over time
Earlier in the day, the downbeat sentiment in the market weighed on the risk-barometer pair. Global markets remain depressed during early Tuesday as traders struggle for clear directions, as well as fear a heavier/longer interest rate increase by the Fed. Also challenging the risk appetite could be a cautious mood ahead of the European Central Bank’s (ECB) monetary policy meeting and the US Consumer Price Index (CPI) data.
Alternatively, China’s hopes of faster economic recovery challenge the AUD/USD bears, considering Australia’s strong trade ties with the dragon nation. China Securities Journal (CSJ) praised the country’s virus control and policy stimulus while expecting economic improvement in the second half (H2) of 2022. Previously, Beijing’s ability to overcome the pandemic and citing preparations to recover from the economic loss with faster unlocks joined US President Joe Biden’s likely easy stand for China, as far as showing readiness to remove Trump-era tariffs, seemed to have favored sentiment.
Not only the risk-off mood and immediate reaction to the RBA’s rate hike but a sudden shift in favor of the bears in the options market also kept the pair sellers hopeful before the RBA. That said, one-month risk reversal (RR) on the AUD/USD pair, a spread between the calls and puts, snapped a three-day uptrend while flashing -0.090 figures at the latest, per Reuters’ data on the options market. In doing so, the Aussie RR also challenge the three-week rally before the previous day’s downbeat figure.
While portraying the mood, S&P 500 Futures print nearly half a percent daily loss around 4,100 whereas S&P/ASX 200 index, the leading Aussie equity gauge, drops 1.63% to 7,086 at the latest. It’s worth noting that the share price index broke fortnight-long support as sellers attack a one-week low. Also, the US 10-year Treasury yields rise for the seventh consecutive day to 3.045%, up 05 basis points (bps) by the press time.
Having witnessed the initial market reaction to the RBA’s move, AUD/USD traders will keep their eyes on the qualitative catalysts, amid a lack of major data/events ahead of Friday’s inflation data from the US and China. However, the US Goods and Services Trade Balance for the said month, forecast at $-89.5B compared to $-109.8B previous readouts, can entertain intraday traders.
Technical analysis
A clear downside break of the three-week-old ascending trend line, around 0.7240 by the press time, directs AUD/USD bears towards the 20-DMA support near 0.7085.
Following are the key headlines from the June RBA monetary policy statement, via Reuters, as presented by Governor Phillip Lowe.
Inflation in Australia has increased significantly.
Committed to doing what is necessary to ensure that inflation in Australia returns to target over time.
Higher prices for electricity and gas and recent increases in petrol prices mean that, in the near term, inflation is likely to be higher than was expected a month ago.
Size and timing of future interest rate increases will be guided by the incoming data and the board's assessment of the outlook for inflation and the labour market.
Today's increase in interest rates will assist with the return of inflation to target over time.
The Australian economy is resilient.
Resilience of the economy and the higher inflation mean that this extraordinary support is no longer needed.
Board expects to take further steps in the process of normalising monetary conditions in Australia over the months ahead.
Housing prices have declined in some markets over recent months but remain more than 25 per cent higher than prior to the pandemic.
One source of uncertainty about the economic outlook is how household spending evolves.
Related reads
- AUD/USD jumps back towards 0.7250 on RBA’s surprise 50 bps rate hike
The Reserve Bank of Australia (RBA) board members announced a 50 basis points (bps) hike to its official cash rate (OCR), lifting it from 0.35% to 0.85% at their June 7 monetary policy meeting.
The RBA surprised markets once again to the upside, as they had priced in a 25 bps lift-off.
The central bank fights raging inflation head-on, with a big hike while it says that “the economy is resilient.”
A Reuters poll of 35 economists showed the RBA will lift its cash rate by another 25 bps to 0.60%. 11 predicted a 40 bps increase to 0.75%, where rates were before the pandemic.
AUD/USD reaction
The AUD/USD pair jumped over 50-pips in a knee-jerk reaction to the hawkish RBA decision.
The spot was last seen trading at 0.7233, up 0.60% on the day.
About RBA rate decision
RBA Interest Rate Decision is announced by the Reserve Bank of Australia. If the RBA is hawkish about the inflationary outlook of the economy and rises the interest rates it is positive, or bullish, for the AUD. Likewise, if the RBA has a dovish view on the Australian economy and keeps the ongoing interest rate, or cuts the interest rate it is seen as negative, or bearish.
- Asian indices are trading positive as the DXY is offered at around 102.69.
- Indian bourses are cautious ahead of the monetary policy by the RBI.
- Oil prices are rising on supply constraints and demand recovery as Shanghai has re-opened.
Markets in the Asian domain are trading positive as the bullish momentum in the US dollar index (DXY) displayed at the open has started fading now. The DXY has faced barricades while attempting to re-test its previous week’s high at 102.73, however, a bearish reversal is not into consideration as investors are expected to remain cautious over the release of the US Consumer Price Index (CPI), which is due on Friday.
At the press time, Japan’s Nikkei225 jumped 0.60%, China A50 urged 1.15%, Hang Seng added 0.15% while Nifty50 slipped almost 1%.
Indian bourses are expected to behave extremely rough this week as the Reserve bank of India (RBI) will dictate the monetary policy on Wednesday. A conservative stance is expected by the market participants as rising oil and commodity prices are impacting Indian households. As per the market consensus, the RBI will increase its interest rates by 35-50 basis points (bps).
The US inflation is expected to land at 8.2% on annual basis. A constant above 8% figure despite the continuous policy tightening by the Federal Reserve (Fed) is worsening the inflation situation.
Meanwhile, oil prices are oscillating around $119.00 after a corrective move. Tight supply due to prohibition of oil imports from Russia by the European Union and demand recovery on Shanghai’s reopening are supporting the oil prices.
- GBPUSD struggles to extend the bounce off intraday low, stays pressured.
- Sustained trading below 50-SMA join downbeat oscillators to keep sellers hopeful.
- Further downside needs validation from 1.2480 to aim for a 150-pip fall.
GBP/USD fades bounce off the intraday low as it retreats to 1.2500 during early Tuesday morning in Europe. In doing so, the cable pair remains pressured inside a one-week-old symmetrical triangle.
However, the quote’s failure to cross the 50-SMA joins recently downbeat RSI (14), as well as the sluggish MACD signals, to hint at the further downside.
That said, a clear downside break of the stated triangle’s support line, around 1.2480 becomes necessary to convince GBP/USD bears.
Following that, a downward trajectory towards the May 18 swing low, near 1.2330 can’t be ruled out.
Meanwhile, recovery moves need validation from the 50-SMA level surrounding 1.2572, as well as the monthly high near 1.2590 and the 1.2600 threshold.
In a case where GBP/USD buyers keep reins past 1.2600, the pair can swiftly cross May’s peak near 1.2670 to aim for the 1.2700 round figure.
GBP/USD: Four-hour chart
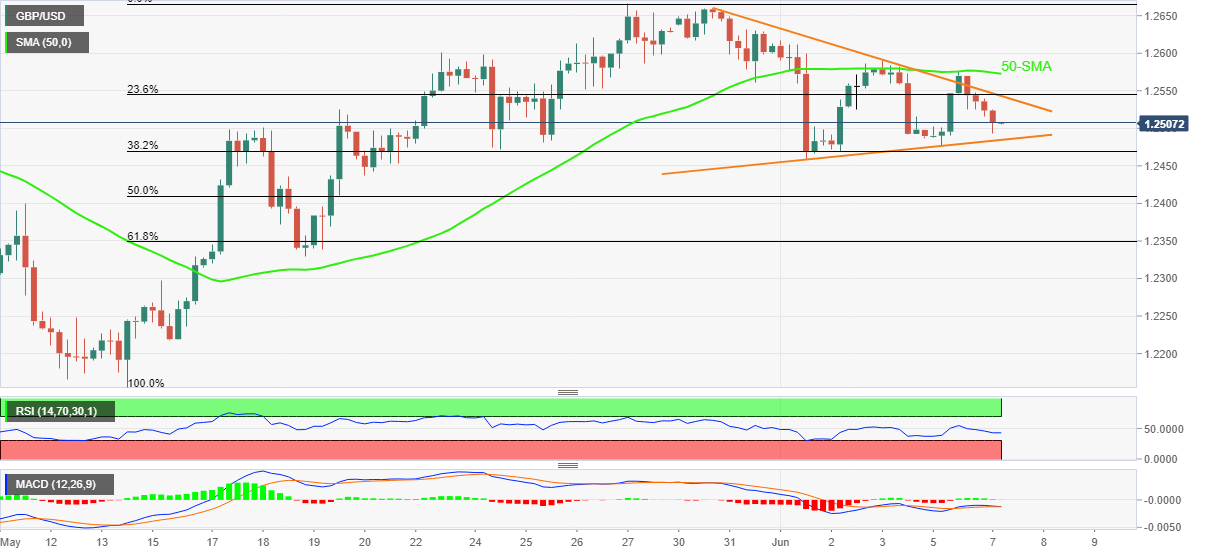
Trend: Further weakness expected
- USD/INR snaps two-day uptrend while reversing from a fortnight top.
- FPI’s biggest daily sale of Indian bonds in a month, firmer US oil prices weigh on INR.
- Eight-year high inflation pushes RBI towards rate hike, Reuters poll signals 0.50% lift.
- Second-tier US data, risk catalysts are important too.
USD/INR extends pullback from a two-week high while refreshing daily lows near 77.70 during the initial hour of the Indian trading session on Tuesday.
In doing so, the Indian rupee (INR) pair seems to brace for the Reserve Bank of India’s (RBI) rate hike while paying a little heed to the broad US dollar gains and the Foreign Portfolio Investors (FPI) exodus from the Indian markets. The reason could also be linked to the recent risk-positive headlines from China.
That said, an eight-year high Indian inflation brews market chatters of a strong rate hike by the RBI during Wednesday’s meeting. “All 47 analysts in a Reuters poll thought the repo rate would be raised for a second month from 4.40%, but forecasts on the size were split six ways, ranging between 25 and 75 bps,” said Reuters.
The survey adds, “India's bond markets are also bracing for liquidity tightening measures with many analysts predicting a 50 bps increase in the cash reserve ratio for banks as the RBI attempts to return monetary conditions to pre-pandemic levels.”
Furthermore, headlines suggesting optimism in China, the Asian leader, also underpin the INR strength. China Securities Journal (CSJ) praised the country’s virus control and policy stimulus while expecting economic improvement in the second half (H2) of 2022. Previously, Beijing’s ability to overcome the pandemic and citing preparations to recover from the economic loss with faster unlocks joined US President Joe Biden’s likely easy stand for China, as far as showing readiness to remove Trump-era tariffs, seemed to have favored sentiment and test INR bears.
Alternatively, a strong outflow of the foreign funds and firmer oil prices, a major burden on the Indian budget deficit, challenge USD/INR sellers. “Foreign investors step up the sale of Indian government bonds, registering their biggest single-session exit in a month yesterday,” said NewsRise per Reuters.
Additionally, growing chatters over the Fed’s faster/heavier rate hikes, especially after Friday’s US jobs report, also propel the USD/INR prices. A strong US Nonfarm Payrolls (NFP) and the last dose of hawkish Fedspeak before the blackout norm favored the US Treasury yields to snap a three-week downtrend by the end of Friday. As per the latest readings, market players anticipate around 70% chances of the Fed’s 0.50% rate hike in September versus nearly 30% odds favoring such an outcome a week ago.
Looking forward, the US Goods and Services Trade Balance for the said month, forecast at $-89.5B compared to $-109.8B in previous readouts, can entertain intraday traders but major attention will be given to Wednesday’s RBI verdict and Friday’s US Consumer Price Index (CPI).
Technical analysis
A daily closing beyond 77.85 appears necessary for the USD/INR bulls to aim for the record top near 78.15, marked in May. Meanwhile, 77.35 and March’s high near 77.17 limits the short-term downside of the pair.
- EUR/USD has displayed a weak pullback towards 1.0684 as the DXY has turned sideways.
- Investors should brace for a hawkish stance from the ECB in its monetary policy announcement.
- A higher-than-expected US inflation figure will bolster caution in the FX domain.
Modest recovery has pushed the EUR/USD pair a little higher, however, the downside in the asset looks likely as volatility is expected to sustain ahead of the release of the US inflation and the interest rate decision by the European Central Bank (ECB).
EUR/USD has witnessed a modest buying interest after hitting a low of 1.0671 in the Asian session. Earlier, the shared currency bulls faced selling pressure after violating Monday’s low at 1.0685. The FX domain is turning cautious as the US Consumer Price Index (CPI) is seen at 8.2%, a little lower than the expectations of 8.3% but higher than the desired levels.
Mounting inflationary pressures are strengthening the odds of an extremely hawkish monetary policy by the Federal Reserve (Fed) next week. Advancing bets on the hawkish Fed have infused fresh blood in the US dollar index (DXY). The DXY is marching higher to recapture its previous week’s high at 102.73.
On the eurozone front, investors are awaiting the monetary policy announcement by the European Central Bank (ECB) on Thursday. The ECB is expected to dictate a hawkish monetary policy for the first time since the Covid-19 pandemic. Red-hot price pressures in the eurozone are advocating for policy tightening. Like the other Western leaders, the ECB has not lifted its interest rates yet.
Apart from the ECB policy, investors will also focus on the Gross Domestic Product (GDP) numbers, which are due on Wednesday. The quarterly and annualized figures are expected to remain unchanged at 0.3% and 5.1% respectively.
- Gold price has turned extremely volatile around $1,840.00 ahead of the US CPI.
- The annual US CPI will remain stable above 8%.
- The DXY is advancing higher amid rising expectations of a jumbo rate hike by the Fed.
Gold price (XAU/USD) is displaying topsy-turvy moves in the Asian session as the US dollar index (DXY) has extended its gains on Tuesday. A firmer Monday session by the DXY has carry-forwarded on Tuesday with a bullish open test-drive move. The precious metal has turned volatile as investors are sheltering themselves behind the DXY ahead of the US Consumer Price Index (CPI), which is due on Friday.
A forecast of an 8.2% annual inflation rate for May and consideration of former respective figures dictate that the price pressures are highly stable above 8%. Despite the rate hikes by the Federal Reserve (Fed) in March and May, the inflationary pressures have not impacted much and the US households seek more rate hikes to safeguard their real income.
The gold price is likely to remain on tenterhooks for a longer period as the US CPI will be followed by the interest rate decision by the Fed next week. Investors will keenly watch the inflation figures as a higher-than-expected inflation figure will compel the Fed to sound extremely hawkish and eventually will impact the bright metal.
Gold technical analysis
On a four-hour scale, XAU/USD is auctioning near the upward sloping trendline of the Ascending Triangle. The formation of the Ascending Triangle chart pattern denotes a rangebound movement in a confined area. The 200-period Exponential Moving Average (EMA) at $1,865.10 has acted as major resistance for the counter. Meanwhile, the Relative Strength Index (RSI) (14) has slipped into a bearish range of 20.00-40.00, which signals a continuation of the downside move by the precious metal further.
Gold four-hour chart

AUD/USD renews intraday low around 0.7165, down for the third consecutive day as traders await the Reserve Bank of Australia’s (RBA) Interest Rate Decision during early Tuesday.
While the risk-off mood and the pre-RBA anxiety can be cited as the key catalysts weighing on the AUD/USD prices of late, a sudden shift in favor of the bears in the options market also keep the pair sellers hopeful.
That said, one-month risk reversal (RR) on the AUD/USD pair, a spread between the calls and puts, snapped a three-day uptrend while flashing -0.090 figures at the latest, per Reuters’ data on the options market.
In doing so, the Aussie RR also challenge the three-week rally before the previous day’s downbeat figure.
It’s worth noting that the downbeat signals, be it from the options market or fundamentals, are in contrast to the RBA’s likely 0.25% rate hike, which in turn requires AUD/USD pair bears to remain cautious.
Also read: Australia 10-year Treasury yields, ASX 200 portray pre-RBA anxiety
- Risk appetite sours amid indecision over Fed’s next moves, market’s anxiety ahead of key data/events.
- Headlines from China, Japan struggle to defend optimists amid light calendar ahead of RBA.
- Full markets’ reaction to the latest swing in sentiment, second-tier US data eyed for immediate directions.
Global markets remain depressed during early Tuesday as traders struggle for clear directions, as well as fear a heavier/longer interest rate increase by the Fed. Also challenging the risk appetite could be a cautious mood ahead of the European Central Bank’s (ECB) monetary policy meeting and the US Consumer Price Index (CPI) data.
While portraying the mood, the US 10-year Treasury yields rise for the seventh consecutive day to 3.05%, up 1.1 basis points (bps). Further, the S&P 500 Futures fail to keep the week-start rebound as it drops 0.46% to 4,103 by the press time.
Friday’s strong US Nonfarm Payrolls (NFP) and the last dose of hawkish Fedspeak before the blackout norm favored the US Treasury yields to snap a three-week downtrend by the end of Friday. As per the latest readings, market players anticipate around 70% chances of the Fed’s 0.50% rate hike in September versus nearly 30% odds favoring such an outcome a week ago.
Alternatively, Bank of Japan (BOJ) Governor Haruhiko Kuroda praises the economic transition and defends the easy money policies while the China eyes further unlock and GDP increase from the second part (H2) of 2022.
China Securities Journal (CSJ) praised the country’s virus control and policy stimulus while expecting economic improvement in the second half (H2) of 2022. Previously, Beijing’s ability to overcome the pandemic and citing preparations to recover from the economic loss with faster unlocks joined US President Joe Biden’s likely easy stand for China, as far as showing readiness to remove Trump-era tariffs, seemed to have favored sentiment and tested the US dollar’s safe-haven appeal.
Given the firmer yields and stock futures, US Dollar Index (DXY) also takes the bids and weighs on commodities, as well as the Antipodeans. Adding to the AUDUSD pair’s weakness is the cautious mood ahead of the Reserve Bank of Australia’s (RBA) rate hike.
That said, traders are likely to remain cautious and may stay away from the riskier assets ahead of the ECB and the US CPI. However, However, risk catalysts and the US Goods and Services Trade Balance for the said month, forecast at $-89.5B compared to $-109.8B previous readouts, can entertain intraday traders.
Finally commenting on the latest yen slide, Bank of Japan (BOJ) Governor Haruhiko Kuroda said Tuesday, “if yen moves are not too sharp, weak yen is beneficial for Japan’s economy.
Additional comments
No comment on fx levels.
Very important for fx to move stably reflecting fundamentals.
Impact of weak yen varies, uneven for each entity.
Weak yen positive to economy as a whole.
Carefully watching impact of fx on economy.
Must be mindful that weak yen could have negative impact on households, smaller service-sector firms.
Must create economic conditions where wages and prices rise more easily.
Meanwhile, a senior BOJ official said that a “sharp yen weakening, as seen recently, is undesirable.”
Market reaction
USD/JPY has paused its upsurge near 132.75 on the latest comments from the BOJ Chief Kuroda on the ongoing yen moves.
The spot is now trading at 132.68, still up 0.62% on the day.
After announcing the first rate increase in more than a decade, the Reserve Bank of Australia (RBA) is up for another hawkish monetary policy outcome and Interest Rate Decision around 04:30 AM GMT on Tuesday.
The RBA is expected to increase the benchmark interest rate by 25 basis points (bps) to 0.60%, mainly to fight inflation and join the league of its foreign friends.
However, the Aussie central bank will remain behind the likes of the Fed and RBNZ, not to forget the BOE and BOC, which makes today’s RBA rate hike interesting. As a result, the RBA Rate Statement will be more important to watch and forecast near-term AUD/USD moves.
Ahead of the event Westpac said,
The RBA, following other central banks around the world, needs to not only unwind the covid stimulus measures, but to combat a significant inflation challenge - in a world of supply headwinds, including disruptions from the Russia / Ukraine conflict. The enormity of the challenge, including risks that inflation expectations could decouple, points to a front loading of rate hikes. Westpac expects a 40bps move in July, with the cash rate climbing to 1.75% by year-end and to peak at 2.25% by mid-2023. Economists are split between 25bp, 40bp and 50bp and market pricing is skittish, around 33bp.
On the other hand, FXStreet’s Valeria Bednarik says,
As said, a 25 bps hike has been already priced in. If somehow the RBA decided to slow down and go for 0.10% or 0.15%, AUD/USD could come under selling pressure, although if the current market’s optimism persists, the slide should be limited. On the other hand, a 40 bps hike plus hints on more interest rate raises coming would result in the AUD/USD pair surging to fresh monthly highs.
How could the RBA decision affect AUD/USD?
AUD/USD stays pressured around 0.7175 as it prints a three-day downtrend ahead of the key RBA interest rate decision. The Aussie pair’s latest moves could be linked to the market’s anxiety ahead of the RBA’s verdict, as well as firmer yields and the risk-off mood.
That being said, the RBA’s 0.25% rate hike is already known and may not even put the Aussie bank near the other major central banks, which in turn suggests the AUD/USD pair’s likely limited bullish reaction in case of a rate lift to 0.60%. Also challenging the moves could be the looming 0.50% Fed rate increase and fears ahead of the US Consumer Price Index (CPI), as the European Central Bank (ECB) meeting.
Hence, AUD/USD prices may portray a knee-jerk reaction to the 0.25 bps rate hike from the RBA. However, the bears are less likely to relinquish control.
Technically, a clear downside break of the three-week-old ascending trend line, around 0.7240 by the press time, directs AUD/USD bears towards the 20-DMA support near 0.7085.
Key quotes
Reserve Bank of Australia Preview: Rate hikes are here to stay
Australia 10-year Treasury yields, ASX 200 portray pre-RBA anxiety
About the RBA interest rate decision
RBA Interest Rate Decision is announced by the Reserve Bank of Australia. If the RBA is hawkish about the inflationary outlook of the economy and rises the interest rates it is positive, or bullish, for the AUD. Likewise, if the RBA has a dovish view on the Australian economy and keeps the ongoing interest rate, or cuts the interest rate it is seen as negative, or bearish.
Analysts at Goldman Sachs believe that the bullish potential in USD/JPY appears limited, in the face of risks of intervention by the Japanese authorities to stem the yen downfall.
Key quotes
"Activity data have looked more resilient over the past week, including upside surprises in ISM manufacturing and nonfarm payrolls. If the trend continues-possibly nudging the FOMC toward a fourth 50bp rate increase in September-we think USD/JPY has room to move moderately higher.”
"That said, the extent of upside still looks limited by official intervention risks and (eventually)pressure on YCC, as domestic growth and inflation pick up this year alongside higher global yields (if the US avoids recession).”
“...As a result, we continue to think that being long Yen represents an attractive way to position for that base-case outcome and are keeping our short USD/JPY trade recommendation in options open.”
-
USD/JPY leans bullish towards 133.00, renews two-decade high on firmer yields, BOJ’s Kuroda
- USD/JPY remains on the front foot for the third consecutive day while poking the early 2002 levels.
- US Treasury yields stretch the first weekly gains in four ahead of inflation data.
- BOJ’s Kuroda praises economic transition backs monetary easing.
- Mixed data from Japan fails to impress traders, second-tier US statistics are also eyed.
USD/JPY bulls appear relentless as the yen pair rises to the fresh high in 20 years, poking the 132.75 level during Tuesday’s Asian session. The quote’s latest run-up could be linked to the broad strength in the US Treasury yields, as well as signals from Bank of Japan (BOJ) Governor Haruhiko Kuroda.
Friday’s strong US Nonfarm Payrolls (NFP) and the last dose of hawkish Fedspeak before the blackout norm favored the US Treasury yields to snap a three-week downtrend by the end of Friday. The same underpins the recently escalating hopes of a 0.5% rate hike during September, versus previously thin chatters surrounding the key issue. The benchmark bond coupon rises two basis points (bps) to 3.57% by the press time.
On the other hand, Bank of Japan (BOJ) Governor Haruhiko Kuroda mentioned that Japan’s economy is improving as a trend. The policymaker also defends the easy money policies of the BOJ while saying, “Unwinding monetary stimulus hastily could hurt Capex and domestic demand.”
It should be noted, however, that upbeat headlines from China and the market’s anxiety ahead of Thursday’s European Central Bank (ECB) monetary policy meeting, as well as Friday’s US Consumer Price Index (CPI) for May, seem to test the yields and the USD/JPY buyers.
Recently, China Securities Journal (CSJ) praised the country’s virus control and policy stimulus while expecting economic improvement in the second half (H2) of 2022. Previously, Beijing’s ability to overcome the pandemic and citing preparations to recover from the economic loss with faster unlocks joined US President Joe Biden’s likely easy stand for China, as far as showing readiness to remove Trump-era tariffs, seemed to have favored sentiment and tested the US dollar’s safe-haven appeal.
On the economic front, Japan’s Labor Cash Earnings rose more than the expected 0.5% to 1.7% in April but Overall Household Spending shrank more than -0.8% market forecasts to -1.7% YoY during the stated month.
Looking forward, yields and chatters surrounding the US inflation are the key catalysts for the USD/JPY prices. That said, Japan’s Coincident Index and Leading Economic Index for April precede the US Goods and Services Trade Balance for April to also direct short-term pair moves.
Technical analysis
USD/JPY pair’s latest run-up could be linked to its ability to cross the double tops marked in April and May. As a result, the quote’s latest upside eyed the 138.2% Fibonacci retracement of May’s downside, around 133.30. However, overbought RSI conditions seem to challenge the USD/JPY bulls afterward.
Alternatively, pullback moves remain elusive until staying beyond the previous resistance, near 131.30-40. Following that, a pullback towards the 61.8% Fibonacci retracement (Fibo.) level of 129.45 can’t be ruled out.
- NZD/USD bears move in as the greenback perks up again.
- The RBA will be a key event for Asia while traders await more clues for the Fed in this week's US CPI.
NZD/USD is offered in the Tokyo morning as the US dollar advances on old resistance on the daily chart as measured by the DXY index. At 0.6466, the kiwi is down some 0.36% and has fallen from a high of 0.6493 to a low of 0.6460 so far. The US dollar continues to gain against a basket of major currencies as risk appetite waned from earlier levels.
Overnight, US stocks were closing well off their earlier highs to increase the appeal of the safe-haven ahead of a key reading on inflation later in the week and the Reserve Bank of Australia today in Asia. The benchmarks, however, managed to end the day in the green but pared earlier gains while solar companies climbed after the Biden administration announced a two-year tariff exemption for solar imports from four Southeast Asian nations.
The Dow Jones Industrial Average was a tough higher at 32,915.78, the S&P 500 added 0.3% to 4,121.43 and the Nasdaq Composite moved up by 0.4% to 12,061.37. Meanwhile, after touching a near 20-year high of 105.01 on May 13, the US dollar index (DXY) had eased back to around the 102 level, although Friday's strong payrolls report helped the dollar notch its first weekly gain in three and we are seeing a follow-through of this on Tuesday in Asia. The index is now 0.20% higher at 102.62.
Ahead of the Federal Reserve's policy announcement on June 15, in which the central bank is widely expected to raise rates by 50 basis points, investors will be keenly eyeing the Consumer Price Index data and looking for signals for how long the Fed may need to continue hiking rates.
''Core prices likely stayed strong in May, with the series registering a second consecutive 0.5% MoM increase,'' analysts at TD Securities explained. ''A drag on inflation recently, we now expect used vehicle prices to be a contributor, advancing for the first time in four months. We also look for continued momentum in airfares and shelter inflation. Our m/m forecasts imply 8.4%/5.9% YoY for total/core prices.''
Domestically, this week, traders will be looking out for the first quarter manufacturing data on Friday but analysts at ANZ Bank argued ''that isn’t likely to perturb markets a great deal, so Kiwi is likely to continue to move on global themes, with the RBA decision this afternoon up next (our AU team expect a 40bp hike to 0.75%).''
''The ECB’s meeting this week is key – as is, we think, the fact that WTI crude oil is back up near record highs (adding to pain as well as inflation pressures via the fuel pump). A recipe for volatility? Maybe.''
- Silver remains pressured between previous support and 200-HMA.
- Bearish MACD signals, RSI (14) keep sellers hopeful to approach $21.00.
- 61.8% Fibonacci retracement acts as an extra filter to the south.
Silver (XAG/USD) takes offers to renew intraday low around $22.00 during Tuesday’s Asian session. In doing so, the bright metal justifies the latest downside break of a one-week-old ascending trend line as bears attack the 200-HMA support.
Given the bearish MACD signals and descending RSI (14), not oversold, XAG/USD prices are likely to decline further.
However, a clear downside break of the 200-HMA level near $22.00, as well as the 61.8% Fibonacci retracement level of June 01-06 upside, near $21.85, becomes necessary for witnessing a heavy fall. The reason could be linked to the double top formation of around $22.50.
During the quote’s weakness past $21.85, the theoretical target of $21.00 lures the bears but the recent swing low near $21.45 may offer an intermediate halt during the declines.
Meanwhile, recovery moves need to jump back beyond the previous support line, around $22.10 by the press time.
Following that, silver buyers may again aim for the double tops surrounding $22.50, a break of which could propel prices towards May’s peak near $28.30.
Silver: Hourly chart
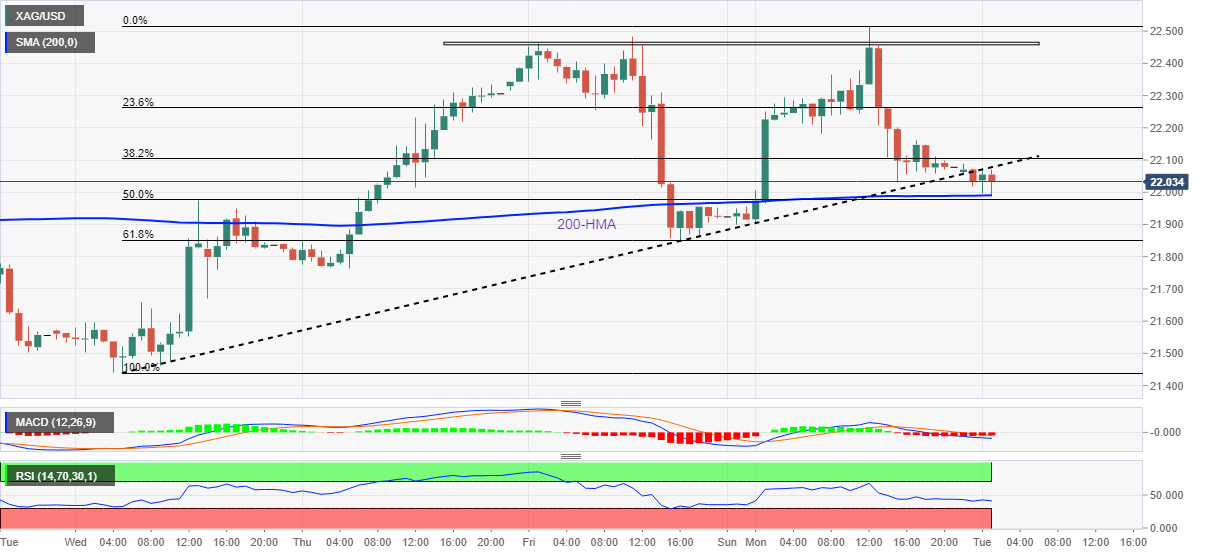
Trend: Further weakness expected
Japanese Finance Minister Shunichi Suzuki said earlier this Tuesday, “excess FX volatility and disorderly fx movements could have an adverse effect on the economy, financial stability.
Additional quotes
No comment on fx levels.
Rapid yen moves inappropriate.
Japan's govt will respond appropriately to exchange rate following G7 agreement on currencies while keeping close communication with us, other authorities.
Desirable for currencies to move stably reflecting economic fundamentals.
No comment on Bank of Japan Governor Kuroda's remark that households are becoming accepting of price hikes.
Market reaction
Amidst the continued slump in the yen, the Japanese authorities are stepping up their verbal intervention but to no avail, as USD/JPY refreshes 20-year highs near 132.70.
In recent trade today, the People’s Bank of China (PBOC) set the yuan (CNY) at 6.6649 vs. the last close of 6.6544.
About the fix
China maintains strict control of the yuan’s rate on the mainland.
The onshore yuan (CNY) differs from the offshore one (CNH) in trading restrictions, this last one is not as tightly controlled.
Each morning, the People’s Bank of China (PBOC) sets a so-called daily midpoint fix, based on the yuan’s previous day's closing level and quotations taken from the inter-bank dealer.
Bank of Japan (BOJ) Governor Haruhiko Kuroda is out on the wires now, via Reuters, expressing his outlook on the Japanese economy.
Key quotes
Japan’s economy is improving as a trend.
Japan’s economy expected to recover ahead.
Exports, output continue to increase as a trend although there are some weakness due supply constraints.
Japan’s core CPI is likely to keep hovering around 2% for the time being before slowing its pace of increase as the boost from energy dissipates.
Market reaction
USD/JPY keeps pushing higher above 132.00, as the yen extends its selling momentum in absence of any mention of the exchange rate value by the BOJ Chief in his latest comments.
At the time of writing, the pair is up 0.63% on the day at 132.74, fresh two-decade highs.
- GBP/USD is declining towards 1.2500 as DXY strengthens on higher US inflation expectations.
- The DXY has continued its upside journey as the hangover of the upbeat US NFP is not faded yet.
- A better-than-expected BRC Like-for-Like Retail Sales have failed to cheer the pound bulls.
The GBP/USD pair has tumbled below 1.2520 in the Asian session after sensing barricades around 1.2526. The asset is declining gradually from Monday after failing to overstep the crucial resistance of 1.2580 on Monday. Investors should brace for a volatility contraction in the cable as the market participants have shifted their focus to the US Consumer Price Index (CPI), which is due on Friday.
A preliminary estimate for the annual US CPI is 8.2%, a tad lower vs. the former print of 8.3%. A minor slippage in the inflation rate is not going to safeguard the real income of US households. The Federal Reserve (Fed) has already announced rate hikes of 25 basis points (bps) and 50 bps in March and May respectively, whose effect is not yet visible on the price pressures.
No doubt, the Fed is going to feature a jumbo rate hike in its monetary policy announcement next week. However, a release of higher-than-expected CPI figures will bring forward more hurdles for Fed policymakers.
Meanwhile, the US dollar index (DXY) has displayed a bullish opening session. The DXY is carry-forwarding its bullish momentum displayed on Monday. The upbeat Nonfarm Payroll reported last week is the major reason behind a firmer rebound in the DXY.
On the pound front, bulls are not performing despite less-weak BRC Like-For-Like Retail Sales. The agency has reported the economic data at -1.5%, better than the consensus of -3.5% and the prior print of -1.7%. Next week, the monetary policy from the Bank o England (BOE) will be the key event.
- Market sentiment in Australia remains divided as traders brace for RBA’s second rate lift.
- Aussie 10-year bond coupon snaps two-day downtrend around 3.50%.
- ASX 200 breaks two-week-old support, drops for the second consecutive day.
- Indecision between 25 bps and 40 bps rate hike makes today’s RBA decision interesting.
Aussie market players remain cautious amid hopes of a stronger rate hike from the Reserve Bank of Australia (RBA), as well as chatters surrounding the Fed’s interest rate moves.
While portraying the mood, Australia’s benchmark 10-year Treasury yields rise 0.95% to 3.52% by the press time. In doing so, the Aussie bond coupons print the first daily gains in three.
On the other hand, S&P/ASX 200 index, the leading Aussie equity gauge, drops 0.63% to 7,160. It’s worth noting that the share price index broke fortnight-long support as sellers attack a one-week low.
Elsewhere, Australia’s AiG Performance of Services Index eased below 57.8 prior to 49.2 and exerted additional downside pressure on the Aussie equities, while also favoring the yields.
It’s worth noting that headlines from China and anxiety ahead of the US Consumer Price Index (CPI), as well as the European Central Bank (ECB) meeting, seem to propel the Aussie yields of late. That said, China Securities Journal (CSJ) praised the country’s virus control and policy stimulus while expecting economic improvement in the second half (H2) of 2022. Previously, Beijing’s ability to overcome the pandemic and citing preparations to recover from the economic loss with faster unlocks joined US President Joe Biden’s likely easy stand for China, as far as showing readiness to remove Trump-era tariffs, seemed to have favored sentiment and tested the US dollar’s safe-haven appeal, which in turn favored the Aussie equities before the fall.
Given the downbeat yield and equities in Australia, coupled with the market’s cautious mood, the AUD/USD continues to consolidate the biggest daily jump in a month during the three-day downtrend around 0.7180 by the press time.
To sum up, traders appear nervous ahead of the Reserve Bank of Australia’s (RBA) anticipated rate hike. However, indecision between the 25 bps and 40 bps move, despite major support for the softer one, keeps AUD/USD prices pressured ahead of the key event.
Also read: Reserve Bank of Australia Preview: Rate hikes are here to stay
- EUR/USD takes offers to renew intraday low during three-day downtrend.
- Clear break of 12-day-old ascending trend line, receding bullish bias of MACD favor sellers.
- Monthly horizontal support, 20-DMA appears a tough nut to crack for sellers.
EUR/USD drops below 1.0700 as bears keep reins during the third consecutive day amid Tuesday’s Asian session.
A downward sloping resistance line from late April joins the pair’s repeated failure to cross the 50-DMA to favor the EUR/USD bears. Also keeping the sellers hopeful is the recent break of an upward sloping support line from May 13, now resistance near 1.0710. Furthermore, the receding size of the bullish bars on the MACD histogram adds strength to the bearish bias.
That said, a convergence of the 20-DMA and one-month-old horizontal area appears strong support around 1.0630.
Following that, April’s low of 1.0470 could act as the last defense for EUR/USD buyers before directing the quote towards the yearly low of 1.0349.
Meanwhile, recovery moves need validation from the 1.0710 support-turned-resistance before challenging the 1.5-month-old descending trend line near 1.0750.
Also questioning the EUR/USD buyers is the previous month’s high near 1.0785 and the 1.0800 threshold.
EUR/USD: Daily chart
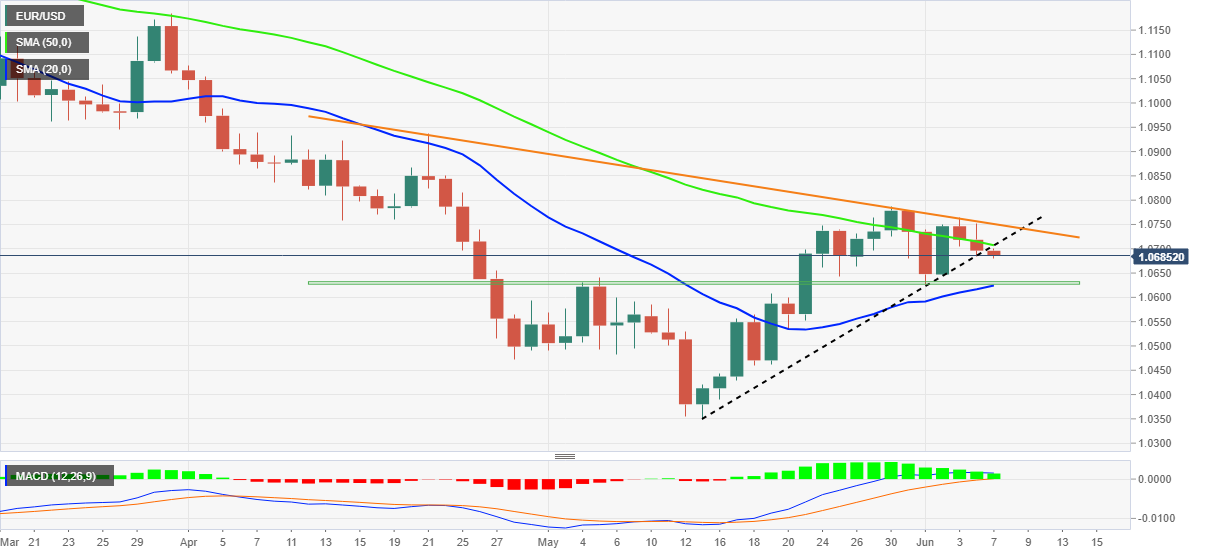
Trend: Further weakness expected
- WTI bears are moving in on a key area of daily support in Tokyo.
- The bulls have cashed in on the rally that came on the back of the relaxation of China lockdowns.
At $118.58, the price of West Texas Intermediate (WTI) crude oil is lower in Tokyo and the bears are advancing towards a potential support structure on the daily chart in what has been a 23.6% Fibonacci correction so far. The price has been pressured due to Saudi Arabia hiking the premium it charges for exports to Asian customers.
Demand from importers as China lifts lockdowns on Shanghai and other centres enabled the price of oil to move higher at the start of the week, but the bulls have been cashing in over New York trade and through the Asian session so far. Last week, the OPEC+ group announced that it would double its monthly quota increases for members to 648,000 barrels per day in July and August. However, it is noted that Russia and other members are unable to boost output, meaning actual production increases will be just more than 100,000 bpd.
''Energy supply risk continues to rise. After all, pent-up demand for mobility continues to fuel a recovery in energy demand with little evidence of demand destruction from higher prices,'' analysts at TD Securities explained.
''We've reiterated that Chinese mobility likely troughed in April, before making substantial improvements by early-May, but continues to improve with our tracking of congestion data for China's top 15 cities by vehicle registrations pointing to a +1.3% improvement in mobility on the week. In this context, supply continues to underwhelm. After all, with only a few Gulf nations effectively holding spare capacity, the OPEC+ group's decision to open their taps at a faster clip result in an underwhelming number of barrels hitting the market, with operational constraints biting into supply for many producers.''
''Meanwhile, the market is awaiting further clarification regarding how the EU and UK will adopt a ban on insurance for Russian oil cargoes,'' the analysts added. ''We reiterate that this will create a significant logistical bottleneck for Russian crude exports, likely resulting in an immediate drop in exports, but may also impact long-term contracts. In this context, we remain long Dec23 Brent crude in anticipation of a continued rise in supply risk premia.''
WTI technical analysis
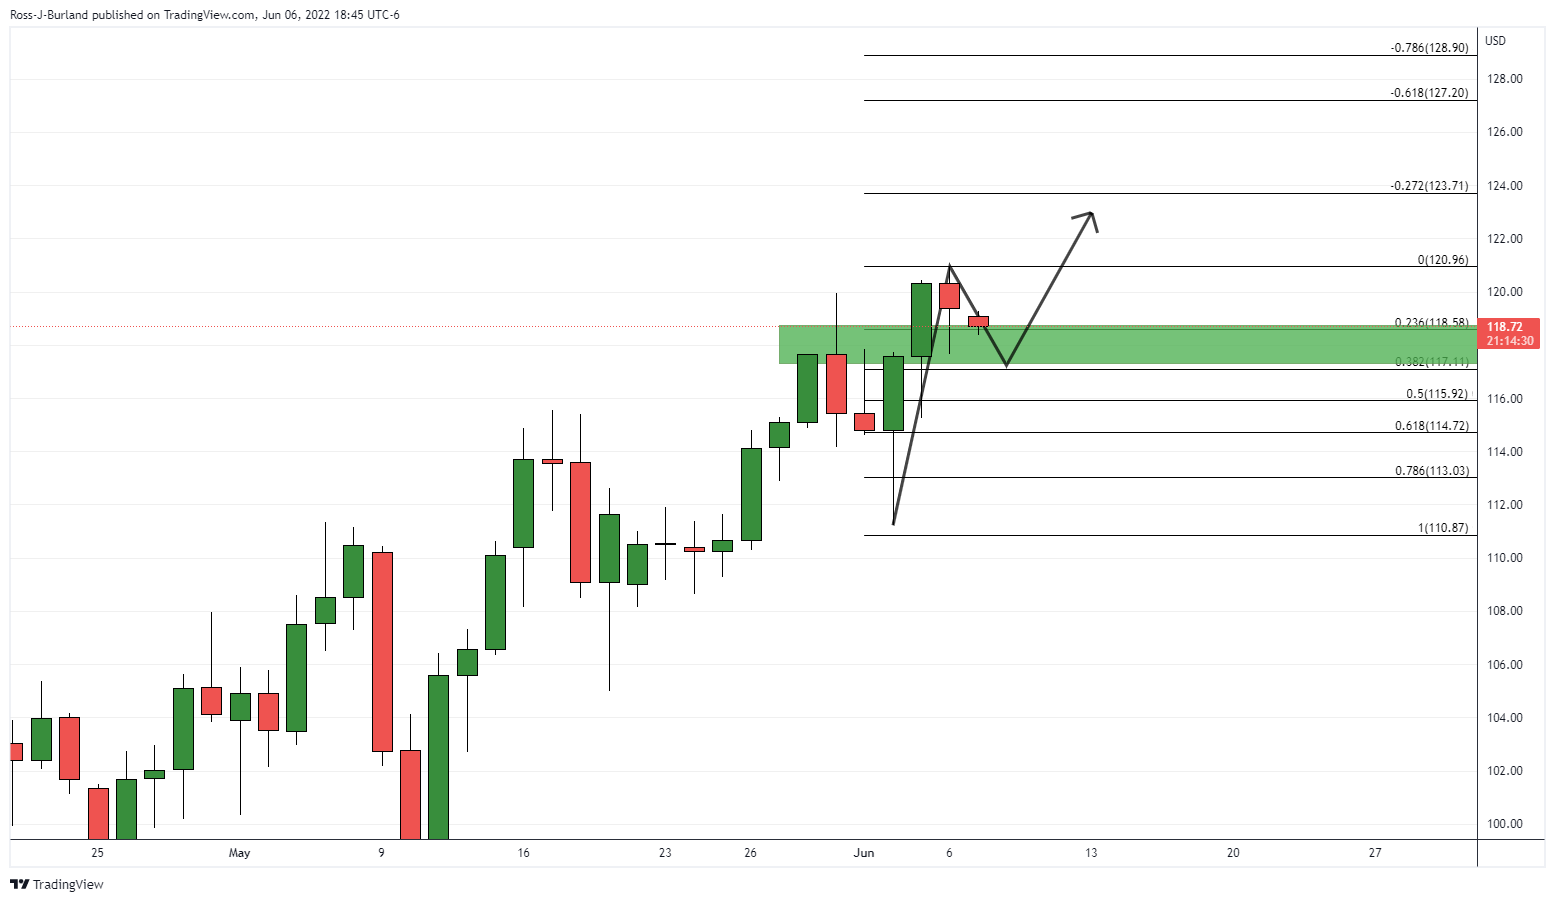
The bears are closing in on the support structure and should the bulls commit to here on a daily basis, this could be the making s for a continuation to the upside for the days ahead.
- Gold bears attack short-term key support around $1,840 during three-day downtrend.
- Firmer yields underpin US dollar strength amid hopes of faster/heavier Fed rate hikes.
- China headlines, pre-ECB mood challenge bears amid lackluster session.
- Second-tier US data, risk catalysts can entertain traders ahead of US CPI, ECB.
Gold Price (XAU/USD) remains pressured around a one-week low, down 0.13% intraday, as sellers poke a short-term key support confluence near $1,840 during Tuesday’s Asian session.
That said, the precious metal’s latest weakness could be linked to the firmer US Dollar Index (DXY), which in turn takes clues from the US Treasury yields.
It’s worth noting that the US Dollar Index (DXY) dribbles around mid-102.00s after a two-day uptrend, not to forget the first weekly jump in three while the US Treasury yields to extend the first weekly gains in four, firmer around 3.04% after rising 10 basis points (bps) on Monday.
Friday’s strong US Nonfarm Payrolls (NFP) and the hawkish appearance of the Fedspeak’s last dose before the blackout norm favored the US Treasury yields to snap a three-week downtrend. The same underpins the recently escalating hopes of a 0.5% rate hike during September, versus previously thin chatters surrounding the key issue.
However, upbeat headlines from China and the market’s anxiety ahead of Thursday’s European Central Bank (ECB) monetary policy meeting, as well as Friday’s US Consumer Price Index (CPI) for May, seem to test the gold sellers.
Recently, China Securities Journal (CSJ) praised the country’s virus control and policy stimulus while expecting economic improvement in the second half (H2) of 2022. Previously, Beijing’s ability to overcome the pandemic and citing preparations to recover from the economic loss with faster unlocks joined US President Joe Biden’s likely easy stand for China, as far as showing readiness to remove Trump-era tariffs, seemed to have favored sentiment and tested the US dollar’s safe-haven appeal. Considering China’s status as one of the world’s biggest gold consumers, positive headlines for the dragon nation favors the XAU/USD prices.
Looking forward, gold traders should keep their eyes on the risk catalysts, as well as the US CPI and ECB, for clear directions. However, the US Goods and Services Trade Balance for the said month, forecast at $-89.5B compared to $-109.8B previous readouts, can also direct short-term moves.
Technical analysis
Gold Price justifies an impending bear cross and RSI retreat as sellers jostle with the 200-DMA and an upward sloping support line from mid-May.
The bearish bias also gains momentum from the metal’s U-turn from a fortnight-old horizontal resistance area near $1,870-75.
Even so, a clear downside break of the $1,840 support confluence becomes necessary for the XAU/USD bears to approach the recent swing low surrounding $1,828.
Following that, a downturn towards the $1,800 threshold and then to May’s low near $1,785 can’t be ruled out.
Alternatively, a clear upside break of $1,875 appears necessary for the gold buyers before challenging a convergence of the 50-DMA and the 100-DMA, near $1,888-90.
Gold: Daily chart
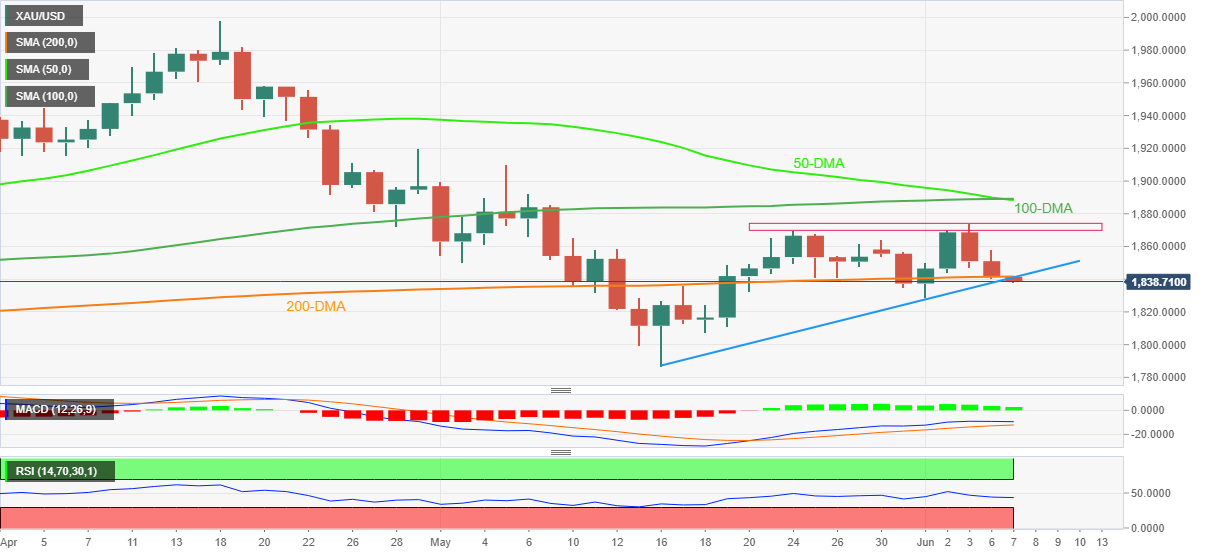
Trend: Further weakness expected
- An auction near the Rising Channel’s lower boundary has kept investors on the tenterhooks.
- The 200-EMA is advancing strongly which has kept the auss1ie bulls alive.
- A slippage in the bearish range of (20.00-40.00) by the RSI (14) has shifted the momentum on the bearish bias.
The AUD/USD pair is attracting some bids around 0.7190 despite slipping below the crucial support of 0.7190 in the Asian session. Sometimes a break below the crucial support calls for a responsive buying action if the market participants found the asset a value bet.
Aussie bulls have been performing stronger against the greenback for the past few trading weeks on the Rising Channel formation. The upper boundary is placed from May 23 high at 0.7127 while the lower boundary is plotted from May 18 low at 0.6949. Usually, a Rising Channel chart formation denotes the dominance of the bulls in an aligned range.
The pair has tumbled below the 50-period Exponential Moving Average (EMA) at 0.7208, which signals a short-term bearish bias. Meanwhile, the 200-EMA at 0.7175 is still advancing higher, which signals that the long-term bullish bias is still intact.
Meanwhile, the Relative Strength Index (RSI) has slipped into a bearish range of 20.00-40.00, which favors the greenback bulls.
Most probably, a responsive buying action will drive the asset higher, if the asset oversteps the round-level resistance of 0.7200 decisively. This will drive the asset higher towards Monday’s high at 0.7230, followed by June’s high at 0.7283.
On the flip side, the greenback bulls could gain momentum if the asset drops below May 31 low at 0.7150. An occurrence of the same will drag the asset towards May 23 high at 0.7127. Further slippage from May 23 high will expose the asset to May 18 high at 0.7148.
AUD/USD hourly chart
-637901579834950560.png)
| Pare | Closed | Change, % |
|---|---|---|
| AUDUSD | 0.71938 | -0.21 |
| EURJPY | 141.057 | 0.5 |
| EURUSD | 1.0694 | -0.23 |
| GBPJPY | 165.253 | 1.03 |
| GBPUSD | 1.25299 | 0.32 |
| NZDUSD | 0.64887 | -0.28 |
| USDCAD | 1.25803 | -0.09 |
| USDCHF | 0.97026 | 0.74 |
| USDJPY | 131.899 | 0.71 |
- USD/JPY takes the bids to refresh multi-day high, up for the third consecutive day.
- Clear break of five-week-old hurdle favors buyers but overbought RSI challenges further upside.
- 50-DMA holds the gate for bear’s entry, 61.8% Fibonacci retracement acts as extra support.
USD/JPY bulls achieve yet another milestone as they knock the 20-year high with 132.30 level during a three-day uptrend to Tuesday’s Tokyo open.
The yen pair’s latest run-up could be linked to its ability to cross the double tops marked in April and May.
As a result, the quote’s latest upside eyed the 138.2% Fibonacci retracement of May’s downside, around 133.30. However, overbought RSI conditions seem to challenge the USD/JPY bulls afterward.
Should the quote rises past 133.30, the 161.8% Fibonacci retracement level and the year 2002 high, respectively near 134.50 and 135.20, will be in focus.
Alternatively, pullback moves remain elusive until staying beyond the previous resistance, near 131.30-40.
Following that, a pullback towards the 61.8% Fibonacci retracement (Fibo.) level of 129.45 can’t be ruled out. Even so, the USD/JPY bears remain cautious unless witnessing a daily closing below the 50-DMA level surrounding 127.75.
USD/JPY: Daily chart
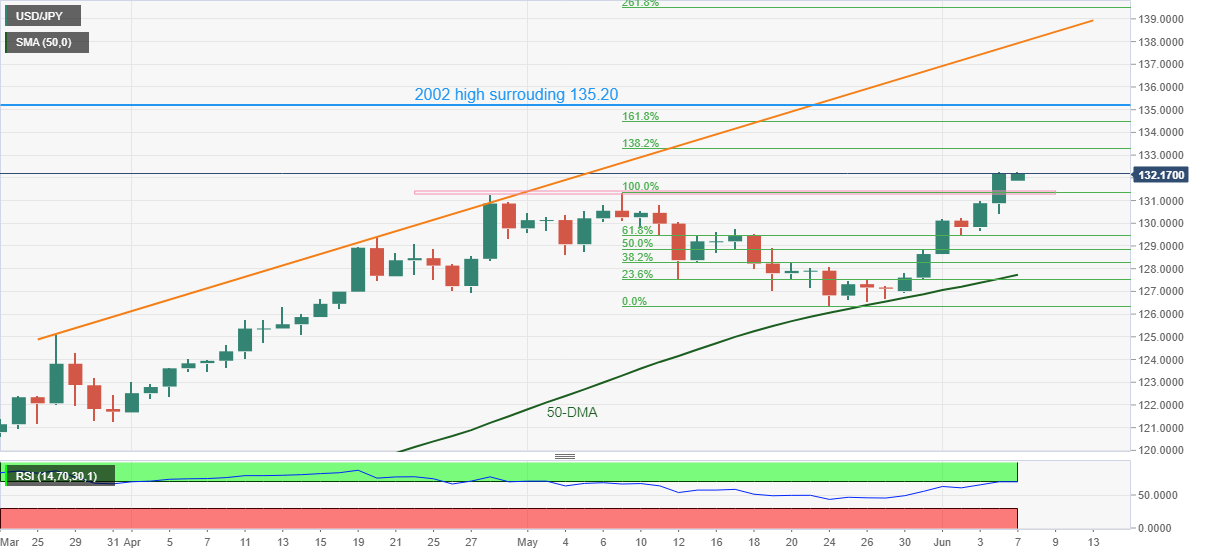
Trend: Limited upside expected


© 2000-2026. All rights reserved.
This site is managed by Teletrade D.J. LLC 2351 LLC 2022 (Euro House, Richmond Hill Road, Kingstown, VC0100, St. Vincent and the Grenadines).
The information on this website is for informational purposes only and does not constitute any investment advice.
The company does not serve or provide services to customers who are residents of the US, Canada, Iran, The Democratic People's Republic of Korea, Yemen and FATF blacklisted countries.
Making transactions on financial markets with marginal financial instruments opens up wide possibilities and allows investors who are willing to take risks to earn high profits, carrying a potentially high risk of losses at the same time. Therefore you should responsibly approach the issue of choosing the appropriate investment strategy, taking the available resources into account, before starting trading.
Use of the information: full or partial use of materials from this website must always be referenced to TeleTrade as the source of information. Use of the materials on the Internet must be accompanied by a hyperlink to teletrade.org. Automatic import of materials and information from this website is prohibited.
Please contact our PR department if you have any questions or need assistance at pr@teletrade.global.
transfers