- Analytics
- News and Tools
- Market News
Analytics, News, and Forecasts for CFD Markets: currency news — 08-06-2022.
- US Dollar Index struggles to extend latest recovery inside a bearish chart pattern.
- Bearish RSI divergence, pullbacks from 200-SMA also keep sellers hopeful.
- Bulls need validation from 103.00, downside break of 102.00 confirms rising wedge.
US Dollar Index (DXY) fades upside momentum inside a rising wedge bearish formation during Thursday’s Asian session. In doing so, the greenback gauge dribbles around 102.55, following the previous day’s bounce off the 50% Fibonacci retracement (Fibo.) of April-May upside.
In addition to the rising wedge, the quote’s multiple failures to cross the 200-SMA since late May joins the bearish RSI divergence to tease the sellers. It’s worth noting that the higher high in prices contrasts with the lower high in RSI (14) to portray the bearish divergence.
That said, the quote’s pullback moves remain elusive until it stays beyond the 50% Fibonacci retracement level of 102.30.
Also acting as the key downside hurdle is the confluence of the 50-SMA and the stated wedge’s support line, close to 102.00.
In a case where the US Dollar Index drops below 102.00, the odds of its south-run to May’s bottom surrounding 101.30 can’t be ruled out.
Alternatively, the 200-SMA and the wedge’s resistance line challenge recovery moves around 102.85.
Following that, the 103.00 threshold appears to challenge the DXY bulls before directing them towards April’s peak of 103.94.
DXY: Four-hour chart
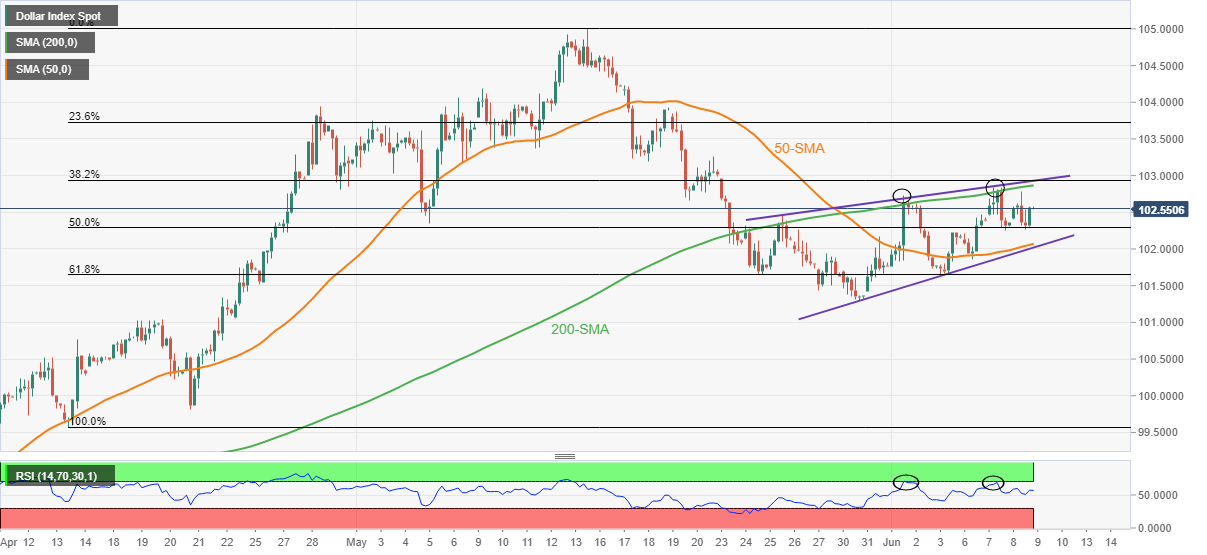
Trend: Pullback expected
- AUD/JPY is expected to extend gains on RBA-BOJ policy divergence.
- The BOJ has restricted its yields to 0.25 to keep up the ultra-loose monetary policy.
- RBA’s 50 bps rate hike announcement may shrink its employment generation ability further.
The AUD/JPY pair is scaling firmly higher towards the round-level resistance of 97.00 on broad weakness in the Japanese yen. The risk barometer is expected to continue its three-day winning streak after overstepping Wednesday’s high at 96.88.
A divergence in the approach of the Bank of Japan (BOJ)’s monetary policy with its respective G-10 peers has brought an intense sell-off in yen. A gradual downside move in Tokyo was lucrative in fetching more business opportunities, however, investors are dumping yen, which has raised concerns. The ideology of restricting the 10-year benchmark Japanese yields at 0.25% is denting the yen’s demand.
It is worth noting that the Japanese economy has achieved the desired 2% inflation target. However, the context is boosted by higher oil prices rather than a broad-based recovery in the aggregate demand.
Meanwhile, the aussie has been underpinned amid a rate hike announcement by the Reserve Bank of Australia (RBA) on Wednesday. The RBA unexpectedly elevated its Official Cash Rate (OCR) by 50 basis points (bps), double the consensus of 25 bps. No wonder, the galloping price pressures forced the RBA to feature a jumbo rate hike but vulnerable employment opportunities may get dented further as the quantitative tightening will lose up the labor market. To be noted, the Australian economy added only 4k jobs in May, significantly lower than the expectations of 30k.
- During the week, the USD/JPY is recording gains of almost 3%.
- A risk-off market mood has not been an excuse for the buck to keep trending higher, underpinned by elevated US Treasury yields.
- USD/JPY Price Forecast: To consolidate before resuming upwards.
The Japanese yen continues weakening against the greenback as USD buyers mount against the weakest currency in the G10, also weighed by higher US Treasury yields, widening the bond spread between both countries. At 134.42, the USD/JPY lurks at the 135.00 psychological level, which analysts and former Japanese policymakers mentioned could trigger intervention in the Forex market.
At the time of writing, the US 10-year Treasury yield sits at 3.00%, flat in the day. Meanwhile, the US Dollar Index, a gauge of the greenback’s value, rises 0.21%, currently at 102.545, a tailwind for the USD/JPY.
Sentiment-wise, Asian equity futures are mixed, with Japanese and Australian stock exchanges ready to open with losses. Chinese markets are poised for a higher open. Concerns about central banks tightening monetary policy might spur an economic slowdown loom.
On Wednesday, the USD/JPY opened near the session’s lows around 132.50 and rallied nonstop until the North American open, when it dipped towards 133.60, before resuming above 134.00.
USD/JPY Price Forecast: Technical outlook
The USD/JPY daily chart depicts the pair as upward biased, despite the parabolic upward move, from 126.86 to 134.40s, reaching a 20-year high. However, USD/JPY traders need to be aware that the last leg-up was printed on weaker momentum, as the Relative Strength Index (RSI) begins to show a negative divergence between the major’s price action and the oscillator. Therefore, the USD/JPY might pull back before resuming the uptrend.
That said, the USD/JPY first support would be the psychological 134.00 mark. Break below would expose the June 8 low at 132.54, followed by the May 9 high at 131.34.
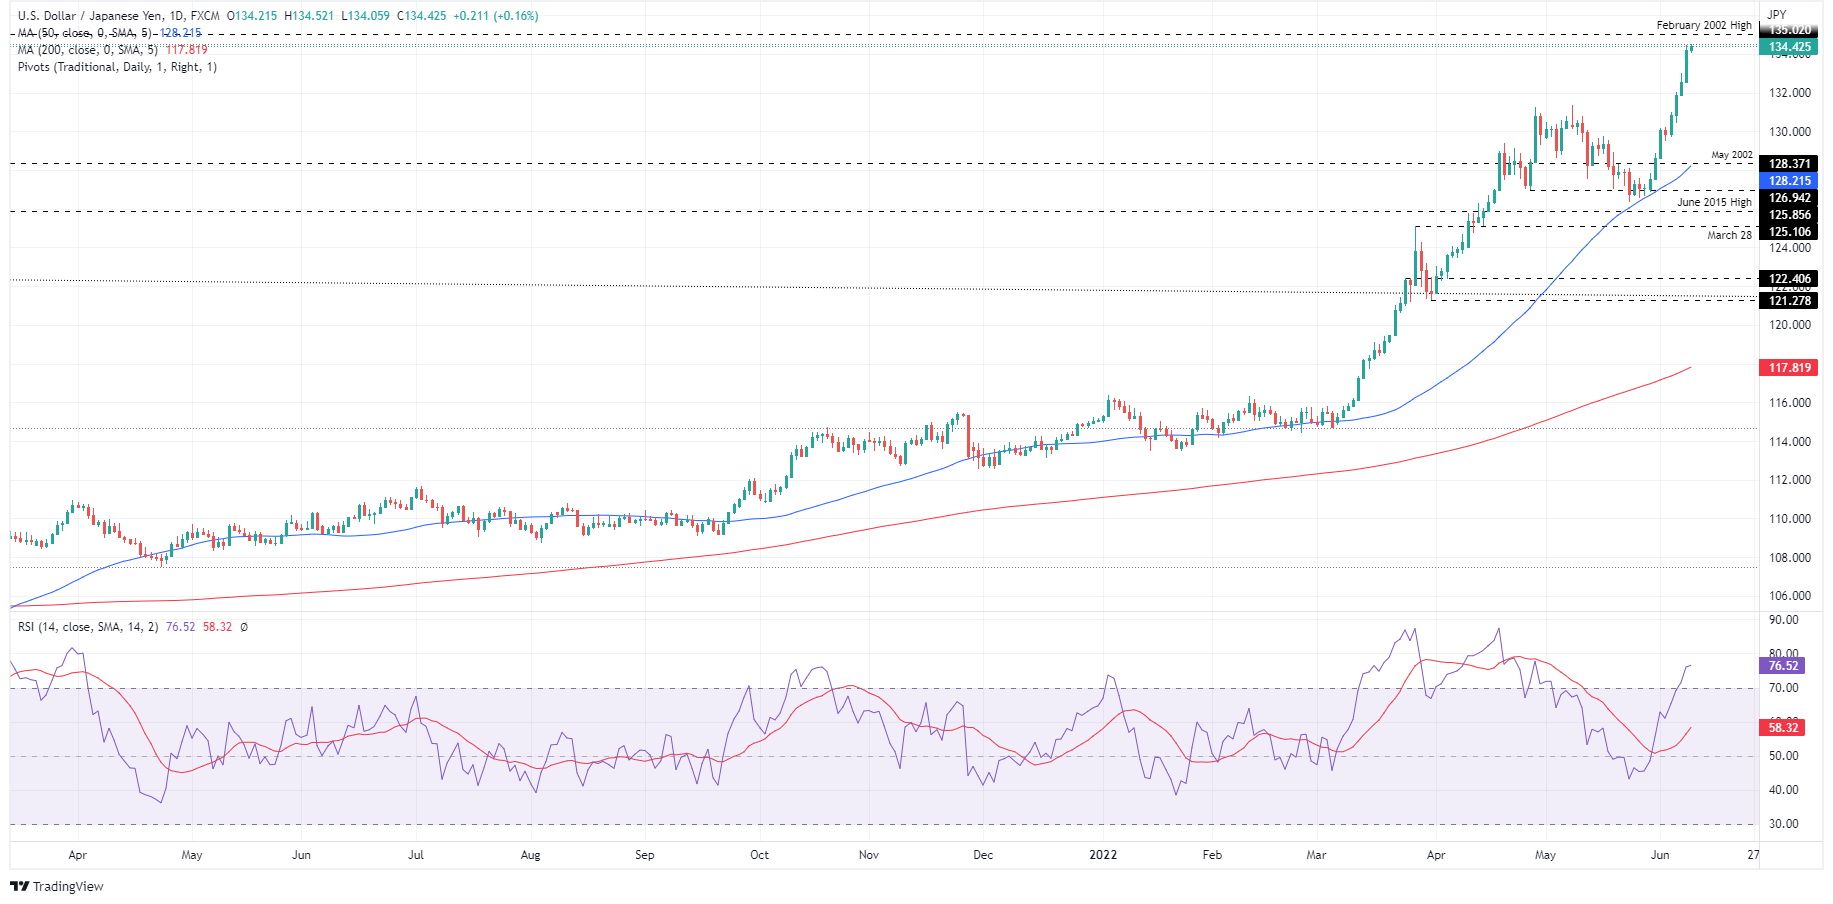
Key Technical Levels
- AUD/USD remains pressured, eyes the first weekly loss in four.
- US dollar benefits from concerns that higher inflation, faster monetary policy normalization to take a toll on economic growth.
- RBA’s rate hike, China’s post-covid unlock fail to impress bulls amid chatters over Fed’s moves, US CPI.
- China trade numbers for May to offer immediate directions ahead of ECB, US CPI.
AUD/USD holds lower ground near 0.7190, keeping the previous day’s losses in a tight range, as sour sentiment joins anxiety ahead of China’s trade numbers. Also exerting downside pressure on the Aussie pair are the recent losses on Wall Street and gold’s failures to impress bulls, not to forget broad US dollar strength.
That said, the Wall Street benchmarks snapped a two-day rebound and the US Dollar Index (DXY) regained upside momentum as it closed with 0.21% daily gains around 102.55 on Wednesday, after retreating from 102.77. Further portraying the risk-off mood is the 5.3 basis points (bps) of an addition to the US 10-year Treasury yields, to 3.027%.
The risk-aversion wave got appreciation after White House spokeswoman Karine Jean-Pierre said they expect the inflation numbers to be released at the end of the week to be elevated. Also supporting the forecasts are the recently firmer US inflation expectations, as per the 10-year breakeven inflation rate per the St. Louis Federal Reserve (FRED) data. That said, the inflation precursor stays firmer around the one-month high of late.
On the same line, the Organisation for Economic Co-operation and Development (OECD) cuts the global growth outlook for 2022 while World Bank (WB) President David Malpass warned that faster-than-expected tightening could recall a debt crisis similar to the one seen in the 1980s.
It should be noted that the Reserve Bank of Australia’s (RBA) surprise 50 bps rate hike and China’s gradual economic transition after the covid-led lockdowns appear to fall short of convincing the AUD/USD pair buyers ahead of this week’s key data/events.
Among them, today’s China Trade Balance, Imports and Exports for May will be the first to direct the Aussie pair ahead of Friday’s inflation numbers from China and the US. Also important will be today’s monetary policy decision from the European Central Bank (ECB), due to its direct impact on the US dollar and the market sentiment.
Although likely improvement in China’s trade numbers may probe the AUD/USD bears, sour sentiment may keep exerting downside pressure on the risk barometer pair.
Technical analysis
AUD/USD fades bounce off yearly low marked in May amid a failure to cross the 200-DMA, around 0.7255 by the press time. The anticipated pullback moves, however, will need validation from the 21-DMA level surrounding 0.7100.
- Gold price has defended the crucial support of $1,850.00 but is still inside the woods.
- Sustenance of the US inflation above 8% will bolster the odds of a bumper rate hike by the Fed.
- The precious metal is expected to remain sideways on Ascending Triangle formation.
Gold price (XAU/USD) is bided strongly below the critical support of $1,850.00 as the US dollar index (DXY) is displaying back and forth moves. The precious metal witnessed barricades while attempting a break above $1,860.00 and slipped lower to $1,849.11.
The market participants need to understand the fact that trading sessions before a principal event bring wild moves in the respective counters. The investing community is awaiting the release of the US Consumer Price Index (CPI), which is due on Friday. Therefore, wild swings cannot be ruled out.
The US inflation is seen as stable at 8.3% on annual basis. The Federal Reserve (Fed) is featuring quantitative restricting measures for a longer period but is still far from achieving the desired outcome. The central bank has already announced two rate hikes by 25 basis points (bps) in March and 50 bps in May. Considering the galloping price pressures and upbeat employment data, which were released last week, a jumbo rate hike by the Fed looks real.
Gold technical analysis
On an hourly scale, the gold price is continued to trade in an Ascending Triangle whose upward sloping trendline is placed from May 16 low at $1,786.94 while the horizontal resistance is plotted from May 24 high at $1,869.69. The 50-period Exponential Moving Average (EMA) at $1,851.36 is overlapping with the gold prices, which signals a consolidation ahead. Meanwhile, the Relative Strength Index (RSI) (14) has faced a hurdle around 60.00 and has shifted back into the 40.00-60.00, which signals a continuation of a consolidation phase.
Gold hourly chart

- USD/CAD fades bounce off seven-week low, stays on the way to fifth weekly loss.
- Fears of faster monetary policy normalization to weigh on economic growth underpin US dollar gains ahead of Friday’s inflation data.
- Oil prices cheer China’s gradual recovery from covid, geopolitical concerns.
- OECD cuts global economic forecasts to challenge the market sentiment and probe pair bears.
USD/CAD teases a return to the bear’s area, after a brief journey with buyers, as the quote eases back towards the seven-week low during the inactive Asian session on Thursday. That said, the Loonie pair fades the previous day’s bounce off the multiday low of 1.2517, printing mild losses around 1.2550 by the press time.
The quote’s latest weakness could be linked to the recently steady US dollar and firmer prices of Canada’s key export item, namely the WTI crude oil.
That said, the black gold stays firmer around a three-month high amid hopes of more energy demand due to China’s unlocks of the covid-led activity restrictions. Also favoring the energy benchmark is the drawdown of crude in the Strategic Petroleum Reserve (SPR) and the Russia-Ukraine crisis. “US commercial crude oil inventories rose unexpectedly last week, while crude in the Strategic Petroleum Reserve fell by a record amount as refiners ramped up production to pre-pandemic levels, the Energy Information Administration said on Wednesday,” said Reuters.
On the other hand, the US Dollar Index (DXY) regained upside momentum as it closed with 0.21% daily gains around 102.55 on Wednesday, after retreating from 102.77. The greenback’s gains could be linked to the broad fears concerning growth and inflation.
The market pessimism gained momentum after White House spokeswoman Karine Jean-Pierre said they expect the inflation numbers to be released at the end of the week to be elevated. Also supporting the forecasts are the recently firmer US inflation expectations, as per the 10-year breakeven inflation rate per the St. Louis Federal Reserve (FRED) data. That said, the inflation precursor stays firmer around the one-month high of late.
On the same line, the Organisation for Economic Co-operation and Development (OECD) cuts the global growth outlook for 2022 while World Bank (WB) President David Malpass warned that faster-than-expected tightening could recall a debt crisis similar to the one seen in the 1980s.
Amid these plays, the Wall Street benchmarks snapped a two-day rebound whereas the US 10-year Treasury yields rose 5.3 bps to 3.027%.
Looking forward, today’s monetary policy decision from the European Central Bank (ECB) appears the key event for markets, as well as for the USD/CAD traders due to its impact on the US dollar. However, major attention will be given to Friday’s US Consumer Price Index (CPI) for May and the Canadian employment report. That said, hawkish expectations from the ECB challenge the recent US dollar gains.
Technical analysis
Unless providing a daily closing beyond the monthly resistance line, around 1.2570 by the press time, USD/CAD prices are on the way to testing the late April swing low near 1.2460.
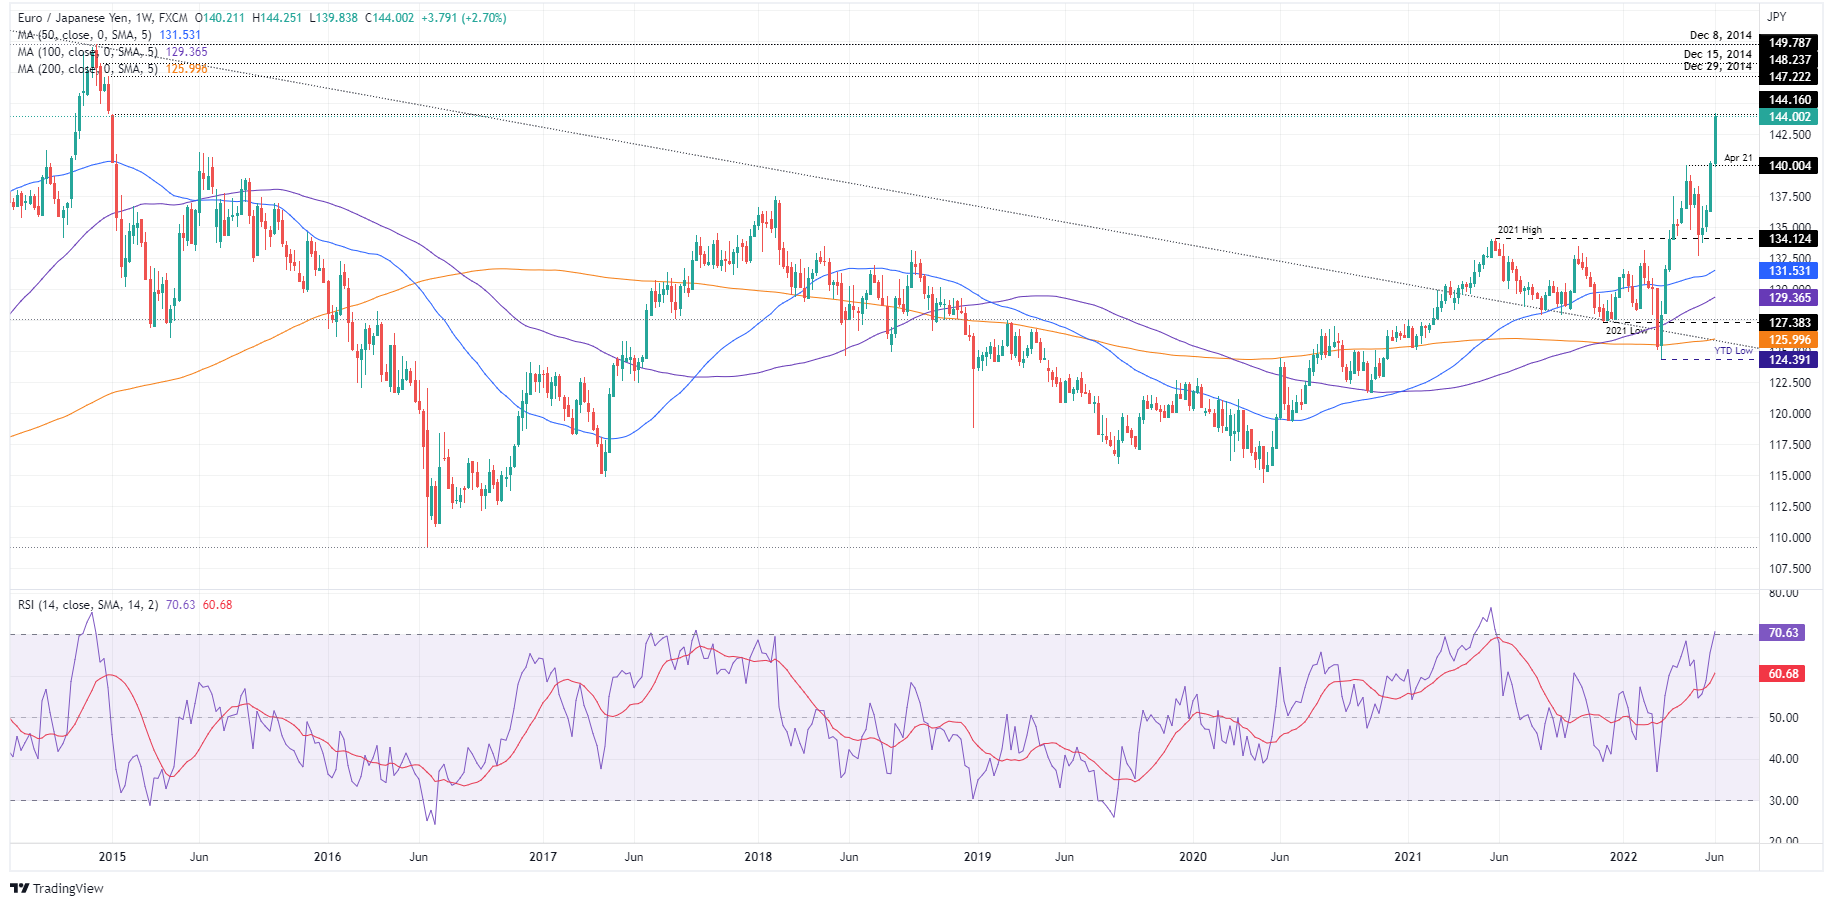
- The shared currency is registering gains of 3% in the week vs. the yen.
- Risk-aversion and ECB’s meeting to keep the pair in choppy trading.
- ECB Preview: Forecasts from eight major banks, ready for lift-off.
- EUR/JPY Price Forecast: A break above 144.14 to open the door towards 147.00s.
The shared currency moves to seven-year-highs around 144.25, spurred by a weaker Japanese yen, tumbling against most G8 currencies. At the time of writing, the EUR/JPY is trading at 143.84, recording minimal gains of 0.01% as the Asian Pacific session begins.
Risk-aversion and ECB’s meeting to keep the pair in choppy trading
Sentiment remains negative on concerns that central banks hiking rates will weigh on the economic growth. Reflecting that, are US equities snapping two days of gains. Asian equity futures fluctuate, reflecting a mixed mood, while EUR/JPY traders brace for the European Central Bank (ECB) monetary policy meeting on Thursday.
The European Central Bank (ECB) is set to announce the end of its APP program, though it would keep rates unchanged. Market players expect Mrs. Lagarde and Co. to lay the ground for a July lift-off while finishing the Quantitative Easing.
Still, investors’ only doubt is if the ECB would guide the markets regarding the pace of rate increases, as some ECB Governing Council (GC) members leaned toward 50 bps hikes, except for Mrs. Lagarde and the ECB’s Chief Economist Philip Lane.
In the meantime, money market futures have priced in around 132 bps of tightening this year, which would imply 25 bps hikes at the three of the four meetings after June, with one meeting expected to see a 50 bps rate raise.
EUR/JPY Price Forecast: Technical outlook
The EUR/JPY weekly chart depicts the cross-currency as upward biased, though it is about to face solid resistance, at around 144.16, January’s 2015 highs. It’s worth noting that the Relative Strength Index (RSI) just reached overbought conditions at 71, which means that the EUR/JPY might consolidate before resuming the uptrend.
Nevertheless, if the EUR/JPY aims higher, the first resistance would be 144.16. A breach of the latter would expose December 29, 2014, high at 147.22, followed by December 15, 2014, high at 148.23, and December 8, 2014, daily high near 149.78
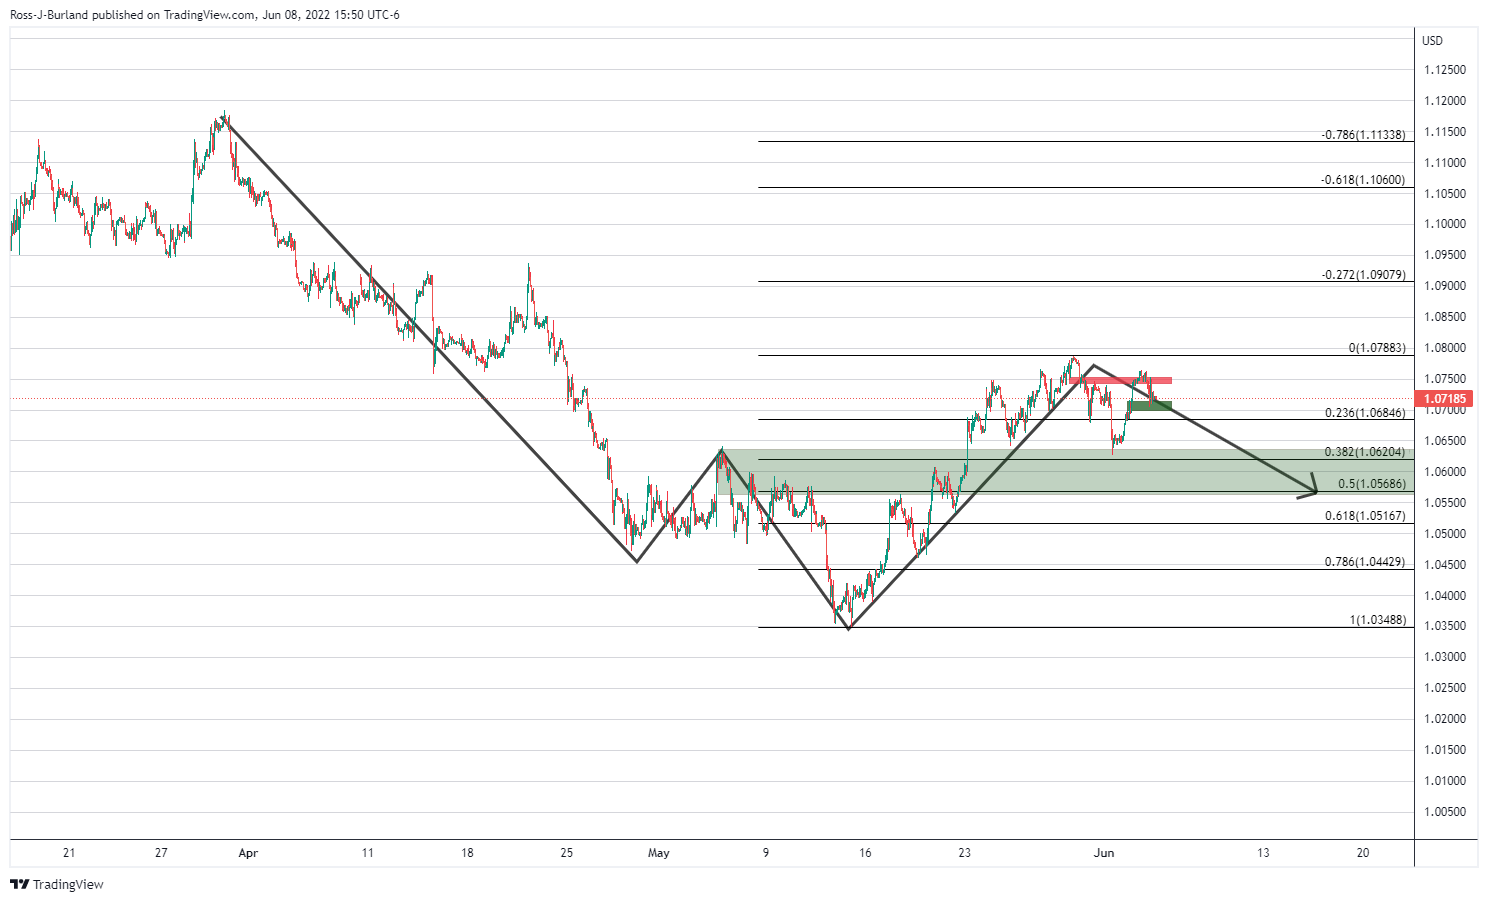
- EUR/USD bears are lurking below a critical resistance.
- A break of 4-hour support could open the risk of a significant correction.
EUR/USD is displaying a bearish bias on the weekly chart which can be analysed on a lower time frame for prospects of a deeper correction in the days ahead. The following illustrates the market structure on a multi-timeframe basis:
EUR/USD weekly chart
This is a powerful reversion pattern and a move in to test the old support, or the nose of the W-formation, is a high probability.
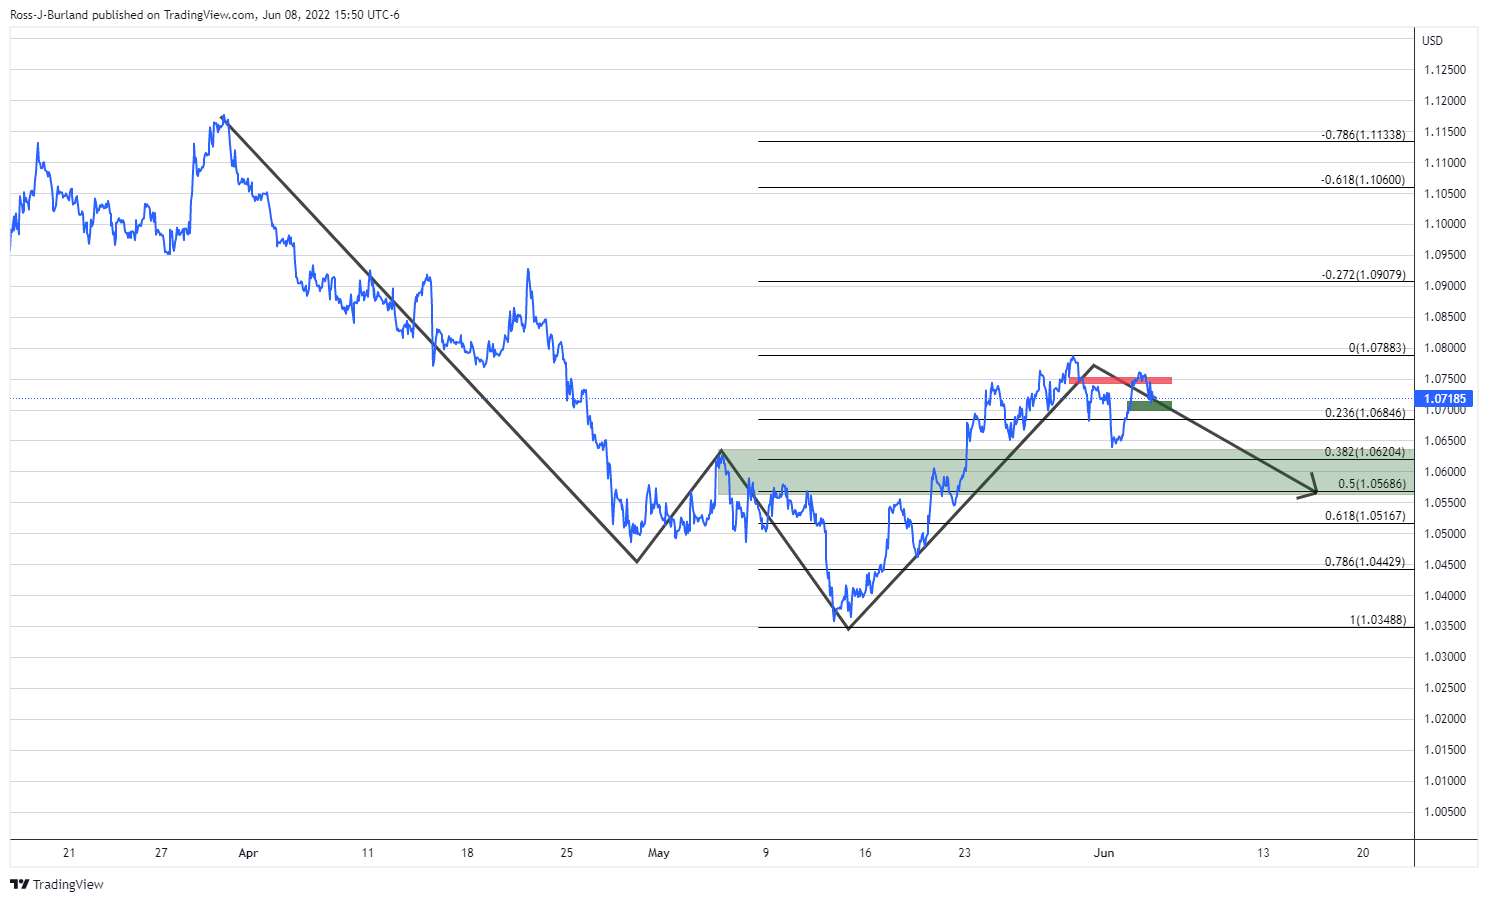
EUR/USD lower time frames, H1 & H4
On the lower time frames is where the current market structure and the potential distribution schematic that can be analysed for a bearish trade set-up
A line chart shows the weekly W pattern more clearly:
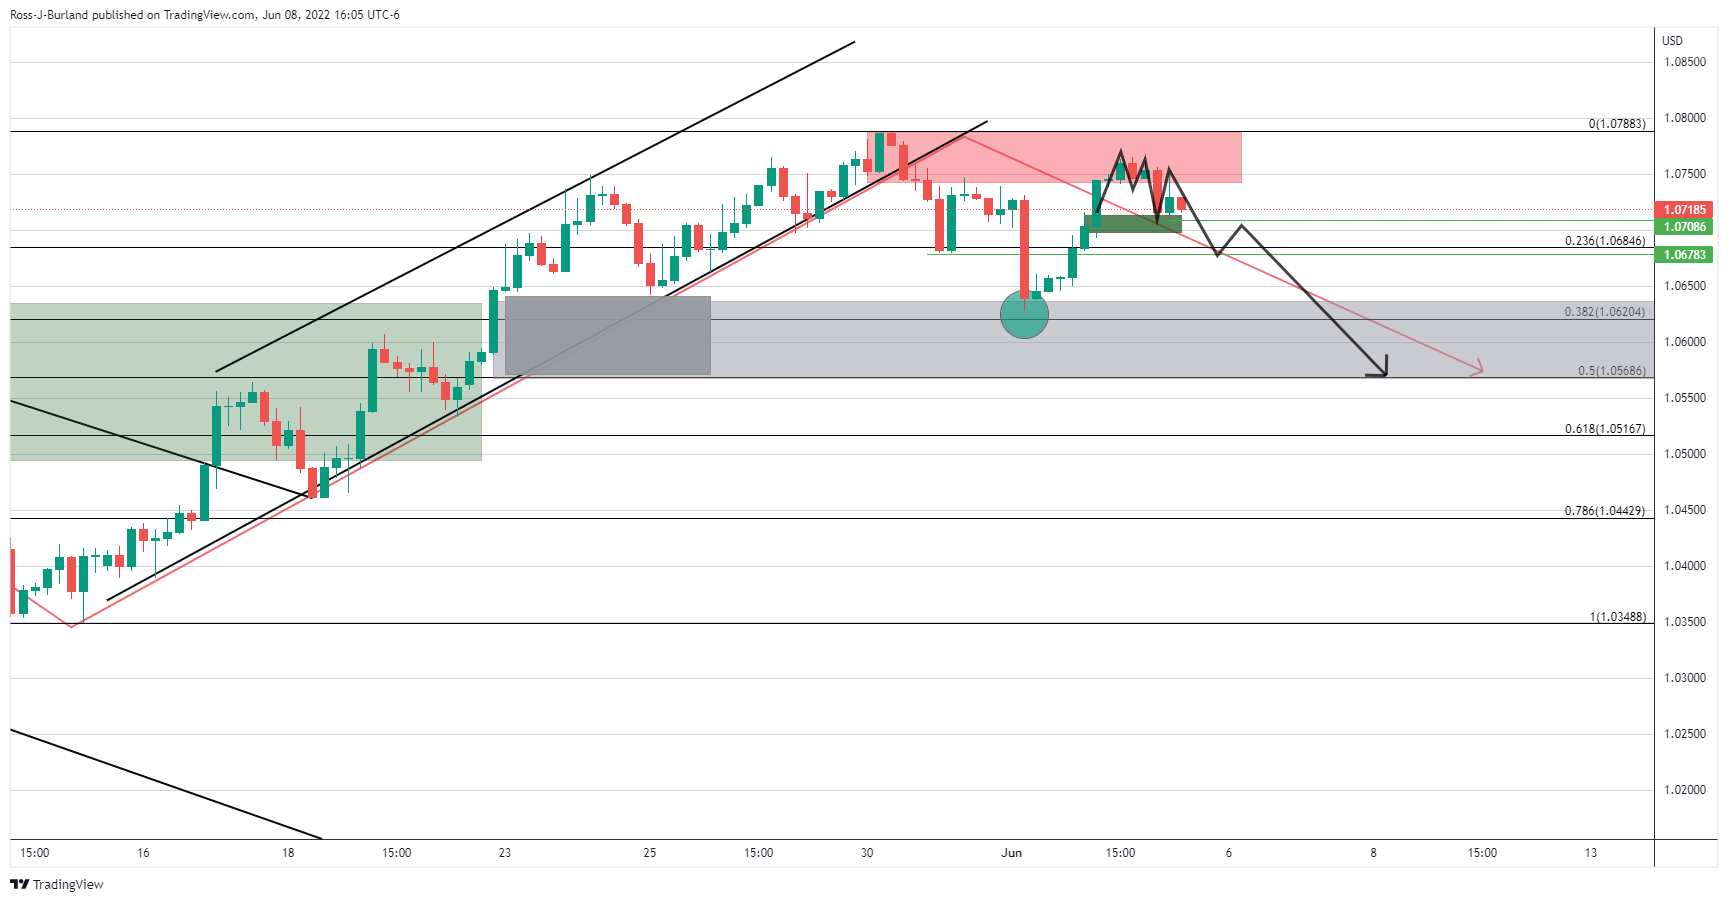
H4 charts
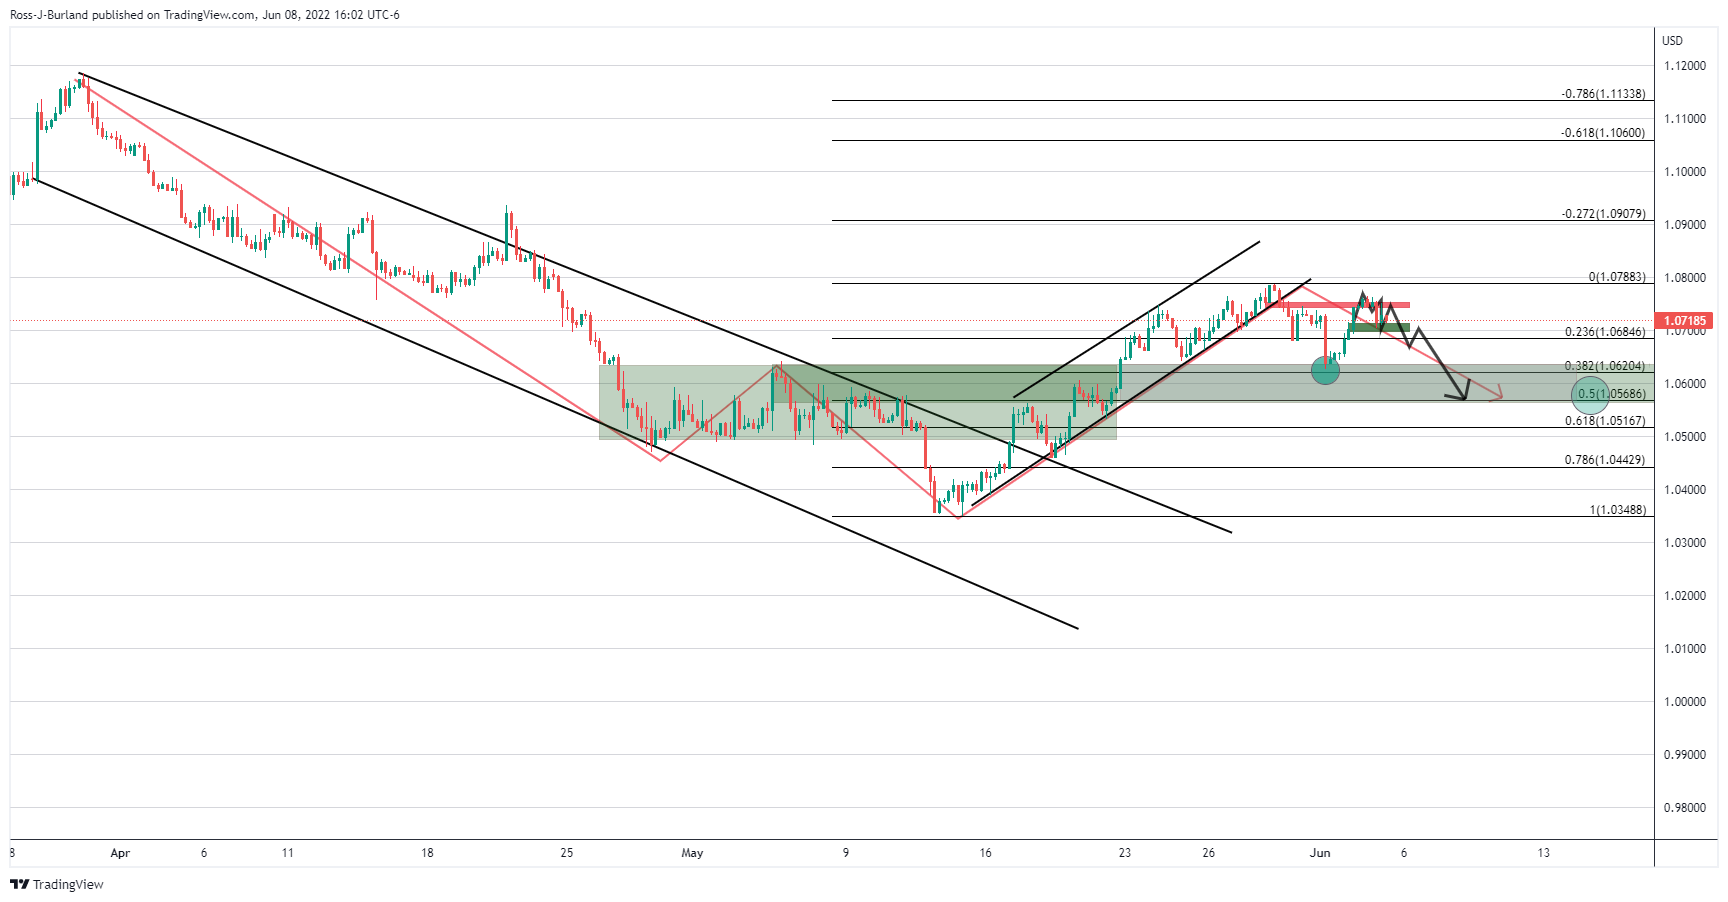
Where there is less noise on the four-hour chart, zooming in on the near-term price action and structure, we can see an M-formation has developed. There are prospects of either some sideways consolidation between resistance and support before a breakout to the downside if we do not get that beforehand.
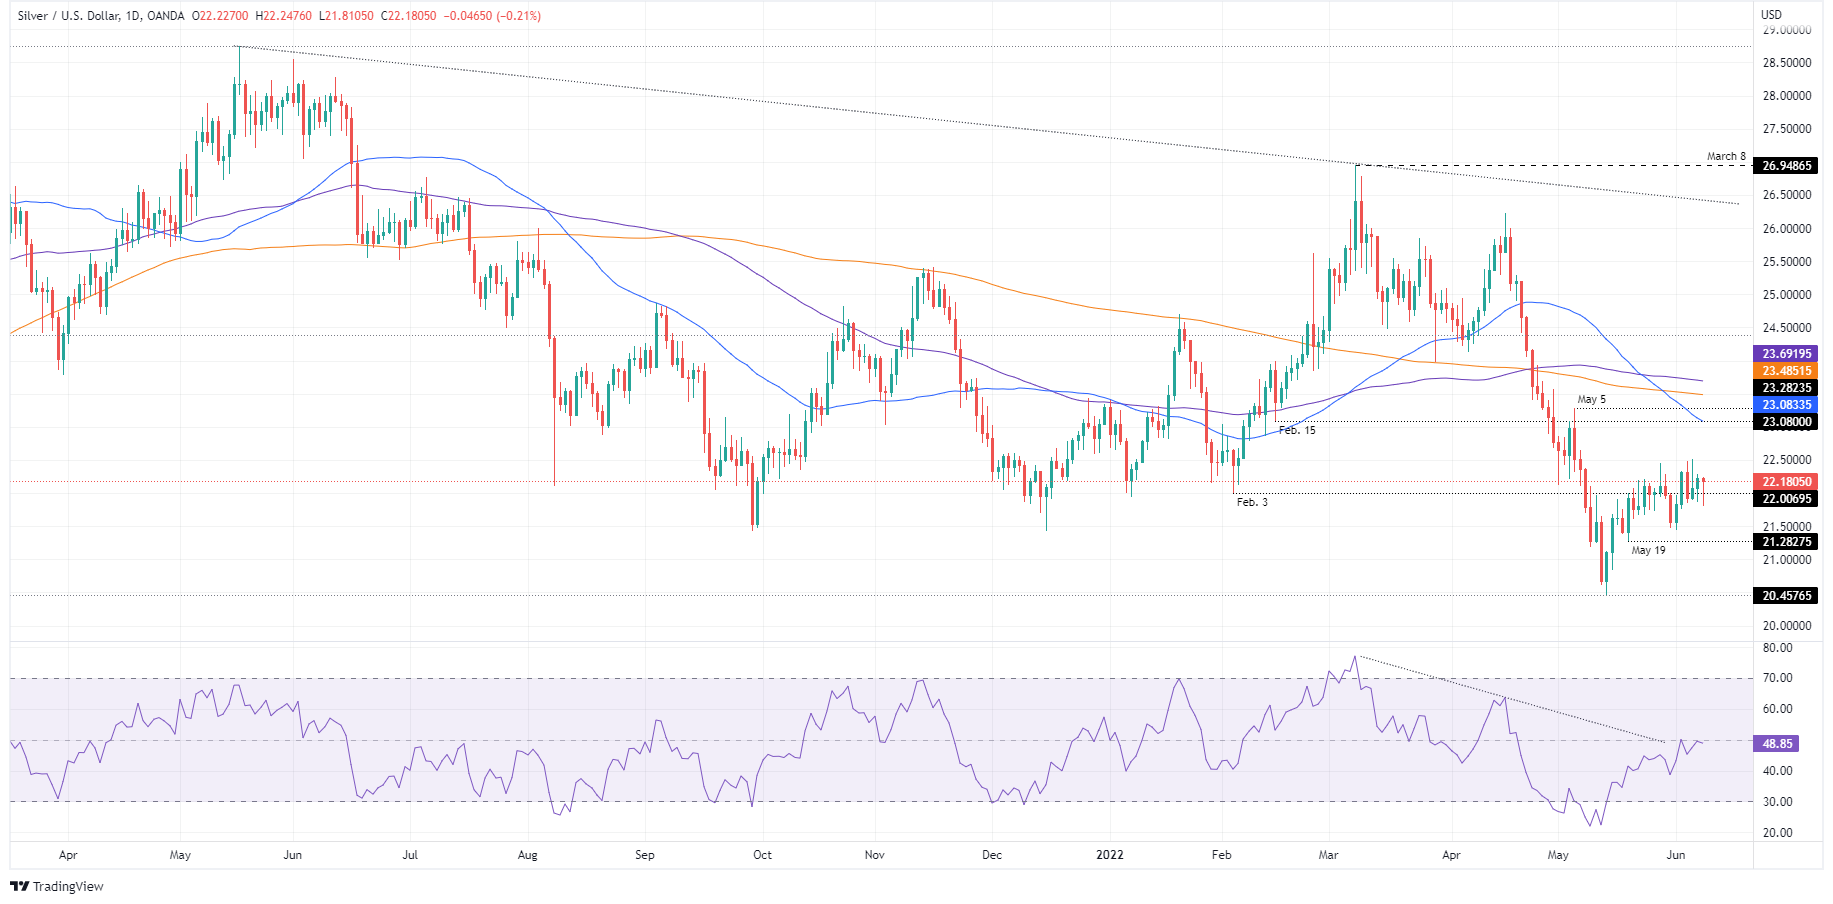
- Silver prices remain depressed below one-week-old descending trend line despite repeated bounces off 100-SMA.
- Sluggish RSI, MACD hints at the continuation of a slow grind to the south.
- 200-SMA adds to the upside filter, monthly low lures bears.
Silver Price (XAG/USD) holds lower ground near $22.00 during Thursday’s initial Asian session, following the biggest daily loss of the week.
In doing so, the bright metal approaches a short-term key support line while consolidating the weekly gains.
Also supporting the gradual weakness is the recently steady RSI (14), as well as sluggish MACD.
On breaking the aforementioned one-month-old support line, near $21.90 by the press time, the XAG/USD prices could drop towards the monthly low surrounding $21.40.
Following that, the 61.8% Fibonacci retracement of the May 13 to June 06 upside, around $21.25, will gain the market’s attention ahead of directing silver sellers towards the $21.00 threshold.
Meanwhile, the 200-SMA and a weekly resistance line restrict short-term upside moves of the silver prices, respectively around $22.15 and $22.20.
Also acting as an upside filter is the monthly peak of $22.51, a break of which could quickly propel the quote towards May’s top near $23.30.
Silver: Four-hour chart
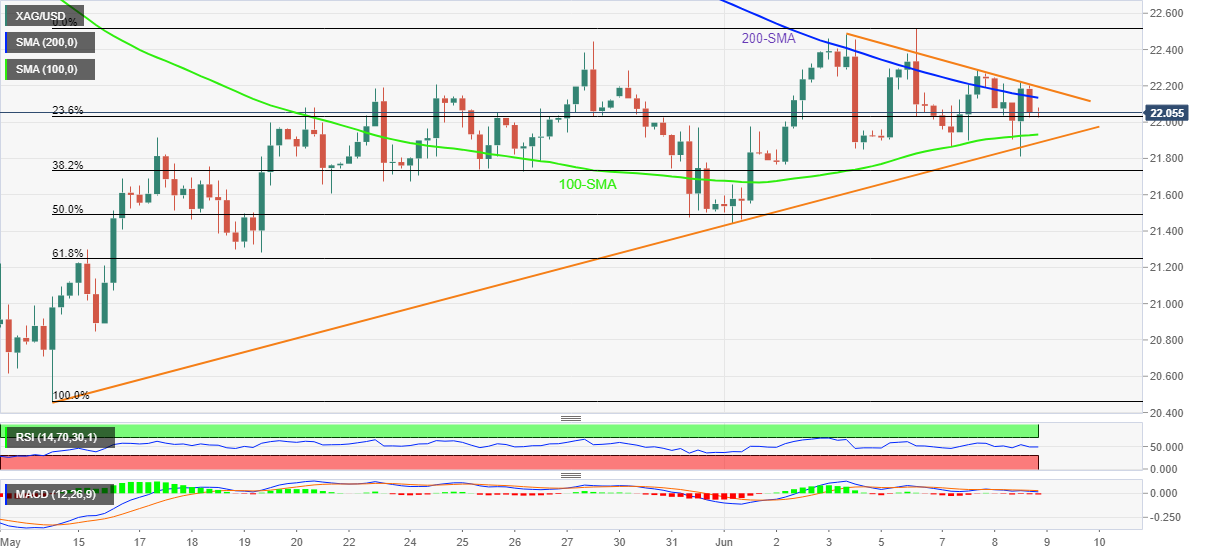
Trend: Further weakness expected
- USD/CHF is advancing towards 0.9800 on a souring market mood.
- A higher seen US inflation event has trimmed the advocacy for the risk-sensitive currencies.
- A stable jobless rate has failed to cheer the Swiss franc bulls.
The USD/CHF pair has witnessed a firmer rebound at open from 0.9768 and is advancing towards the round-level resistance of 0.9800 on negative market sentiment. Uncertainty over the release of the US Consumer Price Index (CPI) on Friday has underpinned the risk-off impulse, which has improved the safe-haven’s appeal.
The annual US inflation is seen unchanged at 8.3% while the core CPI may slip to 5.9% against the prior print of 6.2%. Rising price pressures are tackled by restricted quantitative measures. The Federal Reserve (Fed) has already raised its interest rates by 25 basis points (bps) and 50 bps in March and May respectively. However, a minimal effect has been recorded on price pressures post the rate hike announcements. Adaptation of quick pace in quantitative tightening will trim the demand forecasts significantly, which has already shifted the risk-perceived assets on the tenterhooks.
Meanwhile, the US dollar index (DXY) has turned sideways in a 102.27-102.78 range ahead of the US inflation. Next week, the mega event of monetary policy announcement by the Fed will keep the DXY in the grip of bulls. As expected, the outcome of higher inflation will be joined by the upbeat US Nonfarm Payrolls (NFP) and will bolster the odds of a consecutive 50 bps rate hike announcement by the Fed.
On the Swiss franc front, stability in the jobless rate has failed to cheer the market participants. The Swiss State Secretariat of Economic Affairs has reported the Unemployment Rate at 2.2%. It looks like the Swiss franc bulls are not reacting much to the domestic data and are being guided by the US inflation event.
US inflation expectations, as per the 10-year breakeven inflation rate per the St. Louis Federal Reserve (FRED) data, regain upside momentum after a pullback from the highest levels since early May. With this, the inflation gauge remains around the highest levels since early May, at 2.75% by the end of Wednesday’s North American session.
The inflation gauge becomes more important considering this week’s US Consumer Price Index (CPI) for May, as well as an absence of the Fed policymakers’ speeches, due to the pre-Fed blackout norm.
Further increasing the importance of the precursor were the latest comments from White House spokeswoman Karine Jean-Pierre. The Diplomat said they expect the inflation numbers to be released at the end of the week to be elevated.
The inflation forecasts are also gaining momentum of late higher inflation pushes the global central bankers toward the faster monetary policy normalization amid fears of recession. Earlier in the week, World Bank (WB) President David Malpass warned that faster-than-expected tightening could push some countries into a debt crisis similar to the one seen in the 1980s.
Read: US economy slouches toward recession
- The 50- and 200-EMAs have turned sideways therefore a rangebound move cannot be ruled out.
- A Symmetrical Triangle formation signals a slippage in standard deviation, followed by an expansion in the same.
- Investors should brace for a rangebound move as the RSI (14) has shifted into a 40.00-60.00 range.
The AUD/USD pair is displaying topsy-turvy moves in a narrow range of 0.7187-0.7200. The unavailability of any potential trigger has turned the asset sideways. This week, the asset has auctioned in a range of 0.7157-0.7240, and a similar movement is expected further amid volatility contraction.
On an hourly scale, the asset is trading in a Symmetrical Triangle pattern that signals a slippage in volatility, followed by a breakout in the same. The ascending trendline of the above-mentioned chart pattern is placed from June 2 low at 0.7140 while the downward sloping trendline is plotted from Friday’s high at 0.7283.
The 50- and 200-period Exponential Moving Averages (EMAs) at 0.720 and 0.7187 respectively have turned flat, which signals a consolidation ahead.
Meanwhile, the Relative Strength Index (RSI) (14) has shifted into a 40.00-60.00 range, which bolsters the odds of a rangebound move ahead.
Should the asset oversteps June’s high at 0.7283, it will trigger the upside break of a Symmetrical Triangle, which will infuse fresh blood into the aussie bulls for an upside move towards the April 19 low at 0.7343, followed by the round-level resistance at 0.7400.
Alternatively, aussie bulls can lose their grip if the asset drops below June 2 low at 0.7140, which will drag the asset towards May 26 high at 0.7110. Breach of the latter will expose the asset to more downside towards May 18 high at 0.7048.
AUD/USD hourly chart
-637903211588562903.png)
- The GBP/JPY is registering weekly gains of almost 3%.
- Japanese yen weakness sounds the alarm of a possible intervention in the FX market.
- GBP/JPY traders need to know how the USD/JPY behaves around 135.00.
- GBP/JPY Price Forecast: Remains upward biased, and a break above 169.00 would open the door for 170.00; otherwise, a pullback towards 164.00s is on the cards.
The GBP/JPY soars to fresh six-year highs, despite a risk-off market mood, courtesy of the Bank of Japan’s (BoJ) pledging to keep its ultra-loose monetary policy posture, which also maintains the USD/JPY under pressure, reaching fresh 20-year highs. At the time of writing, the GBP/JPY is trading at 168.24, up almost 1%.
The Japanese yen would be under heavy pressure on Thursday. The USD/JPY is approaching the 135.00 mark, a price level mentioned by former Japanese officials as a line of the sand that could trigger an intervention by the Japanese Ministry of Finance in the Forex market.
Hiroshi Watanabe, a former currency chief in the Ministry of Finance until 2007, said that “Even 130, 135 is not so critically bad for the Japanese economy,” via Bloomberg. However, Watanabe added, “how long it’s going to stay there is quite important.”
In the meantime, Asian equity futures are mixed, carrying on Wall Street’s sentiment, with US stocks recording hefty losses.
Meanwhile, GBP/JPY Wednesday’s price action opened around 166.80s, and rallied steadily towards 168.50s, recording minor pullbacks on its way up,
GBP/JPY Price Forecast: Technical outlook
The GBP/JPY had skyrocketed since May 25, when the cross soared 0.72%, beginning its 1024 pip rally towards printing a 7-year high above 168.50. It’s worth noting that the pair’s bias remains upward, but due to the steepness move of the cross and the Relative Strength Index (RSI) in overbought territory, it might pave the way for a pullback.
If the GBP/JPY heads for a pullback, the cross-currency first support would be June 8 daily low at 166.82. A breach of the latter would expose the 23.6% Fibonacci retracement at 165.49, followed by the 38.2% Fibonacci retracement at 163.62. On the other hand, if the GBP/JPY aims higher, the first resistance would be the 169.00 figure. A break above would expose February’s 2016 swing highs around 170.63. Once cleared, a GBP/JPYrally towards 175.01 is on the cards.
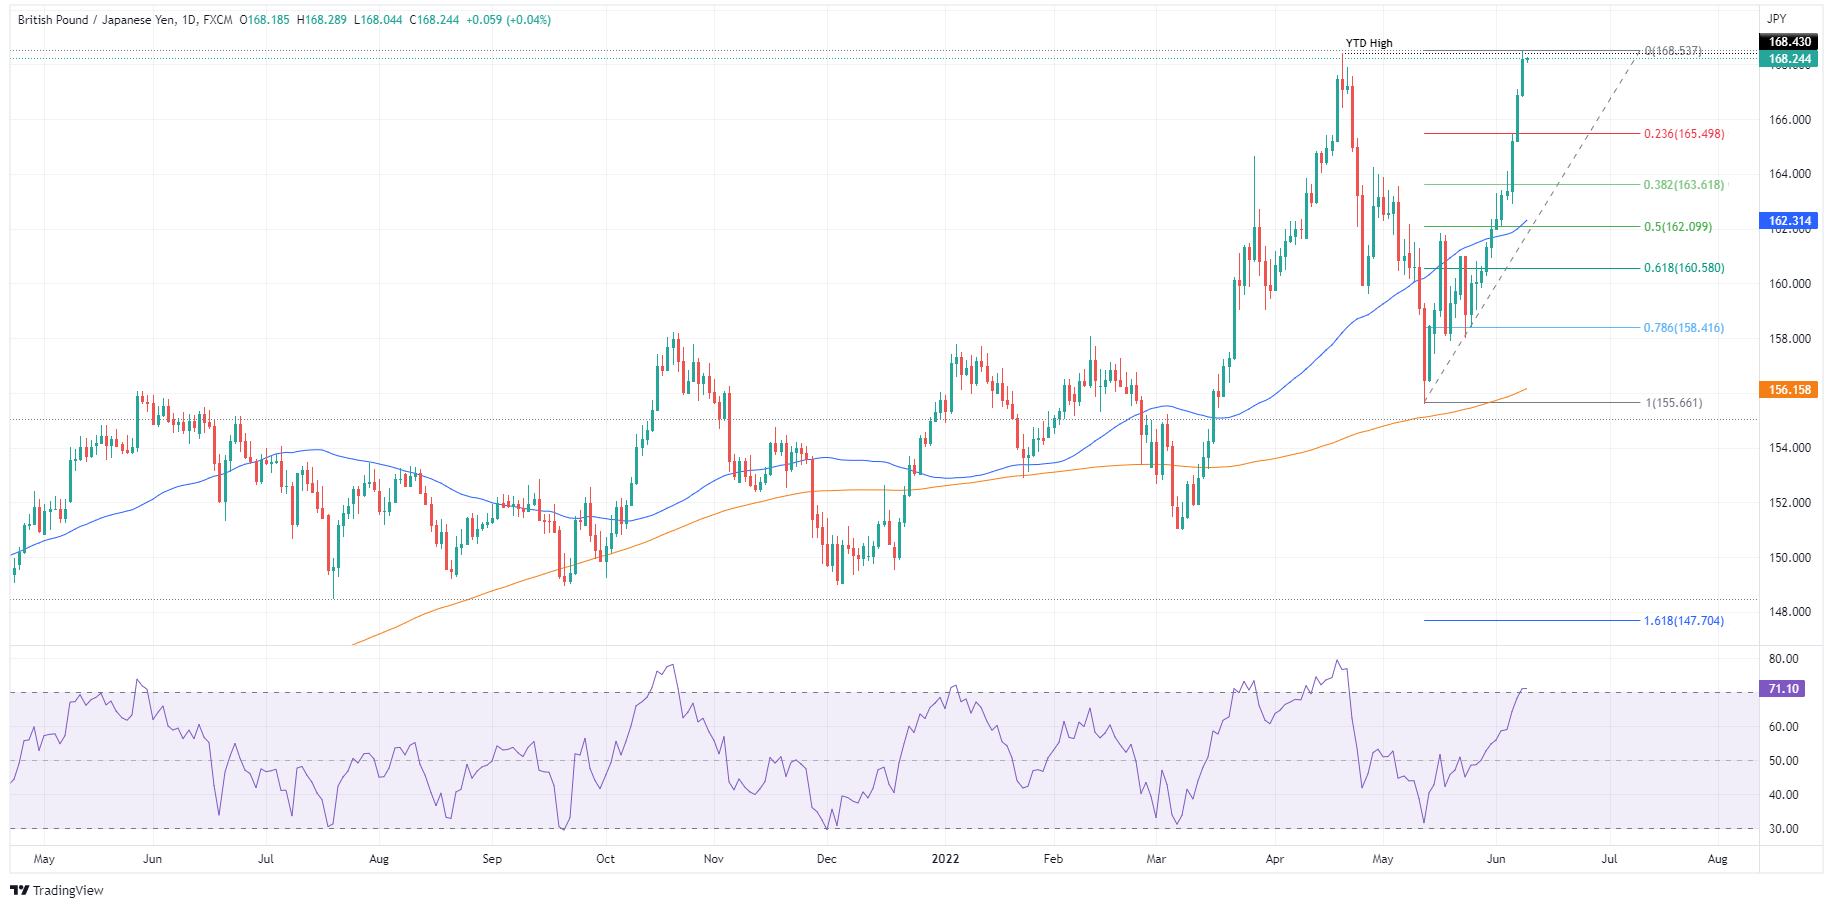
Key Technical Levels
- NZD/USD is meeting a key resistance area that is holding ahead of the ECB.
- The bias will be on the downside for the forseeible future for a potential lower low.
At 0.6445, NZD/USD has been in the hands of the bears mid-week and falling within the 0.64 area back towards the lows of the bearish daily cycle that began at the end of May when the bulls were capped on the last trading day of the month at 0.6563.
The commodity complex has struggled in June as investors were the complications of rising inflation, hawkish central banks, and dire geopolitics global growth prospects.
On Wednesday, equity markets traded slightly weaker in a familiar sour tone ahead of tonight’s European Central Bank meeting and key US events at the end of this week. The Federal Reserve is also just around the corner making for a nervous time in financial markets. The US 10-year auction hit a high yield of 3.03% on Wednesday, up from the 2.943% high in the previous auction. We have seen a subsequent rally in US yields and the 10-year now stands 1.54% higher on the day, supporting the greenback, and weighing on US stocks.
ECB in focus
''Both central banks will update their macroeconomic projections, and we expect that inflation forecasts will be raised, interest rate projections raised, and GDP forecasts cut,'' analysts at ANZ bank said in a note on Thursday morning. ''That is not a good combination for financial markets, and investors are likely to remain defensive as a result. We expect the ECB will err on the side of hawkishness as President Lagarde conveys the central bank’s determination to safeguard price stability. While she favors a gradual approach to normalizing policy, she cannot completely rule out the need for 50bps rate rises as the headline and core inflation pressures continue to intensify.''
As for the Reserve Bank of New Zealand, it has recently announced the balance sheet reduction plans whereby it will begin to sell its holdings of NZGBs from July 2022 and will sell NZD5bn per year in order of the maturity date. It will also sell until its holdings are reduced to zero.
NZD/USD techncial analysis
Meanwhile, from a technical standpoint, the price was meeting a key resistance area that is holding, so the bias will be on the downside for the foreseeable future for a potential lower low within the broader weekly bear trend:
What you need to take care of on Thursday, June 9:
Trading was choppy across the FX board, with most major pairs holding on to familiar levels, except for the USD/JPY pair, which surged to a fresh 20-year high of 134.47. The imbalance between the US Federal Reserve and the Bank of Japan boosted the pair as the BOJ reaffirmed its decision to maintain the ultra-loose monetary policy.
The American dollar suffered early in the US session as government bond yields eased, later recovering some ground amid falling US equities. Wall Street accelerated its decline in the final hours of trading after White House spokeswoman Karine Jean-Pierre said they expect the inflation numbers to be released at the end of week to be elevated.
The EUR/USD pair trades around 1.0710, while GBP/USD stands at 1.2540. The best performer was the Canadian dollar, as crude oil prices soared. The USD/CAD pair trades at around 1.2550 as WTI surged beyond $122.00 a barrel. AUD/USD gave up and settled just below 0.7200.
Gold advanced for a second consecutive day, but gains were tepid. The bright metal is currently changing hands at $1,853 a troy ounce.
On Thursday, the focus will be on the European Central Bank. The ECB is set to announce the end of its stimulus program and keep key rates unchanged while hinting at a July lift-off, actually two steps behind most major central banks. European policymakers have been hinting at a 50 bps rate hike, but President Christine Lagarde inclines for a conservative 25 bps hike. Markets are choppy ahead of the event and ahead of fresh US inflation figures.
Bitcoin Price Prediction: BTC sets sight on $34,000
Like this article? Help us with some feedback by answering this survey:
- The gold price is correcting towards an hourly W-formation's support structure.
- Bulls are starting to move in the following break of the 38.2% Fibo.
At $1,853, the gold price has stuck to a tight range on Wednesday despite some higher volatility in the forex space during the US session. Bulls have been trying to move in on-resistance but are being pushed back by a rally in US yields and the US dollar. Consequently, gold is pulling back on the hourly chart into a potential support area close to a 50% retracement of Wednesday's hourly rally from $1,844.59 lows.
the US 10-year auction hit a high yield of 3.03% on Wednesday, up from the 2.943% high in the previous auction. We have seen a subsequent rally in US yields and the 10-year now stands 1.54% higher on the day, supporting the greenback, and weighing on US stocks and gold in a familiar synergy between the asset classes as the comparative daily chart illustrates below:

Meanwhile, traders will look ahead to key macro events later this week. These will include the European Central Bank tomorrow, Thursday, and US inflation data Friday.
''Core prices likely stayed strong in May, with the series registering a second consecutive 0.5% MoM increase. A drag on inflation recently, we now expect used vehicle prices to be a contributor, advancing for the first time in four months,'' analysts at TD Securities explained. ''We also look for continued momentum in airfares and shelter inflation. Our m/m forecasts imply 8.4%/5.9% YoY for total/core prices.''
As for the ECB, the analysts said unless the governor, Christine Lagarde, ''commits to a series of 50s, EUR/USD has limited room to gain, particularly with the Euribor curve trading where it is and US CPI due the next day. Risk/reward more favorable for EURUSD to trade lower. Long-term inflation forecast will be key.''
In turn, this could keep the US dollar elevated into the US inflation data on Friday and hold the yellow metal back within familiar sideways ranges. However, much will depend on the tone of the ECB. The analysts at TDS also argued that the ECB will ''announce that the APP will end within weeks, and send a strong signal that rate hikes are coming in July and September (October remains a more interesting meeting in this sense). Forecasts will show stronger inflation and weaker growth, highlighting the ECB's challenge going forward.''
Consequently gold could be attractive for its haven qualities. The weakening economic backdrop has enabled the precious metal to find some support from investors. The precious metal has recently pushed above $1,850, despite a stronger USD.
Gold technical analysis

The price is correcting towards the W-formation's support structures and through the Fibonacci retracement scale. Bulls are starting to move in following a break of the 38.2% Fibo but there is still some way to go until the bullish impulse's price imbalance from near the 50% mean reversion level is mitigated. This leaves prospects of a deeper correction, potentially as far as the 61.8% Fibo.
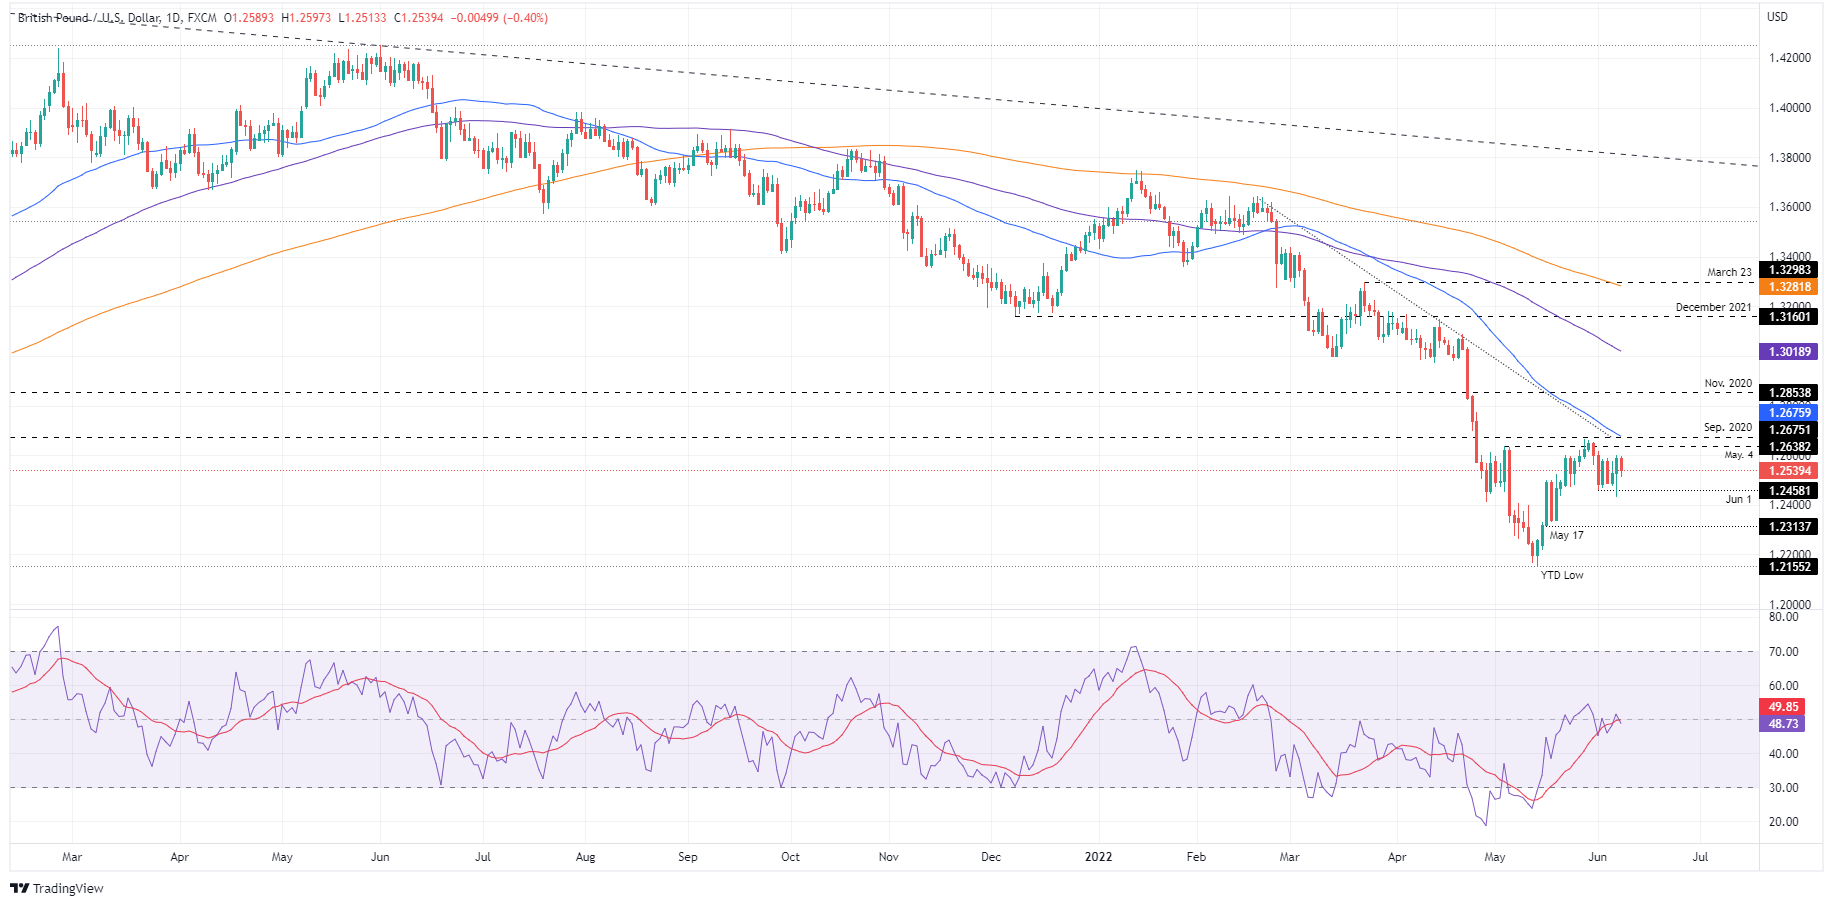
- Sterling clings to weekly gains of 0.42% amidst political turmoil and Brexit jitters.
- A risk-off mood, and high US bond yields, boosted the greenback and weighed on the GBP.
- GBP/USD Price Forecast: Still neutral-downwards, though a daily close below 1.2500 will send the pair tumbling towards 1.2400.
The GBP/USD remains in a consolidation phase, within the 1.2450-1.2670 area, below the 50-day moving average (DMA) at 1.2676, for the eighth consecutive trading day, as risk-aversion increased demand for the greenback. At 1.2539, the GBP/USD reflects the aforementioned in the New York session.
Risk-aversion and elevated US Treasury yields weighed on the GBP
Wall Street’s preparing to finish the day with losses as high US Treasury yields weigh on stocks. Also, underpin the greenback, as the US Dollar Index records gains of 0.18%, sitting at 102.517. In the bond market, the US 10-year T-note rate is rising five basis points, sitting at 3.029%. So, the leading causes of the GBP falling are those mentioned above, alongside UK’s ongoing economic slowdown, as the Bank of England (BoE) gets ready for another rate hike, despite the stagflation scenario.
On Wednesday, the GBP/USD achieved to open near the session’s highs, at 1.2597. Nevertheless, since the beginning of the trading day, the pound dipped towards the daily lows at around 1.2513, followed by a jump towards the 200-hour simple moving average (SMA) at 1.2565. Late in the New York session, cable settled at around the daily pivot, 1.2540s.
In the meantime, the OECD slashed the global economic outlook for 2022 and 2023. The organization expects the worldwide economy to grow 3.0% YoY in 2022, lower than the 4.5% estimated. Previous expectations were at 3.2% for 2023, though the OECD expects growth to hit 2.8% yearly.
The UK economic docket will feature no tier 1 economic data in the week ahead. Contrarily, the US calendar will unveil Initial Jobless Claims, the consumer inflation report, and the UoM consumer sentiment.
GBP/USD Price Forecast: Technical outlook
Despite the ongoing correction, which lifted the major from year-to-date lows at 1.2155 towards 1.2670s, the Sterling remains neutral-downward biased. Further confirming the previously mentioned is the Relative Strenght Index (RSI), at 48.76, even though in bearish territory, lacks the impetus to drag the GBP/USD lower.
In the near term, the GBP/USD’s first resistance would be the 50-day moving average (DMA) at 1.2675. On the other hand, the GBP/USD’s first demand zone would be 1.2500, followed by the June 7 swing low at 1.2430, followed by the 1.2400 figure.
- EUR/USD bulls are being beaten back as US yields pop.
- The focus will soon turn back to the ECB.
At 1.0720, EUR/USD is 0.2% higher on the day so far. The price has travelled up from a low of 1.0671 to reach a high of 1.0748 so far. However, the bears are moving in following the US 10-year auction that hit a high yield of 3.03% on Wednesday, up from the 2.943% high in the previous auction.
We have seen a subsequent rally in US yields and the 10-year now stands 1.54% higher on the day, supporting the greenback ahead of key macro events later this week. These will include the European Central Bank tomorrow, Thursday, and US inflation data Friday.
Meanwhile, the US dollar has caught a bid on the auction and rising yield, and the DXY index that measures the greenback vs.a basket of major rivals is currently up 0.17% to 102.50. The DXY has been trading between the lows and highs of the day, 102.269/102.776. US equities are also sinking in midday trade which tends to favour the greenback as follows:
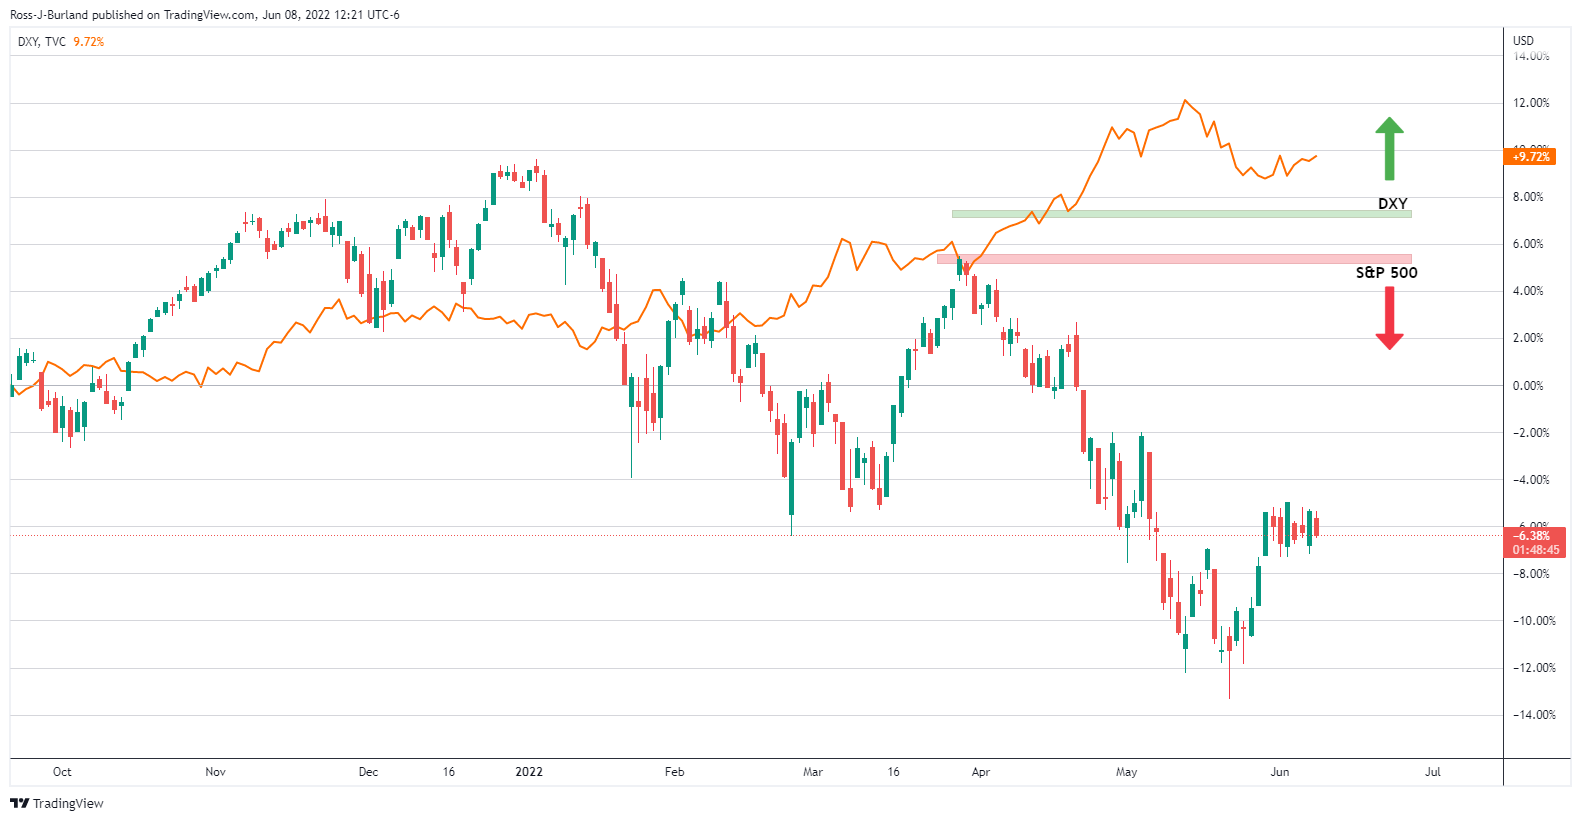
(S&P 500 vs DXY daily chart)
ECB in focus
In a strongly-foreshadowed decision, analysts at TD Securities expect ''the ECB to announce that the APP will end within weeks, and send a strong signal that rate hikes are coming in July and September (October remains a more interesting meeting in this sense). Forecasts will show stronger inflation and weaker growth, highlighting the ECB's challenge going forward.''
Meanwhile, analysts at ABN Amro said ''we expect economic growth to slow considerably to clearly below trend rates from early next year. The economy has a number of cushions in the near term, such as continued post-Covid recovery in the services sector, significant household excess savings and unsatisfied demand for everything from industrial orders to employees.''
''However, these cushions will likely deflate next year, just as the impact of monetary tightening in the eurozone and globally feeds through. At the same time, the policy rate by then would be closer to more normal levels.''
As for trading the ECB, the analysts at TD Securities said ''unless Lagarde commits to a series of 50s, EUR/USD has limited room to gain, particularly with the euribor curve trading where it is and US CPI due the next day. Risk/reward more favourable for EURUSD to trade lower. Long-term inflation forecast will be key.''
- USD/CAD correcting the latest thrust to the downside from the channel lows.
- Bears are otherwise seeking to mitigate until 1.2458 which could be exploited.
At 1.2552, USD/CAD is higher by some 0.2% at the time of writing, recovering from fresh cycle lows posted earlier in the day of 1.2517 as the US dollar emerges as the top performer again vs commodity-FX for the US session so far.
DXY is up 0.17% to 102.50, trading between the lows and highs of the day, 102.269/102.776. US equities are sinking in midday trade and the US 1-year auction hit a high yield of 3.03% on Wednesday, up from the 2.943% high in the previous auction. We have seen a subsequent rally in US yields and the 10-year now stands 1.54% higher on the day, supporting the greenback ahead of key macro events, that include the European Central Bank, US inflation data Friday and Canadian central bank updates and jobs data.
Canada's employment report for May could help guide expectations for the pace of Bank of Canada interest rate hikes. However, the main focus will very much stay with this theme for the end of the week with the BoC's Financial Stability Report which is expected to shine a light on risks and vulnerabilities to the financial system. Analysts at TD Securities said that they ''do not expect any implications for the near-term policy outlook.''
''We will be watching for any new detail on high-leverage borrowers or mortgage delinquencies, but expect an overall message that the financial system remains resilient amid a rising interest rate environment.''
We'll also hear from Governor Macklem on Thursday. Last week, the BoC hiked its benchmark rate by half a percentage point for a second straight time to tackle soaring inflation. in this regard, Reuters reported that ''prices in Canada are rising at their quickest pace in 31 years, but that is not yet feeding into a wage spiral, Canada's budgetary watchdog said on Tuesday, with inflation still expected to return to target in coming years.''
USD/CAD technical analysis
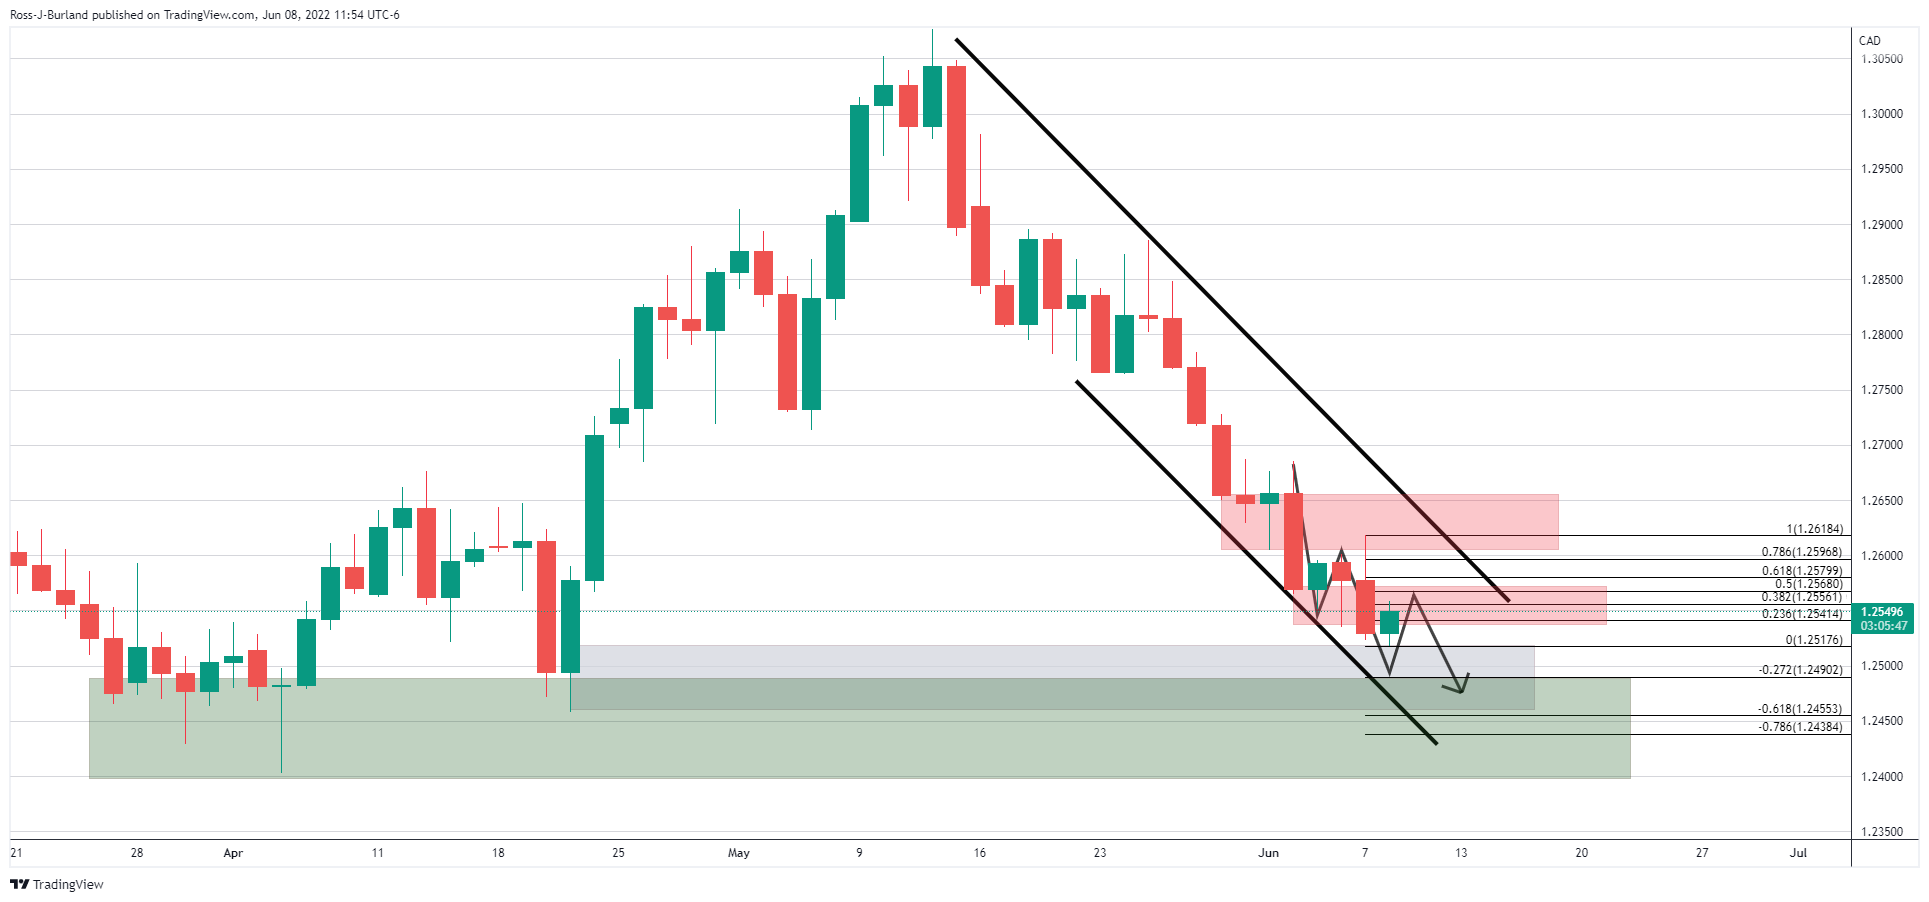
The price is correcting the latest thrust to the downside from the channel lows. However, there is still a price imbalance that the bears are seeking to mitigate until April 21 lows, 1.2458, which could be exploited. With that being said, the price is headed towards a long term support area. Should the bulls commit to the correction, a break of resistance and if the 61.8% Fibonacci fails to draw in supply, then there will be prospects of a deeper correction towards 1.26 the figure and possibly beyond.
- The Australian dollar extends its losses vs. the greenback, down by 0.12%.
- The RBA’s unexpected 0.50% rate hike lifted the major; a negative sentiment erased the AUD/USD gains.
- Investors’ focus turns to the US CPI and UoM Consumer Sentiment data.
- AUD/USD Price Forecast: A daily close below 0.7200 might send the pair tumbling towards 0.7100.
The AUD/USD trims some of its Tuesday’s gains after the Reserve Bank of Australia (RBA) surprisingly hiked rates by 50 bps. Nevertheless, investors’ negative sentiment is weighing on high beta currencies, like the Australian dollar, with the major drifting below the 100-day moving average (DMA). At 0.7199, the AUD/USD is 30 pips short of the latter in the North American session.
The Australian dollar edges down despite RBA’s rate hike
Recapping the RBA decision, the central bank said that inflation is higher than expected, that the labor market is tight, and that the economy is solid. According to the RBA, it was necessary to reduce the monetary stimulus introduced when the Covid-19 global pandemic hit and emphasized the need for additional rate increases over the following months.
Analysts at Commerzbank wrote that the “RBA’s restrictive approach should support AUD, but as long as the economic development in China remains unclear, AUD gains are likely to remain limited.”
In the meantime, European equities ended Wednesday’s session with losses, while US equities remain in the red. Higher US Treasury yields weigh on stocks and underpin the greenback. The US 10-year Treasury yield sits at 3.007%, up almost three basis points, while the US Dollar Index, a measure of the buck’s value against a basket of rivals, edges up by 0.10%, at 102.436.
The factors mentioned above weighed on the AUD/USD, which failed to sustain the rally provided by the RBA’s hike. On Wednesday, the AUD/USD retreated from daily highs at around 0.7234 and is back below the 0.7200 figure, a reflection of a risk-off mood.
Elsewhere, the OECD is the following international organization that shrank the expectations for a higher global economic growth rate. By 2022, the OECD estimates growth at 3.0%, lower than the 4.5% estimated, and by 2023, it will hit 2.8% YoY, less than the 3.2% foreseen.
In the week ahead, the US calendar will feature Initial Jobless Claims for the week ending on June 4, followed by consumer inflation data, alongside the University of Michigan’s Consumer Sentiment.
AUD/USD Price Forecast: Technical outlook
During the day, the AUD/USD broke below the 100-DMA at 0.7228 and edged towards the 50-DMA at 0.7208. At the time of writing, selling pressure on the AUD/USD tumbled the pair below 0.7200. At the same time, the Relative Strength Index (RSI) is aiming downwards, and albeit in a bullish territory at 54.28, its slope signals weak demand on the pair.
Therefore, the AUD/USD would resume its downtrend. That said, the major’s first support would be the June 7 low at 0.7157. Break below would expose the June 2 daily low at 0.7140, followed by the May 27 daily low at 0.7089.
US dollar strength will continue over the remainder of 2022 and over the course of 2023 according to analysts at Wells Fargo. They point out that despite more aggressive monetary tightening from central banks across the world, they believe the Federal Reserve will lead tightening and will continue to push the dollar higher against G10 and emerging market currencies.
Key Quotes:
“Slower global growth underpins our view for a stronger U.S. dollar over the second half of this year and into 2023. In our view, declining growth prospects should attract capital flows to dollar-denominated assets, given the dollar's safe-haven qualities. But, perhaps more inspiring for the dollar's prospects is a hawkish Federal Reserve and the outlook for tighter Fed monetary policy.”
“As of now, we forecast more Fed tightening than financial markets have priced and for most foreign central banks to lag behind the Fed. While the ECB should begin raising interest rates in July and major central banks, such as the Reserve Bank of Australia, become more hawkish, the combination of higher U.S. rates and a smaller Fed balance sheet should result in dollar strength against most G10 currencies.”
“Emerging market currencies are likely to be the most sensitive against this backdrop. We expect emerging market currencies, particularly in Latin America, to weaken over the foreseeable future as growth concerns build and political risk weighs on sentiment.”
Analysts at Rabobank expect the USD/JPY pair to remain around current levels on a one to three month view. They consider the pair could pullback toward 130 around year end.
Key Quotes:
“It can be inferred that if and when wages and prices do rise the BoJ will be able to change the tone of monetary policy. Meanwhile the BoJ is maintaining extremely accommodative policy suggesting that USD/JPY remains exposed to the interest rate differentials between treasuries and JGBs.”
“Although we expect USD/JPY to remain elevated around current levels on a 1 to 3 month view we see scope for USD/JPY to edge back to 130 around year end.”
“Japan’s history of weak wage inflation and the low acceptance of price rises in the country mean that Kuroda’s hopes of hitting the 2% CPI inflation target in a sustainable way are by no way guaranteed. If it is assumed that BoJ policies remain accommodative USD/JPY may be at risk of further gains. Softer yields in the US may be necessary to bring the currency pair down to lower levels.”
- The USD/CHF is registering gains of 1.33% during the week.
- Fragile market sentiment keeps investors flowing towards and outwards of safe-haven peers, like the US dollar.
- USD/CHF Price Forecast: Range-bound in a 30 pip range, at around 0.9735-65 area.
The USD/CHF climbs for the fourth consecutive day but retraces from weekly highs around 0.9780s, though it remains up by 0.30%. At the time of writing, the USD/CHF is trading at 0.9751.
Factors like a dismal market mood boost appetite for the greenback. Reflecting the previously mentioned are European and US equities, falling except for the Nasdaq 100, undermined by rising global bond yields. The US 10-year Treasury yield climbs three and a half basis points above 3.014%.
The US Dollar Index, which measures the buck’s performance vs. a basket of six currencies, remains flat during the day at 102.336.
USD/CHF Price Forecast: Technical outlook
The USD/CHF remains upward biased after the 500 pip pullback from YTD highs at 1.0007, which bounced short of the 61.8% Fibonacci retracement at 0.9532. However, in the last couple of trading days, USD/CHF traders, unable to break above the May 20 high at 0.9764, would keep the USD/CHF in a 30-pip narrow range, with the 38.2% Fibonacci retracement at 0.9735 on the bottom, and 0.9764 on top.
Upwards, the USD/CHF first resistance would be 0.9764, the top of the range. Break above would expose the major to further upward pressure and send it towards the 23..6% Fibonacci retracement at 0.9861. Once cleared, a test of the YTD high at 1.0007 is on the cards. Otherwise, the USD/CHF first support would be the psychological 0.9700 figure. A breach of the latter would expose the 50% Fibonacci retracement at 0.9633, followed by the 50-day moving average (DMA) at 0.9621.
Key Technical Levels
- Gold gains momentum despite higher yields.
- XAU/USD remains sideways, looking at the $1860 resistance.
The US dollar pulled back during the American session boosting XAU/USD that climbed to $1859.70, reaching the highest level in three days. The yellow metal is facing resistance around the $1860 area.
Dollar down, gold slightly higher
On a quiet session, the DXY turned negative in American hours, sliding back to the 102.30 area. US yields are modestly higher with the 10-year at 3.01% and the 30-year at 3.16%. Also Eurozone yields are higher ahead of the European Central Bank meeting on Thursday.
Despite the move in yields, gold is rising although gains seem limited for the moment while unable to break above $1860. A break above would expose the strong barrier of $1870. The following resistance is the $1890 area, a horizontal level and also the confluence of the 55 and 100-day Simple Moving Averages.
If price fails to rise above $1860, a retreat back to the $1850 area seems likely. The immediate support might be seen at $1840 followed by the weekly low at $1836 and then $1827 (June 1 low).
On a wider perspective, XAU/USD continues to move sideways between $1835 and $1870. During the next sessions volatility could pick up considering the ECB meeting on Thursday, US inflation data on Friday, and the FOMC meeting next week.
Technical levels
- Euro rises across the board as EZ yields move higher.
- ECB meeting on Thursday likely to trigger volatility.
- EUR/GBP sideways, without a clear direction.
The EUR/GBP is rising on Wednesday, on the back of a stronger euro across the board. The cross rose from under 0.8500 and peaked at 0.8563. It then pulled back finding support at 0.8550.
The euro gained momentum as German bond yields rose above 1.35% for the first time since 2014. The move takes place ahead of the European Central Bank on Thursday. The central bank is expected to announce the end of the purchase program and to suggest rate hikes at the next meetings.
Analysts at Brown Brothers Harriman point out ECB tightening expectations have picked up ahead of Thursday’s decision. “WIRP suggests liftoff July 21 remains fully priced in. However, markets are now pricing in a potential 50 bp move at either the September 8 or October 27 meetings, followed by a 25 bp hike December 15 that would take the policy rate to 0.75% by year-end, up from 0.5% previously.”
The ECB meeting, the political drama in the UK and a plan from PM Johnson to rewrite parts of the Brexit, warrant volatility ahead for the EUR/GBP cross over the next sessions.
Above 0.8500, below 0.8600
The EUR/GBP is moving in a wide range since late May, finding resistance below 0.8600 and being rejected from under 0.8500. A daily close clearly above 0.8600 should open the doors to more gains, initially to test May’s high at 0.8618. On the flip side, a consolidation below 0.8500 would weaken the euro, leaving the cross vulnerable to a decline to 0.8400.
Technical levels
- Silver is trading positive during the week, up by 1.12%.
- On Wednesday, high US Treasury yields and a solid greenback weigh on silver
- Silver Price Forecast (XAG/USD): Remains range-bound, trading between $21.28-$22.50 in the last month.
Silver (XAG/USD) slides from June 7 highs at around $22.28, courtesy of higher US Treasury yields and a steady greenback amidst a risk-off market mood, which has investors scrambling to safe-haven assets, but the precious metals complex. At $22.18, XAG/USD grinds lower by 0.39% at the time of writing.
Higher US Treasury yields and a solid greenback weigh on silver
The US Dollar Index, a gauge of the buck’s value vs. a basket of its rivals, is almost flat in the day, though slightly positive, at 102.342, recovering from earlier losses that dragged prices towards 102.269. The US 10-year benchmark note rate sits at 3%, gaining two-basis points, a headwind for silver prices.
European and US equities are falling, reflecting a dismal sentiment, weighed by rising bond yields. Investors assess global central banks tightening monetary conditions. As of Thursday, the European Central Bank (ECB) will be the next in line; though it is expected to hold rates unchanged, an announcement of the end of the APP can lay the ground for the first-rate hike in the July meeting.
Elsewhere, the OECD is the following international organization that shrank the expectations for a higher global economic growth rate. By 2022, the OECD estimates growth at 3.0%, lower than the 4.5% estimated, and by 2023, it will hit 2.8% YoY, less than the 3.2% foreseen.
In the meantime, XAG/USD prices remain on the defensive after opening above $22.20. As soon as Wednesday’s Asian session kicked in, prices fell, though the non-yielding metal reclaimed $22.00 after reaching a daily low near $21.80.
In the week ahead, the US calendar will feature Initial Jobless Claims for the week ending on June 4, followed by consumer inflation data, alongside the University of Michigan’s Consumer Sentiment.
Silver Price Forecast (XAG/USD): Technical outlook
XAG/USD remains ina a choppy trading range since May 19. Pressured by a fragile mood and elevated US Treasury yields, silver traders could not break above/below the $21.28-$22.50 range. The Relative Strength Index (RSI) at 48.63 is trendless, portraying silver’s price behavior.
Upwards the XAG/USD’s first resistance would be the June 6, high at $22.51. Break above would expose the 50-day moving average (DMA) at $23.08, followed by the May 5 swing high at $23.28. On the flip side, the XAG/USD’s first support would be $22.00. Once cleared, the following demand area would be the June 1 swing low at $21.43, followed by the May 19 low at $21.28.
- WTI has recovered back above $120 after the latest US EIA inventory report showed gasoline stocks falling unexpectedly.
- Prices remain well supported against the backdrop of strong and rising demand plus OPEC+/Russia supply woes.
- Bulls will continue to target a test of $130 for the weeks ahead.
Despite just-released weekly US EIA crude oil inventory data confirming that, as Tuesday’s Private weekly API inventory report had implied, headlines US crude oil stocks rose unexpectedly last week, the data still showed a decline in gasoline inventories, suggesting demand in the US remains robust. This helped front-month WTI futures move back from close to session lows in the mid-$119s per barrel back to the low-$120s, leaving prices not far below the multi-month peaks they hit earlier in the session in the low-$121s.
Traders also cited reports of a potential halt to production in Norway amid threats of strike action amongst oil workers there as offering some modest support. Crude oil prices have been trading with an upwards trajectory in recent sessions and weeks, with demand in North America and Europe rising as peak summer driving season hits and in China as Beijing and Shanghai reopen with Covid-19 now seemingly under control there. Against the backdrop of strong and recovering demand, global oil markets are very tight right now.
Reuters reported on Wednesday that refinery margins for diesel are at record highs in Asia and most global refineries are running at close to full capacity, as Russian exports of refined products falls amid Western sanctions over its war in Ukraine. Analysts view OPEC+’s decision last week to increase output quotas by 648K barrels per day in July and August as insufficient to make up for the loss of Russian output this summer, given that these output hikes were evenly spread across OPEC+ producers, many of whom aren’t able to actually increase output.
“Unless new Middle East capacity comes online more quickly than we expect or China decides to lift its products export caps, the shortage of (refined) products will only get worse as demand for transport fuels picks up during the northern hemisphere summer,” JP Morgan said in a note on Wednesday. Separately, the CEO of Trafigura said that oil could hit $150 this year against the current backdrop.
Give all of the above, it seems more likely than not that WTI continues its recent upwards trajectory that has seen it rally more than $16 per barrel since the start of May. Oil bulls will continue to target a test of March’s near $130 highs in the coming weeks.
GBP/USD is offered after choppy price action to test 1.26 on Tuesday. While below the 1.26 level, the cable remains vulnerable, economists at Scotiabank report.
Initial support aligns at the 1.25 figure zone
“GBP price action has been choppy since the start of the month but generally confined to 1.26 on the top and the high 1.24s on the bottom – aside from yesterday’s low of 1.2431.”
“The pound plumbing new lows since its May rally yesterday and lengthy sideways trading point to weakness ahead – especially if the GBP again fails at making a push above 1.26.”
“Support is the 1.25 figure zone followed ~1.2480 and yesterday’s low.”
The European Central Bank (ECB) will announce its decision on monetary policy on Thursday, June 9 at 11:45 GMT and as we get closer to the release time, here are the expectations as forecast by the economists and researchers of eight major banks.
The ECB is set to announce the end of its QE program and keep key rates unchanged while hinting at a July lift-off. In the opinion of FXStreet’s Yohay Elam, the ECB will most likely opt for what it already signaled – a 25 bps hike in July.
SocGen
“The June ECB meeting should align with the views we’ve heard over the past month, signalling an end to net APP purchases by early July (or end June) and a rate hike in July. We wonder though: if there was sufficient conviction to signal rate hikes already in early May, why not end QE and raise rates in June? With inflation expectations above 2.2% since early March and market rate expectations well-ahead, why the foot-dragging? Clearly, forward guidance is a difficult habit to shake, reflecting fears of adverse market reactions, but it now seems to be a hindrance to data-dependency and timely action. With the PMIs holding up well in May and inflation next week expected to break new records (7.9%), the outlook may soon demand more action. A discussion on 50bp hikes and QT, for which there is a clear need for early signalling, seems all but premature. The risk of lasting indirect and second-round inflation effects is now so high that it threatens to de-anchor inflation expectations and the ECB’s credibility. This holds true even if growth turns out weaker than expected over the coming quarters. Allowing a gradual reduction in the APP reinvestments could thus help anchor expectations and reduce the need for steeper rate hikes. We expect little help from the upcoming bank TLTRO repayments (around €200bn in June and €450bn over the coming year) and believe a new (limited) TLTRO will be needed in 2023 to smoothen the run-down. A too reactive ECB thus risks higher inflation expectations and more aggressive rate hikes later.”
Deutsche Bank
“Our previous baseline was to expect back-to-back 25 bp hikes from July. We now expect one of the two hikes in Q3 to be a 50 bp hike – September is more likely than July. Hikes of 25 bp in July and 50 bp in September mean the deposit rate will rise above zero in three months. We believe the ECB is continuing to underestimate inflation and we expect support for a 50 bp hike will increase as the summer progresses. On 9 June, we expect the ECB to confirm that APP net purchases will cease at the end of June. Other issues: (1) staff forecasts: inflation to rise to 2% in 2024, satisfying the liftoff criteria; (2) rates guidance: expect the three liftoff conditions to be replaced with language similar to Lagarde's normalisation blog; and (3) TLTRO: expiry of TLTRO discount to be confirmed and ECB to pledge smooth transmission of the hiking cycle through the banking system.”
Nordea
“The ECB is set to confirm that it plans to end asset purchases very early in July and hike rates by 25 bp later that month. While the door is not totally shut for a 50 bp move in July, it would be quite surprising for the ECB to start its hiking cycle with such a big step, especially as Lagarde recently signalled the ECB’s first moves would take place gradually. Given the ECB’s gradual shift towards a more hawkish stance and the market’s receptiveness to such comments, we see risks tilted towards a hawkish interpretation of the ECB’s message, i.e. higher rates and a stronger EUR. The ECB staff forecasts are set to show clear downward revisions to GDP growth but see core inflation above the target also longer out.”
TDS
“We expect the ECB to announce that the APP will end within weeks, and send a strong signal that rate hikes are coming in July and September. Forecasts will show stronger inflation and weaker growth, highlighting the ECB's challenge going forward. With the Euribor curve already reflecting the ECB's most likely scenario for tightening, scope for EUR/USD gains remain limited from here.”
Danske Bank
“This ECB meeting is set to be the formal end of ECB net asset purchases and a clear signal to hike rates in July, although without specific guidance of the size of the first-rate hike. We expect ECB net purchases to end on 1 July, thereby in line with previous guidance for Q3. With inflation pressures continuing to build and the economic backdrop still supported by services, we do not expect the inflation problem to solve itself in the near future. On the other hand, inflation expectations should gradually decline to the 2% mark in late 2024/early 2025, which leaves a narrow window for ECB to hike between now and the coming 12M. Market focus will be on the discussion if a 50bp hike is possible, and if so when, as well as any hints about tools that ECB may take to address fragmentation. We expect ECB to hike 25 bp each meeting until Mar23, but risks are clearly skewed for a 50 bp rate hike in H2 this year (July or Sep most likely).”
Commerzbank
“The ECB Council is expected to decide to end its net asset purchases at the beginning of the third quarter. We also expect it to signal the end of the negative deposit rate by September.”
Rabobank
“A further deterioration of the inflation outlook warrants immediate action, while recent data on the economy remain solid enough to facilitate some tightening. Inflation data have increased the odds of a 50 bp hike. We believe it is unlikely to become the ECB’s base case already, but we would not want to position against this risk. If the ECB does go for a 50 bp hike, we prefer July over September or later. We expect the ECB to terminate APP this month, with zero net purchases from July. Sequencing prevents hiking policy rates this month, but July is all but a done deal. We expect the ECB to confirm that the TLTRO-III discount will not be extended after June. The ECB is not in a hurry to drain liquidity from the system.”
BofA
“We expect the ECB to leave the door open to 50bp in July and September by signalling that negative rates will end during the third quarter (rather than at the end of the third quarter). We have recently changed our ECB call and now expect a total of 150bp throughout 2022. For now, while we reassess our growth forecast and wait for this week's meeting, we think they are likely to be stopped out in 2023. Being forced by persistent inflation surprises, we expect the ECB to begin its hawkish pivot with the end of QE this week and the first hike, possibly by 50bp, in July. We expect this pivot to start supporting the EUR, but we are also cautious as a number of things still weigh on the currency. Assuming our call turns out right, any EUR strength should be temporary.”
EUR/USD has oscillated around the 1.07 level since the start of the month. A disappointing European Central Bank (ECB) decision at its meeting on Thursday could pave the way for a fall below 1.06 during the week ahead, economists at Scotiabank report.
Lagarde unlikely to fan the flames of 50 bps hike bets
“The bloc’s economy expanded by 0.6% QoQ, double the initial estimate, lifting Eurozone yields ahead of tomorrow’s ECB decision. Implied pricing for the bank’s Sep meeting rose by 5bps to near 75bps – implying nearly a full 50bps hike at one of the Jul or Sep meetings.”
“We think Lagarde is unlikely to fan the flames of 50 bps hike bets as the ECB sticks to a gradual forward guidance approach.”
“A disappointing ECB decision, a US inflation beat, and a hawkish Fed next week could combine to pull the EUR firmly below 1.06 in the space of a week.”
Uncertainty about the Bank of England ‘s (BoE's) future course is hig. Economists at Commerbank expect the “Old Lady” to disappoint market expectations. Thus, EUR/GBP is set to trend higher until the end of the year.
Market expectations could be disappointed
“The BoE is continuing its gradual tightening of monetary policy. However, it is likely to act less restrictively than expected by the market. The pound should suffer increasingly from this.”
“Another factor weighing on the pound is that the ECB is also likely to start its monetary policy U-turn in July. We therefore see EUR/GBP higher until the end of the year.”
“Next year, we see scope for lower levels in EUR/GBP because the BoE is likely to continue its rate hike cycle somewhat longer than the ECB.”
- USD/CAD witnessed fresh selling on Wednesday and dropped to its lowest level since April 21.
- Bullish oil prices underpinned the loonie and acted as a headwind amid a modest USD pullback.
- Sustained weakness below the 1.2500 mark would pave the way for additional near-term losses.
The USD/CAD pair struggled to preserve its modest intraday recovery gains and met with a fresh supply near the 1.2560 area on Wednesday. The intraday downfall dragged spot prices to the lowest level since April 21, around the 1.2520 region during the early North American session.
Despite rising US Treasury bond yields and the prevalent cautious mood, the safe-haven US dollar failed to capitalize on its early move up amid a goodish pickup in demand for the shared currency. Apart from this, bullish crude oil prices underpinned the commodity-linked loonie and exerted some downward pressure on the USD/CAD pair.
From a technical perspective, last week's sustained break below the very important 200-day SMA was seen as a fresh trigger for bearish traders. Moreover, the USD/CAD pair's inability to gain any meaningful traction and the emergence of fresh selling at higher levels supports prospects for an extension of a near one-month-old bearish trend.
Some follow-through selling below the 1.2500 psychological mark will reaffirm the negative bias and drag the USD/CAD pair to the next relevant support near the 1.2450 region. The downward trajectory could further get extended and allow bearish traders to challenge the YTD low, around the 1.2400 mark touched on April 5.
On the flip side, the 1.2560 region, or the daily swing high, now seems to have emerged as an immediate hurdle. Any subsequent move up might now be seen as a selling opportunity near the 1.2600 mark. This, in turn, should cap the upside for the USD/CAD pair near the 200-DMA support breakpoint, currently around the 1.2660 area.
USD/CAD daily chart
-637902937299939190.png)
Key levels to watch
- Gold Price reversed an intraday dip to the $1,845 area amid the prevalent cautious mood.
- Expectations for more aggressive central banks and a stronger USD should cap the upside.
- The market focus remains glued to the ECB meeting on Thursday and the US CPI on Friday.
Gold Price struggled to capitalize on the previous day's goodish bounce from the $1,837 area - levels just below the very important 200-day SMA - and edged lower on Wednesday. The early downtick, however, was bought into near the $1,845 region amid the prevalent cautious mood, which tends to benefit the traditional safe-haven precious metal. The XAUUSD was last seen trading just above the $1,850 level, nearly unchanged for the day heading into the North American session.
Gold Price benefits from worsening global economic outlook
The market sentiment remains fragile amid concerns that a more aggressive move by major central banks to constrain inflation could pose challenges to global economic growth. Adding to this, the World Bank slashed its 2022 global growth forecast on Tuesday to 2.9% and tempered investors' appetite for perceived riskier assets. This was evident from a generally weaker tone around the equity markets, which could drive some haven flow towards the XAUUSD. Despite the supporting factors, any meaningful upside still seems elusive, warranting caution before placing aggressive bullish bets.
Also read: Gold Price Forecast: Bull-bear tug-of-war around $1,850 extends, all eyes on US inflation.
Rate hike bets, stronger US dollar to cap Gold Price
Investors remain concerned that the global supply chain disruption caused by the Russia-Ukraine war could push consumer prices even higher. This might force the Federal Reserve to tighten its monetary policy at a faster pace, which, in turn, could trigger a fresh leg up in the US Treasury bond yields. In fact, the yield on the benchmark 10-year US government bond has shot back above the 3.0% threshold and helped revive the USD demand. The European Central Bank (ECB) is also expected to join its global peers and hike interest rates to tamp down inflation. This might further contribute to capping the non-yielding yellow metal ahead of the key ECB monetary policy meeting on Thursday and the US consumer inflation figures on Friday.
Rising inflation fuels rate hike bets
Previewing the upcoming US Consumer Price Index (CPI) data, "there are signs of easing price pressures," FXStreet Analyst Yohay Elam said. "Most importantly, wages advanced by only 0.3% in both April and May, a total of 0.6%, while expectations imply an accumulated gain of 1.1% in Core CPI. Such a mismatch cannot be ruled out, but seems unlikely." In case inflation figures come in softer than expected, investors could see that as a development that could allow the Fed to pause rate hikes in September. In that scenario, US T-bond yields could retreat and help gold gain traction.
Gold Price technical outlook
Gold Price, so far, has managed to defend a technically significant 200-day SMA support, which is currently pegged near the $1,842-$1,841 region. This area should now act as a pivotal point, which if broken decisively could drag the XAUUSD towards the $1,830 intermediate support en-route to the $1,810-$1,808 area and the $1,800 round-figure mark.
On the flip side, momentum beyond the $1,857-$1,857 region is likely to confront resistance near the $1,870 supply zone. Sustained strength beyond would negate any near-term bearish bias and lift the XAUUSD to the next relevant hurdle near the $1,885-$1,886 area. The momentum could further get extended and allow bulls to aim back to reclaim the $1,900 mark for the first time since early May.
-637902916840739663.png)
Gold Price could be headed lower
- EUR/USD adds to Tuesday’s small gains and flirts with 1.0750.
- Extra upside looks likely on a breakout of 1.0750.
EUR/USD’s recovery picks up extra pace and challenges the 1.0750 region on Wednesday.
If the rebound surpasses the 4-month resistance line near 1.0750, the downside pressure is expected to lose traction and allow for the continuation of the move to the may high at 1.0786 (May 30). Up from here comes the weekly high at 1.0936 (April 21), an area reinforced by the 100-day SMA.
In the longer run, the pair’s bearish view is expected to prevail as long as it trades below the 200-day SMA at 1.1215.
EUR/USD daily chart
- USD/JPY hit fresh multi-decade highs near 134.50 but has since backed off towards 134.00.
- But the pair is still over 1.0% higher on the day with BoJ dovishness and rising global yields in focus.
- The pair is now up around 4.5% on the month and over 6.0% since late May lows in the 126s.
USD/JPY extended on its Asia Pacific/early European session gains in the lead up to the US open, printing fresh multi-decade highs just below 134.50 in the process. Analysts have been citing the BoJ’s persistently dovish stance relative to its increasingly hawkish G10 peers, with the ECB the latest major bank to shift in recent weeks towards signaling a series of rate hikes, as weighing on the yen on Wednesday, as well as upside in global yields.
The BoJ’s policy of capping 10-year Japanese yields at no more than 25 bps above zero means that the yen is sensitive to rate differentials, hence, Wednesday’s bounce in US 10-year yields back above 3.0% is lifting USD/JPY. However, since the US open, the pair has fallen back slightly to just above the 134 level, where it continues to hold onto gains of around 1.2% on the day.
That takes the pair’s gains on the week to over 2.5%, since the start of the month to nearly 4.5% and since last month’s sub-126.50 lows printed on 24 May to the north of 6.0%. Many traders will be skeptical as to how much further the latest rally has to run and will be feeling increasingly reluctant to keep chasing the pair higher.
If Friday’s US Consumer Price Inflation data shows an easing of US price pressures and results in some buck weakness as markets pare back on Fed tightening bets, profit-taking could see USD/JPY swiftly drop back to support in the low 131s. But so long as the BoJ refuses to budge from its ultra-dovish policy stance, the outlook for sustained yen strength isn’t great.
On Wednesday, the BoJ’s Governor pushed back against the idea that the central bank should do something about yen weakness. He told the Japanese parliament that FX policy was not the authority of the BoJ and said that a weaker yen would be positive for the economy, so long as moves lower are gradual.
Lee Sue Ann, Economist at UOB Group, assesses the latest RBA event.
Key Takeaways
“The Reserve Bank of Australia (RBA) announced a bigger-than-expected increase in the cash rate target by 50bps to 0.85%. It also increased the interest rate on Exchange Settlement balances by 50bps to 0.75%. Once again, the RBA cited strong inflationary pressures and a resilient economy.”
“The RBA has now embarked on a more aggressive front-loading hiking cycle. Today’s move more than fully unwinds the emergency rate cuts that took place in 2020 amid the COVID-19 pandemic, and it is also the first rate hike under new Prime Minister Anthony Albanese.”
“We continue to expect a series of rate hikes over the coming months. We now see the RBA hiking by another 90bps in the remainder of 2022 to bring the cash rate target to 1.75% by year-end (compared to 1.25% previously), before continuing to rise more gradually over 2023. We retain the same peak of 2.50%, but now expect this to be reached sooner (around mid-2023) than previously forecast (around end-2023).”
- GBP/USD fell back to the mid-1.2500s but remains well within recent ranges as last week’s lows/the 21DMA offer support.
- UK PM Johnson’s no-confidence vote survival has been a key talking point this week, but hasn’t impacted sterling much.
- Currency markets are likely to remain subdued pre-US CPI on Friday.
Broad US dollar strength amid a rise in yields state-side has seen GBP/USD pull back to the 1.2550 are on Wednesday, where the pair is trading lower by about 0.3% on the day. However, the pair continues to trade nearly 1.0% higher versus the multi-week lows it posted on Tuesday in the 1.2430 area and is currently about 0.5% higher on the week.
Support in the form of last week’s lows in the mid-1.2400s and the 21-Day Moving Average in the 1.2480s has supported GBP/USD well so far this week and kept the pair trading well within recent ranges. Though UK politics has been a big talking point, with UK PM Boris Johnson surviving a Conservative Party vote of no-confidence on Monday, it does not seem to have shifted the dial much for the pair.
Though he held on to his position as party leader and PM, Johnson’s authority has arguably been weakened by a larger than expected rebellion by his MPs. Some FX analysts have said this might be a positive for sterling if recent events encourage the PM to bring forward tax cuts/increase fiscal stimulus, as this could modestly boost the weakening outlook for the UK economy.
UK households are facing the worst cost-of-living squeeze in more than a generation, with the government announcing back in May that support this year for low-income households would be increased to the tune of over £30 billion. Further stimulus measures might encourage the BoE to revise higher their very pessimistic growth forecasts for this year and next, thus encouraging a little more monetary tightening.
In the meantime, GBP/USD looks set to continue ranging between the mid-1.2400s to 1.2600 area as traders await the release of US Consumer Price Inflation (CPI) figures on Friday. If that data shows a further easing of US price pressures in May, then this could result in some paring back of Fed tightening bets and could perhaps help the pair test 1.2600 once again.
- DXY trades in a volatile fashion around 102.40/50 on Wednesday.
- So far, gains remain capped by the weekly high near 102.80.
DXY keeps the erratic performance above the 102.00 mark so far this week.
Considering the ongoing price action, further consolidation should not be ruled out, while occasional bullish attempts appear limited by the weekly highs in the 102.80/85 band. A Fibo level (of the mid May-late May sell-off) at 102.71 also underpins this region.
As long as the 3-month line around 101.15 holds the downside, the near-term outlook for the index should remain constructive.
Looking at the longer run, the outlook for the dollar is seen bullish while above the 200-day SMA at 97.13.
DXY daily chart
Economist at UOB Group Lee Sue Ann suggests the ECB will refrain from acting on rates at the June 9 event.
Key Takeaways
“There is an increasing sense of urgency among the hawks within the ECB’s governing council as surging inflation warrant higher interest rates in the Eurozone.”
“We might see the start of policy normalization as early as Jul, though the process will be gradual. We will be revising our forecasts following the ECB meeting in Jun.”
S&P 500 remains above support from its recent price gap and near-term range lows at 4077/57. Thus, economists at Credit Suisse continue to look for a deeper recovery with resistance seen at the 38.2% retracement of the 2022 fall at 4195, then the 63-day average at 4263.
Near-term support moves to 4138/33
“We remain biased to a deeper corrective recovery/consolidation. Above the near-term range high at 4178 is needed to add weight to our view for a test of the 38.2% retracement of the entire 2022 fall at 4195.
“Whilst we would expect a cap at 4195 at first, a break can see strength extend to the key 63-day average at 4263, where we would be alert to a fresh cap. At most, we can see the recovery extending towards the 200-day average and potential downtrend from the 2022 high at 4447/89, however, we have more confidence in a cap here if reached.”
“Near-term support moves to 4138/33, then 4110. Below 4080/58 is needed though to see the risk turn lower again with support then seen next at 3985.”
- NZD/USD has fallen back towards sub-0.6450 weekly lows, where the 21DMA is now offering support.
- The pair is eyeing a possible break towards 0.6300 should risk appetite continue to deteriorate/US yields keep pushing higher.
- Friday’s US CPI data is the main event of the week for the pair.
The New Zealand dollar, whilst not the worst performer on the day (the yen once again takes that crown as it gets battered by the BoJ’s persistently dovish stance), is once again one of the G10’s worst-performing currencies. A rise in US government bond yields, with the 10-year last trading around 6 bps higher above the 3.0% level and near multi-week highs, are boosting the buck across the board.
Meanwhile, though still well within this week’s ranges, US equity index futures are trading on the back foot ahead of the open, putting a dampener on risk appetite in the currency space. NZD is considered one of the more risk-sensitive G10 currencies alongside the likes of AUD and NOK.
As a result, NZD/USD is trading back to the south of the 0.6450 level and eyeing a test of weekly lows in the 0.6420s. For now, the pair’s 21-Day Moving Average closer to 0.6430 is providing support. But a break below here and the 0.6400 level if risk appetite continues to worsen could see the pair quickly fall to the next area of support around 0.6300.
In terms of macro events to watch on Wednesday; a 10-year US bond auction could hurt NZD/USD if it triggered further US yield upside. Otherwise, the calendar is looking pretty quiet. The main event of the week is this Friday’s US Consumer Price Inflation (CPI) report, which will be looked at in the context of how it impacts the outlook for Fed policy.
- EUR/JPY clinches fresh cycle peaks just above the 144.00 mark.
- Further upside now targets the 2015 high beyond 145.00.
The rally in EUR/JPY looks everything but abated and is currently testing the area of new tops in the 144.00 neighbourhood.
The cross briefly probed the area just above the 144.00 mark and opened the door to the continuation of the rally in the very near term. That said, there are no relevant hurdles until the 2015 high at 145.32 (January 2) ahead of the 2014 peak at 149.78 (December 8).
In the meantime, while above the 2-month support line near 135.90, the short-term outlook for the cross should remain bullish.
EUR/JPY daily chart
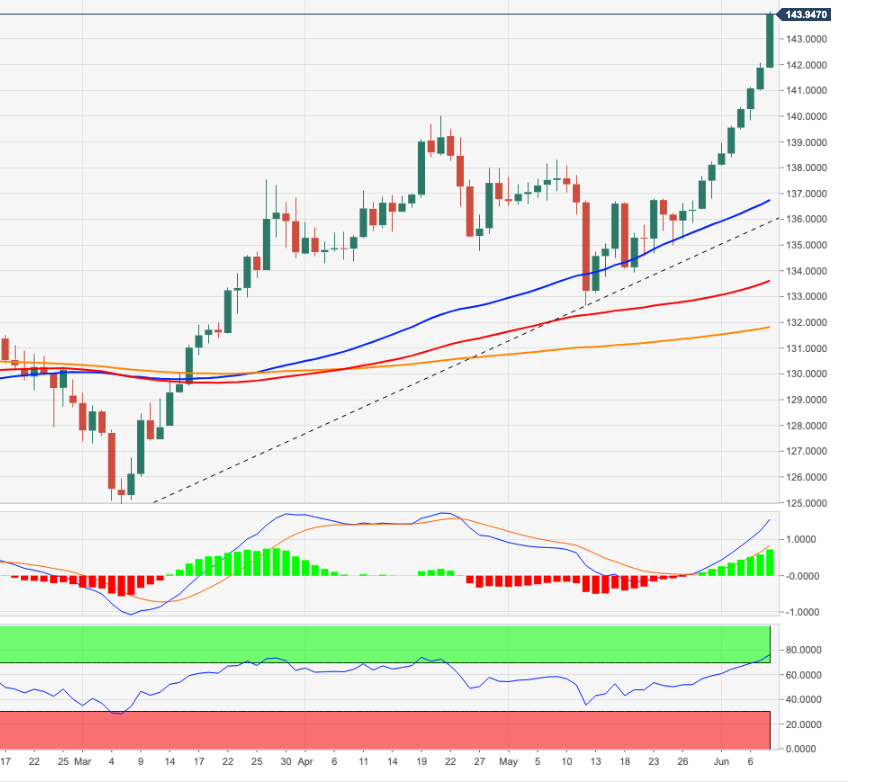
USD/CAD has declined further. Nonetheless, economists at Credit Suisse expect the downmove to be held at 1.2483/00 and look for a broader 1.24-1.31 range to emerge.
Stable break below 1.24 to warn of a deeper setback
“With daily MACD in the outright negative area, we see the potential for further near-term downside to unfold. However, we stay biased for the 1.2483/00 support zone to hold to keep USDCAD within the broader 1.2400-1.3100 range, with a reversion back higher within this range likely from 1.2483/00.”
“A stable break below 1.2400 would warn of a deeper setback, potentially all the way to 1.2300/2287.”
EUR/CHF has jumped higher within its range. However, analysts at Credit Suisse expect resistance at 1.0454/0515 to cap to keep the medium risks biased lower.
Support is seen at 1.0371 initially, then at 1.0306
“Support is seen at 1.0371 initially and then at 1.0306, a fall below which is needed to relieve the current short-term upside pressure and open the door to reach the price lows from mid-April at 1.0189/69.”
“We look for the May highs at 1.0495/0515 to cap the current upside. Should a sustained break above this level take place, this would threaten to negate the currently intact medium-term downtrend and see scope for a stronger upmove to unfold.”
- EUR/USD has rallied into the mid-1.0700s despite broad buck resilience amid strong EZ GDP data ahead of Thursday’s ECB meeting.
- The ECB is expected to signal imminent rate hikes and any hawkish surprise could see EUR/USD test resistance around 1.0800.
- Friday’s US CPI is another key risk event for traders to keep an eye on.
The euro is the best performer of the major G10 currencies on Wednesday, lifting EUR/USD into the mid-1.0700s, even as the US dollar holds its ground reasonably well against most of its other G10 peers amid a rise in US yields. Indeed, the rise in yields in the Eurozone has been bigger, in wake of 1) positive revisions to Eurozone Q1 GDP growth estimates and 2) expectations for a very hawkish sounding ECB meeting on Thursday.
The ECB is expected to signal multiple imminent rate hikes as the bloc continues to grapple with rampant inflation that has reached well into double digits in some of its smaller, more Russo-Ukraine war-exposed nations. According to Reuters, money markets were last pricing a total of 75 bps of tightening by September, which implies a 50 bps rate hike at either the July or September meetings. That’s despite the fact that key ECB policymakers have sought to play down expectations for a 50 bps move and promote the idea of gradualism (i.e. 25 bps hikes) in recent weeks.
Anyway, the EUR/USD bulls are in charge and the pair is eyeing a test of recent highs near the 1.0800 level. A more hawkish than expected ECB (perhaps President Christine Lagarde openly endorses the idea of a 50 bps hike in the next few months) could be one catalyst to push the pair above 1.0800 and to fresh multi-week highs. Another catalyst could be if Friday’s US Consumer Price Inflation (CPI) data offers further evidence of easing US price pressures, which might encourage the market to pare back on Fed tightening bets.
Whatever the cause, a break above 1.0800 would open the door to a run higher to the next key area of resistance in the mid-1.0900s. Such a move would be consequential from a technical standpoint as many might interpret it as snapping EUR/USD out of the negative trend that it has more or less been locked within since May 2021.
Gold stays sidelined. A move below $1,787 is needed to reinject downside momentum again, economists at Credit Suisse report.
Slight downside bias in the broader range
“Gold below its $1,874 recent high and 200-day average can maintain a slight downward bias in the broader sideways range.”
“Beneath $1,787 is needed to reinject downside momentum again for a test of the lower end of the two-year range at $1,691/77. Only below here though would see an important top established.”
- AUD/USD came under some renewed selling pressure on Wednesday amid modest USD strength.
- A goodish pickup in the US bond yields and a softer risk tone benefitted the safe-haven greenback.
- A break below the 0.7150 area is needed to confirm a bearish outlook ahead of the US CPI on Friday.
The AUD/USD pair met with a fresh supply on Wednesday and erased the previous day's modest gains back closer to the 100-day SMA resistance. The pair remained on the defensive heading into the North American session and was last seen trading around the 0.7200 mark, down nearly 0.35% for the day.
A combination of factors provided a modest intraday lift to the US dollar, which, in turn, exerted some downward pressure on the AUD/USD pair. Investors remain concerned that the global supply chain disruption caused by the Russia-Ukraine war could push consumer prices even higher and force the Fed to tighten its monetary policy at a faster pace. This, in turn, triggered a fresh leg up in the US Treasury bond yields, which, along with a softer risk tone, offered some support to the safe-haven greenback.
The market sentiment remains fragile amid doubts that central banks can hike interest rates to curb inflation without impacting economic growth. This, to a larger extent, overshadowed a more hawkish Reserve Bank of Australia (RBA) decision on Tuesday. It is worth recalling that the RBA raised interest rates by the most in 22 years and indicated that further tightening is in the pipeline as it battles to restrain surging inflation. The markets were quick to price in the real risk of another 50 bps rise in July.
That said, the AUD/USD pair's inability to gain any meaningful traction and repeated failures near the 100/200-day SMA confluence suggests that the recent bounce from the YTD low has run out of steam. Traders, however, seemed reluctant to place aggressive bearish bets and preferred to wait for the US consumer inflation figures, scheduled for release on Friday. Hence, it will be prudent to wait for sustained weakness below the 0.7150 horizontal support before positioning for any further depreciating move.
Technical levels to watch
- Silver is trading near $22.00 per troy ounce, well within this week’s ranges.
- XAG/USD has traded subdued so far this week, much as with other asset classes, ahead of US CPI on Friday.
Spot silver (XAG/USD) prices continue to trade within recent intra-day ranges amid a subdued tone to broader macro trading conditions. XAG/USD is currently trading near the $22.00 per troy ounce level, well within the $21.80-$22.50ish ranges that have prevailed over the past five sessions. The precious metal continues to fund support ahead of its 21-Day Moving Average around the $21.80 level.
Silver’s directionless feel reflects the price action being seen in other major asset classes (like US equities, US bond yields and the US dollar), which are all also locked within recent intra-day ranges amid a lack of notable fundamental catalysts, as traders keep their powder dry ahead of this Friday’s US Consumer Price Inflation (CPI) data.
While the upcoming CPI report is just one of many reports that the looks at to gauge US inflationary pressures, it is certainly one of the more important ones, with traders set to pay particularly keen attention to measures of core price pressures. Any signs of a further slowing in the MoM and YoY rates of core inflation would contribute to the growing sense that US inflation has now peaked.
Furthermore, this would come as a welcome development for the Fed, which may be able to slow the pace of monetary tightening from September following widely flagged consecutive 50 bps rate hikes in June (next week) and July. This would probably weigh on both the US dollar and US yields, which would come as a boost to precious metals like silver. In this bullish scenario, a test of and potential break above recent highs in the $22.50 area would be on the cards, with bulls eyeing a move towards $23.00 in the short term.
UOB Group’s Senior Economist Julia Goh and Economist Loke Siew Ting review the latest inflation figures in the Philippines.
Key Takeaways
“Headline inflation accelerated for the third straight month to 5.4% y/y in May (from 4.9% in Apr), exceeding the 5.0% level for the first time since Dec 2018 and marking the highest rate since Nov 2018. The reading matched our estimate and Bloomberg consensus. It was again predominantly driven by higher food and transport costs amid persistent weakness in Peso (PHP).”
“Looking ahead, inflation is poised to stay above 5.0% for the rest of the year and into 1Q23 as the domestic economy continues to reopen, external supply shocks persist, and higher minimum wages further intensify second-round effects on inflation. This will lead to a higher inflation rate of 5.0% for the entire year of 2022 (compared to our previous forecast of 4.5%, BSP est: 4.6%, 2021: 3.9%) and 4.0% for 2023 (vs our earlier projection of 3.5%, BSP est: 3.9%).”
“The latest strong inflation outturn in May and rising inflation expectations would validate a second 25bps hike in the overnight reverse repurchase (RRP) rate by Bangko Sentral ng Pilipinas (BSP) at the upcoming monetary policy meeting on 23 Jun. The continued improvement in domestic economic activities, an expected 50bps hike in the US Fed Funds rate in Jun and Jul, and other central banks’ faster policy normalisation path are also strengthening the case for back-to-back BSP rate increases and moving in near lockstep with US rates. Hence, we revise our BSP rate hike call to 25bps in every remaining meeting of this year (vs +25bps each in 3Q22 and 4Q22 previously), bringing the RRP rate to 3.50% by end of 2022.”
Open interest in natural gas futures markets dropped by around 8.8K contracts after two daily gains in a row on Tuesday, as per preliminary readings from CME Group. On the flip side, volume added to the previous build and went up by around 88.6K contracts.
Natural Gas: The $10.00 mark is around the corner
Prices of natural gas briefly surpassed the $9.50 mark per MMBtu on Tuesday, or new 2022 highs, before ending the session slightly in the negative ground. The move, however, was on the back of diminishing open interest, which is indicative that further losses do not appear on the cards for the time being. Next stop for bulls remains at the psychological $10.00 mark.
USD/CNH is still seen navigating within the 6.6200-6.7200 range for the time being, commented FX Strategists at UOB Group Lee Sue Ann and Quek Ser Leang.
Key Quotes
24-hour view: “Our expectations for USD to trade within a range of 6.6420/6.6770” were incorrect as it soared to a high of 6.6890 before pulling back. Despite the advance, upward momentum not improved by much and USD is unlikely to strengthen much further. For today, USD is more likely to trade between 6.6500 and 6.6900.”
Next 1-3 weeks: “Yesterday (07 Jun, spot at 6.6600), we highlighted that downward momentum is beginning to wane and a break of 6.6850 would indicate that the downside risk has dissipated. USD subsequently popped to a high of 6.6890. Downward pressure has dissipated and USD is likely to trade between 6.6200 and 6.7200 for now.”
- USD/CHF gained traction for the fourth straight day and climbed to a nearly three-week high.
- A pickup in the US bond yields helped revive the USD and remained supportive of the move.
- A softer risk tone underpinned the safe-haven CHF and kept a lid on any meaningful upside.
The USD/CHF pair built on its recent goodish rebound from the 0.9550 support zone and gained some follow-through traction for the fourth successive day on Wednesday. The momentum lifted spot prices to the 0.9800 neighbourhood, or a nearly three-week high during the first half of the European session.
A goodish pickup in the US Treasury bond yields helped revive the US dollar demand, which, in turn, was seen as a key factor that offered some support to the USD/CHF pair. In fact, the yield on the benchmark 10-year US government bond moved back above 3.0%, closer to a nearly four-week high touched earlier this week amid worries about persistent inflation.
Investors remain concerned that the global supply chain disruption caused by the Russia-Ukraine war would push consumer prices even higher. This might force the Fed to tighten its monetary policy at a faster pace, which acted as a tailwind for the US bond yields. That said, a weaker risk tone underpinned the safe-haven Swiss franc and capped gains for the USD/CHF pair.
The market sentiment remains fragile amid doubts that central banks can hike interest rates to curb inflation without impacting economic growth. Hence, the focus will remain on the US consumer inflation figures on Friday, which could determine the Fed's tightening path. This will drive the USD demand and provide a fresh directional impetus to the USD/CHF pair.
In the meantime, the US bond yields will play a key role in influencing the USD price dynamics in the absence of any top-tier economic releases from the US. Apart from this, the broader market risk sentiment would be looked upon for short-term trading opportunities around the USD/CHF pair.
Technical levels to watch
Considering advanced prints from CME Group for crude oil futures markets, open interest shrank for the first time since May 25, this time by around 32.8K contracts. Volume, instead, increased for the second straight session, now by around 284.3K contracts.
WTI: Pause ahead of extra gains?
Tuesday’s decent advance in prices of the West Texas Intermediate (WTI) was amidst shrinking open interest, hinting at the idea that further upside could enter an air pocket sooner rather than later. Collaborating with this view, the commodity flirts with the overbought territory, as the daily RSI approaches the 70 yardstick. The bullish stance remains unchanged nonetheless, with the next target at the 2022 high past the $129.00 mark per barrel (March 8).

- Gold Price is reversing the previous rebound amid risk-off markets.
- The US dollar gains amid risk-aversion and rebounding Treasury yields.
- Global growth concerns to put a floor under XAUUSD, as US inflation is awaited.
Gold Price is reversing a part of the previous recovery gains, in light of a notable US dollar demand alongside rebounding Treasury yields. The dollar capitalizes on the risk-off flows, courtesy of global recession fears, as central banks tighten monetary policy to fight inflation. On the other side, rising inflation expectations boost yields across the curve, adding to the weight on the non-yielding gold. Although XAU bulls manage to find some support from the bleak outlook for the global economy, following the GDP downgrades by the World Bank and the OECD. Traders remain focussed on Friday’s US inflation data for a fresh direction in XAUUSD.
Also read: Gold Price Forecast: Bull-bear tug-of-war around $1,850 extends, all eyes on US inflation
Gold Price: Key levels to watch
The Technical Confluence Detector shows that it is critical for Gold Price to scale the $1,852 hurdle to initiate any meaningful recovery. That level is the intersection of the SMA10 one-day, Fibonacci 23.6% one-day and SMA50 four-hour.
The next bullish target is aligned at the Fibonacci 61.8% one-week at $1,857, above which the pivot point one-day R1 at $1,860 could be challenged.
Strong support of the Fibonacci 61.8% one-month at $1,863 will be a tough nut to crack for XAU bulls.
On the flip side, the Fibonacci 61.8% one-day at $1,844 could emerge as a fierce cushion.
A sustained move below the latter will expose the $1,842-$1,840 demand area, where the SMA200 one-day, Fibonacci 23.6% one-week and pivot point one-day S1 coincide.
The previous day’s low of $1,837 will test the bullish commitments, as sellers will aim for the Fibonacci 38.2% one-month at $1,835.
Here is how it looks on the tool
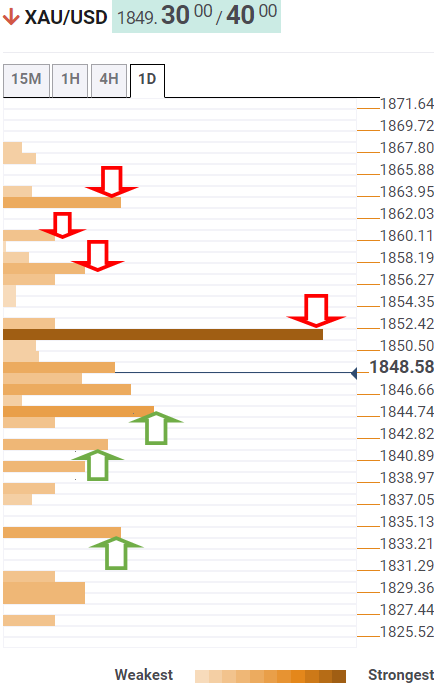
About Technical Confluences Detector
The TCD (Technical Confluences Detector) is a tool to locate and point out those price levels where there is a congestion of indicators, moving averages, Fibonacci levels, Pivot Points, etc. If you are a short-term trader, you will find entry points for counter-trend strategies and hunt a few points at a time. If you are a medium-to-long-term trader, this tool will allow you to know in advance the price levels where a medium-to-long-term trend may stop and rest, where to unwind positions, or where to increase your position size.
The strong upside momentum could lift USD/JPY to the 134.00 neighbourhood in the next weeks, according to FX Strategists at UOB Group Lee Sue Ann and Quek Ser Leang.
Key Quotes
24-hour view: “We highlighted yesterday that ‘further USD strength would not be surprising and that the next resistance is at 132.60 followed by 133.00’. We added, ‘the latter level is likely out of reach for today’. Our view was not wrong even though USD came close to taking out 133.00 (high has been 132.99). While deeply overbought, there is room for the rally in USD to extend to 133.50. The next resistance at 134.00 is likely out of reach for now. Support is at 132.40 followed by 132.10.”
Next 1-3 weeks: “We have expected USD to strengthen since early last week (see annotations in the chart below). As USD soared, in our latest narrative from yesterday (07 Jun, spot at 132.10), we highlighted that solid upward momentum suggests USD could continue to strengthen towards 133.00. USD subsequently surged to a high of 132.99. Momentum remains strong and USD could rally further to 133.50, possibly 134.00. On the downside, a break of 131.40 (‘strong support’ level was at 130.80 yesterday) would indicate that the USD strength has run its course. On a shorter-term note, 132.10 is already a rather solid support.”
- USD/JPY scaled higher for the fourth straight day and shot to a fresh two-decade high.
- The Fed-BoJ monetary policy divergence continued driving flows away from the JPY.
- Overbought conditions warrant some caution for bulls ahead of the US CPI on Friday.
The USD/JPY pair prolonged its recent bullish trajectory witnessed over the past two weeks or so and gained strong follow-through traction for the fourth successive day on Wednesday. This also marked the seventh day of a positive move in the previous eight and pushed spot prices to the highest level since March 2002, around the 133.85 region during the first half of the European session.
A big divergence in the monetary policy stance adopted by the Bank of Japan (dovish) and the Fed (hawkish) was seen as a key factor behind the Japanese yen's underperformance since the beginning of 2022. In fact, BoJ Governor Haruhiko Kuroda reiterated on Wednesday that the central bank must continue its support for the economic activity by keeping its existing ultra-loose policy settings. Moreover, the BoJ has also promised to conduct unlimited bond purchase operations to defend its near-zero target for 10-year yields.
In contrast, the yield on the benchmark 10-year US government bond moved back above 3.0%, closer to a nearly four-week high touched earlier this week amid worries about persistent inflation. Investors remain concerned that the global supply chain disruption caused by the Russia-Ukraine war would continue to push consumer prices higher. This might force the Fed to tighten its monetary policy at a faster pace, which, in turn, helped revive demand for the US dollar and further acted as a tailwind for the USD/JPY pair.
Apart from the aforementioned factors, the strong move up could also be attributed to technical buying following a convincing breakout through the 131.25-131.35 double-top resistance earlier this week. That said, extremely overbought conditions on short-term charts warrant some caution before positioning for any further appreciating move. Investors might also prefer to wait on the sidelines ahead of the US consumer inflation figures on Friday, which would determine the Fed's tightening path. This, in turn, will influence the near-term USD price dynamics and provide a fresh directional impetus to the USD/JPY pair.
Technical levels to watch
Krona losses in May were overdone and have already been partially corrected. A tighter stance by the Riksbank should be able to give SEK some upward momentum in the short term. But since the ECB will probably also carry out the first interest rate hikes in July, further upside potential is limited, economists at Commerzbank report.
Only next year should SEK be able to appreciate further
“The Riksbank could become even more restrictive and raise the interest rate path at its meeting at the end of June due to the inflation trend, which is why SEK could still gain some ground against the euro. However, its upside potential is limited, as the ECB is also likely to start raising interest rates in July.”
“Only next year, when the ECB will soon end its interest rate cycle again, whereas the Riksbank will continue to make gradual interest rate hikes in line with its forecast, should SEK be able to appreciate further.”
In its latest review, the Organisation for Economic Co-operation and Development (OECD) cuts the global growth outlook for 2022, in the face of the Russia-Ukraine war.
The organization, however, sees limited risks of 1970s-style stagflation.
Key takeaways
OECD sees global GDP growth of 3.0% in 2022, 2.8% in 2023 (vs 4.5% in 2022 and 3.2% in 2023 previously).
Sees US growth of 2.5% in 2022 and 1.2% in 2023 (vs 3.7% in 2022 and 2.4% in 2023 previously).
Sees euro area growth of 2.6% in 2022 and 1.6% in 2023 vs 4.3% in 2022 and 2.5% in 2023 previously).
Sees Chinese growth of 4.4% in 2022 and 4.9% in 2023 vs 5.1% in 2022 and 2023 previously).
Inflation to peak in 2022 at 8.5% in OECD as a whole before receding gradually to 6% in 2023
Sees Japanese growth of 1.7% in 2022 and 1.8% in 2023 vs 3.4% in 2022 and 1.1% in 2023 previously).
Removing accommodation is warranted worldwide, but with caution in Europe where supply-driven inflation dominates.
Negative supply shock from oil prices should have less of a stagflationary impact than in the mid-1970s.
Wherever inflation is driven by over-buoyant demand, as in the US monetary policy can tighten faster.
Market reaction
Risk sentiment remains tepid, reflective of the 0.50% drop in the S&P 500 futures. Global growth concerns flagged by the World Bank and the OECD weigh on the investors’ sentiment while boosting the safe-haven US dollar to near 102.80 levels against its main competitors.
- GBP/USD met with a fresh supply on Wednesday and was pressured by a combination of factors.
- A pickup in the US bond yields and a softer risk tone revived demand for the safe-haven buck.
- The UK political turmoil undermined the British pound and further contributed to the selling bias.
The GBP/USD pair struggled to capitalize on the previous day's solid bounce from a nearly three-week low and came under some renewed selling pressure on Wednesday. The pair extended its steady intraday descent through the first half of the European session and dropped to a fresh daily low, around the 1.2515-1.2510 region in the last hour.
Investors remain concerned that global supply chain disruption caused by the Russia-Ukraine war would continue to push consumer prices higher. This might force the US central bank to tighten its monetary policy at a faster pace, which, in turn, triggered a fresh leg up in the US Treasury bond yields. In fact, the yield on the benchmark 10-year US government bond moved back above 3.0%, closer to a nearly four-week high touched earlier this week. This, along with a softer risk tone, helped revive demand for the safe-haven US dollar and exerted downward pressure on the GBP/USD pair.
The market sentiment remains fragile amid worries that a more aggressive move by major central banks to constrain inflation could pose challenges to global economic growth. The British pound was also pressured by the UK political turmoil. British Prime Minister Boris Johnson survived the no-confidence vote on Monday, albeit at a much smaller margin than expected. Given that many MPs from within the Conservative Party voted against him, the development has raised uncertainty over Johnson’s future as the UK Prime Minister and could make it difficult for sterling to attract any buying.
The fundamental backdrop seems tilted in favour of bearish traders and supports prospects for a further near-term depreciating move. That said, market participants might refrain from placing aggressive bets and prefer to wait on the sidelines ahead of the US consumer inflation on Friday. The US CPI report will play a key role in determining the Fed's tightening path, which will drive the USD and provide a fresh directional impetus to the GBP/USD pair. In the meantime, the US bond yields, along with the broader market risk sentiment, would influence the buck and allow traders to grab short-term opportunities.
Technical levels to watch
The Eurozone economy expanded by 0.6% on the quarter in the three months to March of 2022 vs. 0.3% prior, the final revision confirmed on Wednesday. The market consensus was for a reading of 0.3% in the reported period.
On an annualized basis, the bloc’s GDP rate rose by 5.4% in Q1 vs. 5.1% booked in Q4 2021 while matching 5.1% expectations.
Meanwhile, the bloc’s Q1 Employment Change arrived at 0.6% QoQ and 2.9% YoY. The employment data surpassed expectations across the time horizon.
FX implications
EUR/USD was last seen trading at 1.0675, down 0.21% on the day. The euro failed to find any comfort from the upbeat Eurozone GDP and employment data, as the strength in the US dollar dominates.
About Eurozone GDP
The Gross Domestic Product released by Eurostat is a measure of the total value of all goods and services produced by the Eurozone. The GDP is considered a broad measure of the Eurozone's economic activity and health. Usually, a rising trend has a positive effect on the EUR, while a falling trend is seen as negative (or bearish).
Gold climbed slightly to a good $1,850 yesterday and is still trading at roughly this level on Wednesday. On Tuesday, World Bank lowered 2022 global growth forecast to 2.9% from 4.1% in January. What’s more, global inflation will likely remain above target in many economies, lending support to the yellow metal, economists at Commerzbank report.
No demand for gold ETFs in May
“Gold was lent support by the World Bank’s report on the economic situation and outlook. In it, the World Bank has further lowered its forecast for this year’s global economic growth to +2.9%. At the same time, it warned that we could be facing several years of below-average growth and above-average inflation. We believe this will benefit gold in the long term, as it is likely to come into its own as a store of value in such an environment.”
“The World Gold Council (WGC) published figures yesterday for the gold ETFs it tracks. They show outflows of 53 tons in May, bringing a series of four consecutive monthly inflows to an end.”
“The ETF outflows accompanied the downward trend of the gold price that began in April and continued until mid-May. In our view, the price slide was due chiefly to the appreciating US dollar and rising bond yields. In a current market commentary, the WGC also points to the low investor interest, reduced risk perception, the decline in market-based inflation expectations and the recent surge on the stock markets.”
The Bank of Japan (BOJ) will consider downgrading its assessment on factory output at the June policy meeting due to supply disruptions caused by China’s covid lockdowns, Reuters reports, citing sources with the central bank’s thinking.
The BOJ is expected to maintain the view that Japan’s economy is picking up as a trend, noting that it is likely to continue improving, the sources added.
Market reaction
The above headlines are adding to the downside in the Japanese yen, driving USD/JPY to fresh 20-year highs of 133.79. The pair is up 0.90% on the day.
In his comments on Wednesday, the International Energy Agency’s (IEA) chief Fatih Birol voices concerns about higher prices in general.
Key quotes
"Energy efficiency measures are critical to addressing current global energy crisis."
"If we have a harsh, long winter then we may face energy shortages."
"Governments need to look at ways to reduce energy demand."
Market reaction
WTI is almost unchanged on the day, currently trading at $118.26 on these above comments.
“At this moment, Bank of Japan (BOJ) must continue its support for economic activity by continuing with current monetary easing,” the central bank’s Governor Haruhiko Kuroda said on Wednesday.
Additional quotes
Unless the Fed raises interest rates must faster than more than their forward guidance shows, dollar rate may not be so much affected by US-Japan interest rate differentials.
Our monetary policy is aimed at achieving 2% inflation target in a stable and sustainable manner.
The current 2% inflation is simply caused by higher energy prices, will not be sustainable.
We have to continue our monetary easing to support economic recovery and make the labour market much tighter.
I'm quite sure we can achieve 2% inflation in coming years.
China's COVID-19 lockdowns would affect China’s economy as well as global economy.
Don't think China’s COVID-19 lockdowns would have long-term impact on Chinese, world economies.
- USD/TRY extends the advance further north of 17.00.
- The better tone in the dollar weighs on the EM FX space.
- Turkey 10y bond yields navigate in monthly tops around 24.00%.
The Turkish lira loses further ground and pushes USD/TRY to new YTD peaks past the 17.00 mark on Wednesday.
USD/TRY up on stronger dollar
USD/TRY prints gains for the third session in a row and manages to break above the 17,.00 barrier against the backdrop of the generalized bid bias in the US dollar and persistent outflows from the risk complex and the M FX universe.
Indeed, the greenback gathers further pace helped by the firmer sentiment and the resumption of the uptrend in US yields along the curve. Extra legs in the buck come ahead of the key FOMC event due on June 15, where the Fed is expected to raise the Fed Funds Target Range (FFTR) by 50 bps.
Investors seem to have accelerated the selling pressure around the lira particularly after May’s inflation figures ran at the fastest pace in the last two decades. In addition, the bearish sentiment on the currency was exacerbated further (like if the lira needed it) after President R.T.Erdogan reiterated on Monday that rates will continue to go down, reaffirming the government’s view against rate hikes.
What to look for around TRY
USD/TRY keeps the underlying upside bias well and sound and now surpasses the 17.00 neighbourhood, an area last traded back in December 2021.
So far, price action in the Turkish currency is expected to gyrate around the performance of energy prices, the broad risk appetite trends, the Fed’s rate path and the developments from the war in Ukraine.
Extra risks facing TRY also come from the domestic backyard, as inflation gives no signs of abating, real interest rates remain entrenched in negative figures and the political pressure to keep the CBRT biased towards low interest rates remain omnipresent.
Key events in Turkey this week: Unemployment Rate (Friday).
Eminent issues on the back boiler: FX intervention by the CBRT. Progress (or lack of it) of the government’s new scheme oriented to support the lira via protected time deposits. Constant government pressure on the CBRT vs. bank’s credibility/independence. Bouts of geopolitical concerns. Structural reforms. Upcoming Presidential/Parliamentary elections.
USD/TRY key levels
So far, the pair is gaining 2.14% at 17.0903 and faces the next up barrier at 17.0984 (2022 high June 8) seconded by 18.2582 (all-time high December 20) and then 19.00 (round level). On the flip side, a breach of 16.3136 (monthly low June 3) would aim to 16.1431 (low May 27) and finally 15.6684 (low May 23).
- USD/CAD gained some positive traction on Wednesday amid the emergence of fresh USD buying.
- A fresh leg up in the US bond yields and a softer risk tone revived demand for the safe-haven USD.
- Bullish crude oil prices underpinned the loonie and kept a lid on any meaningful gains for the pair.
The USD/CAD pair attracted some buying near the 1.2425 region on Wednesday and reversed a part of the previous day's slide to its lowest level since April 21. The pair held on to its modest intraday gains through the early European session, albeit seemed to struggle to capitalize on the intraday positive move beyond mid-1.2500s.
The US dollar was back in demand amid a goodish pickup in the US Treasury bond yields and turned out to be a key factor that offered some support to the USD/CAD pair. In fact, the yield on the benchmark 10-year US government bond moved back above 3.0%, closer to a nearly four-week high touched earlier this week amid worries about persistent inflation.
Investors remain concerned that global supply chain disruption caused by the Russia-Ukraine war would continue to push consumer prices higher. This might force the US central bank to tighten its monetary policy at a faster pace. Hence, the market focus will remain glued to the latest US consumer inflation figures, scheduled for release on Friday.
Meanwhile, doubts that central banks can hike interest rates to curb inflation without impacting economic growth kept a lid on the overnight optimistic move in the markets. This was seen as another factor that benefitted the safe-haven buck, though bullish crude oil prices underpinned the commodity-linked loonie and capped the USD/CAD pair.
There isn't any major market-moving economic data due for release on Wednesday, either from the US or Canada. Hence, the US bond yields, along with the broader market risk sentiment, will drive the USD demand and provide some impetus to the USD/CAD pair. Apart from this, traders will take cues from oil price dynamics to grab short-term opportunities.
Technical levels to watch
The yen is underperforming again with the break to new highs in USD/JPY encouraging continued selling. Economists at MUFG Bank expect the yen to remain under pressure if US yields stay resilient.
Kuroda keeps to dovish message as USD/JPY hits new highs
“The speed of the move in yen depreciation is certainly now on a par with what we had during much of March and April and at higher levels there will be inevitable increased speculation on Japan intervention to at least slow the move.”
“Governor Kuroda did say today that rapid yen selling is ‘undesirable’ but it would be difficult at this juncture for the MoF to justify yen buying intervention given the actions of the BoJ.”
“If US yields remain underpinned over the short-term yen selling momentum will likely persist.”
Bank of Japan (BOJ) Governor Haruhiko Kuroda said on Wednesday that the BOJ must continue its support for the economic activity by continuing with the current monetary easing, as reported by Reuters.
Additional takeaways
"Unless Fed raises interest rates faster than their forward guidance shows, dollar rate may not be so much affected by US-Japan interest rate differentials."
"Our monetary policy is aimed at achieving 2% inflation target in a stable and sustainable manner."
"The current 2% inflation is simply caused by higher energy prices, will not be sustainable."
"We have to continue our monetary easing to support economic recovery and make the labour market much tighter."
"I'm quite sure we can achieve 2% inflation in coming years."
Market reaction
USD/JPY extended its rally on these comments and was last seen trading at its highest level in 20 years at 133.48, rising 0.7% on a daily basis.
EUR/USD has been consolidating between 1.0643 and 1.0762 since 1 Jun, ahead of the Euopean Cental Bank (ECB) meeting on this Thursday. Risk is for the central bank to sound more hawkish, which could trigger a re-price higher of rate hikes expectations, lending support to the euro, economists at OCBC Bank report.
Upside potential
“A rate hike this week is not expected, but the ECB may provide further hints on the rate hike trajectory, alongside the refreshed staff projections matrix.”
“Potential for market to re-price higher rate hikes expectation may lend some support to the EUR.”
“Upside to the pair is at 1.0787 while support sits at 1.0627.”
- GBP/JPY gained traction for the ninth straight day and shot to its highest level since April 21.
- The heavily offered tone surrounding the JPY was seen as a key factor fueling the momentum.
- The UK political turmoil might hold back bulls from placing fresh bets and cap further gains.
The GBP/JPY cross prolonged its recent strong bullish trajectory witnessed over the past two weeks or so and scaled higher for the ninth successive day on Wednesday. The momentum pushed spot prices to the highest level since April 21, around the 167.70 region during the early European session.
The Japanese yen has been the worst performer this year amid a big divergence in the monetary policy stance adopted by the Bank of Japan and other major central banks. It is worth recalling that the BoJ has vowed to keep its existing ultra-loose policy settings and promised to conduct unlimited bond purchase operations to defend its near-zero target for 10-year yields. This, in turn, was seen as a key factor that continued acting as a tailwind for the GBP/JPY cross.
Bulls seemed rather unaffected by an upward revision of Japanese GDP numbers, which showed that the economy contracted by 0.1% during the first quarter as against the Preliminary estimate of -0.2%. Adding to this, the annualized GDP print witnessed a significant improvement from the 1.0% decline reported previously, to a -0.5%. This, however, did little to provide any respite to the domestic currency or hinder the GBP/JPY pair's ongoing strong positive momentum.
With the latest leg up, spot prices have moved well within the striking distance of a multi-year peak touched in April, though the UK political turmoil could cap any further upside. British Prime Minister Boris Johnson survived the no-confidence vote on Monday, albeit at a much smaller margin than expected. Given that many MPs from within the Conservative Party voted against him, the development has raised uncertainty over Johnson’s future as the UK Prime Minister.
Market participants now look forward to the release of the final UK Construction PMI, which might influence the British pound and provide some impetus to the GBP/JPY cross. Apart from this, the broader market risk sentiment should allow traders to grab short-term opportunities.
Technical levels to watch
USD/JPY trades at its highest level in 20 years above 133.00. The near-term prognosis for the JPY remains soft and economists at Scotiabank believe that the pair could climb as high as 140.
Technical backdrop in USD/JPY is bullish
“The technical backdrop in USD/JPY is bullish, with trend indicators aligned bullishly for USD/JPY across short, medium and long-term timeframes, with no obvious resistance points above the market until 135 (2002 high) and 147.65 (1998 high).”
“While not our base case, we would not rule out USD/JPY extending towards the JPY135-140 range (140 is one standard deviation above its 10-year moving average).”
“We do note that the JPY’s real effective exchange rate is at an all-time low while short-term market positioning indicators (CFTC data) reflect a market that is running a quite significant (though not extreme) short JPY position. These factors may mitigate broader downside pressure on the JPY in the coming months.”
Brent Crude Oil is hovering above key averages but remains still clearly below $139.13. A weekly close above the latter is needed to clear the way towards the record high of $147.50, strategists at Credit Suisse report.
Close below 55-DMA at $110.81 to reinforce a broader sideways range again
“Brent Crude Oil has failed to remain above the $123.74 resistance but still remains solidly above key averages and we look for a sustained move above $123.74 for a test of the $139.13 March high, which we would expect to cap the market, at least temporarily.”
“A weekly close above $139.13 though would be seen to clear the way for a test of the $147.50 record high.”
“Immediate support we identify at the 55-day average, currently at $110.81. A close below here would be seen to reinforce a broader sideways range again with support seen next at $101.80 and then the crucial 200-day average, now at $92.09.”
- EUR/USD trades without direction near 1.0700.
- EMU Q1 GDP Growth Rate next of note in the euro area.
- Germany Industrial Production contracted 0.7% MoM in April.
The single currency comes under pressure and motivates EUR/USD to trade marginally on the defensive below 1.0700 on Wednesday.
EUR/USD looks to data, stays cautious ahead of ECB
EUR/USD fails to gather convincing upside traction amidst alternating risk appetite trends against the backdrop of a firmer note in the greenback.
The so far negative performance in the pair comes amidst some small consolidation in German yields, which continue to trade in levels last seen back in June 2014 north of the 1.30% yardstick.
Earlier in the domestic calendar, German Industrial Production contracted at a monthly 0.7% in April, while another revision of the Q1 GDP Growth Rate is also due later. Across the pond, MBA Mortgage Applications come first seconded by Wholesale Inventories and the weekly report on US crude oil stockpiles by the EIA in the week to June 3.
What to look for around EUR
EUR/USD continues to lose momentum and extends further the rejection from peaks beyond the 1.0700 mark in past sessions.
The pair’s recent multi-week recovery has been on the back of supportive ECB-speak, which continued to point at an initial rate hike as soon as in July, while the consensus view that the bond-purchase programme should end at some point in early Q3 has also lent legs to the European currency.
However, EUR/USD is still far away from exiting the woods and it is expected to remain at the mercy of dollar dynamics, geopolitical concerns and the Fed-ECB divergence, while higher German yields, persistent elevated inflation in the euro area and a decent pace of the economic recovery in the region are also supportive of an improvement in the mood around the euro.
Key events in the euro area this week: Advanced EMU Q1 GDP Growth Rate (Wednesday) – ECB Interest Rate Decision (Thursday).
Eminent issues on the back boiler: Speculation of the start of the hiking cycle by the ECB as soon as this summer. Asymmetric economic recovery post-pandemic in the euro bloc. Impact of the war in Ukraine on the region’s growth prospects.
EUR/USD levels to watch
So far, spot is retreating 0.07% at 1.0691 and a breach of 1.0627 (monthly low June 1) would target 1.0532 (low May 20) en route to 1.0459 (low May 18). On the upside, the next hurdle emerges at 1.0786 (monthly high May 30) seconded by 1.0936 (weekly high April 21) and finally 1.0939 (100-day SMA).
AUD/USD’s correction was capped at 0.7241/7278. Analysts at Credit Suisse anticipate a turn back lower to 0.6758 in due course.
Stable close above 0.7278 to signal yet another false breakout
“AUD’s recovery has been capped below a cluster of key resistances at 0.7241/7278, which includes the 38.2% retracement of the fall from 2021, the 50% retracement of the April/May fall, the 200-day and the 55-day moving averages, as well as the highs of May. With near-term MACD also showing signs of turning lower, we stay biased for the downtrend to reassert itself from here and thus look for an eventual move to the YTD low at 0.6827, ahead of our medium-term objective at 0.6758.”
“A stable close above 0.7278 would negate our medium-term bearish leaning and signal yet another false breakout within a broader range.”
The rand has recovered significantly since mid-May, just like other EM currencies. Tuesday’s GDP data for Q1 provided additional support. However, this is just a brief flicker, according to economists at Commerzbank.
ZAR investors should mainly keep an eye on fiscal risks
“At seasonally adjusted 1.9% compared with the final quarter of 2021 the economy recorded much stronger growth than expected. At the same time, the previous quarter’s result was revised slightly to the upside to 1.4%. That results in QoQ growth of 3%. Even though this is positive, the data is likely to constitute merely a brief flicker as this momentum is unlikely to be sustainable.”
“Not only the devastating floods in parts of the country in early April as well as massive shortages in the electricity supply are likely to notably dampen activity in Q2. The high inflation rate and rising wages are also likely to slow the economy.”
“We expect the rand to trend weaker medium-term. In view of the weak growth prospects for South Africa and the less favourable global interest rate environment, ZAR investors should mainly keep an eye on fiscal risks.”
EUR/USD strength has been capped as looked for at a cluster of resistances at 1.0770/0835. Economists at Credit Suisse expect the pair to drop substantially toward the 1.00/0.99.
Move above 1.0835 to trigger a deeper than expected recovery
“We look for a resumption of the core downtrend from a cluster of resistances, which include the 23.6% retracement of the entire 2021/22 fall, the 38.2% retracement of the fall from February, the 55-day moving average, the mid-April lows and the back of the confirmed broken uptrend from 2017, which all coincide at 1.0770/0835 for a retest and eventual break of the 2017 low for a fall to our next main objective at parity/0.9900.”
“Though not our base case, above 1.0835 would trigger a deeper than expected recovery, with next resistance seen at 1.0923/37.”
- NSX/USD met with a fresh supply on Wednesday and edged back closer to a two-week low.
- A goodish pickup in the US bond yields revive the USD demand and exerted some pressure.
- A softer risk tone also benefitted the safe-haven USD and weighed on the risk-sensitive kiwi.
The NZD/USD pair struggled to capitalize on the previous day's goodish rebound from the 0.6420 area, or a near two-week low and came under some renewed selling pressure on Wednesday. The pair maintained its bid tone through the early European session and was last seen trading just above mid-0.6400s.
The US dollar was back in demand amid a fresh leg up in the US Treasury bond yields and turned out to be a key factor that exerted downward pressure on the NZD/USD pair. In fact, the yield on the benchmark 10-year US government bond moved back above 3.0%, closer to a nearly four-week high touched earlier this week amid worries about persistent inflation.
Investors remain concerned that global supply chain disruption caused by the Russia-Ukraine war would continue to push consumer prices higher. This might force the US central bank to tighten its monetary policy at a faster pace. Hence, the market focus will remain glued to the latest US consumer inflation figures, due for release on Friday.
In the meantime, doubts that central banks can hike interest rates to curb inflation without impacting economic growth kept a lid on the overnight optimistic move in the markets. This further benefitted the greenback's relative safe-haven status and drove flows away from the risk-sensitive kiwi, supporting prospects for an extension of the intraday downfall.
In the absence of top-tier US economic data on Wednesday, the US bond yields will play a key role in influencing the USD price dynamics and provide some impetus to the NZD/USD pair. Apart from this, traders will take cues from the broader market risk sentiment to grab short-term opportunities around the major.
Technical levels to watch
- USD/RUB resumes weekly downtrend after pausing the bears the previous day.
- Firmer oil prices, Russia’s currency reserves and oil payment system defend RUB buyers.
- US Treasury yields underpin US dollar rebound ahead of the US inflation data.
- Ukraine-Russia fails to agree over passage of grain ships, UN intervention looms.
USD/RUB fails to extend the previous day’s corrective pullback as sellers attack 61.00 to refresh the intraday low during early Wednesday morning in Europe.
The Russian ruble (RUB) pair’s losses ignore the recently firmer US Dollar, backed by the upbeat US Treasury yield and the risk-off mood.
That said, the US Dollar Index (DXY) reverses the pullback from a fortnight high as the Treasury bond yields regain upside momentum after snapping a six-day uptrend the previous day. The reason behind the greenback’s rebound could be linked to the anxiety ahead of Thursday’s European Central Bank (ECB) meeting, as well as Friday’s US Consumer Price Index (CPI) for May.
Additionally, the Atlanta Fed’s GDP measure, World Bank (WB) President David Malpass and officials from China, namely Vice Commerce Minister Wang Shouwen and Vice Finance Minister Zou Jiayi, renewed recession fears to offer extra strength to the US dollar.
It’s worth noting that fears of escalating geopolitical crisis between Russia and Ukraine hint at Moscow’s sustained push for payment in terms of RUB, which in turn favor the USD/RUB bears. Also weighing on the quote could be the firmer oil prices, up 0.10% around $120.00 by the press time.
Talking about the latest updates, “Kyiv says it has not yet reached any agreement with Russia or Turkey to allow the safe passage of its grain ships in the Black Sea, injecting skepticism into a push by the U.N. to create a vital food corridor,” per Politico.
Against this backdrop, the S&P 500 Futures print the first daily loss in three around 4,150 and portray the market’s risk-off mood.
Moving on, headlines concerning Russia and global economic growth may entertain USD/RUB traders ahead of this week’s key data/events mentioned above.
Technical analysis
While 21-DMA restricts immediate rebound around 63.15, USD/RUB buyers are likely to remain away until the quote rises past the monthly resistance line, near 64.70 by the press time.
That said, the quote’s current weakness eyes to retest the yearly low surrounding 55.90, marked in May.
AUD/USD was able to benefit only briefly from the Reserve Bank of Australia‘s (RBA) rate decision on Tuesday. The surprisingly strong rate hike should support the aussie, but the bleak Chinese economic outlook is set to cap AUD gains, economists at Commerzbank report.
RBA maintains its restrictive course
“The RBA maintains its restrictive course and assumes that the key rate will continue to rise over the coming months. The board will base its decisions on the incoming information as far as the outlook for inflation and the labour market is concerned.”
“Yesterday‘s hike by 50bp to 0.85% might have come as a surprise, but first of all the central bank provided good arguments supporting the step and secondly, it signalled that the timing and size will be guided by the data. As a result, the market so far has no reason to adjust its expectations significantly to the upside and to plan for a much tighter cycle as a result of yesterday’s decision.”
“Principally the RBA’s restrictive approach should support AUD, but as long as the economic development in China remains unclear AUD gains are likely to remain limited.”
Here is what you need to know on Wednesday, June 8:
The dollar struggled to find demand amid improving market mood on Tuesday but the benchmark 10-year US Treasury bond yield reclaimed 3% early Wednesday, helping the currency stay relatively resilient against its rivals. Eurostat will release the first quarter Gross Domestic Product (GDP) figures for the euro area. There will be a 10-year US Treasury note auction later in the day and the US Census Bureau will publish the Wholesale Inventories data. Ahead of the European Central Bank's (ECB) policy announcements on Thursday and the US inflation data on Friday, the trading action could remain subdued.
In the absence of high-impact data releases, Wall Street's main indexes registered strong gains on Tuesday. US stock index futures, however, are down between 0.3% and 0.4% early Wednesday, pointing to a cautious market mood so far on the day. The US Dollar Index, which tracks the greenback's performance against a basket of six major currencies, posts modest gains near 102.50.
The Reserve Bank of India announced on Wednesday that it hiked its key repo rate by 50 basis points to 4.9% while leaving the reserve repo rate unchanged at 3.35%. USD/INR returned to 77.70 after initially spiking to 77.95.
A day ahead of the release of China’s trade balance data, China's Vice Commerce Minister said in a statement that importers and exporters remain under pressure due to logistics problems and rising material prices.
EUR/USD declined to a five-day low of 1.0652 on Tuesday but managed to recover its losses. The pair trades slightly below 1.0700 in the European session.
GBP/USD ended up closing in positive territory supported by risk flows on Tuesday after having dipped to a multi-week low below 1.2500. The pair was last seen consolidating its gains below 1.2600.
USD/JPY trades at its highest level in 20 years above 133.00. The data from Japan showed that the GDP contracted at an annualized pace of 0.5% in the first quarter. Bank of Japan Governor Haruhiko Kuroda noted on Wednesday that he is withdrawing his remark about households' acceptance of price hikes. “Rapid yen weakening in a short period of time as seen recently is undesirable," Kuroda added but these comments failed to help the yen find demand.
Gold took advantage of retreating US T-bond yields on Tuesday and snapped a two-day losing streak. XAU/USD seems to have steadied near $1,850 in the European session.
Bitcoin continues to edge lower after posting small daily losses on Tuesday and was last seen losing 2% on the day at $30,500. Ethereum stays on the back foot and trades within a touching distance of $1,800.
The US Dollar Index (DXY) setback has been well contained at its rising 55-day moving average (DMA) at 101.49. Economists at Credit Suisse expect DXY to climb towards the 109.25/110.25 region.
Support at 101.49/05 to hold further setbacks if seen
“We remain of the view recent weakness has been corrective only. Above 103.93 should add weight to our view for a move back to the 105.01 current cycle high. We continue to look for an eventual sustained move above here for a move to 109.25/110.25 next – the 78.6% retracement of the 2001/2008 bear market and September 2002 high.”
“Support at 101.49/05 ideally continues to hold further setbacks if seen. A break would warn of a deeper albeit still corrective setback to price support at 99.82/42.”
In the opinion of FX Strategists at UOB Group Lee Sue Ann and Quek Ser Leang, AUD/USD has now likely move into a consolidative phase.
Key Quotes
24-hour view: “Yesterday, we highlighted that AUD ‘is likely to trade with a downward bias towards 0.7150’. We added, ‘a clear break of this level is unlikely’. AUD subsequently spiked to a high of 0.7249, dropped to 0.7157 before rebounding to close at 0.7233 (+0.54%). The rebound from the low could extend but a break of the strong resistance at 0.7260 is unlikely. Support is at 0.7195 followed by 0.7170.”
Next 1-3 weeks: “Our update from yesterday (07 Jun, spot at 0.7190) still stands. As highlighted, the recent AUD strength has come to an end and AUD is likely to consolidate and trade between 0.7100 and 0.7260 for now. Looking ahead, the consolidation phase is likely to be resolved by a break above 0.7260. That said, AUD has to close above 0.7285 before a sustained advance is likely.”
It can be assumed that Prime Minister Johnson will remain at the receiving end of criticism. However, the FX market is focussing on other matters at the moment. Economists at Commerzbank expect the sterling to remain under pressure as the Bank of England (BoE) is set to disappoint markets next week.
Political developments do not matter much for GBP
“The Prime Minister will probably continue to cause negative headlines. Short-term reactions to the FX market are possible, but principally political developments are likely to remain aside with monetary policy constituting the main driver for sterling exchange rates.”
“We see the risk that the market’s interest rate expectations, which rose again recently, will be disappointed and that sterling will come under depreciation pressure. However, we are unlikely to gain any additional insight before 16th June.”
French Finance Minister Bruno Le Maire reiterated on Wednesday that he expects the peak in inflation to last several more weeks or even several more months before the price pressures begin to ease by early 2023.
"By the start of 2023, we will start to see that inflationary peak ease off," Le Maire told BFM TV.
Le Maire has said he expects France to have positive economic growth for 2022.
EUR reaction
The shared currency shrugs off these comments, as EUR/USD keeps its range around 1.0690, down 0.07% so far.
- DXY regains some composure near 102.50 on Wednesday.
- US yields resume the uptrend along the curve.
- Mortgage Applications, Wholesale Inventories next on tap.
The US Dollar Index (DXY), which tracks the greenback vs. a basket of its main competitors, regains the smile and prints small gains around 102.50 midweek.
US Dollar Index keeps the side-lined trade unchanged
The index navigates choppy waters so far this week amidst the gradual advance in US yields as well as alternating risk appetite trends.
Indeed, US yields trade in the area of multi-week highs so far, always underpinned by market chatter surrounding upcoming interest rate hikes by the Federal Reserve at the June and July meetings.
In the US data space, weekly Mortgage Applications measured by MBA are due seconded by Wholesale Inventories for the month of April and the EIA report on crude oil inventories.
What to look for around USD
The index picks up pace and reclaims the mid-102.00s area amidst the so far erratic weekly performance.
The dollar’s weakness seen in mid-May came in response to the rising perception that inflation might have peaked in April, which in turn supports the idea that the Fed may not need to be as aggressive as market participants expect when it comes to raising the Fed Funds rates.
In the meantime, the Fed’s divergence vs. most of its G10 peers coupled with bouts of geopolitical effervescence, higher US yields and a potential “hard landing” of the US economy are all factors still supportive of a stronger dollar in the next months.
Key events in the US this week: MBA Mortgage Applications, Wholesale Inventories (Wednesday) – Initial Claims (Thursday) – Inflation Rate, Flash Consumer Sentiment, Monthly Budget Statement (Friday).
Eminent issues on the back boiler: Powell’s “softish” landing… what does that mean? Escalating geopolitical effervescence vs. Russia and China. Fed’s more aggressive rate path this year and 2023. US-China trade conflict. Future of Biden’s Build Back Better plan.
US Dollar Index relevant levels
Now, the index is gaining 0.19% at 102.52 and a break above 102.83 (monthly high June 7) would open the door to 105.00 (2022 high May 13) and finally 105.63 (high December 11 2002). On the other hand, the next contention emerges at 101.64 (monthly low June 3) seconded by 101.59 (55-day SMA) and then 101.29 (monthly low May 30).
Silver extends its consolidation from just above support from the rising 200-week average, now seen at $20.36. In the view of strategists at Credit Suisse, this strength stays seen as temporary with a major top still in place.
Silver unlikely to stabilize above 200-DMA at $23.50
“With a large and significant top seen in place, this remain seen as a temporary pause only ahead of a sustained break lower in due course with support then seen next at $19.65 initially, then $18.95/40, which we look to hold at first for a consolidation phase.”
“Only above the 200-day average, currently at $23.50, would stabilize the precious metal more meaningfully, which is not our base case.”
FX option expiries for June 8 NY cut at 10:00 Eastern Time, via DTCC, can be found below.
- EUR/USD: EUR amounts
- 1.0550-60 640m
- 1.0580-85 431m
- 1.0600 545m
- 1.0650 537m
- 1.0665-70 310m
- 1.0685 302m
- 1.0720 300m
- 1.0750-60 830m
- 1.0800 880m
- GBP/USD: GBP amounts
- 1.2450 702m
- USD/JPY: USD amounts
- 132.00 210m
- 133.45-51 333m
- USD/CHF: USD amounts
- 0.9525 630m
- AUD/USD: AUD amounts
- 0.7250 203m
- 0.7300-10 485m
- USD/CAD: USD amounts
- 1.2570-80 310m
- NZD/USD: NZD amounts
- 0.6315 1.6b
The US dollar was able to gain some ground again in recent days. However, economists at Commerzbank expect the EUR/USD pair to recover following Thursday’s European Central Bank (ECB) meeting.
USD could receive new impetus next week
“Against the EUR, it should be difficult for the USD to make further gains for the time being since it can probably be assumed that the ECB will strike further hawkish tones at its meeting tomorrow.”
“The USD could then receive new impetus next week, when the Fed's decision is due on Wednesday. But until then, the EUR could set the pace.”
- Pound bulls are firmer on an Inverted Flag formation.
- The RSI (14) is struggling to enter the 40.00-60.00 range.
- Declining 20- and 50-EMAs add to the downside filters.
The EUR/GBP pair is displaying topsy-turvy moves in a narrow range of 0.8495-0.8505 in the early European session. A consolidation phase is witnessed by cross after a sheer downside move. The asset witnessed some significant offers while overstepping weekly highs at 0.8590, which dragged the asset sharply lower towards Tuesday’s low at 0.8493.
On an hourly scale, the asset is forming an Inverted Flag that indicates a rangebound move, which is followed by a fresh downside leg. Usually, the rangebound phase denotes the execution of shorts by those investors, which prefer to enter an auction after the establishment of a bearish bias.
The 20- and 50-period Exponential Moving Averages (EMAs) at 0.8509 and 0.8524 respectively are declining, which adds to the downside filters.
Meanwhile, the Relative Strength Index (RSI) (14) is attempting a move in a 40.00-60.00 range but is likely to find barricades near 60.00.
Should the asset drops below Tuesday’s low at 0.8492, the pound bulls will drag the asset towards May 18 low at 0.8450, followed by May 23 low at 0.8433.
Alternatively, the shared currency bulls could dictate the cross if it oversteps Tuesday’s high at 0.8584. An occurrence of the same will send the pair towards May 12 high at 0.8619. A breach of the latter will drive the asset towards the 29 September 2021 high at 0.8658.
EUR/GBP hourly chart
-637902670540817532.png)
EUR/JPY has seen a clear break above the 2018 high at 137.50. Subsequently, economists at Credit Suisse look for a test of the 2014 high at 149.78.
EUR/JPY to test the 149.78 high of 2014
“EUR/JPY has now seen a decisive break above the 137.50 high of 2018 and we look for further strength to test the 149.78 high of 2014.”
“Whilst we would expect the 149.78 high of 2014 to cap at first, big picture we look for a move to the long-term downtrend and 78.6% retracement resistance at 153.34/155.25.”
USDJPY has surged higher again. Analysts at Credit Suisse highlight the next resistance seen at the 2002 high at 135.20 and with their ultimate objective seen at 147/153.
USD/JPY maintains a multi-year “secular” base
“With a multi-year ‘secular’ base in place, we maintain our core and long-held bullish outlook for a test of the 135.20 high of 2002 next. Whilst we would look for a fresh cap here at first, we look for a sustained break in due course to our 147.62/153.01 core objective – the 38.2% retracement of the entire decline from the 1982 peak and key high of 1998.”
“Support at 126.36 ideally still holds. A break can see a corrective setback, but with fresh support then expected at 125.10.”
- USD/CHF retreats from the highest levels in three weeks as short-term DMA test bulls.
- Firmer RSI keeps buyers hopeful until the quote stays beyond a horizontal support area from late April.
USD/CHF pares weekly gains around 0.9740 heading into Wednesday’s European session. Even so, the Swiss currency (CHF) pair remains firmer for the fourth consecutive day as it battles the 21-DMA hurdle by the press time.
While keeping the USD/CHF buyers hopeful, the RSI (14) remains firmer, not overbought. Also favoring the quote’s further upside is the successful trading beyond the 50-DMA and a seven-week-old horizontal support region.
That said, the 21-DMA level surrounding 0.9740 restricts the pair’s immediate upside ahead of the latest swing high near 0.9780.
Also acting as an upside filter is the 23.6% Fibonacci retracement (Fibo.) of the March-May upside, near 0.9860.
Meanwhile, a convergence of the 50-DMA and 50% Fibo. near 0.9625, appears short-term key support to watch for the USD/CHF sellers.
Should the pair prices drop below 0.9625, a multi-day-old horizontal support zone around 0.9550 seems the last defense for bulls.
USD/CHF: Daily chart
Trend: Further upside expected
The Reserve Bank of Australia’s (RBA’s) 50 bp hike and hawkish statement delivered a jolt of energy to the aussie, which jumped from 0.7185 to a high of 0.7249. However, economists at Westpac believe that near-term trade below 0.70 is plausible.
Turbulent equity markets keeps a lid on the aussie
“Yield spreads should be more supportive of the A$ on a range of crosses for some time. But the fact that the aussie was back below 0.72 later on Tuesday is a reminder of the headwinds facing AUD/USD in particular.”
“The Fed’s quantitative tightening is underway and in coming months will accelerate, while +50 bp is locked in for both next week and late July, with talk of a September pause doused by key Fed officials. This is strong yield support for the US dollar. Moreover, A$ correlations with equities are elevated.”
“We see risks to the 0.7050-0.7100 area during June, though such weakness would provide opportunities to buy given likely more supportive conditions for A$ in Q3.”
Gold is seen extending its defensive trading around $1,850. Economists at TD Securities highlight that the yellow metal is close to entering a bear market trading regime.
Will proprietary traders’ gold length collapse in a post-pandemic world?
“Proprietary traders are holding onto this complacent length, as price action related to the war in Ukraine likely saved the consensus longs from additional liquidations in the face of a hawkish Fed. This cohort represents the greatest risk for a liquidation vacuum in the yellow metal, but with the next few hikes set in stone, traders might have to rely on Fed pricing post-September to catalyze a positioning squeeze.”
“The margin of safety for gold to hold onto its uptrend continues to subside, which only leaves a narrow window for the metal to avoid entering into a bear market trading regime. Notwithstanding, mean-reversion signals are now outperforming in both gold and silver, pointing to additional downside on the horizon.”
Commenting on the rapid decline in the yen, Japanese Finance Minister Shunichi Suzuki said on Wednesday, “weak yen has both merits and demerits.”
Although he made no comment on FX levels.
Related reads
- USD/JPY oscillates around a fresh two-decade high at 133.30, US Inflation in focus
- BOJ’s Kuroda: Rapid yen weakening in short period of time as seen recently is undesirable
Gold is trading choppy within a familiar trading range, challenging the critical $1,842 demand area. XAU/USD awaits a strong catalyst for a big move, FXStreet’s Dwhani Mehta reports.
Bull-bear tug-of-war around $1,850 extends
“The dollar could likely remain buoyant by the cautious market mood while also finding support from firmer yields. This could keep gold sellers hopeful in the near term. All eyes now turn towards the US inflation data release due on Friday for the next big move in gold price. The critical CPI figures will provide fresh hints on the Fed’s tightening path, impacting the USD valuations, as well as, the metal price.”
“The critical $1,842 demand area is the confluence of the horizontal 21 and 200-Daily Moving Averages (DMA). Daily closing below the latter is needed to extend the correction. Selling resurgence could see bears attacking Tuesday’s low of $1,837, below which a test of the previous week’s low of $1,829 remains on the cards. The last line of defense for buyers is seen at the $1,820 round level.”
“Any recovery will need acceptance above the $1,850 psychological barrier, above Monday’s high of $1,858 could be on the buyers’ radars. The previous week’s high of $1,870 will be a tough nut to crack on the road to recovery.”
- USD/JPY is holding it's two-decade high at 133.30 firmly on advancing hawkish Fed bets.
- A tight labor market and higher inflation may result in a bumper rate hike dictation by the Fed.
- Yen bulls have failed to capitalize on better-than-expected GDP numbers.
The USD/JPY pair is hovering around the fresh two-decade high, which is placed at 133.30 and is recorded in the Asian session. The asset advanced firmly after the US dollar index (DXY) extended its gains amid uncertainty over the release of the US inflation, which is scheduled on Friday. At the press time, the asset is juggling in a narrow range of 133.13-133.29 and is expected to deliver an upside break amid broader strength in the DXY.
The DXY is holding its intraday gains and is expected to recapture Tuesday’s high at 102.83. Investors are seeing the US Consumer Price Index (CPI) stable above 8%, which is sufficient to compel the Federal Reserve (Fed) to dictate a 50 basis point (bps) interest rate hike next week. The odds of a bumper rate hike by the Fed are strengthened, thanks to the upbeat US Nonfarm Payrolls (NFP) and price pressures.
It is worth noting that higher employment opportunities generated by the US economy in May will support the Fed to sound hawkish next week without any concerns. A tight labor market rules out the recession fears and provides more liberty to the Fed to take informed decisions.
On the Tokyo front, the yen bulls have failed to capitalize on better-than-expected Gross Domestic Product (GDP) numbers. Japanese Cabinet Office has reported a significant improvement in the annualized GDP numbers as the figure has improved to -0.5% against the expectations and the former print of -1%. Also, the quarterly GDP is climbed to -0.1% vs. the forecasts of -0.3% and the prior figure of -0.2%.
- Gold Price fades the bounce off weekly low, 200-DMA.
- Fears of global recession, anxiety ahead of key data/events weigh on XAUUSD.
- Options market keeps bearish bias intact, ECB, US CPI in focus.
Gold Price (XAU/USD) fails to keep buyers on the board as the US dollar rebound joins the market’s cautious sentiment ahead of the key data/events to weigh on the metal prices. That said, the quote remains pressed around $1,848, reversing the bounce off a one-week low, heading into Wednesday’s European session.
US Dollar Index tracks Treasury yields to weigh on Gold Price
The US Dollar Index (DXY) reverses the pullback from a fortnight high, up 0.18% around 102.52 by the press time. The greenback’s weakness the previous day could be linked to a record slump in the US trade deficit and hopes of an upbeat US budget. The US trade deficit for April marked the historical fall of 19.1% to USD87.1bn the previous day. US 10-year Treasury bond yields rise four basis points (bps) to 3.01% after snapping a six-day downtrend the previous day. The rebound in the bond yields appears to reflect the market’s fears of faster/heavier rate hikes from the US Federal Reserve (Fed). Despite the recently upbeat data, firmer US inflation expectations and hawkish bets over September’s 0.50% rate hike seems to underpin the bond coupons.
Also read: Gold Price Forecast: Tepid recovery within a risk-averse environment
Recession fears exert additional downside pressure

Businessman calculating tax with coins at desk.
Be it the Atlanta Fed’s GDP measure or comment from World Bank (WB) President David Malpass, not to forget China’s Vice Commerce Minister Wang Shouwen and Vice Finance Minister Zou Jiayi, all of them renewed recession fears and weigh on XAUUSD prices. The Atlanta Fed’s GDP gauge now predicts only 0.9% growth, suggesting the economy is on the brink of a recession.
Elsewhere, risk-negative news from Ukraine also weighs on the Gold Price. “Kyiv says it has not yet reached any agreement with Russia or Turkey to allow the safe passage of its grain ships in the Black Sea, injecting skepticism into a push by the U.N. to create a vital food corridor,” said Politico.
Amid these plays, market sentiment remains sour and pushes the S&P 500 Futures to snap a two-day uptrend with near 0.30% intraday losses. The risk-aversion underpins the US dollar’s safe-haven demand and weighs on the gold prices.
In the end, options market data also signals at an increasing bearish bias among the traders. The recent risk reversal (RR) print, the spread between calls and puts, marks the biggest daily fall in a fortnight with a -0.105 figure. In doing so, the RR braces for the third consecutive weekly fall.
Gold Price technical outlook
Gold Price fades bounce off the 23.6% Fibonacci retracement (Fibo.) of the April-May downturn as the 50-DMA pierces off the 100-DMA from above, known as the bear cross. Also keeping the metal sellers hopeful is the steady RSI and MACD conditions.
That said, the quote’s latest weakness eyes to retest the 200-DMA level surrounding $1,840 before directing sellers towards the aforementioned Fibo. level near $1,835.
Should the XAUUSD bears keep reins past $1,835, the odds of witnessing a fall towards $1,807 and the $1,800 threshold can’t be ruled out.
On the contrary, recovery remains elusive until the quote stays below the 100-DMA level around $1,890.
Following that, the $1,900 threshold and late April’s high around $1,920 could test the gold buyers.
Overall, gold prices are likely to witness further downside but the road to the south is bumpy.
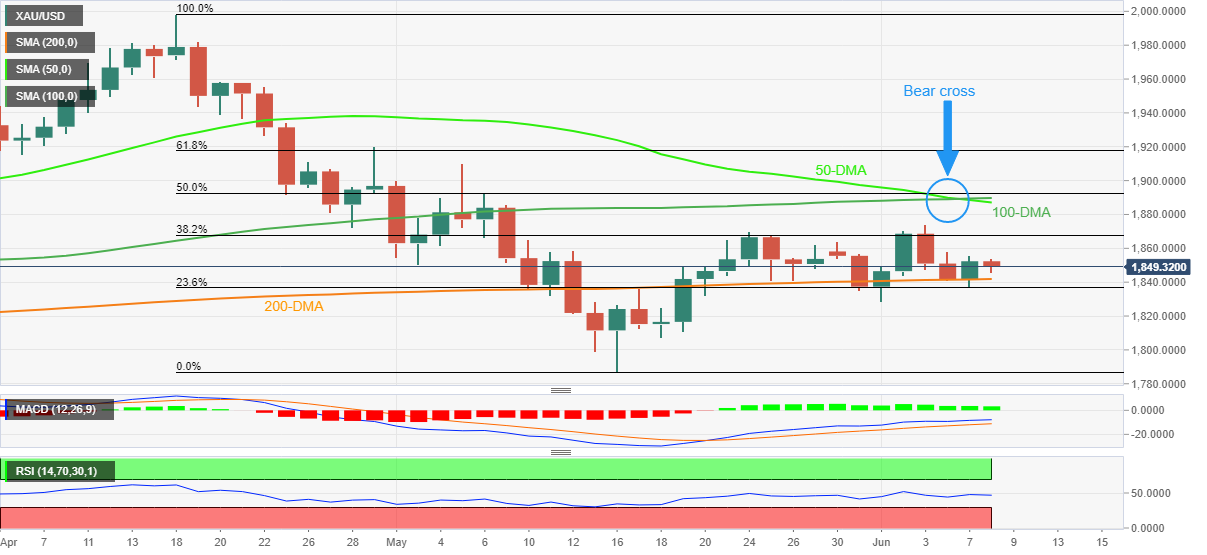
Great trading idea ahead on gold market
“Rapid yen weakening in a short period of time as seen recently is undesirable,” Bank of Japan (BOJ) Governor Haruhiko Kuroda said on Wednesday.
Additional quotes
It was inappropriate to describe households' acceptance of price hikes.
Withdrawing my remark about household' acceptance of price hikes.
Cost-push inflation is bad price hikes which won't last long.
Important for FX to move stably reflecting fundamentals.
Various macroeconomic models show weak yen is positive.
Yen weakening is positive to economy as long as moves are stable.
FX policy is not BOJ’s authority but of course that of government, MOF.
Market reaction
USD/JPY is holding the higher ground above 133.00 amid firmer Treasury yields and the US dollar. BOJ’s verbal intervention has little to no impact on the yen.
The pair is currently trading at 133.12, up 0.39% on the day.
Industrial Production in Germany rebounded less than expected in April, the official data showed on Wednesday, suggesting that the manufacturing sector activity is recovering at a slower pace.
Eurozone’s economic powerhouse’s industrial output jumped by 0.7% MoM, the federal statistics authority Destatis said in figures adjusted for seasonal and calendar effects, vs. a 1.0% expected and -.3.7% last.
On an annualized basis, German industrial production dropped 2.2% in April versus a 3.1% decline booked previously.
FX implications
The shared currency is trading on the defensive below 1.0700 on the downbeat German industrial figures.
At the time of writing, EUR/USD is trading at 1.0690, down 0.08% on the day.
About German Industrial Production
The Industrial Production released by the Statistisches Bundesamt Deutschland measures outputs of the German factories and mines. Changes in industrial production are widely followed as a major indicator of strength in the manufacturing sector. A high reading is seen as positive (or bullish) for the EUR, whereas a low reading is seen as negative (or bearish).
The outlook for cable remains mixed and is expected to trade between 1.2430 and 1.2670 in the next weeks, suggested FX Strategists at UOB Group Lee Sue Ann and Quek Ser Leang.
Key Quotes
24-hour view: “We expected GBP to ‘trade sideways within a range of 1.2470/1.2570’ yesterday. However, GBP dropped to 1.2433 before snapping back up to close higher at 1.2590 (+0.49%). The rapid bounce from the low has scope to extend but a sustained rise above 1.2630 is unlikely (next resistance is at 1.2670). On the downside, a break of 1.2540 (minor support is at 1.2570) would indicate that the current upward pressure has eased.”
Next 1-3 weeks: “Last Friday (03 Jun, spot at 1.2570), we highlighted that the sharp but short-lived swings have resulted in a mixed outlook and we expected GBP to trade between 1.2470 and 1.2670. Yesterday (06 Jun, spot at 1.2515), we highlighted that the underlying tone has softened and GBP could dip below the support at 1.2470. We added, “looking ahead, GBP has to close below 1.2430 before a sustained decline is likely”. GBP subsequently dropped briefly to 1.2433 before rebounding sharply. With the whippy price actions, the outlook remains mixed and further choppy movement would not be surprising, likely between 1.2430 and 1.2670.”
CME Group’s flash data for gold futures markets noted traders scaled back their open interest positions on Tuesday, this time by more than 1.1K contracts, reaching the third consecutive daily pullback. Volume, instead, reversed four daily pullbacks in a row and went up by nearly 17K contracts.
Gold remained side-lined around $1,850
Tuesday’s uptick in gold prices was accompanied by shrinking open interest, leaving the near-term price action tilted to the downside. In the meantime, the ounce troy of the precious metal continues to navigate around the $1,840/50 zone for the time being.
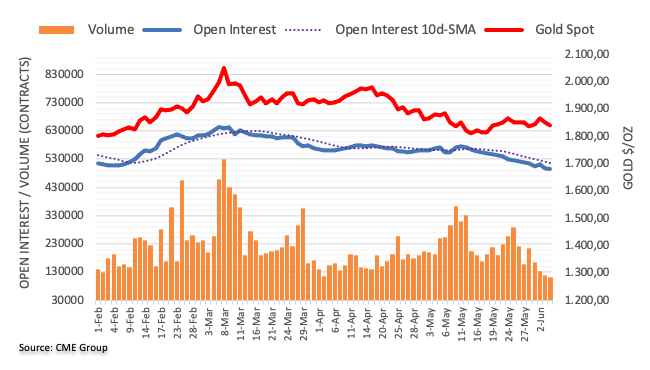
- Aussie bulls look firmer above the 200-EMA at 0.7153.
- A Symmetrical Triangle formatting is advocating a rangebound move ahead.
- The RSI (14) has shifted into the 40.00-60.00, which signals a volatility contraction.
The AUD/USD pair has witnessed a minor rebound after slipping below the crucial support of 0.7200 in the late Tokyo session. On a broader note, significant offers after an attempt to overstep the critical resistance of 0.7267 have pushed the asset into a rangebound territory.
A Symmetrical Triangle formation on a four-hour scale after failing to sustain above May’s high at 0.7267 is indicating volatility contraction ahead. The ascending trendline of the above-mentioned chart pattern is placed from Thursday’s low at 0.7140 while the downward sloping trendline is plotted from Friday’s high at 0.7283.
Despite the deployment of significant offers from the market participants, aussie bulls have defended the 200-period Exponential Moving Average (EMA), which is trading mildly above 0.7150.
Meanwhile, the Relative Strength Index (RSI) (14) has shifted into a 40.00-60.00 range, which bolsters the signals of consolidation ahead.
A decisive move above June’s high at 0.7283 will trigger the upside break of a Symmetrical Triangle, which will infuse fresh blood into the aussie bulls for an upside move towards the April 19 low at 0.7343, followed by the round-level resistance at 0.7400.
On the flip side, aussie bulls can lose their grip if the asset drops below Thursday’s low at 0.7140, which will drag the asset towards May 26 high at 0.7110. Breach of the latter will expose the asset to more downside towards May 18 high at 0.7048.
AUD/USD four-hour chart
-637902634384660328.png)
FX Strategists at UOB Group Lee Sue Ann and Quek Ser Leang noted EUR/USD is still seen within the 1.0635-1.0785 range in the next weeks.
Key Quotes
24-hour view: “We held the view yesterday that EUR ‘is likely to edge lower but a sustained drop below 1.0650 is unlikely’. Our view was not wrong as EUR dropped to 1.0650 before rebounding to close little changed at 1.0699 (0.05%). Downward pressure has eased and EUR is likely to trade sideways for today, expected to be within a range of 1.0665/1.0725.”
Next 1-3 weeks: “Our view from yesterday (07 Jun, spot at 1.0695) still stands. As highlighted, the recent build-up in upward momentum has fizzled out and EUR is not ready to move above 1.0800 just yet. Overall, EUR is likely trade 1.0625 and 1.0785 for now.”
- USD/CAD recovers from seven-week low during the second consecutive monthly fall.
- RSI hints at gradual weakness in bearish bias but 1.2660-70 appears tough nut to crack for buyers.
- Ascending trend line from October 2021 adds to the downside filters.
USD/CAD rebounds from the lowest levels since late April, picking up bids near 1.2550 during early Wednesday morning in Europe.
In doing so, the Loonie pair takes a U-turn from a one-year-old ascending support line. Also keeping the pair buyers hopeful is the downbeat RSI (14) line suggesting a weaker bearish momentum since the quote refreshed its yearly top during early May.
That said, the pair’s latest recovery moves may aim for the weekly top surrounding 1.2620.
However, a convergence of the 200-DMA, descending trend line from May 12 and 50% Fibonacci retracement (Fibo.) of June 2021 to May 2022 upside, around 1.2660-70, becomes crucial resistance for the bulls to cross to retake control.
On the contrary, a downside break of the immediate support line, at 1.2520 by the press time, will have another filter to the south, namely an ascending trend line from October 2021, around 1.2490.
Should the USD/CAD prices drop below 1.2490, the odds of the pair’s south-run towards the yearly lows marked in April around 1.2400 can’t be rejected.
USD/CAD: Daily chart
Trend: Further recovery expected
- USD/TRY remains on the front foot for the third consecutive day.
- Turkish President Erdogan’s rejection to rate hike contrasts Fed’s hawkish bias to favor bulls.
- Risk-off mood, firmer yields add strength to the pair’s upside momentum.
- US CPI appears the key as traders struggle to find Fed’s path post-September.
USD/TRY stays on the way to 17.00 threshold as it refreshes the yearly high for the third consecutive day while picking up bids near 16.85 ahead of Wednesday’s European session.
The broad US dollar rebound could be a general catalyst for the Turkish lira (TRY) pair’s latest strength. However, a monetary policy divergence between the US Federal Reserve (Fed) and the Central Bank of the Republic of Türkiye (CBRT) appears the fundamental base favoring bulls.
Despite witnessing the 70% inflation at home, Turkish President Tayyip Erdogan kept his pledge to reject the interest rate increases. “Speaking after a cabinet meeting this week, Erdogan said Turkey will not raise interest rates but rather continue cutting them in the face of high living costs,” said Reuters.
On the other hand, the US Dollar Index (DXY) reverses the pullback from a fortnight high as the Treasury bond yields regain upside momentum after snapping a six-day uptrend the previous day. The reason behind the greenback’s rebound could be linked to the anxiety ahead of Thursday’s European Central Bank (ECB) meeting, as well as Friday’s US Consumer Price Index (CPI) for May.
Additionally, the Atlanta Fed’s GDP measure, World Bank (WB) President David Malpass and officials from China, namely Vice Commerce Minister Wang Shouwen and Vice Finance Minister Zou Jiayi, renewed recession fears to offer extra strength to the US dollar.
It's worth observing that the risk-negative news from Ukraine also weighs on the mood and fuel the USD/TRY prices. “Kyiv says it has not yet reached any agreement with Russia or Turkey to allow the safe passage of its grain ships in the Black Sea, injecting skepticism into a push by the U.N. to create a vital food corridor,” per Politico.
The latest bullish bias of the USD/TRY traders is likely to extend amid a light calendar and risk-off mood.
Technical analysis
A daily closing beyond a three-month-old resistance line, around 16.72 by the press time, directs USD/TRY towards 17.00 and 17.25 hurdles before directing the bulls towards the 2021 peak surrounding 17.40.
- A positive DXY has offset the optimism of bullish US indices.
- The RBI has elevated its repo rate by 50 bps to 4.90%, inflation is seen stable at above 6%.
- Chinese equities are subdued as investors await China's CPI.
Markets in the Asian domain are trading mixed amid different respective fundamentals. A recovery in Wall Street on Tuesday was expected to infuse optimism in the Asian equities, however, the positive US dollar index (DXY) on Wednesday is guiding the risk-sensitive assets.
At the press time, Japan’s Nikkei225 added 0.92% and Hang Seng gained 1.73% while China A50 is trading flat and Nifty50 eased 0.46%.
Chinese equities are trading flat on Wednesday as investors are awaiting the release of China’s Consumer Price Index (CPI), which is due on Friday. China CPI is seen higher at 2.5% against the prior print of 2.1%. A higher print of China inflation will restrict the People’s Bank of China (PBOC) to flush more liquidity into the economy. This may dampen the growth forecasts and will bring shrinkage into the economy.
Indian indices are displaying wild moves as the Reserve Bank of India (RBI) has elevated its repo rate by 50 basis points (bps). A rate hike announcement by the RBI was already anticipated by the market participants as the Indian economy is facing the headwinds of soaring oil and commodity prices. Officially, the RBI’s repo rate stands at 4.90% after the rate hike announcement. The RBI is expecting sustainability of inflation above 6% for the first three quarters of Calendar Year (CY) 2022.
- USD/INR remains pressured inside familiar trading range despite RBI’s 50 bps rate hike.
- RBI surpasses market forecasts by increasing the Repo Rate to 4.9%.
- Inflation fears, firmer oil prices exert downside pressure on the INR.
- Risk-aversion wave, US dollar strength ahead of key data/events keep bears hopeful.
USD/INR stays indifferent to the RBI’s rate increase during early Wednesday in Europe. In doing so, the Indian rupee (INR) pair seesaws around 77.70 by the press time.
Having been baffled by eight-year high inflation, the Reserve Bank of India (RBI) announces 50 basis points (bps) of a lift in the key Repo Rate to 4.9%. However, the Indian central bank left the Reverse Repo Rate unchanged at 3.35%.
Along with the rate hike, RBI Governor Shaktikanta Das mentioned that inflation has steeply increased much beyond the upper tolerance level. The policymaker also mentioned to remain focused on bringing down inflation closer to target. “Recovery in domestic economic activity remains firm,” adds RBI’s Das.
In addition to the growing inflation fears, the recent chatters surrounding global economic slowdown and the upbeat oil prices also challenge the USD/INR sellers. Furthermore, recovery in the US Treasury yields and anxiety ahead of Thursday’s European Central Bank (ECB) meeting, as well as Friday’s US Consumer Price Index (CPI) for May, favor the US dollar to remain firmer and favor USD/INR buyers.
That said, China’s Vice Commerce Minister Wang Shouwen joined China’s Vice Finance Minister Zou Jiayi to renew fears of global economic slowdown, as well as fears of receding demand. The policymakers were recently in agreement over a belief that the global demand growth is slowing. On the same line were comments from World Bank (WB) President David Malpass who warned that faster-than-expected tightening could push some countries into a debt crisis similar to the one seen in the 1980s seemed to have weighed on the quote of late.
Additionally weighing the market sentiment and favoring the USD/INR upside is the risk-negative news from Ukraine. “Kyiv says it has not yet reached any agreement with Russia or Turkey to allow the safe passage of its grain ships in the Black Sea, injecting skepticism into a push by the U.N. to create a vital food corridor,” per Politico.
It’s worth noting that India’s reliance on oil imports and the record deficit, as well as the exodus of foreign funds from the national market, provide extra strength to the USD/INR prices.
Amid these plays, the US 10-year Treasury bond yields rise two basis points (bps) to 2.99%, after snapping a six-day downtrend the previous day, whereas the S&P 500 Futures print the first daily loss in three around 4,140. Further, the US Dollar Index (DXY) reverses the pullback from a fortnight high while WTI crude oil prices seesaw around $120.00 after refreshing a three-month high earlier in the week.
Moving on, the market’s risk appetite appears the key catalyst for the USD/INR traders before ECB and the US CPI. Should the fears of faster/heavier rate hikes gain momentum, the Indian rupee pair can have further upside to witness.
Technical analysis
USD/INR remains pressured inside a three-week-old trading range between 77.80 and 77.35. However, the bulls appear running out of steam as RSI hints at receding bullish momentum. Hence, the USD/INR prices are likely to witness a pullback towards immediate support.
- WTI grinds lower amid sluggish RSI, MACD, reverses previous day’s gains.
- 200-HMA adds to the downside filters, ascending trend line from May-end guards immediate upside.
WTI crude oil prices pare the previous day’s gains, around $118.00 as sluggish oscillators fail to extend the recovery moves even as the short-term support limits immediate downside. That said, the black gold remains indecisive heading into Wednesday’s European session.
It’s worth noting that the market’s indecision, as well as the recent US dollar rebound and recession fears, may weigh on the black gold prices.
However, one-week-old horizontal support of around $116.35-45 can challenge the energy bears. Also acting as a downside filter is the 200-HMA level of $115.35.
In a case where the WTI prices drop below $115.35, the odds of witnessing a slump towards the monthly low near $110.00 can’t be ruled out.
Meanwhile, recovery moves need validation from an upward sloping trend line from May 31, at $119.50 by the press time.
Following that, the $120.00 round figures could offer an intermediate halt during the run-up to refresh the yearly high, currently around $126.50.
WTI: Hourly chart
Trend: Bullish
- EUR/USD has slipped to 1.0680 after failing to sustain above the psychological resistance of 1.0700.
- The DXY is scaling north on advancing odds of a higher US inflation figure.
- Any delay in a rate hike by the ECB would worsen the inflation situation.
The EUR/USD pair is scaling lower gradually after failing to sustain above the psychological resistance of 1.0700. A bearish open test-drive move has been recorded in the asset as the shared currency bulls faced selling pressure around 1.0708 after a nominal upside at open. The major slipped further to near 1.0681 and is indicating more downside amid uncertainty over the interest rate decision by the European Central Bank (ECB) and the release of the US inflation.
The market participants have forecasted the maintenance of the status quo by the ECB. The central bank will keep the interest rates unchanged at 0% despite mounting price pressures. It is worth noting that the eurozone Harmonized Index of Consumer Prices (HICP) landed above 8% last week. Other Western leaders have also displayed higher inflation, however, their respective central banks have already elevated their interest rates to contain the galloping prices.
The ECB has not raised its interest rates yet and any further delay in the rate hikes will infuse an adrenaline rush into the inflation monster.
Apart from the ECB monetary policy, investors are awaiting the eurozone's Gross Domestic Product (GDP) numbers. The quarterly and annual GDP are seen unchanged at 0.3% and 5.1% respectively.
Meanwhile, the US dollar index (DXY) is marching towards Tuesday’s high at 102.84 on higher US Treasury yields. The 10-year US Treasury yield is hovering around 3% as the US inflation is seen above 8%. The US Consumer Price Index (CPI) is expected to land at 8.3% while the core CPI may print at 5.9%.
- GBP/USD reverses the recovery from three-week low, snaps two-day uptrend.
- Chatters over Brexit falsification grow stronger amid political chaos in the UK.
- US Treasury yields underpin greenback’s recovery moves ahead of US inflation.
- Sour sentiment can keep sellers hopeful amid a light calendar.
GBP/USD fades bounce off three-week low, renews intraday bottom around 1.2565, amid fresh fears concerning Brexit and global recession, as well as Fed’s faster/heavier rate hikes. In doing so, the cable pair snaps a two-day uptrend during the early Wednesday morning in Europe.
Although UK PM Boris Johnson managed to overcome the no-confidence vote, the political drama in Britain doesn’t stop. Recently, Brexit Party Leader Nigel Farage poured cold water on the face of the Labour Party’s expectations to benefit from Johnson’s political struggle by highlighting the fears of re-joining the European Union.
Elsewhere, China’s Vice Commerce Minister Wang Shouwen joined China’s Vice Finance Minister Zou Jiayi to renew fears of global economic slowdown, as well as fears of receding demand. The policymakers were recently in agreement over a belief that the global demand growth is slowing.
On the same line were comments from World Bank (WB) President David Malpass who warned that faster-than-expected tightening could push some countries into a debt crisis similar to the one seen in the 1980s seemed to have weighed on the quote of late.
It’s worth noting that US 10-year Treasury bond yields rise two basis points (bps) to 2.99% after snapping a six-day downtrend the previous day. A record slump in the US trade deficit and hopes of an upbeat US budget seemed to have recalled the US Treasury bond sellers. The US trade deficit for April marked the historical fall of 19.1% to USD87.1bn the previous day.
Additionally weighing the market sentiment and underpinning the GBP/USD downside is the risk-negative news from Ukraine. “Kyiv says it has not yet reached any agreement with Russia or Turkey to allow the safe passage of its grain ships in the Black Sea, injecting skepticism into a push by the U.N. to create a vital food corridor,” said Politico.
Amid these plays, the S&P 500 Futures print the first daily loss in three around 4,140 while the US Dollar Index (DXY) reverses the pullback from a fortnight high.
Moving on, a light calendar can keep GBP/USD traders troubled ahead of Thursday’s European Central Bank (ECB) meeting, as well as Friday’s US Consumer Price Index (CPI) for May.
Technical analysis
GBP/USD remains sidelined inside a week-long trading range between 1.2600 and 1.2480. However, the bulls have multiple hurdle to cross as compared to the bears and hence the downside bias gains major accolades.
- Gold price is struggling to hold itself above $1,850.00 ahead of US inflation.
- Firmer US NFP and inflation expectations are compelling for a 50 bps rate hike next week.
- An Ascending Triangle formation is indicating a consolidation ahead.
Gold price (XAU/USD) is displaying back and forth moves in the Asian session. The precious metal is oscillating in a $2 range after a pullback move from Tuesday’s high at $1,855.64. The mega event of the US inflation this week is going to insert extreme volatility in the FX domain as May inflation figures will have a significant impact on the stance to be adopted by the Federal Reserve (Fed) next week.
Considering the upbeat US Nonfarm Payrolls and above 8% annual inflation figure, Fed chair Jerome Powell may dictate an aggressive interest rate policy. No doubt, higher price pressures are eating the paychecks of households in the US, which seeks exclusive attention from the Fed. Therefore, a consecutive rate hike announcement of 50 basis points (bps) by Fed Powell will be an optimal decision to keep up the fight against inflation.
Meanwhile, the US dollar index (DXY) is facing barricades around its critical resistance at 102.48. A rebound in the positive market sentiment on Tuesday trimmed the DXY’s appeal and underpinned the risk-perceived currencies. For an upside move, the DXY needs to violate Tuesday’s high at 102.84.
Gold technical analysis
On a four-hour scale, XAU/USD is trading in an Ascending Triangle chart pattern whose upward sloping trendline is placed from May 16 low at $1,786.94 while the horizontal resistance is plotted from May 24 high at $1,869.69. The 21-period Exponential Moving Average (EMA) at $1,850.00 is overlapping with the gold prices, which signals a consolidation ahead. Meanwhile, the Relative Strength Index (RSI) (14) is oscillating in the 40.00-60.00 range, which confirms topsy-turvy moves in upcoming sessions.
Gold four-hour chart
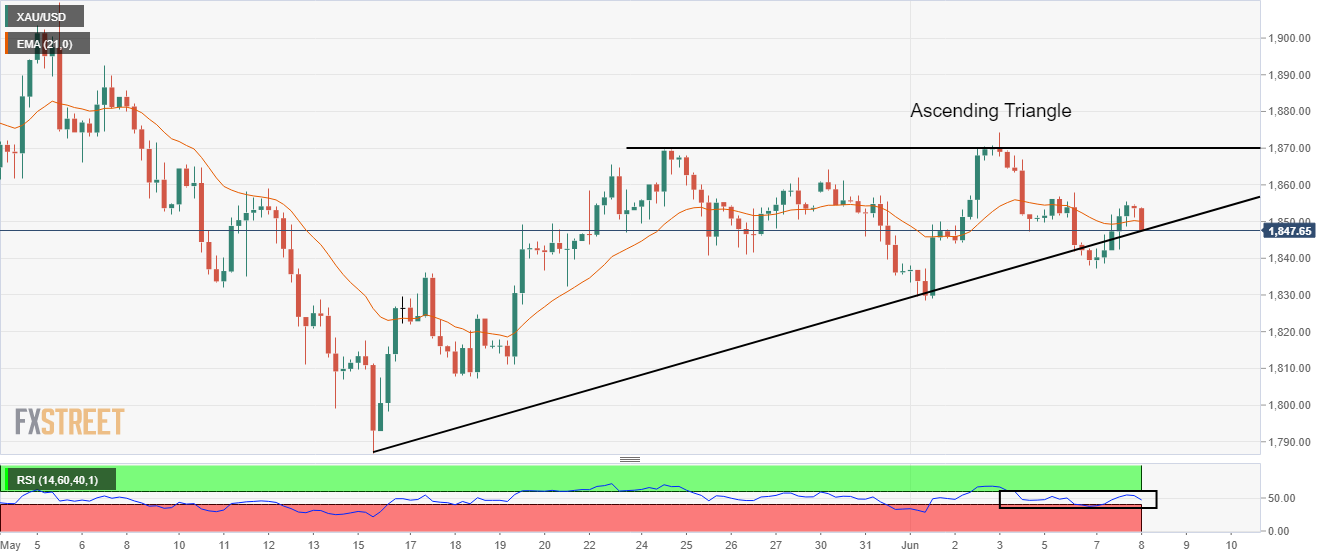
New Zealand (NZ) Finance Minister Grant Robertson said that he is 'confident about the resilience' of the economy but warned that the supply chain issues could extend into the next year.
Key takeaways
“The Government's committed to achieving its target of producing a Budget surplus in 2025, but warns that "there are no easy decisions.”
“Of course, we are committed to reaching that surplus.”
"And I’m very confident about the resilience of the New Zealand economy to be able to do that. But I’ve also been a Minister of Finance through a global pandemic and I know that forces you…there are no costless decisions, there are no easy decisions. It forces us as a Government to be nimble and adaptable that’s what we’ve been doing…the proof is in the pudding."
“What I accept is that there is a high level of demand in the New Zealand economy,"
"That demand is not currently being met by supply. And those supply chain constraints are largely driven by global factors. There are factors within the domestic economy such as labour supply, which have been an issue. But actually they in turn are driven by the international issues with Covid...”
“…Any spending by definition that any government would do has the potential to fuel inflation. What’s important is to make sure that the investments we make are targeted that they achieve the goals that are wider than just the management of inflation."
Related reads
- NZD/USD juggles below 0.6500, yields surge near 3% ahead of US Inflation
- China’s Vice Commerce Minister: Foreign trade faces uncertainties and huge pressure
- NZD/USD is oscillating below 0.6500 as investors are sidelined ahead of the US inflation.
- The US CPI may remain unchanged at 8.3% while the core CPI will see a slump to 5.9%.
- NZ FinMin Grant Robertson dictated that the tailwinds of lower jobless rates and debt are supporting growth levels.
The NZD/USD pair is auctioning in a narrow range of 0.6470-0.6480 in the Asian session. A corrective move after failing to overstep the psychological resistance of 0.6500 on Tuesday may turn into an initiative buying structure ahead of the flat US Consumer Price Index (CPI), which is due on Friday.
The market participants have forecasted that the US inflation will remain unchanged at 8.3% on an annual basis. Higher oil and commodity prices are keeping the price pressures at elevated levels despite the two rate hike announcements by the Federal Reserve (Fed) in March and May. While the core CPI that doesn’t include food and energy prices is expected to slip to 5.9% from the prior print of 6.2%.
Advancing odds of higher inflation is strengthening the US Treasury yields. The 10-year US Treasury yields have jumped to near 3% as higher inflation will bolster the chances of one more jumbo rate hike by the Fed next week. Upbeat employment data and soaring inflation will be taken care of by a 50 basis point (bps) interest rate hike.
On the kiwi front, the antipodean is expected to gain strength on optimist commentary from New Zealand Finance Minister (FinMin) Grant Robertson. According to NZ FinMin Robertson, the kiwi economy is facing the headwinds of rising costs but with the presence of a low jobless rate, decent growth levels, and low debt. The favorable catalysts will safeguard the prospects in a challenging year. A light economic calendar will enhance the dominance of the greenback but next week, investors’ focus will be on the kiwi Gross Domestic Product (GDP) numbers.
- AUD/USD fades the previous day’s rebound from a fortnight low.
- Sour sentiment, firmer US Treasury yields favor bears amid a light calendar.
- Ex-RBA Governor Macfarlane favors faster rate hikes, expects more inflation woes.
- China’s diplomats fear a slowdown in global demand.
AUD/USD remains mildly offers around 0.7220-25 as bears jostle with the buyers amid mixed sentiment and cautious mood ahead of the week’s key data/events. In doing so, the Aussie pair struggles to justify hawkish comments from the former Governor of the Reserve Bank of Australia (RBA) Ian Macfarlane.
Ex-RBA Governor Macfarlane warned over persistently high inflation and the need to sharply hike rates in early Wednesday. The former policymaker also mentioned, “There is enough scarcity in Australia and in the US to keep the rate of inflation high.”
Also read: Ex-RBA Governor Macfarlane: Interest rates could rise sharply in order to fight inflation
On the contrary, China’s Vice Commerce Minister Wang Shouwen joined China’s Vice Finance Minister Zou Jiayi to renew fears of global economic slowdown, as well as fears of receding demand. The policymakers were recently in agreement over a belief that the global demand growth is slowing.
Also read: China’s Vice Commerce Minister: Foreign trade faces uncertainties and huge pressure
It’s worth noting that recovery in the US Treasury yields and anxiety ahead of Thursday’s European Central Bank (ECB) meeting, as well as Friday’s US Consumer Price Index (CPI) for May, seems to grind the AUD/USD pair’s moves.
That said, US 10-year Treasury bond yields rise two basis points (bps) to 2.99% after snapping a six-day downtrend the previous day. A record slump in the US trade deficit and hopes of an upbeat US budget seemed to have recalled the US Treasury bond sellers. The US trade deficit for April marked the historical fall of 19.1% to USD87.1bn the previous day.
Elsewhere, US Treasury Secretary Janet Yellen and hopes of faster economic recovery in China tried to defend the market optimists. On Tuesday, US Treasury Secretary Yellen testified on the Fiscal Year 2023 Budget before the Senate Finance Committee while saying that the US economy faces challenges from "unacceptable levels of inflation", as well as headwinds from supply chain snags. The policymaker added, “An appropriate budget is needed to complement Fed’s actions to tame inflation without harming the labor market.”
It should be noted that comments from World Bank (WB) President David Malpass who warned that faster-than-expected tightening could push some countries into a debt crisis similar to the one seen in the 1980s seemed to have weighed on the quote of late. On the same line could be the risk-negative news from Ukraine. “Kyiv says it has not yet reached any agreement with Russia or Turkey to allow the safe passage of its grain ships in the Black Sea, injecting skepticism into a push by the U.N. to create a vital food corridor,” said Politico.
Technical analysis
A fortnight-old support line defends AUD/USD buyers at around 0.7205. However, the 200-DMA and the recent peak, respectively around 0.7255 and 0.7285, will challenge the Aussie pair’s upside before giving control to the bulls.
China's Vice Commerce Minister said in a statement on Wednesday, the country’s foreign trade stabilization faces uncertainties and huge pressure hit by domestic and external factors.
When asked about slowing trade growth, he said that “Chinese importers and exporters are under pressure due to logistics problems and soaring raw material prices.”
His comments come a day ahead of the release of China’s trade balance data.
Market reaction
AUD/USD was last seen trading modestly flat around 0.7225.
Former Reserve Bank of Australia (RBA) Governor Ian Macfarlane warned over persistently high inflation and the need to sharply hike rates, in a speech on Wednesday.
Key quotes
Will be surprised if the CPU fell back to 2%.
There is enough scarcity in Australia and in the US to keep the rate of inflation high.
Expect interest rates to rise sharply in order to fight inflation, the 50bp hike yesterday was the correct decision.
Market reaction
AUD/USD is holding steady around 0.7225 amid a cautious market tone and a broadly firmer US dollar.
- Sterling is pressured as the US dollar battles back to life.
- The focus will turn to the US inflation data later this week while UK politics hamstrings GBP.
At 1.2577, GBP/USD is under a little pressure in Tokyo after sliding from a high of 1.2597 and reaching a low of 1.2566. In the prior session, sterling dropped to its lowest level in nearly three weeks at 1.2433 before trimming losses in a surge of demand when London flipped over despite the political headwinds for British Prime Minister Johnson. The greenback was sold off which save the day for cable longs.
Boris Johnson survived a confidence vote of 211 to 148, but his 59% share of the vote was less than the 63% achieved by his predecessor Theresa May in her confidence vote of December 2018 who was replaced seven months later, as Reuters remarked. The victory was bitter given he now faces a leadership challenge. With so many of his party had voted against him, the prime minister has effectively lost his majority support in parliament, with the risk that his government is paralysed.
Meanwhile, as measured by the 10-year Treasury yield, yields were falling overnight for the second day of trade this week, down from the 3.062% highs to print lows of 2.963%. Consequently, the greenback was dropping to the lows of the day near 102.30as measured by the US dollar index (DXY), vs. a basket of six currencies. In Asia, DXY is regaining some ground, up 0.18% and reaching a high of 102.558.
Meanwhile, besides the European Central Bank this week, traders will be looking to the US inflation data due Friday for clues on the Federal Reserve's interest rate hike trajectory. We are in a blackout period in terms of Fed speakers. The event will be an important one ahead of the Federal Open Market Committee meeting on June 14-15 where another 50 basis points of rate hikes are currently being priced in.
- EUR/USD takes offers to renew intraday low, reverses the previous day’s recovery.
- 100-SMA, monthly horizontal support test bears before giving them control.
- RSI hints at further downside, 50-SMA adds to the list of resistances.
EUR/USD extends pullback from the weekly resistance line to consolidate the previous day’s losses during Wednesday’s Asian session. That said, the major currency pair takes offers to refresh its intraday low near 1.0685 after snapping a two-day downtrend on Tuesday.
The quote’s pullback from the immediate resistance line also portrays the inability to cross the 50-SMA. Additionally keeping the sellers hopeful is the descending RSI (14) line.
That said, the 100-SMA level of 1.0665 appears the immediate support for the EUR/USD traders to watch.
Following that a one-month-old horizontal support area near 1.0645-35 will be a tough nut to crack for the pair sellers, a break of which won’t hesitate to recall sub-1.0600 levels on the chart.
Alternatively, the aforementioned resistance line and the 50-SMA, respectively near 1.0710 and 1.0720, restrict EUR/USD recovery.
Also keeping the pair buyers on guesses are the multiple resistances marked since late May around 1.0750 and 1.0765, as well as the last monthly high near 1.0785.
Overall, EUR/USD remains on the bear’s radar but the downside appears limited.
EUR/USD: Four-hour chart
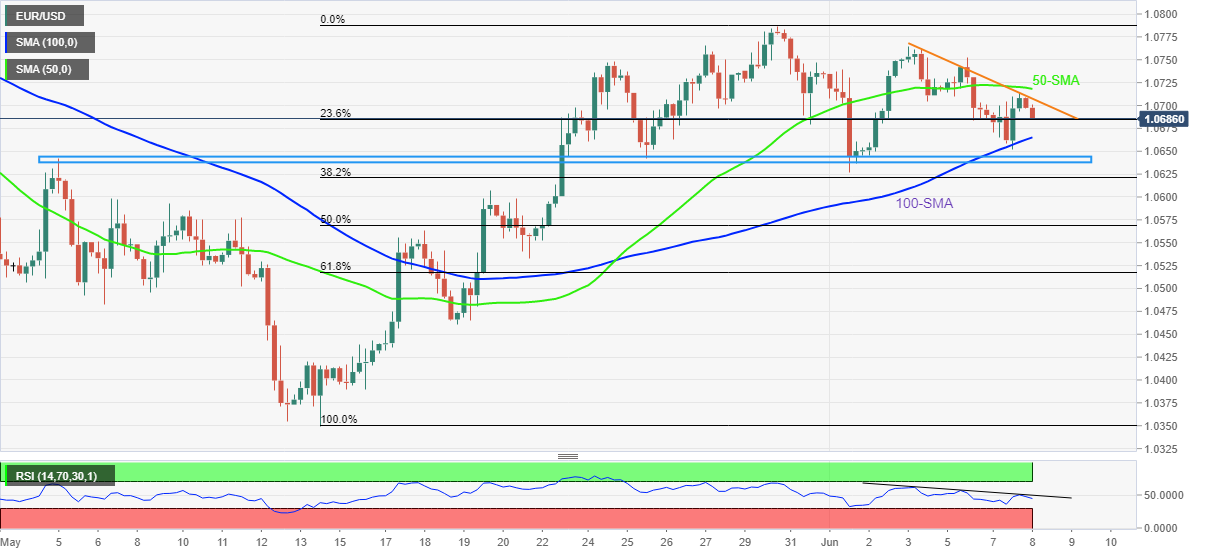
Trend: Further weakness expected
- Market sentiment dwindles amid a lack of major catalysts.
- S&P 500 Futures pause two-day recovery, US 10-year Treasury yields rebound.
- Chatters surrounding inflation and central bank moves may entertain traders ahead of ECB, US inflation.
Global markets remain sluggish as traders seek fresh clues during early Wednesday. However, widening fears of tighter monetary policy at the US Federal Reserve (Fed) renew the US Treasury yields’ upside momentum, which in turn challenges the riskier assets.
While portraying the mood, US 10-year Treasury bond yields rise two basis points (bps) to 2.99% after snapping a six-day downtrend the previous day. That said, the S&P 500 Futures print the first negative daily performance in three, down 0.15% around 4,150 at the latest.
A record slump in the US trade deficit and hopes of an upbeat US budget seemed to have recalled the US Treasury bond sellers. The US trade deficit for April marked the historical fall of 19.1% to USD87.1bn the previous day. Elsewhere, US Treasury Secretary Janet Yellen and hopes of faster economic recovery in China tried to defend the market optimists. On Tuesday, US Treasury Secretary Yellen testified on the Fiscal Year 2023 Budget before the Senate Finance Committee while saying that the US economy faces challenges from "unacceptable levels of inflation", as well as headwinds from supply chain snags. The policymaker added, “An appropriate budget is needed to complement Fed’s actions to tame inflation without harming the labor market.”
It should be noted that comments from World Bank (WB) President David Malpass who warned that faster-than-expected tightening could push some countries into a debt crisis similar to the one seen in the 1980s seemed to have weighed on the quote of late. On the same line could be the risk-negative news from Ukraine. “Kyiv says it has not yet reached any agreement with Russia or Turkey to allow the safe passage of its grain ships in the Black Sea, injecting skepticism into a push by the U.N. to create a vital food corridor,” said Politico.
To sum up, the market’s anxiety ahead of Thursday’s European Central Bank (ECB) meeting, as well as Friday’s US Consumer Price Index (CPI) for May, seems to grind the moves. However, the US Treasury yields and the US dollar appear to benefit from the cautious mood. That said, headlines concerning China and Russia may offer intermediate directions.
In recent trade today, the People’s Bank of China (PBOC) set the yuan (CNY) at 6.6634 vs. last close of 6.6712.
About the fix
China maintains strict control of the yuan’s rate on the mainland.
The onshore yuan (CNY) differs from the offshore one (CNH) in trading restrictions, this last one is not as tightly controlled.
Each morning, the People’s Bank of China (PBOC) sets a so-called daily midpoint fix, based on the yuan’s previous day's closing level and quotations taken from the inter-bank dealer.
- USD/JPY takes the bids to renew multi-year high on market’s cautious mood ahead of the key data/events.
- US Treasury yields regain upside momentum after pausing six-day advances on Tuesday.
- Japan’s upward revision to Q1 2022 GDP fails to stop yen’s weakness amid fears of more policy divergence.
USD/JPY skyrockets to 133.21, the highest level since early 2002, as a rebound in the US Treasury yields joins fears of further widening of the monetary policy divergence between the Bank of Japan (BOJ) and the US Federal Reserve (Fed). In doing so, the yen pair rises for the fourth consecutive day despite witnessing headwinds the previous day.
The US 10-year Treasury bond yields rise 2.2 basis points (bps) to 2.99% after snapping a six-day downtrend the previous day.
It should be noted that the market’s consolidation of recent moves, amid a lack of major data/events, as well as risk-negative news from Ukraine seem to underpin the US dollar’s safe-haven demand and offers extra strength to the USD/JPY run-up.
While portraying the mood, the S&P 500 Futures print the first negative daily performance in three, down 0.15% around 4,150 at the latest.
Other than the pre-data/event anxiety, the BOJ’s sustained bias to keep monetary policy easy in contrast to the Fed’s policy tightening measures also propel the USD/JPY prices. On Tuesday, BOJ Governor Haruhiko Kuroda said, “Would proceed with exit strategy if 2% inflation target in sight but now is not that time.”
Elsewhere, fears of global recession and chatters surrounding optimism budget from the US try to challenge the USD/JPY prices. The growth fears escalate on a comment from World Bank (WB) President David Malpass who warned that faster-than-expected tightening could push some countries into a debt crisis similar to the one seen in the 1980s. Also exerting downside pressure on the bond coupons were comments from US Treasury Secretary Janet Yellen and hopes of faster economic recovery in China, both of which favor risk appetite. On Tuesday, US Treasury Secretary Yellen testified on the Fiscal Year 2023 Budget before the Senate Finance Committee while saying that the US economy faces challenges from "unacceptable levels of inflation", as well as headwinds from supply chain snags. The policymaker added, “An appropriate budget is needed to complement Fed’s actions to tame inflation without harming the labor market.”
Earlier in the day, Japan’s final reading of Q1 2022 GDP improved to -0.1% versus -0.3% previous estimations while the Annualized figures also eased to -0.5% from -1.0% initial forecasts.
Looking forward, USD/JPY traders are likely to witness further upside amid strong yields and fears of further widening in the BOJ and the Fed policies. However, Friday’s US Consumer Price Index (CPI) for May appears crucial to watch for clear directions.
Technical analysis
The 138.2% Fibonacci retracement of May’s downside, around 133.30, joins the overbought RSI to challenge the USD/JPY pair’s immediate upside, a break of which could direct the quote towards 2002’s yearly top near 135.20.
Alternatively, pullback moves remain elusive until staying beyond the previous resistance, near 131.30-40. Following that, a pullback towards the 61.8% Fibonacci retracement (Fibo.) level of 129.45 can’t be ruled out.
- EUR/JPY has climbed above 142.30 despite an improvement in Japan’s GDP numbers.
- The shared currency bulls are awaiting the monetary policy announcement by the ECB.
- An unchanged interest rate policy is expected by the ECB despite advancing inflation.
The EUR/JPY pair has recorded a fresh seven-year high at 142.32 despite the Japanese Cabinet Office having reported better-than-expected Gross Domestic Product (GDP) numbers in the Tokyo session. A significant improvement has been witnessed in the annualized GDP numbers as the figure has improved to -0.5% against the expectations and the former print of -1%. Also, the quarterly GDP is climbed to -0.1% vs. the forecasts of -0.3% and the prior figure of -0.2%.
A potential rise in Japan’s GDP numbers has failed to infuse strength in Japanese yen and the cross has recorded a fresh seven-year high.
Meanwhile, the shared currency bulls are awaiting the announcement of the interest rate decision by the European Central Bank (ECB), which is due on Thursday. As per the market consensus, the ECB is expected to keep interest rates unchanged at 0%. However, hawkish guidance by the ECB President Christine Lagarde could not be ruled out. Mounting inflationary pressures in the eurozone are hurting the paychecks of households in Europe. Therefore, the ECB could elevate its interest rates later this year.
The eurozone inflation has climbed above 8% in May and more upside is expected as the European Union has announced an embargo on oil imports from Russia. Considering its higher dependency on Russian fossil fuels, shifting onto any other supplier would demand ample time, which could elevate oil prices further in the meantime.
But before that, Eurostat will report the GDP numbers on Wednesday. A preliminary estimate for the annual GDP is 5.1% while the quarterly GDP is seen at 0.3%.
- GBP/JPY renews seven-week high, struggles to extend upside momentum during the eighth positive day.
- Overbought RSI, horizontal area from late April challenge buyers.
- Bears have multiple hurdles before retaking controls, 161.30 appears the key support.
GBP/JPY dribbles around the highest levels in seven weeks, grinds higher near 167.35-40 by the press time, as bulls struggle to keep reins amid overbought RSI conditions.
Also challenging the GBP/JPY pair’s upside is the horizontal area comprising multiple tops marked during late April, around 168.00.
Even if the quote manages to rise past 168.00, February 2016 peak surrounding 175.00 could challenge the pair buyers.
On the contrary, pullback moves remain elusive until the quote drops below 161.30 support confluence, comprising 200-SMA and monthly support line.
However, the weekly ascending trend line and the previous resistance line from May 24, respectively around 166.60 and 165.00, could offer an intermediate halt during the anticipated fall.
Overall, GBP/JPY is likely to witness a pullback towards short-term support lines but the trend reversal isn’t brewing.
GBP/JPY: Four-hour chart

Trend: Pullback expected
- USD/CAD is under pressure with the themes surrounding the BoC in focus.
- The week is a busy schedule for CAD considering the data and FSR at the end of the week.
At 1.2536, USD/CAD is pressured and has made fresh cycle lows this week, probing bullish commitments that are so far dwindling. The US dollar, as, per the US dollar index (DXY) fell against a basket of major currencies as US equities shook off an early risk-off mood and in turn, the Canadian dollar strengthened to its highest level in nearly seven weeks.
Oil prices have climbed and Canadian bond yields have advanced further above their US counterparts, leaving the bias with the bears for the sessions ahead. The gap between Canadian and US 10-year yields widened by 4.5 basis points to 20 basis points in favour of the Canadian bond, the widest spread since August 2012.
This comes down to growth prospects and the central banks. While the markets are anticipating continued hikes at the Federal Reserve, the Bank of Canada is also saying it was prepared to act "more forcefully if needed" to bring inflation back to target. The BoC has already hiked by two-second consecutive half-percentage points.
The focus will very much stay with this theme for the end of the week with the BoC's Financial Stability Report which is expected to shine light on risks and vulnerabilities to the financial system. Analysts at TD Securities said that they ''do not expect any implications for the near-term policy outlook.''
''We will be watching for any new detail on high-leverage borrowers or mortgage delinquencies, but expect an overall message that the financial system remains resilient amid a rising interest rate environment.''
We'll also hear from Governor Macklem on Thursday.
In recent data, ''Canada's trade surplus narrowed unexpectedly to C$1.5 billion in April as both imports and exports slowed, but economists said the lull was likely temporary, with supply chain disruptions easing and oil exports set to rebound,'' Reuters reported.
''Ivey Purchasing Managers Index data showed that Canadian economic activity expanded at a faster pace in May as a measure of employment climbed to its highest level in 11 months.''
Meanwhile, traders will also look to Friday's employment report. ''We look for the Canadian labour market to rebound with 35k jobs created in May following the muted performance in April,'' analysts at TD Securities said. ''This reflects a solid increase for mobility trends, record job vacancies, and the sharp drop for COVID infections after the post-Omicron wave. A 35k print would leave UE unchanged at 5.2% (after rounding), but we should see wage growth firm into the high 3s.''
Analysts at RBC Economics said in a note recently that the ''concerns about the Canadian economy’s ability to handle rapidly rising borrowing costs could still exert some downward pressure on the Canadian dollar, which at 79.5 US cents is still well within the roughly 77-81 cent range that has held for nearly a year. But interest rate differentials might not be quite as much of a currency driver as we previously envisioned.''
- Gold consolidates recent gains as yields underpin DXY recovery.
- Recession fears join geopolitical news, market’s inaction to weigh on prices.
- Risk catalysts are important to watch for fresh impulse amid a light calendar.
- Gold Price Forecast: Tepid recovery within a risk-averse environment
Gold Price (XAU/USD) fades the previous day’s recovery around $1,855, mildly offers around $1,850 by the press time, as the US dollar buyers return to the table during Wednesday’s Asian session.
The greenback’s rebound could be linked to the market’s downbeat sentiment, as well as a recovery in the US Treasury yields. That said, the US 10-year Treasury bond yields rise 1.5 basis points (bps) to 2.98% after snapping a six-day downtrend the previous day. It’s worth noting that the S&P 500 Futures’ first negative daily performance in three, down 0.25% around 4,150 at the latest, also seems to underpin the greenback’s safe-haven demand and weigh on gold prices.
The market’s consolidation of recent moves, amid a lack of major data/events, as well as risk-negative news from Ukraine, could be cited as the underlying reasons for the metal’s latest weakness. “Kyiv says it has not yet reached any agreement with Russia or Turkey to allow the safe passage of its grain ships in the Black Sea, injecting skepticism into a push by the U.N. to create a vital food corridor,” said Politico.
Recession fears emanating from the faster monetary policy normalization by the major central banks were cited as the key reason for the previous day’s moves. The fears grew on a comment from World Bank (WB) President David Malpass who warned that faster-than-expected tightening could push some countries into a debt crisis similar to the one seen in the 1980s.
Also exerting downside pressure on the bond coupons were comments from US Treasury Secretary Janet Yellen and hopes of faster economic recovery in China, both of which favor risk appetite. On Tuesday, US Treasury Secretary Yellen testified on the Fiscal Year 2023 Budget before the Senate Finance Committee while saying that the US economy faces challenges from "unacceptable levels of inflation", as well as headwinds from supply chain snags. The policymaker added, “An appropriate budget is needed to complement Fed’s actions to tame inflation without harming the labor market.”
To sum up, gold prices pare recent gains but the sellers remain cautious amid a lack of major data/events, which in turn requires the bullion traders’ discretion ahead of Thursday’s European Central Bank (ECB) meeting and Friday’s US Consumer Price Index (CPI) for May.
Technical analysis
Gold pulls back from 100-HMA, backed by RSI retreat, as sellers struggle to retake control. However, the 50-HMA and an immediate support line, respectively near $1,848 and $1,847, challenge the metal’s nearby downside.
Following that, the weekly bottom surrounding $1,836 and the monthly low of $1,828 may entertain XAU/USD bears ahead of directing them to the $1,800 threshold.
Alternatively, recovery moves need to break the 100-HMA hurdle surrounding $1,855, as well as 38.2% Fibonacci retracement of June 01-03 upside near $1,857, to recall the gold buyers.
Should the bullion prices remain firmer past the $1,857 resistance, the upside momentum may aim for the current month high of $1,874.
Gold: Hourly chart
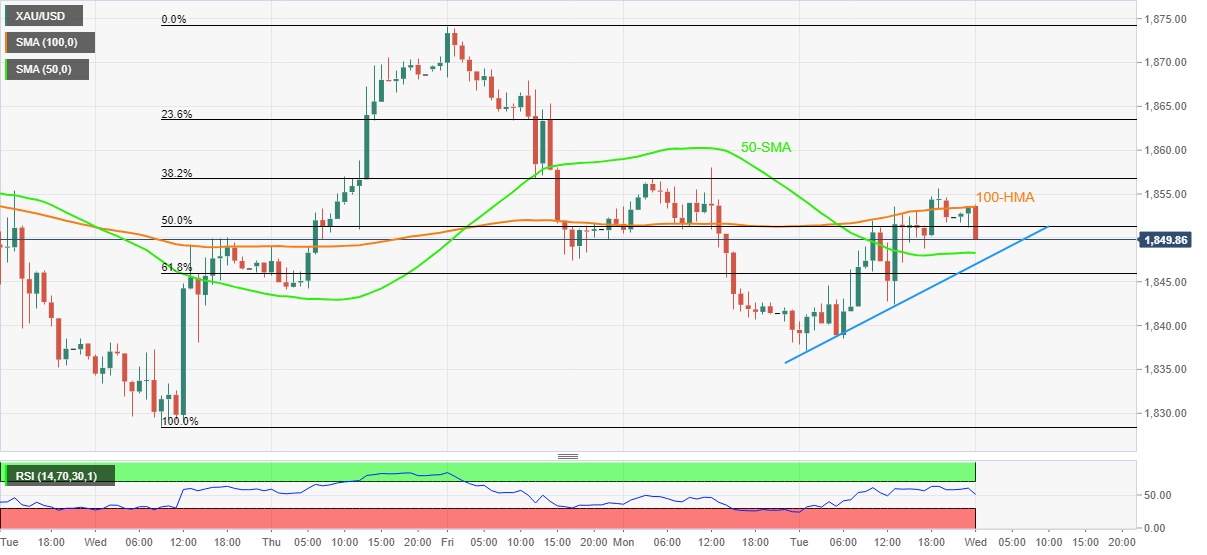
Trend: Further weakness expected
- AUD/USD is expected to rebound after a corrective move on positive market sentiment.
- The RBA elevated its OCR by 50 bps despite the downbeat job additions.
- The US core CPI is likely to slip to 5.9% from the former figure of 6.2%.
The AUD/USD pair has slipped to near 0.7224 after failing to cross 0.7240 on Tuesday. A minor correction after a sheer upside move is indicating that the aussie bulls’ party is not over yet as an unexpected extreme hawkish stance from the Reserve Bank of Australia (RBA) has strengthened the antipodean.
The RBA elevated its benchmark rates by 50 basis points (bps) in its monetary policy meeting on Tuesday. For cornering the soaring inflation, an announcement of a rate hike by 25 bps was expected from RBA Governor Philip Lowe. Also, the downbeat Employment Change reported by the Australian Bureau of Statistics last week indicated that the RBA would not paddle its Official Cash Rate (OCR) vigorously as it may dampen the employment opportunities further.
To be noted, the Australian economy has added 4k jobs in the labor force in May, significantly lower than the estimates of 30k. Therefore, an extreme hawkish stance carries the potential to scale down the employment opportunities firmly.
Meanwhile, the US dollar index (DXY) has opened flat and is expected to remain subdued ahead of the US inflation. The DXY displayed inability on Tuesday while extending its upside move above 102.84. This dragged the asset lower and a slippage below 102.26 will trigger the downside filters.
Going forward, investors’ focus will remain on the release of the US inflation, which is due on Friday. The annual US inflation is expected to remain unchanged at 8.3% while the core Consumer Price Index (CPI) could tumble to 5.9% from the prior print of 6.2%.
- NZD/USD fades the previous day’s bounce off two-week low.
- 200-SMA defends buyers amid receding bearish signals of MACD.
- Monthly horizontal hurdle challenges recovery moves, 0.6420-15 appears extra support to watch.
NZD/USD takes offers to renew intraday low around 0.6480, failing to extend the previous day’s rebound from a fortnight’s low, as a weekly resistance challenges the bulls.
Given the quote’s pullback from short-term resistance, its further declines towards the 200-SMA near 0.6445 can’t be ruled out.
However, a horizontal area comprising multiple lows marked since May 19, near 0.6420-15, could challenge the NZD/USD bears afterward.
In a case where the Kiwi pair drops below 0.6415, the 0.6400 threshold and early May’s peak near 0.6380 may lure the sellers.
On the contrary, a clear upside break of the immediate resistance line, close to 0.6495 by the press time, needs validation from the 0.6500 threshold to recall buyers.
Even so, a one-month-old horizontal hurdle surrounding 0.6570 appears a tough nut to crack for the bulls.
NZD/USD: Four-hour chart
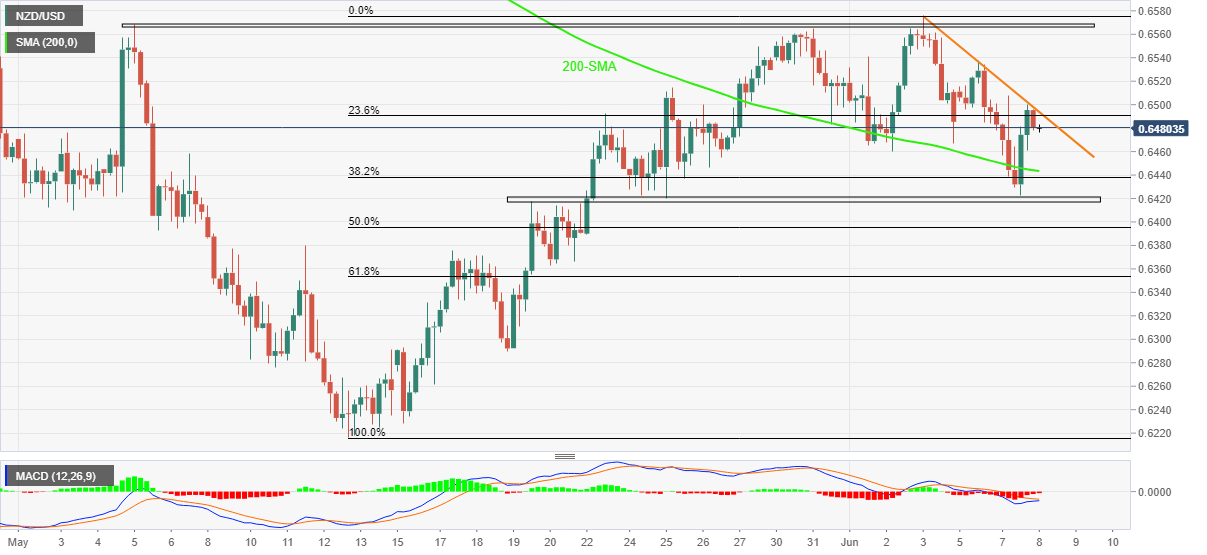
Trend: Further weakness expected
| Pare | Closed | Change, % |
|---|---|---|
| AUDUSD | 0.72313 | 0.52 |
| EURJPY | 142.012 | 0.65 |
| EURUSD | 1.07068 | 0.12 |
| GBPJPY | 166.953 | 0.99 |
| GBPUSD | 1.25891 | 0.47 |
| NZDUSD | 0.64895 | -0.03 |
| USDCAD | 1.25324 | -0.36 |
| USDCHF | 0.97218 | 0.15 |
| USDJPY | 132.63 | 0.52 |
- DXY teases recovery after reversing from a fortnight's high.
- US Treasury yields rebound, stock futures retreat as growth fears join geopolitical headlines during sluggish Asian session.
- WB’s Malpass, US Treasury Secretary Yellen allowed USD bulls to take breather.
- Fed’s September rate hike depends upon Friday’s US CPI while ECB, risk catalysts are important too.
US Dollar Index (DXY) braces for further upside as it fails to extend the previous day’s pullback from a two-week high, picking up bids near 102.35 during Wednesday’s Asian session.
In doing so, the greenback’s relative price versus the six major currencies tracks the recently firmer US Treasury yields, up 1.8 basis points to 2.98%.
It’s worth noting that the S&P 500 Futures’ first negative daily performance in three, down 0.25% around 4,150 at the latest, also seems to underpin the greenback’s safe-haven demand.
The underlying reason could be the market’s consolidation of recent moves amid a lack of major data/events, as well as risk-negative news from Ukraine. “Kyiv says it has not yet reached any agreement with Russia or Turkey to allow the safe passage of its grain ships in the Black Sea, injecting skepticism into a push by the U.N. to create a vital food corridor,” said Politico.
Previously, the US Treasury yields snapped a six-day uptrend and the Wall Street benchmark rose for the second consecutive day to exert downside pressure on the DXY.
Recession fears emanating from the faster monetary policy normalization by the major central banks were cited as the key reason for the previous day’s moves. The fears grew on a comment from World Bank (WB) President David Malpass who warned that faster-than-expected tightening could push some countries into a debt crisis similar to the one seen in the 1980s.
Also exerting downside pressure on the bond coupons were comments from US Treasury Secretary Janet Yellen and hopes of faster economic recovery in China, both of which favor risk appetite. On Tuesday, US Treasury Secretary Yellen testified on the Fiscal Year 2023 Budget before the Senate Finance Committee while saying that the US economy faces challenges from "unacceptable levels of inflation", as well as headwinds from supply chain snags. The policymaker added, “An appropriate budget is needed to complement Fed’s actions to tame inflation without harming the labor market.”
On the contrary, a record monthly drop in the US trade deficit, down 19.1% to USD87.1bn for April, as well as Germany’s downbeat Factory Orders for April, put a floor under the DXY.
Looking forward, markets are likely to remain sidelined ahead of Thursday’s European Central Bank (ECB) meeting and the US Consumer Price Index (CPI) for May, which in turn highlights risk catalysts to be watched for fresh impulse.
Technical analysis
Tuesday’s pin bar candlestick below the 21-DMA level of 102.70 tests the US Dollar Index bulls. However, the 50-DMA, around 101.90, restricts the short-term downside of the greenback gauge.


© 2000-2026. All rights reserved.
This site is managed by Teletrade D.J. LLC 2351 LLC 2022 (Euro House, Richmond Hill Road, Kingstown, VC0100, St. Vincent and the Grenadines).
The information on this website is for informational purposes only and does not constitute any investment advice.
The company does not serve or provide services to customers who are residents of the US, Canada, Iran, The Democratic People's Republic of Korea, Yemen and FATF blacklisted countries.
Making transactions on financial markets with marginal financial instruments opens up wide possibilities and allows investors who are willing to take risks to earn high profits, carrying a potentially high risk of losses at the same time. Therefore you should responsibly approach the issue of choosing the appropriate investment strategy, taking the available resources into account, before starting trading.
Use of the information: full or partial use of materials from this website must always be referenced to TeleTrade as the source of information. Use of the materials on the Internet must be accompanied by a hyperlink to teletrade.org. Automatic import of materials and information from this website is prohibited.
Please contact our PR department if you have any questions or need assistance at pr@teletrade.global.
transfers