- Analytics
- News and Tools
- Market News
Analytics, News, and Forecasts for CFD Markets: currency news — 13-06-2022.
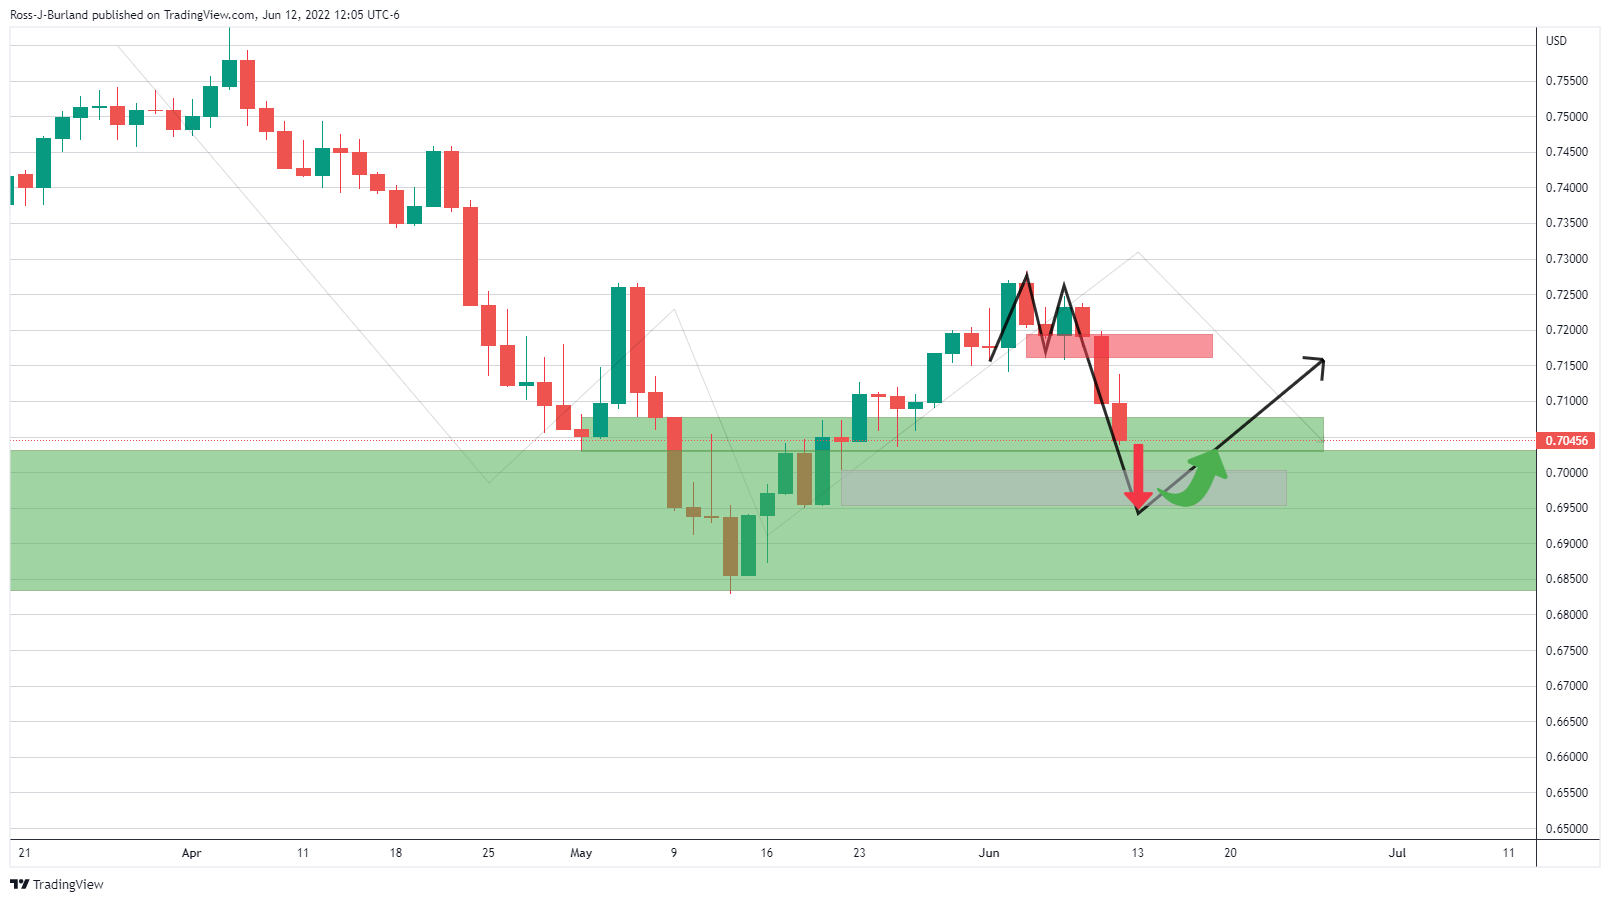
- GBP/JPY is hovering around 163.00 ahead of the UK labor data.
- The show-stopper events this week will be interest rate policies from BOE and BOJ.
- A rate hike by 25 bps is expected by the BOE while the BOJ will stick to its ultra-loose policy.
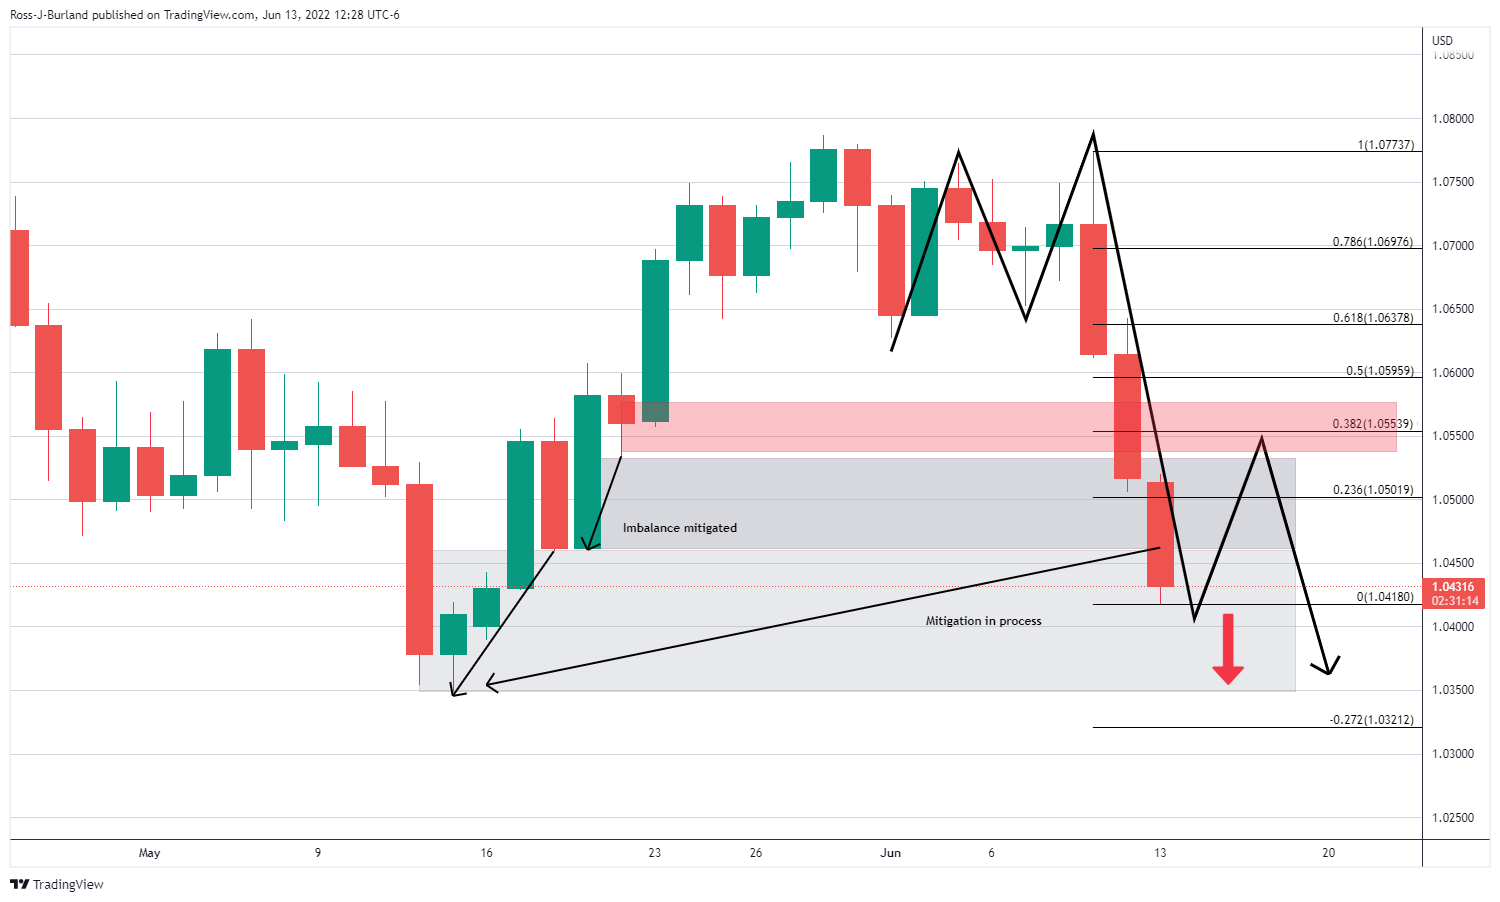
The GBP/JPY pair is displaying back and forth moves in a narrow range of 162.83-163.24 in the Asian session. A lackluster performance in the cross is backed by uncertainty over the release of the UK Employment data. The asset has remained in the negative trajectory from the last week, however, a minor bounce has been witnessed on Monday after hitting a low of 162.25.
Investors are awaiting the release of the UK Employment data, which is expected to improve marginally. The Claimant Count Change is expected to shift lower to -42.5k against the prior print of -56.9k. Also, the Unemployment Rate is likely to fall to 3.6% from the former figure of 3.7%. An improvement in the labor market data will underpin the pound bulls against the Japanese yen for a limited horizon. However, the attention-seeking events will be the monetary policy announcement from the Bank of England and the Bank of Japan (BOJ).
As per the Reuters poll, a rate hike by 25 basis points (bps) is expected by the BOE, which will push the rates to 1.25%. Considering the momentum of price pressures in the UK zone, a rate hike is necessary, however, lower growth forecasts have left a little room for a quarter-to-a-percent bps only. Also, the economic activities in the UK area have underperformed in May. The Gross Domestic Product (GDP) slipped to -0.3% against the expectation of 0.2%. Also, the annual Manufacturing Production figure tumbled to 0.5 vs. 1.8% expected.
On the Japanese yen front, the BOJ is expected to stick to a prudent monetary policy despite advancing price pressures. The inflation rate in Japan's economy has increased above 2%, however, the price pressures are majorly dictated by soaring oil prices.
- USD/CAD probes four-day uptrend amid quiet markets in Asia.
- Chatters over Fed’s 75 bp rate hike in June joined fears of recession to weigh on market sentiment.
- US dollar, Treasury yields benefit from the rush to risk safety, oil prices remain sidelined.
- Risk catalysts are crucial for directions ahead of Wednesday’s FOMC.
USD/CAD flirts with monthly high as bulls take a breather following the four-day run-up during Tuesday’s Asian session. That said, the quote seesaws near 1.2900 by the press time as traders seek fresh clues.
Alike other major currency pairs, USD/CAD also portrayed the broad US dollar strength at the week’s start amid the market’s fears of faster/heavier rate hikes during this week’s Federal Open Market Committee (FOMC). The hawkish Fed expectations were joined by pessimism surrounding China to offer additional strength to the US dollar’s safe-haven demand.
The risk-aversion wave propelled the US Dollar Index (DXY) to rise to the fresh high since 2002 while also fuelling the US 10-year Treasury yields to the highest in over a decade. It should be noted that prices of crude oil, Canada’s main export, remain supported at around $120.00 as traders expect more stimulus from China and a supply crunch ahead.
It’s worth noting that major investment banks, including Goldman Sachs and JP Morgan, recently hiked their Fed rate expectations to include the odds of a 75 bp lift on Wednesday. Also, the US rate futures imply a 96% chance of the Fed raising rates by 75 bps at the June meeting.
Considering the recession fears joining the hawkish expectations from global central banks and inflation woes, not to forget China’s covid jitters, USD/CAD is likely to witness further upside. However, a market consolidation can’t be ruled out ahead of Wednesday’s Fed meeting.
Technical analysis
A three-month-old horizontal hurdle around 1.2900 appears to challenge the USD/CAD bulls. However, the pair’s sustained trading beyond the 50-DMA, at 1.2745 by the press time, keeps the buyers hopeful.
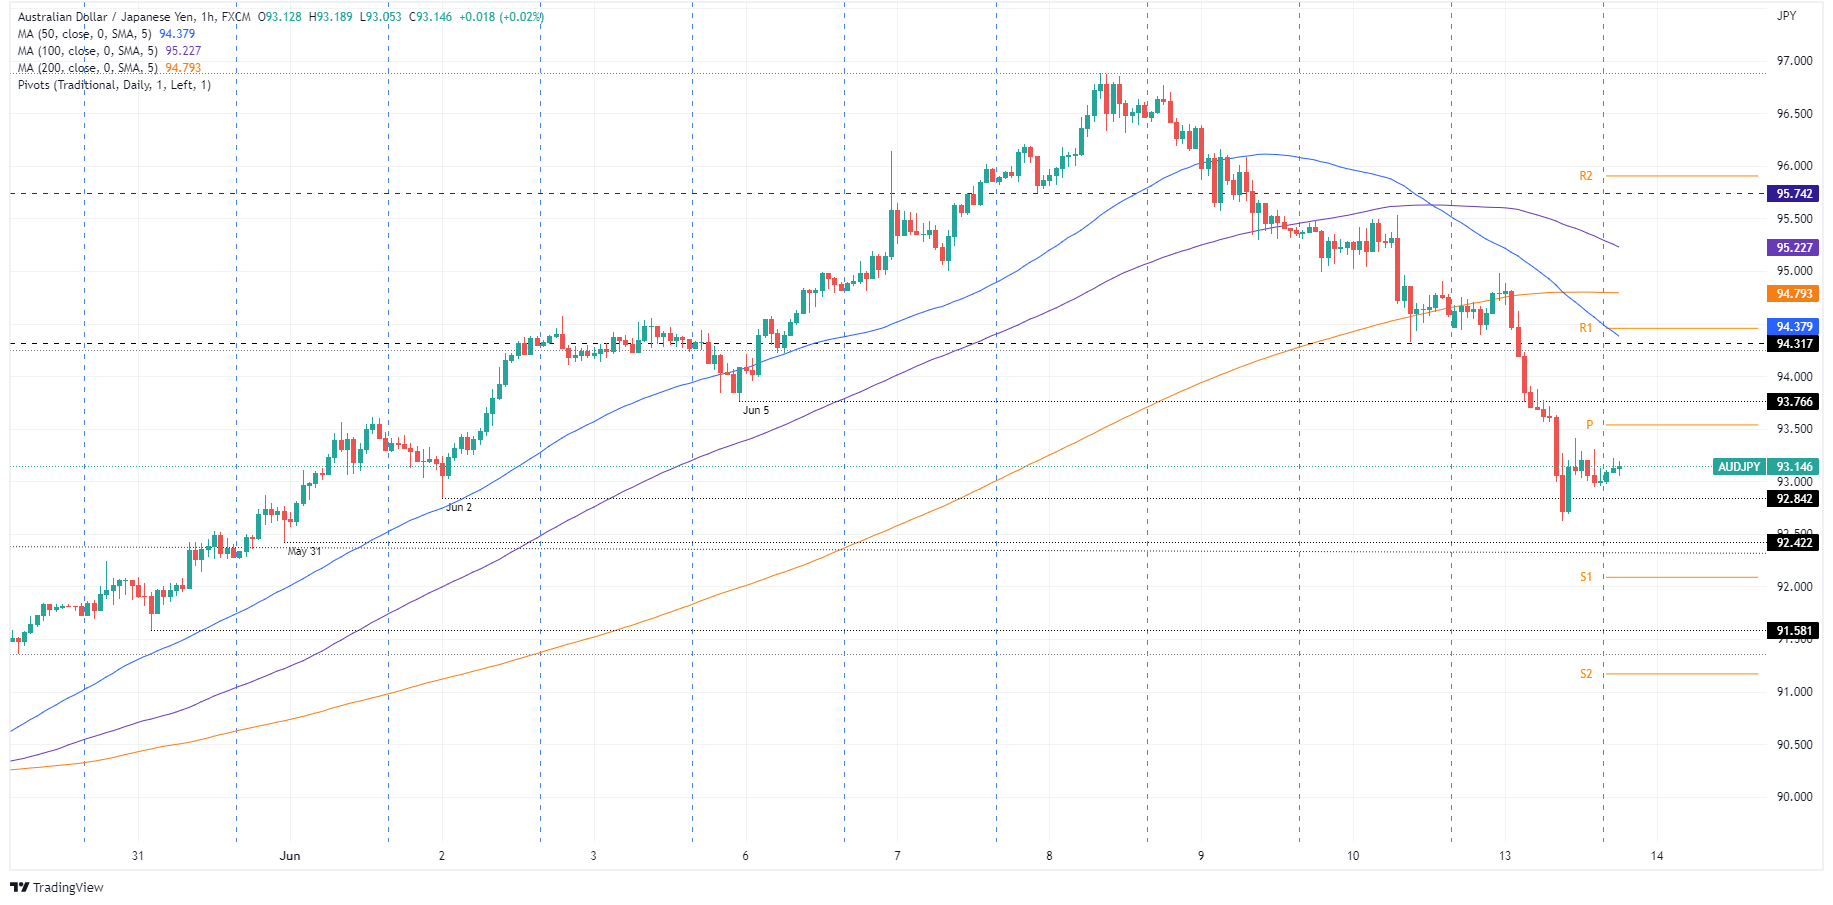
- The AUD/JPY recovered some ground as the Asian Pacific session began.
- The sentiment is still sour, with Asian futures poised to a lower open.
- AUD/JPY Price Forecast: In the near term might extend the pullback towards 92.40-50s before resuming the uptrend.
The AUD/JPY plunged 160 pips on Monday due to sour market sentiment, spurred by investors’ fears that the Federal Reserve could tighten monetary policy at a pace that the US economy might not survive a recession, as reflected by US Treasury yields, elevating to multi-year highs. At 93.14, the AUD/JPY records minimal gains of 0.16% as the Asian Pacific session begins.
Portraying the abovementioned were US equities registering huge losses. Asian futures are poised to a lower open, except for the Nikkei, which is up 0.09%. In the meantime, US Treasury yields, led by the 10-year benchmark note rate, finished at 3.362%, 11-year highs, up 20 bps in the day.
In the FX space, the greenback was the leading currency, except vs. the Japanese yen. On Friday, Japan’s government and the central bank said they were concerned by recent sharp falls in the yen in a rare joint statement, Reuters reported.
AUD/JPY Price Forecast: Technical outlook
The AUD/JPY is hovering around the 93.00 figure, for the first time, since June 2. Nevertheless, albeit falling more than 150 pips on Monday, the cross-currency keeps trading above the daily moving averages (DMAs), which remain below the spot price, with the 50-DMA being the closest to the exchange rate at 92.35.
The AUD/JPY 1-hour chart depicts the pair as downward biased. The 1-hour simple moving averages (SMAs) reside above the spot price, with the 50-hour SMA below the long-time frame ones, around 94.31. Additionally, once AUD/JPY’s price action broke below the June 5 daily low at 93.76, it opened the door for further losses.
Therefore, the AUD/JPY first support would be the 93.00 figure. Once cleared, the following support would be June 2 low at 92.84. A breach of the latter, an area full of sell stops, would send the pair towards the May 31 low at 92.42 before resuming to the upside, aligned with the daily chart overall bias.
Key Technical Levels
- EUR/USD has displayed a minute recovery after hitting a monthly low of 1.0400.
- Investors have started discounting a 75 bps rate hike from the fed.
- ECB Lagarde will dictate the roadmap for accelerating the rate cycle.
The EUR/USD pair is minutely bided around 1.0400 after a perpendicular downside move from the crucial resistance of 1.0650. The downside pressure is expected to force the asset to recapture its five-year low at 1.0389. The shared currency bulls have witnessed an extreme sell-off in the last two trading sessions after violating the consolidation formed in a narrow range of 1.0611-1.0642 last week.
The uncertainty over the announcement of the interest rate decision by the Federal Reserve (Fed), which is due on Wednesday, has set a negative undertone in the market. Risk-perceived currencies have witnessed a steep fall while the appeal of the US dollar index (DXY) is improved significantly.
As per the market consensus, the extent of a rate hike has surged to 75 basis points (bps) after the release of the US Consumer Price Index (CPI). The US inflation has landed at 8.6%, much higher than the prior print of 8.3% while the core CPI has climbed to 6% vs. 5.9% reported earlier. One can witness that higher oil and food prices have contributed majorly to the price pressures.
On the euro front, investors are awaiting the speech from European Central Bank (ECB) President Christine Lagarde, which is due on Wednesday. ECB Lagarde is expected to dictate the roadmap of elevating the rate cycle for the first time from July. The price pressures in the eurozone have already jumped sharply above 8% and are needed to be tamed as early as possible by policy tightening measures.
“Business confidence fell to its lowest level in more than a year last month amid growing fears that inflation poses a long-term threat to company sales,” said the UK Times in its latest news during early Tuesday morning in Asia.
“Confidence among companies is now at levels last seen in April 2021, when coronavirus restrictions were beginning to relax, according to the index by BDO, the accounting and business advisory firm,” the news adds.
It’s worth noting that the sentiment gauge takes a weighted average of the UK’s main business surveys, covering responses from about 4,000 companies, per the UK Times.
Key findings
BDO’s optimism index fell for a second consecutive month in May, dropping by 4.82 points to 101.93. The 100 mark separates expectations for long-term growth from contraction.
The decline was driven by a fall in optimism in the services sector, which has been the hardest hit by falling consumer spending in light of the squeeze on household budgets.
The index for optimism in services fell by 5.35 points to 100.95 in May. Output also fell to its lowest level in more than a year, dropping by 1.86 points in May to 100.53.
The figures reflect official data on output published by the Office for National Statistics yesterday, which showed that the UK economy contracted for the second consecutive month in April, raising fears of an outright fall in output in the second quarter.
Also read: GBP/USD nosedives to a fresh two-year low around 1.2100s on expectations of a Fed 75 bps hike
- NZD/USD pauses seven-day downtrend near the monthly low.
- Nearly oversold RSI seems to underpin recovery moves but previous support from early May challenges rebound.
- 20-DMA, descending resistance line from April adds to the upside filters.
- Bearish MACD, key support break favor sellers eyeing 61.8% FE.
NZD/USD portrays a corrective pullback around a one-month low, snapping a seven-day downtrend, during Tuesday’s inactive Asian session. The kiwi pair refreshed the monthly low to 0.6246 before recently bouncing off to 0.6270.
The recovery moves seem to take clues from the nearly oversold RSI (14) line. However, the pair remains below the previous horizontal support line from May 10, broken the previous day, which in turn joins the bearish MACD signal to keep sellers hopeful.
Even if the quote rises past the 0.6300 immediate hurdle, the 20-DMA near 0.6442 and a 2.5-month-old downward sloping resistance line, near 0.6480, will be crucial for NZD/USD buyer’s return.
Also acting as an upside filter is the monthly high near 0.6580.
Alternatively, fresh declines could be aimed for the yearly low surrounding 0.6215 and may again portray indecision near the 0.6200 threshold.
It’s worth noting that multiple lows marked during March and April of 2020 could also challenge NZD/USD near around 0.6150 before directing them to the 61.8% Fibonacci Expansion (FE) of April-May moves, near 0.6070-65.
NZD/USD: Daily chart
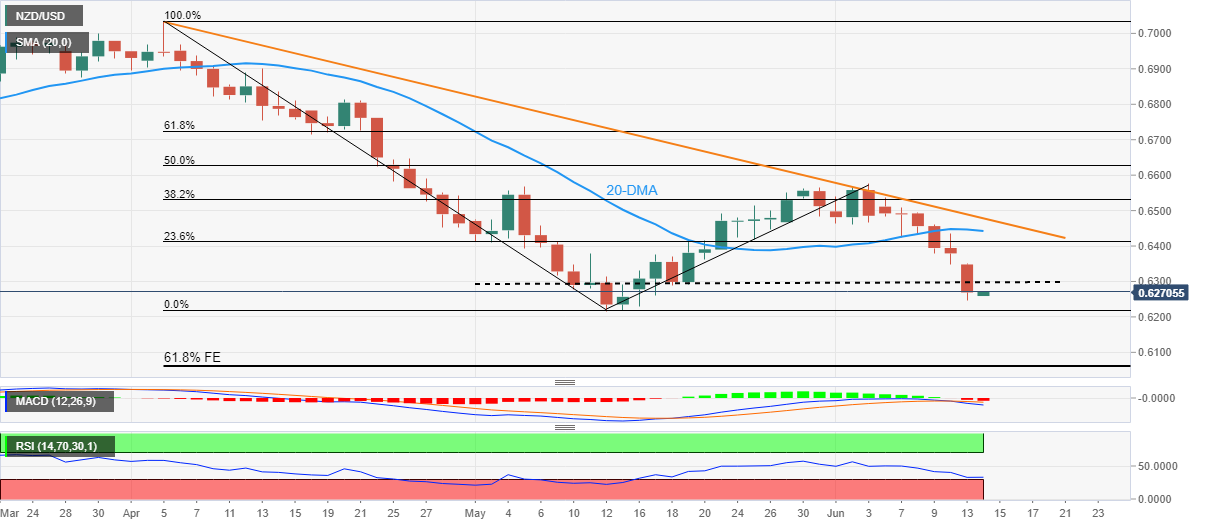
Trend: Further weakness expected
- AUD/USD bears take a breather after the biggest daily fall in five weeks.
- Growing chatters over Fed’s 75 bp rate hike, China’s covid woes drowned riskier assets.
- DXY, Treasury yields cheered safe-haven demand by refreshing multi-year top.
- Australian markets will begin the week with housing, NAB sentiment data but risk catalysts are the key to fresh impulse.
AUD/USD licks its wounds near the recently flashed monthly low surrounding 0.6900, following the heaviest daily fall in five weeks, as Aussie traders return to the table after Monday’s holiday. That said, the quote seesaws near 0.6920-30 after refreshing the monthly low with 0.6910 the previous day.
Growing fears of the Fed’s aggression joined worsening covid conditions in China to underpin the latest risk-aversion wave. Also contributing to the AUD/USD pair’s weakness could be a light Aussie calendar due to the Queen’s Birthday.
Friday’s US inflation data propelled calls for faster/heavier rate increases and spread the market fears as hawkish central bank actions tease recession woes. The same pushed multiple analysts ranging from JP Morgan to Goldman Sachs to revise their Fed forecasts and include expectations of a 75 bp rate hike in June and July. “Our Fed forecast is being revised to include 75bps hikes in June and July,” said Goldman Sachs in its latest Fed forecasts per Reuters.
On the other hand, a fresh spike in China’s covid cases during the weekend again pushed Beijing and Shanghai towards the return of the activity restrictions. Given the dragon nation’s strong trading ties with Australia, coupled with the status of the world’s biggest industrial player, fears of China’s economic hardships weigh on the riskier assets like equities, commodities and Antipodeans.
Against this backdrop, the Wall Street benchmarks slumped to the yearly low marked in January while the US 10-year Treasury yields rose to the highest since May 2011, around 3.36% by the press time.
Considering the full steam risk-off mood, the AUD/USD prices are likely to witness further downside. However, the quarterly readings of Australia’s House Price Index for Q1, expected 1.4% versus 4.7% prior, will precede National Australia Bank’s Business Conditions and Business Confidence figures for May to direct intraday moves.
Technical analysis
A clear downside break of January’s low surrounding 0.6965 directs AUD/USD towards a yearly low of 0.6828.
- USD/CHF is marching towards 1.0000 on advancing hawkish Fed bets.
- The DXY is balancing above 105.00 amid a cautious market mood.
- A continuation of an accommodative stance is expected from the SNB.
The USD/CHF pair is displaying a minor cushion around 0.9960 as oscillators turned extremely oversold on small timeframes. The pair has remained in the grip of the bulls after overstepping the consolidation formed in a 0.9880-0.9900 in Monday’s Asian session and are expected to drive the asset towards the psychological resistance of 1.0000.
A broader strength in the US dollar index (DXY) ahead of the monetary policy announcement by the Federal Reserve (Fed) has infused fresh blood into the DXY-dominating FX pairs. The DXY has established above 105.00 as a higher US Consumer Price Index (CPI) figure has bolstered the odds of a more than 50 basis points (bps) interest rate hike on Wednesday.
As per the previous testimonies from Fed chair Jerome Powell, a 75 bps rate hike is not into consideration but the release of the US inflation at 8.6% on annual basis and the upbeat Nonfarm Payrolls (NFP) have featured its expectations. No doubt, a 75 bps rate hike announcement by the Fed will underpin recession fears in the US economy as extreme liquidity shrinkage from the economy will leave the corporate with fewer corpus to invest, which will result in lower employment generation.
On the Swiss franc front, investors are awaiting the interest rate decision by the Swiss National Bank (SNB), which is due on Friday. Investors are expecting an accommodative stance from the SNB as the inflation rate is still lower than the required levels in the Swiss economy. Although the inflation rate has moved above 2% but is majorly contributed by advancing oil prices.
“Our Fed forecast is being revised to include 75bps hikes in June and July,” said Goldman Sachs in its latest Fed forecasts per Reuters.
Key quotes
We anticipate two more rate increases in 2023 to 3.75-4%, followed by one cut in 2024 to 3.5-3.75%.
We anticipate a 50bp increase in September, followed by 25bp increases in November and December, for an unchanged terminal rate of 3.25-3.5%.
We expect the median dot to show 3.25-3.5% at end-2022.
FX implications
Recently growing chatters over a 75 bp rate hike by the Fed has been the key catalyst for the heavy risk-off mood. The same weighed down equities and propelled the US dollar, as well as Treasury bond yields of late.
Also read: Investors weigh the probabilities of three Fed scenarios: A 50bps, 75bps or even a 100bps hike
- A slippage below 61.8% Fibo retracement confirms more downside move.
- The 10- and 20-EMAs are scaling lower, which adds to the downside filters.
- A bearish range shift by the RSI (14) signals more downside ahead.
The GBP/USD pair has refreshed its two-year low after hitting a low of 1.2107 in the late New York session. The pound bulls have displayed a sheer downside move after violating its prolonged consolidation formed in a 1.2430-1.2600 range from the first day of June.
On the weekly scale, the cable has settled below the 61.8% Fibonacci retracement (which is placed from March 2020 low at 1.1412 to February 2021 high at 1.4243) at 1.2500. Also, the sustainability below the supply zone at 1.2140-1.2250 will remain a major hurdle for the pound bulls.
Declining 10- and 20-period Exponential moving Averages (EMAs) at 1.2528 and 1.2788 respectively adds to the downside filters.
Meanwhile, the Relative Strength Index (RSI) (14) has shifted into a bearish range of 20.00-40.00, which signals that the downside momentum is intact.
Should the asset displays a pullback move towards the above-mentioned supply zone, the greenback bulls will find it an optimal selling opportunity and will drag the asset towards the 18 May 2020 low at 1.2075. A breach of the latter will unleash the asset to find a cushion around the psychological support at 1.2000.
On the flip side, the pound bulls could regain strength if the asset oversteps May 27 high at 1.2667. An occurrence of the same will drive the asset to near 20-EMA at 1.2780, followed by 50% Fibo retracement at 1.2836.
GBP/USD weekly chart
-637907543631608113.png)
- Gold gets trashed as the US dollar rallies to fresh bull cycle highs.
- The Fed is causing angst in the financial markets, expected to hike by at least 50bps this week.
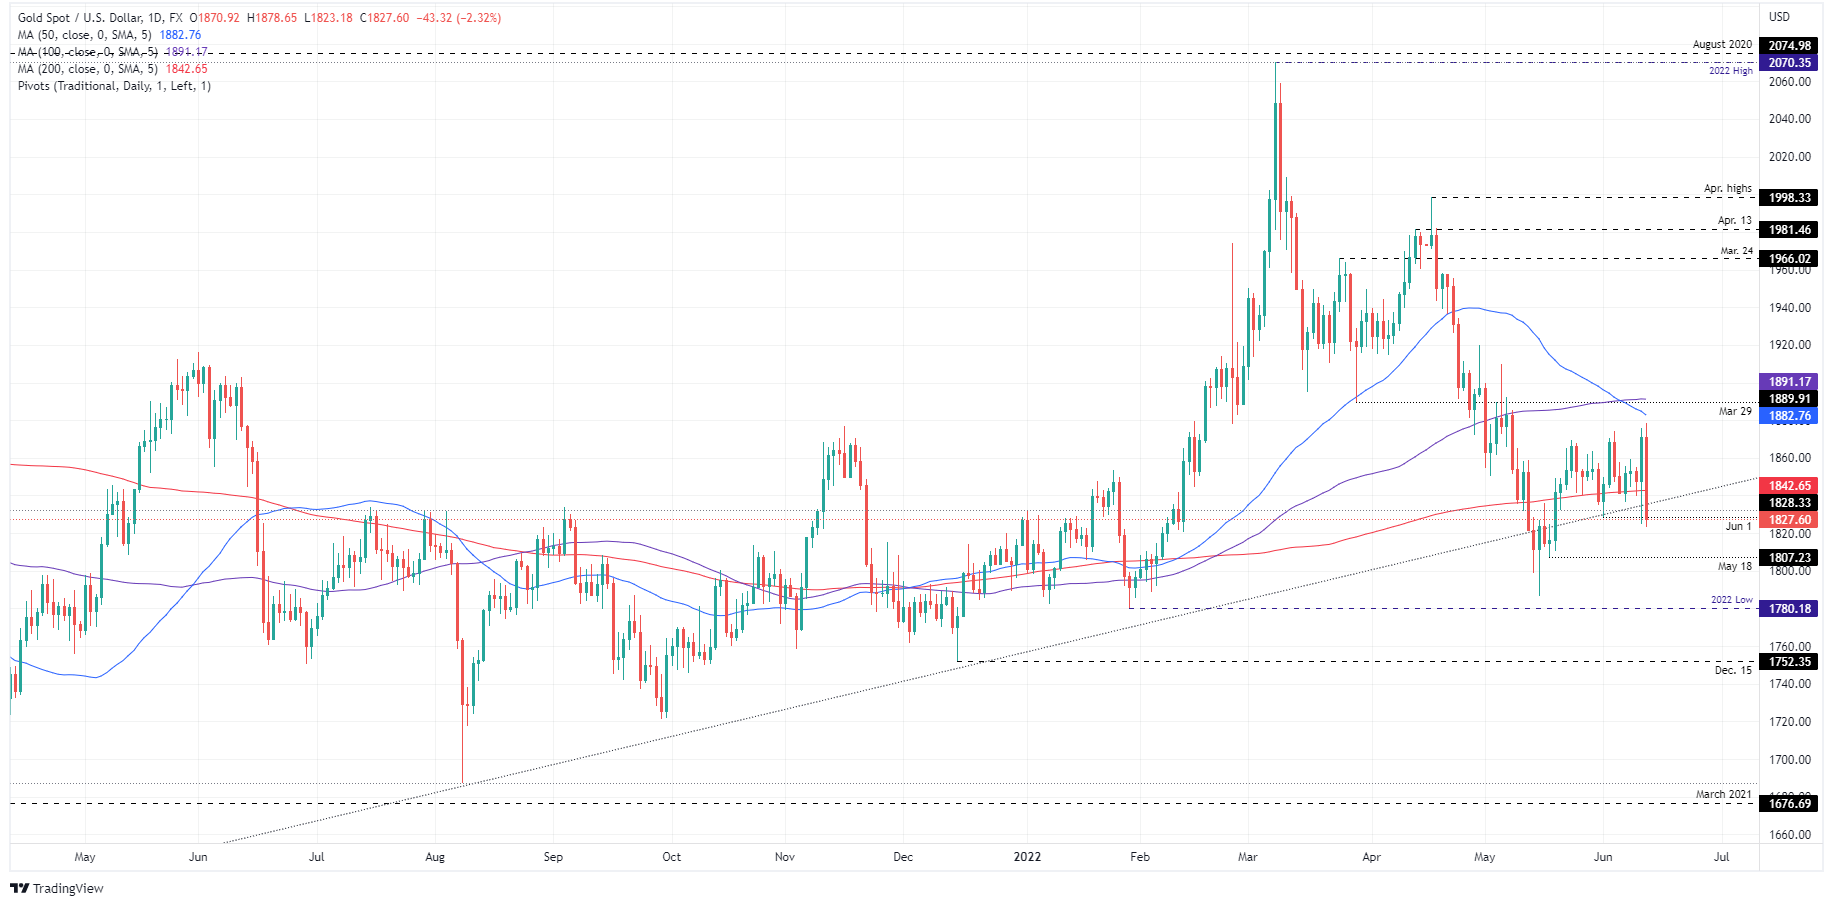
At $1,819.52, the gold price is down some 2.78% after falling from a high of $1,879 to a low of $1,819.10 as investors moved into the greenback with the fears of the recession taking hold.
The Federal Reserve this week is expected to hike which is pushing bond yields to the highest in more than a decade as the central bank is expected to raise interest rates by at least 50-basis points after inflation rose to a 40-year high of 8.6% in May.
Consequently, US equities were down sharply on Monday, with the S&P 500 on pace for its fourth straight decline. The benchmark index is more than 20% below its record closing high on Jan. 3 and such a drop would confirm the index is in a bear market, according to a commonly used definition.
The DXY index, which compares the greenback to a basket of rival currencies has moved as high as 105.285, the highest level since December 2002 which has seen the euro to 1.0403 the low and the yen 135.20.
-
Investors weigh the probabilities of three Fed scenarios: A 50bps, 75bps or even a 100bps hike
''Until evidence emerges that inflation is peaking and on a sustained downwards track, financial asset prices will remain under pressure,'' analysts at ANZ Bank argued.
Despite the hunt for safety, gold for August delivery closed down $29.10 to settle at $1,831.80 per ounce.
''While the strong inflation data immediately translated into higher gold prices, buying gold as an inflation hedge is only viable inasmuch as the higher inflation print is disregarded by monetary policy,'' analysts at TD Securities said.
''The next few Fed hikes are set in stone, which limits the relevance of imminent data releases to the left tail of Fed funds pricing, but the market has aggressively challenged the right tail — bringing 75bp hikes into scope.''
''In turn, the trading bias is still to the downside, but participants are still looking for catalysts to flush out the massive amount of complacent length. We see risks that technical breakdown could be the catalyst,'' the analysts said:
- Firstly, the bar for CTA liquidation is growing thin, as we estimate that a break below $1810/oz would catalyze a substantial selling program from systematic trend followers.
- Secondly, prices have managed to break below the bull-market defining uptrend from 2019, which may catalyze additional liquidations from the complacent bulls at prop-shops.
- Thirdly, a growing valuation gap between gold and real rates might eventually exacerbate the repricing lower in the yellow metal, despite it being attributed to both an undue rise in real rates given quantitative tightening, and to the still-massive complacent length in the yellow metal which has kept the prices elevated.
- On Monday, the GBP/USD plunged nearly 200-pips, losing almost 1.50%.
- US Federal Reserve expectations of a 75 bps rate hike at the Wednesday meeting keep mounting.
- The UK April’s Gross Domestic Product (GDP) shrank for the second straight month.
The GBP/USD tanked to fresh two-year lows around 1.21054 but slightly recovered as investors assessed the news that the US Federal Reserve might hike 75 bps on a news piece published by the WSJ. Additionally, the UK’s GDP in a monthly reading contracted, by 0.3%, fueling expectations that the UK is headed into a recession as the Bank of England hikes rates again. At the time of writing, the GBP/USD is trading at 1.2129.
The greenback benefits from risk-aversion and US Fed rate hikes expectations
Concerns that the US Federal Reserve would tighten more than 50 bps following a worse-than-expected US inflation report shifted sentiment sour. Reflection of the previously mentioned is US equities tumbling between 2.80% and 4.81%. Contrarily, US Treasury yields rose, while the greenback gained more than 1%, reaching a two-decade high, around 105.285.
A Wall Street Journal news piece stated, “A string of troubling inflation reports in recent days is likely to lead Federal Reserve officials to consider surprising markets with a larger-than-expected 0.75-percentage-point interest rate increase at their meeting this week,” further weighed on sentiment.
Elsewhere, China’s coronavirus headlines weighed on the already battered mood. According to Reuters, a Covid-19 outbreak linked to a bar, traced by authorities, with millions facing mandatory testing and thousands under targeted lockdowns. The re-emergence of infections raises worries about China’s economic outlook.
Earlier in the European session, the Office of National Statistics (ONS) reported that Gross Domestic Product (GDP) fell by 0.3% in April; but the 3-months to April 2022 rose by 0.2%. Services fell by 0.3%, and it was the main contributor to GDP’s fall, reflecting a decrease of 5.6% in human health and social work. Production fell by 0.6%, attributed to a fall in manufacturing of 1% on the month, as businesses continue to report the impact of price increases and supply chain shortages.
Monday’s GBP/USD price action witnessed the ongoing Sterling weakness. A weaker than expected GDP maintains investors’ expectations that the Bank of England would continue hiking rates, despite the current economic outlook. Therefore, despite the BoE’s rising rates, the GBP/USD is headed to the downside and, during the day, dropped nearly 200 pips as sellers prepare for a test of the 1.2000 figure.
An absent US economic docket left GBP/USD traders adrift to the market sentiment that ultimately benefitted the USD, a headwind for the GBP/USD.
Key Technical Levels
- The Fed is going to be the key driver in the coming days and central bank watchers are on high alert.
- There are bets being laid against a 50bps hike, and some investment banks see prospects of even a 100bps hike.
- Markets are being roiled by the prospects of a recession with the S&P 500 entering an official bear market.
Typically, during the Federal Reserve's blackout period, financial news agencies, such as the Wall Street Journal fill the void with opinion pieces such as the following:
''A string of troubling inflation reports in recent days is likely to lead Federal Reserve officials to consider surprising markets with a larger-than-expected 0.75-percentage-point interest rate increase at their meeting this week,'' a Wall Street Journal piece opened within an article that has been circulating throughout the start of the week.
''Before officials began their pre-meeting quiet period on June 4, they had signalled they were prepared to raise interest rates by a half percentage point this week and again at their meeting in July,'' the article continues. ''But they also had said their outlook depended on the economy evolving as they expected. Last week’s inflation report from the Labor Department showed a bigger jump in prices in May than officials had anticipated.''
As stated within the following article, EUR/USD bears plough through corrective territories and eye 1.0400 as traders lay odds of just a 50bp hike, ''the US Consumer Price Index increased a bigger-than-expected 8.6% last month, the largest year-on-year increase since December 1981, data showed on Friday, so investors hopeful that inflation has peaked were disappointed. This has left investors on alert that the Federal Reserve may tighten policy for too long and cause a sharp economic slowdown.''
This has led to recession fears which are tilting the US stock market into a confirmed bear market. US equities tumbled on Monday, with the S&P 500 on pace for its fourth straight decline. The benchmark index is more than 20% below its record closing high on Jan. 3 and such a drop would confirm the index is in a bear market, according to a commonly used definition.
Meanwhile, the US dollar index, DXY, which compares the greenback to a basket of rival currencies has ticked as high as 105.285, the highest level since December 2002 which has seen the euro to 1.0403 the low and the yen 135.20.
''Until evidence emerges that inflation is peaking and on a sustained downwards track, financial asset prices will remain under pressure,'' analysts at ANZ Bank argued.
A 75bps hike, is it possible?
In the prior euro article, it was reported that the analysts at Brown Brothers Harriman noted that some banks are raising their Fed calls for a 75 bp move, one for as early as this week.
Is it possible?
''Sure,'' the analysts say, but they think it's very unlikely as there is going to be a very high bar after the Fed already flagged 50 bp moves for June and July.''
Have things really worsened that much? They say ''not really.''
''Looking ahead, the swaps market is now pricing in a terminal rate near 4.0%, a new high and up from around 3.0% at the start of this month. This was the risk if inflation were to remain persistent and that's what we are seeing.''
''When all is said and done, we believe monetary policy divergences remain the dominant driver for FX. As the US economic outlook remains the best relative to its DM peers, the dollar uptrend remains intact,'' analysts at Brown Brothers Harriman argued.
Meanwhile, analysts at Rabobank said the expectation is Wednesday’s meeting will still be the pre-flagged 50bps move. ''However, we are starting to hear whispers of a 75bps hike, and this weekend saw the first suggestion of 100bps and the Fed opening the door to inter-meeting hikes of indeterminate size,'' they explained.
JP Morgan economists see the Fed hiking 75bps and Standard Charted predicts a 10% chance of a 100 bps hike.
However, the last two months of wage data have been showing signs of slowing, which could be a factor that persuades the Fed to stick to a 50bps tightening path.
Markets currently price 80% odds of a half-point increase and 20% odds for 75 basis points, (FEDBETS).
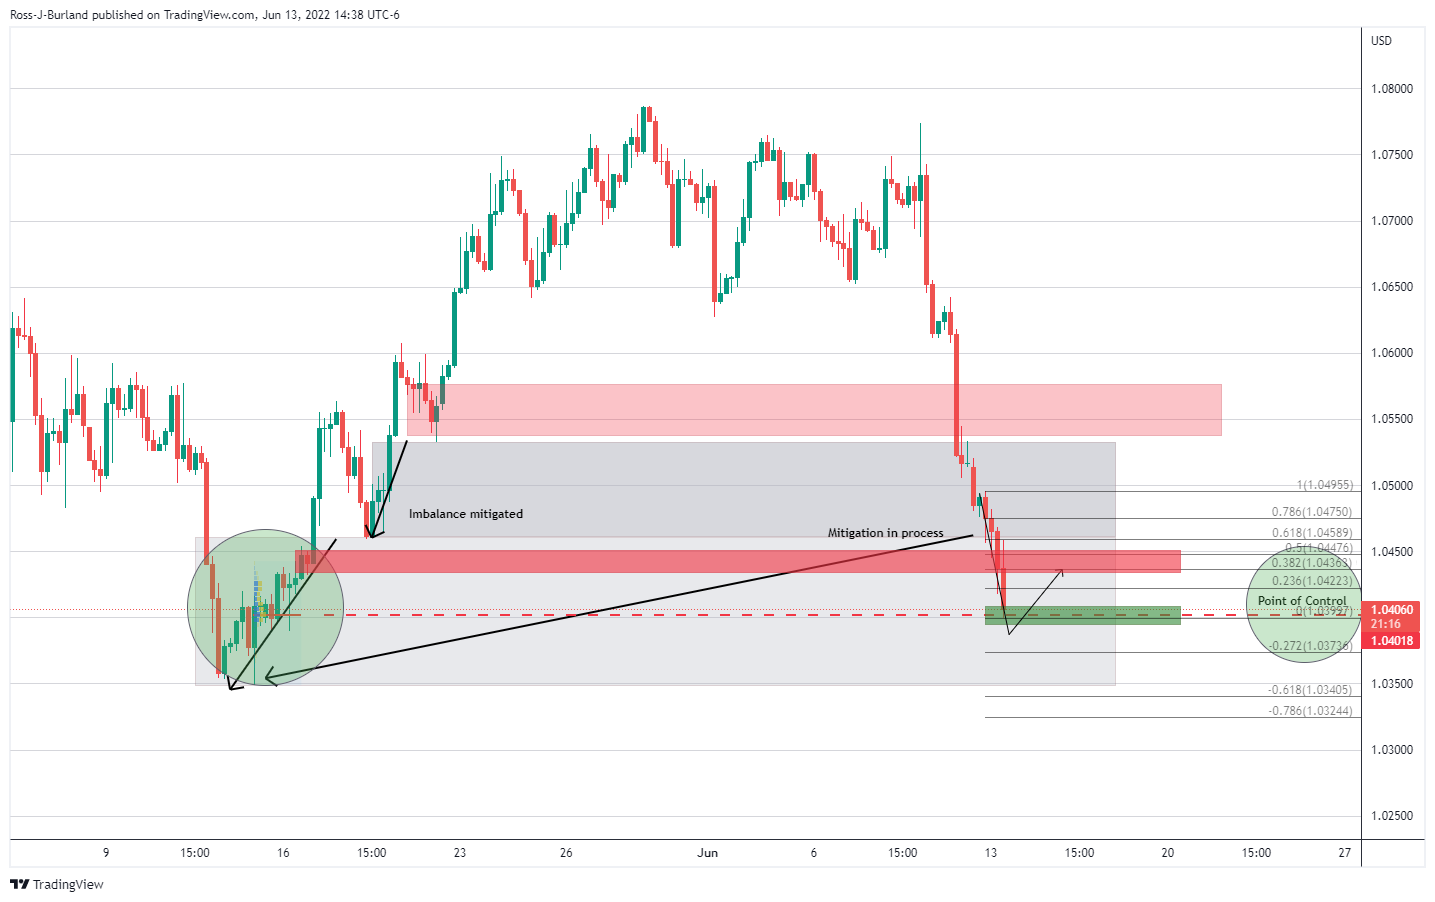
Meanwhile, taking the euro as a gauge of what is to come in the following sessions ahead of the FOMC, we are at a crossroads in forex:
EUR/USD technical analysis
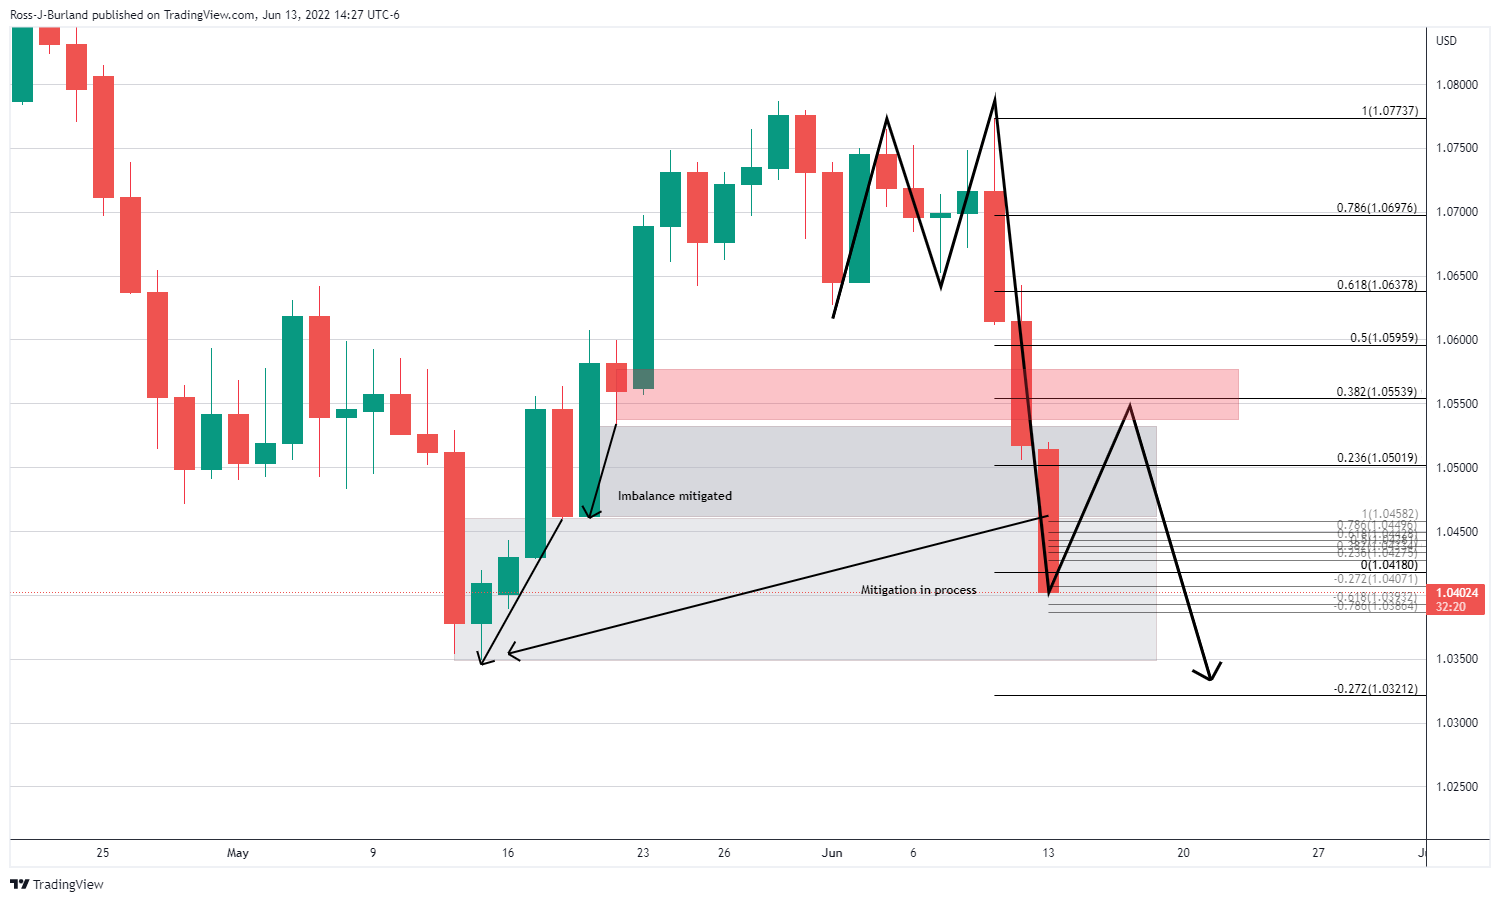
The price is moving in to take out the 1.04 figure with 1.0399 bid seen at some brokers already. According to the above chart, there is still more to come if the price is going to even out the bid from the May 22 lows of 1.0348. However, an hourly correction is more than likely before a break of 1.0390 is seen as the price meets the point of control of the 12-16 May correction on the 4-hour chart as follows:
What you need to take care of on Tuesday, June 14:
Financial markets started the week in risk-off mode, a follow-through of Friday’s negative sentiment after the US reported inflation kept rising in May to reach a multi-decade high. Market participants are looking for a potential 75 bps rate hike as the US Federal Reserve meets this week.
The macroeconomic calendar remained empty, which exacerbated risk-related trading. Wall Street remained pressured while heading into the close, with the three major indexes settling at their lowest since last January. The
The EUR/USD pair trades near the 1.0400 level, while the GBP/USD pair bottomed at a 2-year low of 1.2106, holding near-by at the time being. Commodity-linked currencies also collapsed. AUD/USD trades around 0.6920, while USD/CAD soared to 1.2890. The USD/JPY pair closed the day with a third consecutive doji at around 134.30.
Gold edged lower, with XAU/USD now changing hands at around $1,823 a troy ounce. Crude oil prices continued to advance, with WTI now trading at $120.70 a barrel.
The yield on the US 10-year Treasury note finished the day at 3.37% after peaking at 3.44%, its highest since before the pandemic.
The US Federal Reserve will be the first but not the only central bank to announce its monetary policy decision. The Switzerland National Bank, the Bank of England and the Bank of Japan will also announce their decisions in the upcoming days.
If the US Federal Reserve steps up its bet, it won’t take long until the rest follow such a lead. In the meantime, financial markets will see the decision as mounting concerns about a possible recession, which will translate into more panic selling.
Like this article? Help us with some feedback by answering this survey:
- The New Zealand dollar remains on the defensive, losing 1.69%.
- US hot inflation, and the Federal Reserve meeting, weighed on the market mood and boosted the greenback.
- Tuesday’s US Producer Price Index for May might attract investors’ attention as the Fed monetary policy meeting looms.
The NZD/USD nosedives near 90 pips in a risk-aversion trading day courtesy of May’s US Consumer Price Index, hitting 8.6%, sparking fears that the US Federal Reserve would tight more aggressively than they had, which would drag the US into a recession. At 0.6251, the NZD/USD is trading at fresh four-week lows as sellers begin to target the YTD lows at 0.6216.
Dismal sentiment dominates the financial markets
Dampened market mood keeps investors seeking a flight to safe-haven assets. Wall Street is going into a blood bath, losing between 2.66% and 4.84%. On Tuesday, the US Federal Reserve will begin its two-day monetary policy meeting and is widely expected to hike rates by at least 0.50%. That, alongside the above-mentioned and the re-emergence of a China’s coronavirus outbreak, keeps investors uneasy.
Just crossing the wires, the WSJ reported a news piece that said, “A string of troubling inflation reports in recent days is likely to lead Federal Reserve officials to consider surprising markets with a larger-than-expected 0.75-percentage-point interest rate increase at their meeting this week.”
Market’s reaction
The NZD/USD dipped from 0.6280s to 0.6240s in a matter of 15 minutes. In the meantime, the US Dollar Index reacted upwards and jumped from 104.9325 towards 105.285, at new 2-decade highs, up by 1.03%. The US 10-year Treasury yield jumped to fresh 11-year-highs and is closing to the February 2011 highs at around 3.737%.
Later in the Asian session, the New Zealand calendar will reveal May’s Food Inflation. The US economic docket will unveil the Producer Price Index (PPI) for May, which is expected to rise to 10.9% YoY, lower than April’s 11%. However, due to the jump in the CPI, it could smash the expectations, opening the door for a 75 bps rate hike by the Fed.
Key Technical Levels
- A retracement to the 38.2% Fibo that aligns with old support near 0.7050 could play out.
- However, the 4-hour chart shows no sign of deceleration so far and exposes 0.6890 first.
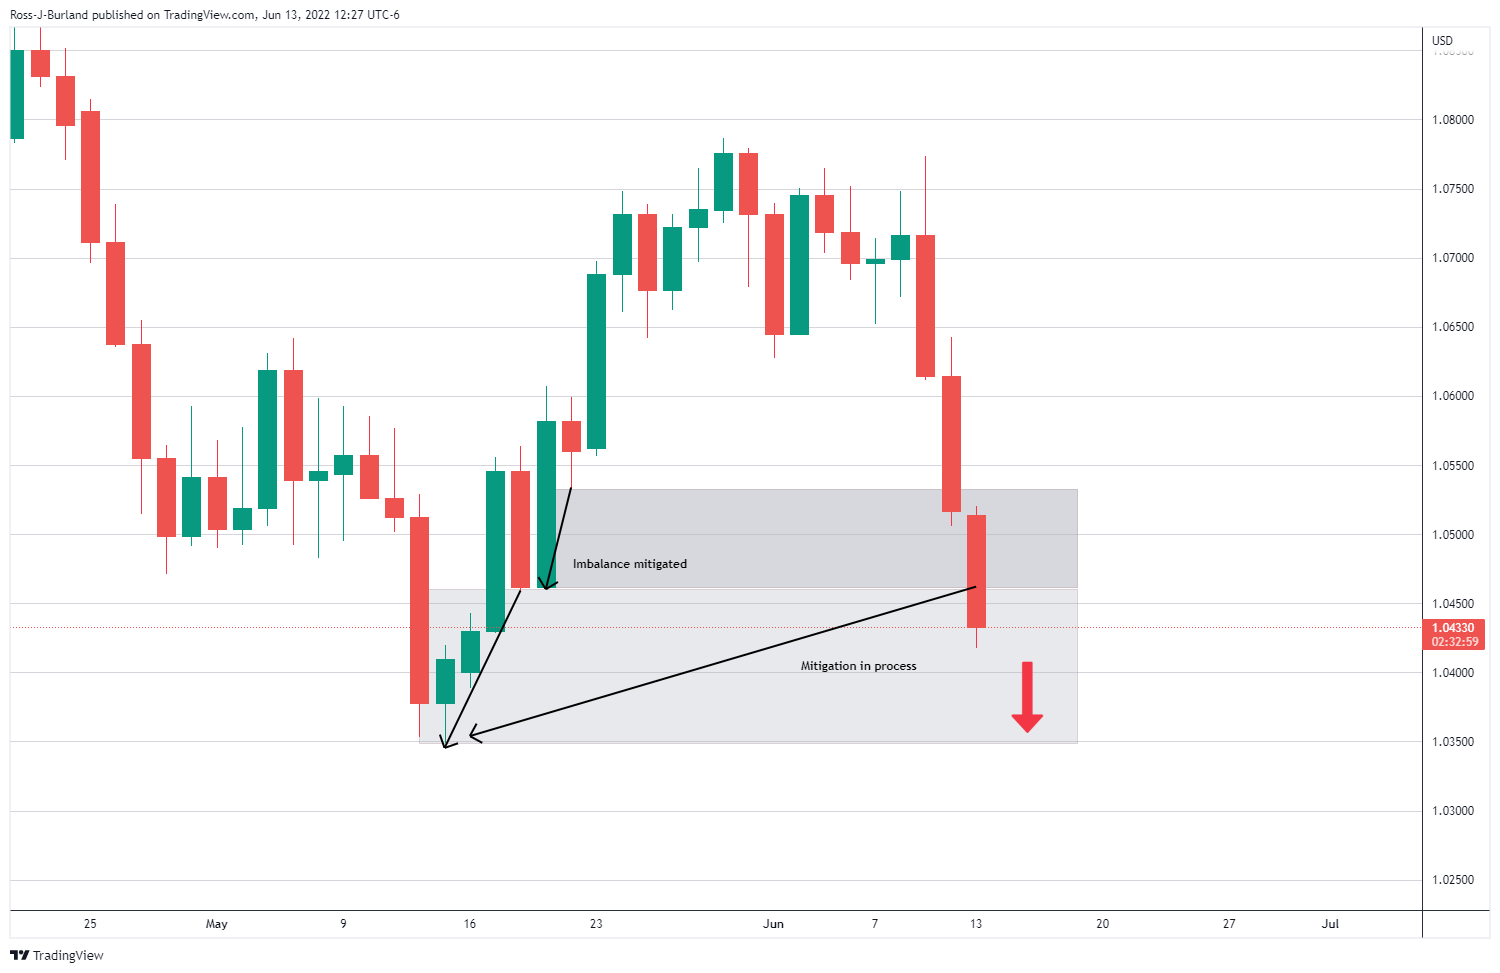
As per the pre-open analysis of AUD/USD, AUD/USD Price Analysis: There's something here for both the bulls and bears, the price has moved in to mitigate an inefficiency that was highlighted as follows:
The grey area marked the price imbalance between 0.6952 and 0.7000 from where there were prospects of a bullish correction. However, as seen in the following chart, the bears are relentless and taking on a fresh area of inefficiency in price:

With that being said, overstretched impulses will need to correct at some point, the question, for now, is when will the bears start to take profits?
In coming to the end of Wall Street, as the clock ticks down to the Fed this Wednesday, speculators might be inclined to cash in now:

A retracement to the 38.2% Fibo that aligns with old support near 0.7050 could play out. However, the 4-hour chart shows no sign of deceleration so far and exposes 0.6890 first:
- Wall Street collapses, remains in a bear market, and the USD rises.
- High inflation might trigger an aggressive US Federal Reserve reaction to tame inflation, despite increasing fears of a US recession.
- USD/CAD Price Forecast: Will face solid resistance at around 1.2880-1.2900.
The USD/CAD gained traction on Monday and extended its rally to three consecutive days, even though it retreated after reaching a daily high near 1.2880s. At the time of writing, the USD/CAD is trading at 1.2864, up by 0.60%.
High inflation in the US increases the odds of an aggressive Fed
US equities reflect a dampened market mood, so the USD/CAD edged higher. Wall Street’s stock indexes record losses between 2.08% and 4.37%, while US Treasury yields skyrocket on fears that an aggressive Federal Reserve tightening cycle might cause a recession in 2023. Last Friday’s inflation report weighed on investors as they reshuffled their portfolios, dumping riskier assets for safe-haven currencies. That boosted the greenback, with the US Dollar Index (DXY) gaining close to 0.70%, sitting at 104.893. Earlier, the DXY reached a multi-year high of around 105.065.
Besides the aforementioned, China’s coronavirus fears are back. A dozen Covid cases linked to a Beijing bar have triggered a race for millions of people facing mandatory testing and thousands under targeted lockdowns via Reuters. The re-emergence of infections is raising concerns about the economic outlook of the second-largest economy.
In the meantime, crude oil prices extend their gains. WTI, the US crude oil benchmark, rose 0.27%, exchanging hands at $121.06 per barrel but fails to lift the Canadian dollar, which is dragged down by global risk aversion.
The lack of economic data in the US and Canadian calendar left the USD/CAD adrift to a market sentiment play. The Canadian docket will feature New Motor Vehicle Sales and Manufacturing sales on Tuesday. On the US front, prices paid by producers for May will be revealed. An uptick on the latter could shift Fed officials towards a higher rate hike, though the baseline scenario remains 50 bps increases.
USD/CAD Price Forecast: Technical outlook
The USD/CAD witnessed a jump from around 1.2550 to 1.2880s in a three-day rally. On its way north, the major broke above the daily moving averages (DMAs), shifting from a neutral-downward bias to a neutral-upwards. Nevertheless, the USD/CAD will face a solid resistance at around 1.2885, the May 25 high, which, if broken, would pave the way for further gains.
If that scenario plays out, the USD/CAD first resistance would be 1.2900. Break above would expose December 20, 2021, daily high at 1.2964, followed by a test of the psychological 1.3000.
- EUR/USD bears stay the course and continue to eye a test of 1.04 the figure.
- The US dollar has climbed to score fresh bull cycle highs ahead of the Fed.
At 1.0448, the euro is still trailing to the US dollar by some 0.65% despite the recent bid in mid-day New York trade. The pair corrected from a low of 1.0418 but fell from a high of 1.0520 at the start of the week. The safe-haven dollar has gained to new two-decade highs versus major rival currencies as measured by the DXY index. The US dollar index (DXY), which measures the currency against six major peers including the yen, ticked as high as 105.065, the highest level since December 2002.
The US consumer price index increased a bigger-than-expected 8.6% last month, the largest year-on-year increase since December 1981, data showed on Friday, so investors hopeful that inflation has peaked were disappointed. This has left investors on alert that the Federal Reserve may tighten policy for too long and cause a sharp economic slowdown.
Fears of a global economic slowdown and bets on steep interest rate hikes by the Fed which have weighed on risk sentiment, sending stocks lower and bond yields higher on the back of red-hot inflation. The 10-year US Treasury yield has climbed to a fresh high of 3.354%, putting it in line with late April 2022 levels.
The moves come as traders are starting to ramp up bets that the Federal Reserve will potentially hike interest rates by 75 basis points on Wednesday. However, the last two months of wage data have been showing signs of slowing, which could be a factor that persuades the Fed to stick to a 50bps tightening path. Markets currently price 80% odds of a half-point increase and 20% odds for 75 basis points, (FEDBETS).
A 75bps hike, is it possible?
Analysts at Brown Brothers Harriman note that some banks are raising their Fed calls for a 75 bp move, one for as early as this week.
Is it possible?
''Sure,'' the analysts say, but they think it's very unlikely as there is going to be a very high bar after the Fed already flagged 50 bp moves for June and July.''
Have things really worsened that much? They say ''not really.''
''Looking ahead, the swaps market is now pricing in a terminal rate near 4.0%, a new high and up from around 3.0% at the start of this month. This was the risk if inflation were to remain persistent and that's what we are seeing.''
''When all is said and done, we believe monetary policy divergences remain the dominant driver for FX. As the U.S. economic outlook remains the best relative to its DM peers, the dollar uptrend remains intact,'' analysts at Brown Brothers Harriman argued.
ECB risks skewed towards more 50bp rate hikes
Meanwhile, the 2-year differential between the US and Germany has recovered to 210 bp after falling to 197 bp last week, the lowest since the end of February, the analysts at BBH noted.
The European Central Bank has been more hawkish of late and it intends to end QE by 1 July and hike policy rates by 25bp in connection with the July meeting, according to its latest statement released last week. The door for hiking by 50bp in September has been left ajar also and will be a strong possibility "if the medium-term inflation outlook persists or deteriorates".
''We now expect the ECB to hike by 25bp in July, 50bp in September and 25bp on each of the following meetings until March 2023 when the hiking cycle is likely to end, in our view. We see risks as skewed towards more 50bp rate hikes,'' analysts at Danske Bank said.
EUR/USD technical analysis
The momentum is strong in the US dollar which is driving the euro to the edge of the abyss, mitigating longer-term price imbalances along the way as follows:
However, there are prospects of a bullish correction in the M formation's last bearish leg which exposes the 38.2% Fibonacci area near 1.0550:
From a 1-hour perspective, however, the price action and structure remain bearish while below the 78.6% Fibo and the market is in the throes of a fresh bearish impulse towards 1.04 the figure following a failed correction.
- The USD/JPY reached a 24-year high above 135.00 but retreated on fears of Japanese intervention in the FX markets.
- A dismal market mood boosts safe-haven peers, thus favoring the JPY, as USD/JPY traders booked profits.
- The Fed and the Bank of Japan will unveil their monetary policy decisions in the week.
The USD/JPY plunges close to 200 pips after breaking above the 135.15 January 2002 high, as speculations of Japanese authorities’ intervention in the FX market emerged last Friday. At 134.18, the USD/JPY retreated from daily highs at around 135.19, despìte US Treasury yields extending their gains towards multi-year highs.
US bond yields rise, but the USD/JPY remains heavy during the day
Global equities remain under pressure as investors assess the almost 9% inflation in the US. Negative sentiment favors safe-haven peers and, in the case of the USD/JPY, the yen. However, during the day, the major weakened to a 24-year, though retreated on a verbal intervention expression by Japanese authorities on Friday, which said, “It’s important that currency rates move in a stable way, reflecting fundamentals. But there have recently been sharp yen declines, which we are concerned about.”
In the meantime, the US Dollar Index, a gauge of the buck’s value against its peers, is advancing 0.64% at 104.857 after reaching a 20-year high at around 105.065.
Central bank divergence between the Fed and the BoJ’s had been the main drivers of the USD/JPY in the year. Also, the positive correlation of the pair with the US 10-year Treasury yield triggered a USD/JPY rally, from 116.00 to 135.00.
Earlier, the short-end of the yield curve, the 2s-10s, inverted during the day on concerns that a higher Federal Funds Rate (FFR) might trigger a recession, as the US central bank battles inflation readings near 9%, not seen since 1981. Also, it is worth noting that some Wall Street’sbanks increased their calls for a potential 75 bps increase, even a 100 bps increase.
Reflection of the aforementioned is the US 10-year benchmark note rate, up at 3.343%, gaining almost 20 bps.
Fed’s and BoJ’s monetary policy decisions, the spotlight on the calendar
A busy US economic docket would keep USD/JPY traders entertained. On Tuesday, the Federal Reserve June meeting begins, and on Wednesday, they will unveil its decision. Later on, the Fed Chair Jerome Powell will high the stand.
Meanwhile, the Japanese docket would feature the Industrial Production, Machinery Orders, and the Balance of Trade. By Friday, the Bank of Japan will reveal its monetary policy, widely expected to hold rates negative at -0.10%.
Key Technical Levels
- Risk aversion intensifies across financial markets.
- Treasuries also decline, US yields at multi-year highs.
- USD/MXN break key resistance levels, tests 20.45/50 area.
The USD/MXN is rising sharply on Monday as global markets tumble. The pair jumped from below 20.00 to 20.50, hitting the highest level since May 2. It is having the biggest daily gain in months boosted by risk aversion.
Latin American currencies are the worst performers on Monday. The USD/CLP (Chilean peso) gains 2.50%, followed by the USD/BRL (Brazilian real) up 2.25% and the USD/COP (Colombian peso) rises 2.20%. The USD/MXN rises by 2.30% and is about to post the highest close in a month.
The rally is testing the 20.45/50 resistance area. It is a zone that capped the upside in April and May. A break higher should trigger more gains targeting initially the 20.70 area. While under 20.45, losses in USD/MXN seem limited, with the new support levels seen at 20.15 and 20.00.
If the current mood in financial markets persists, the Mexican peso will likely remain under pressure. A recovery could limit the upside.
The economic calendar is clear in Mexico for the current week. The key event will be the Federal Reserve meeting. On Wednesday the FOMC will announce its decision. A 50bps rate hike is expected, although some analysts consider the possibility of a larger hike after the latest CPI numbers.
Technical levels
- Friday’s US hot inflation reading triggered a flight to safe-haven currencies like the greenback, and precious metals fell.
- The 2s-10s US Treasury yield curve inverted during the day as a recessionary scenario looms.
- The CME FedWatch Tool shows that the odds of a 75 bps increase in the June meeting lie around 34%.
- Gold Price Forecast (XAU/USD): A daily close at around $1820 to open the door towards $1800.
Gold spot (XAU/USD) slides to a new monthly low near the $1820 figure on Monday, as US Treasury yields skyrocket, propelled by Friday’s hotter than expected US inflation numbers, ahead of the US Federal Reserve June meeting, in which investors have priced in a 50 bps increase. At the time of writing, XAU/USD is trading at $1826.60, down near 2.20%.
Pessimistic sentiment triggered a flight to safe-haven assets, except Gold
Risk-aversion dominates Monday’s session. European and US equities are plunging as a recession looms, spurred by global central banks, which forecasted inflation as transitory, falling behind the curve. Market participants are flying toward safe-haven assets, as reflected by the greenback. The US Dollar Index, a measure of the greenback’s value vs. six currencies, advances 0.80%, trading at fresh 2-decade highs around 105.027.
In the meantime, Gold remains trading heavy after reaching a daily high near $1880, weighed by higher US Treasury yields. The 10-year benchmark note rate jumped to multiyear-highs, to levels last seen in 2011, at around the 3.314% threshold, up by 15 bps.
Meanwhile, the short-end of the yield curve, the 2s-10s, inverted during the day on concerns that a higher Federal Funds Rate (FFR) might trigger a recession, as the US central bank battles inflation readings near 9%, not seen since 1981.
Elsewhere, some commercial banks around the globe begin to price in a 75 bps rate hike on Wednesday, like Barclays. However, most analysts expect the Fed to hike 50 bps as they aim to keep its credibility intact, though it could open the door for higher rate increases in July and September.
The CME FedWatcht Tool shows the odds of a 75 bps rate hike at 34.3% while fully pricing in a 50 bps increase.
With no data in the US economic docket to be released, all eyes are set on the Fed monetary policy decision and Chair Jerome Powell’s post-meeting press conference. Traders must know that the Summary of Economic Projections (SEP) will also be unveiled. Expectations are mounting that officials would update inflation estimations to the upside and growth to the downside.
Gold Price Forecast (XAU/USD): Technical outlook
XAU/USD is trading below the 200-DMA, for the second time, in the last couple of trading sessions. In fact, it also broke a 4-year-old upslope trendline that, if confirmed by a daily close, would pave the way for further losses. Therefore, in the short term, XAU/USD is headed to the downside.
Gold’s first support would be May’s 18 low at $1807.23. A breach of the latter would expose the $1800 figure, which, once cleared, could send XAU/USD tumbling towards the YTD low at $1780.18.
- Euro under pressure, yen soars on risk aversion.
- Dow Jones tumbles 2.60%, US yields print multi-year highs.
- EUR/JPY drops almost 500 pips in three days.
The decline of EUR/JPY from multi-year highs gained speed on Monday and tumbled under 140.00. From last week highs, it has fallen 500 pips
Reversal points to more losses
The EUR/JPY is trading around at 139.48, the lowest level in ten days. It is falling for the third consecutive day, making a sharp reversal that started last week from levels above 144.00.
The cross is holding under 140.00, a relevant support area. A daily close below the next key support at 139.00/10 should open the doors to more losses, targeting 138.40, the 20-day simple moving average.
The slide in EUR/JPY takes place amid risk aversion and despite higher US yields. The yen is among the top performers unaffected by the fact that the US 10-year yield hits the highest level in a decade above 3.30%.
On Wall Street, the Dow Jones is falling by 2.80% and the S&P 500 drops 3.79%. Markets look in panic mode at the beginning of the Federal Reserve’s week. Concerns about the global economic outlook and monetary tightening across the globe weigh on investors. The central bank is seen raising rates by 50 bps, although after Friday’s CPI data some analysts consider it could raise by 75 bps.
Technical levels
Gold bugs beware – a technical breakdown could be the catalyst needed to squeeze a massive amount of complacent length in the yellow metal, according to strategists at TD Securities.
Growing valuation gap between gold and real rates to exacerbate the repricing lower
“The trading bias is still to the downside, but participants are still looking for catalysts to flush out the massive amount of complacent length. We see risks that technical breakdown could be the catalyst. The bar for CTA liquidation is growing thin, as we estimate that a break below $1,810 would catalyze a substantial selling program from systematic trend followers.”
“Prices have managed to break below the bull-market defining uptrend from 2019, which may catalyze additional liquidations from the complacent bulls at prop-shops.”
“A growing valuation gap between gold and real rates might eventually exacerbate the repricing lower in the yellow metal, despite it being attributed to both an undue rise in real rates given quantitative tightening, and to the still-massive complacent length in the yellow metal which has kept the prices elevated.”
- AUD/USD cratered into the low-0.6900s on Monday, down over 1.5% on the day and over 4.0% lower in four days.
- The pair is being battered by risk-off flows as markets price a more hawkish Fed and potential recession.
- China lockdown fears are also hurting the pair, with bears eyeing a near-term test of support in the low-0.6800s.
AUD/USD cratered on Monday in tandem with a collapse in US and global stock market sentiment as investors upped their bets on both Fed tightening (in wake of last Friday’s US inflation data) and a US recession (in wake of last Friday’s US Consumer Sentiment figures). The pair was last trading to the south of the 0.6950 level, having shed over 1.5% on Monday, taking its string of losses in the last four sessions to over 4.0%.
The risk-sensitive Aussie is also feeling the pain of renewed fears about lockdowns in China as Beijing and Shanghai both reinstate restrictions to contain new Covid-19 outbreaks. China is Australia’s largest trade partner and is the main export destination for many of the country’s industrial/energy coming.
Anyone who bet on near-term Aussie upside in wake of last week’s larger-than-expected RBA rate hike has likely already been stopped out. That should deter traders from betting on a substantial rebound in the pair should this Thursday’s Australia labour market report come in better than expected. Indeed, the Aussie is this week set to continue to trade as a function of broader risk appetite and USD flows.
As risk appetite craters on central bank tightening and recession fears and the US dollar benefits from the hawkish Fed and its status as a safe-haven currency (it is the world’s reserve currency, after all), AUD/USD next stop is likely the May lows in the mid-0.6800s. If it can break below 0.6800, there isn't much to stop a run all the way lower to around the 2019 lows in the upper-0.6600s. The main macro events of the week will be Tuesday’s US Retail Sales report for May and Wednesday’s Fed meeting, where some are calling the bank to invoke a Volcker moment and surprise with a larger 75 or 100 bps rate hike.
- WTI is a little lower but still trading near $120, weighed slightly amid risk-off conditions and China lockdown worries.
- Weak US data, a surprisingly hawkish Fed and tough restrictions in China could combine to send WTI towards its 21DMA.
Though still a little lower on the day, oil prices pared the bulk of earlier session losses on Monday, despite steep downside in global risk assets as investors fretted about last Friday’s hotter than expected US inflation and its implications for Fed monetary policymaking, as well as increasing signs that the US economy might be headed for recession. Front-month WTI futures were last trading a few cents in the red in the $120 per barrel area, having bounced from earlier session lows near $118.
Traders cited China Covid-19 developments, after Beijing and Shanghai both moved to reimpose restrictions as Covid-19 infections rose once again, as weighing on the price action, as well as the market’s risk-off mode that has seen the US dollar strengthen. A strong buck means USD-denominated commodities are more expensive for international buyers.
But the bounce from mid-session lows suggests that appetite to buy the dip remains strong, for now. Indeed, global oil markets are still very tight as demand in the northern hemisphere rises towards its summer peak and OPEC+ supply woes show no signs of abating, with Russian output still languishing in the face of strict Western sanctions and as smaller (mainly African) producers struggle amid a lack of investment and amid instability.
Meanwhile, the prospect of a return by the US and Iran to compliance with the 2015 nuclear pact which could set the stage for well over 1 million barrels per day in Iranian exports to return to global markets appeared to have been dealt a death blow last week. Amid a spat with global nuclear watchdog the International Atomic Energy Agency (IAEA), Iran is set to remove nearly all equipment that had been used by the organisation to monitor its nuclear activities.
But traders should be aware that amid the risk that 1) the China lockdown worsens, threatening oil demand in the country, 2) further US data this week points to a recession and 3) the Fed on Wednesday delivers a hawkish surprise as inflation continues to surprise to the upside, oil might be in for a rough time. A test of the 21-Day Moving Average in the mid-$115s seems a solid possibility.
- Silver met with an aggressive supply near the $22.00 confluence resistance on Monday.
- The technical set-up favours bearish traders and supports prospects for further losses.
- Sustained strength beyond the $22.00 mark is needed to negate the bearish outlook.
Silver extended its rejection slide from the $22.00 confluence hurdle and dropped to a near one-month low, around the $21.20 region during the early North American session on Monday.
The latter coincides with the 61.8% Fibonacci retracement level of the $20.46-$22.52 bounce and acceptance below would be seen as a fresh trigger for bearish traders. Meanwhile, Technical indicators on daily/4-hourly charts are holding deep in the bearish territory and are still far from being in the oversold zone.
The technical set-up seems tilted firmly in favour of bearish traders and supports prospects for an extension of the ongoing depreciating move for the XAG/USD. Hence, a subsequent slide below the $21.00 mark, towards challenging the YTD low around the $20.45 area touched on May 13, now looks like a distinct possibility.
On the flip side, attempted recovery might now confront resistance near the 50% Fibo. level, around mid-$21.00s. Any further move up might still be seen as a selling opportunity and runs the risk of fizzling out rather quickly near the $22.00 mark, comprising 200-period SMA on the 4-hour chart and the 23.6% Fibo. level.
A convincing break through the aforementioned barrier would negate the near-term negative bias and shift the bias in favour of bullish traders. The XAG/USD might then surpass an intermediate resistance near the $22.30 area and test the $22.50-$22.60 supply zone. Some follow-through buying should pave the way for additional gains.
Silver 4-hour chart
-637907246110784329.png)
Key levels to watch
GBP/USD has dropped below 1.22 after disappointing GDP data ahead of the Bank of England’s (BoE) decision on Thursday. A cautious stance from the “Old Lady” could send cable to new lows for the year, economists at Scotiabank report.
BoE may allude to an eventual pause in rate hikes
“Further to the USD rally on Fed bets and the weak market's mood, UK April GDP disappointed economists’ expectations in data published this morning. The country’s economy surprisingly contracted by 0.3% MoM against a median forecast for a slight 0.1% expansion.”
“The poor GDP showing makes the BoE’s decision even more difficult. We think odds have risen that the bank alludes to an eventual pause in rate hikes – perhaps as soon as August, but more likely in September or November.”
“OIS markets still seeing two 50 bps hikes across the four BoE meetings between now and November are in for a severe disappointment and the GBP is at clear risk of plumbing new lows for the year (and since mid-2020) under the mid-1.21s if the BoE delivers a cautious message this week.”
The CAD is trading defensively against the strengthening USD. Economists at Scotiabank expect the loonie to continue at the mercy of the current US dollar’s force.
The risk of a push on to 1.2950/1.30 has risen
“The CAD slide looks excessive from our point of view, given the strength of the domestic economy, the BoC’s own hawkish intent, and yield premiums over the USD for the CAD but that will not help the CAD resist the USD’s general advance for the moment.”
“With spot already reaching the 1.2865 area (61.8% Fib of the May/ Jun USD decline), the risk of a push on to 1.2950/1.30 has risen.”
“USD support is 1.2815/25.”
GBP/USD has fallen aggressively. Analysts at Credit Suisse stay tactically bearish, with next key supports at 1.2157/50, then 1.2072, which is certainly not viewed as a floor.
Resistance moves to 1.2431/39
“Next key support is seen at the recent lows at 1.2167/57, which we expect to be broken fairly imminently, with short-term daily MACD momentum turning lower from neutral levels. Thereafter, we continue to look for an eventual fall to our 1.2072/17 target zone – the May 2020 low and 78.6% retracement of the entire 2020/2021 uptrend.”
“Given the very strong downtrend, the 1.2072/17 area is not viewed as a floor and we certainly do not rule out an eventual move to 1.15/1.14, which is the bottom of the six-year range.”
“Near-term resistance moves lower to 1.2300/01 initially, above which would trigger a move to the recent minor breakdown point at 1.2431/39, which we look to cap. Above here would open up more important medium-term resistance at 1.2668/76, where we would have even more confidence in a ceiling if reached.”
EUR/USD drops to mid-1.04s. Economists at Scotiabank expect the pair to extend its decline toward the year-to-date low of 1.0350.
EUR/USD ends its two-week consolidation period
“Risk-off sentiment, widening core-periphery spreads, a more hawkish Fed, and Eurozone growth concerns will likely offset augmented ECB hike bets in the near-term and keep the EUR on the backfoot as the current leg lower eyes the year-to-date low of 1.0350.”
“The EUR’s steep three-cent-plus drop from above the mid-1.07s last Thursday has wiped out a sizable share of its H2-May gains, ending its two-week consolidation period with a sharp slide that points it towards its year-to-date low of 1.0350.”
- Gold has slumped back to test its 200DMA in the low-$1840s having at one point tested its 50DMA near $1880.
- Fed tightening bets have amped up since last Friday’s hot US CPI, hurting gold via higher yields/a stronger buck.
- The Fed policy announcement on Wednesday is this week’s main event.
With investors having had a little more time to digest the implications of last Friday’s hotter than forecast May US Consumer Price Inflation (CPI) data and record weak June US Consumer Sentiment figures, spot gold (XAU/USD) prices have experienced an about-face on Monday. Prices were last trading in the low-$1840s and near the 200-Day Moving Average (at $1842), having reversed more than $30 lower versus earlier session highs near $1880, where the 50DMA came into play as resistance.
Whilst calls for the US to be already in, or on the brink of, recession from analysts on Wall Street are growing louder, something that might normally support safe-haven gold, calls for even faster and more aggressive Fed tightening with CPI at four-decade highs are also growing louder. Some banks have warned that there is a non-negligible chance that the Fed might opt to shock the market with a 75 or even 100 bps rate hike at its policy announcement on Wednesday.
Whilst a 50 bps rate hike remains the market’s base case scenario, bets are rising for the Fed to have taken interest rates well into restrictive territory (i.e. the upper 3.0s%) by this time next year. These renewed hawkish bets on Monday are pressuring US bonds, which pushes yields higher and benefitting the US dollar, thus creating an unfavourable backdrop for gold prices.
A rise in yields hurts demand for gold as it represents a rise in the opportunity cost of holding non-yielding assets (like precious metals). Meanwhile, a stronger buck makes USD-denominated commodities (like XAU/USD) more expensive for international buyers, reducing demand. For now, growth/recession fears might be enough to keep gold supported near its 200DMA in the $1840s. US May Retail Sales data out Tuesday might highlight such fears.
But if the Fed does deliver a big hawkish shock (i.e. a larger than 50 bps rate hike), a test of annual lows under $1800 is on the cards. However, with most analysts now of the opinion that a recession is coming sooner rather than later, gold’s long-term outlook doesn’t look to bad. Looking at the Fed funds futures curve, markets very much remain of the opinion that after some aggressive near-term hiking from the Fed coupled with a recession over the next 12 or so months, US inflation should come eventually come under control, giving the Fed the space to then cut interest rates in the longer-term (which gold bulls want).
The S&P 500 has seen a further sharp fall and gap lower following the CPI release on Friday. Economists at Credit Suisse look for a clear and sustained break below support at 3815 for a fall to the 50% retracement of the 2020/2021 uptrend at 3505.
Resistance moves to 3943 initially
“We look for a conclusive and sustained move below 3815. This should then see the risk stay directly bearish with support seen next at the March 2021 lows at 3730/23 and eventually our core objective at the 50% retracement at 3505, also the location of the 200-week average.”
“Resistance is seen moving to 3943 initially, then the price gap from Friday, starting at 3974 and stretching up to 4017/18, which we look to ideally cap further strength.”
GBP/USD has tumbled back below the 1.22 area. Economists at Rabobank expect the pair to extend its fall to 1.20 over the coming months.
Brexit carries a long-lasting impact on GBP
“We continue to see risk of GBP/USD dipping to 1.20 on a three-month view. This forecast assumes the greenback retains broad-based strength.”
“In a report published last June, the Bank of England identified two factors which were holding back investment. These were covid and Brexit-related uncertainties. The former has mostly passed. The latter is likely continuing to have an impact.”
- Gold Price turned south following the impressive upsurge witnessed last Friday.
- Investors grow increasingly concerned over the US economy tipping into recession.
- A daily close below $1,840 could open the door for additional losses ahead of Fed meeting.
Gold Price reversed its direction at the start of the week and erased all the gains it recorded last Friday. The risk-averse market environment is helping the dollar outperform its rivals on Monday and making it difficult for XAUUSD to shake off the bearish pressure.
Technicals paint a mixed picture
The near-term technical outlook suggests that buyers remain on the sidelines despite Friday's impressive upsurge. The 200-day SMA forms significant support at $1,840 and sellers could look to dominate XAUUSD's action if that level fails ahead of the FOMC's policy announcements on Wednesday.
Gold Price looks fragile on hawkish Fed bets
Markets are pricing in a more-than-50% probability of the Federal Reserve hiking its policy rate by a total of 125 basis points (bps) in the next two meetings, the CME Group's FedWatch Tool shows on Monday. By September, there is an 80% chance that the Fed will raise its rate by at least 175 bps from the 0.75%-1% range where it stands today.
Friday's inflation data from the US seems to have caused markets to reconsider the Fed's rate outlook. The US Bureau of Labor Statistics announced that the Consumer Price Index (CPI) jumped to a fresh multi-decade high of 8.6% on a yearly basis in May, compared to the market expectation of 8.3%. Additionally, the Core CPI, which excludes volatile food and energy prices, rose by 0.6% on a monthly basis.
US CPI data revived inflation fears
Although US bond yields surged higher with the initial reaction to the inflation data, gold managed to find demand ahead of the weekend. Commenting on the market reaction, "both 10-year yields – relevant to gold – and those on two-year notes, which are best for gauging how markets expect the Fed to act, advanced," noted FXStreet Analyst Yohay Elam. "However, those on two yields rose at a much faster pace. If they surpass the 10-year yield – yield curve inversion – it has historically tended to reflect fears of a brewing recession. If the US economy shrinks, the Fed would eventually have to cut interest rates and therefore, long-term yields such as 10-year ones would have to fall. That is what pushed gold higher."
Meanwhile, China's zero-COVID policy continues to cloud gold's demand outlook. Beijing officials announced over the weekend that the city's most populous district, Chaoyang, will go into mass testing because of a "ferocious" coronavirus outbreak. Moreover, Shanghai will reportedly conduct a fresh round of testing for most of its 25 million residents. These developments coupled with growing recession fears caused safe-haven flows to dominate the financial markets on Monday.
Gold Price technical outlook
Gold Price was last seen testing the 200-day SMA at $1,840. In case XAUUSD makes a daily close below that level and starts using it as resistance, it could fall toward $1,825 (June 10 low) and $1,810 (the end-point of the latest downtrend) afterwards.
On the upside, $1,850 (Fibonacci 23.6% retracement) aligns as interim resistance ahead of $1,875 (Fibonacci 38.2% retracement) and $1,890 (100-day SMA).
Meanwhile, the Relative Strength Index (RSI) indicator on the daily chart retreated below 50, confirming the bearish tilt in the near-term technical outlook.
Gold Price report for the week ahead
USD/JPY strength has stalled for now exactly below the 135.20 highs of 2002. But weakness stays seen as corrective ahead of a sustained break higher, with scope for 150 over the longer-term, analysts at Credit Suisse report.
Key 135.20 high of 2002 to cap in the short-term
“We look for the 135.02/135.20 highs of 2002 to cap at first for a fresh phase of consolidation. However, with a multi-year ‘secular’ base completed earlier this year, we ultimately expect 135.20 to be decisively cleared in due course, with resistance then seen next at 135.85/87, ahead of 136.81/84 and then 137.21.”
“Our ultimate objective stays seen in the 147.62/153.01 zone.”
“Near-term support at 133.38/20 is now increasingly important, as a break below here can see a pullback to 132.62, then 132.34 and likely gap and 13-day exponential moving average support at 131.87/62, but with fresh buyers expected here if reached.”
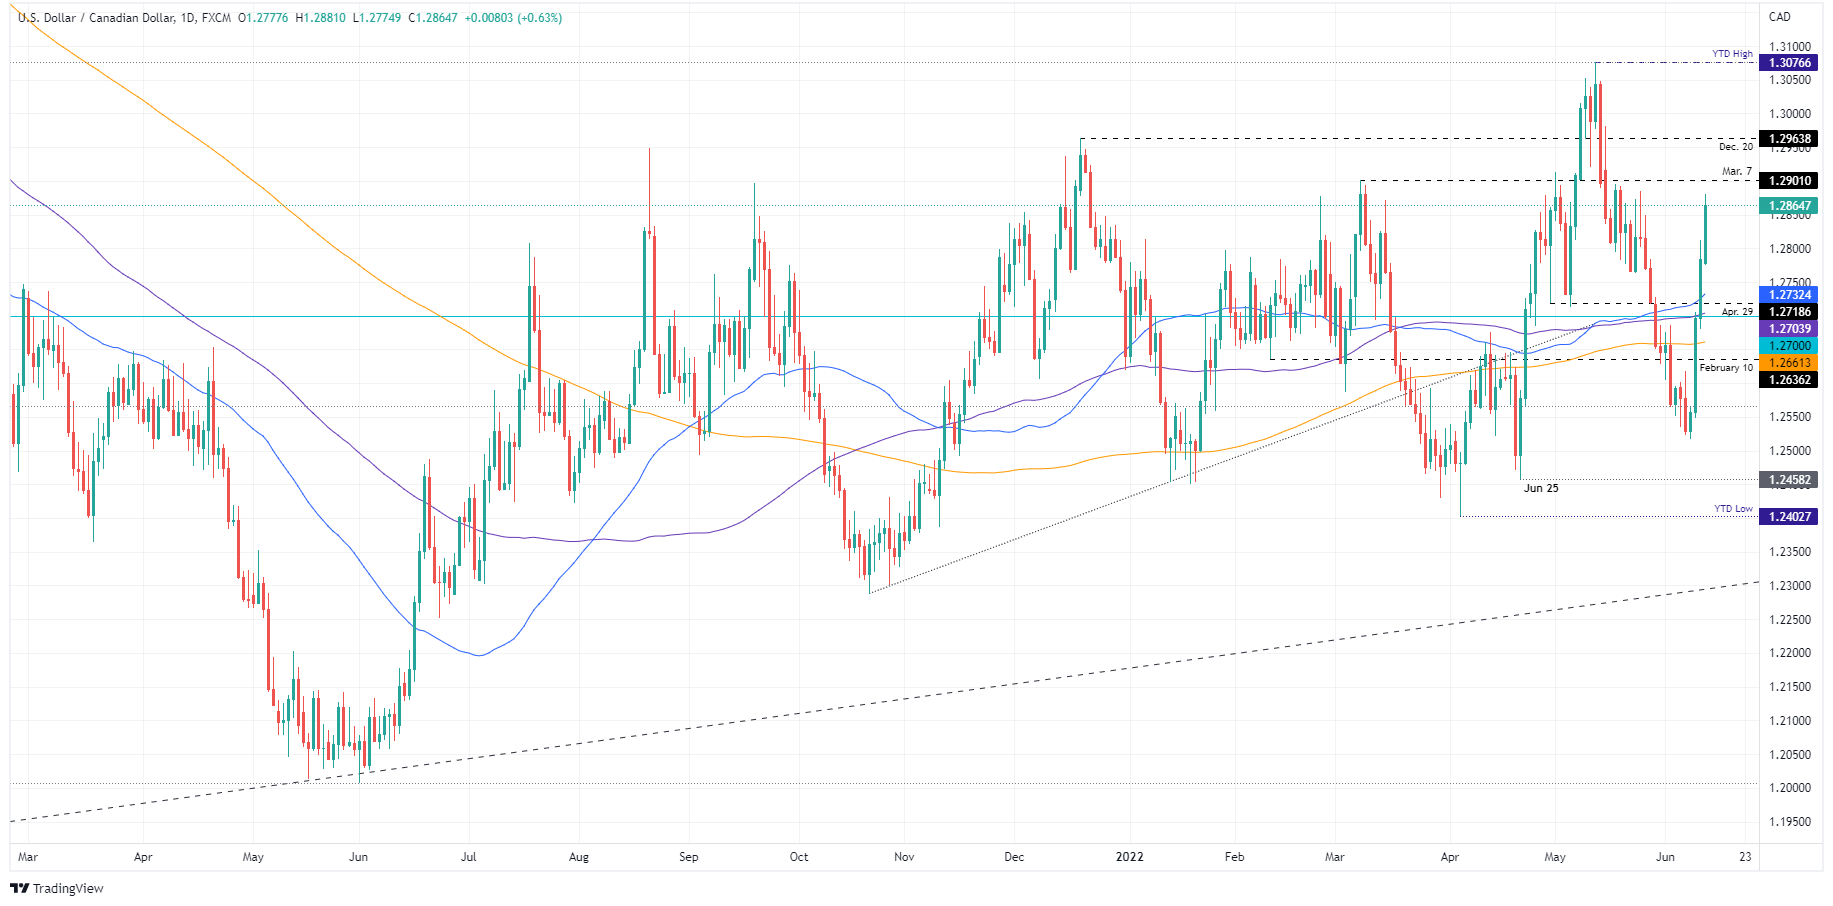
- USD/CAD gained traction for the fourth successive day and climbed to over a two-week high.
- Retreating oil prices undermined the loonie and remained supportive amid a stronger USD.
- Sustained move beyond the 61.8% Fibo. level will set the stage for further near-term gains.
The USD/CAD pair built on last week's solid rebound from the 1.2520-1.2515 region, or its lowest level since April 21 and scaled higher for the fourth successive day on Monday. The momentum lifted spot prices to a two-and-half-week high, though stalled near the 1.2865-1.2870 resistance zone.
Oil prices retreated further from a three-month peak touched last week and undermined the commodity-linked loonie. On the other hand, the prospects for a more aggressive Fed rate hike moves to combat stubbornly high inflation, along with the risk-off mood, benefitted the safe-haven US dollar. The combination of factors continued acting as a tailwind for the USD/CAD pair and remained supportive of the strong move up.
Bulls, however, struggled to capitalize on the move or make it through the 1.2865-1.2870 supply zone, which coincides with the 61.8% Fibonacci retracement level of the 1.3077-1.2518 downfall. The mentioned barrier should now act as a pivotal point, which if cleared decisively would set the stage for a further near-term appreciating move. The USD/CAD pair might then accelerate the momentum towards reclaiming the 1.2900 round figure.
The upward trajectory could further get extended towards the 1.2920-1.2925 intermediate resistance en-route the 1.2960 region, above which bulls could aim to conquer the 1.3000 psychological mark. Some follow-through buying has the potential to push the USD/CAD pair towards the YTD peak, around the 1.3075 area touched in May.
On the flip side, the 50% Fibo. level, near the 1.2800 mark, seems to protect the immediate downside. Any subsequent slide could be seen as a buying opportunity near the 1.2760 region, which should limit the downside near the 1.2730 area, or the 38.2% Fibo. level. The latter should act as a strong base for the USD/CAD pair.
USD/CAD daily chart
-637907213459108101.png)
Key levels to watch
Economists at Nordea believe the Federal Reserve will hike by 50 bps, but uncertainty is very high. If they are right, the USD could weaken in favour of other G10 currencies.
USD could strengthen on a 75 bps hike from the Fed
“We believe the Fed will hike by 50 bps this week but we admit that the uncertainty is very high. If we are right, we will likely see the USD weaken again in favour of other G10 currencies such as EUR, NOK, SEK, DKK, etc over the short-term.
“If we are wrong, the USD could strengthen somewhat more against the rest of G10 currencies.”
“From a technical standpoint, the USD is close to being overbought against most G10 currencies currently.”
The euro is trading heavily near 1.0450. A break below 1.0350 would open up additional losses toward parity, economists at BBH report.
Fragmentation fears have risen in the wake of the ECB decision
“The break below 1.0515 sets up a test of the May 13 low near 1.0350 and after that, we have to start talking about parity.”
“We think the rising risks of fragmentation are a major factor behind subsequent euro weakness. Markets were very disappointed by the lack of any concrete measures to address peripheral spreads, which are making new cycle highs as a result. Reports had hinted at some sort of new emergency bond-buying program but all we got was a pledge to use PEPP reinvestments to address the issue. That wasn't enough and so the euro is plumbing new depths.”
- EUR/USD has slid into the mid-1.0400s as the buck benefits from safe-haven demand and hawkish Fed bets.
- Some are eyeing a test of annual lows in the mid-1.0300 against an increasingly bearish backdrop.
- The main event of the week will be Wednesday’s Fed meeting, plus US Retail Sales and PPI data.
Though ECB policymakers continue to endorse the hawkish rate guidance unveiled by President Christine Lagarde following last week's policy announcement and has markets betting on a 25 bps rate hike next month followed by a 50 bps move in September, the euro bulls are nowhere to be seen. Indeed, EUR/USD has on Monday slumped back to its lowest levels since 17 May just above 1.0450, down a further 0.6% on the day following drops of closer to 1.0% each last Thursday and Friday.
EUR/USD downside over the past few days is a story of US dollar strength, with the buck benefitting from a combination of markets amping up Fed tightening bets and pushing US bond yields higher, while risk assets crumble, spurring demand for the world’s reserve currency as a safe-haven. Regarding the former, US 10-year yields rocketed to fresh multi-year highs on Monday above 3.25%, spurred as market participants bet that the Fed might even opt to go with a 75 or 100 bps rate hike in wake of last Friday’s hotter-than-expected US inflation data.
Traders will recall that data last Friday revealed the headline rate of annual US inflation according to the Consumer Price Index (CPI) to have risen to 8.6%, a new four-decade high. Meanwhile, data released by the University of Michigan later in the day showed Consumer Sentiment at a record low (going back to the 1970s) in June, sparking calls that the US economy might already be in, or at least imminently headed towards, a recession.
Given that high and rising US inflation precludes the Fed from easing to support growth (for the time being), the buck is able to garner safe-haven demand as a result of US growth fears. Punchy geopolitics-related headlines have also been in focus over the weekend, with China flexing about how it is ready to start a war against Taiwan if it declares independence and Russia seemingly gaining further ground in Ukraine. Meanwhile, Covid-19 infections in Beijing are on the rise again as officials there initiate further rounds of mass testing, highlighting the ongoing China lockdown risk.
US data this week (May Retail Sales & Producer Price Inflation plus June Philly Fed Manufacturing Index) is likely to reinforce that the economy is looking increasingly stagflationary, whilst the main event state-side will of course be Wednesday’s Fed policy announcement. The only data of note out of the Eurozone will be German ZEW figures for May on Tuesday. Against the current macro backdrop of risk-off flows and an increasingly hawkish Fed, a test of earlier annual lows in the mid-1.0300s seems very much on the table.
- GBP/USD witnessed selling for the fourth straight day and dropped back closer to the YTD low.
- Disappointing UK macro data fueled recession fears and weighed heavily on the British pound.
- Aggressive Fed rate hike bets and the risk-off mood benefitted the USD and added to the selling.
The GBP/USD pair added to its heavy intraday losses and weakened further below the 1.2200 round-figure mark heading into the North American session. The pair was last seen trading around the 1.2160-1.2165 region, just a few pips above the YTD low touched on May 12.
The monthly UK GDP report released earlier this month showed that the economy contracted by 0.3% in April, marking the first
back-to-back decline since the start of the coronavirus pandemic. Adding to this, the UK Industrial and Manufacturing Production slumped for the second straight month. The lacklustre macro data fuelled fears that Britain could be headed for a recession and clouded the outlook for the Bank of England. This, along with Brexit woes and UK political jitters, took its toll on the British pound.
In the latest Brexit-related developments, the UK government will publish plans to scrap parts of the post-Brexit deal concerning the Northern Ireland Protocol. This would set the stage for a further deterioration in post-Brexit UK-EU relations and possibly spark a trade war in the middle of the cost-of-living crisis. Apart from this, the uncertainty over Boris Johnson’s future as the UK Prime Minister further undermined sterling and dragged the GBP/USD pair lower for the fourth straight day amid broad-based US dollar strength.
The red-hot US consumer inflation data released on Friday fueled speculations that the Fed would tighten its policy at a faster pace and opened the door for a jumbo 75 bps rate hike. This, in turn, pushed the yield on the 2-year Treasury note - seen as a proxy for the Fed's policy rate - to 3% for the first time since 2008. Adding to this, the yield on the benchmark 10-year US government bond shot to the highest level since 2018 and underpinned the buck.
Meanwhile, the prospects for a more aggressive move by major central banks, along with the worsening global economic outlook, continued weighing heavily on investors' sentiment. This was evident from an extended selloff in the equity markets, which provided an additional boost to the greenback's relative safe-haven status. The combination of factors exerted downward pressure on the GBP/USD pair and took along short-term trading stops near the 1.2200 mark.
Some follow-through selling below the YTD low, around the 1.2155 region would be seen as a fresh trigger for bearish traders and set the stage for additional losses. That said, traders might refrain from placing aggressive bets ahead of the key central bank event risks later this week. The Fed is due to announce its policy decision on Wednesday and the BoE meeting is scheduled on Thursday. The outcome should provide a fresh directional impetus to the GBP/USD pair.
Technical levels to watch
Cable remains soft below 1.22 and is set to test the May 13 low near 1.2155. Economists at BBH believe that the GBP/USD pair could nosedive as low as 1.1410.
Brexit remains in the headlines
“GBP/USD is nearing a test of the May 13 low near 1.2155. After that is the May 2020 low near 1.2075 but we continue to target the March 2020 low near 1.1410.”
“A potential trade war with its largest trading partner as the economy is already contracting is yet another reason we remain negative on sterling.”
Slovakian central bank head and European Central Bank (ECB) Governing Council member Peter Kazimir on Monday said that he sees a clear need for a 50 bps rate hike in September, reported Bloomberg. Kazimir continued that he wants to see the ECB get interest rates to positive territory this Autumn and that he sees weak growth continuing for several weeks. Kazimir noted that gradual ECB tightening would begin in July with a 25 bps rate hike, which is what ECB President Christine Lagarde signalled at last week's policy announcement.
55 of 56 economists that took part in a recently conducted Reuters poll see the Bank of England (BOE) hiking its policy rate by 25 basis points to 1.25% on June 16%.
"Roughly two-thirds, 36 of 56 economists, see the next 25 basis point hike to 1.50% in the third quarter, which would most likely come at the August meeting with the next round of quarterly BoE forecasts," Reuters further reported. "Around one-third see rates at 1.75% by-end September, suggesting back-to-back 25 basis point rises."
Market reaction
The British pound stays on the back foot following this headline. As of writing, the GBP/USD pair was losing 0.8% on a daily basis at 1.2215.
FX option expiries for June 13 NY cut at 10:00 Eastern Time, via DTCC, can be found below.
- EUR/USD: EUR amounts
- 1.0475 237m
- 1.0550 250m
- 1.0575 359m
- GBP/USD: GBP amounts
- 1.2500 224m
- USD/CAD: USD amounts
- 1.2850 200m
- AUD/USD: AUD amounts
- 0.7150 462m
- EUR/JPY: EUR amounts
- 140.00 632m
- 143.00 1.69b
- NZD/USD witnessed some follow-through selling on Monday and dropped to a near one-month low.
- Aggressive Fed rate hike bets, the risk-off mood benefitted the safe-haven USD and exerted pressure.
- Acceptance below the 0.6300-0.6290 area would make the pair vulnerable to challenging the YTD low.
The NZD/USD pair prolonged its recent sharp pullback from the 0.6575 area, or a near two-month high touched earlier this month and opened with a bearish gap on Monday. The bearish pressure remained unabated through the first half of the European session and dragged spot prices below the 0.6300 mark, or the lowest level since May 19.
Stronger US consumer inflation figures released on Friday reaffirmed market bets that the Fed would tighten its monetary policy at a faster pace. This led to an extended selloff in the US bond markets, which pushed the yield on the 2-year Treasury note - seen as a proxy for the Fed's policy rate - to 3% for the first time since 2008. Adding to this, the yield on the benchmark 10-year US government bond shot to the highest level since 2018 and provided a strong boost to the US dollar, which, in turn, exerted downward pressure on the NZD/USD pair.
Apart from the relentless rise in the US Treasury bond yields, the prevalent risk-off mood was seen as another factor that benefitted the greenback's relative safe-haven status. The market sentiment remains fragile amid concerns that a more aggressive policy tightening by major central banks to curb soaring inflation would pose challenges to global economic growth. This, in turn, took its toll on the risk sentiment, which was evident from a sea of red across the equity markets and further contributed to driving flows away from the risk-sensitive kiwi.
With the latest leg down, the NZD/USD pair now seems to have found acceptance below the 0.6300 mark and remains vulnerable to depreciating further. Hence, a subsequent fall towards retesting the YTD low, around the 0.6215 region touched in May, now looks like a distinct possibility. Traders, however, might refrain from placing aggressive bearish bets ahead of the outcome of the FOMC meeting. The Fed is scheduled to announce its decision on Wednesday, which will influence the near-term USD price dynamics and provide a fresh directional impetus to the NZD/USD pair.
Technical levels to watch
- USD/CHF scaled higher for the seventh straight day and shot to a nearly four-week high on Monday.
- Aggressive Fed rate hike bets, elevated US bond yields continued acting as a tailwind for the USD.
- The risk-off mood could underpin the safe-haven CHF and cap ahead of the FOMC/SNB meetings.
The USD/CHF pair prolonged its recent strong move up witnessed over the past one-and-half-week or so and gained traction for the seventh successive day on Monday. The momentum lifted spot prices to a near four-week high, around the 0.9920-0.9925 region during the first half of the European session.
Stronger US consumer inflation figures released on Friday lifted bets that the Federal Reserve will get more aggressive to cool price pressures. In fact, the markets are now pricing in about 215 bps of cumulative hikes in 2022 and Fed funds futures reflect rising odds of a 75 bps rate hike by July. This, in turn, acted as a tailwind for the US dollar, which, in turn, continued lending support to the USD/CHF pair.
The prospects for a faster policy tightening by the Fed lifted the 2-year US Treasury note - seen as a proxy for the Fed's policy rate - to 3% for the first time since 2008. Investors also remain concerned that global supply chain disruptions caused by the Russia-Ukraine war and the COVID-19 outbreak in China would push consumer prices even higher. This, in turn, lifted the yield on the benchmark 10-year US government bond to its highest since May 9 and was seen as another factor that extended support to the greenback.
That said, the prevalent risk-off environment could benefit the safe-haven Swiss franc and keep a lid on any further gains for the USD/CHF pair, at least for now. The market sentiment remains fragile amid doubts that major central banks could hike interest rates to curb soaring inflation without affecting global economic growth. Investors also seemed reluctant to place aggressive bets ahead of the key central bank event risks.
The highly-anticipated outcome of a two-day FOMC meeting is scheduled to be announced on Wednesday. This will be followed by the Swiss National Bank meeting on Thursday, which should help determine the next leg of a directional move for the USD/CHF pair. In the meantime, the US bond yields will influence the USD price dynamics, which, along with the broader market risk sentiment, might provide some impetus to the major.
Technical levels to watch
- Gold Price slips from five-week highs as Fed set to hike rate aggressively.
- The US dollar, yields soar on the Fed expectations and risk-off flows.
- XAUUSD remains exposed to more downside ahead of the Fed decision.
Gold Price is correcting sharply from five-week peaks of $1,879, reversing most of Friday’s strong rally. The inverse correlation between the US Treasury yields and the bright metal is back in play. The benchmark 10-year yields are trading at their highest level since 2018 on the bets that the Fed will go for a 75 bps rate hike at least once in its next three meetings to curb rampant inflation. The zero-yielding gold is feeling the heat of soaring yields, which have driven the US dollar higher alongside. Aggressive Fed tightening expectations have overshadowed heightening recession fears while influencing XAUUSD price. Markets now eagerly await Wednesday’s Fed decision for the rate hike guidance and its impact on the related assets.
Also read: Gold Price Forecast: 50 DMA could be a tough nut to crack, as focus shifts to Fed
Gold Price: Key levels to watch
The Technical Confluence Detector shows that Gold Price challenged the fierce support at $1,853, which is the convergence of the SMA10 one-day and SMA200 four-hour.
The next significant downside target is pegged at $1,845, where the Fibonacci 61.8% one-day and one-week merge.
Further south, the SMA200 one-day at $1,842 will test the bullish commitments once again, opening floors for a retest of the pivot point one-week S1 and pivot point one-day S1 intersection at $1,839.
On the flip side, bulls test the confluence of the Fibonacci 38.21% one-day and one-month at $1,858, above which a fresh advance towards $1,863 cannot be ruled out.
At that level, the Fibonacci 61.8% one-month, Fibonacci 23.6% one-day and one-week coincide.
Friday’s high of $1,876 will be put to test should bulls resume the recent bullish momentum.
Here is how it looks on the tool
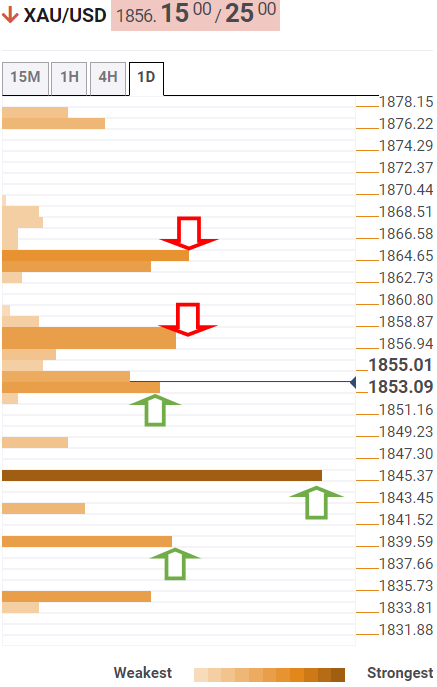
About Technical Confluences Detector
The TCD (Technical Confluences Detector) is a tool to locate and point out those price levels where there is a congestion of indicators, moving averages, Fibonacci levels, Pivot Points, etc. If you are a short-term trader, you will find entry points for counter-trend strategies and hunt a few points at a time. If you are a medium-to-long-term trader, this tool will allow you to know in advance the price levels where a medium-to-long-term trend may stop and rest, where to unwind positions, or where to increase your position size.
A hawkish Federal Reserve on Wednesday will bode ill for the battered yen and raises the probability of an imminent round of FX intervention from Japan. Nonetheless, economists at ING believe that the USD/JPY pair has room to run above the 135 level.
FX intervention appears to be the only solution
“With no signs that the BoJ is deviating from its ultra-loose policy but with a growing desire to stabilise the yen, FX intervention really does appear to be the only solution, unless Japanese authorities are betting on market dynamics (i.e. a correction in US yields) to drive USD/JPY back lower. The prospect of a hawkish Fed on Wednesday does not bode well for such a bet.”
“Should Japan go ahead with FX intervention, expect it to be deployed around the European or US open when markets are more liquid.”
“We believe markets are starting to price in intervention and that might limit USD/JPY for now, although few tangible indications that such a tool is about to be deployed may trigger USD/JPY appreciation well beyond the 135.00 mark.”
- GBP/USD witnessed heavy selling for the fourth straight day and dropped to a fresh multi-week low.
- The UK political jitters, Brexit woes and disappointing UK macro data weighed on the British pound.
- Aggressive Fed rate hike bets, the risk-off mood underpinned the USD and added to the selling bias.
The GBP/USD pair extended last week's rejection slide from the 1.2600 neighbourhood and witnessed heavy selling for the fourth successive day on Monday. The downward trajectory extended through the first half of the European session and dragged spot prices to the 1.2200 neighbourhood, or a fresh four-week low in the last hour.
The British pound was undermined by the uncertainty over Boris Johnson’s future as the UK Prime Minister and Brexit woes. In fact, the UK Foreign Secretary is up for presenting a bill that would effectively override parts of a Brexit deal related to the Northern Ireland Protocol. The European Commission had pledged to respond with all measures at its disposal if Britain moves ahead with a plan to rewrite the Brexit deal. Hence, the legislation could spark a trade war in the middle of the cost-of-living crisis, which could make it difficult for the Bank of England to hike interest rates any further.
The market fears were further fueled by disappointing UK macro data released earlier this Monday. The official figures showed that the economy unexpectedly contracted by 0.3% in April, marking the first
back-to-back decline since the start of the coronavirus pandemic. Adding to this, the UK Industrial and Manufacturing Production also recorded an unexpected fall in April. The data revealed the impact of surging prices on household spending and business activity, fueling recession fears. Apart from this, broad-based US dollar strength was seen as another factor that contributed to the GBP/USD pair's ongoing decline.
The latest US consumer inflation figures released on Friday reaffirmed bets that the Federal Reserve will tighten its monetary policy at a faster pace to cool price pressures. The prospects for a more aggressive Fed remained supportive of elevated US Treasury bond yields. This, along with the worsening global economic outlook and the prevalent risk-off mood, provided an additional boost to the safe-haven greenback. The fundamental backdrop supports prospects for a further near-term depreciating move for the GBP/USD pair, though traders might refrain from fresh bearish bets ahead of this week's FOMC/BOE policy meetings.
Technical levels to watch
This week, the Bank of England meeting is the big highlight for the GBP market. Economists at ING expect more weakness in the pound after the announcement, which could drag the GBP/USD pair down to the 1.20/21 area.
EUR/GBP may test 0.86
“We expect to see a marked divergence within the MPC at this meeting, as we forecast a three-way vote split: some members voting for no change, some for a 50 bps hike, and the overall majority for a 25 bps move.”
“With markets currently pricing in seven 25 bps rate hikes by year-end, we think the risk of a dovish repricing in the GBP curve after this week’s meeting is high, and we expect more weakness in the pound after the announcement.”
“Unless global sentiment rebounds, a move to the 1.20-1.21 area in cable appears to be on the cards, while EUR/GBP may test 0.86.”
- USD/JPY corrects further towards 134.00 on Japanese verbal intervention.
- The US dollar, Treasury yields showcase unrelenting strength on recession fears.
- All eyes shift towards the Fed and BOJ for a fresh trading impulse in the pair.
USD/JPY is back in the red below mid-134.00s, having shaved off all of its gains seen so far this Monday.
Earlier on, the pair extended the ongoing uptrend and clocked fresh 20-year highs at 135.16, having faced rejection at the January 2002 peak of 135.16.
The renewed upside in the spot was triggered by spiking US Treasury yields across the curve, which drove the US dollar higher alongside. The yields, as well as, the dollar soared on intensifying fears over raging inflation and its impact on the US economy should the Fed opt for rapid and bigger rate rises to contain higher prices.
Further, widening monetary policy divergence between the Fed and the Bank of Japan (BOJ) also helped the yen smashing. The BOJ maintained its ultra-dovish rhetoric, backing its loose monetary policy for longer to support the economy.
Although the jawboning or the so-called verbal intervention by the Japanese authorities did save the day for JPY bulls. Japan’s Chief Cabinet Secretary Matsuno said that they are “ready to take appropriate actions on FX market movements if necessary.” Meanwhile, BOJ Chief Haruhiko Kuroda said that the recent decline in the yen is undesirable and that it is not good for the economy.
USD/JPY is extending its corrective slide following the verbal intervention, now down a big figure from over two-decade highs. At the time of writing, the pair is trading at 134.22, down 0.15% on the day.
To help rescue the yen, the BOJ also offered to buy JPY 500 billion worth of Japanese Government Bonds (JGB) on June 14. All eyes now move towards the Fed and the BOJ policy decisions this week, which underscore the policy divergence between the two countries and determine USD/jPY’s next journey.
USD/JPY: Technical levels to consider
GBP/USD has suffered heavy losses at the beginning of the week. As FXStreet’s Eren Sengezer notes, 1.22 is under threat.
A recovery in the current market environment seems unlikely
“The risk-averse market environment makes it difficult for the pair to stage a rebound.”
“If the pair were to stage a technical correction, 1.2270 (static level, former support) aligns as first resistance ahead of 1.23 (psychological level).”
“With a daily close above 1.23, sellers could book their profits and move to the sidelines, allowing the pair to extend its recovery toward 1.2350 (static level).”
“On the downside, 1.220 (psychological level) could be seen as the next bearish target ahead of 1.2155 (two-year low set on May 13).”
- AUD/USD witnessed heavy selling for the fourth straight day and dropped to a fresh multi-week low.
- Aggressive Fed rate hike bets, the risk-off mood underpinned the USD and contributed to the decline.
- Acceptance below the 0.7000 mark, or the 61.8% Fibo. level supports prospects for additional losses.
The AUD/USD pair extended its recent sharp pullback from the 0.7280-0.7285 region, or the monthly peak and witnessed selling for the fourth successive day on Monday. This also marked the sixth day of a negative move in the previous seven and dragged spot prices to over a three-week low, just below the 0.7000 psychological mark during the early part of the European session.
The US dollar continued drawing support from firming expectations that the Fed would need to tighten its policy at a faster pace to curb soaring inflation. Apart from this, the prevalent risk-off mood was seen as another factor that underpinned the safe-haven greenback, which further weighed on the risk-sensitive aussie and contributed to the AUD/USD pair's downfall.
From a technical perspective, a break below the 0.7000 handle, which coincided with the 61.8% Fibonacci retracement level of the recent recovery from the YTD low, could be seen as a fresh trigger for bears. Moreover, technical indicators on the daily chart have been drifting lower in the negative territory and add credence to the near-term bearish outlook for the AUD/USD pair.
Hence, a subsequent slide towards testing the next relevant support, near the 0.6950-0.6945 region, now looks like a distinct possibility. Some follow-through selling has the potential to drag the AUD/USD pair towards intermediate support near the 0.6915-0.6910 area en-route the 0.6855-0.6850 zone and the YTD low, around the 0.6830-0.6825 region touched on May 12.
On the flip side, the 0.7030 zone now seems to act as an immediate resistance ahead of the 50% Fibo. level, around mid-0.7000s. Sustained strength beyond could trigger a short-covering bounce towards the 0.7100 round figure. The latter marks the 38.2% Fibo. level, which if cleared decisively will negate any near-term bearish bias and pave the way for additional gains.
AUD/USD 4-hour chart
-637907047767457807.png)
Key levels to watch
EUR/USD has started the new week on the back foot. As FXStreet’s Eren Sengezer notes, sellers are set to remain in control as long as 1.0520 resistance holds.
Four-hour close below 1.0460 could open the door for further losses
“In case the pair manages to stage a technical correction, it could find it difficult to reclaim 1.0520, where the Fibonacci 61.8% retracement of the latest uptrend is located. As long as this level stays intact, sellers are likely to stay in control.”
“On the downside, 1.0460 (static level) aligns as first support. With a four-hour close below that level, additional losses toward 1.04 (psychological level) and 1.0370 (static level) could be witnessed.”
“In case buyers lift the euro back above 1.0520, 1.0570 (Fibonacci 50% retracement) and 1.06 (psychological level, 200-period SMA) could be seen as next resistances.”
- EUR/USD witnessed selling for the third straight day and dropped to over a three-week low.
- Aggressive Fed rate hike bets, the risk-off mood underpinned the USD and exerted pressure.
- The lack of signal for a 50 bps ECB rate hike in September weighed on the common currency.
The EUR/USD pair extended last week's post-ECB bearish breakdown momentum below the 1.0650 support zone and remained under some selling pressure for the third straight day on Monday. The downward trajectory dragged spot prices below the 1.0500 psychological mark, to a three-and-half-week low during the early European session and was sponsored by broad-based US dollar strength.
Stronger US consumer inflation figures released on Friday lifted bets that the Federal Reserve will get more aggressive to cool price pressures. In fact, the markets are now pricing in about 215 bps of cumulative hikes in 2022 and Fed funds futures reflect rising odds of a 75 bps rate hike by July. This, in turn, pushed the yield on the benchmark 10-year US government bond to its highest since May 9. Adding to this, the 2-year Treasury note - seen as a proxy for the Fed's policy rate - rose to 3% for the first time since 2008 and underpinned the greenback.
The prospects for a more aggressive move by major central banks to curb inflation, along with a fresh COVID-19 warning from China, added to worries about the worsening global economic outlook. China on Saturday said that its capital Beijing is experiencing an "explosive" Covid-19 outbreak. This comes on the back of a mini-lockdown in Shanghai - China’s biggest city and a global financial hub - and took its toll on the global risk sentiment. The anti-risk flow was evident from a sea of red across the equity markets, which further benefitted the safe-haven buck.
On the other hand, the shared currency was further pressured by the European Central Bank's conditional outlook for a jumbo rate hike in September. In fact, the ECB did not specify the size of the rate hike and said that it will be dependent on the inflation forecasts at that time. Apart from this, the downfall could further be attributed to some technical selling below the 1.0500 mark. Acceptance below the said handle might have set the stage for additional losses amid the absence of relevant market-moving economic releases, either from the Eurozone or the US.
Technical levels to watch
The US dollar’s bullish momentum has been reinforced by the release of the much stronger than expected US CPI report on Friday. As economists at MUFG Bank note, USD strength is reinforced by expectations for an even more active Federal Reserve.
Another upside CPI surprise increases pressure on Fed
“The release of the much stronger US CPI report for May will increase pressure on the Fed to deliver a hawkish policy update this week. The report revealed that inflation pressures continued to remain uncomfortably high.”
“We expect the Fed to respond in the week ahead by sending a stronger signal that it will raise rates into restrictive territory to dampen upside inflation risks and slow the economy.”
“The Fed’s updated dot plots are likely to be raised significantly from in March when the median projection for Fed funds rate at the end of this year was set at 1.9% and for the end of next year at 2.8%.”
“We do not expect the Fed’s updated projections to go quite as far as current market pricing but will clearly be in a much more hawkish direction.”
The yen has continued to weaken with USD/JPY breaking above the high from back in January 2002 at 135.15. Economists at MUFG Bank believe that the pair could climb as high as 140.
Intervention risk rising as USD/JPY climbs above 2002 highs
“The break above 2002 highs at 135.15 provides a further bullish signal for the USD/JPY in the near-term and could trigger an acceleration of yen weakness by encouraging speculation of a return to the highs during the Asian Financial Crisis when it last climbed above the 140.00-level.”
“Overall the fundamental developments continue to favour further yen weakness it the near-term but market participants will be more wary of the risk of intervention and/or a hawkish shift in BoJ policy in the week ahead.”
West Texas Intermediate (WTI) is seen trading at $105 and $95 in 2022 and 2023, respectively. Still, risks are skewed towards the upside, strategists at the Bank of Montreal note.
Risks still skewed to the upside
“We remain of the view that the oil market will remain tight in the foreseeable future and, in turn, crude oil prices will remain elevated.”
“We have revised up our annual forecasts for benchmark WTI crude to $105/bbl in 2022 and $95 in 2023 (from $100 and $85). Nonetheless, with global supply appearing to be under greater threat than demand at the moment, we think that pricing risks may be still skewed towards the upside.”
Economists at Credit Agricole CIB Research maintain a bullish bias regarding the loonie and expect the USD/CAD pair to edge lower towards the 1.20 level by end-2022.
Prospects of high energy prices, a solid backbone for additional CAD gains
“The CAD has been supported by the combination of an extended rally in oil prices, as they were hardly impressed by the OPEC+ promise to ramp up production in the coming months; and a more hawkish BoC in June as it stands ready to act more forcefully after back-to-back 50bp rate hikes. At this stage, the second driver may not offer much more of a boost to the CAD in the near-term, unless the BoC is to step up its tightening with the delivery of a larger 75 bps rise in July."
"Ultimately, prospects of high energy prices for longer could be a more solid backbone for additional CAD gains further down the line, albeit coming more as a slow-burner support than an immediate boost.”
“Our forecasts continue to look for USD/CAD to slowly drift towards 1.20 for the rest of the year."
- USD/CAD gained some follow-through traction for the fourth successive day on Monday.
- Retreating oil prices undermined the loonie and remained supportive amid a stronger USD.
- Aggressive Fed rate hike bets, the risk-off mood boosted demand for the safe-haven buck.
The USD/CAD pair built on last week's strong recovery move from the 1.2520-1.2515 region, or its lowest level since April 21 and gained some follow-through traction for the fourth straight day on Monday. The momentum pushed spot prices to a two-and-half-week high during the early European session and was sponsored by a combination of factors.
A fresh COVID-19 warning from China, along with the worsening global economic outlook, dashed hopes for a quick recovery in fuel demand. This, in turn, dragged crude oil prices further away from a three-month peak touched last week, which undermined the commodity-linked loonie. Apart from this, sustained US dollar buying offered support to the USD/CAD pair.
The latest US consumer inflation figures released on Friday reaffirmed bets that the Federal Reserve will get more aggressive to cool price pressures. In fact, the markets are now pricing in about 215 bps of cumulative hikes in 2022 and Fed funds futures reflect rising odds of a 75 bps rate hike by July, which pushed the US Treasury bond yields higher.
In fact, the yield on the benchmark 10-year US government bond rose to its highest since May 9 and the 2-year Treasury note - seen as a proxy for the Fed's policy rate - rose to 3% for the first time since 2008. Apart from this, the prevalent risk-off mood further acted as a tailwind for the safe-haven USD and remained supportive of the bid tone surrounding the USD/CAD pair.
The strong move up could further be attributed to some technical buying on sustained strength above the 1.2800 round-figure mark. It, however, remains to be seen if bulls are able to capitalize on the momentum or opt to lighten their bets ahead of the key central bank even risk - the outcome of the highly-anticipated FOMC policy meeting on Wednesday.
Technical levels to watch
Here is what you need to know on Monday, June 13:
Markets remain risk-averse at the beginning of the week and the greenback capitalizes on safe-haven flows. The US Dollar Index rises for the fourth straight day and closes in on the multi-year high it set on May 13. The benchmark 10-year US Treasury bond yield stays within a touching distance of 3.2% and US stock index futures are down between 1.5% and 2.5%. The economic docket will not feature any high-impact data releases and the risk perception is likely to continue to drive the market action.
On Friday, the data from the US showed that the Consumer Price Index (CPI) jumped to a fresh multi-decade high of 8.6% on a yearly basis in May. This print surpassed the market expectation of 8.3% and caused investors to seek refuge. The S&P 500 Index lost nearly 3% and closed the previous week at 3,900. Over the weekend, the Financial Times reported that 70% of polled experts see the US economy tipping into recession next year.
US CPI reverses to new four-decade high in May threatening GDP.
After spending the Asian session in a relatively tight channel, EUR/USD started to edge lower amid broad-based dollar strength in the European morning. The pair was last seen losing 0.3% on a daily basşs at 1.0485.
GBP/USD slumped to its lowest level since May 16 below 1.2250 on Monday. The data published by the UK's Office for National Statistics revealed that the UK economy contracted by 0.3% on a monthly basis in April, compared to the market expectation for an expansion of 0.2%. Other data from the UK showed that the Manufacturing Production and Industrial Production declined by shrank by 1% and 0.6%, respectively, in the same period.
USD/JPY surged to its highest level in more than 20 years above 135.00 during the Asian trading hours on Monday. Japanese Chief Cabinet Secretary Matsuno said that they were ready to take appropriate actions on exchange movements if necessary and triggered a downward correction in the pair. Similarly, Bank of Japan Governor Haruhiko Kuroda acknowledged that the recent sharp drops in the yen's exchange were undesirable and not good for the economy. USD/JPY was last seen posting modest daily gains at 134.75.
Gold rose sharply on inflation fears late Friday and closed the week at $1,870. With the benchmark 10-year US T-bond yield staying in positive territory, XAU/USD is retreating toward $1,860 on Monday.
Bitcoin extended its slide over the weekend and ended up losing more than 11% last week. BTC/USD stays on the back foot and was last seen testing $25,000, losing nearly 5% on the day. Ethereum registered losses for the 10th straight week and touched its weakest level since February near $1,300 on Monday.
- EUR/GBP jumps from 200-HMA as UK data deteriorates in April.
- Upbeat data and firmer RSI favor bullish bias towards refreshing the monthly top.
- Weekly horizontal support adds to the downside filters.
EUR/GBP takes the bids to refresh intraday high around 0.8565 during early Monday morning in Europe. The cross-currency pair’s latest gains could be linked to the downbeat UK economics for April.
Read: UK Manufacturing Production falls 1% MoM in April vs. 0.2% expected
The pessimistic data joined the pair’s ability to stay beyond the 200-HMA, as well as firmer RSI (14) to cross the one-week-old resistance line, now support around 0.8555.
As a result, EUR/GBP bulls are en route to the monthly high surrounding 0.8590, a break of which can recall the 0.8600 threshold on the chart.
It’s worth noting that the pair’s run-up beyond the 0.8600 psychological mark will be challenged by May’s peak of 0.8618.
On the contrary, pullback moves remain elusive until staying beyond the 200-HMA level of 0.8535.
Following that, a weekly horizontal support area near 0.8525-20 may probe the EUR/GBP bears before directing them to the 0.8500 round figure.
In a case where EUR/GBP remains bearish past 0.8500, the odds favoring a southward trajectory towards the mid-May low near 0.8390 can’t be ruled out.
EUR/GBP: Hourly chart
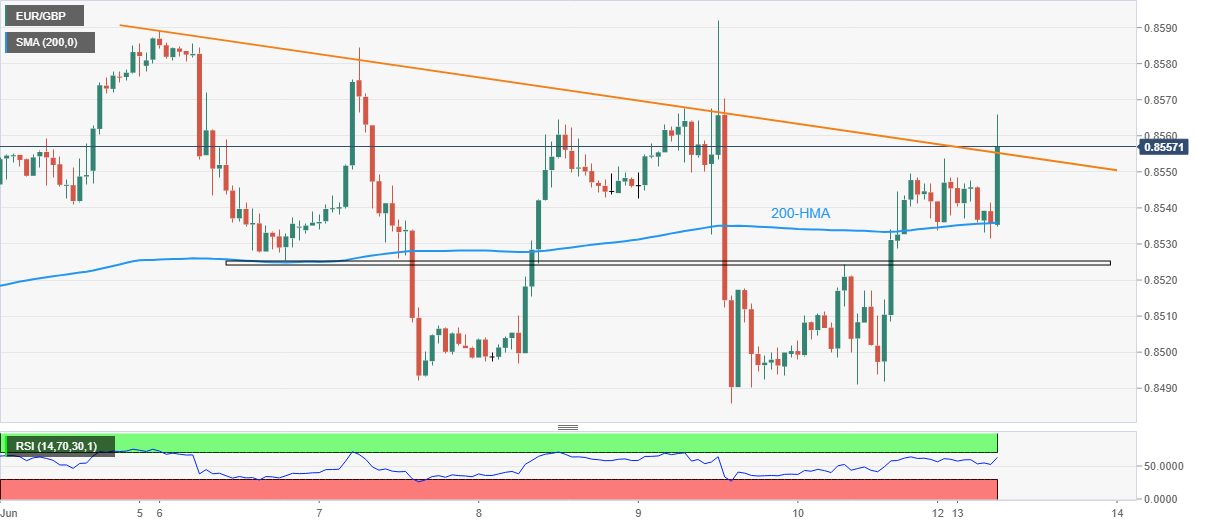
Trend: Further upside expected
In the opinion of economists at Commerzbank, the tight labour market in Canada supports a restrictive Bank of Canada (BoC) course. Subsequently, only markedly strong future price and economic data would be able to lift the loonie.
BoC to maintain its tougher approach for now
“The labour market in Canada is getting increasingly tight. A surprisingly large number of new jobs was created in May, the unemployment rate eased to 5.1%. That suggests that the BoC will maintain its tougher approach for now.”
“The fact that the situation on the labour market becomes tighter unabated points towards a further 50 bps step in July. After that, the BoC might operate slightly more slowly but is likely to make this dependent on the data situation. This is why the market still sees a high likelihood of a 50 bps in September following the May labour market report.”
“Future price and economic data would have to surprise markedly positively to provide new, significant upside potential for CAD in view of already high expectations.”
Gold set a new five-week top at $1,879 at the start of a new week on Monday. Bulls, however, have failed to hold at higher levels. The yellow metal needs to erode the 50 Daily Moving Average (DMA) to enjoy further gains, FXStreet’s Dhwani Mehta reports.
50 DMA could be a tough nut to crack
“A sustained move below the $1,860 demand area once again will call for a test of the $1,850 psychological level. The upward-pointing 21 DMA at $1,848 will be next on sellers’ radars.”
“XAU buyers need to find a strong foothold above the 50 DMA barrier to unleash the further upside towards the mildly bullish 100 DMA at $1,890. The next relevant upside target is pegged at $1,900, the round level.”
See – Gold Price Analysis: XAUUSD set to dive below the $1,800 level – TDS
Former Richmond Fed President Jeffrey Lacker said in an MNI interview on Monday, “my sense is they have to go to 5% before they can really think they're at neutral.”
Additional quotes
"Even at the aggressive current pace of 50 bps per meeting, "they're not going to hit that until the middle of next year."
"Fed officials have said they would like to push official rates, currently in a 0.75% to 1% range, to more neutral levels "expeditiously."
"But policymakers have defined neutral in nominal terms on an assumption that the inflation rate eventually returns to the Fed's 2% target. That's a big assumption."
"Three percent is fine as a neutral rate if inflation already is 2%. But if not, then 3% isn't neutral. What is neutral depends on what the current inflation rate is, what the going rate is, what it's expected to be in the next couple of quarters."
"By the September meeting the data was very clear that they needed to move. But they were hamstrung by their forward guidance and by this commitment to taper asset purchases. That's what held them up to March."
"I think they're six months behind the curve. They're making up for it with speed and haste. But it's not an immediate offset because you can't take back the fact that expectations have seeped into markets, wage rates accelerated over the winter and firms have become accustomed to pricing in cost increases, passing them on as price increases."
"I'm somewhat pessimistic about their ability to bring inflation down without causing a recession. It strikes me as highly unlikely that they're going to be able to do that."
"The signs of inflation coming off its peak are extremely tentative, nothing to take to the bank. It seems very unlikely that they're going to get inflation down."
In the view of economists at Commerzbank, Norges Bank might become even more restrictive. Subsequently, the EUR/NOK pair could fall below the 10 level.
Real interest rates in Norway to be in negative territory more quickly than in the eurozone
“With the publication of the Norwegian inflation data for May, the likelihood of Norges Bank signalling an even tighter rate path than previously at its meeting on 23rd June has risen slightly. A 50 bps rate hike cannot be excluded completely either.”
“Yes, the ECB will also hike its key rate. However, Norges Bank too started this process a long time ago and, in my view, this is going to be accelerated further. The real interest rates in Norway are therefore likely to leave negative territory more quickly than in the eurozone. That suggests that EUR/NOK will be able to fall to 10 and also below.”
Gold Price eases from five-week highs of $1,879. Economists at TD Securities expect the yellow metal to give up all these gains and trend lower toward below $1,800, as policy rates rise sharply.
High inflation to drive gold down toward $1,830-24 in the short-term
“High inflation is likely to drive prices down toward $1,830-24 trading range in the short-term.”
“Longer-term, the yellow metal should trend materially below $1,800.”
“We bet that risks point to gold downside on the horizon, given energy and other price pressures in the economy.”
“While it is quite possible the Fed flakes and pulls back hikes, sacrificing price stability at the alter of full employment, it is too early to say they will introduce policy ambiguity anytime soon. For that reason, our projected correction is not a rout and this is why we have a gold rebounding thereafter next year.”
On the GDP contraction, UK Finance Minister Rishi Sunak said that countries around the world are seeing slowing growth and the that the UK is not immune.
developing story ...
- GBP/JPY takes offers to refresh one-week low following the data release.
- UK’s monthly GDP, Manufacturing Production and Industrial Production dropped below market forecast and prior in April.
- Retreat in the US bond coupons, pessimism surrounding Brexit, UK politics exert downside pressure.
- Statements from UK’s Truss can offer intraday directions, BOE, BOJ appear as the key.
GBP/JPY remains pressured for the third consecutive day, refreshing one-week low, as bears attack 165.00 level heading into Monday’s London open. The cross-currency pair’s latest weakness could be linked to the downbeat UK data, as well as a halt in the US Treasury yields’ rally.
That said, the UK Gross Domestic Product for April dropped to -0.3% MoM versus 0.2% expected and -0.1% prior. The Manufacturing Production and Industrial Production also weakened during the stated month while the trade deficit eased.
Read: UK Manufacturing Production falls 1% MoM in April vs. 0.2% expected
Fears of Britain’s economic hardships grow momentum after the latest raft of the UK data, suggesting a tough challenge for the Bank of England (BOE) as it tries to regain the market’s confidence.
Other than the data, fears of the harsh Brexit and the European Union’s punitive actions in case of the UK’s Northern Ireland Protocol (NIP) repeal also weigh on the GBP/JPY prices.
Additionally, a pause in the US Treasury yields and the Bank of Japan’s (BOJ) intervention also exert downside pressure on the quote. That said, the US 10-year Treasury yields retreat from the monthly high surrounding 3.20%, around 3.17% by the press time, as traders await the Fed’s verdict.
Moving on, GBP/JPY traders need to pay attention to a speech from UK’s Foreign Minister Liz Truss in the House of Commons as the policymaker will unveil details of how Britain will alter NIP. The same could exert additional downside pressure on the GBP/JPY prices.
Technical analysis
Unless providing a daily closing beyond April’s high near 168.45, GBP/JPY remains directed towards the highs marked in March and late April, respectively around 164.65 and 164.25.
US inflation figures beat estimates on all measures. Economists at Rabobank expect the USD/JPY pair to advance nicely towards 135 in the near-term before turning back lower to the 132/30 region later in 2022.
USD/JPY is essentially tied to the outlook for US yields
“The strength of the US May inflation report increases the potential for further gains in USD/JPY on a one to three-month view to 135. This assumes that the BoJ maintains its commitment to its current easy policy settings in its June meeting, as seems very likely.”
“We remain sceptical on the likelihood of actual FX intervention since this would directly oppose the direction of BoJ policy. It would also be in conflict with the agreement that Japan has maintained for years as part of the G7 to allow markets to set exchange rates.”
“We expect that lower US yields should allow USD/JPY to adjust back to the 132/130 region later in the year.”
- GBP/USD has pared its recovery gains after the release of the poor UK data.
- The majority of the economic data have delivered poor performance.
- This week, investors’ focus will remain on monetary policies from the Fed and the BOE.
The GBP/USD pair has pared its modest recovery and has slipped below intraday’s low at 1.2257 on weak UK data. In the early Tokyo session, the asset displayed some exhaustion in the downtrend, however, the greenback bulls have got regained their dominance as the UK’S National Statistics has reported vulnerable UK data.
The Gross Domestic Product (GDP) has slipped to -0.3% against the expectation of 0.2%. Also, the annual Manufacturing Production figure has tumbled to 0.5 vs. 1.8% expected. However, the Industrial Production data has jumped to 0.7% from the estimates of 0.5% on annual basis.
The pound bulls have remained in the grip of bears on solid performance by the US dollar index (DXY). The DXY is oscillating around 104.50 after a juggernaut rally as higher US Inflation has bolstered the odds of a 75 basis point (bps) interest rate hike by the Federal Reserve (Fed) on Monday. The US agency has reported the annual US Consumer Price Index (CPI) figure at 8.6%, much higher than the estimates and the prior print of 8.3%.
The US labor agency also reported upbeat Nonfarm Payrolls (NFP), which has provided more liberty to the Fed to tighten their policy.
Also, the Bank of England (BOE) will announce its monetary policy on Thursday. The BOE could elevate its interest rates further amid soaring price pressures in the UK economy. Advancing oil and commodity prices have pushed the inflation figure to a 40-year high of 9%. Considering the pace of inflation in the UK economy, it would be fit to state that the price pressures could soar to a two-digit figure.
Gold set a new five-week top at $1,879 on Monday, then retreats. All eyes remain on the Federal Reserve decision due later this week on Wednesday. The yellow metal could gain bullish momentum if Chairman Jerome Powell pushes back against a rate hike in September, FXStreet’s Eren Sengezer reports.
Fed takes center stage this week
“The Fed is widely expected to hike its policy rate by 50 basis points to the 1.25%-1.5% range. The Fed remains on track to opt for another 50 bps rate increase in July and it shouldn't be a surprise if that's confirmed.”
“The main question is whether the Fed will pause hikes in September. In case the Fed or FOMC Chairman Jerome Powell pushes back against a rate hike in September, this could be seen as dovish guidance and cause US Treasury bond yields to decline. In that scenario, gold is likely to gather bullish momentum. On the other hand, the dollar should continue to outperform its rivals and weigh on XAUUSD if the Fed leaves the door open for another rate increase in September.”
The UK’s industrial sector recovery remained in the doldrums in April, the latest UK industrial and manufacturing production data published by Office for National Statistics (ONS) showed on Monday.
Manufacturing output arrived at -1.0% MoM in April versus 0.2% expectations and -0.2% booked in March while total industrial output came in at -0.6% vs. 0.2% expected and -0.2% last.
On an annualized basis, the UK manufacturing production figures came in at 0.5% in April, missing expectations of 1.8%. Total industrial output rose by 0.7% in the fourth month of this year against a 0.5% reading expected and the previous 0.7% print.
Separately, the UK goods trade balance numbers were published, which arrived at GBP-20.893 billion in April versus GBP-22.5 billion expectations and GBP-23.897 billion last. The total trade balance (non-EU) came in at GBP-10.988 billion in April versus GBP-13.804 billion previous.
Related reads
- UK GDP contracts by 0.3% in April, a negative surprise
-
GBP/USD tumbles below 1.2260 on poor UK data
- UK GDP arrived at -0.3% MoM in April vs. 0.2% expected.
- GBP/USD remains capped below 1.2300 on downbeat UK GDP.
The UK GDP monthly release showed that the economy unexpectedly contracted in April, arriving at -0.3% vs. 0.2% expectations and -0.1% previous.
Meanwhile, the Index of services (April) came in at 0% 3M/3M vs. 0.4% estimate and 0.4% prior.
The Cable pauses its recovery from one-month lows near 1.2280 on the downside surprise in the UK growth numbers. The spot is shedding 0.32% on the day.
About UK GDP
The Gross Domestic Product released by the National Statistics is a measure of the total value of all goods and services produced by the UK. The GDP is considered as a broad measure of the UK economic activity. Generally speaking, a rising trend has a positive effect on the GBP, while a falling trend is seen as negative (or bearish).
- Gold eases from five-week high to consolidate the biggest daily jump in a month.
- DXY renews monthly top as US CPI underpin hawkish Fed bets, China-linked headlines add to the risk-off mood.
- Growth, recession fears highlight central bank moves as the key catalysts for this week, FOMC in focus.
Gold Price (XAUUSD) retreats from a three-week-old resistance line as risk-aversion underpins the US dollar’s safe-haven demand. That said, the yellow metal’s latest weakness could be linked to the jump in the hawkish Fed bets, as well as China’s covid woes and the technical analysis. However, the bears await more updates on the key catalysts, while also waiting for the Fed’s verdict, to determine short-term XAUUSD moves.
Gold Price struggles to cheer DXY pullback
US Dollar Index (DXY) dribbles around a one-month high, retreating to 104.42 after refreshing the monthly top by the press time, as the US inflation data bolstered expectations of faster/heavier rate hikes by the Fed. However, the market’s indecision tests greenback buyers amid a sluggish Asian session.
Also read: Gold Price Forecast: 50 DMA could be a tough nut to crack, as focus shifts to Fed
Inflation woes weigh on XAUUSD
The headline US inflation, Consumer Price Index (CPI), rose to 8.6% YoY versus 8.3% expected while the Core CPI jumped 6.0% YoY compared to the expected drop to 5.9% from 6.2% a month earlier. A jump in the US inflation numbers propel the US Fed policymakers toward aggressive monetary policy action and weigh on Gold Price.
China’s covid conditions, Sino-American tussles test gold’s recovery
China witnesses fresh covid woes, led by Beijing and Shanghai and weigh on gold prices. “Beijing Sports Authority suspends offline sports events starting from June 13 due to covid,” said Reuters. During the weekend, Beijing’s local government spokesman Xu Heijian mentioned that a covid outbreak linked to a bar in Beijing is ferocious. Shanghai is on the same line as it reintroduced some activity restrictions after witnessing a jump in the virus numbers.
Elsewhere, comments from China’s Defense Minister Wei Fenghe highlight Sino-American jitters. China’s Wei mentioned that China's relationship with the US is at a crossroads. The policymaker also added that they will fight to the end if anyone attempts to secede Taiwan from China. “those who seek Taiwan independence will come to no good end,” said China’s Wei.
Treasury yields keep gold prices pressured
US 10-year Treasury bond yields poke the four-year high marked in May, up 1.7 basis points (bps) to 3.17% by the press time. In doing so, the benchmark bond coupon remains firmer for the fourth consecutive day amid growing fears of the Fed’s faster/heavier rate hikes. It should be noted that the global economic woes also underpin the US Treasury yields and weigh on the XAUUSD.
All eyes on Fed
Federal Reserve building in Washington DC.
US Federal Reserve (Fed) is up for 50 basis points (bps) of a rate hike during June 15 monetary policy meeting. However, the CME FedWatch tool shows the 26.8% chance of a 75 bp rate hike move, which in turn keeps the market in a dicey mode ahead of the key monetary policy meeting. Also important will be the policymakers’ view on rate hikes past August as the markets appear divided on the September action. Should the Fed hawks remain on the path of faster rate lifts, the Gold Price has more to crack on the downside. However, increased expectations of a 75 bps move on Wednesday challenge the gold bears ahead of the key event.
Gold Price technical outlook
Gold Price again fades bounce off the 200-DMA as it reverses from a three-week-old ascending resistance line by the press time.
RSI (14) retreat also hints at the metal’s further weakness even though the bullish MACD signals keep buyers hopeful until the quote stays beyond the 200-DMA support of $1,842.
Even if the quote drops below $1,842, multiple levels marked since mid-May, around $1,830-25, could challenge the XAUUSD bears.
Meanwhile, an upside clearance of the aforementioned resistance line, near $1,878 by the press time, isn’t an open invitation to the gold buyers as the 50-DMA level surrounding $1,883 adds to the resistance levels.
Even if the quote rises past $1,883, the 50% and 61.8% Fibonacci retracement (Fibo.) of the April 18 to May 16 downturn, around $1,893 and $1,917 in that order, will be challenging the XAUUSD’s advances.
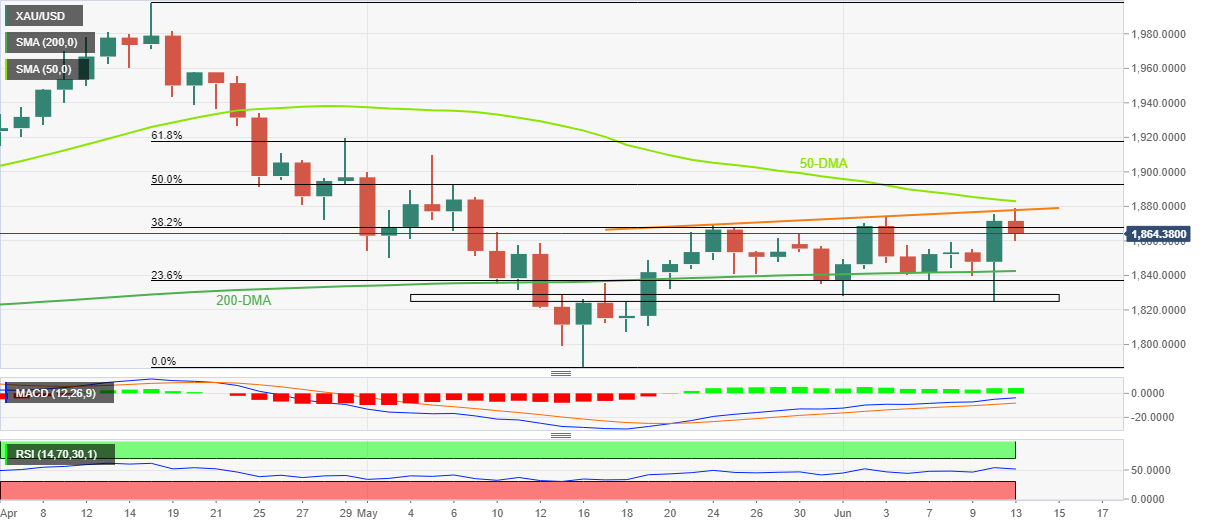
Gold Analysis Forecast
Bank of Japan (BOJ) Governor Haruhiko Kuroda said on Monday, “recent sharp yen falls are undesirable, adding that they are “not good for the economy. “
Additional quotes
BOJ must support economy with monetary easing to achieve higher wages.
Japan's economy still in the midst of recovery from pandemic's hit, rising raw material costs is rising to downward pressure.
Important for forex to move stably reflecting fundamentals.
Will closely watch impact of FX moves on economy, prices.
Japan's economy picking up as a trend despite headwind from rising global commodity prices.
Don't think Japan is in state of stagflation, don't think it will slip into one.
There is uncertainty over impact of Ukraine crisis on Japan’s economy, prices.
Japan's economy likely to improve as impact of covid, supply constraints eases.
- Asian equities are witnessing a bloodbath amid a cautious market mood on higher US Inflation.
- The odds of a 75 bps rate hike by the Fed have improved strongly.
- Oil prices are slipped on hopes of a slump in the aggregate demand.
Markets in the Asian domain have witnessed a bloodbath as higher US Inflation figures, released on Friday in the New York session, have underpinned the negative market sentiment. Asian equities have fallen like a house of cards as the firmer US Consumer Price Index (CPI) has bolstered the odds of a 75 basis point (bps) rate hike by the Federal Reserve (Fed) in its monetary policy meeting, which is due on Wednesday.
At the press time, Japan’s Nikkei225 plunged 2.81%, China A50 eroded 2.15%, Hang Seng dived 2.85%, and Nifty50 dropped 2.58%.
Advancing odds of a rate hike by the Fed have brought an extreme sell-off in the global equities. The scenario of a 75 bps rate hike by the Fed will squeeze liquidity from the market, which will result in multi-filtered investment opportunities. Also, the soaring price pressures are indicating that the aggregate demand will tumble sharply and a recession situation could take place.
Meanwhile, oil prices have also witnessed a steep fall on Friday after the US Bureau of Labor Statistics reported the annual US Inflation figure at 8.6%. This has strengthened the recession fears in western economies. Higher inflation figures are majorly contributed by soaring oil prices lately. Mounting inflation will eat the wallets of the households and therefore lower oil demand will be the outcome. Apart from that, renewed lockdown curbs in China to contain the Covid-19 have bolstered the fears of a slump in aggregate demand.
- USD/TRY grinds higher around yearly top, extending the previous day’s rebound.
- Lower highs, Friday’s Doji probe bulls amid overbought RSI (14).
- Short-term rising channel, previous resistance line from January and 20-DMA test pullback moves.
USD/TRY holds onto the previous day’s recovery around the yearly top, sidelined near 17.20 during early Monday morning in Europe. In doing so, the Turkish lira (TRY) pair stays inside a bullish channel formation, established in early May.
However, overbought RSI conditions and Friday’s Doji hints at the pair’s pullback moves towards the stated channel’s support line, close to 16.90 by the press time.
It should be noted that the quote’s weakness past 16.90 won’t be an open invitation to the USD/TRY bears as the resistance-turned-support line from January joins 20-DMA to challenge the pair’s further declines around 16.49 and 16.43 in that order.
Meanwhile, the upper line of the stated channel, around 17.45, challenges the USD/TRY upside ahead of the yearly top surrounding 17.50.
Following that, the lifetime high marked during late 2021, around 18.35, will be in focus as it holds the key to the pair’s rally towards the 20.00 psychological magnet.
Overall, USD/TRY bulls seem to run out of steam and may take a breather.
USD/TRY: Daily chart
Trend: Pullback expected
The Bank of Japan (BOJ) set a new offer for its bond-buying programme on June 14, announcing it would buy JPY500 bln worth of Japanese Government Bonds (JGB) with a maturity of over five years and up to 10 years.
The BOJ said that it will increase the amount of offers for its bond-buying as needed.
Market reaction
USD/JPY remains unfazed by the BOJ announcement, trading at 135.05, up 0.46% on the day, as of writing.
- AUD/USD retreats towards one-month low during the four-day downtrend as market sentiment remains sour.
- Beijing Sports Authority announces suspension of offline sports, CME’s FedWatch Tool hints at 75 bps rate hike in June.
- Risk-off mood joins firmer US Treasury yields to favor US dollar.
AUD/USD renews selling pressure towards retesting the monthly low of 0.7000 after Beijing amplifies virus woes during early Monday morning in Europe. Also exerting downside pressure on the Aussie pair are the increasing hawkish bets on the Fed’s next move, as well as the Sino-American tussles.
“Beijing Sports Authority suspends offline sports events starting from June 13 due to covid,” said Reuters. During the weekend, Beijing’s local government spokesman Xu Heijian mentioned that a covid outbreak linked to a bar in Beijing is ferocious. Shanghai is on the same line as it reintroduced some activity restrictions after witnessing a jump in the virus numbers.
Elsewhere, comments from China’s Defense Minister Wei Fenghe also weigh on the AUD/USD prices, due to the fears of the fresh Sino-American tussles. China’s Wei mentioned that China's relationship with the US is at a crossroads. The policymaker also added that they will fight to the end if anyone attempts to secede Taiwan from China. “those who seek Taiwan independence will come to no good end,” said China’s Wei.
On a different page, the CME FedWatch tool shows 26.8% chance of a 75 bp Federal Reserve rate hike at the June 15 meeting. The increase in hawkish bets takes clues from Friday’s upbeat US inflation data and propels the US dollar of late. The headline US Consumer Price Index (CPI) rose to 8.6% YoY versus 8.3% expected while the Core CPI jumped 6.0% YoY compared to the expected drop to 5.9% from 6.2% a month earlier.
Amid these plays, the S&P 500 Futures dropped for the fourth consecutive day to refresh a monthly low to around 3,845, down 1.35% by the press time. In doing so, the benchmark US equity futures stay directed towards the yearly low marked in May. Further, the US 10-year Treasury yields rise 2.7 basis points (bps) as buyers attack the four-year low marked in May, around 3.20%.
Moving on, AUD/USD traders may pay attention to the risk catalysts amid a light calendar on Monday. However, Wednesday’s Federal Open Market Committee (FOMC) and Thursday’s Aussie jobs report will be crucial for the pair traders to watch for clear directions.
Technical analysis
A broad horizontal support zone stretched from January, around 0.6955-70 appears a tough nut to crack for the AUD/USD bears. However, recovery remains elusive below the 20-DMA surrounding 0.7125.
- USD/INR refreshes all-time high before retreating to 78.20, prints four-day uptrend.
- Fears of aggressive Fed action join China-linked news to propel USD.
- India bond yields track US counterparts to jump to the highest levels since 2019.
USD/INR jumps to the lifetime high of 78.40 during a four-day uptrend heading into Monday’s European session, consolidating daily gains around 78.20 by the press time. The Indian rupee (INR) pair traces the broad US dollar strength, as well as pessimism in the bond market to print the record top.
That said, the US Dollar Index (DXY) dribbles around a one-month high surrounding 104.50 as the US inflation data bolstered expectations of faster/heavier rate hikes by the Fed. The headline US Consumer Price Index (CPI) rose to 8.6% YoY versus 8.3% expected while the Core CPI jumped 6.0% YoY compared to the expected drop to 5.9% from 6.2% a month earlier. It’s worth noting that the record low of the University of Michigan Consumer Sentiment Index for June, to 50.2 versus revised down 58.1, couldn’t stop the US dollar bulls.
At home, India’s 10-year Treasury bond yields jump to the highest in three years while flashing 7.60% coupon rate at the latest. On a broader front, the US 10-year Treasury yields rise 2.7 basis points (bps) as buyers attack the four-year low marked in May, around 3.20%.
The jump in yields justifies the market’s hawkish bets on the US Federal Reserve. It’s worth observing that the CME FedWatch tool shows 26.8% chance of a 75 bp Federal Reserve rate hike at the June 15 meeting.
Other than what’s already mentioned above, covid fears in China and the Sino-American tussles, recently over Taiwan, also propel the USD/INR prices. Beijing witnessed a jump in the covid numbers during the weekend and recalled some of the virus-led activity restrictions together with the mass testing. Shanghai is on the same line. Recently, Beijing’s local government spokesman Xu Heijian mentioned that a covid outbreak linked to a bar in Beijing is ferocious. Further, China’s Defense Minister Wei Fenghe crossed wires during the weekend stating that China's relationship with the US is at a crossroads. The policymaker also added that they will fight to the end if anyone attempts to secede Taiwan from China. “those who seek Taiwan independence will come to no good end,” said China’s Wei.
Moving on, USD/INR traders need to pay close attention to the risk catalysts, as well as the Fed moves, for fresh impulse.
Technical analysis
Overbought RSI conditions join an upward sloping resistance line from early March to challenge USD/INR bulls around 78.40, a break of which may not hesitate to challenge the 80.00 psychological magnet.
Meanwhile, pullback moves remain elusive until the quote remains beyond 77.85, comprising the upper line of the previous trading range, established in mid-May.
- WTI is expected to remain subdued as higher US CPI has firmed the odds of a 75 bps rate hike by the Fed.
- The resurgence of Covid-19 cases in China has dampened the market sentiment.
- Prohibition of Russian oil imports will keep the oil supply constraints in check.
West Texas Intermediate (WTI), futures on NYMEX, has witnessed a minor bounce after hitting a low of $115.80 in the Asian session, however, the downside bias looks firmer amid renewed lockdown worries in China due to a resurgence in Covid-19 cases and soaring price pressures in the US economy.
The black gold witnessed a steep fall on Friday after the US Bureau of Labor Statistics announced the annual Consumer Price Index (CPI) at 8.6%, much higher than the expectations of 8.3%. A higher-than-expected annual inflation figure has underpinned the odds of a 75 basis point (bps) interest rate hike by the Federal Reserve (Fed) on Wednesday.
An extreme hawkish stance by the Fed will restrict liquidity in the market, which will force the corporate sector to add more filters on the investment opportunities and invest only in the most productive ones. Lower investments will scale down the oil consumption and henceforth the oil prices, which investors are discounting now.
Meanwhile, renewed lockdown worries in China have raised concerns over the oil demand. The Chinese cities: Shanghai and Beijing were recovering after an extreme two-month lockdown period and renewed Covid-19 worries have spooked the market sentiment.
On the supply front, the oil supply will continue to be a major constraint as a prohibition of oil imports from Russia will keep the supply worries intact for a longer horizon.
USD/JPY has broken 135 the figure in Asian trade at the start of the week.
On the monthly chart below, the prior highs from Jan 2002 are located at 135.16 and its blue skies above there to 147.67 and the 1998 summer highs:

The yen has been sold off sharply by bears that have been motivated by the Bank of Japan's dovish rhetoric, announcing that it will stick with its ultra-accommodative policy stance despite the Federal Reserve and other central banks that are accelerating their tightening to tame inflation.
Also read: USD/JPY leans bullish around 20-year high on upbeat options market signals, pre-Fed caution
''The BOJ has made it clear that it will stick to its easy policy settings until it believes that core inflation in Japan can stabilize around the 2% level. There is a chance that an adjustment in the BOJ’s yield curve control policy could come in the autumn,'' analysts at Rabobank said, noting that this month's meeting, June 17, will be closely eyed for any change in policy guidance.
Meanwhile, Japan's government and the central bank said on Friday they were concerned by recent sharp falls in the yen in a rare joint statement, Reuters reported.
''This was the strongest warning to date that Tokyo could intervene to support the currency as it plumbs 20-year lows.''
''The statement underscores growing concern among policymakers over the damage that sharp yen depreciation could inflict on Japan's fragile economy by hurting business activity and consumers.''
- USD/JPY bulls take a breather after rising to the highest levels since 2002.
- Options market signals portray consecutive three weeks of bullish bias.
- Japan’s Matsuno shows readiness to act but sounds vague on FX market intervention.
- Hawkish Fed bets join China-linked headlines to propel prices.
USD/JPY remains on the front foot around a two-decade high, despite recent inaction around 135.00. That said, the quote’s recent consolidation could be linked to the comments from Japan’s Chief Cabinet Secretary Matsuno, as well as the market’s anxiety ahead of Wednesday’s US Federal Reserve (Fed) monetary policy meeting.
Japan’s Chief Cabinet Secretary Matsuno showed the capacity to take appropriate actions on FX market movements if necessary. “Japan's govt will respond appropriately to exchange rate following G7 agreement on currencies while keeping close communication with the US, other authorities,” adds the policymaker.
On the other hand, the CME FedWatch tool shows 26.8% chance of a 75 bp Federal Reserve rate hike at the June 15 meeting, which in turn suggests high hopes from the Fed. As a result, the US Dollar Index (DXY) dribbles around a one-month high.
Additionally supporting the USD/JPY bulls are the options market signals as the weekly risk reversal (RR), the spread between calls and puts, rose for the third consecutive week by the end of Friday, +0.220 at the latest. It should be noted, however, that the daily RR dropped for the second day in a line down -0.210 and test the pair buyers.
Looking forward, a light calendar on Monday may challenge USD/JPY bulls but the risk catalysts, like escalating covid woes from China and the recent Sino-American tussles over Taiwan can underpin the pair’s upside momentum.
Technical analysis
The USD/JPY pair’s ability to cross the three-day-old resistance, around 134.75-80, directs it towards the year 2002’s high surrounding 135.15-20. However, the pair’s upside past 135.20 appears difficult amid overbought RSI.
Meanwhile, the resistance-turned-support around 134.75-80 restricts the yen pair’s immediate downside ahead of an ascending support line from late May, around 133.85 by the press time.
- AUD/JPY is oscillating around 94.60 as investors are shifting their focus to BOJ’s interest rate policy.
- Hawkish RBA in times of weak labor market has weakened the aussie bulls.
- Japan’s upbeat GDP has supported the yen bulls.
The AUD/JPY pair is displaying topsy-turvy moves in a narrow range of 94.32-94.91 from Friday. The risk barometer has turned sideways after a sheer downside falls from 96.88 recorded last week. The aussie bulls got hammered last week after the Reserve Bank of Australia (RBA) dictated an extreme hawkish stance while the Japanese economy reported better-than-expected Gross Domestic Product (GDP) numbers.
The RBA announced an Official Cash Rate (OCR) hike by 50 basis points (bps). RBA Governor Philip Lowe went out of the box and dictated a rate hike higher than the estimates of 25 bps. Investors were not satisfied with featuring a jumbo rate hike despite the unfavorable labor market. The aussie labor market has failed to generate plenty of job opportunities in the last few months.
For May, the Australian economy generated 4k jobs, significantly lower than the estimates of 30k. More liquidity shrinkage from the economy will dampen the labor market further.
On the Tokyo front, the Japanese Cabinet office reported better-than-expected GDP numbers that supported the yen bulls. The quarterly GDP improved to -0.1% from the estimates of -0.3% while the annual GDP climbed to -0.5% from the consensus of -1%.
Going forward, investors’ focus will remain on the interest rate decision by the Bank of Japan (BOJ), which is due on Friday. The BOJ is expected to keep the interest rates unchanged at -0.1% despite the inflation levels having reached above the target of 2%. It is worth noting that the major contribution to the higher inflation rate is the rising oil prices. Therefore, a prudent monetary policy will continue a little longer.
- EUR/USD licks its wounds around three-week low, pares intraday losses of late.
- US dollar cheers risk-aversion wave as hawkish Fed bets, China-linked news weigh on market sentiment.
- Yields dribble around four-year high marked in May, US stock futures eye yearly low.
- Risk catalysts may entertain traders ahead of all-important Fed, ECBSpeak is important too.
EUR/USD picks up bids to consolidate daily losses around 1.0495, staying around the monthly low during a three-day downtrend amid early European morning on Monday. The major currency pair posted the biggest weekly losses since late April by the end of Friday after the US inflation data bolstered expectations of faster/heavier rate hikes by the Fed.
That said, the headline US Consumer Price Index (CPI) rose to 8.6% YoY versus 8.3% expected while the Core CPI jumped 6.0% YoY compared to the expected drop to 5.9% from 6.2% a month earlier. It’s worth noting that the record low of the University of Michigan Consumer Sentiment Index for June, to 50.2 versus revised down 58.1, couldn’t stop the US dollar bulls.
Other than the US inflation numbers, covid fears in China and the Sino-American tussles, recently over Taiwan, also weigh on the EUR/USD prices. Beijing witnessed a jump in the covid numbers during the weekend and recalled some of the virus-led activity restrictions together with the mass testing. Shanghai is on the same line. Recently, Beijing’s local government spokesman Xu Heijian mentioned that a covid outbreak linked to a bar in Beijing is ferocious. Further, China’s Defense Minister Wei Fenghe crossed wires during the weekend stating that China's relationship with the US is at a crossroads. The policymaker also added that they will fight to the end if anyone attempts to secede Taiwan from China. “those who seek Taiwan independence will come to no good end,” said China’s Wei.
At home, multiple European Central Bank (ECB) policymakers likely Madis Muller, Martins Kazaks and Robert Holzmann tried to elaborate on the regional central bank’s 25 bps July rate hike while suggesting that it’s not a strict limit if the inflation remains firmer. It should be noted that Eurozone inflation refreshed its record top in its latest print.
While portraying the mood, the S&P 500 Futures dropped for the fourth consecutive day to refresh a monthly low to around 3,845, down 1.35% by the press time. In doing so, the benchmark US equity futures stay directed towards the yearly low marked in May. Further, the US 10-year Treasury yields rise 2.7 basis points (bps) as buyers attack the four-year low marked in May, around 3.20%.
Looking forward, a light calendar in Europe and the market’s anxiety ahead of Wednesday’s Federal Open Market Committee (FOMC) can keep the EUR/USD prices pressured. However, the CME FedWatch tool shows 26.8% chance of a 75 bp Federal Reserve rate hike at the June 15 meeting, which in turn suggests high hopes, as well as fears of disappointment, suggesting the need for great caution by the pair traders.
Technical analysis
The oversold RSI conditions challenge the pair’s further declines around a 1.5-month-old horizontal support zone, near 1.0470-60.
Alternatively, the corrective pullback may initially aim for the 61.8% and 50% Fibonacci retracements of May 13-30 upside, respectively around 1.0515 and 1.0570.
The Chinese economy likely rebounded in May as declines in industrial output and consumption narrowed, Yicai.com reported, citing economists.
Additional takeaways
“Economists surveyed by Yicai expected industrial output fell 0.49% y/y in May, compared to the 2.9% decline in April, as power consumption by industrial enterprises in Shanghai recovered to 80.5% of the level same period last year while logistics also improved.”
“A decline in consumption narrowed to a 7% YoY dip from the previous 11.1% decline.”
“Fixed-asset investment may remain upbeat, growing about 7.2% amid policy pushes to boost the economy.”
China is set to release its May activity numbers on Wednesday.
Also read: USD/CNH Price Analysis: Bulls cheer fresh monthly high with eyes on 6.7860
- Gold price has slipped sharply after failing to surpass $1,880.00n advancing hawkish Fed bets.
- The DXY has crossed 104.50 amid higher price pressures and a tight labor market.
- A formation of an upthrust in the gold prices indicates a buying climax.
Gold price (XAU/USD) has witnessed a vertical fall after failing to overstep the round-level resistance of $1,880.00. The precious metal advanced sharply on Friday above $1,870.00, attempted to balance above $1,870.00 in the early Asian session but failing to surpass $1,880.00 drifted the gold bulls lower.
A steel fall after an inventory distribution at the open is expected to bring more weakness in the counter. The gold prices have witnessed extreme selling pressure on rising odds of a 75 basis point (bps) interest rate hike by the Federal Reserve (Fed). Soaring price pressures and the upbeat Nonfarm Payrolls (NFP) are expected to compel the Fed to sound extremely hawkish.
The US Consumer Price Index (CPI) landed at 8.6%, higher than the estimates and the former figure of 8.3%. While, the core CPI was released at 6%, higher than the expectations of 5.9%. This indicates that higher food and oil prices are contributing to the inflationary pressures.
Meanwhile, the US dollar index (DXY) is advanced strongly higher above 104.50 on expectations of an extreme hawkish policy by the Fed.
Gold technical analysis
On an hourly scale, the gold prices have witnessed a sell-off after forming an upthrust near $1,880.00, which signals a buying climax, followed by a bearish reversal. The precious metal is holding above the 200-Exponential Moving Average (EMA) at $1,852.20 but is expected to tumble further to near the critical support of $1,830.00. The Relative Strength Index (RSI) (14) has shifted into a 40.00-60.00 range from the bullish range of 60.00-80.00, which signals exhaustion in the upside trend.
Gold hourly chart
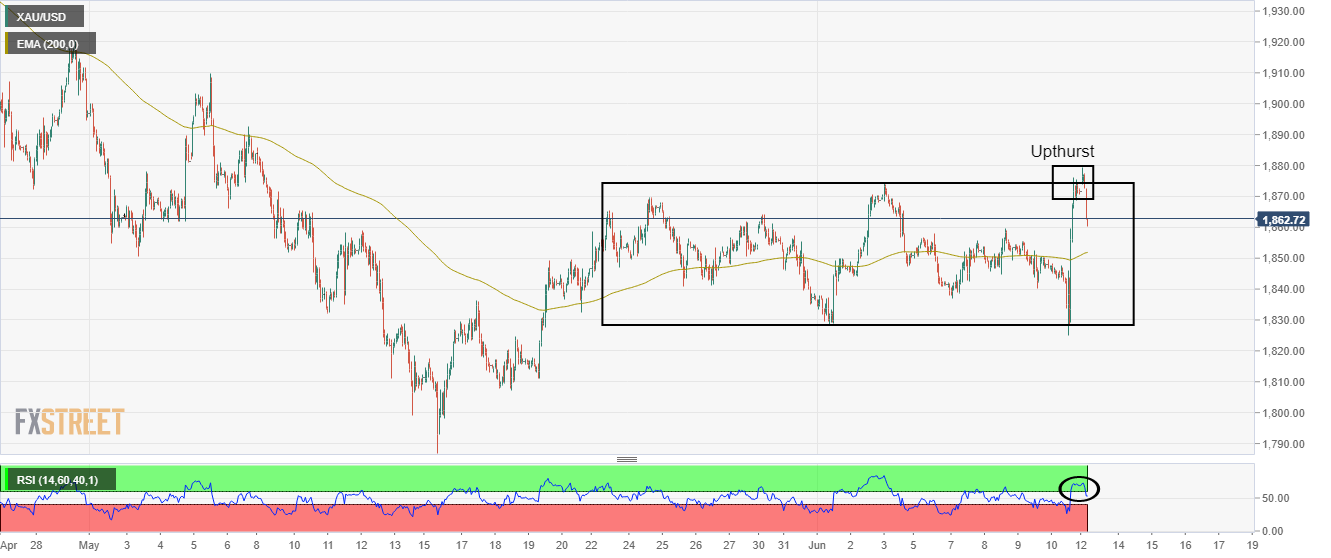
David Kostin, Equity Strategist at Goldman Sachs outline various scenarios for the S&P 500 index, predicting it to fall further to 3,150 levels.
Key quotes
“Base case forecast valuation is expected to remain roughly flat while earnings growth does the heaving lifting and pushes the S&P back to 4300 at year-end 2022.”
"Inflation surprises like this morning’s will also affect the path of multiples, for better or worse."
“Some of the economic developments that have boded well for the Fed’s battle with inflation have intensified concerns about the earnings outlook."
“Valuations dominated investor focus in early 2022, but recent client conversations have centred on risks to EPS estimates.”
“Margins have driven the majority of recent analyst cuts, estimates still appear too high.”
“Expect S&P 500 net margins excluding Financials and Energy will slip from 12.7% in 2021 to 12.6% in 2023.”
Japanese Chief Cabinet Secretary Matsuno came out with the much-needed verbal intervention to rescue the yen from the ongoing slump.
He said that they are “ready to take appropriate actions on FX market movements if necessary.”
Additional quotes
Desirable for currencies to move stably reflecting economic fundamentals.
Closely watching FX moves with a sense of urgency.
Excess FX volatility, disorderly FX movements could have adverse effect on economy, financial stability.
Japan's govt will respond appropriately to exchange rate following G7 agreement on currencies while keeping close communication with us, other authorities.
No comment on FX market intervention.
Will work with BOJ to monitor market movements, impact on prices with heightened sense of urgency.
There is nothing new in view expressed in latest US forex report.
Market reaction
USD/JPY slipped from 134.99 to 134.77 on these above comments, now trading at 134.84, up 0.32% on the day.
- USD/CNH extends one-week-old upward trajectory towards challenging late May’s swing high.
- Yearly top in focus as MACD teases bulls, RSI hints at further upside.
- Previous resistance line, weekly support trend line restrict short-term downside ahead of seven-week-old horizontal area.
USD/CNH remains on the front foot as it refreshes the monthly top around 6.7731, around 6.7635 by the press time of Monday’s Asian session.
In doing so, the offshore Chinese yuan (CNH) pair justifies Friday’s upside break of a one-month-old resistance line, now support around 6.7220.
Also keeping the USD/CNH bulls hopeful is the MACD lines suggesting a bull cross, as well as the firmer RSI (14).
That said, the quote stays on the way to the monthly horizontal resistance area surrounding 6.7840-60 before challenging the yearly top near 6.8384.
Should the USD/CNH prices refresh yearly top, the odds of witnessing a rally towards the 6.9000 psychological magnet can’t be ruled out.
Alternatively, pullback moves need to break the 6.7220 resistance-turned-support to recall the short-term sellers.
Following that, a weekly support line could probe the quote’s further downside around 6.6900.
It’s worth noting that a horizontal area comprising multiple lows marked since late April, surrounding 6.6100, appears a tough nut to crack for the USD/CNH bears afterward.
USD/CNH: Daily chart

Trend: Further upside expected
- Market sentiment remains jittery amid increasing hawkish Fed bets, China-linked news.
- S&P 500 Futures print four-day downtrend to refresh monthly low.
- US 10-year bond coupon pokes the multi-year high marked in May.
- Risk-off mood favors bond sellers, weighs on riskier assets, intermediate pullbacks can’t be ruled out.
Risk-aversion is at full steam during Monday’s Asian session as traders brace for this week’s key central bank decisions. That said, the sour sentiment mainly takes clues from Friday’s strong US inflation data and China’s covid-linked updates, not to forget the Sino-American tensions over Taiwan.
While portraying the mood, the S&P 500 Futures dropped for the fourth consecutive day to refresh a monthly low to around 3,840, down 1.45% by the press time. In doing so, the benchmark US equity futures stay directed towards the yearly low marked in May.
On the other hand, the US 10-year Treasury yields rise 2.7 basis points (bps) as buyers attack the four-year low marked in May, around 3.20%.
Friday’s US inflation numbers roiled the increased fears over the Fed’s aggression while headlines concerning China’s covid conditions and the latest US-China tussles over Taiwan add strength to the risk-off mood.
The sentiment worsened on Friday after the headline US Consumer Price Index (CPI) rose to 8.6% YoY versus 8.3% expected while the Core CPI jumped 6.0% YoY compared to the expected drop to 5.9% from 6.2% a month earlier. It’s worth noting that the record low of the University of Michigan Consumer Sentiment Index for June, to 50.2 versus revised down 58.1, couldn’t stop the US dollar bulls.
On the other hand, Beijing witnessed a jump in the covid numbers during the weekend and recalled some of the virus-led activity restrictions together with the mass testing. Shanghai is on the same line. Recently, Beijing’s local government spokesman Xu Heijian mentioned that a covid outbreak linked to a bar in Beijing is ferocious. Further, China’s Defense Minister Wei Fenghe crossed wires during the weekend stating that China's relationship with the US is at a crossroads. The policymaker also added that they will fight to the end if anyone attempts to secede Taiwan from China. “those who seek Taiwan independence will come to no good end,” said China’s Wei.
Elsewhere, fears of recession gain momentum as the major central banks brace for aggressive rate hikes, except for the Bank of Japan (BOJ), when the economic recovery is fragile.
Looking forward, monetary policy meetings of the Bank of Japan (BOJ), Bank of England (BOE) and the US Federal Reserve (Fed) will be crucial to watch. Additionally, multiple data relating to consumer spending will also entertain the market players during the key week.
Also read: Yield curve inversions return, signaling another recession warning
In its latest Consensus Forecasts published on Monday, the New Zealand Institute of Economic Research (NZIER) showed a downward revision to the growth outlook over the coming years, despite the stronger start.
Key takeaways
“The revisions reflect expectations of weaker activity across most sectors from 2023.“
“These headwinds include continued global supply chain disruptions as countries continue to grapple with COVID-19, the war in Ukraine and rising interest rates.”
“Households and businesses are starting to feel more downbeat.”
“Meanwhile, the inflation outlook has been revised up. This reflects expectations that high inflation will remain persistent in the New Zealand economy.
“Annual GDP growth is expected to ease to below 2% for the year to March 2024 before recovering slightly in the subsequent year. Surveyed economists forecast 2022-23 GDP expanding by 2.9% & 2023-24 +1.9%.
“With major central banks around the world highlighting their increased concern with inflation and embarking on monetary policy tightening, the interest rate outlook has again been revised up .
“Although the Reserve Bank of New Zealand was early in tightening monetary policy, as other central banks have followed suit, this has reduced the yield attractiveness of NZD - denominated assets. This has put downward pressure on the New Zealand dollar.”
This comes ahead of the GDP due from New Zealand this Thursday.
- GBP/USD drops for the fourth consecutive day, takes offer to refresh monthly bottom.
- Sustained break of the key SMAs, bearish MACD signals favor bears ahead of the UK’s monthly data dump.
- Five-week-old horizontal support zone restricts immediate downside amid oversold RSI.
GBP/USD bears keep reins for the fourth consecutive day while refreshing the one-month low during Monday’s mid-Asian session. In doing so, the cable pair takes offers to 1.2270 as it renews the multi-day low by the press time.
However, oversold RSI (14) can join multiple levels marked since May 09 to challenge the pair’s further downside around 1.2260-50.
Failing to do so can quickly fetch the quote towards the yearly low of 1.2155 before directing the GBP/USD bears towards the 1.2000 psychological magnet.
On the contrary, 200-SMA and 100-SMA can challenge the corrective pullback around 1.2468 and 1.2540 in that order.
Also challenging the short-term upside moves of the GBP/USD prices is a descending trend line resistance from mid-April, around 1.2550 by the press time.
To sum up, GBP/USD remains on the bear’s radar ahead of the monthly data dump, as well as monetary policy meetings of the Fed and the Bank of England (BOE). However, the immediate downside has multiple challenges and hence a corrective pullback can’t be ruled out.
GBP/USD: Four-hour chart

Trend: Limited weakness expected
In recent trade today, the People’s Bank of China (PBOC) set the yuan (CNY) at 6.7182 vs. the previous fix of 6.6994 and previous close of 6.7081.
About the fix
China maintains strict control of the yuan’s rate on the mainland.
The onshore yuan (CNY) differs from the offshore one (CNH) in trading restrictions, this last one is not as tightly controlled.
Each morning, the People’s Bank of China (PBOC) sets a so-called daily midpoint fix, based on the yuan’s previous day's closing level and quotations taken from the inter-bank dealer.
USD/CHF prints a seven-day uptrend, takes the bids to renew monthly top near 0.9900, during Monday’s Asian session.
In doing so, the Swiss currency (CHF) pair justifies the strong signals from the options market as bulls keep the reins.
That said, the weekly print of the one-month USD/CHF risk reversal (RR), the ratio of calls to puts, rallied the most in three months by the end of Friday, with the latest figures being 0.240. It’s worth noting that the same portrayed a second weekly positive RR after three consecutive negative prints.
The daily RR and the monthly RR also keep buyers hopeful with the latest prints of 0.010 and 0.280 in that order.
While the options market signals keep USD/CHF buyers hopeful, this week’s monetary policy meetings of the Swiss National Bank (SNB) and the Fed are crucial to watch for clear directions.
Read: USD/CHF oscillates around 0.9880, focus shifts to Fed and SNB
- A break below 50% Fibo retracement has strengthened the greenback bulls.
- The 50- and 200-EMAs have displayed a death cross formation that adds to the downside filters.
- The RSI (14) has shifted into a bearish range of 20.00-40.00.
The AUD/USD pair is declining sharply after a downside break of the consolidation formed in a 0.7038-0.7064 range in the early Tokyo session. The asset is driving lower over the past week after slipping below the crucial support of 0.7150.
A break below 50% Fibonacci retracement (which is placed from May 12 low at 0.6829 to June 3 high at 0.7283) is placed at 0.7055 drifted the asset lower. The asset formed an initiative selling structure near the 50% Fibo retracement, which has strengthened the greenback bulls. Now, more downside is expected towards the psychological support of 0.7000 and a break of the same will infuse adrenaline rush into the greenback bulls.
A death cross, represented by the 50- and 200-period Exponential Moving Averages (EMAs) at 0.7180, adds to the downside filters.
Meanwhile, the Relative Strength Index (RSI) (14) has shifted into a bearish range of 20.00-40.00, which signals more downside ahead.
A decisive drop below the psychological support of 0.7000 will bring more offers to counter, which will drag the aussie bulls towards May 18 low at 0.6949, followed by May 10 low at 0.6910.
On the flip side, aussie bulls could regain control if the asset oversteps Friday’s high at 0.7070. This will send the asset towards 38.2% Fibo retracement at 0.7110. An upside break of 38.2% Fibo retracement will drive the asset towards May 31 low at 0.7150.
AUD/USD hourly chart
-637906792036452577.png)
- USD/JPY crosses a three-day-old horizontal hurdle to refresh 20-year high.
- Overbought RSI, peak of 2002 challenge buyers around multi-year top.
- Fortnight-old ascending trend line, 10-DMA restrict pullback moves.
USD/JPY takes the bids to refresh a two-decade high around 135.00 during Monday’s Asian session.
The yen pair’s latest upside could be linked to the broad US dollar strength, as well as the quote’s ability to cross the three-day-old resistance around 134.75-80.
It should be noted, however, that overbought RSI (14) and the year 2002’s high surrounding 135.15-20 could challenge the USD/JPY bulls.
If at all the quote rises past 135.20, the late 1998 highs around 137.50 and the 140.00 psychological magnet could lure the pair buyers.
Meanwhile, the resistance-turned-support around 134.75-80 restricts the yen pair’s immediate downside ahead of an ascending support line from late May, around 133.85 by the press time.
Following that, the 10-DMA level near 132.20 and May’s top near 131.30 should be watched carefully.
Overall, USD/JPY bulls approach short-term key hurdles with the RSI conditions challenging further upside.
USD/JPY: Daily chart

Trend: Limited upside expected
“The US economy will tip into a recession next year, according to nearly 70 percent of leading academic economists polled by the Financial Times (FT),” per the analysis published early Monday in Asia.
“The latest survey, conducted in partnership with the Initiative on Global Markets at the University of Chicago’s Booth School of Business, suggests mounting headwinds for the world’s largest economy after one of the most rapid rebounds in history, as the Federal Reserve ramps up efforts to contain the highest inflation in about 40 years,” adds the news.
Key findings
Almost 40 percent of the 49 respondents project the National Bureau of Economic Research — the arbiter of when recessions begin and end — will declare one in the first or second quarter of 2023.
A third believe that call will be delayed until the second half of next year.
Compared to February’s survey, more economists are now of the view that core inflation, as measured by the personal consumption expenditures price index, will exceed 3 percent by the end of 2023.
Of the June respondents, 12 percent thought that outcome was “very likely”, up from just 4 percent earlier this year. The share of economists surveyed who thought that level “unlikely” over the same time period has since nearly halved.
Jonathan Wright, an economist at Johns Hopkins University who helped to design the survey, said the notable pessimism around both inflation and growth has stagflationary undertones, although he noted the circumstances are far different than the 1970s, when the term embodied a “much nastier mix of high inflation and recession”.
Nearly 40 percent of the economists warned that the Fed would fail to control inflation if it only raised the federal funds rate to 2.8 percent by the end of the year.
Dean Croushore, who served as an economist at the Fed’s Philadelphia branch for 14 years, cautioned that the central bank may need to eventually raise rates to roughly 5 percent to contain a problem he believed was largely caused by the Fed waiting “far too long” to take action.
Also read: The Rude Inflation Wake up Call: Markets, oil, gold and forex
- NZD/USD is in the hands of the bears and 0.6300 is eyed.
- The Fed is taking the spotlight for the open following last Friday's data.
NZD/USD is down some 0.3% on the day after falling from a high of 0.6350 and reaching a low of 0.6332 so far. There are prospects of a continuation towards 0.63 the figure as illustrated below, especially given the fundamental environment following last Friday's bearish close on Wall Street.
The US dollar rallied in the wake of Friday’s stronger than expected US inflation data, which analysts at ANZ Bank said, ''in turn saw a significant jump in US bond yields as markets started to wonder if the Fed might hike by 75bps this week. With somewhere between 50 and 75bps priced into markets, this makes Thursday’s Fed decision the key focus for markets as they contemplate if the Fed and other central banks might need to go a lot further than just 3½-4%, as most forecasters think at the moment. If this change in thinking is led by the US, then we could be in for a period of USD strength as markets adjust.''
Looking ahead to the week on the domestic calendar, New Zealand's first-quarter Gross Domestic Product will be a focus. ''This week we expect data to show that Omicron stalled GDP growth. We expect a bounce next quarter,'' the analysts at ANZ Bank argued saying that too could weigh on NZD sentiment.
- New Zealand NZIER Quarterly Forecasts - Full Report
Meanwhile, the latest NZIER Consensus Forecasts show a downward revision to the growth outlook over the coming years, despite the stronger starting point:
''The revisions reflect expectations of weaker activity across most sectors from 2023.
Although the recovery in demand was stronger than initially expected as lockdown restrictions were relaxed, there are increasing headwinds for the New Zealand economy. These headwinds include continued global supply chain disruptions as countries continue to grapple with COVID-19, the war in Ukraine and rising interest rates.''
NZD/USD technical analysis
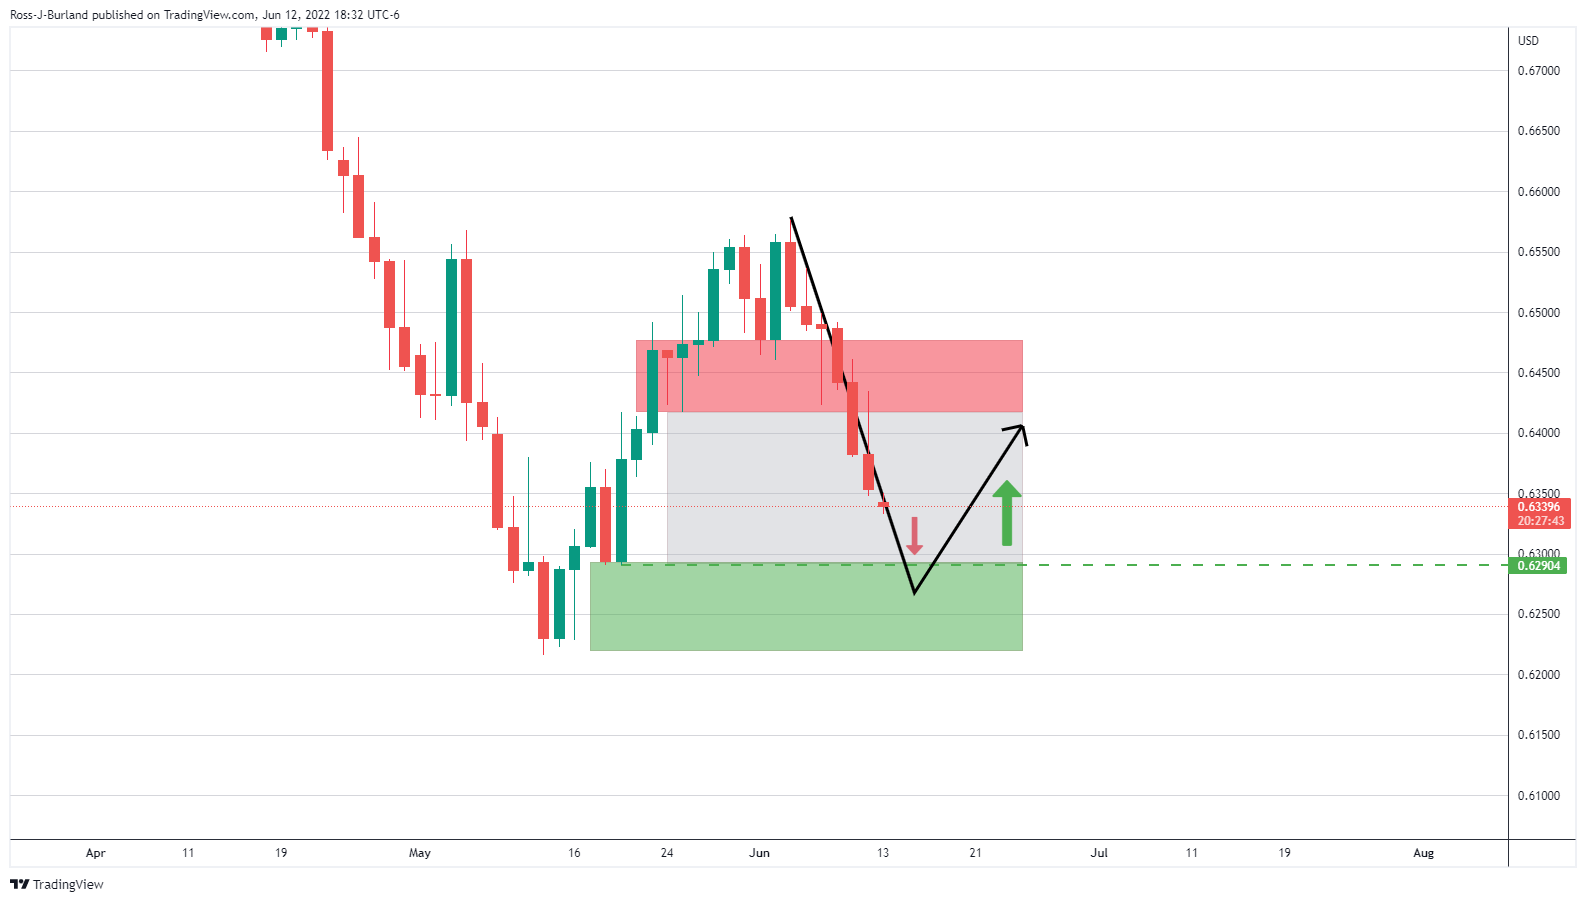
The price is mitigating the price imbalance between the prior lows and 0.6290. A correction, however, would be expected which could appear on the 4-hour chart as follows:
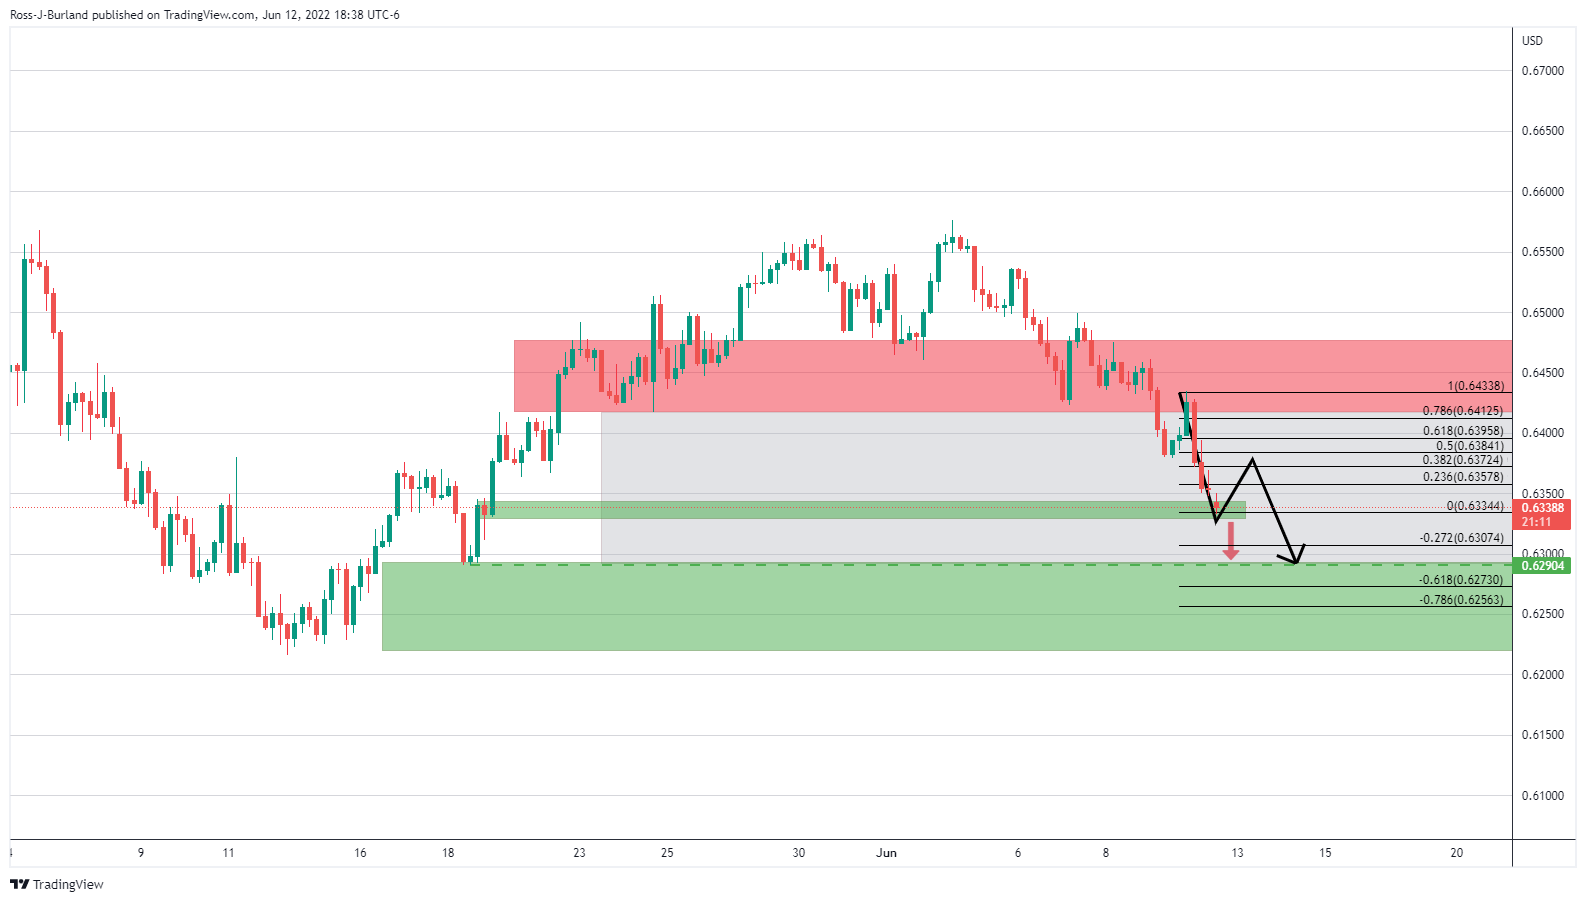
- Gold struggles to extend Friday’s run-up, retreats from five-week high.
- Hawkish Fed bets, China news join short-term resistance line to challenge buyers.
- Risk-aversion can restrict upside moves ahead of Wednesday’s FOMC.
- Gold, Chart of the Week: XAU/USD bulls need to commit or face an avalanche of supply
Gold Price (XAU/USD) pulls back to $1,874, after rising to the highest levels since May 09, during Monday’s Asian session. The precious metal’s latest weakness could be linked to the US dollar’s broad gains ahead of this week’s Federal Reserve (Fed) monetary policy meeting, as well as the risk-off mood. Additionally, a short-term trend line resistance also challenges the bullion buyers.
That said, the US Dollar Index (DXY) refreshes its monthly high around 104.50 while extending the previous three-day uptrend. The greenback gauge cheers the risk-aversion wave and Friday’s hot inflation data to renew a multi-day high.
The DXY rallied on Friday amid increased fears over the Fed’s aggression on skyrocketing US inflation. That said, the headline US Consumer Price Index (CPI) rose to 8.6% YoY versus 8.3% expected while the Core CPI jumped 6.0% YoY compared to the expected drop to 5.9% from 6.2% a month earlier. It’s worth noting that the record low of the University of Michigan Consumer Sentiment Index for June, to 50.2 versus revised down 58.1, couldn’t stop the US dollar bulls.
On the other hand, Beijing witnessed a jump in the covid numbers during the weekend and recalled some of the virus-led activity restrictions together with the mass testing. Shanghai is on the same line. Recently, Beijing’s local government spokesman Xu Heijian mentioned that a covid outbreak linked to a bar in Beijing is ferocious. Furthermore, comments suggesting fresh US-China tussles over Taiwan also probe XAU/USD bulls.
Amid these plays, Wall Street slumped and the US Treasury yields rallied which in turn propelled the US dollar’s safe-haven demand. That said, the S&P 500 Futures drop 1.0% whereas the US 10-year Treasury bond yields remain mostly unchanged around 3.16% at the latest.
Moving on, gold traders can pay attention to the risk catalysts ahead of Wednesday’s Federal Open Market Committee (FOMC). Should the Fed manage to keep the bulls happy, the XAU/USD prices are likely to reverse the latest gains.
Technical analysis
Gold fails to extend the rebound from one-month-old horizontal support, despite crossing the 200-SMA, as the RSI (14) steps back from overbought territory. Also challenging the metal prices is the three-week-old ascending resistance line, near $1,880 by the press time.
Even if the metal prices manage to cross the $1,880 hurdle, the 50% and 61.8% Fibonacci retracement (Fibo.) of April-May downside, respectively near $1,893 and $1,918, could challenge the XAU/USD buyers.
Alternatively, pullbacks remain elusive until the quote stays beyond the 200-SMA level surrounding $1,853.
Following that, a horizontal area comprising multiple levels marked since May 18, near $1,825-30, will regain the gold seller’s attention. If at all the metal drops below $1,830, the odds of its slump towards the previous month’s low near $1,786 can’t be ruled out.
Gold: Four-hour chart

Trend: Pullback expected
- The DXY has registered a fresh three-week high at 104.36 on soaring inflationary pressures.
- Higher US CPI has unfolded the chances of a rate hike by 75 bps by the Fed.
- Weak Michigan CSI displays that inflation has dented the confidence of consumers.
The US dollar index (DXY) is advancing sharply higher as soaring price pressures have infused fresh blood into the asset. The DXY has breached above its previous consolidation range, which placed in a narrow range of 104.04-104.21 on Friday after an initiative buying structure near 103.12.
A 75 bps interest rate hike looks likely
The release of the US Consumer Price Index (CPI) at 8.6%, above the expectations, has opened doors for a rate hike announcement by 75 basis points (bps). The Federal Reserve (Fed) has already hiked its interest rates by 25 bps and 50 bps in March and May’s monetary policy announcements respectively. However, no effect has been witnessed yet although price pressures are still soaring higher. Therefore, the Fed will deploy its all quantitative weapons to tighten the policy and corner the inflation.
Weak Michigan Consumer Sentiment Index (CSI)
The University of Michigan reported the Michigan CSI on Friday at 50.2, significantly lower than the consensus of 58 and the prior print of 58.4. Higher price pressures have dampened the confidence of the consumers in the economy, which could hammer the DXY going forward.
Key events this week: Producer Price Index, Retail Sales, Building permits, Initial Jobless Claims.
Major events this week: Fed interest rate decision, Eurogroup meeting, Swiss National Bank (SNB) interest rate decision, Bank of England (BOE) interest rate, Bank of Japan (BOJ) rate decision.
| Pare | Closed | Change, % |
|---|---|---|
| AUDUSD | 0.70438 | -0.78 |
| EURJPY | 141.366 | -0.92 |
| EURUSD | 1.05211 | -0.91 |
| GBPJPY | 165.411 | -1.49 |
| GBPUSD | 1.23111 | -1.48 |
| NZDUSD | 0.63534 | -0.52 |
| USDCAD | 1.27818 | 0.66 |
| USDCHF | 0.98724 | 0.7 |
| USDJPY | 134.364 | -0.01 |
- EUR/USD stays offered for the third consecutive day, drops to fresh monthly low.
- Clear break of 200-SMA, bearish MACD signals favor sellers.
- Oversold RSI (14) could join nearby key support to probe bears.
EUR/USD takes offers to renew a multi-day low around 1.0490, printing a three-day downtrend during Monday’s Asian session.
The major currency pair’s latest weakness could be linked to the sustained trading below the 200-SMA, as well as bearish MACD signals.
However, oversold RSI conditions may restrict the pair’s further declines, which in turn highlight the 1.5-month-old horizontal support zone around 1.0470-60.
Should the EUR/USD prices drop below 1.0460, the 1.0420 level may offer an intermediate halt during the south-run targeting May’s low of 1.0349.
Alternatively, the corrective pullback may initially aim for the 61.8% and 50% Fibonacci retracements of May 13-30 upside, respectively around 1.0515 and 1.0570.
Following that, the 200-SMA level of 1.0600 will be crucial to watch. It’s worth noting that a steeper descending trend line from Thursday joins the 61.8% Fibonacci retracement level to increase the strength of the 1.0515 immediate hurdle.
EUR/USD: Four-hour chart

Trend: Limited downside expected


© 2000-2026. All rights reserved.
This site is managed by Teletrade D.J. LLC 2351 LLC 2022 (Euro House, Richmond Hill Road, Kingstown, VC0100, St. Vincent and the Grenadines).
The information on this website is for informational purposes only and does not constitute any investment advice.
The company does not serve or provide services to customers who are residents of the US, Canada, Iran, The Democratic People's Republic of Korea, Yemen and FATF blacklisted countries.
Making transactions on financial markets with marginal financial instruments opens up wide possibilities and allows investors who are willing to take risks to earn high profits, carrying a potentially high risk of losses at the same time. Therefore you should responsibly approach the issue of choosing the appropriate investment strategy, taking the available resources into account, before starting trading.
Use of the information: full or partial use of materials from this website must always be referenced to TeleTrade as the source of information. Use of the materials on the Internet must be accompanied by a hyperlink to teletrade.org. Automatic import of materials and information from this website is prohibited.
Please contact our PR department if you have any questions or need assistance at pr@teletrade.global.
transfers