- Analytics
- News and Tools
- Market News
CFD Markets News and Forecasts — 25-11-2022
- The US Dollar stages a recovery on risk aversion spurred by the China Covid-19 crisis.
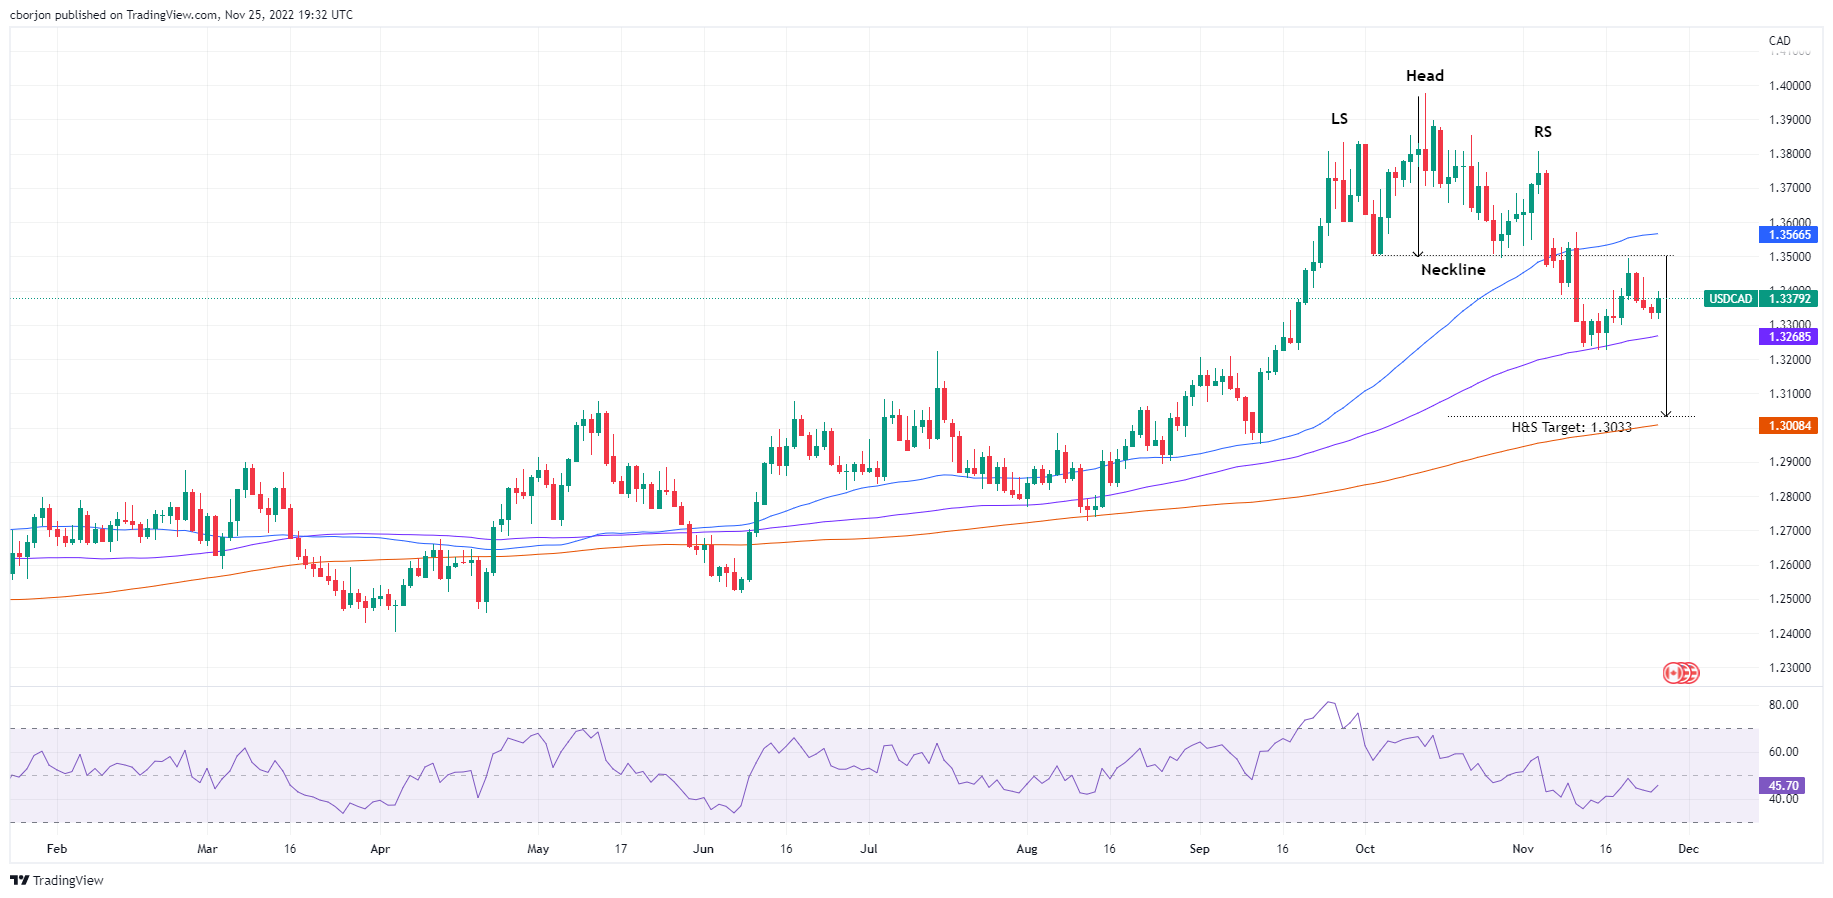
- USD/CAD bounced off weekly lows around 1.3300 and tested the 1.3400 mark.
- USD/CAD Price Analysis: The head-and-shoulders chart pattern remains intact.
The US Dollar (USD) stages a recovery against the Canadian Dollar (CAD) amid a subdued trading session sparked by thin liquidity conditions caused by the observance of the US Thanksgiving holiday. However, China’s Covid-19 cases jumping above 30,000 spurring a risk-off impulse, and US Treasury yields rising, underpinned the USD. At the time of writing, the USD/CAD is trading at 1.3376
USD/CAD Price Analysis: Technical outlook
Delving into the USD/CAD daily chart, the major erased Thursday’s losses, though it faltered to crack the 1.3400 figure after reaching a daily high of 1.3398. Although the US Dollar is buoyant, traders should know that the head-and-shoulders chart pattern is still in play. However, the USD/CAD needs to tumble below 1.3300 and the 100-day Exponential Moving Average (EMA) at 1.3268 to exacerbate a fall toward the head-and-shoulders chart pattern. Otherwise, the USD/CAD might jump above the 1.3500 neckline and invalidate the pattern.
As an alternate scenario, the USD/CAD first resistance would be the 1.3400 figure. A breach of the latter will send the USD/CAD climbing toward the confluence of the head-and-shoulders neckline and the 1.3500 psychological level, followed by the 50-day Exponential Moving Average (EMA) at 1.3566.
USD/CAD Key Technical Levels
- The Pound Sterling drops below 1.2000, set to finish the week with gains of more than 1.50%.
- GBP/USD: Failure to hold above 1.2100 exacerbated a fall toward the November 24 low of 1.2049.
- GBP/USD Price Analysis: A break below 1.2000 will exacerbate a fall towards 1.1800.
The GBP/USD hovers below 1.2100 amid a subdued trading session on low volume conditions spurred by the US Thanksgiving holiday, with the US equity market set to close on Friday, around 13:00 ET. Broad US Dollar (USD) strength spurred by a risk-off impulse caused a retracement on the GBP/USD. At the time of writing, the GBP/USD is trading at 1.2079, registering a minuscule loss of 0.27%.
GBP/USD Price Analysis: Technical outlook
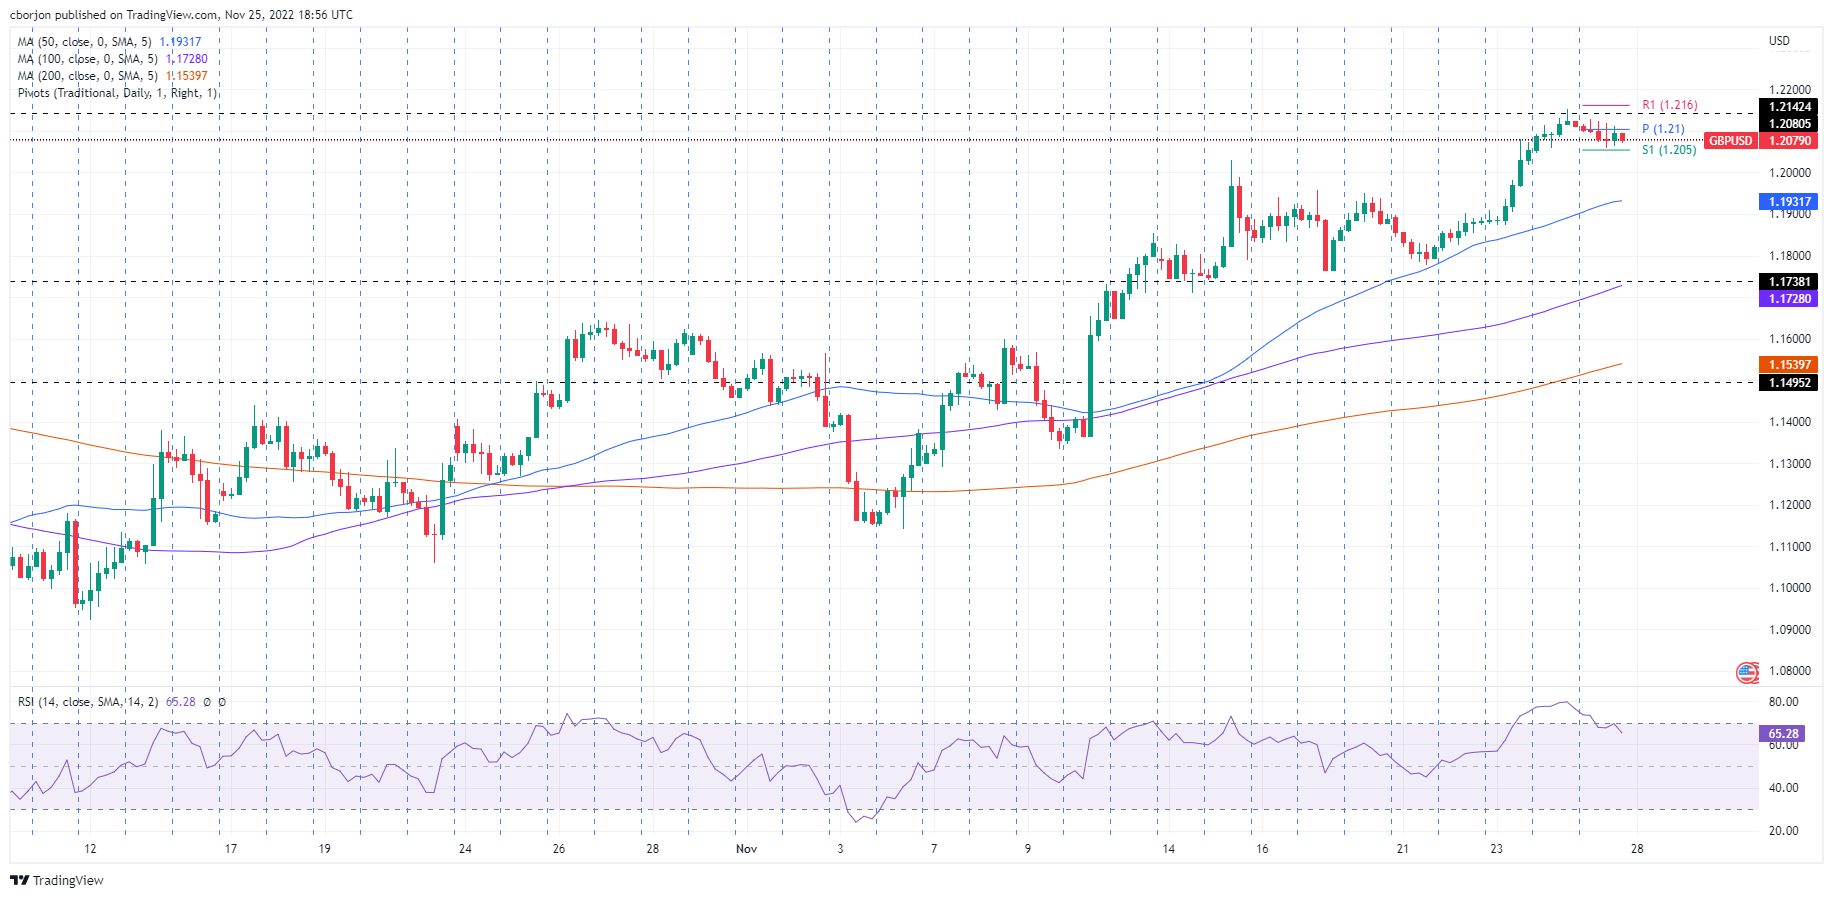
From a daily chart perspective, the GBP/USD remains neutral-upward biased, though lacking the force to break above the 200-day Exponential Moving Average (EMA) around 1.2181. November’s monthly high of around 1.2153 was shy of piercing the latter. Therefore, the GBP/USD would be subject to selling pressure, opening the door for further downside.
The GBP/USD 4-hour chart suggests that the major appears to be topping around the 1.2150 area in the near term, failing to break above the August 17 daily high of 1.2142, exacerbating a drop below 1.2100. Also, the Relative Strength Index (RSI) exiting from overbought conditions after peaking around 1.2150, which could mean two things: traders booking profits after a fall towards multi-decade lows around 1.0300 towards 1.2000, and also some US Dollar (USD) short covering.
Therefore, the GBP/USD path of least resistance is downwards. GBP/USD first support would be the S1 daily pivot point at 1.2050. Break below will expose the 1.2000 figure, followed by the 50-Exponential Moving Average (EMA) at around 1.1931.
GBP/USD Key Technical Levels
- China’s coronavirus crisis weighs on WTI price, on speculations of lower demand.
- The Eurozone threatening to impose a cap on Rusian and a buoyant US Dollar keeps WTI defensive.
- WTI Price Analysis: A daily close below $80.00 could pave the way for a YTD low re-test.
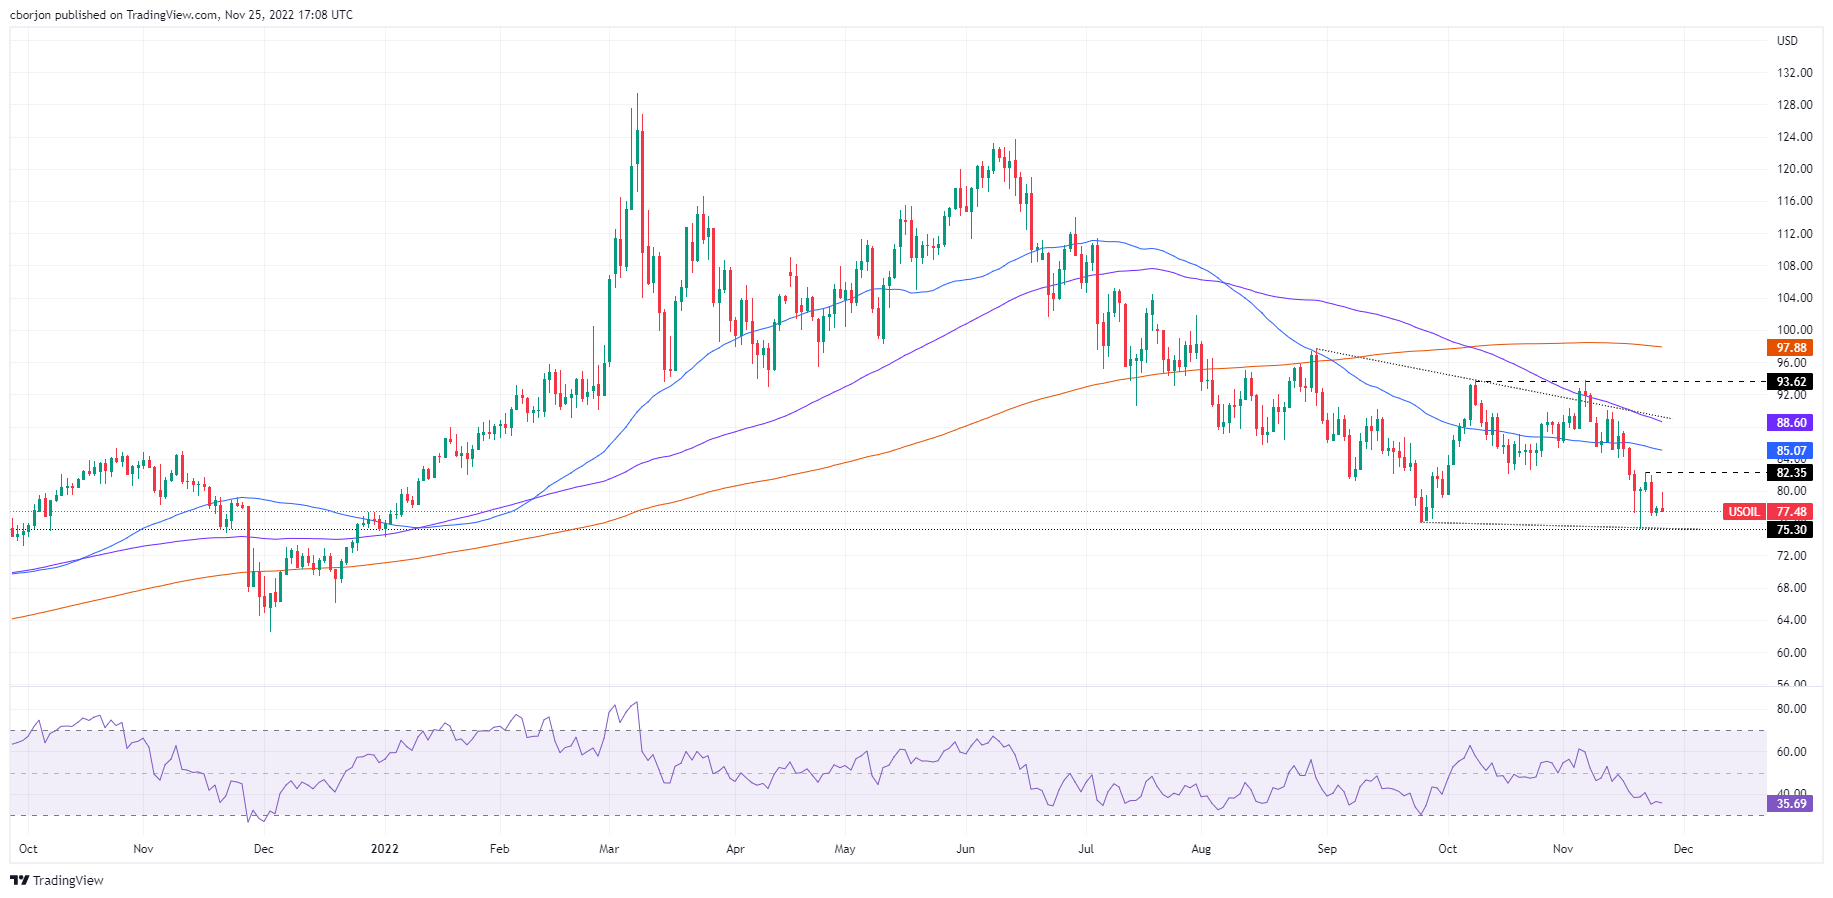
Western Texas Intermediate (WTI), the US crude oil benchmark, remains moderately negative due to low demand concerns surrounding the crude oil market. Factors like ongoing China’s Covid-19 outbreak and reports emerging during the week for increased crude output keep the WTI price stable. At the time of writing, WTI exchanges hands around $77.46 PB
Investors’ sentiment is mixed, in part spurred by thin liquidity conditions amid a shortened week due to the US Thanksgiving holiday. Additionally, China’s registering high number of Covid-19 cases would dent demand for the black gold, weighed on WTI price.
Newswires reported that cases peaked around 31,987 on Thursday, up from Wednesday’s 29,754. At the beginning of the week, Chinese authorities revealed measures to relax Covid-19, aiming to be less restrictive. Still, officials in some cities are again reimposing stricter measures and ordering lockdowns as they scramble to suppress the virus.
Aside from this, reports that the European Union continues its discussions to impose a price cap to Russian oil, between $65 to $70 per barrel, depressed oil prices.
Additionally, the US Dollar (USD) appreciated Friday as some short covering speculation surrounded the market. The US Dollar Index (DXY), a gauge of the greenback’s value against a basket of six peers, climbs 0.36%, up at 106.000.
WTI Price Analysis: Technical outlook
After reaching a weekly high of $82.35 PB on Tuesday, WTI prolonged its losses throughout the week. Of note, WTI falling below $80.00 PB opened the door for further downside and might test the November 21 low of $75.30 if some fundamental reasons increased uncertainty about oil demand. Notably, the Relative Strength Index (RSI) continues to fall further, meaning that sellers are gathering momentum.
Therefore, WTI’s path of least resistance is downwards. WTI’s first support would be $77.00. Break below will expose the November 21 low of $75.30, which, once cleared, could send the WTI price tumbling toward its YTD low of $74.30.
The Bank of Canada (BoC) could be near the end of the interest rate hike cycle, point out analysts at RBC Capital Markets. They consider the BoC will hike by 25 basis points in December.
Key Quotes:
“Canada looks on track to deliver a GDP reading next week that’s just above our 1% (annualized) forecast for Q3. Still, that’s a marked slowdown from the 3.2% average rate over the first half of 2022—a figure that captured much of the initial “reopening” rebound in economic activity as pandemic restrictions eased. Growth in household consumption of services continued to rise in Q3 (based on our own tracking of consumer purchases) but the pace nevertheless slowed after surging more than 16% in Q2.”
“Though labour markets surged back in October, average employment growth still slowed to under 10,000 per month over the last half a year (following softer numbers in the summer and early fall). We are looking for a smaller 5,000 position increase in employment in November and a tick up in the unemployment rate (though to a still very low 5.3% rate from 5.2% in October).”
“Slowing growth prospects and early signs of easing inflation pressures over the past months are all supportive of the view that the Bank of Canada could be close to the end of its current interest rate hiking cycle with our own base case assumption calling for one more 25 basis point increase in the overnight rate in December.”
- Silver falls modestly on Friday, holds above key support levels.
- Technical outlook presents a bullish bias but upside seems limited while under $21.50.
- Break under $20.85 likely to increase bearish pressure.
Silver is falling on the last day of the week. It bottomed during the American session at $21.14 and then quickly bounced back above $21.30, as the correction from the one-week top around $21.70 faded. It is headed toward a weekly gain of 2%.
From a technical perspective, the XAG/USD, has managed to remains above the 210-day Simple Moving Average (SMA) that stands at 20.90. The chart appears to favor the upside at the moment. The area around $20.85/20.90 has become a critical support for that bullish perspective to hold.
A decline below $20.85 could trigger more losses exposing the mid-November intraday low at $20.56. Below the next target is seen at $20.25. Attention then is set on the $19.95/20.00 barrier.
A convincing breakout above $21.50 should open the doors to more gains. The next resistance area is in the $21.65/70 region followed by the $22.00 mark. The five-month high awaits at $22.26.
The XAG/USD is about to post a weekly gain of 2% and technical indicators favor the upside. Price is facing resistance at the 55-week SMA at $21.90. A weekly close above might clear the way to the 100-week SMA at $23.45.
Silver daily chart
-638049873411062313.png)
Technical levels
Recent weakness in the USD saw Gold price testing $1,780. But the Federal Reserve’s commitment to bringing inflation down with tighter monetary policy leaves room for gains in the greenback, strategists at ANZ Bank report.
Fed to hike another 100 bps
“Softer than expected inflation in the US triggered a sell-off in the US Dollar, pushing Gold higher. Nevertheless, inflation remains well above the central bank’s target range of 2%. This leaves room for more tightening until inflation slows considerably.”
“US benchmark yields are rising and likely to move higher given the view of another 100 bps rate hike by the Fed. Investment demand is stabilising, with slowing ETF outflows and covering of short positions.”
“Physical demand for Gold is weakening, though central bank purchases remain strong.”
- The Australian Dollar is on the defensive due to mixed sentiment.
- Federal Reserve: US growth risks are skewed to the downside, capping the US Dollar gains.
- Next week: RBA and Fed officials’ speeches will give direction to the AUD/USD.
The Australian Dollar (AUD) losses ground vs. the US Dollar (USD) amid a mixed sentiment, with US equities wavering due to Federal Reserve (Fed) officials moderating the increase of borrowing costs,. At the same time, China’s Covid-19 cases breaking the 30K threshold keep investors on their toes. Also, after observing the Thanksgiving holiday in the United States (US), thin liquidity conditions exaggerate market movements. Therefore, the AUD/USD is trading at 0.6743, below its opening price by 0.28%.
Mixed sentiment keeps the AUD on the defensive
European and US equities are fluctuating. The lack of a fundamentals catalyst around the AUD/USD pair keeps traders digesting the Federal Reserve’s last meeting minutes. Policymakers judging that “slowing in the pace of increase would likely soon be appropriate” sparked a rally in risk-perceived assets that lasted until the day before US Thanksgiving. The US Dollar is staging a recovery against most G8 currencies, as shown by the US Dollar Index (DXY) gaining 0.57% at 106.238.
Delving into the minutes, Fed officials commented that growth risks in the United States are skewed to the downside. Therefore, Thursday’s US S&P Global PMIs for October flashed signs that the US economy is slowing down as the indices tapped into contractionary territory, a tailwind for the Australian Dollar, with the AUD/USD reaching a weekly high of 0.6780.
Nevertheless, the sentiment is fragile, as China’s Covid-19 cases broke the 30,000 threshold. According to Bloomberg, “Almost every district is seeing targeted lockdowns,” and residents have been asked not to leave Beijing unless necessary. That said, traders moved into safety, with flows exiting high-beta currencies like the AUD, flowing towards the safe-haven status of the greenback.
What to watch
Ahead in the economic calendar, Australia’s docket for the next week will feature speeches by the Reserve Bank of Australia (RBA) Governor Philip Lowe and Governor Kearns. Data-wise, Building Permits, Manufacturing PMIs, and Retail Sales would shed direction on the Australian economy.
On the US front, the US front, Fed speaking would dominate the headlines. On the side of the economic indicator, the Federal Reserve’s favorite gauge of inflation, the PCE, PMIs, and labor market data, would entertain AUD/USD traders.
AUD/USD Key Technical Levels
Economists at Commerzbank have changed their EUR/USD forecast. The pair is now expected to reach the 1.10 level in the coming year.
Not another USD year
“With the Fed's expected interest rate turnaround, this is unlikely to remain the case in 2023.”
“If the ECB refrains from cutting interest rates next year – as we expect – the Euro could look less unattractive than this year.”
“Our EUR/USD price target for 2023 is 1.10.”
See: EUR/USD may get a big boost from rate moves in Q1 – SocGen
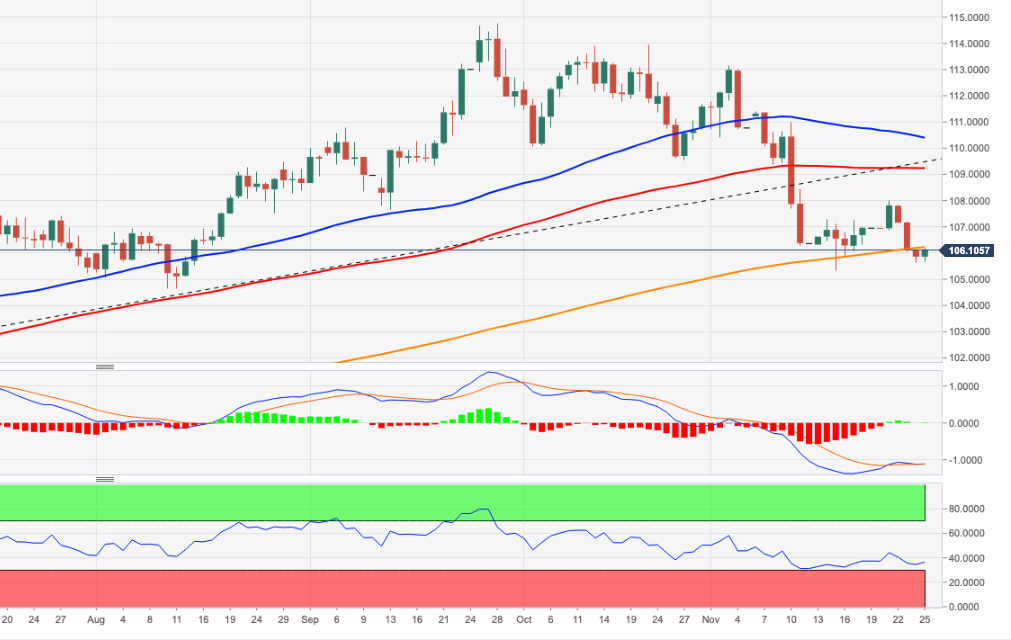
- Japanese yen weakens amid higher government bond yields.
- US Dollar Index rises 0.55% on a quiet low-volume session.
- USD/JPY heads for weekly loss despite Friday’s gains.
The rally of USD/JPY was capped by the 139.50/60 area. Near the end of the week, the pair holds firm above 139.00 supported by rising sovereign bond yields as Wall Street posts gains.
Yen down as yields move up
The Japanese yen fell across the board on Friday, weakened by rising bond yields. The US 10-year bond yield rose to 3.75%, a two-day high while the German 10-year climbed to 1.98%. In Wall Street, the Dow Jones was up by 0.46% and the Nasdaq was falling by 0.29% on a shortened session.
The US Dollar Index was up 0.55% on Friday, but still headed toward the lowest weekly close since mid-August affected by the less hawkish FOMC minutes. Next week, attention will be on the Non-farm payrolls report due on Friday.
Firm below the weekly 20-SMA
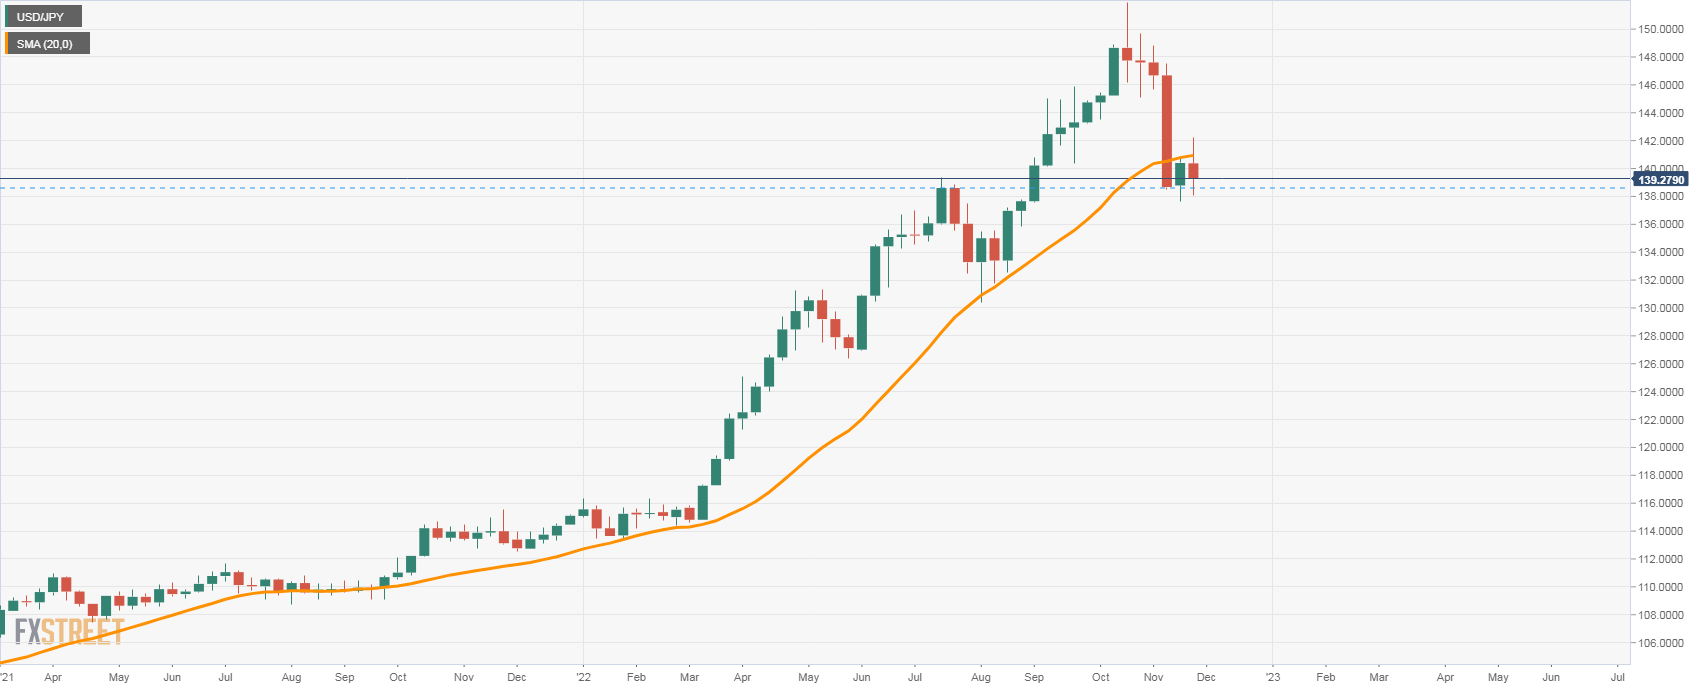
The USD/JPY is about to post a weekly loss of a little more than one hundred pips. During the week it traded as high as 142.24, but then pulled back under the 20-week Simple Moving Average (SMA) that stands at 140.90.
The pair continues to move around 140.00, away from the multi-decade high it hit on October. The declines so far have been contained above 137.50. A daily close below 138.50 would increase the bearish pressure.
USD/JPY weekly chart
Technical levels
The Silver Institute and Metals Focus published new figures showing supply and demand in the global Silver market a week ago. Accordingly, strategists at Commerzbank expect the precious metals to enjoy a substantial up move.
Supply deficit on Silver market due to record-high demand
“Silver demand is set to surge to a record 1.21 billion ounces (37,600 tons) this year. This constitutes a very solid 16% year-on-year increase.”
“For the silver ETFs, which do not count towards physical demand, the Silver Institute and Metals Focus anticipate outflows of 110 million ounces. By contrast, Silver supply is set to grow by only 2% to 1.017 billion ounces (31,600 tons). The Silver market is therefore expected to show a physical supply deficit of 194 million ounces (6,000 tons).”
“The performance of the Silver price does not adequately reflect these figures, as it has fallen by just shy of 8% since the beginning of the year. We therefore envisage substantial upside potential for Silver.”
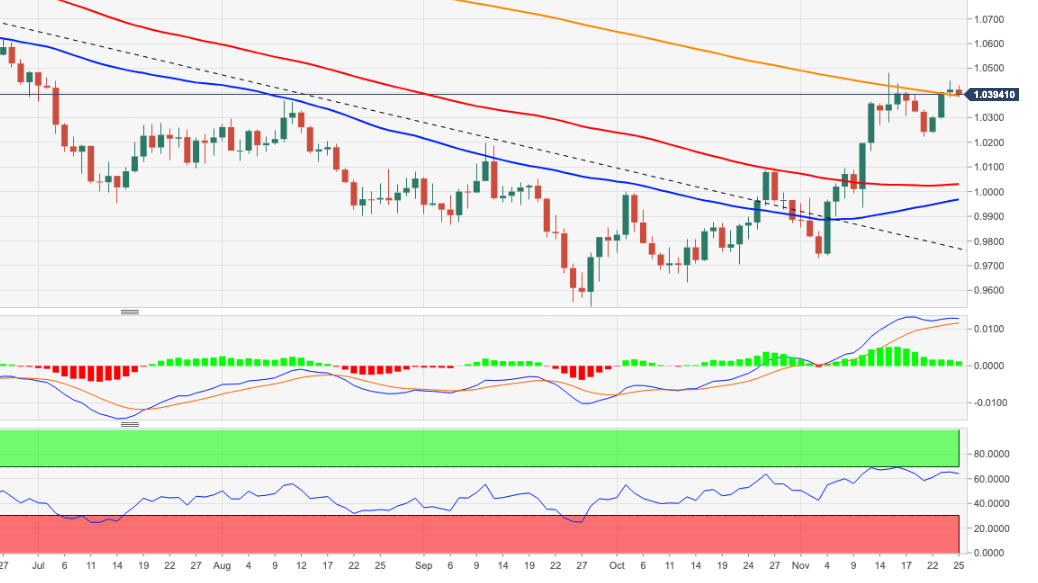
EUR/USD slips back to the sub-1.0400 area at the end of the week. Economists at Nordea believe that the pair has limited upside potential.
Investors are positioned for a higher EUR/USD
“We believe that EUR/USD will be range bound in the weeks to come.”
“When looking at technicalities it would seem the upside in EUR/USD is capped as the cross has risen close to the 200-Day Moving Average, which is a solid resistance level. Moreover, the 14 day Relative Strength Index is close to 70, a level suggesting the USD is oversold against the EUR.”
“From a fundamental perspective, two-year interest rate differentials between EUR and USD argues for lower EUR/USD, while investors are positioned for a higher EUR/USD.”
- The index extends the recovery past the 106.00 hurdle.
- Higher US yields also prop up the upside momentum.
- The mood in the risk complex appears depressed on Friday.
The USD Index (DXY), which measures the greenback vs. a bundle of its main competitors, manages to advance further north of the 106.00 yardstick at the end of the week.
USD Index regains 106.00 and above
The soft tone in the risk-linked galaxy lends much-needed oxygen to the buck and sponsors quite a marked bounce in the index from as low as the 105.60 region recorded in the previous session.
Also supporting the corrective move in the dollar appears the decent uptick in US yields across the curve, which at the same time manage to regain some composure following the post-Minutes weakness.
What to look for around USD
The weekly leg lower in the dollar seems to have met some contention around 105.60 (November 24), triggering a mild rebound afterwards in line with some profit taking stance in the risk-associated universe.
While hawkish Fedspeak maintains the Fed’s pivot narrative in the freezer, upcoming results in US fundamentals would likely play a key role in determining the chances of a slower pace of the Fed’s normalization process in the short term.
Key events in the US this week: Early markets close (Friday).
Eminent issues on the back boiler: Hard/soft/softish? landing of the US economy. Prospects for further rate hikes by the Federal Reserve vs. speculation of a recession in the next months. Fed’s pivot. Geopolitical effervescence vs. Russia and China. US-China persistent trade conflict.
USD Index relevant levels
Now, the index is advancing 0.68% at 106.34 and faces the immediate resistance at 107.99 (weekly high November 21) followed by 109.15 (100-day SMA) and then 110.48 (55-day SMA). On the other hand, the breakdown of 105.34 (monthly low November 15) would open the door to 105.32 (200-day SMA) and finally 104.63 (monthly low August 10).
Though the Gold price has recovered somewhat from its setback, the yellow metal has no upside potential for now, in the view of strategists at Commerzbank.
No end in sight to the rate hikes in the US
“We do not envisage any further potential for recovery in the short term.”
“After all, the US labour market (report due to be published on Friday) is presumably still so tight that any end to the rate hike cycle in the US remains uncertain.”
“Rising interest rates have a braking effect on Gold, being a non-interest-bearing investment.”
- GBP/USD retreats from a multi-month high amid a modest pickup in the USD demand.
- An uptick in the US bond yields prompts some USD short-covering amid thin trading.
- Bets for less aggressive Fed rate hikes might cap the buck and lend support to the pair.
The GBP/USD pair edges lower on Friday and moves away from its highest level since August 12, around the 1.2150-1.2155 region touched on Thursday. The pair remains on the defensive through the early North American session and is currently placed near the daily low, around the 1.2065-1.2060 region.
As investors digest Wednesday's dovish FOMC meeting minutes, the US Dollar attracts some buyers on the last day of the week and acts as a headwind for the GBP/USD pair. A modest uptick in the US Treasury bond yields turns out to be a key factor prompting some short-covering around the buck amid relatively thin trading conditions. Apart from this, the attempted USD recovery lacks any obvious fundamental catalyst and runs the risk of fizzling out rather quickly.
Investors seem convinced that the Federal Reserve will slow the pace of its policy tightening and have now fully priced in a relatively smaller 50 bps rate hike at the December meeting. This is likely to act as a headwind for the US bond yields. apart from this, a generally positive risk tone might further contribute to capping the upside for the safe-haven greenback. This, in turn, should lend some support to the GBP/USD pair and help limit deeper losses.
Furthermore, firming expectations that the Bank of England will continue to raise borrowing costs to combat stubbornly high inflation. This might underpin the British Pound and supports prospects for the emergence of some dip-buying around the GBP/USD pair. In the absence of any relevant economic data, the fundamental backdrop warrants caution before positioning for any further slide. Nevertheless, spot prices remain on track to post gains for the third straight week.
Technical levels to watch
EUR/USD consolidates above the 200-Day Moving Average (DMA) at 1.0380. A weekly close above here would add bullish potential, economists at Scotiabank report.
EUR to remain well-supported on modest dips
“Intraday trading patterns show the EUR edging towards a test of the Nov uptrend at 1.0380, a break below which may undercut some of the positive sentiment that has developed around the EUR over the past few weeks.”
“We look for the EUR to remain well-supported on modest dips.”
“A weekly close above the 200DMA (1.0380) will add to the EUR’s bullish momentum.”
- USD/CAD bounces off the weekly low touched earlier this Friday, though lacks follow-through.
- An uptick in the US bond yields revives the USD demand and offers some support to the major.
- A goodish pickup in Oil prices underpins the Loonie and keeps a lid on any meaningful recovery.
The USD/CAD pair attracts some buying near the 1.3315-1.3320 region and stages a modest recovery from a fresh weekly low touched earlier this Friday. The pair sticks to its gains around the 1.3350 region through the early North American session and for now, seems to have snapped a three-day losing streak, albeit lacks bullish conviction.
A modest uptick in the US Treasury bond yields helps the US Dollar to gain some positive traction on the last day of the week, which, in turn, is seen offering some support to the USD/CAD pair. That said, growing acceptance that the Fed will slow the pace of its policy tightening is holding back the USD bulls from placing aggressive bets and capping the upside for the major.
It is worth recalling the November Federal Open Market Committee (FOMC) meeting minutes released on Wednesday revealed that officials were largely satisfied they could stop front-loading the rate increases. This, in turn, reaffirms bets for a relatively smaller 50 bps rate hike at the next FOMC policy meeting in December. Apart from this, a generally positive risk tone keeps a lid on the safe-haven Greenback.
Furthermore, a goodish pickup in Crude Oil prices underpins the commodity-linked Loonie and further acts as a headwind for the USD/CAD pair amid relatively thin trading volumes. In the absence of any major market-moving economic release, either from the US or Canada, the fundamental backdrop warrants some caution before positioning for any further intraday positive move.
Technical levels to watch
USD/CAD holds range above 1.33. Economists at Scotiabank expect the pair to test the low-1.33s.
Technical undertone remains negative
“Short-term trading patterns show the USD finding good support on minor dips to the 1.3315/20 zone over the past 24 hours and a snap higher in European trade has put a positive print on the intraday chart for the USD from around that point. But upside potential looks pretty limited, with evidence of better USD selling pressure emerging around or above 1.34 in recent days.”
“More generally, the USD appears to be consolidating ahead of another push lower (bear flag pattern); key support is 1.3320 intraday and resistance is 1.3395/00.”
- EUR/USD comes under pressure and returns to the sub-1.0400 area.
- Immediately to the upside emerges the November peak at 1.0481.
EUR/USD faces some selling pressure and slips back to the area below the 1.0400 mark at the end of the week.
A close above the key 200-day SMA, today at 1.0386, in a convincing fashion is needed to shift the pair’s outlook to positive and thus allow for extra gains to potentially visit the November high at 1.0481 (November 15) in the short-term horizon.
The surpass of the latter could put the round level at 1.0500 back on the investors’ radar.
EUR/USD daily chart
- DXY partially sets aside the recent sharp sell-off and regains 106.00.
- The 200-day SMA near 105.30 continues to emerge as a tough support.
DXY finally regains the smile and retakes the area above the 106.00 barrier after three daily drops in a row on Friday.
There is a solid contention area near 105.30, where the November low and the 200-day SMA converge.
In the meantime, the downside pressure in the index is expected to mitigate somewhat once the weekly high at 107.99 is cleared (November 21). Extra gains from here should meet the 100-day SMA at 109.15 ahead of the 9-month resistance line near 110.00.
While above the 200-day SMA at 105.32, the outlook for the index should remain constructive.
DXY daily chart
GBP/USD holds just under week’s high as uptrend is sustained. Economists at Scotiabank expect Cable to remain on solid foot.
GBP rally to remain positive while 1.1995 holds
“We continue to think the GBP has staged a strong enough rebound from the Sep all-time low for gains to be sustainable for now, at least; fiscal policy has been stabilized and market confidence has steadied which should allow the Pound to hold around 1.20 or a little better moving ahead.”
“The Pound’s gains have been supported by solid trend strength signals on the intraday and daily chart but the longer run studies suggest a fair degree of residual bearish momentum is intact, making it a bit harder work for the GBP to rally at the moment. Trends are, however, positive and we look for the GBP rally to remain positive while the Nov bull trend holds (support at 1.1995 currently).”
“Gains through 1.2155 (this week’s high) point to a resumption of the push higher.”
- Gold price retreats from the weekly high set on Friday and is pressured by a combination of factors.
- An uptick in US Treasury bond yields.US Dollar bounce and a positive risk tone undermine the metal.
- Bets for less aggressive rate hikes by Federal Reserve help limit any further losses for the XAU/USD.
Gold price retreats from a fresh weekly high touched earlier this Friday and remain on the defensive through the mid-European session. The XAU/USD is currently placed just above the $1,750 level and for now, seems to have snapped a three-day winning streak. The downtick, however, lacks follow-through and warrants caution before confirming that a two-day-old up trend from the $1,725 region, or a nearly two-week low touched on Wednesday, has run out of steam.
Modest US Dollar uptick and a positive risk tone weigh on Gold price
The US Dollar attracts some buying amid a modest uptick in the US Treasury bond yields, which, in turn, is seen as a key factor acting as a headwind for the Dollar-denominated Gold price. Apart from this, a generally positive tone around the equity markets seems to dent demand for the safe-haven XAU/USD. That said, firming expectations for a less aggressive policy tightening by the Federal Reserve keeps a lid on any meaningful gains for the USD and helps limit the downside for the non-yielding yellow metal.
Dovish signals by Federal Reserve act as a tailwind for Gold price
In fact, the November Federal Open Market Committee (FOMC) meeting minutes released on Wednesday showed that officials were largely satisfied they could stop front-loading the rate increases. The dovish signal validated the peak inflation narrative and reaffirmed bets for a relatively smaller 50 bps rate hike at the next FOMC policy meeting in December. This, in turn, dragged the yield on the benchmark 10-year US government bond to its lowest level since early October, which, in turn, should cap the US Dollar.
China’s COVID-19 woes contribute to limiting losses for Gold price
Furthermore, the worsening COVID-19 situation in China and the imposition of fresh lockdowns might also lend some support to the safe-haven XAU/USD. In the absence of any major market-moving economic releases, traders might also refrain from placing aggressive bets around Gold price amid relatively lighter trading volumes on the last day of the week. Nevertheless, the precious metal remains on track to post modest weekly gains as the focus shifts to next week's important US macro releases, including the closely-watched NFP report.
Traders now look to next week’s key US macro data for a fresh impetus
Apart from this, traders will take cues from the Prelim Q3 GDP report on Wednesday and Core PCE Price Index - the Fed's preferred inflation gauge on Thursday. This, along with Federal Reserve Chair Jerome Powell's speech, will play a key role in influencing the near-term US Dollar price dynamics and provide a fresh directional impetus to Gold price.
Gold price technical outlook
From a technical perspective, any subsequent slide below the $1,750 level now seems to find decent support near the $1,736-$1,735 region. The next relevant support for Gold price is pegged near the $1,725 zone, or a nearly two-week low touched on Wednesday. A convincing break below the latter might prompt some technical selling and drag spot prices further towards the $1,700 round-figure mark.
On the flip side, the $1,760-$1,762 area now seems to have emerged as an immediate hurdle. Some follow-through buying will be seen as a fresh trigger for bulls and lift Gold price to the $1,772 intermediate barrier. The momentum could get extended towards the $1,778 zone en route to the $1,786 region, or the highest level since mid-August touched earlier this month.
Key levels to watch
- EUR/JPY leaves behind three consecutive daily pullbacks on Friday.
- Next on the upside appears the weekly high above 146.13.
EUR/JPY bounces off weekly lows and regains some composure above the 145.00 barrier at the end of the week.
Considering the ongoing rebound, the cross now faces an interim resistance at the weekly high at 146.13 (November 23). The break above the latter exposes a potential move to the November tops past the 147.00 level.
In the longer run, while above the key 200-day SMA at 138.76, the positive outlook is expected to remain unchanged.
EUR/JPY daily chart

A further unwinding of long US Dollar positioning remains the risk, but economists at ING think the US Dollar Index is getting close to some decent support levels.
US Dollar approaching support levels
“Buy-side surveys taken right before the big sell-off on 10/11 November still had long Dollar positions as 'the most crowded trade' and saw the Dollar as the most over-valued on record. We doubt those views will have changed that much and the buy-side will now be eager to sell any USD rallies, believing the Dollar may well have peaked. That may be the case, but we doubt conditions will be in place for a major USD bear trend.”
“We think DXY has strong support near 105.00, marking the 200-Day Moving Average, important lows in early August and a big 38.2% retracement level of the whole rally from summer 2021 (when the Fed started this dollar rally with its more hawkish Dot Plots).”
“For those needing to buy US Dollars, DXY levels near 105 may be as good as any.”
The Euro is getting ahead of itself, but that may continue, according to Kit Juckes, Chief Global FX Strategist at Société Générale.
There is definitely some year-end short-covering lifting the Euro
“We expect the 10-year US-German yield differential to narrow from 180 to 115 bps by the end of Q1, and the 2-year rate differential to narrow from 190 bps to under 1%. The last time we saw those kinds of rate/yield differentials EUR/USD was above 1.15 which is where it will be by the end of Q1 if it goes on rallying at anything like the rate it has since hitting 0.95 at the end of September!”
“The caveat is that the correlation between rate differentials and EUR/USD has been awful recently. I’ve had better luck looking at relative growth expectations, but those have stabilized and while market sentiment is improving with regard to Europe, the Euro is overshooting to the upside on that basis.”
“There is definitely some year-end short-covering lifting the Euro, as well as optimism about the energy and geopolitical outlook. It may take us to Christmas but I’m going to try and resist the temptation to revise 2023 forecasts higher on the back of it!”
USD/JPY is now nearly 10% off its high near 152 in late October. The pair could plunge as low as 125-130 next year, analysts at ING report.
Yen set for out-performance into 2023
“If the Dollar is to move lower in 2023, USD/JPY would be the best vehicle to express the view. This is based on the view that the positive correlation between bonds and equities can break down – bonds rally, equities stay soft – and that the US 10-year Treasury yield ends 2023 at around 2.75%. USD/JPY could be trading at 125-130 under that scenario.”
“We now suspect that any Dollar rally between now and year-end stalls at 142/145.”
“In addition, USD/JPY will be facing a change in the ultra-dovish Bank of Japan governor next April – a big event risk for local and global asset markets.”
The South African central bank (SARB) hiked the key rate by 75 basis points to 7%. The Rand is set to remain supported by the central bank, economists at Commerzbank report.
Tight vote and the rate outlook did not seem particularly hawkish
“The SARB’s decision in favour of the third consecutive 75 bps rate step was tight as expected: two of the five board members voted for a smaller step of 50 bps.”
“Even though the SARB adjusted its rate outlook to the upside, it was apparent that just as before the model-based rate level for late 2022 (as well as for consecutive years) was lower than current levels. The levels signal only moderate future rate hikes, about 25 bps for 2023 and less than that for consecutive years. That is likely to have caused disappointment. The SARB also adjusted its growth and inflation projections.”
“The SARB is likely to remain an important pillar of support for the Rand, but in view of still insufficient reform progress in important areas and difficult global financing conditions, its job is not getting any easier.”
- NZD/USD retreats from a multi-month high set on Thursday, though the downside seems limited.
- China’s COVID-19 woes weigh on investors’ sentiment and dent demand for the risk-sensitive Kiwi.
- Bets for less aggressive Fed rate hikes should act as a headwind for the USD and help limit losses.
The NZD/USD pair comes under some selling pressure on Friday and reverses the previous day's positive move to the 0.6300 neighbourhood, or its highest level since August 18. The intraday downtick extends through the first half of the European session and drags spot prices to a fresh daily low, back below mid-0.6200s in the last hour.
Worries about the worsening COVID-19 situation in China keep a lid on the recent optimistic move in the markets and turn out to be a key factor undermining the risk-sensitive Kiwi. In fact, China announced strict curbs in several major cities in the wake of a record-high jump in daily COVID-19 cases. The developments add to concerns about a further slowdown in economic activity and temper investors' appetite for perceived riskier assets.
The downside for the NZD/USD pair, however, is more likely to be limited amid the underlying bearish sentiment surrounding the US Dollar. The November Federal Open Market Committee (FOMC) meeting minutes released on Wednesday revealed that officials were largely satisfied they could stop front-loading the rate increases. This, in turn, reaffirms bets for a 50 bps lift-off in December, which leads to a further slide in the US Treasury bond yields and might continue to weigh on the buck.
Apart from this, an unprecedented 75 bps rate hike by the Reserve Bank of New Zealand (RBNZ) on Wednesday supports prospects for the emergence of some dip-buying around the NZD/USD pair. Hence, it will be prudent to wait for strong follow-through selling before positioning for a deeper pullback amid absent relevant economic data and thin trading volumes. Nevertheless, spot prices remain on track to post gains for the sixth successive week.
Technical levels to watch
The People’s Bank of China (PBOC) cuts banks’ Reserve Requirement Ratio (RRR) by 25 basis points (bps)
The Chinese central bank said the bank’s Reserve Requirement Ratio cut effective as of December 5.
Additional takeaways
Weighted average RRR for financial institutions at 7.8% after the new cut.
New RRR cut will release around 500 bln yuan in long-term liquidity.
Will step up implementation of prudent monetary policy.
Will keep liquidity reasonably ample.
Will not resort to flood-like stimulus.
Market reaction
AUD/USD is unable to capitalize on the PBOC RRR cut, as it feels the pull of gravity on the back of a sudden strength in the US Dollar. The Aussie is losing 0.33% on the day to trade at 0.6732, as of writing.
EUR/USD continues to fluctuate in a narrow range at around 1.0400. The pair could reach 1.05-1.06 next week, according to economists at ING.
The big Dollar story is dominating
“Despite the looming eurozone recession, ECB hawks such as Isabel Schnabel suggest it may be premature to scale back rate increases. Currently, the market prices 61 bps of hikes on 15 December (we expect 50 bps). Clearly, the 50 bps versus 75 bps debate will continue to run.”
“For EUR/USD, it still looks like the big Dollar story is dominating. We cannot rule out a further correction into the 1.05-1.06 region but would see these as the best levels before year-end. These levels could be seen next week should Fed speakers or November US jobs data prove the catalyst.”
UOB Group’s Senior Economist Alvin Liew comments on the latest release of inflation figures in Singapore.
Key Takeaways
“We expected inflation to slow in Oct but the pace of moderation took us by surprise. Headline CPI declined by 0.4% m/m NSA in Oct (versus Bloomberg median forecast of +0.2% m/m and offsetting Sep’s +0.4% m/m jump). That sequential pace of decrease translated into 6.7% y/y for headline CPI inflation in Oct (down from 7.5%), the lowest print in 5 months, matching Jun’s (6.7%).”
“Core inflation (which excludes accommodation and private road transport) continued to rise, but the pace eased, as it came in at +0.1% m/m, 5.1% y/y in Oct (from 0.5% m/m, 5.3% y/y in Sep), matching Aug (2022), and below the Bloomberg median and our expectation of 5.3%. The sources of core inflationary pressures were again broad-based with food inflation continuing strong, while the increases in services, retail & other goods and electricity & gas inflation stayed positive but slowed to varying magnitudes. As for the headline CPI inflation, other than upside to the core CPI, the accommodation costs increase stayed elevated, while private transport costs saw yet another significant moderation, which explains why the headline CPI corrected more than core.”
“Inflation Outlook – Despite the downtick in Oct inflation, the authorities maintained its inflation outlook and forecasts unchanged from the Sep CPI report. We keep our 2022 forecasts unchanged, 6% for headline (or CPI-All Items) and 4.2% for core, and we also maintain our current set of forecasts, for headline inflation to average 5.0% and core inflation to average 4.0% in 2023. Excluding the 2023 GST impact, we expect headline inflation to average 4.0% and core inflation average 3.0% in 2023.”
Riksbank delivered a 75 basis points hike as expected. In the view of economists at Commerzbank, the Swedish Krona has been hit heavily lately, and expect it to regain some ground.
Riksbank stays its course
“Riksbank hiked its key rate by 75 bps to now 2.50%. Riksbank stays its course and is fighting determinedly against inflation. The reason is clear: ‘Inflation is still far is too high’, according to the statement.”
“I stick to my view that it is unfair that SEK was affected so heavily over the past months by elevated risk aversion.”
“Krona should begin to slowly appreciate over the coming quarters, although in view of the major (political) uncertainty, appreciation is likely to be slower than we had previously expected.”
- USD/JPY gains some positive traction and stages a goodish rebound from over a one-week low.
- A positive risk tone is seen undermining the safe-haven JPY and acting as a tailwind for the pair.
- Bets for less aggressive Fed rate hikes keep the USD bulls on the defensive and might cap gains.
The USD/JPY pair attracts some buying on Friday and recovers a part of the previous day's losses to the 138.00 neighbourhood, or a one-and-half-week low. The pair sticks to intraday gains through the first half of the European session and is currently placed near the top end of its daily range, just below the 139.00 mark.
A generally positive tone around the equity markets undermines the safe-haven Japanese yen, which, in turn, is seen as a key factor offering some support to the USD/JPY pair. Apart from this, a more dovish stance adopted by the Bank of Japan is seen weighing on the domestic currency and acting as a tailwind for the major. The uptick, however, lacks bullish conviction and runs the risk of fizzling out rather quickly amid the underlying bearish sentiment surrounding the US Dollar.
The November FOMC meeting minutes released on Wednesday revealed that officials were largely satisfied they could stop front-loading the rate increases and move in smaller steps. This, in turn, cements bets for a 50 bps lift-off at the next FOMC meeting in December and is evident from the ongoing downfall in the US Treasury bond yields. The resultant narrowing of the US-Japan rate differential is benefitting the JPY and keeping a lid on any meaningful recovery for the USD/JPY pair.
Furthermore, a surge in core consumer prices in Japan's capital - to their fastest annual pace in 40 years in November - cast doubt on the BoJ's view that recent cost-push inflation will prove transitory. This might further hold back traders from placing aggressive bullish bets around the USD/JPY pair amid relatively thin trading volumes. This makes it prudent to wait for strong follow-through buying before confirming that spot prices have bottomed out in the near term.
Technical levels to watch
GBP/USD touched its highest level in three months at 1.2155 on Thursday. The Cable could see further gains to the 1.22/23 region, economists at ING report.
EUR/GBP has good support in the 0.8550/8600 area
“We think positioning has played a major role in this Sterling recovery and GBP/USD could see some further, temporary gains to the 1.22/23 area – which we would again see as the best levels before year-end.”
“EUR/GBP has good support in the 0.8550/8600 area and given our view of a difficult risk environment into year-end and early 2023 as central banks raise rates into recessions, Sterling should remain vulnerable.”
- EUR/USD adds to the recent strength above the 1.0400 mark.
- Germany’s final Q3 GDP Growth Rate expanded 1.3% YoY.
- German Consumer Confidence “improved” to -40.2 in December.
The buying pressure remains well and sound around the shared currency and motivates EUR/USD to extend the uptick beyond the 1.0400 mark with some conviction.
EUR/USD: Outlook shifted to bullish?
EUR/USD so far advances for the fourth consecutive session on Friday and looks to consolidate the recent breakout of the 1.0400 barrier as well as the critical 200-day SMA.
On the latter, it is worth noting that the pair has traded below the 200-day SMA since mid-June 2021. A close above this key region (November 24) should shift the pair’s outlook to constructive and therefore allow for extra gains in the short-term horizon.
The better tone in the risk complex also accompanies the move higher in spot, while auspicious results from the German calendar also add to the optimism around the currency.
Indeed, final GDP figures saw the German economy expand 1.3% YoY in the July-September period and 0.4% vs. the previous quarter. In addition, December’s Consumer Confidence tracked by GfK improved a tad to -40.2 (from -41.9).
What to look for around EUR
EUR/USD remains firm and manages well to keep the trade above the 1.0400 hurdle despite some recovery in the dollar and alternating risk appetite trends.
In the meantime, the European currency is expected to closely follow dollar dynamics, geopolitical concerns and the Fed-ECB divergence. In addition, markets repricing of a potential pivot in the Fed’s policy remains the exclusive driver of the pair’s price action for the time being.
Back to the euro area, the increasing speculation of a potential recession in the region - which looks propped up by dwindling sentiment gauges as well as an incipient slowdown in some fundamentals – emerges as an important domestic headwind facing the euro in the short-term horizon.
Key events in the euro area this week: Germany Final Q3 GDP Growth Rate, GfK Consumer Confidence (Friday).
Eminent issues on the back boiler: Continuation of the ECB hiking cycle vs. increasing recession risks. Impact of the war in Ukraine and the persistent energy crunch on the region’s growth prospects and inflation outlook. Risks of inflation becoming entrenched.
EUR/USD levels to watch
So far, the pair is gaining 0.16% at 1.0427 and faces the next up barrier at 1.0481 (monthly high November 15) ahead of 1.0500 (round level) and finally 1.0614 (weekly high June 27). On the flip side, a breach of 1.0222 (weekly low November 21) would target 1.0029 (100-day SMA) en route to 0.9935 (low November 10).
Gold price looks to preserve weekly gains on Black Friday as the US Dollar continues to lick its wounds, FXStreet’s Dhwani Mehta reports.
Gold cheers China’s covid woes
“Black Friday’s partial holiday in the United States following the Thanksgiving Thursday trading will likely leave the US Dollar struggling, keeping the buoyant tone intact around Gold price.”
“The bleak economic outlook for China intensifies worries over its spillover effect on the global economy, bolstering demand for the yellow metal as a traditional safe-haven asset.”
Senior Economist at UOB Group Alvin Liew assesses the latest GDP figures in Singapore.
Key Takeaways
“Singapore’s final 3Q22 GDP came in at 4.1% y/y from 4.5% growth in 2Q22, lower than our call of 4.2% and Bloomberg poll of 4.3%. On a seasonally adjusted basis, 3Q22 GDP rebounded by 1.1% q/q, from -0.1% in 2Q22. Manufacturing sector slowed as anticipated to 0.8% y/y from 5.6% in 2Q22 while services sector outperformed with a 5.8% y/y gain compared to 5.0% in 2Q22. All major services clusters expanded on a y/y basis except for accommodation.”
“The message from the MTI continued to be one of greater caution, especially on the moderation in external outlook and heightened external risks. It was noted that MTI has removed the mention of COVID-19 risks compared to its Aug report. MTI now expects GDP growth to “be around 3.5 percent” for 2023 and moderate to “0.5 to 2.5 percent” for 2023. GDP Outlook - With the 3Q22 outcome largely within our expectations, we keep our GDP growth outlook for Singapore at 3.5% for 2022, before easing to 0.7% in 2023 to reflect the broad slowing in external outlook next year.”
“MAS Outlook – The latest official 3Q GDP data and 2023 growth outlook does not change our monetary policy outlook. Singapore’s monetary policy is further into a restrictive setting after five rounds of tightening since Oct 2021. With the MAS pulling only one lever in its Oct 2022 decision, there is still room for further tightening into 2023, especially if core inflation does not show signs of moderation. While we believe off-cycles are likely done for the remainder of 2022, it may still be a possibility especially in early 2023.”
European Central Bank (ECB) Chief Economist Philip Lane said on Friday, “wages will be the primary driver of inflation over the coming years.”
Key quotes
“Staggered nature of wage setting means that adjustment of nominal wages to the cumulative increase in cost of living will play out over several years.”
“Even after energy and pandemic factors fade, wage inflation will be a primary driver of prices in the next several years.”
“Long-term inflation expectations appear well anchored.”
Meanwhile, ECB policymaker Madis Muller said it is “too risky to wait for a downturn to cool prices.”
Market reaction
EUR/USD stays well bid above 1.0400 on Black Friday, as the US Dollar weakness continues to dominate across the board. The spot is up 0.19% on the day.
- AUD/USD edges lower on Friday, though the intraday downtick lacks follow-through.
- China’s COVID-19 woes weigh on investors’ sentiment and the risk-sensitive Aussie.
- The prevalent USD selling bias lends support and limits the downside for the major.
The AUD/USD pair struggles to capitalize on its gains recorded over the past three trading sessions and retreats from over a one-week high touched earlier this Friday. The pair trades with a mild negative through the early European session and is currently placed around the mid-0.6700s, though any further pullback seems elusive.
Worries about the worsening COVID-19 situation in China keep a lid on the recent optimistic move in the markets, which, in turn, acts as a headwind for the risk-sensitive Aussie. In fact, China announced strict curbs in several major cities in the wake of a record-high jump in daily COVID-19 cases. This, in turn, adds to concerns about a further slowdown in economic activity and tempers investors' appetite for perceived riskier assets.
The downside for the AUD/USD pair, however, remains cushioned, at least for the time being, amid the underlying bearish sentiment surrounding the US Dollar. The November FOMC meeting minutes released on Wednesday revealed that a substantial majority of policymakers judged that a slowing rate hike would soon be appropriate. This leads to an extension of the recent decline in the US Treasury bond yields and continues to undermine the greenback.
The mixed fundamental backdrop, meanwhile, warrants some caution before positioning for a firm near-term direction for the AUD/USD pair. Moreover, relatively thin trading volumes might further hold back traders from placing aggressive bets and support prospects for an extension of the consolidative price move on the last day of the week.
Technical levels to watch
NZD/USD has broken through the key 0.6235 resistance level and looks solid, supported by higher rates. But beware of hawkish Fed rhetoric, economists at ANZ Bank note.
There is still uncertainty
“We do think higher interest rates and the RBNZ’s hawkish stance are, on balance, a positive for the Kiwi, but newspapers are awash with recession talk, and that of course brings with it the risk that negative sentiment starts to feed on itself.”
“The big global uncertainty is; how does the USD treat the prospect of the Fed slowing down the pace of hikes, but potentially higher terminal rate? Does that feed bearish sentiment, or help USD carry? So there is still uncertainty.”
“Support 0.5875/0.6000 Resistance 0.6470/0.6575”
Slowly, the Euro looks more attractive. However, economists at Commerzbank urge caution against excessive EUR euphoria.
Limited risk premium seems justified
“The recovery in EUR/USD since the beginning of November is likely to be mainly due to the USD correction. However, the EUR negative arguments are also getting increasingly less convincing. Yesterday’s Ifo index provided further evidence that the economic framework conditions are gradually improving.”
“However, we urge caution against excessive EUR euphoria as the risk of an energy crisis has not yet been overcome. As a result, a limited risk premium seems justified.”
- EUR/GBP stages a modest recovery from the monthly low touched on Thursday.
- A combination of factors underpins the shared currency and offers some support.
- Rising bets for additional BoE rate hikes benefit the GBP and seem to cap gains.
The EUR/GBP cross gains some positive traction on Friday and reverses a part of the overnight slide to a fresh monthly low. The cross maintains its bid tone through the early European session, though seems to struggle to capitalize on the strength beyond the 0.8600 mark and remains below the 100-day SMA.
The shared currency's relative outperformance could be attributed to talks of a more aggressive policy tightening by the European Central Bank (ECB). This, in turn, is seen as a key factor offering some support to the EUR/GBP cross. The ECB Governing Council member Isabel Schnabel said on Thursday that the central bank will probably need to raise rates further into restrictive territory. Schnabel added that the incoming data suggests that the room for slowing down the pace of interest rate adjustments remains limited.
Adding to this, the prevalent selling bias around the US Dollar, along with an upward revision of the German Q3 GDP print, benefit the Euro and act as a tailwind for the EUR/GBP cross. According to the final reading, the Eurozone's economic powerhouse expanded by 0.4% during the three months to September and the annual growth rate in Q3 2022 stood at 1.3% vs. the 1.2% estimated. The intraday uptick, however, lacks bullish conviction and remains capped amid the underlying bullish sentiment surrounding the British Pound.
The recent sharp decline in the UK government bond yields represents an easing of financial conditions, which should allow the Bank of England to continue raising borrowing costs to tame inflation. This, in turn, is seen underpinning the Sterling Pound and keeping a lid on any further gains for the EUR/GBP cross, at least for the time being. Hence, it will be prudent to wait for strong follow-through buying before confirming that spot prices have bottomed out and positioning for any meaningful appreciating move.
Technical levels to watch
Sterling is a major reserve currency, accounting for 5% of global foreign exchange reserves while the United Kingdom accounts for only 3% of global GDP. But GBP’s reserve currency role could be under threat, according to analysts at Natixis.
What will happen if GBP’s reserve currency role diminishes?
“Sterling’s reserve currency role is under threat, particularly since the Brexit referendum, in the face of: The UK’s relatively weak growth; The reduced appeal of the United Kingdom for corporate investment; Awareness of the small size of the UK economy relative to its reserve currency status; Labour force decline, due to the departure of Europeans; And the onset of a vicious circle where because pound sterling is less attractive, it depreciates, which in turn makes it less attractive still.”
“If Sterling’s share of global foreign exchange reserves falls, foreign holders of pounds will become sellers. The market for Sterling will then have to rebalance after this selling shock, which will require a huge depreciation of the Pound: To offset central banks’ sales of GBP; To balance the UK’s current account without capital inflows.”
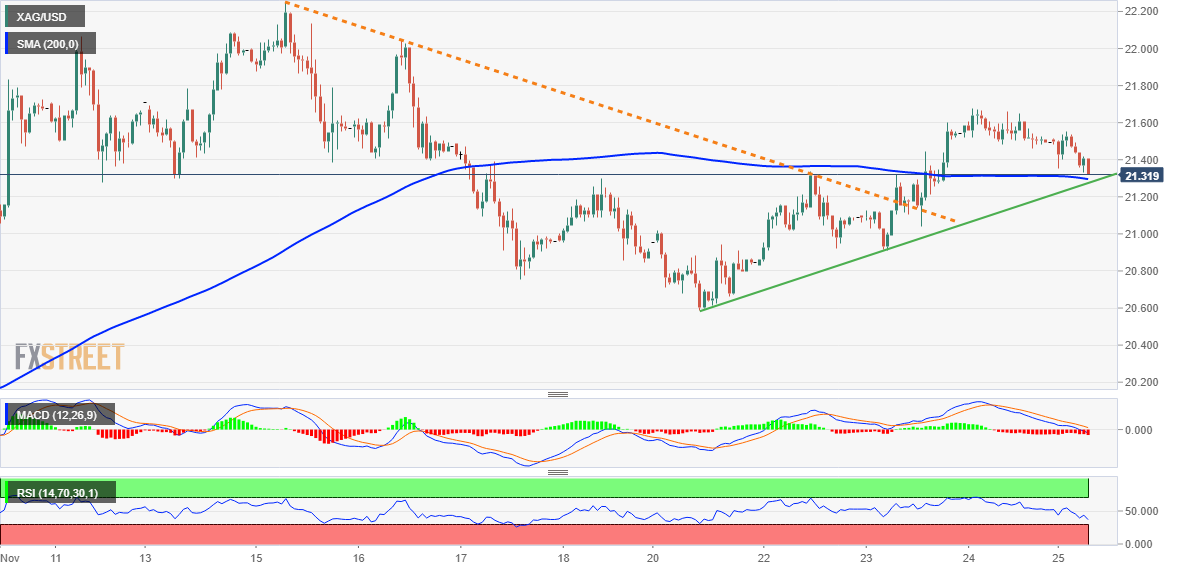
- Silver comes under some selling pressure on Friday, though the downside remains cushioned.
- The technical setup supports prospects for the emergence of some dip-buying at lower levels.
- A sustained break below a trend-line resistance breakout point will negate the positive outlook.
Silver edges lower on the last day of the week and moves further away from over a one-week top, around the $21.65-$21.70 region touched on Thursday. The white metal remains on the defensive through the early European session and is currently placed just below the mid-$21.00s.
From a technical perspective, the XAG/USD, so far, has managed to defend the 200-hour SMA. Against the backdrop of a convincing breakout through a one-week-old descending trend-line resistance on Wednesday, the set-up favours bullish traders and supports prospects for a further near-term appreciating move.
The constructive outlook is reinforced by the fact that oscillators on the daily chart are holding in bullish territory. That said, technical indicators on the 1-hour chart have just started gaining negative traction and warrant some caution amid relatively thin liquidity conditions in the markets.
Nevertheless, the XAG/USD seems poised to surpass the overnight swing high, around the $21.65-$21.70 region, and reclaim the $22.00 mark. This is followed by a five-month high, around the $22.25 zone, above which spot prices could climb to the $22.50-$22.60 area en route to the $23.00 round figure.
On the flip side, the $21.00 mark could act as an immediate support ahead of the ascending trend-line resistance breakpoint, currently around the $20.80 region. A convincing break below the latter could negate the positive outlook and possibly shift the near-term bias in favour of bearish traders.
The XAG/USD might then accelerate the downfall to the $20.60-$20.55 area (weekly low) before eventually dropping to challenge the $20.00 psychological mark. Some follow-through selling might expose the $19.00 round-figure mark, with some intermediate support near the $19.65-$19.60 region.
Silver 1-hour chart
Key levels to watch
- The index reverses part of the weekly drop on Friday.
- Market conditions are expected to remain thin due to US inactivity.
- The risk complex sees some profit taking at the end of the week.
The greenback, in terms of the USD Index (DXY), manages to regain some balance and bounces off recent lows near 105.60 at the end of the week.
USD Index looks to risk trends
The dollar sees its buying interest somewhat re-emerged on Friday after three consecutive daily pullbacks and attempts to reclaim the 106.00 neighbourhood, all after Thursday’s multi-day lows.
Indeed, the better tone in the greenback comes in tandem with some profit taking in the risk complex, which saw its sentiment improve markedly since last Tuesday and later helped by the release of the FOMC Minutes.
Absent data releases in the US calendar and with markets closing early, the broad risk appetite trends are expected to dictate the sentiment among investors at the end of the week amidst the Thanksgiving Day hangover.
What to look for around USD
The weekly leg lower in the dollar seems to have met some contention around 105.60, triggering a mild rebound afterwards in line with some renewed selling bias in the risk-associated universe.
While hawkish Fedspeak maintains the Fed’s pivot narrative in the freezer, upcoming results in US fundamentals would likely play a key role in determining the chances of a slower pace of the Fed’s normalization process in the short term.
Key events in the US this week: Early markets close (Friday).
Eminent issues on the back boiler: Hard/soft/softish? landing of the US economy. Prospects for further rate hikes by the Federal Reserve vs. speculation of a recession in the next months. Fed’s pivot. Geopolitical effervescence vs. Russia and China. US-China persistent trade conflict.
USD Index relevant levels
Now, the index is advancing 0.16% at 105.80 and faces the immediate resistance at 107.99 (weekly high November 21) followed by 109.15 (100-day SMA) and then 110.48 (55-day SMA). On the other hand, the breakdown of 105.34 (monthly low November 15) would open the door to 105.31 (200-day SMA) and finally 104.63 (monthly low August 10).
Here is what you need to know on Friday, November 25:
The trading action in financial markets remains subdued amid thin volumes on Black Friday. Following the Thanksgiving Day holiday, bond and stock markets will close early and the economic calendar won't be offering any high-impact macroeconomic data releases. Profit-taking ahead of the weekend could ramp up the volatility in the second half of the day and cause irregular movements in major currency pairs. Meanwhile, US stock index futures edge higher in the early European morning, pointing to a slightly upbeat market mood.
During the Asian trading hours, China reported 32,695 coronavirus cases, setting a daily record of infections for the second straight day. Chinese officials ordered mass testing and decided to tighten restrictions in Beijing, Shanghai and Guangzhou. Nevertheless, the Shanghai Composite Index clings to modest daily gains and the Hang Seng Index is down only 0.3% toward the end of the week.
On energy-related news, Saudi and Iraqi energy ministers issued a statement early Friday, saying that they will introduce additional measures to ensure stability in the oil market. After falling nearly 5% on Wednesday, crude oil prices started to inch higher in the second half of the week and the barrel of West Texas Intermediate (WTI) was last seen gaining 0.5% on the day at $78.30.
EUR/USD failed to make a decisive move in either direction on Thursday and closed the day flat. The pair continues to fluctuate in a narrow range at around 1.0400 early Friday.
GBP/USD touched its highest level in three months at 1.2155 on Thursday but lost its bullish momentum. At the time of press, the pair was moving sideways near 1.2100. Nonetheless, GBP/USD remains on track to end the third week in positive territory.
USD/JPY fluctuates in a narrow range below 139.00 early Friday. The data from Japan showed the annual Consumer Price Index (CPI) in Tokyo climbed to 3.8% from 3.5% in October. This reading came in higher than the market expectation of 3.6% but failed to trigger a noticeable market reaction.
Statistics New Zealand announced earlier in the day that Retail Sales expanded by 0.3% on a quarterly basis in the third quarter, compared to analysts' estimate for a contraction of 3.4%. Despite the better-than-forecast data, NZD/USD struggled to gather bullish momentum and was last seen trading at around 0.6250.
Gold price registered small daily gains and closed above $1,750 on Thursday. XAU/USD advanced beyond $1,760 in the Asian session but retreated to $1,755 in the European morning.
Following a two-day rally, Bitcoin closed flat on Thursday but lost its traction on Friday. BTC/USD was last seen losing more than 1% on the day at $16,400. Ethereum is down nearly 2% on the day, trading below $1,200.
The German economy expanded by 0.4% on the quarter in the three months to September of 2022 vs. 0.3% prior, the final revision confirmed on Friday. The reading came in above the market consensus of 0.3%.
On an annualized basis, Europe’s economic powerhouse’s GDP grew 1.3% in Q3 2022 vs. 1.2% booked in Q2 while beating 1.2% estimates.
Meanwhile, Germany’s GDP rate w.d.a arrived at 1.2% YoY in Q3 vs. 1.1% expected and 1.1% previous.
FX implications
EUR/USD was last seen trading at 1.0400, unchanged on the day. The Euro shrugged off the upbeat German GDP revision.
About German GDP
The Gross Domestic Product released by the Statistisches Bundesamt Deutschland is a measure of the total value of all goods and services produced by Germany. The GDP is considered as a broad measure of the German economic activity and health. A high reading or a better-than-expected number has a positive effect on the EUR, while a falling trend is seen as negative (or bearish).
Gold price consolidates gains amid subdued trading on Black Friday. The yellow metal could extend its rise toward the three-month high of $1,787, FXStreet’s Dhwani Mehta reports.
Upside bias remains intact
“Doors remain open toward the three-month high of $1,787 should bulls take out the intraday high at $1,761 and this week’s high near $1,770.”
“The 21 and 100-Daily Moving Average (DMA) bullish crossover remains in play, backing the further upside in Gold price.”
“The 14-day Relative Strength Index (RSI) is trading flat above the midline, keeping bullish traders hopeful.”
“On the downside, the psychological $1,750 level will test the bullish commitments. The next support will be seen at Monday’s low of $1,733.”
FX option expiries for Nov 25 NY cut at 10:00 Eastern Time, via DTCC, can be found below.
- EUR/USD: EUR amounts
- 1.0250 766m
- GBP/USD: GBP amounts
- 1.1860 669m
- USD/JPY: USD amounts
- 136.00 372m
- 137.00 710m
- 138.15 300m
- 138.50 980m
- 143.50 870m
- USD/CHF: USD amounts
- 0.9500 600m
- 0.9600 466m
- AUD/USD: AUD amounts
- 0.6700 655m
- 0.6850 358m
- USD/CAD: USD amounts
- 1.3390 358m
- 1.3500 400m
- 1.3620 445m
- 1.3700 560m
- EUR/GBP: EUR amounts
- 0.8655 358m
- GBP/USD is seen oscillating in a narrow trading band on the last day of the week.
- The less hawkish FOMC minutes continue to weigh on the USD and offer support.
- Relatively thin trading conditions hold back bullish traders from placing fresh bets.
The GBP/USD pair is seen oscillating in a narrow band through the early European session on Friday and consolidating this week's strong move up to the highest level since August 12. The pair is currently placed around the 1.2100 round figure and remains well within the striking distance of a technically significant 200-day Simple Moving Average (SMA).
The US Dollar struggles to gain any meaningful traction and languishes just above the monthly low, which, in turn, continues to act as a tailwind for the GBP/USD pair. A dovish assessment of the FOMC meeting minutes released on Wednesday continues to drag the US Treasury bond yields lower. This, along with a generally positive tone around the equity markets, is seen undermining the safe-haven greenback.
The British Pound, on the other hand, draws support from the recent sharp decline in the UK government bond yields. This represents an easing of financial conditions in the UK, which should allow the Bank of England to continue raising borrowing costs to tame inflation. The combination of the aforementioned fundamental factors supports prospects for a further near-term appreciating move for the GBP/USD pair.
That said, a bleak outlook for the UK economy might hold back traders from placing aggressive bullish bets amid a bleak outlook for the UK economy. It is worth recalling that the UK Office for Budget Responsibility (OBR) projected the UK GDP to slump by 1.4% next year as compared to a growth of 1.8% forecast in March. This, in turn, might cap gains for the GBP/USD pair amid lighter trading volumes.
Nevertheless, spot prices remain on track to register gains for the third successive week in the absence of relevant market-moving economic releases, either from the UK. The market focus now shifts to next week's important US macro data - the Prelim Q3 GDP report, Core PCE Price Index (the Fed's preferred inflation gauge) and the closely watched monthly employment details, popularly known as NFP.
Technical levels to watch
Economist at UOB Group Lee Sue Ann reviews the latest interest rate decision by the RBNZ.
Key Quotes
“The Reserve Bank of New Zealand (RBNZ) decided to raise its official cash rate (OCR) by 75bps to 4.25% at its final meeting of the year. Today’s hike follows five consecutive 50bps rate hikes and is the largest since the New Zealand central bank introduced the OCR in 1999 and takes the benchmark to its highest level since 2008.”
“The RBNZ also signalled further tightening ahead, and now sees the OCR peaking at 5.5% in 3Q23, up from a previous peak of 4.1%, before falling in 4Q24, even as it forecasts a recession next year. It also sees the economy contracting for four straight quarters starting from 2Q23; and sees annual inflation climbing to 7.5% in the final quarter of this year from 7.2% currently.”
“There is a three-month gap between today and the next monetary policy decision on 22 Feb. Given how the RBNZ is typically pre-emptive in nature, frontloading now would be more ideal than waiting till then. We had previously highlighted that the risks remain skewed towards more rate hikes, and thus an OCR higher than our 4% forecast. We now think that rates will peak closer to 5.0%, before the RBNZ pauses in the current tightening cycle.”
- USD/JPY has found a temporary cushion around 138.50 as the US Dollar recovers from morning losses.
- The 10-year US Treasury yields have dropped to 3.65% as Fed Powell is expected to shift to a lower rate hike.
- Tokyo’s inflation has outpaced forecasts led by months of yen weakness and elevated energy costs.
The USD/JPY pair is building a cushion around the immediate support of 138.50 in the early European session. Signs of recovery in the USD Index (DXY) have also propelled the USD/JPY pair marginally. The US Dollar has recovered its entire morning losses and is expected to frighten the solid risk-on profile ahead. However, the bias is still in favor of risk-sensitive assets.
S&P500 futures are behaving as inactive as investors are returning after a holiday session due to Thanksgiving Day. The returns generated by 10-year US Treasury bonds have dropped further to 3.65% as odds of continuation of 75 basis points (bps) rate hike by the Federal Reserve (Fed) in its December monetary policy meeting have vanished vigorously.
Investors would prefer to park their funds into the US government bonds if the Fed chose to slowdown its interest rate hike pace. Odds are favoring a deceleration in the extent of an interest rate hike as inflationary pressures have shown meaningful signs of exhaustion and financial risks need some care. Fed chair Jerome Powell is expected not to go extremely down and may shift to a 50 bps rate hike structure as the inflation rate is still far from the targeted rate of 2%.
On the Japanese yen front, the headline Consumer Price Index (CPI) in Tokyo has escalated to 3.8% vs. the consensus of 3.6%. While core CPI has jumped to 2.5% against the projections of 2.1%. As reported by Bloomberg, Tokyo’s inflation has outpaced forecasts to hit its fastest clip since 1982, an acceleration that suggests nationwide price growth will also quicken in November after months of yen weakness and elevated energy costs.
- USD/CAD refreshes weekly low on Friday amid sustained selling around the US Dollar.
- The less hawkish FOMC minutes and a positive risk tone continue to weigh on the buck.
- An uptick in oil prices underpins the Loonie and contributes to the pair’s modest decline.
The USD/CAD pair remains under some selling pressure for the fourth successive day on Friday and drops to a fresh weekly low heading into the European session. Spot prices, however, manage to hold above the 1.3300 round-figure mark and remain at the mercy of the US Dollar price dynamics.
A dovish assessment of the FOMC meeting minutes released on Wednesday continues to weigh on the buck and is seen as a key factor acting as a headwind for the USD/CAD pair. In fact, officials were largely satisfied that they could stop front-loading the rate increases and that slowing the rate-hiking cycle would soon be appropriate. This, in turn, cements expectations for a 50 bps lift-off at the December FOMC meeting and drags the yield on the benchmark 10-year US government bond to its lowest level since early October.
Apart from this, a generally positive tone around the equity markets is seen as another factor weighing on the safe-haven greenback. Furthermore, some follow-through uptick in crude oil prices underpins the commodity-linked Loonie and exerts additional downward pressure on the USD/CAD pair. That said, worries that the worsening COVID-19 situation in China will dent fuel demand keep a lid on any further gains for the black liquid. This, in turn, is holding back traders from placing aggressive bearish bets around the USD/CAD pair.
In the absence of any major market-moving economic releases, either from the US or Canada, the US bond yields and the broader market risk sentiment will drive the USD demand. Apart from this, traders will further take cues from oil price dynamics to grab short-term opportunities around the USD/CAD pair. The intraday momentum, however, is likely to remain limited amid relatively thin trading volumes on the last day of the week.
Technical levels to watch
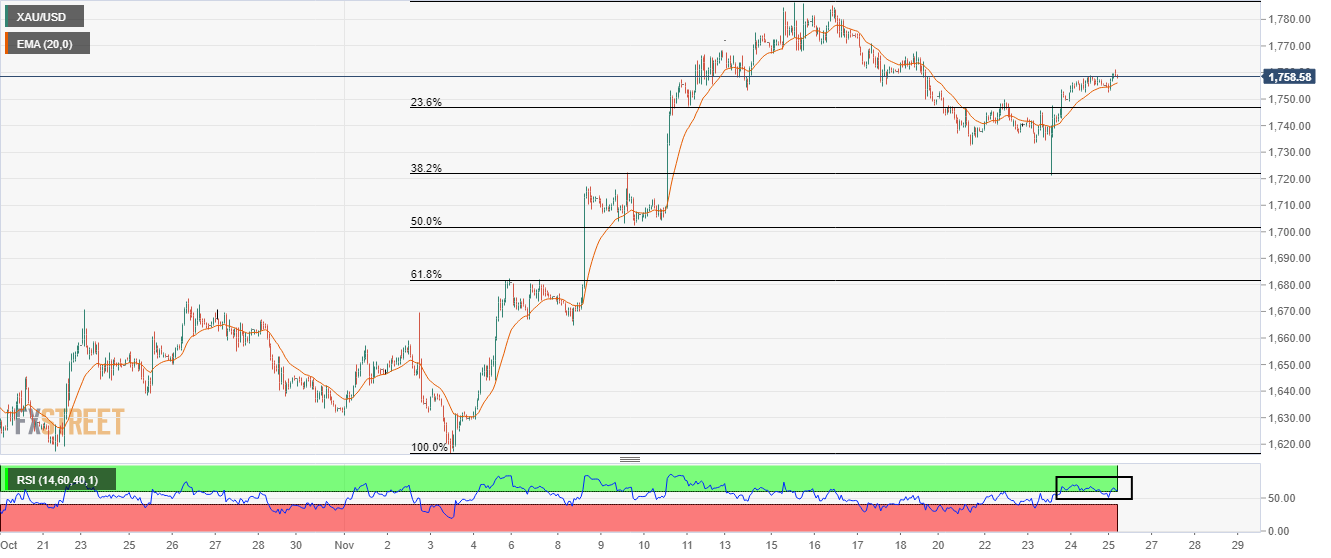
- Gold price is facing hurdles while surpassing the immediate hurdle of $1,760.00.
- Investors see Fed’s rate hike slowdown as a double-edged sword as core CPI has not shown a meaningful slowdown yet.
- An improvement in US Durable Goods Orders poses a bullish filter for the core CPI data.
Gold price (XAU/USD) is facing barricades around the critical resistance of $1,760.00 in the early European session. The precious metal has refreshed its weekly high at $1,761.05, however, further upside seems capped despite a risk-on tone in the global markets.
The USD Index (DXY) is auctioning around its weekly support at 105.65 amid a sheer decline in safe-haven’s appeal. Meanwhile, S&P500 futures are behaving like a dead cat amid the holiday mood in the United States on account of Thanksgiving Day.
No doubt, the headline inflation numbers in the US economy have displayed signs of a decline, however, the core CPI numbers have not shown meaningful signs of slippage yet. Also, the US Durable Goods Orders data that was released this week showed improvement, which is a sign of acceleration in core inflation ahead.
Federal Reserve (Fed) policymakers are required to take significant precautions before making a strategic plan for December monetary policy meeting as a decision to a slowdown in the interest rate hike could be a double-edged sword for them.
Gold technical analysis
On an hourly scale, Gold price has displayed a steep recovery after testing the 38.2% Fibonacci retracement (plotted from November 3 low at $1,616.69 to November 15 high at $1,758.88) at $1,722.00. The precious metal has extended its recovery after testing the 20-period Exponential Moving Average (EMA) at $1,754.65.
Meanwhile, the Relative Strength Index (RSI) (14) has reclaimed the bullish range of 60.00-80.00, which indicates more upside ahead.
Gold hourly chart
- EUR/USD is aiming to recapture Thursday’s high at 1.0445 as US yields extend losses further.
- A slowdown in an interest rate hike by the Fed could a double-edged sword.
- Eurozone investors are eyeing the European gas price cap structure ahead.
The EUR/USD pair has extended its recovery after overstepping the immediate resistance of 1.0420 in the Tokyo session. The Euro pair is aiming to recapture Thursday’s high at 1.0445 as the USD Index (DXY) has resumed its downside journey after showing a wild gyration in its early trade. The US Dollar is declining towards Thursday’s low at 105.64 as investors are channelizing funds again into the risk-sensitive assets after returning from a holiday in the United States on account of Thanksgiving Day.
S&P500 futures are flat while the US Treasury yields are facing immense pressure. The yields on long-term US Treasury bonds have slipped below 3.66% as odds are pointing for a less-hawkish stance in December monetary policy meeting by the Federal Reserve (Fed) chair Jerome Powell.
Investors are punishing the US Dollar as Fed policymakers have vouched for a slowdown in the interest rate hike. Fed policymakers believe that headline United States Consumer Price Index (CPI) has displayed signs of severe exhaustion, therefore, it would be optimal to go on a light note on policy rates. However, the core CPI that excludes oil and food prices has not shown a significant drop.
Also, US Durable Goods Orders released this week remained significantly higher at 1% than expectations and former print. This could add fuel to the core inflation figures. So, choosing the option of deceleration in the interest rates could be a double-edged sword for the market.
On the Eurozone front, investors are keeping an eye on the price cap structure to be introduced for the European gas ahead. Supply chain bottlenecks in the Eurozone have been firing energy prices due to sanctions on Russia. Intercontinental Exchange (ICE) has warned that the finalization of the ceiling on European gas would force energy traders to stump up an additional $33 bln in margin payments, as reported by Financial Times.
- USD/INR is expected to display sheer losses as it has surrendered the critical support of 81.60.
- The 10-year US Treasury yields have dropped to near 3.66% as investors see no 75 bps rate hike move ahead.
- Weaker oil prices and firmer Indian indices have strengthened the Indian rupee bulls.
The USD/INR pair has slipped below the critical support of 81.60 in the Asian session. The asset has surrendered the aforementioned support ahead as overall optimism in the currency market is leading to a sell-off for the US Dollar at rallies.
The US dollar has delivered a downside break of the consolidation formed in a narrow range of 105.84-1.5.94 in the early Tokyo session. The mighty US Dollar is expected to retest Thursday’s low at 105.64. Meanwhile, the 10-year US Treasury yields have started their downside journey and have dropped to near 3.66% as investors see no continuation of the 75 basis points (bps) rate hike regime after the release of the Federal Open market Committee (FOMC) minutes.
On the Indian rupee front, the return of Foreign Institutional Investors (FIIs) to Dalal Street as Nifty50 has reached near its all-time highs has strengthened the Indian rupee. As FIIs are pouring funds into the Indian equity markets due to an improvement in risk appetite theme, foreign reserves in India are escalating.
Apart from that, a sheer decline in oil prices due to rising infections of Coronavirus in China has also infused fresh blood into the Indian rupee bulls. It is worth noting that India is one of the leading importers of oil and lower oil prices would result in a lower outlay of funds from the Indian financial system.
- AUD/USD is aiming to stabilize above the 0.6760 hurdle for further gains.
- The US Dollar is displaying a subdued performance as the overall market mood is extremely bullish.
- Australian Retail Sales data is expected to decline to 0.3% vs. the former release of 0.6%.
The AUD/USD pair is displaying a lackluster performance in the Asian session amid a quiet market mood. The Aussie asset has managed to reclaim the 0.6760 hurdle after a minor sell-off in early Tokyo. Volatility in the currency market has been squeezed dramatically as trading activity is low in the United States due to Thanksgiving Day.
Meanwhile, the US Dollar is displaying a subdued performance in the Tokyo session after a wild move in early trade. The US dollar has turned sideways as the economic calendar has nothing much to offer. As odds for a slower rate hike by the Federal Reserve (Fed) have strengthened, the alpha generated by US Treasury bonds is under investors selling list. The 10-year US Treasury yields have extended their losses to near 3.66%.
Investors are pouring funds into the US Treasury bonds and risk-sensitive assets on the expectation that a shift to lower rate hike measures by the Fed in its December monetary policy meeting will accelerate economic projections. The dictations from the Federal Open Market Committee (FOMC) have already cleared that deceleration in the rate hike pace is necessary to reduce financial risks.
On the Australian dollar front, investors are shifting their focus toward the release of Retail Sales data. The economic data is expected to decline to 0.3% vs. the prior release of 0.6% on a monthly basis. A decline in consumer demand would delight the Reserve Bank of Australia (RBA) as lower retail sales will force the producers to lower their prices to accelerate demand. This might result in a decline in inflation ahead.
- The New Zealand Dollar has not been impacted much despite Retail Sales data missed estimates.
- NZD/USD is hoping for a cushion around the 20-MA (High-Low) band.
- A slippage in the RSI (14) to the 40.00-60.00 range is merely a loss of momentum, not a bearish reversal.
The NZD/USD pair has attempted a recovery after dropping to near 0.6250 in the Asian session. The market mood is extremely quiet as investors are returning gradually after a holiday on account of Thanksgiving Day. Also, the USD Index (DXY) has turned flat after displaying a wild gyration in the morning trade.
The Kiwi asset has not been impacted much after New Zealand Retail Sales missed estimates. The economic data landed at 0.4%, lower than the consensus of 0.5% but remained firmer from the prior release than the prior release of -2.3%.
On an hourly scale, the Kiwi asset is looking for the ground near the 20-period Moving Average (High-Low) in the dimensions of 0.6252-0.6270. Broadly, the upward-sloping trendline placed from November 10 low at 0.5841 will act as a major support for the counter.
Meanwhile, the Relative Strength Index (RSI) (14) has fallen into the 40.00-60.00 range from the bullish range of 60.00-80.00. This indicates that the New Zealand Dollar has lost momentum, however, the upside bias is still intact.
Should the asset break above Thursday’s high at 0.6288, the New Zealand Dollar bulls will drive the asset towards August 1 high at 0.6353, followed by the round-level resistance at 0.6400.
Alternatively, a decline below weekly lows at 0.6088 will drag the Kiwi asset toward November 14 low at 0.6061. A slippage below the latter will expose the major to drag further near the psychological support of 0.6000.
NZD/USD hourly chart
-638049426612714025.png)
- GBP/USD holds steady above 1.2100 as the US Dollar stalls decline.
- Mixed sentiment amid dovish Fed and China’s covid woes cap GBP/USD”s upside.
- 200DMA at 1.2185 remains a tough nut to crack for GBP/USD bulls.
GBP/USD is easing from three-month highs of 1.2153, as bulls take a breather on Black Friday. Amid extended holiday-thinned market conditions, the US Dollar has stalled its decline, as end-of-the-week repositioning seems to be in play.
The Fed November meeting Minutes showed that most board members saw a slower pace of higher appropriate ‘soon’. The dovish pivot in the Fed’s tightening outlook triggered a fresh sell-off in the US Treasury yields, which knocked down the US Dollar across the board.
So far this Black Friday’s trading, the Cable remains at the mercy of the market sentiment, with China’s covid curbs keeping investors on the edge. A partial holiday in the US will leave GBP/USD traders mostly on the sidelines, as the focus shifts toward next week’s US Nonfarm Payrolls (NFP) release.
Nothing seems to have changed technically for GBP/USD, as sellers continue to lurk above the 1.2150 region. Buyers await a sustained break above the bearish 200-Daily Moving Average (DMA) at 1.2185 should the previous day’s high at 1.2153 give way. The next relevant upside barrier is seen at 1.2200, the round number.
The 14-day Relative Strength Index (RSI) has turned flat while above the midline, backing the range trade in the pair, at the moment.
GBP/USD: Daily chart
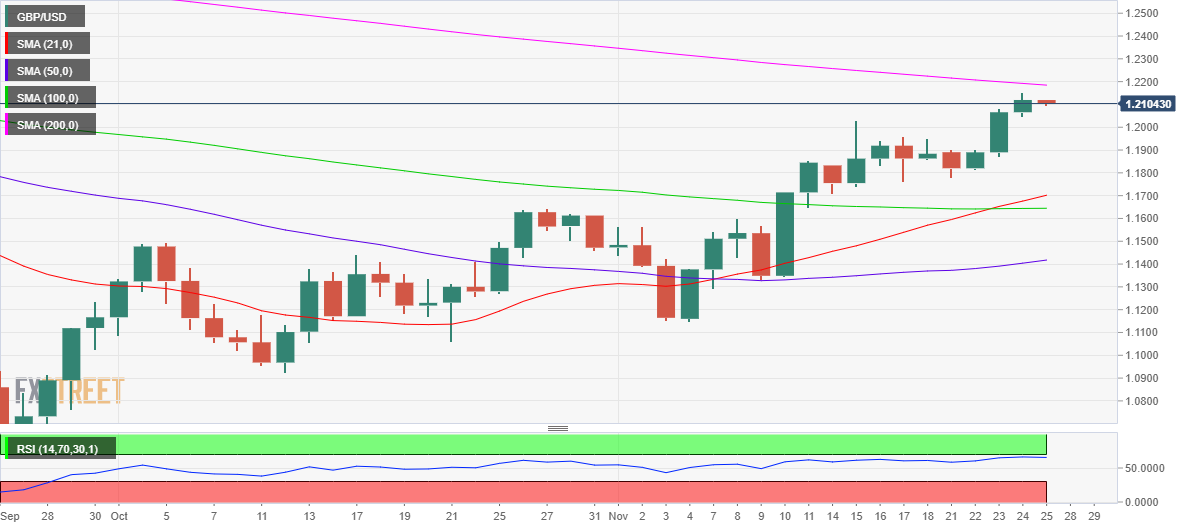
On the flip side, the 1.2050 support area needs to be broken decisively to trigger a corrective decline. The 1.2000 psychological barrier could then come to the rescue of bulls.
The line in the sand for GBP/USD buyers is seen at around 1.1700, where the 21 and 100DMAs hang around.
GBP/USD: Additional technical levels
| Raw materials | Closed | Change, % |
|---|---|---|
| Silver | 21.476 | -0.25 |
| Gold | 1755.01 | 0.32 |
| Palladium | 1892.58 | 0.83 |
- Gold price is set for a positive close on the week amid broad-based US Dollar weakness.
- Federal Reserve’s dovish outlook, light trading to continue supporting Gold price.
- Gold price is poised for a hard battle heading into the US NFP week, $1,775 remains in sight.
Gold price is challenging bearish commitments near the $1,760 round figure, extending its upbeat momentum into the fourth straight trading day. The bright metal is on track to book weekly gains after a negative end a week ago. Broad-based US Dollar weakness remains the underlying catalyst behind the Gold price recovery, as the dovish Federal Reserve minutes offered additional legs to the ongoing correction in the greenback from over two-decade highs. Weak United States data also deepened the pain in the buck while traders preserved the weekly gains in Gold price amid the Thanksgiving week. The US Treasury yields also bore the brunt of the Fed officials agreeing on the need for smaller rate increments going forward. Attention now turns towards the US Nonfarm Payrolls (NFP) due for release in the week ahead, which is one of the most significant data watched out for before the December FOMC meeting.
Also read: Gold triple bottom leads prices higher
Gold Price: Key levels to watch
The Technical Confluence Detector shows that the gold price is looking to clear a powerful resistance at $1,757, the convergence of the Fibonacci 23.6% one-day and one-week.
The immediate upside remains capped by the previous day’s high at $1,759, where the SMA10 one-day also coincides.
The next significant topside barrier is placed at $1,762, which is the Fibonacci 38.2% one-week.
A sustained move above the latter will initiate a meaningful upside toward the pivot point one-day R3 at $1,769.
Further up, $1,775 will be a tough nut to crack for Gold bulls. At that level, the pivot point one-month R2 intersects with the Fibonacci 61.8% one-week.
On the flip side, the immediate support is pegged at the Fibonacci 61.8% one-day of $1,753, below which the previous week’s low at $1,749 will be put to test.
The next best downside bet for Gold bulls is the previous week’s low at $1,747, with the additional declines likely to test the pivot point one-day S3 at $1,741.
Here is how it looks on the tool

About Technical Confluences Detector
The TCD (Technical Confluences Detector) is a tool to locate and point out those price levels where there is a congestion of indicators, moving averages, Fibonacci levels, Pivot Points, etc. If you are a short-term trader, you will find entry points for counter-trend strategies and hunt a few points at a time. If you are a medium-to-long-term trader, this tool will allow you to know in advance the price levels where a medium-to-long-term trend may stop and rest, where to unwind positions, or where to increase your position size.
After Saudi Arabia denied a report that it was discussing an increase in oil supply with OPEC and its allies, there are now reports that they will promise additional measures to ensure oil market stability.
Saudi and Iraqi energy ministers have been reported saying that there is an importance of working within the OPEC+ framework. as a consequence, oil rose in early trade on Friday despite the worries about Chinese demand and expectations due to the increase of covid in the nation: China's Covid infections hit record as economic outlook darkens.
WTI remains below key H1 trendline
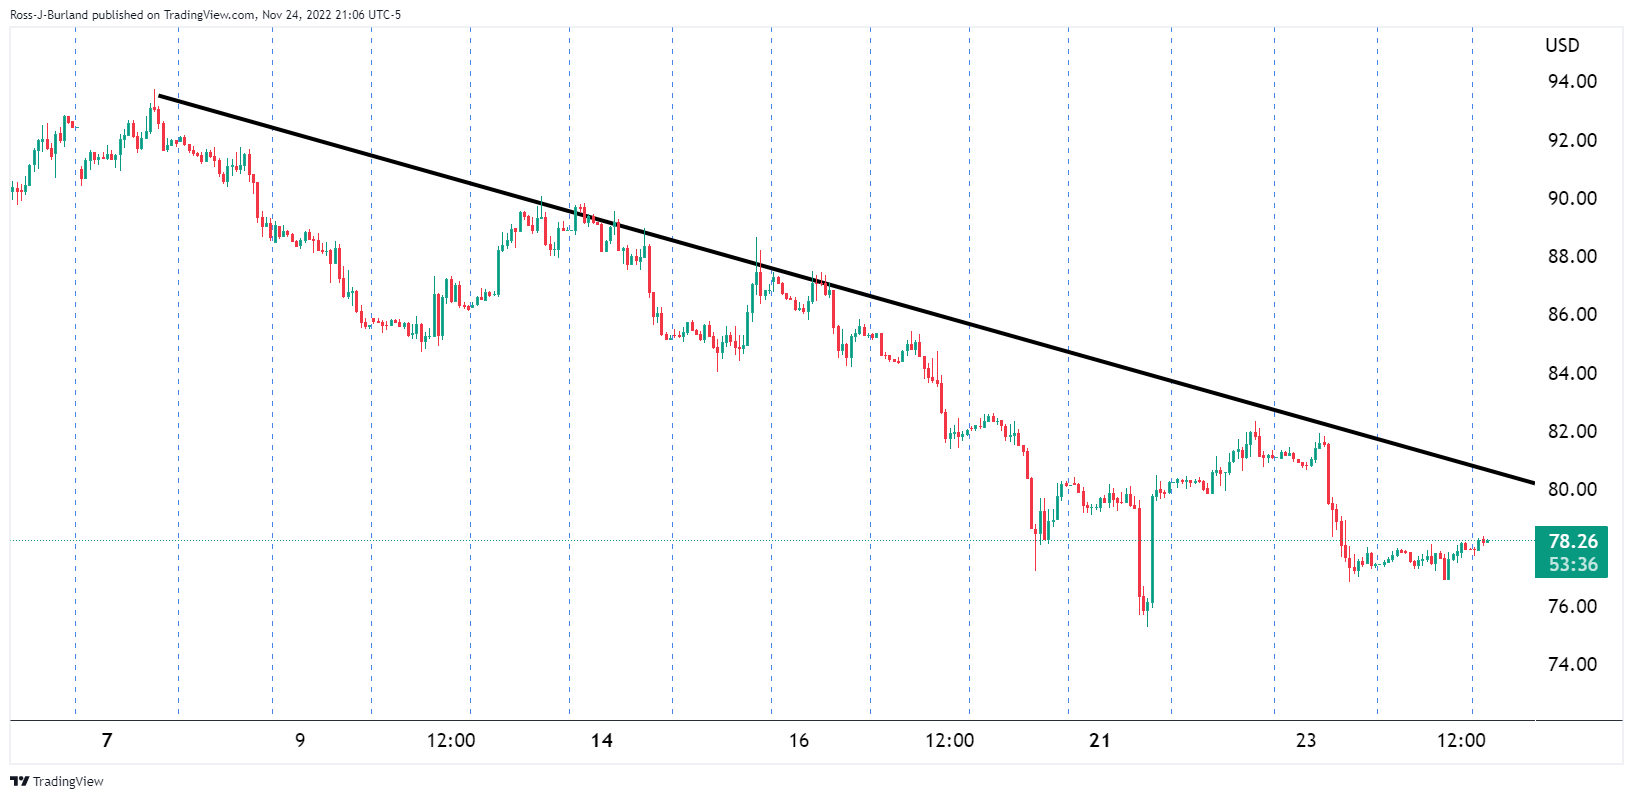
US West Texas Intermediate (WTI) crude is higher by some 0.45% having rallied from a low of $77.75 and reaching a high of $78.41 so far in trade on Friday.
China reported record-high Covid-19 infections on Thursday (Nov 24). Cities nationwide have imposed localised lockdowns which dampens the outlook for the world's second-largest economy.
Meanwhile, the brokerage Nomura cut its China Gross Domestic Product forecast for the fourth quarter to 2.4 per cent year on year from 2.8 per cent, and cut its forecast for full-year growth to 2.8 per cent from 2.9 per cent, which is far short of China's official target of about 5.5 per cent this year.
- USD/CHF is failing to sustain above the 0.9440 hurdle as the risk-on impulse is still solid.
- The US Dollar has displayed wild gyration in the morning trade.
- Swiss Employment level is seen higher at 5.331M than the prior release of 5.316M.
The USD/CHF pair has moved above the immediate hurdle of 0.9940 in the Tokyo session. The risk-sensitive currencies have sensed a minor selling interest as the USD Index (DXY) is displaying wild movements in the early trade. It would be early to say that the risk profile is changing as the volatility in the US Dollar arrived is not backed by any fundamental catalyst.
The returns on US Treasury bonds have trimmed further as investors are not expecting the continuation of a bigger rate hike regime by the Federal Reserve (Fed). The 10-year US Treasury yields have dropped below 3.67% and are expected to display more weakness ahead. Meanwhile, S&P500 futures are displaying some signs of further advances as expectations of a slowdown in policy tightening measures promise an improvement in economic projections ahead.
The golden days of the US Dollar have reached endgame as the United States Consumer Price Index (CPI) has already peaked and has displayed signs of exhaustion. It would be optimal to remain a little cautious as the recent decline in price pressures in the October inflation report is a one-thing thing. Therefore, confidence could get firmer only by a spree of the same.
Going forward, a rough session could be witnessed by the market participants as investors would adjust their extended overnight positions on Friday after a holiday on Thursday on account of Thanksgiving Day.
On the Swiss Franc front, investors are awaiting the release of Friday’s Employment data for the third quarter. The economic data is seen higher at 5.331M than the prior release of 5.316M. An upbeat employment data would support the Swiss National Bank (SNB) to stick with its expansionary policy approach.
In recent trade today, the People’s Bank of China (PBOC) set the yuan (CNY) at 7.1339vs. the last close of 7.1540.
About the fix
China maintains strict control of the yuan’s rate on the mainland.
The onshore yuan (CNY) differs from the offshore one (CNH) in trading restrictions, this last one is not as tightly controlled.
Each morning, the People’s Bank of China (PBOC) sets a so-called daily midpoint fix, based on the yuan’s previous day's closing level and quotations taken from the inter-bank dealer.
- EUR/USD has turned sideways above 1.0400 due to less trading activity amid Thanksgiving Day.
- Federal Reserve is set to ditch the 75 bps rate hike measure to safeguard the economy from financial risks.
- European Central Bank is bound to tighten policy further to slow down inflationary pressures.
- EUR/USD is likely to remain in the grip of bulls as the risk appetite theme has not faded yet.
EUR/USD is displaying a lackluster performance in the Tokyo session after resurfacing from the critical support of 1.0382. The Euro pair is oscillating above the round-level support of 1.0400. The major is awaiting a potential trigger for a fresh impetus as the market mood is extremely quiet amid the holiday in the United States on account of Thanksgiving Day.
The USD Index (DXY) is signaling a rangebound structure after finding a cushion around 105.64. The absence of sheer trading activity has shifted currencies to the sidelines, however, the risk impulse is still bullish. S&P500 futures recorded some gains on Thursday despite the United States markets being closed. The hangover of less-hawkish commentary from Federal Reserve (Fed) policymakers is expected to remain for a while. As the Federal Reserve is highly tilted towards the alternative of decelerating the pace of interest rate hikes, the US Dollar will remain on the tenterhooks.
Meanwhile, the Euro is expected to enjoy extra gains as European Central Bank (ECB) policymakers are seeing further policy restrictions due to the absence of a peak in Eurozone Inflation.
Federal Reserve is set to ditch 75 bps rate hike culture
The United States Consumer Price Index (CPI) has already displayed signs of a slowdown in its October inflation report. This has provided an opportunity for Federal Reserve chair Jerome Powell to slow down the pace of rate hike and shifts its focus towards enlarging financial risks. Back-to-back bigger rate hikes structure by the Federal Reserve (Fed) has exposed firms to skip their monthly obligations due to higher interest payments. Also, a slowdown in the interest rate hike pace by the Federal Reserve would provide an opportunity to observe the accomplishments led by efforts made yet in cooling down inflation.
After Federal Reserve policymakers signaled that a decline in interest rate hike pace would be optimal, the US Dollar is going through a bumpy ride. The US dollar is expected to decline further to near three-month low of around 105.34. Contrary to the efficient market hypothesis, economists at ANZ Bank have considered the move an exaggerated one as headline inflation at 7.7% is still extremely far from the targeted rate of 2%.
Further policy tightening by the European Central Bank to support Euro
Persistent supply chain risks in the Eurozone after Russia’s invasion of Ukraine have accelerated inflation and deep recession risks. The Eurozone inflation has reached to 10.7% and to curtail the same, ECB Governing Council member Isabel Schnabel said on Thursday that they will probably need to raise interest rates further into restrictive territory, as reported by Reuters. European Central Bank policymaker further added that room for slowing down the pace of interest rate adjustments remains limited. And, the largest risk for central banks remains a policy that is falsely calibrated on the assumption of a fast decline in inflation.
Meanwhile, accounts of the European Central Bank's (ECB) October policy meeting revealed on Thursday indicated that a few members also voted for 50 basis points (bps) interest rate hike. The European Central Bank Governing Council believes that policy tightening could be paused in case there will be signs of a deep and prolonged recession.
A structure of price cap on Eurozone gas is awaited
European Union (EU) authorities are planning to levy a ceiling on energy prices to safeguard households from a sheer decline in their real income. In response to that, Intercontinental Exchange (ICE) has warned that the finalization of the ceiling on European gas would force energy traders to stump up an additional $33 bln in margin payments, as reported by Financial Times. Such a large increase in margin requirements could “destabilize the market”,
EUR/USD technical outlook
-638049341724321218.png)
EUR/USD is playing with the 200-period Exponential Moving Average (EMA) at 1.0389 on a daily scale. The corrective move in the asset after printing a high of 1.0482 on November 15 to near 1.0226 has been supported by the upward-sloping trendline placed from November low at 0.9730. Going forward, potential resistances are plotted from June 27 high at 1.0615, and May 30 high at 1.0787.
The Relative Strength Index (RSI) (14) is oscillating in a bullish range of 60.00-80.00, which indicates that the upside momentum is active.
- USD/JPY bulls have steppe don the gas in Asia.
- DXY remains supported by barely out of the bear's grip.
USD/JPY is flat but overall bid vs. prior consolidative markets from overnight. The pair has but inching higher in a grind that has seen the biggest spike in the hourly time frame since the move. Volume is returning in Asia but that is not to say they will continue with there being holiday markets again on Friday in the US with a half day on Wall Street.
The softer US dollar tone and firmer equity mood that prevailed after the US PMIs and FOMC minutes extended to Asia-Pacific markets Thursday and are set to continue to do so on Friday in the absence of a fresh catalyst. US treasury bond markets were closed on Thursday but futures did trade, giving some guidance to forex. The 10-year yield fell 3bp to 3.67% for instance, weighing on the greenback initially before bulls started to move in. Nevertheless, markets are still currently pricing in the Fed funds rate to be 55bp higher at the next meeting in December, peaking at 5.02% in May 2023 after the minutes of the Nov. 1-2 meeting showed officials were largely satisfied they could now move in smaller steps.
In other key statements, the minutes showed that a slower pace of rate hikes would better allow the FOMC to assess progress toward its goals given the uncertain lags around monetary policy. A few participants said slowing the pace of rate hikes could reduce the financial system risks; others that slowing should await more progress on inflation.
The dollar index DXY, which measures the greenback against six major peers, was down 0.2% at 105.85 in Tokyo trade, after sliding 1.1% on Wednesday. As Reuters noted, ''the Fed has taken interest rates to levels not seen since 2008 but slightly cooler-than-expected US consumer price data has stoked expectations of a more moderate pace of hikes.'' Consequently, the US Dollar index slide 5.2% in November, putting it on track for its worst monthly performance in 12 years.
| Index | Change, points | Closed | Change, % |
|---|---|---|---|
| NIKKEI 225 | 267.35 | 28383.09 | 0.95 |
| Hang Seng | 137.09 | 17660.9 | 0.78 |
| KOSPI | 23.32 | 2441.33 | 0.96 |
| ASX 200 | 10 | 7241.8 | 0.14 |
| FTSE 100 | 1.4 | 7466.6 | 0.02 |
| DAX | 111.97 | 14539.56 | 0.78 |
| CAC 40 | 28.23 | 6707.32 | 0.42 |
| Pare | Closed | Change, % |
|---|---|---|
| AUDUSD | 0.6765 | 0.52 |
| EURJPY | 144.338 | -0.48 |
| EURUSD | 1.04121 | 0.16 |
| GBPJPY | 167.924 | -0.14 |
| GBPUSD | 1.21135 | 0.52 |
| NZDUSD | 0.62653 | 0.35 |
| USDCAD | 1.33374 | -0.09 |
| USDCHF | 0.94326 | 0.21 |
| USDJPY | 138.626 | -0.66 |


© 2000-2026. All rights reserved.
This site is managed by Teletrade D.J. LLC 2351 LLC 2022 (Euro House, Richmond Hill Road, Kingstown, VC0100, St. Vincent and the Grenadines).
The information on this website is for informational purposes only and does not constitute any investment advice.
The company does not serve or provide services to customers who are residents of the US, Canada, Iran, The Democratic People's Republic of Korea, Yemen and FATF blacklisted countries.
Making transactions on financial markets with marginal financial instruments opens up wide possibilities and allows investors who are willing to take risks to earn high profits, carrying a potentially high risk of losses at the same time. Therefore you should responsibly approach the issue of choosing the appropriate investment strategy, taking the available resources into account, before starting trading.
Use of the information: full or partial use of materials from this website must always be referenced to TeleTrade as the source of information. Use of the materials on the Internet must be accompanied by a hyperlink to teletrade.org. Automatic import of materials and information from this website is prohibited.
Please contact our PR department if you have any questions or need assistance at pr@teletrade.global.
transfers