- Analiza
- Novosti i instrumenti
- Vesti sa tržišta
Forex-novosti i prognoze od 10-03-2023
- USD/CHF extended its drop past the 20/50-day EMAs after facing resistance at the 200-day EMA.
- USD/CHF Price Forecast: Shifted bearish, though needs to crack 0.9130s to test YTD lows.
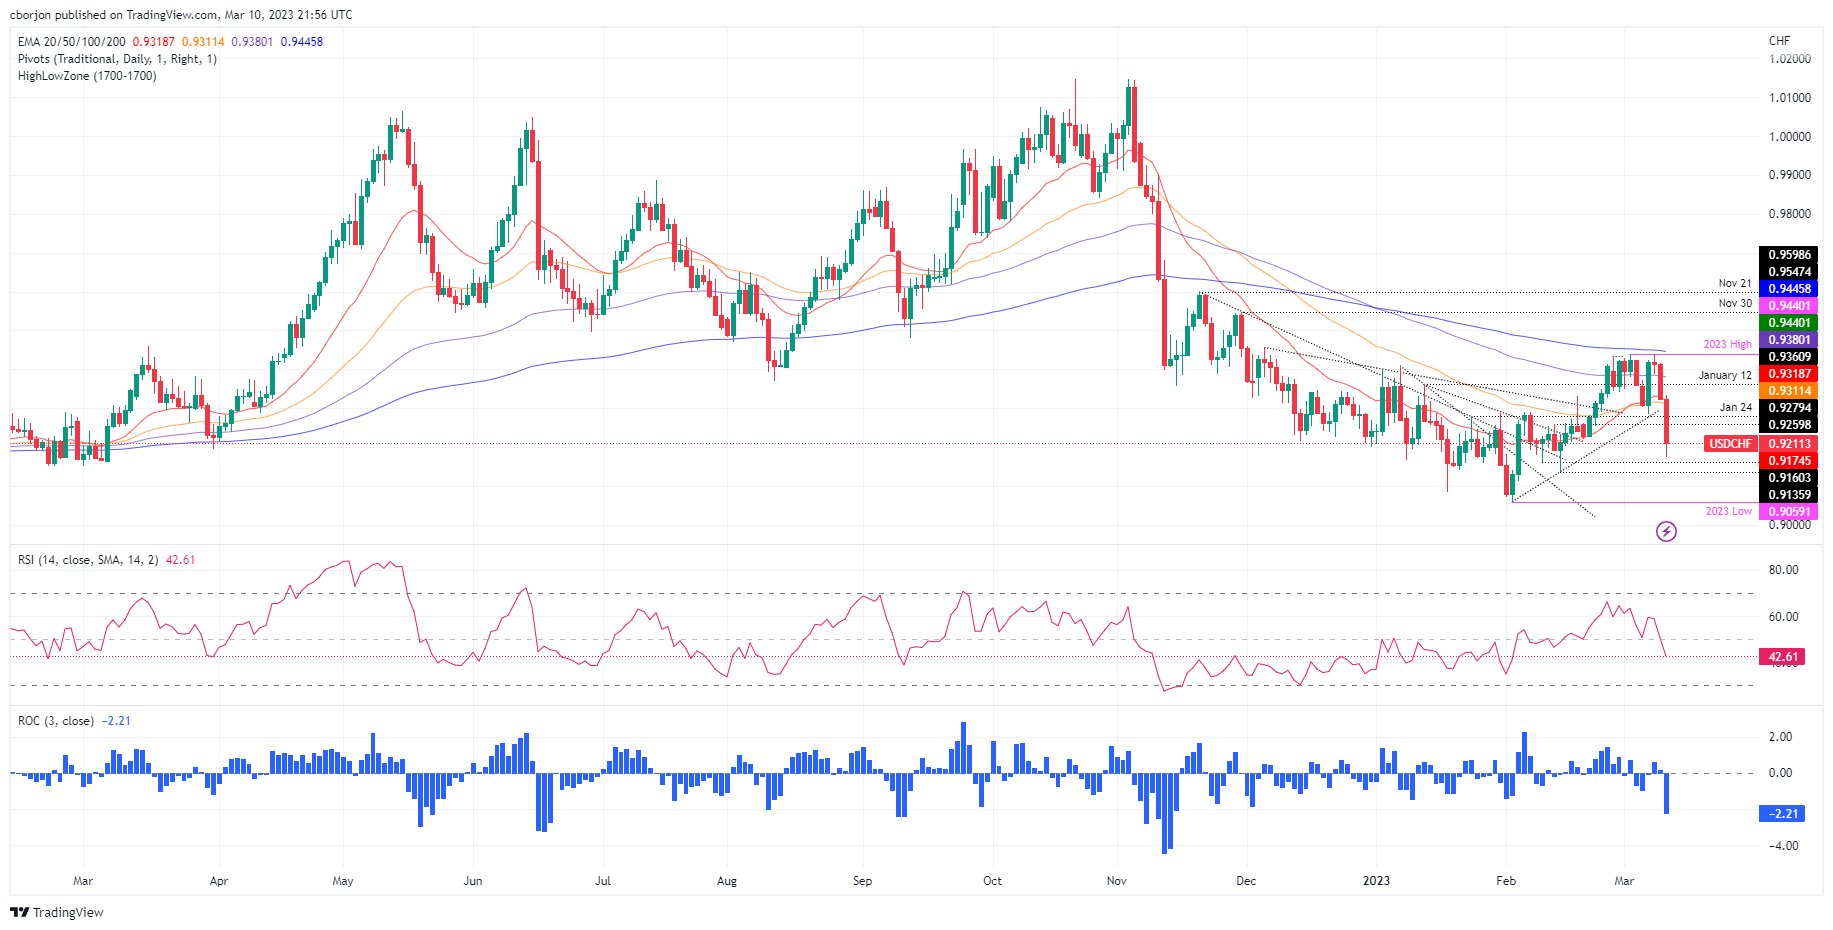
USD/CHF falls below the confluence of the 20 and 50-day Exponential Moving Averages (EMAs), extending its daily losses to more than 1% Friday. A mixed US jobs report weighed on the US Dollar (USD). Sentiment deteriorates on a US bank collapse, which could have spillover in the country. At the time of writing, the USD/CHF is trading at 0.9216.
USD/CHF Price Action
After dropping below the intersection of the 20 and 50-day EMAs, the USD/CHF shifted downwards. During the day, the pair reached a multi-week low of around 0.9174 before buyers stepped in and lifted the price above the 0.9200 figure.
With the Relative Strength Index (RSI) turning bearish and the Rate of Change (RoC) showing that sellers are gathering momentum, the USD/CHF path of least resistance is downwards.
That said, the USD/CHF pair's first support would be the 0.9200 figure. Once broken, the pair would test the March 10 low at 0.9174, followed by the February 14 swing low at 0.9140. A breach of the latter will expose the 0.9100 figure, followed by the YTD low at 0.9059.
In an alternate scenario, if the USD/CHF reclaims 0.9300, that would keep the bulls hopeful for testing the 0.9400 figure. However, buyers must conquer the 50 and 20-day EMAs at 0.9311 and 0.9319.
USD/CHF Daily Chart
USD/CHF Technical Levels
- EUR/USD reached a two-week high at 1.0700 and finished the week with minimal gains.
- Sentiment shifted sour on a default by the Silicon Valley Bank in the US, at the risk of spillover in the sector.
- US jobs data was mixed but flashed signs of cooling down.
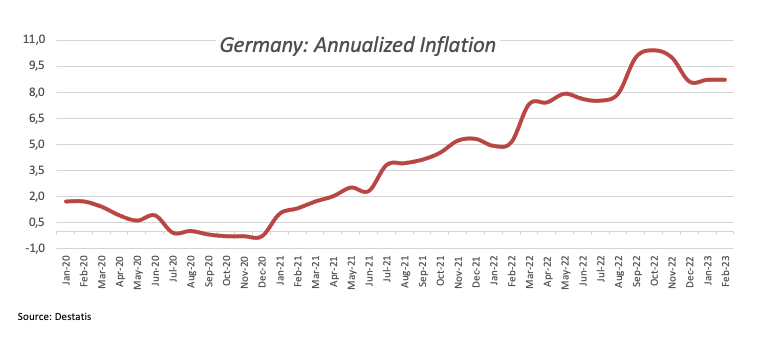
- Germany’s inflation was unchanged and warranted further tightening by the ECB.
The EUR/USD rose 0.45% late in the New York session in a volatile trading day, with Wall Street set to register substantial losses blamed on a US bank collapse. That overshadowed an awaited US jobs report, scrutinized by investors as the US Federal Reserve (Fed) noted that it would increase rates faster. At the time of writing, the EUR/USD exchanges hand at 1.0639.
Risk aversion failed to bolster the USD amidst a potential bank crisis in the US
The US cash equity markets are about to finish the week on the back foot. US regulators seized the Silicon Valley Bank (SVB) after the institution failed to raise capital to meet its requirements. That sent shockwaves across different asset segments as worries for a spillover increased.
Aside from this, the US Department of Labor revealed the February Nonfarm Payrolls report. Figures exceeded forecasts of 205,000 and came at 311,000. Even though the headline made a case for a stronger US Dollar (USD), delving into the details, the Unemployment Rate edged to 3.6% vs. 3.4% estimates, a sign that the labor market is cooling. Average Hourly Earnings increased by 4.6% YoY, below 4.7% estimates.
In the Eurozone (EU) front, Germany reported inflationary data at 8.7% YoY, unchanged from the previous month. The Harmonised Index of Consumer Prices (HICP) rose 9.3% YoY, cementing the case for further tightening by the European Central Bank (ECB).
EUR/USD Technical Levels
Analysts at CIBC point out that the February Canadian employment report wasn't as dramatic as January’s surge, but a slightly above consensus employment gain is another sign that the Canadian economy has more momentum to start 2023 than had initially been expected.
Less drama, still solid momentum
“Although employment growth wasn't as dramatic this month as it has been in the recent past, the underlying trend remains stronger than what would normally be justified by the pace of GDP. Because of that, we still expect to see some softer employment figures and a gradual rise in the unemployment rate throughout the balance of this year, particularly as economic activity slows further with the lagged impact of past interest rate hikes.”
“For now the still historically low unemployment rate and strong wage growth will keep the Bank of Canada leaning towards future rate hikes, although we still don't think the data will be strong enough for policymakers to actually move again.”
Data released on Friday showed the US economy added 311K new jobs in February, surpassing expectations. Analysts at Wells Fargo point out that while hiring remained on a roll, there were hints that strong job growth need not come at the expense of fanning inflation pressures. They see the Federal Reserve remaining in tightening mode.
Solid hiring continued in February, but slowdown in store
“But at 3.6% unemployment, the jobs market incredibly tight. We are therefore wary to extrapolate the degree of easing in earnings growth over the past year, which was likely helped along by the restaffing and job-switching frenzy after the initial phase of COVID dying down. With labor still in fairly short supply, wage pressures are likely to remain elevated in the near term.”
“Even with February's increase in the unemployment rate, the labor market remains incredibility tight. While we expect hiring to slow more markedly from here, there remains plenty of scope for the jobs market to weaken before concerning the Fed.”
“We expect the FOMC to remain in tightening mode awhile yet, with the bar for a 50 bps hike at the upcoming March meeting looking somewhat higher after today's report showing some easing of inflation pressures coming from the jobs market.”
What you need to take care next week:
The US Dollar dropped sharply on Friday after the US employment report. The DXY erased all the gains that followed Federal Reserve Jerome Powell's hawkish remarks. The US economy added more jobs than forecast in February (311K vs 205K) and confirmed the shocking numbers of January. However, the Unemployment Rate rose to 4.6% and wage growth slowed down. Before NFP, expectations about a 50 basis points rate hike at the next FOMC meeting were elevated and then pulled back, pushing US yields to the downside. Treasury bonds also rose amid risk aversion. The VIX (Fear index) jumped on Friday to 27.42, a level not seen since late October. US stock indices added to losses on Friday, ending the week with a decline of more than 4%.
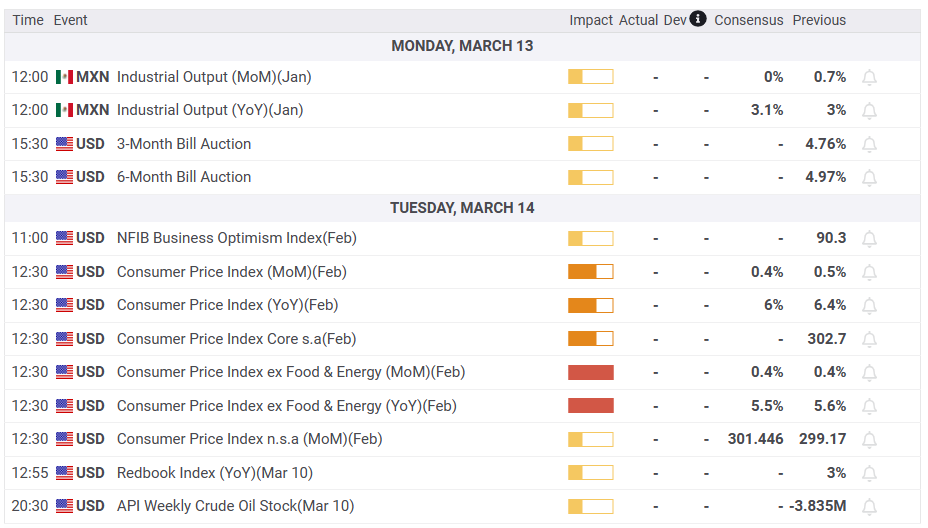
Next week will be quiet on Fed talk as FOMC enters the blackout period. It will be time for rumours and speculations ahead of the March 21-22 meeting. Analysts differ in their forecast, some going for a 25 bps hike and others for 50 bps. The key economic report that could end the debate will be on Tuesday with the US Consumer Price Index. Those numbers would be critical for the consideration of the Fed's rate hike. More inflation numbers are due on Wednesday with the Produce Price Index; also Retail Sales will be reported the same day.
DXY peaked near 106.00, the highest since November and then dropped all the way back to 104.50. The US 2-year Treasury yield rose to the highest since 2007 at 5.08%, falling on Friday to 4.58%, the lowest in three weeks. Despite DXY's reversal, the Dollar held onto weekly gains versus emerging market and commodity currencies.
USD/JPY dropped for the second week in a row after being unable to consolidate above 137.00 hit by lower bond yields and the sell-off in Wall Street. At Kuroda's last meeting, the Bank of Japan kept its policy rate, the Yield Curve Control parameters and guidance unchanged.
Among the week's top performers was the Swiss Franc boosted by risk aversion, lower yields and Swiss inflation data. USD/CHF suffered the worst weekly loss since November. The Australian Dollar was the biggest loser on G10 space affecter after the Reserve Bank of Australia's dovish rate hike. Next Thursday, Australia will report employment numbers. AUD/USD broke the key 0.6600 support area and plunged to the weakest since November. One of the best of the week was selling AUD/CHF after the RBA meeting.
USD/CAD gained over 200 pips over the week, posting above 1.3800, the second-highest weekly close since May 2020. On Wednesday, the Bank of Canada left rates unchanged (as expected) after eight consecutive hikes and said it will stay on "a conditional pause". The Canadian economy added 21.8K jobs in February, above the 10K expected.
EUR/USD erased weekly losses rising back toward 1.0650 on Friday. The pair continues to move sideways between 1.0530 and 1.0700. Next Thursday, the European Central Bank is expected to hike interest rates by 50 basis points. Some debate is emerging at the board about its forward guidance. EUR/GBP is still clinging to the 0.8850 area. GBP/USD rebounded from 1.1800, peaked at 1.2115, to settle around 1.2040. UK employment data is due on Tuesday.
- GBP/USD rallied almost 1% or 114 pips on Friday, post US NFP.
- Bulls struggle at the 200-day EMA, exacerbating a GBP/USD fall of 60 pips to current rates.
- GBP/USD Price Analysis: The bias is bearish, but upside risks remain.
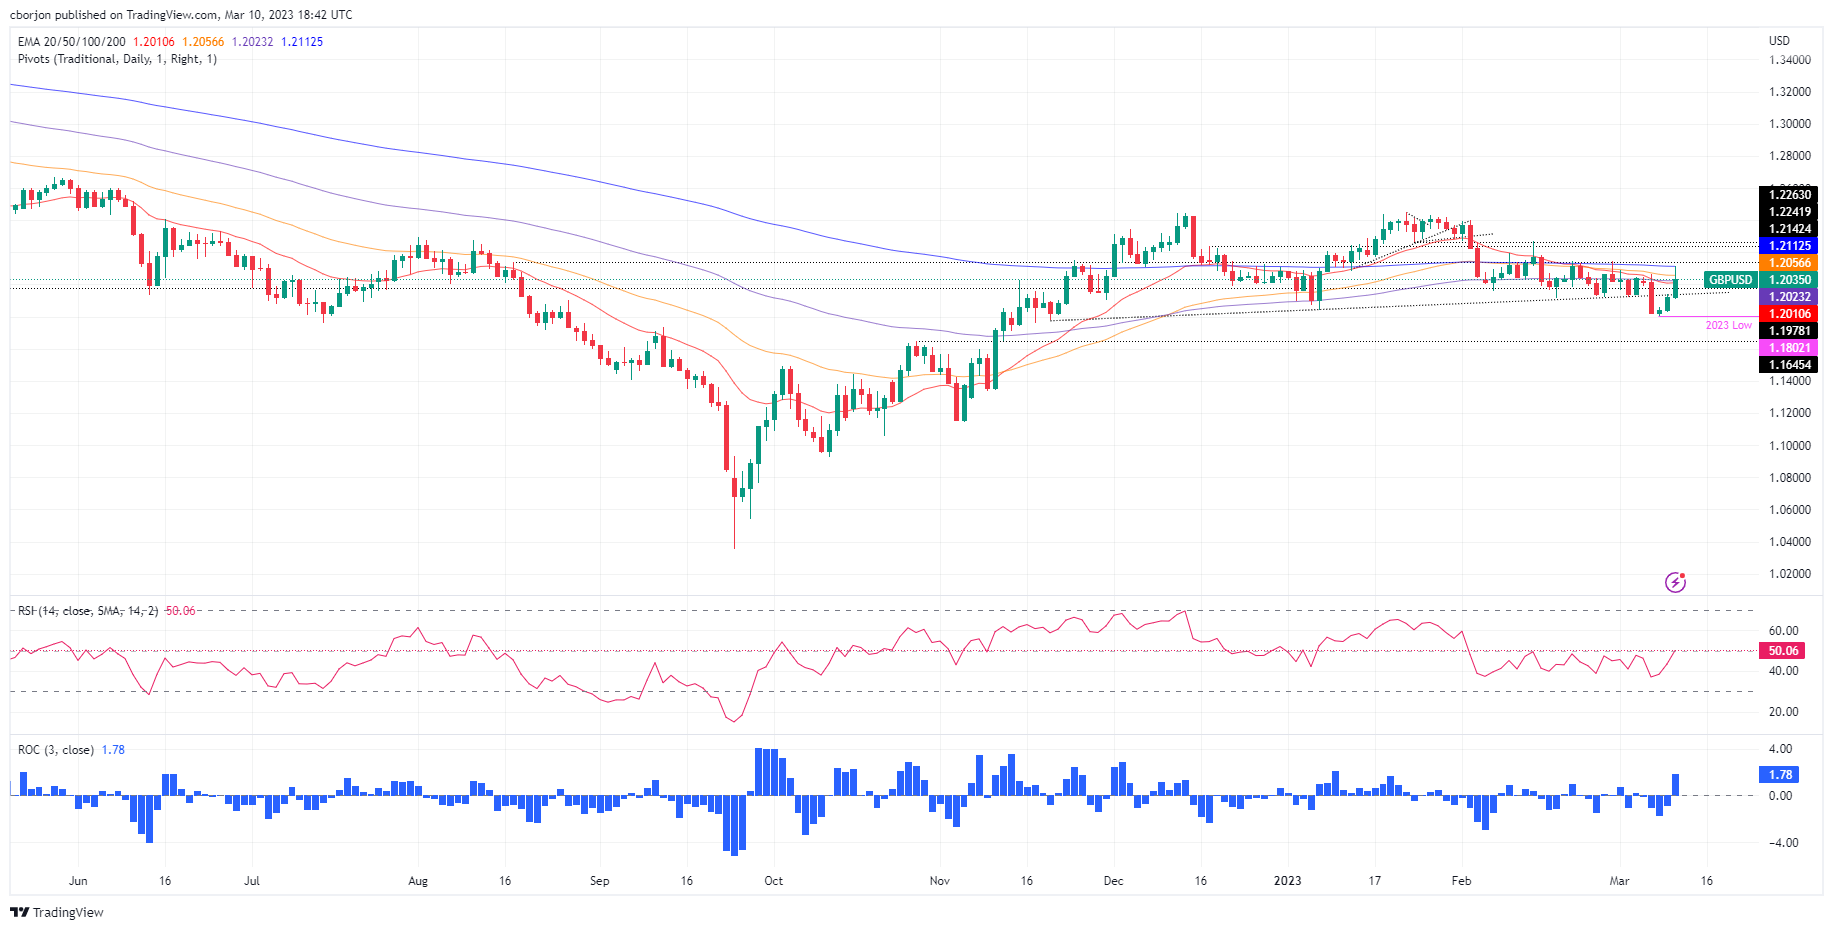
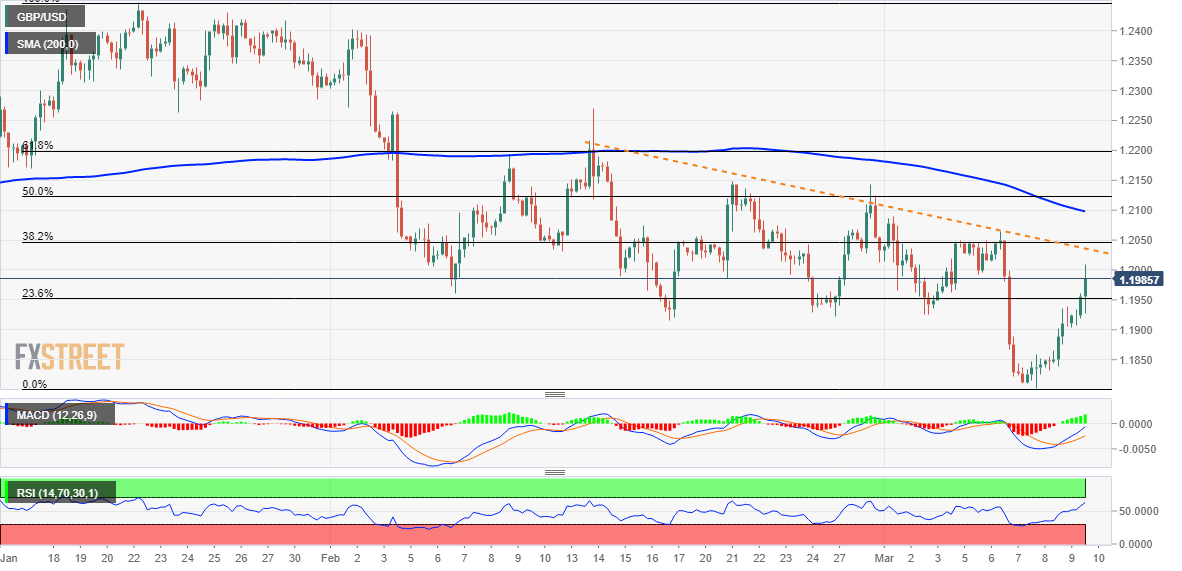
GBP/USD recovers some ground getting ready to finish the week with minimal gains after bouncing off YTD lows at 1.1802, with buyers reclaiming 1.2000 on a mixed US jobs report. At the time of writing, the GBP/USD is trading at 1.2040, above its opening price y 1.01%.
GBP/USD Price Action
The GBP/USD has reclaimed the 1.2000 figure, but its bias has not changed. The aftermath of the US Nonfarm Payrolls report witnessed the Pound Sterling (GBP) reaching the 200-day Exponential Moving Average (EMA) at 1.2112. However, sellers stepped in and dragged the spot beneath the 1.2100 mark.
On its way south, the GBP/USD pierced under the 50-day EMA, leaving the exchange rates around familiar levels. Nevertheless, the 100 and 20-day EMAs are resting below the current prices, warranting further consolidation ahead.
For a bearish resumption, the GBP/USD needs to crack the 100 and 20-day EMAs, each at 1.2023 and 1.2010, respectively. After that, the 1,2000 figure could be grabbed, paving the way for further downside. The following support would be the 1.1900 figure, ahead of the YTD low at 1.1802.
Conversely, the GBP/USD must reclaim the 50-day EMA at 1.2056 if buyers want to remain hopeful of shifting the trend. The next resistance would be 1.2100, followed by the 200-day EMA at 1.2112.
GBP/USD Daily Chart
GBP/USD Technical Levels
- USD/MXN to finish flat on Friday after rallying to a new two-week high of around $18.60.
- The US Bureau of Labor Statistics revealed the US economy added more jobs than expected.
- A rise in the US unemployment rate would warrant a less hawkish Federal Reserve.
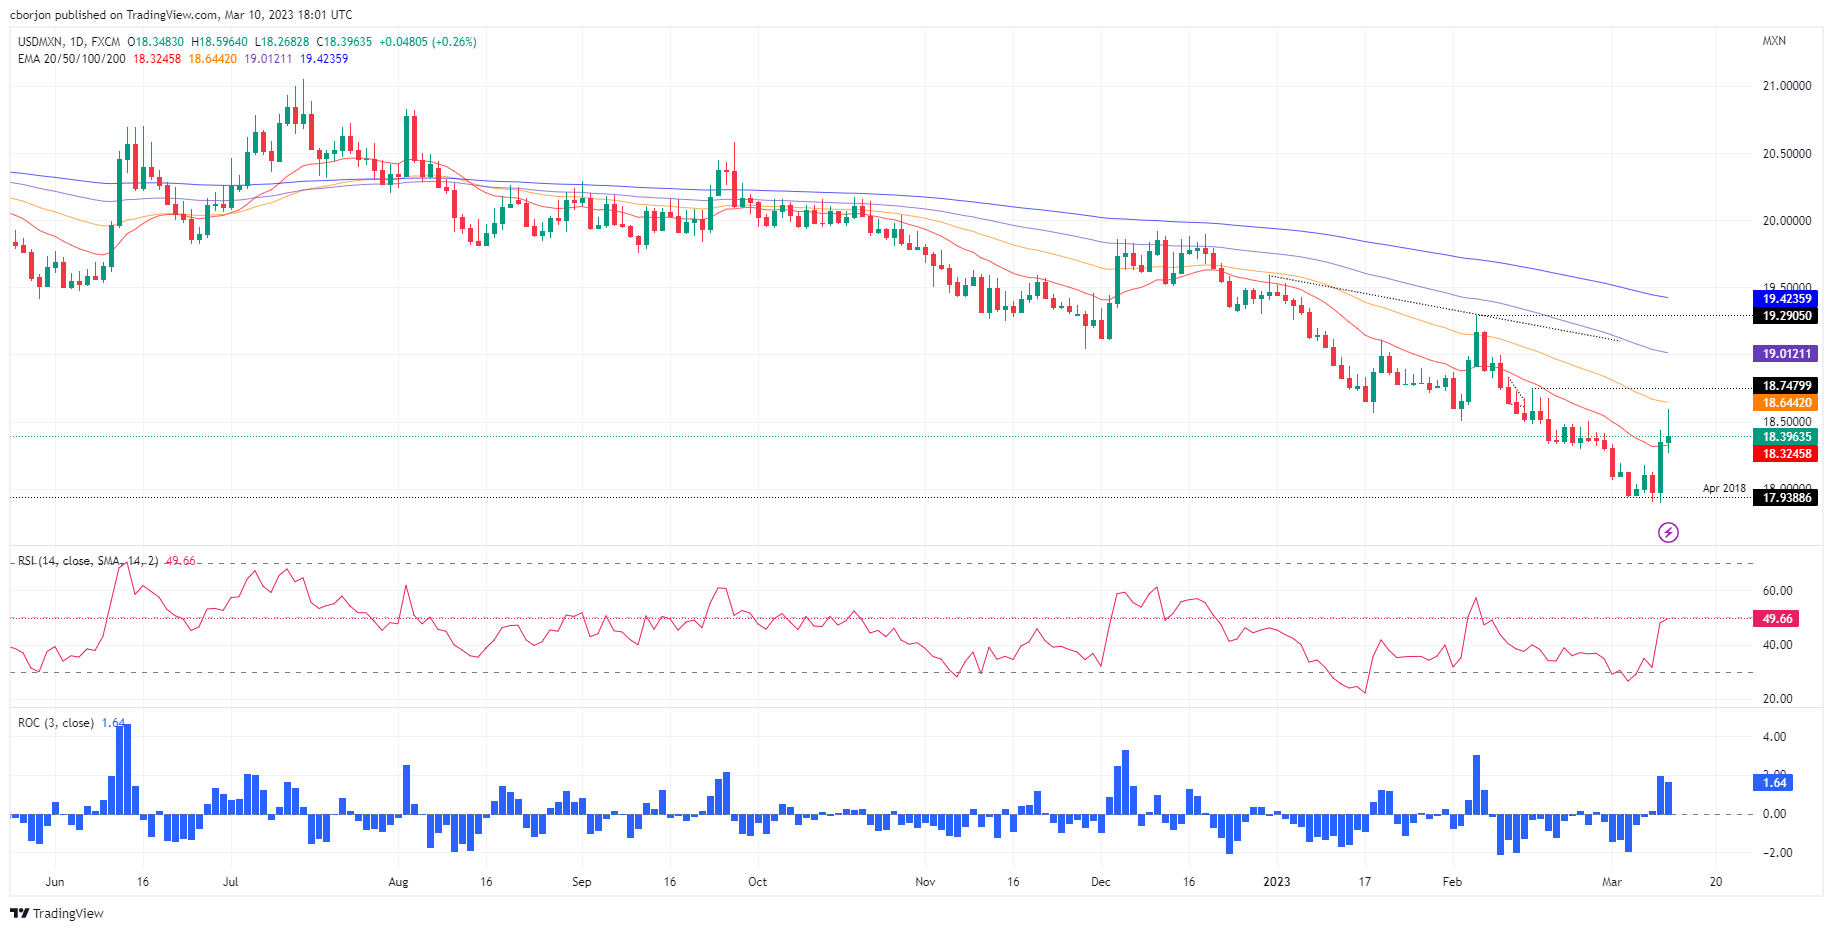
USD/MXN is almost flat after hitting a daily high of 18.5964, though a mixed US employment report weighed on the US Dollar (USD). However, the USD/MXN is still clinging to its gains, up 0.12%, trading at 18.3707.
US Nonfarm Payrolls and the Unemployment Rate rose, the Fed eyed
Sentiment remains sour on US domestic issues about the failure of the Silicon Valley Bank, which overshadowed US economic data. The US Bureau of Labor Statistics (BLS) revealed the February US Nonfarm Payrolls report, with figures exceeding expectations of 225,000, as the US economy created 311,000 jobs. Although data suggests further tightening by the Federal Reserve, the Unemployment Rate was 3.6%, higher than the forecasted 3.4%, indicating a softer labor market.
The previous month’s data was revised lower from 517,000 to 504,000. Average Hourly Earnings increased by 4.6%.
Meanwhile, the US Dollar Index (DXY), which tracks the buck’s value against a basket of six currencies, drops 0.87%, is at 104.365. US Treasury bond yields are plunging across the board, with the 10-year yield down almost 20 bps, at 3.712%.
Reflection of the above mentioned is traders assessing a less aggressive Fed, compared to Powell’s speech on Tuesday. Money market futures estimates a 25 bps rate hike in March and foresee the first rate cut by the year’s end.
The lack of economic data in the Mexican docket keeps traders leaning on sentiment news. US Regulators shut down the Silicon Valley Bank, as the FDIC has seized the bank. Read more here!
USD/MXN Technical analysis
The USD/MXN has shifted neutral to downward biased after buyers reclaimed the 20-day EMA at 18.3247. The US jobs report assisted the Mexican Peso (MXN) and capped the rally that printed a weekly high at 18.5964, shy of the 50-da y EMA at 18.6442. As the New York session progresses, Friday’s candlestick turns to an inverted hammer, which could form an evening star pattern. A further downside in the USD/MXN is expected if that scenario plays out. For a bearish continuation, USD/MXN sellers need to reclaim $18.15. On the flip side, buyers keeping the USD/MXN exchange rate above the 20-day EMA would remain hopeful of testing the 50 and 100-day EMAs in the next week, around 18.644 and 19.0122.
What to watch?
The California Department of Financial Protection and Innovation closed Silicon Valley Bank and appointed the Federal Deposit Insurance Corporation (FDIC) as receiver.
Equity prices of SVB Financial Group collapsed during the week. On Wednesday the bank surprised by announcing it needed to raise $2.25 billion in stock, triggering concerns.
The situation around Silicon Valley Bank weighed on the banking sector and in the overall market sentiment. It is the largest bank to fail since the 2008/2009 financial crisis.
More from the FDIC:
“To protect insured depositors, the FDIC created the Deposit Insurance National Bank of Santa Clara (DINB). At the time of closing, the FDIC as receiver immediately transferred to the DINB all insured deposits of Silicon Valley Bank.”
“All insured depositors will have full access to their insured deposits no later than Monday morning, March 13, 2023. The FDIC will pay uninsured depositors an advance dividend within the next week. Uninsured depositors will receive a receivership certificate for the remaining amount of their uninsured funds. As the FDIC sells the assets of Silicon Valley Bank, future dividend payments may be made to uninsured depositors.”
“Silicon Valley Bank had 17 branches in California and Massachusetts. The main office and all branches of Silicon Valley Bank will reopen on Monday, March 13, 2023.”
“As of December 31, 2022, Silicon Valley Bank had approximately $209.0 billion in total assets and about $175.4 billion in total deposits. At the time of closing, the amount of deposits in excess of the insurance limits was undetermined.”
“Silicon Valley Bank is the first FDIC-insured institution to fail this year.”
- Silver advances more than 2%, set to finish the week almost flat.
- US jobs data was mixed, but the unemployment rate rose, signaling the cooling labor market.
- Traders rushed into precious metals, uncertain about next week’s US inflation data, and punished the US Dollar.
Silver price rallies on the back of a mixed US jobs report that witnessed more Americans than estimated added to the workforce. Even though that would result in a strong US Dollar (USD), the Unemployment rate edged up, taking pressure off the US Federal Reserve (Fed). At the time of writing, the XAG/USD is trading at $20.49 a troy ounce.
Federal Reserve expected to hike gradually as the unemployment rate upticks
Wall Street extended its losses due to a risk-off impulse. The US Department of Labor (DoL) revealed that Nonfarm Payrolls in February rose by 311,000 jobs, more than the 225,000 expected. January’s job numbers were lowered from 517,000 to 504,000. The jobless rate was 3.6%, higher than the forecast of 3.4%, indicating a weaker labor market. Wages rose by 4.6%, and attention turned to the US inflation data next week.
During the week, the US Fed Chair Jerome Powell said that higher and potentially faster interest rate hikes could be needed at his appearance in the US Congress. He added that the US economy remains solid and that the Fed will be watching Nonfarm Payrolls figures and next week’s February Consumer Price Index (CPI) readings.
Market participant’s reaction sees the Federal Reserve hiking 25 bps at the upcoming March meeting. Based on the US jobs data, money market futures expect Powell and Co. will cut rates by the end of 2023.
Additionally, investors sent the greenback tumbling, as shown by the US Dollar Index (DXY) dropping 0.87% at 104.360. US Treasury bond yields extended their losses, with the 10-year yield plunging 16 bps, at 3.741%, a tailwind for precious metals prices. XAG/USD is up more than 2% after testing YTD lows at around $19.92.
XAG/USD Technical levels
Turkish general elections are set to take place in Q2-2023. Economists at Wells Fargo analyze how the outcome of the presidential election could impact the Lira (TRY).
TRY can hold steady if President Erdogan retains office
“Should President Erdogan retain office, the Turkish Lira likely hovers around current levels through the end of the election cycle. Longer-term, as economic trends and monetary policy frameworks go unchanged, large one-off TRY depreciations could materialize, but at a minimum we expect lira depreciation through the middle of 2024. We believe USD/TRY can reach 19.50 by Q4-2023 and trend to 20.00 by mid-2024. ”
“In our regime change scenario, the Lira could experience one of the most sizable rallies in modern history as an independent central bank gets restored and an orthodox monetary policy framework is implemented. In this scenario, USD/TRY can end 2023 around 15.00 and reach 14.00 by mid-2024.”
The FOMC will maintain the ‘higher for longer’ outlook for interest rate policy. Thus, economists at Rabobank expect the US Dollar to streghthen, driving EUR/USD and USD/CHF to 1.05 and 1.05 on a three-month view, respectively.
USD will remain underpinned this year
“Earlier this week, the hawkish tone of Chair Powell’s testimony led to an increase in market expectations that the Fed could hike interest rates by 50 bps at its March policy meeting. His tone was pared back a touch on the second leg of his hearing the following day when he indicated that the discussion about the size of the move was still in play.”
“For choice, we maintain the view that policymakers will be forced into holding rates higher for longer to push inflation back to the 2% level.”
“We maintain our expectation that the USD will remain underpinned this year. We see risk of dips to EUR/USD 1.05 on a three-month view and forecast USD/CHF at 0.95 in three months.”
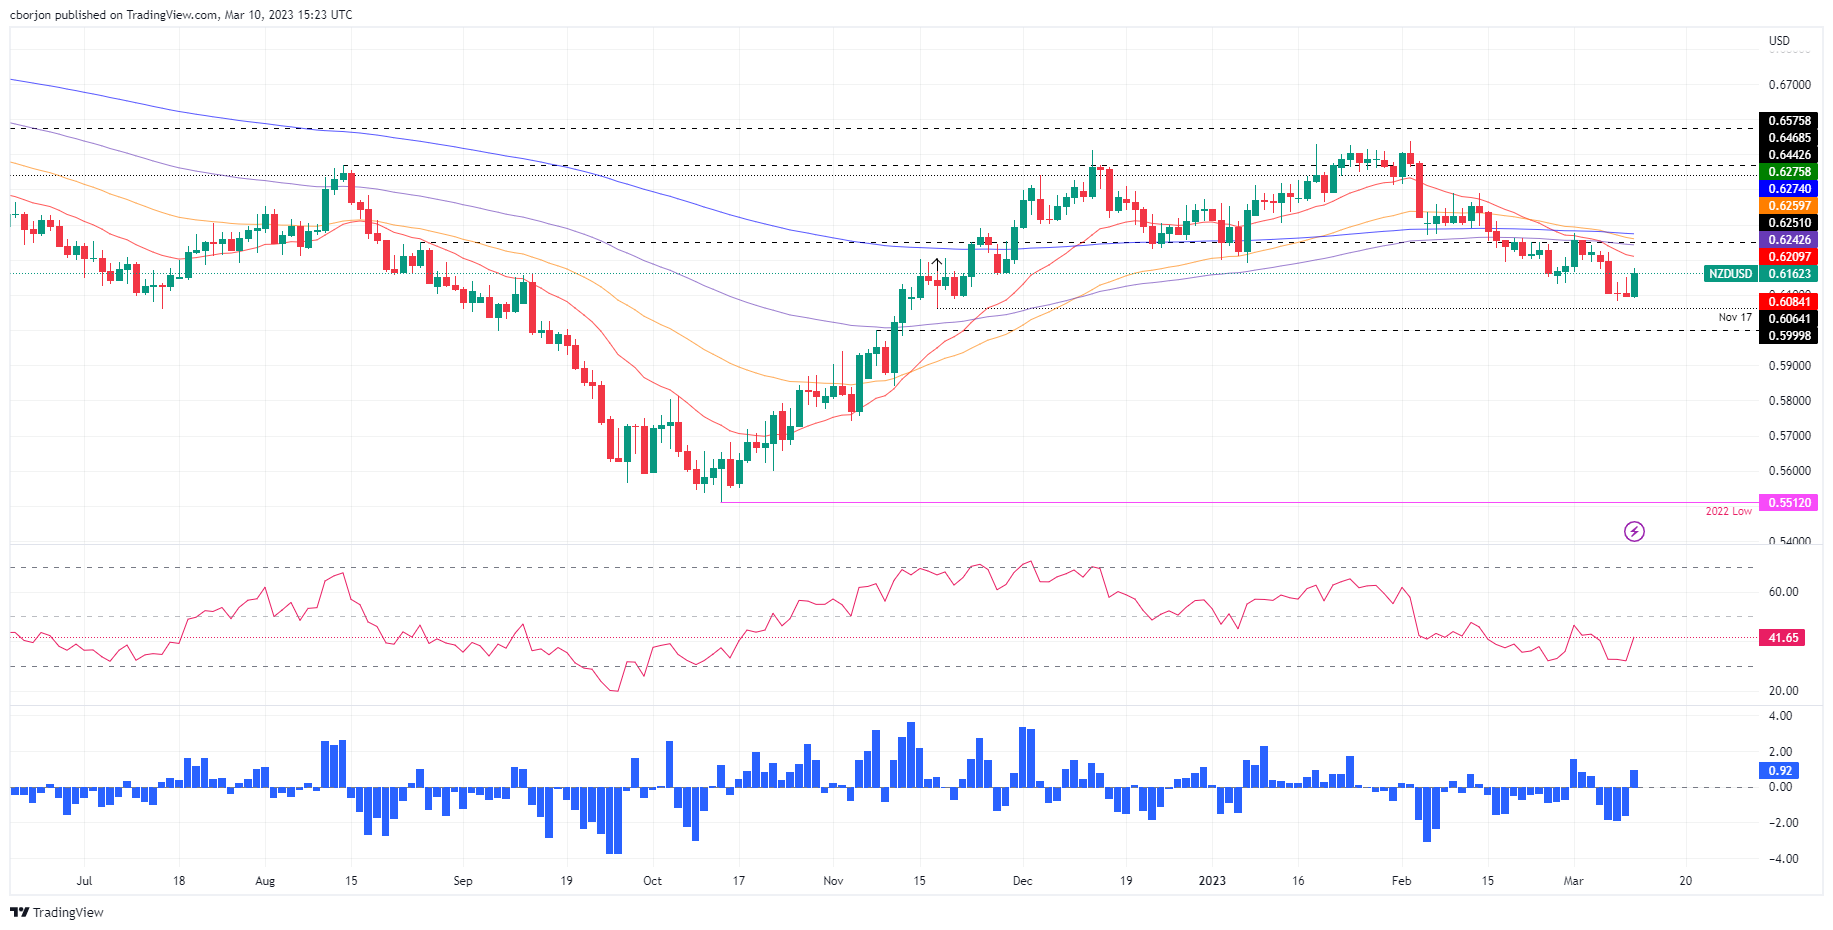
- NZD/USD edges up following a mixed US Nonfarm Payrolls report.
- The Unemployment Rate in the United States edged up, easing pressure on the Federal Reserve to act.
- NZD/USD Price Analysis: It is still downward biased but could test 0.6200.
NZD/USD advances sharply following the release of mixed labor market data in the United States (US). Wall Street opened in the red, reflecting a sour sentiment, while the US Dollar (USD) weakened across the FX board. At the time of writing, the NZD/USD advances 0.76% and trades at 0.6142.
Post US NFP money market futures begin to price in a less hawkish Fed
The highlight of the day, the US Nonfarm Payrolls report for February, showed the economy adding 311,000 jobs, exceeding estimates. January’s data was revised down from 517,000 to 504,000. The Unemployment Rate was above estimates of 3.4%, at 3.6%, signaling that the labor market is easing. Average Hourly Earnings grew 4.6%, and the focus shifted toward the US Consumer Price Index (CPI) next Tuesday.
The data weakened the US Dollar, as shown by the NZD/USD climbing from 0.6117 to 0.6140s. Investors’ initial assessment of the report sees the US Federal Reserve (Fed) hiking rates by 25 bps in March., contrarily to a 50 bps increment. Meanwhile, the swaps markets foresee the first rate cut by the year’s end.
During the week, Fed Chief Jerome Powell stated that rates would peak higher, and if data warranted a faster pace of tightening, the US central bank is ready to act. Now that the first tranche of US data is under the belt, Powell and Co. will be focused on next week’s CPI. Traders should remember that the Fed blackout would begin on Friday at 23:59 hrs.
On the New Zealand front, the economic calendar featured Business PMI in New Zealand, which came at 52 above the previous month’s reading of 50.8, rising for two consecutive months after bottoming around 47.4 in November 2022. Manufacturing Sales in NZ plunged 9.9% YoY, its most significant decline since mid-2020.
NZD/USD Technical analysis
NZD/USD daily chart suggests the downtrend stays intact after a death cross emerged on March 7. That exacerbated the major’s fall to YTD lows of 0.6084. Nevertheless, the uptick in the unemployment rate in the US spurred a jump in the NZD/USD towards the 0.6150s area. If the NZD/USD reclaims the 20-day EMA at 0.6209, that will pave the way toward the 100-day EMA at 0.6242. Otherwise, the NZD/USD could be headed back to 0.6100 before testing the YTD lows.
The Canadian labour market remains red-hot. While the jobs data might do little to assuage the BoC's concern over whether they have done enough on rate hikes, the CAD remains near-term challenged, economists at TD Securities report.
CAD to stay on the defensive on crosses
“The Canadian labour market continues to fire on all cylinders with no sign of mean reversion after 150K jobs were added in January. This number will not change that risks are far more fluid around the Fed than the BoC.”
“Moreover, we think a higher fed funds terminal rate could raise the perceived risk of a hard landing or a financial accident. That, alongside domestic debt imbalances and fragile risk sentiment, should keep CAD on the defensive for now.”
“We see support emerging into 1.3750 for USD/CAD, and CAD biased to lag on crosses.”
Economists at ING expect the AUD/USD pair to remain under pressure near term. However, the Aussie is set to regain some ground in the second half of the year.
Room to recover beyond the short-term
“AUD has been hit quite hard from the deterioration in global risk sentiment and geopolitical turmoil. Improvements in those two factors are needed to allow a rebound in AUD/USD, and that may only start to materialise from the second quarter onwards."
“But the Chinese growth story continues to place AUD in a rather advantageous spot to benefit from a broader stabilisation in risk sentiment.”
“A slowdown in inflation creates problems for RBA hawks, but our base case is still that 4.10% will be reached, and that AUD/USD will climb back sustainably above 0.70 in the second half of 2023.”
- The index extends the drop to 3-day lows near 104.60.
- US yields drop further in the wake of the US jobs report.
- The US economy created more jobs than initially estimated in February.
The greenback now loses further ground and breaks below the key 105.00 barrier when tracked by the USD Index (DXY) on Friday.
USD Index weakens post Payrolls
The selling pressure picks up pace around the greenback as market participants continue to digest the mixed US jobs report for the month of February.
On the latter, the US economy created 311K jobs, once again surpassing consensus for a gain of 205K jobs. Furthermore, the December print was revised to 504K (from 517K).
Somehow removing optimism from the report, the Unemployment Rate increased to 3.6% and the Average Hourly Earnings – a proxy for inflation via wages – rose 0.2% MoM and 4.6% from a year earlier. Additionally, the Participation Rate increased marginally to 62.5% (from 62.4).
Following the release of the February Payrolls, investors now see a 25 bps rate hike as once again the most likely scenario at the Fed’s gathering on March 22, which also weighs on the mood surrounding the buck and props up the corrective decline.
What to look for around USD
The index loses further ground as traders now reduce their bets on a 50 bps rate hike by the Fed later in the month.
The dollar, in the meantime, succumbs to the better tone in the risk-associated universe and gives away part of the recent strong rebound sponsored by hawkish messages from Fed speakers and by Chief Powell at both his testimonies earlier in the week.
In addition, the still elevated inflation as well as the solid labour market and the resilient economy in general also seem to underpin the tighter-for-longer stance from the Federal Reserve.
Key events in the US this week: Nonfarm Payrolls, Unemployment Rate, Monthly Budget Statement (Friday).
Eminent issues on the back boiler: Rising conviction of a soft landing of the US economy. Persistent narrative for a Fed’s tighter-for-longer stance. Terminal rates near 5.5%? Fed’s pivot. Geopolitical effervescence vs. Russia and China. US-China trade conflict.
USD Index relevant levels
Now, the index is retreating 0.69% at 104.55 and the breakdown of 104.09 (weekly low March 1) would open the door to 103.53 (55-day SMA) and finally 102.58 (weekly low February 14). On the other hand, the next up-barrier aligns at 105.88 (2023 high March 8) seconded by 106.62 (200-day SMA) and then 107.19 (weekly high November 30 2022).
Economists at Commerzbank have adjusted their EUR/USD forecast for the next year.
EUR is likely to weaken again in the second half of next year
“We now expect rates to peak at 6% (previously 5.5%) in the US and at 4% in the Eurozone (previously 3.5%). However, what is more decisive for our EUR/USD projections is that we do not expect any ECB rate cuts until the end of the forecasting horizon in late 2024 anymore, whereas we assume that the US will lower its key rate even further in 2024 than previously projected.”
“We have left our EUR/USD projections for 2023 unchanged, but now expect a further rise in EUR/USD to 1.12 until mid-2024.”
“Only in the second half of next year EUR is likely to weaken again as the realisation is then going to take effect that inflation in the Eurozone is more stubborn and that the ECB was not restrictive enough to return inflation to its target. This will put pressure on the Euro.”

Source: Commerzbank Research
- USD/CAD bears move in aggressively on the Canadian jobs reports and a miss in US UR.
- US Dollar is under pressure as a consequence of the NFP disappointments.
USD/CAD fell to a low of 1.3766 from a high of 1.3862 following both the US Nonfarm Payrolls and the Canadian Employment report. The Canada jobs gain has doubled expectations which throw the rate pause sentiment into scrutiny while the US Unemployment Rate ticked high unexpectedly, adding fuel to the USD/CAD's bears engine.
- Canadian Net Change in Employment Febuuary: 21.8K (exp 10.0K; prev 150.0K).
- Previous month:150K. In December jobs rose 69K
- Employment gain for February 21.8K vs 10.0K estimate.
- Unemployment rate 5.0% vs 5.1% expected.
- Full-time employment 31.1K vs 121.1K last month.
- Part-time employment -9.3K vs 28.9K last month.
- Participation rate 65.7% versus 65.7% expected.
- Average hourly wages permanent employees 5.4% versus 4.5% last month.
US Nonfarm Payrolls
- US change in Nonfarm Payrolls Feb: 311K (exp 225K; prev 517K).
- REVISIONS - US Change in Nonfarm Payrolls Feb: 311K (exp 225K; prev 517K; prevR 504K).
- US Unemployment Rate Feb: 3.6% (exp 3.4%; prev 3.4%).
- US Average Hourly Earnings (MoM) Feb: 0.2% (exp 0.3%; prev 0.3%).
- Average Hourly Earnings (YoY) Feb: 4.6% (exp 4.7%; prev 4.4%).
The main disappointments come in the Unemployment Rate while average hourly earnings were a big disappointment also. The DXY US Dollar index fell to a low of 104.6660 after the data from 105.1620 ahead of the data.
USD/CAD technical analysis
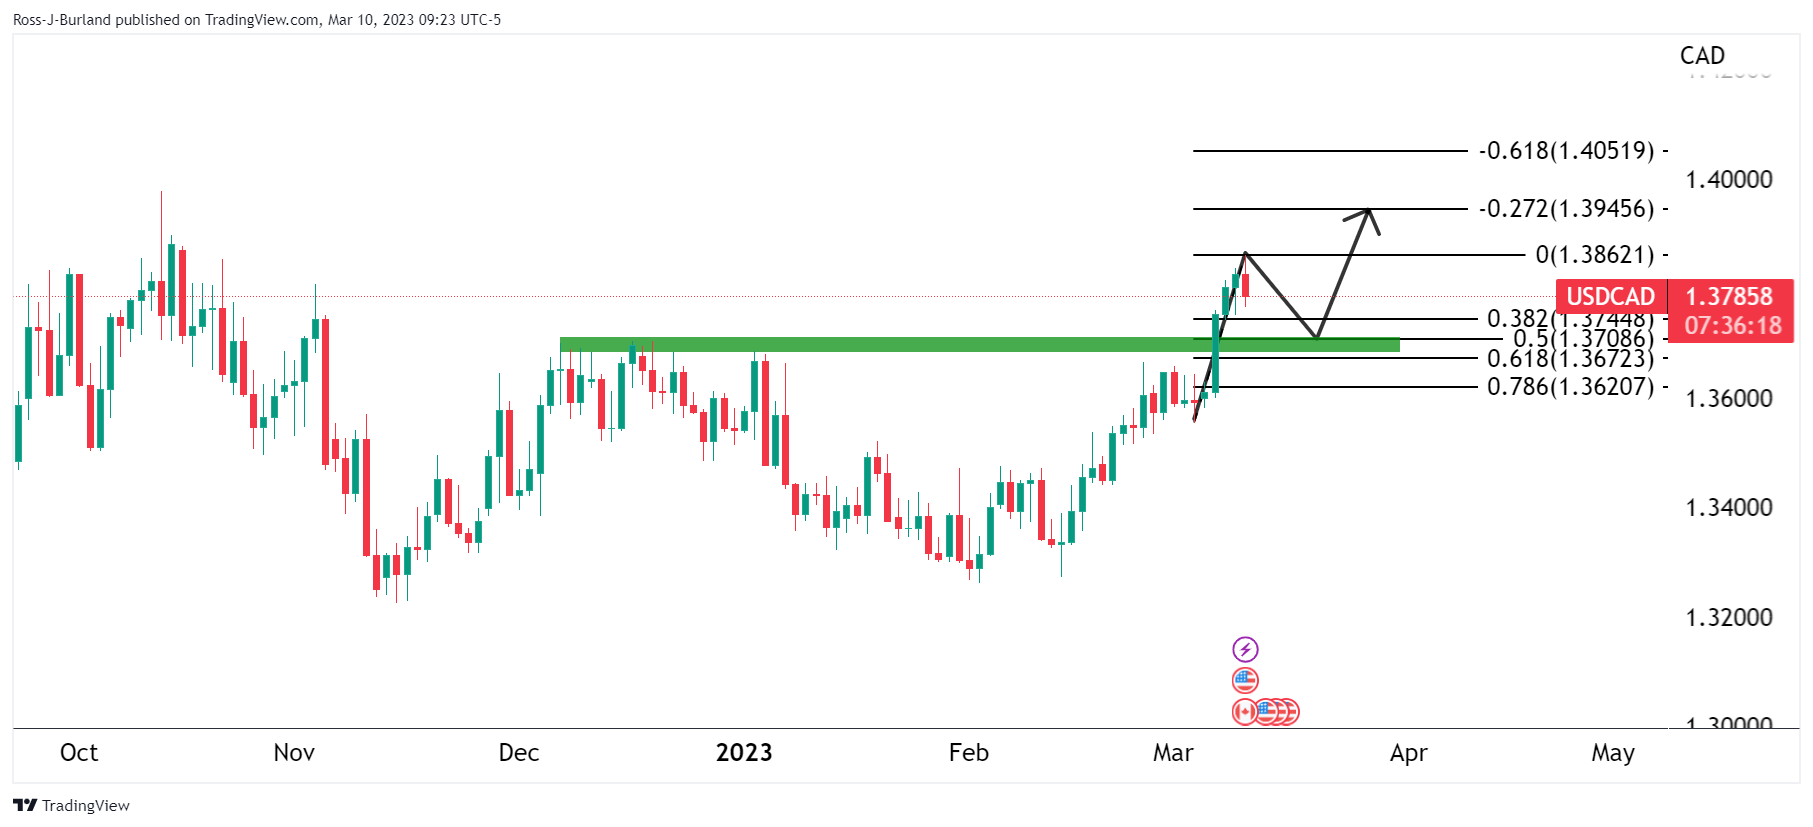
The price is higher on the daily chart and could be due for a correction back into the prior resistance that meets a 50% mean reversion area.
Governor Kuroda’s last monetary policy meeting ended without any surprise policy changes. USD/JPY jumped in reaction. However, economists at MUFG Bank expect the pair to turn back lower.
Bank of Japan left its policy settings unchanged
“There had been a small degree of speculation that Kuroda could make further changes to YCC given the continued dysfunctional JGB market conditions so the unchanged policy announcement has fuelled some Yen selling.”
“USD/JPY has bounced on the back of the BoJ policy announcement but the developments in the US seem far more significant and given the US yield move, a bigger retracement in USD/JPY could be on the horizon.”
- AUD/USD builds on its intraday recovery from a four-month low amid the heavy USD selling bias.
- The mixed US jobs data dampens hopes for a 50 bps Fed rate hike in March and weigh on the buck.
- The RBA’s dovish shifts warrant some caution before placing fresh bullish bets around the major.
The AUD/USD pair stages a modest recovery from a fresh four-month low set earlier this Friday and the momentum picks up pace during the early North American session. The latest leg of a sudden spike in the last hour follows the release of the mixed US jobs data and lifts spot prices to a fresh daily peak, around the 0.6630 region.
The US Dollar weakens across the board after the headline NFP showed that the US economy added 311K new jobs in February, well below the previous month's downwardly revised reading of 504K. Adding to this, the jobless rate unexpectedly rose to 3.6% from the 3.4% previous and wages also fell short of market estimates, rising by 0.2% for the month and a 4.6% YoY rate.
The slight disappointment was enough to force investors to scale back expectations for a more aggressive policy tightening by the Federal Reserve (Fed). In fact, the markets are now pricing in a greater chance of a 25 bps lift-off at the upcoming FOMC meeting on March 21-22, which continues to drag the US Treasury bond yields lower and is seen weighing on the Greenback.
Apart from this, a modest recovery in the US equity futures further undermines the safe-haven buck and benefits the risk-sensitive Australian Dollar. That said, the lack of strong follow-through buying, along with the Reserve Bank of Australia's dovish shift earlier this week, some warrants caution for bulls and before placing aggressive bullish bets around the AUD/USD pair.
Technical levels to watch
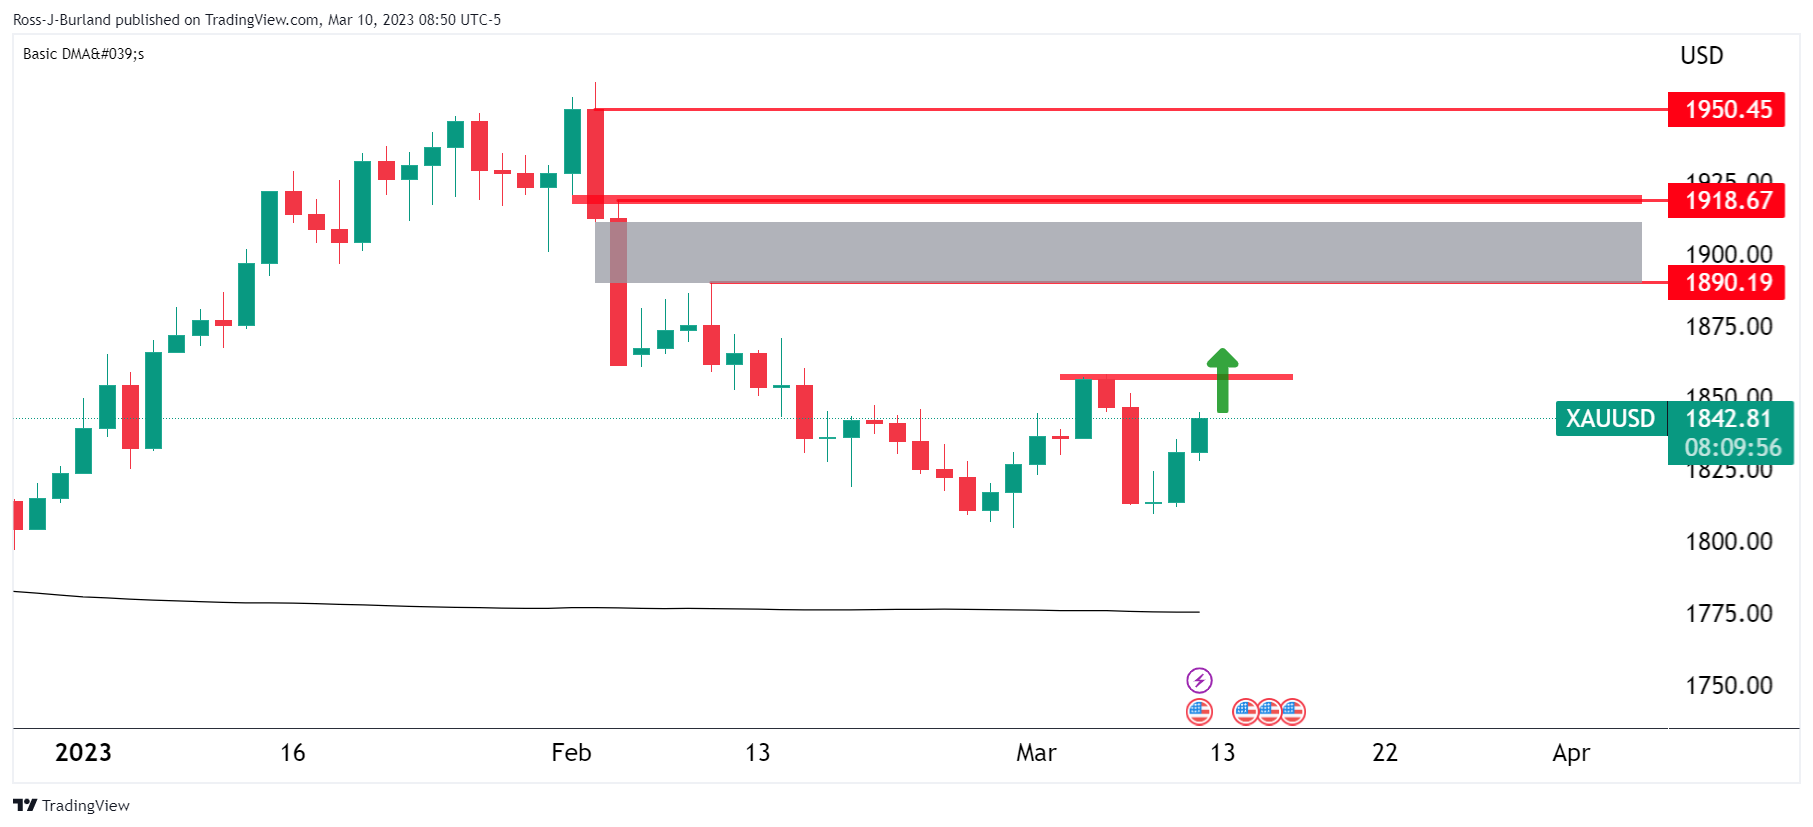
- Gold price rallies on the knee-jerk after Nonfarm Payrolls.
- Gold price bulls eye a break of $1,850 to take back control.
Gold price had been moving higher for a third consecutive day on Friday but the yellow metal was on track for a weekly fall as prospects of further interest rate hikes dented the precious metal's allure, while traders awaited a US Nonfarm Payrolls report.
The Nonfarm Payrolls report has arrived as follows:
US Nonfarm Payrolls
- US change in Nonfarm Payrolls Feb: 311K (exp 225K; prev 517K).
- REVISIONS - US Change in Nonfarm Payrolls Feb: 311K (exp 225K; prev 517K; prevR 504K).
- US Unemployment Rate Feb: 3.6% (exp 3.4%; prev 3.4%).
- US Average Hourly Earnings (MoM) Feb: 0.2% (exp 0.3%; prev 0.3%).
- Average Hourly Earnings (YoY) Feb: 4.6% (exp 4.7%; prev 4.4%).
On the knee-jerk, Gold price has rallied to a fresh corrective high near $1,845 as markets price out the odds of a 50 basis point rate hike from the Federal Reserve this month. The main disappointments come in the Unemployment Rate that might have been expected to remain unchanged at a historically low level of 3.4%; while average hourly earnings were a big disappointment also.
However, when combined with yesterday's JOLTS whereby the Federal Reserve's favorite gauge of labor demand strength, the vacancies-over-unemployed ratio ("V/U ratio"), these reports do not bode well for a Fed that is hoping for a meaningful slowing of the labor market.
The analysts at TD Securities explained that yesterday, ''the V/U ratio remained at a historical high of 1.9 vacancies per unemployed person. In terms of quits, the quits rate did decline to 2.5%, a two-year low, but the lay-offs rate remained quite low at 1.1% and in line with what we've seen in 2022. Overall, a robust report in line with continued labor market strength,'' the analysts argued.
Nevertheless, the Nonfarm Payrolls has missed the mark in some key areas although this could be regarded as a mean-revert in February after the gangbuster report that saw job creation surge to an unexpected 517k in January.
In the previous session, Jobless Claims surprised to the upside during the first week of March, jumping to above the 200k level for the first time in 8 weeks. The series printed 211k, up from 190k. This data took some sting out of the Federal Reserve chair Jerome Powell's hawkish tones when he testified to Congress and warned that a 50 basis point hike was not off the table. However, it is worth noting that the average for claims in 2018-19 was 220k, so the series still remains somewhat below the pre-Covid trend.
Fed funds futures had already been showing that investors had decreased the likelihood of a 50bp hike by the Fed in March to 56%, after being as high as 75% following Powell's speech this week.
Gold technical analysis
Leading into the event, Gold price crossed back above the $1,825 mark in the pursuit of the M-formation's neckline around the 50% mean reversion mark:
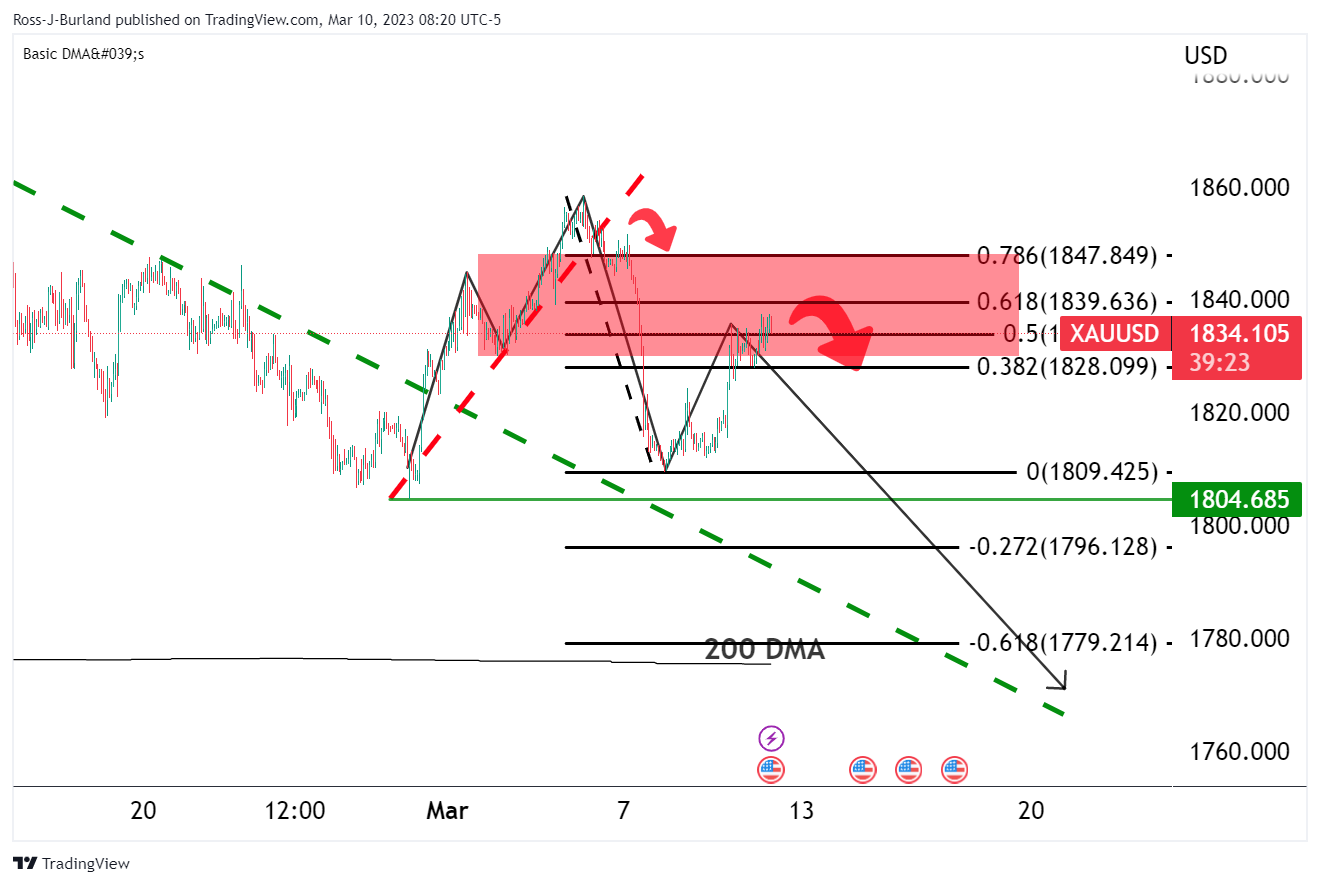
Gold price update
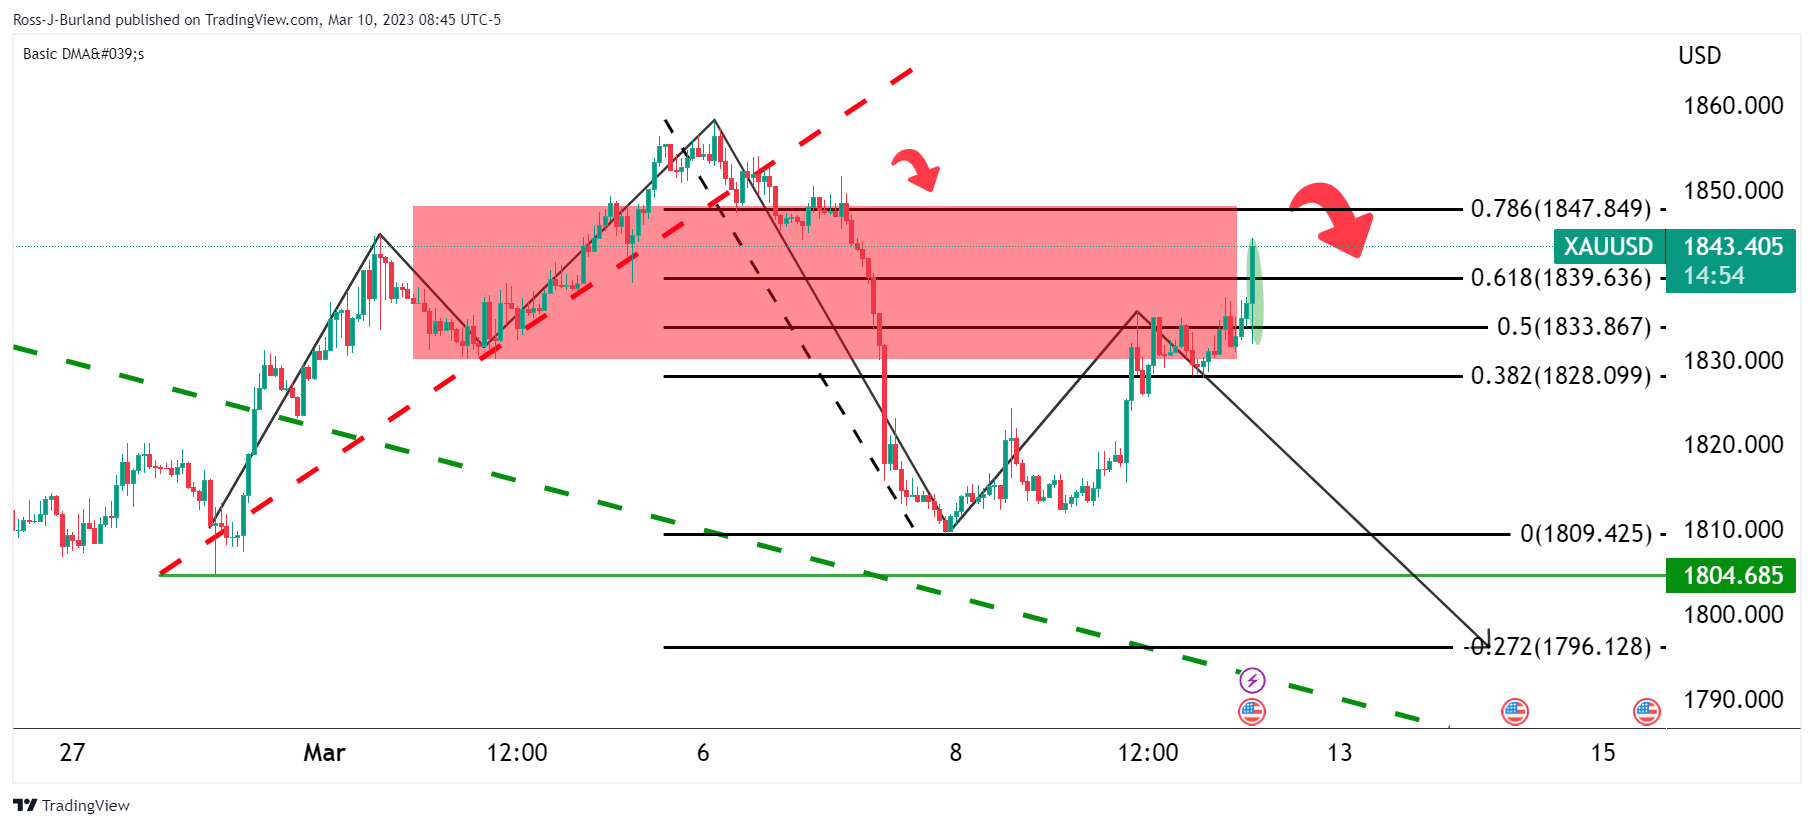
As illustrated, Gold price has rallied on knee-jerk. There is a support location down at $1,804 with resistance above $1,850. If the bears move in again, then there will be prospects of a move to test the Gold price 200 DMA in the coming days with the $1,1770s eyed in that regard. If the $1,850 give way to bulls then there are prospects of a move above the M-formation's double top with the $1900s exposed:
- Unemployment Rate in Canada stayed unchanged at 5% in February.
- USD/CAD trades in negative territory below 1.3800 after the data.
The data published by Statistics Canada revealed on Friday that the Unemployment Rate stayed unchanged at 5% in February. This reading came in slightly better than the market expectation of 5.1%.
Further details of the publication revealed that the Net Change in Employment came in at +21.8K in February, surpassing analysts' estimate of 10,000. Finally, the Participation Rate remained steady at 65.7%.
Market reaction
The USD/CAD came under heavy bearish pressure in the early American session and was last seen losing 0.4% on the day at 1.3773. The broad-based US Dollar weakness also seems to be forcing the pair to stay on the back foot.
- US economy adds 311,000 jobs in February; unemployment rate rises to 3.6%.
- US Dollar drops across the board, US yields hit fresh lows.
- USD/JPY falls below 136.00, flat for the week.
The USD/JPY dropped to levels sub 136.00 following the release of the US employment report. The US Dollar weakened across the board while US yields hit fresh daily lows.
The US Bureau of Labor Statistics (BLS) revealed on Friday that Nonfarm Payrolls rose by 311,000 in February, above the market expectation of 205,000. January’s numbers were marginally revised from 517,000 to 504,000.
The Labor Force Participation Rate improved modestly to 62.5% from 62.4% in January and the Unemployment Rate rose to 3.6%. Average Hourly Earnings increased 4.6% from a year ago.
The US Dollar dropped to fresh lows across the board while US stock index futures turned positive. Markets are digesting the job’s report. The Yen benefit amid a decline in US Yields. The 10-year yield fell to 3.76% and the 2-year hit level under 4.70%.
The USD/JPY dropped almost a hundred pips after NFP. It was trading around 136.70 and bottomed so far at 135.83, slightly above the Asian session low.
The daily lows area in USD/JPY is being challenged at the moment, and a break lower could trigger an acceleration. On the upside, a recovery above 137.00 could strengthen the US Dollar, exposing weekly highs near 138.00.
Technical levels
- GBP/USD adds to its intraday gains and spikes closer to the weekly high in the last hour.
- The upbeat UK GDP print continues to underpin the GBP and extend support to the pair.
- The mixed US NFP report weighs heavily on the USD and provides an additional boost.
The GBP/USD pair catches fresh bids during the early North American session and jumps to the 1.2035-1.2040 area, back closer to the weekly top in reaction to the mixed US monthly jobs data.
The headline NFP showed that the US economy added 311K new jobs in February, beating consensus estimates for a reading of 205K by a big margin. This, however, marks a sharp slowdown from the previous month's downwardly revised reading of 504K. Adding to this, the unemployment rate unexpectedly rose to 3.6% from 3.4% and wages also fell short of market estimates, rising by 0.2% for the month and a 4.6% YoY rate.
The data further points to a softening US labor market and forces investors to scale back their bets for a jumbo 50 bps rate hike at the upcoming FOMC meeting on March 21-21, which is evident from a further decline in the US Treasury bond yields. Apart from this, a goodish recovery in the US equity futures weighs heavily on the safe-haven US Dollar, which, in turn, assists the GBP/USD pair to build on its strong intraday gains.
The British Pound, on the other hand, continues to draw support from the better-than-expected UK monthly GDP print, which showed that the economy expanded by 0.3% in January. This indicates a resilient British economy, which could allow the Bank of England (BoE) to hike interest rates again later this month. This is seen as another factor providing a boost to the GBP/USD pair and supporting prospects for additional gains.
Technical levels to watch
- EUR/USD accelerates gains and revisits 1.0630.
- US Nonfarm Payrolls surprised to the upside (again) in February.
- The unemployment rate climbed to 3.6%.
EUR/USD picks up pace and advances to the 1.0625/30 band, or 3-day highs, in the wake of another solid print from the US jobs report on Friday.
EUR/USD stronger on mixed US jobs report
EUR/USD gathers extra upside pressure after the release of the Nonfarm Payrolls showed the US economy added 311K jobs during February, surpassing initial estimates for a gain of 205K jobs. In addition, the January print was revised a tad lower to 504K (from 517K).
Further data saw the Unemployment Rate ticking higher to 3.6% and the key Average Hourly Earnings – a proxy for inflation via wages – rise 0.2% MoM and 4.6% from a year earlier. Additionally, the Participation Rate increased a tad to 62.5% (from 62.4%).
What to look for around EUR
EUR/USD finds some courage and advances beyond the 1.0600 barrier following another release of the US NFP for the month of February, extending at the same time the optimism seen in the second half of the week.
In the meantime, price action around the European currency should continue to closely follow dollar dynamics, as well as the potential next moves from the ECB after the bank has already anticipated another 50 bps rate raise at the March event.
Back to the euro area, the likely continuation of the normalization process by the ECB beyond the March meeting carries the potential to reignite recession concerns.
Key events in the euro area this week: Germany Final Inflation Rate, ECB Lagarde (Friday).
Eminent issues on the back boiler: Continuation of the ECB hiking cycle amidst dwindling bets for a recession in the region and still elevated inflation. Impact of the Russia-Ukraine war on the growth prospects and inflation outlook in the region. Risks of inflation becoming entrenched.
EUR/USD levels to watch
So far, the pair is advancing 0.46% at 1.0628 and the breakout of 1.0694 (monthly high March 7) would target 1.0712 (55-day SMA) en route to 1.0804 (weekly high February 14). On the downside, the initial support comes at 1.0524 (monthly low March 8) seconded by 1.0481 (2023 low January 6) and finally 1.0323 (200-day SMA).
UOB Group’s Senior Economist Julia Goh and Economist Loke Siew Ting assess the latest interest rate decision by the BNM.
Key Takeaways
“Bank Negara Malaysia (BNM) kept the Overnight Policy Rate (OPR) unchanged at 2.75% for the second straight meeting this year. This came in line with our estimate and Bloomberg consensus whereby 11 out of 20 polled analysts expected a rate pause, while the remaining 9 analysts anticipated a 25bps hike. The central bank cited today’s rate decision is necessary to further assess the impact of the cumulative OPR adjustments of 100bps last year, taking into account the lag effects of monetary policy.”
“Overall, BNM took note of positive developments with the reopening of China’s economy while continuing to expect a moderate growth for Malaysia’s economy amid slower global growth. BNM also expects implementation of projects from the recently retabled Budget 2023 to provide support for the domestic economy. Although headline and core inflation are expected to slow this year, inflation risks are still tilted to the upside which will predominantly stem from potential domestic policy changes on subsidies and price controls, as well as volatility in global commodity prices.”
“On the forward guidance part, BNM added a new line that “the MPC remains vigilant to cost factors, including those arising from financial market developments, that could affect the inflation outlook.” The central bank also continued to signal that further normalisation of monetary policy would depend on the evolving conditions, but there was no guidance on timing or magnitude of potential changes. As such, we continue to expect one more 25bps hike to 3.00% at the next policy meeting on 2-3 May. Thereafter, the central bank may then keep rates on hold for the rest of the year.”
GBP gains have extended today to retest the 1.20 area. A move above the 100-Day Moving Average (DMA) of 1.2017 could enhance Pound’s rebound, economists at Scotiabank report.
January GDP rebound
“Jan industrial and manufacturing activity was a little weaker than expected but service sector growth was stronger, driving a 0.3% gain in monthly GDP, above the 0.1% gain expected. The data suggest the UK economy may hold up better than most have been expecting in the early part of this year and might possibly avoid a recession.”
“A sustained push back above 1.2017 (100-DMA) should enhance the Pound’s rebound but that may be a bit of a reach in the short run, with trend signals tilted bearishly for the GBP on daily and weekly studies.”
- USD/CHF drifts lower for the third straight day and drops to over a two-week low on Friday.
- Reduced bets for more aggressive rate hikes by the Fed weigh on the USD and exert pressure.
- The risk-off mood underpins the safe-haven CHF and contributes to the heavily offered tone.
- Investors now look forward to the crucial US NFP report for some meaningful opportunities.
The USD/CHF pair prolongs this week's retracement slide from the 0.9435-0.9440 supply zone and continues losing ground for the third successive day on Friday. The pair maintains its heavily offered tone heading into the North American session and is currently placed around the 0.9270-0.9265 region, or over a two-week low.
Reduced bets for a more aggressive policy tightening by the Federal Reserve (Fed) drag the US Dollar further away from a three-month high touched on Wednesday, which, in turn, is seen exerting downward pressure on the USD/CHF pair. A larger-than-expected rise in the US Weekly Jobless Claims was seen as the first sign of a softening labor market and forced investors to re-evaluate the possibility of a jumbo 50 bps lift-off at the upcoming FOMC meeting on March 21-22. This leads to a further decline in the US Treasury bond yields and continues to weigh on the Greenback.
Apart from this, the prevalent risk-off environment - as depicted by a sea of red across the global equity markets - benefits the safe-haven Swiss Franc (CHF) and further contributes to the offered tone surrounding the USD/CHF pair. Fed Chair Jerome Powell's hawkish comments earlier this week, saying that the US central bank was prepared to quicken the pace of rate hikes to tame inflation, fueled worries about economic headwinds stemming from rising borrowing costs. Furthermore, fading hopes for a strong economic recovery in China temper investors' appetite for riskier assets.
The USD selling, meanwhile, seems to have abated, at least for the time being, as traders now look forward to the release of the closely-watched US monthly jobs report. The popularly known NFP report will provide a fresh insight into the US labor market conditions. This, along with the latest US consumer inflation figures, due next Tuesday, will influence the Fed's policy outlook, which, in turn, should drive the USD demand. Apart from this, the broader risk sentiment should help traders to determine the next leg of a directional move for the USD/CHF pair.
Technical levels to watch
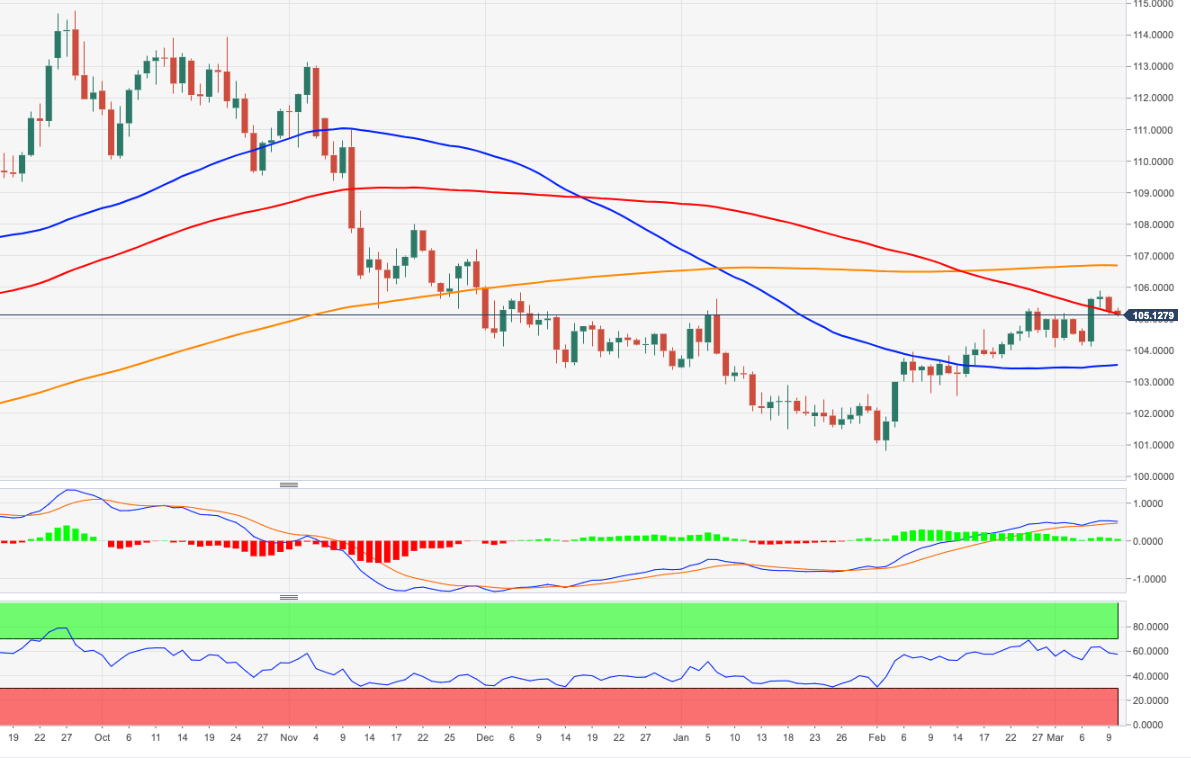
- DXY trades on the defensive for the second session in a row.
- Further advance is likely beyond the 2023 high near 105.90.
DXY adds to Thursday’s daily decline and challenges the 105.00 neighbourhood ahead of the release of US NFP on Friday.
Despite the corrective decline, the positive outlook for the dollar appears unchanged. That said, the surpass of the YTD peak at 105.88 (March 8) should pave the way for the continuation of the uptrend to the key 200-day SMA, today at 106.62.
A convincing move beyond the latter should shift the outlook to constructive in the short-term horizon.
DXY daily chart
Senior Economist Julia Goh and Economist Loke Siew Ting at UOB Group comments on the recent publication of the labour market report in Malaysia.
Key Takeaways
“Malaysia’s labour market started the year of 2023 with marginal improvement. The nation’s unemployment declined for the 18th consecutive month by 3.5k or 0.6% m/m to 596.1k in Jan while the labour force expanded for the 19th month in a row by 25.4k or 0.2% m/m to a fresh record high of 16.8mn. This helped to keep the country’s unemployment rate steady at 3.6% for the fourth succeeding month.”
“Total employment improved further by 28.9k or 0.2% m/m to 16.2mn, a new record high. It was again driven by increased hiring across all economic sectors, led by the services and manufacturing industries.”
“We expect Malaysia’s labour market to maintain its softer recovery momentum this year, supported by various government initiatives to create and retain job opportunities as well as to raise the people’s income amid a moderate domestic growth outlook (MOF est: 4.5%, UOB est: 4.0%, 2022: 8.7%). Lingering global uncertainty and cautious business sentiment amid still high business operating costs are key deterrents to a stronger and faster improvement in the labour market at this juncture. We reiterate our year-end unemployment rate forecast of 3.2% for this year (vs MOF est: 3.5%-3.7%, end-2022: 3.6%).”
EUR/USD is trading modestly higher. However, economists at Scotiabank note that technicals are leaning bearish for the pair.
Key support aligns at 1.0535
“The EUR’s rebound from the mid-week low (equating to a test of the 100-Day Moving Average at 1.0536) may be faltering. Intraday price action suggests a peak/reversal developed, with the EUR topping out via a bearish outside range session on the 6-hour chart around 1.0605 (resistance).”
“Intraday losses are pressuring minor support around 1.0585 and should extend more obviously below 1.0575.”
“Key support is 1.0535.”
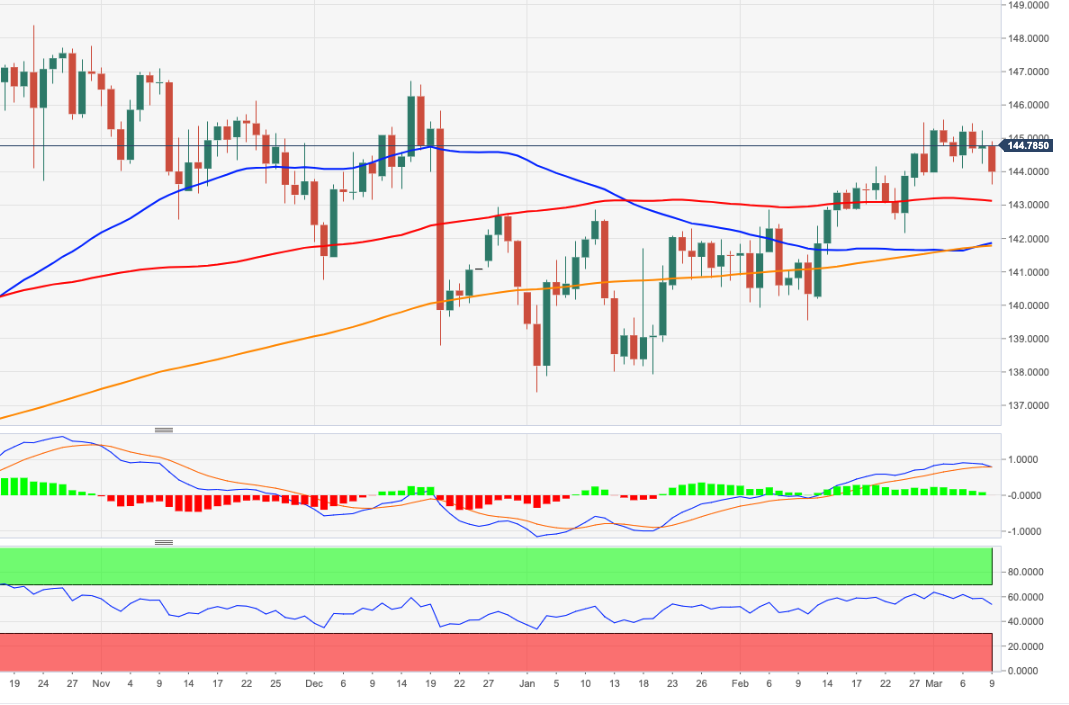
- EUR/JPY reverses Thursday’s pullback and pokes with 145.00.
- Further gains could challenge the 2023 high at 145.56.
EUR/JPY leaves behind Thursday’s marled retracement and briefly surpasses the 145.00 hurdle on Friday.
While further range bound trading seems likely for the time being, the cross is expected to accelerate its gains once the 2023 high at 145.56 (March 2) is cleared. Above this level comes the December 2022 top at 146.72 (December 15).
In the meantime, while above the 200-day SMA, today at 141.77, the outlook for the cross is expected to remain positive.
EUR/JPY daily chart
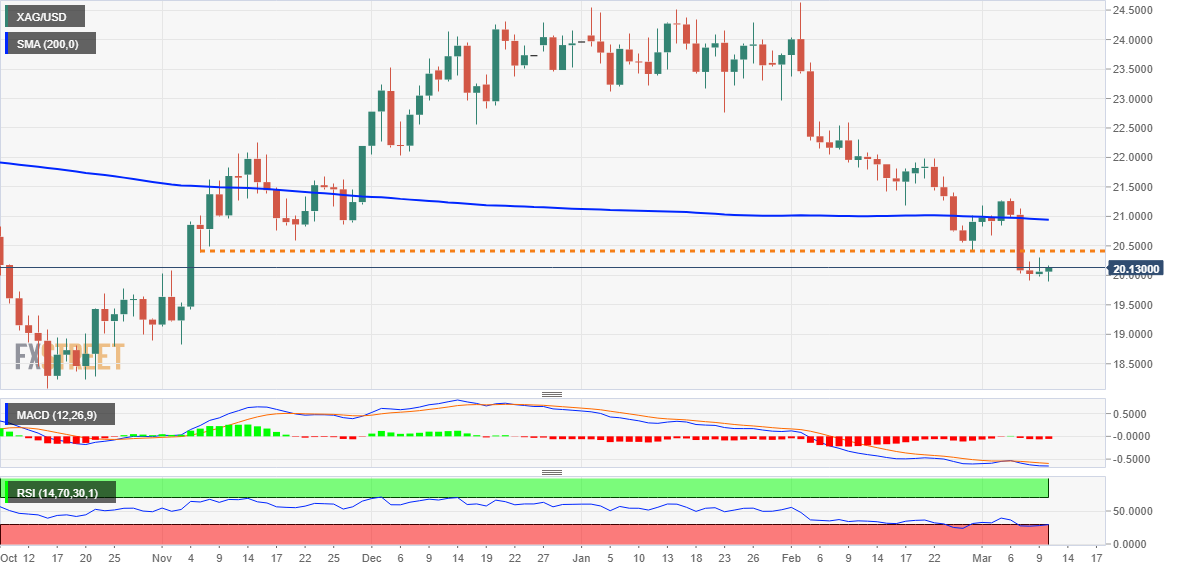
- Silver bounces off a fresh four-month low touched earlier this Friday, though lacks follow-through.
- A slightly oversold RSI on the daily charts supports prospects for some near-term recovery move.
- Bearish traders need to wait for an acceptance below the $20.00 mark before placing fresh bets.
Silver continues to show some resilience below the $20.00 psychological mark and reverses an intraday dip to a fresh four-month low touched earlier this Friday. The uptick, however, lacks bullish conviction, suggesting that the recent downfall witnessed over the past month or so might still be far from being over and positioning for any meaningful appreciating move.
Meanwhile, technical indicators on the daily chart languish in the oversold territory and support prospects for some upside in the near term. That said, the attempted recovery is more likely to confront stiff resistance near the $20.50-$20.40 horizontal support breakpoint, which coincided with the previous YTD low. Some follow-through buying, however, could trigger a short-covering move and lift the XAG/USD towards the 200-day Simple Moving Average (SMA), currently pegged just ahead of the $21.00 mark.
The latter should act as a pivotal point, which if cleared decisively will suggest that the recent pullback from the $24.65 region, or a multi-month peak touched in February has run its course and pave the way for additional gains. The XAG/USD might then accelerate the move towards the next relevant hurdle near the mid-$21.00s before aiming to reclaim the $22.00 round-figure mark.
On the flip side, bearish traders need to wait for an acceptance below the $20.00 mark before placing fresh bets. The subsequent slide could drag the XAG/USD towards the $19.60 intermediate support en route to the $19.00 round-figure mark. Some follow-through selling should pave the way for a slide towards the $18.80-$18.75 zone before the white metal drops to the $18.30-$18.25 zone and the $18.00 level.
Silver daily chart
Key levels to watch
USD/CAD steadies in upper 1.38s. Economists at Scotiabank expect the pair to struggle to surpass the 1.38/39 area.
USD gains look technically stretched
“The good news for the CAD is the short-term spreads may not widen that much more from here – especially if jobs and wage data today remain upbeat – but if equity market headwinds persist, the CAD will have little opportunity to rebound.”
“Price action is hardly indicative of a peak or even a reversal developing. But while trend momentum signals are aligned bullishly for the USD across a range of timeframes, the USD rally is looking very extended across the intraday and daily studies especially. That may help limit USD gains to the 1.38/1.39 range that capped the USD late last year.”
“USD support is 1.3750.”
Nonfarm Payrolls report is in focus ahead of the US Consumer Price Index (CPI) data next week. Economists at MUFG Bank analyze how these two pieces of economic data could impact yields and the Dollar.
Jobs data in focus but CPI data next week may contain moves
“With nearly 40 bps now priced for this month’s FOMC meeting, a strong report today will add to upward pressure on yields although the data would have to be very strong to see the market move to close to fully pricing 50 bps, simply because we will still have the CPI data next week and a strong jobs report coupled with a weak CPI report would probably be enough to keep the FOMC at the current pace of 25 bps hikes.”
“Given the elevated pick-up in yields over recent weeks, and the notable drop back in yields today on the back of increased risk aversion, we would be surprised to see a jobs report that would be strong enough to see another big jump in yields. That could mean some further softening of the Dollar versus core G10 but moves are unlikely to be substantial ahead of CPI unless there’s a considerable off-consensus print in either direction.”
See – NFP Preview: Forecasts from 10 major banks, many new jobs created
Economist at UOB Group Ho Woei Chen reviews the latest inflation figures in China.
Key Takeaways
“Headline inflation slowed to 1.0% y/y in Feb, the lowest in a year, with easing price pressure seen across both food and non-food components. This indicates that the recovery in domestic demand is not on solid grounds yet.”
“Despite the weaker than expected inflation outturn year-to-date, we are keeping our forecast for headline inflation at 2.8% this year (2022: 2.0%) as we monitor the pick-up in price gains ahead, particularly in 2H23 as the economy is expected to return to stronger fundamentals.”
“The PPI remained in deflation for the fifth consecutive month, which worsened to -1.4% y/y in Feb (Bloomberg est: -1.3% y/y, Jan: -0.8% y/y). This was again attributed to a high base comparison particularly high oil prices while the National Bureau of Statistics said that the production recovery of industrial enterprises has accelerated, and market demand has improved. On a sequential basis, PPI was flat after falling in the two preceding months.”
“For the full year in 2023, PPI could be slightly negative at -1.0% after rising 4.1% in 2022 and 8.1% in 2021.”
“People’s Bank of China (PBOC) indicated there may be little room for policy adjustment this year as the real interest rates are at a relatively appropriate level. We will review our LPR forecasts after the rate setting on 20 Mar. Although we have factored in a 10bps cut to the LPRs by end-1Q23, the prospect of that happening has weakened. More important to watch will be the 5Y LPR as a reduction to the rate will signal strong government support to the real estate sector.”
Kuroda's final meeting as Governor of the BoJ delivered no surprises. The reaction in the JPY was rather muted. The ball is in the USD's court with the all-important Nonfarm Payrolls report eyed, economists at TD Securities report.
Kuroda rides off into the sunset with no surprises
“Kuroda wraps up his final meeting as Governor with no surprise and left all policy tools unchanged. Despite this, a future adjustment to YCC remains likely under Ueda. We expect Ueda will order a policy review early on, which we think will serve as a platform to make changes to YCC as early as Q2.”
“USD/JPY at +137 should be key resistance ahead of the NFP. But the ball is in the USD's court for now, and should jobs significantly surprise to the upside (>300K) alongside a strong CPI report next week, 140 does not seem implausible.”
“We expect to see more insulation on cross/JPY however. This is because strong US data will rock all boats but especially the dollar bloc. A re-test of 95/96 in CAD/JPY seems reasonable, particularly as the CAD looks rather vulnerable to the USD with 1.40 now within sight.”
See – NFP Preview: Forecasts from 10 major banks, many new jobs created
Whether XAU/USD will now fall below the $1,800 threshold will depend chiefly on the US labour market data today. The US inflation data and the ECB will be the focus on the Gold market next week, economists at Commerzbank report.
Hawkish ECB to weigh on Gold
“If US labour market data turn out once again to be more buoyant than expected, the Gold price risks sliding further to below the $1,800 mark.”
“Gold market risks suffering a setback in the event of a very hawkish ECB and high US inflation data.”
See – NFP Preview: Forecasts from 10 major banks, many new jobs created
Today's Nonfarm Payrolls release could weaken the US Dollar if we see a big dip in the headline number, economists at ING report.
DXY could head back towards 104.10/20
“The consensus is around +200K, with most estimates in the +100-300K range. Such an outcome looks unlikely to unwind the new-found hawkishness demonstrated this week by Fed Chair Jerome Powell. But a big dip in the headline number and any big backward revisions lower – especially were the wage data benign – could see the Dollar come off 1%.”
“Given the stress in financials, we would probably prefer to be overweight Swiss Franc and Japanese Yen (despite the Bank of Japan not adjusting policy overnight) and slightly underweight the Dollar heading into the NFP release.”
“DXY could head back towards where it started the week at 104.10/20.”
See – NFP Preview: Forecasts from 10 major banks, many new jobs created
- GBP/USD scales higher for the third successive day and draws support from a combination of factors.
- The upbeat UK monthly GDP print boosts the GBP and acts as a tailwind amid a modest USD weakness.
- The mixed technical setup warrants some caution for bullish traders ahead of the key US NFP report.
The GBP/USD pair builds on this week's bounce from the 1.1800 mark, or its lowest level since November 2022, and gains some follow-through traction for the third successive day on Friday. The momentum lifts spot prices to a three-day high during the first half of the European session, with bulls now awaiting a sustained strength beyond the 1.2000 psychological mark before placing fresh bets.
The British Pound gets a boost on the last day of the week after the monthly UK GDP report showed the economy expanded by 0.3% in January. The reading exceeded market expectations for a growth of 0.1% and marks a sharp rebound from the 0.5% contraction recorded in December. The US Dollar, on the other hand, remains on the defensive amid reduced bets for a jumbo 50 bps lift-off at the March FOMC meeting, which, in turn, lends additional support to the GBP/USD pair.
That said, the prevalent risk-off environment - as depicted by a sea of red across the global equity markets amid looming recession risk - helps limit deeper losses for the safe-haven Greenback. Traders also seem reluctant to place aggressive bets and prefer to wait on the sidelines ahead of the US NFP report, due for release later during the early North American session. This, in turn, might keep a lid on any further appreciating move for the GBP/USD pair, at least for the time being.
From a technical perspective, the intraday positive move lifts spot prices beyond the 23.6% Fibonacci retracement level of the recent corrective decline from the vicinity of the mid-1.2450 area, or a multi-month high touched in January. Furthermore, oscillators on the 4-hourly charts have been gaining strong positive traction. This, in turn, supports prospects for an extension of the upward trajectory towards testing the 38.2% Fibo. level, which coincides with the 1.2050-1.2060 supply zone.
That said, technical indicators on the daily chart - though have been recovering - are yet to confirm a bullish outlook. Moreover, the Relative Strength Index (RSI) on the 1-hour chart is flashing overbought conditions and warrants some caution for bulls heading into the key data risks.
On the flip side, the 23.6% Fibo. level, around the mid-1.1900s, now seems to protect the immediate downside. The next relevant support is pegged near a technically significant 200-day Simple Moving Average (SMA), currently pegged around the 1.1900 round-figure mark. A convincing break below the latter will shift the near-term bias back in favour of bearish traders and make the GBP/USD pair vulnerable to accelerate the fall back towards challenging the 1.1800 mark.
GBP/USD 4-hour chart
Key levels to watch
The CAD market is going to clearly focus on the February labour market data, which is due for publication at the same time in Canada as in the US. Economists at Commerzbank analyze how these reports could impact the Loonie.
US data is likely to be more decisive for USD/CAD
“The Loonie is only likely to receive moderate support from a renewed strong Canadian labour market report if the US data is equally strong, whereas it might benefit more against EUR.”
“Rather than going through all the possible options let me just state in conclusion that the Loonie might depreciate further against USD in case of a combination of stronger than expected US data and surprisingly weak labour market data from Canada.”
See:
-
Canadian Jobs Preview: Forecasts from four major banks, a trend reversal would not be surprising
-
NFP Preview: Forecasts from 10 major banks, many new jobs created
UOB Group’s Senior Economist Julia Goh and Economist Loke Siew Ting comments on the latest Committed Investment figures in Malaysia.
Key Takeaways
“Malaysia approved a total of MYR264.6bn investments in 2022, which was 17.6% more than our projected MYR225.0bn but 14.5% lower than the MYR309.4bn recorded in 2021. Over 58% of the total approved investments last year were channelled into the services sector (MYR154.0bn); about one-thirds were injected into the manufacturing sector (MYR84.3bn or ~32%); while the remaining 10% were for the agriculture sector (MYR26.4bn).”
“Foreign direct investments (FDIs) remained the key source for the second straight year since the outbreak of COVID-19, contributing nearly 62% or MYR163.3bn to the overall committed investments. This compared to domestic direct investments (DDIs) that made up about 38% or MYR101.3bn. Top FDI sources were the People’s Republic of China (PRC, MYR55.4bn or 33.9% share), the USA (MYR29.2bn or 17.9% share), the Netherlands (MYR20.4bn or 12.5% share), Singapore (MYR13.6bn or 8.3% share), and Japan (MYR11.4bn or 7.0%).”
“For 2023, we keep a prudent view on the committed investment flows given the persistent uncertainty surrounding the global economy, monetary and financial conditions, as well as geopolitical risks. Also taking into consideration a number of promising projects in MIDA’s pipeline that involved total potential investments of MYR14.6bn, we maintain our full-year approved investment projection at MYR228.0bn for this year (MIDA target: +20% to MYR318.0bn).”
Sterling has been performing a little better over the last 24 hours. But in the view of economists at ING, EUR/GBP can turn big again above 0.8900.
Vulnerable to financial sector stress
“If the banking stress story has a little further to run we can expect a little Sterling under-performance, given the relatively large size of financial services in the UK economy.”
“EUR/GBP can turn big again above 0.8900, while GBP/CHF should make a run at 1.10.”
See: UK GDP grows 0.3% MoM in January vs. 0.1% expected
- USD/JPY regains positive traction on Friday as BoJ keeps policy settings unchanged.
- Reduced bets for a 50 bps Fed rate hike in March weigh on the USD and cap gains.
- The risk-off mood lends support to the JPY and also acts as a headwind for the pair.
- Traders now look forward to the US NFP report for some meaningful opportunities.
The USD/JPY pair shows some resilience below the 100-day Simple Moving Average (SMA) and attracts fresh buying near the 135.80 region, or a multi-day low touched earlier this Friday. The pair stick to its gains through the first half of the European session and is currently placed around the 135.75 area, just a few pips below the daily peak.
The Japanese Yen (JPY) fell sharply on the last day of the week after the Bank of Japan (BoJ) maintained its ultra-dovish stance and left monetary policy settings unchanged. The decision was widely on expected lines, though some analysts were speculating that Haruhiko Kuroda would tweak the yield curve control (YCC) at his last policy meeting as BoJ governor. This, in turn, sent the Japanese bond yields tumbling, which, in turn, weighed on the domestic currency and assisted the USD/JPY pair to regain positive traction.
That said, the prevalent risk-off environment - as depicted by a sea of red across the global equity markets - helps limit losses for the safe-haven JPY. Apart from this, some follow-through US Dollar selling contributes to keeping a lid on any further gains for the USD/JPY pair, at least for the time being. Market participants were forced to reassess expectations for a jumbo 50 bps lift-off at the March FOMC meeting after a larger-than-expected rise in the US Weekly Jobless Claims, which was seen as the first sign of a softening labor market.
Reduced bets for a more aggressive policy tightening by the Fed lead to a further decline in the US Treasury bond yields and keep the USD bulls on the defensive. Traders, however, seem reluctant and prefer to move to the sidelines ahead of the release of the closely-watched US monthly employment details, popularly known as NFP. This, along with the latest US consumer inflation figures, due next Tuesday, will influence the Fed's rate-hike path, which will drive the USD and provide a fresh directional impetus to the USD/JPY Pair.
Technical levels to watch
- EUR/USD adds to Thursday’s advance and hovers around 1.0600.
- ECB’s Panetta, McCaul, Lagarde speak later in the session.
- Markets’ attention remains on the release of US NFP.
EUR/USD advances to 3-day highs just above 1.0600 the figure amidst some tepid selling pressure around the greenback on Friday.
EUR/USD looks at USD, Payrolls
EUR/USD extends further the bounce off multi-week lows recorded in the wake of Powell’s first testimony on Tuesday and pierces the 1.0600 barrier at the end of the week.
In fact, the renewed offered bias in the greenback forced the USD Index (DXY) to give away part of the recent upside in tandem with the loss of traction in US yields across the curve and dwindling bets of a half percentage point interest rate hike by the Fed at the March 22 meeting.
Moving forward, the release of February’s Non-farm Payrolls has been growing in importance as of late and will be the salient event later in the NA session.
Closer to home, ECB’s F. Panetta, E. McCaul and Chair C. Lagarde are all due to speak. Earlier in the session, final inflation figures in Germany showed the CPI rising 8.7% in the year to February and 0.8% from a month earlier.
What to look for around EUR
EUR/USD finds some courage and advances just beyond the 1.0600 barrier ahead of the US NFP for the month of February, extending at the same time the optimism seen in the second half of the week.
In the meantime, price action around the European currency should continue to closely follow dollar dynamics, as well as the potential next moves from the ECB after the bank has already anticipated another 50 bps rate raise at the March event.
Back to the euro area, the likely continuation of the normalization process by the ECB beyond the March meeting carries the potential to reignite recession concerns.
Key events in the euro area this week: Germany Final Inflation Rate, ECB Lagarde (Friday).
Eminent issues on the back boiler: Continuation of the ECB hiking cycle amidst dwindling bets for a recession in the region and still elevated inflation. Impact of the Russia-Ukraine war on the growth prospects and inflation outlook in the region. Risks of inflation becoming entrenched.
EUR/USD levels to watch
So far, the pair is advancing 0.11% at 1.0590 and the breakout of 1.0694 (monthly high March 7) would target 1.0712 (55-day SMA) en route to 1.0804 (weekly high February 14). On the downside, the initial support comes at 1.0524 (monthly low March 8) seconded by 1.0481 (2023 low January 6) and finally 1.0323 (200-day SMA).
Today, the US labor market report for February will be published. Economists at Commerzbank expect the US Dollar to strengthen on a strong report. Nonetheless, weak data is unlikely to weaken the greenback.
Not advisable to position oneself against USD
“If the labor market report is strong, this would be another argument for aggressive rate hikes over the coming months and USD might benefit.”
“It is questionable though whether the market will put pressure on USD if the data disappoints. Consumer price data is due for publication next week and this publication too entails the potential for a surprise. It, therefore, does not seem advisable to position oneself against USD at present.”
See – NFP Preview: Forecasts from 10 major banks, many new jobs created
USD/CNH still needs to clear 7.0000 to allow for extra gains in the next weeks, comment Economist Lee Sue Ann and Markets Strategist Quek Ser Leang at UOB Group.
Key Quotes
24-hour view: “We highlighted yesterday that ‘the price movements are likely part of a consolidation phase’ and we expected USD to trade sideways between 6.9400 and 6.9840. Our view of consolidation was not wrong even though USD traded within a narrower range than expected (6.9643/6.9863). The price actions offer no fresh clues and USD could continue to consolidate, likely between 6.9550 and 6.9900.”
Next 1-3 weeks: “There is no change in our view from Wednesday (08 Mar, spot at 6.9880). As highlighted, while the outlook for USD is still positive, it has to break and stay above 7.0000 before further advance to 7.0200 is unlikely. The upside risk is intact as long as USD stays above 6.9140 (no change in ‘strong support’ level from yesterday).”
- USD/CAD continues scaling higher on Friday and touches its highest level since October.
- Bearish crude Oil prices undermine the Loonie and remain supportive of the momentum.
- The risk-off mood benefits the USD’s relative safe-haven status and acts as a tailwind.
- Traders now look to the monthly jobs data from Canada and the US for a fresh impetus.
The USD/CAD pair adds to its strong weekly gains and climbs to its highest level since October 17, 2022, around the 1.3860 area during the first half of the European session on Friday.
The selling pressure around Crude Oil prices remains unabated for the fourth straight day, which undermines the commodity-linked Loonie and acts as a tailwind for the USD/CAD pair. In fact, the black liquid remains on track to register its worst fall since early February amid worries that slowing global economic growth will dent fuel demand. Apart from this, the fact that the Bank of Canada (BoC) became the first major central bank to pause its rate-hiking cycle on Wednesday is seen as another factor weighing on the Canadian Dollar.
The aforementioned factors, to a larger extent, helps offset a modest US Dollar weakness and continue to push the USD/CAD pair higher. Data released on Thursday showed a larger-than-expected rise in the US Weekly Jobless Claims, which was seen as the first sign of a softening labor market. This, in turn, forced investors to re-evaluate the possibility of a 50 bps lift-off at the upcoming FOMC meeting on March 21-22, leading to a further decline in the US Treasury bond yields and exerting some follow-through pressure on the Greenback.
That said, the prevalent risk-off environment - amid looming recession risks - helps limit losses for the safe-haven buck, at least for the time being. The market sentiment remains fragile in the wake of worries about economic headwinds stemming from rising borrowing costs, which is reinforced by a further deepening of the yield curve. Adding to this, the incoming softer Chinese macro data dashed hopes for a strong recovery in the world's second-largest economy. This, in turn, tempers investors' appetite for perceived riskier assets.
The USD/CAD bulls, meanwhile, might prefer to take a breather amid a slightly overbought Relative Strength Index (RSO) on the daily chart and ahead of the closely-watched US monthly employment details. The popularly known NFP report is more likely to overshadow the Canadian jobs data and play a key role in influencing the pair's near-term trajectory. The focus will then shift to the latest US consumer inflation figures, due for release next Tuesday.
Technical levels to watch
Jobs figures will be released in Canada today. However, this report is set to be overshadowed by the US Nonfarm Payrolls, according to economists at ING report who analyze the USD/CAD pair.
Less relevant payrolls
“Today’s jobs data out of Canada may well matter less than the US NFP for CAD, given the Loonie’s elevated exposure to global risk appetite.”
“We continue to see short-term upside risks for USD/CAD, but remain bearish over the medium term, largely on the back of a projected USD decline, rather than CAD outperformance compared to other pro-cyclical currencies.”
See:
-
Canadian Jobs Preview: Forecasts from four major banks, a trend reversal would not be surprising
-
NFP Preview: Forecasts from 10 major banks, many new jobs created
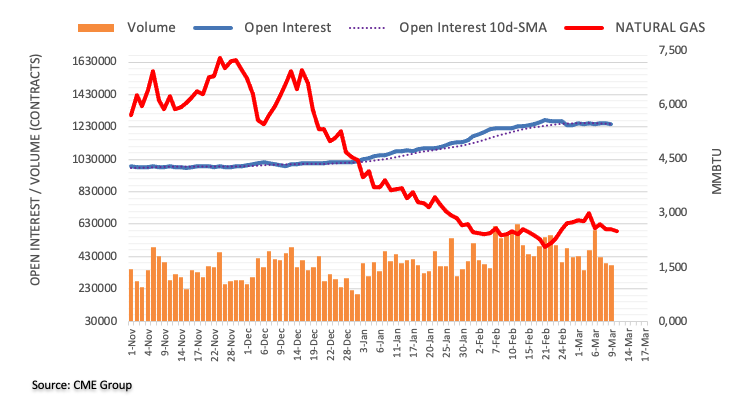
Considering advanced prints from CME Group for natural gas futures markets, open interest shrank for the second straight session on Thursday, now by around 1.7K contracts. In the same line, volume dropped for the third consecutive day, this time by around 12.6K contracts.
Natural Gas: Solid support remains around $2.50
Prices of the natural gas added to Wednesday’s retracement on Thursday. The bearish move was against the backdrop of diminishing open interest and volume and suggests a low probability of further decline in the very near term. So far, the commodity faces a decent contention around the $2.50 region per MMBtu.
According to Economist Lee Sue Ann and Markets Strategist Quek Ser Leang at UOB Group, USD/JPY is seen trading within 135.00/138.00 range for the time being.
Key Quotes
24-hour view: “Our view for USD to trade in range between 136.50 and 137.55 was incorrect as it plummeted to a low of 135.94 before settling at 136.14 (-0.87%). The sharp drop appears to be running ahead and while there is scope for USD to weaken, any decline is viewed as a lower trading range of 135.50/137.00. In other words, a sustained drop below 135.50 is unlikely.”
Next 1-3 weeks: “On Wednesday (08 Mar, spot at 137.30), we highlighted the surge in momentum is expected to lead to further USD strength, likely towards 138.20. USD subsequently rose to 137.91 before pulling back and yesterday, the pullback took out our ‘strong support’ level of 136.20. The breach of the ‘strong support’ indicates that USD is unlikely to advance further. USD appears to have entered a consolidation phase and it is likely to trade within a range of 135.00/138.00 for now.”
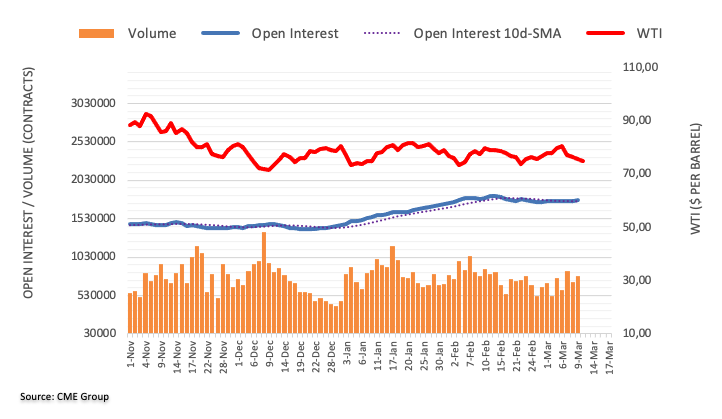
CME Group’s flash data for crude oil futures markets noted traders increased their open interest positions for the third consecutive session on Thursday, this time by around 10.3K contracts. Volume followed suit and rose by around 76.6K contracts.
WTI: En route to the 2023 low?
Prices of the barrel of the WTI extended the weekly leg lower on Thursday. The downtick was in tandem with rising open interest and volume and suggests that extra weakness lie ahead for the commodity. The breakdown of the February low at $73.83 (February 22) should open the door to a test of the 2023 low at $72.30 (February 6).
- GBP/JPY struggles to capitalize in the intraday move up and fails near the 200-day SMA.
- The BoJ’s decision to leave policy settings unchanged weighs on the JPY and lends support.
- The mixed UK macro data and the risk-off environment keeps a lid on any further gains.
The GBP/JPY cross attracts fresh sellers near a technically significant 200-day Simple Moving Average (SMA) on Friday and its goodish intraday rally from sub-162.00 levels. Spot prices surrender a major part of the Bank of Japan (BoJ)-inspired gains and retreat to mid-162.00s during the early part of the European session.
The Japanese Yen (JPY) weakens across the board in a knee-jerk reaction to the BoJ's decision to keep monetary policy settings unchanged at the end of a two-day meeting on Friday. This, in turn, assists the GBP/JPY cross to regain positive traction and build on the previous day's bounce from the 161.60 area, or a nearly two-week low. The uptick gets an additional boost following the release of better-than-expected UK GDP print, which showed that the economy expanded by 0.3% in January as compared to the 0.5% contraction recorded in the previous month.
That said, the UK Manufacturing and Industrial Production contracted more-than-anticipated last month, which, in turn, holds back traders from placing aggressive bullish bets around the British Pound. Apart from this, the prevalent risk-off environment - as depicted by a sea of red across the global equity markets - drives some haven flows towards the JPY and further contributes to capping the upside for the GBP/JPY cross. This, in turn, warrants some caution before positioning for the resumption of the recent upward trajectory witnessed since early February.
The downside, meanwhile, seems limited amid expectations that the BoJ will stick to its dovish stance to support the fragile domestic economy. The bets were lifted by this week's release of the final GDP print from Japan, which showed that the economy narrowly averted a recession in the final quarter of 2022 and reaffirmed continued weakness in the economy. Moreover, the incoming BoJ Governor Kazuo Ueda recently stressed the need to maintain the ultra-loose policy settings and said that the central bank isn't seeking a quick move away from a decade of massive easing.
The aforementioned mixed fundamental backdrop makes it prudent to wait for a sustained move in either direction before positioning for the near-term trajectory for the GBP/JPY cross.
Technical levels to watch
The Bank of England (BoE) is unlikely to do many favours to Sterling, in the view of economists at Commerzbank.
BoE will always seem to be lagging behind developments
“As long as the BoE sticks to its rather cautious communication, contrary to the Fed and the ECB, Sterling is likely to principally remain under depreciation pressure.”
“As far as its communication is concerned the BoE will always seem to be lagging behind developments rather than fighting high levels of inflation actively, thus creating concerns that it might drop behind the curve with its monetary policy. That means monetary policy continues to put pressure on Sterling.”
The continuation of the downtrend in AUD/USD should meet a tough support around the 0.6500 region, suggest Economist Lee Sue Ann and Markets Strategist Quek Ser Leang at UOB Group.
Key Quotes
24-hour view: “Yesterday, we held the view that ‘there is room for AUD to weaken, any decline is likely part of a lower trading range of 0.6560/0.6625’. Our expectations did not materialize as AUD traded between 0.6577 and 0.6636 before closing largely unchanged at 0.6591 (+0.01%). Despite the quiet price actions, downward momentum appears to have increased. Today, AUD is likely to trade with a downward bias but 0.6560 is expected to offer strong support. Resistance is at 0.6615, followed by 0.6635.”
Next 1-3 weeks: “Our update from two days ago (08 Mar, spot at 0.6585) is still valid. As highlighted, AUD is likely to weaken further but any weakness is likely to be at a slower pace. The major support at 0.6500 may not come into view so soon. The downside risk is intact as long as AUD stays below 0.6700 (no change in ‘strong resistance’ level) in the next 1-2 days.”
EUR/USD moves up and down in a narrow range slightly below 1.0600. A weak Nonfarm Payrolls release could send the pair all the way back to where it started the week near 1.0700, economists at ING report.
Caught in the cross-fire
“The SVB Financial-inspired repricing of the Fed curve has seen the two-year EUR:USD swap differential narrow by 20bp in favour of the euro over the last two days. This is providing some support to EUR/USD.”
“A soft NFP job release – questioning whether the Fed has to be as hawkish as Jerome Powell sounded earlier this week – could send us all the way back to where we started the week near 1.0700.”
See – NFP Preview: Forecasts from 10 major banks, many new jobs created
- The index appears mildly offered above the 105.00 mark.
- US yields accelerate the decline ahead of the key Payrolls.
- The US jobs report will take centre stage later in the NA session.
The greenback, when measured by the USD Index (DXY), navigates within a narrow range and slightly on the defensive above the 105.00 yardstick following the opening bell in the old continent on Friday.
USD Index focuses on key US data
The index gives away further ground and adds to the pessimism seen so far in the second half of the week on the back of a tepid improvement in the risk complex ahead of the release of the US jobs report.
Indeed, the upside momentum in the dollar appears somewhat mitigated following fresh YTD peaks near 106.00 the figure recorded in the wake of Chair Powell’s first testimony before the Congress.
The corrective decline in US yields across the curve also accompanies the dollar’s decline amidst divided consensus among investors regarding the upcoming interest rate hike by the Fed.
On this, CME Group’s FedWatch Tool now sees the probability of a 50 bps rate raise at 55%, from just below 80% a day ago.
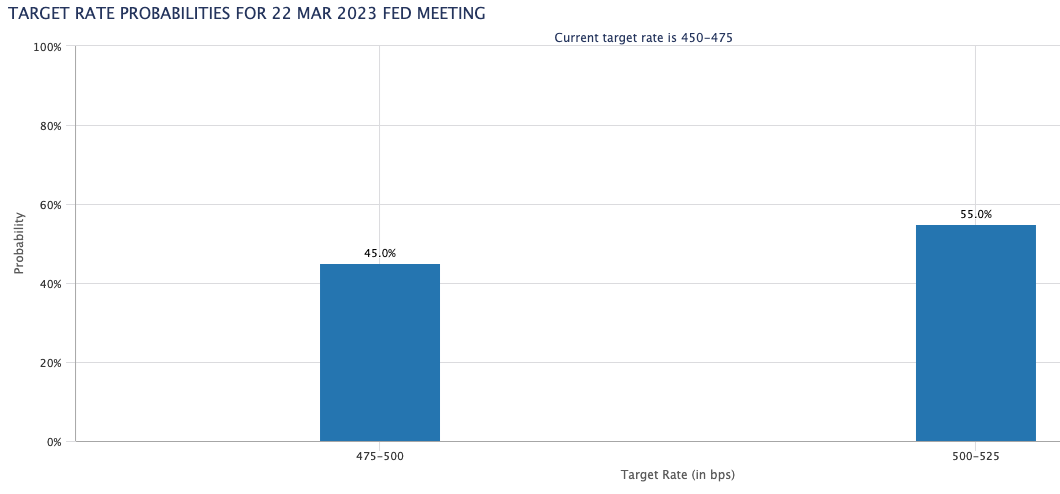
In the US docket, the February’s Non-farm Payrolls will be in the limelight later in the session, with consensus expecting the US economy to have created 205K jobs during last month and the Unemployment Rate to have held steady at 3.4%.
What to look for around USD
The index remains cautious and hovers around the key 105.00 neighbourhood at the end of the week ahead of release of the US jobs report for the month of February.
The dollar, in the meantime, appears well supported by (dwindling?) expectations of a 50 bps rate raise at the Fed’s gathering later in the month. This view has been propped up by hawkish message from Fed speakers from many weeks now and lately by Chief Powell at both his testimonies earlier in the week.
In addition, the still elevated inflation as well as the solid labour market and the resilient economy in general also seem to underpin the tighter-for-longer stance from the Federal Reserve.
Key events in the US this week: Nonfarm Payrolls, Unemployment Rate, Monthly Budget Statement (Friday).
Eminent issues on the back boiler: Rising conviction of a soft landing of the US economy. Persistent narrative for a Fed’s tighter-for-longer stance. Terminal rates near 5.5%? Fed’s pivot. Geopolitical effervescence vs. Russia and China. US-China trade conflict.
USD Index relevant levels
Now, the index is retreating 0.04% at 105.23 and the breakdown of 104.09 (weekly low March 1) would open the door to 103.53 (55-day SMA) and finally 102.58 (weekly low February 14). On the other hand, the next up-barrier aligns at 105.88 (2023 high March 8) seconded by 106.62 (200-day SMA) and then 107.19 (weekly high November 30 2022).
Canada’s employment data for February will be reported by Statistics Canada on Friday, March 10 at 13:30 GMT and as we get closer to the release time, here are forecasts from economists and researchers at four major banks regarding the upcoming jobs figures.
The North American economy is estimated to have created 15K in February as against the whopping 150K in January, with the unemployment rate seen rising a tick to 5.1%.
TDS
“We look for employment to fall by 10K after rising +150K last month, pushing the UE rate to 5.1% but note this will do little to cool an overheated labour market. We are also looking for wage growth to firm to 5.2% YoY.”
NBF
“We expect employment to have fallen 25K in the second month of 2023. Such a decline would translate into a one-tick increase in the unemployment rate to 5.1%, assuming the participation rate remained steady at 65.7% and the working-age population grew at a strong pace.”
CIBC
“We suspect that employment will only inch up by 5K in February and that the unemployment rate will tick up to 5.1%. Wage growth will look stronger this month, thanks to a weaker comparison from a year ago as low-wage hospitality workers were rehired following the short-lasting shutdown measures in January 2022.”
CitiBank
“February employment should rise a strong 40K, partly on stronger immigration in 2022 continues into 2023. We also expect a pick-up in wage growth and a decline in the unemployment rate to 4.9%.”
In the opinion of Economist Lee Sue Ann and Markets Strategist Quek Ser Leang at UOB Group, GBP/USD risks a deeper pullback once 1.1950 is cleared.
Key Quotes
24-hour view: “We did not anticipate the sharp rise in GBP to 1.1940 yesterday (we were expecting GBP to trade sideways). The advance lacks momentum and GBP is unlikely to strengthen much further. Today, GBP is likely to trade between 1.1875 and 1.1950.’
Next 1-3 weeks: “On Wednesday (08 Mar, spot at 1.1830), we indicated that GBP could weaken but likely at a slower pace. We added, ‘The downside risk is intact as long as GBP stays below 1.1950 in the next couple of days’. Yesterday, GBP rose to a high of 1.1940. Downward momentum is beginning to fade and a break of 1.1950 would indicate that GBP is unlikely to weaken further.”
Open interest in gold futures markets shrank by nearly 4K contracts for the first time since February 28 on Thursday according to preliminary readings from CME Group. Volume, instead, kept the choppy performance well in place and went up by around 28.4K contracts.
Gold: Solid support remains near $1800
Thursday’s marked uptick in gold prices came on the back of shrinking open interest, which warns against the continuation of the rebound in the very near term. In the meantime, the precious metal remains well supported around the key $1800 region per ounce troy, where also converge the so far 2023 low and the 100-day SMA.
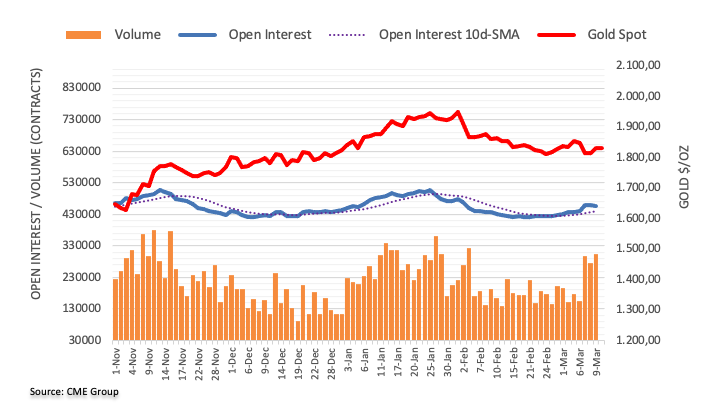
Bank of Japan left its ultra-loose monetary policy unchanged at the last meeting of Governor Kuroda. The Yen weakened slightly. But too much weakness would not be justified, in the view of economists at Commerzbank.
We have not learned much about the yen today
“The outgoing Governor of the BoJ, Haruhiko Kuroda, did not say goodbye with a ‘bang’ (i.e. with a renewed change in monetary policy). The BoJ left its monetary policy unchanged.”
“The Yen is weakening a bit. However, too much JPY weakness would not be justified. For two reasons. (a) Today's outcome was the most likely. (b) It is not evidence that the BoJ will permanently stick to its current monetary policy. Ergo: We haven't learned much this morning.”
- AUD/USD reverses an intraday dip to a fresh YTD low amid the ongoing USD retracement slide.
- Reduced bets for a 50 bps Fed rate hike in March and falling US bond yields weigh on the buck.
- The risk-off mood might cap gains for the risk-sensitive Aussie ahead of the key US NFP report.
The AUD/USD pair attracts some buyers near the 0.6565 region on Friday and recovers early lost ground to a fresh four-month low. Spot prices climb back closer to the 0.6600 round-figure mark during the early European session and draw support from some follow-through US Dollar selling.
In fact, the USD Index, which tracks the Greenback against a basket of currencies, retreats further from a three-month high amid reduced bets for more aggressive policy tightening by the Federal Reserve. Data released on Thursday showed a larger-than-expected rise in the US Weekly Jobless Claims and was seen as the first sign of a softening labor market. This forced investors to reassess the possibility of a 50 bps lift-off at the upcoming FOMC meeting on March 21-22, which is evident from the ongoing downfall in the US Treasury bond yields and continues to weigh on the buck.
That said, the prevalent risk-off environment lends some support to the safe-haven Greenback and could keep a lid on any meaningful upside for the risk-sensitive Australian Dollar. The market sentiment remains fragile amid concerns about economic headwinds stemming from rapidly rising borrowing costs. Adding to this, the recent softer Chinese macro data dashed hopes for a strong recovery in the world's second-largest economy and further fueled recession fears. This is reinforced by a deepening of the yield curve and tempers investors' appetite for perceived riskier assets.
Apart from this, the Reserve Bank of Australia's (RBA) dovish shift earlier this week, signalling that it might be nearing the end of its rate-hiking cycle, might contribute to capping gains for the AUD/USD pair. Traders might also prefer to move to the sidelines ahead of the release of the closely-watched US monthly jobs data, due later during the early North American session. The popularly known NFP report will play a key role in influencing the Fed's policy outlook, which, in turn, will drive the USD demand and help determine the near-term trajectory for the major.
Technical levels to watch
Here is what you need to know on Friday, March 10:
Markets stay cautious early Friday as participants refrain from taking large positions while waiting for the February US jobs report, which could have significant implications on the US Federal Reser's rate outlook. The US Dollar Index holds steady above 105.00 following Thursday's decline and US stock index futures trade in negative territory. Statistics Canada will also release labour market data for February and European Central Bank (ECB) President Christine Lagarde will be delivering a speech later in the day.
Nonfarm Payrolls Preview: Five scenarios for the Fed, USD and stocks reactions, with probabilities.
On Thursday, the data published by the US Department of Labor revealed that weekly Initial Jobless Claims rose by 21,000 to 211,000 in the week ending March 4. Despite the risk-averse market environment, the US Dollar struggled to find demand in the American session. With the benchmark 10-year US Treasury bond yield losing more than 2% on the day, the USD continued to weaken against its major rivals.
Early Friday, the 10-year US T-bond yield continues to push lower and was last seen losing more than 2% on the day at 3.82%. The USD, however, stays resilient for the time being. Nonfarm Payrolls in the US are forecast to rise by 205,000 in February following January's impressive increase of 517,000. Annual wage inflation, as measured by the Average Hourly Earnings, is forecast to edge higher to 4.7% from 4.4% in January.
Following Thursday's rebound, EUR/USD moves up and down in a narrow range slightly below 1.0600 in the European morning. Lagarde is unlikely to comment on the policy outlook later in the day because the ECB is already in the 'quiet period.'
GBP/USD trades modestly higher on the day near 1.1950 early Friday after the UK's Office for National Statistics announced that the real Gross Domestic Product expanded by 0.3% in January, surpassing the market expectation of 0.1%. On a negative note, Manufacturing Production and Industrial Production contracted by 0.4% and 0.3% in the same period, respectively.
As expected, the Bank of Japan (BoJ) left its policy settings unchanged following the last policy meeting led by outgoing Governor Haruhiko Kuroda. In the press conference, Kuroda repeated that they won't hesitate to ease the monetary policy further if necessary but these comments failed to trigger a meaningful market reaction. At the time of press, USD/JPY was marginally higher on the day at 136.40.
USD/CAD extended its weekly rally on Thursday and touched its highest level since October at 1.3850 on Friday before retreating to 1.1830. The Unemployment Rate in Canada is forecast to tick up to 5.1% in February from 5% in January with the Net Change in Employment coming in at +10K.
Gold price capitalized on falling US T-bond yields on Thursday and recovered above $1,830. XAU/USD fluctuates in a tight channel slightly above $1,830 early Friday.
US February Nonfarm Payrolls Preview: Analyzing Gold price's reaction to NFP surprises.
Bitcoin lost more than 6% on Thursday and continued to stretch lower early Friday. BTC/USD was last seen testing $20,000, where it was down nearly 2% on the day. Ethereum broke below $1,500 and touched its weakest level in nearly two months at $1,392 before recovering slightly above $1,400 on Friday.
FX option expiries for Mar 10 NY cut at 10:00 Eastern Time, via DTCC, can be found below.
- EUR/USD: EUR amounts
- 1.0500 1.5b
- 1.0525 1.4b
- 1.0550 1.5b
- 1.0600 1.2b
- 1.0660 1.1b
- USD/JPY: USD amounts
- 135.00 606m
- 136.00 2.6b
- AUD/USD: AUD amounts
- 0.6750 746m
- 0.6820 1.0b
- USD/CAD: USD amounts
- 1.3710 618m
Gold price is consolidating the previous rebound near the $1,830 level in Friday trading ahead of the all-important US Nonfarm Payrolls data. In case, the US NFP blows past expectations, XAU/USD could retest 100-Daily Moving Average (DMA) support, FXStreet’s Dhwani Mehta reports.
XAU/USD to recapture 21 DMA on a disappointing NFP report
“Strong US NFP could reinforce bearish bets on Gold price, smashing rates back toward the critical 100 DMA support at $1,810. Ahead of that, the March 8 high at $1,824 could offer some respite to Gold buyers.”
“A sustained break below the bullish 100 DMA cap could initiate a fresh downswing toward the flattish 200 DMA at $1,775.”
“On the flip side, the Gold price is likely to firmly recapture the 21 DMA resistance at $1,835 on a disappointing US labor market report, which could push back against expectations of bigger Fed rate increases. Further up, Gold price could challenge the $1,850 psychological mark, with eyes on the weekly top at $1,858.”
See – NFP Preview: Forecasts from 10 major banks, many new jobs created
Economist Lee Sue Ann and Markets Strategist Quek Ser Leang at UOB Group note EUR/USD could still slip back below the 1.0500 level.
Key Quotes
24-hour view: “Yesterday, we expected EUR to trade in a range between 1.0520 and 1.0590. However, EUR edged to a high of 1.0590 before settling at 1.0580 (+0.34%). EUR could continue to edge higher today but it is unlikely to break the strong resistance at 1.0630 (minor resistance is at 1.0605). Support is at 1.0560, a breach of 1.0540 would indicate that the current mild upward pressure has eased.”
Next 1-3 weeks: “Our update from two days ago (08 Mar, spot at 1.0550) is still valid. As highlighted, after the sharp drop on Tuesday, downward momentum has improved, albeit not much. All in all, as long as EUR does not move above 1.0630 (no change in ‘strong resistance’ from yesterday), it is likely to gravitate lower towards 1.0485.”
- US jobs report likely to inform inflation narrative, US Dollar and Gold price.
- If the labor market is strong, the Federal Reserve could plough ahead with larger rate hikes.
- Gold price could continue south if a strong result solidifies expectations of a 0.5% rate hike in March.
Gold price has been in a downward spiral since the start of February, and with the next major release for the commodity likely to be the US Bureau of Labor Statistics US jobs report for February, scheduled for release on Friday, March 10, traders may be wondering whether this will continue.
The impact of Nonfarm Payrolls (NFP) on Gold will depend on whether the labor data influences current elevated inflation expectations.
Gold price took a leg lower on Tuesday after comments by the Chairman of the Federal Reserve (Fed) showed he thought interest rates would have to rise in bigger steps to combat persistent inflation. Powell’s comments strengthened the US Dollar, since it benefits from higher US interest rates via the ‘carry trade’, a type of trade in which global investors move money around to jurisdictions where they can earn the most interest. Since Gold is priced in USD, it tends to fall when the US Dollar strengthens, which is why it weakened. US Treasury bonds also fell (their yields rose) and currently Gold price tends to go the same way as bonds.
Data from China at the start of the week – Gold’s biggest market – suggesting demand was softening also didn’t help the precious metal.
How will Gold price react to the US jobs report figures?
The US jobs report, scheduled to be released at 13:30 GMT, could provide important information, either confirming or tempering Powell’s hawkish comments. This is because the more people there are in employment, earning and spending money, the more likely inflation is to rise. As such, the headline Nonfarm Payrolls number could influence whether Gold’s downtrend makes further headway or not. A result that implies inflation will remain high will be negative for Gold and vice versa for the opposite.
Economists expect the NFP to show an average-level 205K jobs were added to the economy in February.
If the actual print is substantially higher – say by a margin of 50K or more – it will reinforce Powell’s fears about high inflation. This will increase expectations the Federal Reserve will raise interest rates more aggressively, further strengthening the US Dollar, and causing Gold price to depreciate.
If the print is substantially lower by a similar margin, it will have the opposite effect and enable Gold price to recover.
In truth, market expectations are already quite elevated that the Fed will raise interest rates by a bigger 0.50% hike at the meeting on March 22, rather than the 0.25% previously expected.
A market-based tool for gauging probabilities for different rate hikes, the CME FedWatch tool, places a 79% probability of a 0.50% hike, at the time of writing. This has increased from only 31% a week ago, before Powell’s speech. Therefore, one might argue there isn’t that much upside left, and perhaps more opportunity to the downside.
There are some other things to consider regarding the US jobs report:
- Nonfarm Payrolls in January showed a bumper 517K increase and this may get revised, probably down.
- Average Hourly Earnings are another important figure within the report since they are a key driver of inflation. They are expected to show a rise of 0.3%, the same as last month. The metric has not fallen beneath 0.3% for over a year, therefore if it were to fall below this key threshold, to say 0.2%, for example, it might dampen inflation expectations and provide relief to the Gold price.
- Unemployment Rate is another significant data point in the report. In January it fell to a post-covid record low of 3.4% and economists expect it to remain at that level in February.
- Labor Force Participation Rate – the percentage of working age people participating in the economy – is at a multi-year high of 62.4% and economists estimate it will fall to 62.3%. A fall in participation can take the edge of gains in other areas of the labor market.
From a technical perspective, Gold price appears to have reversed the steady-eddy uptrend that started in November 2022 and peaked at $1,960 on February 2.
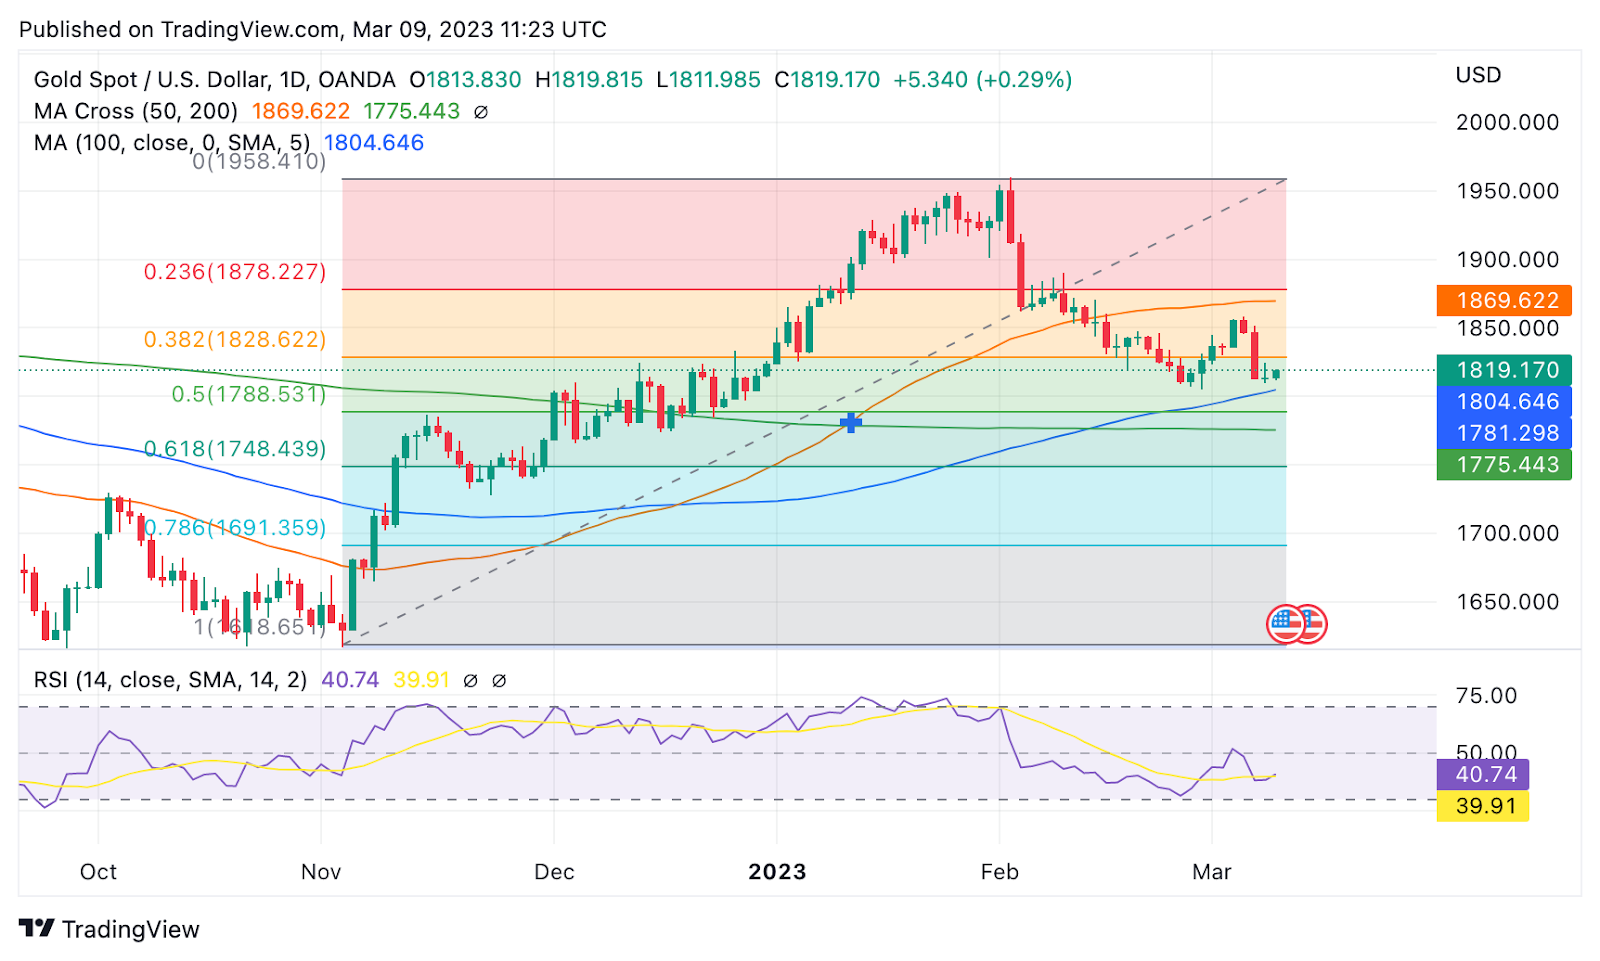
XAU/USD Daily Chart
Since then it has been going down and is now in a concerted short-term downtrend, with a bias that favors bears.
There are, however, significant support levels standing in the way of further declines. Both the 50 and 100-week Simple Moving Averages (SMAs) lie just below last week’s lows at $1,804 and the 100-day SMA is at the same level. These provide a triple lock of formidable SMAs acting as a hard floor under price, which is currently consolidating at $1,817.
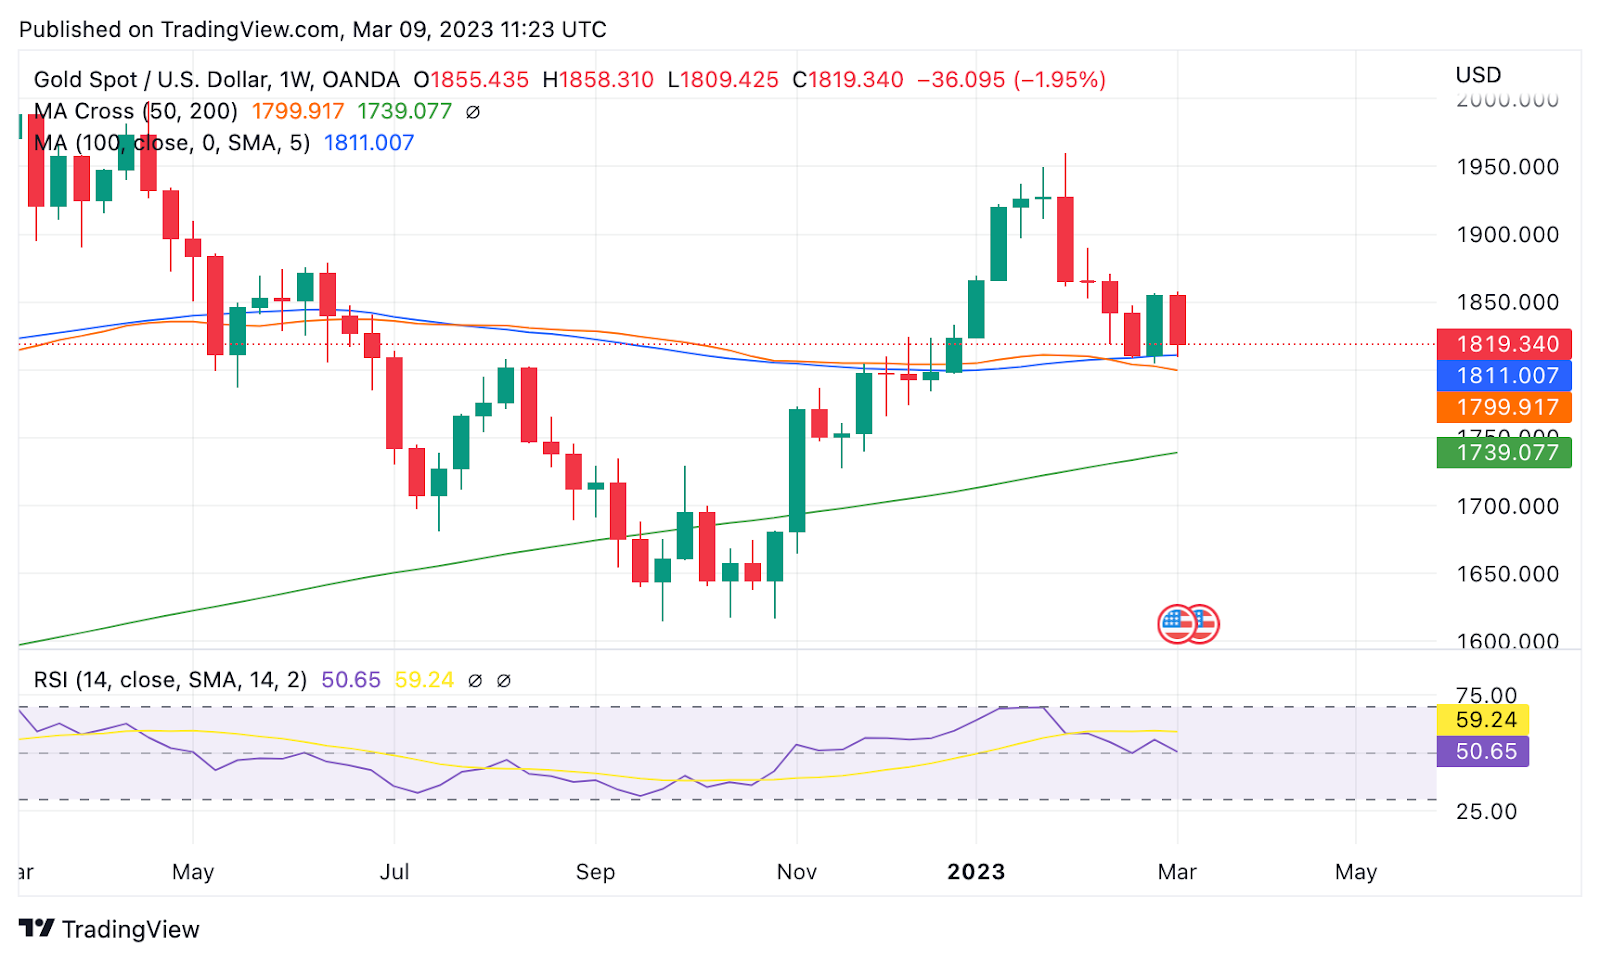
XAU/USD Weekly Chart
Only a clear break and close below them – confirmed by a daily close below $1,790 would provide confirmation of a break and continuation of the downtrend. RSI is currently showing a lack of underlying strength in the last sell-off following Powell’s comments, so more downside may be hard work for bears.
If a successful break does occur the next downside target would probably be at the 100% extrapolation of the recent decline to a target at $1,864, followed by the 0.618 Fibonacci retracement of the uptrend from November 2022 to February 2023, at $1,748.
A surprise rebound from a negative Nonfarm Payrolls number, for example, might see Gold price recover to the March 6 highs at $1,864 again, reversing all of the Powell downfall, at retesting resistance at that level.
US jobs report related content
- US February Nonfarm Payrolls Preview: Analyzing Gold price's reaction to NFP surprises
- Nonfarm Payrolls Preview: Five scenarios for the Fed, USD and stocks reactions, with probabilities
- Gold looks to Friday's NFP [Video]
About the US jobs report
The United States jobs report is released by the US Department of Labor, usually on the first Friday of every month. Along with other figures, the report presents the number of new jobs created during the previous month, in all non-agricultural business.
The monthly changes in the jobs added or lost can be extremely volatile, due to its high relation with economic policy decisions made by the US Federal Reserve. The number is also subject to strong reviews in the upcoming months, and those reviews also tend to trigger volatility across currencies and other financial markets.
Generally speaking, a high reading in the Nonfarm Payrolls headline number is seen as positive (or bullish) for the US Dollar, while a low reading is seen as negative (or bearish). That said, the previous month's reviews and other indicators like the Unemployment Rate can sometimes be as relevant as the headline figure.
- GBP/USD edges higher for the third successive day on Friday amid the ongoing USD downfall.
- Reduced bets for a 50 bps Fed rate hike in March and sliding US bond yields weigh on the buck.
- The upbeat UK GDP print for January benefits the GBP and lends support ahead of the US NFP.
The GBP/USD pair attracts some buyers during the early European session on Friday and climbs to a three-day high, around mid-1.1900s in reaction to the better-than-expected UK monthly GDP print.
The UK Office for National Statistics reported that the economy grew by 0.3% in January as compared to the 0.5% contraction recorded in the previous month and the 0.1% growth expected. This, to a larger extent, offsets the disappointing release of the UK Manufacturing and Industrial Production figures, which, in turn, is seen lending some support to the British Pound. Apart from this, the ongoing US Dollar retracement slide from a three-month low lends additional support to the GBP/USD pair.
A larger-than-expected rise in the US Weekly Jobless Claims was seen as the first sign of a softening labor market and forced investors to reassess the possibility of a 50 bps lift-off at the upcoming FOMC meeting on March 21-22. This is reinforced by a further pullback in the US Treasury bond yields and continues to weigh on the Greenback. The USD bulls, meanwhile, fail to gain any respite from the prevalent risk-off environment - as depicted by a sea of red across the global equity markets.
Traders, however, might refrain from placing aggressive bullish bets around the GBP/USD pair and positioning for an extension of this week's recovery move from the 1.1800 mark, or a fresh YTD low ahead of the US NFP report. The closely-watched US monthly jobs data is due for release later during the early North American session and will play a key role in influencing the Fed's policy outlook. This, in turn, will drive the USD demand and provide a fresh directional impetus to the major.
Technical levels to watch
- EUR/GBP takes offers to refresh intraday low, prints three-day downtrend.
- UK GDP improved in January, Industrial Production, Manufacturing Production deteriorated.
- Hopes of Britain’s economic rebound due to the latest reshuffle in governing policies, Brexit allow GBP to remain firmer.
- BoE versus ECB drama could check pair sellers as the key data begins in London.
EUR/GBP slides 10 pips to refresh intraday low near 0.8860 as the UK’s Office for National Statistics releases the monthly Gross Domestic Product (GDP) on early Friday. It should be noted that the optimism surrounding the British economic transition and mixed sentiment, as well as likely challenges for the Euro, seem to exert additional downside pressure on the cross-currency pair.
UK GDP grew 0.3% MoM in January versus 0.1% expected and -0.5% previous, which in turn pushes back the recession woes and propels the British Pound (GBP) despite mixed readings on the other fronts. That said, UK Industrial Production figures reversed the 0.3% previous expansion with -0.3% MoM marks whereas the Manufacturing Production growth dropped to -0.4% compared to -0.1% market forecasts and 0.0% prior.
Also read: UK Manufacturing Production declines 0.4% MoM in January vs. -0.1% expected
Elsewhere, hopes of economic recovery and more stock market listings seem to help the Cable pair amid a light calendar during the week. “The country's economy is on track to shrink less than expected this year and avoid the two-quarters of negative growth which mark a technical recession,” the British Chambers of Commerce (BCC) forecast on Wednesday per Reuters. Further, Britain’s finance ministry said on Wednesday it will launch a review into how investor research on companies could be improved to attract more listings, a step that follows a decision by UK chip designer Arm Ltd to only list in New York, reported Reuters. On the same line, Britain's revamped financial market rules will largely be aligned with U.S. and European Union regulations to minimize disruption to global companies, its financial services minister Andrew Griffith said on Thursday per Reuters.
It should be noted that Bank of England (BoE) policy maker Swati Dhingra warned against interest rate hikes on Wednesday while saying that overtightening poses a more material risk at this point.
On the other hand, fears of more economic pain for the bloc amid geopolitical tensions with Russia and sticky inflation, as well as higher rates, seem to drag the Euro. It should be noted that the risk-off mood underpins the US Dollar’s haven demand and reduces the demand of its major rival, namely the EUR.
Having witnessed the initial market reaction to the UK’s data dump, EUR/GBP pair traders may concentrate on European Central Bank (ECB) President Christine Lagarde for clear directions. Also important to watch will be a slew of top-tier data from the US and Canada that can entertain the momentum traders across the board.
Technical analysis
Failure to overcome the 0.8930 horizontal hurdle joins the EUR/GBP pair’s clear downside break of a one-week-old ascending trend line, around 0.8895 by the press time, to direct bears towards the 100-DMA support of 0.8765.
- Gold price has attempted recovery from $1,830.00 as USD Index is displaying a subdued performance.
- Weaker US Treasury yields are barricading the upside for the USD Index.
- Fed Powell has confirmed aggressive rate hikes and higher terminal rates to tame the stubborn inflation.
Gold price (XAU/USD) has delivered a break above the consolidation formed in a $2 range in the Asian session. On a broader note, the precious metal is inside the woods as $1,825-1,836 range consolidation is still intact ahead of the release of the United States Nonfarm Payrolls (NFP) data. The US Dollar Index (DXY) is facing barricades in extending its rebound move above 105.35 as weaker yields are keeping a cap on safe-haven’s appeal.
S&P500 futures have recorded significant losses in the Asian session after a nosedive Thursday as an endorsement of higher corporation taxes by US President Joe Biden has triggered a sense of pessimism among investors. Higher corporation taxes are going to dent dividends distributed to shareholders and earnings retained by the firms.
Although Federal Reserve (Fed) chair Jerome Powell has confirmed aggressive rate hikes and a higher terminal rate to tame the stubborn inflation, the release of the United States employment data will deliver more clarity.
Considering the better-than-anticipated US Automatic Data Processing (ADP) Employment figures, it is highly expected that the official employment data could display an upbeat number. As per the consensus, the Unemployment Rate is seen unchanged at 3.4%.
Also read: Gold Price Forecast: XAU/USD slides towards $1,810 on sour sentiment, US NFP in focus
Gold Price: Key levels to watch
The Technical Confluence Detector shows that the Gold price is gathering strength to reclaim the immediate resistance aligned at $1,832.70, where the previous day’s high and three-day high coincide.
A decisive break above $1,832.70 would expose the asset to an enormous high of $1,863.00, where monthly 38.2% Fibonacci retracement and daily upper Bollinger Band coincide.
An alternate case of a breakdown below $1,821.28, where daily 61.8% Fibo retracement and Pivot Point Weekly Support coincide will drag the Gold price dramatically to $1,806.00 where the previous month and previous low equate.
Here is how it looks on the tool
-638140283163317014.png)
About Technical Confluences Detector
The TCD (Technical Confluences Detector) is a tool to locate and point out those price levels where there is a congestion of indicators, moving averages, Fibonacci levels, Pivot Points, etc. If you are a short-term trader, you will find entry points for counter-trend strategies and hunt a few points at a time. If you are a medium-to-long-term trader, this tool will allow you to know in advance the price levels where a medium-to-long-term trend may stop and rest, where to unwind positions, or where to increase your position size.
The industrial sector activity showed contraction in January, the latest UK industrial and manufacturing production data published by Office for National Statistics (ONS) showed on Friday.
Manufacturing output arrived at -0.4% MoM in January versus -0.1% expectations and 0% registered in December while total industrial output came in at -0.3% MoM vs. -0.2% expected and 0.3% last.
On an annualized basis, the UK manufacturing production figures came in at -5.2% in January, missing expectations of -5.0%. Total industrial output plunged by 4.3% in the first month of the year against -4.0% expected and the previous -4.0% reading.
Separately, the UK goods trade balance numbers were published, which arrived at GBP-17.855 billion in January versus GBP-17.75 billion expectations and GBP-19.271 billion last. The total trade balance (non-EU) came in at GBP-7.808 billion in January versus GBP-7.484 billion previous.
Related reads
- UK GDP grows 0.3% MoM in January vs. 0.1% expected
- GBP/USD climbs to three-day top, around mid-1.1900s on better-than-expected UK GDP
- UK GDP arrived at 0.3% MoM in January vs. 0.1% expected.
- GBP/USD extends gains to near 1.1950 on upbeat UK GDP.
The UK Gross Domestic Product (GDP) monthly release showed on Friday that the economy expanded in January, arriving at 0.3 % vs. 0.1% expectations and -0.5% previous.
Meanwhile, the Index of services (January) came in at 0% 3M/3M vs. 0.1% estimate and 0% prior.
Commenting on the GDP data, UK Finance Minister Jeremy Hunt said, “the UK economy has proved more resilient than many expected, but there is a long way to go.”
Market reaction
The Cable picked up fresh bids on the upbeat UK growth numbers. At the press time, the spot is trading 0.17% higher on the day at 1.1944, having briefly recaptured 1.1950 on the data release.
About UK GDP
The Gross Domestic Product released by the National Statistics is a measure of the total value of all goods and services produced by the UK. The GDP is considered a broad measure of the UK economic activity. Generally speaking, a rising trend has a positive effect on the GBP, while a falling trend is seen as negative (or bearish).
- Nonfarm Payrolls report is expected to show a job addition of 205,000 in February.
- US Dollar may be affected by critical data, which may show a 4.7% increase in year-over-year Average Hourly Earnings for workers.
- The Bureau of Labor Statistics is set to report an Unemployment Rate of 3.4% in February.
The Nonfarm Payrolls (NFP) data will be released by the Bureau of Labor Statistics (BLS) this Friday at 13:30 GMT. The NFP release is expected to show job gains of 205,000. However, another positive surprise cannot be ruled out, which could strengthen the renewed upside in the US Dollar (USD).
The US Dollar caught a fresh bid wave and resumed its recovery, following the hawkish comments delivered by Chairman of the Federal Reserve (Fed) Jerome Powell, in his bi-annual testimony earlier this week.
He said that “if the totality of the data were to indicate that faster tightening is warranted, we would be prepared to increase the pace of rate hikes.” He added that the "ultimate level of interest rates" is likely to be higher than previously anticipated as well. While that justifies the resurgent US Dollar demand, the further upside hinges on another strong Nonfarm Payrolls headline number.
What to expect in the next Nonfarm Payrolls report?
Friday's United States (US) economic docket highlights the release of the closely-watched US monthly jobs report data for February. And, the Nonfarm Payrolls expectations are that the economy added 205K jobs during the reported month, down from the stunner 517K in January. The Unemployment Rate is expected to remain unchanged at 3.4% in the second month of this year.
Investors will also pay close attention to the Average Hourly Earnings, especially after the January US Consumer Price Index (CPI) and the Fed’s preferred inflation gauge, the Core PCE Price Index, came in hotter than expected.
It’s worth mentioning that on the state of the United States labor market, Powell said that "overall data on the labor market shows it is extremely tight and contributing to inflation."
Analysts at Commerzbank are bullish on the US labor market and expect another solid jobs report: “Although much lower job gains are to be expected for February, at 240K they should be far from weak. Such an increase in employment would be noteworthy because the US labor market is already extremely tight with an unemployment rate of 3.4%, the lowest since 1969, and this figure is unlikely to have changed in February. Accordingly, we expect the report to support expectations for further rate hikes. We forecast a 25 bps hike at each of the Fed's next three meetings.”
When will be US February Nonfarm Payrolls report released and how could it affect EUR/USD?
The Nonfarm Payrolls report is scheduled for release at 13:30 GMT, on March 10. With the US Dollar reaching a fresh three-month high, courtesy of heightened expectations for a 50 basis points (bps) March Fed rate hike, the EUR/USD pair is languishing in weekly lows below the 1.0600 psychological mark. Stronger US employment details could provide additional legs to the ongoing advancements in the USD, throwing the major pair deeper into losses.
On the other hand, a weaker-than-expected NFP print could trigger a sharp correction in the USD, as it would squash expectations of bigger rate increases by the Fed and an eventual higher terminal rate. The market repricing of the Fed rate hike outlook could reinstate US Dollar bearish trades, initiating a potential turnaround in the EUR/USD pair.
Dhwani Mehta, Analyst at FXStreet, offers a brief technical overview and outlines important technical levels to trade the EUR/USD pair: “The main currency pair is extending its three-day recovery momentum from two-month lows of 1.0524 heading into the NFP showdown. The pair faces strong resistance at the downward-sloping 21-Daily Moving Average (DMA) at 1.0634 once the 1.0600 mark is reclaimed. The next significant resistance levels are seen at the weekly high of 1.0694 and 1.0720 (the flattish 50 DMA).”
“However, the recent upside in the EUR/USD pair appears shortlived, as the 14-day Relative Strength Index (RSI) still remains below the midline, despite the latest uptick. Therefore, on renewed selling, the pair could change course and retest the bullish 100 DMA support at 1.0533, below which a fresh drop toward the 1.0500 level could be in the offing. The last line of defense for Euro bulls is envisioned at 1.1483, the year-to-date low,” Dhwani adds.
Nonfarm Payrolls related content
- Gold Price Forecast: XAU/USD to retest 100 DMA support on strong US Nonfarm Payrolls
- Nonfarm Payrolls Preview: Five scenarios for the Fed, USD and stocks reactions, with probabilities
- EUR/USD Analysis: Bulls remain at the mercy of USD price dynamics ahead of NFP report
About the Nonfarm Payrolls report
The Nonfarm Payrolls released by the US Department of Labor presents the number of new jobs created during the previous month, in all non-agricultural business.
The monthly changes in payrolls can be extremely volatile, due to its high relation with economic policy decisions made by the US Federal Reserve. The number is also subject to strong reviews in the upcoming months, and those reviews also tend to trigger volatility in the forex board.
Generally speaking, a high reading is seen as positive (or bullish) for the US Dollar, while a low reading is seen as negative (or bearish), although previous month's reviews and the Unemployment Rate are as relevant as the headline figure
The US Bureau of Labor Statistics (BLS) will release the February jobs report on Friday, March 10 at 13:30 GMT and as we get closer to the release time, here are the forecasts by the economists and researchers of 10 major banks regarding the upcoming employment data.
Nonfarm Payrolls in the US are forecast to rise by 203K following the 517K increase recorded in January, with the unemployment rate seen steady at 3.4% and average hourly earnings picking up to 4.8% year-on-year vs. 4.4% in January.
Commerzbank
“Although much lower job gains are to be expected for February, at 240K they should be far from weak. Such an increase in employment would be noteworthy because the US labor market is already extremely tight with an unemployment rate of 3.4%, the lowest since 1969, and this figure is unlikely to have changed in February. Accordingly, we expect the report to support expectations for further rate hikes. We forecast a 25 bps hike at each of the Fed's next three meetings.”
Danske Bank
“After the January effects from warm weather and heavy seasonal adjustments fade, we see NFP growth moderating to 220K in February. The nominal terminal rate has been repriced 60 bps higher since the January NFP, which we consider aggressive to be based on only one month worth of data. A sudden softer release could well spark temporary rallies, and hence we still like to hold on to our call of terminal rate at 5.00-5.25%. That said, the bar is low for including another 25 bps for June.”
ING
“We have pencilled in a 200K jobs gain for February but we have next to no confidence. Any random guess between -500K and +500K would be just as valid as our own guest. Business surveys of employment remain soft and job loss announcements are up 440% year-on-year and there is a high chance of revisions to January’s 517K jump. Given that pretty much anything could happen in this report, the likelihood of significant market volatility in the hours and potentially days around the jobs report is high.”
SocGen
“We expect another 280K increase in February. An increase of 150K per month over time should result in a declining unemployment rate. The unemployment rate of course is a separate survey. The 150K threshold is close to the rate of growth in the working-age population, and exceeding that pace would ultimately drive the unemployment rate lower.”
NBF
“We expect payroll growth to have decelerated to 190K in the month, which would remain very solid given the increasingly limited number of people remaining on the sidelines. The household survey is expected to show a similar gain, something which would leave the unemployment rate unchanged at 3.4%, assuming the participation rate stayed put at 62.4%.”
Deutsche Bank
“We expect 300K for both headline and private payrolls. As with January, February was also mild weather-wise for the survey week (which can mean less leisure, hospitality and retail layoffs), although not as much as in the prior month. So the temperature will likely still be an influence. There was a reasonable question mark about seasonal distortions in the last report so who knows how that will impact this week's report. We acknowledge the seasonals but the revisions at the same time to last year's payrolls data suggest the labour market was stronger going into 2023 than previously thought, which means a fair amount of the recent job gains was likely genuine. Unemployment is expected to stay at 54-year lows of 3.4% with the risks it ticks down a tenth.”
CIBC
“We expect a brisk pace of hiring to have created 205K jobs in February. An improvement in the weather in January likely overstated job gains at the start of the year and adds downside risk to February’s print. We expect the unemployment rate to remain at 3.4%. We’re roughly in line with the consensus expectation, which could limit any market reaction.”
Citibank
“Last month’s seasonal adjustment that resulted in a large boost to employment should reverse in February as some workers return to payrolls. Meanwhile, the unemployment rate to remain at 3.4% as the household survey could be somewhat softer than the 255K payrolls after strong gains over the last few months.”
Wells Fargo
“We look for hiring in February to downshift from the torrid January pace but to remain strong at 270K. Equally important to Federal Reserve officials will be data on labor force participation and average hourly earnings. Slowing wage growth would be a sign that labor supply and demand are coming back into a healthier balance.”
Credit Suisse
“We expect job gains to slow to 200K in February after a surprising reacceleration to start the year. The unemployment rate fell sharply in January and we expect it to go sideways in this report at 3.4%. Average hourly earnings have decelerated in the past six months, and we expect this trend to continue with a 0.3% MoM increase in February. Underlying wage growth appears to be moderating across a range of measures and lead indicators, but the current pace of growth is still uncomfortably high for the Fed.”
Bank of Japan (BOJ) Governor Haruhiko Kuroda is speaking at his last post-policy meeting conference on Friday, expressing his take on the monetary policy and economic outlook.
Additional quotes
2% price target is appropriate as it is a global standard.
Monetary easing has been successful in terms of supporting Japan's economic potential.
Positive effects of monetary easing far exceeded side-effects.
True that two sales tax hikes affected consumption, consumer inflation.
Not thinking Abenomics has put too much burden on monetary policy.
Market reaction
USD/JPY was last seen trading at around 136.75, up 0.49% on the day.
- Silver price fades bounce off four-month low after confirming bearish chart pattern earlier in Asia.
- Bearish MACD signals, sustained trading below the key EMAs keep XAG/USD sellers directed toward $18.80 theoretical target.
- Convergence of flag’s top line, 100-EMA appears short-term key upside hurdle to watch during corrective bounce.
Silver (XAG/USD) remains on the back foot around the $20.00 round figure amid early Friday in Europe, fading the bounce off the intraday low.
In doing so, the bright metal retreats from the lower line of a three-day-old bear flag, after confirming the downside suggesting chart formation earlier in the day.
Adding strength to the bearish bias are the downbeat MACD signals and the XAG/USD’s sustained trading below the 100 and 200 Exponential Moving Averages (EMAs).
That said, the recent lows marked around $19.90 and the latest October 2022 peak surrounding $19.75 may entertain the intraday sellers of the Silver during the theoretical target surrounding $18.80.
Meanwhile, recovery moves could aim for the convergence of the 100-EMA and the stated flag’s upper line, close to $20.35. Also acting as an upside filter is the 200-EMA level surrounding $20.65.
It should be noted that the monthly high near $21.30 holds the key to the Silver buyer’s conviction.
To sum up, the Silver price remains bearish and can refresh the four-month low marked earlier in the day.
Silver price: Hourly chart
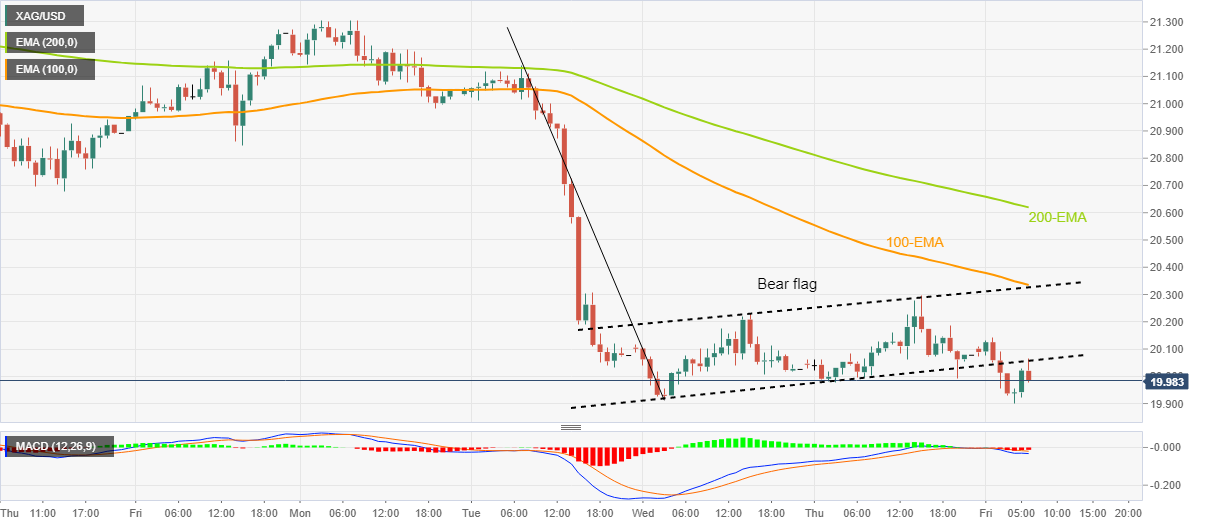
Trend: Further downside expected
Bank of Japan (BOJ) Governor Haruhiko Kuroda is speaking at his last post-policy meeting conference on Friday, noting that he “won't hesitate to ease monetary policy further if necessary.”
Additional quotes
Japanese economy is picking up.
Regrettable that 2% inflation has not been achieved sustainably, stably.
I have personally known professor ueda, who is representative economist in Japan.
I have known Himino, Uchida well, expect them to help with new governor to achieve BoJ’s duty.
Large monetary stimulus helped push up economy.
There are always benefits and side effects to monetary policy.
It is a shame that 2% inflation target was not achieved in a sustainable, stable way over last 10 years.
Expect Ueda to be able to achieve price and financial stability.
Important to continue monetary easing to encourage companies to raise wages.
We are getting a little closer to 2% inflation target.
Cannot comment on what next boj governor will do.
Market reaction
At the time of writing, USD/JPY is keeping its range at around 136.75, up 0.49% on the day.
The UK Economic Data Overview
The British economic calendar is all set to entertain the Cable traders during the early hours of Friday, at 07:00 GMT with the monthly release of January 2023 Gross Domestic Product (GDP) figures. Also increasing the importance of that time are Trade Balance and Industrial Production details for the stated period.
Having witnessed a contraction of 0.5% in economic activities during December 2022, market players will be interested in January month’s GDP figures to confirm the fears of an economic slowdown.
Forecasts suggest that the UK GDP will mark stagnation of the British economy with 0.1% MoM figures for January. GBP/USD traders also await the Index of Services (3M/3M) for the same period, likely to improve to 0.1% versus 0.0% prior, for further insight.
Meanwhile, Manufacturing Production, which makes up around 80% of total industrial production, is expected to ease to -0.1% MoM in January. Also, the total Industrial Production may shrink by 0.2% versus the 0.3% previous expansion.
Considering the yearly figures, the Industrial Production for January is expected to have dropped to -4.0% versus -4.0% previous while the Manufacturing Production is anticipated to have improved to -5.0% in the reported month versus -5.7% the last.
Separately, the UK Goods Trade Balance for October will be reported at the same time and is expected to deteriorate to £-7,966B versus the prior readings of £-7,484B.
How could affect GBP/USD?
GBP/USD struggles to defend the third consecutive profit-making day after bouncing off the lowest levels since November 2022 on Tuesday. In doing so, the Cable pair portrays the market’s cautious mood ahead of the key UK data dump, as well as the US employment report.
The Cable pair’s latest gains could be linked to the US Dollar’s broad-based retreat ahead of the key US Nonfarm Payrolls (NFP) data. Also favoring the Cable buyers could be the Brexit optimism, as well as the UK policymakers’ readiness to easy equity market listing rules to defend London’s financial status.
That said, a positive surprise from the scheduled British statistics may, however, could offer only a kneejerk bounce amid broad pessimism surrounding the UK’s economic growth and likely a lesser hawkish outlook over the BOE than the Fed. It should be noted that the looming US jobs report for February also prods the GBP/USD traders.
Technically, GBP/USD managed to regain its place above the 200-DMA level of 1.1900, after a two-day absence, which in turn keeps buyers hopeful.
Key notes
GBP/USD grinds higher past 1.1900 ahead of UK data dump, US NFP
GBP/USD Forecast: Pound Sterling remains fragile despite technical correction
About the UK Economic Data
The Gross Domestic Product released by the Office for National Statistics (ONS) is a measure of the total value of all goods and services produced by the UK. The GDP is considered a broad measure of the UK's economic activity. Generally speaking, a rising trend has a positive effect on the GBP, while a falling trend is seen as negative (or bearish).
The Manufacturing Production released by the Office for National Statistics (ONS) measures the manufacturing output. Manufacturing Production is significant as a short-term indicator of the strength of UK manufacturing activity that dominates a large part of total GDP. A high reading is seen as positive (or bullish) for the GBP, while a low reading is seen as negative (or bearish).
The trade balance released by the Office for National Statistics (ONS) is a balance between exports and imports of goods. A positive value shows a trade surplus, while a negative value shows a trade deficit. It is an event that generates some volatility for the GBP.
- USD/JPY has turned sideways around 136.65 as investors await US NFP for further guidance.
- BoJ Kuroda continued expansionary monetary policy as the domestic demand and wages have failed to spur inflation.
- The RSI (14) is gathering strength for shifting into the bullish range of 60.00-80.00.
The USD/JPY pair is displaying a volatility contraction around 136.65 after sheer volatility inspired by the continuation of an ultra-easy monetary policy by the Bank of Japan (BoJ). BoJ Governor Haruhiko Kuroda continued expansionary monetary policy as the domestic demand and wages have failed to spurt inflation in the Japanese economy.
The US Dollar Index (DXY) is gathering strength in extending its recovery above the immediate resistance of 105.35. The USD Index has been extremely quiet as investors are awaiting the release of the United States Nonfarm Payrolls (NFP) data. S&P500 futures are continuously accelerating losses as fears of aggressive interest rates by the Federal Reserve (Fed) are skyrocketing.
Meanwhile, the demand for US government bonds is soaring, which has trimmed the 10-year US Treasury yields further below 3.82%.
On an hourly scale, USD/JPY has rebounded firmly from the upward-sloping trendline plotted from March 06 low at 135.37. The asset has extended its recovery above the critical resistance of 136.45, which has turned into support for the US Dollar bulls.
The recovery move in the USD/JPY looks full of strength as the asset has scaled above the 20-and 50-period Exponential Moving Averages (EMAs) at 136.40 and 136.55 respectively.
Meanwhile, the Relative Strength Index (RSI) (14) is making efforts in shifting into the bullish range of 60.00-80.00. An occurrence of the same will trigger the upside momentum.
Going forward, a break above the intraday high at 137.00 will drive the asset toward March 08 high at 137.90 followed by November 28 high at 139.43.
Alternatively, a downside move below the intraday low at 135.82 will drag the asset toward March 01 low at 135.26. A slippage below the latter will expose the asset to February 24 low at 134.06.
USD/JPY hourly chart
-638140252996119846.png)
- NZD/USD fades bounce off the lowest levels since late November 2022, grinds lower of late.
- 50-EMA pierces 200-EMA from above to portray death cross suggesting further downside of the Kiwi pair.
- Oversold RSI conditions, lows marked during mid-November challenge bears.
- Buyers need a successful break of 0.6265 to retake control.
NZD/USD extends the previous day’s pullback from mid-0.6100s as bears flirt with the 0.6100 threshold during early Friday. In doing so, the Kiwi pair justifies Thursday’s failure to cross the late February swing low.
That said, the 50-bar Exponential Moving Average (EMA) pierces the 200-EMA from above and portrays the death cross, which in turn suggests further downside of the NZD/USD.
However, the RSI (14) line is oversold and hence, lows marked during mid-November 2022, around 0.6060, may act as strong support for the NZD/USD bears to watch.
In a case where the Kiwi pair refrains from bouncing off 0.6060 support, it becomes vulnerable to drop towards the early November 2022 peak surrounding the 0.6000 psychological magnet.
Alternatively, a downward-sloping resistance line from February 14, close to the 0.6200 round figure, seems to challenge the NZD/USD pair’s immediate recovery.
It’s worth noting, though, that a convergence of the 50-EMA and 200-EMA, around 0.6265, appears a tough nut to crack for the NZD/USD bulls, a break of which could trigger a run-up targeting the mid-February swing high near 0.6390.
Overall, NZD/USD is likely to decline further but the room towards the south appears limited.
NZD/USD: Daily chart
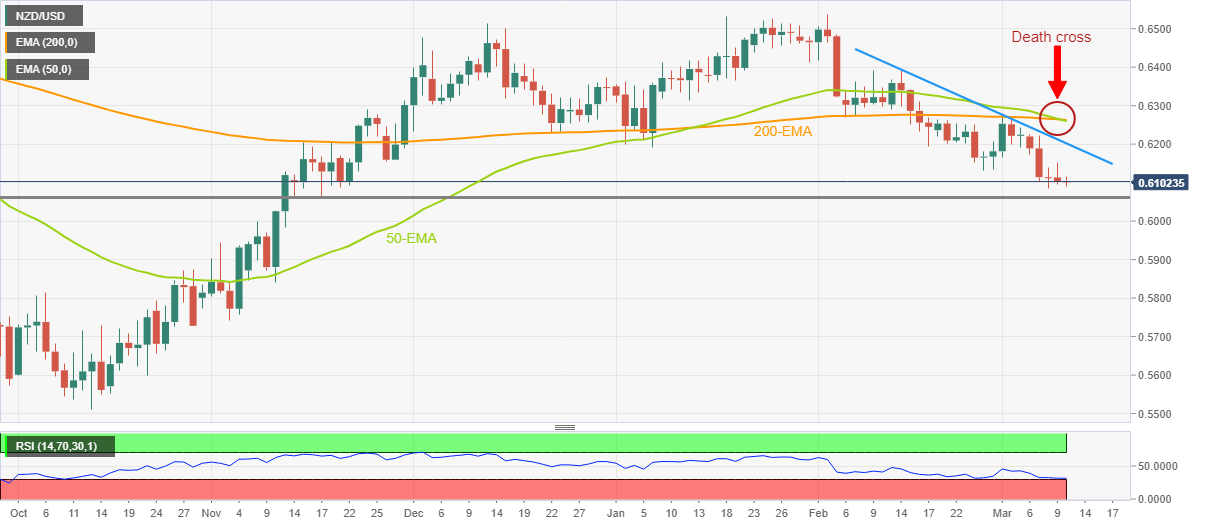
Trend: Further downside expected
- WTI crude oil drops to the lowest levels since February 27, down for the fourth consecutive day.
- Fears of higher inflation, rate lifts join pre-data anxiety to weigh on Oil price.
- Sluggish US Dollar, Treasury bond yields fail to recall energy buyers.
- US NFP, Russia’s reaction to US ties with UK, Australia for nuclear submarine eyed.
WTI crude oil prices remain on the back foot around $75.20 as bears cheer the four-day losing streak amid early Friday in Europe. In doing so, the energy benchmark bears the burden of the risk-off mood ahead of the key data/events.
That said, fears of higher inflation and the need for more rate lifts from the major central banks seem to roil the risk profile.
New York Fed mentioned, in its latest report, that recent upward revisions to inflation data coupled with higher-than-expected levels of inflation had changed the picture of what had appeared to be cooling in price pressures. It should be observed that the previous day’s mixed signals of the US employment data allowed the US Dollar to remain weak, which in turn seemed to have put a floor under the Oil price.
On the contrary, Bloomberg’s analysis suggesting China’s consumer spending is showing signs of a strong rebound joins the hopes of more stimulus from the dragon nation and the US readiness for more spending to prod the risk-off mood and the Oil bears. Additionally putting a floor under the WTI are the geopolitical fears surrounding US President Joe Biden’s budget proposal for 2024 and the US partnership with the UK and Australia for nuclear submarines.
While portraying the mood, S&P 500 Futures remain depressed at the monthly low while US Treasury bond yields stretch the previous day’s pullback from a multi-day high.
Moving on, Oil traders should pay attention to the risk catalysts, as well as the US employment report for February for clear directions.
Technical analysis
WTI slips below the 23.6% Fibonacci retracement level of its November-December 2022 downside, near $75.60, to stretch the early-week pullback from the six-week-old horizontal resistance area surrounding $80.80-$81.00.
The black gold’s pullback joins bearish MACD signals and downbeat RSI (14), not oversold, to keep sellers hopeful of marking another try in breaking the two-month-old ascending support line near $74.20.
Following that, $72.60 is likely a small buffer during the anticipated fall towards January’s low near $70.30.
Alternatively, the 50-DMA level surrounding $77.80 guards the WTI’s immediate recovery ahead of the aforementioned multi-day-old horizontal resistance area near $81.00.
It’s worth noting, however, that the 50% Fibonacci retracement level and a descending resistance line from early December 2022, close to $81.60 and $82.00 in that order, also challenge the WTI crude oil buyers.
WTI crude oil: Daily chart
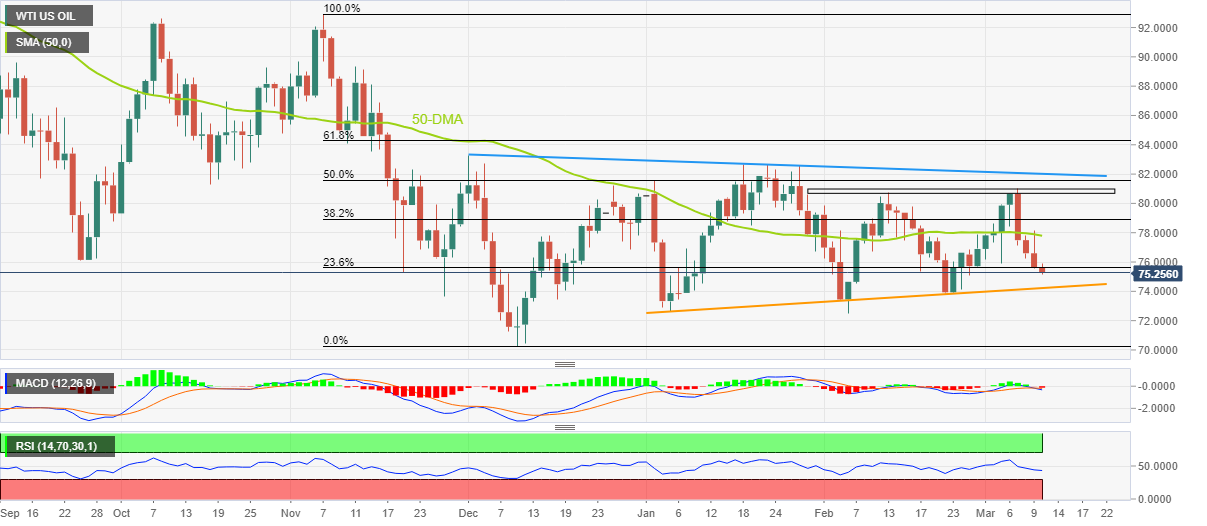
Trend: Further downside expected
- Asian stocks are heavily punished as S&P500 was dumped heavily on Thursday.
- The headline of China’s XI Jinping selection for the third presidential term has failed to support Chinese stocks.
- Moderate capital expenditure and consumption in Japan cited by BoJ Kuroda has brought volatility in Nikkei225.
Markets in the Asian session are demonstrating a bloodbath as rising fears of aggressive interest rate hikes by the Federal Reserve (Fed) turned investors risk-averse. Asian stocks are discounting the intense sell-off that happened in the 500-US stocks basket on Thursday as expectations of upbeat labor market data are conveying that Fed chair Jerome Powell would have no other option than to paddle rates higher.
The US Dollar Index (DXY) has attempted a recovery move after two days of gradual correction. The USD Index is likely to regain the driving seat as investors might gung-ho for safe-haven assets after the release of the United States Nonfarm Payrolls (NFP) data, which will provide clarity on US labor market data.
At the press time, Japan’s Nikkei225 cracked 1.68%, ChinaA50 tumbled 1%, Hang Seng nosedived 2.62%, and Nifty50 surrendered more than 1%.
Fading optimism over Chinese economy recovery after the dismantling of pandemic controls has pushed equities to the south. Thursday’s weak inflation figures have cleared that the economy is struggling to steer its domestic demand.
Also, the headline of China’s XI Jinping selection for the third presidential term unanimously by the Chinese parliament has failed to support Chinese stocks.
Japanese equities have shown immense volatility as Bank of Japan (BoJ) Governor Haruhiko Kuroda favored the continuation of ultra-loose monetary policy in its last meeting. The statement from BoJ Kuroda that capital expenditure and consumption are moderate and exports and imports are trending sideways have triggered a sense of pessimism among investors as the central bank is disbursing heavy stimulus for a longer period.
On the oil front, oil prices have dropped to near $75.00 amid rising fears of a bleak economic outlook in the United States and China.
- USD/INR bears attack a convergence of 50-SMA, one-week-old resistance line.
- Upbeat oscillators suggest further recovery but 200-SMA acts as additional upside filter.
- Ascending trend line from Monday restricts immediate downside.
USD/INR struggles to extend the previous day’s recovery moves as it retreats to 82.00 round figure heading into Friday’s European session. In doing so, the Indian Rupee (INR) pair steps back from a convergence of the 50-bar Simple Moving Average (SMA) and a downward-sloping resistance line from February 27.
Even so, the bullish MACD signals and upward-sloping RSI (14), not overbought, keep USD/INR buyers hopeful of crossing the immediate 82.15 resistance confluence.
Following that, the 200-SMA level surrounding 82.35 acts as the last defense of the pair bears, a break of which could quickly propel the USD/INR prices toward the 23.6% Fibonacci retracement level of its late January-February upside, around 82.55.
It should be noted that the Indian Rupee’s weakness past 82.55 could help the USD/INR bulls to refresh the monthly high, currently around 83.10. In that case, the October 2022 peak of near 83.43 will be in focus.
On the flip side, USD/INR pullback may initially aim for the weekly support line, close to 81.80 at the latest.
However, the 61.8% Fibonacci retracement level and the monthly low, respectively near 81.70 and 81.60, could test the USD/INR bears before giving them control.
Overall, USD/INR is likely to recover but the road to the upside is long and bumpy.
USD/INR: Four-hour chart
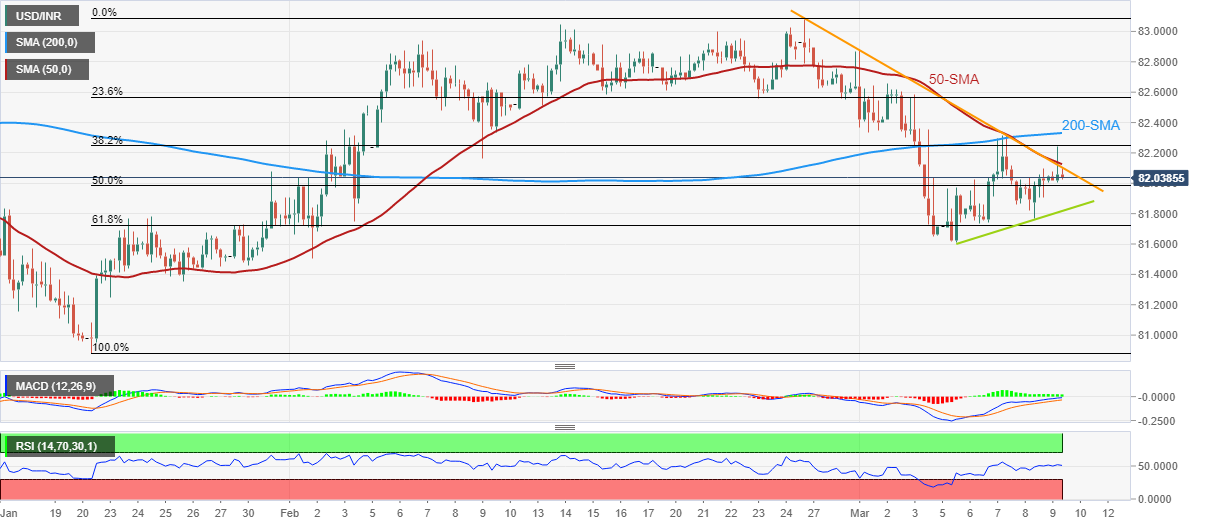
Trend: Further upside expected
- GBP/USD has turned sideways above 1.1900 ahead of US NFP and UK manufacturing data.
- The 10-year US Treasury yields have dropped firmly to near 3.83% amid mixed responses on the US labor market.
- The Cable has met with the horizontal resistance plotted from 1.1915.
The GBP/USD pair is displaying a back-and-forth action in a narrow range of 1.1904-1.1940 continuously from the late New York session. The Cable has turned sideways as investors are awaiting the release of the United States Nonfarm Payrolls (NFP) and the United Kingdom’s manufacturing data for fresh impetus.
The US Dollar Index (DXY) is facing heat in extending its recovery above 105.35 as mixed responses from US labor market-linked indicators have confused investors about the strength of the labor market. A significant jump in Initial Jobless Claims data released on Thursday, and a four-fold planned lay-off, as reported by Reuters, indicates signs of deceleration in the employment status, which has improved demand for US Treasury bonds. The 10-year US Treasury yields have dropped firmly to near 3.83%.
Stretched recovery in the GBP/USD pair has met with the horizontal resistance plotted from February 17 low at 1.1915 on an hourly scale. The Cable is demonstrating an inventory adjustment phase, which could be a transfer of inventory from institutional investors to retail participants.
The 20-period Exponential Moving Average (EMA) at 1.1910 is providing cushion to the Pound Sterling.
Meanwhile, the Relative Strength Index (RSI) (14) has slipped to near 60.00 but has not surrendered the bullish range yet.
Should the Cable break below the round-level support of 1.1900, US Dollar bulls will drag the asset further toward March 08 high at 1.1860 followed by November 17 low at 1.17633.
On the flip side, a move above February 24 high at 1.2040 will drive the asset toward February 23 high around 1.2080. A breach of the latter will expose the asset to February 21 high around 1.2140.
GBP/USD hourly chart
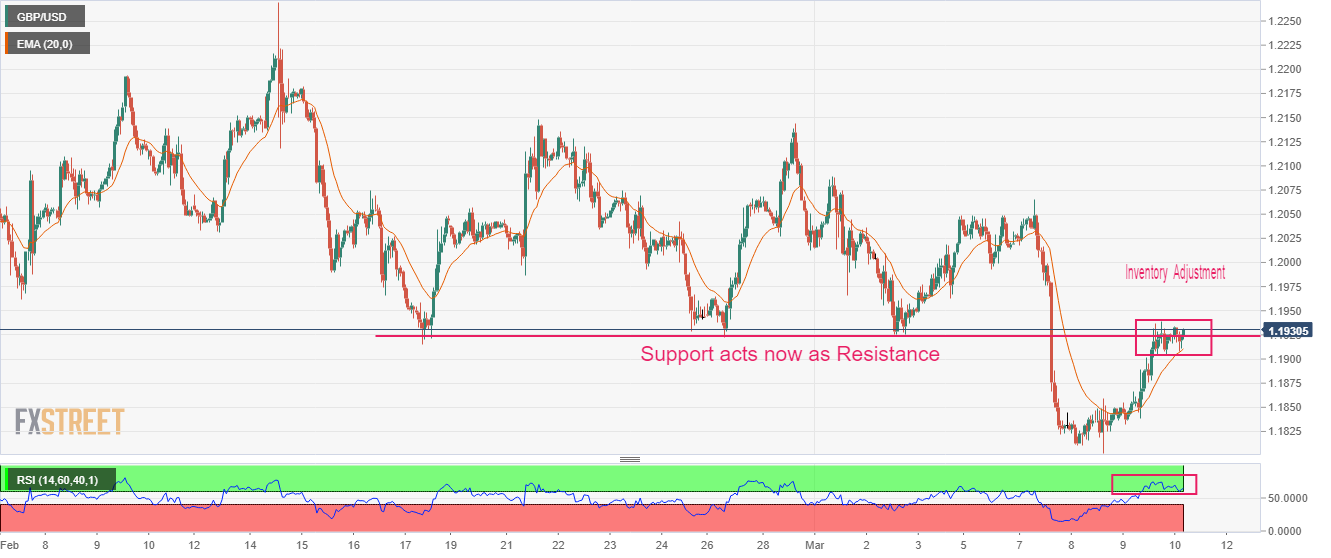
- AUD/USD has refreshed its four-month low at 0.6563 as anxiety among investors has soared ahead of US NFP.
- The Australian Dollar is struggling to firm its feet as optimism linked with China’s economic recovery is fading.
- US Unemployment Rate is expected to remain steady at rock-bottom levels.
The AUD/USD pair has printed a fresh four-month low at 0.6563 in the Asian session. The Aussie asset is facing immense pressure as the US Dollar Index (DXY) has shown a recovery move after a correction to near 105.13.
Although the recovery move from the USD Index is not strong enough, the Australian Dollar is struggling to firm its feet as optimism linked with China’s economic recovery is fading and the Reserve Bank of Australia (RBA) is considering the current monetary policy is restrictive enough to bring down the sticky inflation.
The USD Index is struggling to extend its recovery above 105.35. S&P500 futures have extended losses firmly as the higher tax burden endorsed by US President Joe Biden to support the blue-collar section has discouraged investors. US Biden proposed an increase in corporation tax from 21% to 28%. Also, rich investors are liable to pay hefty taxes now. A sheer sell-off in the 500-US stocks basket is portraying a dismal market mood.
Meanwhile, the demand for US government bonds is accelerating as investors are skeptical about the United States labor market after a surprise jump in the Initial Jobless Claims released on Thursday. A jump in jobless claims by 11%, the highest in the past five months indicates that the US labor market is getting complicated now. Also, a four-fold planned lay-off reported by Reuters indicates that the strength in the labor market is fizzing out.
For transparency on the status of the US labor market, US Nonfarm Payrolls (NFP) data will be keenly watched. According to the estimates, the world’s largest economy has added fresh 203K payrolls in February, lower than the bumper release of 517K recorded for January. The Unemployment Rate is expected to remain steady at 3.4%.
- EUR/USD remains on the front foot for the second consecutive day as buyers attack 100-HMA.
- Overbought RSI conditions, 200-HMA challenge recovery from multi-day low.
- Confirmed break of ascending triangle, multiple tops near 1.0690 push back buyers.
EUR/USD bulls attack the 100-Hour Moving Average (HMA) surrounding 1.0600 as they keep the reins during the second consecutive day on early Friday, waiting for the US employment report for February, as well as a speech from European Central Bank (ECB) President Christine Lagarde.
Not only the 100-HMA but the overbought conditions of the RSI line, placed at 14, also challenge the EUR/USD buyers ahead of the top-tier data/events.
Even if the quote surpasses the 1.0600 hurdle, the 200-HMA level surrounding 1.0610 can act as an extra filter towards the north.
Above all, the EUR/USD bears keep the reins unless the quote stays below the lower line of a one-week-old ascending triangle, the previous support surrounding 1.0650.
Following that, multiple tops marked near 1.0690-95, as well as the 1.0700 threshold, should gain the buyer’s attention.
On the contrary, the month-start bottom of around 1.0565 precedes the latest February swing low and the recent trough, respectively near 1.0530 and 1.0520, to challenge the EUR/USD bears.
It should be observed that the pair’s sustained trading below the 1.0520 mark will need validation from the 1.0500 round figure to convince the EUR/USD sellers.
Talking about fundamentals, the inflation woes and Fed Chair Jerome Powell’s hawkish testimony seems to keep the EUR/USD sellers hopeful but the confirmation from today’s US Nonfarm Payrolls (NFP) becomes necessary.
EUR/USD: Hourly chart
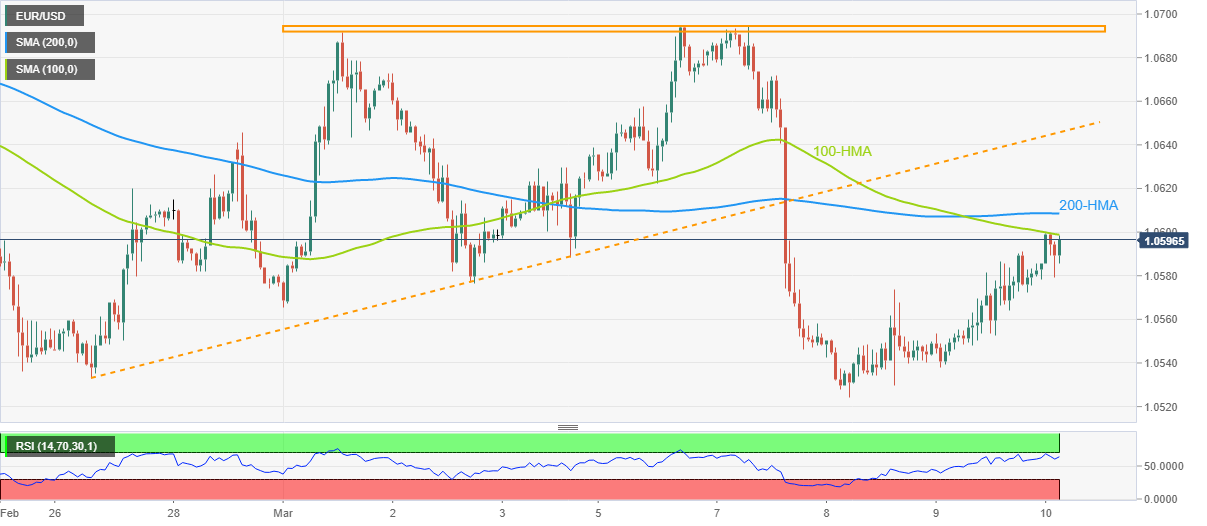
Trend: Pullback expected
- Gold price takes offers to refresh intraday low, pares the biggest daily gain in a week amid volatile session.
- BoJ inaction fails to tame market’s fears amid inflation concerns.
- Geopolitical woes, US Dollar’s rebound from intraday low also weigh on XAU/USD price.
- Key central bank announcements, US employment data for February will be the key for fresh impulse.
Gold price (XAU/USD) remains pressured around the intraday bottom near $1,828 as markets brace for the US jobs report, after witnessing a haywire move on the Bank of Japan’s inaction, during early Friday. It’s worth noting that the precious metal’s latest weakness appears more linked to the risk-off mood than to the US Treasury bond yield and the US Dollar as both these catalysts are in the red zone, despite bouncing off recently.
While talking about the sentiment, BoJ highlights inflation fears and joins the New York Fed to challenge the policy doves, suggesting more rate hikes and question the economic growth, which in turn tease Gold sellers.
That said, the BoJ keeps the short-term interest rate target at -0.1% while directing 10-year Japanese Government Bond (JGB) yields within the band of +/-0.50%.
On the other hand, New York Fed mentioned, in its latest report, that recent upward revisions to inflation data coupled with higher-than-expected levels of inflation had changed the picture of what had appeared to be cooling in price pressures.
It should be observed that the previous day’s mixed signals of the US employment data allowed the US Dollar to remain weak, which in turn seemed to have put a floor under the Gold price.
Also positive for the Gold price could be a news piece from Bloomberg suggesting that China’s consumer spending is showing signs of a strong rebound joining the hopes of more stimulus from the dragon nation and the US readiness for more spending.
However, the latest risk-off mood and cautious sentiment ahead of the Nonfarm Payrolls (NFP) join the geopolitical fears to weigh on sentiment. Among them, US President Joe Biden’s budget proposal for 2024 and the US partnership with the UK and Australia for nuclear submarines weigh on the risk appetite and the XAU/USD.
Looking ahead, the US jobs report for February will be observed closely as traders have recently curtailed the market’s bets on the 50 bps rate hike in March.
Also read: Nonfarm Payrolls Preview: Five scenarios for the Fed, USD and stocks reactions, with probabilities
Gold price technical analysis
Gold price slides within a one-week-old symmetrical triangle, recently easing from the resistance line amid an impending bear cross on the MACD. It’s worth noting that the RSI’s retreat from the overbought territory also exerts downside pressure on the XAU/USD price that aims for the 100-bar Exponential Moving Average (EMA), around $1,827 at the latest.
However, a broad support area between $1,820 and $1,823, comprising multiple levels marked since late February, appears a tough nut to crack for the Gold sellers afterward.
Should the XAU/USD price remains weak past $1,820, an upward-sloping support line from February, forming part of the aforementioned triangle, could act as the last defense of the Gold buyers near $1,810.
Meanwhile, an upside clearance of the stated triangle’s top line, close to $1,835 at the latest, could propel the Gold price towards the month-start peak surrounding $1,845. Following that, the monthly high of nearly $1,859 will be in the spotlight.
Overall, Gold price signals further downside but the room towards the south appears limited.
Gold price: Hourly chart
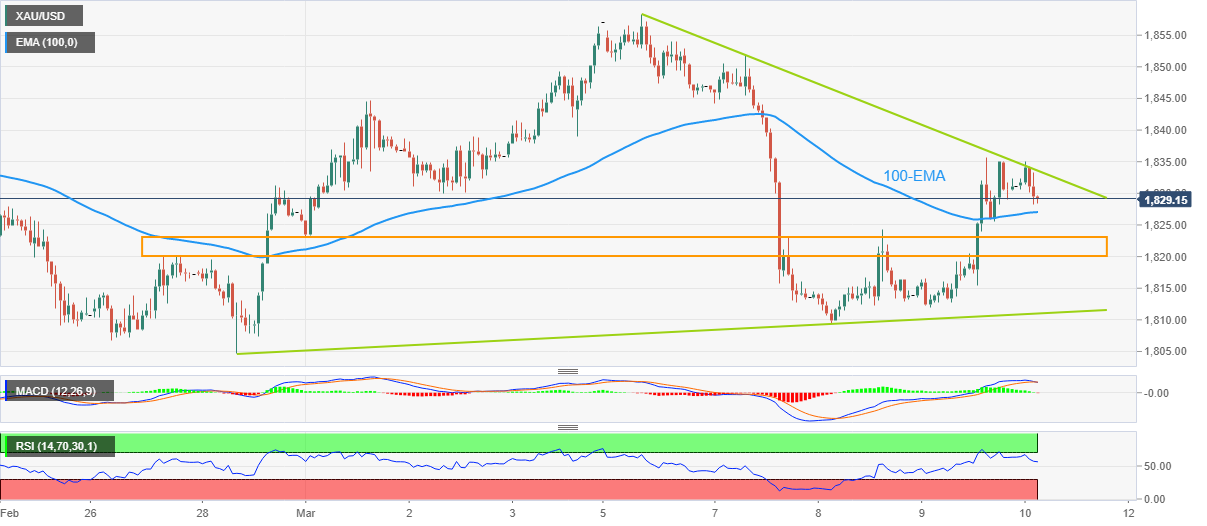
Trend: Further downside expected
- GBP/JPY is aiming to recapture the 163.00 resistance as the Japanese Yen may remain volatile on the dovish BoJ policy.
- BoJ Governor Kuroda will be known for leaking sheer stimulus in the economy to get it out of deflation.
- Going forward, UK’s Manufacturing sector data will be of utmost importance.
The GBP/JPY pair is making efforts in recapturing the critical resistance of 163.00 in the Aisna session. The cross has been propelled after the Bank of Japan (BoJ) Governor Haruhiko Kuroda decided to hold its longstanding ultra-loose monetary policy to stimulate domestic demand. Also, any announcement on the band of 10-year Japanese Government Bonds (JGBs) remained absent.
BoJ Kuroda has mentioned that the Japanese economy is picking up as the impact of the pandemic and supply chain disruptions is fading away. However, remarks dictating moderate capital expenditure and consumption stated that the expansionary monetary policy will continue to stay for a longer period.
BoJ Governor Kuroda will be known for leaking sheer stimulus in the economy to get it out of deflation. However, a hefty price has been paid by commercial banks, which were not making any major profits.
On the inflation front, BoJ Kuroda cited that the core Consumer Price Index (CPI) that excludes oil and food prices is hovering around 4% and also inflation expectations are rising.
With the approval from both houses of Parliament Governor Nominee Kazuo Ueda Ueda has been confirmed as the next BoJ governor. While Shinichi Uchida and Ryozo Himino were appointed as the next BoJ deputy governors by Japan's upper house.
Meanwhile, the Pound Sterling is likely to dance to the tunes of the United Kingdom’s Manufacturing sector data. Monthly Manufacturing production (Jan) and Industrial Production are expected to contract by 0.1% and 0.2% respectively. Contracting manufacturing activities in the UK economy are accelerating the chances of a recession ahead.
BoE policymaker Swati Dhingra warned against further interest rate increases by citing “Overtightening poses a more material risk at this point.” She further added, “Many tightening effects are yet to fully take hold.”
- AUD/JPY marks 70-pip rebound from multi-day low on BoJ, picking up bids of late.
- BoJ defends current monetary policy status even as the dovish Governor departs after a decade.
- Governor Kuroda’s speech, risk catalysts eyed for fresh impulse.
AUD/JPY portrays a rollercoaster move as the Bank of Japan (BoJ) refrains from any major surprises even as Governor Haruhiko Kuroda braces for a goodbye during early Friday. That said, the cross-currency pair initially dropped to 89.26 and refreshed the seven-week low before rallying to the 90.00 threshold, around 89.90 by the press time.
BoJ keeps the short-term interest rate target at -0.1% while directing 10-year Japanese Government Bond (JGB) yields within the band of +/-0.50%. The BoJ Statement, however, mentioned that inflationary expectations are rising, which in turn raises doubts about the future of the Japanese central bank’s ultra-easy monetary policy.
Also read: BoJ: Inflation expectations heightening
Apart from the BoJ moves, a news piece from Bloomberg suggesting that China’s consumer spending is showing signs of a strong rebound joins the hopes of more stimulus from the dragon nation and the US readiness for more spending seems to also favor the AUD/JPY buyers.
Amid these plays, S&P 500 Futures dropped to a fresh low since January 10, down half a percent near 3,900, whereas the US 10-year and two-year Treasury bond yields fall for the second consecutive day to 3.83% and 4.76% in that order.
Elsewhere, the geopolitical fears surrounding China and the US, mainly due to Taiwan, as well as fears emanating from Russia, exert downside pressure on the AUD/JPY prices.
It should, however, be noted that the dovish rhetoric from Reserve Bank of Australia (RBA) Governor Philip Lowe, compared with likely challenges to the BoJ’s ultra-easy monetary policy and the market’s bets of an interest rate hike during late 2023, seems to also cap the AUD/JPY prices ahead of a volatile day.
Technical analysis
Failure to provide a decisive break of an upward-sloping support line from late January 2022, around 89.50 by the press time, keeps AUD/JPY buyers hopeful of poking the previous support line from early January 2023, close to 90.40 at the latest.
- EUR/JPY has dropped quickly from 145.00 amid BoJ’s unchanged monetary policy-inspired volatility.
- BoJ Kuroda has mentioned that the impact of the pandemic and supply chain disruptions is fading away.
- A Reuters poll indicates that chances of a recession in Eurozone have trimmed to 34%.
The EUR/JPY pair has shown a wild gyration as the Bank of Japan (BoJ) has kept a neutral stance on monetary policy. The cross has reversed quickly after testing the critical resistance of 145.00. An interest rate decision of unchanged monetary policy by BoJ Governor Haruhiko Kuroda was widely anticipated as the current inflationary pressures in the Japanese economy are not grown domestically.
The BoJ has kept interest rates at -0.1% as expected. Also, the central bank has maintained its 10-year Japanese Government Bonds (JGBs) yield target of around 0%. BoJ Kuroda has also mentioned that the Japanese economy is picking up as the impact of the pandemic and supply chain disruptions is fading away.
Earlier, Governor Nominee Kazuo Ueda Ueda was confirmed as the next BoJ governor after approval by both houses of parliament. While Shinichi Uchida and Ryozo Himino were appointed as the next BoJ deputy governors by Japan's upper house.
Last week, BoJ Ueda also highlighted the need of maintaining the expansionary monetary policy as the needle of Japan’s Consumer Price Index (CPI) was moving by import prices as domestic demand and wages were insufficient to spurt price pressures.
On the Eurozone front, investors have started discussing the interest rate decision by the European Central Bank (ECB) for March monetary policy as inflationary pressures are rebounding again despite a spree of rate hikes. The latest survey of 60 economists polled by Reuters during March 7-9 indicates that ECB President Christine Lagarde will push the bank’s deposit rate by 50 basis points (bps). And, 25 bps hikes will be announced at the following three meetings in May, June, and July to give a terminal deposit rate of 3.75%.
The survey also claims that chances of a recession in the Eurozone have diminished to 34% from 50% observed in January’s poll.
- USD/JPY initially rallied nearly 100 pips on BoJ’s status quo before retreating to 136.30.
- BoJ leaves benchmark rate unchanged at -0.10%, keeps YCC target surrounding 0.0%.
- BoJ Governor Kuroda will announce details of the latest moves around 06:00 GMT for the one last time.
- Comments from incoming BoJ Governor Ueda, US NFP will also be crucial for clear directions.
USD/JPY portrays a stellar reaction to the Bank of Japan’s (BoJ) inaction during early Friday, initially rallying to 136.97 before retreating to 136.30. In doing so, the Yen pair justifies the Japanese policymaker’s dovish bias even as Governor Haruhiko Kuroda bid adieu after nearly a decade of defending the Asian major.
That said, the BoJ keeps the short-term interest rate target at -0.1% while directing 10-year Japanese Government Bond (JGB) yields within the band of +/-0.50%. The BoJ Statement, however, mentioned that inflationary expectations are rising, which in turn raises doubts about the future of the Japanese central bank’s ultra-easy monetary policy.
Also read: BoJ: Inflation expectations heightening
On the other hand, the US 10-year and two-year Treasury bond yields fall for the second consecutive day, to 3.83% and 4.76% in that order, and challenge the USD/JPY buyers ahead of the key press conference from BoJ Governor Kuroda.
That said, the latest fall in the yields could be linked to the geopolitical fears surrounding China and the US, as well as Russia, not to forget mixed US data and indecision for the Federal Reserve (Fed).
Mixed US data and impending inflation fears appear important catalysts for the markets to remain jittery as the US Initial Jobless Claims marked the biggest jump since January by rising to 211K for the week ended on March 03 versus 195K expected and 190K prior. Additionally, the Challenger Job Cuts were down and the Continuing Jobless Claims were up. It should be noted that the latest report from the New York Fed mentioned that recent upward revisions to inflation data coupled with higher-than-expected levels of inflation had changed the picture of what had appeared to be a cooling in price pressures.
Moving on, Kuroda’s speech will be crucial for the USD/JPY traders ahead of the US jobs report for February.
Technical analysis
Unless marking a successful break of 200-DMA, around 137.50 by the press time, the USD/JPY remains on the bear’s radar.
In its March monetary policy statement, the Bank of Japan (BoJ) highlighted the following about the economic and inflation outlook.
BoJ leaves unchanged forward guidance on interest rates.
Japan's economy picking up.
Japan's economy expected to recover as impact of pandemic, supply constraints fade.
Exports and output moving sideways, capex and consumption increasingly moderately.
Core consumer inflation moving around 4%.
Inflation expectations heightening.
Will keep balance of commercial paper holdings around 2 trln yen.
Will purchase corporate bonds at about the same pace as before covid so amount outstanding will gradually return to pre-pandemic level of around 3 trln yen.
- NZD/USD has slipped below 0.6100 as investors turn anxious ahead of US NF data.
- The USD Index has rebounded firmly after correcting to near 105.13, portraying a recovery in the risk-off mood.
- An increment in the labor cost index will confirm that fears of persistent inflation conveyed by Fed Powell were real.
The NZD/USD pair was struggling to firm its feet above the round-level resistance of 0.6100. The Kiwi asset has surrendered the aforementioned resistance in the Asian session as the US Dollar Index (DXY) has attempted a recovery after a corrective move to near 105.13. A recovery move from the USD Index was highly anticipated as investors usually get anxious ahead of any critical event.
The FX domain is expected to remain on tenterhooks ahead of the release of the United States Nonfarm Payrolls (NFP) data. As per the projections, the US economy has recorded a jump in the number of payrolls by 203K in February. The Unemployment Rate is seen unchanged at 3.4%. Apart from them, the economic indicator which could spoil market mood is the Average Hourly Earnings data.
Higher wages offered by the US firms to bring fresh talent on board due to a shortage of labor are offsetting the impact of rate hikes from the Federal Reserve (Fed). Going forward, the economic data is expected to accelerate further to 4.7% from the former release of 4.4%. An increment in the labor cost index will confirm that fears of persistent inflation conveyed by Fed chair Jerome Powell were real and more aggressive rates are in pipeline to strengthen monetary tools further.
On the New Zealand front, weak China’s Consumer Price Index (CPI) data is indicating that the domestic demand in the Chinese economy has not shown an expected recovery despite the reopening measures. It is worth noting that New Zealand is one of the leading trading partners of China and lower demand in China could weaken NZ exports and eventually impact the New Zealand Dollar.
“The peak for European Central Bank interest rates will be much higher than thought only a month ago,” per the latest survey of 60 economists polled by Reuters during March 7-9. The respondents also added that stubbornly high inflation would push policymakers to be more aggressive.
Key findings
All 60 economists polled by Reuters March 7-9 believed her and said the bank's deposit rate would rise 50 basis points to 3.00% on Thursday.
Medians in the poll showed the euro zone's central bank adding 25 basis points at the following three meetings in May, June and July to give a terminal deposit rate of 3.75%, higher than the 3.25% peak expected in a February poll.
While the median showed the deposit rate peaking at 3.75% it was a view held by only 19 of 60 economists surveyed. Twelve said it would be higher but 29 said it would be lower. The highest forecast was for 4.25%.
However, over 90% of respondents to an extra question, or 35 of 38, said the risks were the terminal rate would be higher than they expect.
There is now only a 34% chance of a recession within the coming year, the poll found, down from 50% in a January poll.
Also read:EUR/USD bulls poke 1.0600 as mixed US data test Fed hawks, US NFP, ECB’s Lagarde eyed
At its March monetary policy meeting, the Bank of Japan (BoJ) board members decided to leave their monetary policy settings unchanged, maintaining rates at -10bps and 10yr JGB yield target unchanged at 0.00%.
Summary of the statement
No change to yield band.
No change to forward guidance on interest rates.
BoJ maintains band around its 10-year JGB yield target at up and down 0.5% each.
BoJ made decision on YCC by unanimous vote.
Market reaction
USD/JPY storms through the 136.00 level on BoJ’s inaction. The pair is currently trading at 136.72, up 0.44% on the day.
- Market sentiment deteriorates as traders await BoJ, US NFP.
- S&P 500 Futures stretch the previous day’s fall towards refreshing multi-day low.
- Yields remains pressured and weigh on US Dollar but Gold, Oil fails to rise.
- Geopolitical woes, inflation fears add strength to the risk-off mood as traders brace for huge volatility.
The risk profile remains dour as market players await this week’s key data/events amid early Friday. Adding strength to the sour sentiment could be the geopolitical fears surrounding China and the US, as well as Russia.
While portraying the mood, the S&P 500 Futures drop to a fresh low since January 10, down half a percent near 3,900, whereas the US 10-year and two-year Treasury bond yields fall for the second consecutive day to 3.83% and 4.76% in that order.
Mixed US data and impending inflation fears appear important catalysts for the markets to remain jittery as the US Initial Jobless Claims marked the biggest jump since January by rising to 211K for the week ended on March 03 versus 195K expected and 190K prior. Additionally, the Challenger Job Cuts were down and the Continuing Jobless Claims were up.
It should be noted that the latest report from the New York Fed mentioned that recent upward revisions to inflation data coupled with higher-than-expected levels of inflation had changed the picture of what had appeared to be a cooling in price pressures.
Elsewhere, the geopolitical fears emanating from US President Joe Biden’s budget proposal for 2024 and the US partnership with the UK and Australia for nuclear submarines weigh on the risk appetite.
Alternatively, a news piece from Bloomberg suggesting that China’s consumer spending is showing signs of a strong rebound joins the hopes of more stimulus from the dragon nation and the US readiness for more spending seems to battle with the market’s pessimism.
Above all, the cautious mood prior to the Bank of Japan’s (BoJ) Monetary Policy Meeting announcements, as well as the US and Canadian jobs report for February, not to forget the UK data dump, challenge the optimists amid hawkish bias from the key central banks.
Also read: Forex Today: Risk off and a mixed Dollar with all eyes on NFP
| Raw materials | Closed | Change, % |
|---|---|---|
| Silver | 20.067 | 0.13 |
| Gold | 1830.9 | 0.91 |
| Palladium | 1393.73 | 2.83 |
- GBP/JPY keeps the previous day’s losses around two-week low, depressed of late.
- Monthly bearish channel, sustained trading below previous support line signals further downside.
- 200-SMA appears the key challenge to bears amid sluggish RSI.
GBP/JPY holds lower ground at the intraday bottom surrounding 162.00 as pair traders await the all-important Bank of Japan (BoJ) monetary policy meeting announcements early Friday.
Also read: GBP/JPY rebounds from 162.00 ahead of UK Manufacturing data and BoJ policy
In doing so, the cross-currency pair remains inside a downward-sloping trend channel from March 01 while keeping the early week’s downside break of the five-week-old support-turned-resistance line.
It’s worth noting that the absence of an oversold RSI and the quote’s sustained trading below the 50-bar Simple Moving Average (SMA) adds strength to the bearish bias.
That said, the stated channel’s bottom line, around 161.65 by the press time, appears to put a floor under the GBP/JPY prices. Following that, the 200-SMA level, near 161.20 by the press time, acts as the last defense of the buyers.
In a case where GBP/JPY remains bearish past 161.20, the sellers may aim for the mid-February swing low surrounding 160.50 and the 160.00 round figure.
Alternatively, recovery moves can target the 163.00 round figure but may have a tough time crossing the 163.25-30 resistance confluence, encompassing the aforementioned channel’s top line and the 50-SMA.
Even if the quote rallies past 163.30, the previous support line from early February, near 163.50, could challenge the run-up before directing the GBP/JPY bulls towards the previous monthly peak surrounding 166.00.
GBP/JPY: Four-hour chart
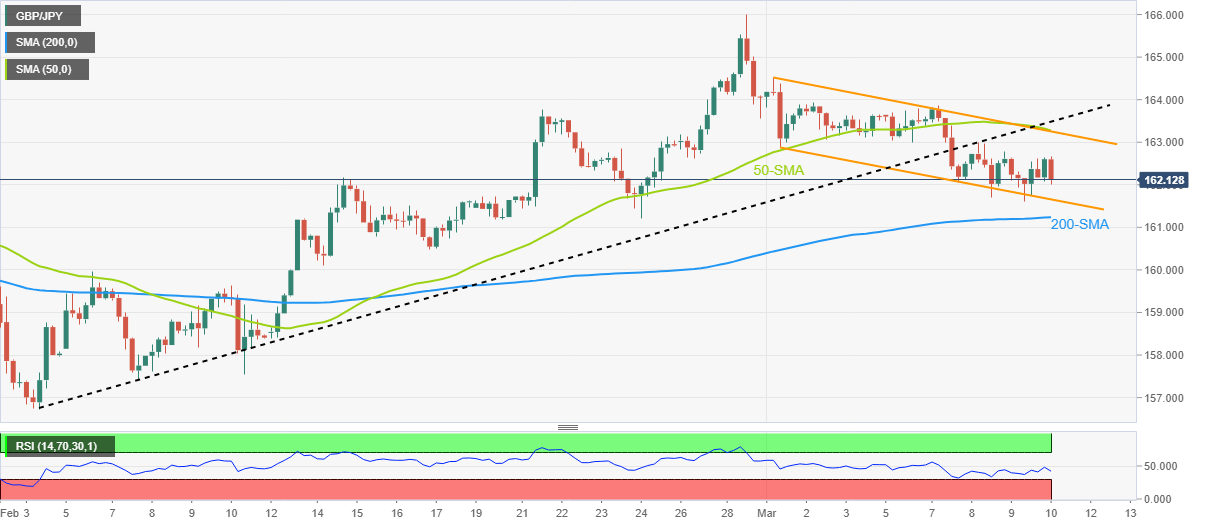
Trend: Further downside expected
- Gold holds steady ahead of key US jobs data.
- Bears are lurking in a key area on the charts. testing a 50% mean reversion area.
Gold price was firmer on Friday as the US Dollar tailed off after data showed that weekly US jobless claims grew more than expected. This led to the market thinking twice with respect to the Federal Reserve's next move.
At the time of writing, the US Dollar index, DXY, was down 0.13%, making the Gold price less expensive for buyers in other currencies. Gold price is holding in the $1,830s on the day so far ahead of the key Nonfarm Payrolls.
Meanwhile, 'the number of people submitting jobless claims in the US increased. Initial claims rose to 211k in the week to 4 March, while continuing claims (from the prior week) lifted to 1,718k,'' analysts at ANZ Bank explained.
''This latest data indicates the labour market may be starting to cool, but this data tends to be very volatile so the market will be looking for further evidence that labour demand is cooling. One measure indicating US companies are starting to cut back their workforce is Challenger Job Cuts data, which shows 77,000 jobs were cut during February,'' the analysts added.
''That is not as much as the January figure of 109,243 but it is 410% higher than the previous February, and it is the highest number of jobs cut in any February since 2009. Most of the cuts are coming in the technology, retail and financial sectors.''
Next key US data
Meanwhile, the forthcoming releases of February US labour and Consumer Price Inflation data will be instrumental in for traders who will be trying to preempt the Federal Open Market Committee's next move at the March meeting. The run of strong US economic data releases last month had already cemented the risk of a higher for longer outlook for Fed interest rates.
Analysts at TD Securities explained that they look for payroll gains to mean-revert to 230k in February following the gangbuster report that saw job creation surge to 517k in January. ''We also expect the unemployment rate to remain unchanged at a historically low level; while average hourly earnings likely accelerated to a 0.4% m/m gain, lifting the y/y measure to a still-elevated 4.8%.''
Gold price technical analysis
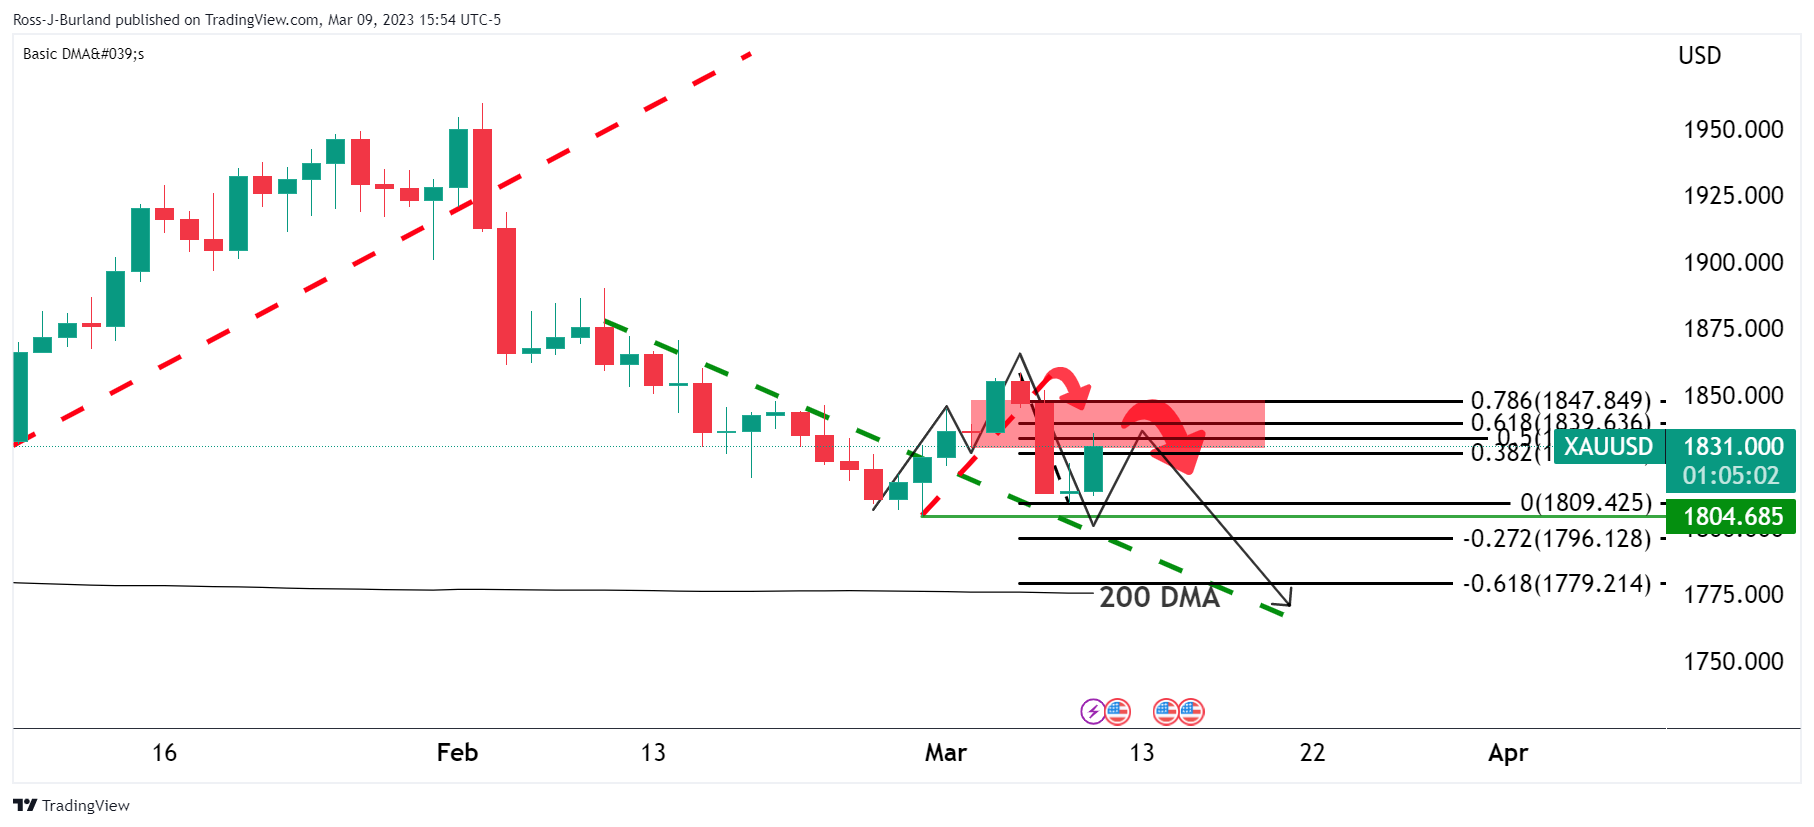
Gold price crossed back above the $1,825 mark in the pursuit of the neckline of M-formation's neckline. There is a support location down at $1,804 with resistance above $1,850. If the bears move in again, then there will be prospects of a move to test the Gold price 200 DMA in the coming days with the $1,1770s eyed in that regard.
- USD/CHF takes offers to refresh intraday low, drops for the third consecutive day.
- Bearish chart formation, downbeat MACD conditions keep sellers hopeful.
- Five-week-old ascending support line, 200-SMA act as additional downside filters.
USD/CHF holds onto the mid-week bearish bias as it drops to 0.9320 during early Friday. That said, the Swiss currency (CHF) pair portrays a bearish chart formation called “double tops” by marking failures to cross the 0.9440 hurdle. The same join the bearish MACD signals to keep the pair sellers hopeful.
However, an upward-sloping support line from early February, around the 0.9300 threshold at the latest, restricts the immediate downside of the pair ahead of the validation point of the bearish chart pattern, namely the early week’s low near 0.9285.
It’s worth noting that the 200-SMA can act as an extra check for the USD/CHF bears before directing them toward the theoretical target of 0.9130, provided the quote remains weak past 0.9285.
Meanwhile, the 0.9400 round figure may act as an immediate upside hurdle for the USD/CHF pair during the pair’s fresh advances.
Even so, the pair sellers can keep the reins unless the quote remains below the double tops marked surrounding 0.9440.
In a case where the USD/CHF price remains firmer past 0.9440, tops marked during late November 2022, around 0.9550 and the 0.9600 round figure, could challenge the pair buyers.
Overall, USD/CHF remains on the bear’s radar but a clear break of 0.9285 becomes necessary to witness further downside of the pair.
USD/CHF: Four-hour chart
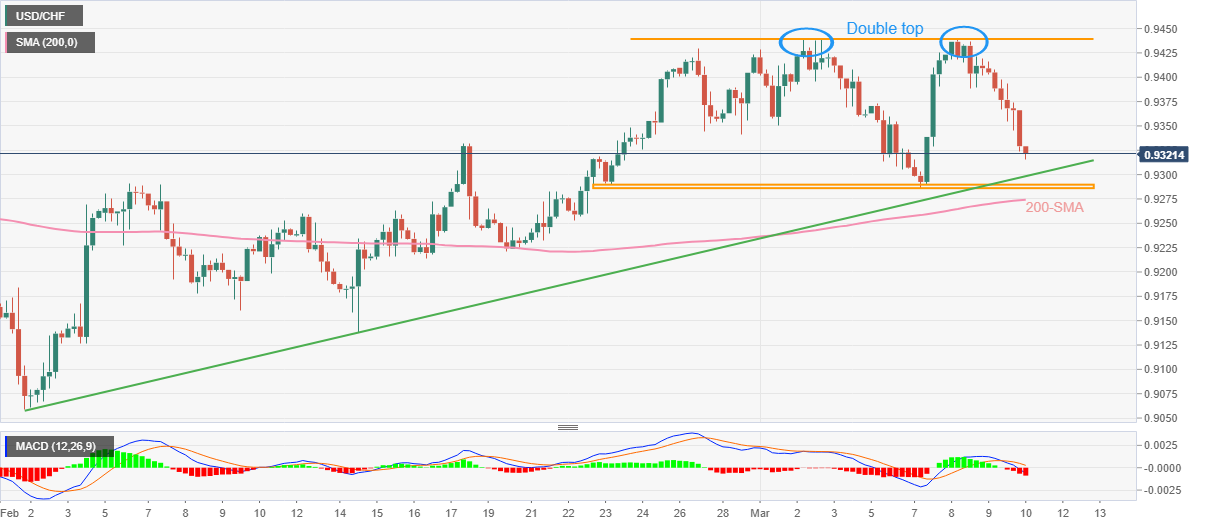
Trend: Further downside expected
Early on Friday, around 03:00 AM GMT, the Bank of Japan (BoJ) will announce the ordinary monetary policy meeting decisions taken after a two-day brainstorming. Following the rate decision, BoJ Governor Haruhiko Kuroda will attend the press conference, around 06:00 AM GMT, to convey the logic behind the latest policy moves.
The Japanese central bank is widely expected to keep the short-term interest rate target at -0.1% while directing 10-year Japanese Government Bond (JGB) yields with the bank of +/-0.50%.
As today’s BoJ monetary policy meeting is the last for Governor Haruhilo Kuroda, who fetched the Asian major from the jaws of deflation during a decade-long fight with deflation, the monetary policy announcements are crucial for the USD/JPY traders to watch.
Although the BOJ isn’t expected to offer any change in its monetary policy, the latest hawkish moves of the major central banks and the inflation fear in Japan, as well as receding real wages, highlight today’s BOJ as the key event. Also increasing the importance of the BOJ announcements are the chatters over Governor Haruhiko Kuroda’s last dovish shot and welcome notes of the incoming Governor Kazuo Ueda.
Ahead of the event, FXStreet’s Valeria Bednarik said,
No changes are expected in this March meeting. Market participants anticipate the interest rate will be held at -0.1% while the Yield Curve Control (YCC) will maintain the current cap of 0.5%. A policy shift by Kuroda in his last meeting would be a shocker, and he usually aims to avoid introducing too much noise.
How could it affect the USD/JPY?
USD/JPY remains depressed around 136.00, extending the previous day’s losses amid broad US Dollar weakness and downbeat Treasury bond yields, ahead of the key BoJ announcements.
Japanese policymakers have already jostled with the expectations of a major move to alter the ultra-easy monetary policy. However, the recent announcement of bond-buying and talks of the town supporting the official push for higher rates in late 2023 seem to challenge the USD/JPY buyers. It should be noted, however, that the BoJ’s play of the Yield Curve Control (YCC) will be crucial to observe during today’s monetary policy releases.
In a case where Kuroda manages to pave the way for future rate hikes, either via the alteration of the YCC band or dumping the YCC ultimately, the USD/JPY could extend its latest U-turn from the 200-DMA hurdle surrounding 137.50.
Alternatively, an absence of no moves and the policymakers’ support the easy money could recall the USD/JPY buyers. However, the rebound will then wait for the US jobs report for clear directions.
Key Notes
Bank of Japan Preview: Kuroda’s and ultra-loose policy farewell
USD/JPY Price Analysis: Bears are moving in ahead of BoJ
USD/JPY eyes a break below 136.00 as investors digest Fed’s rate hike fears, BoJ policy eyed
About BoJ Rate Decision
BoJ Interest Rate Decision is announced by the Bank of Japan. Generally, if the BoJ is hawkish about the inflationary outlook of the economy and rises the interest rates it is positive, or bullish, for the JPY. Likewise, if the BoJ has a dovish view of the Japanese economy and keeps the ongoing interest rate, or cuts the interest rate it is negative, or bearish.
- USD/CAD seesaws around the top line of a one-month-old bullish channel.
- Clear upside break of the multi-day-old horizontal resistance, upbeat MACD signals favor buyers.
- 100-DMA, ascending trend line from last November act as the key supports.
USD/CAD traces dicey markets as it makes rounds to 1.3825-35 during early Friday.
In doing so, the Loonie pair buyers struggle to cheer the previous day’s upside break of an important horizontal resistance area comprising multiple tops marked since late September 2022. The reason could be linked to the overbought RSI (14), as well as the cautious mood ahead of the key US and Canada employment report for February.
Also read: USD/CAD retreats towards 1.3800 as Oil bears take a breather, US/Canada employment data eyed
That said, the USD/CAD dribbles near the top line of a one-month-old ascending trend channel, close to 1.3860 by the press time, as the bullish MACD signals join the previous day’s clear break of the key upside hurdle surrounding 1.3805-15.
As a result, the bulls are likely to keep the reins and may overcome the immediate 1.3860 hurdle, however, the tops marked during October 14 and 17 of the last year, near 1.3885, as well as the 1.3900 threshold, could challenge the pair’s further upside.
In a case where the USD/CAD price remains firmer past 1.3900, the previous yearly high surrounding 1.3980 and the 1.4000 psychological magnet will be in focus.
On the contrary, bears remain off the table unless the USD/CAD price remains within the stated channel, currently between 1.3650 and 1.3860. It should be observed that the aforementioned horizontal resistance-turned-support near 1.3805-15 and the 1.3800 round figure limits the quote’s immediate downside
Even if the USD/CAD bears manage to conquer the 1.3650 support, the 100-DMA and a four-month-old ascending trend line, respectively near 1.3500 and 1.3280, will be crucial for them to watch.
USD/CAD: Daily chart
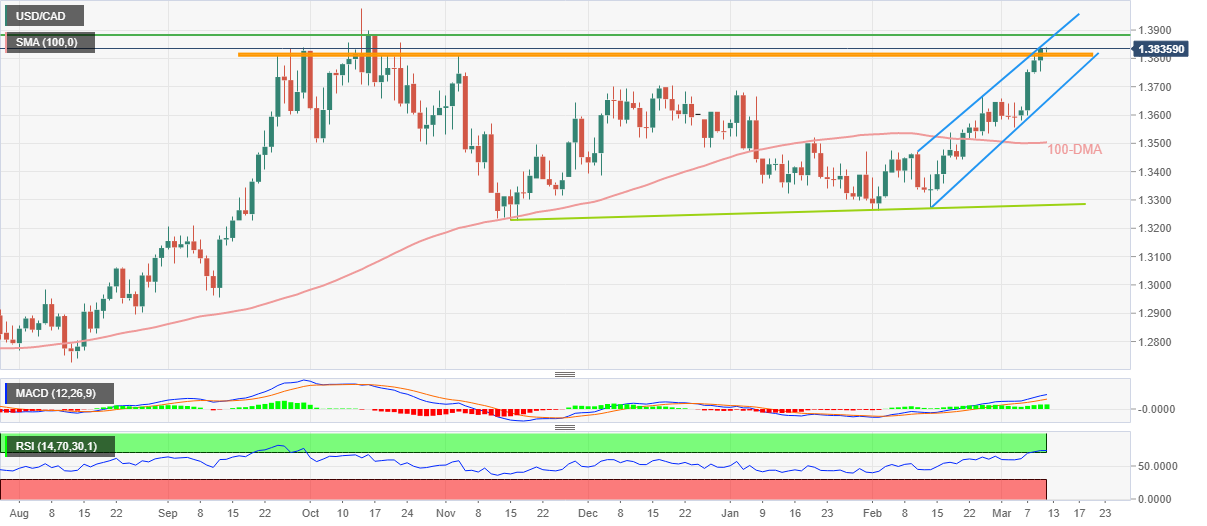
Trend: Limited upside expected
In recent trade today, the People’s Bank of China (PBOC) set the yuan at 6.9655 vs. the previous fix of 6.9666 and the prior close of 6.9630.
About the fix
China maintains strict control of the yuan’s rate on the mainland.
The onshore yuan (CNY) differs from the offshore one (CNH) in trading restrictions, this last one is not as tightly controlled.
Each morning, the People’s Bank of China (PBOC) sets a so-called daily midpoint fix, based on the yuan’s previous day's closing level and quotations taken from the inter-bank dealer.
Japan's upper house has approved the appointment of Kazuo Ueda as next Bank of Japan governor.
Key notes
- Ueda confirmed as next bank of japan governor after approval by both houses of parliament.
- Japan upper house approves appointment of Shinichi Uchida as next BoJ deputy governor.
- Japan upper house approves appointment of Ryozo Himino as next BoJ deputy governor.
- Chief cabinet sec Matsuno: need to discuss joint statement with BoJ with new governor/
- Japanese finmin Suzuki: Expect BoJ to continue appropriate monetary policy
USD/JPY update
USD/JPY is at 135.95, compared with 136.82 as of Thursday's Tokyo stock market close.
Today's policy decision is the last scheduled one for Bank of Japan Gov. Haruhiko Kuroda, whose term is set to expire on April 8.
- GBP/USD is aiming to recapture the immediate resistance of 1.1950 as USD Index has extended losses.
- Investors have started shrugging off volatility associated with aggressive Fed rate hike bets.
- A continuation of the UK’s manufacturing sector contraction might force the BoE to consider a steady monetary policy.
The GBP/USD pair has comfortably shifted its business above 1.1950 in the Asian session. The Cable is looking to stretch its recovery towards 1.1950 amid the absence of sheer anxiety among investors for the United States Nonfarm Payrolls (NFP) release. Also, investors have started shrugging off volatility associated with aggressive Fed rate hike bets. Investors understand the fact that higher inflation could be tamed by restrictive measures from the Fed, therefore, more rates from the Fed are a reality.
S&P500 futures have extended their losses in the Asian session after a nosedive Thursday where investors were discouraged by higher taxes on corporations, billionaires, and rich investors. Higher taxes on corporations will trim their Net Profit margins and investors would get reduced dividends on their investments.
The US Dollar Index (DXY) has dropped below Thursday’s low at 105.13 on hopes that the US labor market is not solid now as considered earlier. An 11% jump in Initial Jobless Claims and four-fold planned lay-offs by US firms are indicating that the US labor market could decelerate ahead. This might compel the Fed to continue its moderate pace for hiking rates further.
However, the release of the US NFP will be of utmost importance to the market. As per the projections, the US economy has recorded a jump in the number of payrolls by 203K in February. The Unemployment Rate is seen unchanged at 3.4%.
On the Pound Sterling front, Manufacturing sector data will be keenly watched. Monthly Manufacturing production (Jan) and Industrial Production are expected to contract by 0.1% and 0.2% respectively.
Investors should be aware of the fact that the performance of the UK manufacturing sector has remained vulnerable in the past few months. This could force the Bank of England (BoE) to pause the policy-tightening process for the time being and allow current monetary policy to show its impact.
- EUR/USD rises for the second consecutive day as markets brace for US NFP.
- Mixed early signals for US employment data, downbeat Treasury bond yields weigh on US Dollar.
- Challenges to sentiment cap the Euro moves in search of hawkish comments from ECB’s Lagarde.
- US jobs data needs to offer positive surprise to recall EUR/USD bears.
EUR/USD picks up bids to extend the mid-week recovery from a two-month low, up 0.16% intraday near 1.0600 during early Friday. In doing so, the Euro pair cheers the broad weakness in the US Dollar ahead of the key US employment report for February, as well as a speech from European Central Bank (ECB) President Christine Lagarde.
The major currency pair snapped a two-day losing streak the previous day as mixed US data joined a retreat in the US Treasury bond yields. Adding strength to the run-up were the hawkish ECB talks and the market’s positioning for today’s key US data. However, inflation fears join the geopolitical tension to challenge the EUR/USD buyers.
That said, US Initial Jobless Claims marked the biggest jump since January by rising to 211K for the week ended on March 03 versus 195K expected and 190K prior. Additionally, the Challenger Job Cuts were down and the Continuing Jobless Claims were up. With this, the early signals for Friday’s Nonfarm Payrolls (NFP) appear mixed and challenge the market’s push for 0.50% Fed rate hike in March, as backed by Federal Reserve Chairman Jerome Powell’s latest signals.
Despite the mixed data, fears of inflation keep favoring the Fed hawks, especially after Chairman Jerome Powell defends the tighter monetary policy, which in turn caps the Euro prices. It should be noted that the latest report from the New York Fed mentioned that recent upward revisions to inflation data coupled with higher-than-expected levels of inflation had changed the picture on what had appeared to be cooling in price pressures.
On the other hand, ECB policymaker Francois Villeroy de Galhau said on Thursday that they will bring inflation back to 2% by end-2024 or end-2025.
Apart from the aforementioned catalysts, the geopolitical fears emanating from US President Joe Biden’s budget proposal for 2024 and the US partnership with the UK and Australia for nuclear submarines should also challenge the EUR/USD buyers.
Against this backdrop, the US 10-year and two-year Treasury bond yields extend the previous day’s losses to 3.88% by the press time and weigh on the US Dollar Index (DXY), down 0.10% to 105.12 at the latest. That said, Wall Street benchmarks closed with more than 1.5% daily losses each, which in turn directed S&P 500 Futures to print mild losses by the press time.
Looking ahead, market forecasts suggest an overall easing in the US employment report for February. The same contrasts with the hawkish Fed bias to highlight the odds of a strong market move in favor of the US Dollar in case of a positive surprise. However, the same requires validation from ECB’s Lagarde.
Also read: Nonfarm Payrolls Preview: Five scenarios for the Fed, USD and stocks reactions, with probabilities
Technical analysis
The 100-DMA joins the steady RSI (14) to challenge EUR/USD bears around 1.0530. The pair’s recovery, however, remains elusive below the one-month-old resistance line, around 1.0665 by the press time.
- USD/JPY bears are in the market and breaking near-term support.
- There are prospects of a move to test 135.50.
USD/JPY is at 135.90, compared with 136.82 as of Thursday's Tokyo stock market close. Today's policy decision is the last scheduled one for Bank of Japan Gov. Haruhiko Kuroda, whose term is set to expire on April 8.
The following offers a bearish bias into the meeting as bears take out the 136 level.
USD/JPY daily charts
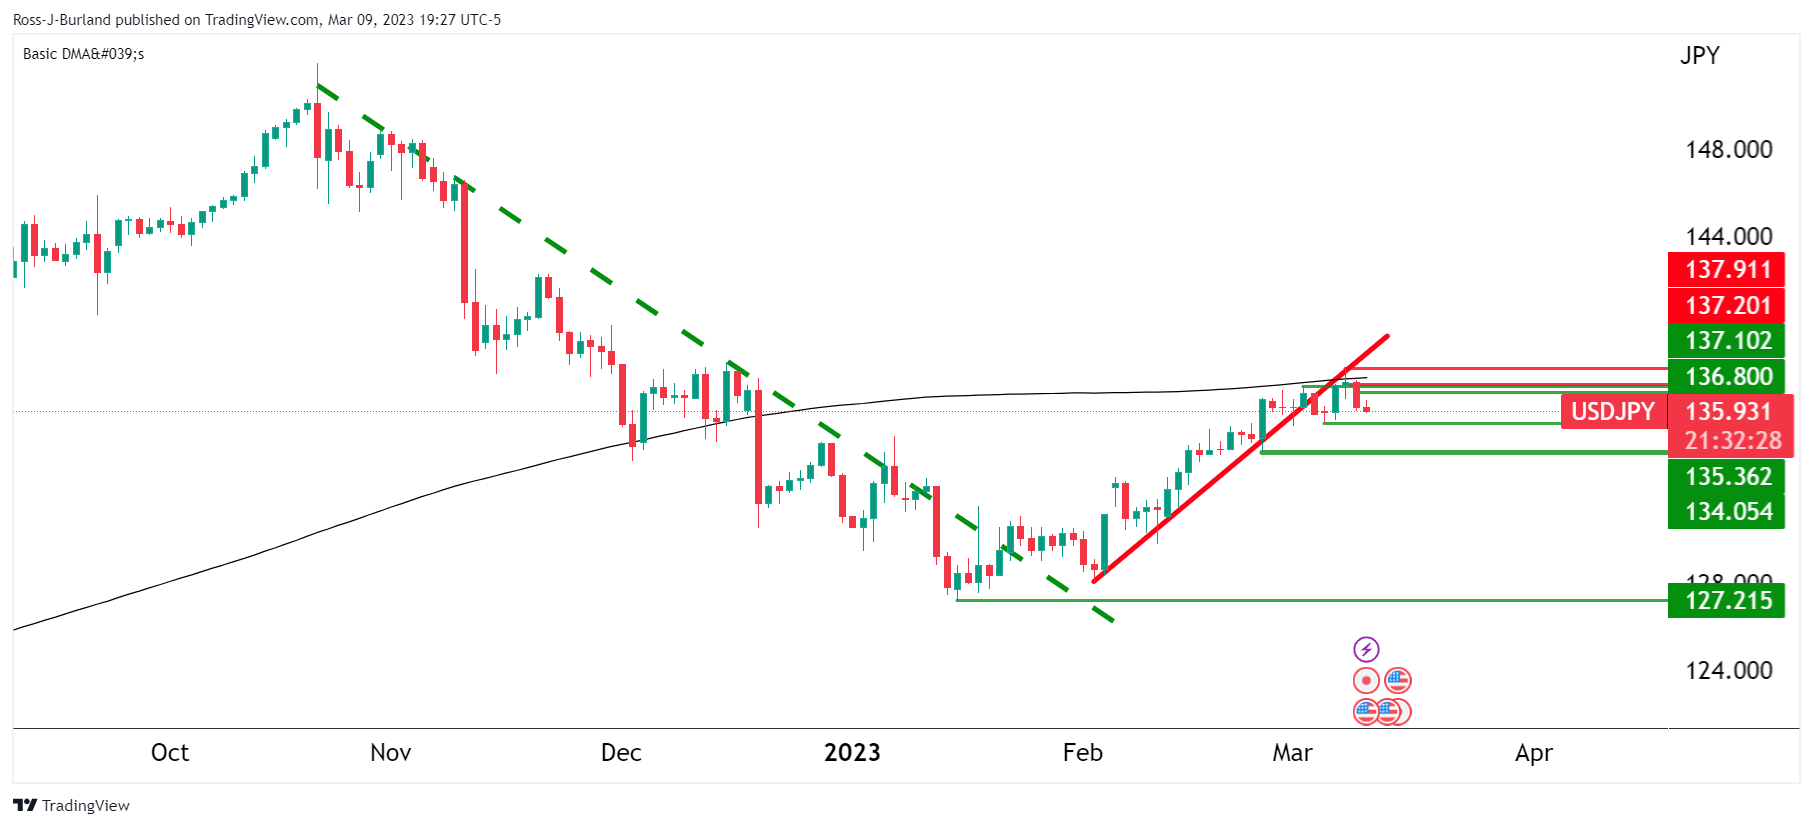
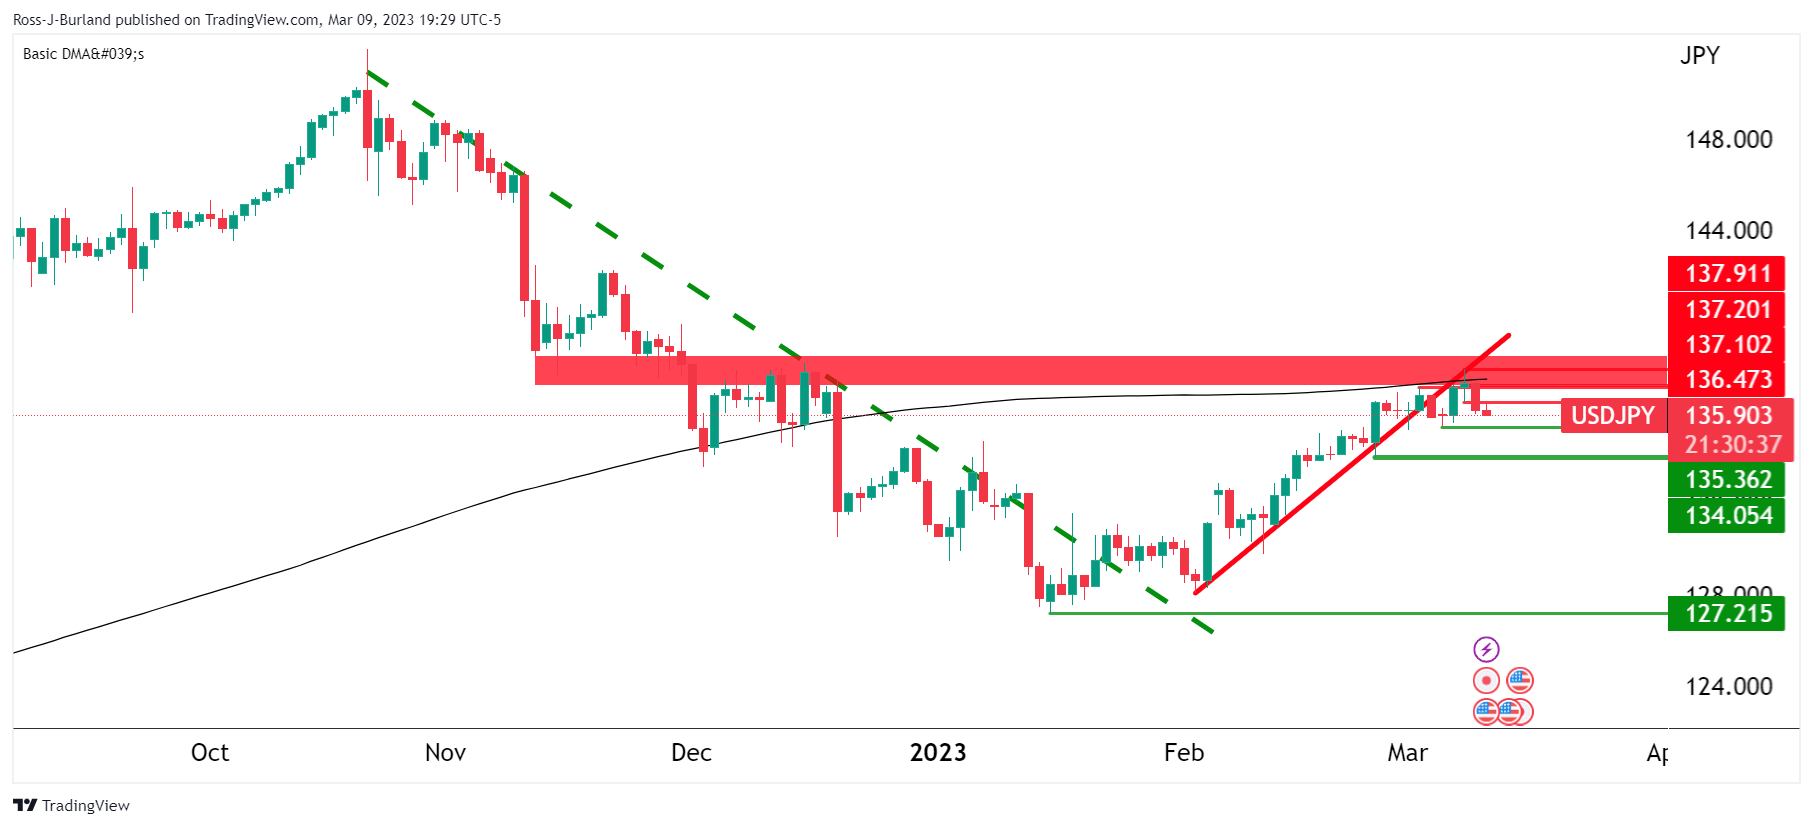
USD/JPY has met the 200 DMA and is being resisted by horizontal resistance in the upper 137s.
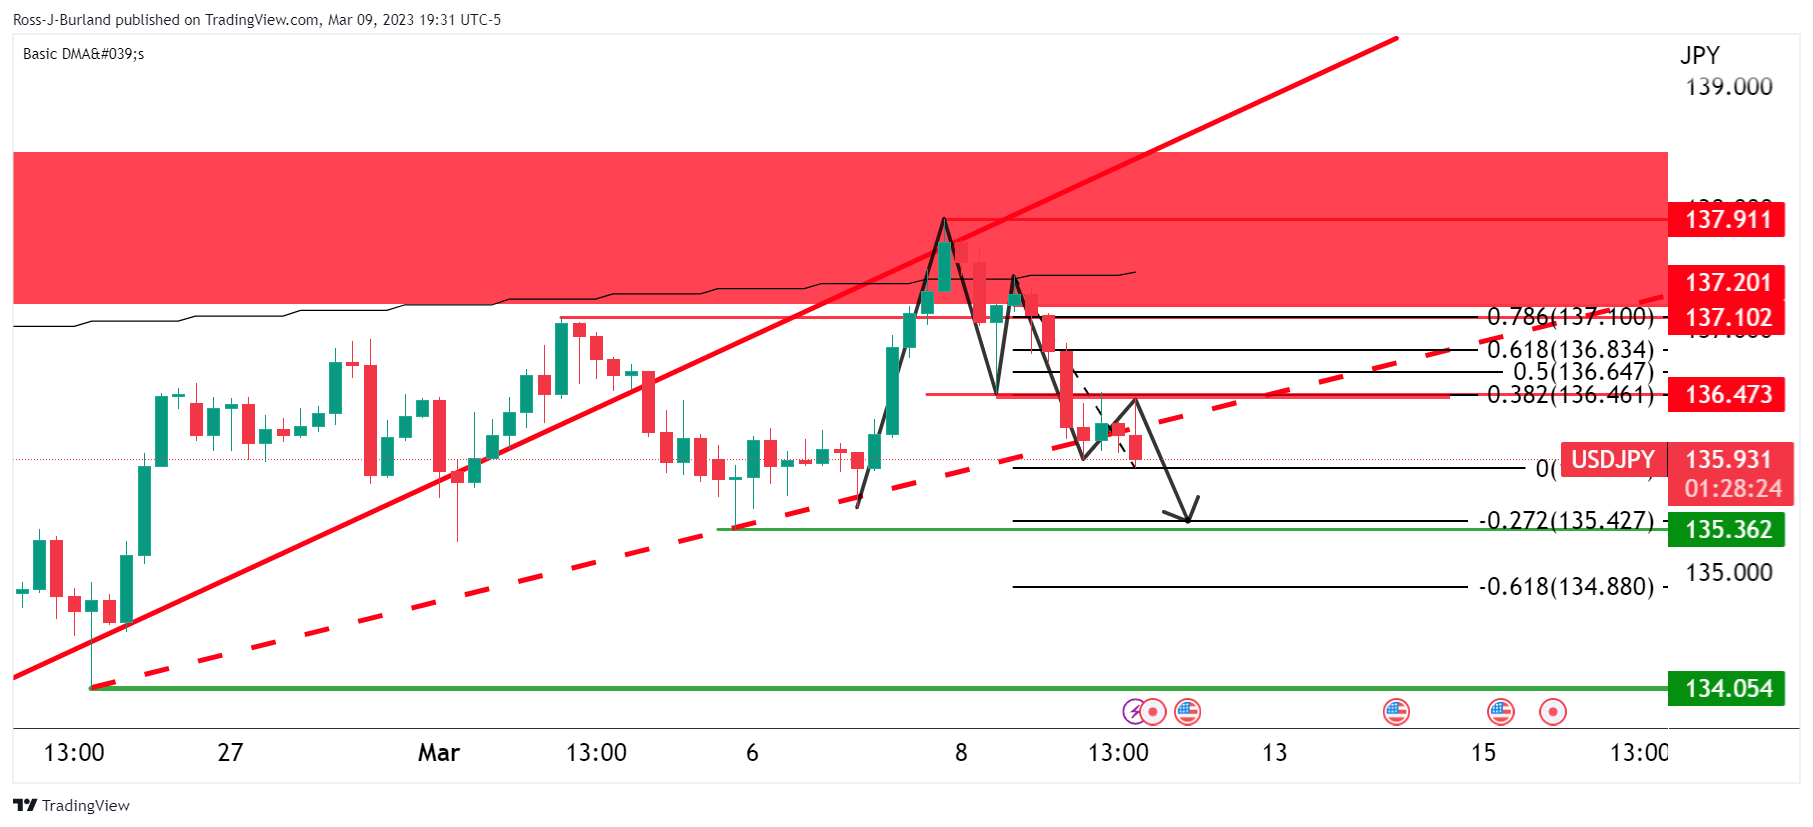
We have seen a correction into the neckline resistance and the bias is technically lower.
USD/JPY H1 chart
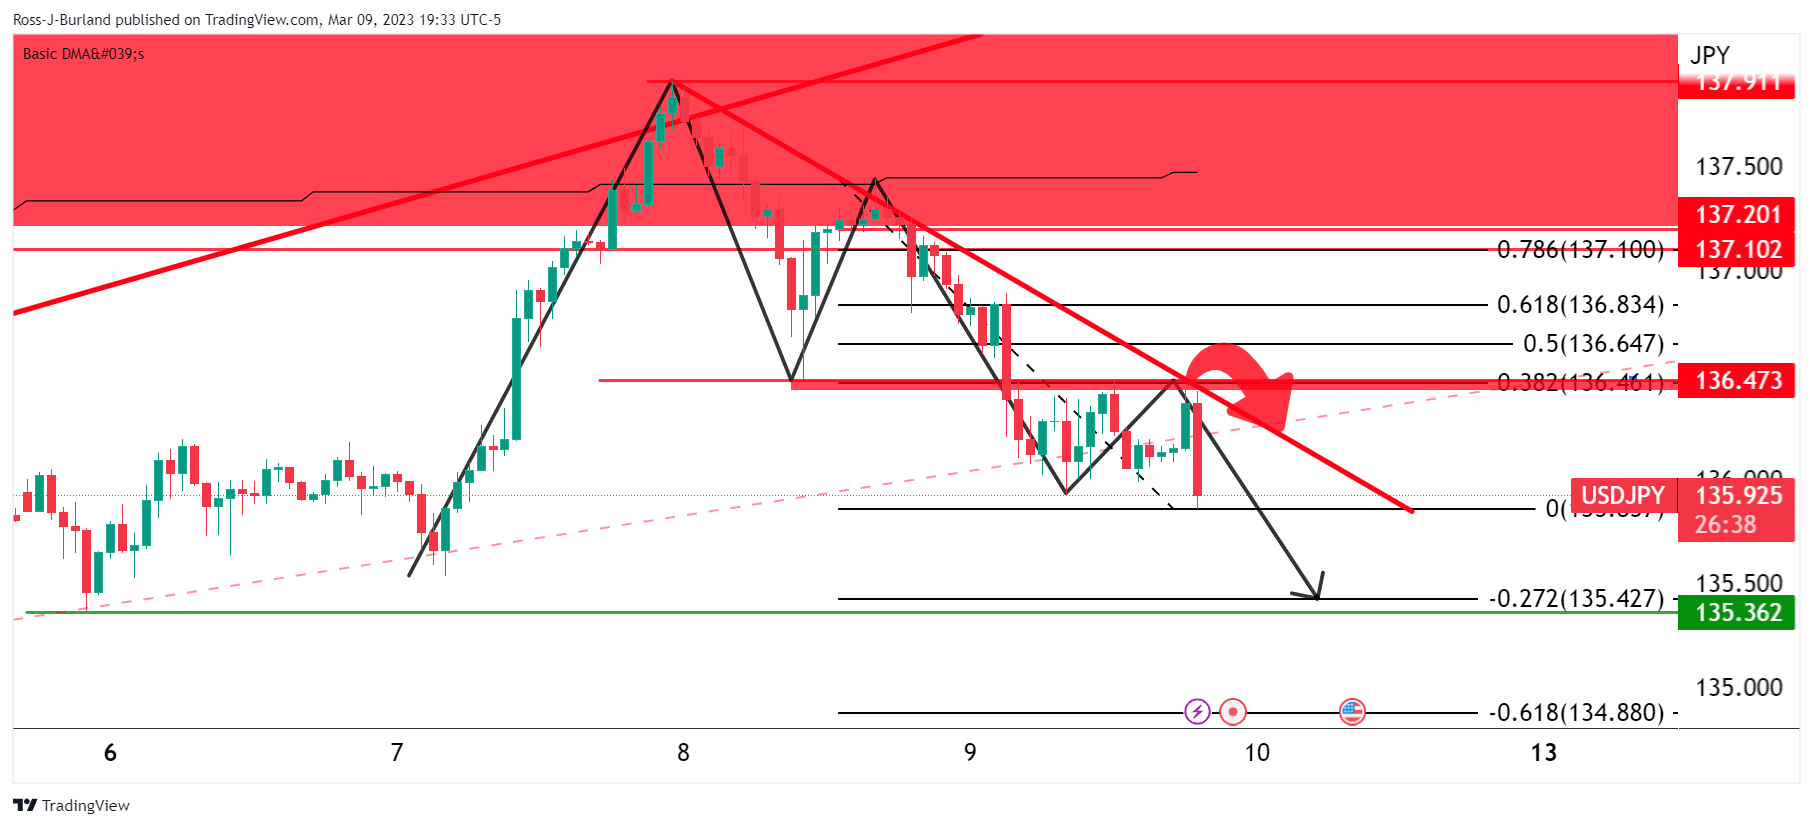
The price is offered with eyes on a test to 135.50 and a touch below while on the front side of the trendline resistance.
- AUD/USD looks vulnerable around 0.6580 as USD Index is building a cushion around 105.20.
- An Inverted Flag formation favors downside bias for the Aussie asset.
- The RSI (14) has slipped into the bearish range of 20.00-40.00, which indicates that the downside momentum has been triggered.
The AUD/USD pair has delivered a less-confident rebound to near 0.6580 in the Asian session. The Aussie asset is navigating in a territory of 0.6580-0.6636 for the past two trading sessions. Investors should brace for sheer volatility as the release of the United States Nonfarm Payrolls (NFP) data will provide clear guidance.
The US Dollar Index (DXY) is building a cushion around 105.20 after a tad longer gradual correction. The release of the US NFP will trigger action moves as it will guide whether the Federal Reserve (Fed) will continue its moderate pace in hiking interest rates or will return to an aggressive rate hike approach.
Meanwhile, the Australian Dollar is expected to remain on tenterhooks as the Reserve Bank of Australia (RBA) has favored pausing policy-tightening ahead despite a one-time decline in the monthly Consumer Price Index (CPI).
AUD/USD is hovering near the edge of the Inverted Flag chart pattern formed on an hourly scale. An Inverted Flag is a trend-following pattern that displays a long consolidation that is followed by a breakdown. Usually, the consolidation phase of the chart pattern serves as an inventory adjustment in which those participants initiate shorts, which prefer to enter an auction after the establishment of a bearish bias.
The 20-period Exponential Moving Average (EMA) at 0.6600 is acting as a major barricade for the Australian Dollar.
Meanwhile, the Relative Strength Index (RSI) (14) has slipped into the bearish range of 20.00-40.00, which indicates that the downside momentum has been triggered.
Going forward, a breakdown of Wednesday’s low at 0.6568 will drag the asset toward the horizontal support plotted from October 4 high at 0.6547 followed by the round-level support at 0.6500.
In an alternate scenario, a break above Wednesday’s high at 0.6629 will push the Aussie asset toward December 22 low at 0.6650. A break above the same might expose the major to February 27 low near 0.6700.
AUD/USD hourly chart
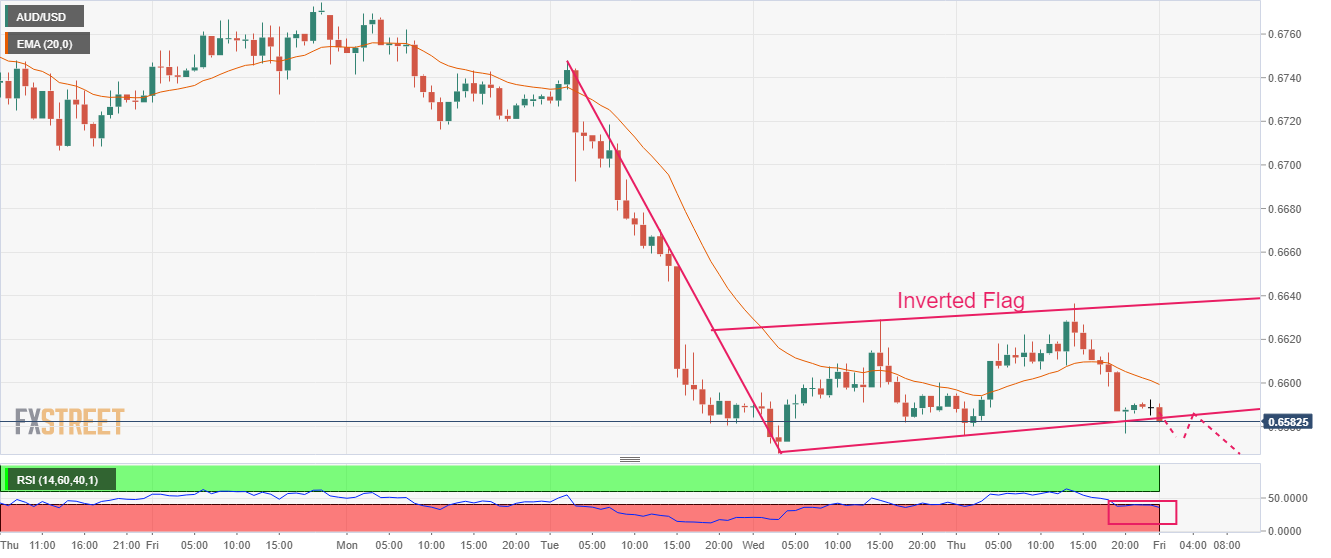
| Index | Change, points | Closed | Change, % |
|---|---|---|---|
| NIKKEI 225 | 178.96 | 28623.15 | 0.63 |
| Hang Seng | -125.51 | 19925.74 | -0.63 |
| KOSPI | -12.82 | 2419.09 | -0.53 |
| ASX 200 | 3.3 | 7311.1 | 0.05 |
| FTSE 100 | -49.92 | 7879.98 | -0.63 |
| DAX | 1.34 | 15633.21 | 0.01 |
| CAC 40 | -8.88 | 7315.88 | -0.12 |
| Dow Jones | -543.54 | 32254.86 | -1.66 |
| S&P 500 | -73.69 | 3918.32 | -1.85 |
| NASDAQ Composite | -237.65 | 11338.35 | -2.05 |
- AUD/JPY struggles to defend the corrective bounce off seven-week low.
- Ascending support lines from early January 2022 challenge bears amid nearly oversold RSI (14).
- Buyers need validation from two-month-old previous support line.
AUD/JPY licks its wounds around 89.70 during Friday’s Asian session as the cross-currency pair traders await the Bank of Japan (BoJ) Monetary Policy Meeting announcements, after refreshing a seven-week low the previous day.
Also read: Bank of Japan Preview: Kuroda’s and ultra-loose policy farewell
In doing so, the pair consolidates the previous day’s corrective bounce off an upward-sloping support line from late January 2022, around 89.50, amid bearish MACD signals. However, the nearly oversold RSI (14) challenges the AUD/JPY sellers from refreshing the multi-day bottom.
If at all the quote breaks the 89.50 support, the ascending support line connecting lows of late January 2022 and lows marked during the last December could act as the last defense of the AUD/JPY buyers, around 88.70.
Alternatively, recovery moves remain elusive unless the pair trades below the previous support line from early January 2023, close to 90.40 at the latest. That said, the 90.00 round figure restricts the immediate upside of the pair.
Should the AUD/JPY price remains firmer past 90.40, the late February lows near 91.30 may probe the buyers before directing them to the all-important 200-DMA hurdle, close to 93.10 at the latest, that holds the key for the pair’s further upside.
Overall, AUD/JPY remains bullish unless the pair breaks the multi-month-old support line near 88.70.
AUD/JPY: Daily chart
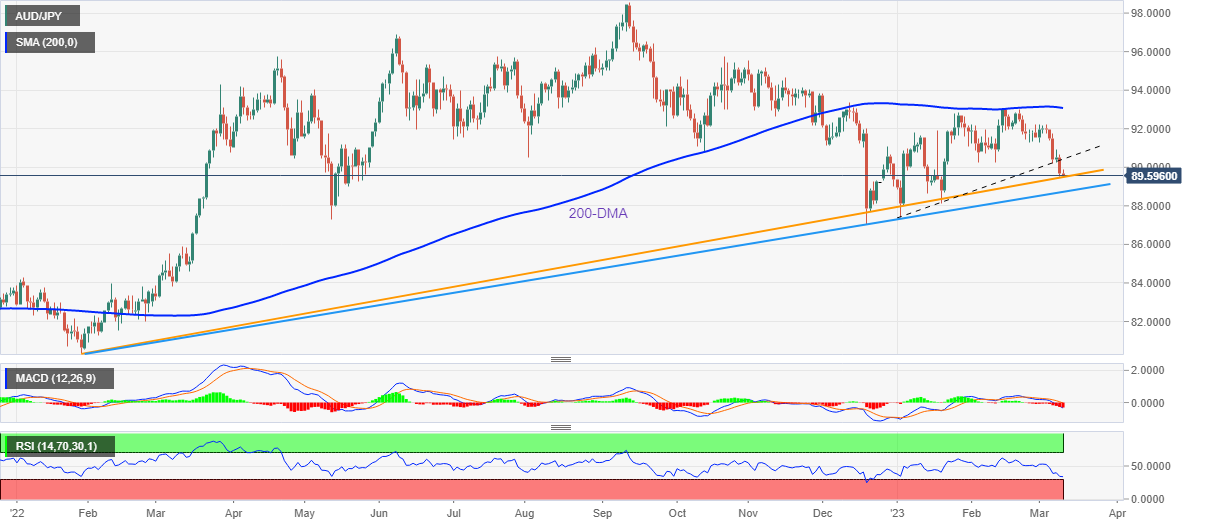
Trend: Limited downside expected
| Pare | Closed | Change, % |
|---|---|---|
| AUDUSD | 0.65899 | -0 |
| EURJPY | 144.036 | -0.53 |
| EURUSD | 1.05817 | 0.36 |
| GBPJPY | 162.279 | -0.16 |
| GBPUSD | 1.1922 | 0.71 |
| NZDUSD | 0.61004 | -0.09 |
| USDCAD | 1.38282 | 0.21 |
| USDCHF | 0.93237 | -0.82 |
| USDJPY | 136.119 | -0.88 |
Reuters reported that Japanese Finance Minister Shunichi Suzuki said on Friday he expected the central bank to guide policy appropriately in close coordination with the government, taking economy, prices and financial conditions into account.
"Our joint efforts have produced major results, creating a situation where the economy is no longer in deflation," Suzuki told reporters.
Key notes
- Monetary policy specifics up to BoJ to decide.
- Expects BoJ to guide policy appropriately taking economy into account.
- Govt will strive to achieve primary balance target in fiscal year 2025.
USD/JPY update
Unmoved by the comments, USD/JPY is at 136.31, compared with 136.82 as of Thursday's Tokyo stock market close.
Today's policy decision is the last scheduled one for Bank of Japan Gov. Haruhiko Kuroda, whose term is set to expire on April 8.
- EUR/JPY picks up bids to pare the previous day’s loses, stays pressured on the weekly basis.
- Hawkish ECB concerns, downbeat Japan data propel prices ahead of the key BoJ.
- BoJ is likely to keep monetary policy unchanged but the end of Kuroda-era teases doves for the one last shot.
EUR/JPY renews its intraday high near 144.40 as Tokyo opens for the key Friday. In doing so, the cross-currency pair reverses the previous day’s losses while picking up bids from a two-week low amid a cautious mood ahead of the Bank of Japan (BoJ) Monetary Policy announcements.
Apart from the pre-BoJ anxiety, a contraction between the monetary policy bias surrounding the BoJ and the European Central Bank (ECB) also weigh on the EUR/JPY price.
That said, ECB policymaker Francois Villeroy de Galhau said on Thursday that they will bring inflation back to 2% by end-2024 or end-2025. On the other hand, expectations surrounding the BoJ event suggest no change in the monetary policy that supports the benchmark interest rates to be held at -0.1% while the Yield Curve Control (YCC) will maintain the current cap of 0.5%.
Also read: Bank of Japan Preview: Kuroda’s and ultra-loose policy farewell
It should be noted that the downbeat prints of Japan’s Producer Price Index (PPI) for February, -0.4% MoM versus -0.3% market forecasts and 0.0% prior, also weigh on the EUR/JPY prices.
Amid these plays, the US 10-year and two-year Treasury bond yields eased to 3.92% and 4.87% versus 5.08% and 4.01% daily open respectively on Thursday. With this, the 10-year coupons marked the biggest daily loss in a week while the two-year counterpart flashed the heaviest fall in two months. As a result, Wall Street benchmarks closed with more than 1.5% daily losses each, with S&P 500 Futures printing mild losses by the press time.
Given the downbeat yields and risk-off mood, the EUR/JPY price may witness hardships in extending the latest recovery. The same highlights the need for the BoJ Governor Haruhiko Kuroda to flash hawkish signs at the end of his dovish career. Additionally, ECB President Chritistine Lagare is also up for a speech and should defend the latest hawkish calls to keep the buyers hopeful.
Technical analysis
Although the 21-DMA restricts the immediate downside of the EUR/JPY pair to around 143.75, the latest rebound appears elusive until the quote stays below the previous support line from early February, near 144.75 by the press time.
- Oil price is expected to continue its downside journey to $75.00 amid a weak global economic outlook.
- A failure of the Chinese administration in spurting domestic demand despite reopening measures has dampened optimism.
- A better-than-projected US NFP might propel the risk of aggressive rate hikes by the Fed.
West Texas Intermediate (WTI), futures on NYMEX, have slipped below $75.50 in the Asian session. The oil price has resumed its downside journey as the optimism among market participants regarding China’s economic recovery after the rollback of lockdown curbs is fading dramatically.
On Thursday, the release of the weak China’s Consumer Price Index (CPI) and Producer Price Index (PPI) figures cleared that the administration is failing to spurt the domestic demand as promised while dismantling the pandemic controls.
The monthly CPI figure was contracted by 0.5% while the street was anticipating a decline to 0.2% from the former release of 0.8%. The price of goods and services in China has accelerated by 1% annually, lower than the consensus of 1.9% and the prior release of 2.1%.
Apart from that, the annual Producer Price Index (PPI) contracted by 1.4% vs. the consensus of 1.3% contraction and 0.8% contraction in the prior release. This indicates that producers have lowered the prices of goods and services at factory gates to offset weak demand. An absence of recovery in domestic demand indicates a loss of consumers’ confidence in the Chinese administration.
After sensing a weak economic outlook from the world’s second-largest economy, economic prospects from the world’s giant United States also look discouraging. A bigger rate hike from the Federal Reserve (Fed) is widely anticipated as US inflation is expected to flex its muscles amid an upbeat labor market. Going forward, the release of the US Nonfarm Payrolls (NFP) data will provide more clarity.
In spite of signs of a weak global economic outlook, the oil price has not shown a sheer sell-off as the US Dollar Index (DXY) has dropped gradually to 105.25. Investors could pump significant funds into the USD index if the US NFP releases better than the consensus.


© 2000-2026. Sva prava zaštićena.
Sajt je vlasništvo kompanije Teletrade D.J. LLC 2351 LLC 2022 (Euro House, Richmond Hill Road, Kingstown, VC0100, St. Vincent and the Grenadines).
Svi podaci koji se nalaze na sajtu ne predstavljaju osnovu za donošenje investicionih odluka, već su informativnog karaktera.
The company does not serve or provide services to customers who are residents of the US, Canada, Iran, The Democratic People's Republic of Korea, Yemen and FATF blacklisted countries.
Izvršenje trgovinskih operacija sa finansijskim instrumentima upotrebom marginalne trgovine pruža velike mogućnosti i omogućava investitorima ostvarivanje visokih prihoda. Međutim, takav vid trgovine povezan je sa potencijalno visokim nivoom rizika od gubitka sredstava. Проведение торговых операций на финанcовых рынках c маржинальными финанcовыми инcтрументами открывает широкие возможноcти, и позволяет инвеcторам, готовым пойти на риcк, получать выcокую прибыль, но при этом неcет в cебе потенциально выcокий уровень риcка получения убытков. Iz tog razloga je pre započinjanja trgovine potrebno odlučiti o izboru odgovarajuće investicione strategije, uzimajući u obzir raspoložive resurse.
Upotreba informacija: U slučaju potpunog ili delimičnog preuzimanja i daljeg korišćenja materijala koji se nalazi na sajtu, potrebno je navesti link odgovarajuće stranice na sajtu kompanije TeleTrade-a kao izvora informacija. Upotreba materijala na internetu mora biti praćena hiper linkom do web stranice teletrade.org. Automatski uvoz materijala i informacija sa stranice je zabranjen.
Ako imate bilo kakvih pitanja, obratite nam se pr@teletrade.global.
транcфери