- Gold price eases from five-week high to pare the biggest daily gains in four months.
- United States Treasury bond yields lick their wounds ahead of US inflation data and probe XAU/USD bulls.
- SVB fallout weigh on Federal Reserve bets as interest rate futures suggest nearness to policy pivot.
- US CPI may offer immediate directions but risk catalysts, yields are crucial for clear view.
Gold price (XAU/USD) fades the previous day’s upside momentum, the strongest in four months, as it makes rounds to the five-week high surrounding $1,910 with eyes on the United States Consumer Price Index (CPI). In doing so, the XAU/USD snaps a three-day winning streak as the US Treasury bond yields seesaw after a notable slump.
Gold price struggles as United States Treasury bond yields dribble
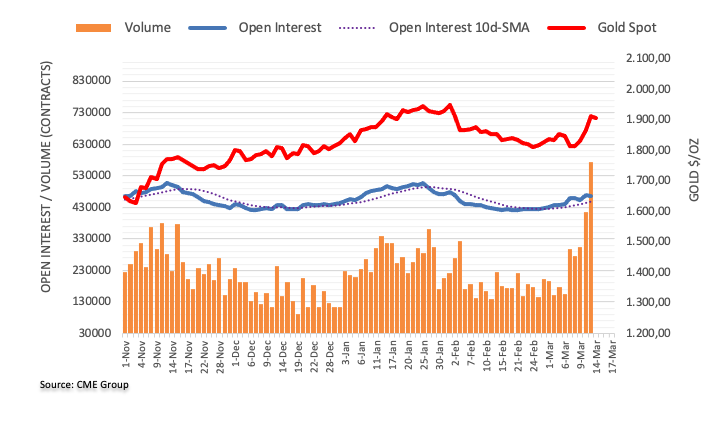
Gold price managed to post the biggest daily jump since November 2022 as the United States Treasury bond yields nosedived the previous day, mostly inactive of late. That said, the US two-year Treasury bond yields marked the biggest daily slump since October 1987 by declining more than 13.0% on a day as US banking regulators rushed to defend the Silicon Valley Bank (SVB) and the Signature Bank. Further, the US 10-year Treasury bond yields also plummeted to the monthly low amid a sudden shift in the market’s Fed bets due to the financial market risks emanating from the stated banks.
It should be noted that the US 10-year Treasury bond yields seesaw around 3.56%, after bouncing off the bottom of 3.418%, whereas the two-year counterpart bounces off the lowest levels since September 2022 to print mild gains around 4.05% by the press time.
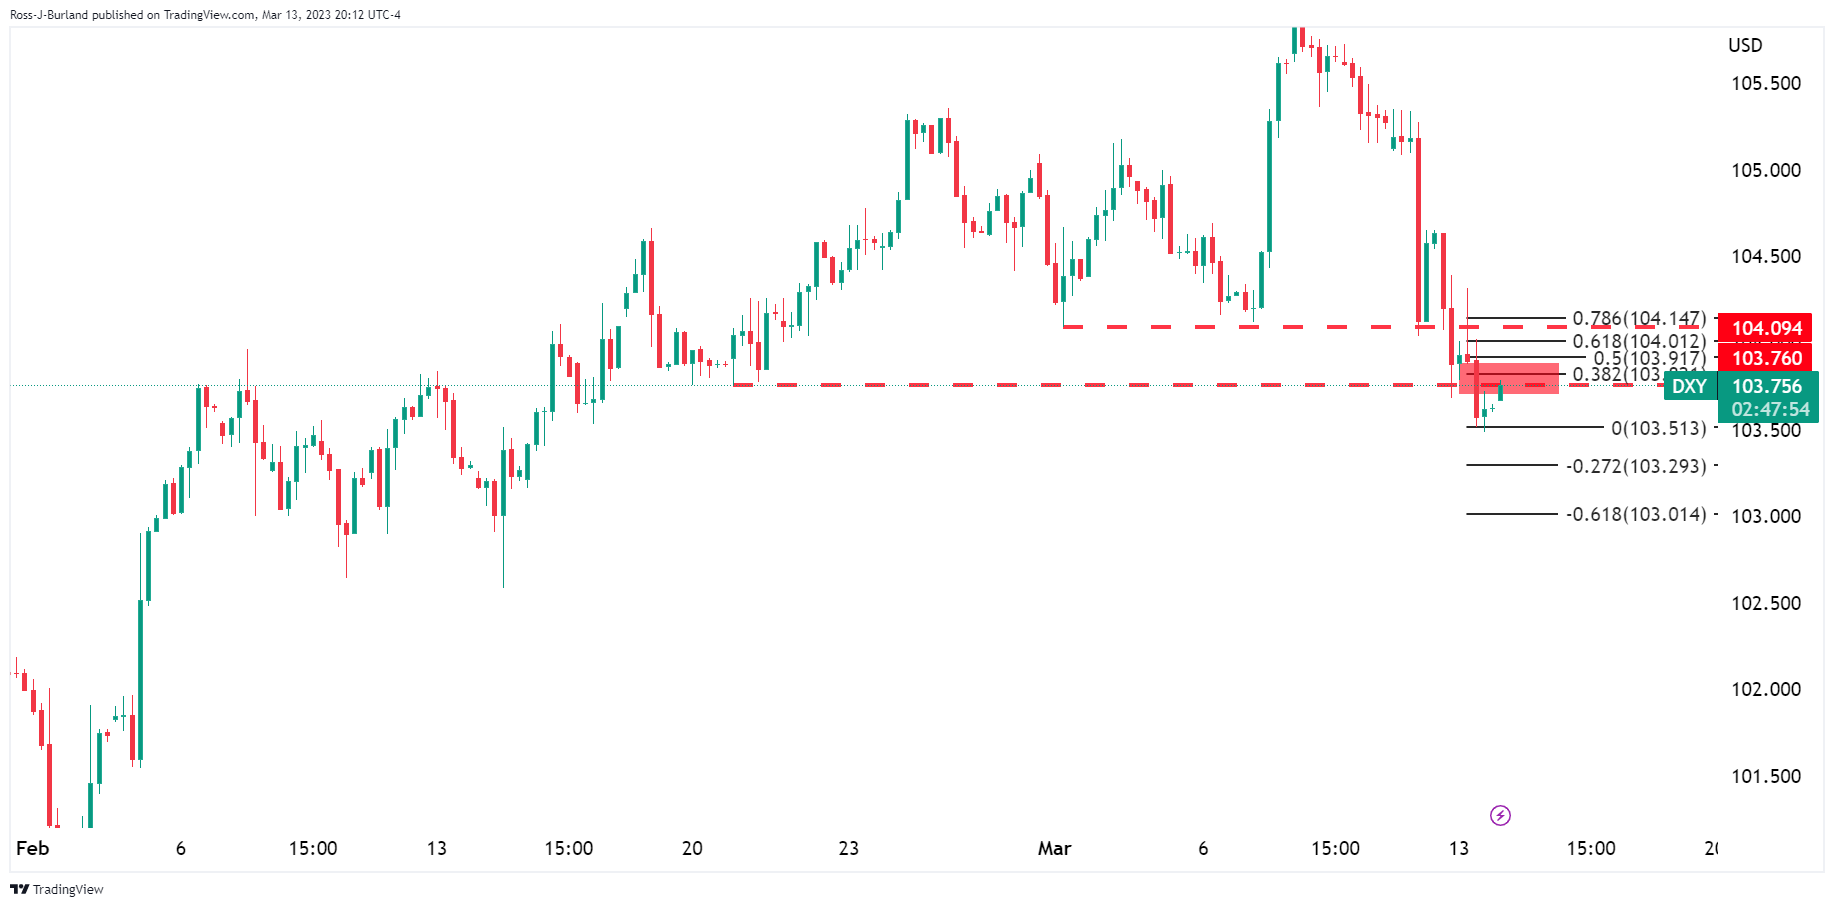
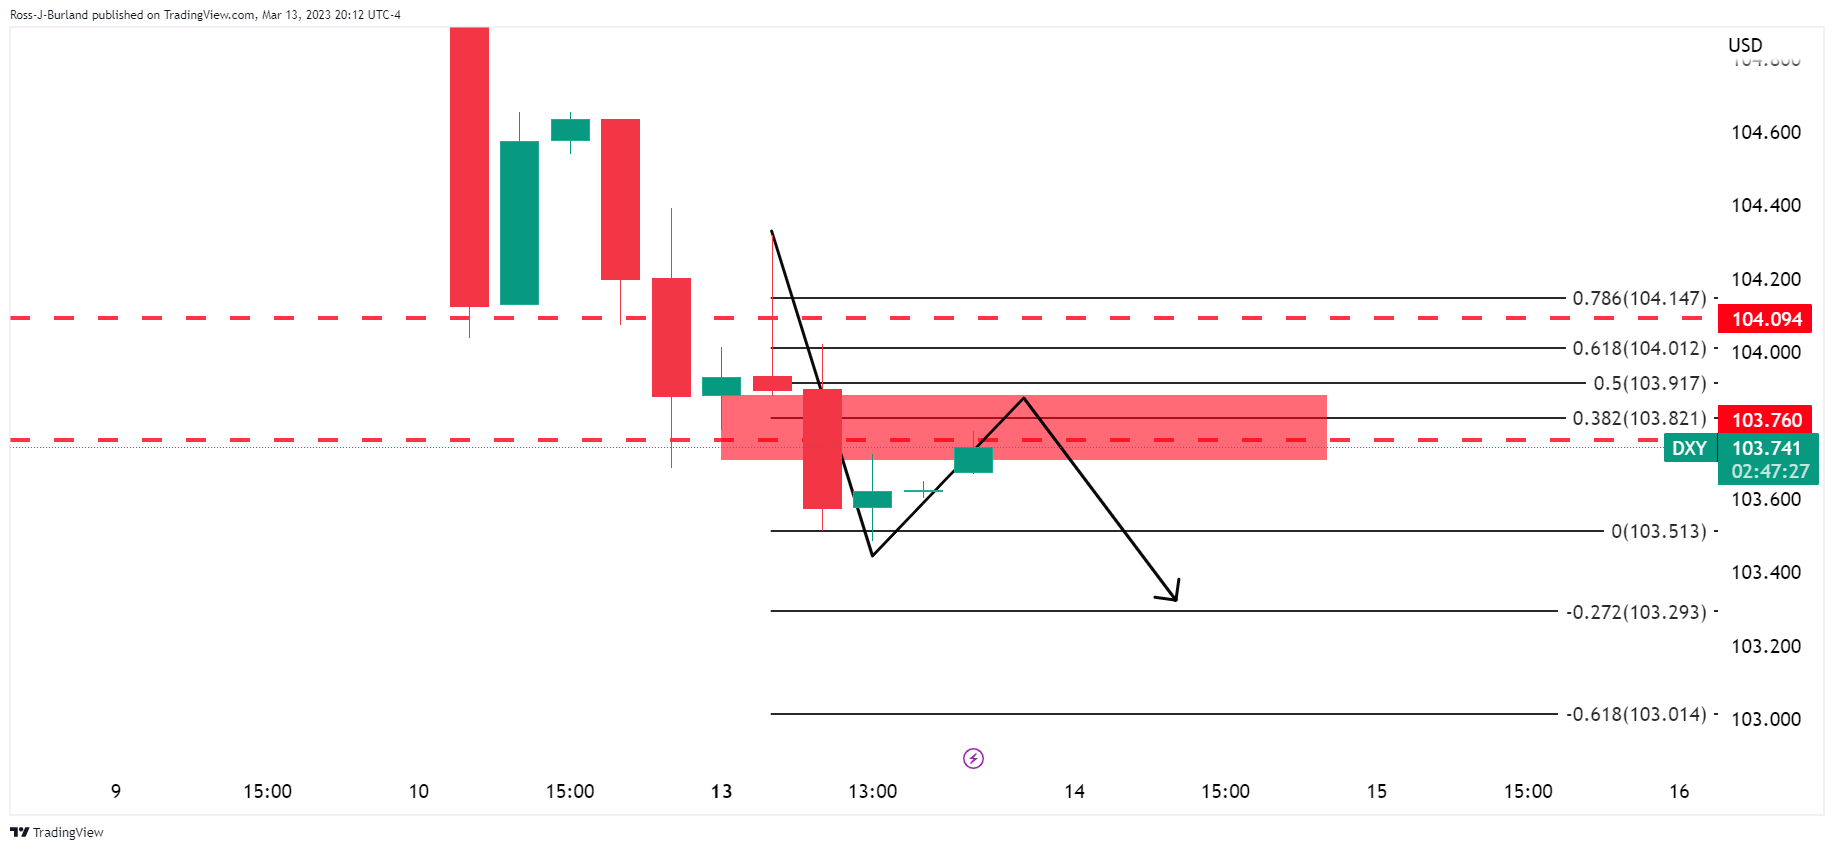
With this, the yield curve inversion shrinks a bit and allows the US Dollar Index (DXY) to lick its wound. That said, the US Dollar Index (DXY) began the week’s trading on a back foot by printing a three-day south-run while declining the most in two months on Monday, mildly bid near 103.68 at the latest.
Federal Reserve bets lure XAU/USD buyers
Although the latest pause in the US Treasury bond yields’ south-run test the Gold price, recent data on the Interest Rate Futures suggests that the Federal Reserve’s hawkish bias run out of steam, which in turn keeps the XAU/USD bulls hopeful. That said, the US Fed Fund Futures have priced in a 69% chance of a 25-bps hike at next week's Fed policy meeting, with a more than 30% probability of a pause. The market last week was poised for a 50-bps increase prior to the SVB collapse, reported Reuters. On the same line could be CME mentioned, “Traders see 33% chance Fed holds rates this month, market pricing shows rate cuts expected as early as June.”
US CPI, risk catalysts in focus
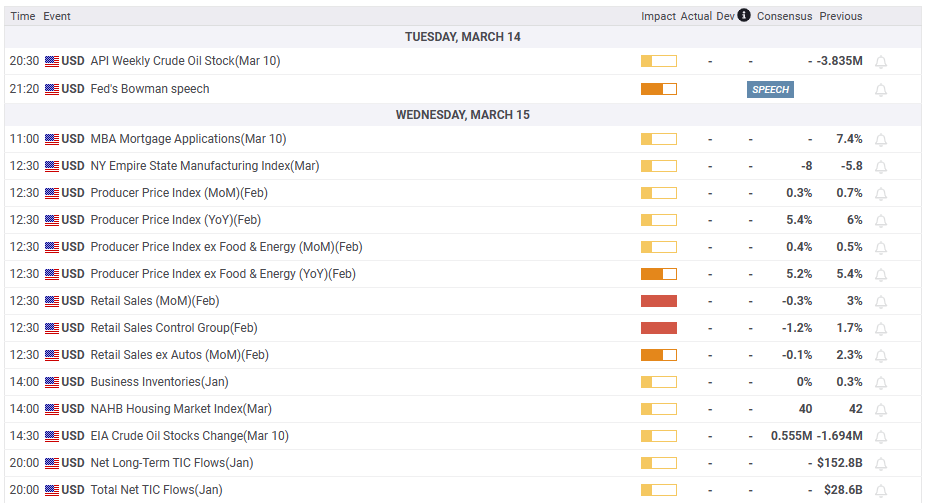
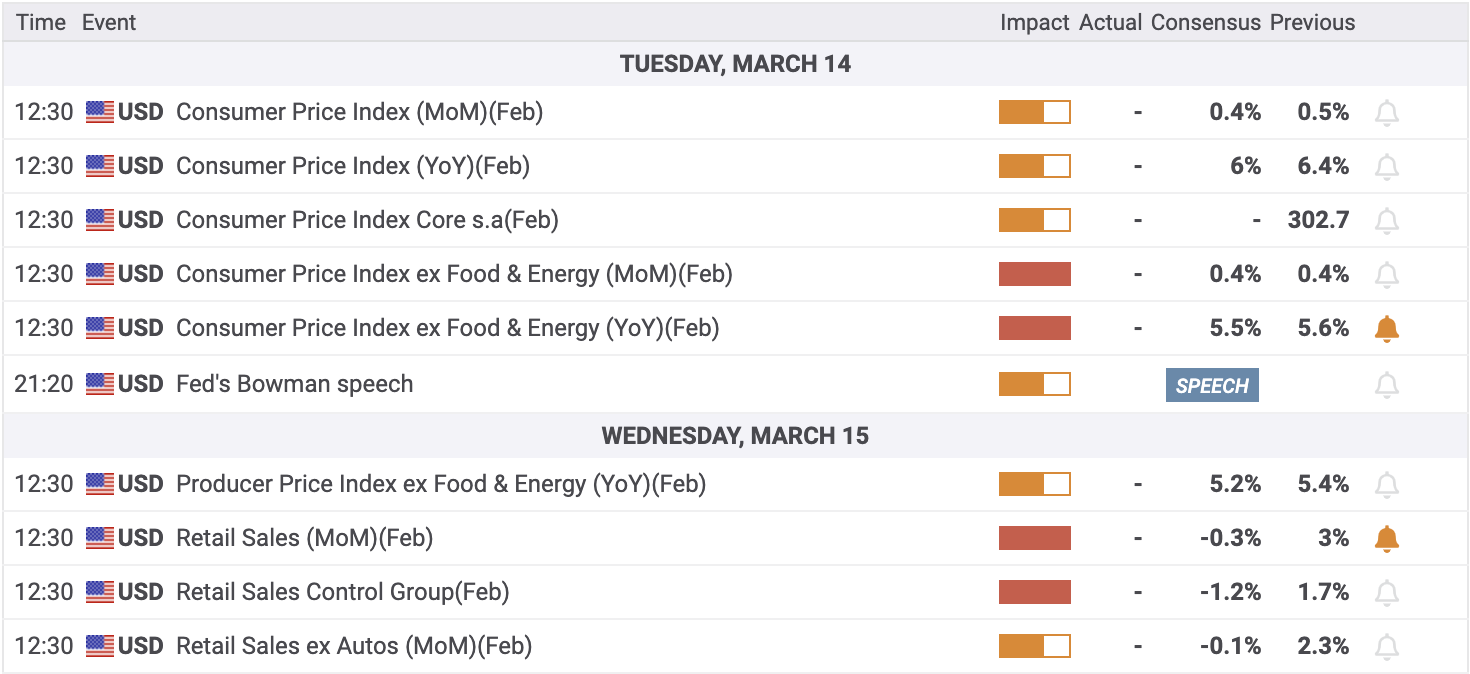
Moving on, the pre-data anxiety may restrict immediate XAU/USD moves and can allow the bullion to pare some of the latest gains. However, hopes of the US inflation data providing any major market move are lesser considering the latest fallouts of the US banks and the trader’s attention on the yields. It should be noted, however, Forecasts suggest the US CPI is likely to ease to 6.0% YoY versus 6.4% prior while CPI ex Food & Energy may slide to 5.5% YoY from 5.6% prior.
Also read: US Inflation Preview: Five scenarios for trading the Core CPI whipsaw within the SVB storm
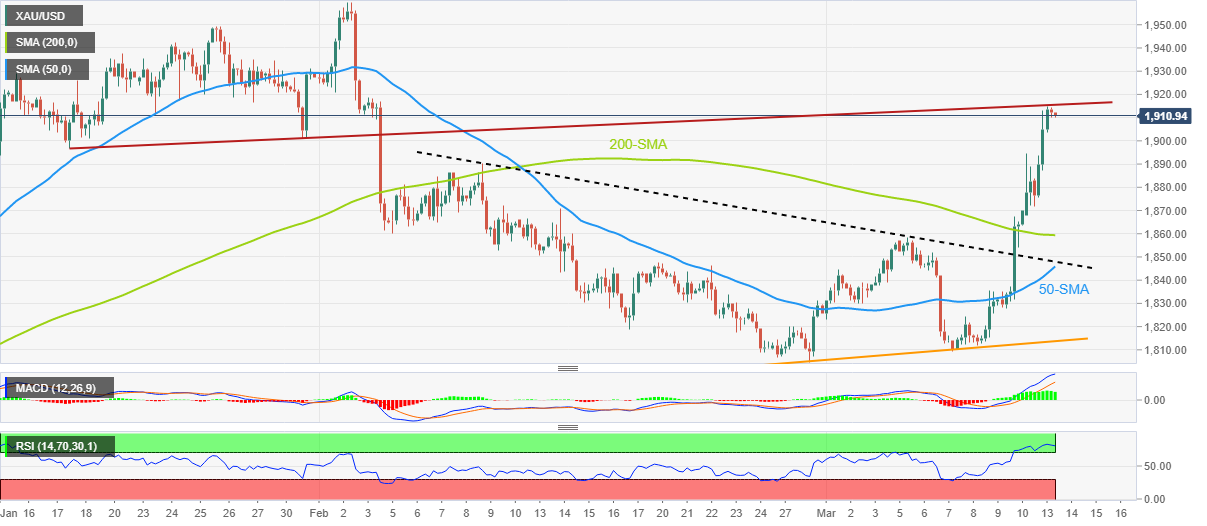
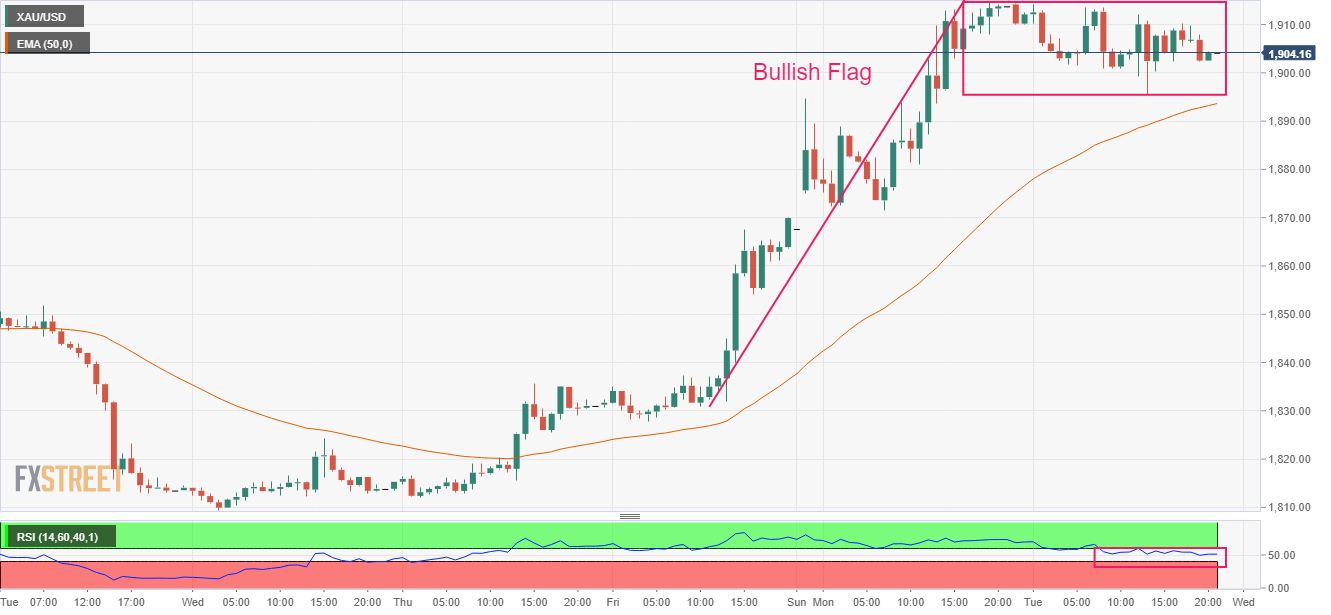
Gold price technical analysis
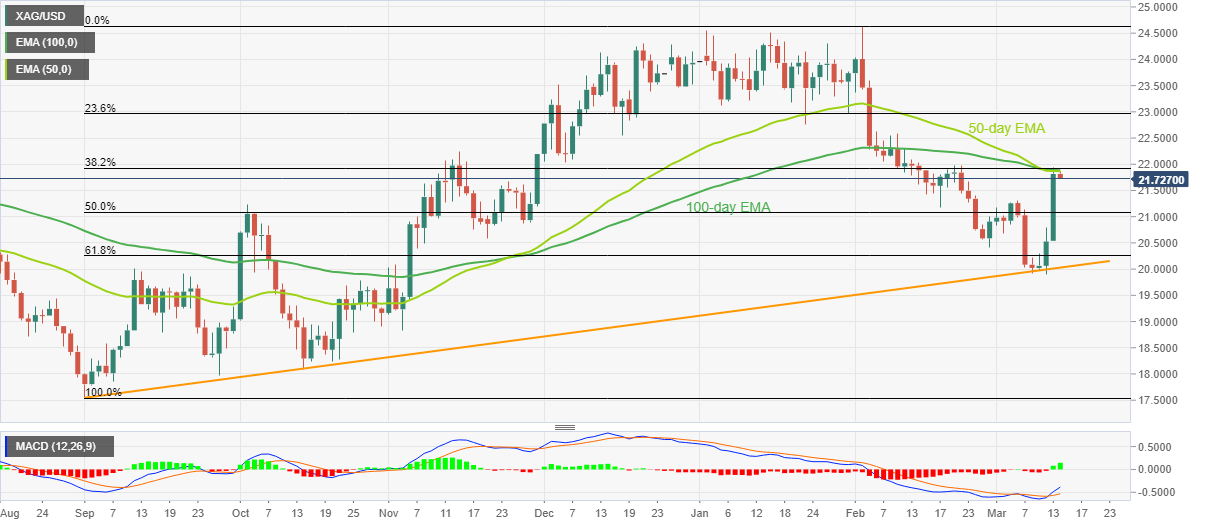
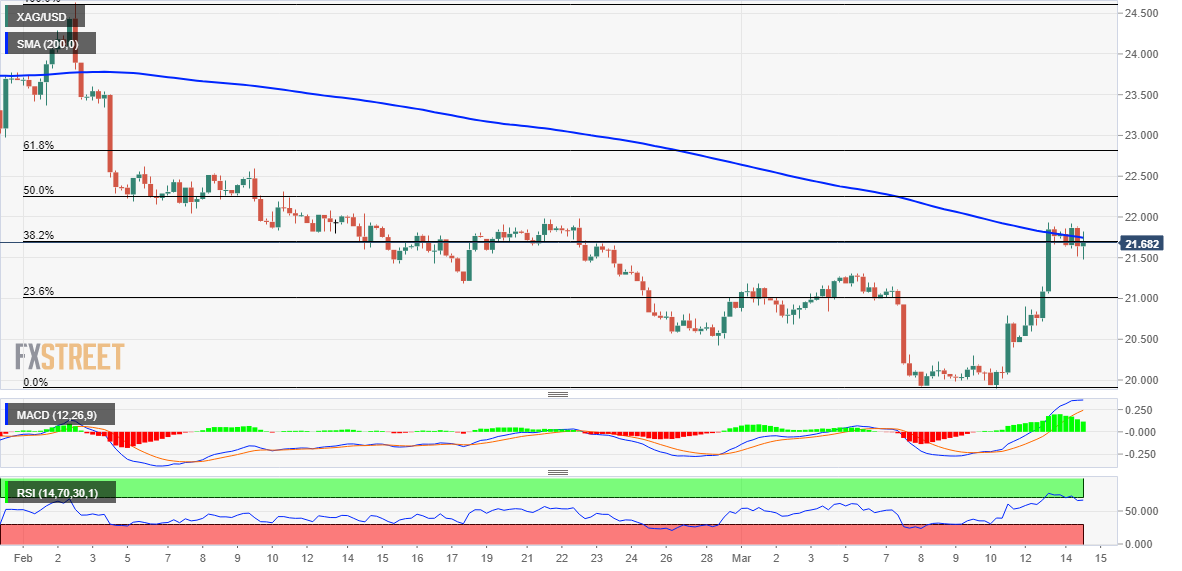
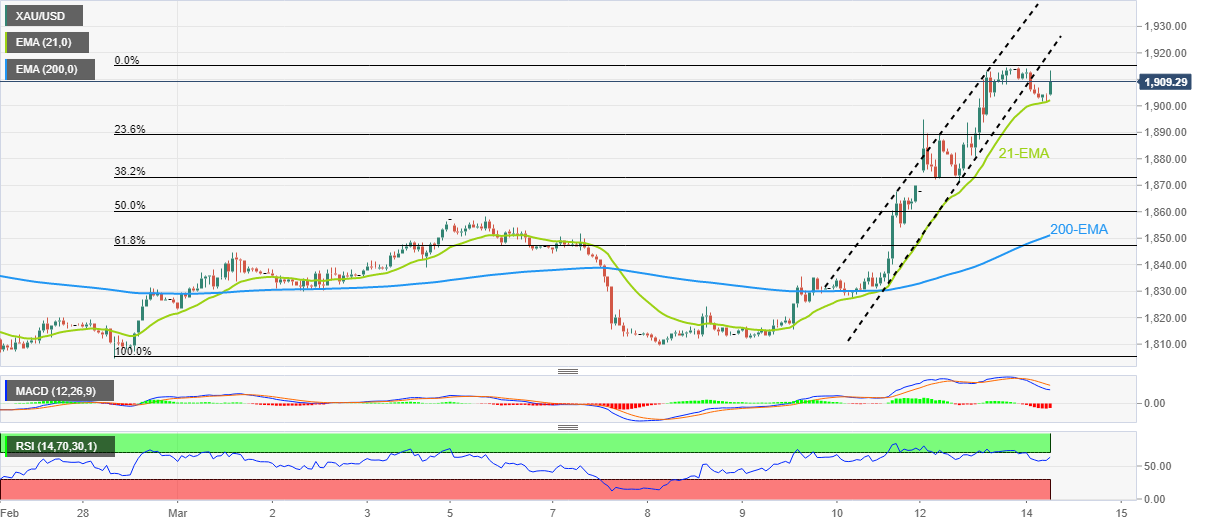
A clear upside break of a downward-sloping trend line from early February allowed the Gold price to extend the run-up towards crossing the 200-bar Simple Moving Average (SMA).
The XAU/USD run-up also took clues from the bullish signals from the Moving Average Convergence and Divergence (MACD) indicator. However, the overbought conditions of the Relative Strength Index (RSI) line, placed at 14, triggered the quote’s pullback from the support-turned-resistance line from January 17, close to $1,915.
Even so, the XAU/USD pullback remains elusive unless dropping back below the 200-SMA level of near $1,860.
That said, a one-month-old previous resistance line, close to $1,847, precedes the 50-SMA of around $1,840 and an upward-sloping trend line from late February, near $1,812, to act as the final defenses of the Gold buyers.
Overall, Gold price occupies a notable space on the bull’s radar as markets brace for the key United States inflation data.
On the flip side, the Gold price upside past the $1,915 immediate hurdle increases the odds of witnessing an extended rise toward January’s peak surrounding $1,960.
Overall, Gold price occupies a notable space on the bull’s radar as markets brace for the key United States inflation data.
Gold price: Four-hour chart
Trend: Further upside expected
-638144319800622259.png)
-638143668962029012.png)
-638143550852683804.png)