- Analiza
- Novosti i instrumenti
- Vesti sa tržišta
Forex-novosti i prognoze od 27-01-2022
- WTI grinds higher around seven-year peak during four-day uptrend.
- US President Biden calls UN Security Council meeting to discuss risk of the Russian invasion to Ukraine.
- US dollar rallied after Fed emphasized inflation concerns to hint at rate hikes.
- US PCE Inflation figures are important, risk catalysts are the key.
WTI crude oil bulls take a breather around $86.90 during Friday’s Asian session, after refreshing the seven-year high the previous day. In doing so, the oil benchmark awaits clear direction amid a mixed play of catalysts and an absence of major data/events.
The black gold rallied to the highest levels since late 2014 the previous day before easing from $88.00. The pullback moves, however, were recently reversed from $85.73.
That said, looming fears of Russia’s invasion of Ukraine contrasts with the US Federal Reserve’s (Fed) hawkish message to entertain the oil traders. However, given the higher emphasis on the immediate geopolitical fears and receding negative concerns over the coronavirus seem to have underpinned the commodity’s latest advances.
“Russia, the world's second-largest oil producer, and the West have been at loggerheads over Ukraine, fanning fears that energy supplies to Europe could be disrupted, although concerns are focused on gas supplies rather than crude,” said Reuters. On the same line were US President Joe Biden’s comments during the CNN interview, citing the escalating risks of Russia's invasion of Ukraine and looking to additional macroeconomic assistance for Kyiv.
Also helping the WTI crude oil could be likely preparations for the next week’s meeting of the Organization of the Petroleum Exporting Countries (OPEC) and allies led by Russia, a group known as OPEC+. Ahead of the meeting, Reuters learns from several sources that OPEC+ is likely to stick with a planned rise in its oil output target for March.
Elsewhere, the US Dollar Index (DXY) rallied to the highest levels last seen during July 2020 as the Federal Reserve (Fed) indirectly confirmed the March rate hike and cited room for more lift-offs.
Talking about the data, Advance Q4 US GDP rose 6.9% annualized versus 5.5% market consensus and 2.3% prior. On the same line was the US Initial Jobless Claims for the week ended in January 21that came in 206K compared to 260K expected and 290K previous. It should be noted, however, that the US Durable Goods Orders for December dropped by -0.9% for December, below -0.5% market consensus.
Against this backdrop, equities reversed initial gains and closed with losses while the US 10-year Treasury yields ended Thursday’s North American trading session with four basis points (bps) of a downside to 1.80%.
Moving on, to the US Core PCE Price Index figures for December, expected 4.8% YoY versus 4.7% prior, will be important for oil traders to watch. However, major attention will be given to the geopolitical concerns as Russia is the world’s second-largest crude producer.
Read: US PCE Inflation Preview: Dollar rally has more legs to run
Technical analysis
A clear upside break of the two-month-old ascending trend line, near $88.20 by the press time, becomes necessary for the WTI bulls to keep reins. In absence of this, a pullback towards a six-week-long support line around $84.30 can’t be ruled out considering the overbought RSI conditions.
- USD/CAD pauses two-day uptrend near the highest levels in three weeks.
- Bullish MACD signals, sustained break of 200-SMA keep buyers hopeful.
- Weekly ascending trend line acts as the key short-term support.
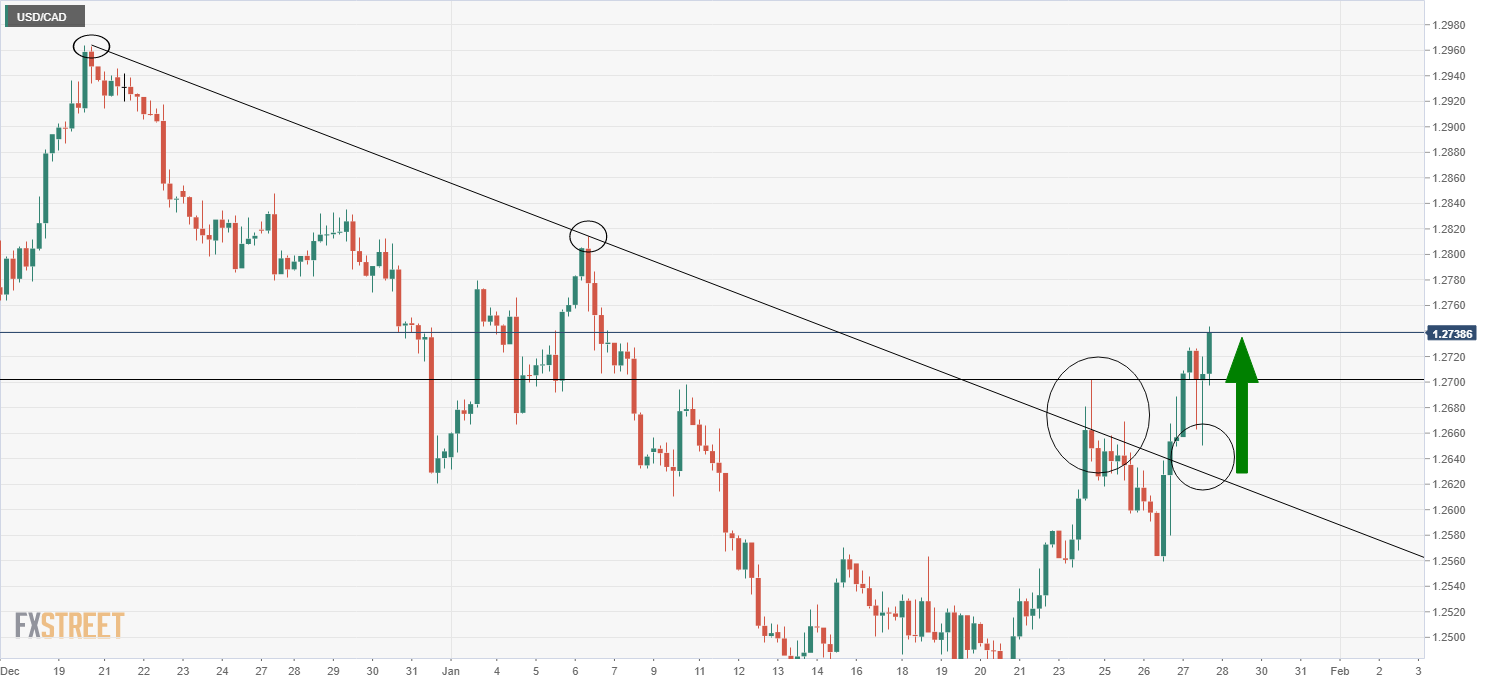
USD/CAD retreats from a three-week high to 1.2736 during a quiet Asian session on Friday. In doing so, the Loonie pair drops for the first time in three days while stepping back from a one-month-old descending resistance line.
Even so, the quote’s successful trading above the 1.2695-2710 support zone, comprising 200-SMA and 50% Fibonacci retracement (Fibo.) of December-January declines, keeps USD/CAD buyers hopeful amid bullish MACD signals.
It’s worth noting that 61.8% Fibo. level near 1.2770 acts as an additional upside hurdle, should the quote manage to cross the immediate trend line barrier around 1.2750.
In a case where USD/CAD manages to stay firmer past 1.2770, the monthly high of 1.2813 and the late December tops close to 1.2850 will test the further advances before directing the quote towards the last month’s peak of 1.2964.
On the flip side, short-term sellers will gain momentum on the break of 1.2695. However, an ascending support line from January 20, near 1.2595, will challenge the USD/CAD sellers afterward.
If at all the USD/CAD bears conquer the 1.2595 support, the 23.6% Fibonacci retracement level of 1.2571 may offer an intermediate halt during the anticipated fall towards the monthly low of 1.2450.
USD/CAD: Four-hour chart
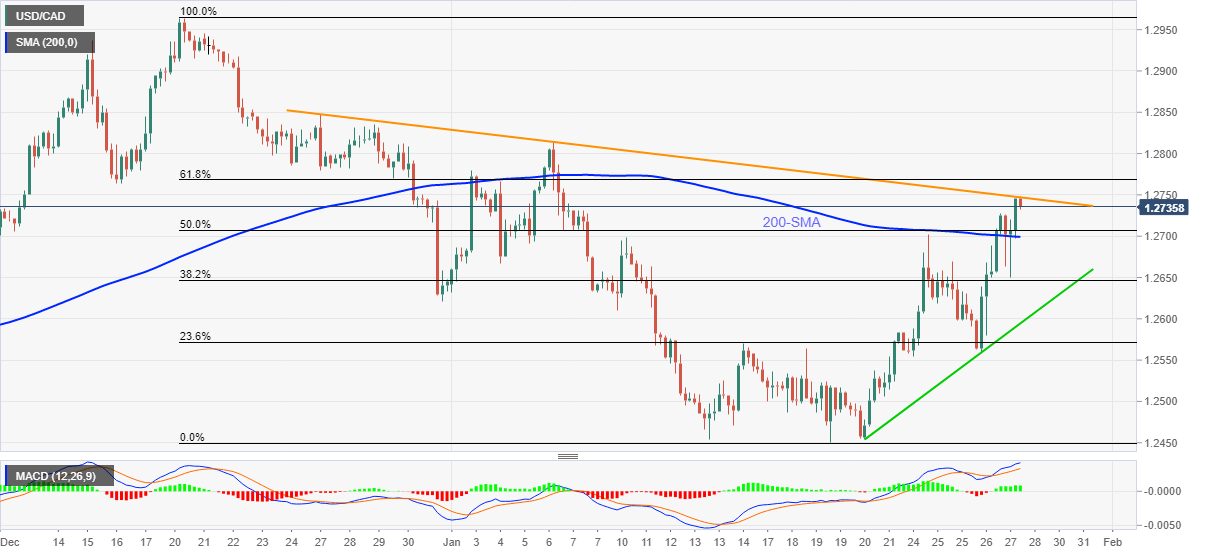
Trend: Further upside expected
With the Fed’s hint of March rate-hike, global markets keep their eyes on the upcoming key inflation gauge for the US Federal Reserve (Fed), namely US Core Personal Consumption Expenditure Price Index, for fresh impulse.
Early signal for the same, namely the US inflation expectations, as measured by the 10-year breakeven inflation rate per the St. Louis Federal Reserve (FRED) data, recovered from the weekly low of 2.38% to 2.40% by the end of Thursday’s North American trading session.
It’s worth noting that the inflation gauge dropped to the lowest level last seen during last September during the previous week before bouncing off 2.33%.
That said, the US Core PCE Price Index figure for December is expected to rise to 4.8% YoY from 4.7% previous reading during today’s US session. The same is likely to bolster the Fed’s hawkish view and can help the US dollar to extend the latest run-up.
Read: US PCE Inflation Preview: Dollar rally has more legs to run
US President Joe Biden and his Ukrainian counterpart Volodymyr Oleksandrovych Zelenskyy talked about Russia on Thursday, per CNN. The news stated that Biden told Zelenskyy that a Russian invasion is now highly certain.
US President Biden also said that the US is looking into additional macroeconomic assistance for Ukraine.
Elsewhere, Biden pushes for a United Nations (UN) Security Council meeting on Monday to discuss the Russia-Ukraine issues. The US leader also reiterated his warning to Russia if it invades Ukraine.
FX implications
The news weighs on the riskier assets while keeping WTI crude oil prices afloat, around $86.80 at the latest.
Read: AUD/USD bears eye sub-0.7000 zone on strong USD ahead of US PCE Inflation
- On Thursday, the NZD/USD plunged to levels not seen since November 2, 2020.
- Risk-aversion in the financial market spurred demand for safe-havens like the USD, weighed on the NZD.
- US Stocks finished in the red, led by the S&P, the less damaged was the Dow Jones Industrial.
- The NZD/USD is downward biased, and a break below 0.6500-11 might send the pair tumbling to 0.6478.
The New Zealand dollar extends its free fall for the sixth consecutive day against the US dollar, plunging close to 300-pips from 0.6850 down under the 0.6600 figure. As the New York session winds down and the Asian session begins, the NZD/USD is trading at 0.6583 at the time of writing.
Risk aversion hurts the prospects of risk-sensitive peers like the NZD
The market sentiment is downbeat. Factors like the hawkish Federal Reserve, which said that might raise interest rates “soon,” in the monetary policy statement, did not have an impact. However, when US central bank Chair Jerome Powell said at the presser that “the committee is of a mind to raise the federal funds rate at the March meeting assuming that the conditions are appropriate for doing so,” those were the words that caused volatility in the market.
Cash stock indices in the US ended with losses. The S&P 500 fell in the session 1.4%, finished at 4326.51, while technology stocks, reflected by the Nasdaq Composite, fell for the second straight day 0.54%, down to 13,352.78, while the less damaged Dow Jones, was almost flat a 0.02% loss, finishing at 34,169.78.
Sector-wise, the leading gainers were energy, utilities, and consumer staple, up some 1.24%, 0.78%, and 0.58% each. Contrarily, the hardest hit by the sell-off were consumer discretionary, real estate, and industrials, falling 2.27%, 1.75%, and 0.93%, respectively.
In the meantime, the US Dollar Index finished up 1.272%, sitting at 97.220, while the 10-year US T-bond yield ended at 1.803%, down five basis points.
A light Asian economic docket, referring to New Zealand data, featured the ANZ NZ consumer confidence, which came at 98, in line with the previous reading. Meanwhile, Japan’s Consumer Price Index (CPI) and Australia Producer Price Index (PPI) will be featured at 23:00 and 23:30 GMT, respectively.
NZD/USD Price Forecast: Technical outlook
The NZD/USD broke a downslope trendline of a descending channel (probably a bullish flag). The result of that emphasized the pair as downward biased, exposing September 24, 2020, a daily low at 0.6511. The closeness of the aforementioned price level to the 0.6500 figure would make the 0.6500-11 region the NZD/USD first support. A breach of it would open the door for further losses. The following demand zone would be August 20, 2020, 0.6487, followed by June 20, 2020, cycle low at 0.6478.
- AUD/USD braces for the biggest weekly fall since August, recently stabilizing near two-month low.
- Markets tried to digest hawkish Fed signals, yields eased but couldn’t help equities, gold.
- US Q4 Advance GDP, Jobless Claims came in stronger to fuel USD, Durable Goods Orders couldn’t harm the buck
- Aussie PPI, risk catalysts to entertain traders with eyes on US Core PCE Inflation.
AUD/USD stays on the way to post the biggest weekly loss in five months, taking rounds to 0.7030-35 during early Friday morning in Asia.
The Aussie pair dropped to December 2021 bottom following the heaviest daily fall in a month the previous day as the US dollar cheered the hawkish Fed verdict. The upside momentum gained support from a slump in gold prices while ignoring mixed equities and a pullback in the US Treasury yields.
Global traders matched expectations of favoring the US dollar against almost everything after the Federal Reserve (Fed) indirectly confirmed the March rate hike and cited room for more lift-offs.
The hawkish expectations gained support from the Advance Q4 US GDP, up 6.9% annualized versus 5.5% market consensus and 2.3% prior. On the same line was the US Initial Jobless Claims for the week ended in January 21that came in 206K compared to 260K expected and 290K previous. It should be noted, however, that the US Durable Goods Orders for December dropped by -0.9% for December, below -0.5% market consensus.
Elsewhere, China's slowest industrial profit growth in nine months and softer Westpac Leading Index for Australia also weighed on the AUD/USD prices. On the same line were softer-than-previous readings of the Aussie Export Price Index and Import Price Index for Q4.
Other than the data and Fed, escalating geopolitical fears concerning the Russia-Ukraine issue also drown the risk barometer AUD/USD prices. Recently, US President Joe Biden told Ukrainian President Volodymyr Oleksandrovych Zelenskyy that a Russian invasion is now highly certain, per CNN. Also backing the risk-off mood was news from China’s Evergrande as the struggled real-estate firm said it is targeting a restructuring proposal within six months.
Amid these plays, equities reversed initial gains and closed with losses while the US 10-year Treasury yields ended Thursday’s North American trading session with four basis points (bps) of a downside to 1.80%. Further, gold prices slumped over 1.0% to below $1,800 whereas the US Dollar Index (DXY) rose to the highest levels last seen during July 2020.
Looking forward, Australia’s Q4 Producer Price Index, expected 0.3% QoQ versus 1.1% prior, will decorate the calendar in Asia but major attention will be given to the US Core PCE Price Index figures for December as they’re considered the Fed’s preferred version of inflation. Markets expect a 4.8% YoY figure versus 4.7% prior.
Read: US PCE Inflation Preview: Dollar rally has more legs to run
Technical analysis
A clear downside break of a horizontal area from August, surrounding 0.7100, directs AUD/USD towards 2021 bottom of 0.6993. However, any further weakness will not hesitate to challenge the 61.8% Fibonacci Expansion (FE) of the pair’s declines from late June 2021 to January 2022, around 0.6920.
Apple (AAPL) reported earnings after the close on Thursday. Earnings per share (EPS) came in at $2.10 versus the estimate of $1.89. Revenue was $123.9 billion versus the estimate for $118.66 billion.
Apple (AAPL) stock forecast
Apple (AAPL) stock is trading at $162.40 in Thursday's aftermarket, a change of 2% versus the regular session close of $159.16.
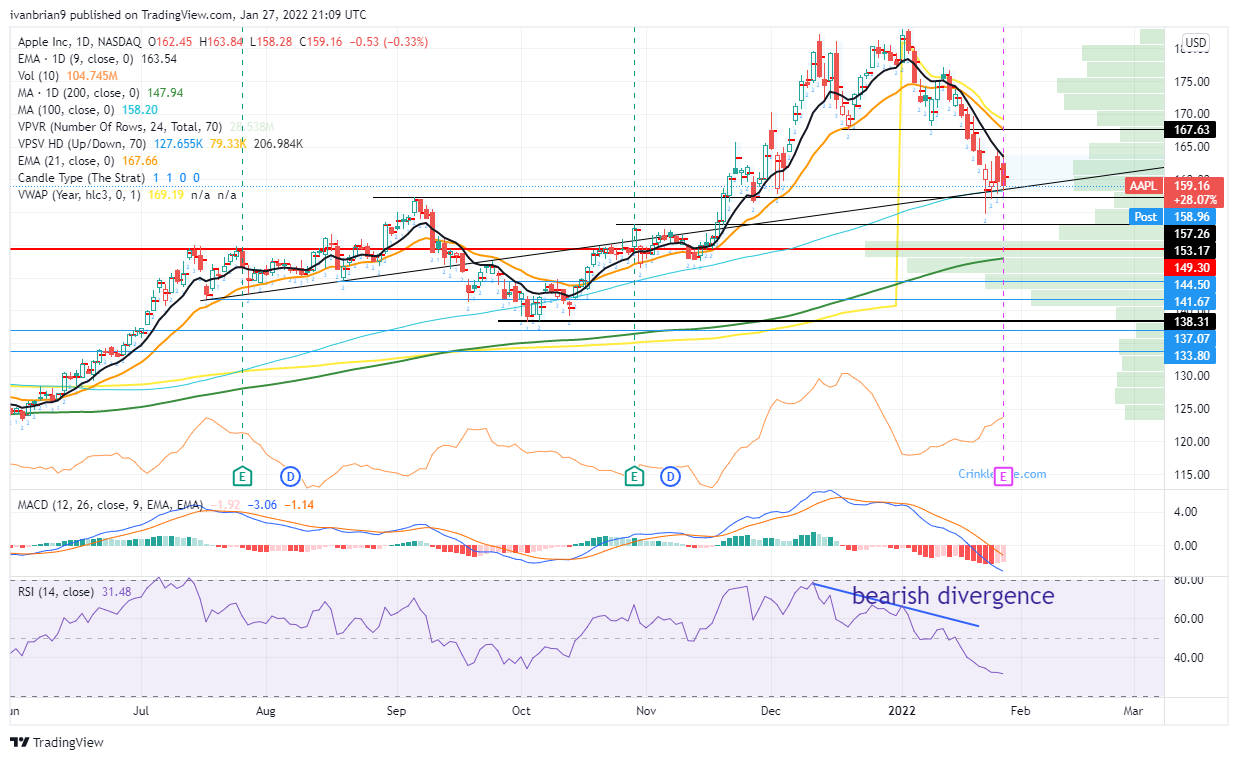
Apple chart, daily
- EUR/USD bulls moving in at the lows for the day.
- Bulls have an eye on the weekly M-formation and prospects of a significant correction.
EUR/USD is set to close off a bearish week towards a test of 1.11 the figure after breaking out of the bearish weekly wedge to the downside. The following illustrates the potential for a downside continuation on the lower time frames while keeping note of the potential for a significant correction to the upside medium term.
EUR/USD weekly chart
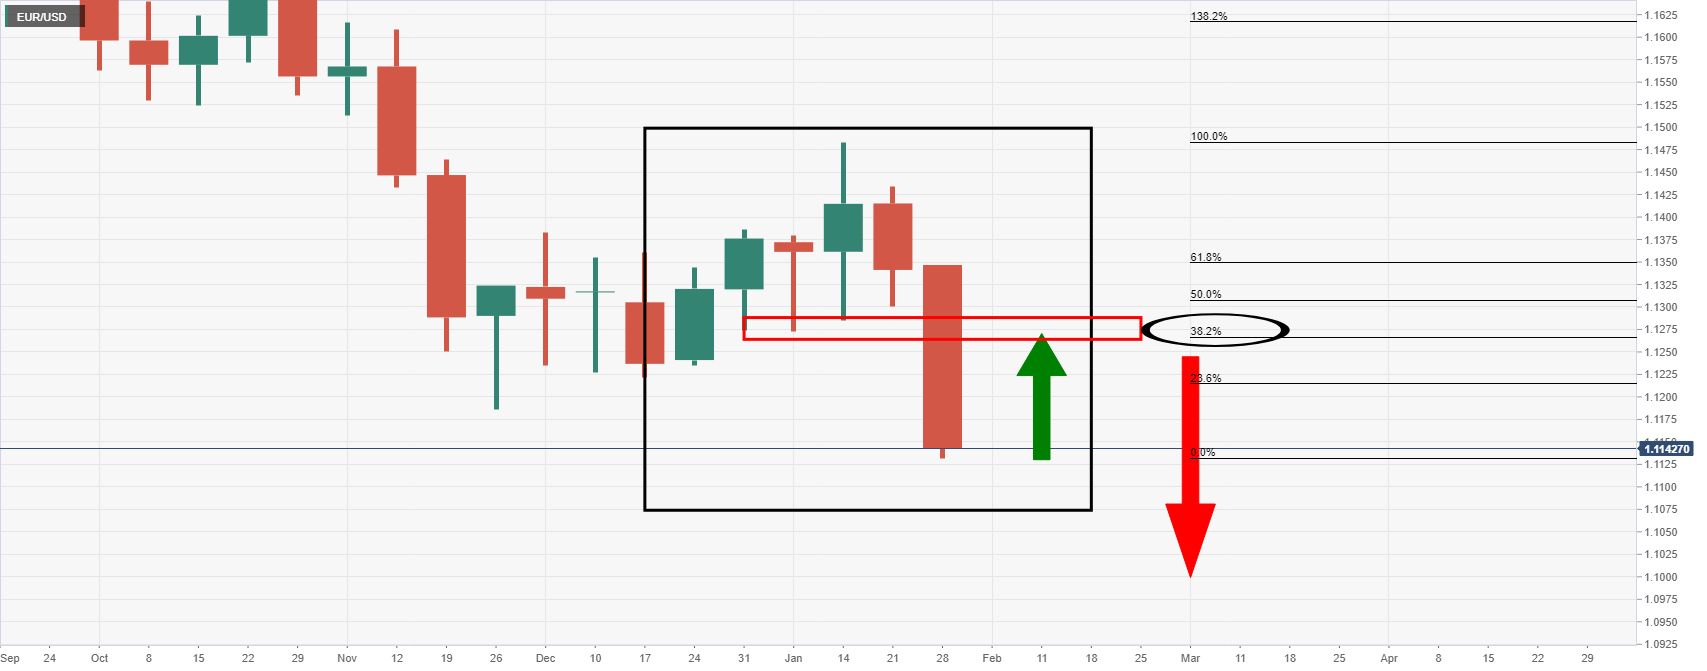
The weekly chart has imprinted an M-formation. This is a reversion pattern and could be a significant theme for the technical outlook in the medium term. The 38.2% Fibonacci retracement level has a confluence with the prior lows that would be expected to at together as a firm resistance structure. Meanwhile, there is still room for a run to test 1.11 the figure, however.
EUR/USD H1 chart
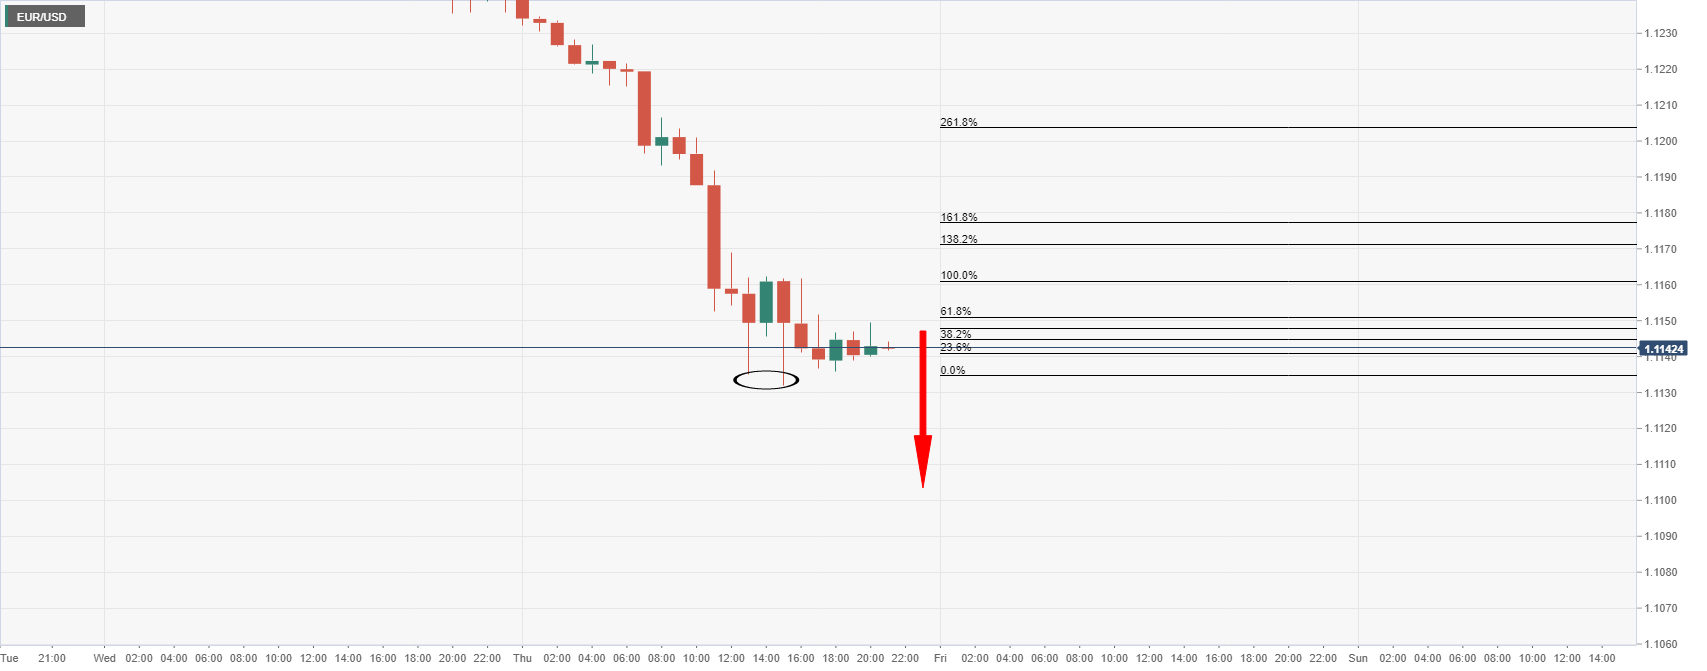
The price has left a bottoming formation given the wicks and subsequent upside correction. The irregularity of the price action is also bullish.
However, we have seen more commitments from the bears since the lows which leave prospects of a downside continuaiton towards 1.11 the figure for the sessions ahead. With that being said, the combination of month-end flows and the choppy price action, the risk-reward is hardly attractive at this stage of the bearish flow.
- GBP/USD is consolidating in the 1.3380 level after dipping under 1.3400 for the first time in over a month.
- Hawkish BoE expectations may be supporting sterling, which outperformed most of its G10 peers even though it succumbed to the dollar.
GBP/USD fell to one-month lows on Thursday underneath the 1.3400 level after slumping below resistance in the 1.3450 area earlier in the session, weighed by a buoyant dollar in wake of Wednesday’s hawkish Fed meeting and strong US GDP data. The pair is now consolidating in the 1.3380 area, practically bang on a level of resistance turned support from back in mid-December, where it trades lower by about 0.6% on the day. Those losses, though extensive, are modest compared to many of sterling’s G10 peers; AUD is down 1.2%, SEK and NZD are down 1.1%, EUR and CHF are down around 0.9%. Sterling’s performance puts it roughly in line with that of the loonie and yen, both of which are also down about 0.6% on the day versus the buck.
While then yen’s comparatively strong on the day performance compared to most of its G10 peers can likely be attributed to choppy US equity market conditions and US yield curve flattening, GBP and CAD may be finding central bank support. Recall that the BoC on Wednesday, while disappointing some calls for a 25bps hike, signaled a rate hike would soon be coming in March (as the Fed did). Meanwhile, investors expect the BoE to lift interest rates by 25bps to 0.25% next Thursday following strong labour market and inflation data for December. While the likes of the euro, Aussie and kiwi have recently broken out to multi-month/year lows, sterling still remains some way above its December 2021 lows just under the 1.3200 area.
Looking ahead, it seems likely that the US dollar’s broad post-Fed rally may have some legs with the Fed seemingly the most intent on monetary policy tightening for some time (i.e. since 2018). Friday’s Core PCE inflation data for December is likely to reinforce that. That keeps GBP/USD downside risks alive, even in the face of BoE hawkishness. Traders should remember to keep an eye on the UK political situation as a UK PM Boris Johnson resignation remains a strong possibility as the partygate scandal drags on. Whilst analysts have so far mostly shrugged off the impact of this political noise on GBP, it surely can’t be helping sterlings cause. Short/medium-term bears will likely be targetting a test of the aforementioned December lows at some point in Q1 2022.
- AUD/USD is in the hands of the bears, but a meanwhile correction can not be ruled out.
- 0.7000 is calling the bears while the 0.7050/'60s could be re-tested first.
Following a break of daily trendline support, AUD/USD has been in the hands of the bears in a sharp and decisive impulse on the daily chart which could be destined to test the December swing lows:
AUD/USD daily chart
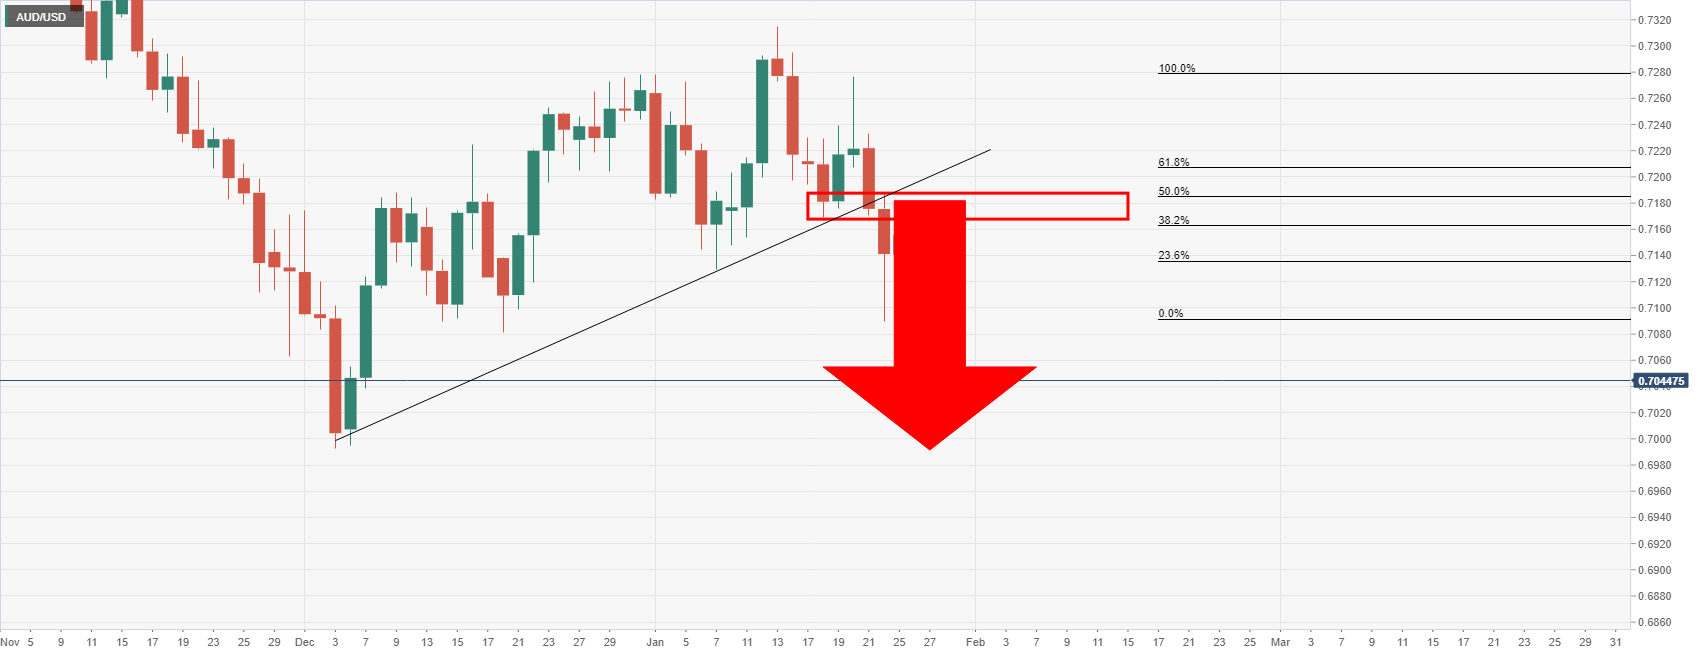
Since the break of the trendline support, the price retested the old support area and was subsequently resisted which led to a downside continuation as follows:
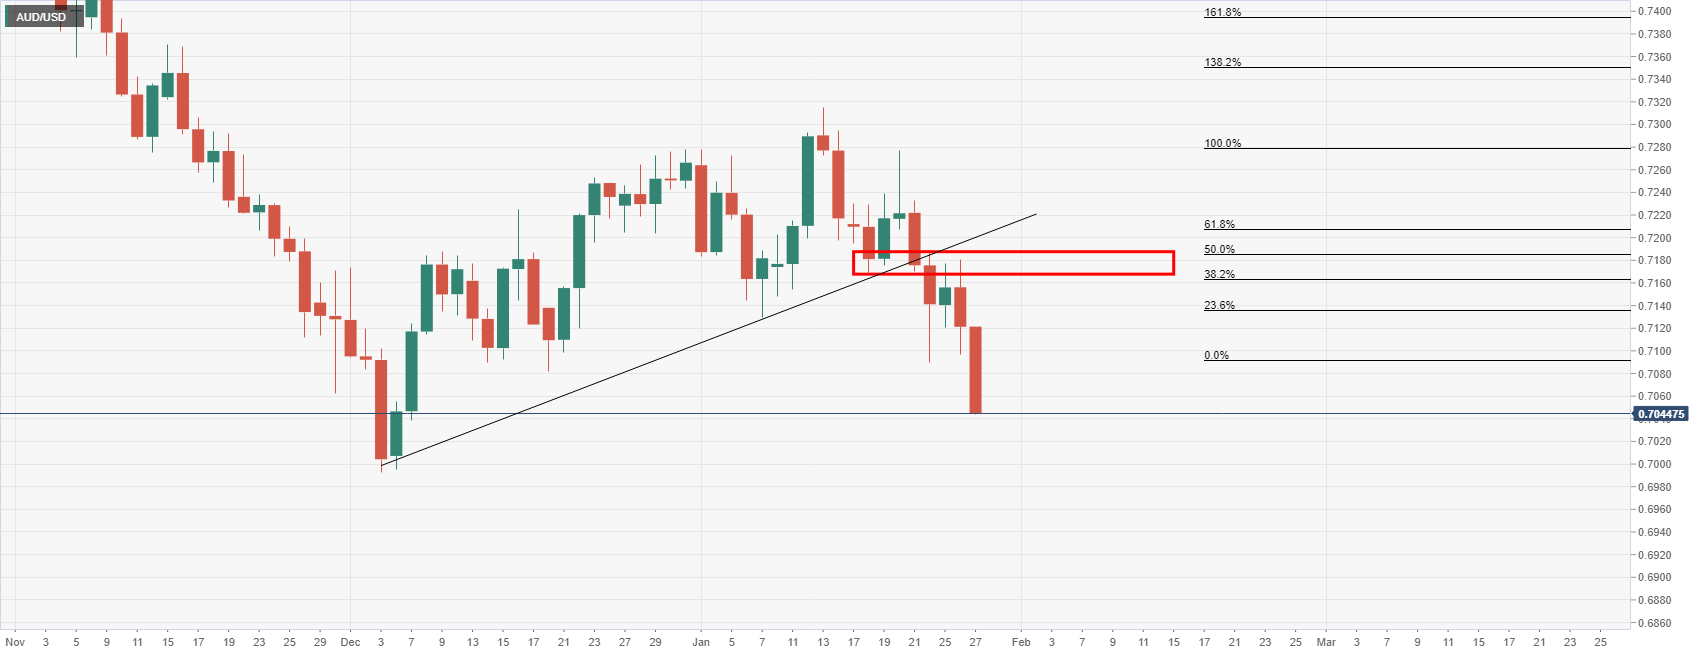
The bears are well and truly in control and a daily close below the midpoint of the 0.70 area could indicate that the path of least resistance will continue to be to the downside for the rest of the week.
With that being said, a bullish correction on the lower time frames could be in order first:
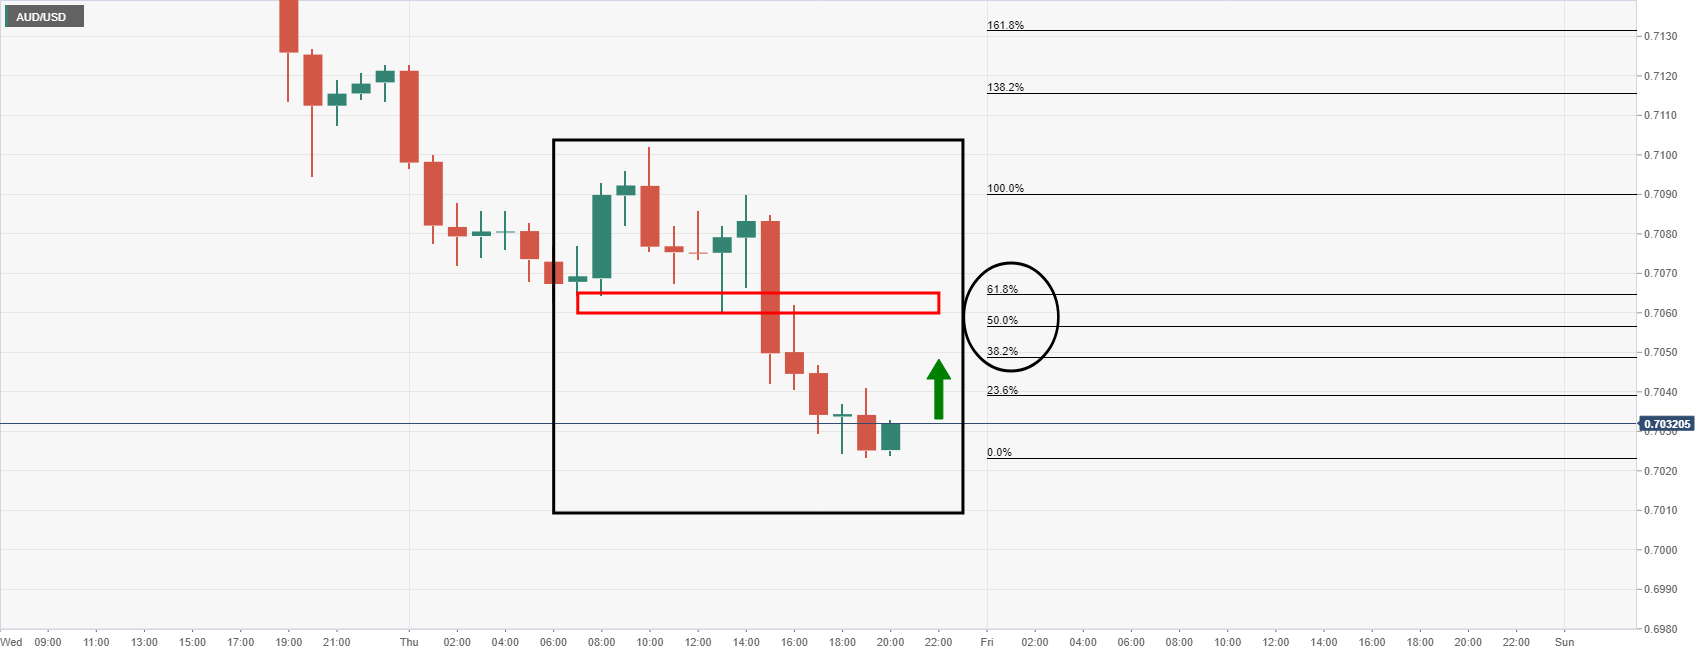
The M-formation is a risk for bears considering the high probability that the price will revert back to, or towards the neckline of the pattern. The 38.2% Fibonacci could come under pressure in this regard before the next wave of selling occurs at a discount from current levels. This puts the 0.7050/'60s on the map for the remaining sessions ahead for the week in the first instance. On the other hand, should the bears commit prior to there, then 0.7000 could be seen first.
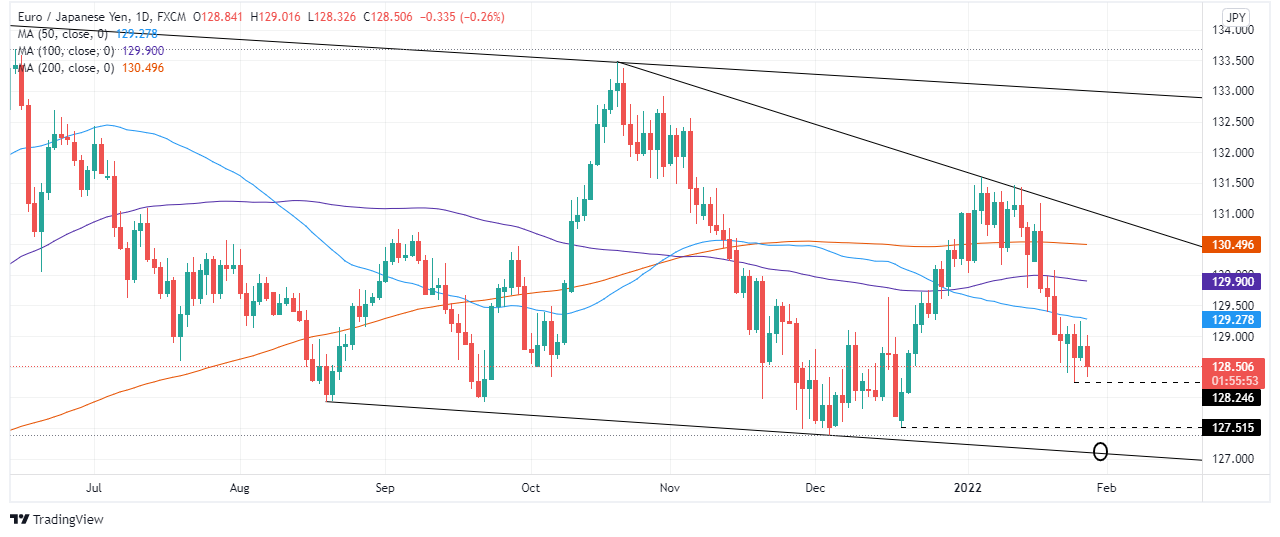
- The shared currency slides against the Japanese yen, down 0.26%.
- The EUR/JPY is neutral-downward biased, though a break under 128.24 would add further downward pressure on the pair.
During the New York session, the EUR/JPY slides 0.40%. At the time of writing, the EUR/JPY is trading at 128.43. A mixed market mood surrounds the financial markets, as depicted by US equity indices trading in the red, except for the Dow Jones, gaining 0.23%.
EUR/JPY Price Forecast: Technical outlook
In the overnight session, the EUR/JPY was subdued around the 50 and the 100-hour simple moving average (SMA), lying at 128.75 and 128.77, respectively. In the overlap of the European and North American session, faced resistance at the abovementioned, followed by a fall towards the daily low at 128.35.
The EUR/JPY daily chart depicts a neutral-downward bias. Although almost flat, the daily moving averages (DMAs) reside above the spot price.
On the downside, the EUR/JPY first support would be January 25 daily low at 128.24. A breach of the latter would expose December 2021, daily lows at 127.51. It is worth noting that a downslope trendline below the latter, part of a falling wedge, might be tested, but it is in the early stages of the pattern.
To the upside, the EUR/JPY first resistance level would be the 50-DMA at 129.27. A test of that level would expose the 100-DMA at 129.89, followed by the 200-DMA at 130.49.
What you need to know on Friday, January 28:
The market was all about the dollar and the Fed after the US central bank pretty much confirmed a rate hike coming in March, fueling speculation of at least four hikes this year. The greenback got additional support from upbeat growth figures, as Q4 GDP came in at 6.9%, much better than the 5.5% expected. Meanwhile, unemployment claims in the week ended January 14 met expectations by printing at 260K.
The American currency extended its post-Fed rally to reach a multi-month high vs the shared currency, as EUR/USD plunged to 1.1130. GBP/USD fell to 1.3354, a one-month low, with both pairs settling nearby.
Commodity-linked currencies also fell, with AUD/USD currently trading at around 0.7030 and USD/CAD at 1.2730. Gold prices collapsed, with the bright metal falling below $1,800 a troy ounce. Crude oil prices advanced to fresh multi-year highs but lost momentum ahead of the daily close and finished the day little changed, with WTI settling at $86.80 a barrel.
Wall Street started the day with a firm footing, posting substantial intraday gains. However, it changed course in the final hours of trading, with indexes falling into the red. US Treasury yields retreated from Wednesday’s peak, with the yield on the 10-year note down to 1.78%. The greenback held on to gains despite the changing direction in equities and yields.
Dogecoin price to break weekly high and tag $0.16
Like this article? Help us with some feedback by answering this survey:
- USD/CAD is at three-week highs around 1.2740, having cleared some key resistance levels on the way.
- The buck has been given a broad boost in wake of Wednesday’s more hawkish than expected remarks from Powell.
- Short-term bulls will be betting that technical buying carries the pair to resistance in the 1.2800 area.
USD/CAD rallied above the 1.2700 level in recent hours to hit a new three-week high around 1.2740, the pair having broken to the north of its 50-day moving average close to 1.2710. USD/CAD now trades about 0.6% higher on the session near 1.2740, having rallied around 90 pips from earlier session lows at 1.2650. At these earlier session lows, it seems that the short-term bulls took the opportunity to add to long positions with the pair retesting a downtrend it broke above in wake of Wednesday’s hawkish Fed meeting.
Indeed, the more hawkish than expected tone of Fed Chair Jerome Powell’s remarks in the post-meeting press conference are the main reason why the US dollar has strengthened across the board, including versus the loonie, on Thursday. Arguably, stronger than expected US GDP growth figures for Q4 2021 are helping sustain the broad USD rally on Thursday. Wednesday’s BoC meeting, where, like the Fed, the central bank also gave the nod to a rate hike in March, has been largely forgotten at this point. Although looking at the daily G10 performance table, with CAD holding up better than most of its G10 peers, it may be offering some relative support (versus the likes of AUD, NZD and NOK for example).
US equity markets have been choppy, as have global crude oil markets, with both asset classes swinging from the green back into the red over the course of the session and not offering the risk/commodity-sensitive loonie much support. With USD/CAD above the downtrend that had prevailed since mid-December and above key resistance in the 1.2700 area, it seems likely that technical buying can carry the pair higher towards resistance around 1.2800 in the short term. If Friday’s US Core PCE inflation data for December comes in higher than expected, this will likely help this move via a boost to the buck amid renewed Fed tightening bets.
- Gold slid to trendline support as US equities lost ground late in the session.
- US Q4 GDP rose 6.9% saar in December, versus 5.5% expected.
- US dollar remains in bullish territory despite the slump in US yields.
Gold, (XAU/USD), was lower in midday markets on Wall Street, losing some 1.4% at $1,795. The price of gold fell from a high of $1,822.18 and had reached a low of $1,791.86. Equity markets initially bounced in the aftermath of the FOMC driven sell-off yesterday. However, they started to slide again and the US dollar edged higher, hitting a one-and-a-half-year high, weighing on the yellow metal.
''The market ran short of optimists as it weighed up the pros and cons of a Fed belatedly determined to tame rampant inflation,'' analysts at ANZ Bank explained.
At the time of writing, the Dow Jones Industrial Average is down 0.25% and has marked a low of 34,034.08 so far, giving up earlier gains of as much as 1.4%. The Nasdaq Composite fell 0.5% to 14,002.58 after trading in the green at market open. The S&P 500 is down 0.37% and hit a low of 4,315.20 after trading up 1.2% earlier in the session. The yield on the US 10-yr note fell to 1.783% and is down 4%.
Powered by bets the US Federal Reserve could deliver faster and larger interest rate hikes in the months ahead, the greenback holds near the highest levels since July 2020 against other major currencies on Thursday, as measured by the DXY index. At the time of writing, it is trading 0.7% up near 97.20 as money markets move in to price in as many as five quarter-point increases by year-end.
The greenback was also supported on the fourth-quarter Gross Domestic Product that rose 6.9% saar vs expectations of a 5.5% rise. The GDP price index also beat expectations, rising 6.9% saar, while Q4 core inflation rose to 4.9% vs 4.6%. Personal consumption expenditures rose 3.3% vs 2.0% in Q3.
Is the Fed jawboning?
Analysts at TD Securities tackle the questions as to whether the Fed is jawboning, or whether they are on a quest to pummel inflation?
''The answer to this question is key to recognizing the regime that lies ahead. By not pushing back against the notion of hikes at consecutive meetings or even against a potential 50bp rate hike, Chair Powell's tone was undeniably hawkish at yesterday's FOMC,'' the analysts argued.
Key points
''The market has already priced-in a 25bp hike in March but the possibility of a 50bp hike is also seeping into market pricing. Given global macro's elevated sensitivity to liquidity, evidence that quantitative tightening might be more impactful for asset prices suggests that this axis could be particularly relevant.''
''We expect that the precious metals complex will struggle to attract capital in the face of a hawkish Fed.''
''We should not discount the possibility that the Fed's tone is also being used as a policy tool — jawboning might also help crush the momentum in inflation expectations that ultimately threatens the Fed's control on inflation itself.''
''In this scenario, the Fed could potentially use the pace of quantitative tightening as a tool to manage the strike on its put, without necessarily causing undue harm to its primary objective of keeping inflation expectations bounded.''
''We have initiated a short gold position and expect a low threshold for CTA trend follower liquidations to support our position.''
Gold technical analysis
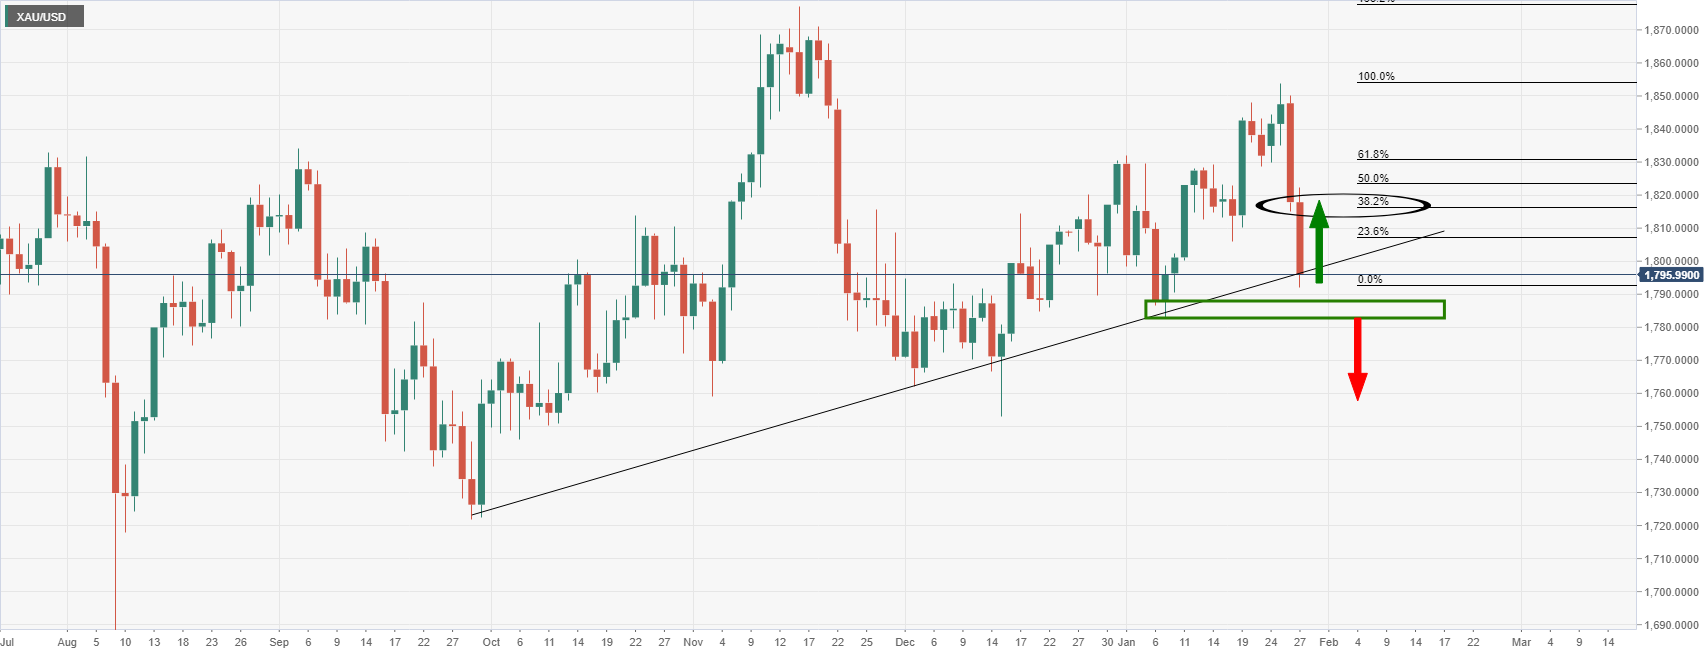
The price, however, is meeting dynamic trendline support. While the momentum is with the bears, profit-taking into month-end could see the bulls move in for the kill. This could be expected to see the price revert back towards liquidity where the 38.2% ratio is currently aligned, towards $1,820. With that being said, a break below the trendline and then $1,780 horizontal support would open the doors to lower levels for the foreseeable future.
- All three major US bourses have reversed earlier gains and are now trading in negative territory.
- The S&P 500 was at one point above 4400 but is now in the low 4300s.
- Sentiment remains mixed and conditions choppy as investors digest this week’s Fed meeting and the latest strong US GDP numbers.
Having been as much as 1.8% higher in earlier trade and above the 4400 level, the S&P 500 has reversed lower in choppy trade and is back to trading in the red in the low 4300s. At current levels around 4320, the index trades lower by about 0.6% on the day. The Nasdaq 100 and Dow indices have seen similarly choppy trading conditions, with both also reversing sizeable gains earlier in the session to slip into the red. The Nasdaq 100 index is now down about 1.0% on the day and probing the 14K level again for a third successive session, while the Dow has reversed from earlier highs in the 34.75K area to just above 34K where it trades lower by about 0.3% on the session. Sentiment remains mixed and conditions choppy as investors digest this week’s Fed meeting and the latest strong US GDP numbers.
Looking at the S&P 500 GICS sector performance, there is a clear defensive bias, with Utilities (+0.4%) and Consumer Staples (+0.3%) leading. Most other sectors are either flat or in the red, aside from the big tech-dominated Communication Services sector, which is about 0.25% higher. The comparatively decent performance of this sector versus the likes of the Information Technology (-1.0%) and Consumer Discretionary (-1.8%) sectors highlights some interesting rotation going on under the surface. The first thing to note is that Tesla has seen a massive 9.0% decline post earnings (the carmaker warned of lasting supply chain issues) and this is weighing on the Consumer Discretionary sector. Meanwhile, Netflix has rocketed nearly 7.0% higher after billionaire investors Bill Ackman hailed the share’s recent post-earnings drop as a great buy-the-dip opportunity.
Elsewhere, the semiconductor subindex within the Information Technology sector is getting battered in wake of poor Intel (-7.5%) earnings, with the co. also warning about supply chain issues. The PHLX Semiconductor Index is down nearly 5.0% on the day. Elsewhere, despite the downbeat tone in most non-defensive equity sectors, large-cap tech stocks have been doing well (Microsoft +1.0%, Amazon +1.0%, Apple -0.4%, Google flat, Meta (Facebook) +0.4%). One equity analyst said, “we believe the biggest opportunity in markets right now is in dividend growth stocks (like the aforementioned large-cap tech names) that have strong balance sheets and cash flows, and can thrive in an environment no matter what the Fed does”.
- The USD dollar marches firmly in the North American session, with the DXY surging 1.34%, above 97.00.
- The greenback gains lie on the back that the US central bank might hike rates in the March meeting.
- USD/JPY is upward biased, though a break above the 115.30-45 region would open the door for a test of YTD highs.
The US dollar extends its rally against the Japanese yen, trading at 115.23, a gain of 0.55% at the time of writing. The investor’s mood has been swinging throughout the day. In the last hour, US equity indices fluctuated between wins and losses, but the USD has been able to hold its ground vs. the safe-haven Japanese yen.
The dollar surge is attributed to Fed hawkishness. On Wednesday, the US central bank kept the Federal Funds Rate (FFR) unchanged around the 0-0.25% range while mentioned that they would hike rates “soon.” Following the release of the monetary policy statement, Fed’s Chairman Jerome Powell said that “the committee is of a mind to raise the federal funds rate at the March meeting assuming that the conditions are appropriate for doing so.”
In the meantime, the US dollar index, which measures the dollar value against a basket of its rivals, advances 1.34%, up to 97.231. Contrarily to the positive performance of the greenback, the US 10-year Treasury yield slides six basis points, from 1.851% to 1,792%
Before Wall Street opened, the US economic docket featured Initial Jobless Claims for the week ending on January 22, fell to 260K from 286K, better than expected after two consecutive weeks of increases. Meanwhile, the Gross Domestic Product (GDP) for Q4 rose by 6.9%, crushing 5.5% expectations, helped by the fiscal policy and Fed accommodative monetary policy.
Later in the day, USD/JPY traders focus would turn to the release of the Consumer Price Index (CPI) in Japan,
USD/JPY Price Forecast: Technical analysis
The USD/JPY is upward biased, as depicted by the daily moving averages (DMAs) residing well below the spot price. At press time, the pair is approaching an upslope trendline drawn from October 2021 swing lows to December ones, broken to the downside on January 13, that will be resistance around 115.30-45 area.
A breach of the latte would expose the YTD high at 116.35, which, once broken, will be followed by January 2017 cycle highs at 118.61, a space of approximately 235-pips.
Contrarily, the USD/JPY first support would be the January 18 daily high, previous resistance-turned-support at 115.00, followed by 114.47, and the 50-DMA at 114.31.
- GBP/USD offers something for both the bulls and bears until the 4-hour support structure breaks.
- The bulls will want to see the 61.8% Fibo give on the 4-hour time frame.
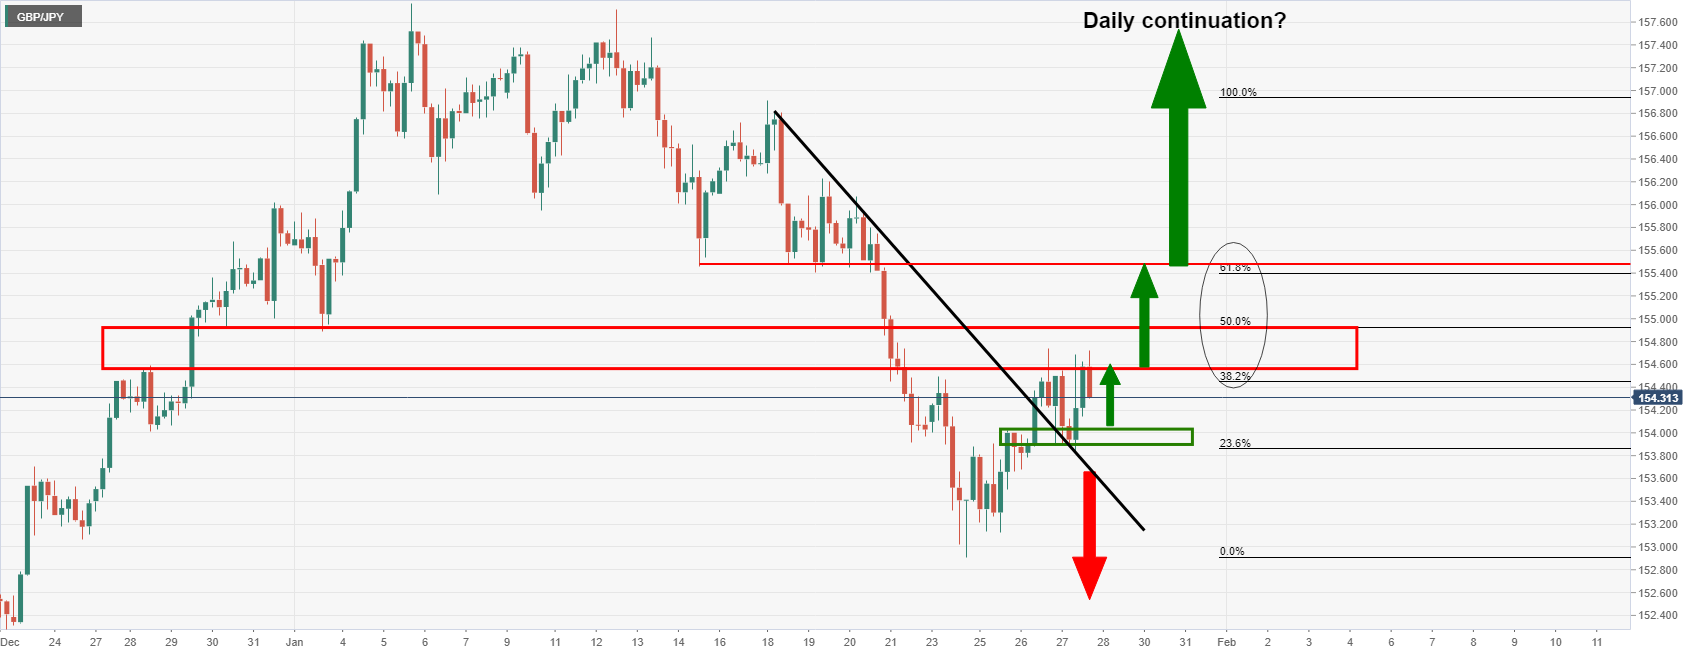
As per the prior day's analysis, GBP/JPY Price Analysis: Bears sinking their teeth into what could be a fresh daily impulse, the price has moved accordingly within the corrective stage of the bearish trend.
The Fibonacci levels are in focus and for now, the space between the 38.2% ratio and the 50% mean reversion mark is offering resistance:
GBP/JPY daily chart
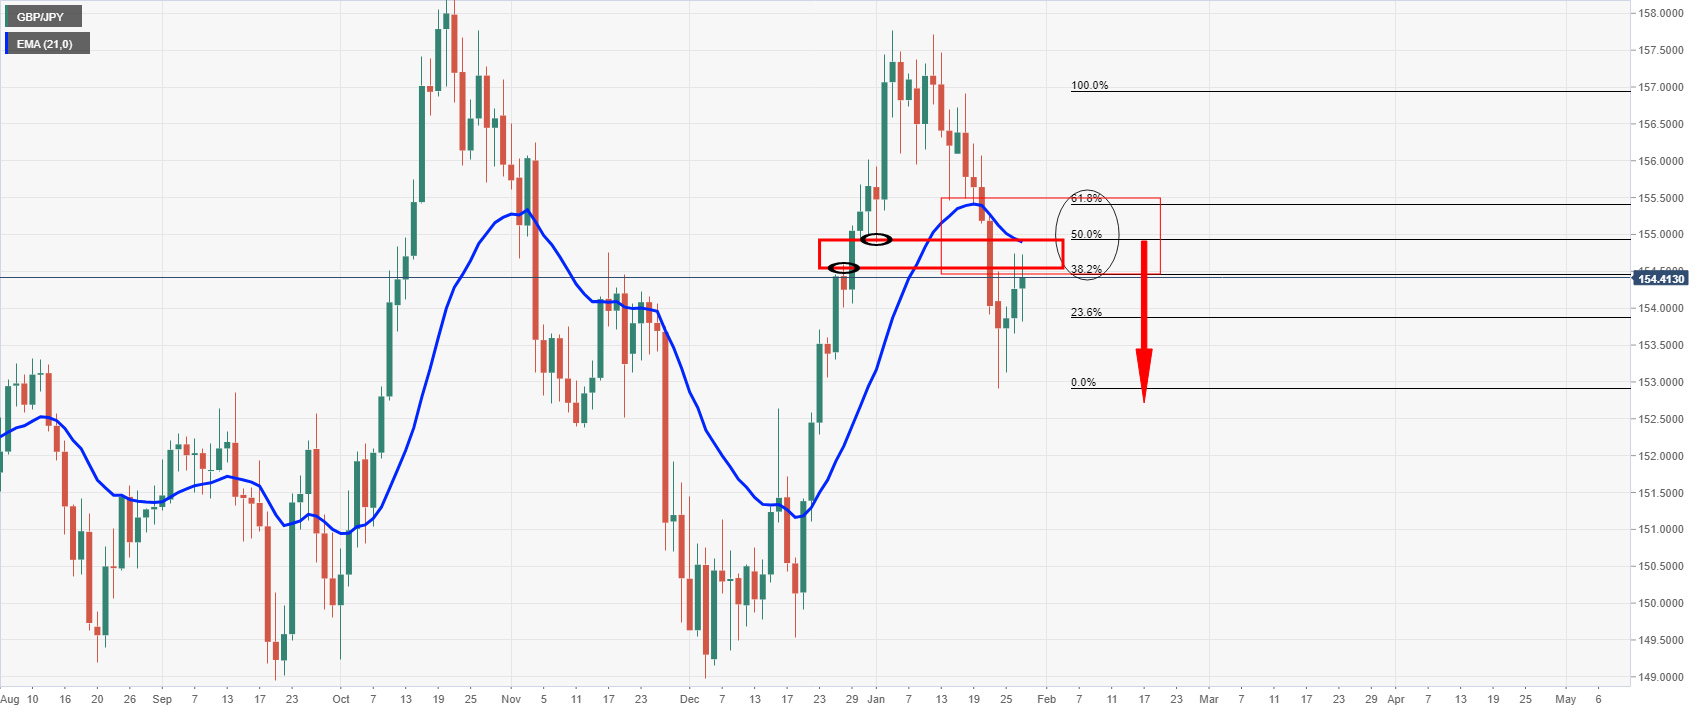
The wicks of the 28 December and 3 January daily candlesticks align and offer values of liquidity below the 21-day EMA, reinforcing the resistance potential.
GBP/JPY H4 chart
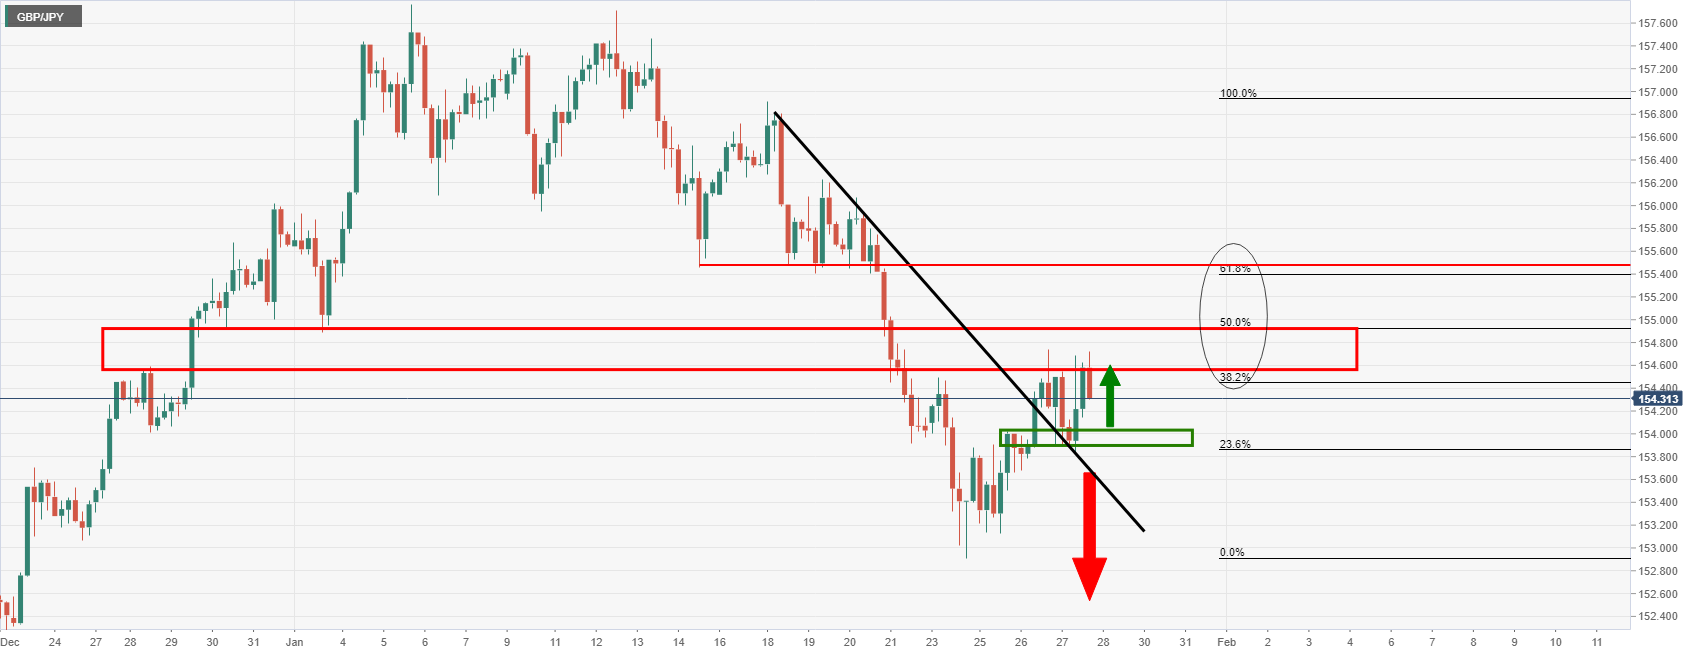
The 4-hour chart shows that the price needs to get below 153.83 where the dynamic support of the counter-trendline and horizontal support meet. On the flip side, if the bulls commit and should the 50% mean reversion give way, then the 61.8% will be the last defence to a potential bullish daily and weekly continuaiton:
GBP/JPY weekly chart
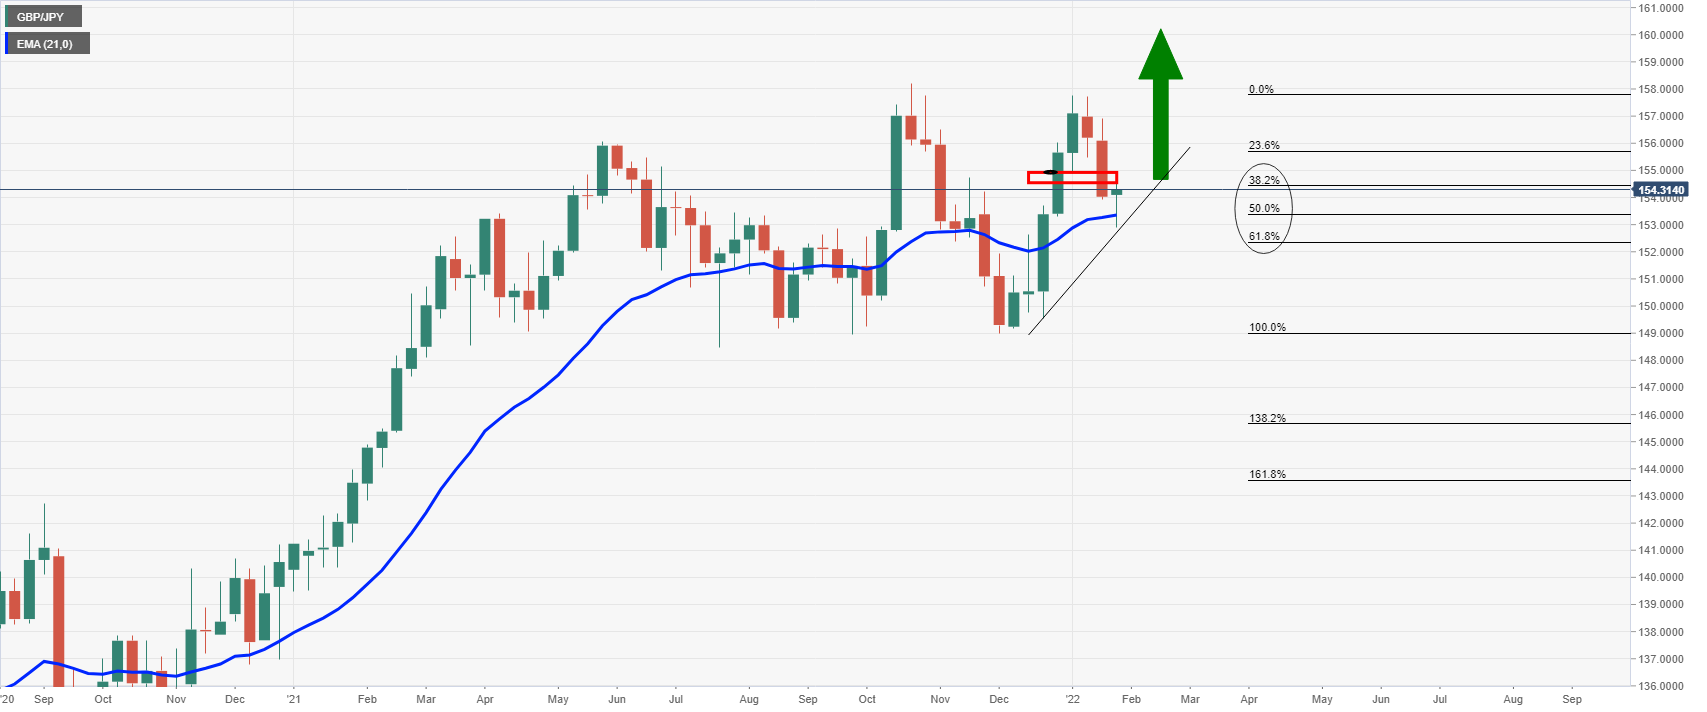
The weekly chart is bullish and the price s testing the critical Fibonaccis. If the price holds the 21-week EMA, and the 4-hour chart's 61.8% gives, then this will be bullish for the outlook in weeks ahead.
- On Thursday, the Swiss franc collapsed almost 1%, as Fed policymakers eye the first rate hike in the March meeting.
- The US Dollar Index marches firmly above 97.00 for the first time since 2020.
- USD/CHF is upward biased, though a retracement before resuming the uptrend is on the cards.
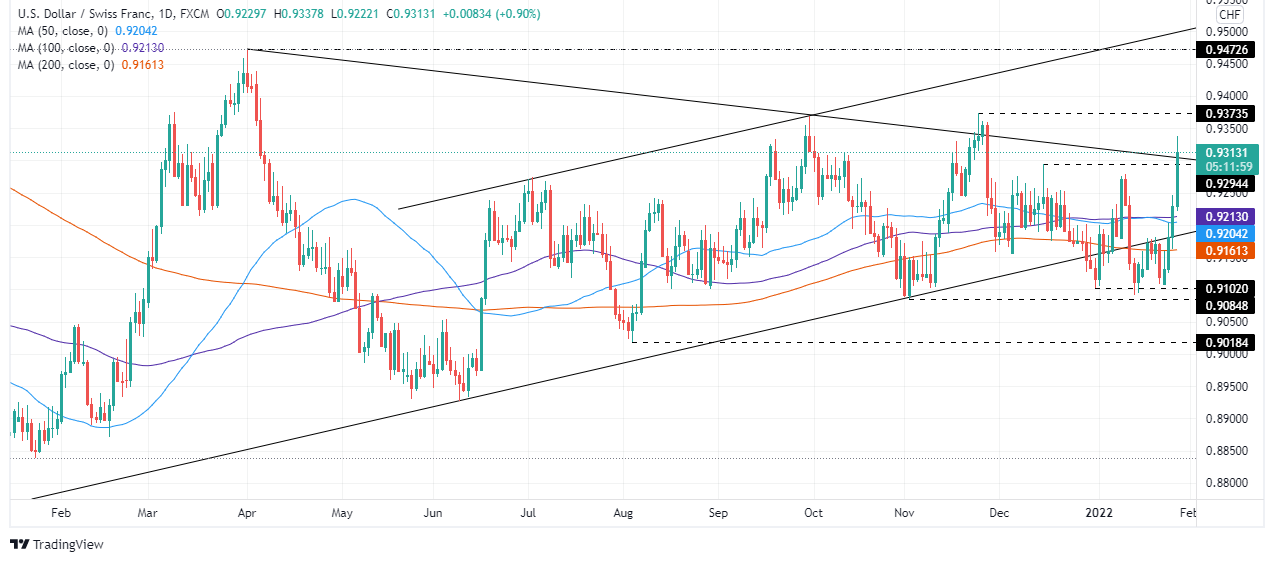
During the North American session, the USD/CHF advances close to 1%, trading above 0.9300 for the first time since November 2021 highs. At the time of writing, the USD/CHF exchanges hands at 0.9312.
A risk-on market mood dented the prospects of the Swiss franc, which usually rallies on risk aversion. In the meantime, the US Dollar marches firmly throughout the session, with the US Dollar Index (DXY) advancing 1.23%, sitting at 97.131.
USD/CHF Price Forecast: Technical outlook
The USD/CHF is upward biased. On Wednesday, the pair broke resistance levels on its way towards 0.9300, like the 50 and 100-day moving averages (DMAs), lying at 0.9204 and 0.9212. Furthermore, it broke a downslope resistance trendline drawn from April – September 2021 cycle highs that pass around the 0.9300-05 area. However, due to the nature of the movement, a pullback towards the figure, or December 15, 2021, a daily high at 0.9294, is on the cards.
That said, the USD/CHF first support is 0.9300. A break of that level immediately suggests a test of December 15, 2021, high at 0.9294, followed by a January 26 daily high at 0.9246.
Contrarily, to the upside, the first resistance is November 2021 cycle high at 0.9373. A breach of the latter would expose the 0.9400 figure, followed by April 2021, swing highs at 0.9472.
- NZD/USD recently dipped below 0.6600 for the first time since early November 2020 as the pair maintains bearish momentum.
- It is now down more than 4.0% from its earlier monthly highs near 0.6900.
- Hawkish Fed vibes and strong US data have been driving the latest downside, with hot NZ CPI figures ignored.
NZD/USD has dipped below the 0.6600 level in recent trade for the first time since early November 2020, as the pair maintains bearish momentum courtesy of renewed USD strength following stronger than expected Q4 US GDP numbers released on Thursday. The latest drop comes after the pair reversed sharply lower from Wednesday highs above 0.6700 when Fed Chair Jerome Powell caught investors off guard with his more hawkish than expected tone in the post-Fed meeting press conference. Since then, the US dollar has strengthened across the board, with the bullish momentum carrying through to a second session. NZD/USD currently trades 0.8% lower on the day after Wednesday’s 0.5% loss, with on-the-week losses now about 1.7%.
Recent losses come following a torrid last few weeks for the kiwi. A reversal lower in global equities (the S&P 500 is roughly 9.0% lower versus monthly highs), a ramping up of Fed tightening bets and technical selling have seen the pair reverse more than 4.0% lower from monthly highs near 0.6900. Indeed, since posting annual highs on January 13, the pair has fallen in nine out of the last ten sessions. The losses really accelerated when NZD/USD broke to the south of its mid-December to mid-January upwards trend channel in the 0.6750 area on January 21. Most short-term bears will be targetting a test of the August/September 2020 lows in the 0.6500 area.
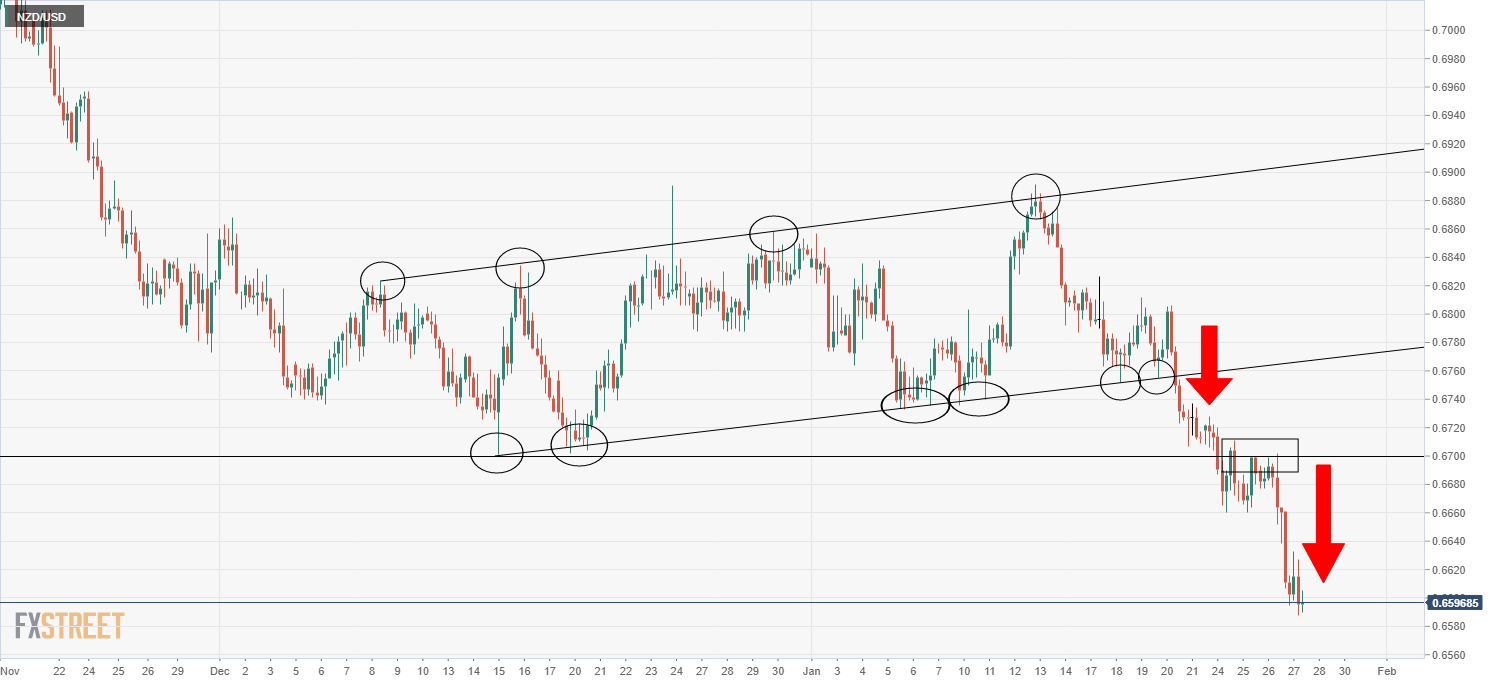
RBNZ hawkishness (the central bank has already hiked rates twice since October 2021, bringing rates to 0.75%) has been unable to shelter the kiwi from losses. That might explain why hotter than expected New Zealand Consumer Price Inflation figures for Q4 2021 (released early during Thursday’s Asia Pacific session) has been unable to offer NZD/USD a lift. For reference, CPI came in at 1.4% QoQ and 5.9% YoY, above the 1.3% and 5.7% expected.
Looking ahead to the rest of the week, though equity market sentiment has taken a turn for the better amid dip-buying, this has not yet come to the aid of risk-sensitive G10 currencies like the kiwi. Equities are likely to remain choppy for the rest of the week as investors digest Wednesday’s Fed meeting, which could keep NZD vulnerable. Otherwise, further bearish NZD/USD could come from Friday’s US Core PCE Inflation data for December, especially if it comes in hot and further pumps Fed tightening bets.
-637788988819980024.png)
Analysts from Rabobank expect no surprises from the European Central Bank at its February meeting. They expect 2022 to bring a reversal of pandemic policies, but not a broader tightening of policy.
Key Quotes:
“The ECB has recovered some policy flexibility in December, but this comes at the cost of some uncertainty and continued market speculation that the ECB will hike rates sooner rather than later. We expect the ECB to stick to its script of transitory inflation, which means that 2022 should only see a reversal of pandemic-related tools, and not a broader withdrawal of monetary accommodation aimed at achieving the inflation goal.”
“While the outlook remains very fluid, we therefore believe that it takes a lot of stars to align before the ECB’s baseline is realised, let alone exceeded, in terms of wage-driven inflationary pressures. And downside risks remain abundant. Most notably, we believe that cost-push inflation could still have a detrimental impact on future consumption and hence medium-term inflation. And the geopolitical environment may further exacerbate the energy price shock, if tensions with Russia escalate.”
“Inflation is still more likely to nip demand in the bud before wage growth gets enough room to accelerate sharply. We therefore maintain our call that 2022 will only see the reversal of pandemic-specific stimulus measures and we do not expect the ECB to turn into a more general inflation hawk.”
Data released on Thursday, showed the US economy grew at a 6.9% annualized rate in the fourth quarter, surpassing gexpectetions. According to analysts at Wells Fargo, the details behind the better-than-expected headline point to a slowing in spending and a back-up in inventories. Without the boost from inventories, GDP would have been just 2.0% in Q4, they explained.
Key Quotes:
“It is tempting to celebrate a better-than-expected outturn with 6.9% GDP growth in the fourth quarter, but due to a confluence of factors we will not likely see that sort of growth again for some time. While to some extent the year-end surge was a function of steady consumer and business spending, both petered out at the end of the year as Omicron cases climbed and hospitalizations followed.”
“In the absence of that stimulus, consumer spending is poised to slow. We do not have a quarterly growth rate north of 3.0% for consumer spending throughout the rest of this year or next year. To the extent that there is good news in that, this will allow supply chains a chance to catch up”.
“The inventory build we saw in Q4 was an unhealthy one, and an argument could be made that it was unintentional. But a slower, sustained build in inventories over the next couple of years will not only underpin growth it will allow for a smoother, if somewhat slower expansion in the business sector.”
“The defining challenge for the economy in the next year or two will be how well we can sustain growth not just in the absence of fiscal policy, but in the face of tightening monetary policy.”
- US dollar holds onto daily gains across the board.
- EUR/USD heads for the lowest daily close since June 2020.
- US Q4 GDP comes above expectations, Jobless Claims slide and Durable Goods Orders decline more than expected.
After a brief recovery, the EUR/USD dropped to 1.1130, hitting a fresh multi-month low. It then rebounded again, finding resistance around 1.1160. The pair remains under pressure amid a broad-based strong US Dollar.
The greenback strengthened sharply after the FOMC meeting. “Fed Chair Jerome Powell was quite hawkish during the press conference, which drove US yields higher, EUR/USD lower and US equities lower. We continue to see EUR/USD at 1.08 and expect dollar strength to broaden against other currencies during H1”, considered analysts at Danske Bank.
Economic data in the US came in mixed on Thursday. The first reading of Q4 US GDP showed activity expanded at a 6.9% annualized rate, above the 5.5% of market consensus. Initial Jobless Claims dropped to 260K in line with expectations. Durable Goods Orders dropped 0.9% in December (vs the 0.6% slide expected). Pending Home Sales fell 3.8% in December.
The economic figures have no impact on price actions as market participants continue to digest the FOMC meeting. The dollar remains firm even as US yields decline and stocks rebound on Thursday.
The EUR/USD is about to post the lowest daily close since June 2020. Despite falling 150 pips during the last 24 hours and showing oversold readings, no signs of a correction or stabilization are seen at the moment. Under 1.1130, the next support might be seen at 1.1105.
Technical levels
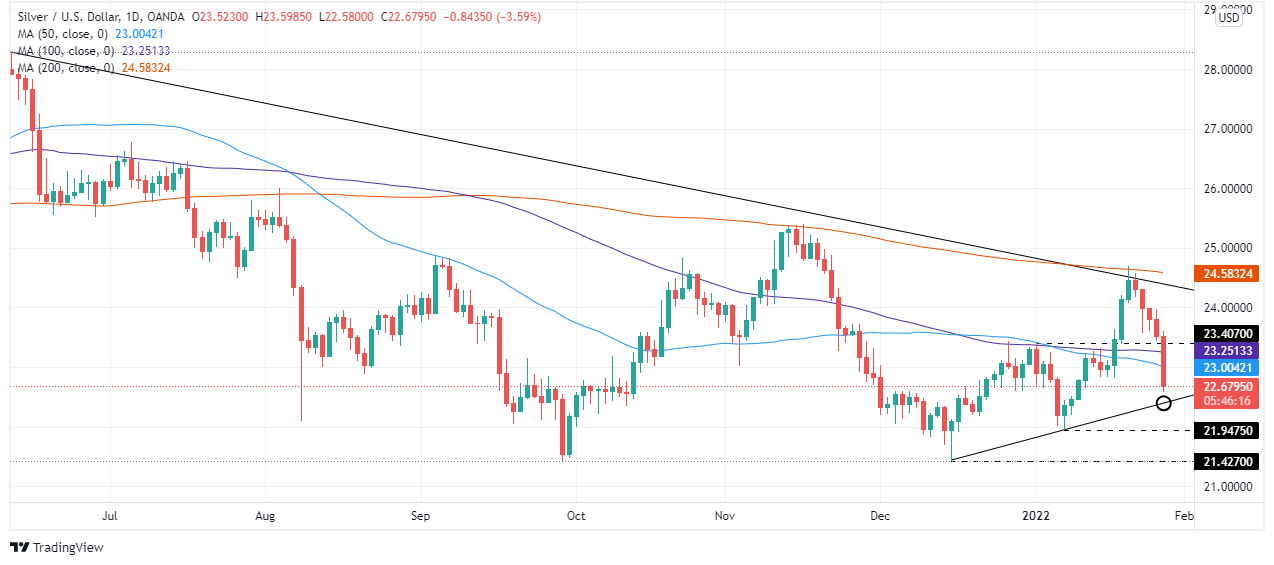
- Silver plummets on the back of Fed’s Chairman Powell, saying that the “committee” could raise rates in the March meeting.
- On Wednesday, the US central bank kept rates unchanged and mentioned that QT would begin after the bank started its hiking cycle.
- XAG/USD is heavily downward pressured, approaching an upslope trendline that might give way towards $21.94.
Silver (XAG/USD) slides sharply on Thursday, after the Federal Reserve’s first monetary policy meeting, left open the door for a rate hike in March, as Fed’s Chairman Jerome Powell mentioned. At the time of writing, XAG/USD is trading at $22.58, down more than 3.97%.
The market sentiment remains positive, as portrayed by European and US equities climbing. In the meantime, the US Dollar Index, a measurement of the greenback value against six peers, advances 1.33%, sitting at 97.224, its highest level since July 2020.
On Wednesday, the US central bank held its first monetary policy meeting of 2022. Fed policymakers agreed to keep rates unchanged at the 0 to 0.25% range. Policymakers commented that inflation reflects “supply and demand imbalances related to the pandemic and the reopening of the US economy.” Furthermore, the balance sheet reduction will begin as soon as the central bank hikes rates.
Chairman Powell hit the stage following the Fed’s monetary policy statement release. He said that “…the committee is of a mind to raise the federal funds rate at the March meeting assuming that the conditions are appropriate for doing so.”
The US economic docket featured Initial Jobless Claims for the week ending on January 22, fell to 260K from 286K in the previous week, showing the labor market’s resilience after two consecutive weeks of increases. Meanwhile, the Gross Domestic Product (GDP) for Q4 rose by 6.9%, crushing 5.5% expectations.
XAG/USD Price Forecast: Technical outlook
Silver (XAG/USD) is under “heavy” downward pressure, breaking previous support levels, like the 100 and the 50-day moving averages (DMAs), lying at $23.25 and $23.00, respectively. That exposed an upslope trendline, drawn from December 2021 lows up to January ones, which lies around $22.35-50 area. In the event of a test of the latter, that would send XAG/USD tumbling towards January 7 cycle low at $21.94, followed by December 2021 lows at $21.42.
Economists at Rabobank have significant doubts over market expectations that the Bank of England (BoE) is likely to hike rates at an aggressive pace this year. Therefore, they expect the GBP/USD to dive below the 1.30 level by mid-year.
The BoE will struggle to tighten policy further this year
“On the assumption that the government does proceed with the announced hike in National Insurance tax in April, we see a risk that the market will unwind some of its assumption on BoE rates and this could leave the pound vulnerable in the spring and early summer.”
“Given our view that the USD will be buoyed as Fed tightened commences, we see risk that cable could dip below the 1.30 level in the middle of the year.”
- US dollar remains strong across the board following Fed’s meeting.
- Mexican peso under pressure amid risk aversion.
- USD/MXN bullish, next resistance at 20.85.
The USD/MXN soared to 20.80, reaching the highest level in five weeks earlier on Thursday, boosted by a stronger US dollar across the board. The greenback is rising sharply on the back monetary policy expectations from the US.
On Wednesday, the Fed opened the doors to rate hike in March and more during the next year. The more “hawkish” than expected tone from Chair Powell triggered sharp moves and hit emerging market currencies. So far, the Mexican peso is not the most affected. The positive tone in Wall Street with the Dow Jones up by 0.98% is helping the MXN.
The fundamental perspective supports the dollar with US yields moving to the upside, and a caution tone prevailing in global equity markets. The Bank of Mexico is expected to hike rates again offsetting somewhat Fed’s boost to the USD/MXN.
From a technical perspective, the bias in USD/MXN points to the upside. A break under 20.60 (uptrend line) should alleviate the bullish tone. The next support stands at 20.52, followed by 20.40. The 20.85/90 barrier is a strong area that if broken, would clear the way for a return above 21.00.
Technical levels
- WTI hit fresh multi-year highs above $88.00 per barrel recently, breaking above last week’s highs.
- Profit-taking has since seen WTI drop back into the mid-$86.00s, but oil holds onto decent on the week gains.
- Positive risk appetite and ongoing geopolitical and OPEC+ supply concerns are an ongoing source of support that might limit downside.
Crude oil prices have been on the back foot in recent trade amid profit-taking after they plowed to fresh multi-year highs. Front-month WTI futures surpassed the $88.00 level for the first time since October 2014 in the last few hours, finally managing to surpass last week’s highs just under $88.00 after failing on Wednesday in wake of the hawkish Fed meeting. However, profit-taking in the last few minutes has seen WTI give up its earlier session gains and slip back into the mid-$86.00s, where it trades down by slightly more than 50 cents on the day. At current levels near-$86.50, oil is trading well within recent intra-day ranges and still holds onto gains of about $1.75 on the week and is more than $4.50 up from earlier weekly lows.
Risk appetite has broadly taken a turn for the better on Thursday, with the S&P 500 up about 1.5% on the session, which (prior to the profit-taking) had been offering some support to crude oil prices. Meanwhile, according to market commentators and analysts, ongoing OPEC+ supply concerns and the tense geopolitical backdrop continue to offer support to the oil complex. After the US and NATO issued a formal response to Russian security requests (essentially rejecting demands to rule out Ukraine ever joining NATO and reduce their Eastern European military presence), global markets await Russia’s next move.
According to Reuters, tensions between NATO/Russia/Ukraine have been “fanning fears of disruption of energy supplies to Europe”. “A more pronounced price slide is being prevented by the Ukraine crisis, as there are still concerns that Russian oil and gas deliveries could be hampered in the event of a military escalation,” analysts at Commerzbank said. Meanwhile, oil market analysts remain concerned about the struggles faced by smaller OPEC+ producers in lifting oil output. Sources have indicated the cartel plans to hike output again in March by 400K barrels per day. OPEC+ supply and geopolitical concerns shielded oil prices this week from bearish US inventory data, which showed a surprise 2.4M barrel inventory build last week.
- Pending Home Sales saw a larger than expected 3.8% MoM drop in December.
- There was no discernable immediate market reaction to the data.
Pending Home Sales in the US fell by 3.8% on a monthly basis in December following November's 2.3% decline (revised lower from a 2.2% decline), data published by the US National Association of Realtors showed on Thursday. That was well below expectations for a decline of 0.2% MoM. The Pending Home Sales Index fell to 117.7 in December from 122.3 (downwardly revised from 122.4) in November.
Market Reaction
There was no discernable immediate market reaction to the data.
- DXY comes under some pressure near 97.30.
- US flash Q4 GDP figures came in above estimates.
- Weekly claims rose in line with expectations by 260K.
After climbing as high as the 97.30 region, the greenback now gives away some gains and recedes to the 97.00 neighbourhood when gauged by the US Dollar Index (DXY).
US Dollar Index in fresh cycle tops
The demand for the dollar accelerated on Thursday and propelled the index to levels last visited back in July 2020 further north of the 97.00 barrier.
The hawkish bias from Chairman Powell at his press conference post the FOMC meeting on Wednesday prompted some repricing of the Fed’s rate path among investors and sponsored fresh inflows into the buck on Thursday.
Also collaborating with the intense upside bias in the dollar, preliminary figures of the US GDP now see the economy expanding more than expected 6.9% in Q4. On the not-so-bright side, headline Durable Goods Orders contracted 0.9% from a month earlier in December.
US Dollar Index relevant levels
Now, the index is gaining 0.57% at 97.02 and a break above 97.26 (2022 high Jan.27) would open the door to 97.80 (high Jun.30 2020) and finally 98.00 (round level). On the flip side, the next down barrier emerges at 96.00 (55-day SMA) seconded by 95.41 (low Jan.20) and then 94.62 (2022 low Jan.14).
- European equities rise, while US futures point to a higher open, reflecting an upbeat market.
- The Loonie holds its ground versus the greenback, which marches firmly with its DXY above 97.00, the first time since July 2020.
- USD/CAD upward biased, as long as the spot remains above the 100 and the 200-DMA.
As the North American session begins, the USD/CAD barely advances after two hawkish holds by the Bank of Canada and the Federal Reserve. At the time of writing, the USD/CAD is trading at 1.2661, up 0.01%. Risk sentiment is upbeat, portrayed by European equity indices trading in the green, while US futures point to a higher open.
The BoC and the Fed delivered a “hawkish” hold
On Wednesday, the Bank of Canada (BoC) and the Federal Reserve (Fed) held their first monetary policy meeting of 2022.
The BoC was the first to hit the stage, which held the overnight rate at 0.25%, as widely expected. However, the Canadian central bank noted that economic slack “has been absorbed,” signaling that a March hike could be possible.
Analysts at TD securities mentioned that “while today’s decision came as a surprise, it does not change our conviction that rates are headed to 1.00% by mid-2022. Furthermore, upcoming meetings are now live for balance sheet runoff with the updated guidance.”
Meanwhile, the Fed kept rates unchanged at the 0 to 0.25% range later in the day. However, it emphasized the need to normalize the economy and noted that the central bank might raise interest rates “soon.” Although the monetary policy statement fell short of hawkishness, Fed’s Chair Powell press conference underpinned the greenback and sent stocks in a free fall.
Powell said that “…the committee is of a mind to raise the federal funds rate at the March meeting assuming that the conditions are appropriate for doing so.”
In the meantime, the US Dollar Index, a gauge of the greenback’s value versus a basket of six rivals, rallies 1.26%, sitting at 97.156, a level last reached on July 7, 2020, underpinned by rising US T-bond yields, with the 10-year note sitting at 1.814%.
Despite broad US dollar strength across the board, the CAD has been able to cap any upwards move, due to higher crude oil prices, with Western Texas Intermediate (WTI) rising 1%, trading at $88.22.
The US economic docket featured Initial Jobless Claims for the week ending on January 22, fell to 260K from 286K in the previous week, showing the labor market’s resilience after two consecutive weeks of increases. Meanwhile, the Gross Domestic Product (GDP) for Q4 rose by 6.9%, crushing 5.5% expectations.
USD/CAD Price Forecast: Technical outlook
The USD/CAD daily chart depicts the upward bias of the pair. The longer time-frame daily moving averages (DMAs) reside below the spot price, while the 50-DMA is at 1.2708, acting as resistance. The Relative Strength Index (RSI), an oscillator that marks overbought/sold conditions, is at 51, aiming higher, supporting the bullish bias.
To the upside, the first resistance would be the aforementioned 50-DMA at 1.2708. A breach of the latter would expose the January 6 cycle high at 1.2813.
Tensions between Russia, on the one hand, and Ukraine and the US and Europe on the other hand, are building. Strategists at ABN Amro have identified four different scenarios, with the most negative assuming a halt of Russian exports of energy products such as natural gas, liquified natural gas (LNG) and/or oil.
The status quo (75% likelihood)
“We expect the situation in the energy markets to remain unchanged. Nevertheless, in this scenario, natural gas prices stay elevated for a longer period of time as the markets continue to be tight, at least until the spring of 2023. In the event of a harsh winter, either in Europe or in Asia or both, pressure would increase on the LNG markets. However, these extra price gains will probably disappear as soon as the cold period is over.”
A de-escalation leading to normalisation of markets (15% likelihood)
“Energy markets would start to normalise. There will be enough gas supply available for consumers in Europe in the course of 2022. Natural gas prices would normalize towards the pre-2021 levels of the low EUR 20s/MWh or even lower as soon as the ongoing tight market conditions for this winter are over.”
Tensions worsen, Russia halts gas exports to Europe (5-10% likelihood)
“With no short-term alternatives to fully replace Russian gas exports towards Europe, energy supply would need to be rationed, in particular for industry. In addition, prices of natural gas would jump significantly higher, and reach new record highs for a large part of the forward curve. The TTF monthly contracts could trade above EUR 200/MWh for an extended period, with peak prices significantly higher. As an indirect effect, prices of electricity would jump higher throughout the whole of Europe.”
An even bigger escalation would also affect oil markets (<5% likelihood)
“Russia would decide to halt oil exports towards Europe. Such a shift in the oil markets would lead to higher oil prices. Oil prices would be trading above $100/bbl and in case of serious supply worries even head for a new test of the all-time high ($149/bbl). Due to tighter market conditions, this situation could hold for the rest of the year.”
- AUD/USD is trading just above its lowest levels since early December near 0.7070 as the dollar remains firm.
- The buck has been boosted across the board by Wednesday’s hawkish Fed and Thursday’s strong US Q4 GDP numbers.
- With major technical support having been cleared, bears will be eyeing a test of 2021 lows near 0.7000.
After hitting its lowest levels since early December just above the 0.7060 mark in recent trade, AUD/USD has continued to trade heavy and at current levels close to 0.7070, trades lower by about 0.6% on the day. The Aussie’s losses are broadly in line with the losses being experienced by most of its non-USD G10 peers, with the major theme driving FX markets on Thursday being post-hawkish Fed dollar strength. Adding to the US dollar’s tailwinds in recent trade was a substantially firmer than expected first estimate of Q4 2021 GDP growth of 6.9% annualised during the quarter, well above the median forecast for 5.5%.
A new poll showing a hawkish shift in investor expectations for RBA policy was unable to shift AUD or distract from post-hawkish Fed US dollar flows. According to the poll, the median economist expectation for when the RBA will implement its first post-pandemic rate hike will be in November of this year, significantly earlier than the central bank’s current guidance for late-2023/2024. Meanwhile, 17 of 22 economists also predicted that the RBA would axe its bond-buying programme in its entirety on its February first meeting next week.
Looking ahead to the rest of the week, with the Fed meeting, US GDP figures, and Australia Consumer Price Inflation data in the rear-view mirror, things should be calmer for the rest of the week from an economic standpoint. AUD/USD should still keep an eye on Friday’s US December Core PCE inflation data, but the main theme for the rest of the week will be USD flows as investors digest the latest Fed meeting and risk appetite. The latter has shown signs of improvement on Thursday, not least helped by more conciliatory rhetoric from the Russians on Ukraine. Nonetheless, with AUD/USD having cleared the last major area of support ahead of sub-0.7000 2021 lows in the 0.7080s, the bears may have the upper hand going into the weekend.
The GBP/USD picture is again looking firmly bearish after the early-week break below the mid 1.34 area. Economists at Scotiabank spot support for the cable at the mid-1.33s before the figure mark.
Resistance is located at the 1.34 area
“A continued decline should find support at the mid-1.33s before the figure mark.”
“GBP/USD is rushing from overbought as recently as two weeks ago toward oversold in the next few days if the current trend continues.”
“Resistance is the 1.34 area followed by 1.3435/50.”
Gold is already down more than 1% on a daily basis and trades below $1,800 for the first time since January 10.
Developing story...
EUR/USD edges under 1.12 after the Federal Reserve hawkish message. Economists at Scotiabank note that the world’s most popular currency pair could slide below 1.11 towards the 1.10 level.
Escalating tensions with Russia will remain a headwind
“Wednesday’s decision by the Fed that probably tees up more rate hikes than markets are expecting reinforces our expectation that the EUR will aim for a test of 1.10 soon.”
“Escalating tensions with Russia will remain a headwind as will the near-term uncertainty in Italian politics.”
“The EUR now faces very limited support markers until 1.11 (psychological) and then firmer support at 1.10.”
- EUR/USD accelerates losses to the 1.1130 area.
- US flash GDP surprised to the upside in the fourth quarter.
- Claims rose by 260K, Durable Goods Orders down 0.9% MoM.
The selling pressure around the single currency picks up extra pace and drags EUR/USD to fresh lows in the proximity of 1.1130 on Thursday.
EUR/USD weaker on upbeat US data
EUR/USD remains well entrenched into the negative territory on Thursday, as the leg lower intensified pari passu with investors’ readjustment to the recent hawkish message from the FOMC and Chair Powell.
In the meantime, the dollar remains well bid and trading in fresh cycle highs when measured by the US Dollar Index (DXY) despite the mixed performance in US yields so far.
Further legs to the buck came after flash GDP figures showed the US economy is seen expanding at an annualized 6.9% in the October-December period. Additional releases saw headline Durable Goods Orders contracting at a monthly 0.9% in December and Initial Claims increasing by 260K in the week to January 22.
EUR/USD levels to watch
So far, spot is losing 0.79% at 1.1152 and faces the next up barrier at 1.1313 (55-day SMA) seconded by 1.1369 (high Jan.20) and finally 1.1456 (100-day SMA). On the other hand, a break below 1.1134 (2022 low Jan.27) would target 1.1100 (round level) en route to 1.1000 (psychological level).
The Canadian dollar lags despite hawkish Bank of Canada (BoC) prospects. But economists at Scotiabank do not expect the loonie to suffer significant losses.
Scope for decent CAD gains over the rest of the year
“We still rather see limited downside for the CAD versus the USD and scope for decent gains over the rest of the year on the basis of monetary policy prospects.”
“The USD’s close above the 1.2640/45 area yesterday nullifies the near-term, technically bearish outlook for funds now, we think, but weak trend momentum argues against an extended move up in the USD – for now, at least.”
“We spot support now at 1.2645/50 and resistance at 1.2725.”
- GBP/USD witnessed aggressive selling on Thursday and dropped to over a one-month low.
- The post-FOMC strong USD rally remained uninterrupted after mixed US macro releases.
- The bias seems tilted in favour of bearish traders and supports prospects for further losses.
The GBP/USD pair maintained its heavily offered tone around the 1.3365 area, or the lowest level since December 23 and had a rather muted reaction to mixed US macro data.
According to the first estimate released by the US Bureau of Economic Analysis this Thursday, growth in the world's largest economy accelerated to a 6.9% annualized pace during Q4 2021. This was well above consensus estimates pointing to a reading of 5.5% and overshadowed weaker than expected US Durable Goods Orders.
This comes after the Fed on Wednesday reaffirmed market expectations for an eventual lift-off in March and did little to dent the strong bullish sentiment surrounding the US dollar. Apart from this, the UK political turmoil undermined the British pound and continued exerting heavy downward pressure on the GBP/USD pair.
Meanwhile, Thursday's fall below the 1.3400 mark validated this week's bearish break through the 100-day SMA and might have already set the stage for a further depreciating move. The negative outlook is reinforced by bearish technical indicators on the daily chart, which are stall far from being in the oversold territory.
Nevertheless, the fundamental backdrop and the technical set-up supports prospects for an extension of the recent sharp pullback from the vicinity of mid-1.3700s. Hence, a subsequent slide towards testing the next relevant support, around the 1.3320-1.3315 region, remains a distinct possibility amid sustained USD buying.
Technical levels to watch
- There were 260K initial claims in the week ending on January 25, in line with expected.
- The dollar rallied, though that was more to do with strong GDP figures.
There were 260,000 initial claims for unemployment benefits in the US during the week ending January 22, data published by the US Department of Labor (DoL) revealed on Thursday. This reading followed last week's print of 290,000 (revised up from 260,000) and was in line with consensus market expectations for 260,000. Continued Claims rose slightly more than expected to 1.675M in the week ending on January 15 from 1.624M the week prior (revised lower from 1.635M) and was slightly above the 1.65M expected. The insured unemployment rate remained unchanged at 1.2%.
Market Reaction
In wake of the latest US data dump that saw GDP growth for Q4 come in much stronger than anticipated, the US dollar has been kicking higher, with the DXY recently crossing into fresh daily/multi-month highs in the 97.20s.
- Core Durable Goods grew at 0.4% MoM in December, in line with expected.
- The dollar rallied, though that was more to do with strong GDP figures released at the same time.
According to the latest release by the US Census Bureau, US Durable Goods Orders fell by 0.9% MoM in December compared to market expectations for a 0.5% decline in sales. The MoM pace of growth in Core Durable Goods Orders was in line with expectations at 0.4%, marking a deceleration from last month's 1.1% reading (revised up from 0.8%).
Market Reaction
In wake of the latest US data dump that saw GDP growth for Q4 come in much stronger than anticipated, the US dollar has been kicking higher, with the DXY recently crossing into fresh daily/multi-month highs in the 97.20s.
- US Real GDP grew at 6.9% annualised in Q4, well above the expected 5.5% pace.
- The US dollar is pushing to fresh multi-month highs as a result, with the data underpinning hawkish Fed bets.
US Real GDP grew at an annualised pace of 6.9% in Q4 2021, well above the median economist forecast for a pace of growth of 5.5%, according to the first estimate released by the US Bureau of Economic Analysis on Thursday. That marked a sharp acceleration from Q3's 2.3% QoQ pace of growth. The GDP Price Index, which measures the annualised change in the price of all goods and services included in the GDP calculations, rose at a pace of 7.0% in Q4, above market expectations for a 6.0% reading. For the full year 2021, real US GDP growth was 5.7%, the strongest since 1984.
Market Reaction
In wake of the latest US data dump that saw GDP growth for Q4 come in much stronger than anticipated, the US dollar has been kicking higher, with the DXY recently crossing into fresh daily/multi-month highs in the 97.20s. The latest GDP figures will likely underpin hawkish Fed bets.
- USD/JPY gained strong follow-through traction on Thursday and shot to over a two-week high.
- The post-FOMC strong USD rally remained uninterrupted and remained supportive of the move.
- Technical buying above the key 115.00 mark further contributed to the ongoing bullish run-up.
The USD/JPY pair continued scaling higher heading into the North American session and shot to over a two-week high, around the 115.25 region in the last hour.
The post-FOMC strong US dollar buying interest remained unabated on Thursday, which, in turn, pushed the USD/JPY pair higher for the second successive day on Thursday. In fact, the key USD Index jumped to the highest level since July 2020 and remained well supported by the prospects for a faster policy tightening by the Fed.
It is worth recalling that the Fed on Wednesday indicated that it would likely begin hiking interest rates in March. In the post-meeting press conference, Fed Chair Jerome Powell kept the door open for a 50 basis-points rate hike move in March. This was seen as a key factor that continued acting as a tailwind for the greenback.
Apart from this, the widening of the US-Japanese government bond yield differential, along with a goodish rebound in the equity markets drove flows away from the safe-haven Japanese yen. This further contributed to the strong intraday move up for the USD/JPY pair, taking along some trading stops placed near the 115.00 mark.
Hence, the ongoing positive momentum could further be attributed to some technical buying, though overbought RSI (14) on hourly charts warrants caution for bullish traders. Market participants now look forward to the US macro releases – Advance US Q4 GDP and Durable Goods Orders – for a fresh trading impetus.
The US economic docket also features the release of the Weekly Initial Jobless Claims and Pending Home Sales data, which along with the US bond yields, will influence the USD price dynamics. Apart from this, traders will take cues from the broader market risk sentiment for some short-term opportunities around the USD/JPY pair.
Technical levels to watch
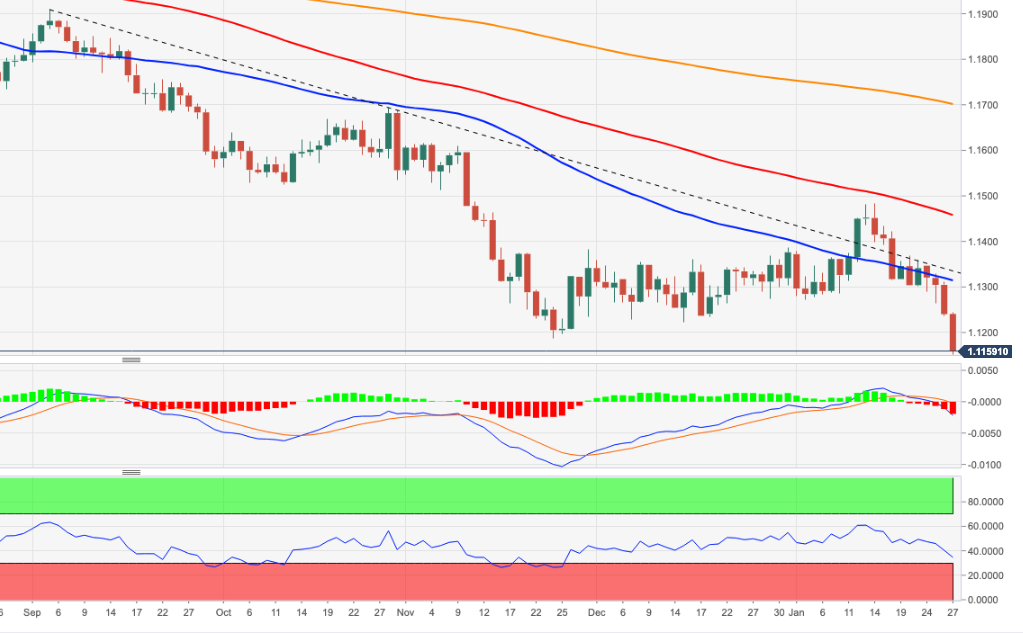
- EUR/USD collapses to levels last seen in June 2020 near 1.1150.
- Further downside could well see 1.10 retested in the near/medium term.
EUR/USD sinks to the mid-1.1100s, area last visited back in June 2020, on the back of the relentless move higher in the US dollar.
Further downside appears likely in light of the ongoing price action. Against this, the next support could turn up at the round levels at 1.1100 and 1.1000, all ahead of May 2020 low at 1.0766 (May 7).
Extra losses in the pair remains well on the cards as long as it remains capped by the 4-month resistance line, today around 1.1340.
In the longer run, the negative outlook is seen unchanged below the key 200-day SMA at 1.1700.
EUR/USD daily chart
Do changes in gold and Bitcoin prices contain useful information? Analysts at Natixis seek to determine whether changes in gold or Bitcoin prices provide information on investors’ perception of future monetary policy, future inflation, future share price movements and dollar’s exchange rate.
Gold and Bitcoin price have a stable correlation only with monetary policy
“We find for the gold price a significant correlation with long-term interest rates (negative) in the US and the OECD, the monetary base (positive) in the US and the OECD, dollar’s exchange rate, to a lesser degree (a depreciation drives up the gold price) but not the stock market index or inflation.”
“For the Bitcoin price, we find a significant correlation with long-term interest rates (negative) in the US and the OECD, rhe monetary base (positive) in the US and the OECD but not with the stock market index, inflation or the dollar’s exchange rate.”
- EUR/GBP has slipped back to the 0.8330s with bears eyeing a retest of recent multi-year lows under 0.8310.
- FX markets are trading on central bank divergence post-hawkish Fed meeting, hence GBP outperformance versus the euro.
EUR/GBP fell to fresh weekly lows in the 0.8330s on Thursday, with bears eyeing a retest of recent multi-year lows printed last week just under 0.8310 and a push lower towards the late-2019/early-2020 lows in the 0.8280 area. Risk appetite took a knock on Wednesday after a hawkish Fed policy meeting where the bank teed up the prospect of multiple rate hikes in 2022 and Fed Chair Jerome Powell refused to rule out a 50bps move in March. Normally, that might push EUR/GBP higher given sterling’s higher beta to broad risk appetite, but the Fed meeting appears to have encouraged FX markets to trade more on central bank policy divergence.
That might explain why EUR/GBP has continued to push lower. The BoE is expected to remain ahead of the Fed in terms of policy normalisation with a second post-pandemic rate hike in February, while the ECB is still yet to substantially taper its QE buying, let alone hike rates. Better than expected retail sector survey data for January from the Confederation of British Industry on Thursday may also be helping sterling outperform the euro. At the very least, the positive UK data appears to have negated a not as bad as forecast German GfK Consumer Sentiment reading for February.
Looking ahead, the much-anticipated Sue Gray report on alleged parties in Downing Street which at the time broke lockdown rules will be released later this week and could further ramp up pressure on UK PM Boris Johnson to resign. Most analysts continue not to expect any follow-through on the pound. Otherwise, other key events to watch this week include flash German, Spanish and French Q4 2021 GDP growth readings on Friday, which could have a moderate impact on ECB policy expectations.
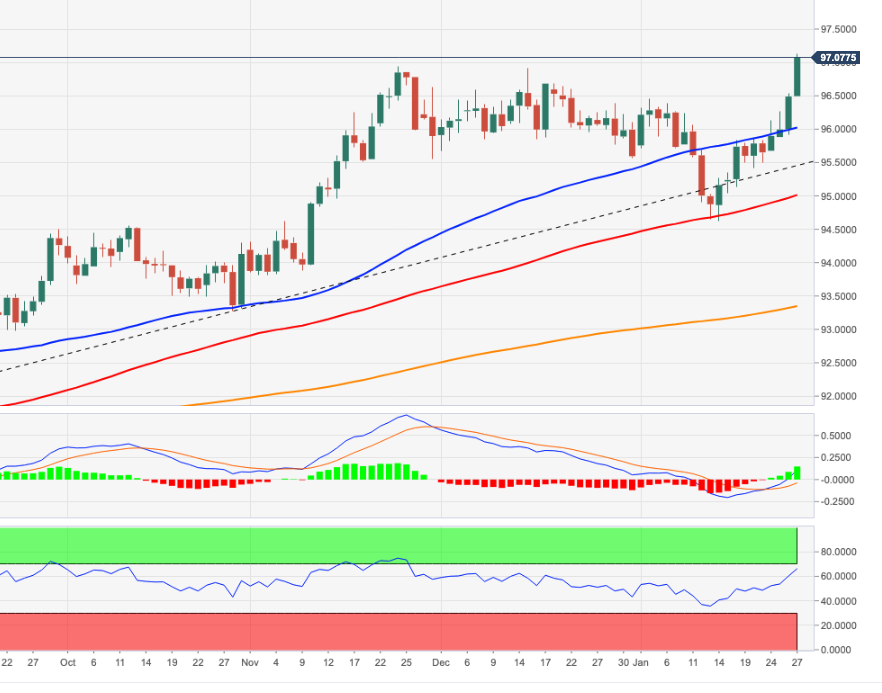
- DXY pushes higher and clinches new tops past the 97.00 mark.
- The June 2020 high at 97.80 should come next for dollar bulls.
DXY extends the advance for yet another session and records new peaks in levels last seen in the summer 2020 further north of the 97.00 barrier on Thursday.
The intense upside in the dollar left behind the previous tops and surpassed the 97.00 yardstick, allowing for the continuation of the rebound for the time being. That said, the door now remains open to a potential move to the June 2020 peak at 97.80 (June 30) ahead of the round level at 98.00.
In the short-term horizon, the upside pressure remains intact while above the 4-month line around 95.45. Looking at the broader picture, the longer-term positive stance in the dollar remains unchanged above the 200-day SMA at 93.32.
DXY daily chart
- Gold has pulled back to around $1810 from Wednesday’s highs above $1850 as markets price in a more hawkish Fed.
- Traders should watch for a break of a recent upwards trend channel that could trigger a drop towards the $1780s.
After pulling back sharply on Wednesday from the $1850 highs to a sub-$1820 close amid hawkish post-Fed meeting vibes, spot gold (XAU/USD) prices have continued to decline, albeit at a steadier pace on Thursday. XAU/USD is currently trading close to the $1810 level, down a further 0.5% and now down about 2.3% from Tuesday’s highs above $1850. Gold was pressured by the DXY broking out to fresh 19-month highs above the 97.00 level, and as major US front-end yields (2s, 5s) broke out to fresh cycle highs as markets moved to price in more aggressive Fed hikes.
The Fed’s monetary policy statement, which indicated a likely March hike, and decision to hold rates was in line with expectations and didn’t move markets, but Fed Chair Jerome Powell’s press conference was deemed hawkish. Traders noted that Powell did not rule out a significantly faster pace of hikes than currently indicated in the dotplot and did not rule out a 50bps hike in March. Powell also said that, if the Fed had been releasing new forecasts at Wednesday’s meeting, he would have upped his inflation outlook.
As a result, the implied yield on the three-month eurodollar future for December 2022 (a proxy for market expectations for where the Fed funds rate will be) has jumped more than 15bps to close not far below 1.45% from previously under 1.30%. In other words, markets are now pricing five rate hikes in 2022. This shift in pricing seems inline with updated Fed calls from major banks, including Nomura, who see a 50bps hike in March followed by a further four before the end of the year.
Recent breakouts in short-end yields and the DXY suggest a shift in momentum that may see further dollar and yield gains. This may continue to pressure spot gold prices; the safe-haven metal has been in a bullish uptrend in recent weeks and is now probing the lower bounds in the. A break below the $1800 area, which would also mean a break back below the 200 and 50-day moving averages, both of which sit just above $1800, would likely trigger technical selling that might push XAU/USD all the way back to annual lows in the $1780s area. Ahead on Thursday, US data worth watching include the first estimate of Q4 GDP growth and December Durable Goods Orders figures, both out at 1330GMT, as well as some more housing data at 1500GMT. Geopolitics is also worth watching as this has arguably been giving gold a lift in recent weeks.
US Q4 GDP Overview
Thursday's economic docket highlights the release of the Advance fourth-quarter US GDP report, or the first estimate, scheduled at 12:30 GMT. Growth in the world's largest economy is expected to have accelerated to a 5.5% annualized pace during the October-December period, up sharply from 2.3% recorded in the third quarter. Although backwards-looking, the report will provide an insight into how much effect the current wave of Omicron COVID-19 variant had on the US economy.
As Yohay Elam, FXStreet's own Analyst explains: “The US economy is set to complete an impressive recovery in 2021 on a high note. The Delta COVID-19 variant held back America's expansion in the third quarter, and the bounce-back was robust in almost all of the quarter. Omicron came in late, and had a negative impact in December, as retail sales data showed for the final month of 2021.”
How Could it Affect EUR/USD?
Heading into the key release, the US dollar shot to the highest level since July 2020 and remained well supported by the fact that the Fed reaffirmed expectations for an eventual lift-off in March. A stronger-than-expected reading will further fuel speculations about a faster policy tightening cycle and provide an additional boost to the greenback. Conversely, any disappointment is more likely to be overshadowed by rising geopolitical tensions between Russia and Ukraine. This, in turn, suggests that the path of least resistance for the EUR/USD pair is to the downside.
Meanwhile, Eren Sengezer, Editor FXStreet, offered a brief technical outlook for the major: “EUR/USD is trading within a touching distance of the 1.1200 psychological level. In case this support turns into resistance, the pair could face additional bearish pressure and touch its weakest level in 18 months near 1.1180. Below that level, 1.1170 (static support from Jul. 2020) aligns as the next support before sellers can target 1.1100 (psychological level).”
Eren further outlined important technical levels to trade the pair: “1.1250 (static level, former support) now acts as the first technical resistance ahead of 1.1270 (static level, former support) and 1.1300 (psychological level). With the Relative Strength Index (RSI) indicator on the four-hour chart showing extremely oversold conditions below 30, a technical correction could be witnessed in the short term but the bearish bias should stay intact unless the pair reclaims 1.1300.”
Key Notes
• US Fourth Quarter GDP Preview: What have you done for me lately?
• US GDP Preview: Inflation component could steal the show, boost dollar, already buoyed by Russia
• EUR/USD Forecast: Sellers eye fresh 18-month lows below 1.1190
About US GDP
The Gross Domestic Product Annualized released by the US Bureau of Economic Analysis shows the monetary value of all the goods, services and structures produced within a country in a given period of time. GDP Annualized is a gross measure of market activity because it indicates the pace at which a country's economy is growing or decreasing. Generally speaking, a high reading or a better than expected number is seen as positive for the USD, while a low reading is negative.
- EUR/JPY stays under pressure and drops to 2-day low near 128.40.
- The December 2021 low (127.50) emerges as the next support of note.
EUR/JPY resumes the bearish trend and leaves behind Wednesday’s uptick.
Price action in the cross keeps signalling a scenario of lower prices for the time being. Indeed, the weakness around EUR/JPY has intensified following the convincing breakdown of the key 200-day SMA (130.49) earlier in the month, opening the door to a potential drop to the December 2021 low near 127.50 (December 3).
While below the 200-day SMA, the outlook for the cross is expected to remain negative.
EUR/JPY daily chart
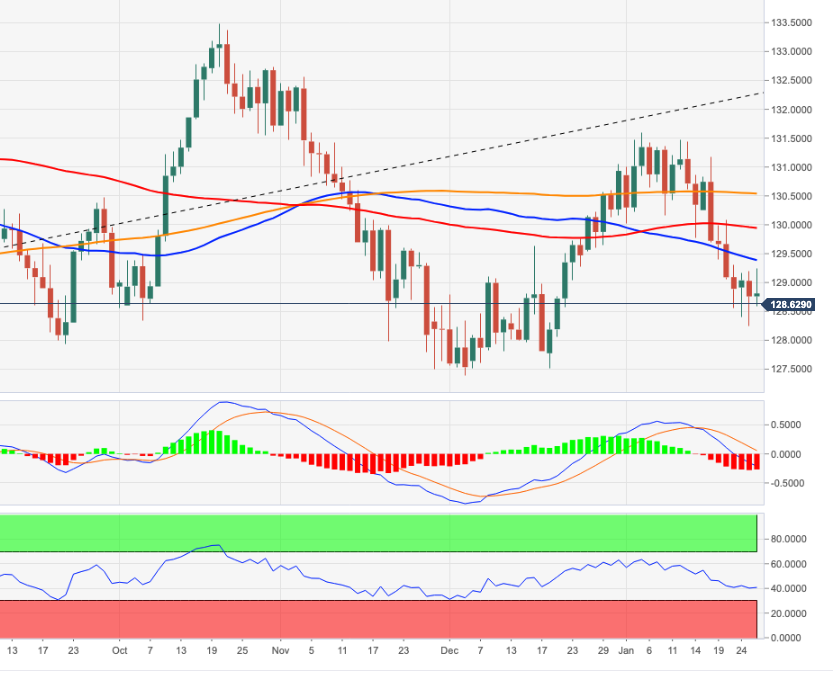
- A combination of supporting factors pushed USD/CHF to a two-month high on Thursday.
- The post-FOMC strong USD buying remained unabated through the mid-European session.
- A recovery in the equity markets undermined the safe-haven CHF and also fueled the move.
The USD/CHF pair jumped to a near two-month high during the mid-European session, with bulls looking to build on the momentum further beyond the 0.9300 mark.
The US dollar built on the overnight hawkish FOMC-inspired strong gains and shot to the highest level since July 2020 amid expectations for a faster policy tightening by the US central bank. In fact, Fed Chair Jerome Powell, answering a question during the post-meeting press conference, kept the door open for a 50 bps rate hike in March. This, in turn, was seen as a key factor that assisted the USD/CHF pair to capitalize on its strong weekly gains and continue scaling higher for the fourth successive day on Thursday.
Meanwhile, an intraday recovery in the equity markets undermined the safe-haven Swiss franc and provide an additional boost to the major. The momentum took along some short-term trading stops placed near the previous monthly swing high, around the 0.9270-0.9275 region. Hence, the bullish momentum could further be attributed to some technical buying and supports prospects for additional gains. Nevertheless, with the latest leg up, the USD/CHF pair has rallied over 200-pips from the 0.9100 mark, or the weekly low.
Market participants now look forward to the US economic docket – featuring the releases of Advance Q4 GDP, Durable Goods Orders, Weekly Jobless Claims and Pending Home Sales. This, along with the US bond yields, will influence the USD price dynamics and provide some impetus to the USD/CHF pair. Apart from this, traders will take cues from the broader market risk sentiment for some short-term opportunities around the major.
Technical levels to watch
- Silver drifted lower for the fifth successive day and dropped to over one-week low on Thursday.
- Some follow-through selling below the $23.00 mark will set the stage for further near-term losses.
- Any attempted recovery move is likely to confront a stiff resistance near the 38.2% Fibo. level.
Silver extended its recent rejection slide from the very important 200-day SMA and witnessed some follow-through selling for the fifth successive day on Thursday. The downward trajectory dragged the white metal to the $23.00 neighbourhood, or a one-and-half-week low during the mid-European session.
The mentioned handle coincides with the 50% Fibonacci retracement level of the $21.43-$24.70 strong move up. Given that technical indicators on the daily chart have just started drifting into the negative territory, a convincing break below will now be seen as a fresh trigger for bearish traders.
Some follow-through selling below last week's swing low, around the $22.80 area, will reaffirm the negative outlook and prompt aggressive technical selling. The XAG/USD might then turn vulnerable to accelerate the fall towards the $22.20 intermediate support en-route the $22.00 round-figure mark.
On the flip side, any meaningful recovery attempt might now confront stiff resistance and remain capped near the 38.2% Fibo. level, around the $23.40-$23.45 zone. Some follow-through buying might trigger a short-covering move towards the $24.00 mark, representing the 23.6% Fibo. level resistance.
Silver daily chart
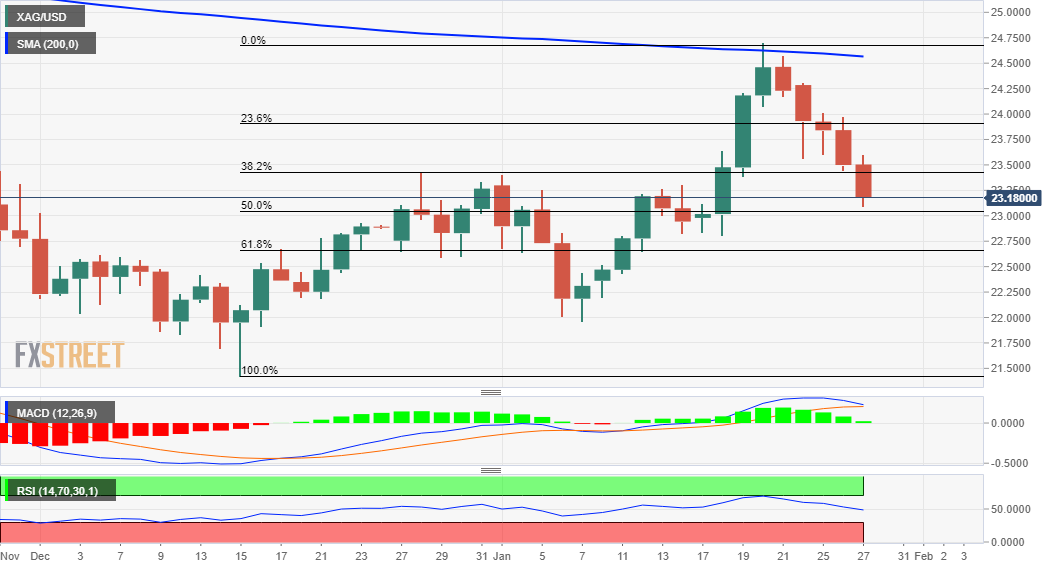
Technical levels to watch
EUR/USD remains under constant bearish pressure on Thursday and trades at its lowest level since June 2020 near 1.1180.
The broad-based dollar strength on the Fed's hawkish policy outlook is causing the pair to extend its slide ahead of high-tier macroeconomic data releases from the US.
Following the Fed's decision to leave the policy settings unchanged, FOMC Chairman Jerome Powell signalled that they will start planning the balance sheet reduction following the first rate hike, which is widely expected to happen in March. Powell further noted that they have "quite a bit of room" to raise rates without hurting the labour market.
According to the CME Group's FedWatch Tool, markets are pricing 66% chance of the Fed hiking its policy rate 50 basis points by May.
The US Dollar Index, which tracks the greenback's performance against a basket of six major currencies, climbed to its highest level in more than 18 months near 97.00.
- Bullish crude oil prices underpinned the loonie and acted as a headwind for USD/CAD.
- The USD build on the post-FOMC strong rally and extended some support to the pair.
- The not so hawkish BoC capped the CAD and supports prospects for additional gains.
The USD/CAD pair maintained its bid tone through the first half of the European session, albeit has retreated a few pips from the daily high and was last seen trading just below the 1.2700 mark.
The pair continued with its struggle to find acceptance above the mentioned handle and witnessed an intraday turnaround from a near three-week high touched earlier this Thursday. Crude oil prices held steady near the seven-year high touched in the previous day amid rising tensions between Russia and Ukraine. This, in turn, underpinned the commodity-linked loonie and acted as a tailwind for the USD/CAD pair.
That said, a combination of factors extended some support and helped limit the downside. The not so hawkish Bank of Canada rate decision on Wednesday kept a lid on any meaningful gains for the Canadian dollar. In fact, the Canadian central bank decided to leave the benchmark interest rate unchanged and disappointed some investors anticipating an imminent start of the tightening cycle amid a surge in domestic inflation.
On the other hand, the Fed reaffirmed market expectations for an eventual lift-off in March. In the post-meeting press conference, Fed Chair Jerome Powell signalled a sustained battle to curb high inflation and triggered a sharp rise in the US Treasury bond yields. This, in turn, pushed the US dollar to the highest level since mid-December and supports prospects for the emergence of some dip-buying at lower levels.
The fundamental backdrop favours bullish traders, though it will be prudent to wait for a sustained strength beyond the 1.2700 mark before positioning for any further gains. Traders now look forward to the US macro data – Advance Q4 GDP, Durable Goods Orders, Weekly Jobless Claims and Pending Home Sales. This, along with the US bond yields, will influence the USD. Apart from this, oil price dynamics should produce some trading opportunities around the USD/CAD pair.
Technical levels to watch
European Central Bank (ECB) policymaker and Slovak central bank Governor Peter Kazimir said on Thursday that inflation in the eurozone is expected to peak in the "nearest months" before starting to decline, as reported by Reuters.
"We see signs of stabilisation in global supply markets," Kazimir further added.
Market reaction
The shared currency is having a difficult time finding demand following these comments. As of writing, the EUR/USD pair was trading at 1.1191, where it was losing more than 0.4% on a daily basis.
GBP/USD has removed with ease support from the 38.2% retracement of the December/January rally at 1.3532/28. Analysts at Credit Suisse see scope for further weakness to the ‘neckline’ to the December base at 1.3376.
Resistance seen at 1.3526
“Cable is testing support from its rising 55-day average at 1.3422, but we see scope for a n overshoot beyond here to the 61.8% retracement at 1.3393, then the ‘neckline’ to the December base at 1.3384/76. We would look for an attempt to hold here. A direct break though would warn of a retest of medium-term support at 1.3189/35.”
“Near-term resistance moves to 1.3470, then 1.3492, with the immediate risk now seen staying lower whilst below 1.3526. A close above here can reassert a choppy range to clear the way for strength back to 1.3556/67 next.”
Although key support has held, analysts at Credit Suisse think it is too early to make the call for an important floor in the S&P 500. The index is set to retest the key cluster of supports at 4213/4164.
Close above 4525 needed to suggest the worst of the sell-off is over
“Whilst we would look for a fresh attempt to hold 4213/4164 the poor momentum picture warns the risk for a break is elevated.”
“Should we see a close below 4164 this would warn of further weakness to 4057 and then we think 3855/15. We would though look for an important floor here though if tested.”
“A close back above the 200-day average and 38.2% retracement of the January sell-off at 4430/50 is seen needed to stabilize the market, but with a close above 4525 needed to suggest the worst of the sell-off is over. Even then, we would expect tough resistance to be found at the 63-day average, currently at 4648 and we would look for this to then cap to define the top of a broad-ranging phase.”
GBP/USD has managed to recover modestly from the monthly low it set at 1.3405 earlier in the session but it's not out of the woods yet. In case buyers fail to defend 1.3400, the pair is likely to extend its slide toward 1.3350, FXStreet’s Eren Sengezer reports.
Next bearish target aligns at 1.3350
“1.3400 (psychological level, Fibonacci 61.8% retracement of the latest uptrend) aligns as first technical support. If this level turns into resistance, the pair could target 1.3350 (static level).”
“On the upside, 1.3440 (middle line of the regression channel) forms the first resistance before the 1.3460/1.3470 area (200-period SMA, Fibonacci 50% retracement).”
- A combination of factors dragged NZD/USD to the lowest level since November 2020.
- The post-FOMC strong USD rally got an additional boost from a sell-off in the equities.
- Oversold RSI assisted the pair to rebound a few pips, though any recovery seems elusive.
The NZD/USD pair remained depressed through the first half of the European session, albeit has managed to recover a few pips from sub-0.6600 levels, or a 15-month low touched earlier this Thursday.
A combination of factors dragged the NZD/USD pair lower for the sixth successive day on Thursday and led to an extension of the recent bearish trajectory witnessed over the past two weeks or so. The post-FOMC US dollar rally remained uninterrupted, which, along with the risk-off impulse in the markets drove flows away from the perceived riskier kiwi.
The Fed on Wednesday reaffirmed market expectations for an eventual lift-off in March, which, in turn, pushed the yield on the 2-year US government bond to the highest level since January 2020. Moreover, the yield on the benchmark 10-year note shot back to the 1.85% threshold and lifted the key USD Index to the highest level since mid-December.
Meanwhile, concerns about a faster policy tightening by the Fed, along with political tensions between Russia and Ukraine, took its toll on the global risk sentiment. This was evident from a slump in the equity markets, which further benefitted the greenback's relative safe-haven status and exerted additional downward pressure on the NZD/USD pair.
That said, oversold RSI (14) on the daily chart assisted the pair to find some support and rebound over 30 pips from the daily swing low, around the 0.6595 region. That said, any meaningful recovery seems elusive amid sustained USD buying. Hence, any further move up might still be seen as a selling opportunity and run the risk of fizzling out quickly.
Market participants now look forward to the US economic releases – Advance Q4 GDP, Durable Goods Orders, Weekly Jobless Claims and Pending Home Sales. This, along with the US bond yields and the broader market risk sentiment, will influence the USD price dynamics and produce some short-term trading opportunities around the NZD/USD pair.
Technical levels to watch
Heading into the quarterly inflation report due to be published by the Turkish central bank (CBRT) this Thursday at 1100 GMT, USD/TRY is extending the previous advance.
At the time of writing, the pair is posting small gains, sitting at the highest levels in a week above 13.60.
The unabated strength in the US dollar is mainly behind USD/TRY’s renewed upside, as bulls continue to cheer the hawkish Fed rhetoric. Fed Chair Jerome Powell hinted at faster rate hikes and balance-sheet reduction this year.
Meanwhile, Turkish central bank Governor Şahap Kavcıoğlu said on Thursday that the forex-protected lira deposit levels are around expected levels.
Additional quotes
“Will see an acceleration in these accounts.”
“Turks need to support de-dollarisation.”
Governor Kavcioglu’s remarks during Thursday’s press conference keep the lira under pressure.
All eyes now remain on Turkey’s first quarterly inflation report, with the country’s consumer inflation at over 36% in December, the highest rate during President Tayyip Erdogan’s 19-year rule.
AUD/USD is falling sharply following the break of its short-term uptrend from December at 0.7129. Analysts at Credit Suisse look for a retest and eventual break of medium-term support at 0.6992/91 – the late 2020 and 2021 lows.
Key resistance seen at 0.7189
“Aussie is set to retest medium-term support at 0.6992/91 – the key lows of late 2020 and 2021. Although this support should again be respected, with an existing major top in place we look for a clear and sustained break in due course. Support would then be seen next at 0.6921 ahead of 0.6832 and then our core and long-held objective of the 50% retracement of the entire 2020/2021 uptrend at 0.6758.”
“Short-term resistance moves to 0.7095, then 0.7123, which we look to now try and cap. We will though look to maintain an immediate negative tactical bias whilst below a cluster of resistances at 0.7167/89, which includes the 55-day average.”
EUR/USD has seen a clear break of support at 1.1272. Economists at Credit Suisse view the corrective phase from late November as now over and look for a resumption of the core downtrend to the 1.1019/02 region.
Resistance is seen moving to 1.1244 initially
“With daily MACD momentum having turned lower again, we maintain our view that the corrective phase is over and core downtrend resumed.”
“We look for a retest of the lows of last November and June/July 2020 at 1.1186/68. We look for this support to now be ideally removed with ease with support then seen next at 1.1046 ahead of our 1.1019/02 main objective – the 78.6% retracement of the 2020/2021 bull trend and top of the base from April/May 2020. We would then look for a fresh phase of consolidation to develop from here.”
“Resistance is seen moving to 1.1244 initially, then 1.1263, with the immediate risk now seen staying directly lower below 1.1299/1.1312.”
- AUD/USD rebounds from monthly lows but downside risks persist.
- The US dollar hovers near one-month top, risk sentiment recovers slightly.
- The aussie eyes daily closing below 0.7088 to extend the downtrend.
AUD/USD has staged a quick rebound from monthly lows of 0.7062 but remains below the 0.7100 barrier.
The US dollar holds onto the post-Fed gains, despite a minor recovery in the risk sentiment, reflective of a bounce in the S&P 500 futures. The futures tied to the S&P 500 index reverse most losses to now trade flat at 4,350.
There is no encouraging news for the risk rebound, although it could mean that investors are adjusting positions ahead of the US Q4 advance GDP release and tech earnings reports.
Technically, AUD/USD is at a make-or-break point, as of writing, trading around the critical daily horizontal support line, aligned at 0.7088.
Bears need a daily closing below the latter to confirm a downside break and fuel a fresh downswing towards the 0.7050 psychological level.
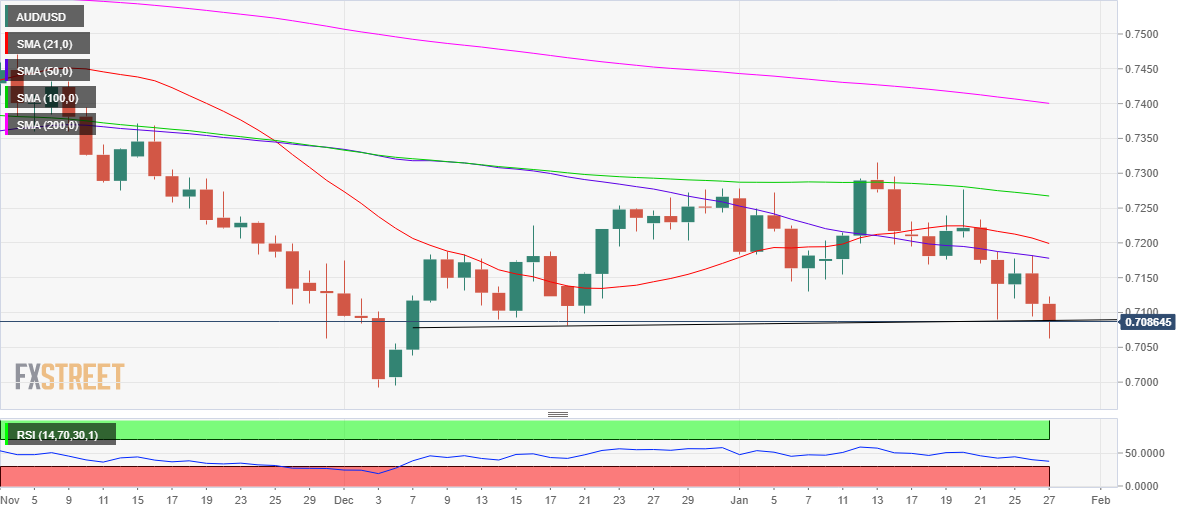
AUD/USD: Daily chart
The next stop for aussie sellers is seen at the December 7 lows of 0.7038, below which the 0.7000 round number comes into play.
The 14-day Relative Strength Index (RSI) looks south below the midline, justifying the bearish outlook.
Alternatively, any recovery will need validation at 0.7100, above which a rally towards the bearish 50-Daily Moving Average (DMA) at 0.7177 cannot be ruled out.
AUD/USD: Additional levels to consider
UOB Group’s Economist Barnabas Gan reviews the latest data from Singapore.
Key Takeaways
“Singapore’s industrial production expanded 15.6% y/y (+4.3% m/m sa) in Dec 2021, surprising market estimates for a milder growth of 12.0% y/y (+0.9% m/m sa). Excluding biomedical manufacturing, industrial production rose 5.0% y/y. Accounting for the latest data, Singapore’s industrial production grew 13.2% for the whole of 2021.”
“Given the strong manufacturing showing in 4Q21, Singapore’s 4Q21 and 2021 GDP growth may likely be revised higher. Full-year GDP growth is expected to be upgraded to 7.3% (from MTI’s advance estimates of 7.2%) in 2021, while 4Q21 GDP growth may be adjusted upwards to 6.2% y/y (from 5.9% y/y).”
“Into 2022, we keep to our view that Singapore manufacturing prognosis remains favourable especially given the strong numbers seen to-date. Our outlook is for full-year manufacturing to grow by an average of 4.0% in 2022. This suggests that despite the high-base growth rate seen in 2021, global trade activity is expected to stay buoyant in the new year.”
- EUR/USD extends the selloff and breaks below 1.1200.
- The greenback gains extra steam following the FOMC event.
- Germany GfK Consumer Confidence improved to -6.7 in February.
Sellers remain well in control of the sentiment around the European currency and drag EUR/USD to fresh YTD lows near 1.1190 on Thursday.
EUR/USD weaker post-FOMC
EUR/USD loses ground for the fourth session in a row on Thursday and approaches the area of the 2021 lows in the 1.1190/85 band, always in response to the firmer tone in the US dollar.
Indeed, the demand for the greenback quickly picked up pace in the wake of the press conference by Chief Powell at the FOMC event on Wednesday.
Indeed, inflows into the buck accelerated after Powell suggested a rate hike in March and left the door open to further hikes at the subsequent meetings this year. It seems to be a matter of how many rate hikes and by how much that investors are expected to be discussing in the next months, putting the debate around the reduction of the balance sheet on the back burner for the time being.
Locally, the German Consumer Confidence measured by GfK improved a tad to -6.7 for the month of February.
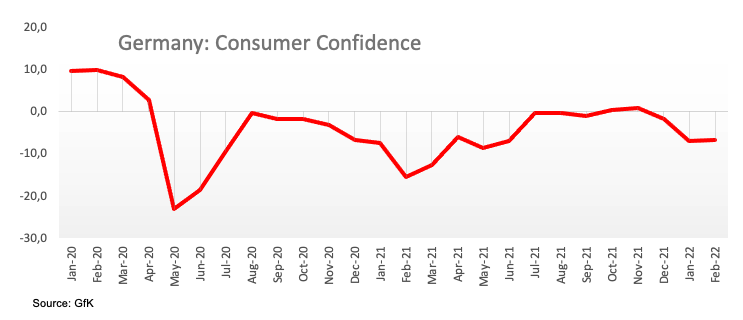
Across the Atlantic, Durable Goods Orders, Pending Home Sales and the flash Q4 GDP figures are due later in the NA session.
What to look for around EUR
EUR/USD sold off and broke below the 1.1200 support for the first time since late December following the hawkish message from Chair Powell on Wednesday. Moving forward, dark clouds seem to be piling up when it comes to the outlook for the pair, particularly in light of the Fed’s imminent start of the tightening cycle vs. the accommodative-for-longer stance in the ECB, despite the high inflation in the euro area is not giving any things of cooling down for the time being. On another front, the unabated advance of the coronavirus pandemic remains as the exclusive factor to look at when it comes to economic growth prospects and investors’ morale in the region.
Key events in the euro area this week: Germany GfK Consumer Confidence (Thursday) – Germany Advanced Q4 GDP, EMU Final Consumer Confidence (Friday).
Eminent issues on the back boiler: Asymmetric economic recovery post-pandemic in the euro area. ECB stance/potential reaction to the persistent elevated inflation in the region. ECB tapering speculation/rate path. Italy elects President of the Republic in late January. Presidential elections in France in April.
EUR/USD levels to watch
So far, spot is losing 0.39% at 1.1197 and faces the next up barrier at 1.1314 (55-day SMA) seconded by 1.1369 (high Jan.20) and finally 1.1457 (100-day SMA). On the other hand, a break below 1.1193 (2022 low Jan.27) would target 1.1186 (2021 low Nov.24) en route to 1.1168 (low Jun.11 2020).
- USD/JPY added to the post-FOMC strong gains and continued scaling higher on Thursday.
- The overnight rally in the US bond yields and a sustained USD buying remained supportive.
- Bulls seemed unaffected by the risk-off mood, which tends to benefit the safe-haven JPY.
The USD/JPY pair jumped to a one-and-half-week high during the early part of the European session and was last seen trading around the key 115.00 psychological mark.
The pair added to the previous day's post-FOMC bullish momentum and scaled higher for the second successive day on Thursday, also marking the third day of a positive move in the previous four. The Fed reaffirmed market expectations for an eventual lift-off in March and pushed the US dollar to the highest level since mid-December. This, in turn, was seen as a key factor that provided a strong boost to the USD/JPY pair.
Moreover, the markets have been pricing in a total of four hikes in 2022, which was evident from the overnight rally in the US Treasury bond yields. In fact, the yield on the benchmark 10-year US government bond jumped to 1.85%. Conversely, the 10-year JGB remained near zero due to the Bank of Japan's yield curve control policy. The resultant widening of the US-Japanese yield differential also acted as a tailwind for the USD/JPY pair.
Meanwhile, the prospects for a faster policy tightening by the Fed, along with political tensions between Russia and Ukraine, took its toll on the global risk sentiment. This was evident from a slump in the equity markets. This, however, did little to revive demand for the safe-haven Japanese yen or hinder the USD/JPY pair's strong move up. The price action favours bullish traders and supports prospects for additional gains.
Market participants now look forward to the US economic releases – Advance Q4 GDP, Durable Goods Orders, Weekly Jobless Claims and Pending Home Sales. This, along with the US bond yields, will influence the USD price dynamics and provide a fresh impetus to the USD/JPY pair. Apart from this, traders might take cues from the broader market risk sentiment to grab some short-term opportunities around the major.
Technical levels to watch
Brent Oil has broken above the highs of 2018 and last October affirming the prevalence of upside momentum. Strategists at Société Générale expect Brent to extend its race higher towards next projections at $92.50 and $95.00/96.30.
Signals of pullback are still not visible
“Weekly MACD has developed negative divergence recently however signals of pullback are still not visible.”
“$85.00/84.70, the 23.6% retracement from December should be an important support near-term. Holding above this, the up move is likely to persist towards next projections at $92.50 and $95.00/96.30.”
- Gold price remains pressured amid firmer US dollar and Treasury yields.
- Fed almost confirms a March rate hike, also balance-sheet reduction this year.
- Gold Price Forecast: XAU/USD bears await US Q4 GDP for the next leg lower
Gold price is pressured by the hawkish Fed’s rhetoric-driven sell-off, as Jerome Powell and Company explicitly said there is room for interest rate hikes while adding that the plans for the balance-sheet reduction are in the offing. The US Treasury yields continue taking advantage of the Fed’s hawkishness, underpinning the dollar bulls at gold’s expense. Further, expectations of aggressive Fed tightening killed the appetite for riskier assets such as stocks and boosted the greenback’s safe-haven demand, exerting additional bearish pressure on gold price. The focus now shifts towards the US top-tier economic releases for fresh trading opportunities in gold.
Read: Fed fallout set to run further
Gold Price: Key levels to watch
The Technical Confluences Detector shows that the gold price is attempting a bounce after having found support at the convergence of the SMA200 four-hour and pivot point one-week S1 at $1,809.
In doing so, the bright metal has cleared the Fibonacci 23.6% one-month at $1,813 to take on the previous day’s low of $1,815.
Acceptance above the latter will call for a fresh rally towards $1,822, the meeting point of the Fibonacci 61.8% one-week and SMA100 four-hour.
Further up, the Fibonacci 38.2% one-day at $1,828 will guard the bullish attempts.
On the flip side, if the abovementioned $1,809 support is breached on a sustained basis, then sellers will look to test a powerful cushion around $1,805.
That level is the confluence of the previous week’s low, SMA200 one-day and SMA50 one-day.
The last line of defense for gold buyers is seen at the Fibonacci 38.2% one-month at $1,800.
Here is how it looks on the tool
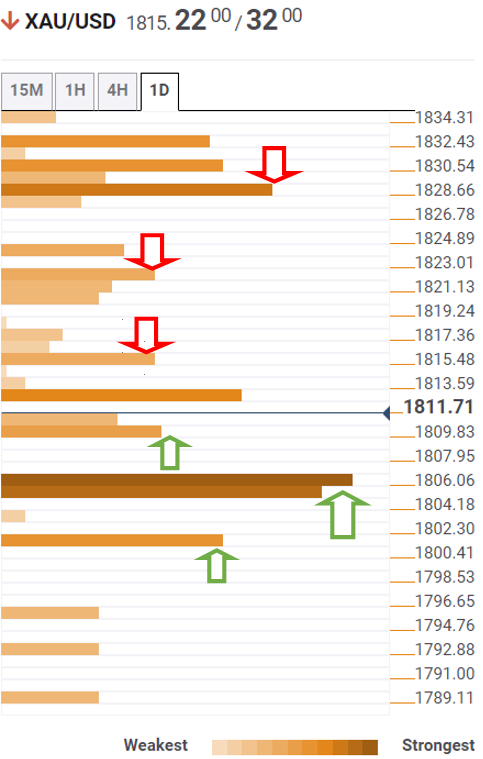
About Technical Confluences Detector
The TCD (Technical Confluences Detector) is a tool to locate and point out those price levels where there is a congestion of indicators, moving averages, Fibonacci levels, Pivot Points, etc. If you are a short-term trader, you will find entry points for counter-trend strategies and hunt a few points at a time. If you are a medium-to-long-term trader, this tool will allow you to know in advance the price levels where a medium-to-long-term trend may stop and rest, where to unwind positions, or where to increase your position size.
EUR/USD continues to edge lower toward 1.1200. Economists at Société Généraleexpect the world’s most popular currency pair to extend its decline towards 1.1185.
Retest of 1.1185 not ruled out
“There is a risk of further decline towards recent trough and multiyear trend line near 1.1185/1.1160 and 1.1040.”
“First hurdle is at 1.1295.”
The spotlight falls in South Africa on Thursday where the South African Reserve Bank is expected to hike the policy rate to 4.00% from 3.75%. USD/ZAR has rebound from a multi month ascending trend line near 15.07 towards 15.60. A break above here would denote further upside potential, economists at Société Générale report.
Risk of deeper downtrend towards 200-DMA at 14.85 on a break under 15.07
“We pencil in a 25bp increase by the SARB to 4.0% and hawkish guidance is likely to be maintained. The scope for a hawkish surprise is small unless rates rise 50bp, which is unlikely considering the resilience of the rand compared to others in EMEA.”
“Overcoming 15.60, the 38.2% retracement from November and the daily Kijun line resistance will be crucial to denote an extended bounce towards daily Ichimoku cloud at 15.87 and recent peak of 16.35.”
“In case the support at 15.07 gets violated, there would be a risk of deeper downtrend towards 200-DMA at 14.85.”
The US dollar continues to strengthen following more hawkish than expected Federal Reserve policy update. Economists at MUFG Bank expect the greenback to stay strong in the next months after hawkish comments from Fed Chair Jerome Powell.
Fed Chair Powell opens door to even faster rate hikes
“Powell dropped guidance that rate hikes were likely to be ‘gradual’. At the same time, Powell emphasized that the US economy was ‘in a very different place’ than it was in 2015 when it started the last tightening cycle with stronger growth, a stronger labour market and much higher inflation. It suggests that the Fed is planning to raise rates faster than in the previous tightening cycle.”
“The hawkish policy update from the Fed supports our outlook for the USD to strengthen further at the start of this year and will continue to provide a more challenging backdrop for riskier assets and currencies.”
AUD/NZD trended lower over much of 2021. According to economists at Westpac the Reserve Bank of Australia (RBA) should affirm market expectations for 2022 rate hikes, while China’s demand for industrial commodities supports AUD/NZD, targeting 1.0800.
Relative external/commodity trend is strongly in AUD’s favour
“This week’s Australia Q4 CPI data reinforced expectations that the RBA next week will make major changes to its forecasts and rhetoric, preparing for higher rates in coming months.”
“The relative external/commodity trend is strongly in A$’s favour. Australia has run historically large trade and C/A surpluses for 4 years, whereas NZ’s C/A deficit is the widest since 2008. China’s recent tilt towards infrastructure-led growth seems likely to extend the outperformance of Australia’s industrial commodity exports.”
“We see scope for AUD/NZD to extend recent gains to 1.0800 multi-day/week.”
Uncertainty around Prime Minister Boris Johnson is unlikely to persist. Furthermore, solid activity data and inflationary pressures as Omicron restrictions ease should lift GBP towards recent highs, in the opinion of economists at Westpac.
GBP/USD may be vulnerable to another flush to 1.3400
“The easing of covid restrictions and moves away from working from home should lift economic activityy. Nov employment and production were stronger than anticipated and inflation data was notably higher. Dec’s Omicron impacted retail sales were surprisingly weak, but recent survey data suggest that demand has remained firm and maintain potential for another BoE hike.”
“PM Johnson’s position is increasingly precarious. Discontent over his leadership still needs 15% (54 MPs) of Tory MPs to lodge their lack of confidence to trigger a leadership challenge. That may create concerns over leadership, but it would also end the current uncertainty and so the impact on GBP might perversely be positive.”
“GBP/USD may be vulnerable to another flush to 1.3400 but easing of restrictions and a potential BoE hike could trigger a lift to 1.3625 if not a retest of 1.3750.”
EUR/USD has extended its bearish trend following Fed's policy announcements. As FXStreet’s Eren Sengezer notes, sellers eye fresh 18-month lows below 1.1190.
Euro/dollar is extremely oversold in the short-term
“In case the 1.1200 support turns into resistance, the pair could face additional bearish pressure and touch its weakest level in 18 months near 1.1180. Below that level, 1.1170 (static support from Jul. 2020) aligns as the next support before sellers can target 1.1100 (psychological level).”
“1.1250 (static level, former support) now acts as the first technical resistance ahead of 1.1270 (static level, former support) and 1.1300 (psychological level).”
“With the Relative Strength Index (RSI) indicator on the four-hour chart showing extremely oversold conditions below 30, a technical correction could be witnessed in the short term but the bearish bias should stay intact unless the pair reclaims 1.1300.”
The US Dollar Index (DXY) rose more than 0.5% on Wednesday. Federal Reserve Chair Jerome Powell did not rule out a more abrupt policy tightening, setting the stage for a likely quick sprint for DXY to fresh post-covid highs beyond 96.94 in coming days, economists at Westpac report.
Surging Fed policy hike expectations set the stage for sustained DXY upside
“Fed Chair Powell emphatically underscored the Fed’s abrupt hawkish pivot with a resolute message – a hike in March, the tail risk of Fed hikes at every meeting and the prospect of earlier balance sheet drawdown.”
“DXY has yet to fully price in the yield support that has formed at the front-end in the last several weeks, let alone what may develop in coming months.”
“DXY is within striking of last year’s highs at 96.94. Beyond that a quick sprint toward 99-100 is on the cards in the next few weeks.”
- GBP/USD witnessed heavy selling for the second successive day amid a broad-based USD strength.
- The UK political turmoil further undermined the sterling and contributed to the ongoing downfall.
- Investors now look forward to important US macro releases for some meaningful trading impetus.
The GBP/USD pair dropped to a near one-month low during the early European session, with bears now awaiting a sustained break below the 1.3400 round-figure mark.
The pair extended the previous day's post-FOMC rejection slide from the 1.3525 region, or the 100-day SMA resistance and witnessed selling for the second successive day on Thursday. This also marked the sixth day of a negative move in the previous six and was sponsored by a broad-based US dollar strength.
The Fed on Wednesday reaffirmed market expectations for an eventual lift-off in March, which triggered a sharp rise in the US Treasury bond yields. In fact, the 2-year US bond yield, which is sensitive to rate hike expectations, shot to a 23-month high and pushed the USD to the highest level since mid-December.
Meanwhile, concerns about a faster policy tightening by the Fed, along with political tensions between Russia and Ukraine, took its toll on the global risk sentiment. This was evident from a slump in the equity markets, which further benefitted the greenback's relative safe-haven status against its British counterpart.
On the other hand, the political turmoil over UK Prime Minister Boris Johnson’s alleged lockdown-busting parties in Downing Street undermined sterling. This, in turn, exerted additional pressure on the GBP/USD pair, though expectations that the Bank of England will hike interest rates might help limit losses.
Nevertheless, the GBP/USD pair, so far, has failed to attract any buying interest and remains at the mercy of the USD price dynamics amid absent relevant macro data from the UK. Traders now look forward to the US economic releases – Advance Q4 GDP, Durable Goods Orders, Weekly Jobless Claims and Pending Home Sales – for a fresh impetus.
Technical levels to watch
FX Strategists at UOB Group noted USD/CNH is seen accelerating gains on a break above the 6.3555 level.
Key Quotes
24-hour view: “USD traded between 6.3237 and 6.3384 yesterday, narrower than our expected sideway-trading range of 6.3240/6.3430. USD rose above 6.3430 during early Asian hours and upward momentum is beginning to build. The build-up in momentum is likely to lead to an advance above 6.3500. The next resistance at 6.3555 may not be easy to break. On the downside, 6.3330 is a solid support (minor support is at 6.3360.”
Next 1-3 weeks: “We turned negative in USD two weeks ago. As USD declined, in our latest narrative from two days ago (25 Jan, spot at 6.3300), we highlighted that downward momentum has not improved by much but USD could weaken further to 6.3180. We added, a breach of 6.3500 would indicate that the weak phase in USD has come to an end. While 6.3500 is still intact, USD traded on a firm note during early Asian hours and downward momentum has dissipated. Shorter-term upward momentum is beginning to build but USD has to clear 6.3555 before a sustained advance is likely. The chance for USD to clear 6.3555 is quite high and it would increase further as long as USD does not below 6.3270 within these few days. Looking ahead, the next resistance above 6.3555 is at 6.3700.”
- DXY extends the strong upside and records new highs.
- US yields trade on a mixed tone post-FOMC meeting.
- Advanced Q4 GDP, Initial Claims next on tap in the US docket.
The greenback extends the rally and records new highs for the year past the 96.80 level when tracked by the US Dollar Index (DXY) on Thursday.
US Dollar Index now looks to data
The index remains bid and advances for the fourth consecutive session on Thursday, gathering fresh steam following the hawkish message at the FOMC gathering on Wednesday.
The move higher in the buck comes amidst the mixed performance in the US money markets, where yields in the short end of the curve climb to levels last seen in February 2020 near 1.20% vs. downticks in the belly and the long end.
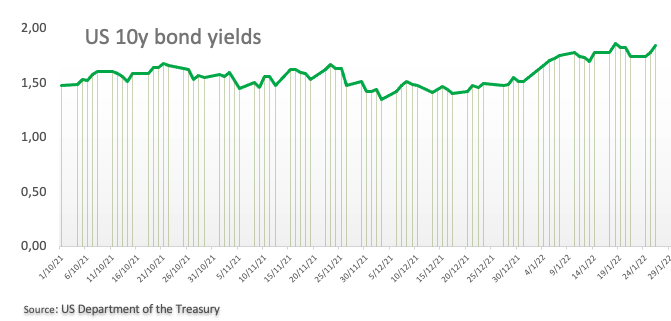
The dollar reinforces its upside as market participants continue to adjust to the recent announcements by the Fed at its meeting on Wednesday.
While the Federal Reserve kept rates on hold as expected, Chief Powell opened the door to a March hike and did not rule out raising the Fed Funds Target Range at every meeting this year. Investors’ attention, therefore, are expected to remain focused on the quantity of rate hikes this year and the size of them, relegating somewhat speculation surrounding the timing of the balance sheet runoff, which according to Powell will be data dependent.
Later in the US data space, the flash Q4 GDP will take centre stage seconded by usual weekly Claims, Durable Goods Orders and Pending Home Sales.
What to look for around USD
The index extends the sharp advance to new tops and already trades at shouting distance from the 2021 high just below the 97.00 barrier, all after the Fed’s hawkish tilt exacerbated the upside in the dollar on Wednesday. Meanwhile, the constructive outlook for the greenback is expected to remain unchanged for the time being on the back of rising yields, persistent elevated inflation, supportive Fedspeak and the solid pace of the US economic recovery.
Key events in the US this week: Durable Goods Orders, Advanced Q4 GDP, Initial Claims, Pending Home Sales (Thursday) – PCE, Personal Income/Spending, Final Consumer Sentiment (Friday).
Eminent issues on the back boiler: Fed’s rate path this year. US-China trade conflict under the Biden administration. Debt ceiling issue. Escalating geopolitical effervescence vs. Russia and China.
US Dollar Index relevant levels
Now, the index is gaining 0.37% at 96.83 and a break above 96.85 (2022 high Jan.27) would open the door to 96.93 (2021 high Nov.24) and finally 97.00 (round level). On the flip side, the next down barrier emerges at 96.00 (55-day SMA) seconded by 95.41 (low Jan.20) and then 94.62 (2022 low Jan.14).
Gold has risen but remains caught in its broader range. XAU/USD snapped its recent uptrend to two-month highs of $1,854 and slumped to five-day lows just above $1,810 in the aftermath of the Fed decision. Strategists at Credit Suisse expect the yellow metal to suffer further losses on a break under $1,759/54.
Break above $1,877 is needed to ease fears of a top
“Below $1,759/54 remains needed to clear the way for a retest of key price and retracement support from the lower end of the range at $1,691/76. Only below here though would see a major top established to mark an important change of trend lower, with support then seen at $1,620/15 initially, before $1,572/61.”
“A break above $1,877 is needed to ease fears of a top, but with a break above $1,917 needed to suggest we are seeing a more sustainable move higher, potentially back to the $2,075 record high.”
EUR/USD suffered heavy losses on Wednesday and continues to edge lower toward 1.1200 early Thursday. According to economists at Westpac, divergence in central bank policy is likely to limit any EUR rallies and maintain the downtrend in EUR/USD at least into ECB’s key March policy meeting.
EUR-USD 2yr Swaps Spread suggests a lower path for EUR/USD
“The chart of the EU-US 2yr swap spread clearly shows the directional pull of this divergence. This looks set to continue, at least until ECB’s allotted end of PEPP and reappraisal of policy and economic projections in March.”
“Germany’s transition of power from Merkel to Scholzled government was expected to be smooth and have little market impact. The risk of a change in French leadership may not be so smooth but is an issue for Q2 22. Italy may also face a change in leadership.”
“January’s failure of EUR/USD to hold above 1.14 could trigger a retest 1.1200, or even 1.1000-50 area.”
EUR/USD should move lower. The broad 1.12/14 range that has held since November 2021 now looks stale and economists at TD Securities expect the pair to settle in a new range marked by 1.10/12.
USD/JPY to move toward 118 over the balance of the year
“We think EUR/USD is now at the cusp of a new lower trading range marked by 1.10/12.”
“We think USD/JPY has topside risks on the basis that it primarily remains a function of Fed pricing. Not only will the BoJ lag the Fed, but an appreciable pivot is likely to lag the ECB. So, overall, we think it is appropriate to expect yen weakness. We forecast a move to 118 over the balance of the year.”
The US Dollar Index (DXY) was last seen trading at its highest level since mid-December at 96.83, rising 0.3% on the day. Economists at ING expect the DXY to hit late November highs at at just under 97.00.
Dollar strength to be played out against the low-yielders
“While acknowledging that we are going through a rocky period for risk assets, we think it is too early to conclude that Fed tightening or high energy prices severely choke global growth this year and would prefer the former scenario of dollar strength largely being played out against the low-yielders.”
“With DXY heavily weighted to European currencies and dollar positioning a lot more balanced, favour DXY making a running at the late November highs at just under 97.00.”
The Federal Reserve is almost sure to raise rates in March and seems determined to start its balance sheet contraction relatively soon. Economists at Nordea still expect four Fed hikes for this year, but the chance of even faster rate increases should not be overlooked.
March hike and more ahead
“We see four Fed hikes this year, but would not rule out a faster pace especially towards the end of the year.”
“We expect a decision on the balance sheet contraction during the summer.”
“We see more upside potential for US yields and more downside for the EUR/USD.”
EUR/USD is now not far from its late November lows of 1.1185. Economists at ING forecast the world’s most popular currency pair at 1.08 by the end of the second quarter.
Euro to bear the brunt of tension in Ukraine
“So far the ECB is firmly sticking to the script that the bump in inflation will not hurry them into hiking. Until something substantially changes here, expect EUR/USD to stay under pressure.”
“We retain a 1.10 target for the end of 1Q22 and a 1.08 target for the end of 2Q22.”
“In addition, one would expect European currencies to bear the brunt of tension in Ukraine. The prospect of disruption to energy supplies or at least a further surge in prices will hurt European industry and the consumer – and favour the geography and energy independence of the dollar.”
Economists at Westpac expect kiwi’s January decline to continue to 0.6600, following NZ-US yield spreads which have been depressed by a more hawkish Federal Reserve and repricing.
Fed rate hikes to outpace market pricing
“While NZ’s economic data pulse should remain positive, the Fed-driven USD will dominate. NZ-US yield spreads have declined recently, with the RBNZ fully priced but the Fed arguably underpriced.”
“Multi-month, we remain bearish, targeting sub-0.6600. Our view is that the US dollar will outperform most currencies over the next few months as Fed rate hikes outpace market pricing.”
Brent Crude Oil rose to the highest level since 2014, with the global benchmark approaching $90/b early on Wednesday. Strategists at TD Securities expect to see further gains to $100/b.
More upside possible
“The market is pricing in the risk that there will be some sort of geopolitical event on the Ukraine-Russian border, which may trigger a set of sanctions which could reduce Russian natural gas and oil supplies available to global markets. Lower US production is also supportive.”
“Now that the IEA and other forecasters are projecting a stronger-than-expected demand trajectory for crude, while supply may be reduced due to conflict in Eastern Europe, the oil market could still move higher.”
“Given the current technical setup, we reiterate that it would not take much on the supply or demand front to send benchmark crudes on a path toward $100/b, should evidence point to chronic deficits into 2022 and risk appetite remains firm.”
USD/JPY faces further upside once 105.05 is cleared in the short-term horizon, commented FX Strategists at UOB Group.
Key Quotes
24-hour view: “Our view for USD to ‘dip below 113.60’ yesterday was incorrect as it surged to a high of 114.69 before closing on a strong note at 114.63 (+0.68%). Strong upward momentum suggests further USD strength even though the major resistance at 115.05 is likely out of reach for today (there is another resistance at 114.90). Support is at 114.50 followed by 114.25.”
Next 1-3 weeks: “We have held the same view since last Friday (21 Jan, spot at 113.90) where USD ‘has to break 113.40 before a decline to 113.00 is likely’. USD subsequently dropped to 113.46 but yesterday (26 Jan) it surged above our ‘strong resistance’ level at 114.45 (high of 114.69). The rapid improvement in upward momentum has shifted the risk to the upside. However, USD has to clear the major resistance level at 115.05 before sustained advance is likely. The upside risk is intact as long as USD does not move below the ‘strong support’ level, currently at 114.05.”
Open interest in natural gas futures markets shrank for the sixth session in a row on Wednesday considering preliminary readings from CME Group. On the other hand, volume reversed three consecutive daily pullbacks and rose by around 147.6K contracts.
Natural Gas faces initial support around $3.80
Prices of natural gas flirted with 2-week highs around $4.40 on Wednesday. The uptick, however, came in tandem with shrinking open interest, which opens the door to a probable corrective move in the very near term. Occasional bearish moves, in the meantime, should meet initial contention around the $3.80 region per MMBtu.
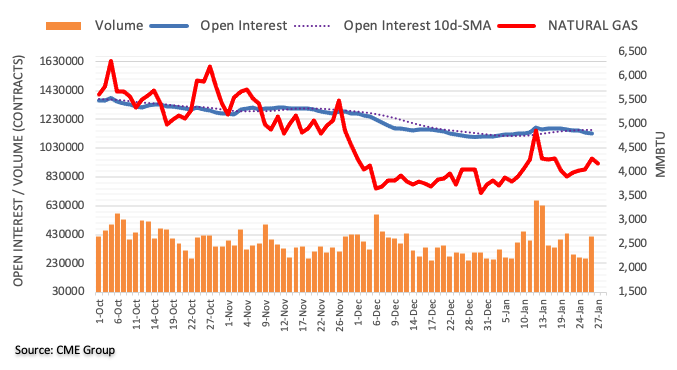
ING’s bullish view on the Canadian dollar for the rest of the year remains unchanged despite Omicron caution keeps the Bank of Canada (BoC) on hold.
A March hike the first of many
“The BoC statement clearly paves the way for a rate hike in March, which means that the prospect of five rate hikes in 2022 currently priced in by the market remains quite intact.”
“We continue to see the BoC tightening cycle as a positive factor for CAD in 2022, although external factors will play a big role too in directing the currency from now on.”
“Assuming oil prices remain resilient and the global risk sentiment picture stabilises after the recent jitters, we think USD/CAD can stay on a downtrend for the rest of the year and hit 1.22 in 4Q22.”
AUD/USD remains under pressure and risks a drop to 0.7060 in the next weeks, suggested FX Strategists at UOB Group.
Key Quotes
24-hour view: “We did not anticipate the sharp drop in AUD to 0.7095 during NY session. AUD extended its decline during Asian hours and strong downward momentum suggests further weakness. That said, oversold conditions suggest the major support at 0.7060 could be out of reach. Resistance is at 0.7120 followed by 0.7145.”
Next 1-3 weeks: “We have expected AUD to weaken since Monday (24 Jan, spot at 0.7180). After AUD plummeted to 0.7091, we highlighted on Tuesday (25 Jan, spot at 0.7150) that the rapid drop appears to be overdone but the downside risk remains intact. We added, any weakness is expected to encounter solid support at 0.7090. AUD dropped to 0.7095 during NY session and extended its decline as it took out 0.7090 during Asian hours. Downward momentum has improved and the focus now is at 0.7060. A break of this level could lead to further AUD weakness to 0.7030. On the upside, a break of the ‘strong resistance’ at 0.7180 (level was at 0.7225 yesterday) would indicate that the downside risk has dissipated.”
- Palladium snaps seven-day uptrend near the highest levels since September 2021.
- Overbought RSI, failures to cross the key resistance line signals further weakness.
- 200-DMA, three-month-old horizontal support lures short-term sellers while bulls have a bumpy road to the north.
Palladium (XPD/USD) takes offers around $2,304, down 1.26% intraday, as the market’s risk-off mood drown commodities heading into Thursday’s European session.
In doing so, the bullion prices take a U-turn from a descending trend line from May 2021. Given the overbought RSI conditions, the latest declines are likely to last longer.
The same highlights the 200-DMA and a horizontal resistance-turned-support area from October 2021, respectively around $2,210 and $2,185, for XPD/USD sellers.
In a case where palladium prices drop below $2,185, the $2,000 psychological magnet and December 2021 top near $1,997, should return to the chart.
Alternatively, the metal’s run-up beyond the stated resistance line, near $2,340 by the press time, will aim for the 61.8% Fibonacci retracement of May-December 2021 downside, close to $2,460.
Following that, the XPD/USD bulls will have a free hand to aim for the $3,000 round figure with tops marked in July around $1,720 and $2,880 likely acting as buffers.
Palladium: Daily chart
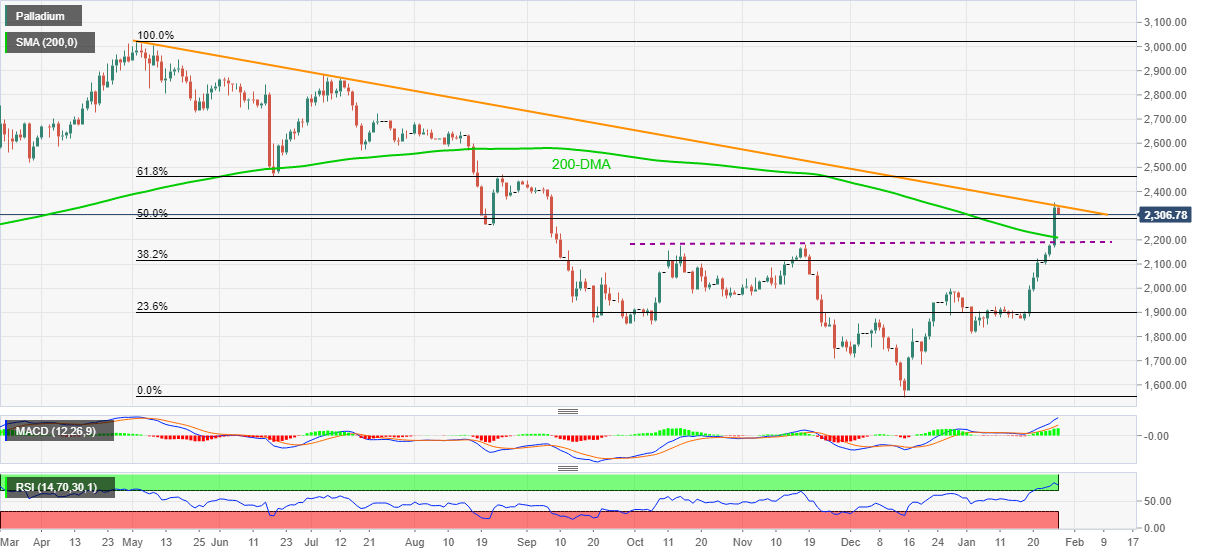
Trend: Pullback expected
Here is what you need to know on Thursday, January 27:
FOMC Chairman Jerome Powell's hawkish remarks late Wednesday triggered a dollar rally and weighed heavily on major global equity indexes. The US Dollar Index (DXY) continues to push higher early Thursday and markets remain risk-averse ahead of key data releases. The US Bureau of Economic Analysis will publish its first estimate of the fourth-quarter Gross Domestic Product growth, the US Census Bureau will release the Durable Goods Orders figures. Weekly Initial Jobless Claims and Pending Home Sales data will also be featured in the US economic docket.
The Fed left its policy settings unchanged following its January policy meeting as expected. While responding to questions from the press, FOMC Chairman Jerome Powell noted that there was "quite a bit of room" to raise the policy rate without hurting the labour market. Powell further added that inflation has gotten worse since the December meeting and reaffirmed that the committee was in favour of hiking the policy rate in March "assuming that the conditions are appropriate for doing so."
Reflecting the positive impact of Powell's comments on the policy outlook on the dollar's performance against its major rivals, the DXY rose more than 0.5% on Wednesday. As of writing, the DXY was at its highest level since mid-December at 96.68, rising 0.2% on the day. Meanwhile, the benchmark 10-year US Treasury bond yield, which closed the previous five trading days in the negative territory, surged by more than 5% on Wednesday and now stays within a touching distance of 1.9%.
After rising more than 1% during the first half of the session, the S&P 500 Index ended up closing in the red on Wednesday. US stocks futures indexes are down between 1.1% and 1.6% in the early European session, suggesting that Wall Street selloff will likely continue after the opening bell.
Federal Reserve rate cycle to begin in March, markets reverse on warning.
EUR/USD suffered heavy losses on Wednesday and continues to edge lower toward 1.1200 early Thursday. There won't be any high-tier data releases from the euro area and the dollar's market valuation is likely to continue to drive the pair's action.
GBP/USD is trading at its lowest level since the beginning of the year and looks to test 1.3400.
USD/CAD jumped above 1.2600 in the early NA session on Wednesday after the Bank of Canada (BOC) left its policy rate unchanged. Although the pair erased its gains during BoC Governor Tiff Macklem's, who said that they will have to raise rates to counter inflation, press conference, it regathered bullish momentum and climbed above 1.2700.
Gold registered its largest one-day drop since November as it lost more than 1.5% amid surging US Treasury bond yields. XAU/USD is approaching a critical support area near $1,800 and renewed technical selling pressure could be witnessed if that level fails to hold.
USD/JPY gained nearly 100 pips on the back of rising US yields on Wednesday and seems to have gone into a consolidation phase below 115.00 early Thursday.
Bitcoin rose sharply with the initial reaction to the Fed's policy statement but failed to preserve its recovery momentum. BTC is down nearly 2% on the day at $36,000 in the early European session. Ethereum is losing more than 2% on the day near $2,400 after closing the previous two days flat.
Gold price is consolidating the Fed-led sell-off to weekly lows just above $1,810. XAU/USD bears await US Q4 GDP for the next leg lower, FXStreet’s Dhwani Mehta reports.
Death cross to keep any recovery short-lived
“Bears take a breather in the aftermath of the Fed decision while waiting for the US advance Q4 GDP and Durable goods data. The US economy is likely to have regained steam in Q4, 2021, as the growth is seen at the best level in 37 years, arriving at 5.4% YoY. Meanwhile, easing geopolitical tensions around Ukraine, weigh negatively on the traditional safe-haven gold.”
“A sustained break below $1,810, which is the January 19 lows, is needed to test the critical support near $1,805, where the 200-Daily Moving Average (DMA) and the 50-DMA coincide, having confirmed a death cross earlier this week. That level also brings in the wedge support line.”
CME Group’s flash data for crude oil futures markets noted traders added nearly 20K contracts to their open interest positions on Wednesday, reaching the third consecutive daily build. On the other hand, volume dropped by more than 100K contracts, partially reversing the previous day’s uptick.
WTI approaches the $90.00 mark
Prices of the WTI clinched new peaks just below the $88.00 mark on Wednesday. The move was accompanied by increasing open interest, which remains supportive of further upside in the very near term, while the moderate drop in volume could slow the pace of the upside or spark a corrective decline. The next barrier for oil bulls now emerges at $90.00 per barrel.
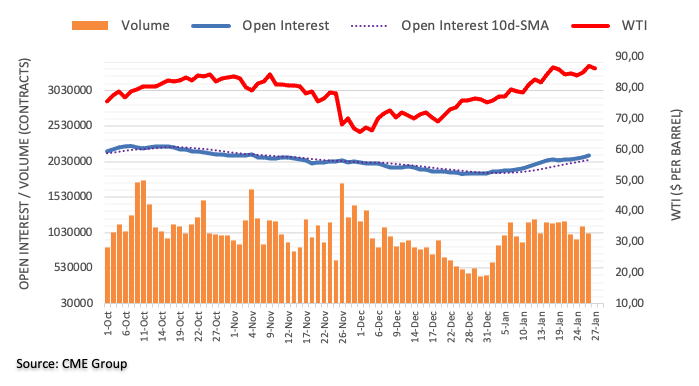
Analysts at Japan’s investment banking giant, Nomura, change their rate hike call for the Fed, as they now see the world’s most powerful central bank raising rates by 50-basis points (bps) in March.
Key quotes
"He (Fed Chair Powel) repeatedly appeared to differentiate the upcoming hiking cycle from the last time the Fed normalized its policy rate at a roughly quarterly pace.”
"We now expect a 50 bp rate hike at the March (Fed) meeting, followed by three consecutive 25 bp hikes in May, June and July.”
“Another 25 bp hike was expected in December.”
- Federal Reserve rate cycle to begin in March, markets reverse on warning
- EUR/USD eyes deeper declines as the key support gives way.
- The Fed tilts hawkish, hinting at balance-sheet reduction and March rate hike.
- A downside break of the key daily support line opens floors towards 2021 lows.
EUR/USD is pressurizing the daily lows, as it heads towards 1.1200 amid a relentless rise in the US dollar across the board.
The greenback receives a double booster shot, with the hawkish Fed outlook-driven downbeat mood boosting its safe-haven appeal. Meanwhile, spiking US Treasury yields on faster and more Fed rate-hikes also add to the upside in the dollar.
The Fed kept its policy settings on hold but pledged to tame inflation by sooner interest rates hike and decrease in its bond-holdings once the rate-hike cycle kicks in.
The euro remains undermined by the divergent monetary policy outlooks between the Fed and the ECB. The ECB continues to downplay 2022 rate hike expectations, despite soaring inflation in the old continent.
Attention now turns towards the US Q4 GDP release for fresh trading impetus while the Durable Goods data will be also eyed.
EUR/USD broke the two-month-long ascending trendline support, then at 1.1295, on a daily closing basis, opening floors for a test of the 2021 lows of 1.1186.
Ahead of that target, bears will challenge the 1.1200 round level.
The 14-day Relative Strength Index (RSI) remains bearish below the midline, suggesting that sellers will likely maintain control in the near term.
EUR/USD: Daily chart
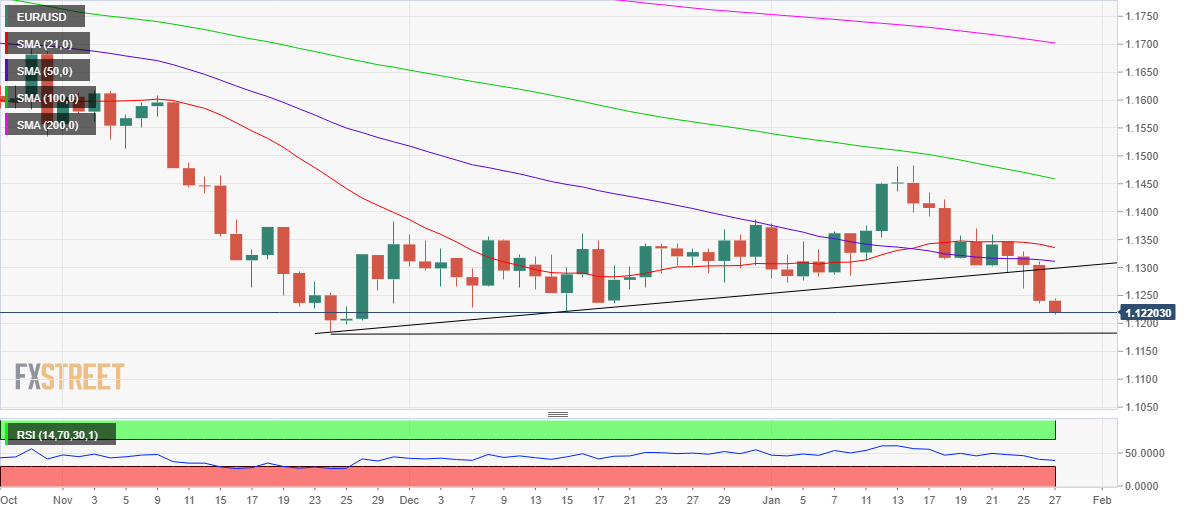
On the flip side, bulls need to take out daily highs of 1.1244 to unleash the additional recovery towards the trendline support now resistance at 1.1298.
Further up, the downward-sloping 50-Daily Moving Average (DMA) at 1.1312 will come into play.
The next significant resistance is envisioned at the mildly bearish 21-DMA at 1.1335.
EUR/USD: Additional levels to consider
In opinion of FX Strategists at UOB Group, GBP/USD remains poised to extend the decline in the short-term horizon.
Key Quotes
24-hour view: “Our expectations for GBP to ‘trade sideways’ yesterday were incorrect as it plummeted to 1.3445 during NY session. Despite the decline, downward momentum has not improved by all that much. While there is room for GBP to drop below 1.3430, the next major support at 1.3400 could be out of reach. On the upside, a breach of 1.3500 (minor resistance is at 1.3475) would indicate that the current downward pressure has eased.”
Next 1-3 weeks: “In our latest narrative from Tuesday (25 Jan, spot at 1.3485), we highlighted that while further GBP weakness is likely, oversold shorter-term conditions suggest that a slower pace of decline and the next support at 1.3400 may not come into the picture so soon. There is no change in our view for now. Overall, the downside risk is intact as long as GBP does not move above the ‘strong resistance’ at 1.3545 (level was at 1.3575 yesterday).”
NZD/USD prices lead the G10 currency pairs’ south-run during early Thursday. As a result, the one-month risk reversal (RR) of NZD/USD, a gauge of calls to puts, prints losses for the first time in three days.
Not only snapping two-day uptrend with -0.150 the figure, but the weekly RR is also favoring the NZD/USD bears. That said. the RR prints the heaviest weekly fall since late November, around -0.4000 by the press time, during a two-week fall.
It’s worth noting that the NZD/USD prices do trade in tandem with the options market signals as the quote drops 0.70% intraday while poking the lowest levels since November 2020 at the latest.
Read: NZD/USD Price Analysis: Renews yearly low under 0.6650, four-month-old support eyed
The risk-off mood seems to have taken clues from the US Federal Reserve’s (Fed) hawkish appearance during Wednesday’s Federal Open Market Committee (FOMC) meeting. However, the bears may soon take a breather as the advanced reading of US Q4 GDP looms.
Read: US GDP Preview: Inflation component could steal the show, boost dollar, already buoyed by Russia
- The post-FOMC strong USD buying pushed USD/CHF to over a two-week high on Thursday.
- Bulls seemed unaffected by the risk-off impulse, which tends to underpin the safe-haven CHF.
- The momentum seems strong enough to push spot prices back towards the monthly swing high.
The USD/CHF pair maintained its bid tone heading into the European session and was last seen trading around mid-0.9200s, or over a two-week high.
The pair built on this week's goodish bounce from the 0.9100 mark and gained positive traction for the fourth successive day on Thursday. The US dollar added to the post-FOMC strong gains and shot to the highest level since mid-December. This, in turn, was seen as a key factor driving the USD/CHF pair higher.
The Fed on Wednesday reinforced expectations for an eventual lift-off in March and pushed the 2-year US bond yield, which is sensitive to rate hike expectations, to the highest level since February 2020. Moreover, the yield on the benchmark 10-year government bond jumped back above 1.85% and underpinned the buck.
Meanwhile, the prospects of imminent rate hikes triggered a fresh wave of the global risk-aversion trade, which was evident from a sea of red across the equity markets. The anti-risk flow, however, did little to boost demand for the safe-haven Swiss franc or stall the USD/CHF pair's ongoing upward trajectory.
From a technical perspective, the overnight sustained strength beyond the 0.9200 mark was seen as a fresh trigger for bullish traders. The subsequent move up further validated the positive outlook and might have already set the stage for a move towards testing the monthly swing high, around the 0.9275-0.9280 region.
Market participants now look forward to the US macro releases – Advance Q4 GDP print, Durable Goods Orders, Weekly Initial Jobless Claims and Pending Home Sales data. This, along with the US bond yields, should influence the USD price dynamics and produce some trading opportunities around the USD/CHF pair.
Technical levels to watch
According to advanced figures from CME Group for gold futures markets, open interest shrank by around 17.8K contracts after two daily builds in a row on Wednesday. Volume, instead, remained choppy and went up by around 158.7K contracts, offsetting the previous pullback.
Gold remains supported around $1,800
Wednesday’s sharp selloff in prices of gold was on the back of shrinking open interest, indicative that a deeper pullback might be out of favour in the very near term. However, the marked increase in volume allows for the continuation of the downside, which is expected to meet solid support around the $1,800 mark per ounce troy.
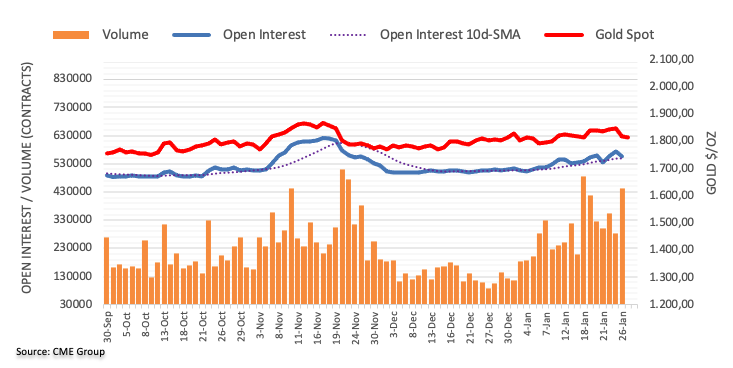
- Gold prices remain pressured after posting the heaviest daily fall in two months.
- Hawkish Fed, geopolitical concerns weigh on market sentiment.
- DXY jumps to six-week high, yields struggles after rising the most in three weeks.
- Gold Price Forecast: XAU/USD bears await US Q4 GDP for the next leg lower
Gold (XAU/USD) prices seem all-set to print the first weekly loss in three, refreshing intraday low near $1,813 heading into Thursday’s European session.
Broad risk-off mood joins stronger US dollar to drown the gold prices after Wednesday’s Federal Open Market Committee (FOMC) meeting. Adding to the sour sentiment are concerns over China’s Evergrande and Russia that exert additional downside pressure on the riskier assets like commodities and equities.
The US Federal Reserve (Fed) matched wide market forecasts while keeping the benchmark interest rates and tapering targets intact. However, the interesting part from the Monetary Policy Statement was, “The Committee expects it will soon be appropriate to raise the target range for the federal funds rate.”
Fed Chair Jerome Powell sounded a bit cautiously optimistic as he said, “The rate-hike path would depend on incoming data and noted that it is ‘impossible’ to predict.” Though, Powell’s comments like, “There’s plenty of room to raise rates,” seemed to propel the faster rate hike concerning and propelled the US dollar, which in turn drowned gold prices from the yearly resistance.
Additionally, China’s Evergrande said it is targeting a restructuring proposal within six months while the US State Department warned Russia over Nordstorm 2 oil pipeline if it invades Ukraine. It should be observed that escalating virus numbers in Japan also weigh on the market sentiment due to the nation’s key status in the global bond markets.
Against this backdrop, the US 10-year Treasury yields seesaw around 1.85%, mildly offered after positing the biggest daily gains in three weeks. However, stock futures in the US and Europe print over 1.0% intraday losses by the press time.
That said, gold prices are likely to extend the immediate downside as technical breakdown joins the fundamental cause. However, today’s US Q4 GDP and Durable Goods Orders for December will be important for the short-term direction.
Technical analysis
Gold extends downside break of a three-week-old rising trend channel amid bearish MACD signals, suggesting further downside of the yellow metal. However, RSI conditions are oversold and challenge bulls.
Hence, the immediate support of 200-SMA, near $1,810 by the press time, may trigger the quote’s corrective pullback. Also acting as the short-term key support is an ascending trend line from December 15, near $1,809.
That said, failures to bounce off $1,809 could quickly drag gold prices to the $1,800 threshold and then towards the monthly low of $1,782.
Meanwhile, recovery moves remain elusive below the channel’s lower line, around $1,827.
Following that, the 50-SMA and the recent highs, respectively around $1,831 and $1,853, will be in focus.
Gold: Four-hour chart
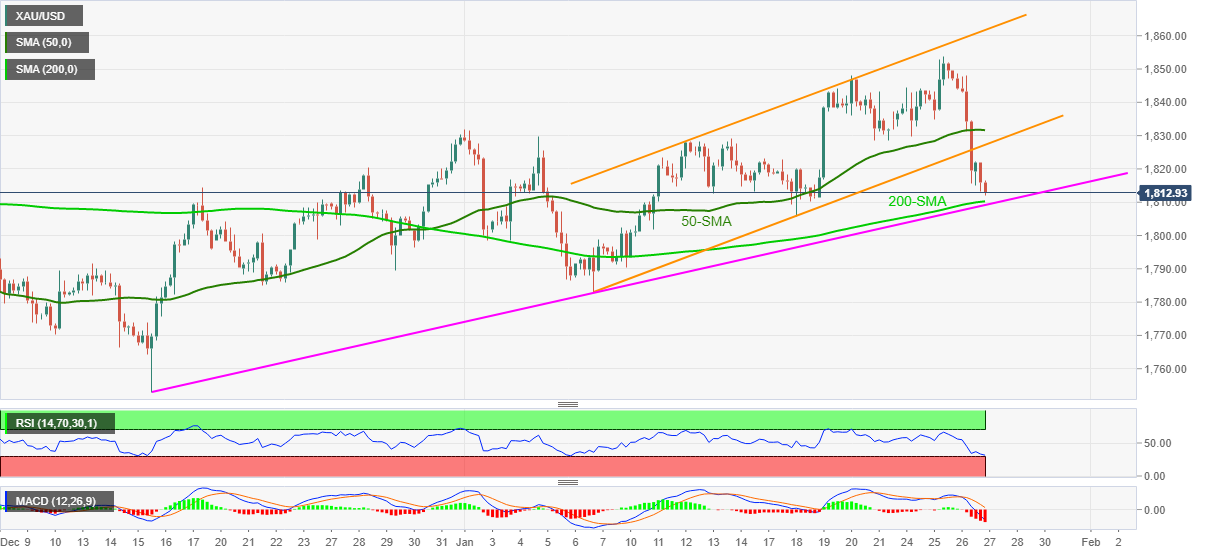
It’s worth noting that a death-cross on the daily chart, a condition where 50-DMA crossed 200-DMA to the downside, hints at the bullion’s further weakness. Additionally, buyers’ rejection from the yearly resistance line, around $1,846 at the latest, also favors gold bears.
Gold: Daily chart
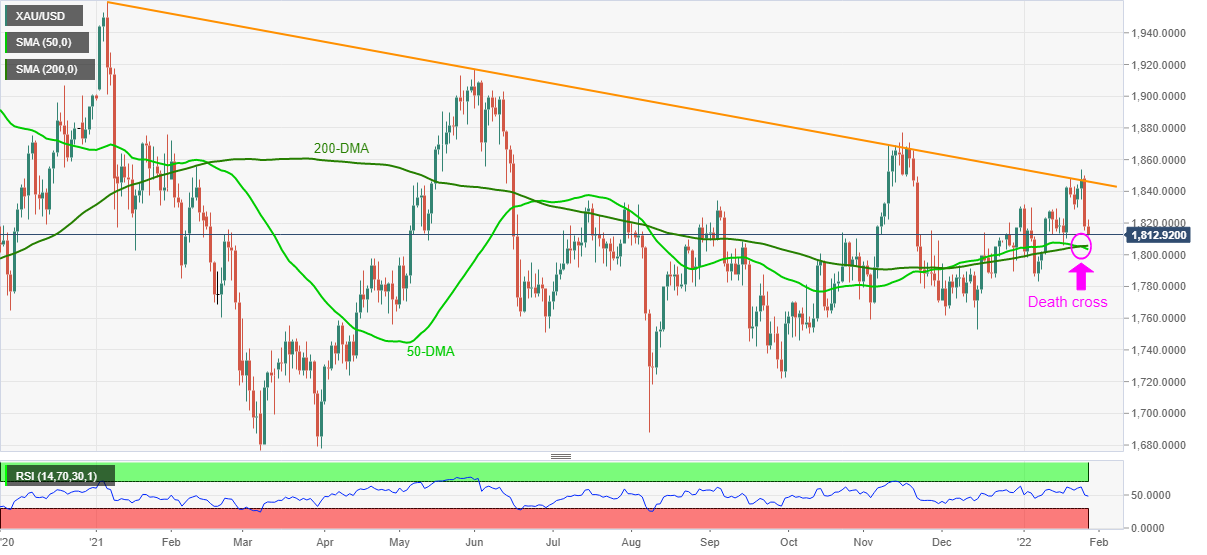
FX Strategists at UOB Group now sees EUR/USD heading towards the 1.1210 level in the next weeks.
Key Quotes
24-hour view: “We expected EUR to ‘trade sideways’ yesterday. However, EUR plunged to a low of 1.1234 during NY session. The rapid decline is oversold but strong downward momentum indicates that EUR could weaken further. In view of the oversold conditions, a sustained decline below 1.1210 is unlikely (next support at 1.1185 is unlikely to come under threat). Resistance is at 1.1260 followed by 1.1280.”
Next 1-3 weeks: “Yesterday (26 Jan, spot at 1.1305), we highlighted that the downward bias is intact and there is scope for EUR to ‘edge lower to 1.1240’. Our view for a lower EUR was not wrong but we did quite anticipate the sharp and rapid drop during NY session (low of 1.1234). Downward momentum has improved further and EUR is likely to continue to head lower. A clear break of 1.1210 would increase the odds for EUR to head lower towards the 2021 low near 1.1185. The EUR weakness is deemed intact as long as 1.1315 (‘strong resistance’ level was at 1.1365 yesterday) is not breached.”
The latest Reuters poll of analysts and fund managers showed Thursday, investors ramped up their long bets on the Chinese yuan to the highest since June 3, 2021, despite the Omicron covid variant-led hit and hawkish Fed outlook.
Key findings
“Positions in the baht were neutral, the first time they have been anything but bearish since Feb. 25.”
“Investors turned short on the Indian rupee just a fortnight after going long, while bearish bets on the Philippine peso were at their highest since Oct. 7.”
“Long positions in the Chinese yuan were at their highest since June. “
“Market participants turned bullish on Singapore's dollar for the first time since early November.”
Related reads
- USD/INR Price News: Indian rupee refreshes monthly low above 75.00 after Fed showdown
- S. Korean Vice FinMin: Will act to stabilize market if needed
- Asian equities witness losses as Fed flagged rate hike concerns.
- US stock futures drop over 1.0%, Treasury yields struggles to defend the first daily positive in six.
- Japan’s Nikkei, South Korea’s KOSPI are the biggest losers, Indonesia seems least affected.
Asia-Pacific markets portray a risk-off mood during early Thursday as shares drop and yields stay firmer following the US Federal Reserve’s (Fed) hawkish halt.
That said, the MSCI’s index of Asia-Pacific shares outside Japan drops 2.0% whereas Japan’s Nikkei and South Korea’s KOSPI lead the losses with over 3.0% daily fall heading into the European session.
While geopolitical concerns surrounding Russia add to the Fed-led risk-aversion wave to drown the equities, Omicron woes and North Korea’s missile tests exert additional downside pressure on the stocks from Japan and South Korea.
That said, Australia’s ASX 200 declines around 2.0% amid firmer calls of the RBA’s rate hike during late 2022. New Zealand’s NZX 50 joined the league with 2.20% intraday declines as Q4 2021 inflation data came stronger.
Chinese stocks couldn’t buck the trend as Evergrande struggles to make coupon payments and eyes for debt restructuring, which in turn weigh on the equity markets based in Hong Kong and India.
It’s worth noting that Indonesia’s IDX Composite becomes the least negatively affected stock market from the Asia-Pacific group, down 0.20% intraday at the latest. The reason for Indonesian markets to stay mostly stable as Bank Indonesia (BI) Governor Perry Warjiyo tamed immediate rate hike concerns by signaling action in late 2022.
On a broader front, the US 10-year Treasury yields seesaw around 1.85%, mildly offered after positing the biggest daily gains in three weeks. However, stock futures in the US and Europe print over 1.0% intraday losses by the press time.
Moving on, the US Q4 GDP and Durable Goods Orders for December will be important to watch for the markets but there are fewer hopes of bulls.
Read: US GDP Preview: Inflation component could steal the show, boost dollar, already buoyed by Russia
- USD/CAD refreshes multi-day top after crossing five-week-old resistance line.
- Bullish MACD signals further upside beyond 50-DMA, sellers need validation from 200-DMA.
USD/CAD pierces 1.2700, up 0.30% around 1.2715 to refresh a three-week top during early Thursday in Europe.
In doing so, the Loonie pair justifies the previous day’s upside break of a descending trend line from December 20, as well as the bullish MACD signals.
However, the 50-DMA level of 1.2715 restricts the quote’s immediate advances.
In addition to the 1.2715 resistance, 1.2780 and the 1.2800 levels may also challenge USD/CAD bulls before directing them to the two-month-old horizontal resistance near 1.2850.
Alternatively, pullback moves remain elusive beyond the previous resistance line, near 1.2640 by the press time.
Following that, 50% and 61.8% Fibonacci retracement level of October-December upside, respectively near 1.2630 and 1.2545, will challenge the USD/CAD bears.
Even if the USD/CAD prices drop below 1.2545 support, the 200-DMA around 1.2500 will act as the last hope for bulls.
USD/CAD: Daily chart
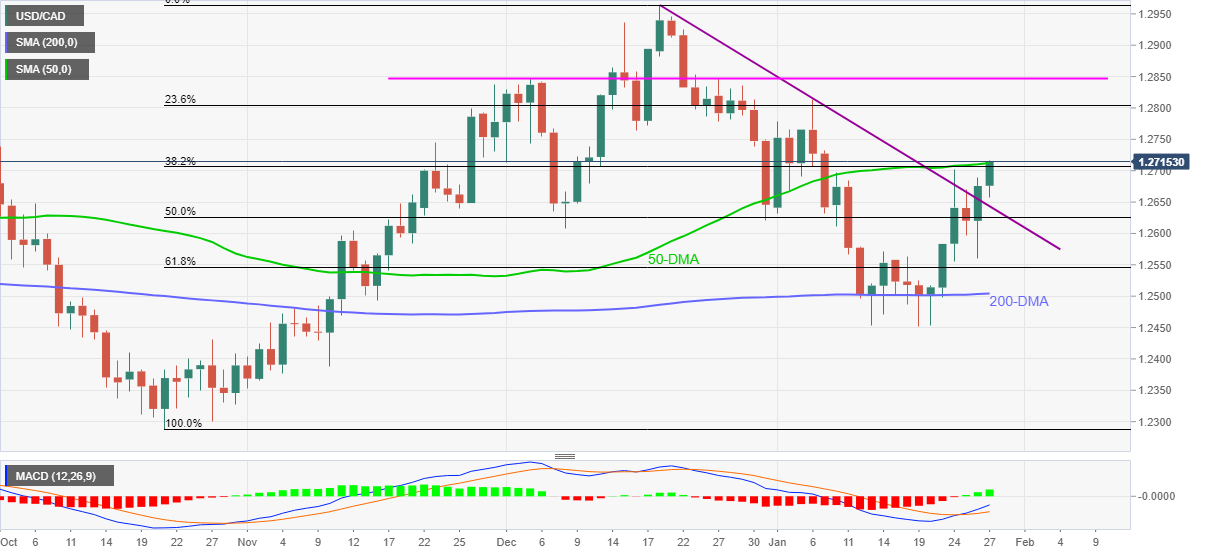
Trend: Further upside expected
- GBP/USD takes offers to renew monthly low, down for the second consecutive day.
- EU to sue UK over deal in bonkers, delay in Brexit talks over NI.
- Sue Grey's report awaited as UK PM Johnson defends drinks party, animal evacuation from Afghanistan adds to the problems.
- Fed matched hawkish market forecasts, US Q4 GDP awaited for better understanding.
GBP/USD extends the previous day’s losses amid broad US dollar gains post-Fed and worsening Brexit, as well as political, conditions in the UK. That said, the cable pair drops to 1.3430, down 0.20% intraday to refresh the daily lows heading into Thursday’s London open.
Starting with the Fed, the US Federal Reserve (Fed) matched wide market expectations to keep benchmark interest rates and tapering targets intact during Wednesday’s Federal Open Market Committee (FOMC) meeting. However, the interesting part from the Monetary Policy Statement was, “The Committee expects it will soon be appropriate to raise the target range for the federal funds rate.”
At home, UK PM Boris Johnson managed to take a sigh of relief on Wednesday, though for a short time, as the Sue Grey report was stopped from publishing. “Asked if Mr. Johnson would need to resign if he was interviewed under caution by police, he said: ‘No, of course, that wouldn't be a resigning matter, because people are innocent in this country until proved guilty,’” said the Sky News.
Elsewhere, The Sun mentioned that Brussels will sue Britain for a breach of the Brexit trade deal in a bonkers row about wind farms. On the same line was the escalating pressure on UK Brexit Minister Liz Truss to overcome the deadlock concerning the Northern Ireland (NI) protocol, recently by Democratic Unionist Party (DUP) leader Sir Jeffrey Donaldson.
It should be noted that the easing covid-linked activity restrictions and recently hawkish UK data offer a tough fight to the GBP/USD bears of late.
That said, the market’s risk-off mood underpins the US dollar demand. The same could be witnessed in firmer US Treasury yields and over 1.0% loss of the stock futures.
Moving on, the key report conveying the future of UK PM Johnson will be eyed to determine short-term GBP/USD moves. Also on the watcher’s list are the US Q4 GDP and Durable Goods Orders for December.
Read: US GDP Preview: Inflation component could steal the show, boost dollar, already buoyed by Russia
Technical analysis
A horizontal area from December 23 around 1.3435-30 may join oversold RSI conditions to trigger GBP/USD bounce. However, further downside past 1.3430 won’t hesitate to challenge 61.8% Fibonacci retracement of December 2021 to January 2022 upside, around 1.3385.
- WTI crude oil prices step back from multi-day high, stays pressured around intraday low of late.
- Fed-led fears propel US Treasury yields and US dollar but Russia-linked geopolitical tensions keep oil buyers hopeful.
- EIA inventories contrasted API stockpiles, China’s Evergrande, virus woes add to the risk-off mood.
- US Q4 Advance GDP, Durable Goods Orders eyed for fresh impulse.
WTI crude oil prices consolidate gains near eight-year high, easing to $86.00 amid early Thursday morning in Europe.
In doing so, the black gold respects the broad risk-off mood, as well as downbeat official weekly inventory data from the US Energy Information Administration (EIA). However, the bulls remain hopeful as geopolitical tussles between Russia and Ukraine stay on the table.
Market sentiment sours after the Fed matched the broad consensus of offering a hawkish halt. the US Federal Reserve (Fed) matched wide market expectations to keep benchmark interest rates and tapering targets intact during Wednesday’s Federal Open Market Committee (FOMC) meeting. However, the interesting part from the Monetary Policy Statement was, “The Committee expects it will soon be appropriate to raise the target range for the federal funds rate.”
On a different page, US Secretary of State Antony Blinken and Chinese Foreign Minister Wang Yi discussed how they could advance forward together regarding the Russia-Ukraine conflict, per the US state department spokesperson. It’s worth noting that the US State Department earlier warned Russia over Nordstorm 2 oil pipeline if it invades Ukraine.
Elsewhere, Evergrande said it is targeting a restructuring proposal within six months whereas the virus woes escalate in Japan.
Amid these plays, S&P 500 Futures drop 1.5% while the US 10-year Treasury yields remain firmer around 1.85%, after rising the most in three weeks the previous day.
It’s worth noting that the weekly EIA stockpiles rose past the -0.728M forecast and 0.515M markets expectations to 2.377M at the latest. Earlier in the week, the private industry report, from the American Petroleum Institute (API), showed that the oil inventories shrank 0.872M versus the previous addition of 1.404M.
Looking forward, WTI crude oil traders will pay attention to the aforementioned risk catalysts for fresh impulse, mostly to confirm further bearish bias. However, the first readings of the US Q4 GDP and Durable Goods Orders for December will be important to watch afterward.
Read: US GDP Preview: Inflation component could steal the show, boost dollar, already buoyed by Russia
Technical analysis
Although overbought RSI conditions do challenge WTI bulls, the oil sellers may not take risk of entry until witnessing a clear downside break of the 10-DMA level surrounding $84.80. Even so, an ascending support line from December 20, near $83.50, will challenge the bears.
- USD/JPY struggles with short-term moving average to extend post-Fed gains.
- Clear break of three-week-old resistance line keeps buyers hopeful to challenge November 2021 top.
- Downbeat Momentum line probes the pair’s further upside.
- 100-DMA, 50% Fibonacci retracement act as strong supports.
USD/JPY buyers attack 21-DMA to extend Fed-led gains during early Thursday.
The yen pair crossed a downward sloping resistance line from January 04, now support around 114.15, to refresh weekly high near 114.78. However, failures to cross the 21-DMA dragged the quote back to 114.65-60 by the press time.
In addition to the failures of the cross the 21-DMA, the downbeat Momentum line also probes USD/JPY buyers until the quote stays below 114.80 level comprising the stated short-term moving average.
If at all USD/JPY rises past 114.80, November’s peak of 115.52 and monthly top near 116.35 will be in focus.
Alternatively, pullback moves may initially aim for the previous resistance line near 114.15, a break of which will direct USD/JPY prices towards 38.2% Fibonacci retracement (Fibo.) level of September 2021 to January 2022 upside, at 113.60.
Though, the pair’s downside past 113.60 will be difficult as the 100-DMA and 50% Fibo., respectively around 113.40 and 112.75, appear tough nuts to crack for the pair bears.
USD/JPY: Daily chart
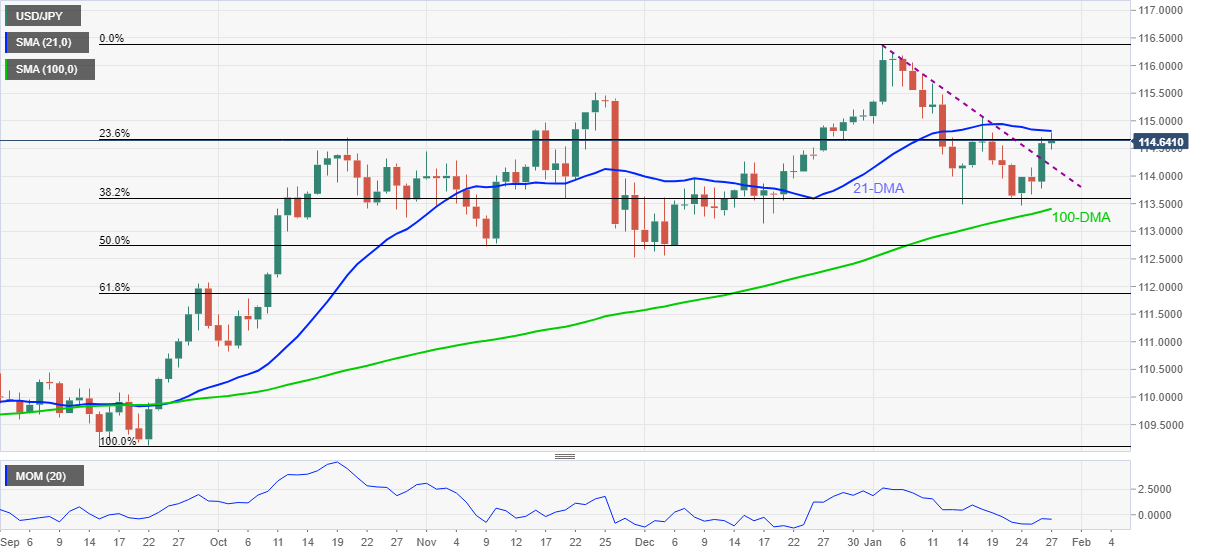
Trend: Pullback expected
- EUR/USD bears stay in control as Asian shares take a plunge.
- The Fed's hawkishness is reverberating throughout global markets, weighing on risk-sensitive currencies.
The US dollar is bid in Asia and risk aversion remains in play while investors fret over the Federal Reserve's plans to steadily tighten policy and political tensions between Russia and Ukraine. The euro, which trades as a proxy to these themes is continuing to bleed out from Wednesday's slide in EUR/USD.
As expected, Fed officials left the funds rate unchanged, kept QE on track to end in March, and signalled a likely rate hike in March. However, chairman Jerome Powell's tone was more hawkish than expected which sent US yields and the dollar on a tear, weighing heavily in the euro due to the divergence between the two nations' central banks.
EUR/USD enters the 1.10/12 trading range
At the time of writing, EUR/USD is losing some 0.15% to 1.222 the low and has fallen from a high of 1.1243. The move is in tandem with the slide in Asian shares that have fallen to their lowest in more than 14 months with MSCI's broad gauge of regional markets outside Japan down at its lowest level since early November 2020. Hong Kong's Hang Seng index and Australian shares fell 2% and Chinese blue-chips were 0.2% lower. In Tokyo, the Nikkei fell 3.22%, touching its lowest point since November 2020.
''We now expect four instead of three 25bp rate hikes along with the start of QT this year,'' analysts at TD Securities said with respect to the Fed. ''We also now expect QT to formally be announced in May, instead of September, so we have a tightening announcement at each of the next three meetings. For 2022, we forecast a 25bp hike in March, the start of QT in May, and then 25bp hikes in June, September, and December.''
''Powell did not pull any punches on the potential need to tighten aggressively. This supports our bias for further USD resilience early this year, particularly against the funders. EURUSD is likely to enter a new lower 1.10/12 trading range.''
- GBP/JPY bears are lurking and a downside extension could be on the cards.
- The daily chart's 38.2% Fibo has been breached but bears are committing.
GBP/JPY has been correcting the bearish daily impulse during the course of this week as the yen's dominance subsides in the wake of renewed risk appetite.
However, the atmosphere is fickle and prone to pivot on a dime with the likes of tensions over the prospects of a conflict in the east of Europe/central Asia. Russia is the market's wild card and for that reason, GBP/JPY's downside structure on the charts cannot be ignored.
GBP/JPY daily chart
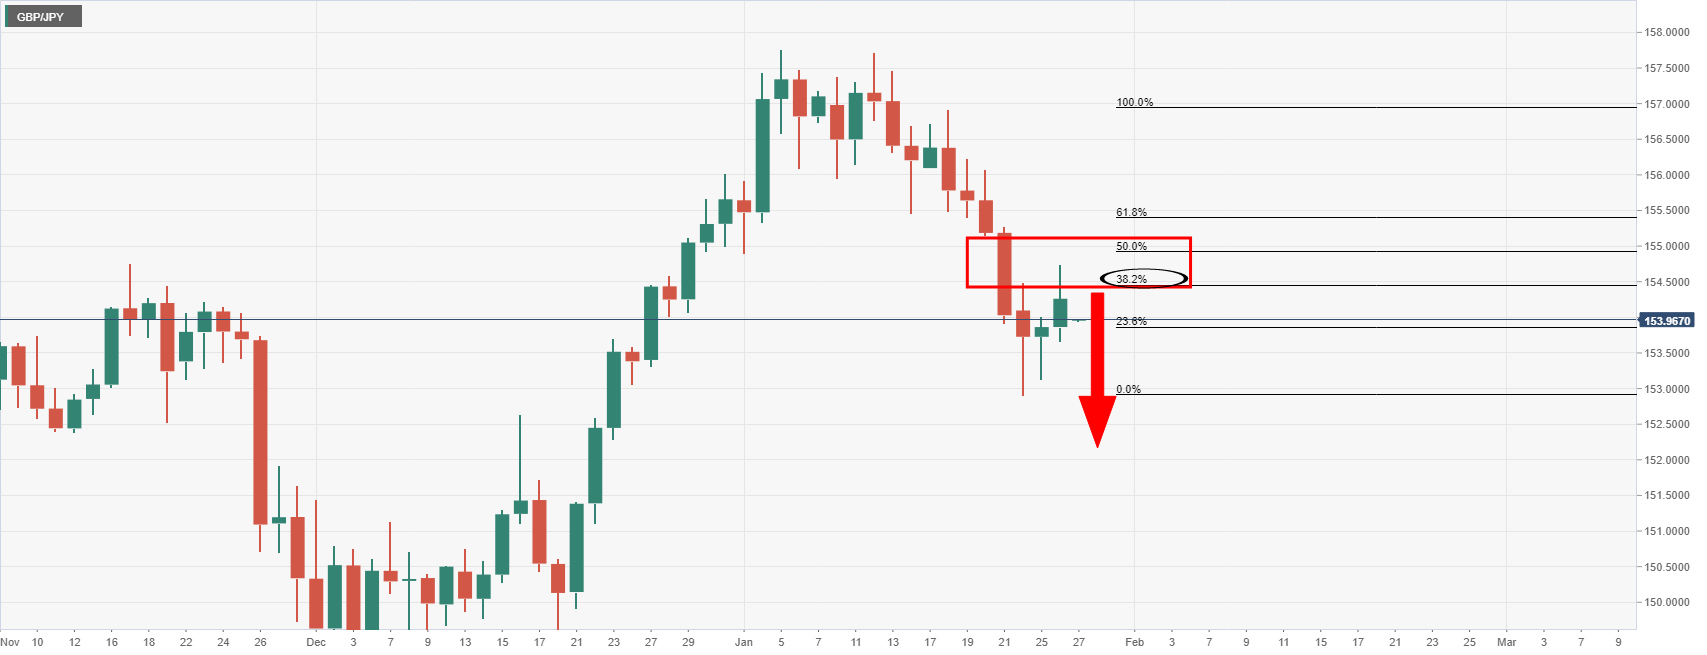
The daily chart is seeing the price attack the downside with the price correcting into a significant Fibonacci level as being the 38.2% ratio. This is a ratio that is renowned to act as resistance following such aggressive impulses.
GBP/JPY H4 chart
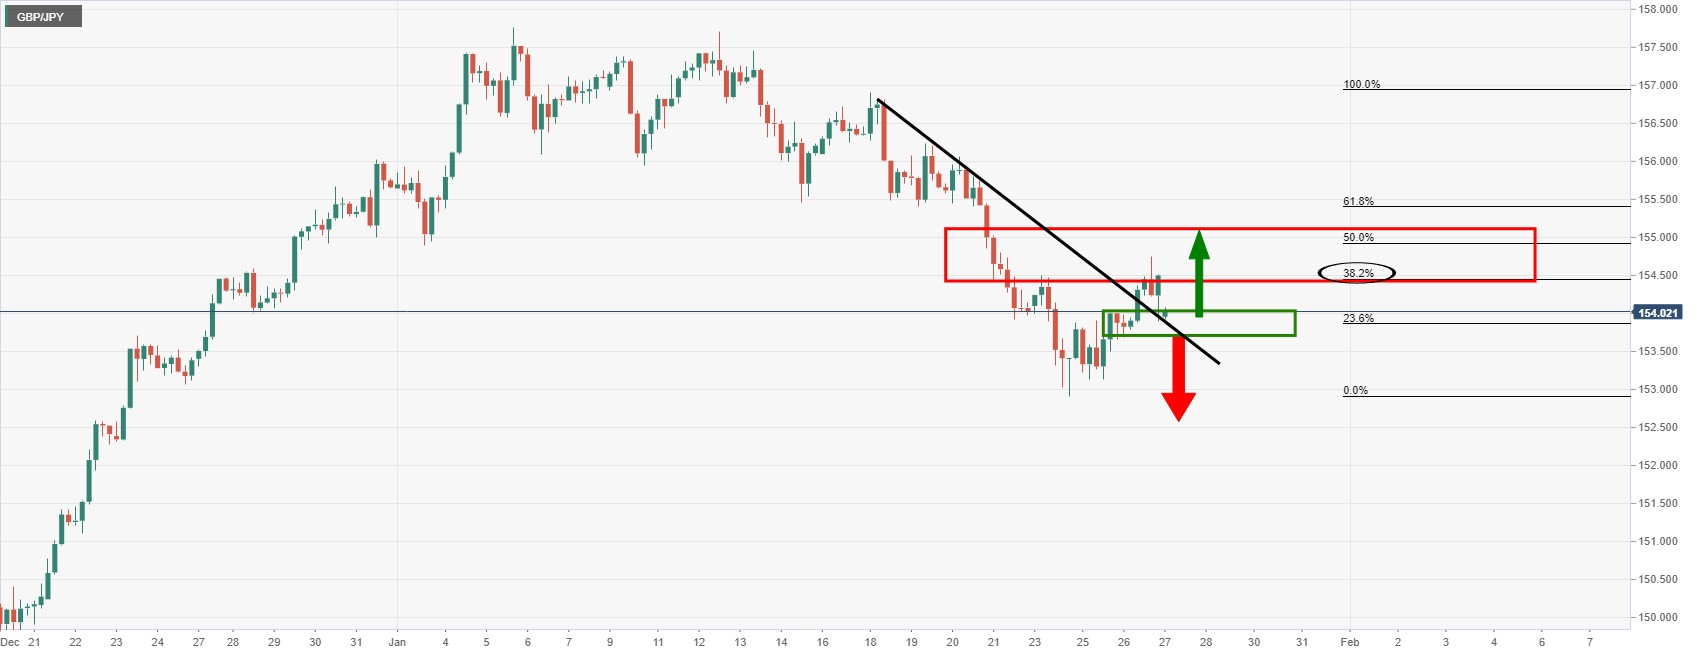
From a 4-hour perspective, the bears will need to clear the horizontal and counter-trendline supports before the price can freely ride lower.
China’s new ambassador to Australia Xiao Qian urges both the countries to get their diplomatic relationship “back to the right track” after more than four years of sourness, per Bloomberg.
Key quotes
The two governments were at a “critical juncture.”
The relationship faced “many difficulties and challenges as well as enormous opportunities and potentials.”
Looked forward “to working with the Australian government and friends in all sectors to increase engagement and communication.”
Australian Trade Minister Dan Tehan said Wednesday that China’s “economic coercion” against the country had been unsuccessful, with no new sanctions being imposed in a year.
Market reaction
AUD/USD is flirting with daily lows near 0.7075, little impressed by encouraging comments from China’s diplomat.
The spot is down 0.46% on the day, currently trading at 0.7079.
- AUD/USD takes offers to refresh multi-day low, down for the second consecutive day.
- S&P 500 Futures drop 1.5%, ASX 200 drops over 10% from monthly peak while declining 2.5% intraday.
- US dollar reacts positively to the hawkish Fed, riskier assets drown.
- Geopolitical and financial fears join Omicron headlines to exert additional downside pressure ahead of US Q4 Advance GDP.
With the post-Fed risk aversion in full steam, AUD/USD drops half a percent to print the biggest daily fall in a week around 0.7080. In doing so, the Aussie pair declines to the lowest levels since December 07 amid the very early Thursday morning in Europe.
In addition to the Fed-led risk-off mood, fears of China’s financial market crackdown due to Evergrande join the Russia-Ukraine tussles and virus woes to add to the AUD/USD weakness.
Recently, Evergrande said it is targeting a restructuring proposal within six months. Elsewhere, the US State Department warned Russia over Nordstorm 2 oil pipeline if it invades Ukraine. Additionally, record high daily covid infection numbers in Japan and heavy pressure on the Aussie medical system due to the South African COVID-19 variant portray the coronavirus woes and weigh on the AUD/USD prices.
It's worth mentioning that China's slowest industrial profit growth in nine months and softer Westpac Leading Index for Australia also weigh on the AUD/USD prices. On the same line were softer-than-previous readings of Aussie Export Price Index and Import Price Index for Q4.
On Wednesday, the US Federal Reserve (Fed) matched wide market expectations to keep benchmark interest rates and tapering targets intact during Wednesday’s Federal Open Market Committee (FOMC) meeting. However, the interesting part from the Monetary Policy Statement was, “The Committee expects it will soon be appropriate to raise the target range for the federal funds rate.”
Amid these plays, S&P 500 Futures drop 1.5% while the US 10-year Treasury yields remain firmer around 1.85%, after rising the most in three weeks the previous day.
At home, Australia’s ASX 200 drops 2.5% intraday at the latest, which in turn signals the Aussie equity benchmark’s more than 10% declines from the monthly high. The reason could be linked to the escalating hopes of the Reserve Bank of Australia’s (RBA) rate hikes.
That said, AUD/USD traders will pay attention to the aforementioned risk catalysts for fresh impulse, mostly to confirm further bearish bias. However, the first readings of the US Q4 GDP and Durable Goods Orders for December will be important to watch afterward.
Technical analysis
Having confirmed a rising wedge bearish chart pattern during the last Friday, AUD/USD prices are vulnerable to drop towards the year 2021 bottom surrounding 0.6990.
| Raw materials | Closed | Change, % |
|---|---|---|
| Brent | 88.63 | 1.89 |
| Silver | 23.506 | -1.38 |
| Gold | 1818.742 | -1.56 |
| Palladium | 2327.53 | 6.21 |
- USD/IDR rises for the second consecutive day to refresh one-week high.
- BI Governor Warjiyo hints at rate hikes during late 2022, Fed announced hawkish halt.
- Risk catalysts may entertain traders ahead of US Q4 Advance GDP, Durable Goods Orders.
USD/IDR stays firmer around the weekly top of $14,403, up 0.10% intraday at $14,380 during Thursday’s Asian session.
In doing so, the Indonesia rupiah (IDR) pair pays little heed to the comments from Bank Indonesia (BI) Governor Pere Warjiyo.
“Indonesia's central bank governor Perry Warjiyo said on Thursday early signs of inflation might be seen at the end of this year and would be the basis for Bank Indonesia (BI) to start considering raising its policy interest rates,” said Reuters. The news adds, “BI will rely more on bond yield differential flexibility to mitigate global spillover from tightening by the U.S. Federal Reserve while it starts ‘normalizing’ excess liquidity Southeast Asia's biggest economy,” per BI Governor Warjiyo.
The USD/IDR pair’s rejection to cheer hawkish comments from BI Governor could be linked to the US Federal Reserve’s (Fed) readiness to lift the benchmark rates amid inflation fears.
The US Federal Reserve (Fed) matched wide market expectations to keep benchmark interest rates and tapering targets intact during Wednesday’s Federal Open Market Committee (FOMC) meeting. However, the interesting part from the Monetary Policy Statement was, “The Committee expects it will soon be appropriate to raise the target range for the federal funds rate.”
Fed Chairman Jerome Powell also spoke in sync with the hawkish signals from the US central bank while saying, “There’s plenty of room to raise rates.” Though, his comments like, “The rate-hike path would depend on incoming data and noted that it is ‘impossible’ to predict,” seemed to have probed the USD/IDR bulls of late.
Read: Fed Quick Analysis: Three dovish moves boost stocks, why more could come, why the dollar could rise
Amid these plays, the US 10-year Treasury yields remain firmer around 1.85% while the US stock futures drop over 1.0% at the latest.
Looking forward, the risk catalysts like Ukraine-Russia tussles and Sino-American tensions, not to forget virus woes, may play an important role in direct short-term USD/IDR moves, major attention will be given to the first readings of the US Q4 GDP and Durable Goods Orders for December for clear direction.
Read: US GDP Preview: Inflation component could steal the show, boost dollar, already buoyed by Russia
Technical analysis
Although sustained trading beyond the 20-DMA level of $14,330 keeps USD/IDR buyers hopeful, a clear upside break of $14,450 horizontal area should challenge the quote’s short-term advances.
Shares of the troubled Chinese real-estate giant, Evergrande Group, is extending losses to the tune of over 9% in Thursday’s trading so far.
The extended sell-off comes after the property developer group said that it is targeting to have a restructuring proposal within six months.
The company made this announcement, in the face of Beijing tightening control over the property developer.
Market reaction
The Asian stock markets are in a sea of red, thanks to the aggressive tightening expectations fuelled by Fed Chair Jerome Powell at Wednesday’s policy announcements.
Dismal earnings reports in Asia combined with the Evergrande news have triggered steep losses in the regional indices.
Hang Seng is down over 2% while the Shanghai Composite Index and the Nikkei 225 lose 0.71% and 2.45% respectively.
- USD/INR rises for the fourth consecutive day on hawkish Fed.
- Two-week-old ascending trend channel may test the bulls, sellers need 74.55 breakout to keep reins.
- Firmer MACD signals, a clear break of 200-SMA favor bulls.
USD/INR stays firmer at the highest levels in five weeks around 75.12 during Thursday’s Asian session.
The Indian rupee (INR) pair renewed multi-day high during the early hours of trading in Asia as US dollar bulls cheered the Federal Reserve’s (Fed) hawkish halt. The greenback strength helped USD/INR prices to rise further beyond the 200-SMA.
Read: Fed Quick Analysis: Three dovish moves boost stocks, why more could come, why the dollar could rise
As the MACD signal joins firmer prices past the key moving average, USD/INR bulls are likely to keep the reins.
However, the resistance line of a fortnight-long ascending trend channel joins the 50% Fibonacci retracement (Fibo.) of December-January downside near 75.20 to portray a short-term key resistance for the USD/INR bulls.
Should the quote rise past $75.20, further upside towards the 61.8% Fibo. level and late December swing high, respectively around 75.50 and 75.90, will be in focus.
Alternatively, pullback moves remain less worrisome until staying beyond 200-SMA and 38.2% Fibonacci retracement level, close to 74.80.
Following that, the support line of the stated bullish channel, close to 74.55, will be crucial to watch for USD/INR bears as a break of which can recall sub-74.00 area to the chart.
USD/INR: Four-hour chart
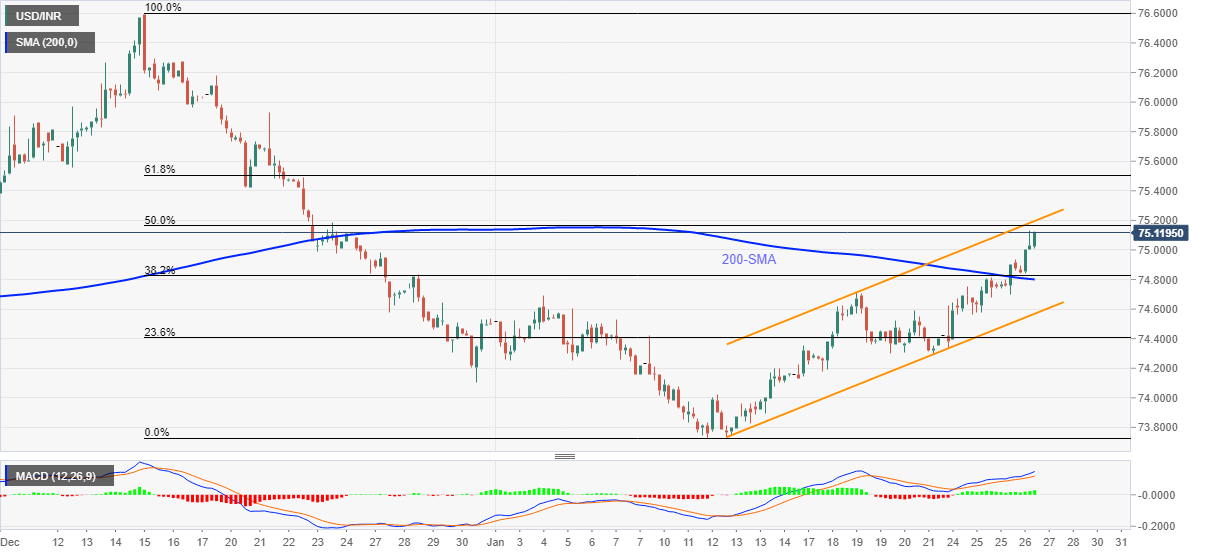
Trend: Further upside expected
- Silver is in the hands of the bears, looking for a deeper test of old resistance.
- Bulls eye the 4-hour resistance structures ahead for prospects of a bullish contiuaiton.
Silver, XAG/USD, has been taken lower by the rise in the US dollar and hawkish comments from the Federal Reserve's chairman, Jerome Powell. The bears are in control and there is a focus on the prior resistances that are currently being challenged in this downside extension.
XAG/USD daily chart
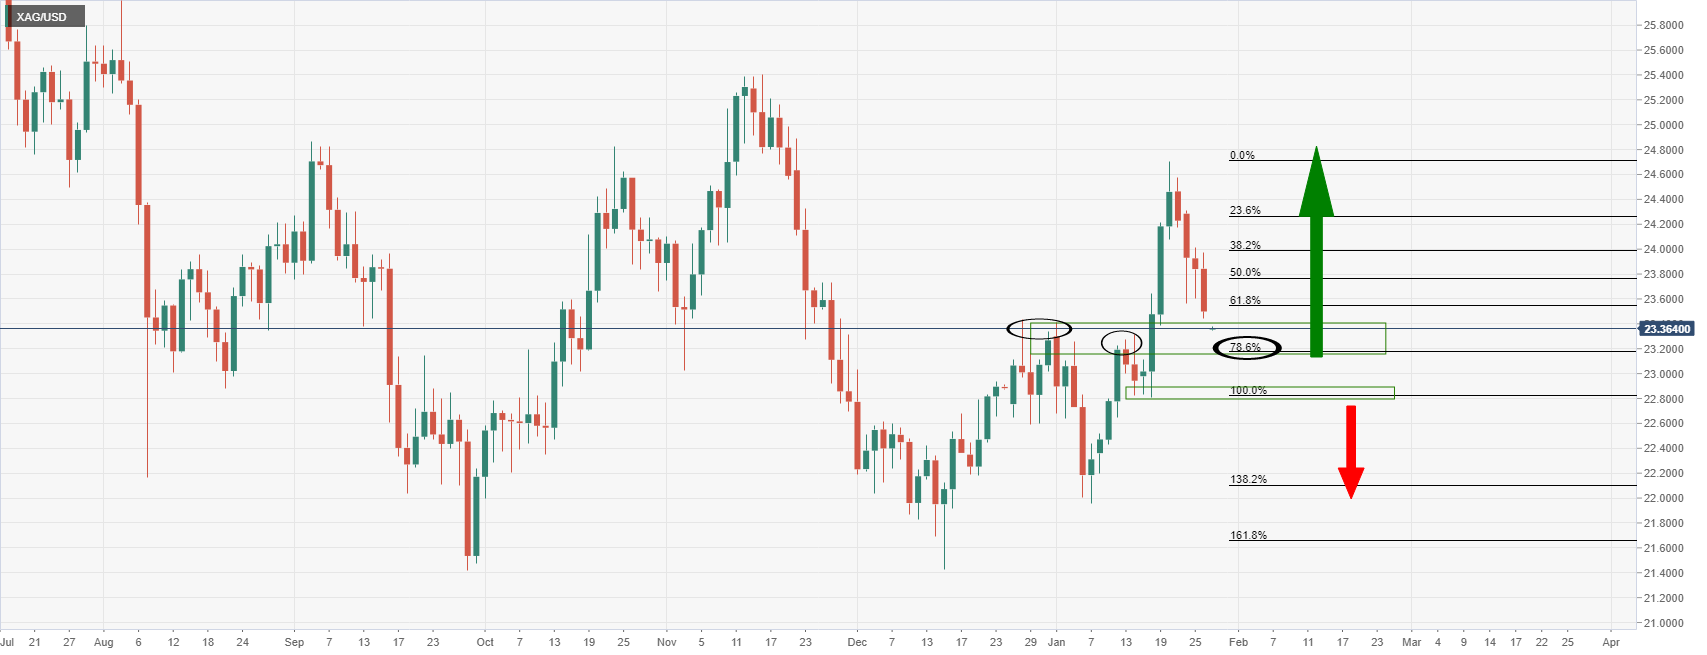
The 78.6% Fibonacci retracement is eyed near 23.20. A commitment for the bulls there will raise prospects of a build back into the 23 and 24 areas for the days ahead. A break above 24 the figure will be essential in this respect:
XAG/USD H4 chart
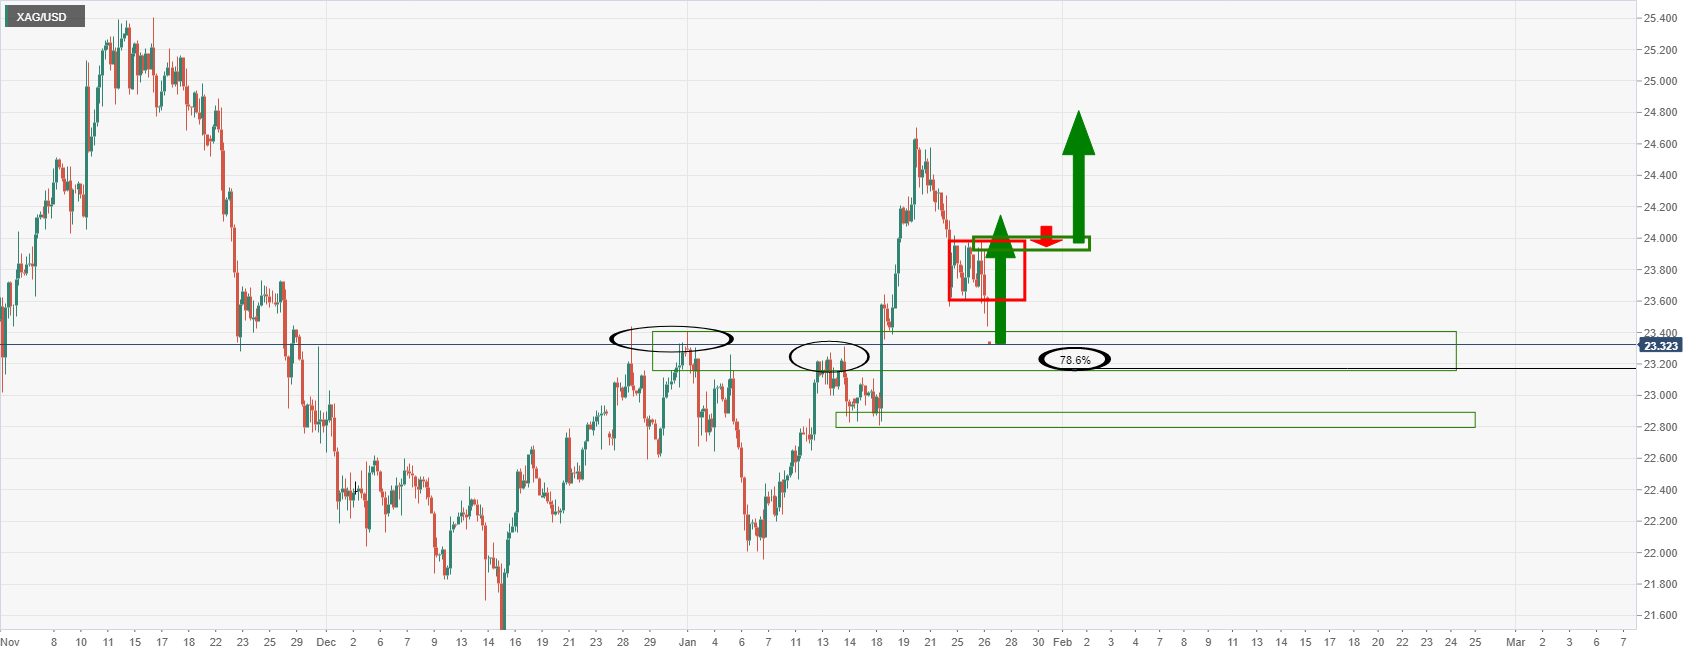
The 4-hour chart shows that there is a structure that the bulls will need to conquer if a bullish daily extension is to evolve over the coming days. This is located between 23.60 and 24.00.
South Korean Vice Finance Minister said on Thursday that they “will act to stabilize market if needed.”
He added that they “will coordinate with Bank of Korea (BOK) to stabilize the government bond market if necessary.”
Market reaction
As of writing, USD/KRW is trading at three-week highs of 1,203.24, up 0.22% on the day, little affected by these above comments.
- USD/TRY holds onto post-Fed advances, recently paring early Asian losses.
- Turkish President Erdogan again criticized higher interest rates, plans alternative debt instruments for investors.
- US T-bond yields, DXY cheer Fed’s hawkish halt with eyes US Q4 Advance GDP, Durable Goods Orders.
USD/TRY picks up bids to $13.60, reversing the early Asian pullback on Thursday, as market players cheer the US Federal Reserve’s (Fed) hawkish play.
In doing so, the Turkish lira (TRY) currency pair ignores comments from President Recep Tayyip Erdogan who “Urges Turks to borrow after unorthodox rate cuts”, per Reuters.
During an interview with NTV, Turkish President Erdogan signaled further steps to relieve the burden of inflation while promising new alternative debt issuance for investors. The national leader reiterated his dislike for higher interest rates while saying, “High-interest rate environment creates a fragile situation.” Additionally, Erdogan also said, per Reuters, that loans will be used to increase production while also showing confidence in the new economic model that will ensure Turkey will be less impacted by speculative moves.
On the other hand, the US Federal Reserve (Fed) matched wide market expectations to keep benchmark interest rates and tapering targets intact during Wednesday’s Federal Open Market Committee (FOMC) meeting. However, the interesting part from the Monetary Policy Statement was, “The Committee expects it will soon be appropriate to raise the target range for the federal funds rate.”
Fed Chairman Jerome Powell also spoke in sync with the hawkish signals from the US central bank while saying, “There’s plenty of room to raise rates.” Though, his comments like, “The rate-hike path would depend on incoming data and noted that it is ‘impossible’ to predict,” were taken with a pinch of salt.
Amid these plays, US equities and commodities remained on the back foot, except for oil, whereas the US 10-year Treasury yields rose the most in three weeks, up eight basis points (bps) to 1.87% by the end of Wednesday’s North American session. That said, the US T-bond yields stay firmer around 1.85% while the S&P 500 Futures drop 0.65% by the press time.
Looking forward, comments from Turkey and geopolitical tension surrounding Russia and China may entertain USD/TRY traders. However, major attention will be given to the first readings of the US Q4 GDP and Durable Goods Orders for December.
Technical analysis
Unless successfully crossing a five-week-old descending trend line, around $13.70 at the latest, USD/TRY remains lackluster. That said, the 21-DMA level of $13.51 and the mid-January lows near $13.15 could challenge the pair bears.
| Time | Country | Event | Period | Previous value | Forecast |
|---|---|---|---|---|---|
| 00:30 (GMT) | Australia | Export Price Index, q/q | Quarter IV | 6.2% | |
| 00:30 (GMT) | Australia | Import Price Index, q/q | Quarter IV | 5.4% | |
| 07:00 (GMT) | Germany | Gfk Consumer Confidence Survey | February | -6.8 | -7.8 |
| 07:00 (GMT) | Switzerland | Trade Balance | December | 4.2 | |
| 11:00 (GMT) | United Kingdom | CBI retail sales volume balance | January | 8 | 13 |
| 13:30 (GMT) | U.S. | Continuing Jobless Claims | January | 1635 | 1650 |
| 13:30 (GMT) | U.S. | PCE price index, q/q | Quarter IV | 5.3% | |
| 13:30 (GMT) | U.S. | Initial Jobless Claims | January | 286 | 260 |
| 13:30 (GMT) | U.S. | Durable goods orders ex defense | December | 2% | |
| 13:30 (GMT) | U.S. | Durable Goods Orders ex Transportation | December | 0.8% | 0.4% |
| 13:30 (GMT) | U.S. | Durable Goods Orders | December | 2.5% | -0.5% |
| 13:30 (GMT) | U.S. | GDP, q/q | Quarter IV | 2.3% | 5.5% |
| 15:00 (GMT) | U.S. | Pending Home Sales (MoM) | December | -2.2% | 0.4% |
| 23:30 (GMT) | Japan | Tokyo CPI ex Fresh Food, y/y | January | 0.5% | 0.3% |
| 23:30 (GMT) | Japan | Tokyo Consumer Price Index, y/y | January | 0.8% |
In recent trade today, the People’s Bank of China (PBOC) set the yuan (CNY) at 6.3382 vs the last close of 6.3206 and estimate at 6.3333. Yesterday was the strongest fix since April 2018.
About the fix
China maintains strict control of the yuan’s rate on the mainland.
The onshore yuan (CNY) differs from the offshore one (CNH) in trading restrictions, this last one is not as tightly controlled.
Each morning, the People’s Bank of China (PBOC) sets a so-called daily midpoint fix, based on the yuan’s previous day closing level and quotations taken from the inter-bank dealer.
- Bears have eyes on 0.70 the figure on a break of current support,
- There could be a meanwhile correctio back to 0.7120 in the meantime.
As per the prior analysis, AUD/USD Price Analysis: Bulls going against the grain to M-formation neckline target, and AUD/USD depends on the Fed, but bears are waiting in the wings for downside daily extension, the price has deteriorated.
AUD/USD prior analysis
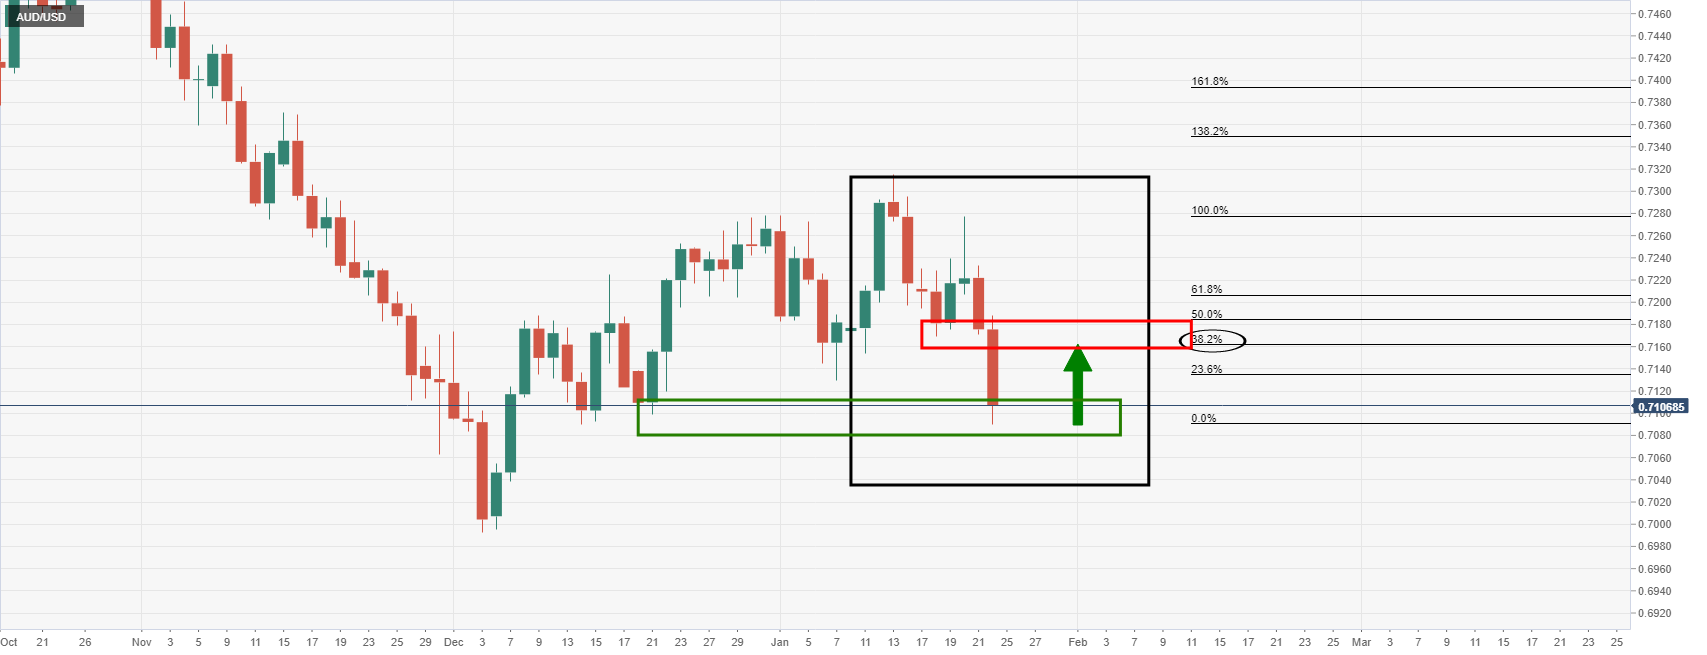
The M-formation was neckline was identified as a bullish target:
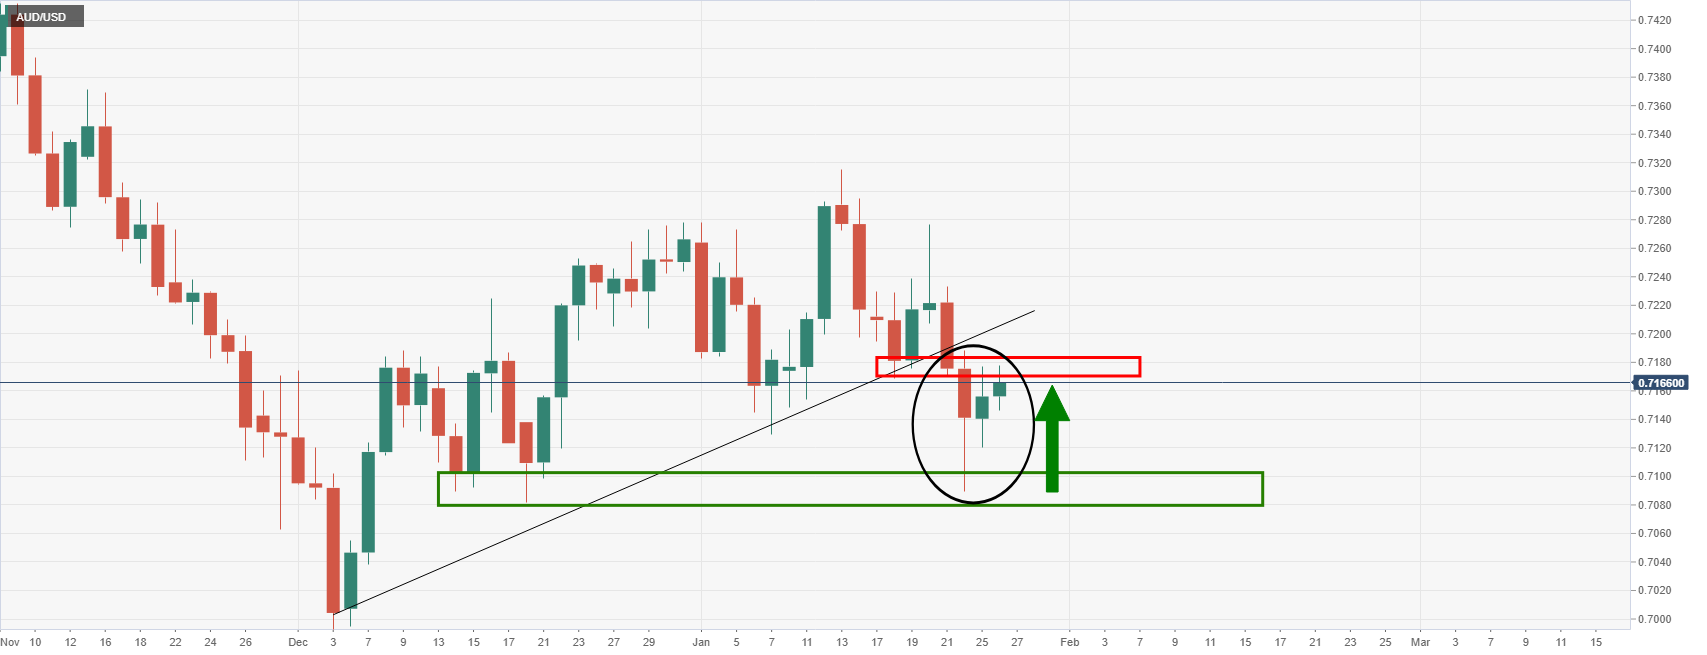
The Fed was a potential catalyst for the bearish daily extension:
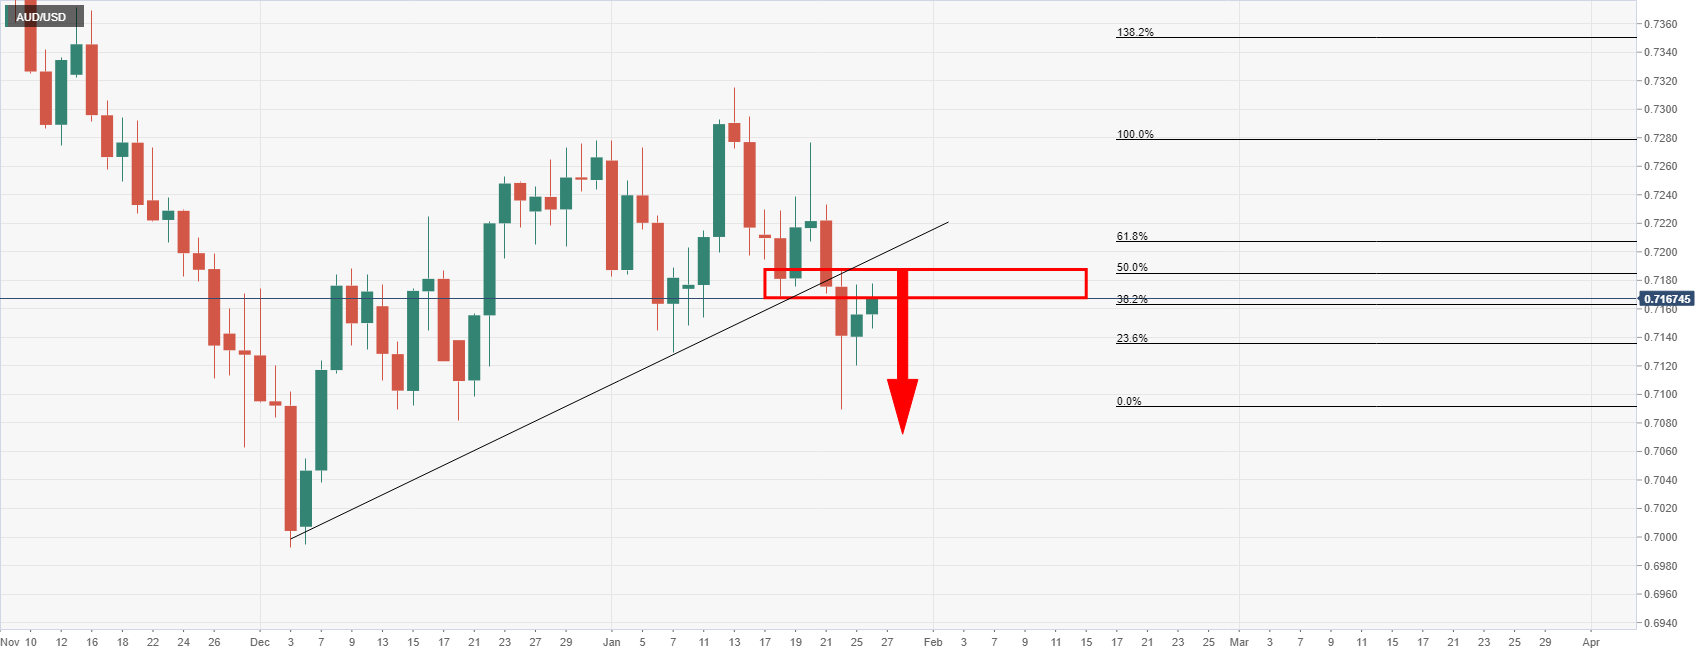
AUD/USD live market
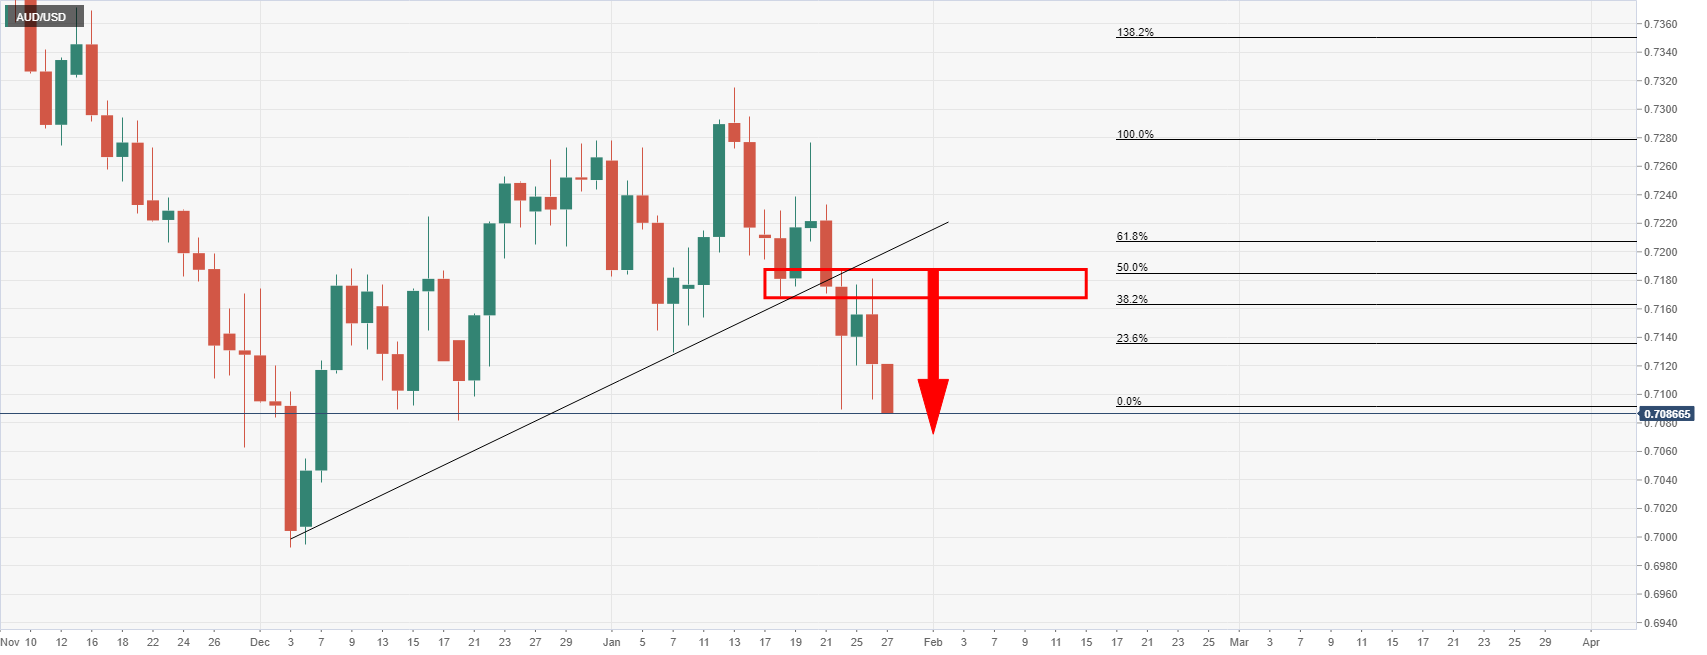
AUD/USD has met the downside target as illustrated above and would be now expected to hold at this level of support:
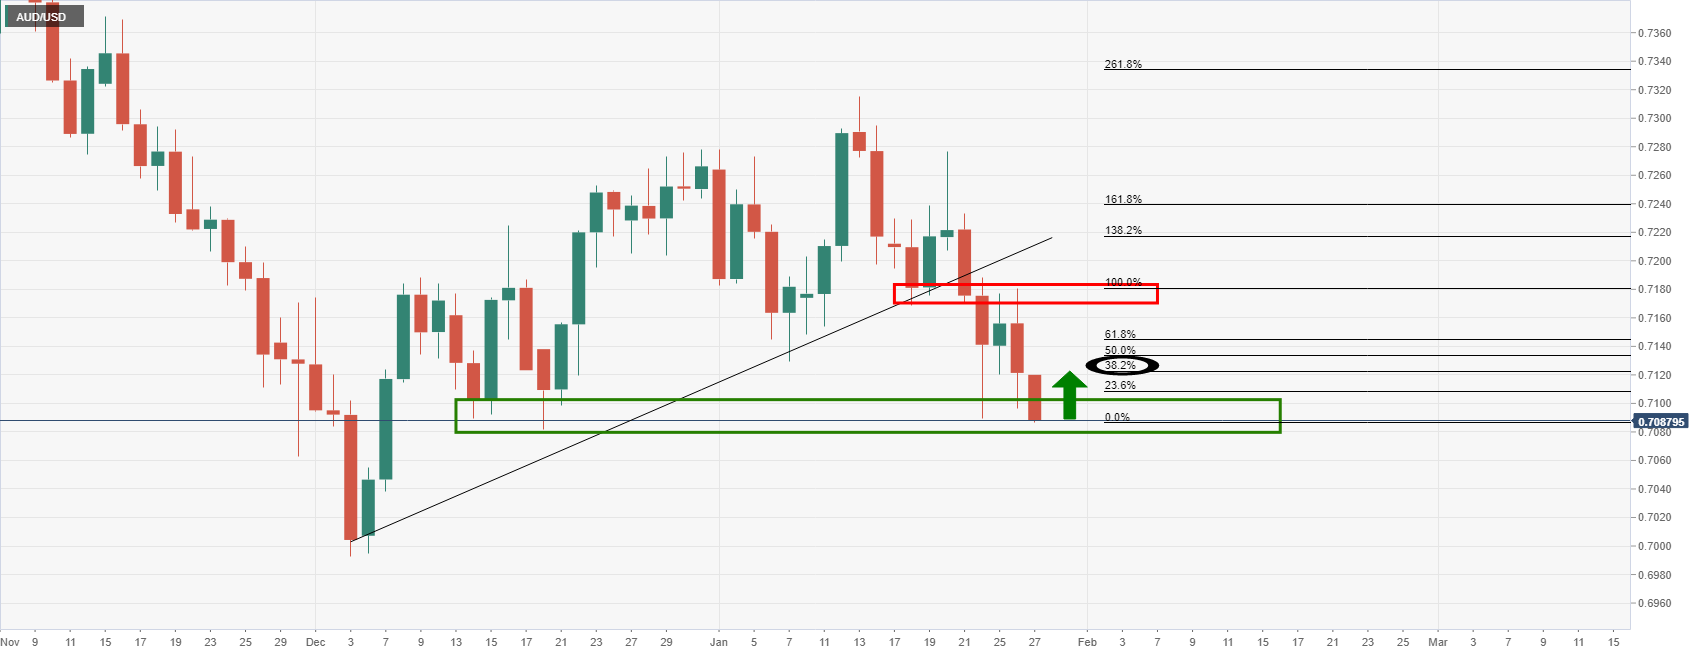
The 38.2% Fibonacci is compelling at this juncture neat 0.7120. On the other hand, if the bears commit, then a break of support opens risk to test 0.70 the figure in the coming sessions.
- NZD/USD takes offers to refresh 14-month low during a six-day downtrend.
- RSI conditions may test bears around the key support line.
- December 2021 low, bearish MACD signals will challenge recovery moves.
NZD/USD stands on slippery grounds while declining to the fresh low since November 2020, down 0.35% intraday around 0.6630 amid early Thursday morning.
Given the quote’s sustained trading below the year 2021 low, coupled with the bearish MACD signals, NZD/USD prices are likely to remain weak.
However, oversold RSI conditions may challenge the pair sellers around a descending support line from late September, near 0.6610.
Should the quote keep declining below 0.6610, the 0.6600 round figure and lows marked during November 2020 around 0.6590 will probe the NZD/USD bears.
Meanwhile, an upside clear break of the 2021 low near 0.6700 will aim for a two-week-old resistance line near 0.6725.
It’s worth noting, however, that the NZD/USD bull’s dominance past 0.6725 will highlight a two-month-old resistance line near 0.6795-6800.
NZD/USD: Daily chart
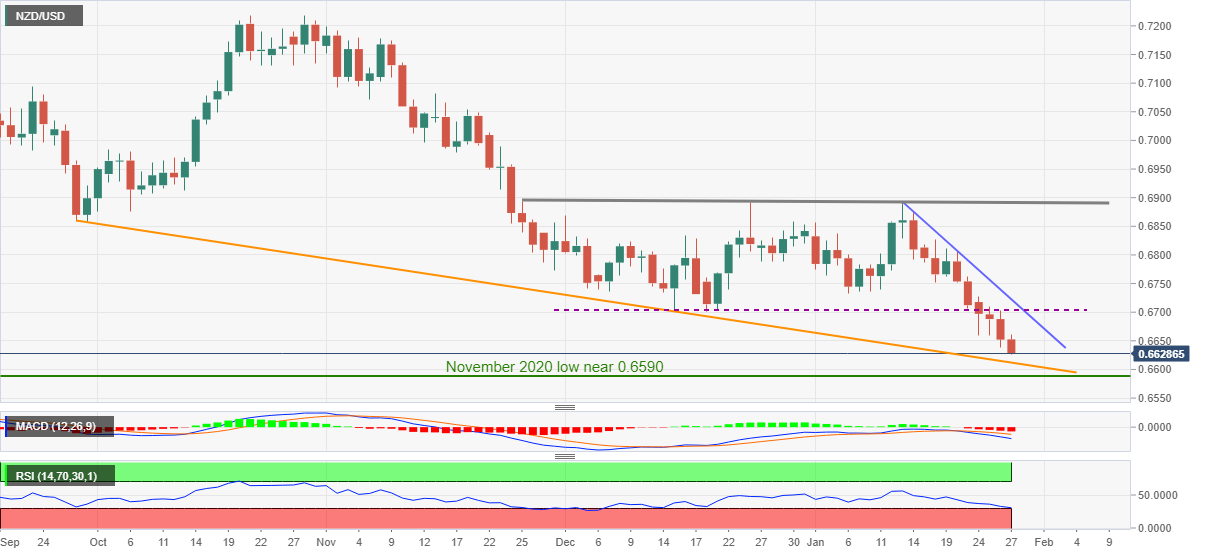
Trend: Further weakness expected
- DXY struggles to extend latest gains after rising the most in three weeks.
- Fed matched market consensus of flagging faster rate hikes but Powell’s cautious optimism probes bulls afterward.
- Fears emanating from Russia, virus woes and Sino-American tensions join hawkish Fed to keep greenback buyers hopeful.
- US Q4 Advance GDP, Durable Goods Orders for December will offer more details for bulls.
US Dollar Index (DXY) seesaws around the monthly high of 96.53, recently easing to 96.50 during Thursday’s Asian session.
The greenback gauge justified hawkish Fed comments as it rose the most since January 03 the previous day. In doing so, the quote crossed a short-term key trend line resistance and refreshed the monthly peak.
The US Federal Reserve (Fed) matched wide market expectations to keep benchmark interest rates and tapering targets intact during Wednesday’s Federal Open Market Committee (FOMC) meeting. However, the interesting part from the Monetary Policy Statement was, “The Committee expects it will soon be appropriate to raise the target range for the federal funds rate.”
Fed Chairman Jerome Powell also spoke in sync with the hawkish signals from the US central bank while saying, “There’s plenty of room to raise rates.” Though, his comments like, “The rate-hike path would depend on incoming data and noted that it is ‘impossible’ to predict,” seemed to have probed the greenback bulls afterward.
Adding to the market fears and stopping the US Dollar Index is the warning from the US State Department, “If Russia invades Ukraine one way or another, Nord Stream 2 will not move forward,” per Reuters. On the same line are the recently escalating tensions between the US and China over trade and Taiwan issues. Furthermore, worsening virus conditions in Asia also seem to stop the US Treasury yields from rising further of late.
That said, the Wall Street benchmarks and commodities remained on the back foot, except for oil, following the Fed’s verdict whereas the US 10-year Treasury yields rose the most in three weeks, up eight basis points (bps) to 1.87% by the end of Wednesday’s North American session. It should be observed that the US T-bond yields ease to 1.84% while the S&P 500 Futures print mild gains by the press time.
Although the risk catalysts like Ukraine-Russia tussles and Sino-American tensions, not to forget virus woes, may play a notable role to direct short-term USD/JPY moves, major attention will be given to the first readings of the US Q4 GDP and Durable Goods Orders for December for fresh impulse.
Read: US GDP Preview: Inflation component could steal the show, boost dollar, already buoyed by Russia
Technical analysis
A clear upside break of a two-month-long resistance line, now support around 96.28, favor US Dollar Index bulls to aim for the 2021 peak near the 97.00 threshold.
- GBP/USD remains on the back foot around short-term critical supports.
- Downbeat MACD lines, failure to keep the bounce off one-month-old horizontal support area favor bears.
- Bulls need to cross fortnight-old resistance line to retake control.
GBP/USD battles key supports as sellers poke 1.3460 during early Thursday.
The cable pair broke the 200-SMA following the US Federal Reserve’s (Fed) hawkish verdicts. However, clear trading beneath the same becomes necessary to convince the bears.
Other than the sustained trading below the 200-SMA level of 1.3478, GBP/USD sellers also need to conquer the horizontal area from December 23, around 1.3435-30, to stay in the driver’s seat.
Given the bearish MACD signals and the pair’s latest pullback, GBP/USD prices are likely to conquer the aforementioned supports, which in turn will direct the quote towards 61.8% Fibonacci retracement of December 2021 to January 2022 upside, around 1.3385.
Following that, the mid-December high near 1.3375 can act as a validation point to the south-run targeting the 1.3300 threshold.
Alternatively, recovery moves need to stay beyond the 200-SMA level of 1.3478 to challenge the 38.2% Fibo. level near 1.3525.
Though, GBP/USD bulls remain unconvinced till the quote stays below a two-week-long descending trend line, around 1.3575 by the press time.
GBP/USD: Four-hour chart
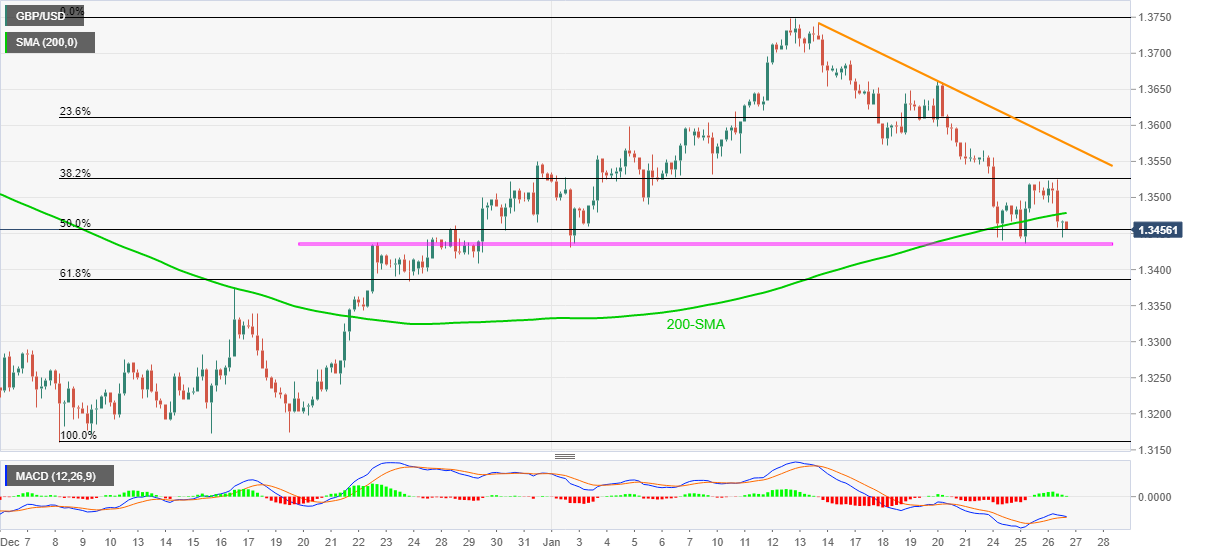
Trend: Further weakness expected
- Gold fell heavily following hawkish remarks from the Federal Reserve's chairman.
- XAU/USD bears throw in the towel near a critical support area.
- The focus is on a significant correction back towards $1,830.
At $1,820, Gold, (XAU/USD) is virtually flat in Tokyo following market volatility overnight. Jerome Powell surprised markets with a hawkish pivot, commenting that the Fed could raise rates at every meeting if need be.
Additionally, Powell said in the presser that the Fed could move faster and sooner than they did the last time which helped the US dollar to extend on pre presser gains as US 2-year yields jumped the biggest one day gain since 2020. The US dollar rose to a five-week high:
DXY M5 chart, US session
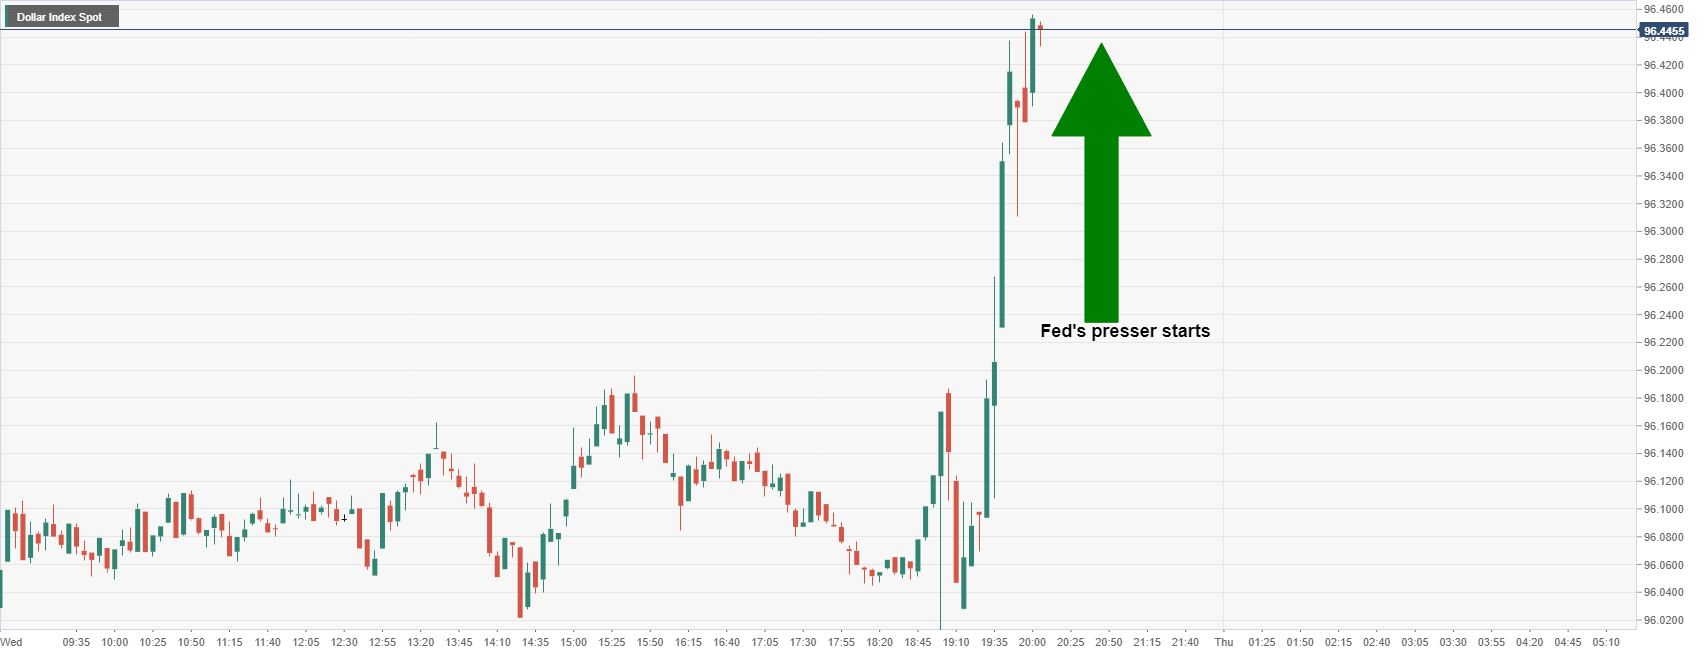
''Today’s announcement from the Fed is expected to prepare the market for a March rate hike and confirm QE will end before then. The tone set by Powell will be closely watched for any signals as to how quickly the Fed intends to par back its balance sheet,'' analysts at ANZ Bank exlained.
''Several members of the Federal Open Market Committee (FOMC) have already indicated they support a March rate hike. Inflation has been stronger than anticipated, wage inflation is increasing and the falling unemployment rate now sets the scene for the FOMC to signal that rate hikes, in March, are on the cards.''
US Treasury yields across the curve jumped and added to gains when the Fed chairman added colour to the statement that said US interest rates would rise "soon", adding that it will end its asset purchase program in early March.
The Fed, however, did not set a specific date for raising interest rates. With that being said, federal funds futures have fully priced in a quarter-point tightening for the Fed's March meeting, and another three hikes for 2022.
Powell was uber hawkish in his comments around raising rates at every meeting. "Quite a bit of room to raise rates without hurting jobs'', he added.
Fed's Powell's key comments
- We are of the mind to raise rates at the March meeting.
- The current economy means we can move sooner, perhaps faster than we did last time.
- The next meeting will be coming to more of the details on the Balance Sheet.
- Other forces this year should also bring down inflation.
- Quite a bit of room to raise rates without dampening employment.
- No decision made on policy path, path to be led by incoming data.
As a consequence, the benchmark US 10-year yield rose to 1.855%. The US 30-year yields were moved to 2.172% and on the front end of the curve, US 2-year yields shot up to 1.095%.
Equity markets rallied ahead of the FOMC statement but soon ran into sellers following the combination of the statement and Powell's hawkish comments.
Fed's statement, key takeaways
- A rather mixed and fairly dovish statement ticked some of the boxes as follows:
- As expected, the benchmark interest rate was unchanged; The Target Range stands at 0.00% - 0.25% - Interest Rate on Excess Reserves is also unchanged at 0.15%.
- There were no mentions of early rate hikes, let alone a 50bp hike (which some analysts have been expecting).
- QE is not indicated to end early either and that the balance sheet shrinking would start after rate hikes commence.
- The Fed has warned that soon it will be appropriate to raise rates.
- The Fed has stated that both the economy/employment have strengthened and that jobs gains are solid.
- "Overall financial conditions remain accommodative, in part reflecting policy measures to support the economy and the flow of credit to US households and businesses," is an unchanged statement that indicates we are no closer to lift off than of the prior meeting.
- Subsequent to this statement, Fed's funds futures are looking for four rate hikes for this year.
US stocks slid when Powell reinforced expectations for a March interest rate hike. The Nasdaq Composite ended near flat at 13,542.12, Microsoft helped the index keep out of negative territory though. The S&P 500 ended 0.2% lower at 4,349.93 and the Dow Jones Industrial Average was also bleeding, ending down 0.4% to 34,168.09.
XAU prices were steady leading into Powell’s press conference following the FOMC meeting. However, his comments that rates could rise sharply saw gold prices sell off sharply late in the session.
''Certainly, markets have priced-in a March hike for some time, which takes the sting out of the hiking signals, but evidence that quantitative tightening might be more impactful for asset prices suggests that this axis will still be relevant,'' analysts at TD Securities explained.
''With little additional information provided about the pace of quantitative tightening, the complex should continue to struggle to attract capital in the face of a hawkish Fed. In this context, while gold ETFs recorded massive inflows last week, these may have been distorted by options-related activity, with the concurrent rise in volatility suggesting only some mild safe-haven flows,'' the analysts added.
''The evidence continues to overwhelmingly point to Chinese purchases as the single largest source of inflows, which are vulnerable with Lunar New Year around the corner. CTA trend followers are set to liquidate some gold length should prices break below $1810/oz.''
Gold technical analysis
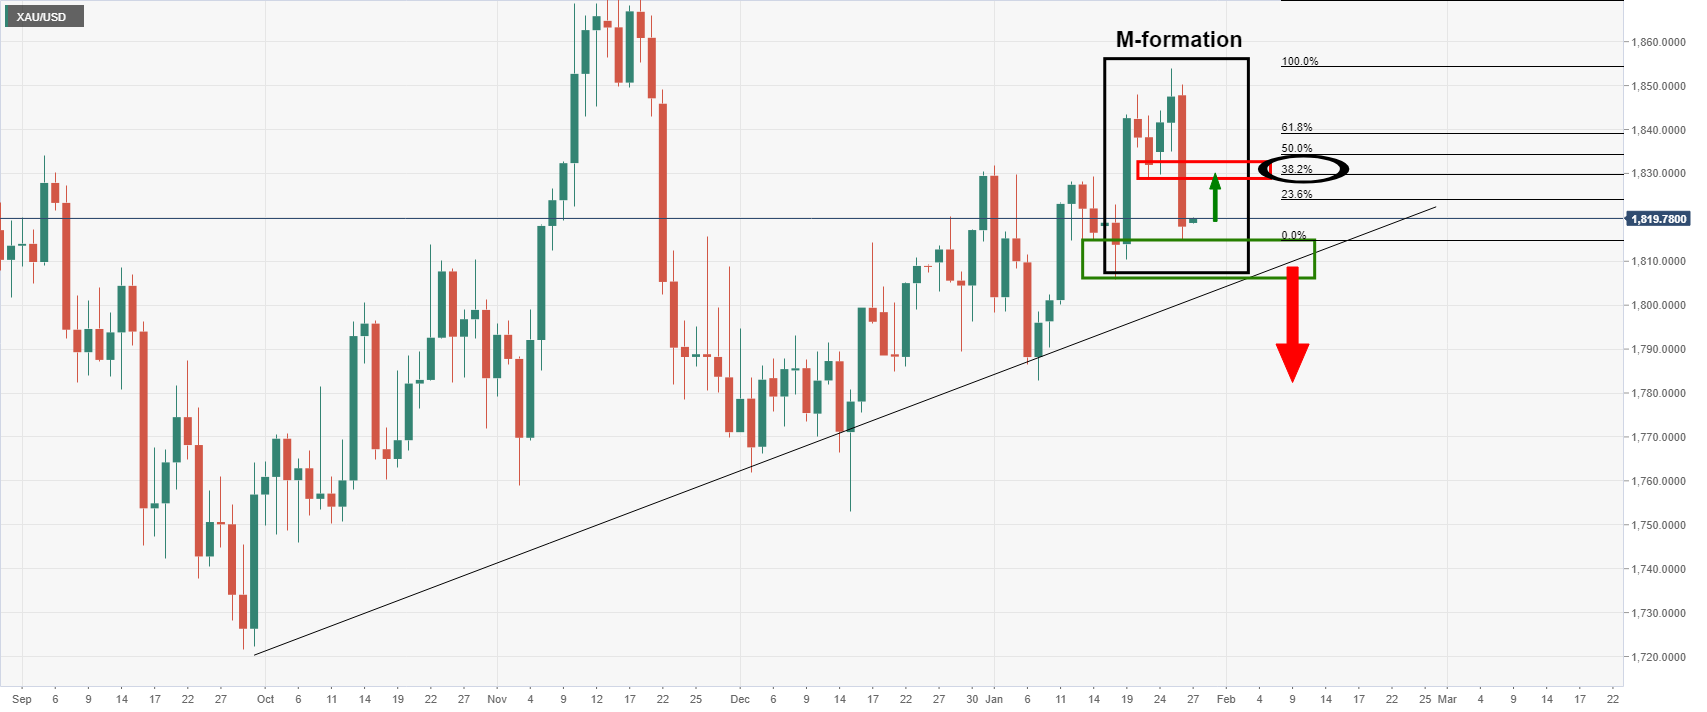
The price of gold has left an M-formation on the daily chart. This is a reversion pattern and has a high completion rate of the price being drawn back to test the neckline of the M-formation.
As it stands, the 38.2% Fibonacci retracement level has a direct influence on the neckline, which adds extra confluence as an attractive bullish corrective target for the days ahead near $1,830. Alternatively, a break of $1,810 and the trendline support opens significant risk to the downside.
- USD/JPY takes the bids to refresh weekly top, jumped the most in 14 days post-Fed.
- US T-bond yields printed heaviest daily jump in three weeks after Fed matched upbeat market expectations.
- Japan reports record daily covid infections, BOJ also accepts Omicron fears.
- Advance readings of US Q4 GDP, Durable Goods Orders will be watched for fresh impulse, risk catalysts are important too.
USD/JPY justifies hawkish Fed showdown while taking the bids near 114.75, up 0.15% intraday to refresh weekly top as Tokyo opens for Thursday.
The yen pair rose the most in three weeks after the US Federal Reserve (Fed) matched hawkish expectations by the market as it flagged interest rate hikes amid inflation woes.
The US Federal Reserve (Fed) kept benchmark interest rates and tapering targets intact during Wednesday’s Federal Open Market Committee (FOMC) meeting. However, the interesting part from the Monetary Policy Statement was, “The Committee expects it will soon be appropriate to raise the target range for the federal funds rate.”
Fed Chairman Jerome Powell also spoke in sync with the hawkish signals from the US central bank while saying, “There’s plenty of room to raise rates.” Though, his comments like, “The rate-hike path would depend on incoming data and noted that it is ‘impossible’ to predict,” seemed to have probed the USD/JPY bulls afterward before the latest run-up.
Read: Fed Quick Analysis: Three dovish moves boost stocks, why more could come, why the dollar could rise
It’s worth noting that the US warning to scrap Nordstorm 2 oil pipeline deal with Russia if it invades Ukraine and the record high covid numbers in Japan are likely to act as immediate challenges for the risk appetite and the USD/JPY pair.
“Japan's daily count of new COVID-19 cases hit yet another record of over 70,000 on Wednesday as the more transmissible Omicron variant continues its rapid spread in Tokyo and elsewhere,” said Kyodo News.
Talking about the data, US housing numbers improved in December whereas Japan’s Foreign Bond Investment shrunk to negative and the Foreign Investment in Japan Stocks reversed the previous contraction with ¥10.2B level.
Against this backdrop, US equities and commodities remained on the back foot, except for oil, whereas the US 10-year Treasury yields rose the most in three weeks, up eight basis points (bps) to 1.87% by the end of Wednesday’s North American session. That said, the US T-bond yields stay firmer around 1.87% while the S&P 500 Futures print mild gains by the press time.
Looking forward, risk catalysts like Ukraine-Russia tussles and Sino-American tensions, not to forget virus woes, may play a notable role to direct short-term USD/JPY moves but major attention will be given to the first readings of the US Q4 GDP and Durable Goods Orders for December.
Read: US GDP Preview: Inflation component could steal the show, boost dollar, already buoyed by Russia
Technical analysis
USD/JPY pair’s daily closing beyond a three-week-old resistance line, now support near 114.15, directs the quote towards the mid-month top of 115.06.
| Pare | Closed | Change, % |
|---|---|---|
| AUDUSD | 0.71155 | -0.42 |
| EURJPY | 128.901 | 0.19 |
| EURUSD | 1.12421 | -0.5 |
| GBPJPY | 154.387 | 0.45 |
| GBPUSD | 1.34638 | -0.27 |
| NZDUSD | 0.66537 | -0.44 |
| USDCAD | 1.26624 | 0.3 |
| USDCHF | 0.92411 | 0.66 |
| USDJPY | 114.665 | 0.71 |


© 2000-2026. Sva prava zaštićena.
Sajt je vlasništvo kompanije Teletrade D.J. LLC 2351 LLC 2022 (Euro House, Richmond Hill Road, Kingstown, VC0100, St. Vincent and the Grenadines).
Svi podaci koji se nalaze na sajtu ne predstavljaju osnovu za donošenje investicionih odluka, već su informativnog karaktera.
The company does not serve or provide services to customers who are residents of the US, Canada, Iran, The Democratic People's Republic of Korea, Yemen and FATF blacklisted countries.
Izvršenje trgovinskih operacija sa finansijskim instrumentima upotrebom marginalne trgovine pruža velike mogućnosti i omogućava investitorima ostvarivanje visokih prihoda. Međutim, takav vid trgovine povezan je sa potencijalno visokim nivoom rizika od gubitka sredstava. Проведение торговых операций на финанcовых рынках c маржинальными финанcовыми инcтрументами открывает широкие возможноcти, и позволяет инвеcторам, готовым пойти на риcк, получать выcокую прибыль, но при этом неcет в cебе потенциально выcокий уровень риcка получения убытков. Iz tog razloga je pre započinjanja trgovine potrebno odlučiti o izboru odgovarajuće investicione strategije, uzimajući u obzir raspoložive resurse.
Upotreba informacija: U slučaju potpunog ili delimičnog preuzimanja i daljeg korišćenja materijala koji se nalazi na sajtu, potrebno je navesti link odgovarajuće stranice na sajtu kompanije TeleTrade-a kao izvora informacija. Upotreba materijala na internetu mora biti praćena hiper linkom do web stranice teletrade.org. Automatski uvoz materijala i informacija sa stranice je zabranjen.
Ako imate bilo kakvih pitanja, obratite nam se pr@teletrade.global.
транcфери