- Analiza
- Novosti i instrumenti
- Vesti sa tržišta
Forex-novosti i prognoze od 25-01-2022
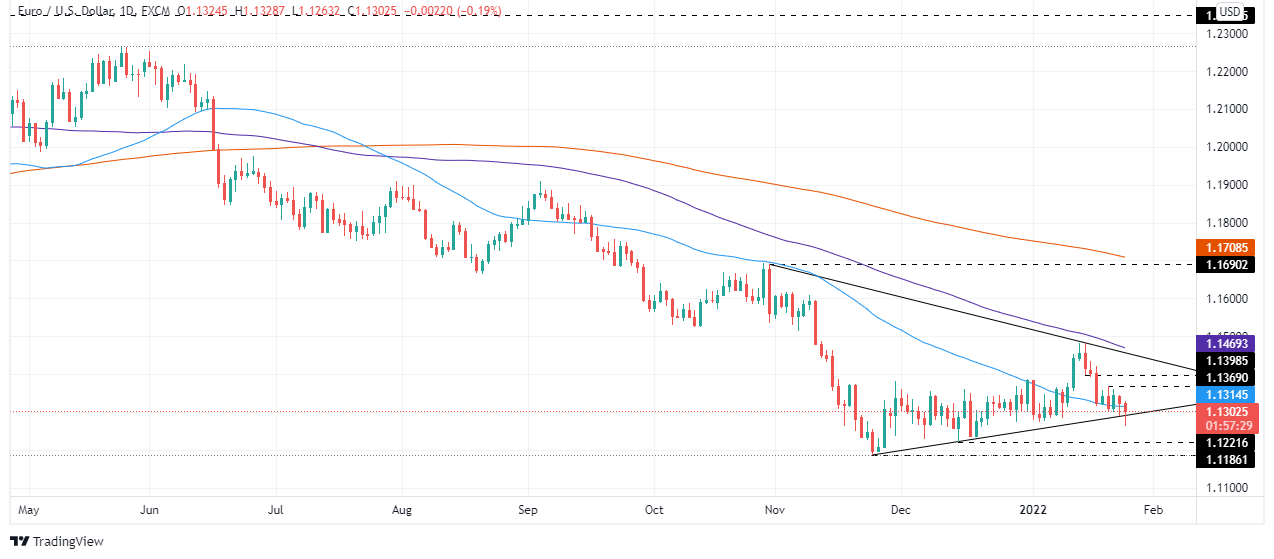
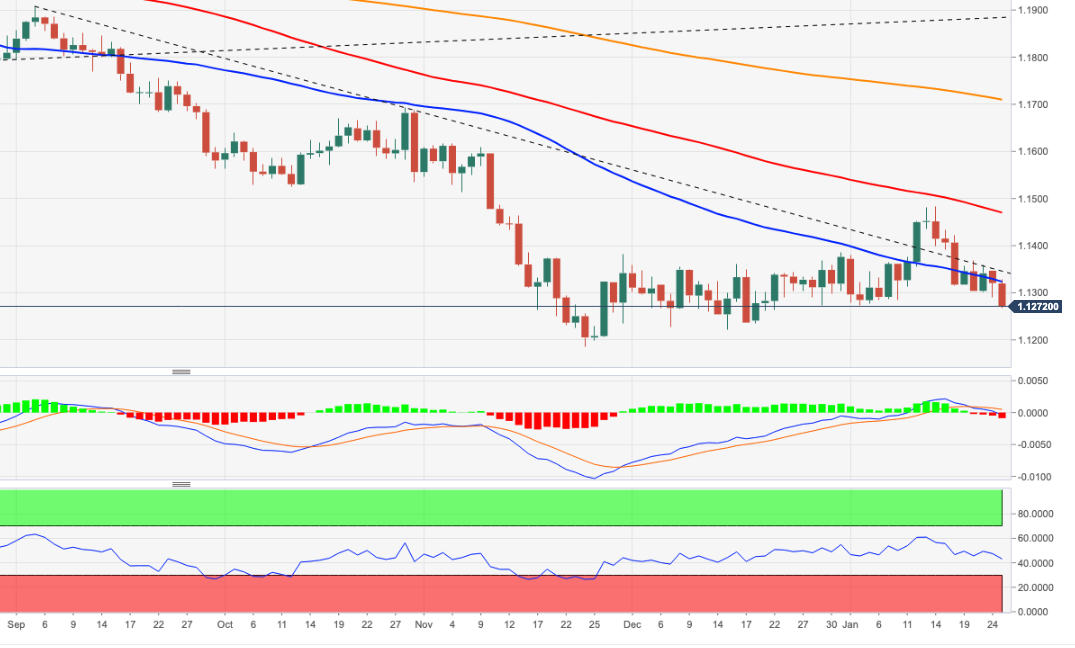
- EUR/USD struggles to keep the bounce off two-month-old support line.
- Risk sentiment dwindles amid pre-Fed anxiety, Russia-Ukraine tension and IMF’s growth forecasts.
- ECB’s Lane rejects hawkish calls due to Omicron, adding to bearish bias.
EUR/USD dribbles around 1.1300, following a two-day decline to the five-week low. In doing so, the major currency pair struggles to keep the previous day’s corrective pullback as market players brace for the Federal Open Market Committee (FOMC) meeting.
In addition to the pre-Fed fears, the European Central Bank (ECB) Chief Economist Philip Lane’s rejection of Omicron-linked inflation fears also weighs on the EUR/USD prices. “The coronavirus Omicron variant is not turning out to be a factor that will influence the activity levels for the year,” said the policymaker.
On a different page, firmer German and Eurozone IFO numbers joined downbeat US CB Consumer Confidence and Richmond Fed Manufacturing Index to lift the EUR/USD pair. However, the upbeat US inflation expectations, per the 10-year breakeven inflation rate per the St. Louis Federal Reserve (FRED) data, kept sellers in control.
Elsewhere, global ire towards Russia, on not backing down, joins the downbeat economic forecasts by the International Monetary Fund (IMF) to exert additional downside pressure on the EUR/USD prices.
Against this backdrop, Wall Street closed in red and the US 10-year Treasury yields printed the least daily losses after a four-day downtrend. That said, prices of gold and oil gained.
Moving on, second-tier US data relating to housing and trade may entertain EUR/USD traders but the Fed’s verdict is crucial as markets await March rate-hike hints.
Read: Federal Reserve Interest Rate Decision Preview: Inflation, Omicron and equities
Technical analysis
Although EUR/USD bounces off an upward sloping trend line from late November, a one-week-old resistance line and 20-DMA, respectively around 1.1320 and 1.1345, challenge the quote’s short-term recovery moves.
If at all the major currency pair rises past 1.1345, the 38.2% Fibonacci retracement (Fibo.) of October-November 2021 downside, near 1.1380, will be the key as it holds the gate for the pair’s further rally towards the monthly high of 1.1481.
Alternatively, multiple lows marked since late November highlight 1.1230 as the next support following the EUR/USD pair’s clear downside break of 1.1290.
Should the pair bears keep reins past 1.1230, the year 2021 low near 1.1185 will be in focus.
EUR/USD: Daily chart
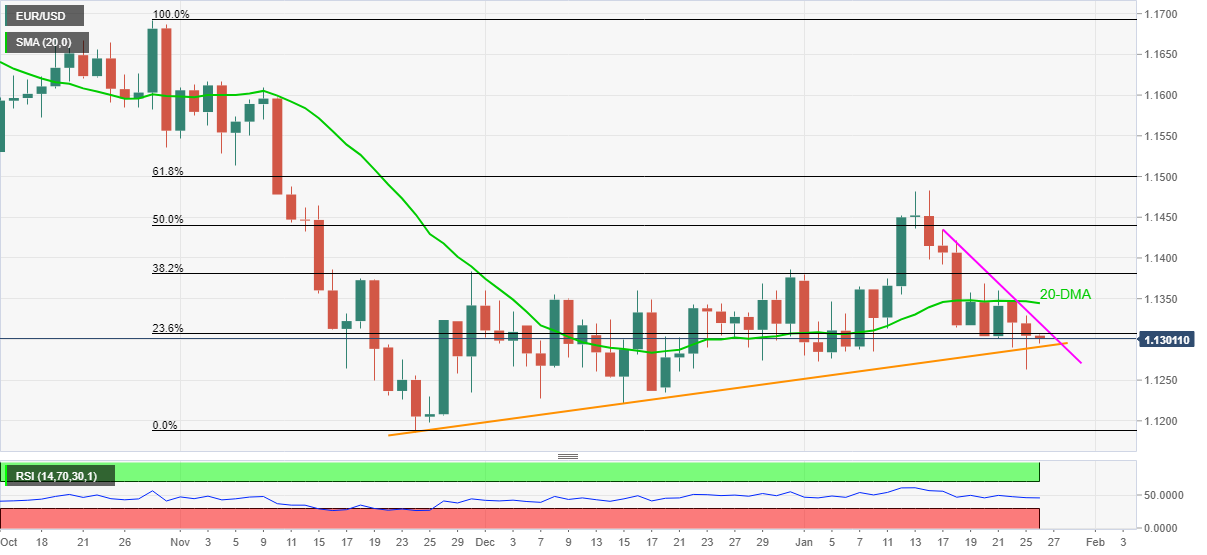
Trend: Further weakness expected
- Geopolitical issues between Ukraine and Russia, and middle-East tensions, triggered the jump in oil prices.
- The International Energy Agency (IEA) reported that OPEC+ missed its production targets.
- The US Department of Energy approved an exchange of 13.4 million barrels of crude oil from the SPR.
- WTI is upward biased, though a break above $85.83 would expose $86.90.
On Tuesday, the Western Texas Intermediate (WTI), US crude oil benchmark, advances some 1.65%, trading at $84.97 per barrel at the time of writing.
The rise in oil prices is attributed to a list of factors. Eastern Europe geopolitical tensions between Ukraine and Russia, and the attack on Monday on a United Arab Emirates US military base, increased worries of a tighter supply of the so-called black gold.
Additionally, the Organization of the Petroleum Exporting Countries and its allies (OPEC+) encountered problems to hit its target of 400K crude oil barrels per day, as reported by Reuters.
The International Energy Agency (IEA) said in the last week that the group missed its production targets by 790,000 barrels per day (BPD) in December as members like West African producers Nigeria and Angola struggled to raise output.
Meanwhile, around 20:00 GMT, the US Department of Energy approved an exchange of 13.4 million barrels of crude oil from the Strategic Petroleum Reserve to seven companies as part of President Joe Biden’s effort to help control oil prices, per Reuters.
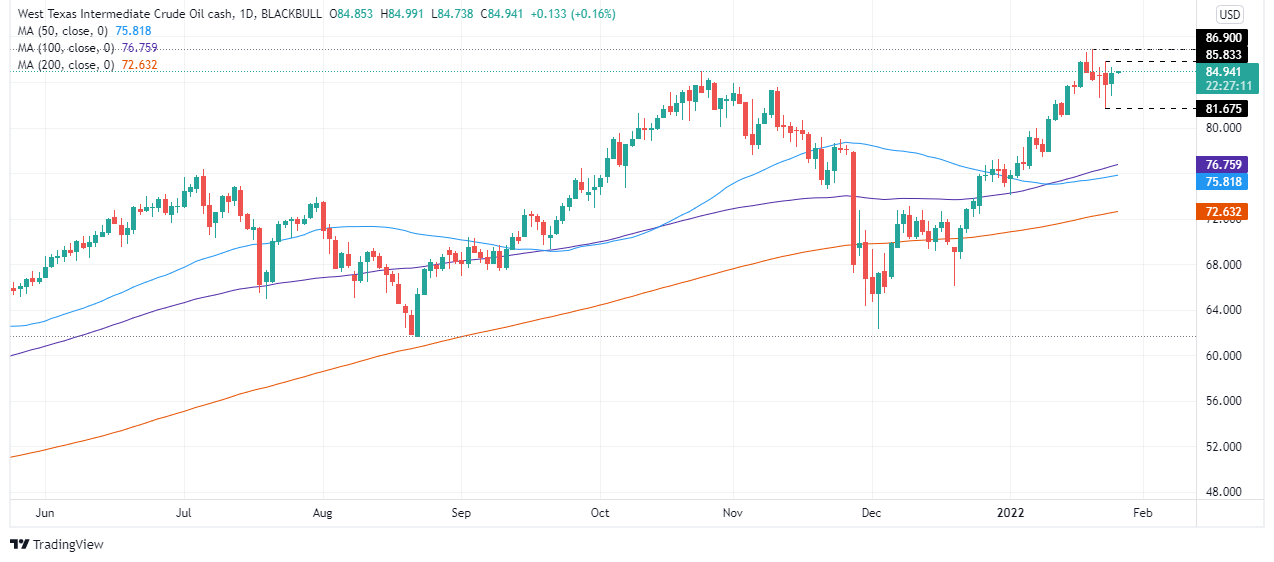
WTI Price Forecast: Technical outlook
The black-gold trimmed some of its Monday’s losses but failed to break above $85.83. That said, WTI’s is upward biased. The daily moving averages (DMAs) reside below the spot price, though the 50-DMA is about to close above the 100-DMA, which sits at $76.75.
To the upside, WTI’s first resistance would be January 24 daily high at $85.83. A break above that level would expose the January 20 cycle high at $86.90.
Early Wednesday morning in Asia, House Speaker Nancy came out with the news conveying the US House Democrats’ release of the America COMPETES Act of 2022.
Among major issues, the US readiness to combat China on various manufacturing and supply issues gains major attention.
FX reaction
It’s worth noting that the bill is yet to reach Senate, not to talk about is it a law, which makes it a little less worrisome issue amid the Fed fears and Russia-linked geopolitical tension.
As a result, the risk barometer AUD/USD pays a little heed to the news and takes rounds to 0.7150 by the press time.
Read: AUD/USD hovers around 0.7150 on Australia Day holiday, focus on Fed
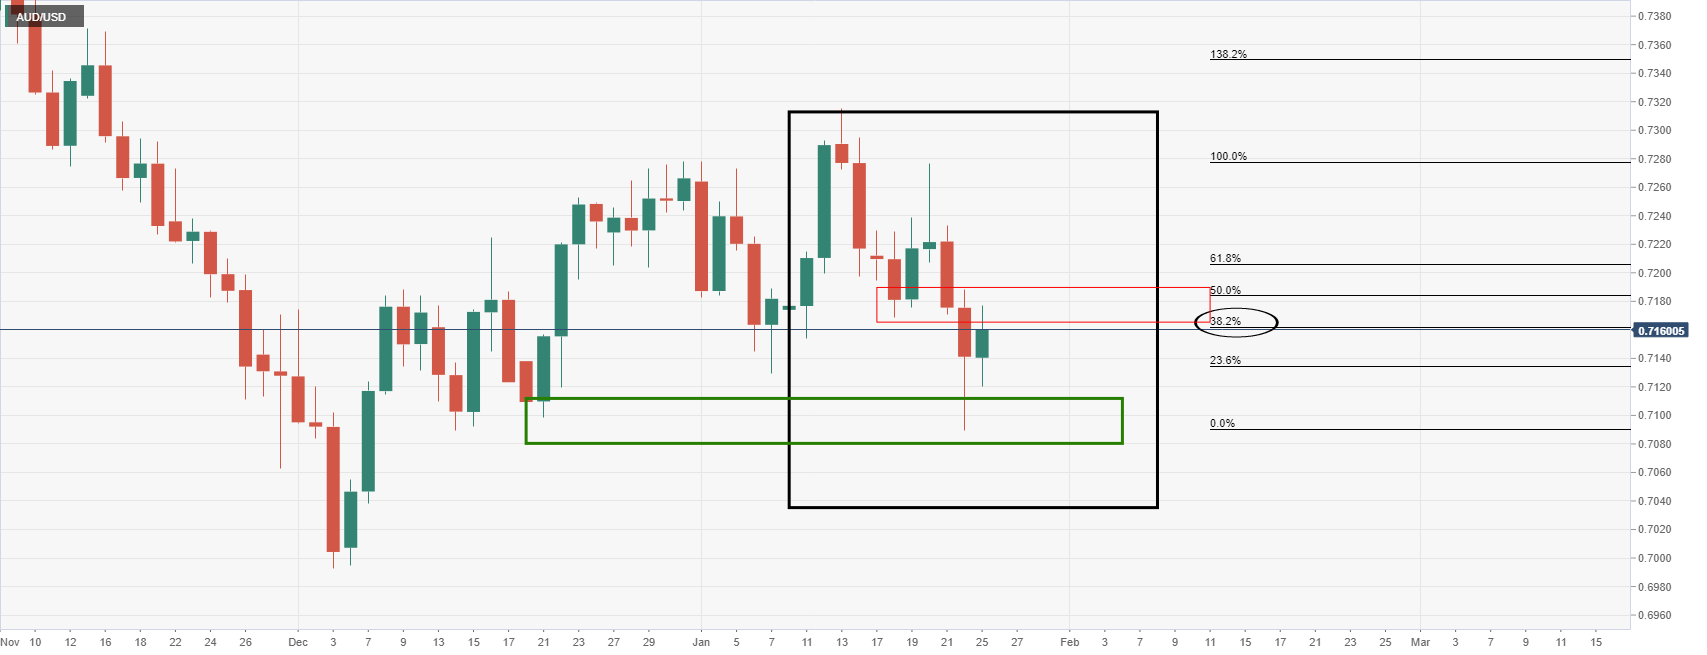
- AUD/USD fades bounce off five-week low as pre-Fed anxiety escalates.
- Strong Aussie inflation helped buyers to battle the broad risk-off mood.
- Russia-Ukraine fears, IMF’s growth forecasts add to the bearish bias.
- Second-tier US data may entertain traders but all eyes on FOMC’s verdict amid March rate hike chatters.
AUD/USD fails to extend the previous day’s corrective pullback from a five-week low, retreats to 0.7150 during early Wednesday morning in Asia.
The risk barometer pair cheered upbeat Australia data the previous day to snap a two-day downtrend. However, fears of the hawkish Fed join geopolitical tensions and downbeat economic forecasts by the International Monetary Fund (IMF) to keep downside pressure on the quote.
That said, Australia's Q4 inflation rose past the Reserve Bank of Australia (RBA) forecasts to 3.5% YoY while the RBA Trimmed Mean CPI also crossed prior and market consensus to 1.0%. Given the already out strong employment data, Australia's inflation enabled AUD/USD traders to expect no major hurdle for the RBA to accept rate hike chances in 2022 versus previous rejections.
Also, the receding cases of Omicron in Australia and confidence in the medical system, as well as vaccine jabbing, added strength to the AUD/USD rebound.
However, the Fed hawks ignore softer US CB Consumer Confidence and Richmond Fed Manufacturing Index figures amid firmer US inflation expectations, per the 10-year breakeven inflation rate per the St. Louis Federal Reserve (FRED) data to weigh on AUD/USD. The inflation gauge rose for the third consecutive day on Tuesday after declining to the lowest since September on January 20.
It’s worth observing that the US, the UK and European Union (EU) are determined to levy economic sanctions on Russia if it invades Ukraine, which in turn keeps geopolitical fears on the table and test AUD/USD rebound. However, the latest updates suggest receding fears of an imminent war between Moscow and Kyiv.
Furthermore, the IMF No. 2 official Gita Gopinath conveyed downbeat economic forecasts the previous day as Omicron spreads. “We project global growth this year at 4.4%, 0.5 percentage point lower than previously forecast, mainly because of downgrades for the United States and China,” said IMF’s Gopinath per Reuters.
Against this backdrop, Wall Street closed in red and the US 10-year Treasury yields printed the least daily losses after a four-day downtrend. That said, prices of gold and oil gained.
Considering the off in Australian markets and the pre-Fed fears, AUD/USD may witness a lackluster day in Asia. However, fears of the hawkish Fed keep sellers hopeful.
Read: Federal Reserve Interest Rate Decision Preview: Inflation, Omicron and equities
Technical analysis
AUD/USD fades bounce off the 23.6% Fibonacci retracement of late June to December 2021 downside, around 0.7140, below the 50-DMA resistance level of 0.7182. That said, the further downside may halt around 0.7080 before challenging 2021 low near the 0.6995 mark.
- NZD/USD stays pressured around multiday bottom after four-day downtrend.
- Sour sentiment, Omicron woes at home join IMF’s downgrade to China growth to weigh on Kiwi prices.
- Downbeat US data fails to reject upbeat expectations from Fed, Russia-Ukraine tussles stay on the table.
- Yields, DXY stay firmer amid hopes of hawkish Fed, equities print losses.
NZD/USD portrays a corrective pullback from a 14-month low of around 0.6690 but stays depressed after a four-day downtrend to early Wednesday morning in Asia.
The kiwi pair’s latest consolidation could be linked to the day-end bounce in riskier assets after a heavy risk-off session. However, the bears keep control as pre-Fed anxiety escalates. Also weighing on the risk appetite, as well as the NZD/USD prices, are the escalating fears of a Russia-Ukraine was and downbeat economic forecasts by the International Monetary Fund (IMF).
Although the US CB Consumer Confidence and Richmond Fed Manufacturing Index joined the week-start trend of softer data, with Markit PMIs, Fed hawks remain hopeful on upbeat US inflation expectations, per the 10-year breakeven inflation rate per the St. Louis Federal Reserve (FRED) data. The inflation gauge rose for the third consecutive day on Tuesday after declining to the lowest since September on January 20.
Elsewhere, policymakers at the US, the UK and European Union (EU) are determined to levy economic sanctions on Russia if it invades Ukraine. However, the latest updates suggest receding fears of an imminent war between Moscow and Kyiv.
At home, New Zealand (NZ) Prime Minister Jacinda Ardern accepted rising fears of Omicron but stood ready for border reopening in February. The South African variant spreads faster in the Pacific nation and is likely to post 50K cases from the latest below 100 levels. In light of this, NZ Herald said, “The Government will today reveal how it will try to step up the fight against Omicron as the highly infectious Covid-19 variant spreads across the country, with predictions of up to 50,000 cases a day.”
It should be noted that the IMF No. 2 official Gita Gopinath conveyed downbeat economic forecasts the previous day as Omicron spreads. “We project global growth this year at 4.4%, 0.5 percentage point lower than previously forecast, mainly because of downgrades for the United States and China,” said IMF’s Gopinath per Reuters.
Amid these plays, Wall Street closed in red and the US 10-year Treasury yields printed the least daily losses after a four-day downtrend. That said, prices of gold and oil gained.
Looking forward, the pre-Fed caution can keep markets light-lipped but the US housing and trade numbers will join other risk catalysts to entertain NZD/USD traders. Among them will be the NZ government’s more steps to battle Omicron.
Given the highly hawkish hopes from the Fed, odds of a sharp disappointment with a slightly measured tone can’t be ruled out, which in turn could trigger the much-awaited bounce for the NZD/USD.
Read: Federal Reserve Interest Rate Decision Preview: Inflation, Omicron and equities
Technical analysis
Unless crossing a two-week-long resistance line near 0.6735, NZD/USD stays vulnerable to test a descending trend line from late September 2021, around 0.6615 by the press time.
- The AUD/JPY advances for the first day out of the last three, up some 0.09%.
- A risk-off market mood keeps investors flowing through safe-haven assets, thus favoring the Japanese yen.
- The AUD/JPY is downward biased, but the price action is under consolidations as portrayed by the last two trading days.
Despite the financial markets' risk-off mood, the Australian dollar snaps three consecutive days of losses advances some 0.09%. At the time of writing, the AUD/JPY is trading at 81.47.
Market participants are getting ready for the Federal Reserve to unveil its first monetary policy statement of the year. Investors have already priced in a 25 bps rate hike in the March meeting, but the questions that remain to be answered by the Fed are the pace of the Quantitative Tightening (QT) and when it will start. Alongside the uncertainty of the US central bank tightening, geopolitical events keep the USD and the JPY on the right foot, to the detriment of risk-sensitive currencies.
The conflict between Ukraine and Russia has been escalating in the last week. The US Department of Defense maintains 8,500 American troops on heightened alert and could be deployed if Russia invades Ukraine.
On Tuesday, the AUD/JPY remained in the 81.05-81.78 range, seesawing around the 50-hour simple moving average (SMA), with no apparent bias, trapped around the latter and the 100-hour SMA at 81.83.
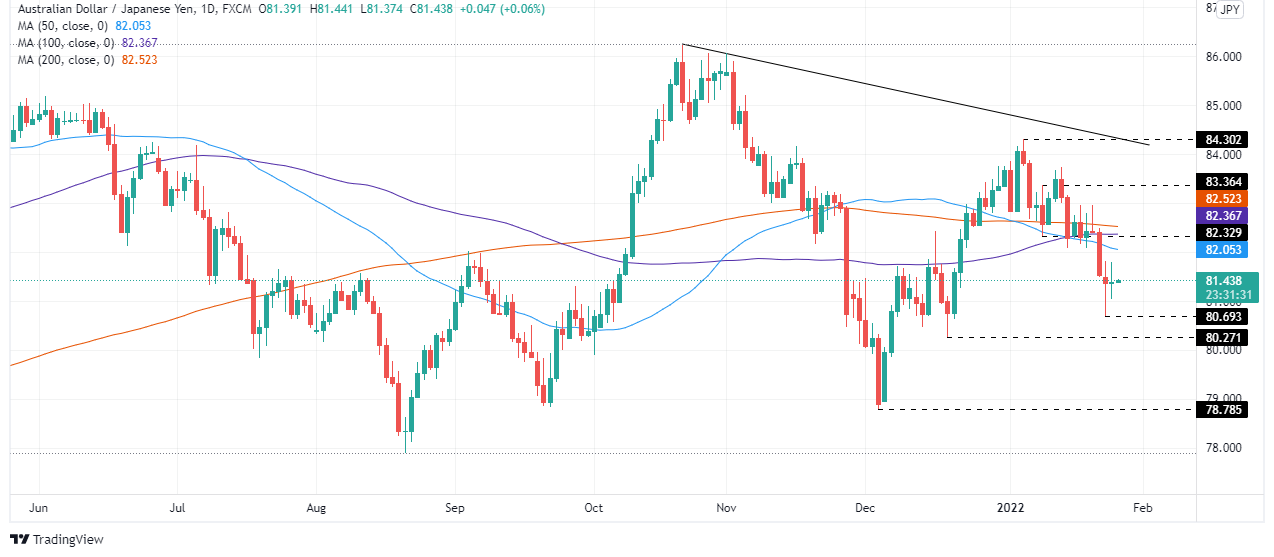
AUD/JPY Price Forecast: Technical outlook
From a technical perspective, Monday's AUD/JPY price action witnessed a jump from the YTD lows around 80.69, which pushed the pair above the 81.00 handle, courtesy of the recovery of the US stock market by the end of the day. That said, on Tuesday, a doji emerged, which could be the signal of a pause of the downtrend or might be an early signal of a reversal candle pattern.
To the upside, the AUD/JPY first resistance level would be the 50-day moving average (DMA) at 82.05. A breach of the latter would expose the confluence of the January 10 daily low previous support-turned-resistance and the 100-DMA in the 82.33-37 range, that once broken, would give way for a test of the 200-DMA at 82.52.
On the flip side, the first support would be 81.00. A break under that level will keep bears in control and will open the door for further gains. The next demand area would be the January 24 daily low at 80.69, followed by December 20, 2021, daily low at 80.27.
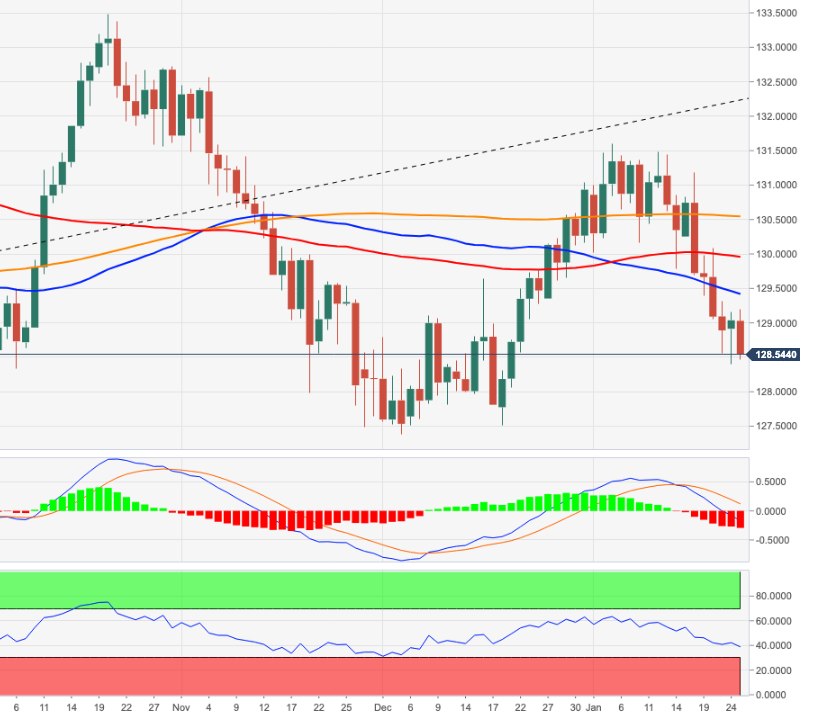
- EUR/JPY has recovered from 128.20 lows to the 128.75 area, but nonetheless trades lower as the recent negative bias continues.
- Many technicians, perhaps in anticipation of continued safe-haven yen demand, will be targetting a test of the December 127.50 lows.
Though the pair has recovered from its earlier session lows in the 128.20s back to the 128.75 area in more recent trade, and thus eroded the day’s losses to a mere 0.25% from as much as 0.6%, EUR/JPY’s negative bias continues. Indeed, EUR/JPY’s lows on Tuesday was a fresh more than one-month low and mark a sixth successive session where the pair has printed a lower low. After Monday’s more overtly defensive bias to FX market trade that saw the yen and euro alike perform well, the euro was an underperformer during Tuesday’s more mixed session.
That underperformance comes despite better-than-expected German Ifo figures released in the European morning, which as analysts have pointed out, was perhaps negated by pessimistic economic commentary from the economic institute. From a technical perspective, the fact that EUR/JPY hasn’t yet been able to muster a recovery back towards prior support now resistance in the 129.50 area, or back to test its 50-day moving average since dropping below it, is a bearish sign.
Many technicians, perhaps in anticipation of continued safe-haven yen demand as global risk appetite remains rocky amid central bank (Fed) tightening and geopolitical risks, will be targetting an eventual test of the December lows in the 127.50 area. It doesn’t seem likely that tensions between NATO/Ukraine/Russia in Eastern Europe will let up any time soon, though as long as war doesn’t break out imminently, there is a chance that markets get fatigued with the situation in the coming weeks.
That might mean central bank (Fed) tightening is the main threat to global risk appetite, meaning much of EUR/JPY’s near-term direction may be determined by Wednesday’s Fed event. For EUR/JPY to stabilise and recover back to earlier annual highs in the 131.00s, a broader recovery in risk appetite is going to be needed (with US equities recovering a decent portion of recently lost ground) and FX market focus is going to need to recalibrate on central bank policy divergence. Here the story could be a long-term EUR/JPY positive, with the Eurozone facing much higher upside inflation risks and, as a result, likely to remove monetary stimulus at a faster pace compared to Japan.
- GBP/USD bulls look to 1.3580s for the days ahead.
- Near-term bears are in anticipaiton of a deeper correction on the lower time frames.
In ealrier analysis in the US sesison, 1.35 the figure was noted as an anchor point from which bulls would be expected to struggle to pull away from. However, a key level of resistance was penertrated and a high high for the day was scoed all of the way towards 1.3520:
GBP/USD, prior analysis
The price had run into a wall of resistance as per the prior analysis on the 15-min chart above. A rejection in the first test there was expected to open risk back to the 61.8% Fibo of the 15-min bullish impulse near 1.35 the figure.
However, the bulls have taken the reigns and pushed on through as follows:
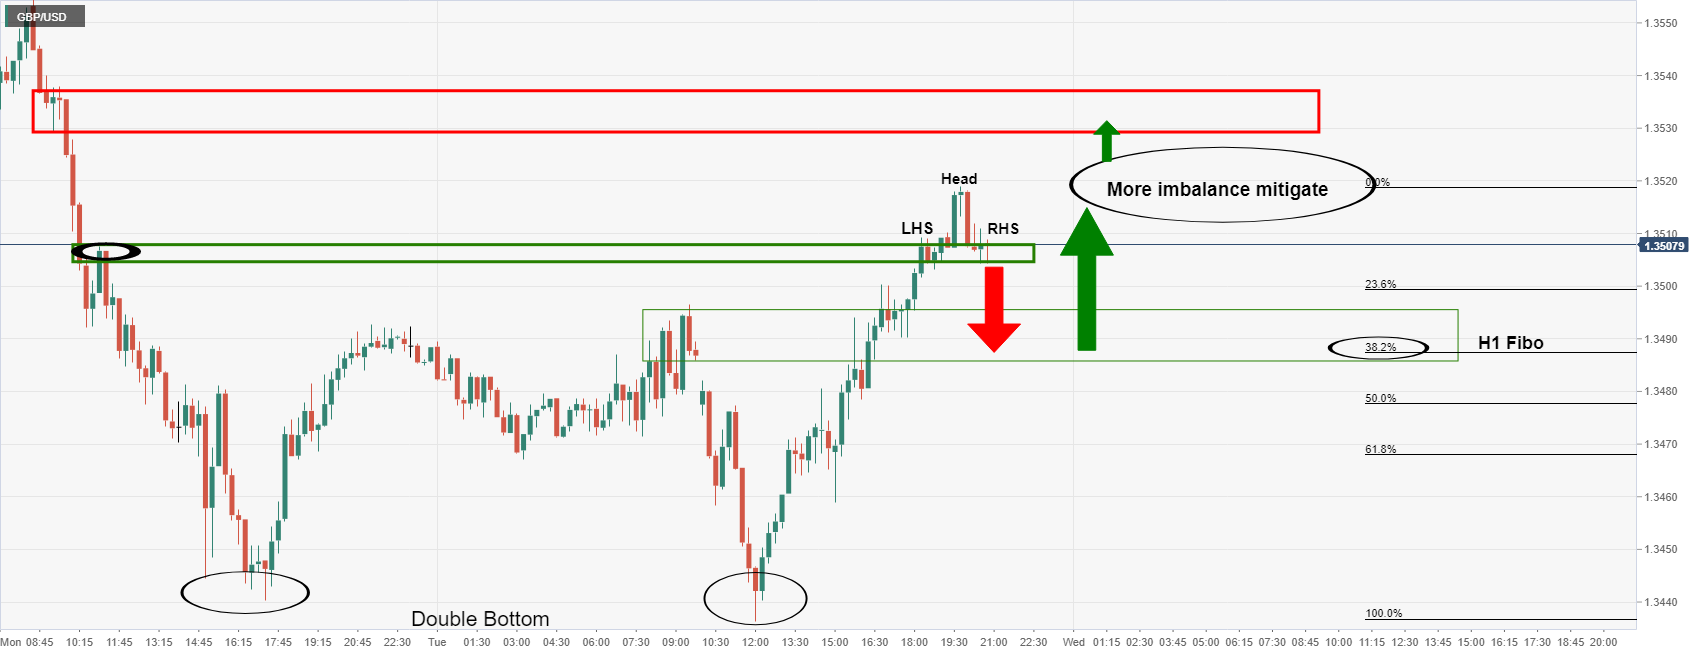
The price rallied to a high of 1.3518 and is about to leave a bullish daily closing candle for the day which opens prospects of a deeper retracement of the bearish daily impulse as per the chart below. In the mean time however, there is now bearish structure forming on the 15-min chart in the form of a potential bearish head and shoulders topping formaiton.
If trhe right hand shoulder forms followed by a subsequent break and close below the neckline near 1.35 the fifure, then the hourly 38.2% % Fibonacci retracement will be eyed for a potential support for the sessions ahead. Should the dollar remain under pressure, then the bulls will be encouraged to renegage at a discount and that could lead to a bullish exptensio into the imbalance of price between the highs and the late 1.3530s.
GBP/USD daily chart
Looking further a field, the daily M-formaiton is compelling, especially given the prospects of today's bullish daily close:
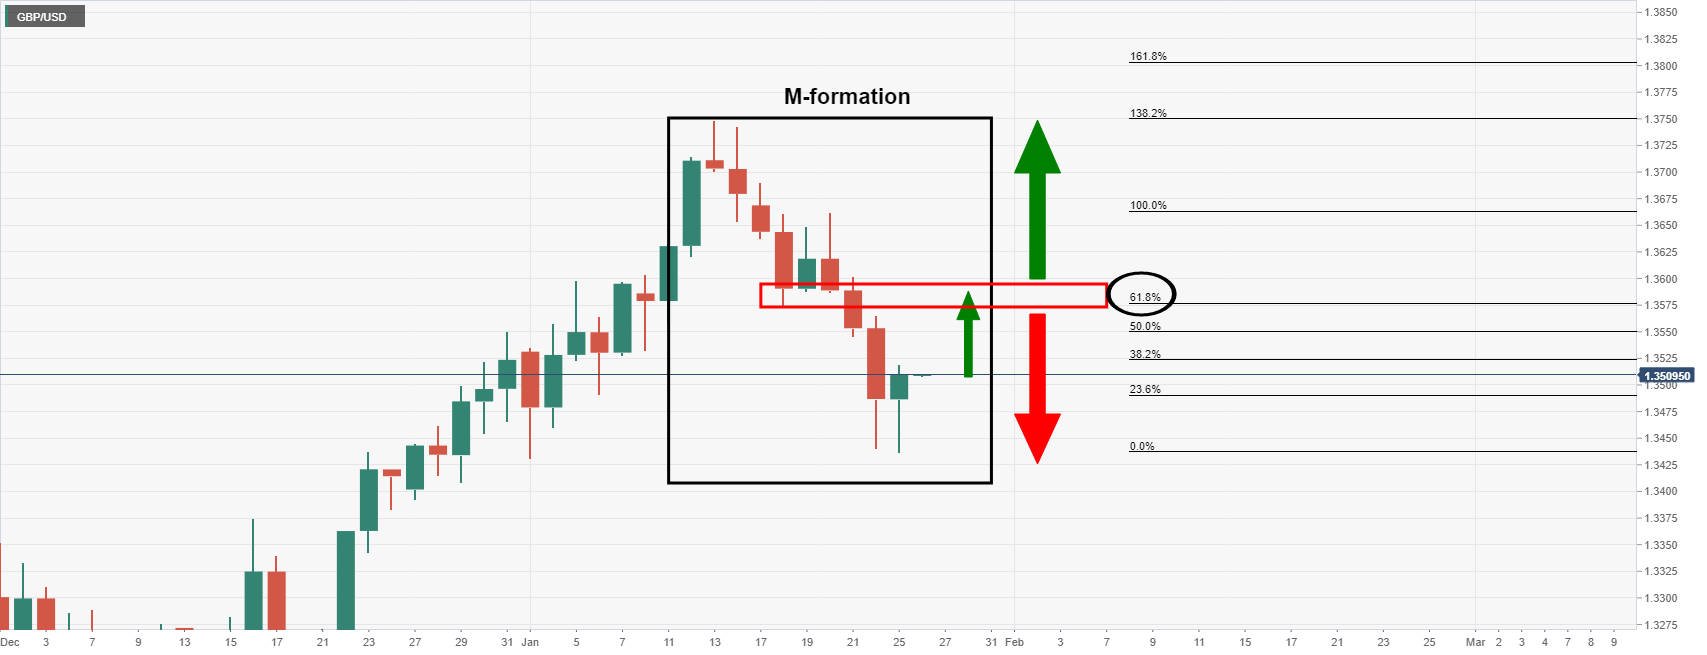
The 61.8% Fibonacci retracement level has a cnfluence with the neckline of the M-formaiton. The W and M patterns have a high completion rate of the price being drawn back into the prior structure, aka, the neckline. In this case, near to 1.3580.
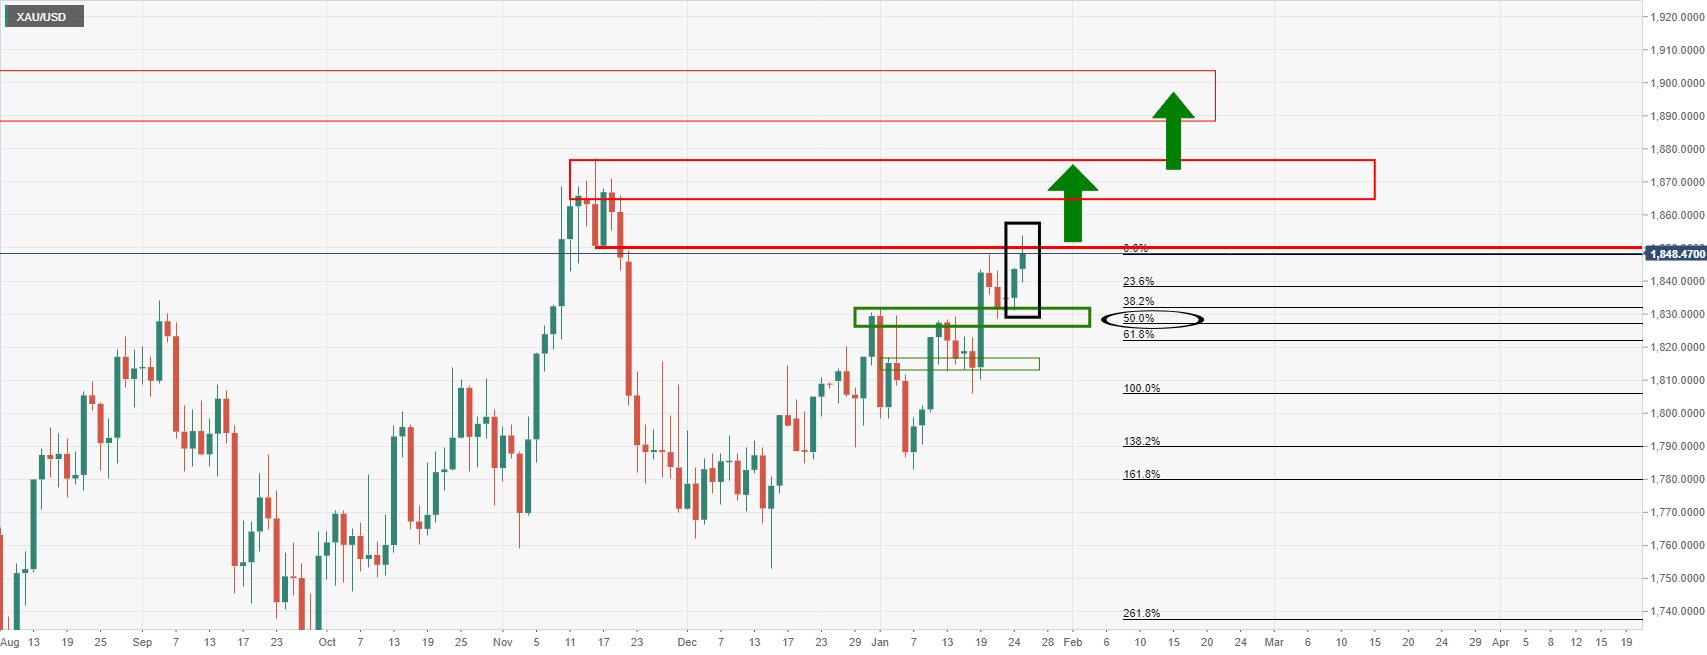
- Gold moves into a key psychlogical area on its northerly trajectory.
- The Fed is what counts for the forthcoming sessions.
Gold (XAU/USD) has rallied on Tuesday, adding around 0.5% to the scale after climning from a low of $1,834.95 to a high of $1,853.88 so far. The US dollar has come under pressure after reaching a a two-week peak over tensions between Russia and the West. However, there was a five-year Treasury auction that has weighed on the US dollar considering the bond market's appatite for US Treasurys at the current coupon.
The angst in centrak Asia took a back seat today to the outcome of the Federal Open Market Committee's two-day meeting that draws to a close on Wednesday. Investor were expecying the Fed to announce the end of QE prematurely and signal a readiness to hike in March.
In turn, there was a focus on today's 5-year Treasury auction. The bid-to cover ratio was high and so too was the yield wth the US selling 5-year notes at 1.533% vs WI 1.547%on a $55 billion sale. That was the highest yield since October 2019. The prior was 1.263% and the bid to cover at 2.50 vs 2.41 prior. This indicates that the market could be pricing the Fed too hawkish for the medium term. This is a bullish theme for gold.
Moreover, markets will be looking to take profit in the Fed which could be playing out in the reenback as we apprach month end as well. Given the recent rout in markets, a growing cohort of participants will be hoping that the Fed will manage to provide a soothing tone for markets.
''Considering that Chair Powell's primary goal is to prevent a de-anchoring of inflation expectations, it's unlikely that the Fed will pivot from their plan to start hiking rates as soon as March, and start quantitative tightening soon after,'' analysts at TD Securities argued.
''Certainly, markets have priced-in a March hike for some time, which takes the sting out of this form of tightening, but participants have begun to question whether the strike on the Fed's put is further from the market in a regime where the central bank is battling inflation.''
''In this context,'' the analysts said, ''evidence that quantitative tightening might be more impactful for asset prices suggests that the Fed could still eventually use this tool to manage the strike on its put, without necessarily causing undue harm to its primary objective of keeping inflation expectations bounded. For precious metals, this signals few immediate avenues for relief.''
The analysts exlained that ''while gold ETFs recorded massive inflows, these may have been distorted by options-related activity, with the concurrent rise in volatility suggesting only some additional safe-haven flows.
The evidence continues to overwhelmingly point to Chinese purchases as the single largest source of inflows, which are vulnerable with Lunar New Year around the corner. CTA trend followers are set to liquidate some gold length should prices break below $1815/oz.''
Gold and US dollar technical analysis
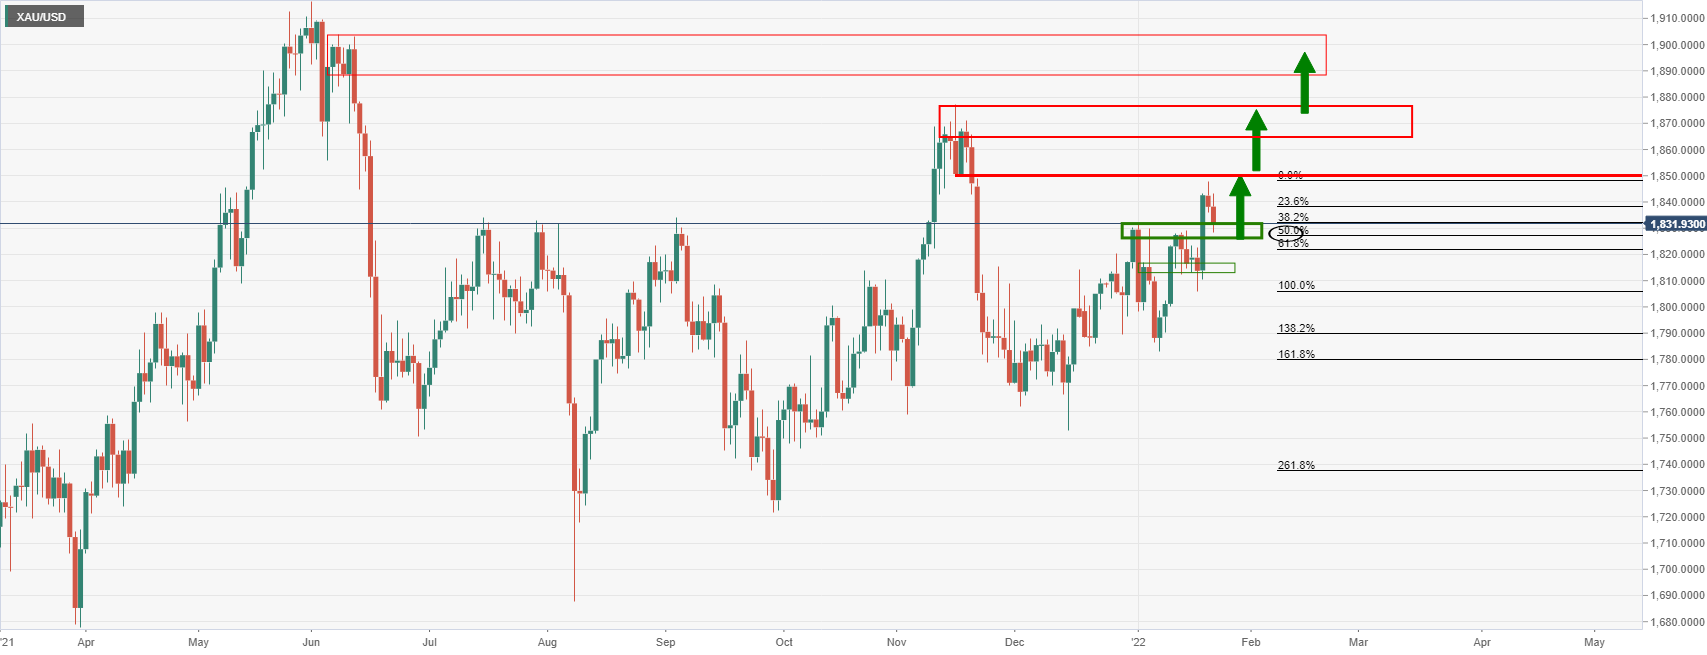
Firsltly, the US dollar could be finding a bid here and the Russian risks remains a supporting factor:
Additionally, the M-formation is a reversion pattern, so a move higher in the greenback could infold in coming hours as markets get set for the Federal Reserve. Therefore, runaway gold prices may not be in strore for the immeaduate future.
Meanwhile, as per the start of the week's analysis, Chart of the Week: Bulls pining for $1,850+, could be just a Fed away, the bulls have reached the psychological $1,850 target. This was forcasted to leave the bulls in good stead towards the $1,870's as last major defence for the $1,900s:
Gold's prior analysis
Gold live market, daily chart
What you need to know on Wednesday, January 26:
Choppy, unpredictable trading conditions prevailed for a second straight session on Tuesday. Ahead of the US close, the S&P 500 is still trading in the red but has recovered sharply off earlier session lows, giving a sense of De-Ja Vu after yesterday’s ferocious late-session recovery. The net result for G10 FX markets, which have been sensitive to equity market fluctuations as of late, is a slightly pro-risk bias. The Dollar Index (DXY) is trading marginally higher on the day but has pulled back from earlier highs 96.20s to underneath the big figure.
USD shrugged off mixed Consumer Confidence data, the headline index for which saw a slight fall owing to inflation and pandemic (Omicron) worries but not as much as expected, and slightly stronger than expected house price growth in November. The main talking point in markets remains 1) the Fed meeting on Wednesday and 2) geopolitics, with both having been cited as reasons for risk asset underperformance and heightened safe-haven demand.
But one day ahead of what is expected to be a very hawkish sounding Fed meeting (they are expected to give the green light to multiple hikes and QT in 2022), most risk-sensitive G10 currencies did well.
The Australian and Canadian dollars, both gained around 0.3% on the day versus the buck, taking the second and third from the top spot in terms of on-the-day G10 performance, lagging on the high beta NOK, which gained 0.5%. The Aussie, which jumped back above 0.7150/$, was supported by hawkish RBA bets in wake of a hotter than expected Q4 2021 Consumer Price Inflation report that will have come as a big surprise to the central bank.
The loonie is also being supported by hawkish central bank bets, with a minority of analysts calling for the BoC to surprise the consensus with a 25bps rate hike on Wednesday. More likely, the bank will tweak its forward guidance on rate hikes to reflect the recent run of strong economic data to signal a rate hike is coming in March.
Pound sterling was another risk-sensitive G10 currency to perform well on Tuesday, with GBP/USD recovering back above the 1.3500 level as FX markets continue to ignore an uncertain UK political backdrop. With the London police now investigating claims of parties in Downing Street that broke lockdown rules, Boris Johnson’s position as PM looks tenuous, though strategists expect that any potential replacement (like Chancellor Rishi Sunak) will be a “safe pair of hands”.
In terms of the rest of the G10 currencies; JPY and NZD were both flat on the day versus the buck, with USD/JPY just under 114.00 and NZD/USD just under 0.6700 ahead of December New Zealand trade figures.
Despite decent German Ifo survey results out during the European morning, the euro dropped 0.2% versus the buck, with EUR/USD suffering from technical selling amid the break below a key long-term uptrend in play since late November. The pair currently trades on the 1.1300 handle having recovered from earlier lows in the 1.1260s, its lowest level in more than a month.
Finally, CHF was the standout G10 underperformer on the day, with EUR/CHF rallying 0.4% to the 1.0375 area and USD/CHF rallying 0.6% to hit 0.9200 for the first time in nearly two weeks as some speculated about SNB intervention.
- The shared currency slides for the second straight day, down 0.19%.
- The crisis in eastern Europe weighs on the EUR boosts the safe-haven peers.
- The EUR/USD is downward biased, though upside risks remain as the 50-DMA closes to the spot price.
During the North American session, the euro slumps, attributed to a risk-off market mood that has spurred demand for safe-haven assets, meaning a higher USD. Factors like the Ukraine – Russia crisis and the Fed’s first monetary policy meeting of the year maintain market participants uneasy, as portrayed by US equities trading in the red. At the time of writing, the EUR/USD is trading at 1.1300.
In the meantime, the US Dollar Index, a gauge of the greenback’s value versus a basket of its rivals, advances some 0.10%, sitting at 96.01, clinging to the 96.00 threshold.
On Tuesday, during the overnight session for North American traders, the EUR/USD fell from 1.1325 towards the figure, giving way for USD bulls, who secured a 40-pip move to the daily low of the day at 1.1263. However, as the New York session progressed, EUR bulls entered the market, reclaiming the 1.1300 figure.
EUR/USD Price Forecast: Technical outlook
That said, the EUR/USD pair is neutral-downward biased. The 50-day moving average (DMA) moves close to the spot price, leading the way for the longer time-frame ones, with the 100-DMA and the 200-DMA lying at 1.1469 and 1.1708 each. Nevertheless, the bias is downward as long as the exchange rate remains below the former.
On the downside, the EUR/USD first support would be an upslope trendline drawn from December 2021 swing lows, which passes around the 1.1290-1.1300 area. In the outcome of breaking lower, the next support would be December 15, 2021, a daily low at 1.1221, followed by 2021 yearly low at 1.1186.
To the upside, the first resistance would be the 50-DMA at 1.1314. A breach of the latter would expose the January 20 pivot high at 1.1369, followed by the January 14 daily low previous support-turned-resistance at 1.1399.
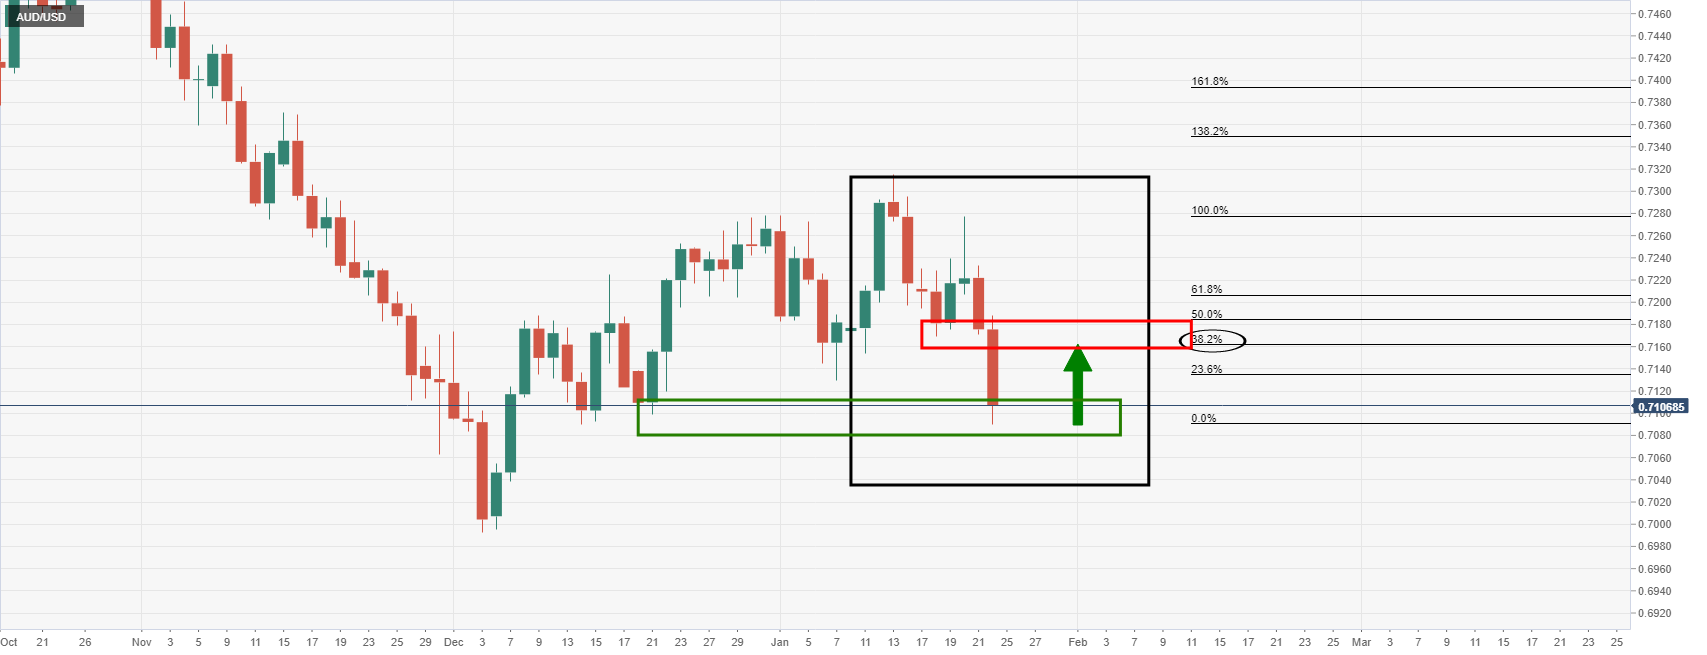
- AUD/USD bulls step in and target the daily M-formation neckline as the greenback slides.
- DXY is testing 96 the figure ahead of the Fed.
As per prior analysis at the start of the week, AUD/USD Price Analysis: Bears move the Aussie to the edge of the abyss, the price has advanced towards an identified daily target area in recent trade.
AUD/USD, prior analysis
It was started that ''AUD/USD's M-formation on the daily chart is a compelling chart pattern for the week ahead.''
AUD/USD live chart
As illustrated, the bulls have homed in n the neckline of the M-formation in trade today. This has occurred in a sharply hourly bullish impulse as follows:
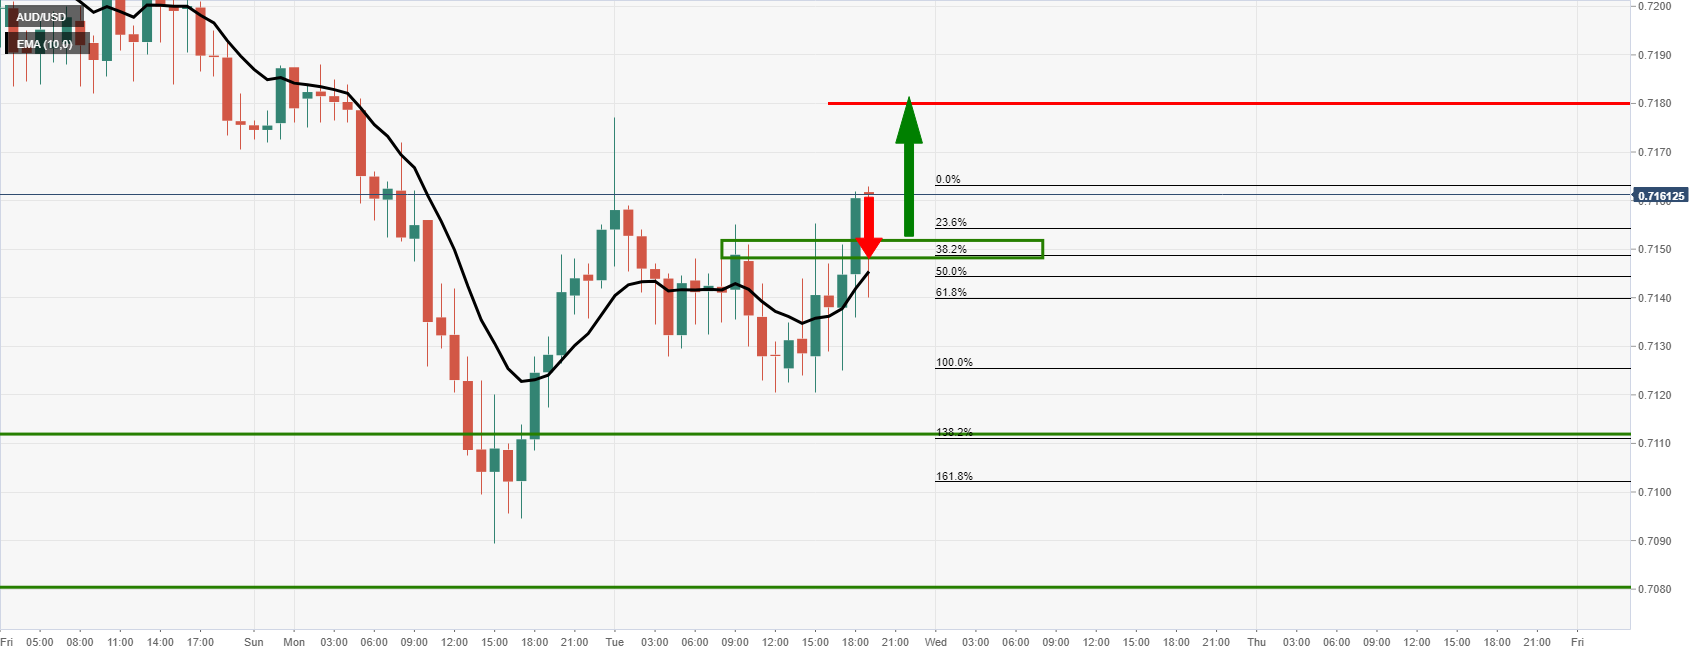
The bullish impulse may not be over yet, but a correction could be in order back towards the prior resistance that has a confluence with the 38.2% Fibonacci retracement of the recent rally that meets with the 10-EMA.
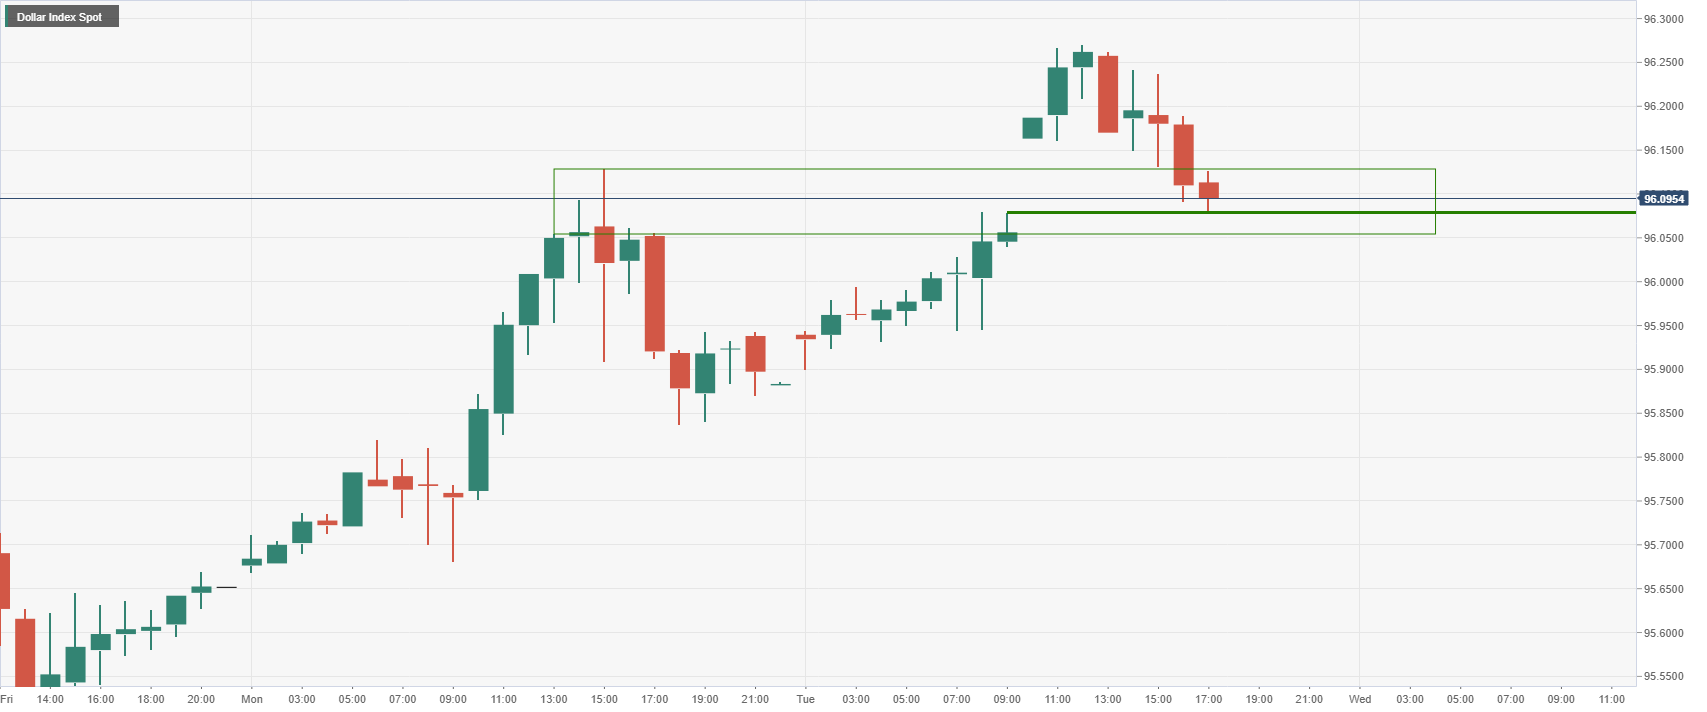
The move has occurred as the US dollar sinks to test deeper liquidity and 96 the figure in the DXY index, breaking prior resistance and support as follows:
However, considering how fluid geopolitics are, if there is a Russian invasion of Ukraine, the US dollar would be expected to continue higher. In turn, this would be taking the Aussie down with it for a test of bullish commitments in the lower end of the 0.70 areas.
Additionally, the M-formation is a reversion pattern, so a move higher in the greenback could infold in coming hours as markets get set for the Federal Reserve.
- GBP/USD bulls are attempting to breakout of hourly consolidation.
- The H1 double bottom is encouraging, but the US dollar bulls have not yet thrown in the towel ahead of the Fed.
Now oscillating around 1.35 the figure, GBP/USD is flat but turning green on the day following a recovery from the lows of 1.3436 and printing a recent double hourly bottom. The US dollar has fallen under pressure as the 10-year yields remain pressured.
The US dollar, as measured by the DXY, an index that compares the greenback to a basket of major currencies, is sliding from the highs of the day of 96.272. It trades near 96.10 at the time of writing and is moving in on a key level of hourly support, as illustrated in the technical analysis below.
Meanwhile, fundamentally, the markets are in high anticipation of the Federal Reserve interest rate decision and accompanying statement. ''A likely March rate hike has been well communicated, so a "prepare for liftoff" signal will not be market-moving,'' analysts at TD Securities explained.
''More important will be guidance on QT as well as the funds rate after March. We don’t expect definitive signals, unfortunately; the next dot plot update is in March. The result could be mixed messages.''
Domestically, the pound has been favoured of late, at least until the extreme risk-off flows started to emerge in the latter part of this month. GBP has been the top daily performer as we entered the New Year. Investors cheered the UKs management of the coronavirus while also investing in marginally higher rates following the Bank of England's first rate hike since the onset of the pandemic, increasing its main interest rate to 0.25%.
Money markets (IRPR) currently price in more than 100 basis points (bps) in interest rate rises in 2022 and an 87% chance of a 25 bps increase in February after data showed last Wednesday that UK inflation rose faster than expected to its highest in nearly 30 years in December. Overall, the BoE tightening story has been supporting the pound, but considering the UK's twin deficits, at times of risk-off, the pound tends to be regarded as a risky asset class.
GBP suffered a steep sell-off when geopolitics unsettled markets at the end of last week and the start of this week's business. For instance, the pound weakened broadly on Friday, pulling back from a 23-month high versus the euro touched in the previous session as weakness in Wall Street prompted investors to take profits after a rally last week.
Then, on Monday, the British pound dropped further and its lowest in three weeks versus the US dollar. If risk sentiment turns around on reduced tensions in central Asia and Ukraine, then profit taking would likely support the pound and weigh on the greenback. However, the situation is fluid and uncertainty still prevails in risk-off markets on Tuesday. US stocks were sharply lower in midday trading, unwinding a portion of Monday's late recovery amid continuing market volatility.
Meanwhile, Prime Minister Boris Johnson has fought to save his premiership amid a deepening revolt inside the Tory party over a series of lockdown shindigs in Downing Street, contrary to the lockdown social distancing laws at the time.
However, "the pound has not paid much heed to recent headlines regarding the position and character of PM Johnson as this can be explained by the fact that no general election is scheduled until 2024 in the UK and whoever is party leader will inherit a large parliamentary majority," Rabobank analysts argued.
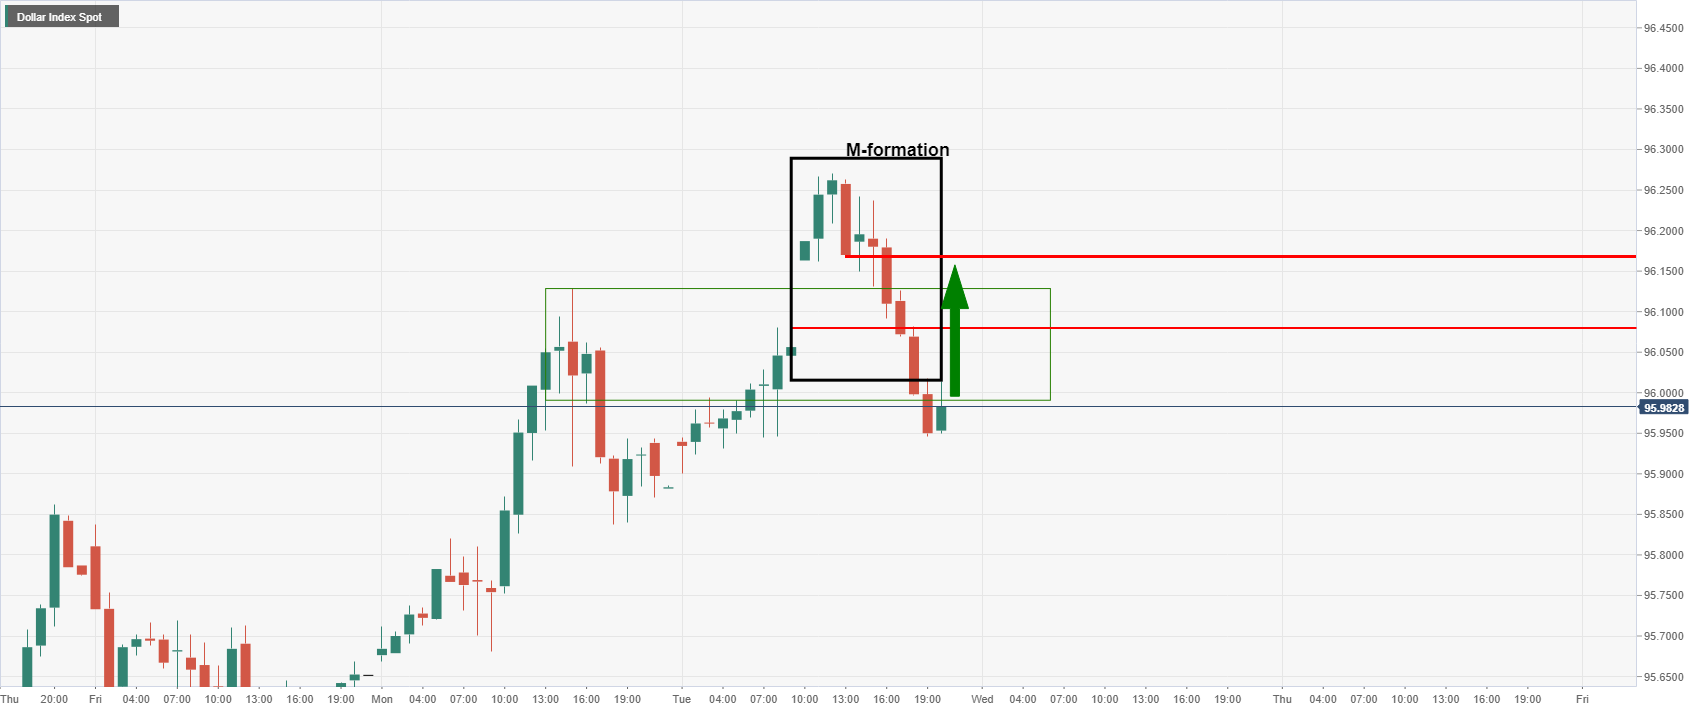
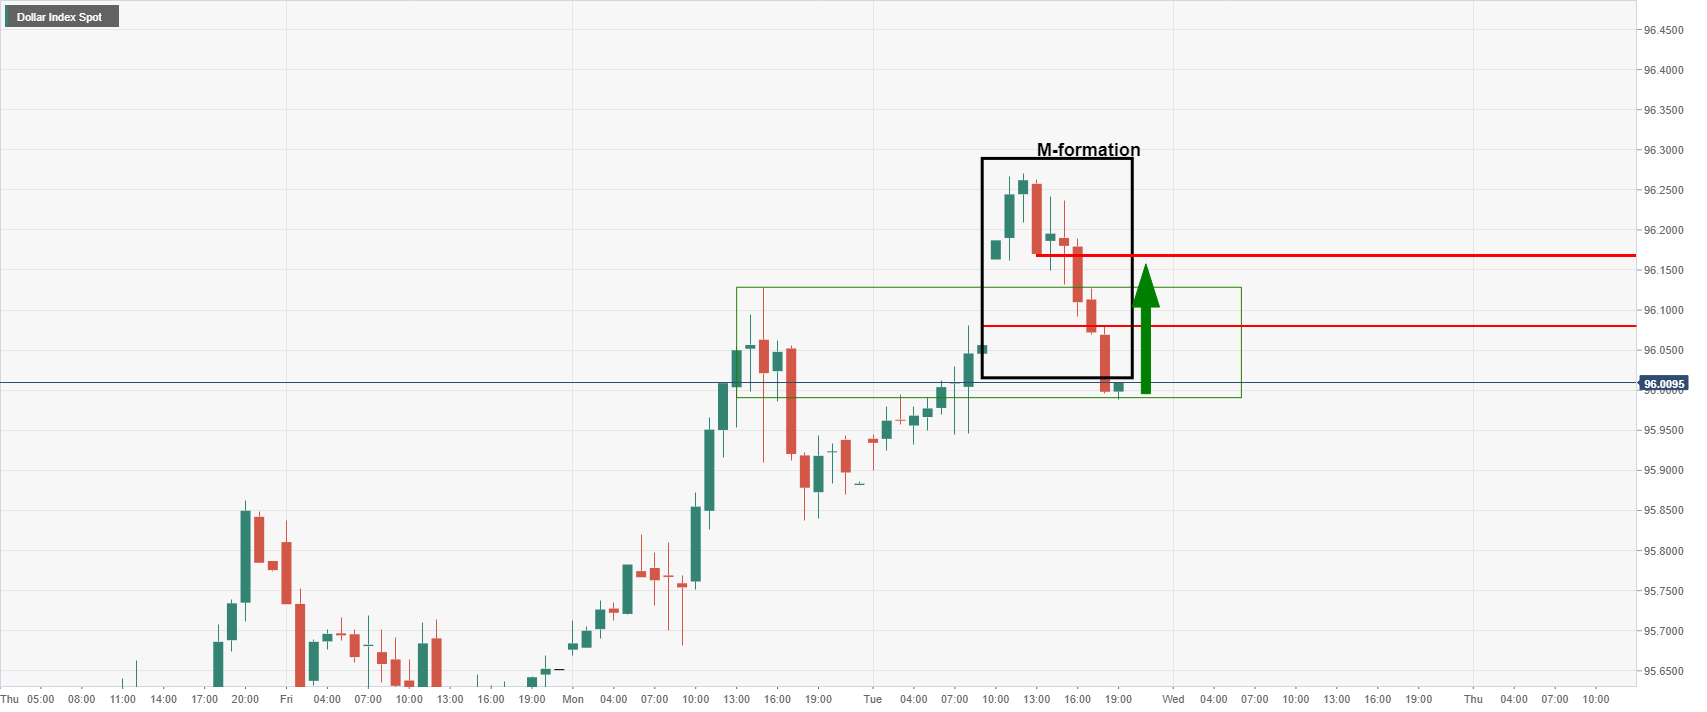
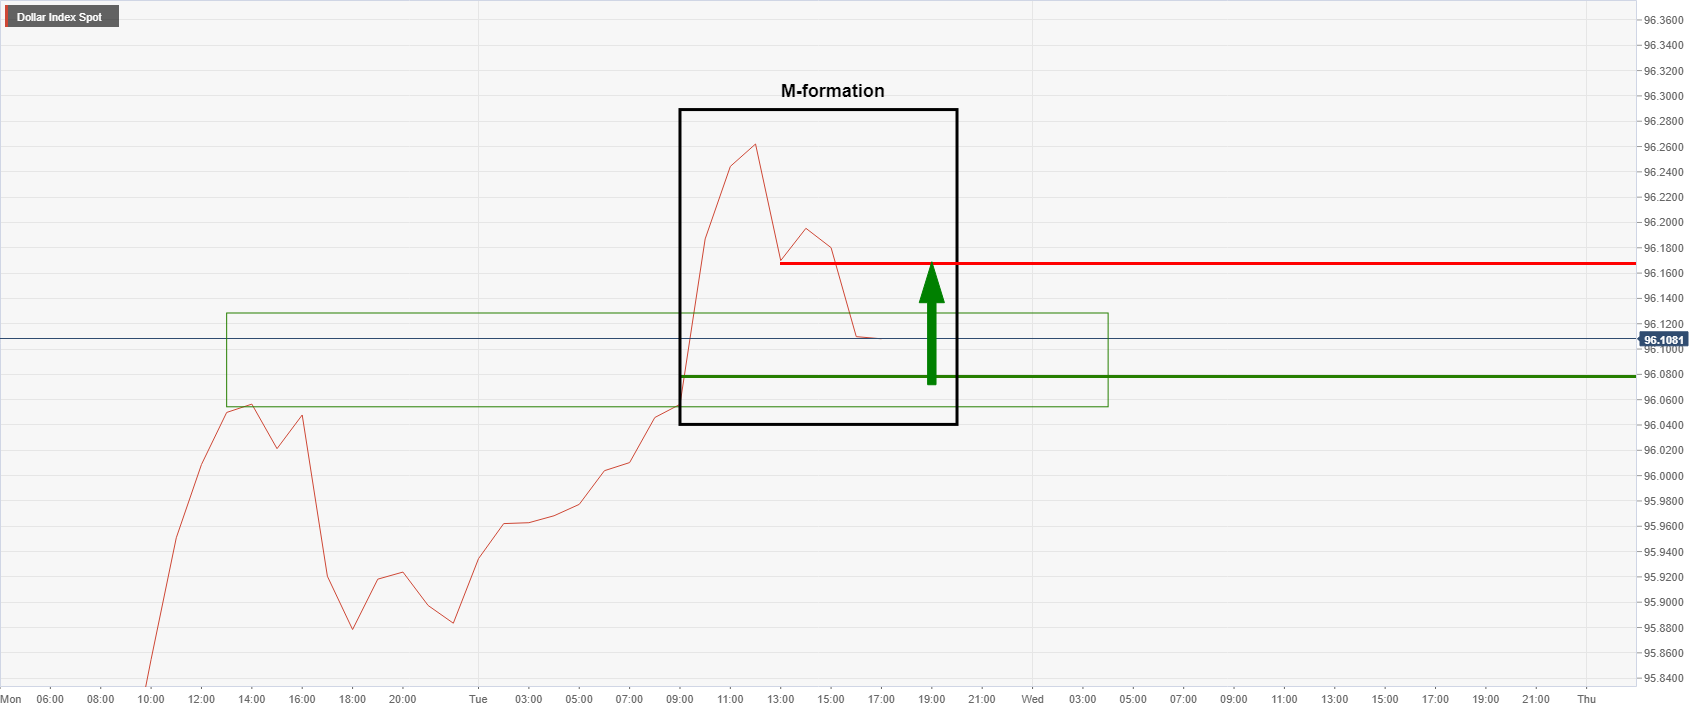
US dollar H1 chart
The US dollar is closing the gap but the M-formation being left behind is a reversion pattern and the neckline towards 96.20 could be retested in coming hours:
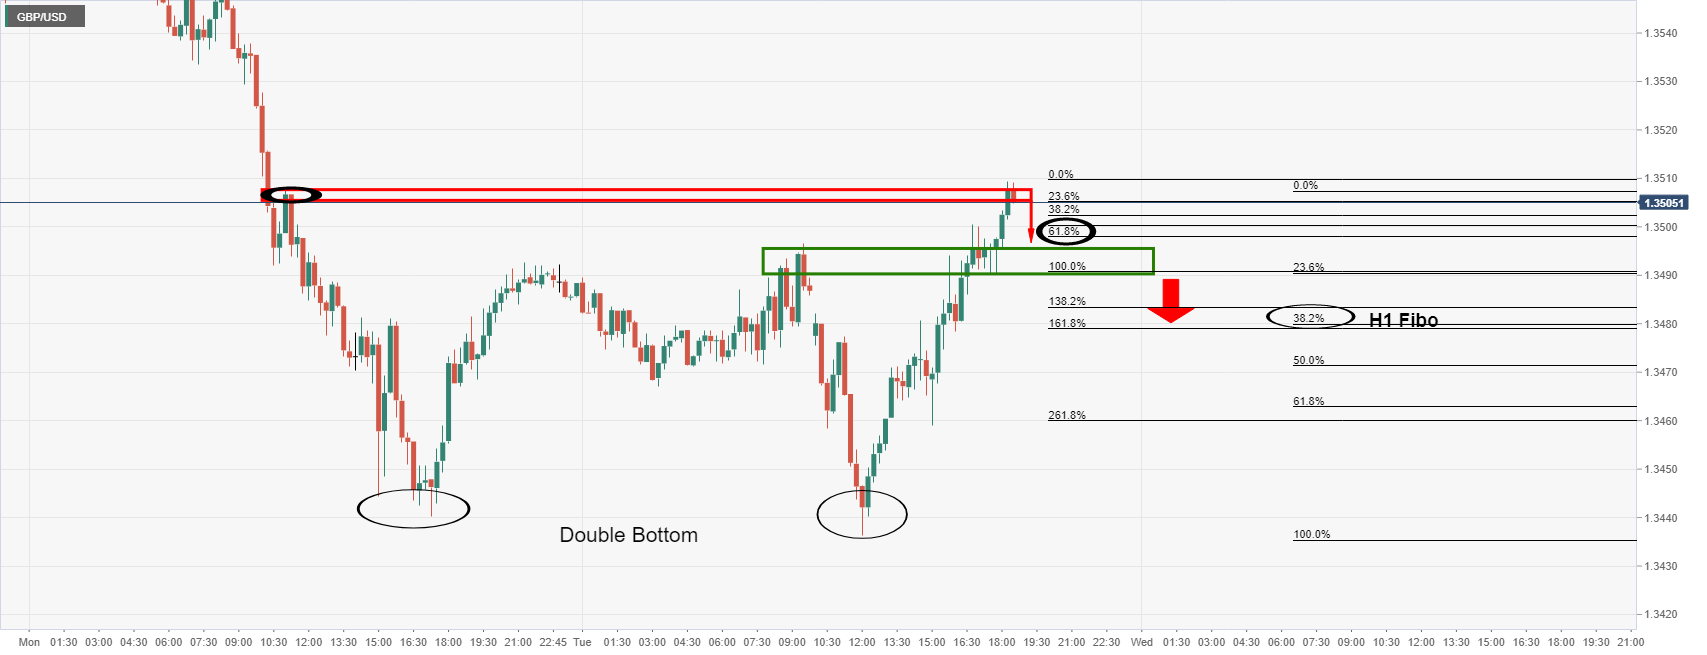
GBP/USD H1 and M15 charts
This would be expected to keep the pound anchored to 1.35 the figure or thereabouts:
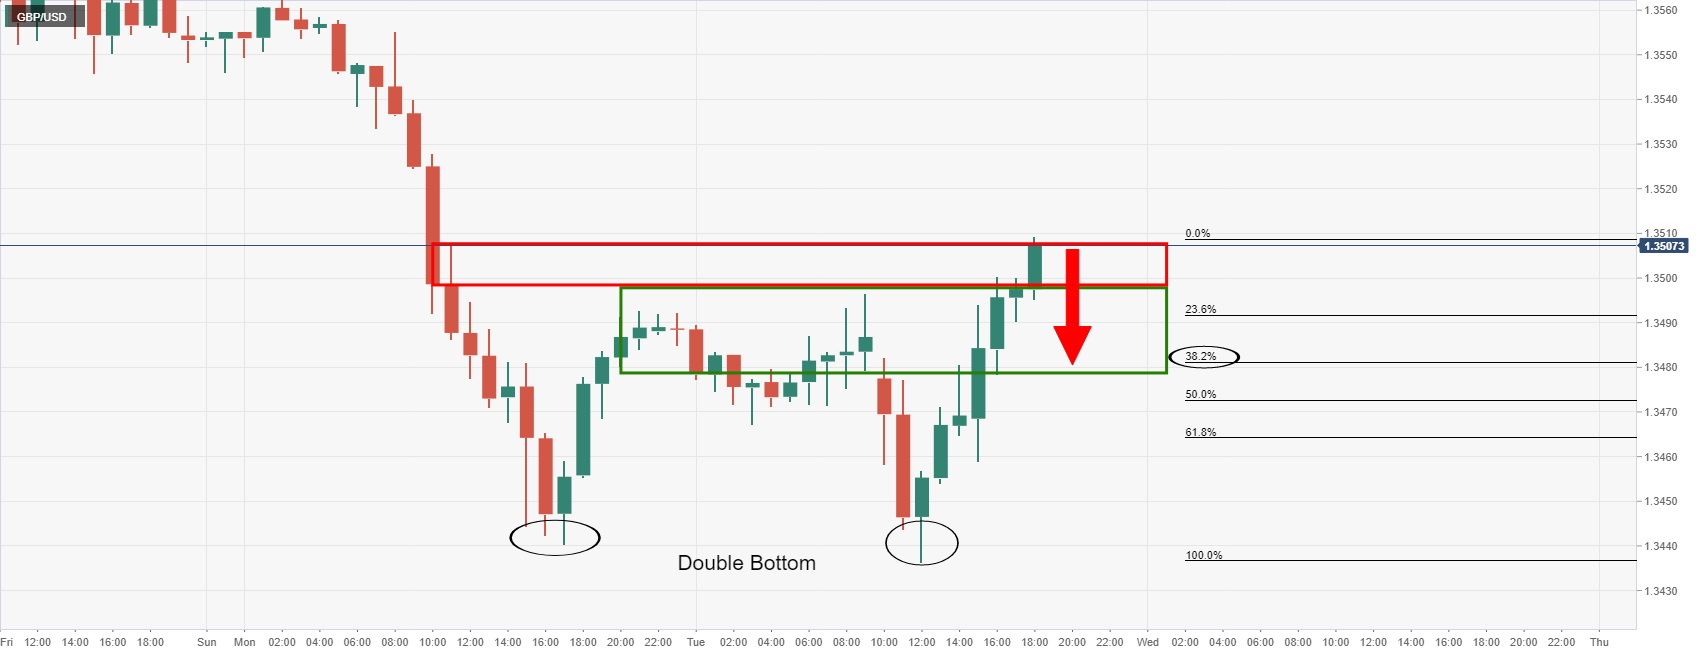
The price has made a double bottom on the hourly chart and the break of the prior corrective highs near 1.3500 the figure is encouraging from a bullish perspective. However, from a lower time frame schematic, a correction would be expected at this juncture:

The price has run into a wall of resistance as per the 15-min chart and rejection in the first test here opens risk back to the 61.8% Fibo if the 51-min bullish impulse near 1.35 the figure. Support is seen into 1.3490. However, the 38.2% Fibonacci level near 1.3480 could come under pressure if the bulls do not commit at 1.35 the figure for the sessions ahead.
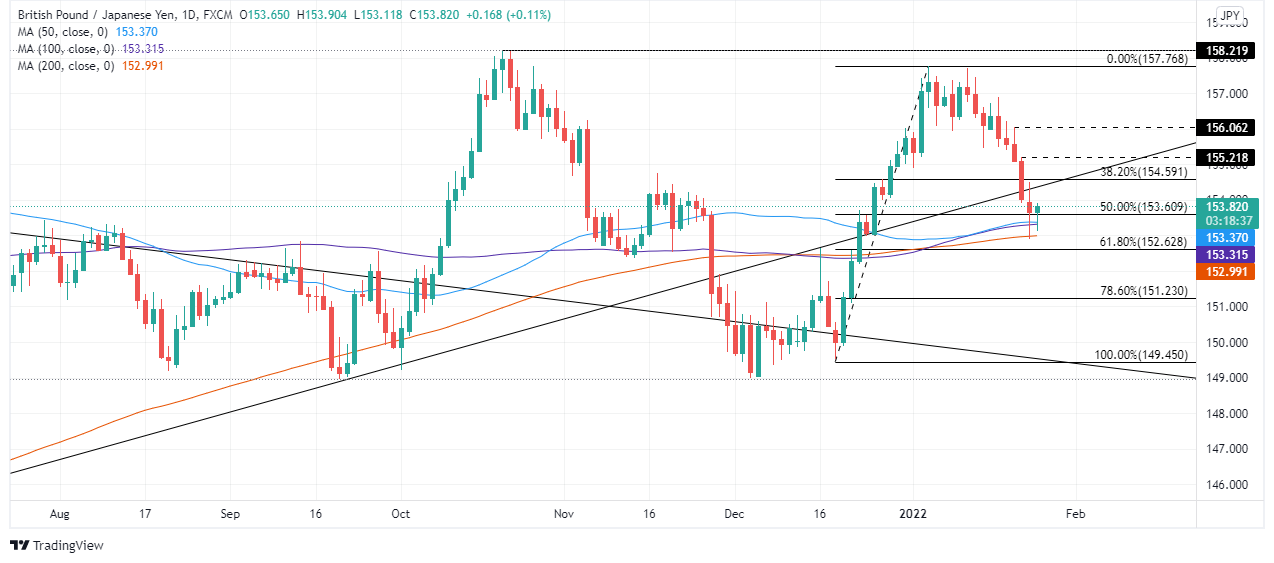
- On Tuesday, the GBP/JPY advances 0.12% during the North American session.
- Geopolitical issues and US central bank hawkish expectations dented investors' sentiment.
- GBP/JPY is upward biased, supported by the confluence of the 50, 100, and 200-DMAs around the 152.99-153.37 area.
The British pound snaps five days of losses against the Japanese yen, influenced by dampened market sentiment, spurred by the Ukraine – Russia conflict, alongside US central bank tightening monetary policy conditions, as the Federal Reserve begins its two-day meeting. At the time of writing, the GBP/JPY is trading at 153.78.
The GBP/JPY remained subdued in the overnight session, for North American traders, in the 153.12-70 range. Nevertheless, JPY bulls have been unable to test the YTD low reached on January 24 at 152.90, attributed to the confluence of the daily moving averages (DMAs) in the 152.99-153.37 range that provided support for British pound buyers.
GBP/JPY Price Forecast: Technical outlook
That said, the GBP/JPY daily chart supports an upward bias, despite falling 480 pips since January 12, after reaching a high at around 157.70.
To the upside, the cross-currency first resistance would be the confluence of the 38.2% Fibonacci retracement level, drawn from the 149.45-157.77 range, alongside the January 24 daily high at 154.59. A break above that level would expose the January 21 daily high at 155.22, followed by January 20 daily high at 156.06.
Contrarily, the first support would be the 50-DMA at 153.37, followed by the 100-DMA at 153.32 and then the 200-DMA at 152.99.
- The New Zealand dollar falls for four straight days, attributed to risk-off market sentiment.
- Geopolitical issues weigh on the NZD to boost the greenback prospects.
- US Consumer Confidence came lower than expected though investors mainly ignored it.
The New Zealand dollar slides during the North American session, trading at 0.6679 at the time of writing. A downbeat market sentiment portrayed by US equities trading in the red weighs on the NZD, boosting the safe-haven status of the greenback.
Eastern Europe conflict and FOMC monetary policy meeting dampen investors mood
Factors like the Federal Reserve monetary policy meeting and the Ukraine – Russia conflict keep investors nervous. Safe-haven assets like gold and low-yield currencies tend to benefit in times of geopolitical uncertainty.
During the North American session, the US Department of Defense put 8,500 American troops under high alert and will be deployed IF Russia attacks Ukraine. At press time, the Ukraine President said that the situation is under control. They are working to ensure that the meeting between the Presidents of Ukraine, Russia, Germany, and France takes place as soon as possible, as reported by Reuters.
In the meantime, the US 10-year T-bond yield sits at 1.75% during the day, underpins the greenback with the US dollar index, which measures the buck’s value against its peers, climbs 0.17%, up to 96.080.
The US economic docket featured the Conference Board (CB) Consumer Confidence Index, which came at 113.80, down from December 115.2 reading.
According to Lynn Franco, Senior Director of Economic Indicators at The Conference Board, consumer confidence moderated a bit in January. Regarding inflation concerns, she noted that “… declined for the second straight month, but remain elevated after hitting a 13-year high in November 2021.” Further added that “looking ahead, both confidence and consumer spending may continue to be challenged by rising prices and the ongoing pandemic.”
Therefore, NZD/USD traders will take cues from market sentiment, which has been downbeat, influenced by the eastern Europ conflict. That alongside the Federal Reserve, monetary policy meeting, might keep traders on the sidelines before opening new bets in the pair.
- USD/CHF hit its highest level in nearly two weeks on Tuesday amid CHF underperformance despite risk-off equity market flows.
- The pair is probing 0.9200, a break above which could open the door to a test of annual highs.
- Market commentators speculated that SNB intervention might be behind a portion of Tuesday’s weakness.
USD/CHF hit its highest level in nearly two weeks on Tuesday as the Swiss franc lost its safe-haven shine despite further downside in US (and global) equities and ongoing Italian political uncertainty. The pair broke to the north of its 200 and 21-day moving averages in the 0.9160 area and above last week’s peaks around 0.9180 and is now probing the 0.9200 level and the 50-day moving average just above it. At current levels ever so slightly below the big 0.9200 figure, the pair is trading with gains of about 0.7% o the day, making it the standout worst performer in the G10 FX space on the day.
Market commentators speculated that SNB intervention might be behind a portion of Tuesday’s weakness. Traders should watch next Monday’s weekly Swiss sight deposit balance data for “confirmation”, with a sharp rise usually indicative of increased SNB CHF selling. Focus for the rest of the week will be dominated by Wednesday’s Fed policy announcement. Analysts suspect that the expected hawkish tone to this meeting (where the Fed will give the green light to a March rate hike and then QT later in the year), as well as the continued risk-off tone being seen in US equity markets, suggests upside risks for USD this week.
A big question will be, if markets continue to trade with a risk-off bias for the rest of the week, will safe-haven demand for CHF return? And would any return of safe-haven demand for the franc be enough to shield it from safe-haven demand from the buck? From a technical perspective, if USD/CHF manages a clean break above 0.9200, then a move back to 2022 and December 2021 highs near 0.9300 will be o the cards.
- AUD/USD is stable in the 0.7140 area on Tuesday after Monday’s brief dip below 0.7100.
- Hotter than expected Australian CPI data is helping shield AUD from further risk appetite-related losses as US equities slide.
After coming within a whisker of hitting the December 20 lows just above 0.7080 on Monday but then subsequently recovering back to the 0.7150 area as Wall Street recovered, AUD/USD has remained resilient and trades flat near 0.7140 on Tuesday. That despite sentiment in US equity markets taking a turn for the worse again, which weighed on the pair this time on Monday. Stronger than expected headline US Consumer Confidence figures for January have also not been able to weigh substantially on the pair that has held in the 0.7120-0.7160ish ranges for most of Tuesday’s session thus far.
The Aussie is finding support following a hotter than expected Q4 2021 Consumer Price Inflation report out of Australia that showed the headline rate rising from 3.0% in Q3 to 3.5% versus forecasts for a rise to 3.2%. Importantly, the RBA’s Trimmed Mean measure of inflation rose to 2.6% from 2.1%, much larger than the expected jump to 2.4%, putting core inflationary pressures back above the midpoint of the RBA’s 2-3% target range two years earlier than the central bank forecast. The data helped to stoke RBA tightening bets, thus helping to underpin the Aussie and shield it from the risk appetite-related downside being seen in its antipodean counterpart NZD on Tuesday.
Despite current RBA guidance that there will be no rate hikes until late-2023/2024, money market futures are now nearly pricing a 15bps rate hike in full by May. “Next week the RBA will likely end its QE and bring forward the timing it expects to begin raising rates from late-2023/2024 (according to its current forecasts) to firmly into 2023” noted analysts at Credit Agricole. “At this stage, the RBA is unlikely to give up its forecast of no rate hikes in 2022 until it sees wages data in February” the analysts added.
If the RBA’s meeting next week underwhelms market expectations for a hawkish shift and a signal for rate hikes in 2022, that suggests downside risks for AUD/USD, a cross already hampered recently by deteriorating risk appetite and a strengthening dollar. Bears will be looking for a more sustained break below 0.7100 in the coming days/weeks which would open the door to a move towards December lows at 0.7000.
- The greenback slides against the Japanese yen, despite a mixed market mood.
- Some 8,500 American troops were put under high alert, attributed to the escalation of the Russia – Ukraine conflict.
- USD/JPY is upward biased despite breaking under the 50-DMA, though the longer time-frame ones remain under the spot price.
In the North American session, the USD/JPY extend its advance for two consecutive days, closing to the 114.00 psychological level. At the time of writing, the USD/JPY is trading at 113.90.
Eastern Europe conflict and FOMC meeting, spurred a risk-off market mood
The market sentiment is mixed as European equities trade in the green and the US stock indices post losses. Factors like the Ukraine – Russia conflict and the US central bank signaling the possibility of hiking rates in the March FOMC meeting.
Today, the Federal Reserve will begin its two-day monetary policy meeting, which will be watched closely by market participants, as they assess the central bank’s timeline for hiking rates and the forward guidance regarding Quantitative Tightening (QT).
Regarding the eastern Europ conflict, “the US Department of Defense in Washington said about 8,500 American troops were put on heightened alert and were awaiting orders to deploy to the region if Russia invade Ukraine,” according to Reuters.
In the meantime, the US 10-year Treasury yield declines two basis points, sitting at 1.752%, weighs on the USD/JPY. The US Dollar Index, a measurement of the greenback’s performance against a basket of six rivals, advances 0.28% sits at 96.182.
The US economic docket featured the CB Consumer Confidence decreased to 113.8 from 115.2 December’s reading, revised down. The market expected a reading of 111.2.
USD/JPY Price Forecast: Technical outlook
The USD/JPY is upward biased; despite breaking under the 50-day moving average (DMA) on January 20. The pair broke below the aforementioned, finishing the day at 114.07. That said, the USD/JPY has been unable to reclaim the level, though it fell 15-pips short of reaching it during the day.
To the upside, the USD/JPY first resistance would be the 114.00 figure. The breach of the latter would expose the 50-DMA at 114.28, followed by the January 18 daily high at 115.06.
Contrarily, the first support would be 113.67. A break under that level would expose the January 24 daily low at 113.47, followed by the 100-DMA that could sponsor a recovery for USD bulls at 113.29.
- US equities have turned lower again on Tuesday as markets continue to fret ahead of Wednesday’s Fed policy announcement.
- The S&P 500 is down 1.6%, the Nasdaq 100 2.5% and the Dow 0.8%.
After Monday’s stunning late-session recovery that saw the major US indices post and incredible recovery from intra-day lows, sentiment has taken a turn for the worse again. The S&P 500, which recovered a more than 4.0% dip to as lows as the 4220s on Monday to close above 4400, is trading about 1.6% lower on Tuesday in the 4320 area, though has admittedly recovered from a brief dip under 4300. At current levels, the index now trades with losses of about 1.9% on the week and 9.5% on the month. If the S&P 500 closes at current levels, it will confirm a correction (or 10% drop) from recent record highs printed back at the start of the year above 4800.
Strong Q4 earnings releases from blue-chip companies 3M and IBM failed to lift the mood, with markets instead opting to fret about the potential outcome of Wednesday's Fed policy announcement. The two-day Fed meeting kicks off on Tuesday and the bank is expected to give the green light to multiple rate hikes (starting in March) in 2022 as well some ideas for potential quantitative tightening plans. Ahead of that, earnings from mega-cap tech giant Microsoft after Tuesday’s close offer the opportunity to lift market sentiment ahead of earnings from Apple and Tesla later in the week.
Looking at the other major US indices; with tech leading the equity market decline on Tuesday, the Nasdaq 100 is the underperformer, down 2.5% on the day, taking its on-the-year losses to 13.5%. The Dow, meanwhile, was last down about 0.8% near the 34K level, though did recover from a brief intra-day dip as low as the 33.6K where it traded as much as 2.4% down. The S&P 500 Volatility Index, which nearly went as high as 40.00 on Monday, its highest since November 2020 at the time, was stable in the 32.50 area.
AUD/USD has been on the back foot since the middle of the month. Economists at Rabobank expect the aussie to struggle amid mounting tensions between Russia and Ukraine but improving Australian fundamentals could lift the pair to 0.74 by year-end.
Scope for AUD to outperform the GBP on a six-month view
“The USD is likely to remain on the front foot through the first half of this year as Fed tightening begins.”
“The USD’s dominance in the global payments system suggests it is set to find additional support if the tensions regarding Ukraine worsen further. AUD/USD could struggle to make much headway in this environment particularly given its historical sensitivity to risk appetite.”
“The improvement in Australia fundamentals suggests AUD/USD has to potential to finish the year moderately higher in the 0.74 area.”
“We see scope for AUD to outperform the GBP on a six-month view. This is based on our estimate that the market has priced in too much policy tightening from the BoE.”
“Our six-month GBP/AUD forecast stands at 1.74.”
- Metals and US stocks remain volatile amid concerns across markets.
- XAU/USD rises $10 in a few minutes and then erases gains.
- Positive outlook for gold while above $1830.
A quick drop in US yields boosted XAU/USD that jumped from $1840 to $1853, reaching the highest level since November 19. It then pulled back all the way to $1840 and now is approaching the $1850 area again.
Prices remain volatile in metals, stocks and bonds. The spike in gold took place amid a quick decline in US yields and after US stocks trimmed losses. The Dow Jones is falling 1.08% and the Nasdaq 2.37%, both indices off lows.
Market participants await the outcome of the FOMC meeting. On Wednesday, the central bank is expected to give clear signals of a March rate hike.
Short-term outlook
Volatility across financial markets is also affecting gold that can jump and then reverse sharply in a few minutes. The outlook for gold remains biased to the upside while above $1830. A side below would clear the way for to a test of the 20-day simple moving average at $1820.
A consolidation above $1850 would be a positive development pointing to more gain with a target at the next resistance zone at $1865/70.
- USD/CAD has dropped back from earlier session highs in the 1.2660s to the 1.2640 area.
- The loonie and other risk-sensitive currencies remain highly sensitive to US equity market volatility.
- But traders may be reluctant to sell CAD ahead of Wednesday’s BoC rate decision.
USD/CAD has dropped back from earlier session highs in the 1.2660s to the 1.2640 area, to put it back to trading with Asia Pacific 1.2620-1.2650ish trading ranges. The loonie and other risk-sensitive currencies remain highly sensitive to US equity market volatility. Major US indices have been taking a beating heading into Wednesday’s Fed policy meeting, where the bank is expected to give the green light for as many as four rate hikes in 2022 and also the start of quantitative tightening. After recovering a more than 4.0% drop on Monday, the S&P 500 is reeling again on Tuesday and is down about 1.8%, meaning it is now more than 10% below its recent record highs and in correction territory.
At current levels in the 1.2630s, USD/CAD trades flat on the day, with the loonie holding up better versus the buck than the likes of the euro, Swiss franc, New Zealand dollar and Scandinavian currencies. Traders may be reluctant to sell CAD ahead of Wednesday’s BoC rate decision, where there appears to be an outside chance that the central bank surprises market participants with a 25bps rate hike. In a recent Bloomberg poll, seven out of 31 participants said they think the BoC will hike this week. A surprise hike would cut against the guidance that the bank has given in recent months; currently, the BoC sees the conditions for a rate hike being met in “the middle quarters of 2022”, implying a hike no earlier than April.
But last week’s hot Consumer Price Inflation report and strong quarterly Business Outlook Survey, which pointed to strong growth, high inflationary pressures and a tight labour market, all suggest a hawkish tweak to guidance is coming. In other words, it seems very likely that if the BoC doesn’t go with an outright rate hike on Wednesday, they will at the very least signal that a hike could be coming as soon as March. USD/CAD traders will thus have their hands full for the remainder of the week, juggling what are likely to be hawkish Fed and BoC meetings on Wednesday as well as an ongoing downturn in macro risk appetite. That suggests a mixed outlook for USD/CAD, with arguably some upside risk. Any break above Monday’s 1.2700 highs would open the door for a rally towards the next resistance around 1.2800.
- Rising US T-bond yields underpin the greenback weigh on the precious metals complex.
- Ukraine and Russian tensions keep the markets looking for the safe-haven status of the USD.
- XAG/USD Technical Outlook: Bearish biased unless it breaks above the 200-DMA at $24.61.
Silver slides for the third consecutive trading session, trading at $23.81 during the New York session at the time of writing. The market mood has remained unchanged since the beginning of the week. Ukraine – Russian conflict keeps grabbing the headlines while market participants await the Federal Reserve monetary policy decision.
The white metal – a safe-haven precious metal like gold–failed to appreciate, despite geopolitical issues in part attributed to the US T-bond yields, recovering some of Monday’s losses, when it pierced the 1.70% threshold at press time sits at 1.747%, underpins the greenback. The US Dollar Index, a gauge of the buck’s value against a basket of its rivals, advances 0.28%, up to 96.118 at 14:19GMT.
Analysts at TD securities expressed that a hike to the funds rate at the March FOMC meeting has already been signaled by Fed policymakers, led by Jerome Powell. A lift-off signal from the January meeting should not surprise anyone. Nevertheless, the topic that keeps investors uneasy is Quantitative Tightening (QT), or the balance sheet reduction.
The US economic docket featured the Housing Price Index (HPI), which came at 1.1% in line with expectations. At 15:00 GMT, the Conference Board will release the Consumer Confidence for December, expected at 111.4.
XAG/USD Price Forecast: Technical outlook
On Tuesday, the white metal is trading near the close of Monday, which was $23.98. two cents from the $24.00 threshold. The price action of the last two days approached the 78.6% Fibonacci retracement drawn from the last pivot low at $22.81 to the highest of the year at $24.70. However, the white metal is bearish-biased unless XAG/USD breaks the 200-day moving average (DMA) at $24.61.
To the upside, the first resistance is the 38.2% Fibonacci retracement level at $23.98, unsuccessfully broken one time. The next supply zone would be the January 24 daily high at $24.31, followed by the abovementioned 200-DMA at $24.61.

- EUR/USD remains well on the defensive and drops to 1.1260.
- The dollar keeps pushing higher despite mixed yields.
- US Consumer Confidence comes up next.
Further weakness dragged EUR/USD to fresh 2022 lows in the proximity of the 1.1260 level on Tuesday.
EUR/USD weak on dollar buying
EUR/USD remains under heavy pressure in a context favourable to the greenback, where geopolitical tensions persist and US money markets continue to show a mixed performance.
On the latter, yields in the short end of the curve manage to regain some upside traction as opposed to the continuation of the downtrend in the belly and the long end.
In the meantime, the risk complex remains well under pressure against the backdrop of rising cautiousness ahead of the FOMC meeting on Wednesday, where consensus seems to be tilted towards a hawkish message from the Committee.
Further out, better-than-expected results in the German docket failed to lend some support to the shared currency after the Business Climate tracked by the IFO survey surprised to the upside in January.
Across the pond, house prices measured by the FHFA House Price Index and the S&P/Case-Shiller Index rose 1.1% MoM in November and 18.3% YoY in the same period, respectively. Further data showed the relevant US Consumer Confidence at 113.8 in January (from 115.2) and the Richmond Fed Manufacturing Index retreating to 8 for the same month.
EUR/USD levels to watch
So far, spot is losing 0.43% at 1.1276 and faces the next up barrier at 1.1369 (high Jan.20) seconded by 1.1469 (100-day SMA) and finally 1.1482 (2022 high Jan.14). On the other hand, a break below 1.1263 (2022 low Jan.25) would target 1.1221 (monthly low Dec.15 2021) en route to 1.1186 (2021 low Nov.24).
According to the latest US Conference Board survey, headline Consumer Confidence fell to 113.8 in January from 115.2 (revised lower from 115.8) in December, less than the expected decline to 111.8. The drop slight drop reflects the impact of the rapid spread of the Omicron Covid-19 variant in the US over the last few weeks, but remains substantially above prior pandemic lows in the 80 area, endorsing the Fed's view that the economy has become more resilient to each new Covid wave.
Market Reaction
FX markets do not seem to have reacted to the latest, despite it underpinning the idea of economic resilience in the face of the Omicron variant which should underpin Fed confidence in the economic recovery.
- After chopping within an $82.00-$86.00 range on Monday, WTI futures are a little lower on Tuesday in the mid-$83.00s.
- But WTI’s on-the-year outperformance compared to equities remains remarkable and will likely persist amid bullish crude oil specific factors.
It was a choppy start to the week for global oil markets, with front-month WTI futures swinging within an $82.00-$86.00 range as energy markets were buffeted by extreme volatility in US equity markets. With US equity futures pointing lower heading into the Tuesday, oil prices are also sagging, with WTI down just under 50 cents and trading in the mid-$83.00s, now a good $4.0 below the multi-year highs printed last Wednesday above $87.50. While recent volatility/downside in US equity markets, which analysts have said is being driven by heightened Fed tightening fears ahead of Wednesday's policy announcement, has weighed on oil in recent days, oil continues to outperform on an on-the-year basis.
WTI is up 11% on the year having surged from the mid-$75.00s, S&P 500 futures are (ahead of the open) trading down nearly 9.0% on the year. Crude oil-specific factors have been supporting oil prices. Firstly, expectations for a continued robust recovery in crude oil demand this year remain elevated, with the international spread of Omicron already easing and not seen as dealing a long-term blow to demand. Secondly, OPEC+ supply issues have been a big theme, with smaller producers in the cartel struggling to keep pace with rising output quotas.
Geopolitical tensions have also been amping up increasing the risk-premia embedded in oil prices; Iran-aligned Yemeni militia groups have recently upped attacks on the UAE, near the key Strait of Hormuz global oil supply chokepoint. Meanwhile, NATO has started beefing up its Eastern European military presence in response to the Russian military build-up on the Ukrainian border. The implication for Russia’s oil output/exports (Russia is the world’s third-largest oil producer of more than 11M barrels per day) in case of a military incursion remains unclear. These factors are likely to keep oil prices underpinned relatively well versus equity markets, even if the downturn in the latter continues.
- GBP/USD dropped to a fresh multi-week low, though found support ahead of the monthly low.
- The set-up still favours bearish traders and supports prospects for a further depreciating move.
- Attempted recovery could be seen as a selling opportunity near the 1.3530 support breakpoint.
The GBP/USD pair extended its recent pullback from the vicinity of mid-1.3700s, or a two-month low and witnessed some selling for the fourth successive day on Tuesday.
The downward trajectory dragged spot prices to a fresh three-week low during the mid-European session, though stalled just ahead of the monthly swing low. The GBP/USD pair once again showed some resilience below the 50% Fibonacci retracement level of 1.3161-1.3749 move up and has now recovered to the 1.3465 area.
Given the overnight breakthrough the 100-day SMA and the 38.2% Fibo. confluence and the subsequent slide below the 1.3500 psychological mark, the bias remains tilted in favour of bearish traders. Hence, any attempted recovery runs the risk of fizzling out rather quickly and remain capped amid the UK political crisis.
The near-term negative outlook is reinforced by the fact that technical indicators on the daily chart have just started drifting into the negative territory. A subsequent slide below the monthly swing low, around the 1.3430 region, will reaffirm the bearish bias and set the stage for a further near-term depreciating move.
The GBP/USD pair might then turn vulnerable to accelerate the downfall towards the 1.3400 mark en-route the 61.8% Fibo. level support, around the 1.3380 region. Some follow-through selling has the potential to drag spot prices further towards the next relevant support near the 1.3320 horizontal zone.
On the flip side, the 1.3500 mark now seems to act as an immediate resistance ahead of the 1.3530-1.3535 confluence support breakpoint. A sustained strength beyond could trigger a short-covering bounce and allow bulls to aim back to reclaim the 1.3600 mark, which coincides with the 23.6% Fibo. level resistance.
GBP/USD daily chart
-637787157802188836.png)
Technical levels to watch
Sterling losses are extending for the seventh day in eight to trade in the mid 1.34s. Economists at Scotiabank note that a breach of the 1.34 would clear the way for a slump to the 1.32 area.
Cable has failed at the 1.3495/500 resistance
“GBP/USD is still holding above Monday’s intraday low of 1.3440 that stands as support, followed by the 50-day MA at 1.3421 and the big figure area.”
“A break under 1.34 will spell more trouble ahead for the pound and target a move to the 1.32 zone.”
“Resistance is 1.3495/500 (failed test this morning) followed by the 100-day MA at 1.3536 and the mid-figure area.”
The collapse in the S&P 500 has extended to the 38.2% retracement of the rally from October 2020 at 4213 and the aggressive turnaround higher has seen a near-term bullish reversal pattern complete. Strategists at Credit Suisse look for a consolidation phase into the FOMC on Wednesday, but with 4430/4450 ideally capping.
VIX set to challenge the October 2020 high of 41.16
“We look for a consolidation/recovery phase to emerge prior to the FOMC this Wednesday. We thus look for a test of resistance at 4430/50 – the key 200-day average and 38.2% Fibonacci retracement of the January collapse – but with our bias for this to cap for a phase of consolidation, ahead of a retest of 4213/4164.”
“Whilst we will look for evidence of a floor at 4213/4164 again, should weakness extend we would see scope for further weakness to 4057, potentially 3855/15.”
“A close above 4450 would be seen to mark a further stabilization, with resistance then seen next at 4477 ahead of 4495.”
“VIX continues to surge higher and we look for a test of 41.16/36 – the October 2020 high and 38.2% retracement of the 2020/2021 fall. Beyond here, and we would then see scope for a move to 50.”
EUR/USD slips under 1.13. Economists at Scotiabank expect the pair to find support around the 1.1250 level.
Euro remains at risk of further losses on mounting Russia/Ukraine tensions
“The EUR’s losses since mid-month have today seen it break under the bottom of the upward trending channel where it traded since late-November (at 1.1292). Losses beyond this point may find support at the mid-figure area followed by ~1.1220/35.”
“Resistance is 1.1290/300 followed by ~1.1335.”
“The EUR remains at risk of further losses on escalating risks between Russia and Ukraine (and NATO), as well as tomorrow’s Fed meeting where the bank will likely tee up a rate hike.”
- USD/TRY adds to the recent upside momentum.
- The stronger dollar weighs on the EM FX space.
- Turkey 10y bond yields sink to multi-week lows.
The Turkish currency depreciates further and motivates USD/TRY to advance to new tops near 13.60 on Tuesday.
USD/TRY up on dollar gains, geopolitics
USD/TRY trades with decent gains for the third session in a row in the first half of the week, always amidst the strong rebound in the US dollar and persistent jitters stemming from the Russia-Ukraine front.
The offered stance in the lira seems to have accelerated after finmin N.Nebati said on Monday that around $10B in FX bank deposits could be converted to the Turkish currency, all following last week’s parliamentary decision that gains from such deposits will be exempt from corporate income tax.
It is worth recalling that the Erdogan Administration announced in late December a time-deposit scheme that compensates depositors for losses in case the lira depreciates during the duration of the deposit.
That announcement, coupled with increased FX intervention by the Turkish central bank (CBRT), forced USD/TRY to quickly abandon the area of all-time highs near 18.30 (December 20) and to drop to as low as the vicinity of the psychological 10.00 mark,
where solid contention emerged eventually.
In the calendar, Turkey’s Capacity Utilization eased a tad to 77.6% in January (from 78.7%) and the Manufacturing Confidence improved to 109.5 in the same month (from 106.1).
What to look for around TRY
The pair keeps the multi-session consolidative theme well in place, always within the 13.00-14.00 range. The range bound stance appears reinforced by the recent steady hand by the Turkish central bank, while skepticism keeps running high over the effectiveness of the recently announced plan to promote the de-dollarization of the economy. In the meantime, the reluctance of the CBRT to change the (collision?) course and the omnipresent political pressure to favour lower interest rates in the current context of rampant inflation and (very) negative real interest rates are forecast to keep the domestic currency under pressure for the time being.
Key events in Turkey this week: Capacity Utilization, Manufacturing Confidence (Tuesday) – Economic Confidence Index (Friday).
Eminent issues on the back boiler: Progress (or lack of it) of the government’s new scheme oriented to support the lira via protected time deposits. Constant government pressure on the CBRT vs. bank’s credibility/independence. Bouts of geopolitical concerns. Much-needed structural reforms. Growth outlook vs. progress of the coronavirus pandemic. Earlier Presidential/Parliamentary elections?
USD/TRY key levels
So far, the pair is advancing 0.63% at 13.5217 and a drop below 12.7523 (2022 low Jan.3) would expose 10.2027 (monthly low Dec.23) and finally 9.8039 (200-day SMA). On the other hand, the next up barrier lines up at 13.9319 (2022 high Jan.10) followed by 18.2582 (all-time high Dec.20) and then 19.0000 (round level).
- EUR/GBP pulls back to 0.8370 area after hitting near-one-month highs on Tuesday amid equity market turmoil.
- Some traders may continue to use EUR/GBP longs as a means of hedging against equity market weakness.
After Tuesday’s global equity market turmoil that translated into broad weakness in the more risk-sensitive G10 currencies, sending EUR/GBP to near one-month highs in the 0.8420s, the pair has pulled back a tad and stabilised in the 0.8375 area. Sellers appeared to take advantage of the latest rally to add to short positions, perhaps in anticipation that risk appetite-related GBP weakness will prove short-lived and BoE monetary policy tightening in the coming weeks will continue to weigh. Risk appetite stabilisation is far from guaranteed against the backdrop of a highly anticipated Fed policy meeting on Wednesday and rising NATO/Ukraine/Russia tensions. Some traders may continue to use EUR/GBP longs as a means of hedging against equity market weakness.
Elsewhere, the latest stronger than expected German IFO survey results haven't translated into euro strength and didn’t impact EUR/GBP. The economic commentary from IFO was downbeat, with the group saying it is too early to talk about an economic turnaround in Germany. IFO added that there is not yet any easing of prices, with about half of firms surveyed looking to raise prices. Data has taken a back seat as a driver of FX market sentiment this week, with EUR/GBP not responsive to Monday’s mixed Eurozone and weaker than expected UK PMIs either.
That is likely to remain the case when individual Eurozone countries start releasing Q4 2021 GDP data at the end of the week, with focus more on themes like risk appetite, geopolitics and central bank tightening. In the same vein, as calls for UK PM Boris Johnson to resign grow ever louder in the UK as the Downing Street party scandal grows, FX strategists remain confident this won't result in lasting GBP weakness. “Should Johnson leave, his successor would likely be seen as a safe pair of hands and we do not see any political risk premium being built into GBP” say analysts at ING.
- USD/CAD edged higher on Tuesday, albeit lacked any follow-through or bullish conviction.
- Fed rate hike bets, surging US bond yields benefitted the USD and extended some support.
- Weaker crude oil prices undermined the loonie and further acted as a tailwind for the pair.
- Investors, however, seemed reluctant ahead of the FOMC and BoC decision on Wednesday.
The USD/CAD pair traded with a mild positive bias through the early North American session, albeit seemed struggling to capitalize on the move beyond mid-1.2600s.
Following the previous day's pullback from the 1.2700 mark, or a two-week high, the USD/CAD pair edged higher on Tuesday and was supported by a combination of factors. Weaker crude oil prices undermined the commodity-linked loonie and acted as a tailwind for the major. Adding to this, broad-based US dollar strength also extended some support to the pair, though the uptick lacked bullish conviction.
The USD continued drawing support from firming expectations that the Fed will tighten its monetary policy at a faster pace than anticipated. In fact, the markets have fully priced in an eventual lift-off in March and expect a total of four hikes in 2022. This was reaffirmed by a strong pickup in the US Treasury bond yields, which turned out to be another factor that benefitted the greenback.
That said, speculations that the Bank of Canada could increase rates as early as this week – amid a jump in Canada’s annual inflation rate to a three-decade high – helped limit losses for the Canadian dollar. This, in turn, held back traders from placing aggressive bets heading into the key central bank event risks – the BoC policy decision and the outcome of a two-day FOMC meeting on Wednesday.
Hence, it will be prudent to wait for a strong follow-through buying before confirming that the USD/CAD pair has formed a strong base near the 1.2445 region and positioning for any further gains. Market participants now look forward to the release of the Conference Board's US Consumer Confidence Index. This, along with oil price dynamics, might provide some trading impetus to the USD/CAD pair.
Technical levels to watch
Gold ends up closing the second straight week in positive territory. On Wednesday, the Federal Reserve will announce its policy rate decision and release the Monetary Policy Statement following its two-day meeting. In the view of FXStreet’s Eren Sengezer, XAU/USD could turn south on a hawkish Fed surprise.
Dovish scenario
“The Fed adopts a dovish tone by suggesting that it will remain patient with regards to policy tightening. US T-bond yields could fall sharply on such a shift in the policy outlook and provide a boost to XAU/USD. FOMC Chairman Jerome Powell would need to voice renewed concerns over the labour market and the growth outlook to convince investors that they will not rush to continue to lift rates after March.”
Hawkish scenario
“Chairman Powell will definitely have to respond to questions on the possibility of a 50 bps hike in March. If Powell reveals that they have discussed such an option, US T-bond yields could surge higher and force gold to turn south. Moreover, a decision to increase the reductions in monthly asset purchases could also be assessed as a bullish development for the greenback.”
- Spot gold prices have pulled back a little on Tuesday to back under $1840 but remain underpinned amid volatile equities.
- Gold remains resilient to a stronger USD and higher US yields and continue to trade well within recent $1830-$1845 ranges.
Spot gold (XAU/USD) prices have pulled back a little from Asia Pacific highs in the $1843 area over the last few hours and were last trading in the $1838 area, down about 0.3% on the day. That still leaves the precious metal well within recent $1830-$1845ish ranges that have prevailed over the last few sessions. High levels of US equity market volatility is helping underpin gold with safe-haven demand. The S&P 500 was all over the place on Monday, reversing a more than 4.0% drop, and has since dropped over 1.0% in pre-market trade on Tuesday.
That safe-haven demand amid turmoil in the equity space, as well as elevated geopolitical tensions (primarily in Eastern Europe), is helping to shield gold from recent advances in the US dollar and bond yields. As market pre-position ahead what should be a very hawkish Fed meeting on Wednesday, the Dollar Index (DXY) hit fresh three-week highs on Tuesday in the low-96.00s, boosted by higher yields across the US treasury curve (10s +4bps to 1.78%). Typically, this combination would be a negative for gold; a stronger USD makes dollar-denominated gold more expensive for the holders of international currencies and higher yields increase the opportunity cost of holding non-yielding precious metals.
November House Price and January Consumer Confidence data out of the UK on Tuesday is unlikely to shift the narrative much for markets or dissuade the Fed from deeming it appropriate to signal that multiple rate hikes and quantitative tightening in 2022 is appropriate. Indeed, very week flash January US PMI data (primarily the services sector) was shrugged off by markets on Monday as being driven by temporary Omicron factors and this is almost certainly also how the Fed will view things.
What will be most interesting this week will be if gold can continue to hold only a few bucks below multi-month highs near the $1840 if hawkish Fed vibes continue to drive the US dollar and US yields higher. Any move back to and break below support in the $1830 area would open the door to a drop back to the 200 and 50-day moving averages in the $1800 area.
- AUD/USD struggled to preserve stronger Australian CPI-led intraday gains to the 0.7175 region.
- Rebounding US bond yields, Fed rate hike bets underpinned the USD and exerted some pressure.
- Stability in the European equity markets failed to lend any support to the perceived riskier aussie.
The USD continued scaling higher through the mid-European session and dragged the AUD/USD pair to a fresh daily low, around the 0.7125 region in the last hour.
The pair struggled to capitalize on its early uptick supported by hotter-than-expected Australian CPI figures and attracted fresh selling near the 0.7175 area on Tuesday amid sustained US dollar buying. Against the backdrop of expectations for a faster policy tightening by the Fed, a strong rebound in the US Treasury bond yields pushed the greenback to a fresh two-week high. This, in turn, was seen as a key factor that exerted downward pressure on the AUD/USD pair.
Investors now seem convinced that the Fed would begin raising interest rates in March and have been pricing in a total of four hikes in 2022. Apart from this, rising geopolitical risk over Ukraine further benefitted the greenback's relative safe-haven status. The combination of factors, to a larger extent, negated signs of stability in the European equity markets and failed to impress bullish traders or lend any support to the perceived riskier aussie.
With the USD price dynamics turning out to be a key driver of the AUD/USD pair's momentum, traders now look forward to the Conference Board's US Consumer Confidence Index for a fresh impetus. Apart from this, the US bond yields will drive the USD demand. This, along with the broader market risk sentiment, should produce some trading opportunities. The key focus, however, will remain on the outcome of a two-day FOMC meeting, scheduled to be announced on Wednesday.
From a technical perspective, the emergence of fresh selling on Tuesday favours bearish traders and supports prospects for an extension of last week's rejection slide from the 100-day SMA. Sustained weakness below the 0.7100 mark will reaffirm the negative outlook and turn the AUD/USD pair vulnerable. The downward trajectory could then drag spot prices to the 0.7060-50 intermediate support en-route the 2021 swing low, around the key 0.7000 psychological mark.
Technical levels to watch
- EUR/USD drops further and clocks new 2022 low.
- The decline could now extend to the December 2021 low near 1.1220.
EUR/USD remains immersed into the negative territory and drops to new YTD lows in the 1.1270/65 band on Tuesday.
The bias appears tilted to a deeper pullback in the very near term. That said, the next support of note is now seen at the December 2021 low at 1.1221 (December 15) ahead of the 2021 low at 1.1186 (November 24).
The longer term negative outlook for EUR/USD is seen unchanged while below the key 200-day SMA at 1.1708.
EUR/USD daily chart
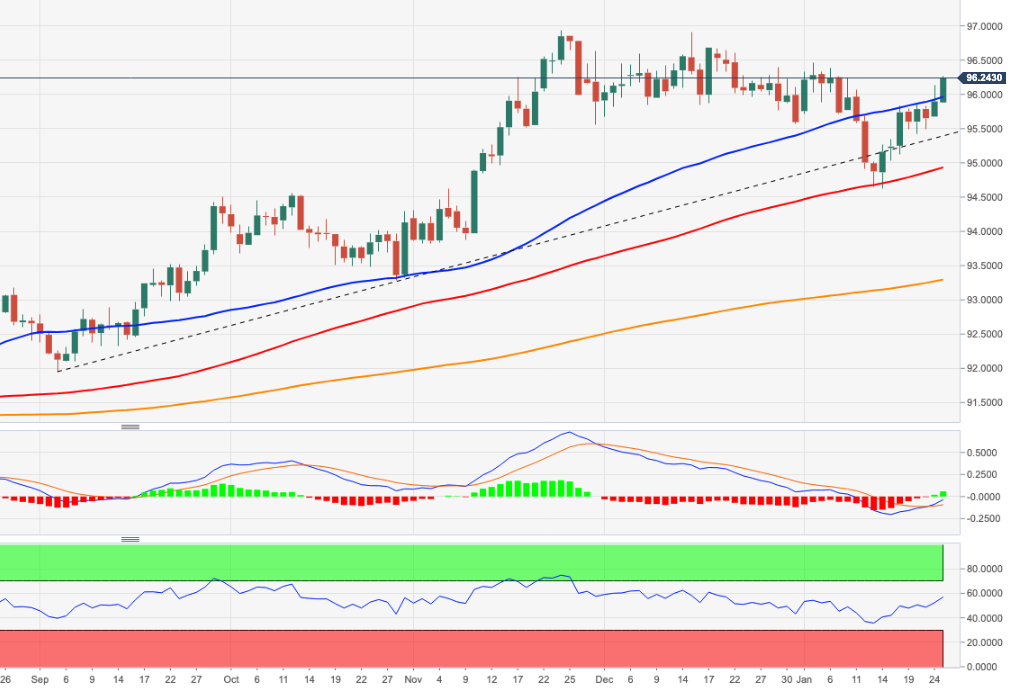
- DXY gathers extra steam and clinches tops around 96.30.
- The YTD peak at 96.46 emerges as the next key target.
DXY extends Monday’s upbeat tone and advances to multi-day tops in the vicinity of the 96.30 level on Tuesday.
The intense upside in the dollar has recently surpassed the 4-month line, today near 95.40, allowing for the continuation of the rebound in the short-term horizon. That said, the door now remains open to a potential assault of the so far 2022 top at 96.46 (January 4). The surpass of this level should then put the 2021 top at 96.93 (November 24) back on the radar.
Looking at the broader picture, the longer-term positive stance in the dollar remains unchanged above the 200-day SMA at 93.26.
DXY daily chart
- EUR/JPY resumes the downside after Monday’s uptick.
- Next on the way south comes the December 2021 lows near 127.50.
Sellers remain well in control of the sentiment surrounding EUR/JPY on turnaround Tuesday.
Price action in the cross keeps pointing to further retracements for the time being. Indeed, EUR/JPY accelerated the losses following the convincing breakdown of the key 200-day SMA (130.50) in past sessions, opening the door to a potential drop to the December 2021 low near 127.50 (December 3).
While below the 200-day SMA, the outlook for the cross is expected to remain negative.
EUR/JPY daily chart
Barnabas Gan, Economist at UOB Group, reviews the latest inflation figures in Singapore.
Key Takeaways
“Singapore’s consumer prices rose at its fastest rate since Feb 2013 at 4.0% y/y (+0.5% m/m sa) in Dec 2021. This is significantly higher compared to market expectations for a milder headline inflation rate of 3.7% y/y, albeit closer to our outlook of 3.9% y/y.”
“Inflation risks are still being felt at this juncture, given that headline inflation had accelerated for four straight months. Given the recent stronger-than-expected inflation readings, the authorities have refrained from publishing their full-year headline and core inflation outlook for 2022.”
“The higher-than-expected headline inflation as well as core inflation crossing the 2.0% handle reinforce our call for MAS to further normalise monetary policy in April 2022. Accounting for the perceived inflation drivers for 2022 amid higher inflation prints especially in 4Q21, we upgrade our headline and core inflation forecasts to 2.5% (from 2.0%) and 1.5% (from 1.0%) respectively for 2022 with upside risks.”
UOB Group’s FX Strategists noted USD/CNH still risks a decline to the 6.3180 level in the next weeks.
Key Quotes
24-hour view: “While we expected USD to weaken yesterday, we were of the view that ‘any weakness is expected to encounter solid support at 6.3300’. The subsequent weakness exceeded our expectations as USD dropped to 6.3248 before rebounding. The current movement is viewed as part of consolidation phase and USD is likely to trade between 6.3240 and 6.3430.”
Next 1-3 weeks: “Yesterday (24 Jan, spot at 6.3400), we highlighted that downward momentum is beginning to perk up and the chance for USD to break the major support at 6.3300 has increased. Our view was not wrong as USD subsequently dropped to 6.3248. Downward momentum has improved, albeit not by much. From here, USD could weaken further to 6.3180 (next support is at 6.3000). On the upside, a breach of 6.3500 (‘strong resistance’ was at 6.3650 yesterday) would indicate that the weak phase is USD that started more than a week ago (see annotations in the chart below) has come to an end.”
European Central Bank (ECB) chief economist Philip Lane said on Tuesday that the coronavirus Omicron variant is not turning out to be a factor that will influence the activity levels for the year, as reported by Reuters.
"So far, we do not see a big response of wages to inflation," Lane added.
Market reaction
The shared currency stays on the back foot following these comments. As of writing, the EUR/USD pair was trading at 1.1282, where it was down 0.35% on a daily basis.
- USD/JPY moved into the positive territory for the second successive day on Tuesday.
- Rebounding US bond yields underpinned the USD and extended support to the pair.
- A positive tone around the European equity markets weighed on the safe-haven JPY.
The USD/JPY pair climbed back above the 114.00 mark during the first half of the European session and was last seen trading near a two-day high.
A combination of supporting factors assisted the USD/JPY pair to attract some dip-buying near the 113.65 area on Tuesday and turn positive for the second successive day. The US dollar continued drawing support from expectations that the Fed will tighten its monetary policy at a faster pace than expected.
In fact, the markets seem convinced about an eventual Fed lift-off in March and have been pricing in a total of four rate hikes in 2022. Bulls further took cues from a goodish rebound in the US Treasury bond yields, which was seen as another factor that underpinned the buck and extended some support to the USD/JPY pair.
Meanwhile, the latest leg up witnessed over the past hour or so could be attributed to a positive tone around the European equity markets, which tends to weigh on the safe-haven Japanese yen. Bulls now await some follow-through buying beyond the 200-hour SMA before positioning for any further intraday appreciating move.
Market participants now look forward to the release of the Conference Board's US Consumer Confidence Index for some impetus during the early North American session. This, along with the US bond yields, will influence the USD. Apart from this, the broader market risk sentiment should provide some impetus to the USD/JPY pair.
Technical levels to watch
- GBP/USD lacked any firm directional bias and oscillated in a range below the 1.3500 mark.
- The UK political turmoil acted as a headwind and capped gains amid modest USD strength.
- The downside remains limited as investors seemed reluctant ahead of the FOMC decision.
The GBP/USD pair seesawed between tepid gains/minor losses through the first half of the European session and remained confined in a range below the key 1.3500 psychological mark.
A combination of negative factors failed to assist the GBP/USD pair to gain any traction or capitalize on the overnight recovery move from a three-week low, around the 1.3440 region. Growing demand for UK Prime Minister Boris Johnson's resignation over a series of lockdown parties in Downing Street acted as a headwind for the British pound. Apart from this, modest US dollar strength capped the upside for the major.
The USD held steady near a two-week high and continued drawing support from expectations that the Fed will tighten its monetary policy at a faster pace than expected. In fact, the markets seem convinced about an eventual Fed lift-off in March and have been pricing in a total of four rate hikes in 2022. Apart from this, a goodish rebound in the US Treasury bond yields turned out to be another factor that underpinned the buck.
That said, a generally positive tone around the European equity markets held back traders from placing aggressive bullish bets around the safe-haven greenback. This, along with rising bets for additional interest rate hikes by the Bank of England, helped limit any deeper losses for the GBP/USD pair. Investors also seemed reluctant and preferred to wait for the outcome of a two-day FOMC monetary policy meeting.
In the absence of any major market-moving economic data from the UK, investors might wait for a fresh catalyst before positioning for a firm intraday direction. Later during the early North American session, traders might take cues from the release of the Conference Board's US Consumer Confidence Index. The data will influence the USD price dynamics and provide some short-term trading impetus to the GBP/USD pair.
Technical levels to watch
EUR/USD has lost its recovery momentum after meeting resistance at 1.1330. As long as it stays below that level, sellers are likely to continue to dominate the pair's action, FXStreet’s Eren Sengezer reports.
Sellers eye 1.1270 as euro stays below key resistance
“On the downside, 1.1270 (static level) aligns as the next target ahead of 1.1250 (static level) and 1.1230 (static level).”
“In case EUR/USD rises above 1.1330 and starts using it as support, it could extend its rebound to 1.1350 (100-period SMA, the Fibonacci 61.8% retracement of the latest uptrend).”
- USD/CHF gained strong positive traction on Tuesday and jumped to a near two-week high.
- A positive opening across the European equity markets undermined the safe-haven CHF.
- Rebounding US bond yields benefitted the USD and remained supportive of the move up.
The USD/CHF pair scaled higher through the early European session and shot to a nearly two-week high, around the 0.9180 region in the last hour.
The pair built to the overnight modest bounce from the 0.9100 area and gained strong positive traction on Tuesday, taking along some short-term trading stops near the very important 200-day SMA. A positive opening around the European equity markets undermined the safe-haven Swiss franc. This, along with modest US dollar strength, provided a goodish lift to the USD/CHF pair.
The greenback remained well supported by expectations that the Fed will tighten its policy faster than anticipated. In fact, the markets seem convinced that the Fed will begin raising interest rates in March and have been pricing in a total of four hikes in 2022. Adding to this, rebounding US Treasury bond yields further assisted the USD to hold steady near a two-week high.
Apart from this, the intraday momentum could further be attributed to some buying above a technically significant 200-day SMA. Some follow-through buying beyond the 0.9200 mark will be seen as a fresh trigger for bullish traders and set the stage for additional gains. The USD/CHF pair might then accelerate the momentum towards the 0.9250-0.9255 horizontal resistance.
It, however, remains to be seen if bulls are able to capitalize on the move or opt to lighten their bets heading into the FOMC monetary policy meeting, starting this Tuesday. The Fed is scheduled to announce its decision on Wednesday, which will play a key role in influencing the near-term
USD price dynamics and provide a fresh directional impetus to the USD/CHF pair.
In the meantime, traders will take cues from the release of the Conference Board's US Consumer Confidence Index, due later during the early North American session. This, along with the US bond yields, will drive the USD demand. Apart from this, the broader market risk sentiment should further produce some short-term trading opportunities around the USD/CHF pair.
Technical levels to watch
USD/CNH has affirmed prevalence of downward momentum. The pair is set to extend its decline towards the 6.2940 mark, economists at Société Générale report.
Steady down move
“Ongoing downtrend is expected to persist towards next projections at 6.2940.”
“Daily Ichimoku cloud at 6.3700 should contain short-term upside.”
Following the release of the German IFO Business Survey, the institute’s Economist Klaus Wohlrabe said that “there is a slight easing of supply shortages in the industry.”
Additional quotes
German economy starts new year with glimmer of hope.
It is too early to talk about a turnaround of economic situation.
Raw materials and preliminary products supply issues have eased.
Delivery bottlenecks in retail have also eased.
No easing of prices, at least every second industrial firm planning further price hikes.
Export expectations of industry have improved significantly.
EUR/USD reaction
EUR/USD remains pressured near 1.1300, shedding 0.22% so far. The focus remains on Wednesday’s Fed decision and the Russia-Ukraine crisis.
Euro Stoxx 50 could stage a rebound in the near-term but the risks are skewed to the downside. Failure to defend 4000/3965 would clear the path for a decline towards the 3760 mark, economists at Société Générale report.
Multi-month trend line near 4170pts to cap
“Euro Stoxx 50 is now in vicinity to the neckline of the formation at 4000/3965pts. This is a crucial support zone.”
“A short-term bounce can’t be ruled out however the multi-month trend line near 4170pts could cap.”
“In case the index fails to defend 4000/3965pts, there would be a risk of a deeper downtrend towards 3910pts, the 23.6% retracement from 2020 and 3760pts.”
- German IFO Business Climate Index came in at 95.7 in January.
- IFO Current Economic Assessment fell to 96.1 this month.
- January German IFO Expectations Index arrived at 95.2, a big beat.
The headline German IFO Business Climate Index unexpectedly jumped to 95.7 in January versus last month's 94.7 and the consensus estimates of 94.7.
Meanwhile, the Current Economic Assessment dropped to 96.1 points in the reported month as compared to last month's 96.9 and 96.1 anticipated.
The IFO Expectations Index – indicating firms’ projections for the next six months, rose to 95.2 in January from the previous month’s 92.6 reading and much better than the market expectations of 93.0.
Market reaction
EUR/USD is little changed on the mixed German IFO survey.
At the time of writing, the pair is down 0.24% on the day, trading at 1.1297.
About German IFO
The headline IFO business climate index was rebased and recalibrated in April after the IFO research Institute changed series from the base year of 2000 to the base year of 2005 as of May 2011 and then changed series to include services as of April 2018. The survey now includes 9,000 monthly survey responses from firms in the manufacturing, service sector, trade and construction.
Global equity markets had their worst week since early 2021. But in the view of economists at UBS, further equity market downside may be limited.
Short-term market direction can remain volatile
“With a number of critical market factors still in flux, the short-term market direction can remain volatile.”
“For longer-term investors, we don’t think it is a bad thing if market volatility takes some air out of the more speculative corners of the market. Nor is it a bad thing if current volatility means that some secular growth names are offered at their best prices in months.”
“It’s also important to remember that economic growth remains robust, which should support cyclical and value sectors in the short-term.”
“We keep our end-2022 S&P 500 price target of 5,100.”
The Russian rouble stabilises this morning after sliding nearly 3% in two days against the dollar and the euro. Economists at Société Générale expect the pair EUR/RUB to surge above the 90.00 level towards 91.00.
EUR/RUB to extend its phase of rebound towards 91.00
“EUR/RUB has crossed above an ascending channel which denotes upward momentum is regaining.”
“Holding above the MA near 86.00/85.70, the bounce could persist towards projections of 91.00 which is also the trend line connecting peaks of November 2020 and April 2021.”
“First support is located at 87.70, the 23.6% retracement from October.”
- GBP/JPY was seen consolidating its recent sharp decline to a one-month low.
- The UK political crisis continued weighing on sterling and acted as a headwind.
- A positive risk tone undermined the safe-haven JPY and extended some support.
The GBP/JPY cross remained on the defensive through the early European session, albeit has managed to rebound a few pips from daily low and was last seen trading around mid-153.00s.
The cross seesawed between tepid gains/minor losses on Tuesday and consolidated its recent sharp decline to a one-month low. Bulls, so far, have managed to defend the very important 200-day SMA support, though any meaningful recovery still seems elusive amid the recent political development in the United Kingdom.
In fact, UK Prime Minister Boris Johnson was dragged into the controversy over a series of alleged lockdown-busting parties in Downing Street. According to sources, No 10 police has given 'extremely damning' party gate evidence to Sue Gray – the senior civil servant who has been tasked with the official inquiry.
The source further added that “if Boris Johnson is still Prime Minister by the end of the week, I’d be very surprised.” Adding to this, the incoming disappointing UK macro data, including the latest PMI prints released on Monday, continued undermining the British pound and acted as a headwind for the GBP/JPY cross.
That said, expectations that the Bank of England will hike interest rates further at the upcoming policy meeting extended some support to sterling. Apart from this, a positive opening in the European equity markets dented demand for the safe-haven Japanese yen and helped limit losses for the GBP/JPY cross, at least for now.
Moving ahead, there isn't any major market-moving economic data due for release from the UK. Hence, the UK political news will play a key role in influencing the GBP. Apart from this, the broader market risk sentiment will be looked upon for some short-term trading opportunities around the GBP/JPY cross.
Technical levels to watch
AUD/CAD retains a weak tone as the market continues to pressure the 0.8970/75 area. Economists at Scotiabank expect the pair to drop towards the 0.88 region.
Technical factors remain broadly negative
“Trend signals are aligned bearishly for the AUD/CAD across a range of timeframes and continue to suggest that a powerful downtrend remains intact.”
“We still look for a clear push under 0.8970/75 to drive additional AUD losses towards the 0.88 area (61.8% of the 2020/2021 rally at 0.8805).”
“Minor gains in the cross remain a sell.”
A war between Russia and Ukraine would see a flight to the safety of the US dollar, Japanese yen, Swiss franc and gold, strategists at Rabobank report.
Russian and Ukrainian currencies to slump on an impactful war
“A ‘risk-off’ flight to the dollar, yen, Swiss franc and gold would be the near-term FX trades to a war starting.”
“EUR, caught up on the frontlines, would not be as well placed, more so if the Baltic is hit.”
“CNY is certain to remain de facto pegged to the dollar to try to show its stability.”
“The Russian and Ukrainian currencies would slump.”
See: EUR/USD to plummet towards 1.10 on mounting Russia/Ukraine tensions – Rabobank
EUR/CAD found firm support around 1.4150 last week. Nonetheless, upside scope remains limited, in the opinion of economists at Scotiabank.
Gains to 1.43/1.44 are the best the EUR/CAD will be able to muster
“The squeeze higher has checked the immediate downside risks for the cross but the broader undertone for the EUR remains weak and daily, weekly and monthly trend oscillators remain aligned bearishly for the EUR – suggesting that scope for EUR gains remains limited at the moment.”
“The bounce in the cross from the base of the recent range does suggest potential for a retest of the 1.46 zone – major resistance at 1.4615 – but we rather feel that gains to the 1.43/1.44 range are perhaps the best the EUR will be able to muster (given trend oscillators).”
“There is minor trend resistance at 1.4330 and more important channel resistance, formerly support, at 1.4405.”
War between Russia and Ukraine would be a nightmare scenario for energy markets. An impactful war happening would lift oil prices to the $125 level, strategists at Rabobank report.
Assuming all countries halt purchases of Russian energy, oil could riseto $175
“The US would be hard pushed to supply all the shortfall that physical (and Russian political) disruptions to oil and gas pipelines could produce, even with the help of Qatar. War will also result in elevated risk-premiums and higher transit costs. On that basis, oil may hit $125 and natural gas $200 in per barrel of oil equivalent terms.”
“Assuming all countries halt purchases of Russian energy, the potential price impact would be huge, with oil rising to $175 and European gas to $250.”
Economists at Deutsche Bank are making an adjustment to their EUR/USD forecasts. They expect the world’s most popular currency pair to decline to 1.10 in the first half of the year before bouncing back higher to end the year at 1.15.
EUR/USD forecast at 1.20, 1.25, 1.30 by end-23, 24 and 25 respectively
“We remain bullish on the dollar and see EUR/USD declining to 1.10 in the first half of the year given any shift in ECB messaging is likely to be backloaded.
“We forecast EUR/USD finishing the year at 1.15 in 2022 (from 1.08 previously), and 1.20, 1.25, 1.30 by end-23, 24 and 25 respectively.”
Over the past five days, the Japanese yen is the only G10 currency to have outperformed the US dollar. The Swiss franc is third in the rankings. The strong performance of these three safe havens sits with the risk-off tone that is engulfing markets. In the view of economists at Rabobank, as a conflict in Ukraine has the potential to create more good shortages and higher inflation, demand for safe haven assets such as the USD, CHF and the JPY has the potential to surge.
Rise in concerns over gas price to enhance the downside bias in EUR/CHF
“If a Russian invasion of Ukraine does take place the USD, CHF and the JPY would likely spike higher vs a basket of other currencies.”
“Relatively higher yields in the US and the anticipation of Fed rate hikes this year suggests that USD could fare better than the CHF and the JPY if any conflict were extended.”
“Any rise in concerns over gas price in the eurozone is likely to enhance the downside bias in EUR/CHF. We would favour selling rallies near-term with a view to a move towards parity if a conflict was initiated.”
“A conflict would increase the likelihood of a move to EUR/JPY 128.00 and would likely accelerate a move towards EUR/USD 1.10.”
- EUR/USD extends the bearish start of the week on Tuesday.
- The German IFO Business Climate will take centre stage in the docket.
- CB Consumer Confidence next of significance in the US calendar.
The selling bias around the single currency remains well and sound on Tuesday and puts EUR/USD under pressure near the 1.1300 neighbourhood.
EUR/USD looks to data, FOMC
EUR/USD sheds ground for the second session in a row on Tuesday amidst the continuation of the recovery in the greenback, which lifted the US Dollar Index (DXY) back to the key 96.00 zone despite the mixed activity in US yields.
In the meantime, investors are expected to remain wary ahead of the upcoming FOMC event on Wednesday, while the geopolitical front – with Russia, Ukraine and the US in the centre of the debate – is seen dictating the mood in the more macro scenario.
In the domestic calendar, the German Business Climate measured by the IFO survey will grab all the attention later on Tuesday ahead of the US Consumer Confidence for the month of January and releases from the US housing sector.
What to look for around EUR
EUR/USD seems to have met a tough barrier in the area below 1.1500 in mid-January, sparking a corrective downside soon afterwards in tandem with the strong recovery in the greenback. Moving forward, there is not much optimism around the pair, particularly in light of the Fed’s imminent start of the tightening cycle vs. the accommodative-for-longer stance in the ECB, despite the high inflation in the euro area is not giving any things of cooling down for the time being. On another front, the unabated advance of the coronavirus pandemic remains as the exclusive factor to look at when it comes to economic growth prospects and investors’ morale in the region.
Key events in the euro area this week: Germany IFO Business Climate (Tuesday) – Germany GfK Consumer Confidence (Thursday) – Germany Advanced Q4 GDP, EMU Final Consumer Confidence.
Eminent issues on the back boiler: Asymmetric economic recovery post-pandemic in the euro area. ECB stance/potential reaction to the persistent elevated inflation in the region. ECB tapering speculation/rate path. Italy elects President of the Republic in late January. Presidential elections in France in April.
EUR/USD levels to watch
So far, spot is losing 0.14% at 1.1308 and faces the next up barrier at 1.1369 (high Jan.20) seconded by 1.1469 (100-day SMA) and finally 1.1482 (2022 high Jan.14). On the other hand, a break below 1.1290 (weekly low Jan.24) would target 1.1272 (2022 low Jan.4) en route to 1.1221 (monthly low Dec.15 2021).
- NZD/USD edged lower for the fourth straight day and was pressured by a combination of factors.
- The dominant risk-off theme in the markets continued weighing on the perceived riskier kiwi.
- Rebounding US bond yields, Fed rate hike bets underpinned the USD and added to the selling bias.
The NZD/USD pair remained depressed through the early European session and was last seen trading near the 0.6675 region, just a few pips above the lowest level since November 2020 touched on Monday.
The pair struggled to capitalize on the overnight late recovery of around 40 pips from the 0.6660 area and met with a fresh supply on Tuesday amid the dominant risk-off theme in the markets. Rising geopolitical risk over Ukraine, along with concerns that rising borrowing costs could dent the earnings outlook for companies continued weighing on investors' sentiment. This was seen as a key factor that acted as a headwind for the perceived riskier kiwi.
The flight to safety, along with rebounding US Treasury bond yields and expectations for a faster policy tightening by the Fed, continued underpinning the safe-haven US dollar. This was seen as another factor that exerted some pressure on the NZD/USD pair for the fourth successive day. That said, any further downside seems limited as investors might refrain from placing aggressive bets and prefer to wait for the outcome of a two-day FOMC policy meeting.
The markets seem convinced that the US central bank would begin raising interest rates in March and have been pricing in a total of four hikes in 2022. Hence, market players will look for fresh clues about the likely timing of when the Fed will actually start the policy tightening cycle. This, in turn, will play a key role in influencing the near-term USD price dynamics and help determine the next leg of a directional move for the NZD/USD pair.
In the meantime, traders on Tuesday will take cues from the release of the Conference Board's US Consumer Confidence Index, due later during the early North American session. This, along with the US bond yields and the broader market risk sentiment, will drive the USD demand and produce some meaningful trading opportunities around the NZD/USD pair.
Technical levels to watch
USD/JPY continued to find a base at 113.50 before reversing higher towards the 114.00 area with Wall Street's main indexes rising sharply ahead of the closing bell late Monday. Economists at OCBC Bank expect the pair to remove the 113.50 support on another leg lower for equites.
Equity-led decline has not fully played out
“The baseline expectation is that the equity-led decline has not fully played out.”
“Should there be another clear leg lower for equities, expect the 113.50 support to be breached and the downside target shifts to 112.60.”
AUD/USD is under pressure in a broadening risk-off environment. Further extension of weakness would focus on the December lows of 0.6993 where the aussie stumbled into demand on prior three occasions, Benjamin Wong, Strategist at DBS Bank, reports.
Repeating a previous bearish channel breakdown
“AUD is trading lower with a fresh bearish MACD (moving average convergence/divergence) signal as it goes out to mimic a channel breakdown that we saw last September through November. The price path is as well complicated, and appears driven by a more complex seven price legs lower.”
“The Ichimoku chart flags the rally failure at the recent 0.7314 high. Prices have broken under the cloud’ support at 0.7167 and more importantly the prior year-to-date lows of 0.7130 (that traded in early January). A prevailing risk-off mood is undermining AUD.”
“The early-December lows at 0.6993 is a key determinant level given it has held thrice since last September; and a further extended dip heralding a trendline test at 0.6947.”
The Monetary Authority of Singapore (MAS) held a surprise policy review today, ahead of their scheduled April policy meeting. The SGD rallied on today's MAS action and analysts at TD Securities expect SGD to trade firm given the prospect of further tightening at the April 2022 meeting.
MAS surprises with an inter-meeting tightening
“The MAS acted today after data yesterday showed that core inflation printed at 2.1% YoY in Dec 2021, above the 2% rate, which we think MAS the Bank considers as an informal inflation target. The slope of the SGD NEER band was likely raised to 1.0% today from 0.5% previously; there was no change to the midpoint and width of the band.”
“The Bank shifted its inflation outlook higher and sees core inflation in 2022 at ‘2-3%’, higher than the ‘1-2%’ expected back in October 2021. Similarly, headline (CPI-All Items) inflation is projected at ‘2.5%-3.5%’, from the earlier forecast of ‘1.5%-2.5%’.”
“Going into the FOMC meeting tomorrow, we think USD could stay on the front foot due to market jitters over a hawkish Fed and would wait for better entry levels to short USD/SGD especially if MAS intervenes to weaken the currency soon.”
“Our call for further MAS action at the April 2022 meeting should imply greater room for SGD upside over the medium-term and we expect USD/SGD to retest 1.32 (the lows in 2021) by Q2 2022.”
- DXY adds to Monday’s advance around the 96.00 yardstick.
- The Federal Reserve starts its 2-day meeting on Tuesday.
- US Consumer Confidence, House Price Index next on tap.
The US Dollar Index (DXY), which gauges the greenback vs. a bundle of its main competitors, keeps the upbeat tone and challenges the 96.00 region on turnaround Tuesday.
US Dollar Index cautious ahead of FOMC
The index advances for the second session in a row and extends the optimism in the first half of the week against the backdrop of rising cautiousness among investors in light of the upcoming FOMC event (Wednesday).
In the US cash markets, yields of the 2y note manage to get some upside traction an reverse the recent weakness, while the belly and the long end of the curve remain on the defensive ahead of the opening bell in the old continent.
in the meantime, the 2-day FOMC meeting is expected to kick in later on Tuesday, with consensus among market participants biased towards a hawkish tilt at the event.
In the US data space, the housing sector will be in the limelight with the releases of the FHFA House Price Index and the S&P/Case-Shiller Index seconded by the always relevant Consumer Confidence tracked by the Conference Board.
What to look for around USD
The index started the week on a positive note and reclaimed the 96.00 neighbourhood so far this week. In spite of consensus already priced in a probable move on rates by the Fed at the March meeting, the constructive outlook for the greenback is expected to remain unchanged into this week and ahead of the FOMC event on Wednesday. Looking at the broader scenario, higher US yields, persistent elevated inflation, supportive Fedspeak and the solid pace of the US economic recovery should continue to underpin the buck in the months to come.
Key events in the US this week: House Price Index, CB Consumer Confidence (Tuesday) – Trade Balance, New Home Sales, FOMC Meeting, Powell’s Press Conference (Wednesday) – Durable Goods Orders, Advanced Q4 GDP, Initial Claims, Pending Home Sales (Thursday) – PCE, Personal Income/Spending, Final Consumer Sentiment (Friday).
Eminent issues on the back boiler: Fed’s rate path this year. US-China trade conflict under the Biden administration. Debt ceiling issue. Escalating geopolitical effervescence vs. Russia and China.
US Dollar Index relevant levels
Now, the index is gaining 0.08% at 95.94 and a break above 96.12 (weekly high Jan.24) would open the door to 96.46 (2022 high Jan.4) and finally 96.93 (2021 high Nov.24). On the flip side, the next down barrier emerges at 94.89 (100-day SMA) followed by 94.62 (2022 low Jan.14) and then 93.27 (monthly low Oct.28 2021).
EUR/USD retains a heavy tone, but the pair remains above the 1.1300 support. A break below here would clear the way towards the November low of 1.1186.
Russia/Ukraine tensions, the immediate driver risk factor
“A breach of 1.1300 will leave the Nov low at 1.1186 vulnerable.”
“Outside of equity-driven risk negative, the immediate driver risk factor will be the Ukraine issue.”
“Prefer to stay negative for now.”
Here is what you need to know on Tuesday, January 25:
Safe-haven flows continue to dominate the financial markets amid escalating geopolitical tensions and renewed concerns over a global economic slowdown. The US Dollar Index climbed to its highest level in two weeks above 96.00 on Monday before retreating modestly in the late American session. Although the S&P 500 Index ended up closing the day in the positive territory on dip-buying, US stocks futures indexes are losing between 0.7% and 1.25% early Tuesday. IFO survey from Germany and CB Consumer Confidence data from the US will be looked upon for fresh impetus but risk perception is likely to remain the primary market driver ahead of Wednesday's FOMC meeting.
According to the latest reports, Russia has deployed around 100,000 troops alongside heavy weaponry at the Ukrainian border and markets grow increasingly concerned about a possible invasion. In response, the White House has announced that more than 8,000 troops were put on high alert and ready to be deployed.
Meanwhile, China’s Commerce Ministry said in a statement on Tuesday that China was facing a "grim" foreign trade situation in 2022, citing inflation, supply chain issues and the loss of momentum in global economic recovery.
USD/RUB gained more than 2% on Monday and reached its highest level since November 2020 at 79.5. Russia's central bank announced that it will stop buying foreign exchange on the domestic market and helped the pair stage a correction. USD/RUB was last seen posting small daily losses at 78.60.
EUR/USD stays under modest bearish pressure after closing in the negative territory on Monday and trades within a touching distance of 1.1300.
GBP/USD dropped to its lowest level in three weeks at 1.3439 on Monday but managed to erase a small portion of its losses. The pair seems to have gone into a consolidation phase below 1.3500 early Tuesday.
USD/JPY fell below 113.50 but reversed its direction with Wall Street's main indexes rising sharply ahead of the closing bell late Monday. Nevertheless, the pair's recovery seems to have lost its momentum around 114.00.
Gold took advantage of falling US Treasury bond yields and rose 0.5% on Monday. XAU/USD is staying relatively quiet around $1,840 early Tuesday.
AUD/USD edged higher toward 0.7200 after the data from Australia showed that the Consumer Price Index jumped to 3.5% on a yearly basis in the fourth quarter from 3% in the third quarter. The risk-averse market environment, however, forced the pair to turn south. AUD/USD was last seen posting small daily losses at 0.7135.
Bitcoin recovered decisively but lost its bullish momentum before reaching $40,000. BTC/USD is down 2.5% little below $36,000 in the early European session. Despite a late rebound, Ethereum closed in the red on Monday and continues to stretch lower toward the critical $2,000 handle.
Gold price is treading waters below $1,850 as risk-off flows dominate. As FXStreet’s Dhwani Mehta notes, death cross signals caution for XAU/USD bulls ahead of the Federal Reserve meeting.
Death cross confirmation awaited
“Gold price is looking to test the upper boundary of a month-long rising wedge formation, now aligned at $1,851. However, gold bulls need to take out the two-month highs of 1,848 first.”
“A potential correction after refreshing two-month highs cannot be ruled out, as the daily chart displays a death cross. The 200-Daily Moving Average (DMA) has crossed the 50-DMA for the upside, flashing a bearish signal.”
“On the downside, immediate declines could be restricted by a strong demand area around $1,829, Friday’s and Monday’s lows. The bullish 21-DMA at $1,818 will then come to the rescue of gold buyers. Further south, January 19 lows of $1,810 will be the next downside target.”
See – Gold Price Forecast: XAU/USD has to do more to prove it is ready to soar higher – DBS Bank
A test of 113.00 is likely once USD/JPY breaches the 113.40 level in the short term, commented FX Strategists at UOB Group.
Key Quotes
24-hour view: “We expected USD to ‘trade sideways between 113.60 and 114.20’ yesterday. USD subsequently traded within a lower range than expected (113.46/113.99). The price actions offer no fresh clues and USD could continue to trade sideways, albeit at a higher range of 113.65/114.20.”
Next 1-3 weeks: “Our view from last Friday (21 Jan, spot at 113.90) still stands. As highlighted, shorter-term downward momentum has improved but USD has to break 113.40 before a decline to 113.00 is likely. The chance for USD to break 113.40 is not high (note that USD rebounded after touching 113.46 yesterday) but it would increase further as long as USD does not move above 114.45 (no change in ‘strong resistance level’).”
- EUR/JPY fades bounce off monthly low, grinds lower below 50-DMA.
- Bearish MACD signals, absence of oversold RSI keep sellers hopeful.
- 61.8% Fibonacci retracement level, August-September 2021 low offer intermediate supports.
- Bullish momentum remains elusive below 130.70, 50% Fibo. may add to the upside filters.
EUR/JPY pares intraday losses around 128.75, down 0.75% on a day heading into Tuesday’s European session.
Even so, the cross-currency pair remains on the bear’s radar as it fails to extend the previous day’s corrective pullback from monthly low, also comprising the 61.8% Fibonacci retracement (Fibo.)level of January-May 2021 upside, near 128.50.
Also favoring the EUR/JPY bears is the quote’s sustained trading below 50-DMA level of 129.35 amid bearish MACD and downbeat RSI, not oversold.
That said, lows marked during August and September months during the last year, around 127.90, will act as an extra filter to the south before directing the quote towards a one-year-old support line, near 127.75.
Meanwhile, a clear upside break of 129.35 will propel the quote towards breaking the 130.00 threshold. However, 38.2% Fibo. level surrounding 130.70 becomes crucial to watch for further upside moves.
Overall, EUR/JPY prices are likely to extend declines from early January even if the seller’s journey will be a bumpy one.
EUR/JPY: Daily chart
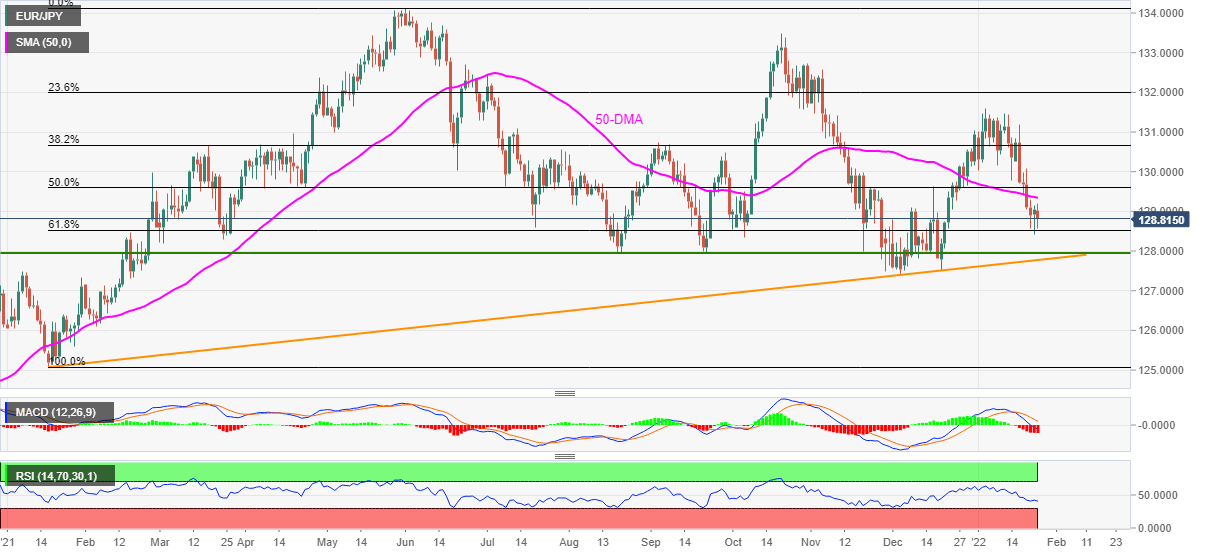
Trend: Further weakness expected
Considering advanced prints from CME Group for natural gas futures markets, open interest reversed three daily pullbacks in a row and went up by around 12.2K contracts at the beginning of the week. On the other hand, volume retreated for the second straight session, now by around 16.3K contracts.
Natural Gas appears supported near $3.80
Natural gas prices added to Friday’s gains on Monday along with rising open interest, which could see the ongoing rebound extending further in the very near term at least. The 200-day SMA around $4.10 caps the upside for the time being, while the $3.80 region per MMBtu emerges as a decent initial contention.
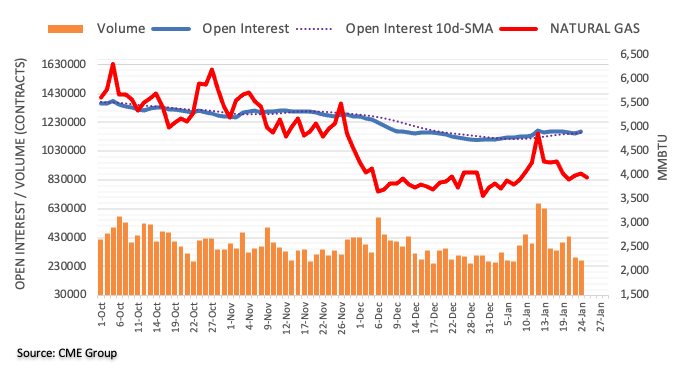
- The risk-off mood benefitted the safe-haven JPY and acted as a headwind for USD/JPY.
- Rebounding US bond yields underpinned the USD and helped limit any meaningful slide.
- Investors also seemed reluctant to place aggressive bets ahead of the key FOMC decision.
The USD/JPY pair bounced a few pips from the daily low and was last seen trading in the neutral territory, around the 113.85 region heading into the European session.
The pair built on the previous day's late recovery momentum from the 113.45 area, or the lowest level since December 20 and gained some positive traction during the early part of the trading on Tuesday. A goodish rebound in the US Treasury bond yields acted as a tailwind for the US dollar amid expectations for a faster policy tightening by the Fed. This, in turn, was seen as a key factor that provided a modest lift to the USD/JPY pair.
The uptick, however, lacked bullish conviction and struggled to find acceptance above the 114.00 mark amid the prevalent risk-off mood, which tends to benefit the safe-haven Japanese yen. Rising geopolitical risk over Ukraine, along with concerns that rising borrowing costs could dent the earnings outlook for companies continued weighing on investors' sentiment. This was evident from a generally weaker tone around the equity markets.
Meanwhile, the downside seems limited, at least for the time being, as investors would prefer to wait for the outcome of a two-day FOMC monetary policy meeting. The Fed is scheduled to announce its decision on Wednesday, which should provide fresh clues about the likely timing of when the Fed will commence its policy tightening cycle. This will influence the near-term USD price dynamics and provide a fresh directional impetus to the USD/JPY pair.
In the meantime, traders on Tuesday will take cues from the release of the Conference Board's US Consumer Confidence Index, due later during the early North American session. This, along with the US bond yields, will drive the USD demand. Apart from this, the broader market risk sentiment could produce some short-term trading opportunities around the USD/JPY pair.
Technical levels to watch
Bank of Japan (BOJ) Governor Haruhiko Kuroda is back on the wires, via Reuters, making some comments on the exchange rate stability.
Key quotes
Important for fx to move stably reflecting economic fundamentals.
FX rates not moving sharply, don't need to consider fx moves as big factor behind recent price rises.
Real wages may briefly come under pressure from rising inflation but wage earners' real income will continue to rise and underpin consumption.
Recent Japan inflation driven mostly by global commodity prices, rather than weak yen.
BOJ must continue easy policy as 2% inflation remains distant.
Unlike in past, there is not just downside but upside risks to Japan’s price outlook.
Hard to foresee Japan’s inflation approaching 2% and have big impact on inflation expectations.
Market reaction
USD/JPY is attempting a bounce towards 114.00 amid rebounding Treasury yields and firmer US dollar.
The spot was last seen trading at 113.86, down 0.04% on the day.
- GBP/USD nurses losses amid a four-day downtrend, risk-aversion.
- 50-DMA support at 1.3421 remains in sight if bears extend their control.
- Bearish RSI points to additional downside, focus remains on the Fed.
GBP/USD is licking its wounds below 1.3500, as bears take a breather after the recent downward spiral to three-week lows of 1.3440.
Looming UK political concerns combined with intensifying risk-off mood hit the high-beta currency, the GBP, keeping the bearish tone intact around the cable.
NATO readying their forces in Eastern Europe, as the geopolitical tensions between Russia and Ukraine escalate, spooked markets and bolstered the safe-haven demand for the US dollar.
Further, the greenback also benefited from aggressive Fed rate hike expectations, as the world’s most powerful central bank is set to hint at policy normalization on Wednesday when it concludes its two-day meeting.
In the meantime, the broader market sentiment, Russia-Ukraine updates and the UK political developments will continue to influence the major.
Looking at GBP/USD’s daily chart, the pair remains exposed to downside risks, with a sustained break below Monday’s low of 1.3440 to unleash the additional declines towards the horizontal 100-Daily Moving Average (DMA) at 1.3421.
The 14-day Relative Strength Index (RSI) is inching lower below the midline, suggesting that there is more room to fall for the currency pair.
The next significant support is seen at the round level of 1.3400.
GBP/USD: Daily chart
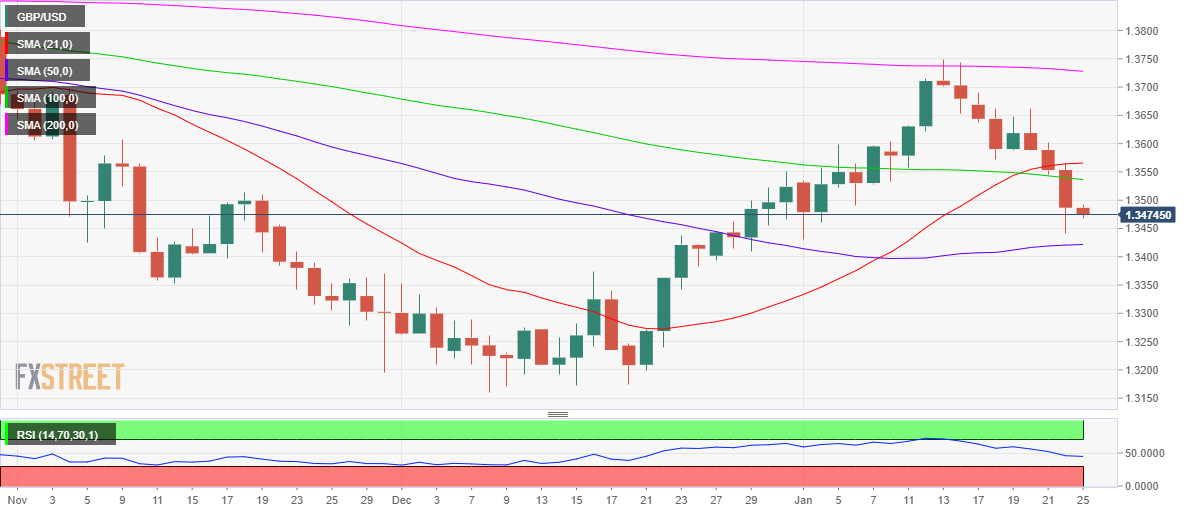
Alternatively, acceptance above mildly bearish 50-DMA at 1.3536 on a daily closing basis is critical to attempting any recovery from multi-week lows.
The 21-DMA at 1.3565 will then challenge the road to recovery, as bulls look to recapture the 1.3600 hurdle.
GBP/USD: Additional technical levels
NZD/USD remains poised for further decline, although a move to 0.6635 appears unlikely for the time being, suggested FX Strategists at UOB Group.
Key Quotes
24-hour view: “We highlighted yesterday that ‘a break of 0.6700 would not be surprising but NZD may not be able to maintain a foothold below this level’. NZD subsequently cracked 0.6700, plummeted to 0.6661 before rebounding. The rebound amid deeply oversold conditions suggest that NZD is unlikely to weaken further. For today, NZD is more likely to consolidate and trade within a range of 0.6665/0.6720.”
Next 1-3 weeks: “Last Friday (21 Jan, spot at 0.6740), we highlighted that NZD is likely to trade with a downward bias. Yesterday (24 Jan), we highlighted that a break of 0.6700 would shift the focus to the next support at 0.6670. While our view was not wrong, we did not expect the sharp drop to 0.6661 during NY session. Risk remains on the downside but deeply oversold conditions suggest that the next support at 0.6635 may not come into the picture so soon. On the upside, a breach of 0.6750 (‘strong resistance’ level was at 0.6780 yesterday) would indicate that the downside risk has dissipated.”
CME Group’s flash readings for crude oil futures markets noted traders added nearly 22K contracts to their open interest positions on Monday, extending the choppy activity seen as of late. Volume, instead, shrank for the second session in a row, this time by around 66.6K contracts.
WTI: Next support comes at $80.00
The corrective move in prices of the WTI continued on Monday. Furthermore, the downtick was in tandem with rising open interest, which is supportive of extra losses in the very near term. Against that, the $80.00 mark per barrel should initially hold the downside in the short-term horizon.
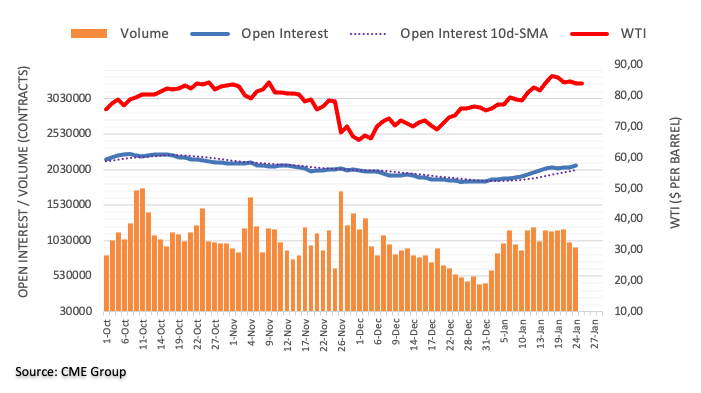
- Palladium bulls take a breather around the highest levels in nine weeks.
- Sustained trading beyond 100-DMA, bullish MACD signals favor buyers.
- Further upside eyes horizontal area from October, short-term sellers aim for December’s top.
Palladium (XPD/USD) pauses a four-day uptrend around $2,135, down 0.30% intraday heading into Tuesday’s European session.
In doing so, the precious metal eases from a multi-day high, flashed the previous day, but stays on the bull’s radar.
Bullish bias over the metal remains intact despite the latest pullback as the quote stays beyond the 100-DMA level of $1,936, as well as December’s high near $1,998. Also supporting the trend are the bullish MACD signals.
That said, the latest weakness may aim for a 38.2% Fibonacci retracement level of the May-December 2021 downside, near $2,115.
On the contrary, further XPD/USD advances will be challenged by a three-month-long horizontal area of around $2,180.
During the quote’s run-up beyond $2,180, the 200-DMA and a descending trend line from May, respectively around $2,215 and $2,345, will be crucial to watch.
Palladium: Daily chart
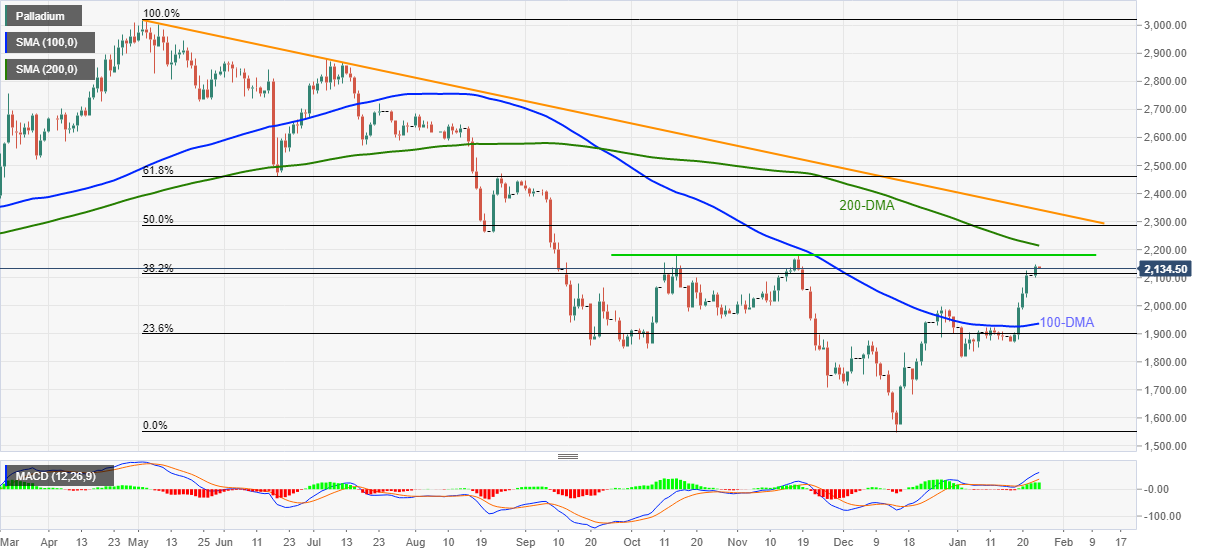
Trend: Bullish
In opinion of FX Strategists at UOB Group, the near-term outlook for Cable still points to further downside, although a test of the 1.3400 zone appears not favoured for the time being.
Key Quotes
24-hour view: “We expected GBP to ‘weaken further’ yesterday but we were of the view that ‘1.3500 is likely out of reach’. However, GBP easily breached 1.3500 as it plunged to 1.3441 before recovering slightly. While deeply oversold, the weakness in GBP has yet to stabilize. For today, there is room for GBP to dip to 1.3430 first before a more sustained rebound can be expected. The major support at 1.3400 is unlikely to come into the picture. On the upside, a break of 1.3535 (minor resistance is at 1.3510) would indicate that the current weakness in GBP has stabilized.”
Next 1-3 weeks: “Yesterday (24 Jan, spot at 1.3550), we highlighted that GBP is likely to trade with a downward bias towards 1.3500. While our shift to a negative stance in GBP was timely, we did not expect the swift and sharp drop as GBP easily took out the support at 1.3500 and plunged to 1.3441. Downward momentum has improved considerably and further GBP weakness is likely. That said, oversold shorter-term conditions suggest that a slower pace of decline and the next support at 1.3400 may not come into the picture so soon.”
Open interest in gold futures markets increased by around 35.5K contracts on Monday, resuming the uptrend after Friday’s pullback an all according to preliminary data from CME Group. In the same line, volume went up by nearly 54K contracts after three consecutive daily drops.
Gold remains capped by the $1,850 region
Prices of gold recorded decent gains on Monday amidst increasing open interest and volume, which is indicative that further gains could be in the pipeline in the very near term. That said, the next significant hurdle for the precious metal remains at recent peaks around $1,850.
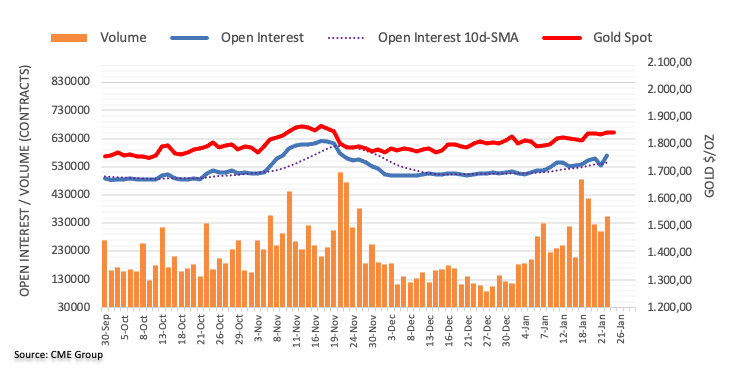
- USD/CAD prints four-day uptrend around three-week top, sidelined of late.
- Risk appetite weakens as markets await FOMC, oil struggles to cheer Russia headlines.
- US CB Consumer Confidence, API Weekly Crude Oil Stock may direct intraday moves, Fed in focus.
USD/CAD remains indecisive after refreshing a fortnight top the previous day, retreating from intraday high to 1.2645 ahead of Tuesday’s European session.
In doing so, the Loonie pair struggles to find a balance between the risk-off mood and hawkish headlines for Canada’s key export item, WTI crude oil, amid sluggish trading hours.
That said, market sentiment sours as traders await the Federal Open Market Committee (FOMC) meeting with mixed clues over the Fed’s next moves. Among them were the recently downbeat US Markit PMIs and the US inflation expectations, per the 10-year breakeven inflation rate per the St. Louis Federal Reserve (FRED) data.
On other hand, geopolitical fears surrounding Russia and Ukraine escalate as Moscow refrains from accepting the global pressure towards a ceasefire even as political leaders warn of economic sanctions.
As the risk-off mood underpin US Treasury yields and the US dollar demand, WTI crude oil prices remain pressured, down 0.16% intraday around $83.45 by the press time. It’s worth observing that the easing fears of Omicron and China’s readiness to defend investors amid financial and covid risks keep oil buyers hopeful.
Moving on, the US CB Consumer Confidence for January, prior 115.8, will precede the weekly private oil inventory data from the American Petroleum Institute (API) to direct short-term USD/CAD moves. However, major attention will be given to Wednesday’s Fed meeting as markets expect Chairman Jerome Powell to signal a March rate hike.
Technical analysis
Unless crossing a five-week-old descending resistance line, around 1.2660 by the press time, odds of the USD/CAD pullback towards the 200-DMA retest, near 1.2500 at the latest, can’t be ruled out.
EUR/USD faces a potential drop to the sub-1.1300 region in the next weeks, noted FX Strategists at UOB Group.
Key Quotes
24-hour view: “Our expectations for USD to ‘trade between 1.1310 and 1.1360’ was incorrect as EUR dropped to 1.1289 before rebounding. Despite the rebound, the underlying tone is soft and we see room for EUR to test the major support at 1.1285. For today, the odds of EUR breaking this major support are not high. Resistance is at 1.1340 followed by 1.1360.”
Next 1-3 weeks: “Last Thursday (20 Jan, spot at 1.1340), we highlighted that there is a slight downward bias in EUR but any weakness is likely limited to a test of 1.1285. Yesterday (24 Jan), EUR dipped to 1.1289 before rebounding. Despite the rebound, the downward bias remains intact as long as EUR does not breach 1.1385 (no change in ‘strong resistance’ level). Looking ahead, if there is a clear break of 1.1285, the next support level to watch is at 1.1240.”
Despite the Omicron covid variant-led community spread, New Zealand will go ahead with plans to start a phased reopening of the border from the end of February, Prime Minister Jacinda Ardern said at a news conference Tuesday in Wellington.
Key quotes
“We will likely confirm the specific date at cabinet in the following two weeks.”
“We’ve made no decision to steer away from the guidelines we gave at the end of the year. We know now we are dealing with omicron in the community and so no changes have been made to those settings at this stage.”
“Because rapid antigen tests can produce false positives, we do want to make sure we use them in the right environments.”
“People testing in a widespread way for no reason is not something we want to encourage. We don’t’ want someone staying at home when they don’t need to.”
Market reaction
NZD/USD is under heavy selling pressure amid broad risk-aversion-led US dollar’s strength. The resource-linked kiwi ignores a minor bounce in oil prices, as it currently trades at 0.6673, down 0.34% on the day.
- USD/CHF remains sidelined around intraday high, defends two-week-old resistance break.
- Firmer Momentum line, sustained trading beyond 200-HMA favor buyers.
- Fortnight-long descending resistance line guards immediate upside moves.
USD/CHF grinds higher around 0.9155, up 0.09% intraday heading into Tuesday’s European session.
In doing so, the Swiss currency (CHF) pair holds onto the previous day’s upside break of a two-week-long resistance break, now support around 0.9150.
Also keeping USD/CHF buyers hopeful is the pair’s successful trading above the 200-HMA and firmer Momentum line.
Even so, a descending resistance line from January 12, around 0.9160, restricts the quote’s nearby advances.
Should USD/CHF buyers manage to cross the 0.9160 hurdle, an upside momentum towards Thursday’s peak near 0.9180 can’t be ruled out.
On the contrary, a downside break of 0.9150 will drag the quote back to the 200-HMA level of 0.9141 but any further declines won’t hesitate to recall the USD/CHF bears.
Following that, the 0.9100 threshold and the monthly low of 0.9092 will be in focus ahead of November 2021 trough surrounding 0.9088.
USD/CHF: Hourly chart
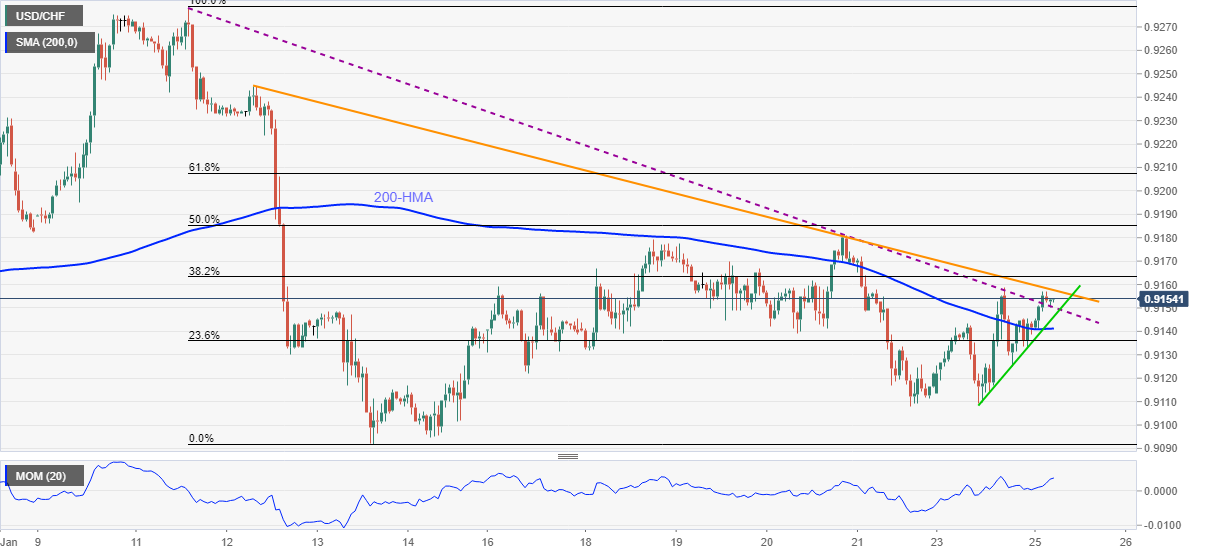
Trend: Further upside expected
- EUR/USD remains on the back foot around two-week low.
- Market sentiment remains sour as Russia-Ukraine worries join pre-Fed anxiety.
- Yields pause four-day downtrend, stock futures remain depressed.
- US CB Consumer Confidence will offer more insight on inflation ahead of FOMC.
EUR/USD fades bounce off two-week low as bears brace for a clear break of 1.1300 during early Tuesday in Europe, mildly offered around 1.1315 by the press time.
The quote dropped to a fortnight low the previous day as the US dollar began the Fed week on a front foot. In addition to the pre-Fed anxiety, geopolitical concerns surrounding Russia and mixed data from Eurozone, as well as from the US, keep EUR/USD traders on the edge ahead of Wednesday’s Federal Open Market Committee (FOMC) meeting.
Although strong German PMIs for January enabled ECB Governing Council member Francois Villeroy de Galhau to reiterate his hawkish bias, mixed Eurozone activity numbers poured cold water on the face of EUR/USD buyers.
On the other hand, US PMIs were sluggish too but US inflation expectations, per the 10-year breakeven inflation rate per the St. Louis Federal Reserve (FRED) data, bolster the Fed’s rate hike concerns and weigh on the EUR/USD prices.
Additionally, talks of economic sanctions on Russia, if it invades Ukraine, join China Commerce Ministry’s fears of downbeat 2022 to exert additional downside pressure on the market sentiment.
Amid these plays, the US 10-year Treasury yields pause a four-day downtrend, around 1.78% while the US Dollar Index (DXY) rises for the second consecutive day while poking the six-week-old resistance line.
Looking forward, the economic calendar remains mostly quiet in Europe, with only IFO numbers, but the US CB Consumer Confidence for January, prior 115.8, will offer additional hints of inflation conditions and becomes crucial for EUR/USD traders if citing reflation fears.
Technical analysis
EUR/USD battles the 200-SMA, as well as a descending trend line from January 17, by the press time.
Given the lack of firmer RSI and strong resistances, EUR/USD prices are likely to witness a pullback from the 50% Fibonacci retracement (Fibo.) level of November-January advances, near 1.1335, towards the aforementioned trend line near 1.1300.
On the contrary, the 1.1335 level, comprising 200-SMA holds the key to the pair’s fresh upside towards December 2021 top near 1.1385.
- Gold stays firmer around intraday high as bulls brace for yearly resistance break.
- Risk assets remain on the back foot as pre-Fed anxiety joins Russia-led geopolitical risks.
- Firmer inflation expectations add to the fears of hawkish Fed, US CB Consumer Confidence eyed.
Gold (XAU/USD) holds on to the week-start rebound towards the yearly resistance line, dribbles around $1,842 during early Tuesday morning in Europe.
Mixed clues ahead of Wednesday’s Federal Open Market Committee (FOMC) meeting join grim concerns over Russia-Ukraine to underpin the yellow metal’s safe-haven demand.
However, a lack of major catalysts and pre-Fed anxiety seems to probe the gold buyers. On the same line are the downbeat prints of US Markit PMIs for January. Additionally, chatters concerning China’s Evergrande and trade/political ties with the US also offer distant support to the gold buyers.
Though, firmer US Treasury yields and downbeat equities keep gold buyers cautious after the metal failed to cross the key hurdle the previous week. Further, upbeat prints of US inflation expectations, per the 10-year breakeven inflation rate per the St. Louis Federal Reserve (FRED) data, seem to bolster the Fed’s rate hike concerns and probe gold’s immediate upside.
While portraying the market mood, the US 10-year Treasury yields stay firmer around 1.78%, rising for the first time in the last five days, whereas the US stock futures and Asia-Pacific shares remain on the back foot.
That said, grim concerns may keep gold buyers hopeful but the recent recovery in the US Treasury yields may test the upside momentum. On the data calendar, US CB Consumer Confidence for January, prior 115.8, will offer intermediate inflation-related clues to traders, making it important ahead of tomorrow’s Fed drama.
Read: Conference Board Consumer Confidence January Preview: Inflation is a shock to the system
Technical analysis
Gold stays directed towards the yearly resistance line amid bullish MACD signals and steady RSI, which in turn suggests the bull's dominance over prices.
That said, gold buyers remain hopeful until the precious metal drops below $1,818 support confluence, including 20-DMA, a 12-day-old ascending trend line and 50% Fibonacci retracement (Fibo.) of January-March downside.
That said, gold’s declines past $1,818 will quickly challenge the $,800 threshold but the 38.2% Fibo. level near $1,784 could trigger the bullion’s rebound.
Alternatively, a yearly resistance line near $1,848 precedes the 61.8% Fibonacci retracement level around $1,851 to limit the short-term upside of gold.
It should be noted, however, that a clear upside past $1,851 will enable the gold buyers to challenge November 2021 peak surrounding $1,877 before aiming for the $1,900 round figure.
Overall, gold prices witness pullback as buyers lacked the strength to cross the key hurdle. However, the bears have a long way to go before retaking controls.
Gold: Daily chart
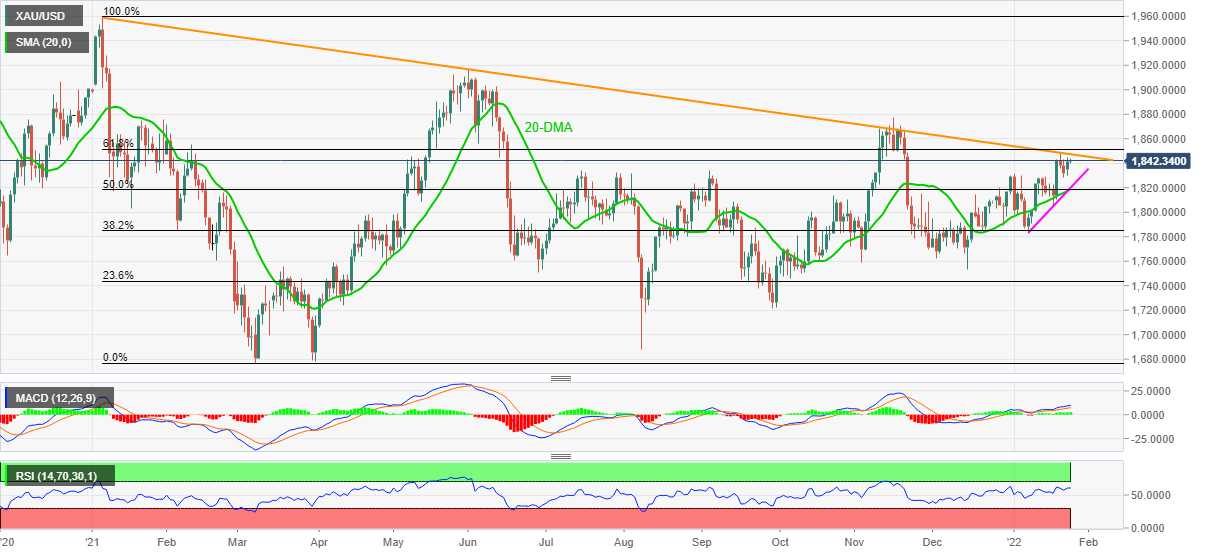
Trend: Further upside expected
- Asian equities remain on the back foot while tracking broad risk-off mood.
- Australia CPI, South Korea GDP drown markets in Canberra, Seoul.
- Fears of Fed’s faster rate hikes join escalating tensions between Russia and Ukraine to weigh on sentiment.
- US CB Consumer Confidence eyed ahead of Wednesday’s FOMC.
Asian equities track US stock futures while printing losses during early Tuesday. Market sentiment sours amid inflation and geopolitical concerns ahead of Wednesday’s Federal Open Market Committee (FOMC) meeting.
That said, MSCI’s index of Asia-Pacific shares ex-Japan drops 1.60% while Japan’s Nikkei 225 prints 2.20% intraday loss heading into Tuesday’s European session.
Among the key losers is Australia’s ASX 200 and South Korea’s KOSPI, both of which drop around 2.0% at the latest. Strong prints of Australia’s Q4 Consumer Price Index (CPI) followed an upbeat Aussie jobs report to propel the Reserve Bank of Australia (RBA) towards stiff monetary policy, which in turn weighed on the Aussie stocks. On the other hand, South Korea’s preliminary readings of Q4 GDP also came out as robust and favored bears in Seoul.
Elsewhere, Japan is up for taking 34 out of 47 prefectures under quasi emergency due to the South African covid variant, namely Omicron, but hopes of stimulus seem to defend Japanese traders.
It’s worth noting that policymakers at China’s Evergrande discuss with creditors amid a looming crisis over bond coupon payment. On the same line were downbeat comments from the Chinese Commerce Ministry. Though, the People’s Bank of China (PBOC) stays ready to defend the interest of Beijing-based investors. As a result, stocks in China and Hong Kong print mild losses.
On a broader front, the US 10-year Treasury yields stay firmer around 1.78%, rising for the first time in the last five days, whereas the US stock futures remain on the back foot.
Moving on, market sentiment is likely to remain sluggish ahead of tomorrow’s Fed meeting but US CB Consumer Confidence for January, prior 115.8, will offer intermediate clues to investors.
Read: Conference Board Consumer Confidence January Preview: Inflation is a shock to the system
- USD/INR prints bullish chart pattern on four-hour play around monthly top.
- Bullish MACD, firmer RSI hints at further advances, 200-SMA adds to the upside filters.
USD/INR remains indecisive around 74.65 during early Tuesday, after refreshing the monthly peak the previous day.
Even so, the Indian rupee (INR) pair keeps the bullish chart pattern, namely head and shoulders (H&S), alive on the four-hour play.
In addition to the bullish formation, upbeat MACD signals and RSI line also hints at the quote’s further advances.
However, a clear upside break of the neckline, around 74.65, becomes necessary to confirm the theoretical upward transition towards 75.50, comprising 61.8% Fibonacci retracement (Fibo.) of December-January fall.
During the run-up, the 200-SMA level near 74.85 and the 75.00 threshold may offer intermediate halts.
Meanwhile, pullback moves may aim for 74.30 and the 74.00 round figure before the 74.00 could lure USD/INR bears.
Following that, the monthly low and mid-September 2021 bottom, respectively around 73.75 and 73.30, will be in focus.
During the run-up,
USD/INR: Four-hour chart
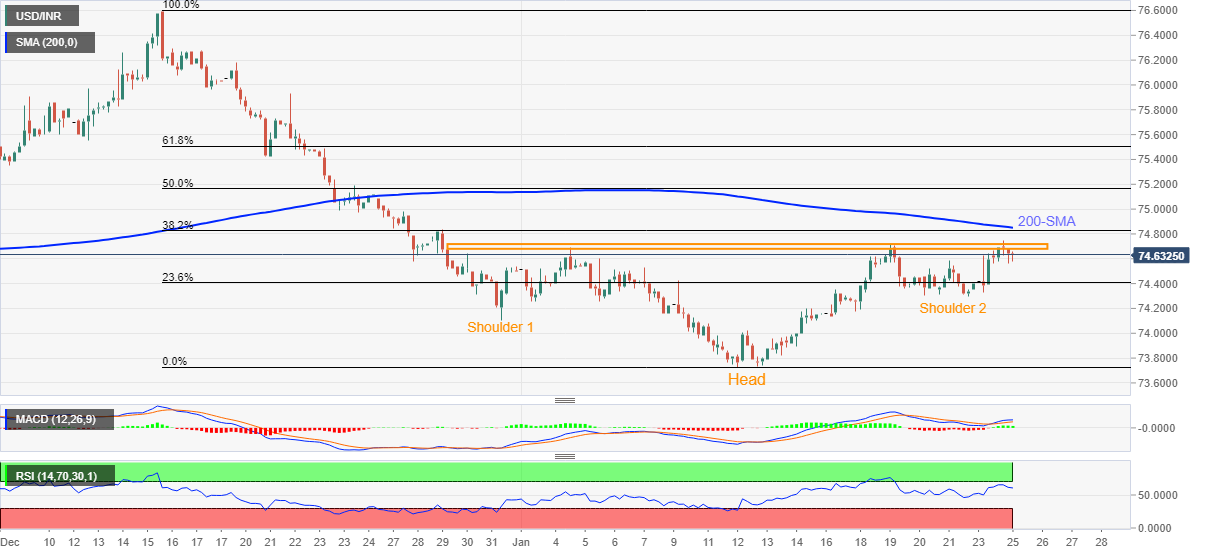
Trend: Further upside expected
- USD/JPY eyes deeper losses below 113.73 as risk-off trades remain at full steam.
- The pre-Fed rebound in the US Treasury yields could save the day for bulls.
- Sellers keep their sight on 100-DMA at 113.31 on the additional declines.
USD/JPY is challenging the key demand area below 114.00 once again, as JPY bulls fight back control amid a risk-off market profile.
Investors run for the safe-haven yen amid escalating tensions over a potential Russian war with Ukraine, as the US readies troops alongside its NATO allies. Additionally, expectations that the Fed could surprise markets by a small rate hike this week also kept the investors on tenterhooks.
Further, tightening covid restriction in Japan due to the Omicron variant contagion underpins the local currency further.
The downside in the pair, however, could be cushioned by the repositioning in the US dollar and the Treasury yields, as they staged a decent rebound ahead of the Fed meeting.
USD/JPY: Technical outlook
USD/JPY’s daily chart shows that the price has is testing the bulls’ commitments at the two-month-old ascending trendline support at 113.73.
The spot tested the critical daily support line over the past two trading days, although managed to defend it.
Daily closing below the latter will trigger a fresh downswing towards the bullish 100-Daily Moving Average (DMA) at 113.31.
The 113.00 round level will be next on sellers’ radars, opening floors towards the November 30 lows of 112.53.
The 14-day Relative Strength Index (RSI) is pointing south below 50.00, allowing room for more declines.
USD/JPY: Daily chart
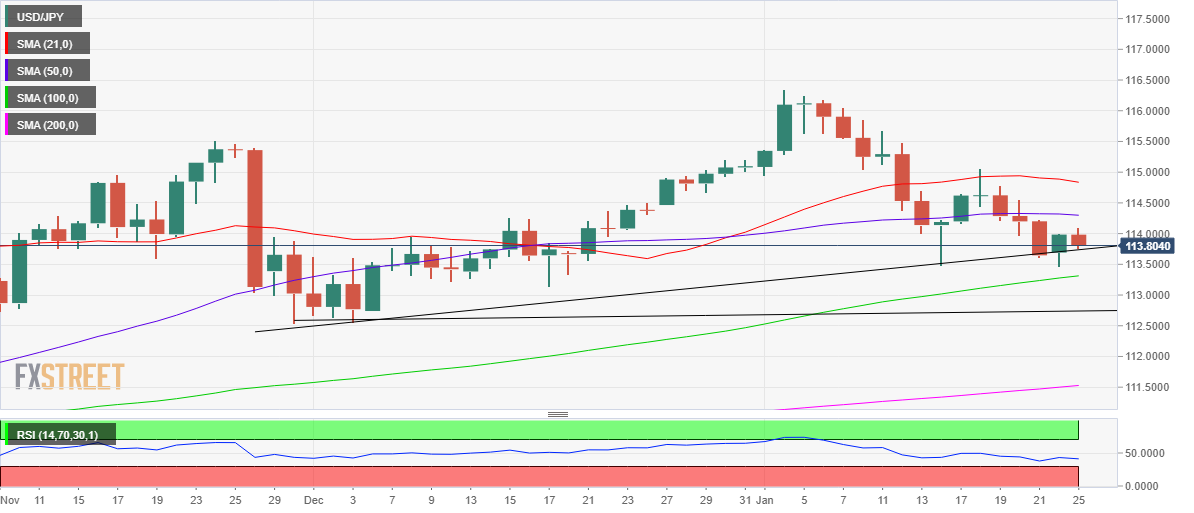
On the other side, any retracement will need to find acceptance above the 114.00 level, above which scaling the horizontal 50-DMA at 114.30 is crucial to initiate a meaningful recovery.
The next bullish target is seen at the psychological level at 114.50 should the renewed upside maintain the momentum.
USD/JPY: Additional levels to consider
- AUD/USD bears are in play for the sessions ahead.
- Bulls will be keen on a daily retest of the neckline of the M-formation and Aussie CPI could be just the ticket.
AUD/USD has resumed the downside in Asia despite the inflation data that surprised to the upside in a big way.
''Underlying inflation accelerated to 1% QoQ and 2.6% YoY in Q4. Quarterly trimmed mean inflation is now at its highest rate since Q3 2008, and the annual figure pushed above the mid-point of the Reserve Bank of Australia’s target band for the first time since mid-2014,'' analysts said on the matter.
''The RBA will now almost certainly need to adjust its forward guidance to acknowledge a rate hike is possible this year. We suspect the RBA won’t shift to a 2022 rate hike as being its central case, likely wanting to see wages growth clearly accelerate. But earlier than expected evidence of this is also possible.''
Meanwhile, the technical outlook is more mixed.
AUD/USD daily chart
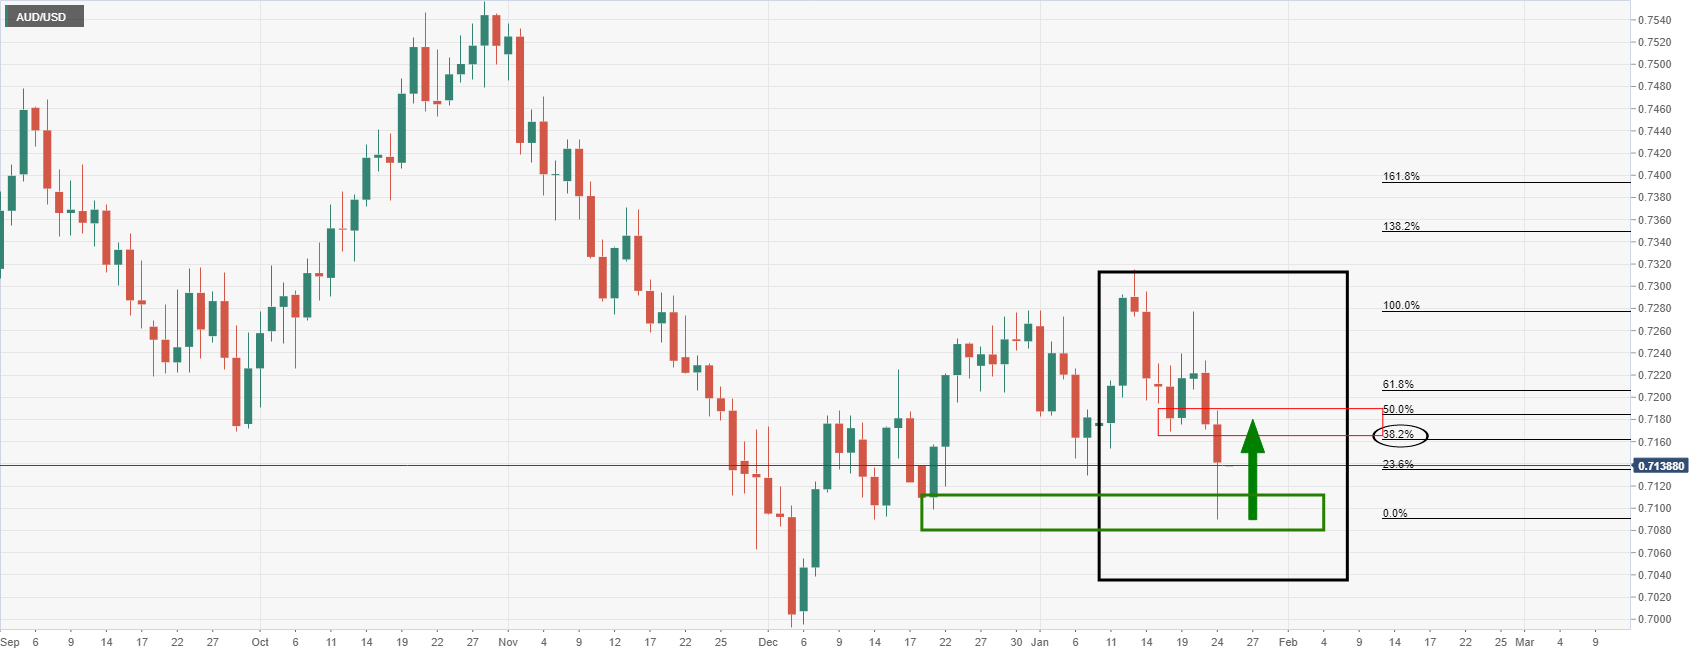
From a daily perspective, the bulls are potentially going to be in play as per the M-formation's neckline and a 38.2% Fibonacci retracement. The M-formation is a reversion pattern that has a high completion rate. However, this is on a daily basis. For now, the focus is on filling in the wick to the downside towards 0.71 the figure for the sessions ahead:
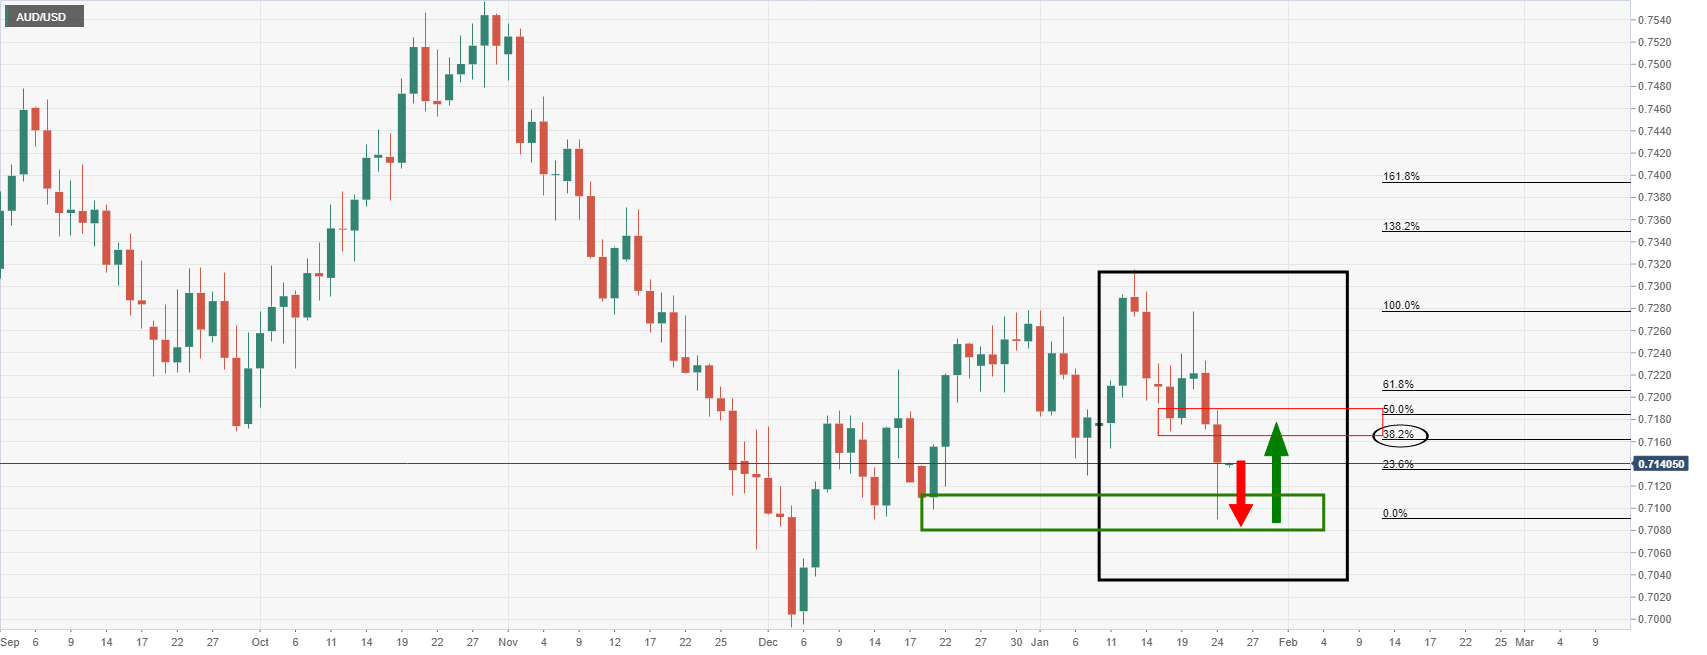
- NZD/USD is heavy as the US dollar remains firm in risk-off markets.
- Russia and the Fed are a toxic cocktail for high beta currencies such as the NZD.
Down some 0.15%, NZD/USD is currently trading near 0.6690 and has travelled between a low of 0.6670 and a high of 0.6709. The escalating tensions between Russia and Ukraine have been the driver while investors get set for the Federal Reserve this Wednesday,
As a result, the S&P 500 came within a hair's breadth of a correction, its first correction since the 2020 collapse in global markets brought on by the coronavirus pandemic. However, US stocks ended higher Monday after reversing heavy early losses rallying late ahead of mega-cap technology earnings and a Federal Reserve policy meeting this week. The Nasdaq Composite gained 0.6% to 13,855.13, turning green in a drastic last-minute reversal. The S&P 500 rose 0.3% to 4,410.13 and the Dow Jones Industrial Average was also 0.3% higher, to 34,364.50.
Meanwhile, ''data are pointing to an easing in economic activity at the start of the year, amid broader inflation concerns,'' analysts at ANZ Bank explained.
This week, the Consumer Price Index will be the focus in this regard. ''The 10% rise in oil prices over Q4 should see Transport as the most significant contributor to the headline with upside risks coming from housing, primarily on rising raw material costs and a faster pace of consents,'' analysts at TD Securities exlained. ''A print near 6%, a 3 decade high is unlikely to trigger a significant market reaction, but a print in line with the RBNZ's 5.7% YoY forecast should drive a rally.''
As for the US Central Bank, the market is getting set for a US Federal Reserve and the market is expecting the Fed to signal the removal of its vast stimulus programme. ''The risk with the meeting may be that the Fed comes out even more vociferously in its intentions to adjust policy in response to inflation,'' the analysts at ANZ Bank explained.
China’s Commerce Ministry said in a statement on Tuesday, the country faces a grim foreign trade situation in 2022.
The Ministry, however, noted that it “has confidence will maintain full-year foreign trade operations within a reasonable range.”
Market reaction
USD/CNY stages a sharp V-shaped recovery from a downward spike to 6.3259, now trading neutral at 6.3306.
- GBP/JPY remains on the back foot for the sixth consecutive day, fades Monday’s corrective pullback.
- Convergence of 50-DMA, 100-DMA challenges immediate declines ahead of 200-DMA.
- Bearish MACD signals keep sellers hopeful, two-week-old descending trend line becomes crucial resistance.
GBP/JPY takes offers around 153.30, down 0.27% intraday to portray six-day declines during early Tuesday.
In doing so, the cross-currency pair jostles with the 100-DMA and 50-DMA while reversing the late Monday’s rebound from the one-month low.
Given the bearish MACD and failures to keep the bounce off 152.90, GBP/JPY prices are likely to remain pressured. However, a daily closing below the 200-DMA level of 153.00 becomes necessary for the pair sellers to remain in the driver’s seat.
Following that, the early November 2021 low near 152.40 and 23.6% Fibonacci retracement (Fibo.) of November-December downside, near 151.15, will be in focus.
Alternatively, recovery moves may initially aim for the 61.8% Fibo. level of 154.70.
However, GBP/JPY bulls remain unconvinced til the quote stays below a downward sloping resistance line from January 12, near 155.30.
Overall, GBP/JPY sellers keep the reins but further downside becomes doubtful.
GBP/JPY: Daily chart
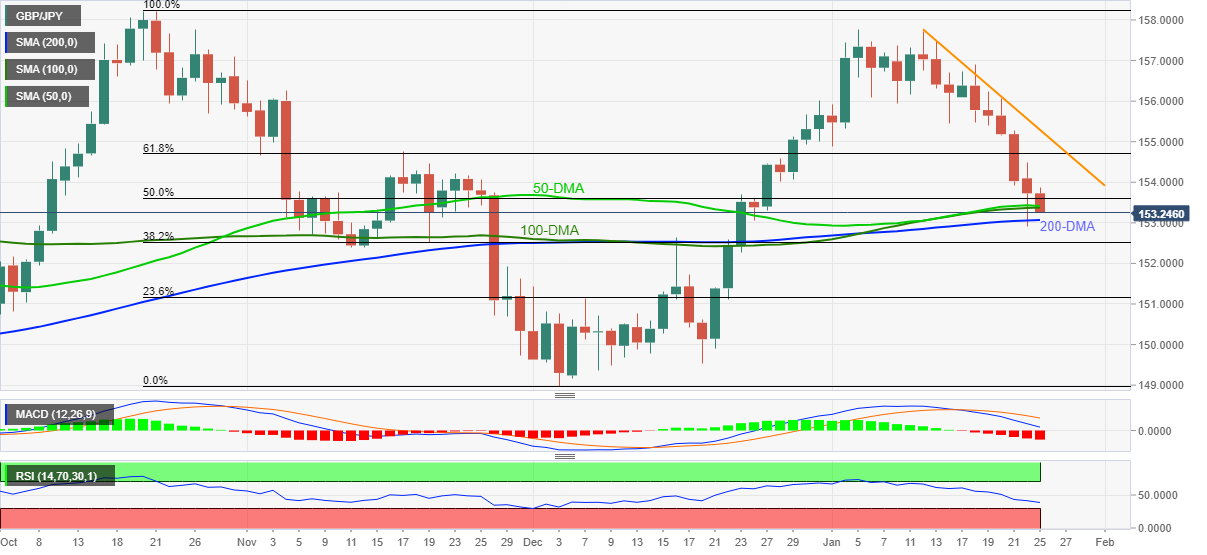
Trend: Recovery moves expected
| Raw materials | Closed | Change, % |
|---|---|---|
| Brent | 86.28 | -1.92 |
| Silver | 23.989 | -0.87 |
| Gold | 1843.012 | 0.56 |
| Palladium | 2146.5 | 2.24 |
- US 10-year Treasury yields keep bounce from one-week low, steady of late.
- S&P 500 Futures, Asia-Pacific stocks print losses after volatile Wall Street.
- Pre-Fed caution, Russia-Ukraine story keeps risk appetite weak.
- US CB Consumer Confidence may entertain traders ahead of tomorrow’s FOMC.
Be it fears of faster monetary policy consolidation or the Russia-Ukraine tussles, global markets remain risk-off during early Tuesday.
While portraying the mood, the US 10-year Treasury yields stay firmer around 1.78%, rising for the first time in the last five days. Further, US stock futures and Asia-Pacific shares remain on the back foot.
The bond coupons began the week on a firmer note, taking Wall Street benchmarks to the south, before declining to the lowest levels in seven days during late Monday. The corrective pullback also helped US equities to end Monday’s North American session on a positive side.
The recovery moves could be linked to the downbeat prints of the US Markit PMIs for January. “The Markit Flash US Composite PMI dropped sharply in January to 50.8 (from 57.0), its lowest read since July 2020. Both the manufacturing and service sectors fell sharply supply chain disruptions and labor shortages continue. Input price inflation is slowing but output prices are still rising sharply as firms look to recover more of the price increases they have encountered over the past year,” said ANZ analysts.
Though, upbeat prints of US inflation expectations, per the 10-year breakeven inflation rate per the St. Louis Federal Reserve (FRED) data, seem to bolster the Fed’s rate hike concerns ahead of Wednesday’s Federal Open Market Committee (FOMC) meeting.
Escalating the war of words over the geopolitical tussles between Russia and Ukraine also underpinned the risk aversion at the start of the key week. The US, Europe and the North Atlantic Treaty Organization (NATO) push Russia towards a ceasefire amid reports that Moscow is up for a battle with Ukraine. As per the latest updates from the UK, leaders agreed that if Russia continues its intervention into Ukraine, allies must respond quickly, including through a package of sanctions.
It’s worth noting that US Treasury Secretary Janet Yellen accepted the same and praised Fed efforts, which in turn strengthened bullish bias over the FOMC.
Although markets keep eyes on the Fed, today’s US CB Consumer Confidence for January, prior 115.8, will offer intermediate clues to investors.
Read: Fed Preview: Three ways Powell could out-dove markets, dealing a blow to the dollar
Analysts at JP Morgan offer their take on the first US Federal Reserve (Fed) policy meeting of 2022 and its likely impact on the US dollar.
Key quotes
"We do not expect fireworks from the Fed on Wednesday. It is possible that the Fed chooses to conclude QE early, though even if they do, the ultimate impact on US yields could be relatively muted given that a March hike is already fully priced and that UST valuations have closed much of the valuation gap that had persisted through late-2021.”
"This may limit the extent of tactical upside for the dollar against low-yielders even with a hawkish outcome.”
- GBP/USD is attempting to break back to the downside.
- There is a lot going into the mix and geopolitics are front and centre.
GBP/USD is holding tight in somewhat bearish territory below 1.35 the figure. At 1.3480, the price is tinkering on the edge of another run to the downside having already fallen from 1.3490 to print a low of 1.3473.
Sterling dropped on Monday to its lowest in three weeks versus the US dollar, with traders moving out of risk and into safe havens due to the expectations of Fed tightening and escalating tensions between Russia and Ukraine.
The market is getting set for a US Federal Reserve meeting this week and the chances are, the central bank is about to signal the removal of its vast stimulus programme.
''A likely March rate hike has been well communicated, so a "prepare for liftoff" signal will not be market-moving,'' analysts at TD Securities explained. ''More important will be guidance on QT as well as the funds rate after March. We don’t expect definitive signals, unfortunately; the next dot plot update is in March. The result could be mixed messages.''
Meanwhile, the spotlight has been on geopolitics. The United States and Uk set the stage for the risk of start to the week on Sunday. The US said it was ordering diplomats' family members to leave Ukraine, in one of the clearest signs yet that Washington is bracing for an aggressive Russian move in the region. The UK has repeatedly been warning Russia that an invasion would be "disastrous" and a "painful, violent and bloody business", as PM Boris Johnson warned.
Stock markets plummeted in a broad-based sell-off on Monday, and the S&P 500 came within a hair's breadth of a correction, its first correction since the 2020 collapse in global markets brought on by the coronavirus pandemic.
The S&P 500 slumped as much as 4%. However, US stocks ended higher Monday after reversing heavy early losses rallying late ahead of mega-cap technology earnings and a Federal Reserve policy meeting this week. The Nasdaq Composite gained 0.6% to 13,855.13, turning green in a drastic last-minute reversal. The S&P 500 rose 0.3% to 4,410.13 and the Dow Jones Industrial Average was also 0.3% higher, to 34,364.50.
GBP domestic fundamentals and politics
Meanwhile, British business activity grew less than anticipated in January, with the Purchasing Managers Index (PMI) touching an 11-month low, but cost pressures stayed high. This is data that will be eyed in anticipation of the Bank of England that is expected to hike rates in February. Last week, UK inflation rose faster than expected to its highest in nearly 30 years in December.
Besides economics, in the background, the investigation into Parttgate at the official residence of British Prime Minister Boris Johnson during Britain's 2020 lockdown is due to be published this week. MPs may force a confidence vote on BoJo after the release of the Sue Gray report which is likely to put the brakes on any significant correction in the pound.
GBP/USD technical analysis
From a technical perspective, however, the bears will need to penetrate below the current lows and hourly support if the downside is going to be sustained:
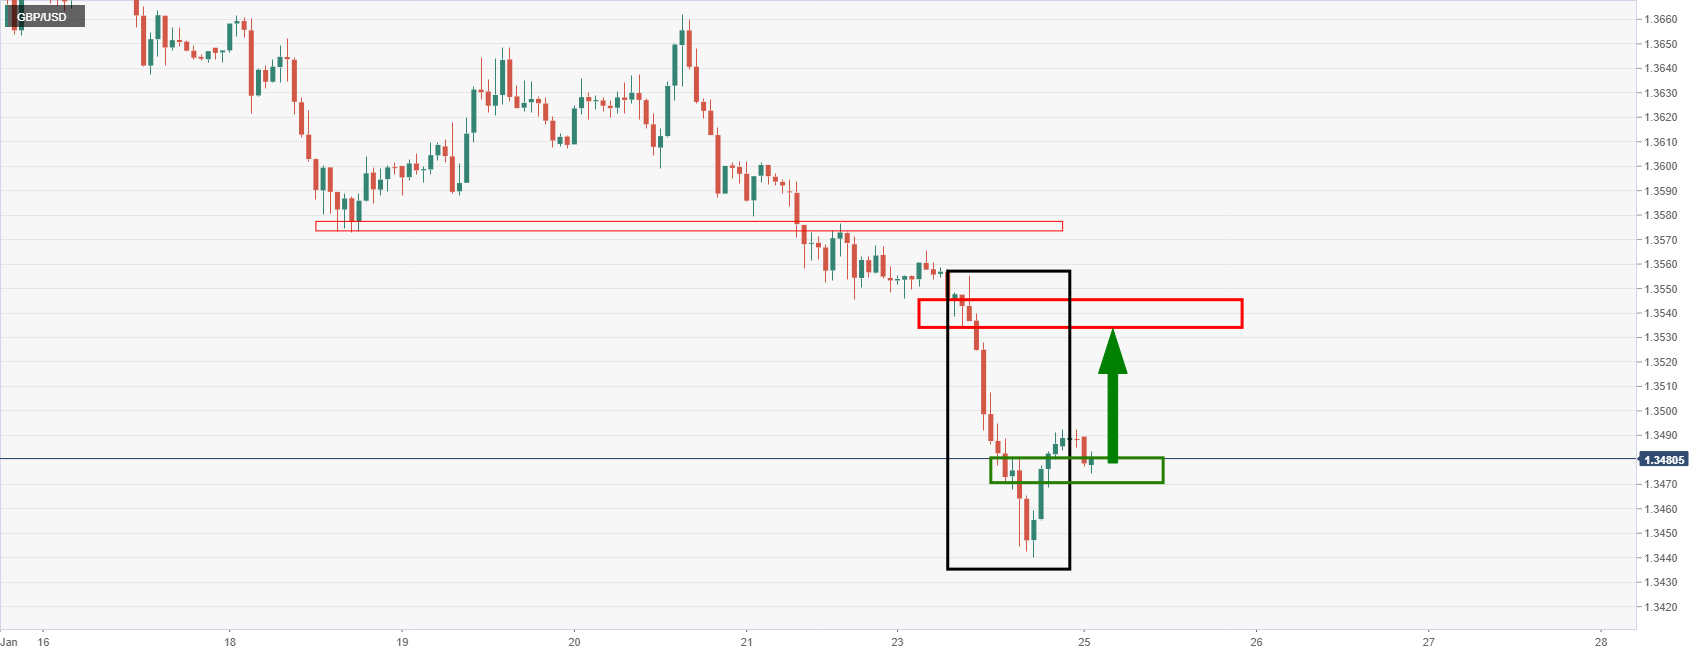
- DXY remains sidelined after failing to cross short-term key resistances.
- Six-week-old descending trend line, 50-DMA guards immediate upside.
- Bullish MACD signals keep buyers hopeful aboe crucial Fibonacci retracement levels, 100-DMA.
US Dollar Index (DXY) struggles to extend the previous day’s run-up around a fortnight high, taking rounds to 92.90 during early Tuesday.
The greenback gauge pierced a multi-day-old resistance line and the 50-DMA the previous day but couldn’t keep the breakout on a daily closing basis.
However, bullish MACD signals join the DXY’s sustained run-up beyond the 100-DMA and 61.8% Fibonacci retracement (Fibo.) of October-November 2021 upside to keep buyers hopeful.
That said, a clear upside break of the 96.00 hurdle will propel the US Dollar Index towards the monthly high of 96.46 before directing the quote to the year 2021 peak of 96.94.
Meanwhile, pullback moves may take rests around 38.2% and 50.0% Fibo. levels, respectively near 95.55 and 95.10.
Though, the 100-DMA and 61.8% Fibonacci retracement level, close to 94.90 and 94.68 in that order, will be crucial supports to watch for the DXY bears afterward.
To sum up, US Dollar Index keeps the upside momentum but a rally needs to cross the 96.0 resistance.
DXY: Daily chart
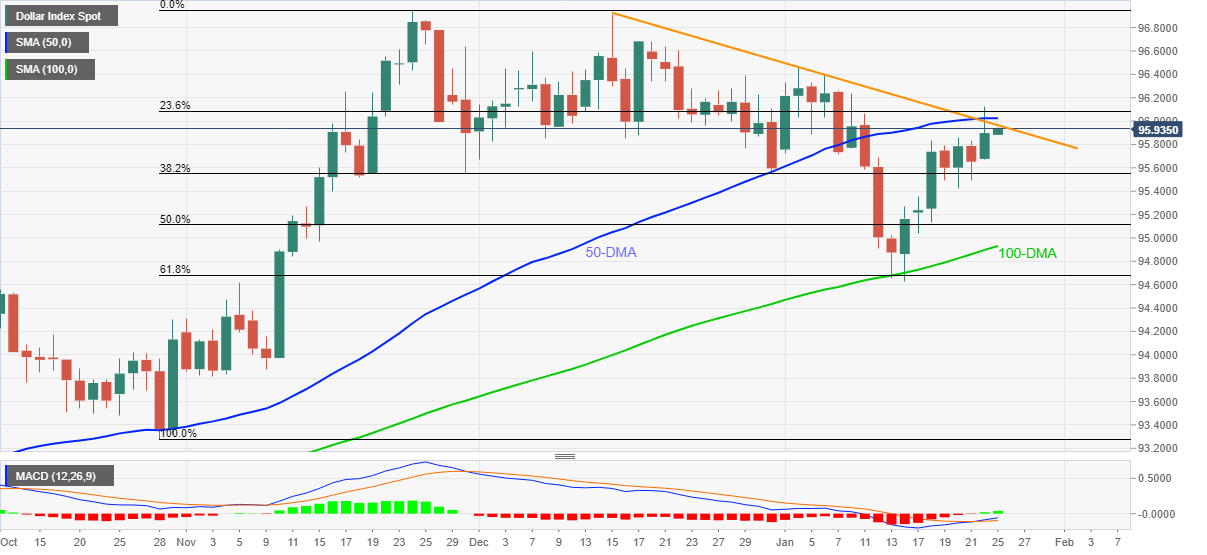
Trend: Further upside expected
- USD/TRY remains pressured around intraday low, stays inside weekly trading range.
- Market sentiment dwindles as traders await Fed, Russia-Ukraine tussles escalate.
- Turkish Treasury sellers more lira bond, energy crisis pushes diplomats to visit Iran.
- Second-tier data from Turkey, US CB Consumer Confidence will decorate calendar but FOMC will be the key.
USD/TRY fails to keep the previous two-day advances, recently sidelined around $13.48 during early Tuesday.
The Turkish lira (TRY) pair’s latest losses could be linked to the market’s consolidation ahead of the key Federal Open Market Committee (FOMC) meeting, not to forget hopes of the Turkish government’s ability to defend the national currency and solve the energy crisis at home.
On Monday, Turkey’s Treasury department sold net 1,984.8 million lira of 2-year fixed-coupon bond in the auction, per Reuters. The news also mentioned the government’s selling of 10,287.5 million lira of CPI-indexed 6-year bond.
Elsewhere, a team of Turkish diplomats visits Iran after a political rift with Tehran marked the biggest ever power cut and challenged the industrial production at home.
It’s worth noting, however, that fears of the Fed rate hike and a war of words relating to the Russia-Ukraine situations exert downside pressure on the market sentiment, as well as favoring the US dollar due to its risk barometer status.
Looking forward, Turkey’s Capacity Utilization and Manufacturing Confidence for January may entertain USD/TRY traders ahead of the US CB Consumer Confidence for the said month. Though, major attention will be given to Wednesday’s FOMC amid hopes of getting clues for the March rate hike, which in turn could propel the pair prices.
Read: Fed Preview: Three ways Powell could out-dove markets, dealing a blow to the dollar
Technical analysis
Failures to provide a clear upside break of a two-week-old resistance suggest the USD/TRY pair’s further grinding around $13.50. Though, higher low formation keeps buyers hopeful.
| Time | Country | Event | Period | Previous value | Forecast |
|---|---|---|---|---|---|
| 00:30 (GMT) | Australia | National Australia Bank's Business Confidence | December | 12 | |
| 00:30 (GMT) | Australia | Trimmed Mean CPI y/y | Quarter IV | 2.1% | 2.4% |
| 00:30 (GMT) | Australia | CPI, y/y | Quarter IV | 3% | 3.2% |
| 00:30 (GMT) | Australia | Trimmed Mean CPI q/q | Quarter IV | 0.7% | 0.7% |
| 00:30 (GMT) | Australia | CPI, q/q | Quarter IV | 0.8% | 1% |
| 07:00 (GMT) | United Kingdom | PSNB, bln | December | -17.4 | -18.5 |
| 09:00 (GMT) | Germany | IFO - Current Assessment | January | 96.9 | 96.3 |
| 09:00 (GMT) | Germany | IFO - Expectations | January | 92.6 | 93 |
| 09:00 (GMT) | Germany | IFO - Business Climate | January | 94.7 | 94.7 |
| 11:00 (GMT) | United Kingdom | CBI industrial order books balance | January | 24 | 22 |
| 14:00 (GMT) | U.S. | Housing Price Index, y/y | November | 17.4% | |
| 14:00 (GMT) | U.S. | Housing Price Index, m/m | November | 1.1% | |
| 14:00 (GMT) | Belgium | Business Climate | January | 3.6 | |
| 14:00 (GMT) | U.S. | S&P/Case-Shiller Home Price Indices, y/y | November | 18.4% | 18% |
| 15:00 (GMT) | U.S. | Richmond Fed Manufacturing Index | January | 16 | |
| 15:00 (GMT) | U.S. | Consumer confidence | January | 115.8 | 111.8 |
| 21:45 (GMT) | New Zealand | Trade Balance, mln | December | -864 |
In recent trade today, the People’s Bank of China (PBOC) set the yuan (CNY) at 6.3418 vs the last close of 6.3304 and the estimate at 6.3386.
About the fix
China maintains strict control of the yuan’s rate on the mainland.
The onshore yuan (CNY) differs from the offshore one (CNH) in trading restrictions, this last one is not as tightly controlled.
Each morning, the People’s Bank of China (PBOC) sets a so-called daily midpoint fix, based on the yuan’s previous day closing level and quotations taken from the inter-bank dealer.
Reuters reported that the Bank of Japan Governor Haruhiko Kuroda said on Tuesday the central bank must maintain ultra-loose monetary policy, while keeping an eye on the risk that inflation accelerates before wages begin to rise.
''Speaking in parliament, Kuroda also said he did not think Japan was experiencing an "abnormal" weak yen that pushes up import costs excessively, stressing that recent rising living costs were driven mostly by higher commodity and energy costs.''
Key notes
Global commodity price rise is much bigger factor than weak yen in pushing up japan's consumer inflation.
Main firms are still reluctant to pass on rising costs to consumers, as seen in modest rise in consumer inflation.
Must create cycle in which rising corporate profits, expansion in economy leads to rises in both prices and wages.
BoJ will continue easy monetary policy so economic recovery pushes up wages and leads to gradual rise in consumer inflation.
Must continue current easy policy while keeping eye out on risk inflation accelerates before wages start to rise.
Japan isn't experiencing 'abnormal' weak yen that is pushing up import prices excessively.
- AUD/JPY extends the week-start rebound from late December lows.
- Receding bearish bias of MACD joins firmer data to favor bulls.
- Australia Q4 CPI, RBA Trimmed Mean CPI crossed forecasts and prior, NAB data came in softer for December.
- Death cross keeps sellers hopeful, three-week-old resistance line adds to the upside filters.
AUD/JPY justifies strong Australia inflation data by refreshing intraday top around 81.80, currently up 0.25% intraday, during early Tuesday.
In doing so, the cross-currency pair stretches the previous day’s bounce off 61.8% Fibonacci retracement (Fibo.) level of December-January upside, around 80.90.
That said, Australia’s fourth quarter (Q4) Consumer Price Index (CPI) rose more than 1.0% forecast and 0.8% QoQ to 1.3% while the YoY figures crossed the Reserve Bank of Australia’s (RBA) SOMP projections to 3.5%, versus 3.2% expected and 3.0% prior. Further, the RBA Trimmed Mean CPI crossed 0.7% market consensus with 1.0% figures on QoQ while also rising past 2.4% YoY forecast to 2.6%.
Read: Breaking: Aussie CPI comes in hotter and lifts AUD over 26 pips off the bat
Other than the fundamentals and 61.8% Fibo, The corrective pullback also gains support from the receding bearish bias of the MACD.
Even so, a bear cross between the 50-SMA and 200-SMA keeps sellers hopeful until the quote stays below 82.45.
Also acting as an upside hurdle is a descending resistance line from January 05, near 82.70.
Alternatively, pullback moves may aim for the key Fibonacci level retest, near 80.90, a break of which will strengthen the bearish approach towards the 80.00 threshold. Following that, December’s low near 78.80 will be in focus.
AUD/JPY: Four-hour chart
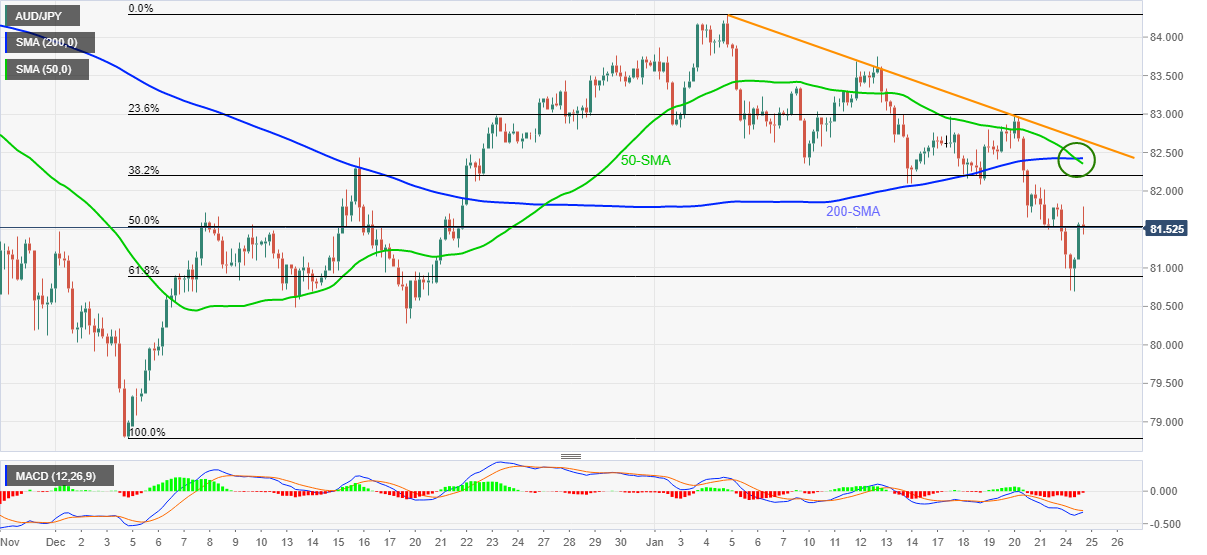
Trend: Further recovery expected
- AUD/USD extends early Asian rebound from five-week low on firmer Australia inflation data.
- Australia Q4 CPI, RBA Trimmed Mean CPI rose past forecasts, NAB data came in softer for December.
- Risk-off mood adds to the upside filters amid pre-Fed woes, Russia-Ukraine tension.
- US CB Consumer Confidence will decorate the calendar, all eyes on Wednesday’s FOMC.
AUD/USD pops 25 pips to 0.7175 as Australia Q4 inflation data came in stronger than expected during early Tuesday.
The Aussie pair initially consolidated the losses around the lowest levels since late December amid cautious optimism at the pacific major, mainly concerning South African covid variant Omicron.
That said, Australia’s fourth quarter (Q4) Consumer Price Index (CPI) rose more than 1.0% forecast and 0.8% QoQ to 1.3% while the YoY figures crossed the Reserve Bank of Australia’s (RBA) SOMP projections to 3.5%, versus 3.2% expected and 3.0% prior. Further, the RBA Trimmed Mean CPI crossed 0.7% market consensus with 1.0% figures on QoQ while also rising past 2.4% YoY forecast to 2.6%.
It’s worth noting that the National Australia Bank’s (NAB) Business Confidence and Business Conditions figures for December came in bleak as the former dropped to -12 versus 16 forecast whereas the latter eased to 8 from 12.
“We’ve written a lot about Australia’s upcoming CPI over the past week or two, so we don’t want to keep repeating ourselves. Suffice to say that the number will matter a lot. Most immediately for the RBA, which may need to acknowledge that a rate hike in 2022 is no longer completely out of the question. It could also have political implications, with the cost of living shaping up as a key issue for the upcoming Federal election,” said ANZ ahead of the key inflation data.
It’s worth noting that the recently easing covid cases in Australia join China’s latest monetary policy easing, as well as encouraging headlines from Evergrande to also favor the AUD/USD buyers.
However, fears of the Fed rate hike and a war of words relating to the Russia-Ukraine situations exert downside pressure on the market sentiment, as well as on the AUD/USD prices due to its risk barometer status.
While portraying the mood, the US 10-year Treasury yields stay firmer around 1.78% while the US stock futures and Australia’s ASX 200 print losses at the latest.
Looking forward, US CB Consumer Confidence for January, prior 115.8, will be crucial data for USD/JPY. However, major attention will be given to the risk catalysts.
Technical analysis
Two-month-old horizontal support near 0.7090-80 restricts short-term AUD/USD declines, which in turn joins the receding bearish bias of the MACD to favor the latest corrective pullback. However, the support-turned-resistance line from December 20, near 0.7170, followed by the 200-DMA level of 0.7200, challenges the Aussie pair’s further upside.
Australia’s fourth-quarter Consumer Price Index has been published as follows:
Australia Core Inflation 2.6% YoY vs the expected 2.4%.
- CPI (YoY) Q4: 3.5% (est 3.2%, prev 3.0%).
- CPI Trimmed Mean (QoQ) Q4: 1.0% (est 0.7%, prev 0.7%).
In terms of key drivers, dwelling purchase prices, auto fuel and food will have played an important role in this release, analysts at Westpac explained in a note ahead of the event.
Meanwhile, this data will mean a lot for markets. ''Most immediately for the Reserve Bank of Australia, which may need to acknowledge that a rate hike in 2022 is no longer completely out of the question, analysts at ANZ Bank said. ''It could also have political implications, with the cost of living shaping up as a key issue for the upcoming Federal election.''
AUD/USD has moved higher on the data as follows:
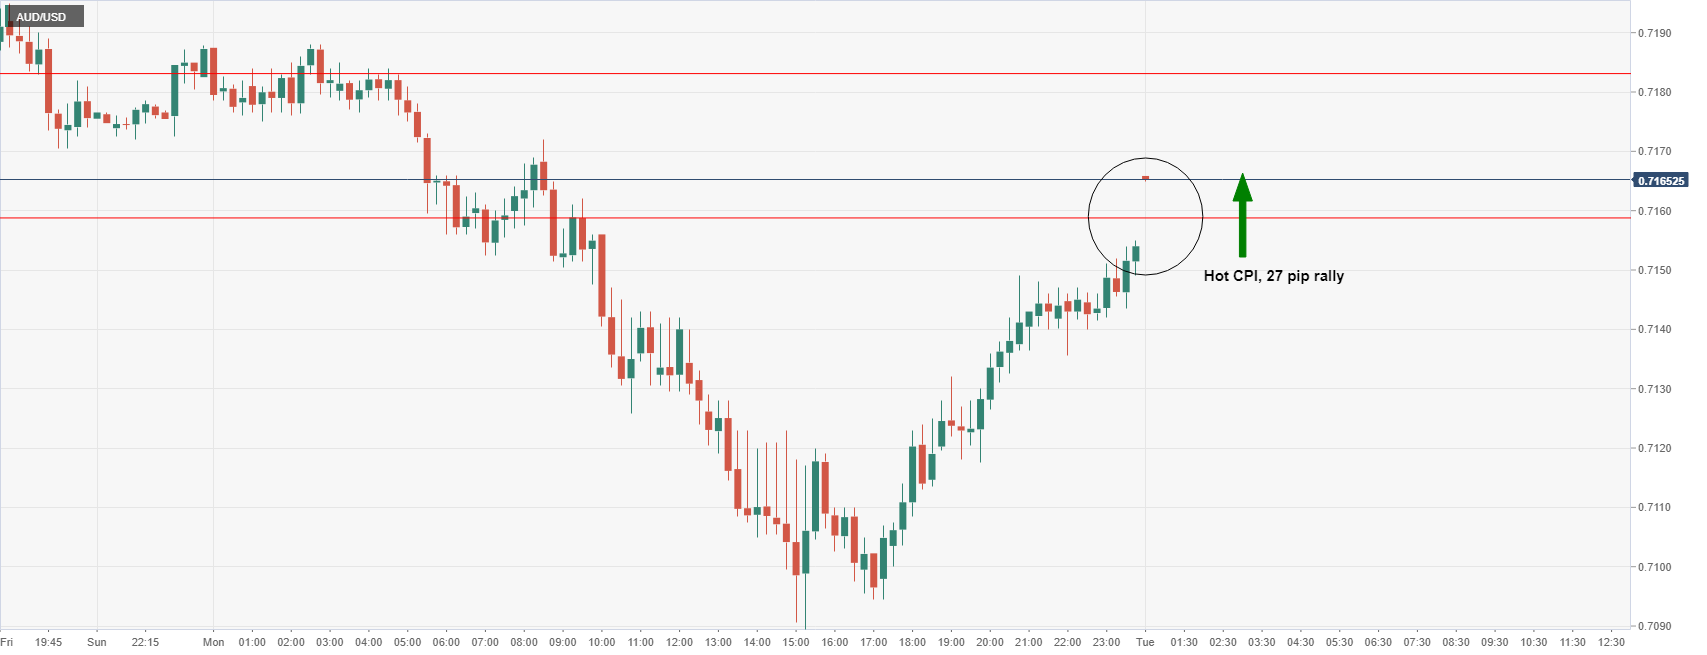
(15-min chart)
The move falls in line with prior analysis for a test of the M-formation's neckline:
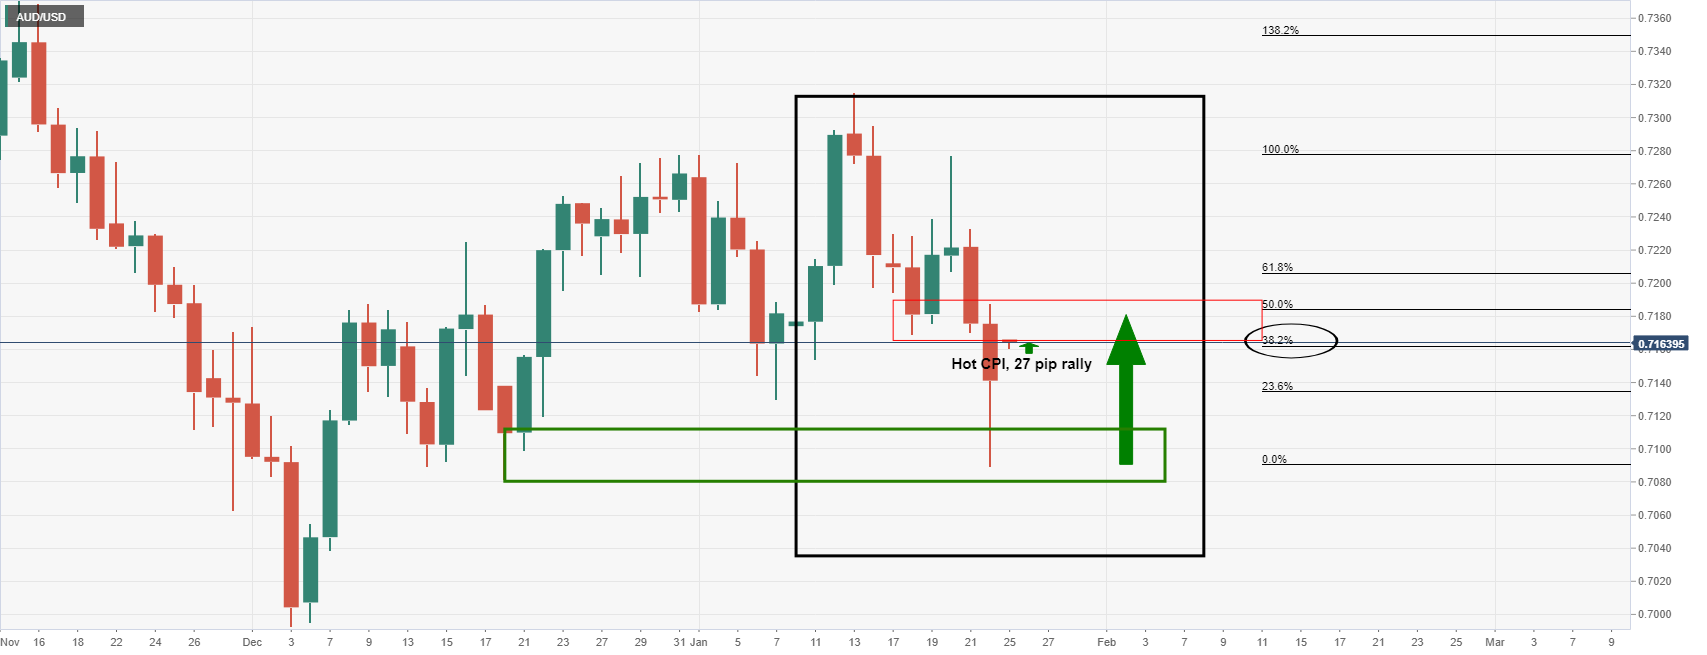
(Daily charts)
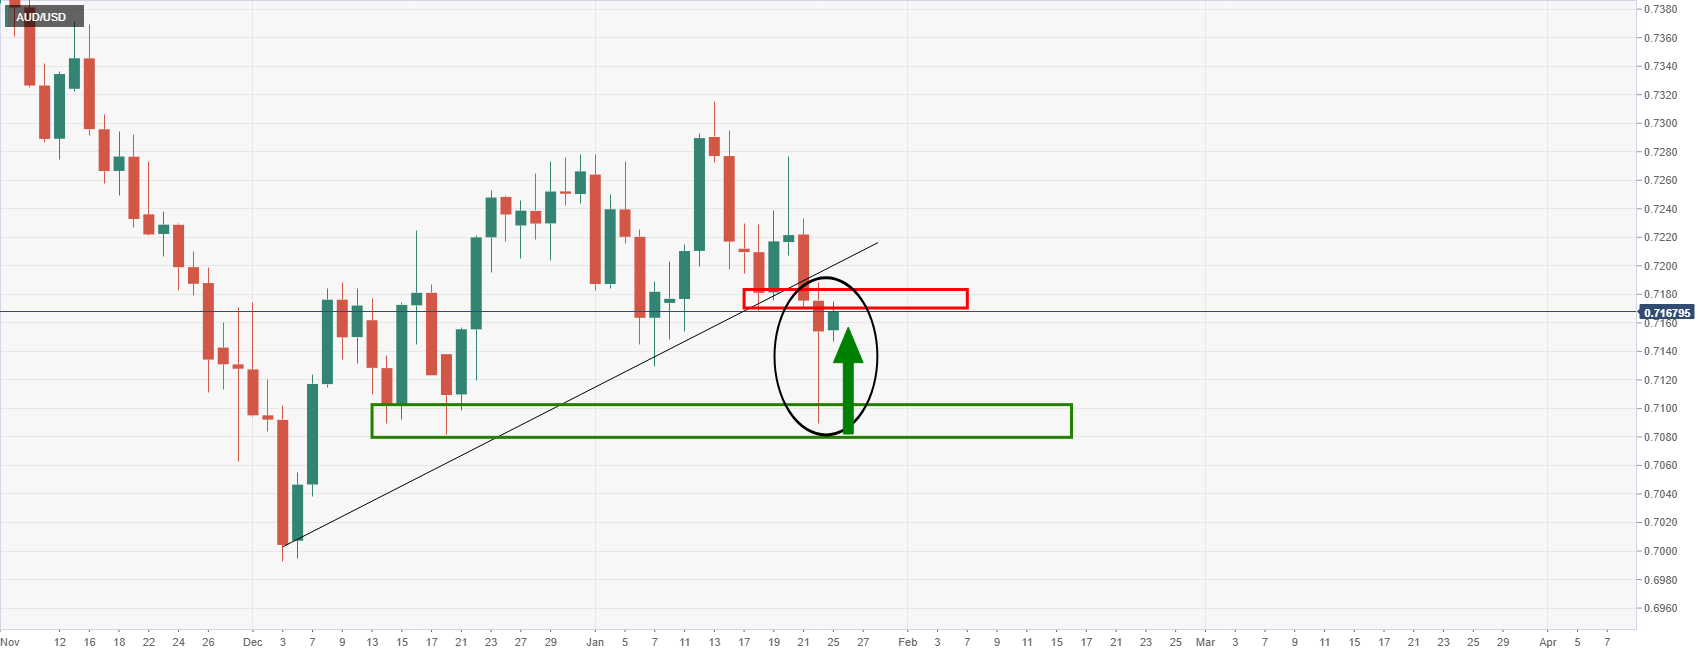
AUD/USD prior analysis
It was stated overnight in a prior article that ''AUD/USD's M-formation on the daily chart is a compelling chart pattern for the week ahead. A reversion towards 0.7150/60 would be expected...''
About Consumer Price Index (CPI)
It is published by the Australian Bureau of Statistics (ABS) has a significant impact on the market and the AUD valuation. The gauge is closely watched by the Reserve Bank of Australia (RBA), in order to achieve its inflation mandate, which has major monetary policy implications. Rising consumer prices tend to be AUD bullish, as the RBA could hike interest rates to maintain its inflation target. The data is released nearly 25 days after the quarter ends.
- USD/JPY retreats after staging a recovery from the lowest levels since late December.
- Market sentiment remains sour amid pre-Fed caution, Russia-Ukraine tussles.
- Japan eyes to put 34 of 47 prefectures under quasi-emergency due to Omicron.
- US CB Consumer Confidence, risk catalysts eyed for fresh impulse, FOMC is the key.
USD/JPY portrays a failure to extend the previous day’s rebound near 114.00 as Tokyo opens for Tuesday. The yen pair bounced off a five-week low the previous day as risk-off mood propelled the US dollar. However, fears of widespread virus-linked quasi-emergency conditions in Japan triggered the risk barometer pair’s latest pullback.
That said, Japan’s surging covid cases push authorities to push more prefectures towards harder activity restrictions. The policymakers will decide on the same during Tuesday. “Japan will decide Tuesday to expand a COVID-19 quasi-state of emergency to 34 of the nation's 47 prefectures with the addition of 18 more areas to stem the rapid spread of the Omicron variant of the coronavirus,” said Kyodo News in this regard.
Market sentiment turned sour on Monday as traders piled on more bets over the US Federal Reserve’s (Fed) hawkish appearance during Wednesday’s Federal Open Market Committee (FOMC) meeting. Escalating the war of words over the geopolitical tussles between Russia and Ukraine also underpinned the risk aversion at the start of the key week.
The US, Europe and the North Atlantic Treaty Organization (NATO) push Russia towards a ceasefire amid reports that Moscow is up for a battle with Ukraine. As per the latest updates from the UK, leaders agreed that if Russia continues its intervention into Ukraine, allies must respond quickly, including through a package of sanctions.
Elsewhere, softer US Markit PMIs for January came in softer but Japan Jibun Bank Manufacturing PMI refreshed its four-year high on Monday.
That said, fears of supply chain disruptions and inflation woes were the major catalysts to propel the US Treasury yields and the US Dollar Index (DXY). US Treasury Secretary Janet Yellen accepted the same and praised Fed efforts, which in turn strengthened bullish bias over the FOMC.
Amid these plays, the US 10-year Treasury yields stay firmer around 1.77% while the US stock futures and Japan’s Nikkei 225 print mild gains at the latest.
Moving on, US CB Consumer Confidence for January, prior 115.8, will be crucial data for USD/JPY. However, major attention will be given to the risk catalysts.
Technical analysis
Unless staying beyond the previous resistance line from March 2021, around 112.80, USD/JPY buyers remain hopeful. However, a three-week-old resistance line near 114.45 restricts the pair’s short-term recovery.
| Pare | Closed | Change, % |
|---|---|---|
| AUDUSD | 0.71452 | -0.38 |
| EURJPY | 129.073 | 0.1 |
| EURUSD | 1.13252 | -0.11 |
| GBPJPY | 153.768 | -0.16 |
| GBPUSD | 1.34911 | -0.45 |
| NZDUSD | 0.66993 | -0.21 |
| USDCAD | 1.26358 | 0.47 |
| USDCHF | 0.91404 | 0.26 |
| USDJPY | 113.976 | 0.27 |
- Gold's safe-haven allure draws in the bulls to target the $1,850s.
- A bid through the prior daily highs will take on the $1,850 and open risk to the $1,870s.
Gold prices edge higher on Monday as safe-haven buying emerged. The precious metal moved in close quarters with the psychological $1,850 area printing a high of $1,844.18 in the NY session and is starting Tokyo a touch under pressure near $1,842.
The drivers in the market are geopolitical, for now, until the Federal Reserve meeting last in the week. Despite rising expectations, the US Fed will raise rates faster than previously expected, investors have been moving into gold for its safe-haven qualities.
Inflows into gold back ETFs continue to surge, analysts at ANZ bank noted. ''SPDR Gold Shares, the largest ETF recorded its biggest net inflow in USD terms since listing in 2004. By weight, 27.6 tonnes were added.''
Gold advanced on Monday as a selloff in Wall Street driven by geopolitical tensions over Ukraine drove demand for the precious metal. Spot gold rose over 0.5% per ounce. US gold futures settled up 0.5% at $1,841.70 after NATO said it was putting forces on standby in eastern Europe in response to Russia's military build-up at Ukraine's borders. Russia denounced NATO's move as an escalation of tensions.
Meanwhile, the US dollar climbed to a two-week high on Monday against a basket of currencies as measured by the DXY index. The dollar index rose 0.67% to 96.12 during the US session. The greenback tends to perform at times of risk-off and owing to the slight yield advantage. It is also set to outperform the likes of the CHF and the yen should tensions escalate.
For instance, antagonising Russia, the United States is considering transferring some troops stationed in western Europe to eastern Europe in coming weeks and US President Joe Biden has already ordered diplomats' families to leave Kyiv.
Eyes on the Fed
As for the Federal Reserve risk, the US dollar index has gained some 1.5% since Jan. 14 in anticipation of a hawkish outcome from this week's interest rate decision. Several banks have raised forecasts for the speed and size of the Fed's policy tightening.
Most expect the first hike to be 0.25% in March and three more to 1.0% by year-end. The Fed has already signalled the start of interest rate hikes in March, but traders will be tuning in to see if the statement indicates how fast it will shrink down its holdings of Treasuries and mortgage debt on the balance sheet from beyond $8 trillion.
Gold positioning
''Gold ETFs recorded a massive inflow totalling nearly 900k oz on Friday, in a sign that equity market turbulence is finally leading to a rise in safe-haven demand for the yellow metal. While the recorded inflows may be distorted by options-related activity, the concurrent rise in volatility also suggests some safe-haven appetite building,'' analysts at TD Securities said in a note.
However, the analysts warn ''with Lunar New Year around the corner, Chinese physical demand may subside just as CTA inflows run out of steam. In fact, CTA trend followers are set to liquidate some gold length should prices break below $1815/oz.''
Gold technical analysis
As per the pre-open analysis this week, Gold, Chart of the Week: Bulls pining for $1,850+, could be just a Fed away, the price has been moving in on critical resistance:
Gold, prior analysis
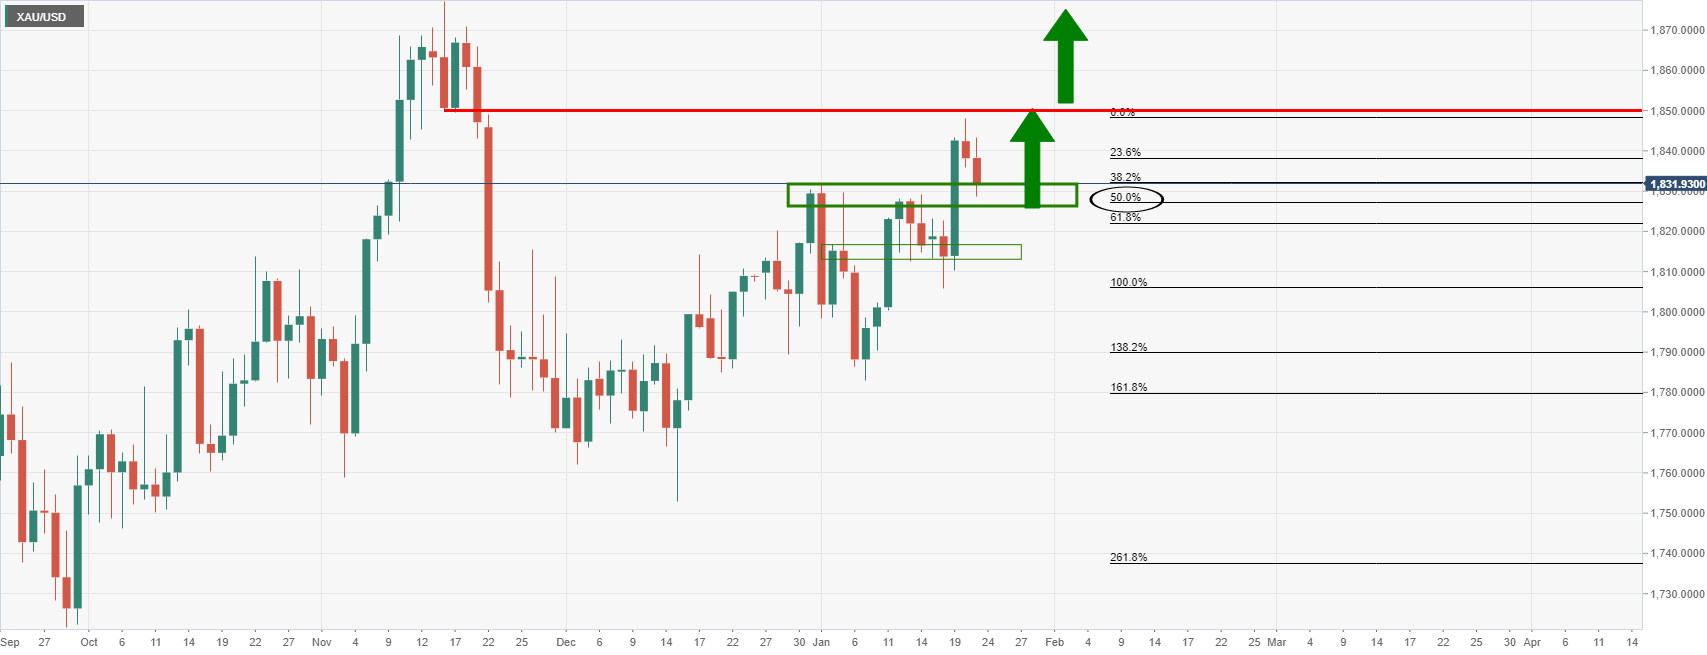
Gold, live market update
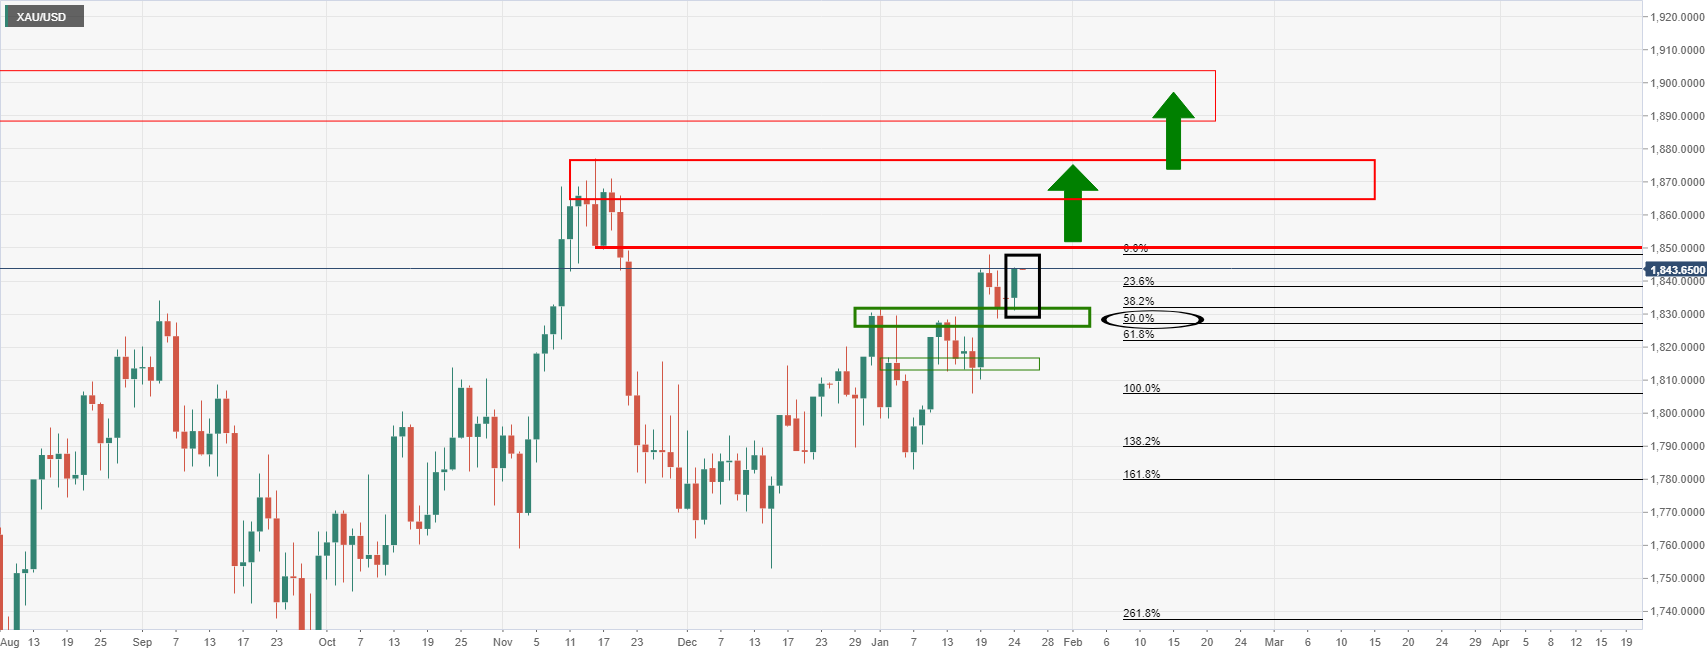
A bid through the prior highs will take on the $1,850 and open risk to the $1,870s in the coming sessions.


© 2000-2026. Sva prava zaštićena.
Sajt je vlasništvo kompanije Teletrade D.J. LLC 2351 LLC 2022 (Euro House, Richmond Hill Road, Kingstown, VC0100, St. Vincent and the Grenadines).
Svi podaci koji se nalaze na sajtu ne predstavljaju osnovu za donošenje investicionih odluka, već su informativnog karaktera.
The company does not serve or provide services to customers who are residents of the US, Canada, Iran, The Democratic People's Republic of Korea, Yemen and FATF blacklisted countries.
Izvršenje trgovinskih operacija sa finansijskim instrumentima upotrebom marginalne trgovine pruža velike mogućnosti i omogućava investitorima ostvarivanje visokih prihoda. Međutim, takav vid trgovine povezan je sa potencijalno visokim nivoom rizika od gubitka sredstava. Проведение торговых операций на финанcовых рынках c маржинальными финанcовыми инcтрументами открывает широкие возможноcти, и позволяет инвеcторам, готовым пойти на риcк, получать выcокую прибыль, но при этом неcет в cебе потенциально выcокий уровень риcка получения убытков. Iz tog razloga je pre započinjanja trgovine potrebno odlučiti o izboru odgovarajuće investicione strategije, uzimajući u obzir raspoložive resurse.
Upotreba informacija: U slučaju potpunog ili delimičnog preuzimanja i daljeg korišćenja materijala koji se nalazi na sajtu, potrebno je navesti link odgovarajuće stranice na sajtu kompanije TeleTrade-a kao izvora informacija. Upotreba materijala na internetu mora biti praćena hiper linkom do web stranice teletrade.org. Automatski uvoz materijala i informacija sa stranice je zabranjen.
Ako imate bilo kakvih pitanja, obratite nam se pr@teletrade.global.
транcфери