- Analiza
- Novosti i instrumenti
- Vesti sa tržišta
Forex-novosti i prognoze od 28-01-2022
- The USD/JPY slides 0.15% as investors prepare for the weekend.
- The greenback finished the week above 97.00 for the first time since June 2020.
- USD/JPY is upward biased, but the pair could print a leg-down before resuming the uptrend.
As Wall Street closes, the USD/JPY slides ahead of the weekend, spurred by the US 10-year Treasury yield fall, which drops eight basis points, from 1.85% to 1.777%. At the time of writing, the USD/JPY is trading at 115.22.
The New York session witnessed a slight improvement in the market mood as US stocks rebounded near the close of Wall Street, finishing with gains.
The USD has been on the defensive in the FX market, undermined by falling US T-bond yields versus the Japanese yen, failing to break above an upslope trendline, drawn from October 2021 lows to December ones passing around the 115.40-60 range.
On Friday, during the overnight session for North American traders, the USD/JPY peaked at around 115.68, above the abovementioned trendline. However, as American traders got to their desks, the pair fell 40-pips to current levels.
USD/JPY Price Forecast: Technical outlook
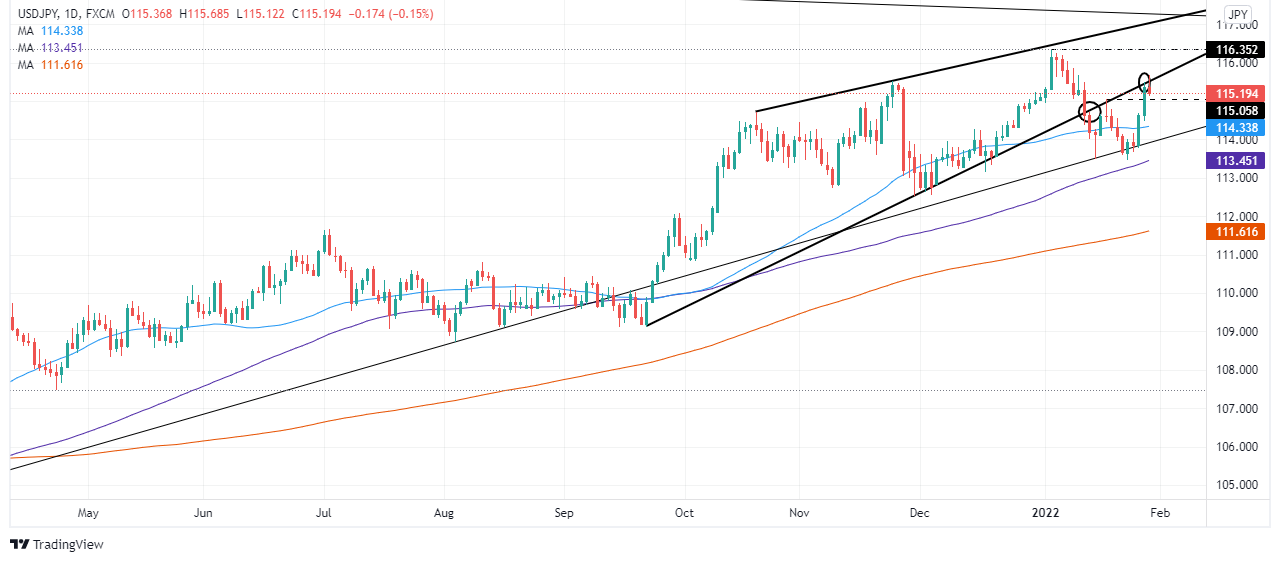
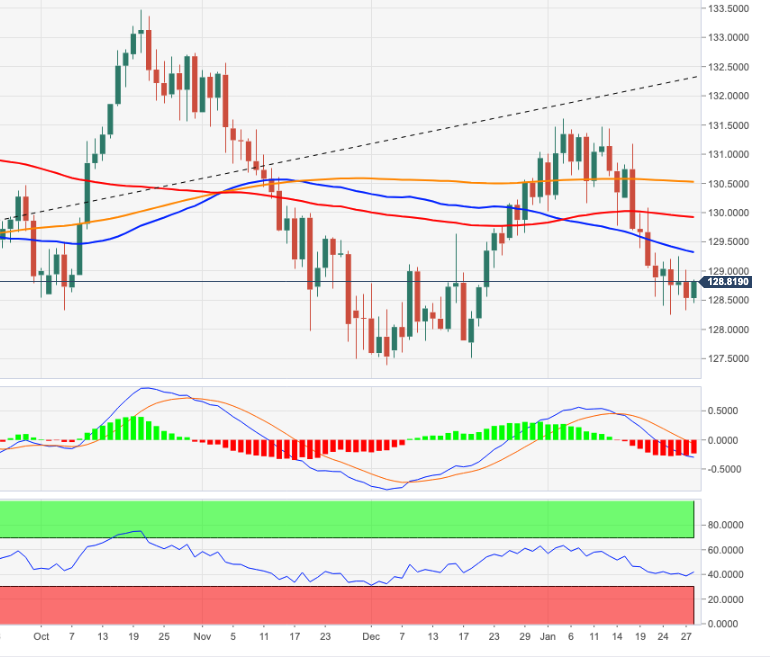
The USD/JPY is upward biased, as depicted by the daily chart. Failure to break above 115.70 might open the door for a leg-down before resuming the uptrend. However, as long as the retracement remains above the 50-day moving average (DMA) at 114.34, it would keep the uptrend intact.
The USD/JPY to the upside, the first resistance would be January 4, YTD high at 116.35. A breach of the latter would expose a downslope trendline drawn since August 1998 swing highs, a 24-year old trendline around 117.00-20, followed by a test of January 3, 2017, swing high at 118.61.
- US equities surged in late trade after a broadly positive session as Fed bets eased after softer wage data.
- The S&P 500 lept to close above the 4400 level again to close 2.4% higher and end the week positive.
- Apple led the charge after positive Q4 earnings and record iPhone sales.
US equity markets posted solid gains on the final trading day of the week. The S&P 500 gained 2.4% to close at 4430, the Nasdaq 100 gained 3.2% to close just under 14.45K after bouncing again at 14K and the Dow gained 1.7% to rally above 34.7K from an earlier session dip under 34K. Much of the surge came in late trade, but equities also got a lift before the open after US Q4 Employment Cost Index data showed a more pronounced than expected slowdown in wage pressures, news analysts said would be met with relief at the Fed, thus reducing the likelihood of a larger 50bps hike in March. Bond yields have eased on the session as a result, helping tech/growth names outperform, after a tough week for these stocks as market participants upped tightening bets after Fed Chair Jerome Powell’s hawkish post-Fed meeting remarks.
The market was led by a more than 6% surge in Apple’s share price back towards $170, a more than 9% rebound from earlier weekly lows under $155, leaving shares only just over 7.0% above recent record highs at $183. The company posted better than expected top and bottom-line earnings results for Q4 after Thursday’s close, with iPhone sales in the quarter hitting a new record. Apple’s results come following a busy last few sessions for earnings, with 168 of the 505 S&P 500 companies having now reported for Q4. According to Refinitiv data cited by Reuters, 77% of those companies have beaten analyst expectations.
But the S&P 500 only closed the week 0.8% higher, the Dow 1.3% higher and the Nasdaq 100 0.1% higher. Analysts noted that investors have been more focused on earnings guidance, especially relating to how ongoing global supply chain snags are expected to impact earnings in the coming quarters. On this topic, the news has been mixed this week. Recall Tesla collapsed more than 10% on Thursday due to negative commentary regarding the impact of supply chains in the coming months. Elsewhere, Caterpillar’s share price, seen as a bellwether for the health of the global economy, fell more than 5.0% on Friday after the co. warned about higher production and labour costs.
- Silver losses almost 8% in the week, the biggest fall in the year.
- The greenback posts its best week since June 2021, with the DXY steady at 97.251.
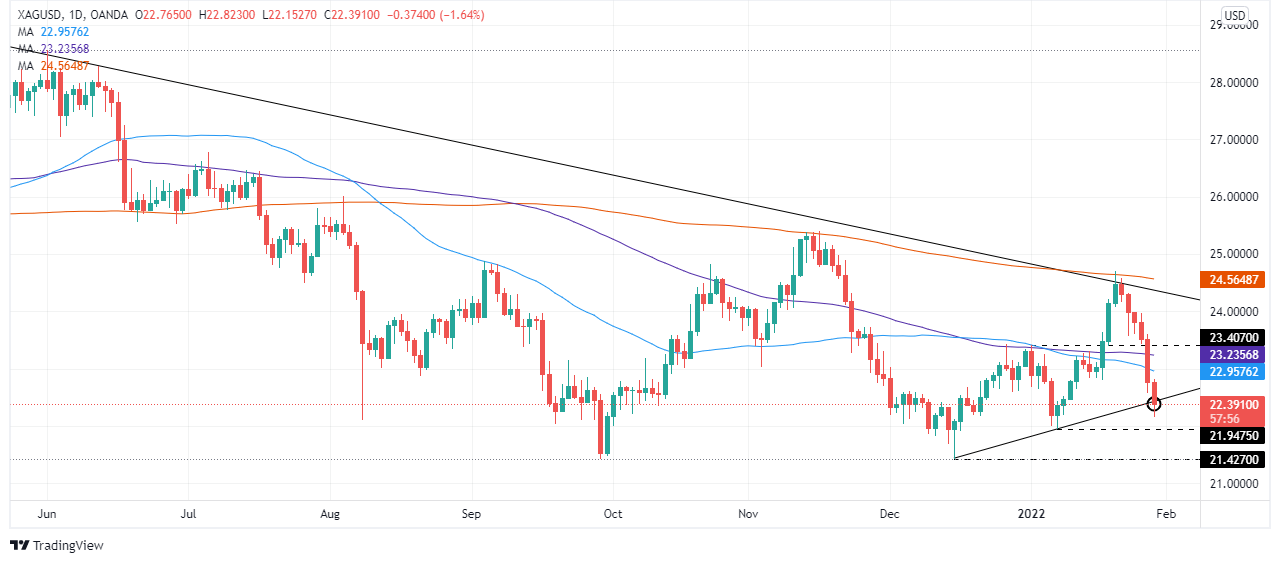
- The XAG/USD stills downward pressured, and a break below $22.35 would expose $22.00 and beyond.
Silver (XAG/USD) looks forward to finishing its worst week in the year, slumping for six consecutive days, trading at $22.39 at the time of writing. That said, the white metal accumulates losses of 7.90% in the week, the largest since November 2021, when it shed 5.90% of its value.
King dollar is back, gaining 1.70% in the week, the largest since June 2021
The US dollar is the main gainer of the week. So far, the US Dollar Index, a gauge of the greenback’s value against a basket of its rivals, advances 1.70% in the week, sitting at 97.251. It is the biggest gain since June 2021 in the week when the US central bank favorite gauge of inflation, the Personal Consumption Expenditure (PCE), rose to 4.9%, the highest level reached since June 1982.
On Friday, the US Bureau of Economic Analysis reported that the Core Personal Consumption Expenditure (PCE) for December, the Fed’s favorite gauge of inflation, rose by 4.9%, 0.1% higher than expected, and left behind the 4.7% reported in November.
Meanwhile, investors appear to be rebalancing their portfolios after the FOMC monetary policy meeting. Even though the monetary policy statement was perceived as a “hawkish hold,” the market’s reaction was null. However, when Fed Chair Jerome Powell expressed at his press conference that “the committee is of a mind to raise the federal funds rate at the March meeting,” the stock sell-off began
Before Wall Street opened, Minnesota Fed President Neil Kashkari hit the wires. He said that the Fed needs to bring the US economy in balance by raising interest rates. Kashkari noted that the central bank does not know how many increases will take and emphasized that the Fed would be adjusting as more data comes in.
XAG/USD Price Forecast: Technical outlook
Silver is downward biased, though USD bulls are struggling to break an upslope trendline drawn from December 2021 lows up to January ones that pass around the $22.35-50 area. In the event of a test of the latter, that would send XAG/USD tumbling towards January 7 cycle low at $21.94, followed by December 2021 lows at $21.42.
- GBP/JPY dipped back from earlier highs near 155.00 to the low 154.00s but remains within recent ranges.
- The pair is still trading in the green after nursing a recovery from an earlier weekly dip.
- There is notable resistance in the 153.00 area and resistance in the 155.50 area.
GBP/JPY held within a 154.00-155.00ish range on Friday, as the pair continued to nurse a recovery from its earlier weekly dip to sub-153.00 levels. The pair, which was as much as 0.75% down at the start of the week, now trades with on the week gains of about 0.15% in the 154.20s. A late yen bid on Friday that has propelled the safe-haven currency to the top of the G10 performance table has seen the pair pull back from earlier session highs closer to 155.00, but the pair continues to trade broadly flat on the day and within recent ranges.
Looking ahead to next week, technicians will be keeping an eye on support in the 153.00 area where not only this week’s lows reside, but also the 200-day moving average. If another broad downturn in risk appetite (like what happened last week) sends the pair back lower again, a break below this area would open the door to a test of the key 152.40/50 balance area that has provided both support and resistance since last September. Conversely, to the upside, traders should keep an eye on notable resistance in the 155.50 area. The Bank of England policy announcement on Thursday will be the major economic event of the week.
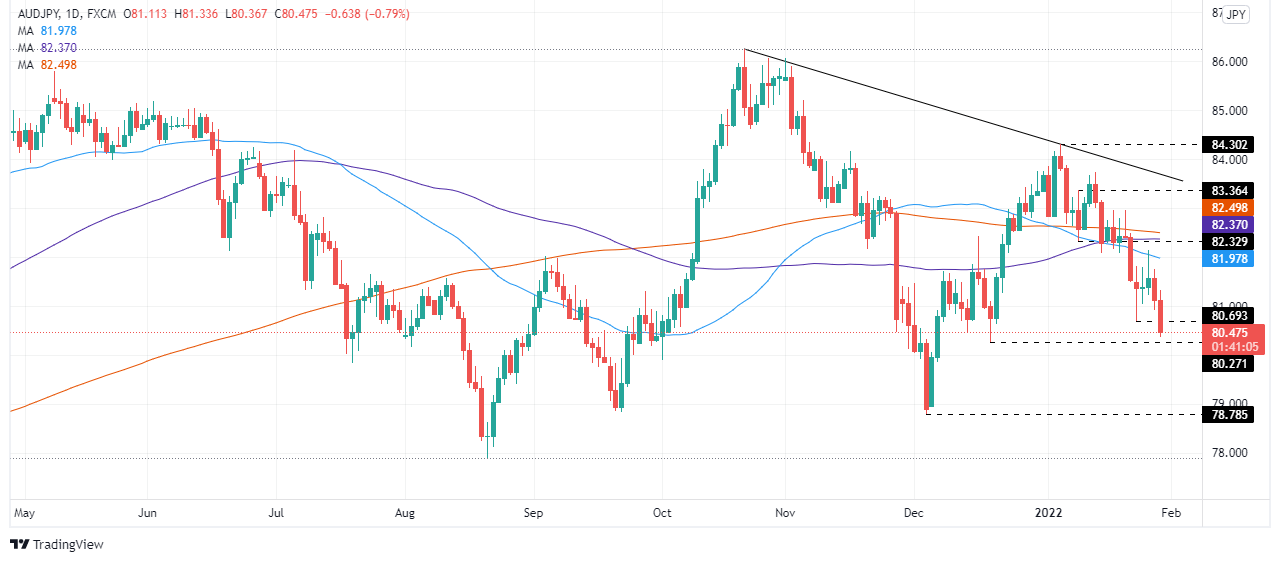
- The Australian dollar fell off the cliff against the Japanese yen, down 0.77%.
- Market sentiment has improved in the session, but in the FX market, safe-haven peers rise.
- AUD/JPY bears look forward to a Weekly/Friday close below 80.70, which would increase the odds for a fall towards 78.78.
On Friday, as the North American session progresses, the AUD/JPY plunges close to 100-pips in the day. At the time of writing is trading at 80.47. Risk-sensitive currencies like the Australian and New Zealand dollar extended their slide vs. the Japanese yen for the second consecutive day, since Wednesday when the Federal Reserve officially signaled that they would hike rates “soon.”
The AUD/JPY seesawed at the announcement, though it remained within familiar levels. However, as Fed Chair Jerome Powell hit the stage, he noted that the US central bank might raise rates in March. The signal was clear for investors, as risk aversion appeared while market participants scrambled towards safer assets. In the FX complex, flows went to the USD and the JPY.
In the meantime, US equities trade in the green at press time, reflecting a slight improvement in appetite. Nevertheless, month-end flows will keep the greenback and the JPY in the front foot until the next month.
Fundamentally speaking, the AUD/JPY should be headed to the upside, based on central bank divergence. However, risk sentiment weighed on the Australian dollar. Also, the economic deceleration of China, and the People’s Bank of China (PBoC) cutting rates, signals nervousness of the communist party regarding the Asian giant economic outlook.
AUD/JPY Price Forecast: Technical outlook
The AUD/JPY depicts the pair as downward biased. Daily moving averages (DMAs) reside well above the spot price, around the 81.98-82.37 range. The break under January 24 daily low at 80.69, immediately exposed December 20, 2021, low at 80.27. A breach of the latter might send the pair tumbling close to 150-pips to the following support level located at 78.79, the December 3, 2021, daily low.
- After dipping to fresh 18-month lows under the 0.7000 level, AUD/USD has been consolidating.
- There are now not any major levels of support until the 0.6775 area, which coincides with a key 50% Fibonacci.
- Strong US data next week could further spur dollar gains if it further spurs Fed tightening bets.
- Already very hawkish RBA expectations reduce the scope of a hawkish surprise at next week’s meeting that could lift AUD.
After dipping to fresh 18-month lows underneath the 0.7000 level during morning European trade, AUD/USD has been consolidating just below the big figure. The pair was momentarily able to reclaim 0.70 status in wake of data showing an easing of US wage inflation pressures, which triggered some dollar profit-taking and paring back on Fed tightening bets. That dollar weakness didn’t last long, with Core PCE inflation data showing inflationary pressures remained highly elevated at the end of 2021.
Now that AUD/USD has cleared key levels of support at 0.7000 in the form of the 2021 and Q4 2020 lows, technicians turn their attention to the next support zone. There is arguably some support in the 0.6920s and 0.6840s, but nothing major until the 0.6775 area. This level happens to roughly coincide with the 50% Fibonacci retracement back from the post-pandemic at roughly 0.8000 to the post-pandemic low at roughly 0.5500.
Despite having already lost 2.5% on the week, most would agree that AUD/USD’s recent break below 0.7000 leaves it very vulnerable from a technical perspective. Next week, AUD/USD traders will have plenty to focus on, with the RBA monetary policy announcement on Tuesday followed by a monetary policy statement on Friday, as well as key January US data releases (ISM survey and official jobs data). Friday’s sensitivity in the US dollar to the latest Q4 Employment Cost Index suggests things could get volatile if next week’s official jobs data surprises.
Meanwhile, some might argue that next week’s RBA meeting is one of the most highly anticipated in years. The bank is expected to axe its QE programme and faces immense market pressures to drastically shift its rate hike guidance. At the moment, the RBA board says it doesn’t see the conditions for rate hikes being met until 2023 at the earliest. That compares to money market pricing for a first rate hike as soon as May and a recent Reuters poll of economists where the median expectation was for the bank to hike rates in November.
Unfortunately for the AUD/USD bulls, the fact that market expectations have gotten so far ahead of the RBA’s stance means that even if they do complete a sizeable hawkish pivot on their current position (i.e. pointing to hikes by end-2022) the scope for a hawkish surprise that would lift the battered Aussie is low.
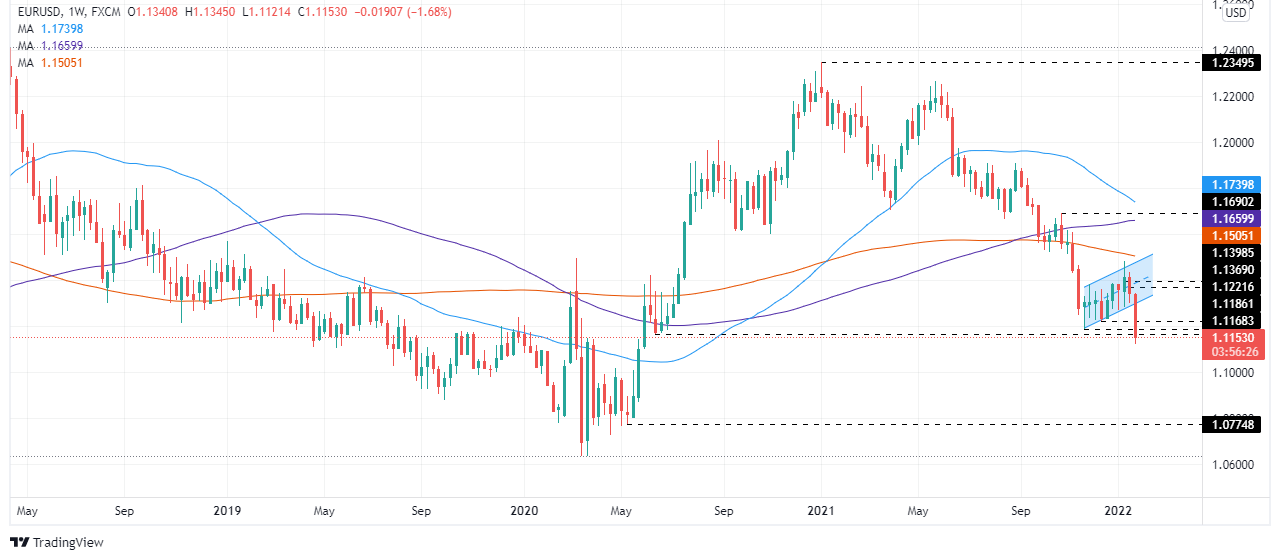
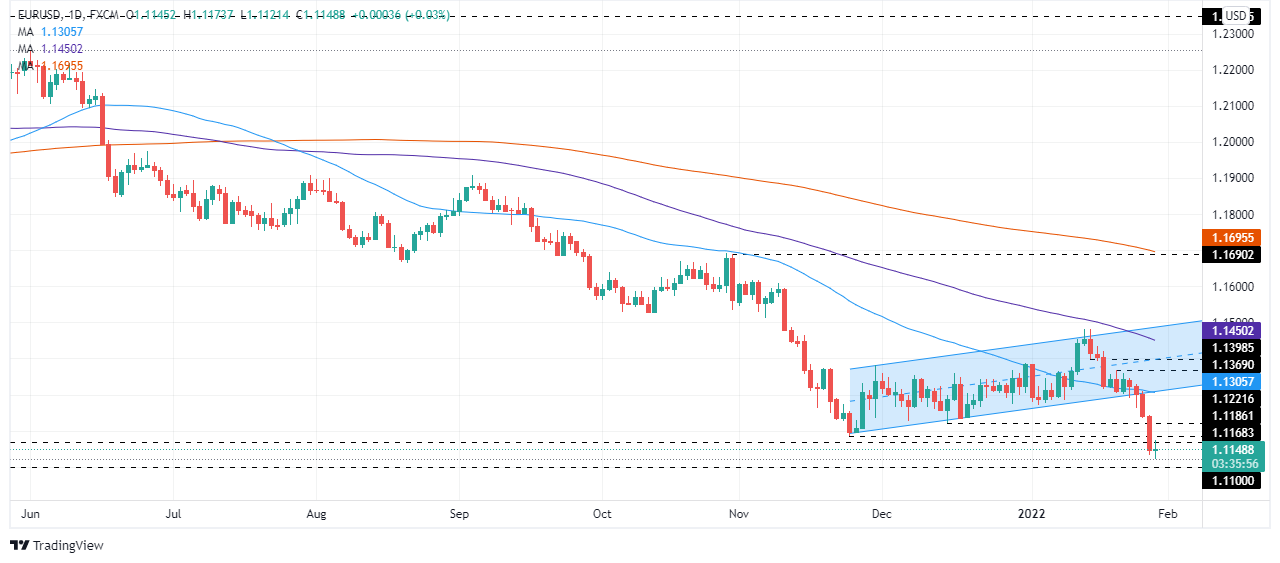
- The EUR/USD is under heavy downward pressure, as the pair eyes May 2020 swing lows.
- EUR/USD bulls failure to defend 1.1100, it would open the door towards 1.0775.
After holding above 1.1200 for too many days before USD bulls launched an attack to 2021 yearly low, however, the shared currency barely advances in the day. At the time of writing is trading at 1.1155, climbing 0.10% during the North American session.
EUR/USD Price Forecast: Technical outlook
During the overnight session for North American traders, the EUR/USD seesawed around 1.1140. However, in the European open, the pair dipped to 1.1122, jumping towards the daily high at 1.1173, attributed to USD month-end flows or technical moves, as the US Core PCE came at 4.9%, further emphasizing the need for higher rates on the Federal Funds Rate (FFR).
Weekly chart
The EUR/USD is downward biased, as depicted by the break of a bearish flag, which has 1.1100 as its target. Moreover, the weekly moving averages (WMAs) reside well above the spot price. So, a breach of the June 2020 swing lows at 1.1076 would accelerate a fall towards May 202 swing lows around 1.0775.
Daily chart
The EUR/USD daily chart depicts the pair as also downward biased, as the weekly chart. That said, the daily moving averages (DMAs) reside above the spot price. On January 26, the EUR/USD broke below the bottom trendline of a bearish flag, which gave way for a break of the 2021 yearly low at 1.1186 on Thursday.
That said, the first support would be the figure at 1.1100. A breach of the latter would expose May 14, 2020, daily low at 1.0775
- EUR/JPY was flat on Friday despite a heavy Eurozone data slate amid a calm end to the week.
- Focus now turns to next week’s ECB policy decision and flash Eurozone CPI data.
Despite a heavy slate of Eurozone data out during the European morning, it has been a rather tame trading day for EUR/JPY, with the pair swinging within 128.40-128.80ish ranges, well within this week's 100 pip, 128.20-129.20ish range. Right now, the pair is trading just to the north of the 128.50 mark and if roughly flat on the session. Where last week was a story of safe-haven demand driving FX market flows, thus pushing EUR/USD lower from the 130s, this week was a story of choppiness/indecisiveness, hence the mixed trading conditions for EUR/JPY.
Fed hawkishness in the middle of the week turned the focus in FX markets away from risk appetite back towards central banks and policy divergence. But in a win for the EUR/JPY bears, this did not seem translate into notable upside for the pair. Even if it had, short-term bears may well have used the opportunity to add to short positions in at resistance in the 129.50 area. They may be hoping that US data next week (ISM surveys and the official jobs report) contributes to a further surge in Fed tightening bets, thus knocking stocks lower again and triggering renewed safe-haven yen demand. That way the pair might fall back to test December lows in the 127.50 area.
But central bank policy will also be in the spotlight next week, with the ECB announcing a rate decision on Thursday. The meeting isn’t expected to yield any policy/guidance changes as ECB members have recently reiterated their belief in inflation being transitory and the bank’s current forecasts that it will drop back under 2.0% by the end of year. Wednesday’s Eurozone flash Consumer Price Inflation reading, if it comes in substantially hotter than forecast, may test this narrative. The theme of Eurozone inflation and how the ECB views it will also be an important driver next week.
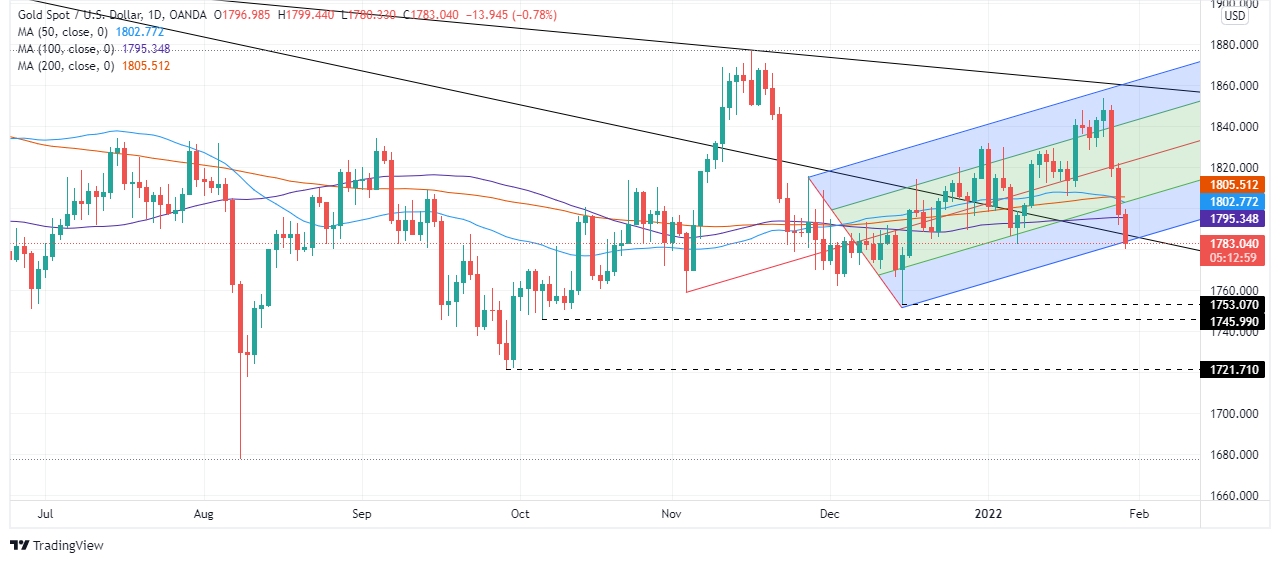
- The yellow metal has fallen close to 4% in the week, spurred by a hawkish US central bank.
- Fed’s Kashkari expects that the Fed would hike rates at the March meeting.
- XAU/USD is downward biased, though a daily close below $1752 would open the door for further losses.
Gold (XAU/USD spot vs. the US dollar extended its fall since Wednesday when the FOMC issued the first monetary policy statement of 2022. During the New York session at the time of writing, the XAU/USD is trading at $1,785.
US Core PCE increase higher than expected, Fed policymakers noted
The market sentiment has improved since the US cash equity markets opened. Nevertheless, European equity indices have been unable to get back in the green. Before Wall Street opened, the US Bureau of Economic Analysis unveiled the Federal Reserve favorite gauge of inflation, the Core Personal Consumption Expenditure (PCE) for December, increased by 4.9%, higher than the 4.8% foresee by analysts and 0.2% higher than the November reading.
Meanwhile, Minnesota Fed President Neil Kashkari said that the Fed needs to bring the US economy in balance by raising interest rates. Kashkari noted that the central bank does not know how many increases will take and emphasized that the Fed would be adjusting as more data comes in.
Later on, he said that “inflation is higher than expected” and expects the Fed to raise rates at the March meeting in an interview with Yahoo! Finance.
Concerns about the US central bank tightening dent the market sentiment
In the meantime, market participants keep digesting the Fed’s awaited change in monetary policy stance. Although the monetary policy statement was viewed as a “hawkish hold,” the initial reaction was no surprise. Nevertheless, Fed’s Chair Powell press conference rocked the boat, saying that “the committee is of a mind to raise the federal funds rate at the March meeting.”
Before Wall Street opened, Minnesota Fed President Neil Kashkari hit the wires. He said that the Fed needs to bring the US economy in balance by raising interest rates. Kashkari noted that the central bank does not know how many increases will take and emphasized that the Fed would be adjusting as more data comes in.
The US economic docket just featured the University of Michigan Consumer Sentiment for January on its final reading, which came at 67.2 lower than the 68.7 expected.
XAU/USD Price Forecast: Technical outlook
Gold is trading near the bottom of a Pitchfork’s channel, drawn from the beginning of December, as depicted by the daily chart. That trendline intersects with a downslope trendline, drawn from August 2020 swing highs, acting as resistance for the non-yielding metal around $1,790-$1,800. Furthermore, the daily moving averages (DMAs) reside above the spot price. Therefore, XAU/USD is downward biased.
The first support level would be December 15, 2021, swing low at $1,753. A breach of the latter would expose October 6, 2021, a daily low at $1746, followed by September 29, 2021, a low at $1,721.
Analysts at MUFG Bank, have a trade idea of a long position of the USD/ZAR, with an entry level at 15.500, a target at 16.300 and a stop loss around 15.000. They point out that broad dollar strength is already starting to weigh more heavily on the South African rand again.
Key Quotes:
“The ZAR has been one of the best performing currencies so far this year. It helped USD/ZAR to drop sharply from just above the 16.000-level at the end of last year and down closer to the 15.000 at the start of the New Year. The ZAR has been supported in part by strong foreign demand for South African bonds in January. It was the strongest month of foreign purchases since May of last year. It highlights the tentative pick-up in investor appetite for select emerging markets exposure.”
“We are not convinced that the turnaround in sentiment can be sustained in the current challenging external environment. The correlation between ZAR performance and US yields had broken down over the past month. The Fed’s decision to signal a faster pace of rate hikes should keep upward pressure on US yields and the USD in the near-term which we expect to begin to have more of a negative impact on the ZAR. Price action over the past week suggests that broad USD strength is already starting to weigh more heavily on the ZAR again.”
“We see room for a further reversal of the move lower in USD/ZAR from the start of this year.”
Analysts at Wells Fargo think the FOMC will announce the commencement of balance sheet reduction at the July 27 meeting. They look for the Federal Reserve to hike the Fed Funds rate by 125 bps in 2022.
Key Quotes:
“We now think it is likely that the Committee will hike rates by 25 bps at the March 16, May 4 and June 15 policy meetings. Previously, we had anticipated that the FOMC would pause in May.”
“Along with 25 bp rate hikes in September and December, we now forecast that the FOMC will raise its target range for the federal funds rate by 125 bps over the course of 2022. We continue to look for 75 bps more of additional rate hikes next year.”
“In light of Wednesday's developments, we now think that the Committee will bring forward its announcement of balance sheet reduction to the July 27 meeting with commencement in August.”
“We expect the FOMC will take a pass on a rate hike at that meeting, but the beginning of balance sheet reduction will also be another form of monetary policy tightening. If, as we currently anticipate, the Federal Reserve follows the same monthly schedule that was detailed above, then it will reach its monthly caps of $70 billion of Treasury securities and $30 billion of MBS in January 2023 rather than in March, as we previously forecasted.”
Analysts at MUFG Bank, point out that policy divergence and geopolitical risks will remain a weight on the euro in the near term, reinforcing the bearish trend in the EUR/USD pair. They see a widening policy divergence between the European Central Bank and the Federal Reserve, as the FOMC plays catch up with upside inflation risks.
Key Quotes:
“The EUR has fallen to fresh lows against the USD over the past week after breaking below the November low at 1.1186. It takes the pair closer to the lows during the initial phase of the pandemic when it briefly traded between 1.0500 and 1.1000 from February 2020 to May 2020. At the same time the EUR/GBP is trading close to recent lows at just above the 0.8300-level, and pre-pandemic lows from February 2020 and December 2019 at around 0.8280. The EUR has been now trending lower against the USD since June of last year, and for just over a year against the GBP.”
“The EUR’s downward momentum has been reinforced by the Fed’s hawkish policy update in which Fed Chair Powell opened the door to faster rate hikes than during the previous tightening cycle.”
“Recent developments support our forecast for EUR/USD to fall to 1.1000 in Q1. Downward pressure on the pair could be reinforced in the near-term if tensions between Russian and the Ukraine intensify. The bearish EUR trend would be challenged though in the week ahead if the ECB does not push back as strongly against rate hike expectations for this year.”
The Bank of Canada kept the interest rate unchanged this week but signalled imminent tightening at the next meeting in March. Next week, the key economic event will be the jobs report on Friday. Analysts at RBC Capital Markets see a drop of 70K in employment in January.
Key Quotes:
“Canadian labour market data for January is expected to weaken substantially. We’re eyeing a 75,000 drop in employment and an uptick in the unemployment rate to 6.4% after COVID-19 restrictions prompted business closures in large parts of the country.”
“Businesses in virtually all industries were reporting acute labour shortages just ahead of the Omicron surge, and are expected to be hesitant to let workers go as quickly as in past virus waves. For sectors unaffected by closures, high rates of absenteeism due to illness and self-isolation will weigh on total hours worked, if not official employment counts. Still, the number of available unemployed workers relative to the number of job postings is already very low—and that will likely still be the case once restrictions are lifted. Health experts are cautiously optimistic about the trajectory of infections in Canada.”
“Overall we do not expect Omicron disruptions to extend significantly beyond the first quarter of 2022.”
Data released on Friday showed the Employment Cost Index (ECI) rose 1% during the fourth quarter, and 4% during the year. Analysts at Wells Fargo point out the quarterly increase was more restrained than Q3's 1.3% gain, and they consider that may tamp down fears of a wage-price spiral amid signs businesses are not upping pay at such a frenzied pace.
Key Quotes:
“The ECI includes benefits in addition to wages and salary costs, and also controls for compositional changes in the workforce. That makes it a cleaner read on the degree of labor cost pressures facing businesses. The FOMC's emphasis on the ECI was on full display in Chair Powell's December post-meeting press conference, when he highlighted it as a reason he thought about announcing a faster pace for tapering asset purchases back in November.”
“The more temperate quarterly gain likely has Fed officials breathing a bit of relief that labor costs did not accelerate further on a sequential basis, but glad they have telegraphed a more hawkish path for policy given that the overall pace of employment costs continue to point to a very tight labor market.”
“While the cooler quarterly pace of ECI suggests employment costs are not running away, it is far too early to suggest the worst is over when it comes to labor cost growth. Amid an already tight labor market and the Omicron wave dealing a setback for the labor supply outlook, wage pressures are likely to remain firmly upward over the next few quarters.”
- WTI hit fresh seven-year highs at $88.82 on Friday, but has since pulled back under $88.00 again.
- WTI remains on course for healthy on the week gains of about $3.0, a sixth successive week in the green.
- Geopolitics and OPEC+ output capacity remain concerns that are supportive for prices as focus switches to next week’s OPEC+ meeting.
Front-month WTI futures hit fresh seven-year peaks on Friday, reaching $88.82 for the first time since October 2014, before pulling back somewhat to just below $88.00 again. Still, that leaves WTI trading more than 50 cents higher on the session and about $3.0 higher on the week. Indeed, WTI is on course to post a sixth successive weekly rally, a run that has seen the American benchmark for sweet light crude oil rally more than $20.00 from the low-$66.00s. The next area of major upside resistance is the psychologically important $90.00 level and then the late-2013 lows in the mid-$91.00s just above it.
Oil market analysts continue to cite a combination of bullish factors on both the demand and supply side as supporting the recent rally. Firstly, on the demand side, as the Omicron variant fades in major developed economies facilitating “reopening”, demand has held up and is expected to post strong growth for the year. Meanwhile, on the supply side, market commentators continue to cite OPEC+ capacity constraints and geopolitical tensions between NATO/Ukraine/Russia as supportive. Traders have also cited an increase in the threat to UAE output presented by an uptick in Iran-back Houthi militias based in Yemen.
“The risk premium on the oil price is now likely to be almost $10/bbl,” said analysts at Commerzbank. These factors helped to support oil this week in the face of large surprise crude oil inventory builds in the US. Attention now turns to next week’s OPEC+ meeting where sources have already said the cartel is set to stick to its existing policy of hiking output quotas by 400K barrels per day each month. Market participants remain highly skeptical about the group’s ability (particularly the smaller producers) to keep up with output quota hikes.
- US dollar remains firm across the board, holds onto weekly gains.
- USD/CAD heads for the highest daily close in a month.
The USD/CAD rose earlier on Friday to 1.2796, the highest intraday level since January 6. It then pulled back to the 20-hour SMA at 1.2745, and it is moving again toward the recent top. The key driver continues to the dollar’s rally.
The greenback remains supported by risk aversion and Fed’s tightening expectations. Higher crude oil prices supported the loonie only modestly.
From the level it had a week ago, USD/CAD is up more than 200 pips, having the best performance since August of last year.
After central banks, Jobs data
Despite falling against the US dollar, the loonie is about to post the highest weekly close in more than a year versus AUD and NZD on a risk aversion environment. The Bank of Canada did not hike rates this week, but offered signs that a tightening cycle will begin in March.
The focus across financial markets will likely continue around Wall Street and the US dollar. Regarding data, the key report in the US will be the Non-farm payroll report. After Wednesday’s FOMC meeting, prices are still adapting to the changes in monetary policy expectations.
“Next week, the focus will be on January jobs data in Canada, a chance to measure the impact of Omicron restrictions in the country. Signs of resilience and more wage growth pressure could fuel speculation around a 50bp March hike and support CAD. We expect USD/CAD to stabilise around current levels with more USD strength that should mostly be channelled through weaker low-yielders”, explained analysts at ING.
Technical levels
- USD/CHF has remained well supported above 0.9300, shrugging off strong Swiss data and unreactive to the latest US data dump.
- The pair is trading higher on the week by about 2.2% and trades close to weekly highs in the 0.9330s.
- USD/CHF is now eyeing a test of H2 2021 highs in the 0.9370 area.
USD/CHF has remained well supported to the north of the 0.9300 level on Friday, as has been the case now since prior to Thursday’s US open, as the December highs at 0.9294 offer support. To the upside, technicians will note resistance in the form of weekly highs in the 0.9330s which are likely to cap the price action for the remainder of the week. The pair didn’t react to stronger than expected Swiss KOF Leading Indicator data, which edged higher for the first time since early 2021, nor has it seen much of a reaction to the recent heavy slate of US data.
Admittedly, the buck saw some minor initial weakness following evidence of easing wage pressures after the QoQ inflation rate of the Q4 Employment Cost Index fell more than expected. That may have triggered some momentary dollar profit-taking, but with a larger than expected rise in Core PCE inflation in December and heavy slate of US data next week, it is far to early to say the recent dollar rally is over.
That dollar rally, which was initially triggered on Wednesday after more hawkish than expected remarks from Fed chair Jerome Powell in the post-Fed meeting press conference, has seen USD/CHF surge from under 0.9200 to current levels above 0.9300 since Wednesday. That surge since Wednesday has taken the pair’s on-the-week gains to around 2.2% and has taken the pair to the north of the 0.9100-0.9300 range that had prevailed since the start of December.
USD/CHF is now eyeing a test of H2 2021 highs in the 0.9370 area. If next week’s US data (ISM surveys and the official labour market report) comes in hot and further boosts hawkish Fed bets, bulls will be betting that USD/CHF has a run at the 0.9400 level.
The jump in US short-dated rates on a hawkish Fed has sent EUR/USD to new cycle lows. Economists at ING expect the pair to challenge the 1.10 level as the European Central Bank (ECB) stance does not seem to support the shared currency.
ECB offers little support
“It looks just a matter of time before 1.10 is tested.”
“Ahead of Thursday’s ECB meeting, we’ll get to see 4Q Eurozone GDP data and the January CPI reading. Consensus expects +0.4% QoQ for the Eurozone figure. Eurozone CPI is expected to turn the corner in January at 4.3% YoY as some base effects drop out. Clearer indications that inflation peaked at 5% in December will hardly push the ECB into a more aggressive stance.”
“With the ECB providing no support for short-dated Eurozone interest rates, EUR/USD will remain at the mercy of the re-priced Fed tightening cycle.”
- The NZD is losing 0.53% during the New York session.
- US Core PCE closes to 5%, while Fed tightening conditions spurred market sentiment.
- Tensions in Eastern Europe ease as Russia engages in negotiations with the US.
As the North American session begins, the NZD/USD slides for the seventh straight day, unable to recover from its losses since January 20. At the time of writing is trading at 0.6552. Risk-aversion in the markets keeps safe-haven peers in the bid, while risk-sensitive currencies like the NZD, the AUD, and the GBP, fall.
US Core PCE inflation rises
The US Bureau of Economic Analysis reported on Friday that the Core Personal Consumption Expenditure (PCE) for December, the Fed’s favorite gauge of inflation, rose by 4.9%, 0.1% higher than expected, and left behind the 4.7% reported in November.
Concerns about the US central bank tightening dent the market sentiment
In the meantime, market participants keep digesting the Fed’s awaited change in monetary policy stance. Although the monetary policy statement was viewed as a “hawkish hold,” the initial reaction was no surprise. Nevertheless, Fed’s Chair Powell press conference rocked the boat, saying that “the committee is of a mind to raise the federal funds rate at the March meeting.”
Before Wall Street opened, Minnesota Fed President Neil Kashkari hit the wires. He said that the Fed needs to bring the US economy in balance by raising interest rates. Kashkari noted that the central bank does not know how many increases will take and emphasized that the Fed would be adjusting as more data comes in.
Eastern Europe tensions ease
During the European session, it crossed the wires that Russia is willing to engage with US security proposals and emphasized that it does not want the war over Ukraine, giving a slight relief for investors.
Gold climbed to its highest level since November at $1,853 on Wednesday but ended up losing more than 3% from that level to end the week deep in the negative territory below $1,800. In the view of FXStreet’s Eren Sengezer, XAU/USD is poised for further losses.
Focus shifts to the US January jobs report
“Nonfarm Payrolls are forecast to rise by 238K in January. The low bar suggests that there is room for a positive surprise and a stronger-than-forecast NFP print should favour the dollar in the near-term. On the flip side, a third disappointing reading in a row could weigh on the dollar and open the door for a rebound in XAU/USD.”
“Average Hourly Earnings will be the key data point to watch. On a yearly basis, wage inflation is expected to rise to 5.1% from 4.7%. Fed policymakers are concerned that a steady rise in wages could cause consumer inflation to remain high for a prolonged period. Hence, high wage inflation should be seen as a dollar-positive and vice versa.”
“First support is located at $1,770 (static level). In case this level turns into resistance, the next bearish target could be seen at $1,755 (static level).”
“On the upside, the 100-day SMA forms the first resistance at $1,795. Even if XAU/USD reclaims that level, the 200-day SMA aligns as the next hurdle at $1,805. Only a daily close above the latter could attract buyers and help gold shake off the bearish pressure.”
- DXY comes under pressure near 97.50 on Friday.
- US Core PCE rose more than expected in December.
- Final Consumer Sentiment deflates to 67.2 in January.
The upside momentum in the greenback seems to have run out of some steam after hitting new cycle tops past 97.40 when gauged by the US Dollar Index (DXY).
US Dollar Index capped near 97.50
The index now gives away part of the recent advance along with the loss of upside bias in US yields, particularly in the short end and the belly of the curve.
It seems investors decided to cash out some gains in light of the recent acute move higher in the buck, while market participants continue to recalibrate expectations around the potential moves by the Fed in the next months.
In the US docket, inflation tracked by the Core PCE rose 4.9% YoY in December and 5.8% when it comes to the headline PCE. Further results showed Personal Income and Personal Spending expanding 0.3% MoM and contracting 0.6% MoM in December, respectively. Lastly, the Consumer Sentiment eased a tad to 67.2 in January as per the final U-Mich Index.
US Dollar Index relevant levels
Now, the index is losing 0.01% at 97.19 and a break above 97.44 (2022 high Jan.28) would open the door to 97.80 (high Jun.30 2020) and finally 98.00 (round level). On the flip side, the next down barrier emerges at 96.05 (55-day SMA) seconded by 95.41 (low Jan.20) and then 94.62 (2022 low Jan.14).
Federal Reserve Bank of Minneapolis President Neel Kashkari said on Friday that he expects the Fed to raise rates at the March meeting, in an interview with Yahoo Finance.
Additional Remarks:
"Inflation is higher than I expected, has lasted longer."
"Inflation should start to normalize this year."
"The Fed will do its part."
"I would expect by mid-year inflation will show evidence of trending down."
"We have to see how data plays out."
"Other factors should start to bring inflation down even before the Fed acts."
"The Fed's messaging on rates has already had an effect on the economy."
"The Fed needs to follow through and walk the walk."
"A pause in spring on rate hikes is conceivable."
"Would not be appropriate to signal rate hikes would be gradual or deliberate... too much is outside our control."
"We need more information before we can decide what we'll do a few months from now."
"If inflation comes down faster than we expect, that would be good news, and the Fed would need to do less."
"The Fed has much less influence on long-end of the yield curve."
"Long end of the yield curve is signaling we are probably heading into a period of more modest inflation, growth."
"The yield curve gives us feedback on where we are relative to neutral."
"The yield curve suggests we are not that far away from neutral, not as far as we thought."
"We don't want to slam on brakes."
"Investors have confidence that we are serious about keeping inflation in check."
"The fear of the virus is still keeping people on the sidelines of the workforce."
"China's zero covid policy could affect US supply chains and the global economy."
"It's a very muddy economic picture right now."
"It's unacceptable what took place with Fed policymakers trading during 2020."
"We are committed to re-earning the public's trust, there was damage."
- UoM Consumer Sentiment fell to 67.2 from the flash estimate of 68.7, its lowest reading since 2011.
- There was no market reaction to the latest UoM data.
The University of Michigan's (UoM) final estimate of the Consumer Sentiment Index came in at 67.2 in December, below the flash estimate of 68.7 released earlier in the month, and well below November's reading of 70.6. That marked a fresh low since 2011. The Current Conditions index fell to 72.0 versus expectations for 73.2 and down from November's 74.2 reading, while the Consumer Expectations index fell to 64.1 from 68.3 in November, below the expected 65.8.
Market Reaction
There was no market reaction to the latest UoM data.
S&P 500 remains capped at its 200-day average and the 38.2% retracement of its January collapse at 4434/53. Economists at Credit Suisse continue to view this as a temporary relief bounce only ahead of a retest of the recent low, the 23.6% retracement of the entire 2020/2021 uptrend and the 38.2% retracement of the rally from October 2020 at 4223/4199.
A short-term pause only prior to the risk turning firmly lower again
“Whilst further near-term consolidation should be allowed for, we remain of the view this is a short-term pause only prior to the risk turning firmly lower again.”
“Below 4276 should clear the way for a retest of support at 4223/4199 – the recent low, the 23.6% retracement of the entire 2020/2021 uptrend and the 38.2% retracement of the rally from October 2020. Whilst we will look for evidence of a floor here again, should weakness directly extend we would see scope for further weakness to 4173/64 next, ahead of 4057 and eventually we think more important support at 3855/15.”
“Near-term resistance moves to 4355, then 4374.”
“A close above 4450 remains needed to mark a stabilization and a more prolonged consolidation, with resistance then seen next at 4495.”
In the view of economists at Scotiabank, the EUR/USD pair will remain on a path toward 1.10 as price action points to continued losses to a test of 1.11.
Resistance is located at 1.1150/55
“Support at the intraday low of 1.1120/25 will stand ahead of the figure zone, after which point there are no obvious markers to prevent a decline to 1.10.”
“The week’s losses have left the EUR just shy of oversold on the RSI which may help to ease the currency’s slide and see it settle into a 1.1150/200 consolidation band.”
“Resistance is 1.1150/55 followed by the 1.12 area.”
USD/CAD is poised to close out the week on a firm note nearing 1.28. A break above the 1.2815 would clear the way towards the 1.2950 region, economists at Scotiabank report.
Minor support for the loonie from crude
“Firm commodity prices – with crude heading for a sixth weekly gain – are providing a modest prop for the CAD but near term risks are tilting a bit lower for the currency amid soft risk appetite and a long wait for the March BoC decision.”
“The short-term uptrend has gathered a little more bullish momentum over the past session or two and the USD is within reach of minor resistance at 1.2815 (minor high from January). There is little resistance above there until the 1.2900/50 zone, however – the range highs for spot over the past year.”
“Intraday support is 1.2710/15.”
- GBP/USD has jumped back above 1.3400 in wake of the latest US data dump.
- The dollar has weakened amid profit-taking after data revealed an easing of US wage pressures in Q4.
In wake of the latest US data dump that contained promising signs of easing US wage pressures last quarter, the dollar has seen broad weakness which has helped to propel GBP/USD back above the 1.3400 level. Indeed, the pair recently high session highs in the 1.3420s, where it now trades with modest gains of about 0.3% on the session. Technicians may now look for cable to test resistance in the form of the earlier weekly lows in the 1.3430-50 area, where some swing traders may be tempted to reload short positions.
Despite some profit-taking in wake of the latest US data dump that saw Core PCE and Personal Income/Spending figures print roughly in line with expectations but surprising weakness in Q4 Employment Cost inflation, many buck bulls will remain confident. Indeed, the broader Dollar Index (DXY) is still up about 1.6% on the week (and GBP/USD is down about 1.0% on the week), spurred by Fed tightening bets after Fed Chair Jerome Powell’s hawkish post-policy announcement remarks. As the Fed leaves itself plenty of optionality to tighten at a faster, or slower pace, dependent upon the data, there is plenty of space for further data surprises next week to power further Usd upside.
That suggests downside risks for G10/USD majors, including GBP/USD in the week ahead, with the most important data releases to scrutinise the January ISM surveys and official labour market report. As some strategists talk about a return to GBP/USD to December’s sub-1.3200 lows, note that next week’s BoE meeting may offer some upside risk, given the bank is likely to implement another rate hike and layout quantitative tightening plans.
At the very least, even if the broad dollar rally does power on and drives GBP/USD lower, there is a distinct chance that sterling’s losses against the buck are limited compared to other G10 currencies. That has been the case this week, with GBP down around 1.0% versus the buck, while CAD, JPY and EUR are 1.4-1.6% lower and CHF, NZD and AUD all more than 2.0% lower.
USD/JPY maintains its strong recovery for a break above the recent reaction high at 115.06 to mark a fresh base. As the Credit Suisse analyst team notes, the risk has turned back higher with key resistance seen at 116.35/75.
Support at 114.48 now ideally holds
“USD/JPY above 115.06 sees a base established to clear the way for strength back to 116.35/75, then the long-term downtrend from April 1990 at 116.75.”
“Whilst a fresh cap at 116.75 should be allowed for, with a major base established last year we continue to look for an eventual clear break above 116.75 in due course. This should then clear the way for a move to the 118.61 highs of late 2016/early 2017.”
“Support moves to 115.16/06 initially, then 114.49, with 114.48 now ideally holding to keep the immediate risk higher. Below would warn of further ranging and a fall back to 113.78.”
Argentine President Alberto Fernandez announced on Friday that they have reached an agreement with the International Monetary Fund to revamp the debt of over $40 billion that the country has been struggling to pay, as reported by Reuters.
"The agreement does not condition Argentina's economic policies nor impose reaching 'zero deficit'," Fernandez added and said that they will send the agreement to Congress for approval.
Commenting on this development, Argentina's Economy Minister Martín Guzmán explained the agreement with the IMF involves an economic framework and measures that promote the country's growth. "There will be no sudden exchange rate shock," Guzmán further noted. "International reserves expected to grow by $5 billion in 2022."
- EUR/USD manages to rebound from 2022 lows.
- US Core PCE rose 4.9% YoY in December, more than estimated.
- US final Consumer Sentiment is due next in the docket.
After bottoming out inf the 1.1120 region, or new YTD lows, EUR/USD regains some composure and returns to the positive territory near 1.1160 at the end of the week.
EUR/USD looks contained near 1.1100
EUR/USD now reverses part of the recent intense selloff and regains the 1.1150/60 band on the back of the knee-jerk in the greenback.
Indeed, the US Dollar Index (DXY) trims earlier gains along with the loss of upside momentum in yields in the short end of the curve, which came under pressure after hitting 2-year peaks near 1.23%.
The pullback in the dollar came after US inflation figures measured by the Core PCE rose 4.9% YoY in December, more than initially estimated, while the headline PCE gained 5.8% from a year earlier. Additionally, Personal Income expanded 0.3% MoM in the same period and Personal Spending contracted 0.6% MoM.
Later in the session, the final Consumer Sentiment print for the month of January will close the weekly calendar.
EUR/USD levels to watch
So far, spot is up 0.10% at 1.1156 and faces the next up barrier at 1.1308 (55-day SMA) seconded by 1.1369 (high Jan.20) and finally 1.1450 (100-day SMA). On the other hand, a break below 1.1121 (2022 low Jan.28) would target 1.1100 (round level) en route to 1.1000 (psychological level).
- USD/JPY witnessed some profit-taking from a near three-week high touched earlier this Friday.
- The USD retreated from the highest level since July 2020 after the release of the PCE Price Index.
- The risk-off mood benefitted the safe-haven JPY and further contributed to the intraday decline.
The USD/JPY pair surrendered its intraday gains to a near three-week high and retreated back below mid-115.00s, or the lower end of its daily trading range during the early North American session.
The pair build on its solid rebound from a two-month low, around the 113.45 region touched earlier this week and gained some follow-through traction on Friday. The momentum was sponsored by the sustained US dollar buying, bolstered by expectations that the Fed will tighten its monetary policy at a faster pace than anticipated to contain stubbornly high inflation.
In fact, the markets have started pricing in the possibility of five quarter-point rate hikes by the end of 2022 and also expect that the first hike in March could be 50 basis points. The bets were reinforced by Friday's data, showing that the Fed's preferred inflation gauge – Core PCE Price Index – rose 0.5% MoM in December and the yearly rate climbed to 4.9% from 4.7%.
The USD, however, witnessed some profit-taking from the highest level since July 2020 touched earlier this Friday. On the other hand, the prevalent risk-off mood drove some haven flows towards the Japanese yen. The combination of factors prompted some long-unwinding around the USD/JPY pair led to an intraday pullback of over 50 pips from the 115.65-115-70 area.
That said, the Fed's more hawkish stance, along with elevated US Treasury bond yields should continue to act as a tailwind for the greenback. This, along with the recent widening of the US-Japanese bond yield spread, should help limit any meaningful corrective slide for the USD/JPY pair, rather attract some dip-buying at lower levels.
Hence, it will be prudent to wait for a strong follow-through selling before confirming that the post-FOMC rally has run out of steam and placing any bearish bets around the USD/JPY pair. Nevertheless, the pair remains on track to post strong weekly gains, snapping two successive weeks of the losing streak.
Technical levels to watch
Federal Reserve Bank of Minneapolis President Neel Kashkari said that the Fed needs to bring the US economy back into balance by raising interest rates a little bit. We don't know how many interest rates hikes it will take, he added, saying that we (the Fed) are adjusting as the data comes in.
Market Reaction
There was no reaction to Kashkari's remarks.
- Personal Income rose 0.3% MoM in December, below expected, while Personal Spending fell 0.6% MoM as expected.
- The DXY has seen some weakness, which analysts said reflected weaker Q4 US wage data released at the same time.
US Personal Income rose by 0.3% MoM in December, below expectations for a 0.5% MoM rise, according to a report released on Friday by the Bureau of Economic Analysis and Department of Commerce. That marked a slight deceleration from November's 0.5% MoM growth rate. Meanwhile, Personal Spending fell by 0.6% in December, in line with expectations for a 0.6% MoM drop, confirming a deceleration from November's 0.4% MoM positive growth rate.
Market Reaction
Broadly in line with expected Personal Income and Spending figures don't seem to have impacted FX markets. The dollar has eased in wake of the latest data dump, where the focus has been on a larger than expected deceleration in the US Q4 Employment Cost Index inflation rate. The data has been interpreted as easing the pressure on the Fed to aggressively hike interest rates this year to tame labour market inflationary pressures and short-end US yields have seen a sharp pullback, weighing on the buck.
- Core PCE inflation came in a little above expected at 4.9% in December.
- The DXY has seen some weakness, which analysts said reflected weaker Q4 US wage data released at the same time.
Inflation in the US, as measured by the Core Personal Consumption Expenditures (PCE) Price Index, rose to 4.9% YoY in December, the US Bureau of Economic Analysis reported on Friday. That was slightly above the consensus forecast for an inflation rate of 4.8% and marked a slight acceleration from November's Core PCE inflation rate of 4.7%. The MoM rate of Core PCE inflation was 0.5% in December, in line with expectations and unchanged from November's inflation rate. Core PCE is the Fed's favoured measure of underlying inflation.
Market Reaction
Despite the headline YoY rate of Core PCE coming in a little hotter than expected for December, the DXY has seen a slight pullback in recent trade, dipping back into the 97.10s from close to 97.40 prior to the data. Some analysts have said this could be a reflection of weaker than expected US Q4 Employment Cost Index data, which was released at the same time as the Core PCE data at 1330GMT. The Index rose 1.0% QoQ last quarter, below expectations for an inflation rate of 1.2% and below Q3's 1.3% rate.
- Silver witnessed some follow-through selling for the sixth successive day on Friday.
- The technical set-up favours bearish traders and supports prospects for further losses.
- Any attempted recovery could now be seen as a selling opportunity and remain capped.
Silver extended its recent rejection slide from the very important 200-day SMA and continued losing ground for the sixth successive day on Friday. The white metal remained depressed heading into the North American session and was last seen trading around mid-$22.00s or a near three-week low.
The overnight breakthrough the 50% Fibonacci retracement level of the $21.43-$24.70 strong move up and a subsequent slide below last week's swing low, around the $22.80 area, favours bearish traders. The negative outlook is reinforced by the fact that oscillators on the daily chart have been gaining negative traction and are still far from being in the oversold territory.
Hence, some follow-through weakness towards testing the next relevant support, around the $22.20 region, remains a distinct possibility. This is followed by the monthly low, around the $22.00-$21.95 area. Failure to defend the mentioned support levels will be seen as a fresh trigger for bearish traders and set the stage for a further near-term depreciating move for the XAG/USD.
On the flip side, attempted recovery might now confront immediate resistance near the $22.80 region ahead of the $23.00 mark, or the 61.8% Fibo. level. Any further move up might still be seen as a selling opportunity and runs the risk of fizzling out rather quickly. This, in turn, should cap the upside for the XAG/USD near the 50% Fibo. level resistance, around the $23.30 region.
Silver daily chart
-637789726909460505.png)
Technical levels to watch
- Spot gold is a little lower ahead of a US data dump, trading about 0.3% lower around $1790.
- That leaves the precious metal a few bucks above annual lows.
- Analysts warn that strong US data could feed the Fed tightening narrative and push gold towards support around $1750.
Spot gold (XAU/USD) prices are currently holding up above support in the form of the annual lows at $1782 as attention turns to an imminent US data dump at 1330GMT. December Core PCE inflation, December Personal Income and Spending and Q4 Employment Cost data will all be released. On the day, gold prices are nonetheless trading in heavy fashion, and currently trade about 0.3% lower around the $1790 mark, leaving them on course to post a third successive negative session.
The dollar remains perky on Friday with the DXY at fresh multi-month highs near 97.50 and on course for its largest one-week rise in seven months, which, combined with higher US yields across the curve, has been weighing on gold. Spot prices are now down about 2.5% on the week and more than 3.5% lower versus their pre-hawkish Fed levels. Analysts note that if the upcoming data releases (most importantly, the inflation data) feed into the narrative of more aggressive/front-loaded Fed tightening, thus further boosting the buck and yields, gold remains vulnerable to further losses.
That logic applies not only to the upcoming data on Friday, but also to next week’s data. Looking at XAU/USD from a technical perspective, its recent break below a medium-term upwards trend channel on Thursday that also saw the precious metal break below its 200-day moving average just above $1800 suggests further selling in on the cards. Bears will be looking for a test of recent November/December lows in the $1750 area.
Will central banks have to react to the inflation that will result from the energy transition? Economists at Natixis believe the answer is clearly no. A hike in central bank interest rates in response to this inflation would be absurd.
The energy transition will require massive additional investment
“Raising interest rates in response to inflation would reduce energy demand somewhat but would not change the fact that the cost of producing energy is higher. It is not excess energy demand that causes inflation, but the change in energy production technology.”
“The energy transition will require very significant investments, some of which have low financial returns (thermal renovation of housing, decarbonisation of industry). This will be all the easier as long-term interest rates remain low: raising interest rates in response to inflation would prevent these investments from being made.”
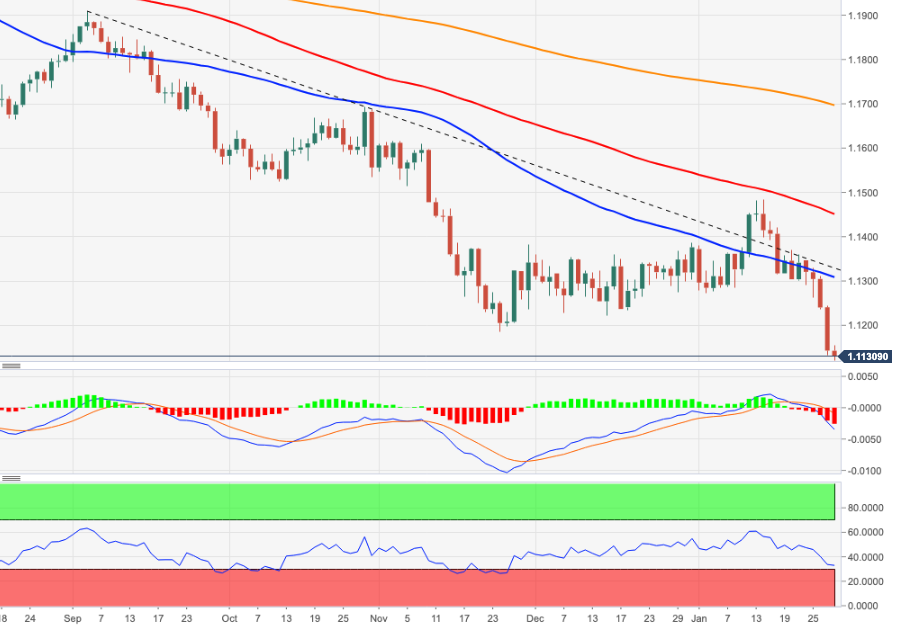
- EUR/USD sheds further ground and drops to new lows near 1.1120.
- A deeper pullback could expose a test of the 1.10 mark.
EUR/USD remains well under pressure and tumbles to the low-1.1100s, an area last visited in June 2020, on Friday.
Further downside appears likely in light of the ongoing price action. Against this, the next support could turn up at the round levels at 1.1100 and 1.1000, all ahead of May 2020 low at 1.0766 (May 7).
Extra losses in the pair remains well on the cards as long as it remains capped by the 4-month resistance line, today near 1.1340.
In the longer run, the negative outlook is seen unchanged below the key 200-day SMA at 1.1700.
EUR/USD daily chart
US PCE Price Index Overview
Friday's US economic docket highlights the release of the November Personal Consumption Expenditure (PCE) Price Index, scheduled later during the early North American session at 13:30 GMT. The headline gauge is expected to have edged lower to 0.5% in December from 0.6% previous, while the yearly rate is seen rising to 6.1% from 5.7% in November. The core reading is forecast to come in at 0.5% for the reported month and rise from a 4.8% YoY rate from 4.7%.
How Could it Affect EUR/USD?
A strong than expected reading will boost bets for a 50 bps Fed rate hike in March and push the US Treasury bond yields/US dollar higher. Conversely, a softer print might do little to derail the Fed's plan for an eventual liftoff in March or dent the prevalent strong bullish sentiment surrounding the buck. This, in turn, suggests that the path of least resistance for the EUR/USD pair is to the downside.
Meanwhile, Eren Sengezer, Editor at FXStreet, offered a brief technical outlook for the major: “the pair continues to show extremely oversold conditions with the Relative Strength Index (RSI) staying way below 40. Furthermore, EUR/USD is trading below the descending regression channel coming from mid-January. Even if the pair were rise above 1.1150 and return within the descending channel, sellers are likely to remain in control as long as the 1.1220 (upper limit of the descending channel) resistance holds..”
“On the downside, 1.1100 (psychological level) aligns as the next support. Back in January 2020, EUR/USD extended its decline to 1.1000 after it broke below 1.1100 and a similar action could be expected in the short term,” Eren added further.
Key Notes
• US PCE Inflation Preview: Dollar rally has more legs to run
• EUR/USD Forecast: No convincing recovery in sight for euro
• Further weakness lies ahead for EUR/USD – UOB
About the US PCE Price Index
The Personal Spending released by the Bureau of Economic Analysis, Department of Commerce is an indicator that measures the total expenditure by individuals. The level of spending can be used as an indicator of consumer optimism. It is also considered as a measure of economic growth: While Personal spending stimulates inflationary pressures, it could lead to raise interest rates. A high reading is positive (or Bullish) for the USD.
- EUR/GBP is flat in the 0.8320s as FX markets head into the weekend in a calmer mood.
- Looking ahead to next week, ECB and BoE policy meetings will dominate the headlines and the price action.
EUR/GBP trades flat on the day in the 0.8320s, just above multi-year lows just above the key 0.8300 level and late-2019/early-2020 lows around 0.8280. The pair has ignored the latest mixed Eurozone GDP numbers, which saw France and Spain both post better than expected QoQ Q4 growth rates of 0.7% and 2.0% respectively, whilst Germany saw a larger than expected QoQ contraction of 0.7%. GDP data aside, the Eurozone data slate has been heavy, with the latest European Commission Business and Consumer sentiment survey coming in a little weaker than expected in January and at its lowest since last April.
Elsewhere, the YoY rate of M3 money supply growth was a tad stronger than expected, whilst Import price growth in Germany slowed significantly more than expected in December. As with the GDP data, other releases were also ignored (hence why EUR/GBP is flat), as FX markets see some pre-weekend calm after a volatile week. On which note, EUR/GBP currently trades roughly 0.5% lower on the week and is currently about 1.2% below Monday’s highs in the 0.8420s, the pair reversing lower as FX market focus switched from risk-off to central bank divergence.
On which note, central banks will be a key theme for EUR/GBP traders next week with the BoE and ECB both announcing policy decisions next Thursday. No policy or guidance changes are expected from the latter, but the BoE is now near-unanimously expected to hike rates by 25bps to 0.5% and kick off a discussion on (or even kickstart) outright quantitative tightening (QT) that is likely to begin with ending reinvestments. Recall that the BoE said last year that when rates reached 0.5%, QT could begin. Many FX strategists expect this divergence to continue to drive EUR/GBP lower in the short-term and are targetting the multi-year lows in the 0.8280 area.
Risk appetite has been choppy and shakey this week and another sharp downturn, perhaps if strong US data triggers further hawkish Fed bets, presents some upside risk to the pair. Other things for investors to watch will be flash Eurozone January Consumer Price Inflation data in the early part of the week and German Factory Orders data on Friday.
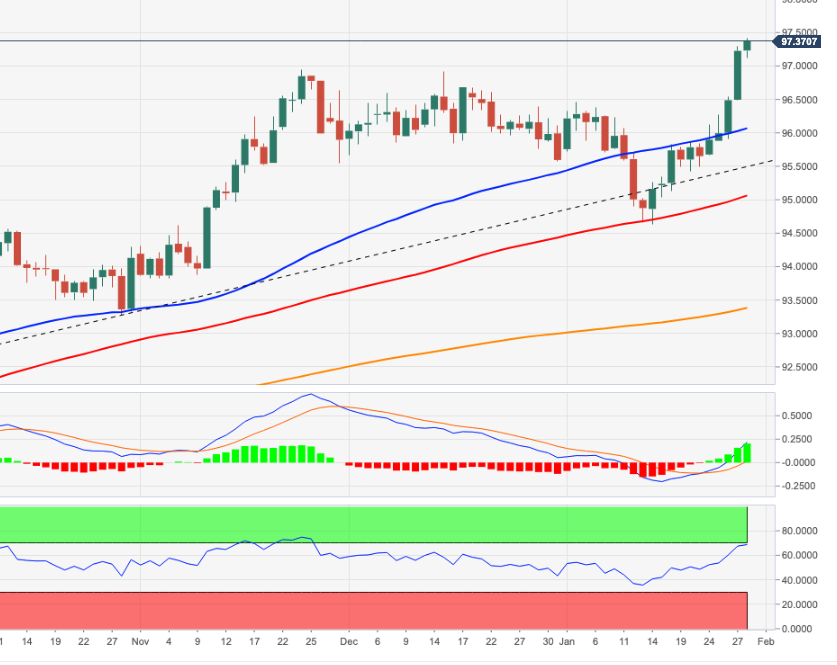
- DXY records new cycle tops near 97.40 on Friday.
- Next on the upside is seen the June 2020 high at 97.80.
DXY pushes higher and clinches fresh highs in levels last seen in June 2020 in the 97.40/45 band on Friday.
The intense upside in the dollar quickly left behind the 97.00 barrier and remains well poised to extend the leg higher in the short-term horizon. That said, the door now remains open to a potential move to the June 2020 peak at 97.80 (June 30) ahead of the round level at 98.00.
In the short-term horizon, the upside pressure remains intact while above the 4-month line near 95.50. Looking at the broader picture, the longer-term positive stance in the dollar remains unchanged above the 200-day SMA at 93.35.
DXY daily chart
Senior Economist at UOB Group Alvin Liew comments on the last FOMC event (January 26).
Key Takeaways
“The Jan 2022 FOMC was seen as visibly hawkish as the Fed signaled clearly that the first policy rate hike will take place in the upcoming 15/16 March FOMC. Adding to the hawkish bias was the Fed’s opaqueness about the policy rate trajectory.”
“The FOMC statement also confirmed that the asset purchase program (QE) tapering will be further reduced in Feb 2022 (increase its holdings of Treasury securities by at least $20 billion per month and of agency mortgage-backed securities by at least $10 billion per month) and be completed by early Mar 2022, before the 15/16 March FOMC.”
“The FOMC also released a document titled the “Principles for Reducing the Size of the Federal Reserve's Balance Sheet” of which the FOMC members affirmed that the Federal funds rate remains the primary tool for the Fed’s monetary policy… Powell during the press conference said no decision was taken at the Jan FOMC meeting on the pace of the balance sheet runoff or when it would start, adding that the Fed will discuss balance sheet at next two meetings.”
“FOMC Outlook: We now expect the first Fed funds target rate (FFTR) hike will be in Mar 2022 FOMC by 25bps to 0.25-0.50%, followed by 3 more 25bps hikes in Jun 2022, Sep 2022 and Dec 2022, bringing the FFTR to the range of 1.0-1.25% by end of 2022. Risks are evidently skewed toward more aggressive and frequent Fed hikes in 2022, and will largely depend on the inflation path, especially if price increase accelerates significantly in 1Q due to Omicron-related factors, wage increases and inflation expectations. That said, Powell did note that Omicron will surely weigh on 1Q 2022 GDP growth and that makes us hesitate to call for a more aggressive opening hike.”
- AUD/USD extended its recent downfall and dived to the lowest level since July 2020 on Friday.
- The Fed's hawkish stance, elevated US bond yields underpinned the USD and exerted pressure.
- The risk-off mood further contributed to driving flows away from the perceived riskier aussie.
The AUD/USD pair continued losing ground through the mid-European session and dropped to its lowest level since July 2020, around the 0.6970-0.6965 region in the last hour.
Following an early uptick to the 0.7045 area, the AUD/USD pair met with a fresh supply on the last day of the week and prolonged its recent rejection slide from the 100-day SMA. This marked the third successive day of a negative move – also the fifth in the previous six – and was sponsored by a combination of factors.
The US dollar remained well supported by expectations for a more aggressive policy response by the Fed to contain stubbornly high inflation. In fact, the markets have started pricing in the possibility of five quarter-point rate hikes by the end of 2022 and also expect that the first hike in March could be 50 basis points.
This was reinforced by a fresh leg up in the US Treasury bond yields, which continued acting as a tailwind for the buck. Apart from this, the risk-off mood – as depicted by a weaker tone around the equity markets – further benefitted the safe-haven greenback and drove flows away from the perceived riskier aussie.
The combination of negative forces contributed to the AUD/USD pair's ongoing decline, taking along some short-term trading stops placed near the key 0.7000 psychological mark. Hence, the latest leg down witnessed over the past hour or so could further be attributed to some technical selling below the mentioned handle.
It will now be interesting to see if the AUD/USD pair is able to find any support at lower levels amid slightly oversold conditions on short-term charts. Market participants now look forward to the US macro data – the Core Personal Consumption Expenditure Price index and revised Michigan Consumer Sentiment Index – for a fresh impetus.
Technical levels to watch
- EUR/JPY extends the erratic performance so far this week.
- The cross appears supported around 128.20.
EUR/JPY regains upside traction and leaves behind Thursday’s pullback.
In light of the recent price action, the cross seems to have moved into a consolidative phase, with support emerging around 128.20 for the time being. On the upside, there is a temporary and initial hurdle at the 55-day SMA at 129.29. The surpass of the latter could alleviate the downside pressure and allow for a probable move to the more relevant 200-day SMA.
While below the 200-day SMA AT 130.48, the outlook for the cross is expected to remain negative.
EUR/JPY daily chart
UOB Group’s Senior Economist Julia Goh and Economist Loke Siew Ting review the latest GDP figures in the Philippines.
Key Takeaways
“The Philippines’ economy recovered at a faster-than-expected pace of 7.7% y/y in 4Q21 (UOB est: +7.0%; Bloomberg est: +6.3%; 3Q21: +6.9%), bolstered by all sectors and resilient household consumption. For the full year of 2021, GDP expanded by 5.6%, in line with our projection of 5.5% (official est: 5.0%-5.5%; 2020: -9.6%).”
“Notwithstanding a stronger growth rebound in 4Q21, we maintain our 2022 full-year GDP growth forecast at 6.5%, lower than the government’s 7.0%-9.0% target, as the growth outlook remains subject to downside risks. Downside risks could arise from the pandemic, prolonged global supply chain bottlenecks, softening global growth momentum, tighter global financial conditions, and domestic policy uncertainty post the presidential elections on 9 May.”
“Although BSP has inclined to err on the side of sustaining growth rather than fighting transitory inflation, the Fed’s abrupt shift in policy since Dec 2021 has piled pressure on other central banks including BSP to embark on a wider normalization path this year. Following our revised Fed outlook this morning (27 Jan, see details in report), we are now expecting BSP to raise policy rate twice this year (+25bps each in 3Q22 and 4Q22), versus our previous forecast of just one 25bps hike in 3Q22. This will bring the overnight reverse repurchase rate to 2.50% by end-2022 (from 2.00% currently).”
UOB Group’s FX Strategists now see the upside momentum lifting USD/CNH to the 6.3975 level in the next weeks.
Key Quotes
24-hour view: “While we detected the ‘build-up in momentum’ yesterday and expected USD to advance, we were of the view that ‘the resistance at 6.3555 may not be easy to break’. However, USD has no problem cracking 6.3555 as it rocketed to 6.3755 before easing. The advance is deeply overbought but there is room for USD to test 6.3800 before easing. The next resistance at 6.3975 is unlikely to come into the picture for now. Support is at 6.3600 followed by 6.3530.”
Next 1-3 weeks: “Yesterday (27 Jan, spot at 6.3425), we indicated that the recent weak phase in USD has ended. We noted shorter-term upward momentum is beginning to build but USD has to clear 6.3555 before a sustained advance is likely. We did not anticipate the rapid upward acceleration as USD lifted off and closed sharply higher (+0.47%). Strong boost in momentum is likely to lead to further USD strength. Next resistance level of note is at 6.3975. The upside risk is intact as long as USD does not move below 6.3490 (‘strong support’ level was at 6.3270 yesterday).”
- Gold continued losing ground for the third straight day and dropped to a three-week low.
- The Fed's hawkish stance, elevated US bond yields, stronger USD contributed to the slide.
- The prevalent risk-off mood could help limit any further losses for the safe-haven metal.
Gold extended the post-FOMC decline and witnessed some follow-through selling for the third successive day on Friday. The bearish pressure remained unabated through the first half of the European session and dragged spot prices to a fresh three-week low, around the $1,790 region.
The Fed took a more hawkish stance on Wednesday and indicated that it could raise interest rates at a faster pace than anticipated to contain surging inflation. The money market was quick to react and started pricing in the possibility of five quarter-point rate hikes by the end of 2022. Short-term interest rate futures also imply a 20% risk that the first hike in March could be 50 basis points. This, in turn, pushed the 2-year US government bond yields, which is more sensitive to rate hike expectations, to a 23-month high and continued driving flows away from the non-yielding gold.
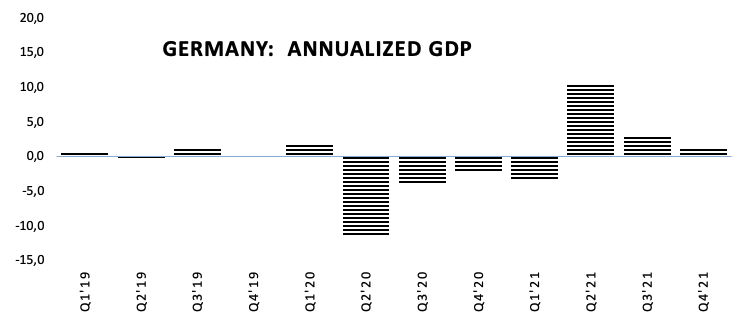
Expectations for a more aggressive policy response by the Fed, along with elevated US Treasury bond yields pushed the US dollar to the highest level since July 2020. The greenback was further underpinned by Thursday's release of the Advance US GDP report, which showed that the world's largest economy grew at a 6.9% annualize pace during the fourth quarter. For 2021 as a whole, the economy expanded by 5.8% and notched its strongest growth in nearly four decades. A stronger buck was seen as another factor that exerted pressure on the dollar-denominated gold and contributed to the decline.
Apart from this, Friday's downfall could further be attributed to some technical selling on a sustained break below the $1,800 round-figure mark. That said, the prevalent risk-off mood – amid concerns about a potential armed conflict in Ukraine – could hold back bearish traders and limit losses for the safe-haven gold. Traders now eye US macro releases – the Core Personal Consumption Expenditure Price index and revised Michigan Consumer Sentiment Index – for a fresh impetus. Nevertheless, the XAU/USD remains on track to record its worst weekly slide since late November.
Technical outlook
From a technical perspective, gold has now confirmed a near-term bearish break below an upward sloping trend-line extending from the August 2021 swing low. This, in turn, supports prospects for a further depreciating move. The negative outlook is reinforced by bearish technical indicators on the daily chart, which are still far from being in the oversold territory. Hence, a subsequent fall towards the $1,785 intermediate support, en-route the $1,770-$1.768 region, remains a distinct possibility.
On the flip side, attempted recovery moves might now confront stiff resistance near the mentioned ascending trend-line support breakpoint, around the $1,798 region. Any further move up could be seen as a selling opportunity and remain capped near the very important 200-day SMA, currently around the $1,805 area. The latter should act as a pivotal point for traders, which if cleared decisively might trigger a short-covering move towards the $1,830-$1,832 static resistance.
Gold daily chart
-637789631161781321.png)
Levels to watch
- Euro area consumer and business sentiment deteriorated slightly in January.
- EUR/USD continues to trade in the negative territory below 1.1150.
The monthly data published by the European Commission showed on Friday that the Economic Sentiment Indicator (ESI) eased further in January in both the EU (-1.4 points to 111.6) and the euro area (-1.1 points to 112.7). The market expectation was for the ESI to improve to 114.5 in the euro area.
Further details of the publication revealed that Industrial Confidence declined to 13.9 in the euro area from 14.6 and Services Sentiment edged lower to 91. from 10.9. Both of these prints came in worse than analysts' estimates.
Finally, Consumer Confidence fell by 0.4 points to -8.5, slightly weaker than the flash estimate of -8.4.
Market reaction
The shared currency showed no immediate reaction to these figures. As of writing, the EUR/USD pair was down 0.1% on a daily basis at 1.1132.
USD/INR has enjoyed a four-day winning streak though is retreating from five-week highs of 75.31 on Friday. Still, economists at Société Générale expect the pair to test the 75.50/70 region.
Revisit of 75.50/75.70 on the cards
“A quick rebound is under way and it could retest graphical levels of 75.50/75.70.”
“Only a break below 200-DMA at 74.30 would denote a deeper pullback.”
- EUR/USD extends the downside to 1.1120 on Friday.
- German Q4 GDP expanded 1.4% YoY, contracted 0.7% QoQ.
- US PCE, Consumer Sentiment next of relevance in the NA session.
The single currency extends the weakness for yet another session and drags EUR/USD to fresh lows in the 1.1120 region at the end of the week.
EUR/USD remains weak post-FOMC
EUR/USD sheds ground for the fifth consecutive session on Friday, dropping to levels last traded in June 2020 in the 1.1130/20 band and always on the back of the intense rally in the greenback.
Indeed, the strong upside in the greenback remains bolstered by the firm sentiment sparked following the FOMC gathering on Wednesday, which lent extra wings to the buck and propelled the US Dollar Index to new cycle highs.
In the domestic calendar, the German economy expanded at an annualized 1.4% in the October-December period and contracted 0.7% inter-quarter, as per the release of the GDP figures. In addition, ECB’s M3 Money Supply expanded 6.9% in the year to December.
In the NA session, the inflation figures gauged by the PCE will take centre stage seconded by the final U-Mich Index and Personal Income/Spending.
What to look for around EUR
The selloff in EUR/USD remains unabated and the pair now approaches the 1.1100 level amidst the relentless march north in the dollar. Moving forward, dark clouds seem to be piling up when it comes to the outlook for the pair, particularly in light of the Fed’s imminent start of the tightening cycle vs. the accommodative-for-longer stance in the ECB, despite the high inflation in the euro area is not giving any things of cooling down for the time being. On another front, the unabated advance of the coronavirus pandemic remains as the exclusive factor to look at when it comes to economic growth prospects and investors’ morale in the region.
Key events in the euro area this week: Germany Advanced Q4 GDP, EMU Final Consumer Confidence (Friday).
Eminent issues on the back boiler: Asymmetric economic recovery post-pandemic in the euro area. ECB stance/potential reaction to the persistent elevated inflation in the region. ECB tapering speculation/rate path. Italy elects President of the Republic in late January. Presidential elections in France in April.
EUR/USD levels to watch
So far, spot is losing 0.10% at 1.1134 and faces the next up barrier at 1.1307 (55-day SMA) seconded by 1.1369 (high Jan.20) and finally 1.1450 (100-day SMA). On the other hand, a break below 1.1121 (2022 low Jan.28) would target 1.1100 (round level) en route to 1.1000 (psychological level).
In order to counter the impact of coronavirus lockdowns and a property sector downturn on the economy, China’s government should ramp up fiscal spending, the International Monetary Fund (MF) said in its annual report on the country’s economy.
Key takeaways
The economic recovery “lacks balance and momentum has slowed, reflecting the rapid withdrawal of fiscal support, lagging consumption amid recurrent COVID-19 outbreaks despite a successful vaccination campaign, and slowing real-estate investment.”
“The combination of more frequent outbreaks and a zero-Covid tolerance approach has forced China’s economic activity into a stop-and-go pattern” and this could “further delay the recovery in private demand.”
“The IMF has no reason to expect that coronavirus outbreaks will become any less frequent this year.”
“This is one of the big reasons we have lowered our forecast for the year.”
“The government should prioritize spending on “targeted direct income support” instead of infrastructure investment.”
- USD/CAD gained traction for the third straight day and climbed to over a three-week high.
- The post-FOMC USD rally remained uninterrupted and remained supportive of the move.
- Retreating oil prices undermined the loonie and provided an additional boost to the pair.
The USD/CAD pair scaled higher through the first half of the European session and shot to an over three-week high, around the 1.2775 region in the last hour.
A combination of supporting factors assisted the USD/CAD pair to reverse an intraday dip to the 1.2710 area and turn positive for the third successive day on Friday. Crude oil prices pulled away from a fresh seven-year high touched in the previous day and undermined the commodity-linked loonie. This, along with the prevalent strong bullish sentiment surrounding the US dollar, continued extending support to the major.
In fact, the USD Index built on its post-FOMC momentum and climbed to the highest level since July 2020 amid expectations that the US central bank will tighten its policy at a faster pace. The money markets have been pricing in the possibility of five quarter-point hikes by the end of 2022. Moreover, interest rate futures imply a 20% risk that the first hike in March could be 50 basis points, which acted as a tailwind for the buck.
On the other hand, the Canadian dollar was weighed down by the not so hawkish Bank of Canada rate decision on Wednesday to leave the benchmark interest rate unchanged. This might have disappointed some market participants anticipating an imminent start of the tightening cycle amid a surge in domestic inflation to a three-decade high. Adding to this, the Canadian central bank also lowered its inflation and growth forecasts.
With the latest leg up, the USD/CAD pair has now rallied over 300 pips from the 1.2450 support zone, or over a two-month low touched last week. Acceptance above the 1.2700 mark and the subsequent move up supports prospects for additional gains. The positive outlook is reinforced by bullish oscillators on the daily chart. Hence, a further near-term appreciating move, towards reclaiming the 1.2800 mark, remains a distinct possibility.
Market participants now look forward to the US economic docket – featuring the release of the Core Personal Consumption Expenditure Price Index and revised Michigan Consumer Sentiment Index. This, along with the US bond yields, will influence the USD. Apart from this, oil price dynamics should provide some impetus to the USD/CAD pair.
Technical levels to watch
GBP/USD suffered heavy losses on Thursday. The 1.3300 level is seen as the next bearish target – removal of which would open up 1.3160/1.3130, economists at Société Générale report.
Test of 1.3300 is likely
“GBP/USD could drift towards next potential support at 1.3300, the 76.4% retracement from December.”
“Failure to hold 1.3300 will mean a retest of December low near 1.3160/1.3130.”
EUR/USD has broken the trend line drawn since November (1.1270/1.1300) resulting in regain of downward momentum. While below here, the world’s most popular currency pair could sustain further losses towards 1.1040, economists at Société Générale report.
Initial resistance seen at 1.1210
“Daily MACD is at a higher level as compared to November denoting positive divergence however signals of rebound are still not visible.”
“Failure to reclaim 1.1270/1.1300 can lead to continuation in downtrend. Next objectives are located at 1.1125/1.1085 and projections of 1.1040.
“First resistance is at 1.1210, the 23.6% retracement of last bout of down move.”
Russian Foreign Minister Sergei Lavrov on Friday that “there will be no war with Ukraine but we will not allow to ignore our interest.”
Additional quotes
The US proposals were better than proposals received from NATO.”
“Expect to meet US Secretary of State Antony Blinken in the next couple of weeks.”
“President Vladimir Putin would decide how to respond to the proposals.”
These comments come as tensions between Moscow and Kyiv are at their highest in years, with a large Russian troop stationed near the shared borders of the two countries.
Lavrov said Thursday, the written responses presented by the US and NATO to Russia's security demands fail to address Moscow's concerns over the eastward expansion of the military alliance, per CNN News.
Market reaction
The risk sentiment is deteriorating, as the Fed rate hike concerns continue to haunt markets ahead od the US PCE inflation release.
The S&P 500 futures pare gains to now trade at 4,329 while the US dollar index clinches fresh multi-month peaks of 97.42, as of writing.
The European Central Bank (ECB) is likely to deliver its first post-pandemic interest rate hike in September 2023, six months after it brings an end to its quantitative easing (QE) programme, the latest Bloomberg survey of economists showed on Friday.
Key findings
“Most survey participants said consumer-price growth in the region -- at 5% now -- will likely settle below the ECB’s 2% target next year.”
“Analysts in the survey only see a 10-basis-point increase in the deposit rate -- currently at -0.5% -- in September 2023.”
“Official projections published in December anticipate price growth of 3.2% in 2022 and 1.8% in both 2023 and 2024.”
“More than half of survey respondents said these expectations are “likely” or “highly likely” to pan out. Just over a third said it’s an “unlikely” or “highly unlikely” scenario.”
- German GDP arrives at -0.7% QoQ in Q4 vs. -0.3% expected.
- Annualized German GDP stands at 1.4% in Q4 vs. 1.8% expected.
- EUR/USD unmoved on discouraging German Q4 growth numbers.
The German economy shrunk by 0.7% inter-quarter in the fourth quarter of 2021 when compared to the expectations of -0.3% and 1.7% booked in Q3, the preliminary report published by Destatis showed on Friday.
Meanwhile, the annualized GDP rate dropped to 1.4% in Q4 against the previous reading of 2.5% while missing the market expectations of a 1.8% figure.
EUR/USD unfazed by poor data
EUR/USD remains little affected by the below-forecasts German growth numbers.
The major was last seen trading at 1.1138, slightly off the 19-month lows of 1.1122 while losing 0.06% on the day.
About German Prelim GDP
The Gross Domestic Product released by the Statistisches Bundesamt Deutschland is a measure of the total value of all goods and services produced by Germany. The GDP is considered as a broad measure of German economic activity and health. A high reading or a better-than-expected number has a positive effect on the EUR, while a falling trend is seen as negative (or bearish).
- GBP/USD failed to preserve its modest intraday recovery gains to the 1.3415 region.
- The prevalent bullish sentiment surrounding the USD acted as a headwind for the pair.
- BoE rate hike bets might help limit any deeper losses for the major, at least for now.
The GBP/USD pair surrendered its modest intraday gains and retreated to the lower end of its daily trading range, around the 1.3370 region during the early European session.
The pair struggled to capitalize on its attempted recovery move and met with a fresh supply near the 1.3415 region on Friday amid the prevalent bullish sentiment surrounding the US dollar. In fact, the USD Index shot to the highest level since July 2020 amid expectations that the Fed will tighten its monetary policy at a faster pace than anticipated.
The markets have started pricing in the possibility of five quarter-point hikes by the end of 2022. Moreover, short-term interest rate futures imply a 20% risk that the first hike in March could be 50 basis points. The buck was also underpinned by Thursday's US Q4 GDP report, showing that the economy expanded by 6.9% annualized pace as against 5.5% expected.
On the other hand, the British pound was weighed down by growing demands for UK Prime Minister Boris Johnson's resignation over a series of lockdown parties in Downing Street. This was seen as another factor that acted as a headwind for the GBP/USD pair, though expectations that the Bank of England will hike interest rates help limit further losses.
From a technical perspective, the GBP/USD pair, so far, has managed to hold its neck above the overnight swing low, around the 1.3357 area, or the lowest level since December 23. This should now act as a key pivotal point for traders, which if broken decisively will set the stage for an extension of the recent slide witnessed over the past two weeks or so.
In the absence of any major market-moving data from the UK, the USD price dynamics will continue to play a key role in influencing the GBP/USD pair. Later during the early North American session, traders will take cues from the US economic releases – the Core Personal Consumption Expenditure Price Index and revised Michigan Consumer Sentiment Index for January.
Levels to watch
USD/JPY looks ready to advance to the 115.80 region ahead of a breakout of 116.00, commented FX Strategists at UOB Group.
Key Quotes
24-hour view: “The strong surge in USD to 115.48 came as a surprise (we expected USD to strengthen but we were of the view that 115.05 is likely out of reach). While the advance is overbought, strong upward momentum could lead further USD strength. That said, it is left to be seen if USD can maintain a foothold above 115.80. On the downside, a breach of 115.00 (minor support is at 115.20) would indicate that the upward pressure has eased.”
Next 1-3 weeks: “We highlighted yesterday (27 Jan, spot at 114.65) that risk has shifted to the upside. We added, USD ‘has to clear 115.05 before a sustained advance is likely’. USD subsequently blew past 115.05 and surged to 115.48. The price actions suggest USD is ready to head higher to 115.80, possibly 116.05. The upside risk is intact as long as USD does not move below 114.80 (‘strong support’ level was at 114.05 yesterday).”
- DXY keeps the Fed-led rally well and sound above 97.00.
- US yields resumes the upside across the curve on Friday.
- PCE, U-Mich Index next of relevance in the US calendar.
The greenback, in terms of the US Dollar Index (DXY), pushes higher and reaches new highs around 97.40 at the end of the week.
US Dollar Index now looks to data
The index advances uninterruptedly since Monday and clinches new peaks in the 97.40 region, levels last traded back in July 2020.
The daily improvement in the buck comes against the backdrop of the better mood in US yields, with the short term of the curve surpassing the 1.21% mark to nearly 2-year peaks, the belly following suit near 1.83% and the long end navigating in the upper end of the last 7-month range around 2.13%. The ongoing bear flattening of the curve has been exacerbated following the hawkish tilt at the FOMC meeting on Wednesday.
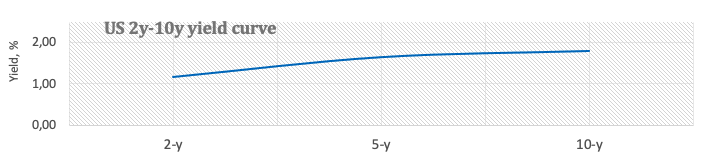
The prospects of a faster and maybe stronger pace of the Fed’s tightening flagged at the last meeting sponsored a noticeable exodus from the risk complex and into the dollar, which in turn morphed into extra oxygen for the DXY.
Later in the US data space, the focus of attention will be on the inflation figures measured by the PCE seconded by the final print of the Consumer Sentiment for the current month and Personal Income/Spending during December.
What to look for around USD
The index regained extra pace following the hawkish message at the FOMC gathering and pushes the greenback to new tops past the 97.00 barrier. Meanwhile, the constructive outlook for the greenback is expected to remain unchanged for the time being on the back of rising yields, persistent elevated inflation, supportive Fedspeak and the solid pace of the US economic recovery.
Key events in the US this week: PCE, Personal Income/Spending, Final Consumer Sentiment (Friday).
Eminent issues on the back boiler: Fed’s rate path this year. US-China trade conflict under the Biden administration. Debt ceiling issue. Escalating geopolitical effervescence vs. Russia and China.
US Dollar Index relevant levels
Now, the index is gaining 0.17% at 97.37 and a break above 97.42 (2022 high Jan.28) would open the door to 97.80 (high Jun.30 2020) and finally 98.00 (round level). On the flip side, the next down barrier emerges at 96.05 (55-day SMA) seconded by 95.41 (low Jan.20) and then 94.62 (2022 low Jan.14).
FX option expiries for January 28 NY cut at 10:00 Eastern Time, via DTCC, can be found below.
- EUR/USD: EUR amounts
- 1.1100 734m
- 1.1150 1.3b
- 1.1200 1.3b
- 1.1270 807m
- 1.1300 938m
- 1.1320 415m
- 1.1400 475m
- USD/JPY: USD amounts
- 113.15 655m
- 114.00 748m
- 114.50 646m
- 115.00 1.4b
- 115.50 1.8b
- 116.00 1.0b
- USD/CHF: USD amounts
- 0.8900 500m
- 0.9550 500m
- AUD/USD: AUD amounts
- 0.7050 458m
- 0.7145-0.7150 699m
- USD/CAD: USD amounts
- 1.2400 390m
- 1.2425 300m
- 1.2550 406m
- 1.2700 549m
- 1.2800 514m
- NZD/USD: NZD amounts
- 0.6735 520m
EUR/USD has slumped to its weakest level in more than a year. Buyers are unlikely to take action, subsequently, there is no convincing recovery in sight for the euro, in the view of FXStreet’s Eren Sengezer.
Investors await EU sentiment and US inflation data
“The European Commission will release the Consumer Confidence, Industrial Confidence, Services Sentiment, Business Climate and Economic Sentiment indexes for January. Even if these data point to an improvement in consumer and business confidence in the euro area, the shared currency is unlikely to stage a convincing recovery against the greenback.”
“The Core PCE Price Index is expected to rise to 4.8% in December and a stronger-than-forecast print should allow the dollar to continue to outperform heading into the weekend. On the flip side, a soft inflation reading could cause the greenback to lose some interest but such a market reaction is likely to remain short-lived.”
“Even if the pair were rise above 1.1150 and return within the descending channel, sellers are likely to remain in control as long as the 1.1220 (upper limit of the descending channel) resistance holds.”
“On the downside, 1.1100 (psychological level) aligns as the next support. Back in January 2020, EUR/USD extended its decline to 1.1000 it broke below 1.1100 and a similar action could be expected in the short term.”
Central bank policy normalization – or lack of it – and monetary policy differentials are the main reasons why the USD/JPY is set to race higher towards the 118 level this year, in the opinion of economists at Scotiabank.
Gains in the USD unlikely to encounter verbal intervention from officials in Washington or Tokyo
“We expect the Fed to tighten monetary policy aggressively and look for the Fed funds rate to reach 2.00% this year to combat more persistent and entrenched inflationary pressures. Meanwhile, the Bank of Japan (BoJ) is unlikely to shift monetary policy any time soon.
“We expect rates to rise in the US whereas Japanese government bond yields are poised to remain extremely low. We forecast US 10Y bond yields reaching 2.40% this year and to hold at or a little above that point in 2023. In contrast, JGB yields are poised to remain more or less flat this year (0.14%) and rise just 3bps from that to 0.16% in 2023, according to the Bloomberg survey.”
“Our correlation studies suggest the influence of longer-term yield spreads on USDJPY is rising again. The 5-year and 10-year spread correlations with spot are holding at 60% currently while the 2Y spread correlation remains a relatively soft 46%. Wider spreads will lift the USD.”
“A higher USD/JPY rate would likely suit both the US and Japan at the moment. A firmer dollar helps curb imported inflationary pressures into the US while Japan’s exporter base will welcome a weaker exchange rate.”
“The consensus anticipates little movement in the JPY this year or next (116 forecast for both end-2022 and end-2023) whereas we see more upside risk to 118 this year and 120 in 2023.”
USD/CHF has climbed to a fresh daily high around the 0.9320 region. Economists at the Bank of America think the pair paints a bullish technical picture and is set to grind higher towards the 0.9400 level.
Weekly close above 0.9232 needed to say breakout
"USD/CHF rallied marginally above trend line resistance (again). It needs a weekly close above 0.9232 to say breakout.”
“We hold a bullish bias while the support line at 0.9088 holds for upside to 0.9400, the 200-week SMA at 0.9558 and maybe the Fib level at 0.9672."
- A combination of supporting factors assisted USD/CHF to regain traction on Friday.
- Expectations for a faster policy tightening by the Fed continued to benefit the USD.
- The risk-on impulse undermined the safe-haven CHF and provided an additional lift.
The USD/CHF pair caught some bids during the early European session and climbed to a fresh daily high, around the 0.9320 region in the last hour.
Following the overnight late pullback from a two-month high, the USD/CHF pair attracted some dip-buying on Friday and scaled higher for the fifth successive day. A recovery in the global risk sentiment – as depicted by a generally positive tone around the equity markets – undermined the safe-haven Swiss franc. This, along with the prevalent strong bullish sentiment surrounding the US dollar, acted as a tailwind for the major.
The Fed on Wednesday indicated that it could raise interest rates at a faster pace than anticipated to contain stubbornly high inflation. The market was quick to start pricing in the possibility of five quarter-point rate hikes by the end of 2022. Moreover, short-term interest rate futures imply a 20% risk that the first hike in March could be 50 basis points. This, in turn, pushed the USD Index to the highest level since July 2020.
From a technical perspective, Thursday's convincing breakthrough the 0.9265-0.9270 resistance zone was seen as a fresh trigger for bullish traders. A subsequent strength and acceptance above the 0.9300 mark adds credence to the outlook and supports prospects for an extension of this week's strong rally from the 0.9100 mark. Hence, a move towards November 2021 swing high, around the 0.9375 area, remains a distinct possibility.
Market participants now look forward to the US macro data – the Core Personal Consumption Expenditure Price Index and revised Michigan Consumer Sentiment Index for January. This, along with the US bond yields, will influence the USD. Apart from this, the broader market risk sentiment would provide some impetus to the USD/CHF pair.
Technical levels to watch
Near-term bias for further EUR weakness rises even as Germany’s consumption and ifo reports show improvement. In the view of economists at Citibank, the 1.08-1.10 area may offer more durable medium-term support for EUR/USD.
EUR/USD weakness sooner rather than later
“EUR/USD has broken below major range support between 1.1180-1.1210 with leveraged accounts seen selling. This adds to the large real money buying of USD and suggests that the improved German Gfk and ifo reports are unlikely to change EUR’s near-term weakness bias.”
“With the Fed hinting at optionality on the timing and extent to which it will quantitatively tighten, while ECB tapering and timing of rate-liftoff now seems pretty much discounted, the 1.08-1.10 area may offer more durable medium-term support for EUR/USD (assuming minimal risk from the French parliamentary elections in June).”
Ahead of Germany’s Preliminary GDP for the fourth quarter of 2021, the country’s Economy Ministry said that the economic growth to reach pre-crisis levels in Q2 2022.
The Ministry said that it expects 2023 economic growth of 2.3%.
Market reaction
EUR/USD is seeing fresh supply, flirting with fresh 19-month lows of 1.1126, as the US dollar resumes the hawkish Fed-led upside ahead of the PCE inflation data.
EUR/GBP stands on slippery grounds while refreshing the weekly low to 0.8315. If the Bank of England (BoE) delivers a 25bp rake hike next week, the pair could challenge strong support around the 0.8275 mark.
Base rate priced at 1.35% for December
“Current pricing for the BoE's UK base rate is now at a staggering 1.35% for the December BoE meeting.”
In the past, in a deflationary environment with weak global demand, a former BoE might have issued a verbal rate protest against such pricing – in order to weaken GBP. However, we suspect that the BoE is currently welcoming GBP strength in its fight against higher energy prices.”
“A 25bp rate hike next week and no protest against market pricing of rate hikes should see EUR/GBP pressing strong support near 0.8275.”
The FOMC largely delivered on expectations, leaving its policy rate steady, but signalling a likely rate hike in March. Federal Reserve (Fed) Chair Jerome Powell’s hawkish comments and the Fed’s policy normalisation pivot should support the USD, in the view of economists at HSBC.
Fed Chair Powell made some hawkish comments, probably supporting the USD
“Powell suggested that rates could be raised faster than in the prior tightening cycle, with every meeting potentially live. He did not rule out the possibility of a potential 50bp hike at some stage in the cycle. The Fed Chair also leaned a bit more heavily on the upside risks to inflation and suggested further upward revisions to Fed inflation forecasts were likely to come in the March projections.”
“Fed Chair Powell also reiterated that balance sheet reduction would likely occur faster than during the last tightening cycle.”
“We have been looking for a continuation of USD strength as the Fed moves towards policy normalisation, and this January meeting should provide a bit more impetus on that front.”
Economists at Scotiabank continue to see merits in the longer-run outlook for the Canadian dollar. They expect the USD/CAD to tank towards the 1.20 level by the end of the year.
Potential gains in the CAD versus both the EUR and JPY where yields are poised to stay low
“We expect relatively firm commodity prices (energy) to help underpin the CAD.”
“Our interest rate forecast anticipates the BoC matching the Fed in terms of policy tightening this year but tightening more than the Fed in 2023 (50bps vs 25bps) – and we are more confident that the BoC delivers on these expectations.”
“The CAD should benefit from supportive term yield spreads against the USD and find gains against the low or lower-yielding currencies (e.g. the EUR and JPY) easier to come by.”
“We spot initial support at 1.23 below the market and resistance at 1.2810/15 ahead of 1.2950.”
“We forecast a year-end rate of 1.20 for USD/CAD versus the Bloomberg consensus of 1.24.”
Crude oil prices rallied sharply as market fears of another COVID-induced hit to demand failed to materialise. Supply-side constraints then sustained the rally. Strategists at ANZ expect the market to remain in deficit in Q1 2022.
Supply-side issues tighten the crude oil market
“With supply constraints likely to be a feature of the oil market for a while, we see markets pricing in a sizeable risk premium. This should offset headwinds from an Iran nuclear deal and a more hawkish Fed.”
“We have raised our short-term price target to $95/bbl.”
- USD/JPY climbed to a nearly three-week high and was supported by a combination of factors.
- The widening of US-Japanese yield spread, the risk-on impulse weighed on the safe-haven JPY.
- The stage seems all set for an extension of the week-long strong rally from a two-month low.
The USD/JPY pair edged higher through the early European session and climbed beyond mid-115.00s or a nearly three-week high in the last hour.
A combination of factors assisted the USD/JPY pair to attract some dip-buying near the 115.20 area on Friday and turn positive for the third successive day. This also marked the fourth day of a positive move in the previous five, with bulls now looking to build on this week's strong rally from over a two-month low, around the 113.45 region touched on Monday.
A goodish recovery in the global risk sentiment – as depicted by a generally positive tone across the equity markets – undermined the safe-haven Japanese yen. Apart from this, the divergence in the Fed-Bank of Japan monetary policy outlooks further drove flows away from the JPY and continued pushing the USD/JPY pair higher on the last day of the week.
The Fed on Wednesday indicated that it could raise interest rates at a faster pace than anticipated to contain stubbornly high inflation. The market was quick to start pricing in the possibility of five quarter-point rate hikes by the end of 2022. Moreover, short-term interest rate futures imply a 20% risk that the first hike in March could be 50 basis points.
Conversely, the Bank of Japan reaffirmed to continue with their persistent and powerful monetary easing until further notice. This, in turn, has resulted in a further widening of the 2-year US-Japanese government bond yield differential to its highest since late February 2020, which was seen as another factor that provided a boost to the USD/JPY pair.
Friday's follow-through move up could further be attributed to some technical buying following the overnight sustained strength back above the key 115.00 psychological mark. The subsequent price action favours bullish traders and supports prospects for an extension of the recent appreciating move, possibly back towards reclaiming the 116.00 round figure.
Investors now look forward to the US macro data – the Core Personal Consumption Expenditure Price Index and revised Michigan Consumer Sentiment Index for January. This, along with the US bond yields, will influence the USD. Traders will also take cues from the broader market risk sentiment for some short-term opportunities around the USD/JPY pair.
Technical levels to watch
In opinion of FX Strategists at UOB Group, AUD/USD risks further pullbacks with the next support just below 0.7000 the figure.
Key Quotes
24-hour view: “While we expected AUD to weaken yesterday, we highlighted that ‘oversold conditions suggest the major support at 0.7060 could be out of reach’. In other words, we did not anticipate the plunge in AUD to 0.7024. Conditions remain oversold and while AUD could extend its decline, a break of Dec’s low near 0.6995 is unlikely for now. Resistance is at 0.7070 followed by 0.7095.”
Next 1-3 weeks: “Yesterday (27 Jan, spot at 0.7090), we noted that ‘downward momentum has improved and the focus now is at 0.7060’. That said, we did not expect 0.7060 to be breached so quickly as AUD plummeted to 0.7024 during NY session. Further AUD weakness is likely and the next support is at the Dec’s low near 0.6995. On the upside, a break of the ‘strong resistance’ at 0.7125 (level was at 0.7180 yesterday) would indicate that the weak phase in AUD that started earlier this week has run its course. Looking ahead, a break of 0.6995 would shift the focus to 0.6935.”
The USD extended its Fed-fueled rally on Thursday. NZD weakness was no exception in that context. Economists at ANZ Bank note that the NZD/USD pair is heading towards support at 0.6550 and then more importantly, the 0.6500 level.
Upside risks to interest rates
“The kiwi remains in a pronounced downtrend vs USD as the market re-assesses the outlook for US interest rates.”
“Despite the speed of the fall in NZD/USD, the NZD is approaching key support at 0.6550 and 0.6500. The former is the 50% Fibonacci retracement of the entire up-move from March 2020, whilst the latter has historically provided strong support. Labour market data next week are a key focus.”
Considering advanced figures from CME Group for natural gas futures markets, open interest rose by around 21.3K contracts after six consecutive daily builds on Thursday. In the same direction, volume rose for the second straight session, now by around 100.5K contracts.
Natural Gas targets the 2022 highs just below $5.00
Natural gas prices extended the positive streak on Thursday, surpassing the key 200-day SMA ($4.128). The uptick was accompanied by rising open interest and volume and opens the door to further gains in the very near term. That said, the YTD peak around $4.90 now emerges as the next magnet for bulls.
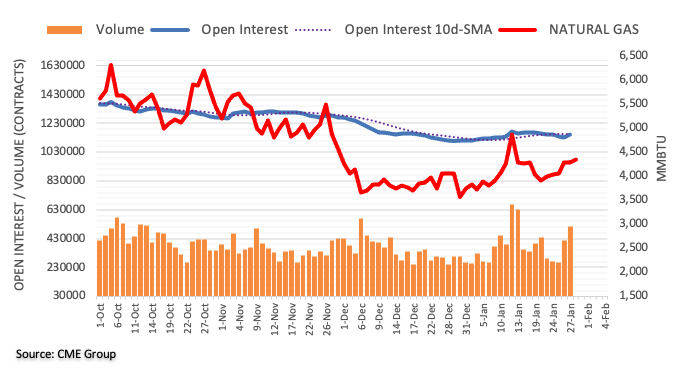
While further downside remains on the cards, Cable is expected to meet a tough support in the 1.3300 zone, suggested FX Strategists at UOB Group.
Key Quotes
24-hour view: “We expected GBP to weaken yesterday but we were of the view that ‘the major support at 1.3400 could be out of reach’. The subsequent weakness exceeded our expectations as GBP dropped to 1.3360. Deeply oversold conditions suggest that GBP is unlikely to weaken much further. For today, GBP is more likely to trade between 1.3350 and 1.3440.”
Next 1-3 weeks: “We have expected GBP to weaken since Monday (24 Jan, spot at 1.3550). As GBP declined, in our latest narrative from 25 Jan (spot at 1.3485), we highlighted that while further GBP weakness is likely, oversold shorter-term conditions suggest that that ‘1.3400 may not come into the picture so soon’. After trading sideways for a couple of days, GBP cracked 1.3400 yesterday (27 Jan) and dropped to 1.3360. Downward momentum has been boosted and GBP could weaken further. That said, any decline is expected to face solid support at 1.3300. Overall, the downside risk is intact as long as GBP does not move above the ‘strong resistance’ at 1.3485 (level was at 1.3545 yesterday).”
CME Group’s flash data for crude oil futures markets noted traders scaled back their open interest positions by around 5.8K contracts on Thursday following three daily drops in a row. Volume followed suit and dropped for the second straight session, now by around 133.8K.
WTI could attempt some consolidation ahead of $90.00
Crude oil prices charted an inconclusive session on Thursday in tandem with diminishing open interest and volume. That said, there seems to be room for some side-lined trading in WTI ahead of a potential move to the $90.00 mark per barrel in the not-so-distant future.
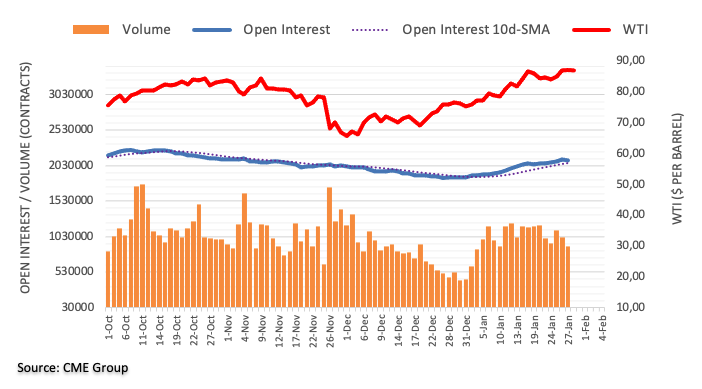
Gold price is making a minor recovery attempt from the near strong support of $1,795. But Thursday’s close below the horizontal 100-Daily Moving Average (DMA) at $1,795 points to more downside in the making, FXStreet’s Dhwani Mehta reports.
XAU/USD not out of the woods yet
“Thursday’s closing below the 100-DMA at $1,795 provides the extra zest to XAU sellers. Any retracement from lower levels will face initial hurdle at the bearish 50-DMA of $1,802, above which the flattish 200-DMA at $1,806 will come into the picture. Recapturing the 21-DMA at $1,818 is critical to negating the bearish momentum in the near-term.”
“With the 14-Relative Strength Index (RSI) still below the midline, the downside bias appears well in place. The next significant target for gold bears is seen at $1,783, the January lows. A firm break below the latter will accelerate the sell-off towards $1,750.”
See – Gold Price Forecast: XAU/USD to open up support at $1,691/76 on removal of $1,759/54 – Credit Suisse
Commenting on the Fed’s hawkish pivot, Bank of Japan (BOJ) Haruhiko Kuroda said, they “don't expect Fed policy to have a negative impact on Japan’s economy.”
Additional comments
“Desirable for fx rates to move stably reflecting fundamentals.”
“Watching fx moves carefully.”
'Very appropriate' for Fed to shift policy given heightening inflation expectations, wages.”
“Desirable for Japan’ economy that the US economy continues to achieve strong growth without excessive inflation.”
“The US monetary tightening has frequently led to weak yen but that is not always the case.”
“Very concerned about the situation in Ukraine, watching closely possible impact on oil price moves.”
“BOJ’s continued massive monetary easing will help boost corporate profits, improve the job market.”
“Possible that higher energy prices will put temporary downward pressure on real wages.”
“If times comes to debate exit policy, targeting shorter maturity JGB yield could become option.”
“At this stage, it's premature to raise yield target, take steps to steepen the yield curve.”
“If 2% price target is achieved, the board will likely debate various options.”
“Think current YCC is appropriate at moment.”
Market reaction
USD/JPY was last seen trading at 115.46, up 0.11% on the day.
Here is what you need to know on Friday, January 28:
The dollar extended its Fed-fueled rally on Thursday and the US Dollar Index reached its highest level since July 2020 before going into a consolidation phase on Friday. The European economic docket will feature eurozone sentiment data and German growth numbers. Later in the session, the US Bureau of Economic Analysis (BEA) will publish the December Personal Consumption Expenditures (PCE) Price Index, the Fed's preferred gauge of inflation, data alongside Personal Spending and Personal Income figures.
US PCE Inflation Preview: Dollar rally has more legs to run.
The greenback outperformed its rivals on Thursday as investors continued to price an aggressive Fed policy tightening. The upbeat US data, which showed that the economy expanded at an annualized rate of 6.9% in the fourth quarter, helped the dollar preserve its strength in the second half of the day. Nonetheless, Wall Street's main indexes closed in the territory, reflecting the negative impact of the Fed's announcements on risk sentiment. US stocks futures indexes trade flat early Friday, pointing to a slight improvement in market mood.
Meanwhile, the ongoing conflict between Russia and Ukraine continue to weigh on market sentiment. US President Joe Biden said on Thursday that there was a "distinct possibility" that Russia could invade Ukraine in February. On another concerning note, Russia noted that there was "little ground for optimism" following the US' dismissal of Russia's demands.
EUR/USD lost more than 100 pips on Thursday and touched its lowest level since June 2020 at 1.1132. The dollar's valuation continues to drive the pair, which was last seen moving sideways around 1.1150.
GBP/USD fell below 1.3400 for the first time in more than a month on Thursday before recovering modestly. On a weekly basis, the pair is down more than 1%.
Gold lost more than 1% for the second straight day on Thursday and broke below several key support levels. XAU/USD is trading slightly below $1,800 early Friday.
USD/JPY jumped above 115.00 for the first time in two weeks and fluctuates in a narrow channel around 115.50. The benchmark 10-year US Treasury bond yield is up nearly 1%, helping the pair preserve its bullish momentum.
Bitcoin continues to move up and down in a tight range below $40,000 ahead of the weekend. Ethereum is struggling to make a decisive move in either direction as it trades near $2,500.
FX Strategists at UOB Group suggested there is still scope for further decline in EUR/USD in the short-term horizon.
Key Quotes
24-hour view: “While we expected EUR to ‘weaken further’ yesterday, we were of the view that ‘a sustained decline below 1.1210 is unlikely’. We did not anticipate the sharp sell-off that sliced through a couple of major supports with ease (low has been 1.1130). While there is room for the sell-off to extend, deeply oversold conditions suggest that a clear break of 1.1100 is unlikely. On the upside, a break of 1.1185 (minor resistance is at 1.1165) would indicate that the current weakness has stabilized.”
Next 1-3 weeks: “Yesterday (27 Jan, spot at 1.1240), we highlighted that downward momentum has improved further and EUR is likely to continue to head lower. We added, ‘a clear break of 1.1210 would increase the odds for EUR to head lower towards the 2021 low near 1.1185’. While our view for a weaker EUR was not wrong, the break of 1.1185 triggered an outsized plunge to 1.1130. The impulsive downward momentum is likely lead to further EUR weakness. The next support levels are 1.1100 followed by 1.1050. Overall, the weak phase in EUR that started one week ago (see annotations in the chart below) is intact as long as EUR does not move above 1.1225 (‘strong resistance level was at a much higher level of 1.1315 yesterday).”
- AUD/USD staged a modest recovery from the lowest level since December 7 touched earlier this Friday.
- A positive risk tone undermined the safe-haven greenback and benefitted the perceived riskier aussie.
- Rising bets on multiple Fed rate hikes should limit the USD downside and cap the upside for the major.
The AUD/USD pair traded with a mild positive bias heading into the European session and was last seen hovering near the daily high, around the 0.7040 region.
Having touched its lowest level since December 7, around the 0.7020 area, the AUD/USD pair attracted some buying on Friday and recovered a part of the overnight slump. A recovery in the global risk sentiment – as depicted by a generally positive tone around the equity markets – undermined the safe-haven US dollar and benefitted the perceived riskier aussie. That said, any meaningful recovery still seems elusive amid the prospects for a faster policy tightening by the Fed, which should act as a tailwind for the greenback.
It is worth recalling that the Fed on Wednesday indicated that it could raise interest rates at a faster pace than anticipated to contain stubbornly high inflation. The market was quick to react and started pricing in the possibility of five quarter-point rate hikes by the end of 2022. Moreover, short-term interest rate futures imply a 20% risk that the first hike in March could be 50 basis points. This was reinforced by elevated US Treasury bond yields, which supports prospects for the emergence of some USD dip-buying.
The fundamental backdrop seems tilted firmly in favour of the USD bulls. Hence, any subsequent move up for the AUD/USD pair might still be seen as a selling opportunity and run the risk of fizzling out rather quickly. The pair remains vulnerable to prolonging its recent bearish trajectory and challenging the key 0.7000 psychological mark. Some follow-through selling below the 2021 low will set the stage for a further near-term downward trajectory.
Investors now look forward to the US economic docket – featuring the Core Personal Consumption Expenditure Price index and revised Michigan Consumer Sentiment Index for January. This, along with the US bond yields, will influence the USD price dynamics and provide some impetus to the AUD/USD pair. Apart from this, traders will take cues from the broader market risk sentiment to grab some short-term opportunities on the last day of the week.
Technical levels to watch
“China’s infrastructure fixed-asset investment (FAI) is likely to accelerate in 2022 to cushion a property investment slowdown and stabilize the economy,” said global rating giant Fitch during early Friday.
Fitch also adds, “Total FAI may rise by low-single digits as infrastructure FAI picks up to mitigate the slowdown in property investment.”
Also positive for China could be the Reuters news stating, “China regulator talks to foreign banks to soothe concerns over the economy.”
Reuters quotes three sources familiar with the matter to mention, “China's Securities and Regulatory Commission (CSRC) this week held a meeting with executives of top western banks and asset managers to reassure them about economic prospects after last year's unprecedented regulatory crackdown.”
FX reaction
The news joins the recent US dollar pullback to help AUD/USD print mild gains above 0.7000.
Read: US T-bond yields, stock futures rebound as markets wait for US data
Germany’s Economic Adviser said in a statement on Friday, the European Central Bank (ECB) “will need to react if inflation is 'persistent'.”
Although he was quick to add, “that for now, there is no reason for rate hikes yet.”
Market reaction
EUR/USD remains unfazed by these above comments, keeping its range near 1.1150 amid quiet markets and ahead of the US PCE inflation data.
- Gold price buyers appear non-committal near $1,800, await US PCE inflation.
- Fed’s hawkishness and stronger US data will keep gold’s upside capped.
- Gold price rebounds ahead of US PCE inflation, not out of the woods yet.
Gold bulls seem to come up for the last dance ahead of the Fed’s favorite inflation gauge, the PCE Price Index. As the dust settles over the Fed’s hawkishness-led market turmoil, the US dollar is losing its demand as a safe haven. Strengthening Treasury yields, however, keeps the recovery mode capped in gold price. Gold price remains on track to book its sharpest weekly decline since November, courtesy of the hawkish Fed outlook on the interest rates and balance-sheet reduction.
Read: US PCE Inflation Preview: Dollar rally has more legs to run
Gold Price: Key levels to watch
The Technical Confluences Detector shows that the gold price is fading its road to recovery from two-week troughs, having met strong supply at $1,800. At that level, the Fibonacci 23.6% one-day coincides with the SMA5 four-hour.
The next resistance awaits at $1,803, the intersection of the Fibonacci 38.2% and one-day, SMA50 one-day.
The SMA200 one-day sitting at $1,806 will then challenge the bearish commitments, as bulls move towards a powerful hurdle at $1,810. That level is the convergence of the Fibonacci 61.8% one-day, SMA200 four-hour and pivot point one-week S1.
On the flip side, the immediate cushion is aligned at the SMA100 one-day at $1,796, below which sellers will retest the previous day’s low of $1,792.
The pivot point one-week S2 will be the line in the sand for gold optimists.
Here is how it looks on the tool
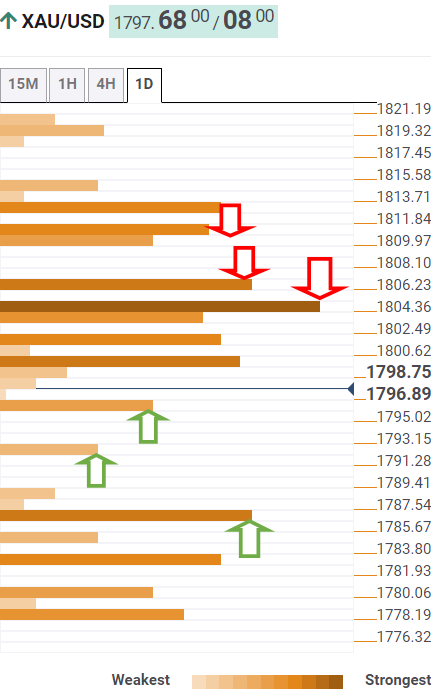
About Technical Confluences Detector
The TCD (Technical Confluences Detector) is a tool to locate and point out those price levels where there is a congestion of indicators, moving averages, Fibonacci levels, Pivot Points, etc. If you are a short-term trader, you will find entry points for counter-trend strategies and hunt a few points at a time. If you are a medium-to-long-term trader, this tool will allow you to know in advance the price levels where a medium-to-long-term trend may stop and rest, where to unwind positions, or where to increase your position size.
- EUR/GBP takes offers to refresh weekly low, drops towards 10-week-old support line.
- Receding bullish bias of MACD, descending RSI line signal further declines.
EUR/GBP stands on slippery grounds while refreshing the weekly low to 0.8315, down for the fourth consecutive day ahead of Friday’s European session.
In doing so, cross-currency pair extends early-week pullback below 50-DMA amid descending RSI line, not oversold. Also favoring EUR/GBP sellers is the recently easing bullish bias of the MACD.
That said, the quote currently drops towards a descending trend line from mid-November, around 0.8300, with the latest multi-month low of 0.8305 acting as immediate support.
Should the EUR/GBP bears keep reins past 0.8300, the 61.8% Fibonacci Expansion (FE) of the pair’s December 20, 2021, to January 14, 2022 moves, near 0.8265, will be in focus.
Alternatively, recovery moves remain elusive until crossing the 50-DMA level of 0.8426.
However, the bounce from the stated support line may aim to regain the 0.8400 if managed to cross the November lows near 0.8385.
EUR/GBP: Daily chart
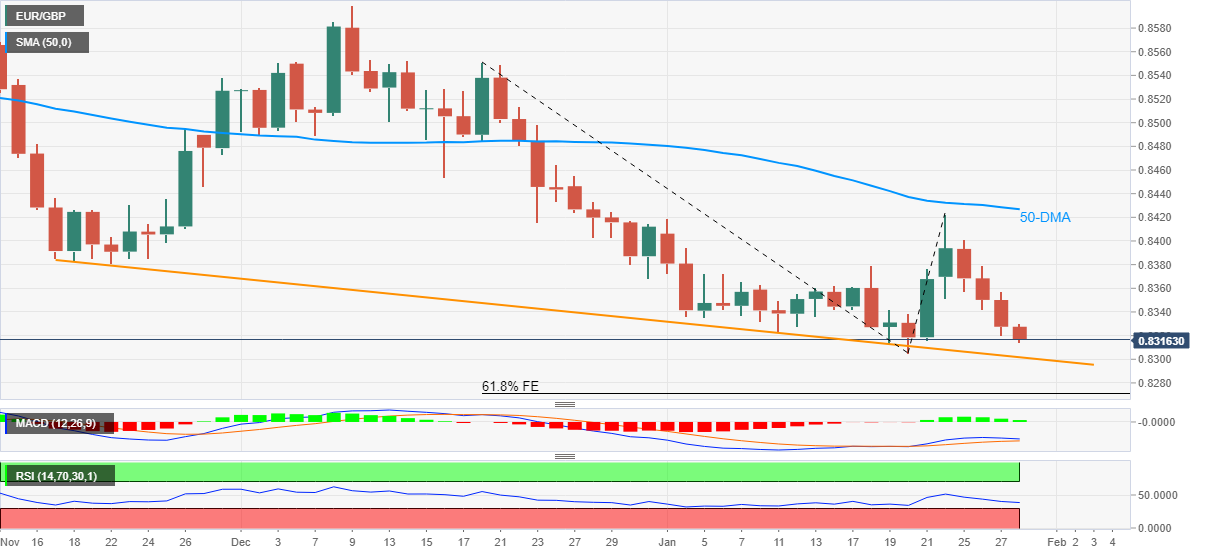
Trend: Further weakness expected
Open interest in gold futures markets shrank for the second session in a row on Thursday, this time by around 10.4K contracts according to preliminary readings from CMR Group. In the same line, volume remained choppy and dropped by around 18.3K contracts.
Gold looks contained around $1,800
Gold prices extended the bearish trend and closed below the key $1,800 mark per ounce troy on Thursday. The move was amidst shrinking open interest and volume, suggesting that a deeper drop appears out of favour in the very near term. In the meantime, the yellow metal looks well supported around the $1,800 mark.
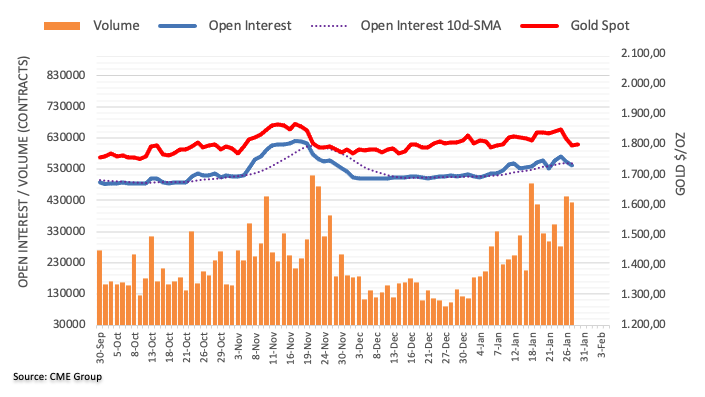
Quek Ser Leang at UOB Group’s Global Economics & Markets Research noted the index could surpass 98.00 once 97.80 is cleared.
Key Quotes
“In our last Chart of the Day for USD Index from 2 months ago (25 Nov 2021), we highlighted that ‘USD Index is likely to trend upwards in the months ahead and the next resistance level of note is at 97.80’. We added, ‘only an unlikely break of the 55-week exponential moving average would indicate that USD Index is not ready to trend upwards’. Our anticipation for an up-trend did not materialize as USD Index subsequently traded sideways before dipping to a low of 94.63 two weeks ago.”
“However, USD Index lifted off this week and while the week has yet to end, USD Index appears poised to post its biggest 1-week gain since Jun 2021. The large gain coupled with weekly MACD turning positive suggests that USD Index is ready to trend higher this time round. In view of the strong momentum, a break of 97.80 would not be surprising. If USD Index can close above this level on a weekly basis, it would increase the odds of an advance to 98.20. In order to maintain the current impulsive momentum, USD Index should ideally stay above 95.40 even though the key support is at 94.63.”
- USD/CAD snaps two-day uptrend, eases from the highest level in three weeks.
- Oil prices stay firmer amid Russia-Ukraine tussles, USD pullback.
- Markets brace for Fed’s preferred inflation gauge as rate hikes are in talks.
USD/CAD fades bounce off intraday low during the first negative daily performance in three amid early Friday in Europe.
Alike other majors, the Loonie pair also adhered to the broad US dollar gains post-Fed during the last two days, refreshing the highest levels in three weeks. However, escalating tensions surrounding the Russia-Ukraine geopolitical tension propel prices of Canada’s main export item WTI crude oil, which in turn weigh on the USD/CAD prices amid USD pullback.
US President Joe Biden talked with his Ukrainian counterpart Volodymyr Oleksandrovych Zelenskyy while showing readiness to offer more economic support. On the other hand, Russia repeatedly shows dislike for the Western allies’ interruption and hints at a full-fledged war with Kyiv. Amid these plays, WTI crude oil rallied to the highest levels since late 2014 the previous day, up 0.15% daily near $86.60.
Elsewhere, the US dollar eases from the highest levels last seen during July 2020 as traders await US Core PCE Price Index figures for December as they’re considered the Fed’s preferred version of inflation. Markets expect a 4.8% YoY figure versus 4.7% prior.
Read:
On Thursday, the Advance Q4 US GDP, up 6.9% annualized versus 5.5% market consensus and 2.3% prior. On the same line was the US Initial Jobless Claims for the week ended in January 21that came in 206K compared to 260K expected and 290K previous. It should be noted, however, that the US Durable Goods Orders for December dropped by -0.9% for December, below -0.5% market consensus.
It’s worth noting that the mixed performance of the market, portrayed by steady yields and mildly bid stock futures, also probes the US dollar bulls after the heavy run-up in the last few days.
Looking forward, headlines concerning the Russia-Ukraine tussles may offer immediate direction but major attention should be given to US PCE Price Index data.
Read: US PCE Inflation Preview: Dollar rally has more legs to run
Technical analysis
The USD/CAD pair’s successful trading above the 1.2695-2710 support zone, comprising 200-SMA and 50% Fibonacci retracement (Fibo.) of December-January declines, keeps USD/CAD buyers hopeful amid bullish MACD signals.
On the flip side, short-term sellers will gain momentum on the break of 1.2695. However, an ascending support line from January 20, near 1.2595, will challenge the USD/CAD sellers afterward.
- NZD/USD bears take a breather at 15-month low during the biggest weekly fall since November.
- Previous support line from late September guards recovery moves.
- Oversold RSI conditions challenge further selling but rebound remains elusive below 0.6700.
- Bears remain directed towards 0.6480 support zone with September 2020 lows likely testing immediate downside.
NZD/USD struggles to regain 0.6600 while bouncing off October 2020 levels during early Friday morning in Europe.
The kiwi pair dropped during the last six days to form the multi-day bottom around 0.6570. However, oversold RSI conditions triggered the quote’s corrective pullback.
Even so, the intraday buyers need to cross the descending trend line resistance, previous support near 0.6610, to justify the upside momentum.
Following that, a convergence of the 10-DMA and a descending trend line from January 13, near 0.6700, becomes crucial for NZD/USD buyers to watch.
Alternatively, fresh declines will wait for the downside break of 0.6570. The same gains support from the bearish MACD signals.
In that case, September 2020 low near 0.6510 may act as immediate support ahead of directing the NZD/USD bears to the troughs marked in August 2020 and June 2019 around 0.6480.
Overall, NZD/USD prices remain vulnerable to the further downside but the RSI conditions triggered the latest bounce.
NZD/USD: Daily chart
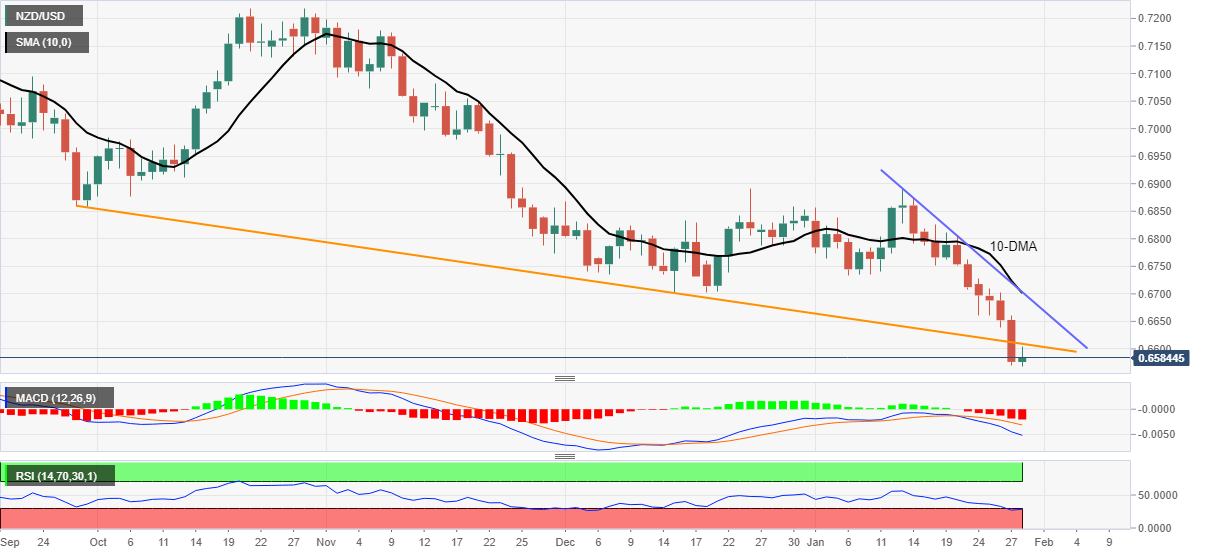
Trend: Bearish
- GBP/USD bounces off five-week low amid a sluggish Asian session.
- UK Foreign Secretary Liz Truss eyes significant progress in Brexit talks by February, Dover queues, DUP portray pessimism.
- Report over UK PM Johnson’s future leadership remains delayed with more negative details getting added of late.
- US Q4 Advance GDP came in mixed, Fed’s preferred inflation gauge eyed for fresh impulse.
GBP/USD pierces the 1.3400 threshold to refresh intraday high heading into Friday’s London open as markets pause the USD favor ahead of the Fed’s preferred inflation data. Also supporting the corrective pullback from a multi-day low are the upbeat headlines concerning Brexit and measured optimism over UK politics.
That said, UK’s Truss hoped to fast-track Brexit talks by February with hopes to get the support of pro-British unionists in Northern Ireland as opposed to the current arrangements, per Reuters. The British Brexit negotiator spoke during a visit to Belfast the previous day.
Additionally, a delay in the Sue Gray report also seems to underpin the GBP/USD buyers amid hopes that UK PM Boris Johnson will easily overcome the political challenges. However, his Tory friends keep piling more issues to brace for leadership change, the latest one was the No10 u-turn on National Insurance Hike.
On the contrary, long lines of lorries at the Dover and the Democratic Unionist Party’s (DUP) push to Liz Truss to deliver a solution to Northern Ireland (NI) protocol seems to test the optimists.
Elsewhere, the US dollar eases from the highest levels last seen during July 2020 as traders await US Core PCE Price Index figures for December as they’re considered the Fed’s preferred version of inflation. Markets expect a 4.8% YoY figure versus 4.7% prior.
Read: US PCE Inflation Preview: Dollar rally has more legs to run
On Thursday, the Advance Q4 US GDP, up 6.9% annualized versus 5.5% market consensus and 2.3% prior. On the same line was the US Initial Jobless Claims for the week ended in January 21that came in 206K compared to 260K expected and 290K previous. It should be noted, however, that the US Durable Goods Orders for December dropped by -0.9% for December, below -0.5% market consensus.
It’s worth noting that the mixed performance of the market, portrayed by steady yields and mildly bid stock futures, also probes the US dollar bulls after the heavy run-up in the last few days.
As a result, GBP/USD traders may extend the latest run-up should the UK politics and Brexit flash positive headlines. Though, the expected strength of the US inflation data may challenge the pair buyers.
Technical analysis
GBP/USD rebound eyes 50-DMA and a descending trend line from January 14, respectively around 1.3420 and 1.3470, amid bearish MACD signals and downbeat RSI conditions, not oversold. As a result, the fresh selling may wait for a clear downside break of the horizontal area established since early November, around 1.3350-60.
- EUR/USD licks its wounds at the lowest levels in 20 months, recently easing from intraday high.
- Markets remain lackluster amid mixed concerns over Russia-Ukraine and softer start to Friday.
- ECB’s Kazimir expects near-term increase in inflation, improvement in German Consumer Confidence teases ECB hawks ahead of key GDP.
- US Q4 GDP jumped, inflation expectations gained but PCE Price Index awaited.
EUR/USD hovers around 1.1150 during a sluggish Friday morning as markets take a breather following the heavily volatile session post-Fed.
In doing so, the major currency pair rebounds from the lowest levels since May 2020, flashed the previous day, also snapping the four-day downtrend. Even so, the quote braces for the biggest weekly fall since mid-June 2021.
That said, the market’s latest indecision could be linked to the cautious mood ahead of preliminary readings of German Q4 GDP, expected -0.3% versus +1.7% prior, as well as the US Core PCE Price Index figures for December, forecast +4.8% YoY versus 4.7% prior.
It should be noted that the mixed concerns over the fears of Russia’s invasion of Ukraine and associated risks to the bloc also probe the EUR/USD traders. At the latest, US President Joe Biden talked with his Ukrainian counterpart Volodymyr Oleksandrovych Zelenskyy while showing readiness to offer more economic support.
Amid these plays, the benchmark US 10-year Treasury yields stay firmer around 1.81%, after declining the most in a month the previous day whereas the S&P 500 Futures also print mild gains around 4,330 by the press time.
On Thursday, the German GfK Consumer Confidence Survey showed improvement in the final figure of -6.7, versus -7.8% expected and -6.9 prior. Elsewhere, Advance Q4 US GDP rose 6.9% annualized versus 5.5% market consensus and 2.3% prior. On the same line was the US Initial Jobless Claims for the week ended in January 21that came in 206K compared to 260K expected and 290K previous. Further, the US Durable Goods Orders for December dropped by -0.9% for December, below -0.5% market consensus.
Looking forward, the initial readings of German GDP will help the ECB hawks, especially from Bundesbank. Though, the EUR/USD buyers have a long way to go.
Read: US PCE Inflation Preview: Dollar rally has more legs to run
Technical analysis
A clear downside break of the June 2020 swing low near 1.1165 directs EUR/USD prices towards an early May 2020 high of 1.1018. Also acting as an upside filter is the year 2021 bottom surrounding 1.1185.
- Asian equities stay indecisive as markets await Fed’s preferred inflation gauge.
- IMF suggests easy-money policies to BOJ, inflation likely to dent global growth in 2022.
- Wall Street closed in red but Apple share offered a good start to S&P 500 Futures.
- Russia-Ukraine story flashes mixed messages, Aussie data prints higher factory-gate inflation.
Asia-Pacific shares trade mixed during an inactive Friday as investors take a breather following the recent volatility due to the US Federal Reserve’s (Fed) hawkish signals. The latest indecision of traders could also be linked to the cautious sentiment ahead of the US inflation data, as well as mixed concerns over the key risk catalysts.
That said, MSCI’s index of Asia-Pacific shares outside Japan treads water around the lowest levels since October 2020. However, Japan’s Nikkei 225 and Australia’s ASX 200 gain around 2.0% each.
Japanese investors cheer comments from the International Monetary Fund (IMF) officials suggesting the need for further easy money policies at the Bank of Japan (BOJ). Additionally, softer-than-expected and previous readings of the Tokyo Consumer Price Index (CPI) also favor Nikkei 225 to consolidate recent losses.
Australian markets seem to brace for the upcoming Reserve Bank of Australia (RBA) meeting while tracking mildly bid US stock futures, as the ASX 200 gains aren’t suited to the upbeat Producer Price Index (PPI) data for the fourth quarter (Q4).
Elsewhere, stocks in China grind higher with gains in blue-chip companies whereas Hong Kong and New Zealand markets are down nearly 1.0%.
It should be observed that South Korean and Indian investors are paring the weekly losses while equities in Indonesia remain lackluster.
On a broader front, Wall Street closed in the red but Apple’s results favored stock futures to print mild gains afterward. That said, the US Treasury yields stay firmer by the press time with eyes on the Core PCE Price Index data for December, expected to rise from 4.7% to 4.8% YoY.
Read: US PCE Inflation Preview: Dollar rally has more legs to run
- USD/INR snaps a four-day winning streak, eases from five-week lows.
- Indian rupee buyers emerge near 75.30, as the USD eases across the board.
- 50-DMA at 74.90 eyed if USD/INR corrects further ahead of US inflation.
USD/INR is retreating from five-week highs of 75.31, tracking the pullback in the US dollar across the board.
The sentiment around the Asian stock markets and US equity futures improves, in the wake of likely easing of the Ukraine tensions and fading Fed rate hike concerns, capping the demand for the safe-haven US dollar.
Meanwhile, Indian rupee bulls pay little heed to the renewed uptick in oil prices, as the dynamics of the US dollar remain pivotal ahead of the PCE inflation data.
At the time of writing, the spot is heading south towards 75.00, posting moderate losses on the day.
If the correction gathers steam, then USD/INR bears could the mildly bullish 50-Daily Moving Average (DMA) at 74.90.
Further south, the 100-DMA support at 74.68 will come to the rescue of bulls.
The 14-day Relative Strength Index (RSI) is turning lower while above the midline, justifying the pullback in the spot from multi-week highs.
USD/INR: Daily chart
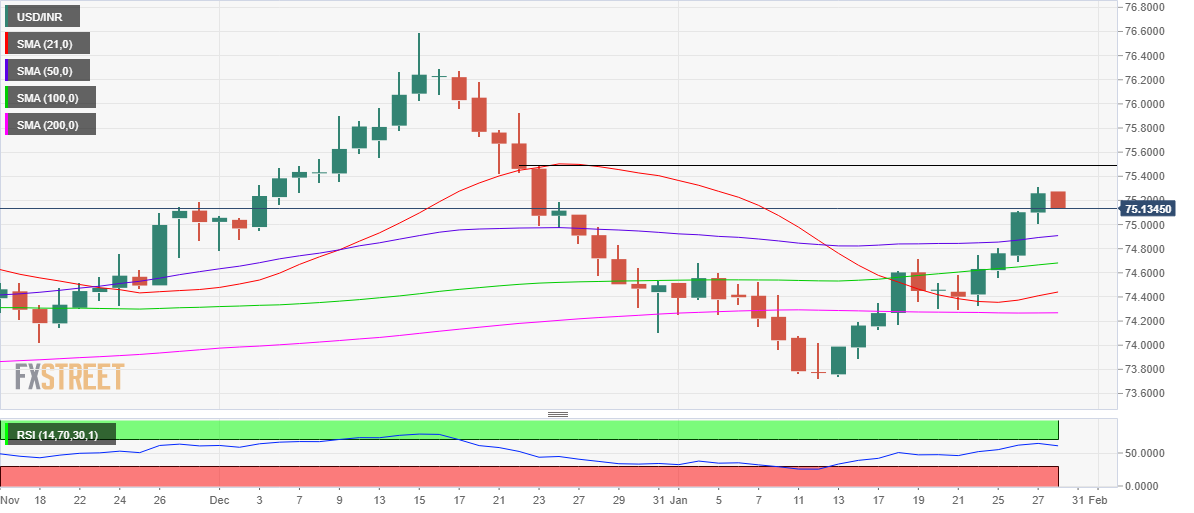
On the flip side, buyers will retest three-week highs of 75.31, above which the December 23 top of 75.48 will be eyed.
The next relevant upside target is envisioned at $76.00, the round figure.
USD/INR: Additional levels
- USD/CHF eases from two-month high to pare weekly gains.
- Previous resistance from mid-December appears key short-term support, four-month-long horizontal area guards immediate upside.
- Bullish MACD signals, successful trend line breakout favor buyers.
USD/CHF eases from a two-month high to 0.9300 while consolidating the weekly gains during Friday’s Asian session.
In doing so, the Swiss currency (CHF) pair prints daily losses, down 0.12% intraday at the latest, for the first time in five days.
However, the quote keeps the previous day’s upside break of a descending resistance line from November, now support around 0.9270. Also keeping buyers hopeful are the bullish MACD signals.
That said, a horizontal area comprising multiple tops marked since September offers immediate headwinds to the USD/CHF prices around 0.9335-40.
It’s worth noting that the quote’s upside past 0.9340 will need validation from November’s high of 0.9373 ahead of challenging the year 2021 peak of 0.9472.
Meanwhile, the latest pullback moves aim for the previous resistance line near 0.9270, a break of which will direct USD/CHF prices towards the 0.9200 threshold.
Though, the 61.8% Fibonacci retracement of August-November 2021 upside and monthly low, respectively near 0.9150 and 0.9090, will challenge the pair’s downside past 0.9200.
To sum up, USD/CHF remains on the bull’s radar despite the latest pullback.
USD/CHF: Daily chart
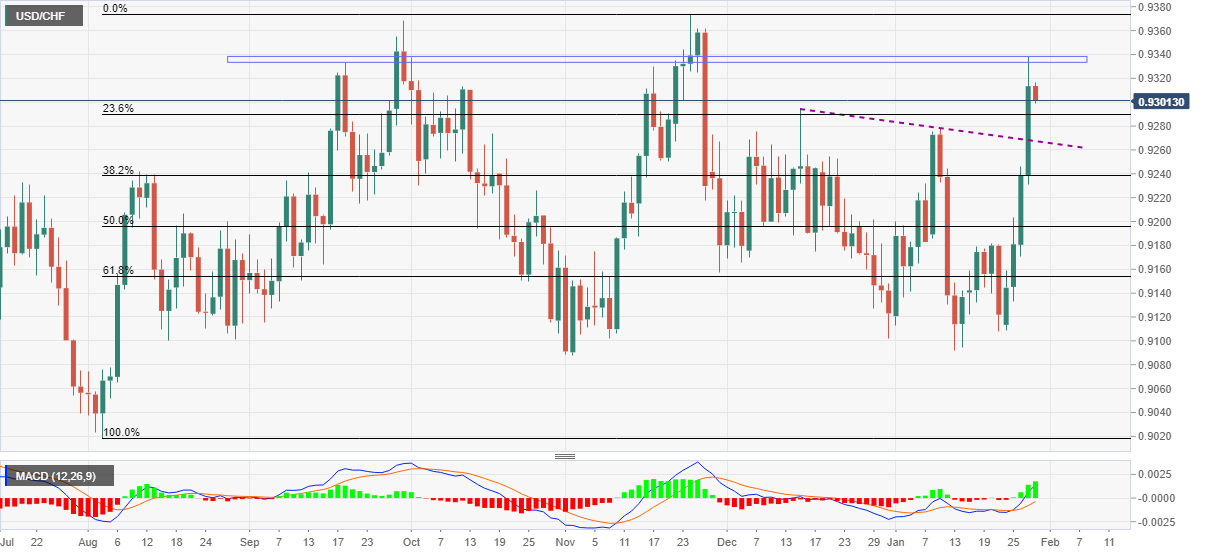
Trend: Bullish
“Persistently high inflation will haunt the world economy this year,” per the latest Reuters’ poll of economists published during early Friday.
The poll also states that the economists trimmed their global growth outlook on worries of slowing demand and the risk interest rates would rise faster than assumed so far.
Key quotes
In the latest quarterly Reuters surveys of over 500 economists taken throughout January, economists raised their 2022 inflation forecasts for most of the 46 economies covered.
While price pressures are still expected to ease in 2023, the inflation outlook is much stickier than three months ago.
At the same time, economists downgraded their global growth forecasts. After expanding 5.8% last year, the world economy is expected to slow to 4.3% growth in 2022, down from 4.5% predicted in October, in part because of higher interest rates and costs of living. Growth is seen slowing further to 3.6% and 3.2% in 2023 and 2024, respectively.
Nearly 40% of those who answered an additional question singled out inflation as the top risk to the global economy this year, with nearly 35% picking coronavirus variants, and 22% worried about central banks moving too quickly.
Also read: Federal Reserve rate cycle to begin in March, markets reverse on warning
- Silver price rebounds as DXY eases but not out of the woods yet.
- XAG/USD faces stiff resistance at the bearish 50-DMA barrier.
- Bears eye a firm break below rising trendline support at $22.43.
Silver price (XAG/USD) is catching a breather above $22.50 after a five-day non-stop downward spiral.
A minor pullback in the US dollar across the board, as the Asian stocks and US equity futures regain footing ahead of PCE inflation data this Friday. The US dollar index eases from 18-month highs of 97.29 to now trade at 97.19, down 0.07% on the day.
The greenback garnered strength this week, mainly in response to the hawkish Fed outlook, stronger US Q4 advance GDP and the Russia-Ukraine geopolitical risks.
Markets are taking profits off the table on their dollar longs ahead of the critical US PCE inflation release, helping silver price find a floor.
However, a bottom in silver price appears distant, as bears are likely to remain in the game amid a bearish technical setup on the daily chart.
After the downside break from three-week-old ascending trendline support at $23.66 on Wednesday, selling pressure intensified and knocked down silver price sharply through all the major Daily Moving Averages (DMA).
XAG bulls, however, managed to find support just ahead of the six-week-long rising trendline support, now aligned at $22.43.
Silver Price Chart: Daily chart
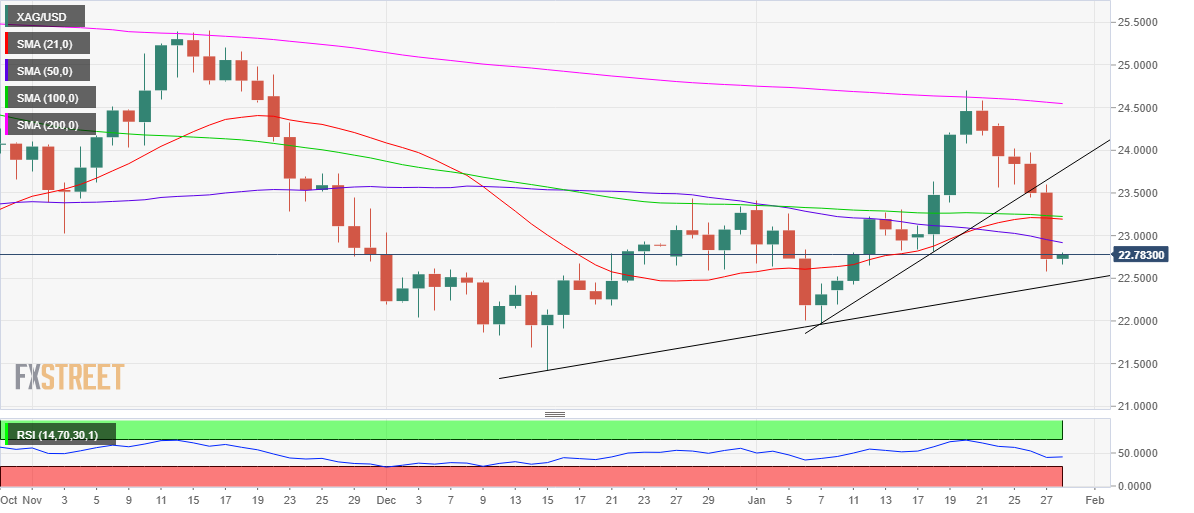
If buyers fail to find a strong foothold above the bearish 50-DMA at $22.91, then sellers are likely to return, putting the daily trendline support at risk once again.
Daily closing below the latter will trigger a sharp sell-off towards the January 7 lows of $21.95, below which the $21.50 psychological level will be on the sellers’ radars.
The 14-day Relative Strength Index (RSI) is attempting a bounce but remains well below the midline, suggesting that the downside risks remain intact.
Silver Additional levels
| Raw materials | Closed | Change, % |
|---|---|---|
| Brent | 88.76 | 0.35 |
| Silver | 22.762 | -3.33 |
| Gold | 1796.553 | -1.28 |
| Palladium | 2373.25 | 2.12 |
- USD/TRY snaps two-day uptrend during a sluggish session, retreats from daily high of late.
- A bullish moving average crossover, firmer RSI favor buyers.
- 12-day-old support line adds to the downside filters, monthly horizontal line restricts immediate upside.
USD/TRY struggles to defend buyers, down 0.25% intraday while easing to $13.62 amid Friday’s Asian session.
The Turkish lira (TRY) pair rose during the last two days before easing from $13.67. The pullback moves, however, remain elusive due to the golden cross on the four-hour (4H) play.
A golden cross is the bullish moving average crossover wherein the 50-SMA crosses the 200-SMA from the upside to signal the underlying asset’s further advances.
That said, the USD/TRY prices need to overcome the $13.70 immediate hurdle ahead of confronting the monthly resistance line near $13.95.
During the quote’s upside past $13.95, the December 21 peak of $14.13 will act as the key hurdle to the USD/TRY rally.
On the contrary, the stated SMA convergence near $13.50 restricts the short-term downside of USD/TRY.
Following that, an upward sloping trend line from January 12, near $13.35, will be important before welcoming the USD/TRY bears.
USD/TRY: Four-hour chart
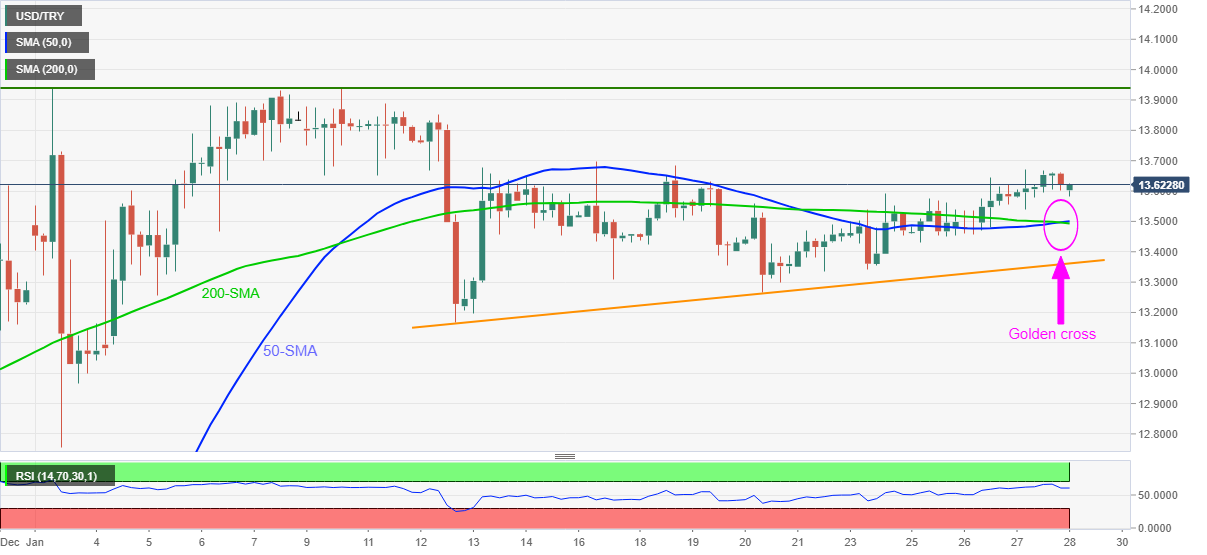
Trend: Further upside expected
- GBP/JPY is looking to extend the recovery momentum towards 155.00.
- The hawkish Fed-led rally in USD/JPY outweighs the cable’s downside.
- 50-DMA is set to cross the 100-DMA to the south, RSI stays bearish.
GBP/JPY is building onto the three-day upbeat momentum, as bulls eye a sustained move above the recent range highs near 154.75.
The ongoing recovery rally in the cross could be attributed to the hawkish Fed outlook on the interest rates and balance-sheet reduction, which has taken USD/JPY sharply higher alongside the US dollar and the Treasury yields.
Further, a big beat on the US Q4 annualized GDP data also bolstered the dollar’ rally, aiding the bullish undertone seen in the USD/JPY pair, as well, as GBP/JPY.
Meanwhile, a sense of calm on the Russia-Ukraine crisis, with the US seeking to ease the diplomatic tensions has weighed on the Japanese yen’s safe-haven appeal, in turn, collaborating to the upside in GBP/jPY.
On the other side, looming Brexit and UK political uncertainty continue to keep the GBP bears alive and cheerful. The Irish Democratic Unionist Party’s (DUP) First Minister Paul Givan said that the UK must take action if the European Union (EU) agreement cannot be reached by February 21.
Meanwhile, members of the UK PM Boris Johnson’s Conservatives party are considering their options, as pressure mounts on Johnson over his involvement in the violation of government rules during the covid lockdown in the country.
Looking ahead, markets will remain focussed on the geopolitical developments and UK political news ahead of the US PCE inflation release.
GBP/JPY: Technical outlook
From a short-term technical perspective, GBP/JPY is trying hard to extend the upside towards 155.00 but bulls remain cautious amid a looming bear cross on the daily sticks.
The 50-Daily Moving Average (DMA) is on the verge of cutting the 100-DMA for the downside, which will flash a bearish signal.
The 14-day Relative Strength Index (RSI) is edging higher but still remains below the midline, suggesting that the upside attempts could face stiff resistance.
GBP/JPY daily chart
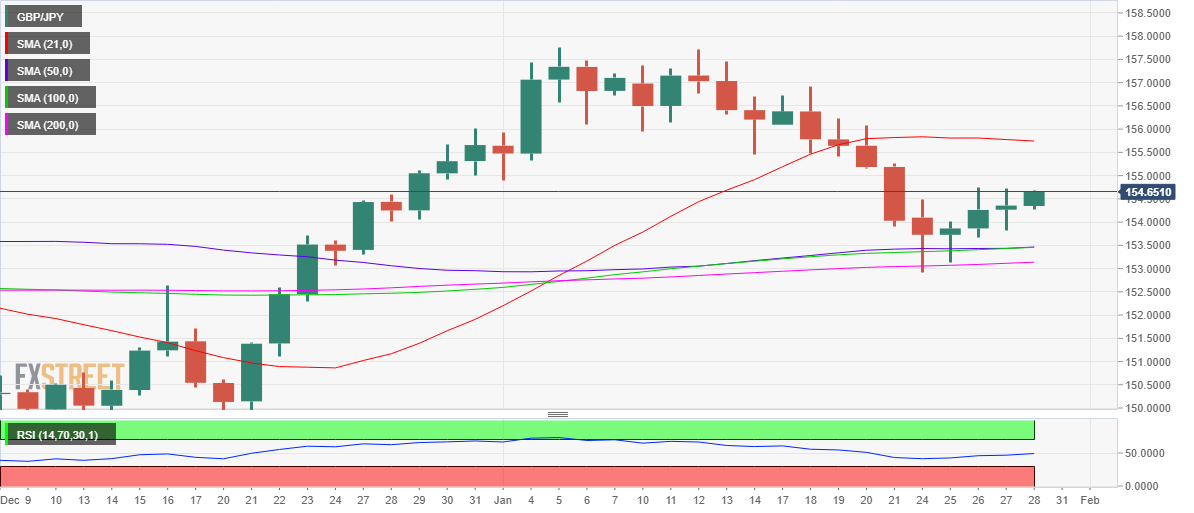
Immediate resistance is seen at 154.75, above which the 155.00 round level will get tested.
On the downside, the daily lows of 154.26 will come into play before the bears target the previous day’s low of 153.82.
GBP/JPY additional levels to watch
- US Treasury yields consolidate the heaviest daily fall in a month.
- S&P 500 Futures rise half a percent, Asia-Pacific equities trade mixed.
- Cautious sentiment ahead of US Core PCE Inflation data, mixed updates over Russia-Ukraine story probe traders amid sluggish Asian session.
Global markets take a breather during early Friday after two consecutive days of Fed-led volatility. That said, the risk appetite remains sluggish as traders await key US inflation data amid an absence of major catalysts. Also contributing to the boring session are the mixed updates on the Russia-Ukraine tussles.
While portraying the mood, the benchmark US 10-year Treasury yields stay firmer around 1.81%, after declining the most in a month the previous day. However, the S&P 500 Futures also print mild gains around 4,330 by the press time.
Additionally, stocks in Australia, Japan and South Korea stay positive whereas those from China and New Zealand print mild losses at the latest.
It’s worth noting that firmer US data drowned Wall Street the previous day despite an upbeat start to Thursday’s trading. That said, Advance Q4 US GDP rose 6.9% annualized versus 5.5% market consensus and 2.3% prior. On the same line was the US Initial Jobless Claims for the week ended in January 21that came in 206K compared to 260K expected and 290K previous. It should be noted, however, that the US Durable Goods Orders for December dropped by -0.9% for December, below -0.5% market consensus.
In addition to the mixed data, the active US role in the Russia-Ukraine tussles and Moscow’s refrain to step back also test the market players.
Above all, an absence of major data/events and cautious sentiment ahead of the Fed’s preferred inflation gauge, namely the US Core PCE Price Index, seem to confuse traders and restrict the market moves of late. It should be noted that the key US data for December is expected to rise from 4.7% to 4.8% YoY, suggesting further upside for the US Treasury yields and favoring the US dollar which in turn could exert downside pressure on commodities and other riskier assets.
Read: US PCE Inflation Preview: Dollar rally has more legs to run
- Gold prints a corrective pullback from a three-week low.
- Yields pause previous declines, US stock futures print mild gains but Asia-Pacific equities trade mixed.
- Firmer US data, inflation expectations keep gold bears hopeful before Fed’s preferred inflation gauge, India gold demand tests sellers.
- Gold Price Forecast: Poised to challenge January’s low at 1,782.60
Gold (XAU/USD) licks the Fed-led wounds of around $1,797-98, up 0.15% intraday during Friday’s Asian session. In doing so, the yellow metal reacts to the upbeat demand forecasts for the world’s top gold consumer, as well as mildly bid US equity futures, amid a sluggish session.
The bright metal refreshed a three-week low the previous day as markets cheered the US Federal Reserve’s (Fed) signals of the March rate hike and room for more lift-offs. That said, the hawkish Fed hints offered a $50.00 slump in the gold prices before the latest bounce from $1,791.
Gold prices portray a corrective pullback as demand from the world’s second-largest gold consumer India is likely to increase, per the World Gold Council (WGC) report shared by Reuters. “India's gold consumption is expected to rise further in 2022 after jumping 79% last year as pent-up demand and an improvement in consumer confidence are seen boosting retail jewelry sales,” the news said.
Indian demand has averaged 769.7 tonnes over the last 10 years and is expected to jump to the highest levels in six years, per regional CEO of WGC India, to around 800-850 tonnes versus 797.3 tonnes last year.
On a different page, markets digest Fed-led wounds amid a light calendar day in Asia, which in turn allows equities and other riskier assets like gold to consolidate the latest losses. Additionally, mixed concerns over the Russia-Ukraine tussles and cautious mood ahead of the Fed’s preferred inflation gauge also help gold prices to print a corrective pullback.
Read: US President Biden eyes additional macroeconomic help for Ukraine as Russian invasion looms
Amid these plays, the US 10-year Treasury yields stay firmer around 1.81% while the S&P 500 Futures rise half a percent by the press time. Additionally, the Asia-Pacific equities traded mixed while the US Dollar Index (DXY) struggles for a clear direction after rising to the highest levels since July 2020 the previous day.
Looking forward, the gold traders may now await the US Core PCE Price Index figures for December as they’re considered the Fed’s preferred version of inflation. Markets expect a 4.8% YoY figure versus 4.7% prior. Also important will be updates over the likely Russian invasion of Ukraine.
Read: US PCE Inflation Preview: Dollar rally has more legs to run
Technical analysis
Be it a clear downside break of $1,810 support confluence on 4H or the 200-DMA level of $1,805, gold selling is in full steam.
However, oversold RSI conditions on the four-hour chart (4H) triggered the metals latest rebound from $1,791 support level comprising 61.8% Fibonacci retracement of December-January upside.
Also acting as immediate support is the area comprising multiple levels marked since late December, near $1,785.
Following that, a slump to $1,770 and the last month’s bottom surrounding $1,753 can’t be ruled out.
Gold: Four-hour chart
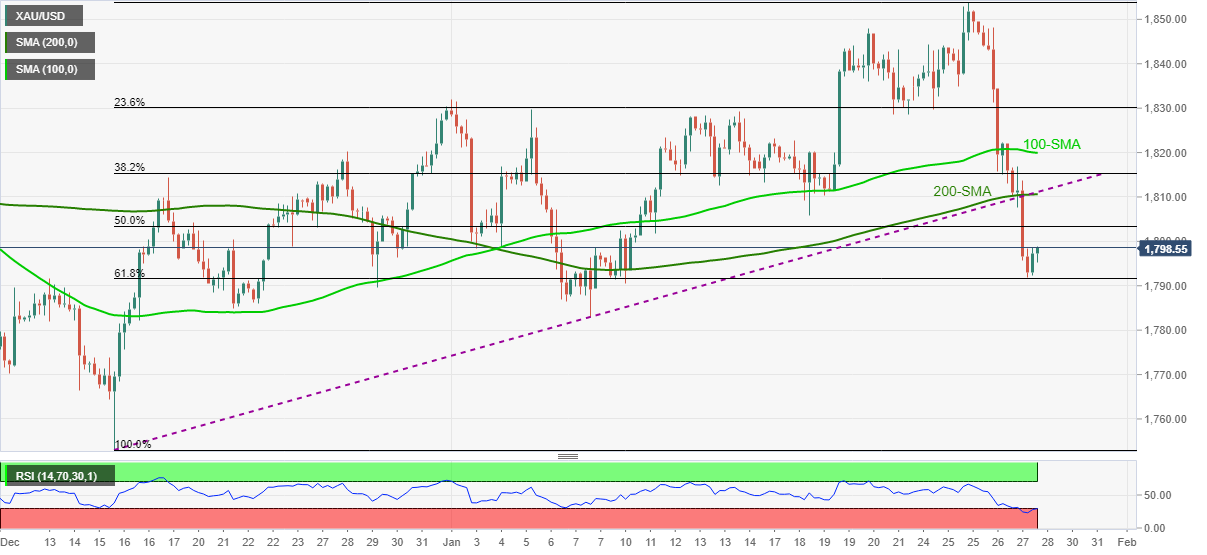
It’s worth noting that the daily chart shows a notable downside gap as the quote recently conquered an upward sloping support line from August, now resistance around $1,800.
Gold: Daily chart
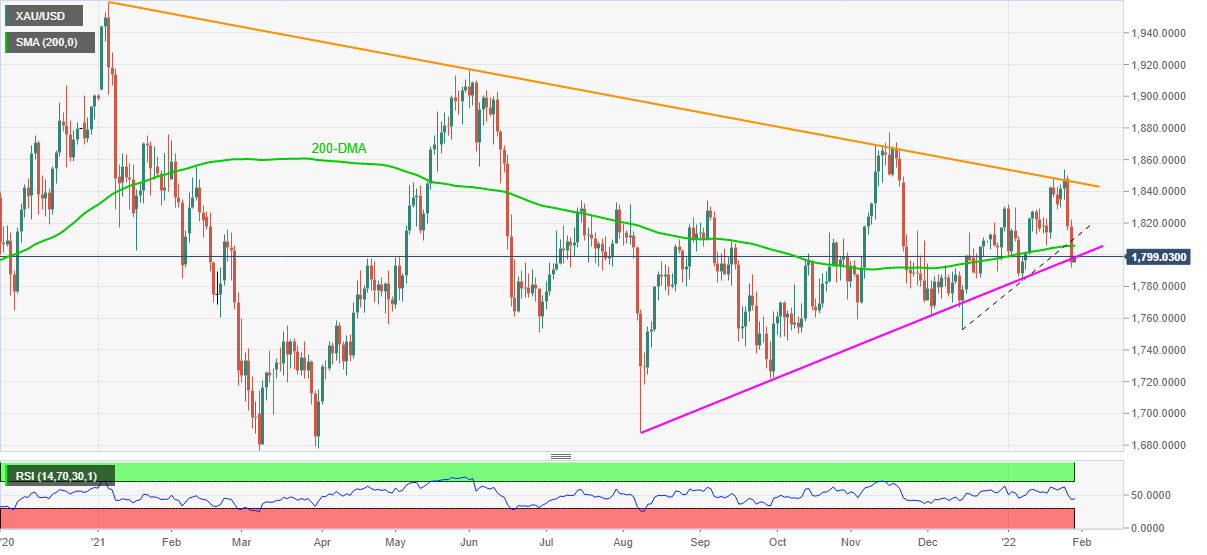
Alternatively, a clear upside break of $1,810 will need validation from $1,831 to recall gold buyers.
Even so, the yearly resistance line and the monthly peak, respectively around $1,847 and $1,853 will be tough nuts to crack for the gold bulls.
| Time | Country | Event | Period | Previous value | Forecast |
|---|---|---|---|---|---|
| 00:30 (GMT) | Australia | Producer price index, q / q | Quarter IV | 1.1% | |
| 00:30 (GMT) | Australia | Producer price index, y/y | Quarter IV | 2.9% | |
| 06:30 (GMT) | France | Consumer spending | December | 0.8% | 0.2% |
| 06:30 (GMT) | France | GDP, q/q | Quarter IV | 3% | 0.5% |
| 08:00 (GMT) | Switzerland | KOF Leading Indicator | January | 107.0 | 106.3 |
| 09:00 (GMT) | Eurozone | Private Loans, Y/Y | December | 4.2% | |
| 09:00 (GMT) | Eurozone | M3 money supply, adjusted y/y | December | 7.3% | 6.8% |
| 09:00 (GMT) | Germany | GDP (QoQ) | Quarter IV | 1.7% | -0.3% |
| 09:00 (GMT) | Germany | GDP (YoY) | Quarter IV | 2.5% | 1.8% |
| 10:00 (GMT) | Eurozone | Industrial confidence | January | 14.9 | 15 |
| 10:00 (GMT) | Eurozone | Consumer Confidence | January | -8.4 | -8.5 |
| 10:00 (GMT) | Eurozone | Economic sentiment index | January | 115.3 | 114.5 |
| 13:30 (GMT) | U.S. | Employment Cost Index | Quarter IV | 1.3% | 1.2% |
| 13:30 (GMT) | U.S. | Personal spending | December | 0.6% | -0.6% |
| 13:30 (GMT) | U.S. | PCE price index ex food, energy, m/m | December | 0.5% | 0.5% |
| 13:30 (GMT) | U.S. | PCE price index ex food, energy, Y/Y | December | 4.7% | 4.8% |
| 13:30 (GMT) | U.S. | Personal Income, m/m | December | 0.4% | 0.5% |
| 15:00 (GMT) | U.S. | Reuters/Michigan Consumer Sentiment Index | January | 70.6 | 68.7 |
| 18:00 (GMT) | U.S. | Baker Hughes Oil Rig Count | January | 491 |
The People’s Bank of China (PBOC) set the USD/CNY reference rate at on Friday 6.3746 when compared to the previous fix and the previous close at 6.3382 and 6.3688. respectively.
Following the PBOC rate anouncement, Reuters came out with the details suggesting, "China central bank injects 200 billion yuan via 14-day reverse repos at 2.25% versus prior 2.25%."
The PBOC recently cut reverse repo rate by a 10 basis points (bps) and has been trying to defend the Chinese yuan bears with heavy liquidity injection. However, the Chinese central bank seems to have gained little success so far, except for the latest bounce, even as the Fed announced rate hike signals during this week.
One-month risk reversal for the EUR/USD, a gauge of calls to puts, braces for the biggest weekly fall since October with the latest print of -0.187 by the end of Thursday’s North American session.
In doing so, the options market gauge drops for the second consecutive week as per the options market data on Reuters.
Not only the weekly signs but the daily figures also drop with -0.1000 at the latest, per Reuters.
The downbeat signals justify the US Federal Reserve’s (Fed) indirect confirmation of the March rate hike and hints of room for more lift-offs.
It should be noted, however, that the latest corrective pullback from the lowest levels since June 2020 could be linked to the market’s cautious mood ahead of the US Core PCE Price Index figures for December, as they’re considered the Fed’s preferred version of inflation. Forecasts suggest a 4.8% YoY figure versus 4.7% prior.
Read: US PCE Inflation Preview: Dollar rally has more legs to run
- AUD/USD holds lower ground near two-month bottom, pauses two-day downtrend.
- Oversold RSI probes bears but downbeat MACD signals, sustained break of the key support zone hint at further weakness.
- Key moving averages, monthly high add to the upside filters.
AUD/USD dribbles around 0.7030 during a mixed Asian session on Friday, after declining to an early December low following the two-day downtrend.
In doing so, the Aussie pair justifies oversold RSI conditions to defend the 0.7000 psychological magnet.
However, a clear downside break of a five-month-old horizontal resistance area, between 0.7090 and 0.7110, keeps AUD/USD sellers hopeful amid bearish MACD signals.
Even if the pair buyers manage to cross the 0.7110 hurdle, the 50-DMA and the 100-DMA surrounding 0.7175 and 0.7265 in that order will challenge the pair’s further upside.
Alternatively, lows marked during December 2021, also the lowest levels since November 2020, around 0.6990, will challenge the AUD/USD bears during the fresh downside.
Should the remains bearish past 0.6990, the 61.8% Fibonacci Expansion (FE) of the pair’s declines from late June 2021 to January 2022, around 0.6920, will be in focus.
AUD/USD: Daily chart
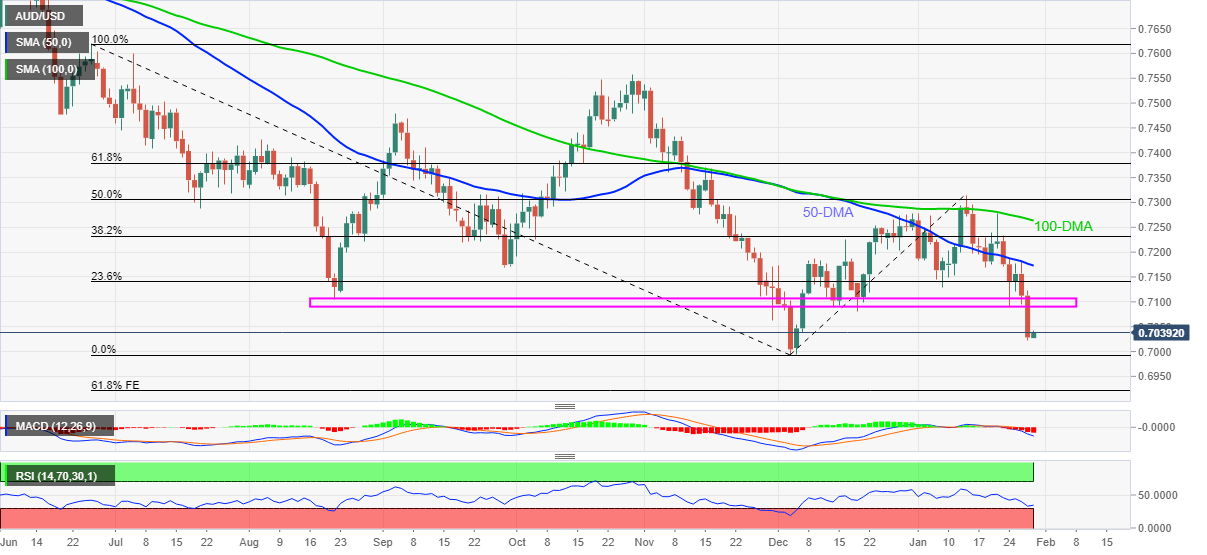
Trend: Further weakness expected
- USD/JPY holds onto intraday gains around two-week top.
- Yields rebound, S&P 500 Futures print mild gains as markets digest Fed moves.
- IMF signals Fed tightening will exert downside pressure on yen, pushes BOJ for more easy money policies.
- Tokyo CPI eases in January, US Core PCE Inflation data eyed.
USD/JPY grinds higher around a fortnight high, taking rounds to the intraday top near 115.40 during the initial hours of Tokyo open on Friday.
In doing so, the yen pair rises for the third consecutive day amid a rebound in the US Treasury yields, as well as the International Monetary Fund’s (IMF) push for easy Bank of Japan (BOJ) policies.
It’s worth noting that Tokyo Consumer Price Index (CPI) for January eased to 0.5% versus 0.6% expected while the Tokyo CPI ex Food, Energy dropped below -0.3% forecast to -0.7% YoY.
Early Friday in Asia, IMF’s Deputy Director of the Asia and Pacific Department Odd Per Brekk joined IMF Japan Chief Ranil Salgado to hint at the further downside pressure on the yen, as well as suggest accommodative monetary policy to the Bank of Japan. The executives also highlighted a bearish bias for the Japanese yen due to the Fed’s latest hawkish stand.
Read: IMF urges BOJ to consider targeting shorter-term yields
That said, the pair’s recent upside also takes clues from the firmer US Treasury yields, up to one basis point (bp) to 1.81% by the press time.
The US bond yields eased after the US Federal Reserve (Fed) indirectly confirmed the March rate hike and cited room for more lift-offs. However, the bond buyers were recently stopped by the upbeat US data.
During the previous day, Advance Q4 US GDP rose 6.9% annualized versus 5.5% market consensus and 2.3% prior. On the same line was the US Initial Jobless Claims for the week ended in January 21that came in 206K compared to 260K expected and 290K previous. It should be noted, however, that the US Durable Goods Orders for December dropped by -0.9% for December, below -0.5% market consensus.
In addition to the US data and IMF comments, fears of Russia-Ukraine tension also underpin the US Treasury yields and favor USD/JPY buyers.
That said, the pair bulls may now await the US Core PCE Price Index figures for December as they’re considered the Fed’s preferred version of inflation. Markets expect a 4.8% YoY figure versus 4.7% prior.
Read: US PCE Inflation Preview: Dollar rally has more legs to run
Technical analysis
A clear upside break of November 2021 high of 115.52 becomes necessary for the USD/JPY bulls to aim for the last month’s peak surrounding 116.35. In absence of this, the quote may witness a pullback towards the 21-DMA level near 114.85.
- GBP/USD struggles to keep the bounce off five-week low.
- Bearish MACD signals, sustained trading below short-term key supports favor sellers.
- Fortnight-old resistance line, 21-DMA challenge immediate upside moves.
GBP/USD fades the corrective pullback from a horizontal area established since early November, retreating to 1.3380 amid Friday’s Asian session.
The cable pair dropped during the last two trading sessions before the bears took a breather around the five-week low of 1.3357.
That said, the rebound struggles around the 61.8% Fibonacci retracement (Fibo.) level of December-January upside, near 1.3390, of late.
In addition to the immediate Fibo. resistance, the 50-DMA and a descending trend line from January 14, respectively around 1.3420 and 1.3470, act to challenge the GBP/USD buyers.
It’s worth noting that bearish MACD signals and downbeat RSI conditions, not oversold, are in favor of the GBP/USD sellers.
As a result, the fresh selling may wait for a clear downside break of the aforementioned horizontal support stretched from November 11, around 1.3350-60.
Following that, 1.3280 may act as a buffer during the GBP/USD south-run targeting December’s low near 1.3160.
GBP/USD: Daily chart
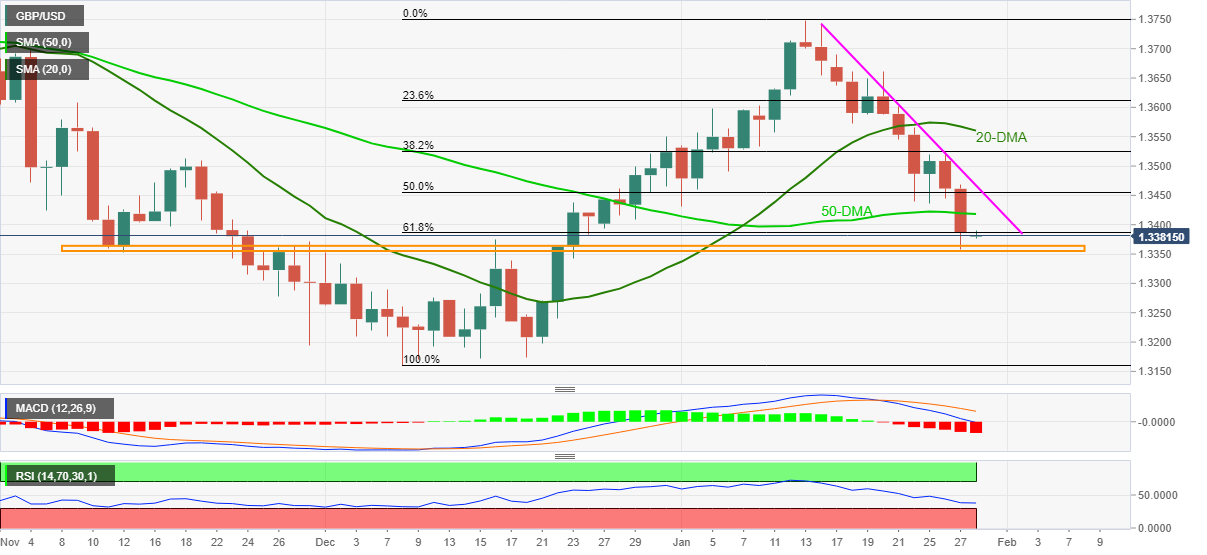
Trend: Further weakness expected
| Pare | Closed | Change, % |
|---|---|---|
| AUDUSD | 0.70341 | -1.11 |
| EURJPY | 128.552 | -0.27 |
| EURUSD | 1.11437 | -0.84 |
| GBPJPY | 154.375 | 0 |
| GBPUSD | 1.3381 | -0.6 |
| NZDUSD | 0.65808 | -1.01 |
| USDCAD | 1.27408 | 0.58 |
| USDCHF | 0.931 | 0.82 |
| USDJPY | 115.366 | 0.66 |
“The Bank of Japan (BOJ) should consider further steps to make its ultra-easy monetary policy more sustainable, such as steepening the yield curve by targeting a shorter maturity than the current 10-year yield,” said an executive from the International Monetary Fund (IMF), per Reuters.
Odd Per Brekk, Deputy Director of the IMF's Asia and Pacific Department, crossed wires via Reuters during early Friday in Asia as the executive said, “The BOJ must clearly communicate that the move would be aimed at enhancing the effect of its ultra-easy policy, not at withdrawing stimulus.”
Key quotes
Unlike in other advanced economies, we see inflation in Japan over the next few years moving in the 1% range, which is below the BOJ's target.
This means that the BOJ should continue its accommodative monetary policy stance.
We think YCC (Yield Curve Control) has been successful. It has worked well. But we have also seen some adverse side-effects on the financial sector.
Now is not the time to do this. It's something to consider if you need to strengthen policy or respond to shocks.
While the recent rise in food and energy costs will prove temporary, Japan will see inflation momentum build up this year as consumption rebounds and allows companies to pass on some of the higher costs to households.
To get inflation sustainably to the 2% target requires a broader policy strategy.
Our preliminary assessment is that japan's current account in 2021 was in line with fundamentals, this also holds for yen exchange rate.
It's important to keep in mind BOJ's policy is focused on inflation target not exchange rates.
Exchange rates are outcome rather than target of Japan's monetary policy.
It's worth noting taht IMF Japan Chief Ranil Salgado also spoke after IMF's Brekk while saying, "If markets become volatile due to fed tightening cycle, that could have the other impact on yen due to its safe-haven status," per Reuters.
Additional comments from IMF's Salgado
Fed tightening cycle could widen interest rate differentials between u.s. and japan, which could put downward pressure on yen.
China slowdown can be a downside risk through trade.
USD/JPY picks up bids
Following the news, USD/JPY remains firmer around a two-week high flashed the previous day, refreshing intraday high to 115.43 as Tokyo opens for Friday.


© 2000-2026. Sva prava zaštićena.
Sajt je vlasništvo kompanije Teletrade D.J. LLC 2351 LLC 2022 (Euro House, Richmond Hill Road, Kingstown, VC0100, St. Vincent and the Grenadines).
Svi podaci koji se nalaze na sajtu ne predstavljaju osnovu za donošenje investicionih odluka, već su informativnog karaktera.
The company does not serve or provide services to customers who are residents of the US, Canada, Iran, The Democratic People's Republic of Korea, Yemen and FATF blacklisted countries.
Izvršenje trgovinskih operacija sa finansijskim instrumentima upotrebom marginalne trgovine pruža velike mogućnosti i omogućava investitorima ostvarivanje visokih prihoda. Međutim, takav vid trgovine povezan je sa potencijalno visokim nivoom rizika od gubitka sredstava. Проведение торговых операций на финанcовых рынках c маржинальными финанcовыми инcтрументами открывает широкие возможноcти, и позволяет инвеcторам, готовым пойти на риcк, получать выcокую прибыль, но при этом неcет в cебе потенциально выcокий уровень риcка получения убытков. Iz tog razloga je pre započinjanja trgovine potrebno odlučiti o izboru odgovarajuće investicione strategije, uzimajući u obzir raspoložive resurse.
Upotreba informacija: U slučaju potpunog ili delimičnog preuzimanja i daljeg korišćenja materijala koji se nalazi na sajtu, potrebno je navesti link odgovarajuće stranice na sajtu kompanije TeleTrade-a kao izvora informacija. Upotreba materijala na internetu mora biti praćena hiper linkom do web stranice teletrade.org. Automatski uvoz materijala i informacija sa stranice je zabranjen.
Ako imate bilo kakvih pitanja, obratite nam se pr@teletrade.global.
транcфери