- Analiza
- Novosti i instrumenti
- Vesti sa tržišta
Forex-novosti i prognoze od 30-01-2022
- Silver prints seven-day downtrend, remains pressured around three-week low.
- 78.6% Fibonacci retracement level tests bears targeting monthly low, 50-DMA adds to the upside filters.
- The sluggish Momentum line hints at further grinding at the multi-day bottom.
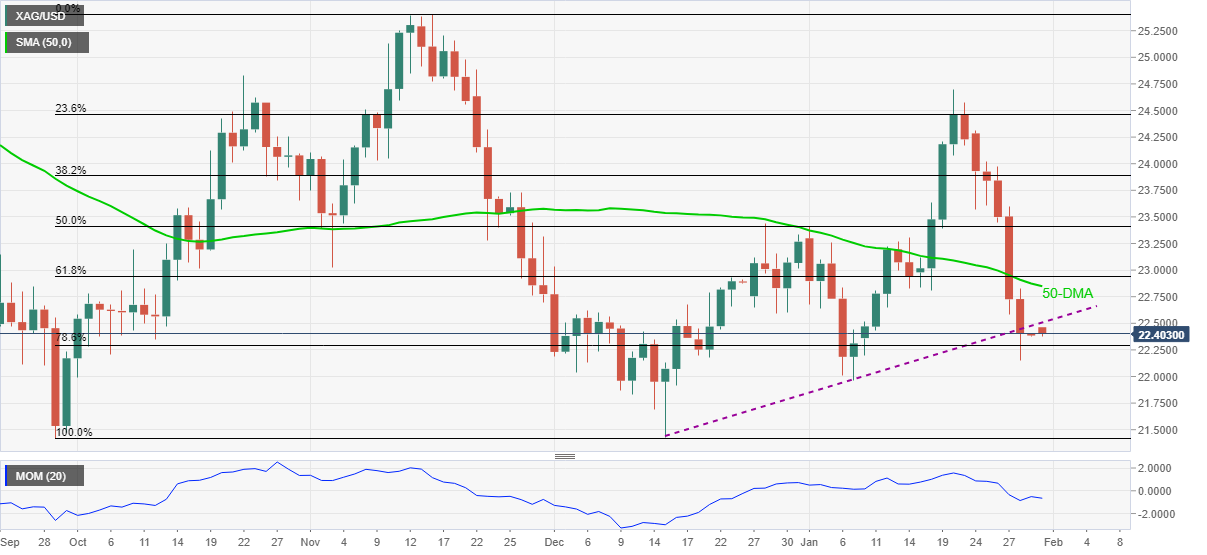
Silver (XAG/USD) remains on the back foot around $22.40, down 0.10% intraday during Monday’s Asian session.
In doing so, the bright metal remains pressured near the monthly low while staying between the previous support line from December 15 and the 78.6% Fibonacci retracement (Fibo.) of September-November upside.
It should be noted, however, that the downbeat Momentum and sustained trading below 50-DMA keep bears hopeful to refresh the monthly low, currently around $21.95.
Following that, the double bottoms marked in 2021 surrounding $21.42 will be crucial to watch.
Meanwhile, corrective pullback needs to cross the aforementioned support-turned-resistance line near $22.50 to aim for the 50-DMA level of $22.85.
During the XAG/USD upside past $2.85, the $23.00 threshold will test the buyers before directing them to the 50% Fibo. level near $23.41.
Silver: Daily chart
Trend: Further weakness expected
- GBP/USD bulls are taking control with eyes on a significant correction for the opening sessions.
- Bears will be lurking near old support on the daily time frame.
The following illustrated a bearish bias on the daily chart for GBP/USD. The bulls are correcting the bearish impulse on the daily chart and a move into retest old support near 1.3440 could on the cards for the sessions ahead. However, bears will be looking for a discount should the resistance hold initial tests:
GBP/USD daily chart
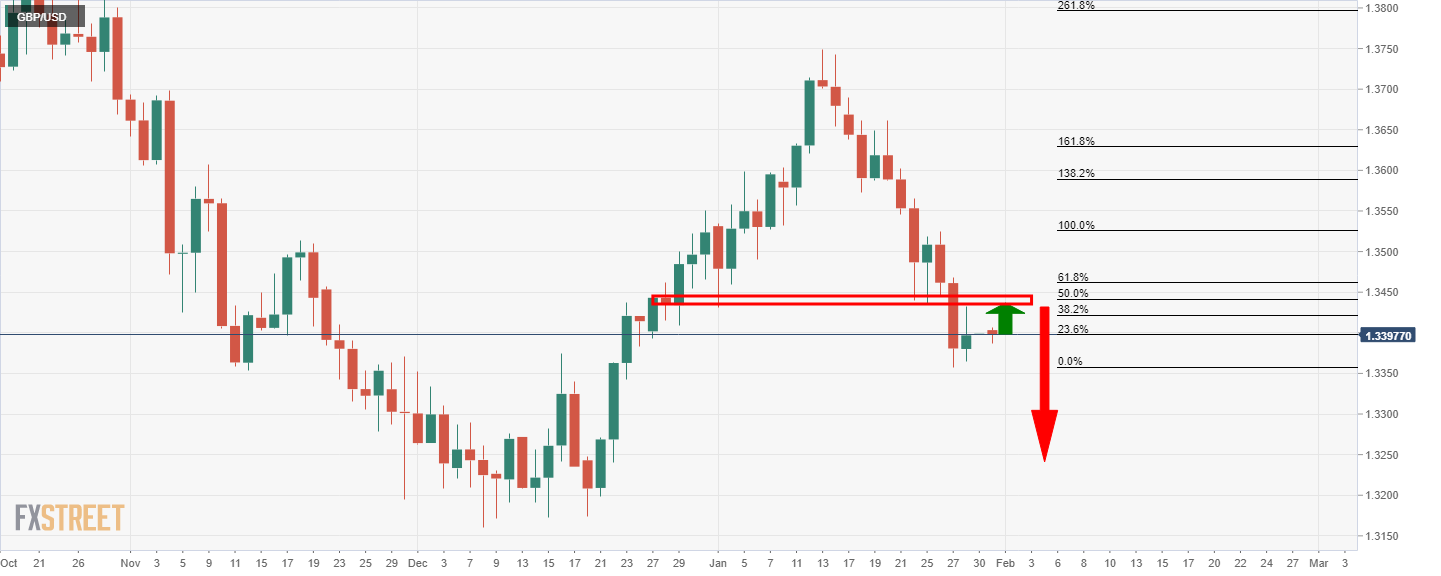
As illustrated in the daily chart above, a move into the old support might be met with selling interest which would open risk of mitigation of the price imbalance in December's bull rally from near 1.3170.
GBP/USD H4 chart
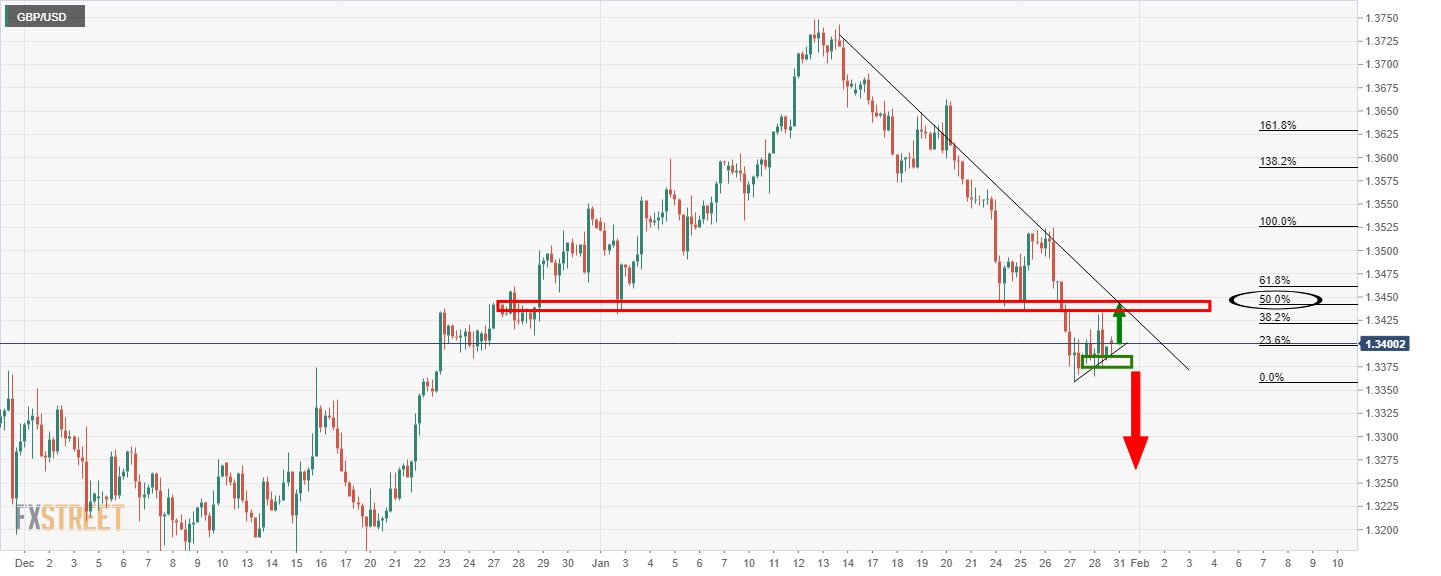
From a 4-hour perspective, the bears will want to see the price rejected at the prior support base which means the trendline resistance is near a 50% mean reversion. A break below the horizontal support of 1.3380 would be expected to open the way to the daily target area.
- USD/CAD grinds higher around three-week top, oil prices offer a firmer start to the week.
- BOC’s Macklem defends last week’s inaction, also cites less comfort with inflation.
- US Senate braces for a law to sanction Russia, OPEC+ likely to keep pre-planned output hike on the table.
- A light calendar at home/abroad highlights risk catalysts as the key drivers.
USD/CAD struggles to extend the three-day uptrend around the monthly high, recently taking rounds to 1.2775-80 amid Monday’s Asian session.
In doing so, the Loonie pair buyers find themselves challenged by the firmer oil prices, as well as comments from the Bank of Canada (BOC) Governor Tiff Macklem. Also testing the USD/CAD buyers is the absence of major catalysts and cautious mood in the market.
That said, WTI Crude Oil prices rise 0.40% to $87.00 by the press time. In doing so, the oil buyers stay hopeful amid news from Reuters suggesting that “US senators are very close to reaching a deal on legislation to sanction Russia over its actions on Ukraine, including some measures that may take effect before any invasion, two leading senators said on Sunday.”
Also favoring that oil prices are chatters that the global oil producers may not be able to match production hike targets even if they go ahead with planned output rise during this week’s OPEC+ meeting. That said, OPEC+ is a group of the Organization of the Petroleum Exporting Countries (OPEC) and its allies led by Russia.
At home, the last week’s BOC inaction got criticized and hence pushed BOC Governor Macklem to mention during the weekend comments, shared via Globe & Mail, “I’m not comfortable with where inflation is, but I don’t regret the actions we took.”
On the other hand, Federal Reserve’s (Fed) hawkish halt got largely praised and fuelled the US dollar until Friday’s US Q4 Employment Cost Index (ECI) eased to 1.0% from 1.2% market consensus and 1.3%. The wage-related data challenged the market’s previous concerns of 50 basis points (bps) of a rate hike by the Fed when it meets in March. It should be noted, however, that the Fed’s preferred gauge of inflation, namely Core PCE Price Index for December rose to 4.9%, versus 4.8% forecast and 4.7% prior, to keep the Fed hawks on the table.
Following the US data release, Federal Reserve Bank of Minneapolis President Neel Kashkari said that he expects Fed to raise rates at the March meeting. Though, the policymaker emphasized the importance of incoming data while also saying, “Have to see how data plays out.” On the same line was Raphael Bostic, president of the Fed’s Atlanta branch who reiterated his call for three Fed rate lifts in 2022, in an interview with the Financial Times (FT), with the first coming in March. “If the data say that things have evolved in a way that a 50 basis point move is required or [would] be appropriate, then I’m going to lean into that . . . If moving in successive meetings makes s the US 10-year Treasury yields dropped three bps to 1.778% whereas the Wall Street benchmarks had a positive day to end the week.
Against this backdrop, the US 10-year Treasury yields dropped three bps to 1.778% whereas the Wall Street benchmarks had a positive day to end the week. That said, the S&P 500 Futures print mild loss at the latest.
Considering a lack of major data/events on Monday, USD/CAD prices may rely on the risk catalysts while Friday’s jobs report for the US and Canada will be crucial.
Read: USD/CAD Weekly forecast: Fed promise trumps BOC pause
Technical analysis
Unless declining back below the 50-DMA level surrounding 1.2720, USD/CAD bulls can keep 1.2800 and the monthly high of 1.2813 on the radar.
- EUR/USD seesaws around the lowest levels since June 2020.
- Friday’s candlestick, oversold RSI conditions test bears at multi-day low.
- Rebound remains elusive below 2021 bottom, 61.8% Fibonacci retracement of 2017-18 upside.
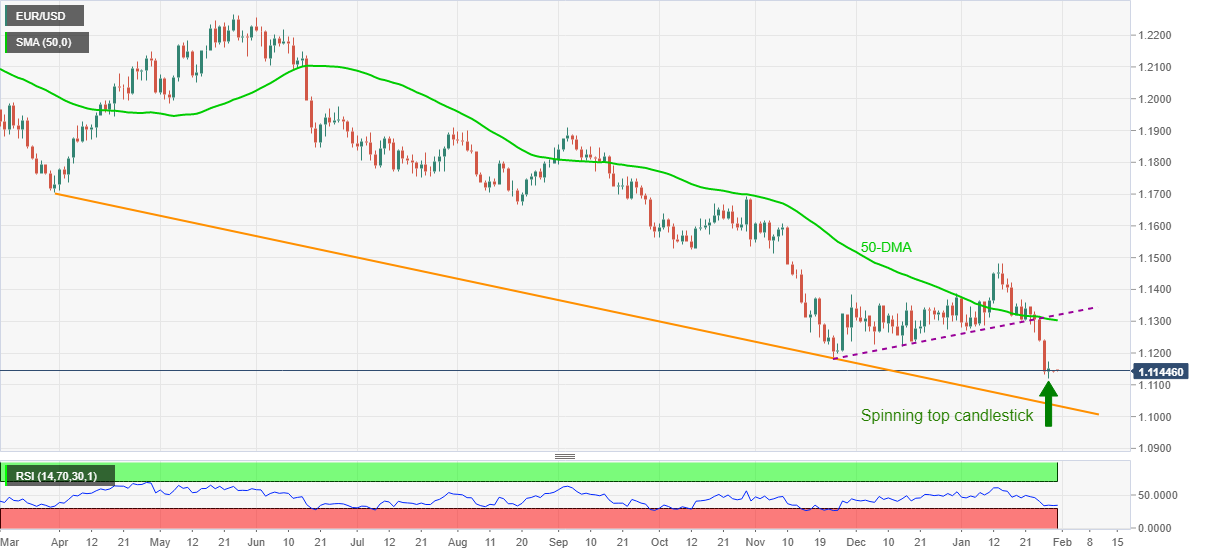
EUR/USD remains sidelined around 1.1145, keeping Friday’s corrective pullback from multi-day low amid a quiet start to the week’s trading.
In doing so, the major currency pair justifies Friday’s bullish spinning top candlestick amid oversold RSI conditions.
However, the last year’s low marked in December 2021 joins 61.8% Fibonacci retracement (Fibo.) of the pair’s 2017-18 advances to highlight 1.1185 as the key upside hurdle.
EUR/USD: Weekly chart
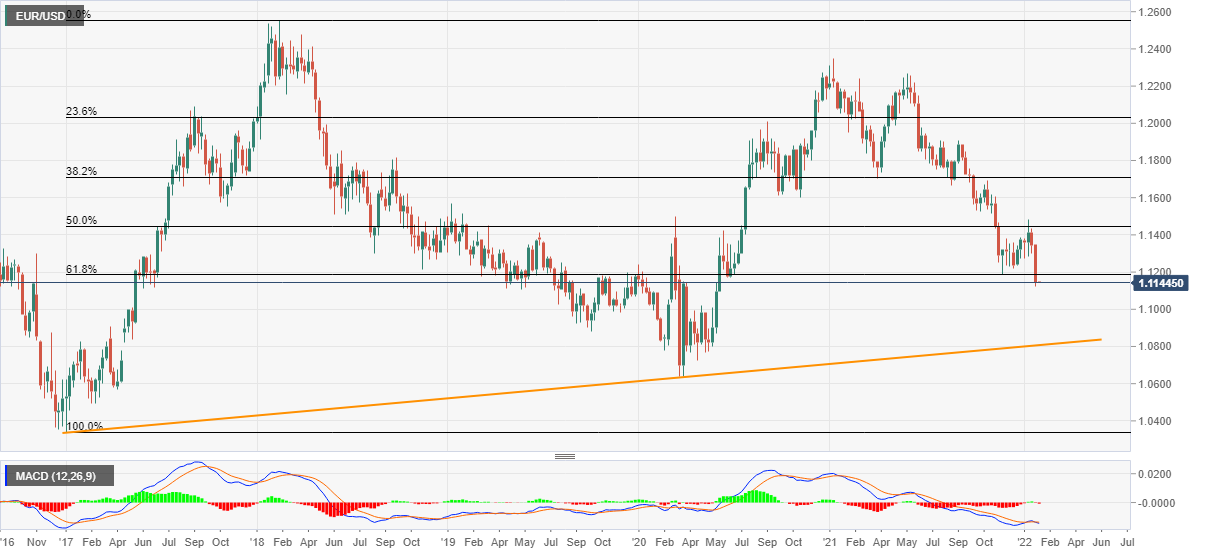
Trend: Bearish
If the pair manages to cross the 1.1185 resistance confluence, the corrective pullback could eye the 50-DMA level near 1.1300.
During the quote’s upside past 1.1300, the previous support line from November 24, 2021, near 1.1320 will act as an extra filter to the north before highlighting the December 2021 peak of 1.1386 for the EUR/USD bulls.
Alternatively, a downward sloping trend line from March 2021, near 1.1030, will lure the EUR/USD bears on breaking the recent multi-day bottom around 1.1120.
EUR/USD: Daily chart
Trend: Bearish
- Gold is being held up by critical support on the daily chart.
- The week ahead and key events could move the needle as bulls ad bears battle it out
- XAU/USD poised for further losses on Fed's hawkish stance
The price of gold, XAU/USD, ended the week on the front foot and was correcting from the lows of last week's bearish run from $1,780, moving in on the prior day's support near $1,800. Trading around Friday's close near $1,791, the yellow metal is on thin ice, technically, as it balances upon critical daily trendline support for the open.
Risk appetite improved on Friday. World stocks rallied with corporate earnings taking up the spotlight which was a positive focus and welcoming distraction from the geopolitical turmoil and Federal Reserve tightening concerns. Economic data also helped to ease inflation worries, which left the US dollar in consolidation and US yields on the backfoot.
US Treasury yields fell across the curve on Friday as the Fed's favoured inflation gauge, the core personal consumption expenditure price index (PCE), stayed within expectations. In the 12 months through December, the PCE increased 5.8%. That was the largest advance since 1982 and followed a 5.7% year-on-year increase in November. Nevertheless, the 2-year and the 10-year yield curve steepened to as much as 65.10 basis points after hitting its narrowest spread since November 2020 on Thursday.
The outcome was significant because the Federal Reserve on Wednesday indicated it is likely to raise rates in March when it also reaffirmed plans to end its pandemic-era bond purchases at the same time. This would clear the way for launching a significant reduction in its asset holdings which has the markets on edge, which had been weighing on stocks and supporting the US dollar.
''The Fed's hawkish tone is sapping risk appetite from the market, but safe-haven flows also remain subdued despite rising risks of a conflict in Ukraine, leaving investors with few avenues toward refuge,'' analysts at TD Securities explained. ''We expect that the precious metals complex will struggle to attract capital in this context.'' This is said after gold recorded its biggest weekly loss since August.
The week ahead
Meanwhile, the week ahead could be a critical one for gold considering the lineup of US events that include the US Nonfarm Payrolls jobs data and US ISM numbers.
''More regional surveys for January will be released early next week, so expectations could change, but the surveys already released point to declines in both ISM indexes,'' analysts at TD Securities said, ''Weakening can likely be explained in large part by temporary fallout from Omicron, but a fading of the boost from fiscal stimulus is probably causing some slowing as well.''
With regards to the jobs data, the analysts explained, ''the recovery in employment was probably temporarily interrupted by the Omicron-led surge in COVID cases. Many of the employees who had to isolate likely continued to be paid, and thus remained on payrolls, but many were likely not paid. The report will probably show continued strength in wage gains. The report will include the annual revision to the data.''
Gold technical analysis
Analysts at ANZ Bank argued that gold looks vulnerable for further losses, having broken below its key moving averages to trade below $1,800/oz.
-
Gold, Chart of the Week: Supply flooded the market in $1,850's, USD bulls hold the reins
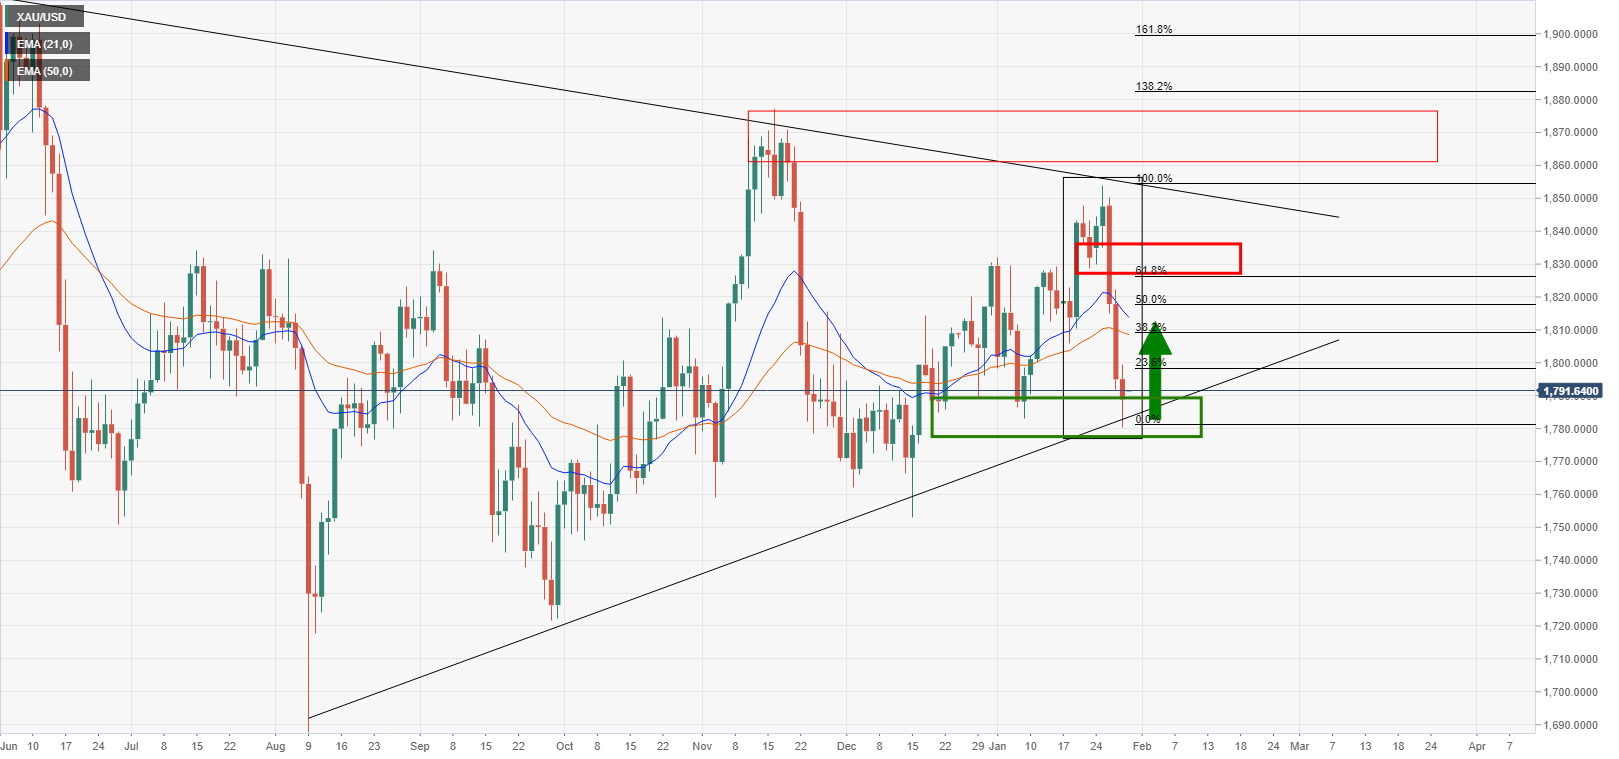
With that being said, the price could be on the verge of a significant upside correction for the sessions ahead considering the price has run into a wall of support as illustrated above near $1,780. The 21 and 50-day EMAs coincide with a 38.2% ratio and a 50% mean reversion thereafter which could draw in the price towards $1,810/820.
- NZD/USD grinds lower around multi-month bottom, offers no surprise on the week-start.
- Fed policymakers stay hawkish after signaling March rate hike, US ECI allowed bears to take a breather of late.
- China PMI eased before a week-long holiday season, New Zealand/US jobs report will be the key this week.
- Geopolitical tension surrounding Russia escalates, no major data/event to watch on Monday.
NZD/USD dribbles around 0.6550, struggling to keep late Friday’s bounce off a 16-month low amid a quiet start to the week.
The Kiwi pair printed the heaviest weekly fall since mid-August 2021 in the last week on the US Federal Reserve’s (Fed) hawkish halt. Also adding to the pair’s weakness was the Omicron spread in New Zealand (NZ) and geopolitical concerns surrounding Russia-Ukraine. In doing so, the quote ignored the upbeat NZ Consumer Price Index (CPI) for the fourth quarter (Q4). However, this week’s employment data from the US and New Zealand will be important for the pair traders amid fresh concerns challenging the Fed’s 0.50% rate hike in March.
US Dollar Index (DXY) rose to the highest levels since July 2020 before retreating from 97.44 on Friday after the US Q4 Employment Cost Index (ECI) eased to 1.0% from 1.2% market consensus and 1.3%. The wage-related data challenged the market’s previous concerns of 50 basis points (bps) of a rate hike by the Fed when it meets in March. It should be noted, however, that the Fed’s preferred gauge of inflation, namely Core PCE Price Index for December rose to 4.9%, versus 4.8% forecast and 4.7% prior, to keep the Fed hawks on the table.
Following the US data release, Federal Reserve Bank of Minneapolis President Neel Kashkari said that he expects Fed to raise rates at the March meeting. Though, the policymaker emphasized the importance of incoming data while also saying, “Have to see how data plays out.” On the same line was Raphael Bostic, president of the Fed’s Atlanta branch who reiterated his call for three Fed rate lifts in 2022, in an interview with the Financial Times (FT), with the first coming in March. “If the data say that things have evolved in a way that a 50 basis point move is required or [would] be appropriate, then I’m going to lean into that . . . If moving in successive meetings makes sense, I’ll be comfortable with that,” said Fed’s Bostic per FT.
Elsewhere, New Zealand Prime Minister Jacinda Ardern and Governor-General Dame Cindy Kiro are both in line for their covid test results as being among passengers asked to self-isolate after being on a flight with a positive case, per NZ Herald. The news also mentioned, “It comes as 103 new community cases of the virus were recorded in New Zealand yesterday, and one new death.”
It’s worth noting that Reuters recently ran a story suggesting that the US Senate is close to legislation to sanction Russia, which in turn will escalate the geopolitical tension between the West and Moscow. As a result, the risk-off can keep downside pressure on the Antipodeans.
Amid these plays, the US 10-year Treasury yields dropped three bps to 1.778% whereas the Wall Street benchmarks had a positive day to end the week.
Moving on, this Wednesday’s Q4 jobs report from New Zealand and monthly employment data from the US, up for publishing on Friday, will be crucial for NZD/USD prices forecasts. That said, a lack of major data/events on Monday will highlight the risk catalysts for fresh impulse.
Technical analysis
Unless rising back beyond a downward sloping previous support line from March 2021, around 0.6665-70, NZD/USD remains vulnerable to test the 50% Fibonacci retracement (Fibo.) of March 2020 to February 2021 upside, near 0.6465. That said, the RSI conditions hint at a corrective pullback before resuming the fortnight-old downtrend.
- It is a key week for AUD/USD traders with the RBA in focus.
- The overstretched net-short positions could result in a short squeeze with 0.71 eyed ar key resistance.
AUD/USD ended a bad week at a critical support area on the charts, however, traders will be keen to reposition themselves ahead of what could be a hawkish teat at the Reserve bank of Australia. For the open, 0.7010 will be an important level on the upside for the bulls to clear.
AUD/USD traded between 0.6967 and 0.7045 recovery mode after spiking through the December lows of 0.6993. The bulls managed to get the price back over the line to the upside to close there as bears cashed in ahead of another critical central bank week.
Short positions are relatively overstretched on AUD/USD due to the recent lack of an appetite for high-beta currencies/high appetite for USD. Should there be another step in the direction of policy normalisation at the RBA, owing to a tighter jobs market and higher inflation readings for the fourth quarter, then traders could jump on the opportunity to force a timely correction on the daily charts, (see below).
''We expect the RBA to forecast trimmed mean inflation of 3% by mid-2022 in Friday’s Statement on Monetary Policy, with unemployment falling below 4% by the end of year,'' analysts at ANZ Bank said.
''These numbers will be referenced in Tuesday’s RBA Board statement, though we expect the RBA Board to say it will wait until wages growth accelerates further before it lifts the cash rate.''
''Its forecast for wages growth will likely point to a rate hike in the first half of 2023 as being its central case, but Lowe is expected to admit for the first time, in Tuesday’s statement and/or his speech the following day, that a move in 2022 is a possibility if wages growth comes through faster than forecast.''
AUD/USD technical analysis
For the open, 0.7010 will be key:
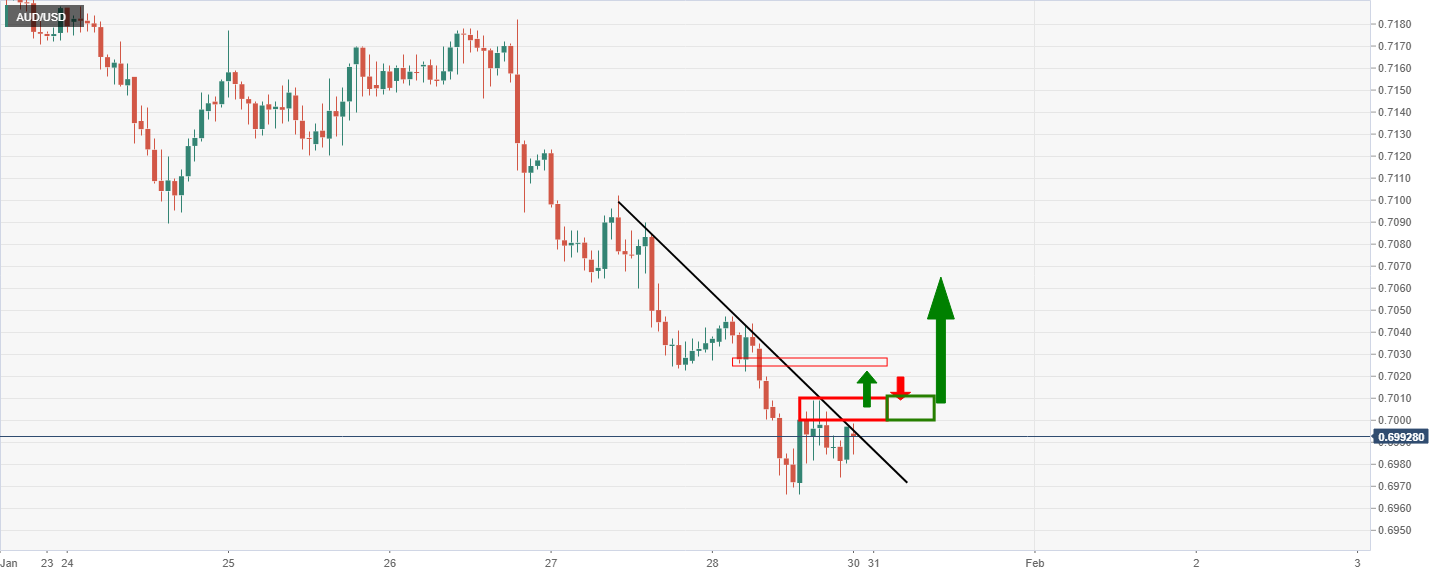
The hourly resistance at 0.7010 guards a breakout of the hourly downtrend. The bigger picture, however, is as follows:
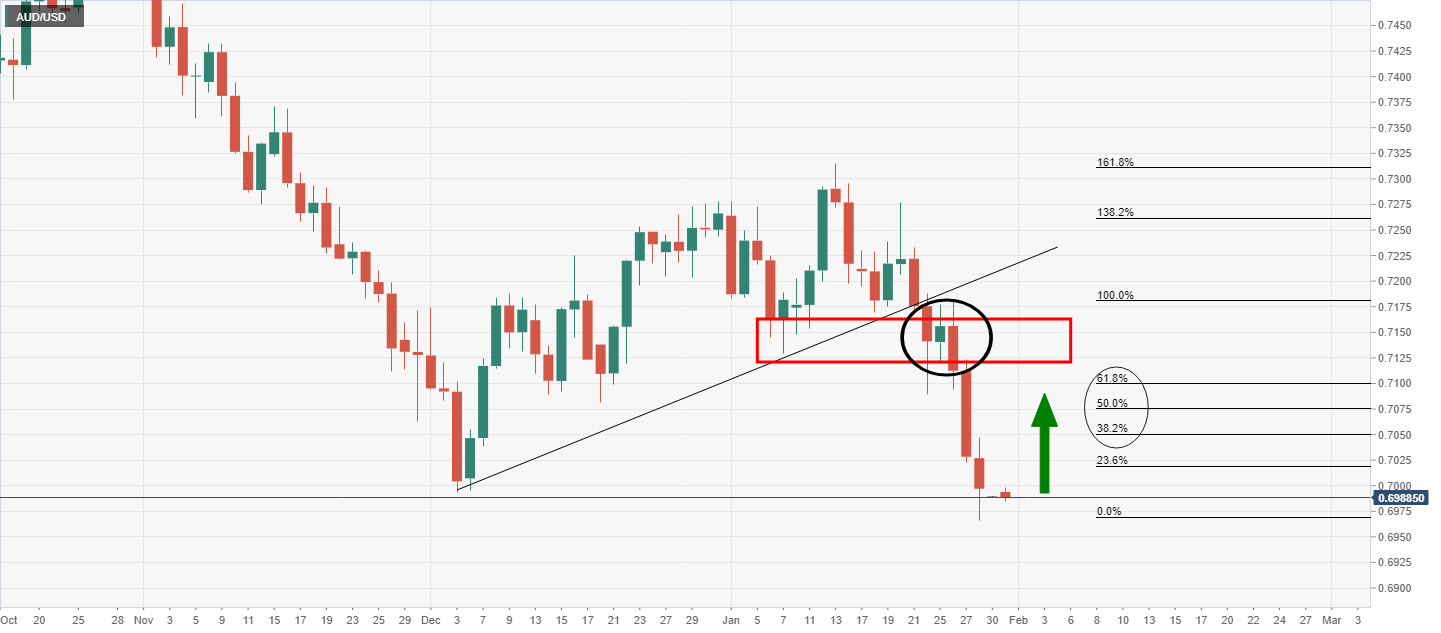
As per the chart above, the bulls can target the Fibonaccis on the way to the prior structure and the lower highs of the December bullish trend near 0.7130. The golden ratio, 61.8%, should be a key area near the psychological 0.71 round number. 0.7180 would be expected to act as a critical resistance below the counter trendline.
Failing that scenario, the bears could push the price into the abyss below 0.6950:
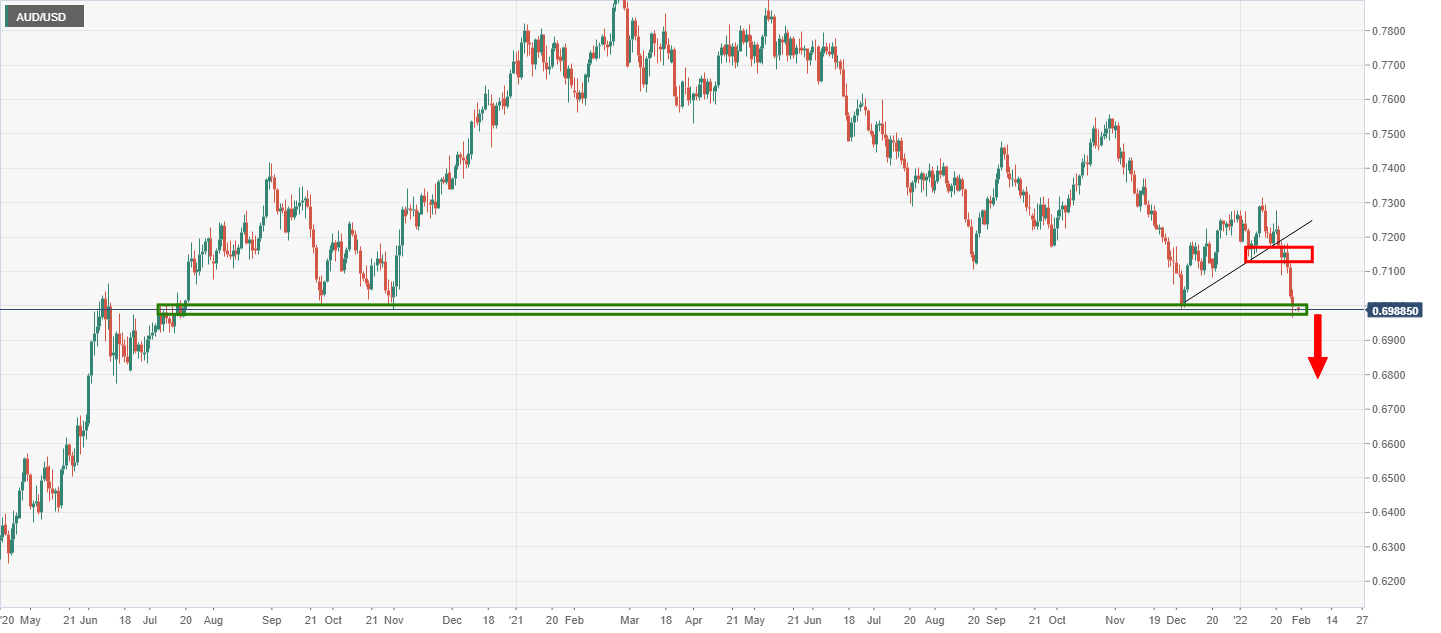
However, a correction would be the most typical course for the pair at this juncture prior to further downside:


© 2000-2026. Sva prava zaštićena.
Sajt je vlasništvo kompanije Teletrade D.J. LLC 2351 LLC 2022 (Euro House, Richmond Hill Road, Kingstown, VC0100, St. Vincent and the Grenadines).
Svi podaci koji se nalaze na sajtu ne predstavljaju osnovu za donošenje investicionih odluka, već su informativnog karaktera.
The company does not serve or provide services to customers who are residents of the US, Canada, Iran, The Democratic People's Republic of Korea, Yemen and FATF blacklisted countries.
Izvršenje trgovinskih operacija sa finansijskim instrumentima upotrebom marginalne trgovine pruža velike mogućnosti i omogućava investitorima ostvarivanje visokih prihoda. Međutim, takav vid trgovine povezan je sa potencijalno visokim nivoom rizika od gubitka sredstava. Проведение торговых операций на финанcовых рынках c маржинальными финанcовыми инcтрументами открывает широкие возможноcти, и позволяет инвеcторам, готовым пойти на риcк, получать выcокую прибыль, но при этом неcет в cебе потенциально выcокий уровень риcка получения убытков. Iz tog razloga je pre započinjanja trgovine potrebno odlučiti o izboru odgovarajuće investicione strategije, uzimajući u obzir raspoložive resurse.
Upotreba informacija: U slučaju potpunog ili delimičnog preuzimanja i daljeg korišćenja materijala koji se nalazi na sajtu, potrebno je navesti link odgovarajuće stranice na sajtu kompanije TeleTrade-a kao izvora informacija. Upotreba materijala na internetu mora biti praćena hiper linkom do web stranice teletrade.org. Automatski uvoz materijala i informacija sa stranice je zabranjen.
Ako imate bilo kakvih pitanja, obratite nam se pr@teletrade.global.
транcфери