- Analiza
- Novosti i instrumenti
- Vesti sa tržišta
Forex-novosti i prognoze od 02-02-2022
- GBP/USD struggles to extend four-day uptrend around a two-week high.
- Bullish Momentum, sustained trading beyond 100-day, 50-day EMAs keep buyers hopeful.
- Six-week-old support line adds to the downside filters, descending trend line from July lures buyers.
- Bank of England Interest Rate Decision: Gilts are the crucial topic
GBP/USD seesaws around a fortnight high near 1.3575 as traders brace for the Bank of England (BOE) monetary policy decision during Thursday’s Asian session.
The cable pair rose during the last four consecutive days to cross the 100-day EMA and the 50-day EMA but is struggling to surpass the 200-day EMA ahead of the key event. However, the upbeat Momentum line and likely hawkish outcome from the BOE keep GBP/USD buyers hopeful.
That said, a clear upside break of the 200-day EMA level of 1.3585 becomes necessary for the pair buyers to aim for a descending resistance line from late July, around 1.3635 at the latest.
Following that, an upward trajectory towards the January high of 1.3748 can’t be ruled out. Though, October 2021 tops near 1.3835 may test the GBP/USD bulls afterward.
Meanwhile, pullback moves will initially test the 100-day EMA level of 1.3538 before revisiting the 50-day EMA surrounding 1.3500.
Even if the quote drops below 1.3500, an ascending trend line from late December 2021, close to 1.3390, will be in focus.
GBP/USD: Daily chart

Trend: Further upside expected
Early Thursday morning in Asia, Reuters shared prepared statements from President Joe Biden's pick for various positions in the Federal Reserve (Fed), posted by the US Senate Committee.
“Sarah Bloom Raskin, President Joe Biden's pick to lead the Federal Reserve's regulatory work (Nominee for Fed’s Vice Chair for Supervision), plans to tell lawmakers on Thursday that it would not be her job to direct banks where to lend,” said Reuters.
The Nominee for Fed’s Vice Chair for Supervision also said her job would be to consult widely with experts inside and outside the Fed on how banks are managing their risks, rather than directing credit.
“Reducing inflation should be 'top priority for federal reserve while sustaining recovery,” mentions Fed Nominee Raskin.
Reuters adds, “Raskin has faced criticism from Republicans and some energy groups that if confirmed, she might discourage lending to fossil fuel companies.”
Moving on, US President Biden’s Nominee to the Federal Reserve Board Philip Jefferson said, per Reuters, “Tackling high inflation and keeping inflation expectations anchored should be a main priority for the central bank.”
"Today, the economy is facing two major challenges: the COVID-19 pandemic and inflation," Jefferson said in prepared remarks released ahead of a confirmation hearing on Thursday at the Senate Banking committee per Reuters.
"The spike in inflation we are seeing today threatens to heighten expectations of future inflation," adds US President Biden’s pick for Fed Board.
At last, Lisa Cook, one of U.S. President Joe Biden's nominees to the Federal Reserve Board, said the central bank's most important task is tackling high inflation, said Reuters.
“I agree with Chair Powell that our most important task is tackling inflation. High inflation is a grave threat to a long, sustained expansion," said Fed Board Nominee Cook.
FX reaction
The news adds to the market’s recently cautious sentiment ahead of the key monetary policy meetings by the European Central Bank and the Bank of England. However, the US dollar is yet to recover the latest losses.
Read: Forex Today: Dollar retains the weak stance ahead of BOE, ECB
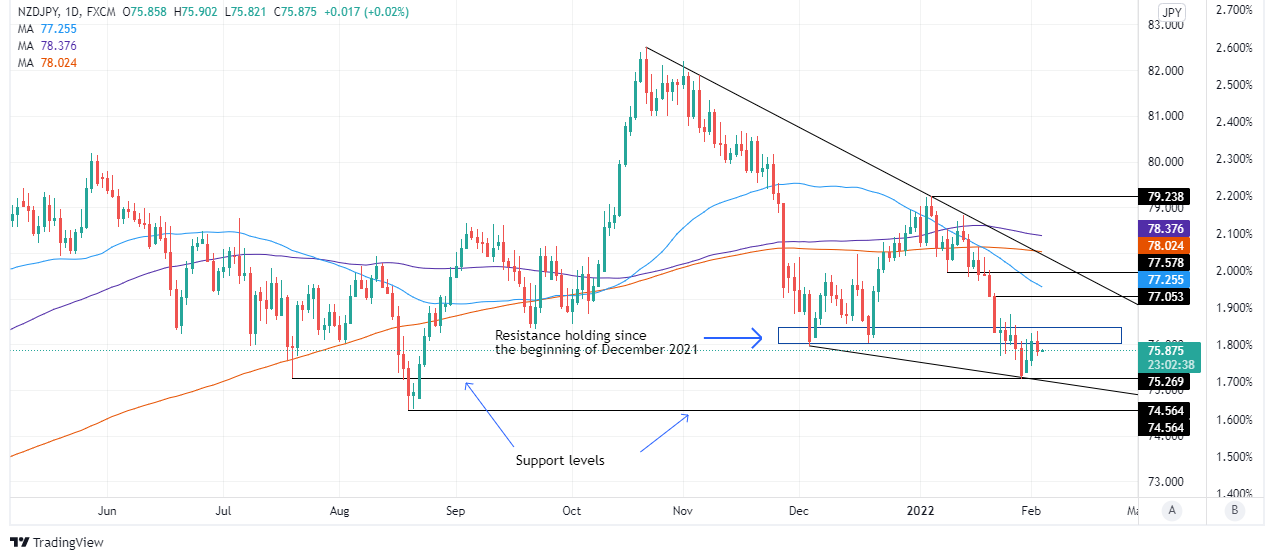
- The NZD/JPY is flat as the Asian Pacific session begins.
- NZD/JPY Technical Outlook: The path of least resistance is downwards, further cemented by the daily close beneath 76.00.
The NZD/JPY slides as the New York session finishes, down some 0.25%. At the time of writing, the NZD/JPY is trading at 75.89. The overall market sentiment is upbeat, except for the FX market. The JPY and the CHF posted gains between 0.50% and 0.56%, respectively. Meanwhile, the high beta currencies ended in the red, led by the NZD, which lost 1.95%.
On Wednesday, the NZD/JPY reached a weekly high at 76,26, followed by a fall towards 76.00, as European traders got to their desks. The drop was courtesy of NZD's weakness due to mixed employment numbers. Later on the day, during the North American session, the pair gave way for JPY bulls, who pushed the pair below the 76.00 figure.
NZD/JPY Price Forecast: Technical outlook
The NZD/JPY is downward biased, as depicted by the daily moving averages (DMAs), with a downslope residing above the spot price. Furthermore, failure to print a daily close below the 76.00 figure opened the door for further losses. That said, the first support level would be July 20, 2021, a daily low at 75.27, followed by August 19, 2021, a daily low at 74.56.
Contrarily, in the event of the cross-currency pair holding its ground against JPY bulls, the first resistance would be 76.00. A break above that level could pave the way for further gains. The next resistance would be January 26 daily high at 76.67, followed by January 21 cycle high at 77.05.
- EUR/USD grinds higher at weekly top after four-day rebound from 20-month low.
- Steady RSI, looming bullish cross of MACD favor buyers.
- 100-DMA becomes the key hurdle, 10-DMA limits pullback moves.
- ECB February Preview: Euro bulls hope for a hawkish ECB on hot EU inflation
EUR/USD portrays the pre-ECB anxiety while edging higher past 1.1300 during early Thursday morning in Asia. That said, the major currency pair seesaws around 1.1305 after refreshing the weekly top to 1.1330 the previous day.
The pullback moves could be linked to the quote’s failure to provide a daily closing beyond the 50-DMA level of 1.1310.
However, sustained trading beyond the previous resistance line from January 14 and 10-DMA, respectively around 1.1180 and 1.1260, keeps the EUR/USD buyers hopeful as they brace for the key monetary policy meeting by the European Central Bank (ECB).
Also adding strength to the bullish bias is the steady RSI line and the MACD conditions that tease bulls.
It’s worth noting that a broad support zone from late November near 1.1185-75 becomes the key to challenge EUR/USD bears.
Alternatively, a clear upside break of the 50-DMA level of 1.1310 will enable the EUR/USD bulls to aim for the 100-DMA surrounding 1.1435.
During the run-up, December 2021 top near 1.1385 and the 1.1400 threshold will act as intermediate halts.
EUR/USD: Daily chart
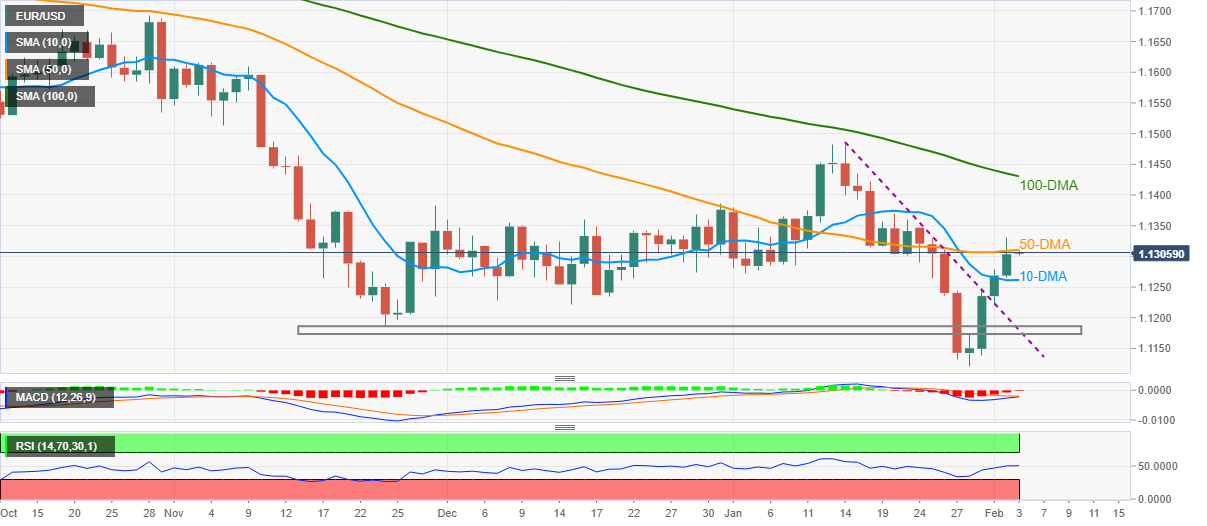
Trend: Further upside expected
“New Zealanders in Australia will be allowed to return without having to isolate in MIQ from February 28, and those in the rest of world from March 14,” said New Zealand (NZ) Prime Minister (PM) Jacinda Ardern as she releases a five-step plan of easing the covid-linked border controls during early Thursday morning in Asia, per ABC News.
Additional quotes
Instead of MIQ, those who are vaccinated will be allowed to self-isolate elsewhere.
We are well on our way to reaching that destination. But we are not quite there yet.
Fully vaccinated Kiwis and other currently eligible travellers from Australia will be able to travel to New Zealand from 11.59 pm Sunday 27 February, and instead of going into MIQ, will be able to self-isolate.
In step 2, two weeks later on Sunday 13 March, fully vaccinated New Zealanders and other currently eligible travellers from the rest of the world will also be able to travel into New Zealand without going through MIQ.
Step 3 begins from 11.59 pm 12 April. Here we further extend our border extension to include a large international student cohort of up to 5,000 students for entry ahead of semester 2 and temporary visa holders who still meet relevant visa requirements.
Step 4 sees the biggest expansion yet, and includes our Australian cousins and all other visitors and other visitors and business travellers who can normally enter New Zealand without a visa. This stage is likely to begin when we have much larger case numbers than we have now. For planning, we anticipate this stage will begin no later than July.
Step 5 begins in October and includes all other visitors and students who require a visa to enter New Zealand, with normal visa processing resuming.
NZD/USD renews intraday high but stays pressured…
Following the news, NZD/USD prices refreshed daily high to 0.6645 but remain depressed as markets turn cautious ahead of the key central bank meetings, namely the ECB and the BOE.
Read: NZD/USD bulls take a breather in pursuit of 0.67 the figure for days ahead
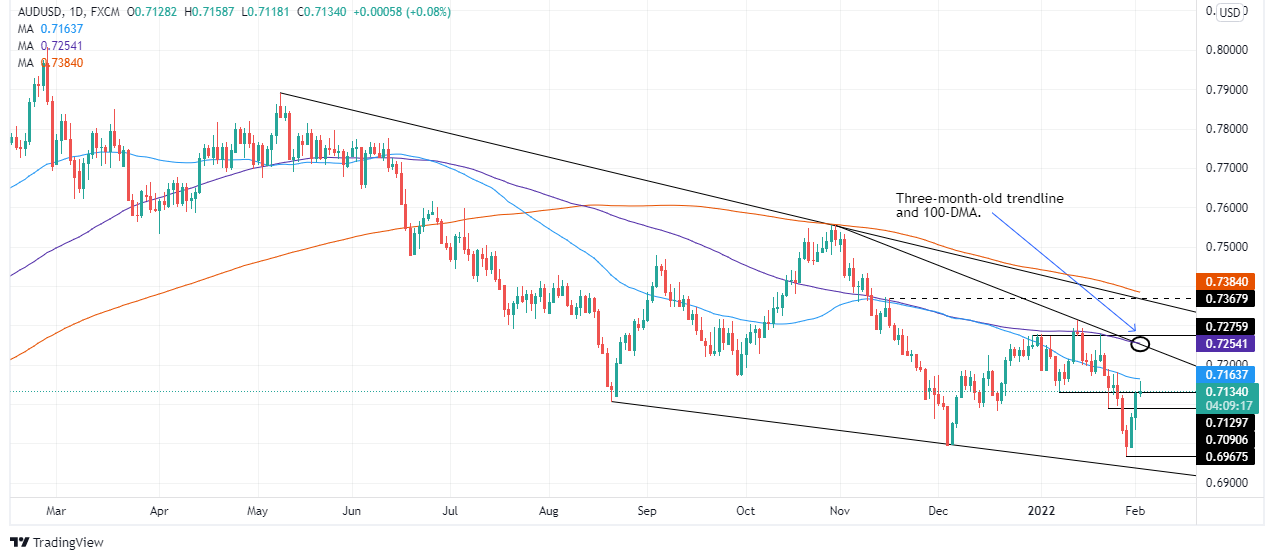
- AUD/USD bears are stalling at a critical daily resistance block.
- The bears are monitoring for bearish structures on lower time frames.
From a daily perspective, the AUD/USD has reached a potential resistance bloc which is guarding the M-formation's neckline near 0.7170. The price on Wednesday is forming a Bearish Doji.
AUD/USD daily chart
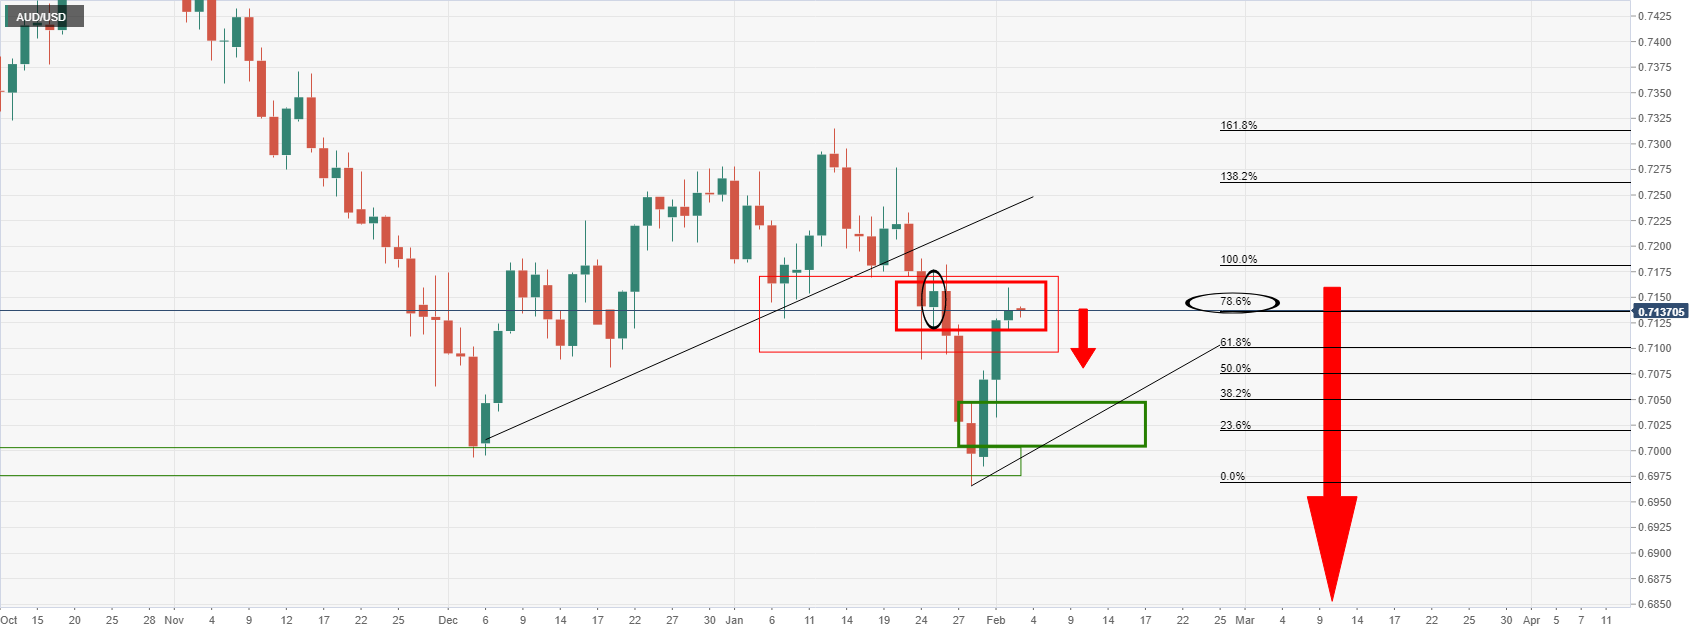
The bears will be looking for confirmation that this bullish correction may have ended from Thursday's candle's close. An ideal and textbook outcome would be a bearish engulfing candle such as this:
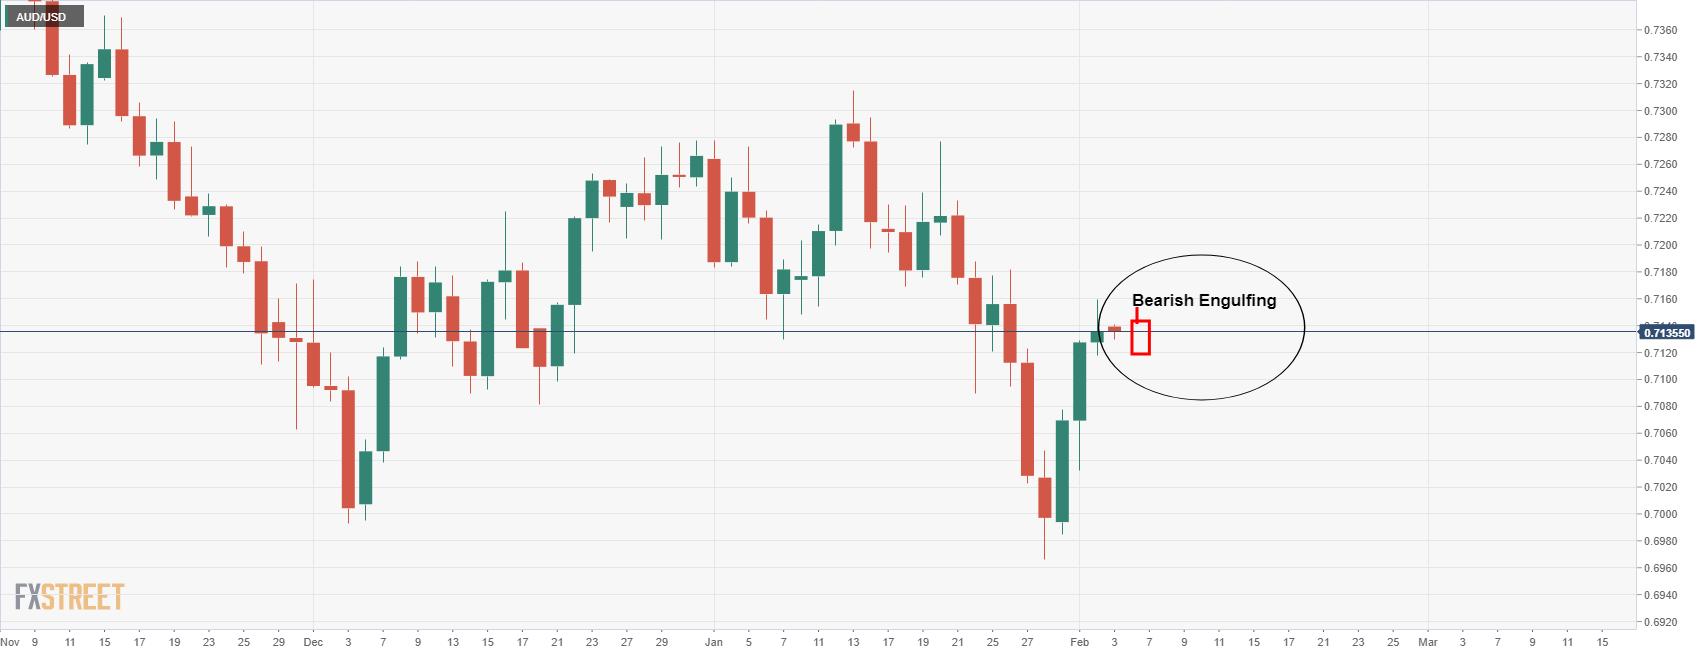
Bears will be monitoring price action from a 4-hour time frame in hope of a bearish structure over the coming days from which to engage and target a daily downside extension as illustrated above.
AUD/USD H4 chart
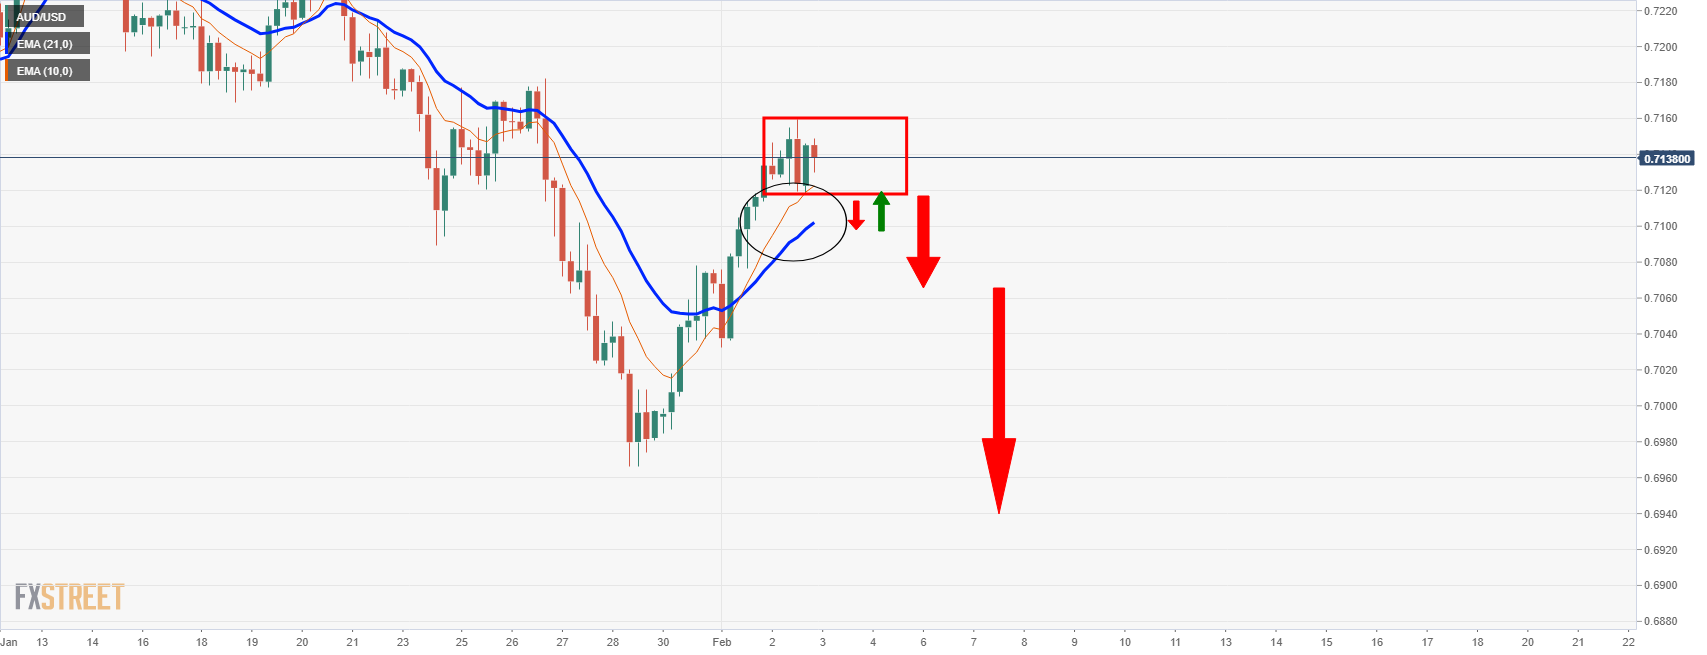
The moving averages are showing the price remains in bullish territory but bears wl be on the lookout for a bearish crossover with the 10 moving below the 21 EMA in the sessions ahead. In doing so, a newly formed resistance structure below 0.7120 could be the basis for the downside bias if it holds on subsequent bullish retests.
- NZD/USD stalls in the daily correction despite further weakness in the greenback.
- NZD/USD bulls still might not be throwing in the towel just yet.
NZD/USD stalled midweek as the correction met a prior low on the daily time frame. At 0.6635, the price is flat at the end of the North America session and is set to leave a Doji candle on the daily time frame.
As analysts at ANZ Bank said, ''the Kiwi had a whippy sort of a night, rallying up to around 0.6660 before coming back early this morning as the USD DXY put in a very mild recovery off lows and the AUD lost momentum following Lowe’s still measured tone in his speech yesterday.''
Recalling the Reserve Bank of Australia event earlier in the week, the Aussie dragged the kiwi along for a ride to the upside, despite the dovish tone set at the central bank. The markets appear to be setting aside the interest rate differentials for the time being and are enjoying a burst of life in risk appetite that has returned this week. The dollar bloc currencies have benefitted from ongoing weakness in the greenback as a consequence.
''While price action has been a bit whippy (which isn’t unusual), dips have tended to be shallow and it has been well supported on pull-backs,'' the analysts at ANZ bank argued.
''The data backdrop remains very strong, but at the moment, markets are thinking more about commodity prices and the post-Omicron outlook, and so in that regard, higher oil prices, which have spilt over (no pun intended) onto higher milk prices, and today’s NZ government border announcements bear watching.''
US jobs market in vouge
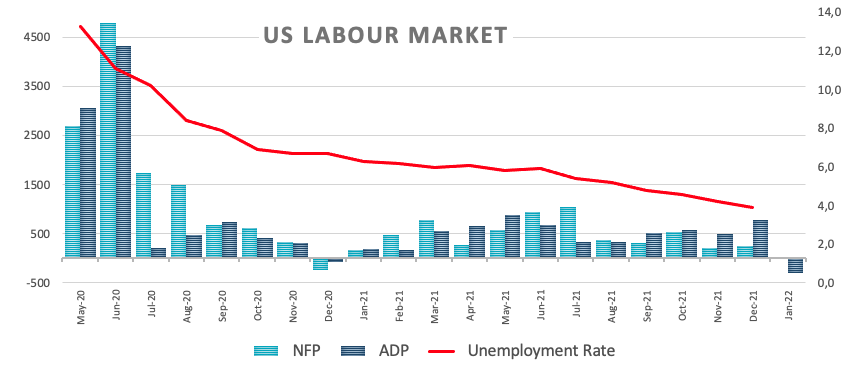
Meanwhile, the US dollar was once again on the back foot owing to a bearish prelude to this week's main event in US Nonfarm Payrolls on Friday. The dollar declined to a more than a one-week low on Wednesday after data showed a drop in US private sector employment in January due to the increase in COVID-19 infections. ADP private payrolls, which showed a 301,000 drop, was missing an estimate of 207k.
Also, the January decline followed a downwardly revised 776,000 increase in December, compared with the 807,000 gain initially reported. By sector, goods-producing jobs fell by 27,000, while service-providing jobs plunged by 274,000, with leisure and hospitality jobs down 154,000.
The chorus of less hawkish Fedspeak this week coupled with disappointing data has led to a decrease in pricing of Fed rate hikes in the futures markets. In late afternoon trading, US rate futures priced in about 4.7 hikes this year, or 118.6 basis points of policy tightening, down from the five rate increases seen over the last two days, Reuters reported. ''Futures also showed the probability of a 50-basis-point hike in March has settled at 12.5%, from as high as 32% late last week.''
NZD/USD technical analysis

The weekly outlook is bullish as per the M-formation neckline target.

The daily chart's deceleration could lead to a test of prior daily highs near 0.66 the figure first before the price finds more demand from there. This could lead to a continuation of the correction into a 61.8% ratio target near 0.67 the figure.
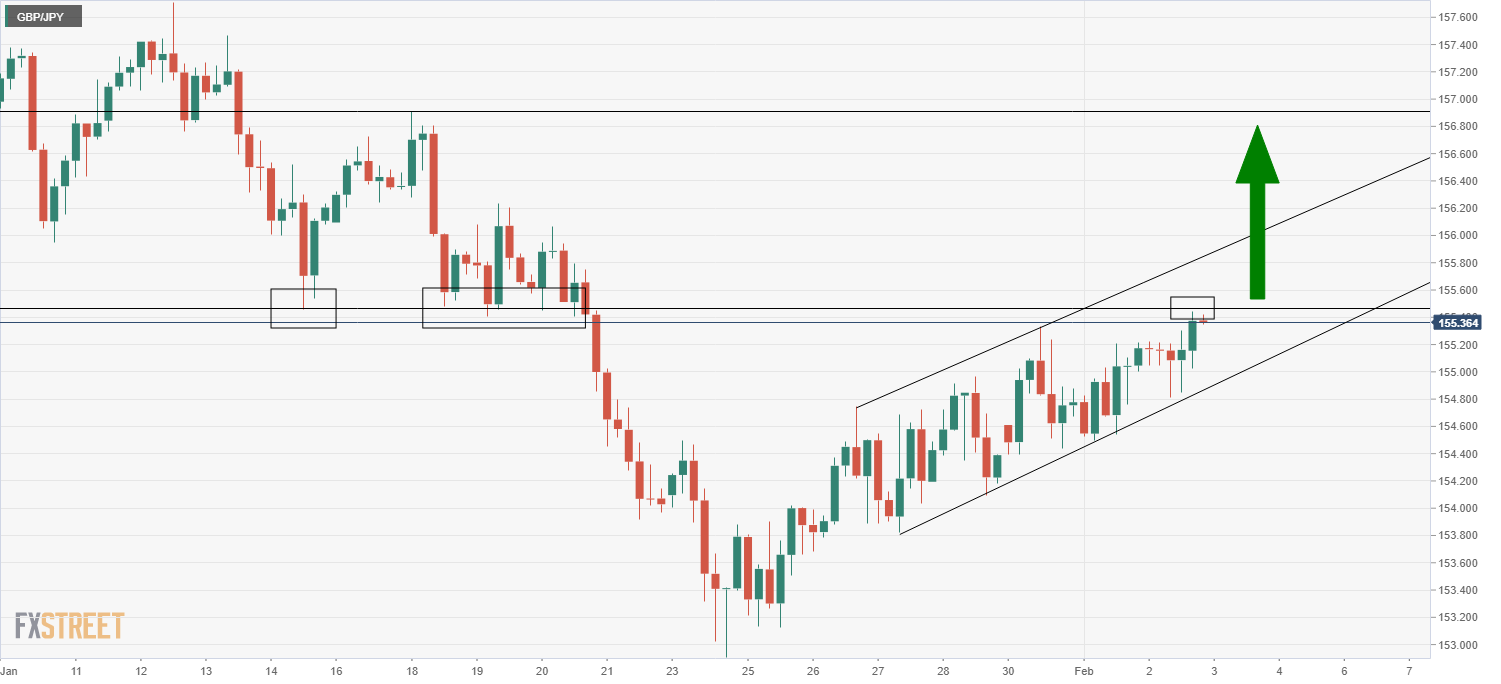
- GBP/JPY continued to advance on Wednesday as risk appetite improved the BoE’s policy decision day eve, remaining supported above 155.00.
- GBP/JPY has been trending higher, alongside equities, as of late within the confines of a bullish trend channel.
GBP/JPY continued to trend higher on Wednesday, gaining 0.2% on the day to hit fresh near-two-week highs whilst remaining well supported above the 155.00 level as global risk appetite continued to improve. The pair has been trending higher over the last week or so within the confines of a bullish trend channel, and has now rallied more than 1.5% from sub-153.00 January lows, in fitting with the recent recovery seen in global equity markets. The more risk-sensitive sterling tends to perform better versus the safe-haven yen in times when global equities are advancing.
Ahead of Thursday’s BoE meeting, where the bank is expected to hike interest rates by 25bps to 0.5% and outline quantitative tightening plans, GBP/JPY has been unable to push beyond resistance in the 155.40 area from mid-January. Should there be either a hawkish BoE surprise or a continued improvement in risk appetite, or both, on Thursday, the pair may well break above this level and have a run at the next resistance area at 157.00. Ahead of Thursday’s BoE meeting, however, trading conditions are likely to remain subdued as traders keep their powder dry and remain in wait-and-see mode.
Bank of Canada Governor Tiff Macklem on Wednesday said that there is some uncertainty about how quickly inflation will come down, according to Reuters. However, Macklem added that the bank is confident that inflation will eventually come down, and that the latest GDP data reinforced the view that Q4 2021 growth was strong. With labour markets tightening and evidence of capacity pressures increasing, he added, the BoC expects higher interest rates will be needed to bring inflation back to the 2.0% target. Finally, he noted that there is some evidence that Canadians have not been dipping into excess savings as of late.
Market Reaction
CAD has not seen any notable reaction to the latest remarks from Macklem, which were broadly in line with the tone of last week's meeting.
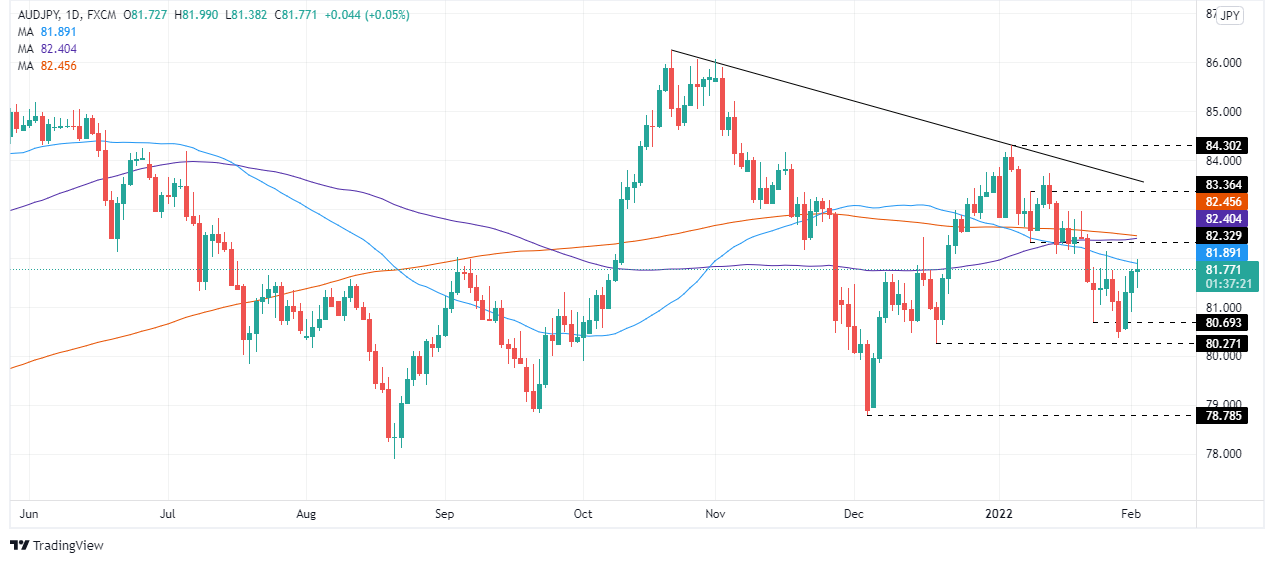
- The AUD/JPY advances despite a risk-off mood in the FX complex, up 0.01%.
- AUD/JPY Technical Outlook: Downward biased as long as it remains below 82.60.
On Wednesday, the Australian dollar pares losses against the low-yielder Japanese yen during the North American session. At the time of writing, the AUD/JPY is trading at 81.77.
The market sentiment in the FX complex is risk-off. The Japanese yen has strengthened as the New York session progressed. In the meantime, risk-sensitive currencies like the AUD, the NZD, and the CAD fall vs. the abovementioned.
AUD/JPY Price Forecast: Technical outlook
During the overnight session for American traders, the AUD/JPY meandered close to the 82.00 figure not reached since January 26 but failed to reclaim the abovementioned. From that point, broad safe-haven flows to the JPY, weighed on the AUD/JPY, dipping to the 200-hour simple moving average (SMA) at 81.38.
The AUD/JPY is downward biased, as depicted by the daily moving averages (DMAs), which lie above the spot price in orderly bearish form. Downwards, the first support would be February 1 daily low at 80.90. A breach of the latter would expose January 24 daily low at 80.69, followed by the YTD low at 80.36.
Contrarily, in the event of an AUD/JPY shift upwards, the first resistance would be the 50-DMA at 81.89. If the previous-mentioned level gives way for AUD bulls, the next resistance would be 82.00, followed by the confluence of the 100 and the 200-DMA lying within the 82.40-46 range.
- Gold bears are monitoring for a deceleration in the bullish correction, now at critical resistance.
- The 4-hour time frame offers a compelling picture of the market structure.
As per the Chart of the Week analysis, the daily M-formation that was noted has played out as follows.
It was stated that ''considering the trendline support and the daily M-formation, the technicians would argue that a significant correction of the bearish impulse could be in play...''
Gold, daily chart prior analysis
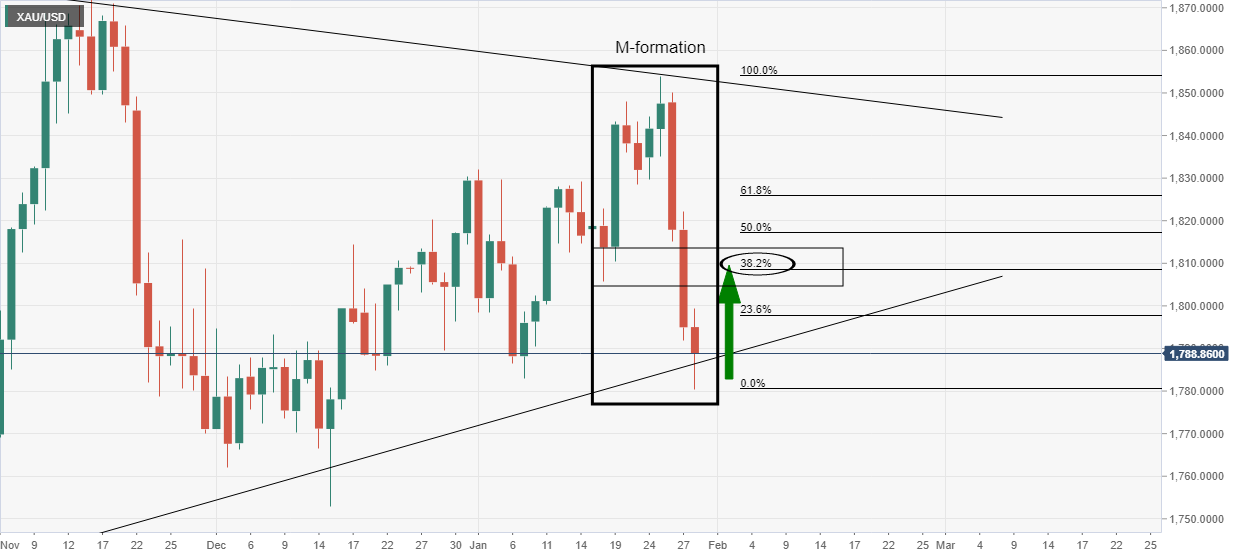
In the case above, the 38.2% Fibonacci retracement level near $1,810 was the initial target area that had a confluence with prior structure as illustrated.
Gold, live market
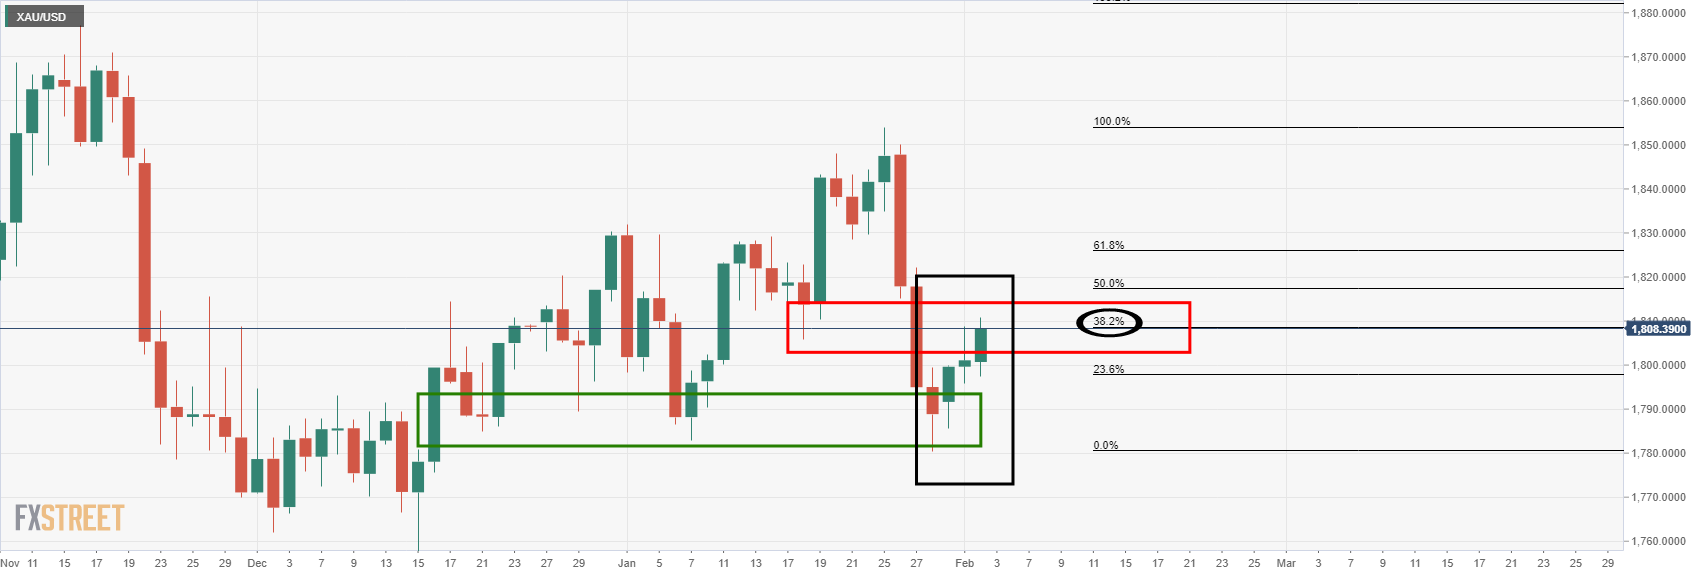
So far so good.
What bears will now want to see is a deceleration in the price action. This can be monitored from a lower time frame, such as the 4-hour chart:

In the above chart, we can see a number of interesting structures that leave a bearish bias below the $1,820's. The price would be expected to move lower to test the W-formation's neckline near $1,802 as follows:

As stated at the start of the week's analysis in the Chart of the Week, ''should this playout, and if the bears commit ... additional supply could be the straw that breaks the camel's back for a sizeable continuation to crack the trendline support as follows:

On the other hand, if the US dollar gives way again, then the neckline of the M would be the last defence for a restest of the wedge resistance the $1,850's once again:
- The S&P 500 is pushing towards 4500, up around 0.8% on the day and spurred by strong Google earnings.
- That puts the index on course for a fourth successive positive session as equities continue their strong start to February.
- Focus has turned to upcoming Facebook and Amazon earnings ahead of Friday’s official US jobs report.
US equity markets enjoyed a broad-based rally for a fourth successive session on Wednesday, with the latest leg in the rebound from January’s lows driven by strong earnings from tech giant Alphabet (Google’s parent company). GOOG shares surged as much as 10% on Wednesday after the company posted record quarterly sales following Tuesday’s market close and announced a new 20 to one stock split. Analysts said this would make investing in the company more appealing to the retail crowd. After the closing bell, focus then switches to earnings from Meta Platforms (Facebook) ahead of Amazon results on Thursday.
Strong Google earnings helped lift the S&P 500 0.8% to the 4580s, with the bulls eyeing a challenge of the 4600 level. Equity analysts reasoned that strong tech earnings could catalyze a recovery back towards early January levels, as long as upcoming economic data releases don’t provoke further Fed tightening fears. The Nasdaq 100 index was 0.7% higher and managed to break back above the 15K level, while the Dow was up 0.6% to back above 35.5K. Compared to January lows, the S&P 500 trades 8.7% higher, the Nasdaq 100 10.2% higher and the Dow 7.3% higher.
However, the three indices are still 4.9%, 9.7% and 3.7% below recent record highs. Whilst a more cautious tone to Fed rhetoric this week has aided recent gains, for equities to return back to record levels, more certainty that the Fed isn’t going to tighten “too” aggressively is needed. Policymakers this week suggested that a 50bps rate hike in March is highly unlikely and emphasised that the timing and pace of upcoming tightening remain uncertain and data dependent. That means equity markets will be closely scrutinising upcoming data releases, the most important of which this week include Friday’s labour market report.
Wednesday’s weak ADP figures will strengthen the market’s conviction that Friday’s headline payrolls number is likely going to be poor. But Fed members have said they expect this and flagged wage growth and labour slack metrics as more important to monitor. If Average Hourly Earnings growth surprises to the downside like last Friday’s Q4 Employment Cost Index figures did (recall that helped equities at the time), that could spur a strong finish to the week for equities. More broadly, bad jobs data is good jobs data as far as the US stock market is concerned, with investors hoping to see numbers that will keep the Fed cautious and tightening monetary policy at a more measured pace in 2022.
What you need to know on Thursday, February 3:
The American dollar kept falling on Wednesday to reach fresh weekly lows against its high-yielding rivals. The EUR/USD pair reached 1.1329 as the EU annual Consumer Price Index jumped to 5.1% in January, largely surpassing the 4.4% expected and above the 5% previous. The reading came one day ahead of the European Central Bank monetary policy announcement, putting pressure on the central bank to respond with a tighter monetary policy.
Government bond yields held near the lower end of their weekly range.
GBP/USD heads into the Asian opening, trading near a daily high of 1.3587, as Wall Street recovered from an early knee-jerk and closed in the green. Stocks eased after the release of the US ADP survey, which showed that the private sector lost 301K positions in January, much worse than anticipated and fueling concerns about the economic recovery in the country.
AUD/USD trades in the 0.7140 region, while USD/CAD is down to 1.2660, while safe-haven currencies also advanced against the dollar.
Gold posted a modest intraday advance and trades at $1,808 a troy ounce, while crude oil prices remained steady around Tuesday’s close. WTI settled at $88.10 a barrel.
US indexes managed to post gains after a soft start to the day. The DJIA added over 200 points and was the best performer.
On Thursday, the European Central Bank and the Bank of England will announce their decisions on monetary policy.
Crypto.com price slips despite offer to protect Australian users against hacks
Like this article? Help us with some feedback by answering this survey:
- The Loonie gains 0.07% vs. the greenback in the New York session.
- The FX complex is in a risk-off mood, the JPY, and the CHF rise.
- USD/CAD remains upward biased, despite retreating near 1.2650s.
The Loonie gains ground vs. the greenback for the third consecutive day in the week. At press time, the USD/CAD is trading at 1.2672. The market sentiment is mixed, as some European equity indices recorded losses. Meanwhile, US stock indices advance, except for the Russell 2000, down 1.20% during the day.
In the FX complex, the mood shifted towards a risk-off as portrayed by recent JPY and CHF strength, up some 0.28% and 0.25%, respectively. In the meantime, the US Dollar Index, a gauge of the greenback’s value against a basket of six peers, losses almost 0.50%, sitting at 95.95.
On Wednesday, the US economic docket featured the ADP employment report for January. Market participants expected an increase of 207K jobs added to the economy but instead witnessed the losses of 301K. That was noticed by some Fed members, like Philadelphia Fed Patrick Harker, who expects that the Nonfarm Payrolls report would be bad due to the spread of the Covid-19 Omicron variant.
In the report, the ADP Chief Economist said, “That the labor market took a step back at the start of 2022 due to the effect of the Omicron variant and its significant, though likely temporary, impact to job growth.”
In the commodities market, particularly US crude oil due to its high correlation to the Canadian dollar, the Western Texas Intermediate also known as WTI, rises 0.05% during the North American session, trading at $88.39 per barrel.
USD/CAD Price Forecast: Technical outlook
The USD/CAD retreated from the 50-day moving average (DMA). Nevertheless, the upward bias remains in place as long as the 100 and the 200-DMA remain positioned below the spot price, though almost horizontal.
The retracement witnessed in the last three trading sessions stalled around the February 1 daily low at 1.2654. However, a breach of the latter would expose the 100-DMA at 1.2620, followed by the 1.2600 figure.
Contrarily, if the USD/CAD uptrend resumes, the first resistance would be 1.2700, immediately followed by the 50-DMA at 1.2712. An upside break would open the door towards January 28 highs at 1.2797.
UK Chancellor of the Exchequer (Finance Minister) Rishi Sunak will hold a major press conference on Thursday amid souring UK energy costs, reported The Sun. The UK energy regulator Ofgem will announce the new energy price cap for April on Thursday morning (UK time) and Sunak is expected to announce new financial support measures for low-income Brits.
Market Reaction
GBP does not seem to have reacted much to the latest news, though if Sunak's measures on Thursday are interpreted as amounting to meaningful fiscal stimulus, the impact on sterling could be modestly positive.
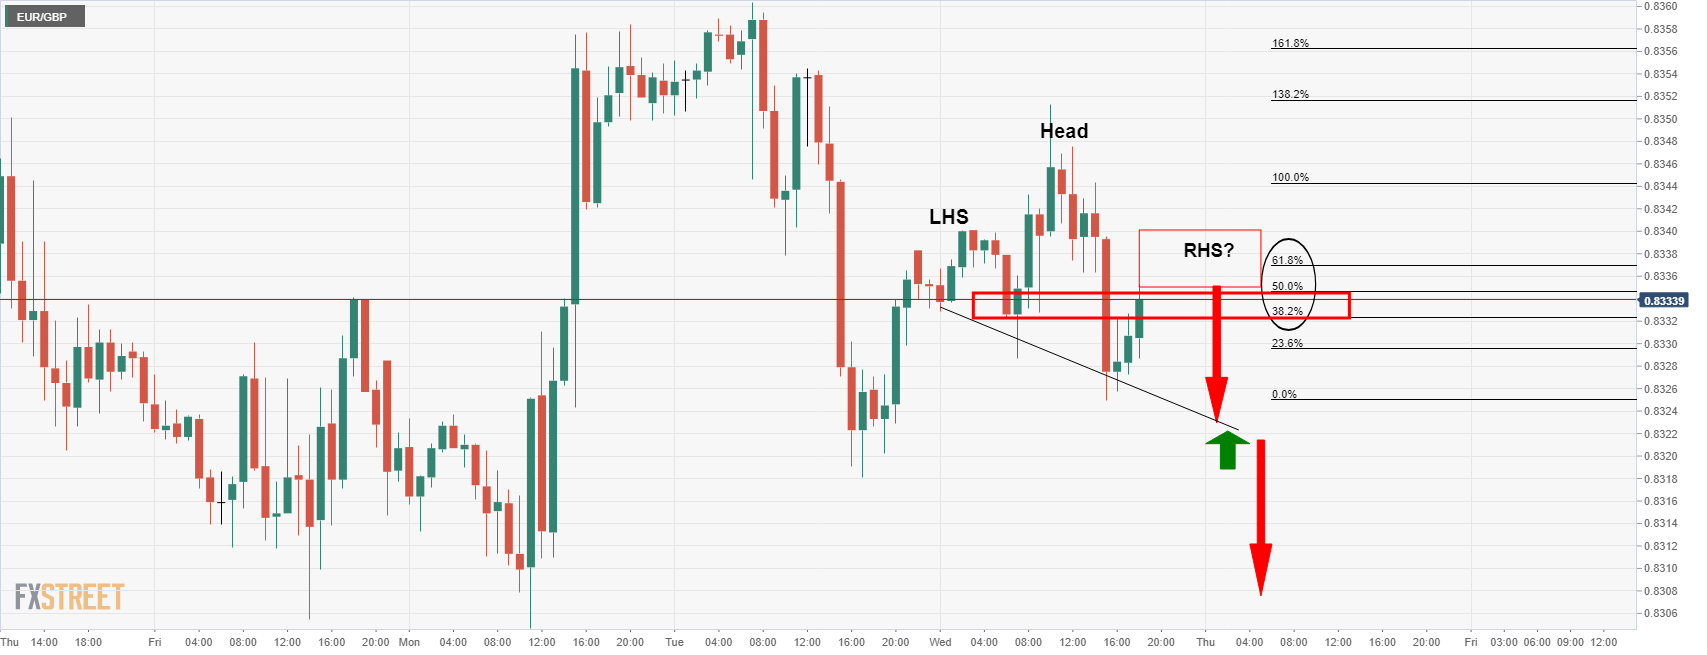
- EUR/GBP bears are waiting in the flanks of the central bank meetings.
- Bulls are tiring on the bid which opens prospects of a downside continuation.
EUR/GBP is under the spotlight this week considering the central bank meetings on Thursday. ''The money market has priced in another 125 bps on UK rates on a 12-month view. This compares with around 35 bps on Eurozone rates in the same period,'' analysts at Rabobank explained.
''The guidance provided by the ECB and the BoE tomorrow will provide an opportunity for investors to re-evaluate these policy expectations and this suggests the potential for fresh direction for EUR/GBP.''
As for the technical outlook for the meetings, the following illustrates a bearish bias from an hourly perspective:
EUR/GBP H1 charts

The price is losing traction on the bid as it moves in on the 50% mean reversion point of the prior bearish impulse. If the bears commit here, then there will be prospects of a bearish head & shoulders forming in subsequent sessions and price action as follows:
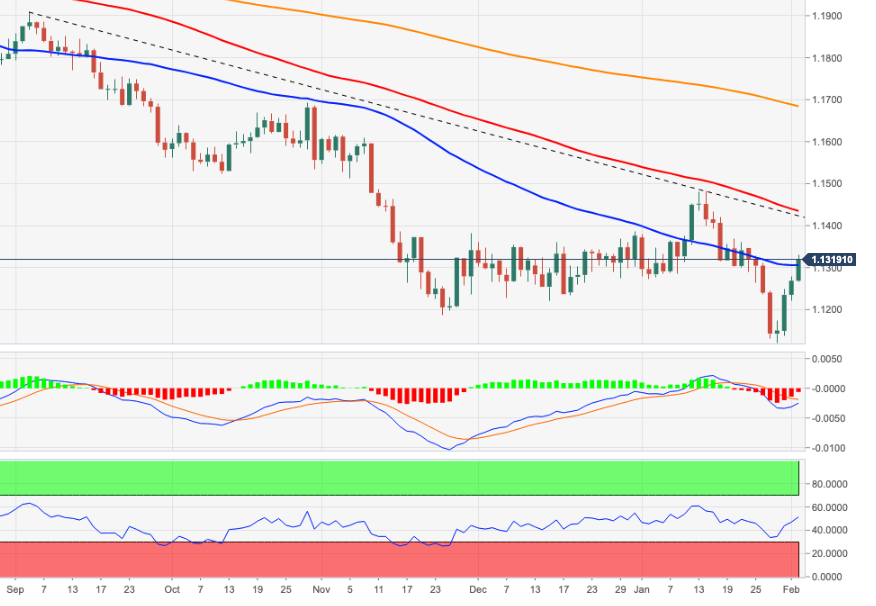
- EUR/USD continues to remain well supported above 1.1300 after hot Eurozone inflation, having shrugged off weak US ADP data.
- Focus now turns to Thursday’s ECB meeting and whether the bank will adjust its inflation view.
EUR/USD continues to trade well supported to the north of the 1.1300 level as the euro remains well positioned near the top of the daily G10 performance table, having been boosted by post-hot Eurozone inflation data hawkish ECB bets. While the pair had already broken above the key 1.1275 resistance area during Asia Pacific trade amid continued US dollar weakness, it was sent lurching above the big figure after Eurozone HICP inflation unexpectedly hit fresh record highs in January.
Weak US ADP National Employment data, which showed a surprise more than 300K drop in employment last month, was broadly shrugged off by FX markets. That’s because market participants don’t trust ADP to accurately predict the official NFP number and Fed members have recently been emphasising the importance of wage growth data. Thus, EUR/USD has spent the last few hours going sideways in the 1.1310 area, where it currently trades with gains of about 0.4% on the day. Subdued trade is likely to persist ahead of Thursday’s ECB policy decision.
In wake of the latest Eurozone inflation surprise, some analysts are calling for the ECB to adjust its inflation view. At its last meeting, the central bank said that it still viewed inflation as transitory and likely to fall back under the 2.0% target by the end of 2022, but that this view could shift on persistent inflation surprises. The ECB won’t be posting new forecasts but could hint towards an upgrade at the coming meeting that might validate current market pricing for a hiking cycle to begin in the final quarter of 2022. A hawkish surprise at Thursday’s meeting would likely lift EUR/USD further towards the upper 1.1300s.
- GBP/USD bulls in good stead for a run towards the 1.3660's.
- The BoE is now the main focus ahead of Friday's US NFP.
At 1.3570, GBP/USD is around 0.40% higher on the day as it tracks down the start of the New York sessions highs of 1.3587 again during midday trade. Sterling is climbing on Wednesday for the fourth session in a row, reaching a 1-1/2-week high against the dollar.
Trader's expectations that the Bank of England will raise interest rates on Thursday, a disappointment in US jobs data, a softer US dollar and rebounding US stocks, is supporting cable higher.
Bearish prelude for NFP
The US dollar depreciated to a low of 95.806 at the start of the day as measured by the DXY index as what might be regarded as a prelude to Friday's January Nonfarm Payrolls employment report disappointed. ADP private payrolls, which showed a 301,000 drop, was missing an estimate of 207k.
Also, the January decline followed a downwardly revised 776,000 increase in December, compared with the 807,000 gain initially reported. By sector, goods-producing jobs fell by 27,000, while service-providing jobs plunged by 274,000, with leisure and hospitality jobs down 154,000.
Meanwhile, domestic data for sterling since December has shown that the economy was in much better shape than expected heading into Omicron, and high inflation is lifting inflation expectations. Encouragingly for cable bulls this week, a survey has shown British manufacturing output grew at the fastest pace in six months in January. This is supporting the view that the British economy is still handsomely rebounding from the COVID-19 recession.
Moving into the key event, the BoE, which was among the first off the blocks among its developed market peers to raise interest rates in December, the money markets are now expecting a total of 125 bps in rate hikes from the central bank this year.
This has been priced into the pound, so traders will be keen to see if policymakers strike a more hawkish tone to curb inflation in Thursday's meeting.
Reuters reported on Wednesday that most economists polled by the news agency believe the BoE will also signal its approach to start unwinding its 895 billion pound ($1.2 trillion) quantitative easing programme.
''Investors have now fully priced a 25-basis-point rise in the BoE's main interest rate to 0.50% on Feb. 3 and economists polled by Reuters also expect that outcome from the meeting.''
A bearish outlook for GBP on BoE
Based on their base case scenario for Thursday's BoE meeting, analysts at TD Securities said, ''we think the profile skews more negatively for GBP on the day, especially as positioning looks relatively long. That said, external drivers, like risk and the USD, feature prominently in the price action.''
Their base case view, published on Wednesday in the same notes is as follows:
''The MPC hikes Bank Rate, but echoing its recent messaging, offers few hints at future rate hikes beyond the big-picture acknowledgement that rates need to continue rising. The yield curve is implicitly backed by the MPC over the medium-term with 2024 inflation likely to be revised just a touch higher (though still under 2%).''
GBP vulnerable to a tax hike
Meanwhile, at the start of the week press reports indicated that the planned April increase in UK National Insurance Tax will go ahead despite calls from some Tory MPs for this to be reviewed in light of the rise in the cost of living.
''On the assumption that the government does proceed with its tax hike in April, we see the risk that the market will unwind some of its assumptions on BoE rates and this could leave the pound vulnerable in the spring and early summer,'' analysts at Rabobank argued. '' Given our view that the USD will be buoyed as Fed tightening commences, we see a risk that cable could dip below the 1.30 level in the middle of the year.''
As for politics, currency markets have simply ignored the latest developments of the political crisis in Britain over lockdown parties at Downing Street. This is despite the fact that six Conservative members of parliament now publicly saying they are seeking a vote of confidence on Prime Minister Boris Johnson's leadership on Wednesday.
GBP/USD technical analysis
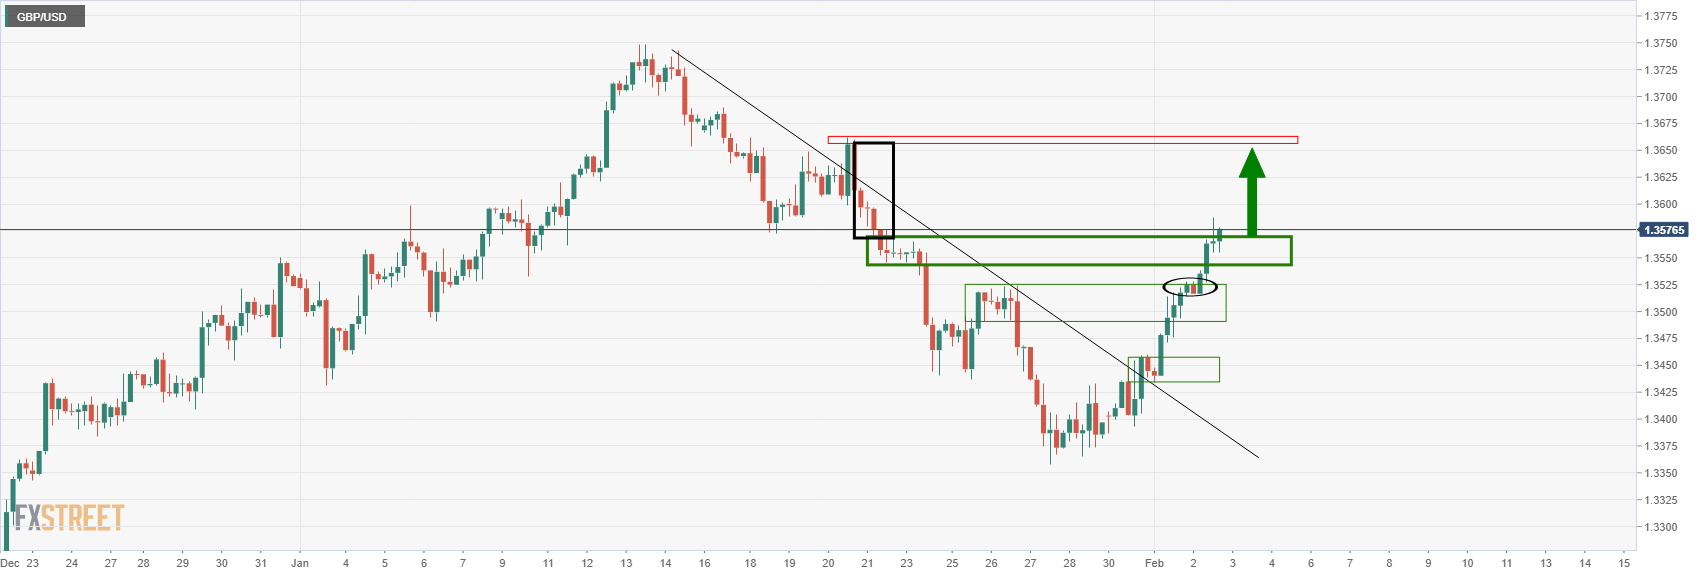
The price has burst through what might have been expected to be a firmer resistance on the 4-hour charts near 1.3525. A break of 1.3580 could set the stage for a rally through to the 1.3660s to mitigate an old imbalance of price between here and there.
- The AUD/USD climbs some 0.07% in the North American session.
- AUD/USD Technical Outlook: Downward biased as shown by the confluence of resistance levels and DMAs depicting a downslope.
The AUD/USD retreats from weekly highs, right around the 50-day moving average (DMA) at 0.7163, edges lower some 0.07%. At the time of writing, the AUD/USD is trading at 0.7134. Market conditions are mixed, as European and US equity indices fluctuate between gainers and losers in the middle of the North American session.
In the meantime, the US Dollar Index, a gauge of the greenback’s value vs. a basket of six rivals, is losing 0.38% in the day but reclaimed the 96.00 figure as investors flow towards safe-haven peers.
AUD/USD Price Forecast: Technical outlook
The AUD/USD seesawed around the 0.7130-60 range during the overnight session until Wall Street opened. However, as American traders got to their desks, the release of US macroeconomic data influenced the dip from weekly highs around 0.7158 to 0.7125.
The Aussie is downward biased, based on the daily moving averages (DMAs) residing above the spot price, with a downslope. Furthermore, an eight-month-old downslope trendline, drawn from 2021 yearly highs, confluences with the 200-DMA, around 0.7384, 130-pips above the 100-DMA at 0.7254.
The AUD/USD first support would be the January 7 daily low at 0.7129. A breach of the latter would expose the January 24 daily low at 0.7090, followed by January 28 at 0.6967.
To the upside, the AUD/USD first resistance would be the 50-DMA at 0.7163. If it gives way for AUD bulls, the next resistance would be 0.7200, followed by the confluence of a three-month-old downslope trendline and the 100-DMA at 0.7254.
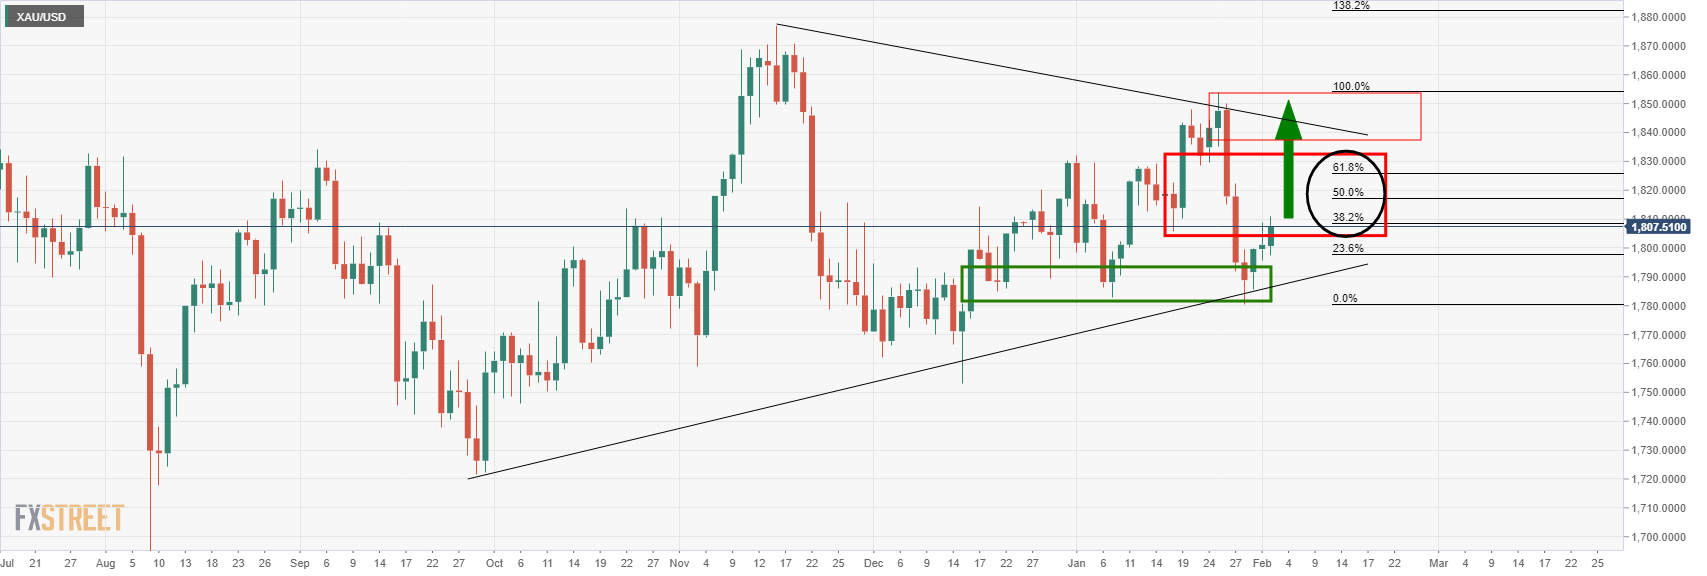
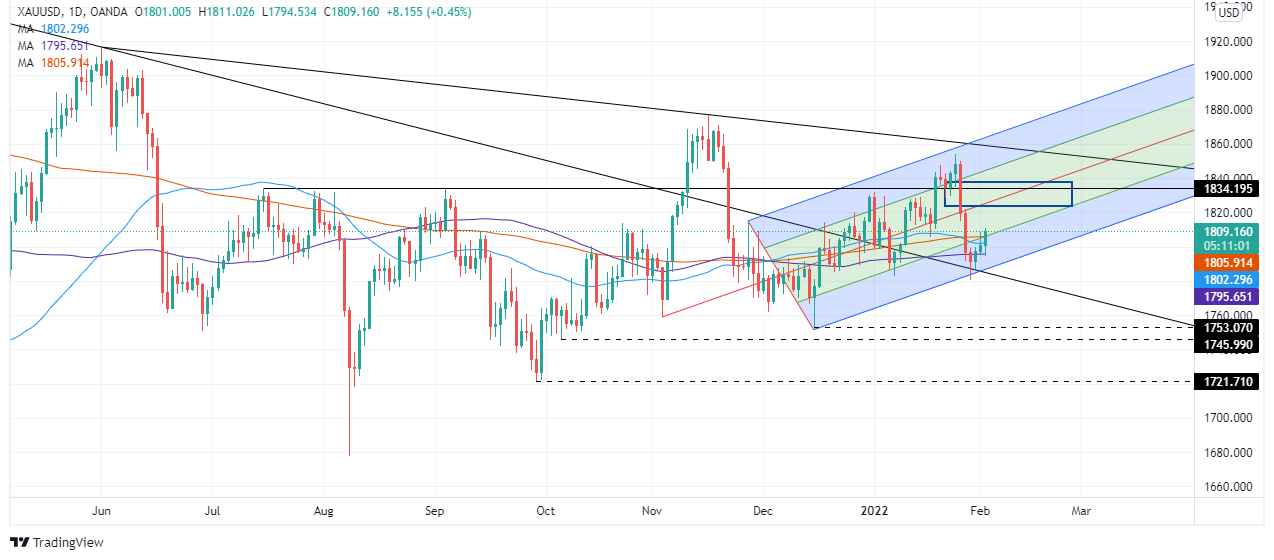
- The non-yielding metal is trading above $1805, the trendsetter 200-DMA.
- The US ADP data was worse than expected; it could be a prelude to the Nonfarm Payrolls (NFP).
- XAU/USD Technical Outlook: A daily close above the 200-DMA could signal a shift in gold’s trend.
Gold (XAU/USD) climbs in the North American session as US T-bond yields led by the 10-year benchmark note fall three basis points, undermining the greenback. At the time of writing, XAU/USD is trading at $1808, up 0.44%.
The market sentiment is mixed, as European bourses remain in the green, while US equity indices fluctuate between gains/losses. Meanwhile, the US Dollar Index extends its losses throughout the week to three straight days, down 0.20%, sitting at 96.07.
ADP worse than foreseen report a prelude of Friday’s Nonfarm payrolls?
Before Wall Street opened, the ADP Jobs report for January was released. The print came awful, showing that the US economy lost more than 301K, private employees when analysts estimated it would add 207K new jobs.
The ADP Chief Economist said that “The labor market recovery took a step back at the start of 2022 due to the effect of the Omicron variant and its significant, though likely temporary, impact on job growth.” Nevertheless, officials in the White House and Fed members warned that the January employment report would be disappointing, subject to the impact of the Omicron variant.
On Tuesday, Fed speakers with the likes of Philadelphia Fed President Patrick Harker and St. Louis James Bullard crossed the wires.
Philadelphia’s Fed Harker said that the Fed could begin unwinding its balance sheet once Federal Funds Rates (FFR) hit 1 – 1,25%. Worth noting that Harker said that the employment report would probably be bad due to the Omicron variant. Regarding hiking rates, he does not foresee a 50 bps hike.
Meanwhile, St. Louis Fed Bullard said that he estimates two hikes, one in March followed by May. Bullard said that at the beginning of the H2, the US central bank would be able to assess how robust inflation seems for the rest of 2022 and expects to adjust accordingly. Concerning Quantitative Tightening (QT), Bullard noted that he would like to start in Q2 and emphasized that the runoff could be faster.
XAU/USD Price Forecast: Technical outlook
On Wednesday, the yellow metal, so far, reclaimed the 200-day moving average (DMA), which lies at $1,805. However, it faces resistance at the mid-line between the central/bottom trendlines of Pitchfork’s channel, around $1,808-12 area.
The break above ALL the DMAs appears to put the greenback under pressure. Nevertheless, to further cement gold’s trend shift to the upside, XAU bulls would need a daily close above $1,815. In that event, the first resistance would be the central trendline of Pitchfork’s channel around $1824-26. A breach of the latter would expose July 15, 2021, high at $1,834, followed by the mid-line within the central/top trendline of the channel around $1,844.
- Spot silver prices continue to struggle to benefit from the latest USD slump, amid selling pressure in the $23.00 area.
- That despite a massive miss on expectations in the latest US ADP figures, which come ahead of Friday’s jobs report.
- Perhaps what XAG/USD needs is to clear the resistance area around $23.00 before a more substantial rebound can take place.
Spot silver (XAG/USD) prices continue to struggle to benefit from the latest US dollar slump, as spot prices continue to face selling pressure ahead of the $23.00 per troy ounce level. Indeed, since pulling back from earlier session highs in the $22.80s after failing to rally above the 50-day moving average at $22.86, the precious metal has traded in choppy fashion, even dipping below $22.50 at one point. At current levels in the $22.60s, it trades about 0.2% higher on the session. That despite a massive miss on expectations in the latest US ADP National Employment report, which showed private payrolls dropping by more than 300K in January versus forecasts for a 207K rise.
Though ADP hasn’t had the best track record as of late in predicting the official US payroll change number (out on Friday), it will push already very low expectations even lower. The rapid spread of Omicron over the past six weeks or so in the US has disrupted the usual labour market churn and slowed the pace of hiring. In light of this, markets have broadly ignored the latest ADP report and will likely ignore the headline NFP number on Friday (so long as it doesn’t deviate to massively from the roughly 150K expected job gain). Fed officials have flagged wage cost pressures as more important in the near-term to policymaking decisions, so Friday’s Average Hourly Earnings (AHE) growth metric will be the most closely followed aspect of the report.
If AHE follows in the footsteps of last week’s Q4 Employment Cost Index data by underwhelming expectations, the US dollar may gather fresh momentum. Spot silver’s failure to capitalise on the USD weakness that has already ensued this week raises questions about whether the aforementioned scenario would ultimately be a XAG/USD positive. Perhaps what XAG/USD needs is to clear the resistance area around $23.00 before a more substantial rebound can take place. Certainly, a rally above $23.00 would open the door to a run back towards $24.00. However, in the longer-run, in an environment where the Fed is moving towards tighter policy, the 200DMA may continue to provide a long-term ceiling, as has been the case since last August.
- Mexican peso lost strength after being unable to break 20.50.
- USD/MXN rebounded after hitting a fresh weekly low at 20.47.
- Rebound likely to weaken near 20.70.
The USD/MXN is rising on Wednesday after falling sharply during the previous two trading days when it corrected from levels near 21.00 to 20.47. The Mexican peso was rejected twice from under 20.50, showing difficulties in extending the rally.
The key support area is 20.50 and a daily close below would point to more losses, targeting 20.35. A decline below 20.35 should clear the way for a new test of the critical area of 20.25/20.30 that includes the 200-day simple moving average.
The current move to the upside will likely face resistance near 20.70. The mentioned level is a critical short-term resistance. A break above would expose the next obstacle seen at 20.85/90.
On the weekly chart, the USD/MXN is still in negative despite Wednesday’s gains. The weekly chart shows the 20-week simple moving average at 20.60; a close above would keep the doors open for 21.00.
USD/MXN Daily chart
-637794153852198555.png)
- USD/CHF fell under 0.9200 on Wednesday, down another 0.2% and taking weekly losses to about 1.3%.
- US dollar weakness continued for a third day, amid better risk appetite, position squaring and easing Fed tightening bets.
US dollar weakness has continued for a third day on Wednesday, with the buck weighed by the continued improvement in global equity market sentiment, long-position squaring and a paring back of Fed tightening bets. More recently, weak ADP national employment change figures for January have further dented USD sentiment. As a result, USD/CHF dropped back under 0.9200 on Wednesday and is now below both its 21 and 50-day moving averages at the 0.9192 and 0.9198 levels respectively. At current levels close to 0.9190, USD/CHF is off earlier session lows in the 0.9170s, but still trades with on the day losses of about 0.2%.
USD/CHF is now trading roughly 1.3% lower on the week and about 1.6% down versus its Monday highs in the mid-0.9300s. FX market focus has predominantly been on US data, Fed expectations and risk appetite so far this week, but will on Thursday switch to central banks, with the BoE and ECB both reporting. If the ECB sticks to its “transitory” inflation narrative and shrug off upside inflation risks despite Wednesday’s hot Eurozone HICP inflation figures, that could bolster the European safe-haven CHF, which has in the past benefitted from ECB dovishness. Short-term bears may look for USD/CHF to test support in the form of its 200DMA at 0.9164.
Focus will switch back to US data and Fed expectations on Friday when the official US labour market report for January will be released. The headline number is expected to be weak but this shouldn’t faze markets (just as Wednesday’s weak ADP numbers didn’t), with focus instead on wage inflation pressures and measures of labour market slack. If those also show signs of easing in January, then that would be interpreted as easing the pressure on the Fed to tighten so fast in 2022 and would hit the US dollar. Such a scenario could conceivably see USD/CHF hit support in the form of 2022 lows in the 0.9100 area, although some might see the dollar’s drop already this week as somewhat overdone, which may reduce downside risks.
- DXY falls for the third consecutive day, hits lowest since January 24.
- Employment data from the US came sharply below expectations.
- USD/JPY finds support above 114.00, holds negative bias.
The USD/JPY is falling on Wednesday for the fourth consecutive day. It bottomed at 114.14 after the release of the US ADP employment report. During the American session, it has been trading in range between 114.20 and 114.45, consolidating daily losses.
The decline of USD/JPY takes place as the DXY continues to correct lower and while US yields remain rangebound. The Index is falling 0.23%; it bottomed at 95.82, the weakest in almost two weeks before bouncing back above 96.00. The 10-year stands at 1.77%, down 1.05% for the day.
The yen is posting mixed results across the board. The improvement in risk sentiment weighs on the Japanese currency. The worse-than-expected economic numbers from the US did not push the yen sharply higher. The ADP employment report showed a decline in private payrolls of 301K, against expectations of a 200K increase. Attention now turns to Friday’s NFP.
Strong barrier ahead
The negative bias in USD/JPY remains in place. The yen appears to have reached a strong barrier above 114.00/10. A break under the area should clear the way for a test of 113.45 (January low).
On the upside, the immediate resistance is seen at 114.45 followed by 114.60 and then 114.95. A daily close back above 115.00 would alleviate the bearish pressure.
Technical levels
- The NZD/USD snaps two consecutive days of gains, down 0.15%, amid a positive market mood.
- The US ADP employment report was dismal, though it barely influenced the US dollar.
- NZD/USD is downward biased, and failure to break above a downslope trendline opened the door for the YTD low.
The New Zealand dollar climbs but retreats from weekly highs around 0.6662 after mixed than foreseen NZ jobs report released in the Asian session. At the time of writing, the NZD/USD is trading at 0.6637.
The US ADP Employment report was ignored by investors as they prepare for Friday's NFP
An hour and a half before Wall Street’s opened, the ADP Jobs report was released. The figures were dismal, showing the losses of more than 301K employments when polled economists expected at least 207K private jobs added to the economy.
The ADP Chief Economist said that “The labor market recovery took a step back at the start of 2022 due to the effect of the Omicron variant and its significant, though likely temporary, impact to job growth.” Nevertheless, officials in the White House and Fed members warned that the January employment report would be disappointing, subject to the impact of the Omicron variant.
Meanwhile, in the Asian session, New Zealand’s employment report showed that the unemployment rate fell from 3.3% to 3.2%, while the Labor Cost Index jumped two tenths from the previous month to 2.6%., but short of the 2.9% foreseen.
The RBNZ is expected to hike rates 25 basis points to the Overnight Cash Rate (OCR) at the February meeting. Nevertheless, wage growth is lagging widely, so the NZ central bank could decide to slow rate hike increases in 2022, allowing inflation to shoot up.
NZD/USD Price Forecast: Technical outlook
The NZD/USD is downward biased, as shown by the daily moving averages (DMAs) residing above the spot price, despite the recent jump from YTD lows, at 0.6529. All the DMAs have a downward slope, suggesting the downtrend could be accelerating. Furthermore, a bottom downslope trendline of a descending channel, broken to the downside on January 26, located around the 0.6650-60 range, was challenged through the day.
Failure to break the abovementioned opened the door for further losses. The NZD/USD first support would be the figure at 0.6600. A breach of it, then the NZD/USD would face January 28 high, previous resistance-turned-support at 0.6588, followed by the YTD low at 0.6529.
- One day out from an anticipated second successive BoE rate hike, pound sterling has been trading on the front foot.
- GBP/USD recently surpassed its 21DMA at 1.3557 before running into resistance ahead of the 1.3600 level
- The pair wasn’t much moved by the latest weak US ADP figures, with USD traders more focused on wage growth.
One day out from an anticipated second successive BoE rate hike, pound sterling has been trading on the front foot, with GBP/USD recently surpassing its 21-day moving average at 1.3557 before running into resistance ahead of the 1.3600 level. At current levels in the 1.3560s, the pair trades with on-the-day gains of about 0.3%, taking its on-the-week gains to about 1.3% and the rebound from last week’s sub-1.3400 lows to roughly 1.5%. While hawkish BoE bets ahead of Thursday’s meeting are one factor supporting GBP/USD on Wednesday, with the latest BRC Shop Price inflation figures jumping to near-decade highs and adding to inflation fears, dollar factors are also in play.
Market commentators are citing a combination of 1) a paring back of long positions and 2) a paring back on hawkish Fed bets following recent policymaker communications as the major driver of recent US dollar weakness. Regarding positioning; MUFG noted on Wednesday that their 2yr z-score measure of Leveraged Funds’ long USD positioning is “at an extreme”, with USD longs at a level not seen since 2011. However, ING says that “if position-squaring is indeed behind this week’s dollar weakness… we expect the dollar’s positioning now to have reached a somewhat more balanced level which can allow for some stabilisation,” the bank says. “After all”, they continue, “a market that is quite freely speculating on the pace and size of Fed tightening is unlikely to turn much less bullish on the dollar anytime soon”.
Regarding recent Fed speak, policymakers played down the prospect of a 50bps rate hike in March. Meanwhile, though policymakers speaking this week have unanimously expressed support for the start of a rate hiking cycle next month, most emphasised a data-dependent approach when it comes to determining its timing, pace and extent. That implies that US economic data in the coming months will take on even more important than usual, starting with this Friday’s official January labour market report. The latest weak ADP national employment change figures have solidified expectations for a weak headline NFP number but didn’t impact FX markets or GBP/USD too much given Fed members have said they are more focused on wage growth.
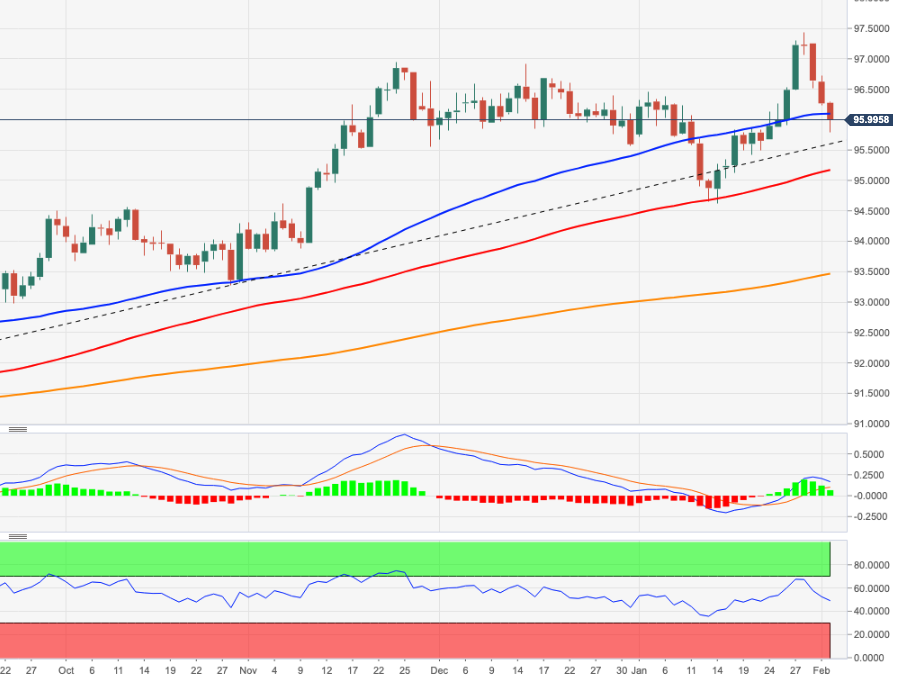
- DXY drops as low as the 95.80 region on Monday.
- Consolidation remains the name of the game around US yields.
- The ADP report surprised to the downside in January.
The greenback remains on the defensive although it managed to bounce off daily lows near 95.80 when measured by the US Dollar Index (DXY).
US Dollar Index stays supported near 95.80
Following fresh multi-day lows around 95.80, the index now regained some composure and looks to reclaim the key 96.00 zone in a context where US yields remain depressed amidst the broad side-lined theme.
The rebound in the dollar came soon after the ADP report showed the US private sector lost 301K jobs during last month, missing consensus although matching previous speculation that the labour market could have suffered the impact of the rapid spread of the omicron variant in past weeks. The drop in the ADP print was the biggest since April 2020, the onset of the pandemic.
What to look for around USD
The dollar’s corrective downside remains well in place, although some decent support seems to have turned up around 95.80. Reasons behind the strong correction in the buck can be found in the improved mood in the risk-associated universe and dormant US yields (despite navigating the upper end of the recent range). However, the constructive outlook for the greenback is expected to remain unchanged in the longer run on the back of rising yields, persistent elevated inflation, supportive Fedspeak and the solid pace of the US economic recovery.
Key events in the US this week:) ADP Employment Change (Wednesday) – Initial Jobless Claims, ISM Non-Manufacturing PMI, Factory Orders (Thursday) – Nonfarm Payrolls, Unemployment Rate (Friday).
Eminent issues on the back boiler: Fed’s rate path this year. US-China trade conflict under the Biden administration. Debt ceiling issues. Escalating geopolitical effervescence vs. Russia and China.
US Dollar Index relevant levels
Now, the index is losing 0.30% at 95.97 and a break above 97.44 (2022 high Jan.28) would open the door to 97.80 (high Jun.30 2020) and finally 98.00 (round level). On the flip side, the next down barrier emerges at 95.80 (weekly low Feb.2) seconded by 95.41 (low Jan.20) and then 94.62 (2022 low Jan.14).
In January, the Mexican peso weakened modestly from 20.496 to 20.655 against the US dollar. As economists at MUFG Bank note, the USD/MXN is set to inch higher amid expected tightening from the Federal Reserve.
MXN tends to gradually depreciate amid Fed policy and local policies
“Even though it seems highly priced in by the market, we assess that the effective monetary policy tightening in the US might further strengthen the US dollar leading to our call of MXN weakening this year.”
“We expect a moderate pace of depreciation once Banxico tends to continue increasing its key policy rate in order to control inflation expectations, which might partially offset the drivers that push MXN to weaker levels.”
“We need to keep monitoring Lopez Obrador protectionist policies, especially in the energy sector. US President Joe Biden’s trade chief is reviewing these policies to see how they relate to the country’s commitments to their 2020 USMCA trade deal.”
The S&P 500 maintains a strong tone. Analysts at Credit Suisse see scope for further strength yet to the 61.8% retracement of the January collapse at 4591, potentially the 63-day average at 4639, but with this then ideally capping.
Initial support seen at 4526/24
“We see scope for the recovery to extend further yet with resistance seen next at the 61.8% retracement of the January sell-off at 4591, then the potential downtrend from the beginning of January and price resistance at 4602/12. With the 63-day average seen not far above at 4639, we look for a cap in this 4602/39 zone to define the top of a broader sideways range.”
“Support is seen at 4526/24 initially, then 4504, with a break below 4494/84 needed to ease the immediate upside bias for a retreat back to 4453, then a retest of the 200-day average at 4439.”
- EUR/USD remains bid and surpasses the 1.1300 mark.
- Above 1.1300 the pair targets the 1.1369 level.
EUR/USD keeps the bid bias unchanged for yet another session, this time finally leaving behind the key 1.1300 barrier to click new multi-day highs.
While the ongoing strength is deemed as corrective only, it seems it still has the legs to go further on. Against such a scenario, extra gains could extend to the January 20 high at 1.1369 ahead of the 1.1430 region, where the 100-day SMA and the 4-month resistance line coincide.
In the longer run, the negative outlook is seen unchanged below the key 200-day SMA at 1.1683.
EUR/USD daily chart
GBP/USD is firming up its drive above 1.35 ahead of expected Bank of Enland (BoE) hike on Thursday. Economists at Scotiabank believe that the “Old Lady” will not meet market expectations of further rate hikes, pounding the pound.
Near-term ceiling for the cable at 1.36
“We await the BoE’s announcement tomorrow – where we see a 25bps hike but some pushback against market pricing (GBP downside risk).”
“Market pricing for the BoE has held steady at a 95-100% chance of a hike tomorrow and a total of five 25bps hikes by end-2023. We think it’s more likely that the bank delivers only 100bps in rate increases this year, which should eventually act as a headwind for the GBP as markets reprice expectations.”
“We see the 1.36 mark as a near-term ceiling for the GBP.”
“It would take a clear sign from the BoE that it is willing to go above its neutral rate for the pound to test 1.38.”
EUR/USD has broken through 1.13 trading on a strong four-day streak from the low 1.11s last Friday. Economists at Scotiabank expect the world’s most popular currency pair to challenge the 1.14 level.
Below 1.13 support is seen around the 1.1280 mark
“The EUR is testing its 50-day MA of 1.1310, which alongside the figure stand as key levels to watch on a closing basis. Resistance ahead stands at 1.1335 and the mid-figure zone – with the 1.14 area roughly marking trendline resistance from the losses since June.”
“Support is ~1.1280 if the EUR fails to hold around the figure, followed by 1.1250 and 1.1235.”
- Weak ADP data has failed to push EUR/USD higher, though the pair continues to trade well supported above 1.1300.
- The euro was boosted earlier in the day after hotter than expected Eurozone inflation spurred hawkish ECB bets.
- The central bank announces policy on Thursday ahead of the official January US labour market report on Friday.
Significantly weaker than expected US ADP national employment change figures for January, which showed a surprise 301K drop versus forecasts for a 207K rise, has failed to push EUR/USD to fresh session highs in the 1.1330s. Nonetheless, the pair continues to trade higher by close to 0.3% on the day and is well supported above 1.1300, taking its three-day rebound from last Friday’s 18-month lows around 1.1120 to around than 1.5%. The latest soft US labour market data will likely help keep Fed tightening bets, which have been pared back in recent days following cautious commentary from Fed policymakers, in check ahead of Friday’s official January labour market report. This, combined with an ongoing further bout of dollar-long position squaring, may keep the pair supported above 1.1300 for now.
Though ADP’s national employment change estimate has a poor post-pandemic track record of predicting the official payroll number each month, some economists may be inclined to revise lower their forecasts. Prior to the ADP report, the consensus estimate for Friday’s NFP number was 150K. The weak ADP data’s failure to have a lasting market impact is not just indicative of poor NFP predictive power, but also because the headline official payroll number on Friday won’t be the most closely followed labour market metric. Fed officials have stated that, given their belief the US labour market is pretty much back to near-term full employment, metrics pertaining to wage cost pressures are more important to policy-making decisions right now.
ECB meeting looms
Ahead of Friday’s important official US labour market report, EUR/USD traders will be focused on the ECB’s monetary policy announcement on Thursday. Record high Eurozone HICP inflation data released on Wednesday, which surprisingly rose to 5.1% YoY in January versus expectations for a drop to 4.4%, has complicated things for the bank. Up until now, the ECB has reffered to inflation as transitoy and had said it thought YoY inflation rates would have peaked in December.
The hotter than expected data helped boost the euro on Wednesday amid bets that the ECB will be forced into changing its tone on inflation and acknowledge upside risks to its forecasts. “The ECB will have to adjust its inflation forecast upwards from the current 3.2% for 2022 and 1.8% for 2023” analysts at Berenberg noted. “As soon as the ECB raises its inflation forecast, it must also discuss interest rate steps” the bank added, warning that “perhaps the ECB will surprise us on Thursday.” A hawkish ECB surprise could push EUR/USD back towards 1.1400.
- DXY breaks decisively below the key 96.00 support.
- Next on the downside comes a minor support at 95.41.
DXY adds to the weekly leg lower and clinches fresh lows in the 95.80 region on Wednesday.
The downside extends for the third session in a row and after breaking below the 96.00 yardstick it has now opened the door to a deeper pullback in the short-term horizon. That said, the index faces the next minor support at 95.41 (low January 20) ahead of the 100-day SMA, today at 95.13.
In the near term, the upside pressure remains intact while above the 4-month line around 95.00. Looking at the broader picture, the longer-term positive stance in the dollar remains unchanged above the 200-day SMA at 93.43.
DXY daily chart
- A combination of factors dragged USD/CAD lower for the third successive day on Wednesday.
- Bullish oil prices underpinned the loonie and exerted pressure amid sustained USD selling bias.
- The disappointing release of the US ADP report did little to provide any respite to the USD bulls.
The USD/CAD pair witnessed fresh selling during the early North American session and dropped to a fresh weekly low, around mid-1.2600s in reaction to the dismal US ADP report.
Following an early uptick to the 1.2700 mark, the USD/CAD pair turned lower for the third successive day on Wednesday and was pressured by a combination of factors. Crude oil prices jumped to a fresh seven-year high, which continued underpinning the commodity-linked loonie. This, along with the heavily offered tone surrounding the US dollar, exerted downward pressure on the major.
Oil prices broke out of a one-week-old consolidative trading range and shot to a fresh seven-year high after the OPEC+ announced to increase March oil production by 400K barrels per day. This, along with the post-pandemic recovery in fuel demand, should keep a tight supply condition. Apart from this, the conflict between Russia and the West over Ukraine acted as a tailwind for the black gold.
On the other hand, the greenback was weighed down by diminishing odds for a 50 bps Fed rate hike in March and lost additional ground following the release of disappointing US macro data, Automatic Data Processing (ADP) reported this Wednesday that the US private-sector employment declined by 301K in January as against market expectations for an addition of 207K jobs and the 807K previous.
This, along with weaker US Treasury bond yields and a generally positive tone around the equity markets, further undermined the greenback's relative safe-haven status. The fundamental backdrop supports prospects for a further near-term depreciating move for the USD/CAD pair, though the lack of any follow-through selling warrants some caution for aggressive bearish traders.
Technical levels to watch
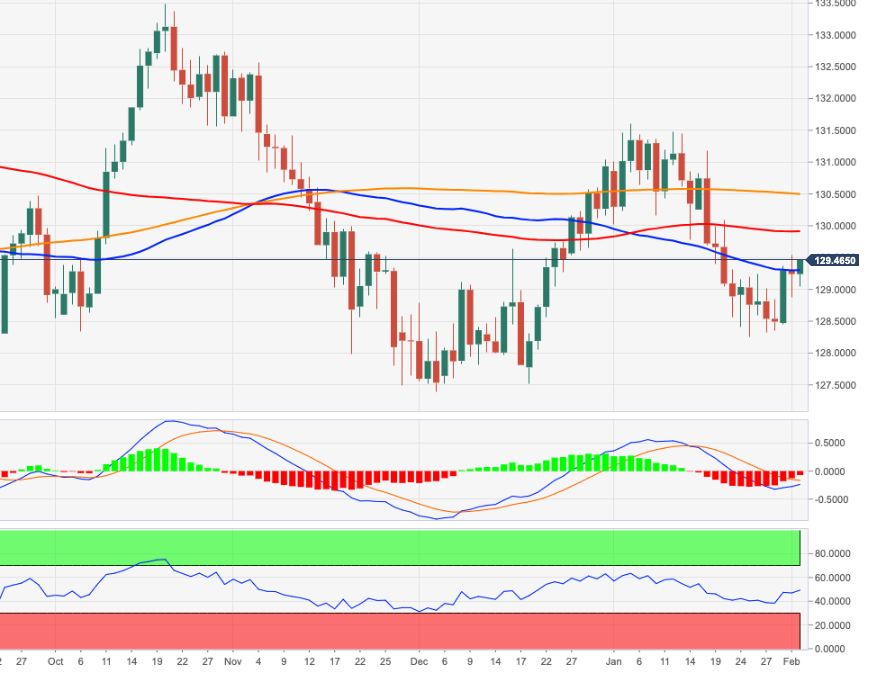
- EUR/JPY resumes the downside following Tuesday’s downtick.
- Next on the upside comes the 200-day SMA near 130.50.
EUR/JPY trades in the upper end of the weekly range further north of the key 129.00 hurdle midweek.
In light of the recent price action, further recovery in the cross could be in the pipeline in the short term. Against this, there is an interim hurdle at the 100-day SMA at 129.88, just ahead of 130.08 (high January 20). The surpass of the latter should put a move to the 200-day SMA, today at 130.45, back on the radar.
While below the 200-day SMA, the outlook for the cross is expected to remain negative.
EUR/JPY daily chart
- The prevalent USD selling bias pushed AUD/USD higher for the third straight day.
- The disappointing US ADP report did little to provide any respite to the USD bulls.
- The RBA’s dovish stance seemed to be the only factor capping gains for the major.
The AUD/USD pair maintained its bid tone through the early European session and held steady near the weekly high, just above mid-0.7100s post-US ADP report.
Automatic Data Processing (ADP) reported this Wednesday that the US private-sector employment declined by 301K in January as against market expectations for an addition of 207K jobs and the 807K previous. The awful data exerted additional pressure on the already weaker US dollar, which continues to be weighed down by less hawkish comments by Fed officials.
In fact, St. Louis Fed President James Bullard (a noted hawk) and Philadelphia Fed President Patrick Harker pushed back against market bets and downplayed the prospect of a 50bps hike in March. Apart from this, a softer tone around the US Treasury bond yields further undermined the safe-haven buck and benefitted the perceived riskier aussie.
The combination of supporting factors largely offset the Reserve Bank of Australia's dovish stance and assisted the AUD/USD pair to capitalize on this week's upward trajectory. This marked the third straight day of an uptick, summing up to a strong rally of nearly 200 pips from the lowest level since July 2020, around the 0.6965 area touched last Friday.
It, however, remains to be seen if bulls are able to maintain their near-term dominant position or opt to lighten their bets ahead of the closely-watched US monthly jobs report (NFP) on Friday. Hence, any subsequent move up might confront resistance near the 0.7175 area, which if cleared will suggest that the AUD/USD pair has bottomed out.
Technical levels to watch
- ADP data showed private US employment falling 301K in January versus expectations for a 207K gain.
- The DXY continues to trade at session lows in the 95.80s with the latest data not doing anything to help it rebound.
Employment in the US private sector fell by 301,000 in January, monthly data published by the Automatic Data Processing (ADP) Research Institute revealed on Wednesday, marking only the second month-on-month drop in employment since April 2020 when the US first went into lockdown. That was a huge miss on consensus economist forecasts for an employment gain of 207,000 and marked a more than 1,000,000 turnaround from December's 776,000 job gain (which ADP had revised lower from 807,000).
“The labor market recovery took a step back at the start of 2022 due to the effect of the Omicron variant and its significant, though likely temporary, impact to job growth,” said Nela Richardson, chief economist, ADP. “The majority of industry sectors experienced job loss, marking the most recent decline since December 2020. Leisure and hospitality saw the largest setback after substantial gains in fourth-quarter 2021, while small businesses were hit hardest by losses, erasing most of the job gains made in December 2021.”
Market Reaction
The DXY continues to trade close to session lows in the 95.80s area in wake of the latest, much weaker than expected ADP jobs report. The report will likely see economists revising down their forecasts for Friday's official payroll number for January, which is unlikely to help the US dollar, which had already been suffering from position squaring and a paring of Fed tightening bets, rebound. That said, the main focus on Friday is on measures of wage cost pressures and labour market slack rather than the headline NFP number, with Fed officials this week already noting they expect a weak headline number.
- WTI rallied above $89.00 to hit fresh seven-year highs as OPEC+’s JMMC recommended a 400K BPD output hike in March.
- The OPEC+ meeting is now underway and expected to confirm this recommendation.
- Oil price upside reflects a pricing out of bets that the group would hike output by more than 400K BPD.
Oil prices popped higher in recent trade, with front-month WTI futures surpassing the $89.00 level to hit fresh seven-year highs as OPEC+’s Joint Ministerial Monitoring Committee (JMMC) recommended a 400K barrel per day (BPD) output hike in March. WTI even managed to briefly advance above the $89.50 level and eye a test of the $90 per barrel mark for the first time since October 2014, though has since dropped back a little. The recommendation from the JMMC, which always meet (though don’t always make a policy recommendation) ahead of OPEC+ meetings, suggests the group will stick to its policy of increasing output by 400K BPD each month.
The positive market reaction likely reflects a pricing out of bets that the group would agree to lift output by more than 400K BPD due to higher prices and strong demand. Attention now turns to the meeting of OPEC+ oil ministers, which just started, who will be expected to take the JMMC’s recommendation. A principal concern that has helped to lift oil prices in recent weeks, noted analysts at UniCredit, “is that many (OPEC+) members are unable to deliver on their quotas due to a lack of spare capacity as a result of years of underinvestment”. “If Saudi and Russia show any signs of raising their production to shoulder shortfalls of some members who cannot meet their output targets, oil prices will likely fall” warned another analyst. “But if there are no such surprises” they continued, “the market is expected to keep a bullish trend as demand is recovering and geopolitical tensions linger”.
Elsewhere in relevant oil market news, weekly private API inventories on Tuesday revealed a surprise drawdown of oil inventories of 1.6M barrels versus expectations for a 1.5M barrel build. Analysts said this has also contributed to recent WTI upside, though, notably the same data also showed a much larger than expected build of 5.8M barrels (versus 1.6M expected) in US gasoline inventories. Oil traders now look ahead to official weekly US EIA numbers out at 1530GMT for confirmation. Separately, another theme worth monitoring is US weather. The centre and Northeast of the US is expected to be hit by a major winter storm this week which is predicted to bring heavy snow and freezing temperatures – analysts have noted this is likely to boost near-term energy demand.
EUR/GBP has regained positive traction on Wednesday. The Bank of England (BoE) policy decision and the European Central Bank (ECB) meeting on Thursday will provide an opportunity for investors to re-evaluate policy expectations. Meanwhile, economists at Rabobank expect EUR/GBP to inch higher towards the 0.85 zone by mid-2022.
Little scope for further BoE moves after spring
“The BoE could follow a 25 bps rate hike this week with another move in May. After that, we see little scope for further moves this cycle. Consequently, we view GBP as being vulnerable in the spring and beyond as the market backtracks on current expectations regarding interest rate settings.”
“The need for flexibility may lessen the amount of conviction with which ECB President Lagarde pushes back against market expectations for 2022 rate hikes at tomorrow’s post council meeting press conference.”
“We expect EUR/GBP to be creeping higher on a three to six-month view towards the 0.85 area in the middle of the year.”
- XAU/USD is consolidating near its 200DMA at $1806 ahead of the release of ADP’s estimate of US January employment change.
- Gold remains decently underpinned as USD continues to decline due to repositioning and a paring back of Fed tightening bets.
As the sharp US dollar downturn continues for a third successive session and with the DXY having shed another 0.5% on the day to drop back below the 96.00 level, spot gold (XAU/USD) prices are trading in the green. Note that a cheaper US dollar makes USD-denominated gold cheaper for purchase by holders of international currencies, thus boosting its demand. Market commentators are citing a combination of 1) a paring back of long positions and 2) a paring back on hawkish Fed bets following recent policymaker communications as the major driver of recent US dollar weakness.
Regarding positioning; MUFG noted on Wednesday that their 2yr z-score measure of Leveraged Funds’ long USD positioning is “at an extreme”, with USD longs at a level not seen since 2011. However, ING says that “if position-squaring is indeed behind this week’s dollar weakness… we expect the dollar’s positioning now to have reached a somewhat more balanced level which can allow for some stabilisation,” the bank says. “After all”, they continue, “a market that is quite freely speculating on the pace and size of Fed tightening is unlikely to turn much less bullish on the dollar anytime soon”.
Regarding recent Fed speak, policymakers played down the prospect of a 50bps rate hike in March. Meanwhile, though policymakers speaking this week have unanimously expressed support for the start of a rate hiking cycle next month, most emphasised a data-dependent approach when it comes to determining its timing, pace and extent. Not only has such rhetoric helped take the wind out of the US dollar, but it has also helped keep a lid on US bond yields, another positive for spot gold.
Ahead of the release of payroll company ADP’s estimate of US employment change in January at 1315GMT, spot gold prices have nudged back above the $1800 level. Analysts have said that due to the data’s poor predictive power of the official NFP number (which is released on Friday) plus the fact that Friday’s number is expected to be pretty poor and larger ignored anyway, markets won’t react much to the ADP release. For now, the XAU/USD price action remains capped by the 200-day moving average at just under $1806, with prices having failed to get above this level on Tuesday. Otherwise, its expected to be a quiet session with no major other US data releases or scheduled Fed speakers.
- USD/JPY prolonged its bearish trend for the fourth straight day amid sustained USD selling.
- Break below the 200-hour SMA, around the 114.55 area, aggravated the bearish pressure.
- Investors now look forward to the US ADP report for some short-term trading opportunities.
The USD/JPY pair continued losing ground through the mid-European session and dropped to over a one-week low, around the 114.25 region in the last hour.
The pair witnessed heavy selling for the fourth successive day on Wednesday and has now retreated nearly 150 pips from the 115.70 area, or a three-week high touched last Friday. Less hawkish comments by Fed officials accelerated the recent US dollar retracement slide from the post-FOMC swing high to the 18-month peak, which, in turn, exerted pressure on the USD/JPY pair.
In fact, St. Louis Fed President James Bullard (a noted hawk) and Philadelphia Fed President Patrick Harker pushed back against market bets and downplayed the prospect of a 50bps hike in March. Bearish traders further took cues from a softer tone surrounding the US Treasury bond yields, which further undermined the greenback and contributed to the USD/JPY pair's ongoing decline.
Apart from this, the downfall could further be attributed to some technical selling below the 200-hour SMA support near the 114.55 area. The USD/JPY pair's inability to attract any buying at lower levels favours bearish traders. This, along with the conflict between Russia and the West over Ukraine, which tends to benefit the safe-haven Japanese yen, supports prospects for further losses.
Market participants now look forward to the US economic docket, highlighting the release of the ADP report on private-sector employment. Apart from this, the US bond yields will influence the USD price dynamics and provide some impetus to the USD/JPY pair. The focus, however, will remain on the closely-watched US monthly jobs report – popularly known as NFP due on Friday.
Technical levels to watch
US ADP jobs report overview
Wednesday's US economic docket highlights the release of the ADP report on private-sector employment, scheduled at 13:15 GMT. Consensus estimates suggest that the US private-sector employers added 207K jobs in January, marking a sharp decelerating from the 807K reported in the previous month. The report might influence expectations from the official Nonfarm Payrolls (NFP) report and help predict how things could move on Friday.
How could it affect EUR/USD?
Ahead of the key release, a stronger Eurozone CPI print pushed the EUR/USD pair back above the 1.1300 mark amid the prevalent US dollar selling bias. Given that Fed officials have downplayed the prospects for a 50 bps rate hike in March, a weaker ADP report would keep the USD bulls on the defensive and provide an additional lift to the pair. Conversely, a stronger print might do little to influence the Fed's policy outlook or provide any meaningful respite to the buck. This, in turn, suggests that the path of least resistance for the pair is to the upside, though traders might refrain from placing aggressive bets ahead of the ECB meeting on Thursday.
Meanwhile, Eren Sengezer, Editor at FXStreet, outlined important technical levels to trade the EUR/USD pair: “ the 200-period and the 100-period SMAs on the four-hour chart form stiff resistance at 1.1320 before the pair could target 1.1340 (Fibonacci 61.8% retracement).”
“On the downside, 1.1260 (Fibonacci 38.2% retracement) aligns as first support. If this level turns into resistance, additional losses toward the 1.1210/1.1200 area (Fibonacci 23.6% retracement, psychological level) could be witnessed,” Eren added further.
Key Notes
• EUR/USD: Options market turns most bullish in 10 weeks
• EUR/USD Forecast: Unconvinced bulls may soon give up
• US Dollar Index extends the downside to 96.10 ahead of data
About the US ADP jobs report
The Employment Change released by the Automatic Data Processing, Inc, Inc is a measure of the change in the number of employed people in the US. Generally speaking, a rise in this indicator has positive implications for consumer spending, stimulating economic growth. So a high reading is traditionally seen as positive, or bullish for the USD, while a low reading is seen as negative, or bearish.
Eurozone money markets now price in 30 basis points of the European Central Bank (ECB) rate hikes by December 2022, according to Reuters.
Earlier in the session, the data published by Eurostat showed that the annual inflation in the euro area, as measured by the Harmonised Index of Consumer Prices (HICP), rose to 5.1% in January from 5% in December. This print came in higher than the market expectation of 4.4%.
Market reaction
EUR/USD preserves its bullish momentum during the European trading hours and the pair was last seen rising 0.35% on the day at 1.1309.
- EUR/GBP regained positive traction on Wednesday, though the uptick lacked follow-through.
- Weaker USD, stronger Eurozone CPI figures underpinned the euro and remained supportive.
- BoE rate hike bets continued acting as a tailwind for sterling and capped any meaningful gains.
The EUR/GBP cross maintained its bid tone through the first half of the European session and refreshed daily high, around the 0.8345 region post-Eurozone CPI.
The cross attracted some buying on Wednesday and reversed a part of the previous day's losses, though bulls seemed struggling to capitalize on this week's bounce from the 0.8300 mark, or the two-year low. The prevalent US dollar selling bias was seen as a key factor that extended some support to the shared currency, which was further underpinned by the stronger Eurozone consumer inflation figures.
In fact, the headline CPI surprised to the upside and jumped 5.1% YoY in January from 5.0% previous. This was well above the consensus forecast pointing to a reading of 4.4%. Adding to this, the core CPI arrived at 2.3% YoY during the reported month as against 1.9% expected and the 2.6% reported in December. this comes days after the German CPI surpassed expectations and rose 5.1% in January.
The supporting factor, however, was offset by a bid tone surrounding the British pound, which remained well supported by expectations for an additional interest rate hike by the Bank of England. This, in turn, held back bulls from placing aggressive bets around the EUR/GBP cross and kept a lid on any meaningful upside, warranting some caution before confirming that a near-term bottom has been formed.
Investors also seemed reluctant and might prefer to wait on the sidelines ahead of the key central bank event risks – the BoE policy decision and the ECB meeting on Thursday. Nevertheless, the EUR/GBP cross, so far, has managed to stick to its modest intraday gains and remains well within the striking distance of the weekly high, around the 0.8360 region touched in the previous day.
Technical levels to watch
The krona has continued to underperform at the start of the new year as it has extended the sell-off that started in November. Economists at Société Générale expect the EUR/SEK to inch higher towards the 10.66/68 region.
Downside limited
“EUR/SEK is likely to head higher towards September 2020 levels of 10.66/10.68.”
“Lower limit of the pattern at 10.20 should cushion.”
The annualized Eurozone Consumer Price Index (CPI) jumps by 5.1% in January, surprising markets to the upside while a tad higher from the previous increase of 5.0%, the latest data published by Eurostat showed on Tuesday. The consensus forecast was for a softer reading of 4.4%.
The core figures arrived at 2.3% YoY in January when compared to 1.9% expectations and 2.6% booked in December.
The Euro area figures come a couple of days after Germany’s annual inflation for January rose above expectations of 4.7%, arriving at 5.1% following a 5.7% increase reported in December.
The bloc’s CPI figures hold significance, as it helps investor assess the chances that the European Central Bank (ECB) might signal a faster than the expected path for policy tightening. The ECB is due to announce its interest rate decision on Thursday.
Key details (via Eurostat)
“Looking at the main components of euro area inflation, energy is expected to have the highest annual rate in January (28.6%, compared with 25.9% in December), followed by food, alcohol & tobacco (3.6%, compared with 3.2% in December), services (2.4%, stable compared with December) and non-energy industrial goods (2.3%, compared with 2.9% in December).”
EUR/USD reaction
EUR/USD briefly recaptured 1.1300 on unexpectedly hotter Eurozone inflation. The spot is currently adding 0.27% on the day, trading at 1.1299.
- USD/CAD gained some positive traction on Wednesday, though lacked any follow-through.
- Bullish oil prices underpinned the loonie and capped the upside amid sustained USD selling.
- Investors now await OPEC+ decision and the US ADP report before placing directional bets.
The USD/CAD pair refreshed daily high during the first half of the European session, though struggled to capitalize on the move beyond the 1.2700 mark.
Following a brief consolidation through the early part of the trading on Wednesday, the USD/CAD pair attracted some buying and for now, seems to have snapped two days of the losing streak. That said, bullish crude oil prices continued underpinning the commodity-linked loonie and capped the upside amid the prevalent US dollar selling bias.
Oil prices held steady near the seven-year high touched last week and remained well supported by expectations about a limited production increase by major oil producers. Adding to this, the conflict between Russia and the West over Ukraine further acted as a tailwind for the black gold ahead of the OPEC+ decision later this Wednesday.
On the other hand, the US dollar was weighed down by less hawkish comments by Fed officials, pushing back against markets bets for a 50 bps rate hike in March. This was seen as another factor that held back traders from placing aggressive bullish bets and kept a lid on any meaningful gains for the USD/CAD pair, at least for now.
Market participants now look forward to headlines coming out of the OPEC+ meeting. This, along with geopolitical developments, will influence oil price dynamics and provide some impetus to the USD/CAD pair. Traders will further take cues from the release of the US ADP report on private-sector employment for some short-term opportunities.
Technical levels to watch
GBP/USD has advanced beyond 1.3500 amid broad-based dollar weakness. But as FXStreet’s Eren Sengezer notes, cable closes in on key resistance at 1.3560 that could cap recovery.
Key resistance level seems to have formed at 1.3560
“The 100-period SMA on the four-hour chart and the Fibonacci 50% retracement of the latest downtrend form a stiff resistance at 1.3560. The 20-day SMA is also reinforcing that level. In case the pair rises above that hurdle and starts using it as support, it could target 1.3600 (psychological level, Fibonacci 61.8% retracement).”
“On the downside, 1.3500 (psychological level, 200-period SMA, Fibonacci 38.2% retracement) align as the first significant support before 1.3460 (Fibonacci 23.6% retracement).”
S&P 500 briefly breached last October lows at 4280 and found strong support near 4200, the 23.6% retracement of the whole up move since 2020. Now the index is staging a strong rebound and further gains are expected once above 4580/4600, economists at Société Générale report.
4425 is first support
“A sharp bounce is under way leading the index close to first layer of resistance at 4580/4600 representing the lower limit of previous channel. This must be overcome for extension in rebound.”
“If the index fails to establish itself above the 4580/4600 hurdle, a pullback is not ruled out. 4425 will be first support.”
See: S&P 500 Index to tank towards a 3,400-3,700 range on escalation of Ukraine-Russia crisis – UBS
- Gold price wavers in a familiar range, but the downside appears favored.
- The USD correction is saving the day for gold bulls ahead of key event risks.
- Gold’s path of least resistance appears down, US jobs data eyed.
Gold price has stalled its two-day relief recovery, as sellers are back in the game amid a risk-on rally on global stocks. Traders have looked past the Fed angst, as upbeat corporate earnings lift the mood. The risk-on flows-driven US dollar demise and retreating Treasury yields are helping put a floor under the gold price. Incoming event risks in the US employment data, BOE and ECB rate decisions, however, will provide a fresh direction in gold price.
Read: Gold back to inflection point
Gold Price: Key levels to watch
The Technical Confluences Detector shows that the gold price is challenging the Fibonacci 61.8% level of the daily range at $1,802 on renewed upside. That is the point where the SMA-50 one-day also hangs around.
If that level is cleared decisively, then bulls will look out for a confluence of the 200-day SMA and Fibonacci 23.6% level of the daily range at $1,806.
The next powerful resistance aligns at $1,809, the intersection of the previous day’s high and Fibonacci 38.2% of the weekly and monthly ranges.
Further up, the 200-4hr SMA at $1,812 will be the level to beat for gold bulls.
On the flip side, the immediate downside cushion is seen at Fibonacci 23.6% of the weekly and monthly ranges at $1,797.
Sellers will then target $1,795, where the 100-day SMA and the previous day’s low meet.
A sharp drop towards $1,789 cannot be ruled out on a breach of the latter. That level is the convergence of the Fibonacci 161.8% of the daily range and daily S2 pivot point.
Here is how it looks on the tool
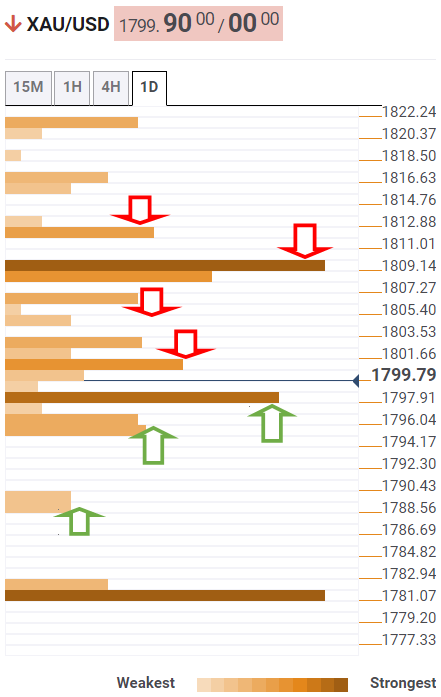
About Technical Confluences Detector
The TCD (Technical Confluences Detector) is a tool to locate and point out those price levels where there is a congestion of indicators, moving averages, Fibonacci levels, Pivot Points, etc. If you are a short-term trader, you will find entry points for counter-trend strategies and hunt a few points at a time. If you are a medium-to-long-term trader, this tool will allow you to know in advance the price levels where a medium-to-long-term trend may stop and rest, where to unwind positions, or where to increase your position size.
- GBP/USD continued scaling higher for the fourth successive day on Wednesday.
- BoE rate hike expectations remained supportive amid sustained USD selling bias.
- Investors now eye the US ADP report for some short-term trading opportunities.
The USD selling remained unabated through the early part of the European session and pushed the GBP/USD pair to a one-and-half-week high, around mid-1.3500s in the last hour.
The pair built on its recent bounce from the 1.3360-1.3355 area, or over two-month low touched last week and gained traction for the fourth successive day on Wednesday. The British pound continued drawing support from expectations that the Bank of England will hike interest rates at its upcoming meeting.
On the other hand, the US dollar was weighed down by less hawkish comments by Fed officials, pushing back against markets bets for a 50 bps rate hike in March. The combination of supporting factors helped offset the UK political drama and remained supportive of the GBP/USD pair's ongoing positive momentum.
Wednesday's move up could further be attributed to some follow-through technical buying following the overnight sustained break through the key 1.3500 psychological mark. It, however, remains to be seen if bulls are able to maintain their dominant position or opt to lighten their bets ahead of the key event/data risks.
The BoE is scheduled to announce its policy decision on Thursday and announce the first back-to-back interest rate rises since 2004. This would allow policymakers to begin paring back the £895 billion balance sheet by stopping the reinvestment of expired bonds, which should continue to act as a tailwind for sterling.
Apart from this, the market focus will be on the release of the closely-watched US monthly jobs report – popularly known as NFP on Friday. In the meantime, the US ADP report on private-sector employment, due later this Wednesday, might influence the USD price dynamics and provide some trading impetus to the GBP/USD pair.
Technical levels to watch
- WTI price turns red for the first time in seven days.
- Bulls turn cautious ahead of the OPEC+ decision, despite the DXY weakness.
- Defending 21-SMA on the 4H chart is critical to retest the seven-year highs.
WTI (NYMEX futures) is posting small losses so far this Wednesday, although defending the $87 mark after repeated failures to at the $88 threshold over the past few sessions.
The retreat in the US oil could be attributed to anxious markets, as they look forward to the OPEC and its allies (OPEC+) meeting due later this Wednesday.
OPEC+ is likely to maintain its existing policies of moderate output increases on Wednesday, Reuters reported, citing five sources from the producers' group.
Meanwhile, the sentiment around the US dollar and Wall Street indices will also play a pivot role in the oil price action.
Traders will also closely eye the Energy Information Administration (EIA) Crude Oil Stocks Change data for fresh trading opportunities.
From a near-term technical perspective, WTI bulls remain hopeful so long as they hold above the horizontal 21-Simple Moving Average (SMA) on the four-hour chart.
The 14-day Relative Strength Index (RSI) holds well above the midline, keeping the bullish potential intact.
If the bulls regain momentum, then a retest of the seven-year top at $88.22 cannot be ruled out.
On the flip side, a breach of the 21-SMA on a four-hourly candlestick closing basis will trigger a fresh downswing towards the ascending 50-SMA at $86.05.
WTI: Daily chart
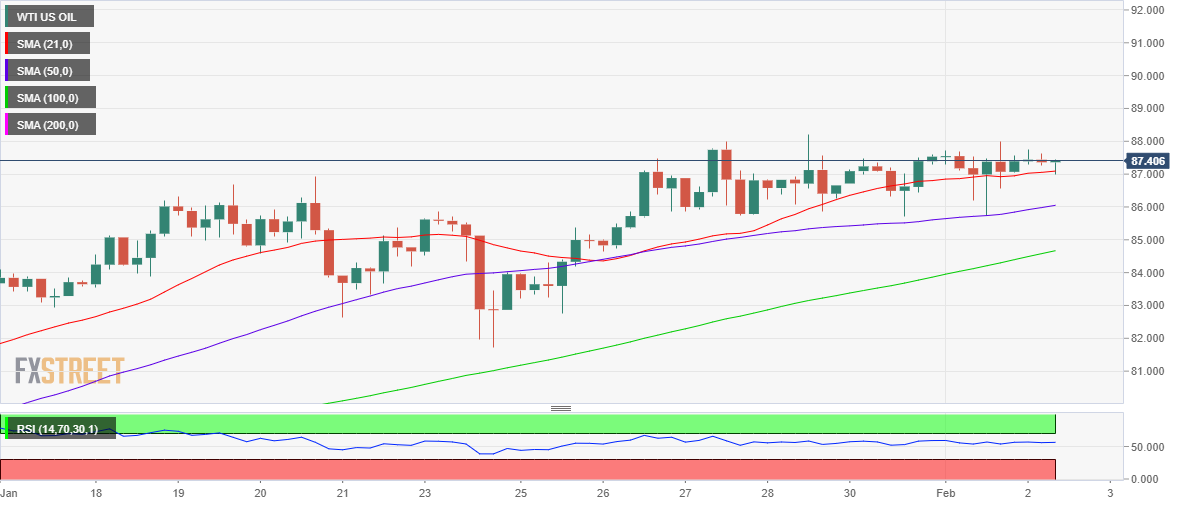
WTI: Additional levels to watch
- USD/CHF edged lower for the fourth successive day amid the prevalent USD selling bias.
- Geopolitical tensions benefitted the safe-haven CHF and contributed to the ongoing fall.
- Investors look forward to the US ADP report for some short-term trading opportunities.
The USD/CHF pair dropped to a one-week low during the early European session, with bears now looking to extend the downward trajectory further below the 0.9200 mark.
Following a brief consolidation earlier this Wednesday, the USD/CHF pair met with a fresh supply and retreated further from over a two-month high, around the 0.9345 area touched earlier this week. The US dollar continues to be weighed down by less hawkish comments by Fed officials. This, in turn, was seen as a key factor that dragged the pair lower for the fourth successive day.
In fact, St. Louis Fed President James Bullard (a noted hawk) and Philadelphia Fed President Patrick Harker pushed back against market bets and downplayed the prospect of a 50bps hike in March. Apart from this, the conflict between Russia and the West over Ukraine benefitted the Swiss franc's safe-haven status and also contributed to the selling bias around the USD/CHF pair.
From a technical perspective, the weekly fall of over 150 pips and acceptance below the 0.9200 mark will set the stage for a further near-term depreciating move for the USD/CHF pair. That said, investors might refrain from placing aggressive bets and prefer to wait for the release of the closely-watched US monthly jobs report – popularly known as NFP on Friday.
In the meantime, market participants on Wednesday will take cues from the US ADP report on private-sector employment, due later during the early North American session. The data might influence the USD price dynamics and provide some impetus to the USD/CHF pair. This, along with the broader market risk sentiment, should produce some short-term trading opportunities.
Technical levels to watch
- EUR/USD extends the upside to the boundaries of 1.1300.
- Final January EMU CPI next of note in the domestic calendar.
- US ADP report will be the salient event later in the NA session.
The upside momentum around the shared currency remains everything but abated and now lifts EUR/USD to fresh multi-day highs near 1.1300 the figure on Wednesday.
EUR/USD strong on USD selling
EUR/USD advances uninterruptedly since Friday on the back of now deep correction in the US dollar, recovering at the same time nearly half of the selloff witnessed in the second half of January.
As mentioned, the greenback continues to lose ground on the back of the moderate improvement in the risk appetite trends, lower US yields and the perception of a less aggressive start of the Fed’s lift-off, as per recent comments from some Fed speakers.
The strong rebound in spot comes along the bounce in yields of the German 10y Bund reference to the positive territory on a more convincing note, as they managed to flirt with the 0.05% level for the first time since April 2019 on Tuesday.
In the docket, the focus of attention will be on the release of the final inflation figures in the broader Euroland for the month of January. In the US data sphere, the job creation by the US private sector tracked by the ADP report will be the salient event later on Wednesday.
What to look for around EUR
EUR/USD extended the bounce off 1.1120 (January 28) and now re-targets the 1.1300 barrier amidst improved risk appetite trends and the renewed selling mood in the dollar. Moving forward, the outlook for the pair remains far from rosy despite the rebound, particularly in light of the Fed’s imminent start of the tightening cycle vs. the accommodative-for-longer stance in the ECB, despite the high inflation in the euro area is not giving any things of cooling down for the time being. On another front, the unabated advance of the coronavirus pandemic remains as the exclusive factor to look at when it comes to economic growth prospects and investors’ morale in the region.
Key events in the euro area this week: EMU Flash January CPI (Wednesday) – EMU, Germany Final January Services PMI, ECB Meeting (Thursday) – EMU Retail Sales (Friday).
Eminent issues on the back boiler: Asymmetric economic recovery post-pandemic in the euro area. ECB stance/potential reaction to the persistent elevated inflation in the region. ECB tapering speculation/rate path. Italy elects President of the Republic in late January. Presidential elections in France in April. Geopolitical concerns from the Russia-Ukraine conflict.
EUR/USD levels to watch
So far, spot is gaining 0.13% at 1.1285 and faces the next up barrier at 1.1294 (weekly high Feb.2) seconded by 1.1304 (55-day SMA) and finally 1.1369 (high Jan.20). On the other hand, a break below 1.1121 (2022 low Jan.28) would target 1.1100 (round level) en route to 1.1000 (psychological level).
The Korean won depreciated by 1.4% against the US dollar in January. Economists at Société Générale expect the USD/KRW pair to edge higher towards 1217727.
Holding above 1185 is crucial for persistence in up move
“USD/KRW is expected to inch higher towards next projections at 1217 and 1227.”
“Defending a multi-month trend line at 1185 will be crucial for persistence in up move.”
During January the krona weakened against the euro from 10.294 to 10.474. In the year ahead, economists at MUFG Bank expect the krona to strengthen modestly against the euro.
Riksbank moves to gradually tighten policy ahead of ECB
“The krona should derive more support against the euro at least from our view that the Riksbank will normalize policy ahead of the ECB.”
“The Riksbank has just ended their QE programme at the end of last year and has signalled a willingness to begin shrinking their balance sheet before rate hikes are currently planned in 2024.”
EUR/CHF has bounced towards the daily Ichimoku cloud at 1.0440. A break above here is needed to see further gains towards the low of 2020 near 1.0510, economists at Société Générale report.
Initial support seen at 1.0325
“The 1.0440 resistance must be crossed for an extended rebound towards the low of 2020 near 1.0510.”
“December low of 1.0325 is first support.”
- DXY sheds further ground and approaches the 96.00 neighbourhood.
- US yields keep showing an absence of upside traction.
- US ADP report will take centre stage later in the NA session.
The recent selloff in the greenback remains well and sound and now drags the US Dollar Index (DXY) closer to the 96.00 mark on Wednesday.
US Dollar Index focuses on data, yields
The index loses ground for the third session in a row and puts the 96.00 yardstick to the test amidst the continuation of the upbeat sentiment in the risk complex and the lack of upside traction in US yields.
Indeed, the consolidative phase in the US cash markets prevails so far, prompting yields to extend the range bound theme in the upper end of the recent range as market participants continue to recalibrate their expectations to the potential Fed’s interest rate path.
In the US data space, the ADP report will take centre stage seconded by the weekly figures from Mortgage Applications measured by MBA.
What to look for around USD
The dollar’s corrective move remains well in place following recent 2022 peaks (January 28), always amidst the improved mood in the risk-associated universe and muted US yields. The sharp advance in the index in past sessions followed expectations that the Federal Reserve will start its hiking cycle and quantitative tightening in the relatively short-term horizon. Furthermore, the constructive outlook for the greenback is expected to remain unchanged for the time being on the back of rising yields, persistent elevated inflation, supportive Fedspeak and the solid pace of the US economic recovery.
Key events in the US this week:) ADP Employment Change (Wednesday) – Initial Jobless Claims, ISM Non-Manufacturing PMI, Factory Orders (Thursday) – Nonfarm Payrolls, Unemployment Rate (Friday).
Eminent issues on the back boiler: Fed’s rate path this year. US-China trade conflict under the Biden administration. Debt ceiling issues. Escalating geopolitical effervescence vs. Russia and China.
US Dollar Index relevant levels
Now, the index is losing 0.18% at 96.09 and a break above 97.44 (2022 high Jan.28) would open the door to 97.80 (high Jun.30 2020) and finally 98.00 (round level). On the flip side, the next down barrier emerges at 95.91 (20-day SMA) seconded by 95.41 (low Jan.20) and then 94.62 (2022 low Jan.14).
The Chinese yuan depreciated by 0.11% against the US dollar in January. Economists at MUFG Bank expect the USD/CNY to hover around this month and then edge higher towards 6.40 the end of the first quarter.
Further policy rate cut expected in China
“We expect additional policy rate cut by PBoC to happen in the remainder of Q1, and the divergent direction of monetary policies between China and the US implies a further narrowing of yield spreads between US and China, which will put downward pressure on CNY. But-near term, seasonality factor, those corporations with US dollar may still have demand for conversion around/after the Chinese New Year time, which might keep CNY at relative strong levels.”
“We expect USD/CNY to remain around 6.3700 in February, and then to move slightly higher to 6.4000 by the end of Q1 2022.”
USD/BRL erased the 200-day moving average (DMA) at 5.37 earlier this week and is now lining up a test of 5.22. Below here, next objectives would be 5.11, last September low and the range at 4.95/4.89, economists at Société Générale report.
200-DMA at 5.37 to cap an initial bounce
“Next potential support is located at 5.22, the 61.8% retracement from last June.”
“An initial bounce is likely however 200-DMA at 5.37 is likely to cap.”
“If the downtrend persists below 5.22, next potential objectives would be at 5.11, last September low and the lower band of the range at 4.95/4.89.”
The US Dollar Index(DXY) advanced by 0.9% in January after weakening by 0.3% in December. Economists at MUFG Bank continue to see scope for further modest dollar strength but they maintain that will reverse later in the year.
USD strength for now
“The focus on the potential for more aggressive tightening by the Fed will likely keep the US dollar supported for now.”
“We remain sceptical of the tightening priced to be delivered which will likely mean the US dollar strength reverses later in the year.”
The New Zealand dollar has been trending weaker in recent months. Economists at MUFG Bank expect the kiwi to recover later in 2022 as the Reserve Bank of New Zealand (RBNZ) has plenty of space to hike.
RBNZ is expected to be the most aggressive in tightening through this year
“The OIS market pricing showing the RBNZ is expected to be the most aggressive in tightening through this year.”
“Even if economic data remains mixed, the RBNZ will be determined to move forward with additional rate hikes. This could weigh on NZD performance initially but assuming domestic conditions improve, NZD recovery later in the year should follow.”
The EUR/USD pair seems to have gone into a consolidation phase below 1.1300 as investors await EU inflation data. Euro could lose traction on soft EU inflation print, FXStreet’s Eren Sengezer reports.
Euro faces stiff resistance levels at 1.1300 and 1.1320
“The Consumer Price Index (CPI) in the euro area is forecast to edge lower to 4.4% on a yearly basis in January from 5% in December. A weaker-than-expected CPI print could make it difficult for the shared currency to continue to outperform the greenback. On the other hand, EUR/USD could gather further bullish momentum in case inflation proves to be hotter than expected in January.”
“In order to extend its recovery, EUR/USD needs to overcome 1.1300, where the Fibonacci 50% retracement of the two-week-long downtrend is located. Above that level, the 200-period and the 100-period SMAs on the four-hour chart form stiff resistance at 1.1320 before the pair could target 1.1340 (Fibonacci 61.8% retracement).”
“On the downside, 1.1260 (Fibonacci 38.2% retracement) aligns as first support. If this level turns into resistance, additional losses toward the 1.1210/1.1200 area (Fibonacci 23.6% retracement, psychological level) could be witnessed.”
Economists at Bank of America Global Research expect the Bank of England (BoE) to hike 25bp at its meeting this week, then 25bp in May and August. Nonetheless, they see limited scope for the British pound upside.
BoE to confirm it will cease gilt reinvestments
"We expect the BoE to hike 25bp at its meeting this week, then 25bp in May and August. We expect the BoE to confirm it will cease gilt reinvestments when it hikes in February, starting 'passive' Quantitative Tightening (QT). We expect the BoE to also begin active sales in November at an initial pace of GBP5 B a month."
"We doubt that a hawkish BoE provides the kind of impetus that it did in December as GBP enters into a month which has historically presented seasonal headwinds to sterling."
Statement from the Bank of Canada (BoC) Governor Tiff Macklem will be crucial as markets brace for the BoC rate hike. Economists at ING expect the USD/CAD pair to edge lower to 1.2600 this week and extend its fall below 1.2500 by the summer.
Keep an eye on Macklem's comments
“Rate differentials continue to offer a bullish argument for the loonie, and markets are currently pricing in six BoC rate hikes in 2022. This may be a key topic in today’s Senate testimony by the BoC Governor Tiff Macklem, as policymakers may question whether the Bank is doing enough to fight inflation. Hawkish comments by Macklem may both consolidate markets’ view around six hikes in 2022 and fuel speculation about a 50bp move in March.”
“We could see CAD edge back to 1.2600 thanks to the supported environment for pro-cyclical currencies this week.”
“We think that the aggressive BoC tightening cycle will provide some substantial support to the loonie this year, and we expect a move below 1.25 by the summer.”
- The prevalent USD selling bias assisted AUD/USD to gain traction for the third successive day.
- The RBA’s dovish stance held back bulls from placing aggressive bets and capped the upside.
- Investors now look forward to the US ADP report for some short-term trading opportunities.
The AUD/USD pair traded with a mild positive bias through the early European session and was last seen hovering near the daily high, around the 0.7140 region.
The pair build on its recent strong recovery move from the lowest level since July 2020 touched last week and edged higher for the third successive day on Wednesday. Fed officials downplayed the prospect of a 50 bps hike in March, which, kept the US dollar bulls on the defensive and extended some support to the AUD/USD pair.
In fact, St. Louis Fed President James Bullard said on Tuesday that he would argue for rate rises in March, May and June, but did not favour a 50 bps hike. Adding to this, Philadelphia Fed President Patrick Harker said that he supports a 25 bps increase in March and is a little less convinced for a 50 bps hike.
Apart from this, a generally positive tone around the equity markets further undermined the greenback's relative safe-haven status and benefitted the perceived riskier aussie. That said, earlier dovish remarks by the Reserve Bank of Australia, Governor Phillip Lowe, kept a lid on any meaningful gains for the AUD/USD pair.
Speaking at the National Press Club, Lowe said that the end of QE doesn't mean cash-rate rise is imminent and reiterated that a rise in inflation does not require an immediate response. This comes after the RBA on Tuesday indicated that it would be patient in terms of raising interest rates despite soaring inflation.
The fundamental backdrop warrants some caution for aggressive bullish traders and makes it prudent to wait for a strong follow-through buying before confirming that AUD/USD pair has bottomed out. Hence, any subsequent move up might still be seen as a selling opportunity and runs the risk of fizzling out rather quickly.
Market participants now look forward to the release of the US ADP report on private-sector employment, due later during the early North American session. The data might influence the USD price dynamics, which, along with the broader market risk sentiment, should provide some impetus to the AUD/USD pair
Technical levels to watch
The Bank of Thailand (BoT) will not sound the alarm over baht strength until USD/THB nears the 31.00 level or lower, in the view of economists at Credit Suisse.
There is still much further potential for growth to Thai tourism
“The Thai government has been relatively fast in easing restrictions on the movement of people in 2022, and we think increased demand from abroad for Thai tourism services will put appreciation pressure on the Thai baht.”
“Despite headwinds from a hawkish Fed, we think USD/THB will trade lower towards 32.00, with no intervention from the BoT until USD/THB reaches 31.00 or lower.”
EUR/USD stays relatively quiet below 1.1300. This level should be a tough resistance, in the opinion of economists at ING.
EUR/USD to remain in the 1.1250/1.1300 area
“EUR/USD has remained quite bid, now eyeing the 1.1300 level. This is a level that could indeed see some resistance and attract many sellers, so we are inclined to think EUR/USD will remain in the 1.1250/1.1300 area into tomorrow’s ECB meeting.”
“We see mostly downside risks for the pair as the hawkish bar has been set higher after the strong German CPI numbers on Monday and we expect President Lagarde to keep showing patience on inflation and tightening.”
Analysts at Credit Suisse believe it is too early to position for a trend-reversal in EUR/CHF. They revise the exchange rate target lower from 1.0250 to 1.0050.
SNB stresses its price stability mandate
“A resumption of the downtrend is still possible as the SNB is very much committed to its price stability mandate. Switzerland's healthy external account and a deteriorating global risk sentiment should also support the franc.”
“Given the proximity of the current spot rate to our previous target of 1.0250, we revise it lower to 1.0050.”
“We adjust lower the level where we consider our view incorrect from 1.0720 to 1.0610.”
- USD/JPY turned lower for the fourth successive day amid modest USD weakness.
- Geopolitical tensions benefitted the safe-haven JPY and added to the selling bias.
- The Fed-BoJ monetary policy divergence should limit further losses for the major.
The USD/JPY pair edged lower through the early European session and dropped closer to the overnight swing low, around the 114.60 region in the last hour.
Following an early uptick to the 114.80 area, the USD/JPY pair met with a fresh supply and drifted into the negative territory for the fourth successive day on Wednesday. Bears might now be looking to extend the recent sharp pullback from the 115.70 region touched last week amid the prevalent selling bias around the US dollar.
Fed officials downplayed the prospect of a 50bps hike in March, which, in turn, weighed on the buck. In fact, St. Louis Fed President James Bullard said that he did not favour a more aggressive policy response. Separately, Philadelphia Fed President Patrick Harker said that he is a little less convinced of a 50 bps hike.
On the other hand, the conflict between Russia and the West over Ukraine continued lending some support to the safe-haven Japanese yen. This was seen as another factor exerting some pressure on the USD/JPY pair, though the divergence between the Fed and the Bank of Japan policy outlook should help limit any further losses.
The markets have fully priced in an eventual Fed liftoff in March and expect five quarter-point rate hikes by the end of 2022. Conversely, the Bank of Japan has repeatedly reaffirmed to continue with its persistent and powerful monetary easing until further notice. This, in turn, warrants some caution for aggressive bearish traders.
Moving ahead, traders now look forward to the US ADP report on private-sector employment for some impetus later during the early North American session. The data might influence the USD price dynamics, though the market focus will remain on Friday's release of the closely-watched US monthly jobs report (NFP).
Technical levels to watch
Gold price is trading just below the $1,800 threshold. In the view of FXStreet’s Dhwani Mehta, XAU/USD’s path of least resistance appears down as a break below the 100-day moving average (DMA) at $1,795 would allow room for more declines.
Sellers just have one key barrier in the 100-DMA to crack
“Bears are fencing the $1,795 area, where the horizontal 100-DMA aligns. A sustained break below here will call for a retest of the January 28 lows of $1,780. Once that is breached, the additional downside will target the December 16 troughs of $1,776. Further south, the $1,750 psychological barrier will be back on bears’ radars.”
“On the flip side, recapturing 50-DMA at $1,802on a daily closing basis is critical to take on the all-important 200-DMA once again, which is now at $1,806. Should the renewed upside hold, buyers will look out to test the confluence of the wedge support-turned-resistance and bearish 21-DMA at $1,815.”
- Markets begin February on firmer tone as Fed fears ease, earnings rise.
- Off in China, Hong Kong restricts moves, Indian bourses ignore RBI rate hike concerns.
- NZX 50 cheers mixed NZ employment data, RBA’s Lowe propels ASX 200.
Equity investors remain mostly positive during Wednesday’s Asian session as fears of the Fed’s monetary policy tightening fade. Also favoring the stock buyers are upbeat earnings and the market’s bullish consolidation during the month-start moves.
While portraying the mood, MSCI’s index of Asia-Pacific shares ex-Japan rises 0.20% but Japan’s Nikkei 225 rallies 1.7% BOJ Governor Kuroda praise easy money policies.
On the same line was RBA Governor Philip Lowe who refrained from rate lift signals and favored ASX 200 to rise around 1.20% heading into Wednesday’s European session. Further, New Zealand’s NZX 50 also pleased the bulls with near 2.0% daily jump after the Q4 employment data failed to bolster RBNZ hawks.
It should be noted that off in China and Hong Kong limits the market moves elsewhere but India as New Delhi still rejoices Union Budget while paying a little heed to the RBI rate hike concerns.
On a broader front, the US 10-year Treasury yields fade the previous day’s rebound from a weekly low near 1.80% while upbeat prints of the Wall Street benchmarks seem to help the S&P 500 Futures to remain firm around 4,555 at the latest. Additionally, Euro Stoxx 50 Futures also rise 0.30% by the press time.
It’s worth noting that the US Dollar Index (DXY) remains pressured for the fourth consecutive day near the weekly low but commodities aren’t capable of extending the previous gains.
That said, the key challenges to the sentiment are mixed comments from the US Federal Reserve (Fed) officials and the recently firmer US data, as well as the US Senate’s procedural voting on China Competition Bill. On the contrary, receding fears of Russia’s immediate invasion of Ukraine join the market’s optimism to overcome the Omicron-linked supply crunch fears.
Moving on, the Eurozone Consumer Price Index (CPI) for January, expected 4.4% YoY versus 5.5% prior, will precede the early signal to Friday’s US Nonfarm Payrolls (NFP), namely the US ADP Employment Change for January, expected 207K versus 807K prior, to direct market’s intraday moves. Though, major attention will be given to Fedspeak and Russia-Ukraine headlines.
Read: US T-bond yields fade bounce off weekly low, stock futures track Wall Street gains
FX option expiries for February 2 NY cut at 10:00 Eastern Time, via DTCC, can be found below.
- EUR/USD: EUR amounts
- 1.1200 596m
- 1.1240 1.3b
- 1.1300 359m
- USD/JPY: USD amounts
- 112.90 600m
- 113.25 600m
- 113.61 600m
- 115.00 1.1b
- 115.50 761m
- 116.00 1.5b
- GBP/USD: GBP amounts
- 1.3645 404m
- USD/CHF: USD amounts
- 0.9250 435m
- AUD/USD: AUD amounts
- 0.7050 506m
- 0.7250 563m
- USD/CAD: USD amounts
- 1.2500 711m
- Silver remained confined in a narrow trading range heading into the European session on Wednesday.
- The price action favours bearish traders and supports prospects for an extension of the recent decline.
- Sustained strength beyond the $23.00 round figure is needed to negate the near-term bearish outlook.
Silver struggled to gain any meaningful traction on Wednesday and oscillated in a narrow trading band, just above mid-$22.00s heading into the European session.
Given the previous day's rejection slide from the $23.00 mark, the lack of buying interest favours bearish traders and supports prospects for the resumption of a two-week-old descending trend. The negative bias is reinforced by the fact that technical indicators are holding deep in the bearish territory on 4-hour/daily charts.
Some follow-through selling below the $22.50 area will reaffirm the outlook and drag the XAG/USD back towards last week's swing high, around the $22.15 region. This is closely followed by the $22.00 mark, which if broken decisively should pave the way for a slide towards challenging the double-bottom support, around the $21.40 zone.
On the flip side, the $23.00 mark might continue to act as an immediate strong resistance ahead of the $23.35-$23.40 region. Sustained strength beyond will negate the bearish outlook and prompt some technical buying. This should allow the XAG/USD to surpass the $24.00 mark and climb further towards the YTD high, around the $24.70 region.
Silver 1-hour chart
-637793815999763911.png)
Technical levels to watch
Here is what you need to know on Wednesday, February 2:
The greenback continued to weaken against its rivals on Tuesday and the US Dollar Index (DXY) erased a large portion of the previous week's gains. The risk-positive market environment made it difficult for the dollar to find demand and the benchmark 10-year US Treasury bond yield returned below 1.8% to weigh further on the currency. Early Wednesday, the DXY seems to have gone into a consolidation phase above 96.00. Markets await January Consumer Price Index (CPI) data from the euro area and the ADP's private-sector employment report for the US ahead of Thursday's highly anticipated central bank meetings.
After rising nearly 2% on Monday, the S&P 500 Index opened modestly on Tuesday but ended up closing the day in the positive territory. Early Wednesday, US stock index futures are up between 0.1% and 0.35%.
EUR/USD stays relatively quiet below 1.1300 heading into the European session. CPI in the euro area is forecast to decline to 4.4% on a yearly basis from 5% in December. A soft inflation print could cause the shared currency to lose interest.
GBP/USD is fluctuating in a tight range above 1.3500. The market expectation is for the Bank of England to raise its policy rate by 25 basis points on Thursday.
USD/JPY fell for the third straight trading day on Tuesday pressured by retreating US Treasury bond yields. The pair was last seen moving sideways at aroun115.00.
NZD/USD lost its bullish momentum following the mixed jobs report and was last seen trading flat on the day near 0.6630. The Unemployment Rate in New Zealand declined to 3.2% in the fourth quarter from 3.4%. On a negative note, Employment Change arrived at +0.1% in Q4, falling short of the market expectation of 0.3%.
Gold rose toward $1,810 on Tuesday but gave back the majority of its daily gains before closing near $1,800. The yellow metal is trading in the negative territory early Wednesday.
Bitcoin extended its rebound on Tuesday but seems to have lost its bullish momentum before testing $40,000. Ethereum closed the last two trading days in the green and gained nearly 7% during that period before going into a consolidation phase at around $2,700.
- USD/CHF remains pressured around one-week low, struggles after three-day downtrend.
- Downbeat RSI joins key SMA, Fibonacci retracement levels to test the bears.
- Buyers need validation from three-week-old horizontal resistance to regain control.
USD/CHF remains pressured around 0.9210 during the four-day downtrend ahead of Wednesday’s European session.
In doing so, the Swiss currency (CHF) pair seesaws around 50% Fibonacci retracement (Fibo.) of January 13-31 upside amid bearish MACD signals.
Although a clear downside break of a short-term horizontal area comprising early January tops favor USD/CHF sellers, coupled with the downbeat MACD, weak RSI line hints at the receding power of bears.
Even if the quote declines further and breaks the 0.9200 immediate support, a convergence of the 200-SMA, 100-SMA and 61.8% Fibo. near 0.9190-85 will be a tough nut to crack for the bears.
Also acting as downside filters are the multiple tops marked during late January around 0.9180, as well as an upward sloping trend line from January 13, at 0.9128 by the press time.
Alternatively, recovery moves need to cross the support-turned-resistance zone surrounding 0.9280 to convince USD/CHF buyers.
Following that, an upward trajectory towards the highs marked in January 2022 and November 2021, respectively near 0.9345 and 0.9375, can’t be ruled out.
USD/CHF: Four-hour chart

Trend: Limited downside expected
Open interest in natural gas futures markets rose for the fourth session in a row on Tuesday, now by around 1.8K contracts, according to advanced prints from CME Group. On the flip side, volume shrank by around 46.4K contracts, adding to Monday’s drop.
Natural Gas: Strong hurdle emerges around $5.00
Prices of natural gas somewhat reversed the ongoing rally on Tuesday. The downtick was in tandem with rising open interest, which favours further decline in the very near term, while the moderate drop in volume could slow the pace/extension of that potential move. Extra gains in natural gas, in the meantime, need to clear the $5.00 mark per MMBtu on a sustainable fashion.
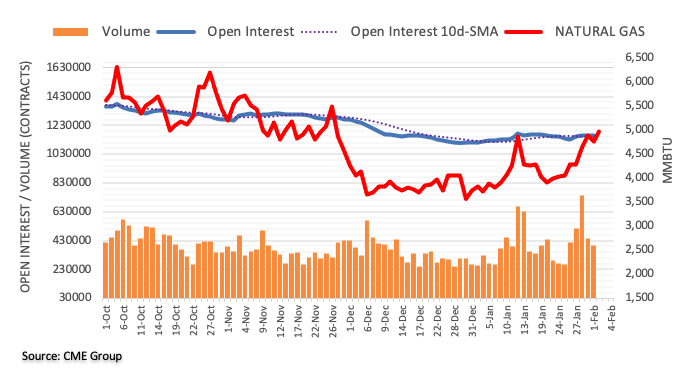
- EUR/GBP sees a renewed upside while above 0.8300.
- The cross needs to clear the 21-DMA to take on the 0.8360 barrier.
- Bearish RSI keeps bulls cautious ahead of key BOE, ECB showdown.
EUR/GBP is trying hard to extend the previous rebound from near the 0.8320 region, currently trading in the green at 0.8336.
Despite the uptick, bulls appear non-committal ahead of the BOE and ECB monetary policy decisions due Thursday, with the former likely to hike the interest rates for the second time in a row.
The ECB is likely to stand pat while dismissing the inflationary concerns. The central bank divergence is likely to limit the bullish potential in the cross.
Technically, the EUR/GBP cross is making headways to recapture the bearish 21-Daily Moving Average (DMA) at 0.8346.
Further up, the recent range highs near 0.8360 will emerge as a powerful resistance for the optimists.
The next level to beat for bulls will be the 0.8400 round number.
EUR/GBP daily chart
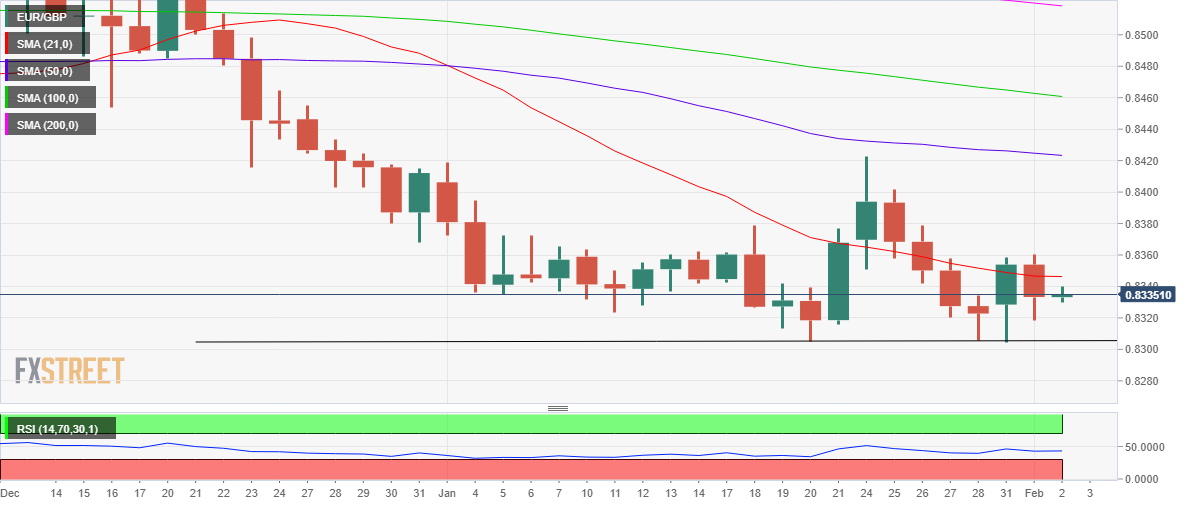
However, the 14-day Relative Strength Index (RSI) remains below the midline, warranting caution for bulls.
Therefore, selling resurgence could call for a retest of Tuesday’s low of 0.8318, below which 0.8300 could be probed.
That level is the critical horizontal trendline support on the daily time frame.
EUR/GBP additional levels
- GBP/USD struggles to extend three-day uptrend at weekly top.
- EU toughens rules on using antibiotics on animals, British businesses accuse government of trolling with heavy Brexit report.
- UK PM Johnson apologizes on Sue Gray report but no fines announced yet, UK Foreign Minister Truss tests covid positive.
- US ADP Employment Change, risk catalysts can entertain traders ahead of Super Thursday.
GBP/USD grinds higher around the weekly top, recently taking rounds to 1.3520 as cable traders brace for Wednesday’s London open.
In doing so, the quote fails to cheer USD weakness as challenges emanating from Brexit and the UK politics join pre-BOE caution. Also challenging the market’s immediate performance is the looming precursor of Friday’s US Nonfarm Payrolls, namely the US ADP Employment Change figures for January.
Amid a Brexit deadlock, Independent says, “Post-Brexit trade deals present a “real risk” to UK farming standards, campaigners have warned, as the EU introduces tough new restrictions on the use of antibiotics on animals. On the same line were major criticism of the 108-page “Benefits of Brexit’ report by the UK businesses over long delays, higher costs and more paperwork. It’s worth noting that UK’s Foreign Minister, newly appointed Brexit Chief, Liz Truss recently became the second Cabinet Minister to get infected with the covid, which in turn hints at the further delay in the Brexit talks and a negative sign for the GBP/USD prices.
Elsewhere, UK PM Boris Johnson apologized after finding guilty of holding parties during the covid-led lockdown, per Sue Gray's report. However, No10 refrains from any fines and said, per The Guardian, “If Boris Johnson is fined by the police over illegal parties at No 10, the public will be told.”
On the other hand, the US Dollar Index (DXY) also remains sluggish around weekly low on mixed data and unclear Fedspeak. On Tuesday, US ISM Services PMI for January rose to 57.6 versus 57.5 expected, marking the 20th straight expansion of the manufacturing activity.
Talking about the Fedspeak, Atlanta Fed President Raphael Bostic said on Tuesday that there is a "real danger" of inflation expectations drifting from the Fed's 2.0% target to 4% or higher. On the other hand, St Louis Fed President James Bullard said that he thinks it is an open question whether the Fed will have to become more restrictive (i.e. raise rates above the "neutral" 2.0%-2.5% zone).
It’s worth observing that the US Senate’s procedural voting on the China Competition Bill and chatters over Russia-Ukraine, as well as mixed concerns for global inflation, challenge markets ahead of the key weekly events, including the Bank of England (BOE) monetary policy meetings. Ahead of the BOE, Reuters said, “Most economists polled by Reuters think the BoE will on Thursday raise interest rates to 0.5% -- the threshold at which it has said it will start unwinding its 895 billion pounds ($1.2 trillion) quantitative easing program.”
On an intraday basis, the US ADP Employment Change for January, expected 207K versus 807K prior, will be important for the GBP/USD traders.
Technical analysis
GBP/USD bulls attack a descending resistance line from January 13, around 1.3530, while keeping the three-day rebound from the 61.8% Fibonacci retracement (Fibo.) of December 2021 to early January 2022 upside. Even so, the 100-SMA level near 1.3560 will act as an extra filter to the north before fueling the GBP/USD prices towards the previous month’s peak of 1.3748.
Alternatively, pullback moves may aim for the 50-SMA level of 1.3470 ahead of highlighting a convergence of the previous resistance line from January 20 and 61.8% Fibonacci retracement level surrounding 1.3385.
Considering flash data from CME Group for crude oil futures markets, open interest dropped by 6K contracts on Tuesday, reversing the previous day’s pullback. Volume, instead, remained choppy and increased by nearly 27K contracts following the uptick seen at the beginning of the week.
WTI faces solid resistance around $90.00
The rally in prices of the WTI could be losing some momentum after Tuesday’s uptick was amidst rising open interest and declining volume. In addition, the commodity navigates the overbought territory, which could also spark a corrective move in the not-so-distant future. In the meantime, the $90.00 zone keeps capping the upside for the time being.
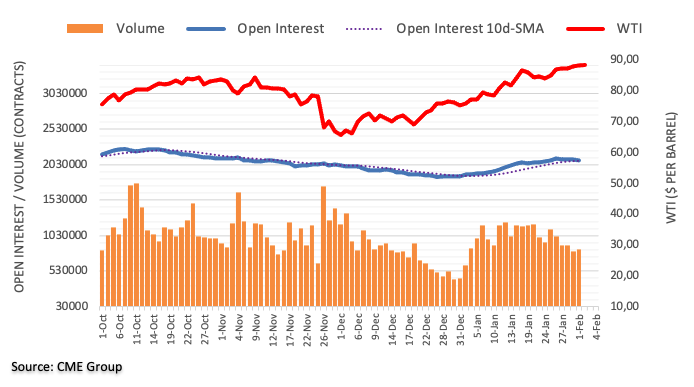
CME Group’s preliminary readings for gold futures markets noted traders trimmed their open interest positions by nearly 7K contracts on Tuesday, the fifth consecutive daily pullback. Volume followed suit and also extended the downtrend, this time by around 14.7K contracts.
Gold looks to support $1,800
Tuesday’s uptick in prices of gold came amidst shrinking open interest and volume, which is indicative that extra losses look not favoured at least in the very near term. That said, the $1,800 still emerges as the key magnet for bulls for the time being.

- AUD/USD stays firmer around weekly top during three-day uptrend.
- Sustained break of two-week-old descending trend line, bullish MACD signals favor buyers.
- 200-SMA, 61.8% Fibonacci retracement level will challenge bullish momentum.
AUD/USD bulls attack key Fibonacci retracement level near the weekly top, up 0.12% intraday near 0.7135 heading into Wednesday’s European session.
The Aussie pair’s latest up-moves could be linked to the previous day’s upside break of a descending resistance line from January 20, as well as bullish MACD signals.
However, a convergence of the 61.8% Fibonacci retracement (Fibo.) of January 13-28 downside and 200-SMA, near 0.7180-85, becomes a tough nut to crack for the AUD/USD bulls.
That said, 50% Fibo. restricts the quote’s immediate upside near 0.7140 whereas a three-week-long resistance line near 0.7210 will test the pair buyers past 0.7185.
On the flip side, pullback moves may initially aim for the 0.7100 threshold before highlighting the weekly support line surrounding 0.7075.
Also defending AUD/USD bulls is the previous resistance line from late January, around 0.7055 at the latest.
AUD/USD: Four-hour chart
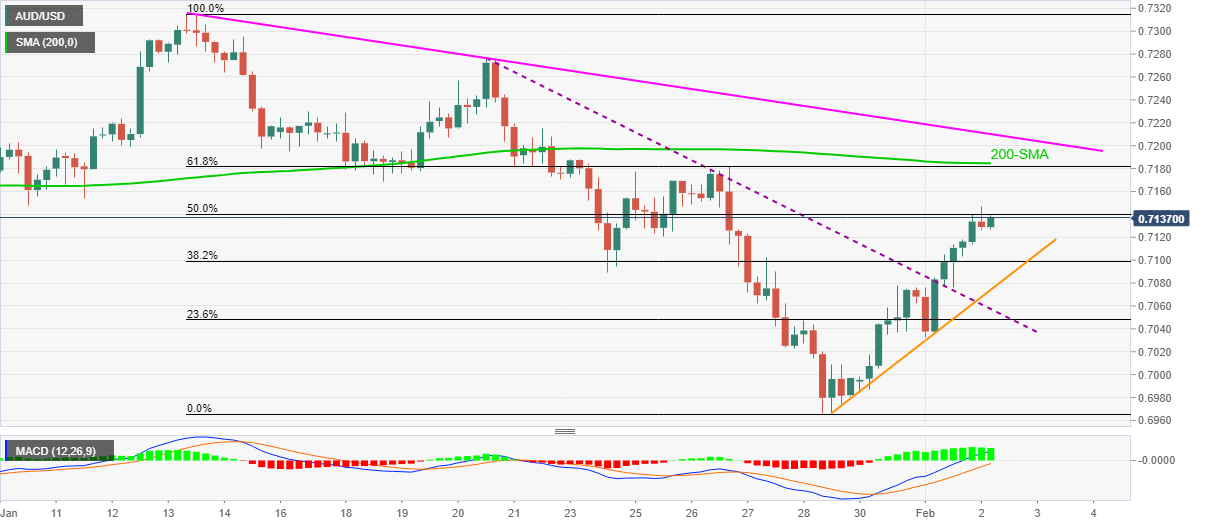
Trend: Further upside expected
Citigroup's Chief India Economist Samiran Chakraborty said in a client note that the Indian rupee remains exposed to downside risks amid easing likelihood of Indian sovereign bonds’ inclusion on global indices this year.
Key quotes
“We had expected $30 billion inflows on the back of global bond index inclusion in our baseline balance of payment estimate of $49 billion for FY23.”
“With lesser likelihood of bond index inclusion happening this year, BoP surplus could be substantially lower and can in fact turn into deficit if oil prices stay at a current level rather than our base case of averaging $65/bbl.”
“The economy may struggle to find enough offsetting foreign inflows in view of higher-than-expected energy prices and expectations of a pickup in non-energy imports, especially with global financial conditions expected to tighten.”
“If the Reserve Bank of India maintains its volatility-dampener role during times of the rupee’s weakness, the local unit will likely see an orderly depreciation in the next financial year, without assuming a sharp dollar decline and fall in oil prices.”
-
USD/INR Price News: Indian rupee recaptures 100-DMA amid Feb RBI rate hike bets
- Gold drops for the first time in three days, fades rebound from seven-week low.
- Sellers remain hesitant as market sentiment dwindles ahead of key data/events.
- Mixed Fedspeak, downbeat yields and geopolitical fears keep buyers on guard.
- Gold Price Forecast: XAU/USD’s path of least resistance appears down, US jobs data eyed
Gold (XAU/USD) snaps two-day uptrend while printing mild losses around $1,797 during the early Wednesday morning in Europe. In doing so, the yellow metal consolidates weekly gains while fading the bounce from the lowest levels since late November.
Market’s indecision ahead of crucial catalysts joins mixed signals from central bankers and risk events to underpin the metal’s latest weakness. Also challenging the gold buyers is the 20th expansion of the US ISM Manufacturing PMI, to 57.6 versus 57.5 expected.
That said, Atlanta Fed President Raphael Bostic said on Tuesday that there is a "real danger" of inflation expectations drifting from the Fed's 2.0% target to 4% or higher. On the other hand, St Louis Fed President James Bullard said that he thinks it is an open question whether the Fed will have to become more restrictive (i.e. raise rates above the "neutral" 2.0%-2.5% zone).
On a different page, Elsewhere, the US Senate’s procedural voting on the China Competition Bill and chatters over Russia-Ukraine, as well as mixed concerns for global inflation, challenge market’s mood and weigh on gold prices.
Amid these plays, the US 10-year Treasury yields fade the previous day’s rebound from a weekly low near 1.80% while upbeat prints of the Wall Street benchmarks seem to help the S&P 500 Futures to remain firm around 4,555 at the latest.
Looking forward, the early signal to Friday’s US Nonfarm Payrolls (NFP), namely the US ADP Employment Change for January, expected 207K versus 807K prior, will be important for immediate direction. However, major attention will be given to Thursday’s ECB and Friday’s US jobs report, not to forget the Fedspeak.
Technical analysis
Although bearish MACD signals favor the 200-DMA’s rejection to gold buyers, 100-DMA and 50% Fibonacci retracement (Fibo.) of August-November upside, respectively near $1,795 and $1,782, challenge the commodity’s further weakness.
Given the market’s cautious mood ahead of the crucial data/events, coupled with the metal’s failures to conquer the key DMAs, gold prices are likely to remain sidelined unless breaking $1,782.
However, a clear downside break of $1,782 won’t hesitate to direct gold sellers towards the 61.8% Fibo. level near $1,760, which holds the key to gold bear’s dominance.
Alternatively, a daily closing beyond the 200-DMA level of $1,806 will direct gold buyers towards the 23.6% Fibonacci retracement level of $1,832.
It’s worth noting that gold’s upside past $1,832 will be questioned by January’s peak around $1,854, a break of which will escalate the run-up towards the late 2021 high of $1,877.
Gold: Daily chart
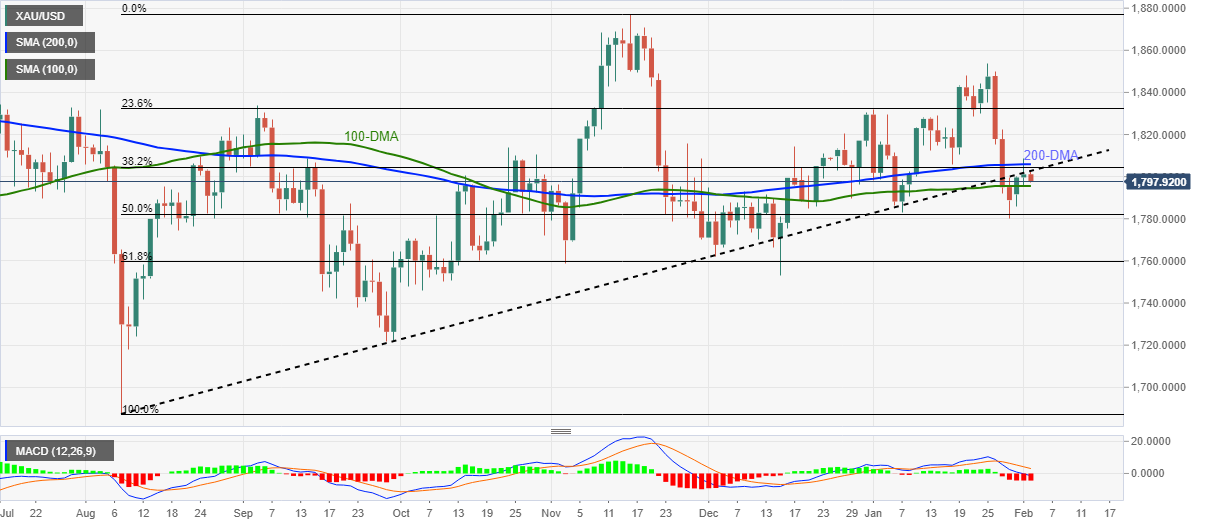
Trend: Sideways
- EUR/USD struggles during the fourth day of rebound from 20-month low.
- Eurozone Unemployment Rate dropped to record low, German Retail Sales, US ISM Manufacturing PMI improved.
- Markets struggle for clear direction ahead of ECB, US NFP amid mixed Fedspeak, risk catalyst.
- Eurozone CPI, US ADP Employment Change bear downbeat forecasts for January but bulls eye positive surprises.
EUR/USD grinds higher around the weekly top near 1.1280, extending the bounce from a multi-day low heading into Wednesday’s European session.
The major currency pair’s latest gains could be linked to the market’s lack of conviction over the Fed’s hawkish stance, backed by mixed data and unclear Fedspeak. Adding to the upside momentum are the hawkish hopes from the European Central Bank (ECB) amid recently firmer Eurozone data.
That said, the bloc’s Unemployment Rate refreshed an all-time low with a 7.0% figure for December the previous day. On the same line was Germany’s upbeat Retail Sales, up from -0.6% forecast to 0.0% YoY during the stated month.
Talking about the US data, ISM Services PMI for January rose to 57.6 versus 57.5 expected, marking the 20th straight expansion of the manufacturing activity.
It’s worth noting that Atlanta Fed President Raphael Bostic said on Tuesday that there is a "real danger" of inflation expectations drifting from the Fed's 2.0% target to 4% or higher. On the other hand, St Louis Fed President James Bullard said that he thinks it is an open question whether the Fed will have to become more restrictive (i.e. raise rates above the "neutral" 2.0%-2.5% zone).
Elsewhere, the US Senate’s procedural voting on the China Competition Bill and chatters over Russia-Ukraine, as well as mixed concerns for global inflation, challenge markets ahead of the key weekly events.
Against this backdrop, the US 10-year Treasury yields fade the previous day’s rebound from a weekly low near 1.80% while upbeat prints of the Wall Street benchmarks seem to help the S&P 500 Futures to remain firm around 4,555 at the latest.
Looking forward, preliminary readings of the January Eurozone Consumer Price Index (CPI), expected 4.4% versus 5.0% prior, will be crucial for the ECB haws to keep backing Quantitative Tapering (QT). On the other hand, the early signal to Friday’s US Nonfarm Payrolls (NFP), namely the US ADP Employment Change for January, expected 207K versus 807K prior, will also be important to determine short-term USD/CAD moves ahead of Thursday’s ECB and Friday’s US jobs report.
Technical analysis
EUR/USD bulls cheer upside break of a three-week-old descending resistance line, now support around 1.1205, amid firmer MACD and RSI as they flirt with the 38.2% Fibonacci retracement (Fibo.) level of January 14-28 downside.
That said, the bulls currently aim for 50% Fibo. around 1.1300 as an immediate target during the further advances. However, a confluence of the 100-SMA and 200-SMA around 1.1315-20 will be a tough nut to crack for the pair bulls afterward.
Meanwhile, pullback moves remain elusive until staying beyond the resistance-turned-support and 23.6% Fibonacci retracement level near 1.1200.
- USD/IDR retreats from intraday high but stays firmer on D1 for the first time in three days.
- Indonesia's Inflation rose past market consensus and prior to 2.18% in January.
- Indonesia removes ban on coal exports, sets date for Bali tourism reopening.
- US ADP Employment Change, risk catalysts will be important for fresh impulse.
USD/IDR struggles to extend early Asian session gains around $14,340 after strong Indonesia inflation figures.
With this, the Indonesia rupiah (IDR) bulls can bargain with the sellers as the pair rejects the previous two-day downtrend.
That said, Indonesia Inflation rose past 2.15% market consensus and 1.87% prior to 2.18% YoY during January. Further, Core Inflation also improved to 1.84% versus 1.71% expected and 1.56% previous readouts.
Other than the upbeat Indonesia data, easing coal emergency in the world’s top exporters of thermal coal joins reopening of the island of Bali for foreign tourists from February 04 to keep USD/IDR bears hopeful.
Additionally, downbeat US Treasury yields and the US Dollar Index (DXY) also favor USD/IDR sellers ahead of the key the US ADP Employment Change for January, expected 207K versus 807K prior.
Technical analysis
Although a three-week-old resistance line near $14,420 restricts USD/IDR buyers, the 200-day EMA defends the upside momentum, around $14,327 by the press time.
“Japan's economy expanding moderately thanks in part to BOJ’s aggressive monetary easing,” Bank of Japan (BOJ) Governor Haruhiko Kuroda said in a statement on Wednesday.
He said, “it's true Japan’s low-interest-rate environment has had an impact on regional banks through various channels.”
Kuroda said that he cannot accept view BOJ’s easy policy has led to regional banks' deteriorating health.
Meanwhile, Japanese PM Fumio Kishida was reported as saying that “consolidation is among options for regional banks to prop up their business health, but any decision must lead to the revitalization of regional economies.”
Read: USD/JPY Price Analysis: Bounces off 21-day EMA towards 115.00
- USD/JPY stays firmer around intraday top, snaps two-day downtrend to recovery from weekly low.
- Steady RSI, oversold Momentum line back further recovery.
- 10-week-old horizontal area becomes a key hurdle, 100-day EMA adds to the downside filters.
USD/JPY consolidates weekly losses around 114.80 amid the late Asian session on Wednesday.
The yen pair bounces off 21-day EMA as sellers ran out of steam around weekly low, as per the Momentum line.
The rebound takes clues from steady RSI to suggest further advances towards the 115.00 threshold.
However, a horizontal area comprising multiple levels marked since November 24, near 115.50-60, becomes a tough nut to crack for USD/JPY bulls, a break of which will enable them to aim for the yearly high around 116.35.
Alternatively, pullback moves will need to provide a daily closing below the 21-day EMA level of 114.65 to convince sellers.
Even so, the previous resistance line from January 04 and the 100-day EMA, respectively around 114.15 and 113.50, will challenge the USD/JPY bears afterward.
USD/JPY: Daily chart
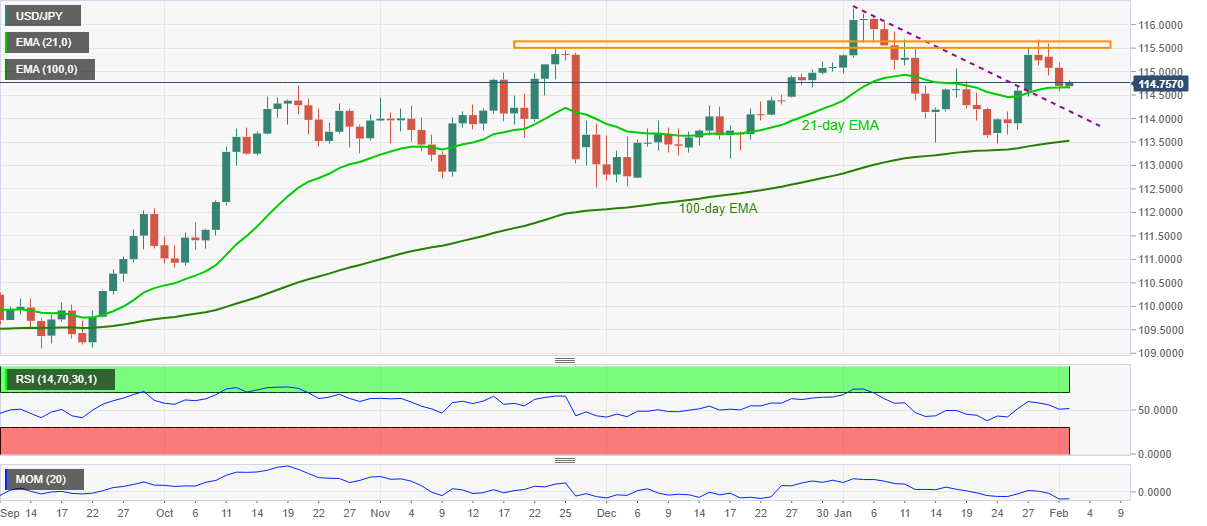
Trend: Further recovery expected
- USD/CAD snaps two-day downtrend to bounce off weekly low.
- Oil prices remain lackluster amid absence of major catalysts, cautious mood ahead of OPEC+ verdict.
- Canada GDP improved in November, US ISM Manufacturing PMI prints 20th expansion in January.
- BOC’s Gravelle, Canadian Building Permits add to the watcher's list ahead of key jobs report.
USD/CAD pauses two-day downtrend around the weekly bottom below 1.2700 amid early European morning on Wednesday. In doing so, the Loonie pair tracks sluggish oil prices and indecisive markets to consolidate recent losses while heading into the key data/events.
WTI crude oil, Canada’s main export item, drops 0.20% intraday to $87.50 while portraying the indecision after Friday’s jump to an eight-year high. In doing so, the energy traders struggle amid mixed concerns over Russia-Ukraine tussles, the recent chatters over the China Competition Bill and pre-OPEC+ caution.
Elsewhere, Fed policymakers’ refrain from openly supporting a rate hike in March joins firmer US and Canadian data to trouble USD/CAD traders.
On Tuesday, Canada’s GDP for November rose past 0.3% market consensus to 0.6% YoY while the Markit Manufacturing PMI for January eased to 56.2 versus 56.9 expectations.
On the other hand, US ISM Services PMI for January rose to 57.6 versus 57.5 expected, marking the 20th straight expansion of the manufacturing activity. That said, Atlanta Fed President Raphael Bostic said on Tuesday that there is a "real danger" of inflation expectations drifting from the Fed's 2.0% target to 4% or higher. On the other hand, St Louis Fed President James Bullard said that he thinks it is an open question whether the Fed will have to become more restrictive (i.e. raise rates above the "neutral" 2.0%-2.5% zone).
Amid these plays, the US 10-year Treasury yields fade the previous day’s rebound from a weekly low near 1.80% while upbeat prints of the Wall Street benchmarks seem to help the S&P 500 Futures to remain firm around 4,555 at the latest.
Moving on, statements from the Bank of Canada (BOC) Deputy Governor Toni Gravelle and Governor Tiff Macklem will be crucial as markets brace for the BOC rate hike after the latest disappointment. It’s worth noting that BOC’s Macklem recently conveyed dislike for inflation.
Additionally, the early signal to Friday’s US Nonfarm Payrolls (NFP), namely the US ADP Employment Change for January, expected 207K versus 807K prior, will also be important to determine short-term USD/CAD moves ahead of Friday’s employment data from the US and Canada.
Technical analysis
A two-week-old support line restricts immediate USD/CAD downside around 1.2690 ahead of the 100-DMA level of 1.2625. Bullish bias, however, needs validation from a descending resistance line from December 23, near 1.2790. That said, firmer RSI and bullish MACD signals join the pair’s refrain to break immediate key supports to keep buyers hopeful.
- USD/INR reverses a part of the previous rebound amid DXY weakness.
- Indian rupee gains on hopes of a February rate hike by the RBI.
- USD/INR breaches 100-DMA but bullish RSI could keep downside capped.
USD/INR has returned to the red zone after kicking off February on a positive note, as sellers continue to lurk just below the $75 mark.
The pullback in the spot could be associated with the ongoing corrective decline in the US dollar across its main peers, as the Fed angst subsides ahead of the key employment data.
Moreover, markets expect the Reserve Bank of India (RBI) to start the tightening cycle from this month, offering some support to the Indian rupee bulls.
Analysts at Morgan Stanley expect RBI to start normalization with reverse repo hike in February, followed by repo rate hikes from April.
This comes as they see “India’s budget math largely reasonable with potential upside for tax revenue estimates.“
On the contrary, Oxford Economics noted that India’s uneven recovery requires more targeted support in short term.
Markets now look forward to the US ADP jobs data and the oil-price action for fresh trading impetus on the pair.
USD/INR: Technical outlook
At the time of writing, the spot is pressuring lows near 74.70, posting moderate losses on the day.
In doing so, the spot has breached the 100-Daily Moving Average (DMA) at 74.71, which was the previous resistance.
If the downtick gathers steam, then USD/INR could see a fresh drop towards the mildly bullish 21-DMA at 74.46.
Further south, the horizontal 200-DMA support at 74.27 will challenge the bullish commitments.
USD/INR: Daily chart
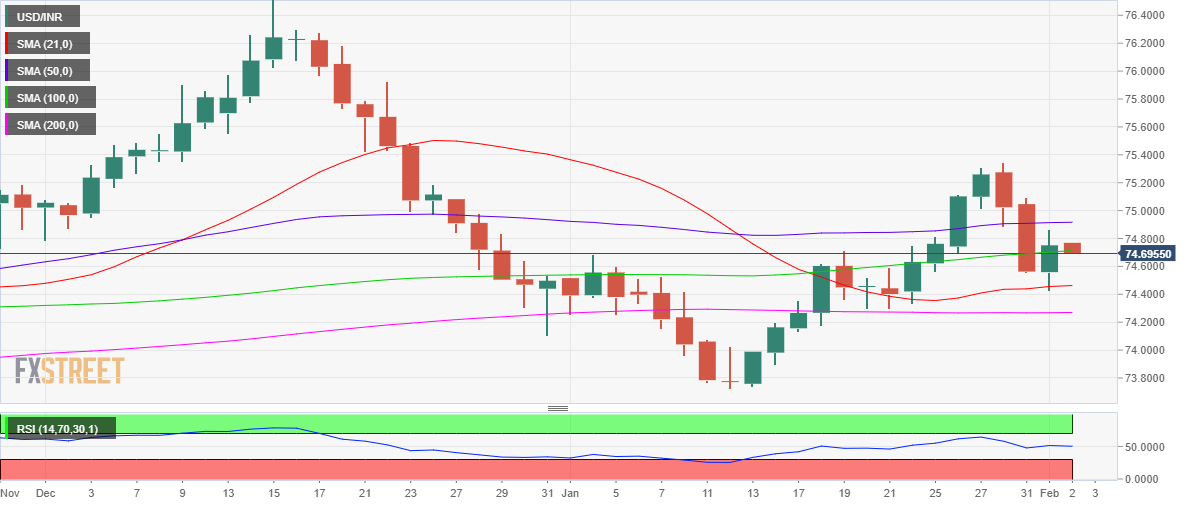
The 14-day Relative Strength Index (RSI), however, is sitting just above the midline, suggesting that the downside could be limited.
Should the buyers regain control Tuesday’s high of 74.86 will be retested, allowing for the further upside towards the 75 level. The ascending 50-DMA hangs around that price zone.
Recapturing the latter is critical to initiating a meaningful recovery towards the January highs of 75.34.
USD/INR: Additional levels
- GBP/JPY bears are lurking in a critical stage of the bull's correction.
- The daily 61.8% Fibonacci level is calling but a break of 154.45 will be critical to the downside.
GBP/JPY has been correcting the daily bearish impulse since the end of January's business. The daily correction has been uninterrupted, to date since January 24.
The price has rallied all the way into the 50% mean reversion area and has sights on the 61.8% target near 155.40 with little let-up in the pound's strength. The following illustrates the daily market structure and also where the price will need to break on a 4-hour time frame basis for bears to be in for a running.
GBP/JPY daily chart
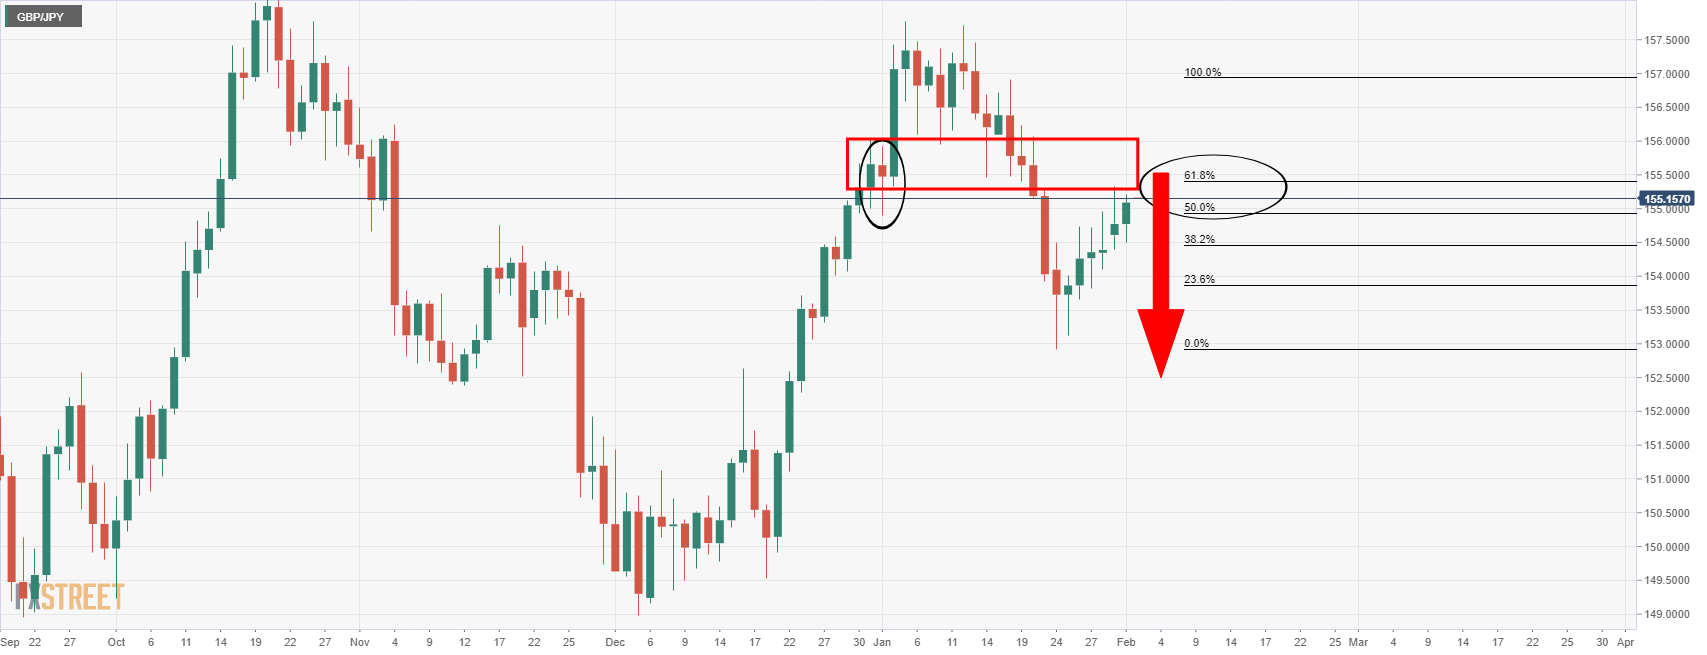
As illustrated, the old order block of January 3 is a compelling area on the chart that meets with the 61.8% and 50% ratios. This could equate to a firm area of resistance and if so, bears will start to monitor for bearish structure on the lower time frames as follows:
GBP/JPY H4 chart
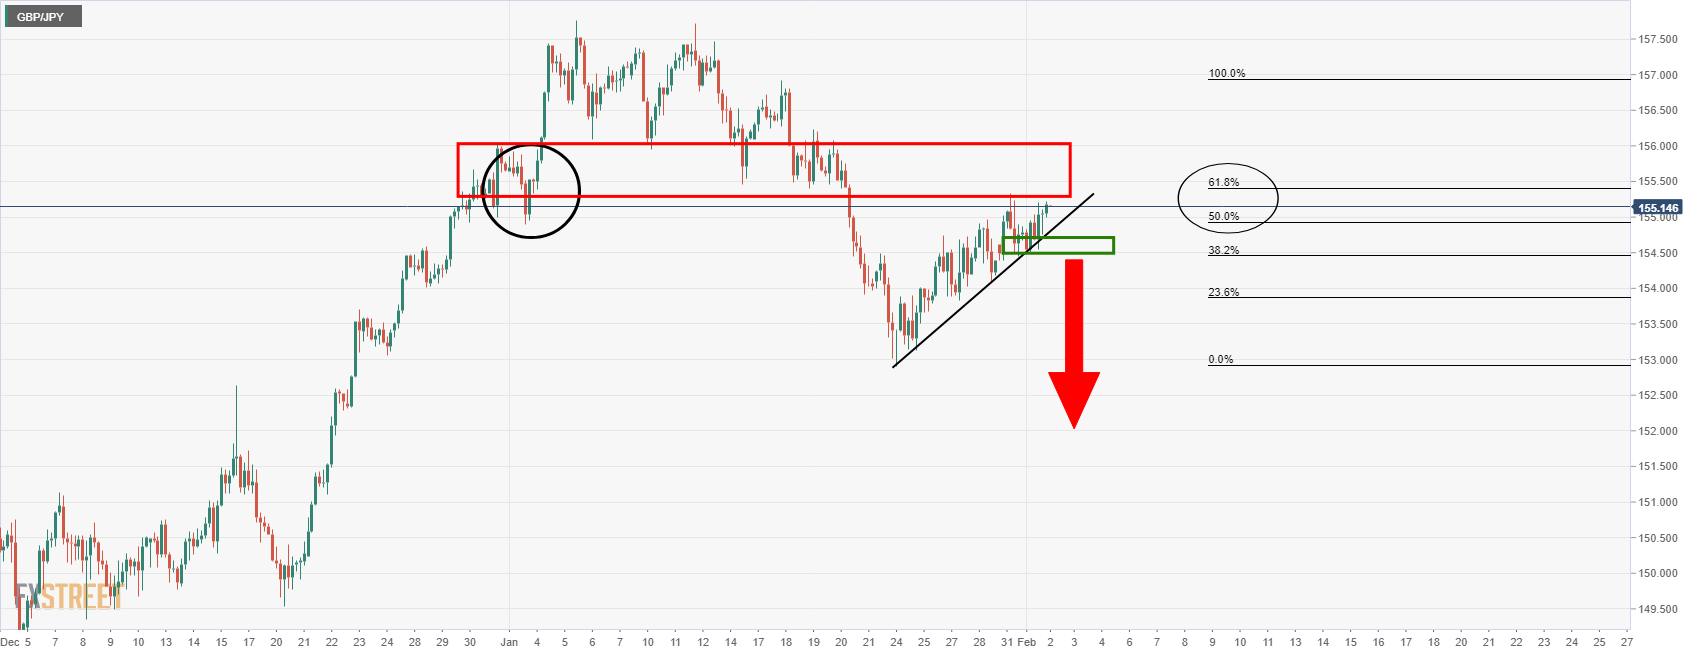
Should the price manage to break the current support block, then there will be expectations of a drive to the downside and below the dynamic and horizontal support as illustrated above. 154.45 is ket in this regard.
One-month risk reversal (RR) for the EUR/USD, a gauge of calls to puts, rises the most since November 26 as per the latest options market data on Reuters.
That said, the daily RR figures for February 01 jumped to +0.110 while extending the previous day’s rebound. The weekly figures also portray bullish bias with a +0.210 level after declining for the two consecutive weeks in the last.
It’s worth noting that the US inflation expectations, as measured by the 10-year breakeven inflation rate per the St. Louis Federal Reserve (FRED) data, retreat from a two-week top. The same joins mixed Fedspeak and firmer US data to challenge traders ahead of the early signal to Friday’s US Nonfarm Payrolls (NFP), namely the US ADP Employment Change for January, expected 207K versus 807K prior.
It’s worth noting that the EUR/USD prices print a four-day uptrend around the weekly top, up 0.06% near 1.1280 at the latest.
Read: EUR/USD Price Analysis: Bulls eye 1.1315-20 resistance confluence
According to the latest report published by the British Retail Consortium (BRC), the UK retailers hiked their prices to the highest levels in more than nine years in January as firms pass on soaring food, fuel and transportation costs amid spreading inflation.
Key takeaways
the strain on profit margins meant prices will almost certainly climb further in the coming months.
“Retailers are working hard to cut costs, but it would be impossible to protect consumers from any future rises.”
“As commodity prices, energy prices and transportation costs continue to rise, it is inevitable that retail prices will continue to follow in the future.”
“The BRC said prices rose 1.5% from a year earlier, almost double the pace registered in December. Food-price inflation climbed to 2.7%, but the biggest push came from non-food stores where prices rose 0.9% after falling 0.2% in the previous month,” per Bloomberg.
Market reaction
GBP/USD is sitting at weekly highs of 1.3530, awaiting the BOE decision for a fresh leg higher. The spot is trading almost unchanged on the day.
| Raw materials | Closed | Change, % |
|---|---|---|
| Brent | 89.3 | -0.41 |
| Silver | 22.638 | 0.72 |
| Gold | 1800.97 | 0.2 |
| Palladium | 2360.93 | 1.44 |
- US 10-year Treasury yields remain pressured amid lacklustre markets.
- Receding fears of Russia, mixed Fedspeak help equities amid DXY weakness.
- US ADP Employment Change will be eyed to forecast Friday’s NFP.
Risk appetite remains sluggish during early Wednesday as traders brace for the key weekly data/events.
While portraying the mood, the benchmark US 10-year Treasury bond coupons struggle around 1.79%, despite bouncing off a one-week low the previous day. However, the S&P 500 Futures rise 0.50% while tracking the Wall Street gains to keep buyers hopeful.
Read: S&P 500 rebounds into 4530s on dip-buying/short-covering, set to end choppy session on front foot
It’s worth noting that the softer US Dollar Index (DXY) helps WTI crude oil but not the gold prices ahead of the early signal to Friday’s US Nonfarm Payrolls (NFP), namely the US ADP Employment Change for January, expected 207K versus 807K prior.
Among the key challenges to the sentiment are mixed comments from the US Federal Reserve (Fed) officials and the recently firmer US data, as well as the US Senate’s procedural voting on China Competition Bill. On the contrary, receding fears of Russia’s immediate invasion of Ukraine join the market’s optimism to overcome the Omicron-linked supply crunch fears.
US ISM Services PMI for January rose to 57.6 versus 57.5 expected, marking the 20th straight expansion of the manufacturing activity. That said, Atlanta Fed President Raphael Bostic said on Tuesday that there is a "real danger" of inflation expectations drifting from the Fed's 2.0% target to 4% or higher. On the other hand, St Louis Fed President James Bullard said that he thinks it is an open question whether the Fed will have to become more restrictive (i.e. raise rates above the "neutral" 2.0%-2.5% zone).
Moving on, the preliminary reading of the Eurozone Consumer Price Index (CPI) for January, expected 4.4% YoY versus 5.5% prior, will also be important to watch ahead of Thursday’s European Central Bank (ECB) meeting, not to forget US ADP data.
Above all, Fedspeak and Russia-Ukraine headlines will be crucial for near-term market direction as traders brace for the March rate hike.
Read: It's the end of the month and the Fed continues to confuse
Reserve Bank of Australia (RBA) Governor Phillip Lowe sounds dovish once again while addressing the Q & A session following his earlier speech.
Key quotes
Not surprising that faster progress on economy would bring forward timing of rate hike.
Coming federal election is not a consideration for policy.
Rise in inflation does not require an immediate response.
Paying attention to broader measure of labour costs than just wage price index.
Not hanging on every wage price number.
Remains to be seen if rates will rise this year.
Clearly scenarios where we would be hiking later this year.
Still plausible that first rate rise is a year or longer away.
Surprised market pricing in same number of rate hikes as in the US.
Still struggle with market pricing for Australian rates.
Risk of inflation getting out of hand is very low.
Can respond if inflation rising too fast.
Solution to high housing prices in not to put up interest rates.
Unlikely will have to tighten aggressively to control inflation.
High debt means household sector will be responsive to higher rates.
Have unique opportunity to unemployment down without inflation getting too high.
Market reaction
AUD/USD is consolidating its gains below 0.7150 after dovish comments from RBA Governor Lowe halted the flight in the aussie. The spot is currently trading at 0.7137, still up 0.17% on the day.
- NZD/USD bulls stay in control and target higher levels still.
- The daily and weekly M-formations are compelling and have a confluence of Fibos that align with structure.
As per the prior session's analysis for NZD/USD, NZD/USD Price Analysis: Traders await RBA volatility to decipher the code in the market structure, the bird took flight as expected and has moved in towards a critical area on the longer-term charts as follows:
NZD/USD prior analysis
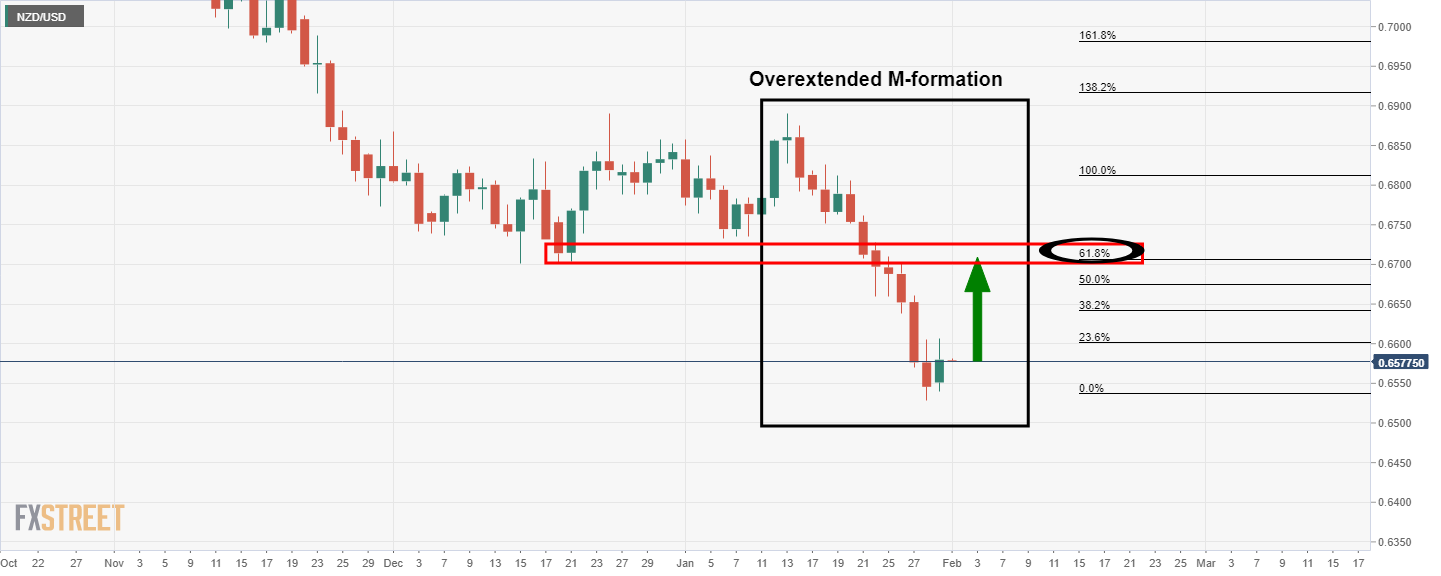
It was explained that the M-formation is overextended, but it is a reversion pattern nevertheless and the price would be expected to correct towards the 61.8% Fibonacci retracement level over the course of the coming days.
NZD/USD live market
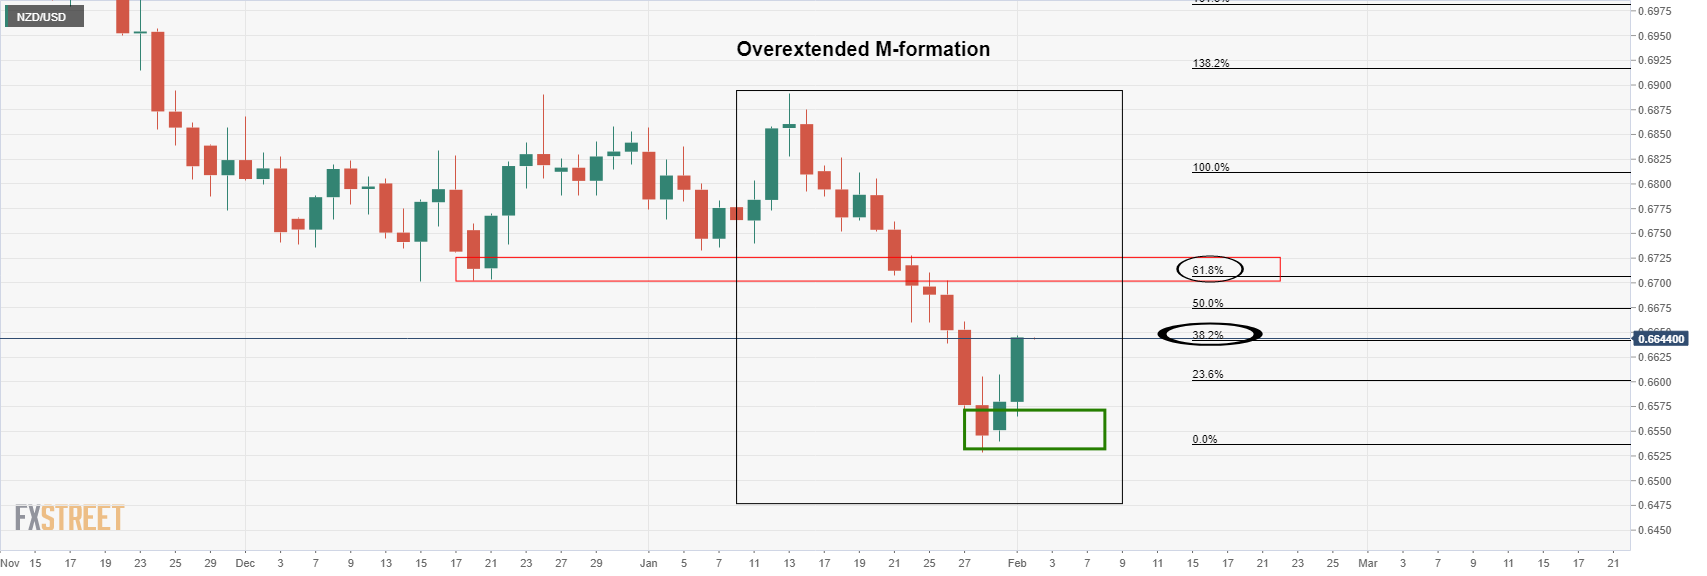
The price has rallied into the 38.2% Fibonacci retracement level o the way to the presumed target area near the 61.8% ratio. The weekly chart offers additional confluence as follows:
NZD/USD weekly chart
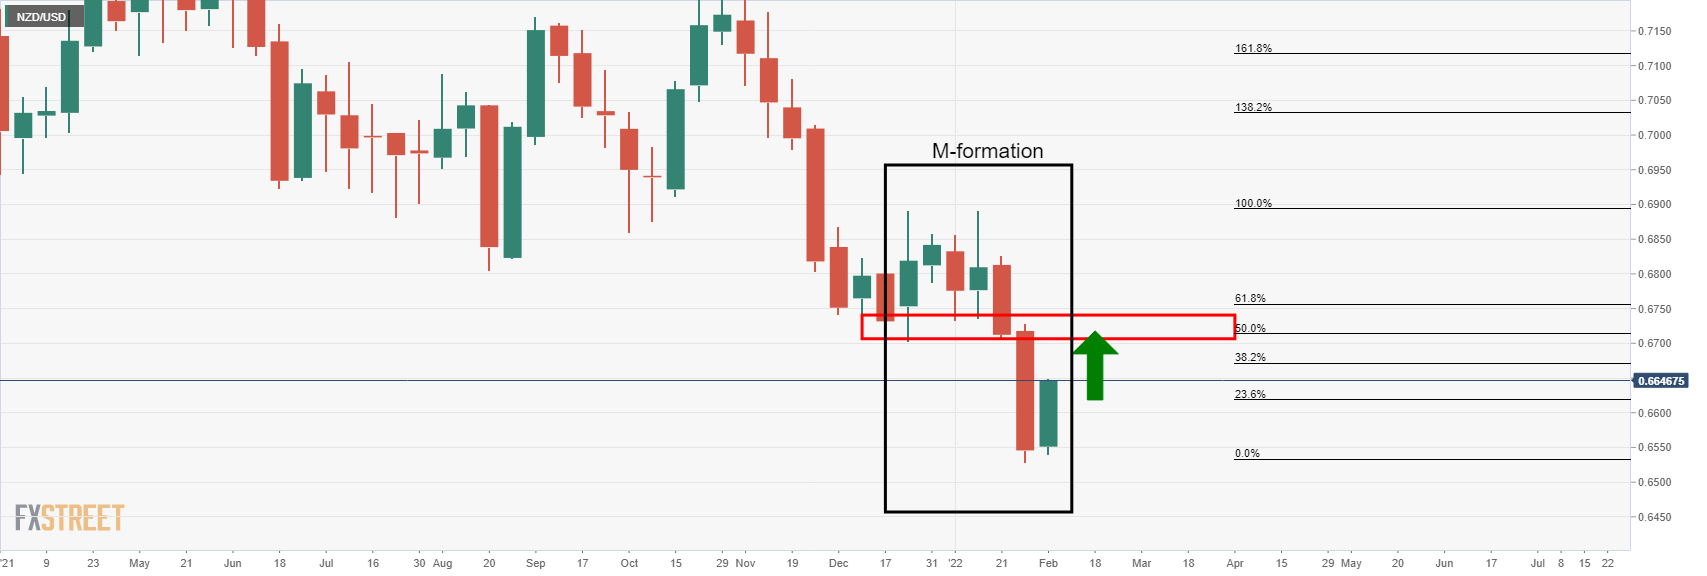
A 50% mean reversion of the weekly bearish leg of its own M-formation aligns with the daily target in the low 0.67 area.
The US. House of Representatives has likely scheduled a procedural vote on Wednesday to pass a bill aimed at increasing US competitiveness with China and supporting the American chip industry, Reuters reports, citing a source familiar with the decision.
The source added: “If the procedural vote succeeds in the narrowly Democratic-controlled House, the full chamber would aim to vote on the full bill on Friday.”
This comes after the Senate passed the US Innovation and Competition Act last year, which includes $52 billion to increase US semiconductor production and authorizes $190 billion to strengthen US technology and research to compete with China.
Market reaction
The US dollar index is extending its correction from multi-month peaks into the third straight day on Wednesday, unfazed by the above headlines.
The index was last seen trading at 96.24, down 0.15% on the day.
- DXY remains on the back foot around intraday low, down for the fourth consecutive day.
- Clear downside break of 13-day-old support line keeps sellers hopeful.
- Bulls need to cross 10-week-long horizontal area to regain the controls.
US Dollar Index (DXY) holds lower ground near 96.25, prints a four-day downtrend during early Wednesday.
In doing so, the greenback gauge justifies the previous day’s downside break of a short-term support line, as well as steady RSI.
As a result, the US Dollar Index signals further downside towards the 50-SMA level of 96.08. However, the quote’s further weakness will be challenged by the 96.00 threshold.
Should the DXY bears manage to conquer the 96.00 round figure, multiple lows marked since November 18 will challenge additional downside around 95.60-50.
Meanwhile, the support-turned-resistance line from January 14 will challenge the pair’s immediate recovery moves near 96.75.
Following that, a horizontal area from November 24 and January 28 low, respectively around 96.95 and 97.05, will be crucial to watch for the US Dollar Index bulls.
DXY: Daily chart
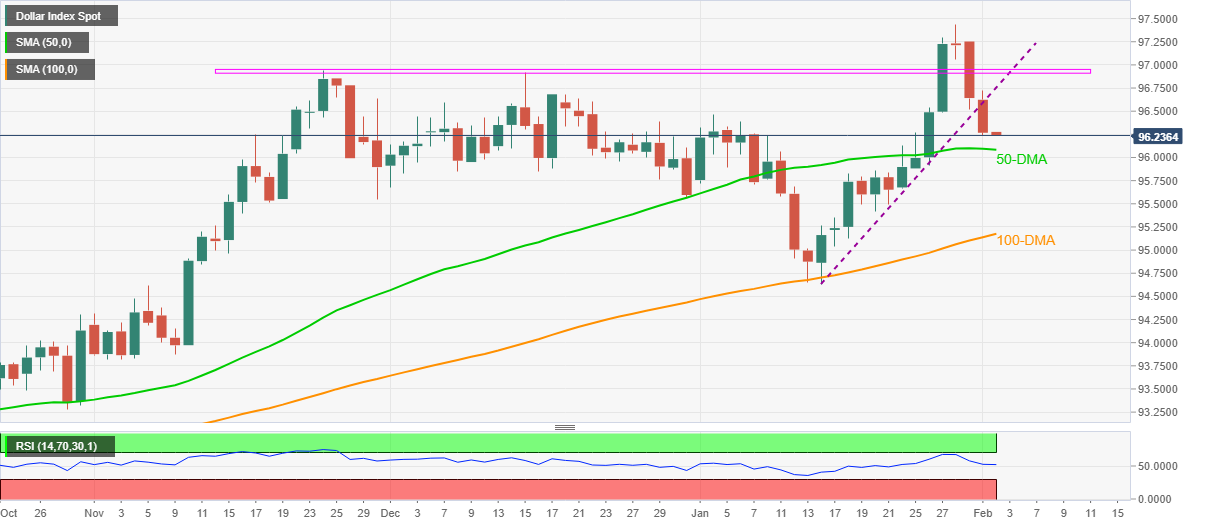
Trend: Further weakness expected
- AUD/USD struggles to extend three-day uptrend, stays sidelined around weekly top.
- Governor Lowe repeats RBA statement saying, “End of bond purchase program does not mean a cash rate rise is imminent.”
- Market sentiment dwindles ahead of key weekly data/events, mixed Fedspeak add to sluggish moves.
- US ADP Employment Change for January will be important for nearby directions.
AUD/USD bulls take a breather around the weekly top, easing to 0.7135, on RBA Governor Philip Lowe’s cautious optimism during early Wednesday. Even so, the risk barometer stays firmer for the third consecutive day up 0.12% intraday at the latest.
In addition to reiterating the RBA statement, Governor Lowe also states, “Too early to conclude inflation is sustainably within target range.” However, the bulls remain hopeful as the policymaker mentions, “Worst of disruptive economic effects from omicron now behind us.”
Read: Reserve Bank of Australia Governor Philip Lowe: End of QE doesn't mean cash-rate rise imminent
On Tuesday, the Reserve Bank of Australia (RBA) formally announced an end to the Quantitative Easing (QE) and conveyed hopes of further recovery in inflation and GDP. Though, the Aussie central bank’s rejection of the immediate rate hike concerns and comments like, “Inflation has picked up, it is too early to conclude that it is sustainably within the target band,” initially weighed on the AUD/USD.
However, softer US Dollar Index (DXY) and upbeat performance of equities and gold seemed to have underpinned the AUD/USD pair’s recovery moves towards refreshing the weekly top.
Risk appetite improved the previous day despite mixed comments from the US Federal Reserve (Fed) officials and the recently firmer US data, not to forget indecision over the Russia-Ukraine issues. While portraying the same, the US 10-year Treasury yields snapped a two-day downtrend to regain 1.80%, recently sluggish around the same level. Though, the Wall Street benchmarks printed gains and help the S&P 500 Futures to remain firm around 4,555 at the latest.
That said, The US ISM Services PMI for January rose to 57.6 versus 57.5 expected, marking the 20th straight expansion of the manufacturing activity, which in turn allowed the Fed to keep its hawkish bias. However, recent Fedspeak has been confusing and tests the US dollar bulls ahead of the key US jobs report for January, up for publishing on Friday.
To mention Fedspeak, Atlanta Fed President Raphael Bostic said on Tuesday that there is a "real danger" of inflation expectations drifting from the Fed's 2.0% target to 4% or higher. On the other hand, St Louis Fed President James Bullard said that he thinks it is an open question whether the Fed will have to become more restrictive (i.e. raise rates above the "neutral" 2.0%-2.5% zone).
Having witnessed initial reaction to comments from RBA Governor Lowe, AUD/USD traders will pay attention to the risk catalysts for fresh impulse. Also important will be the US ADP Employment Change for January, expected 207K versus 807K prior.
Technical analysis
AUD/USD bulls cheer a clear upside break of a fortnight-old resistance line, now support around 0.7060, as well as crossing a three-week-old descending trend line near 0.7115, to aim for the 50-DMA resistance of 0.7165.
The pair’s further upside, however, needs validation from 200-SMA on a four-hour (4H) chart, near 0.7185, to challenge the 100-DMA key hurdle surrounding 0.7255.
Reserve Bank of Australia governor Philip Lowe's speech on the economic outlook today to National Press Club is underway and can be followed and listened to live at this link.
Lowe is speaking following yesterdays RBA interest rate decision and before the bank will release a full set of economic forecasts on Friday.
Key comments, so far
Jobs growth strong, Unemployment Low.
Weathered economic storm better than expected.
Pandemic is not yet behind us.
US inflation pick up adds uncertainty to the outlook.
Optimistic about the country's prospects.
End of QE doesn't mean cash-rate rise is imminent.
Prepared to be patient.
Says achievement of our inflation, unemployment goals within sight.
Too early to conclude inflation is sustainably within target range.
"Over the course of this year" will be watching price pressures, consumption, wages.
Says board committed to full employment, prepared to be patient.
Don’t need to move in lock step with other central banks.
See significant uncertainties as to the persistence of recent price pressures.
Lowe says don’t want to see inflation too low or too high.
Lowe says will do what is necessary to maintain low and stable inflation.
Central forecast sees underlying inflation around 2.75% over this year and next.
Wage price index to rise 2.75% this year. 3% over 2023.
Sees unemployment falling to around 3.75% by end of year, staying there in 2023.
Business liaison suggests demand for labour remains strong.
Worst of disruptive economic effects from omicron now behind us.
Still expect GDP to grow in march quarter, although only modestly.
AUD/USD's reaction
So far the currency is stable at around 0.7139.
RBA meeting, dovish but AUD rallies
Australia's central bank kept its cash rate at a record low of 0.1% on Tuesday and ended its A$275 billion ($194.40 billion) bond-buying campaign as expected, but pushed back hard on market wagers for an early rate rise.
The RBA emphasised that ceasing bond purchases did "not imply" a near-term increase in interest rates and the Board was still prepared to be patient.
"As the Board has stated previously, it will not increase the cash rate until actual inflation is sustainably within the 2 to 3% target range," RBA Governor Philip Lowe said in a brief statement.
"While inflation has picked up, it is too early to conclude that it is sustainably within the target band."
The Omicron outbreak has affected the economy, but it has not derailed the economic recovery," Lowe concluded.
The dovish message sent the Aussie lower on the knee-jerk to 0.7033 though markets still think the RBA is behind the curve on inflation.
The Aussie has subsequently rallied into a critical resistance area on the charts as follows:
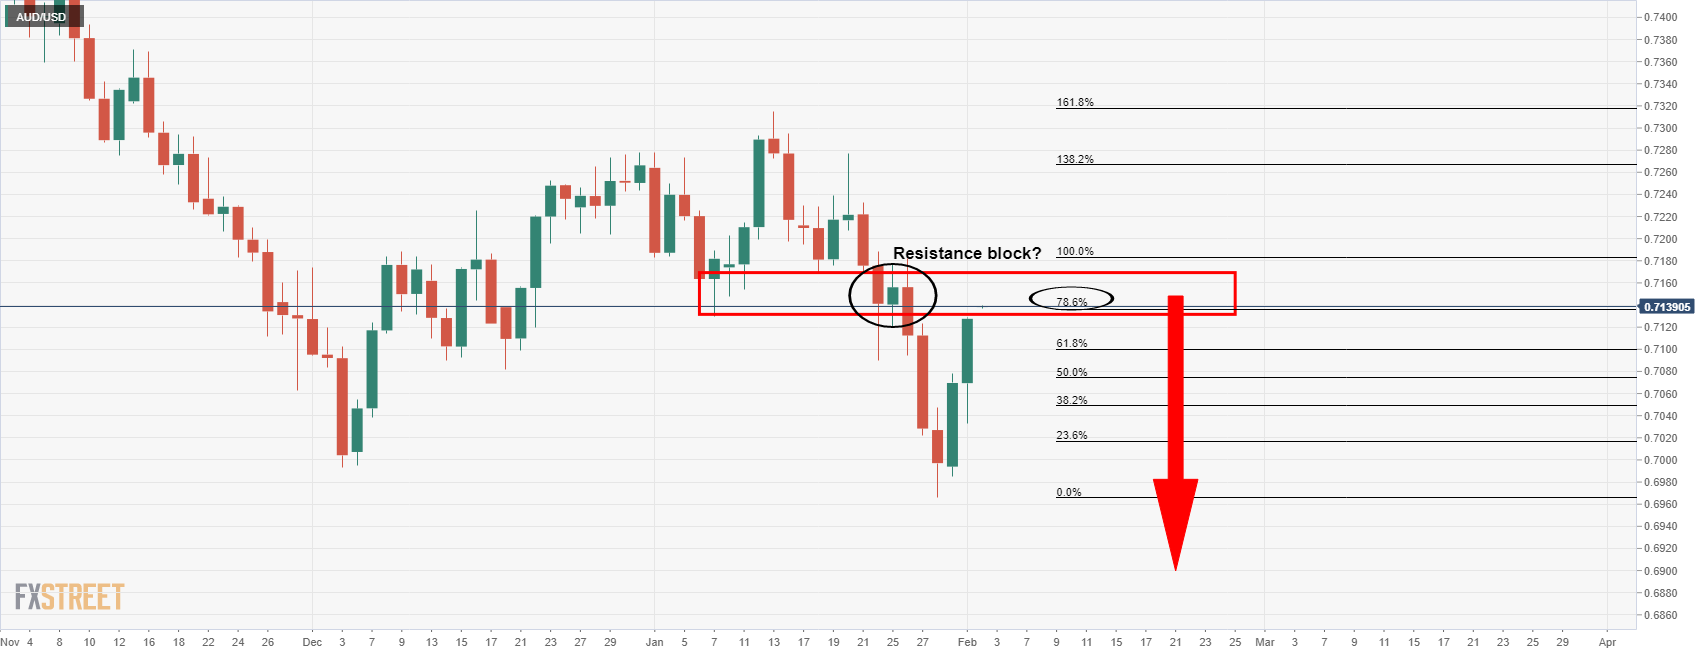
-
AUD/USD Price Analysis: Bears are waiting to pounce from key higher time frame resistance structures
| Time | Country | Event | Period | Previous value | Forecast |
|---|---|---|---|---|---|
| 01:30 (GMT) | Australia | RBA's Governor Philip Lowe Speaks | |||
| 10:00 (GMT) | Eurozone | Harmonized CPI ex EFAT, Y/Y | January | 2.6% | 1.9% |
| 10:00 (GMT) | Eurozone | Harmonized CPI, Y/Y | January | 5% | 4.4% |
| 10:00 (GMT) | Eurozone | Harmonized CPI | January | 0.4% | |
| 13:15 (GMT) | U.S. | ADP Employment Report | January | 807 | 250 |
| 13:30 (GMT) | Canada | Building Permits (MoM) | December | 6.8% | -1.5% |
| 15:30 (GMT) | U.S. | Crude Oil Inventories | January | 2.377 | 1.525 |
| 21:30 (GMT) | Australia | AiG Performance of Construction Index | December | 57 |
- USD/TRY keeps the latest rebound from multi-day low during sluggish Asian session.
- CBRT to ensure maximum interest rate on converted lira deposits, Turkish Manufacturing PMI eased in January.
- US ISM Manufacturing PMI came in strong but mixed Fed weighed on the USD.
- US ADP Employment Change, risk catalysts will be the key for near-term directions.
USD/TRY picks up bids to refresh intraday high around $13.45 during Wednesday’s Asian session.
In doing so, the Turkish lira (TRY) pair holds onto the previous day’s bounce off the lower point in three weeks.
The USD/TRY bounce on Tuesday could be linked to the downbeat prints of Turkish Markit Manufacturing PMI for January, to 50.5 versus 52.1 a month earlier. "The new year began very much as the old one ended, with Turkish manufacturers continuing to face the challenges of operating in an inflationary environment," said Andrew Harker, economics director at IHS Markit,” per Reuters following the data.
It’s worth noting that the USD/TRY bulls were previously challenged by the nation’s Official Gazette highlighting the Central Bank of Turkey’s (CBRT) readiness to offer maximum benefits to lira deposits. “Turkish central bank will determine the maximum interest rate on foreign currency and gold deposit accounts converted to lira in a scheme that protects local currency savings against exchange rate volatility,” said the official statement per Reuters.
On the other hand, The US ISM Services PMI for January rose to 57.6 versus 57.5 expected, marking the 20th straight expansion of the manufacturing activity. Even so, Fed policymakers sounded mixed on Tuesday. Atlanta Fed President Raphael Bostic said on Tuesday that there is a "real danger" of inflation expectations drifting from the Fed's 2.0% target to 4% or higher. On the other hand, St Louis Fed President James Bullard said that he thinks it is an open question whether the Fed will have to become more restrictive (i.e. raise rates above the "neutral" 2.0%-2.5% zone).
Amid these plays, the US Dollar Index (DXY) dropped for the second consecutive day even as the US Treasury yields recovered. That said, Wall Street printed mild gains and seems to help the S&P 500 Futures to remain firm around 4,555 at the latest.
Moving on, USD/TRY traders may pay attention to the risk catalysts amid a light calendar heading into the US ADP Employment Change for January, expected 207K versus 807K prior. The reading is well-known as a precursor to Friday’s US Nonfarm Payrolls (NFP) and hence could recall the pair buyers on positive surprise.
Technical analysis
Although multiple lows marked around $13.25 limit short-term USD/TRY downside, buyers will remain cautious until witnessing a clear break of the 21-DMA level of $13.55.
- Silver picks up bids to print three-day uptrend, reverses previous day’s pullback from the key SMA.
- Previous support line from December 2021, three-week-old resistance add to the upside filters.
- Weekly ascending trend line limits immediate downside, Momentum indicator favors bulls.
Silver (XAG/USD) holds onto the weekly rebound near $22.65, despite the previous day’s pullback from 200-SMA, during Wednesday’s Asian session.
It’s worth noting that the weekly support line joins firmer Momentum to keep buyers hopeful of clearly overcoming an upward sloping support-turned-resistance line from December 15, around $22.75.
Following that, the 200-SMA level near $23.00 will precede a three-week-long resistance line, near $23.15, to challenge XAG/USD bulls.
Should silver prices rise past $23.15, a five-week-old horizontal resistance area near $23.45 will be important to convince the bulls.
Alternatively, pullback moves remain elusive until staying beyond an upward sloping trend line from Friday, near $22.50 at the latest.
In a case where the silver bears manage to conquer the nearby support line, the recent swing low around $22.15 and January’s trough surrounding $21.95, will be crucial before targeting the December 2021 low of $21.42.
Silver: Four-hour chart
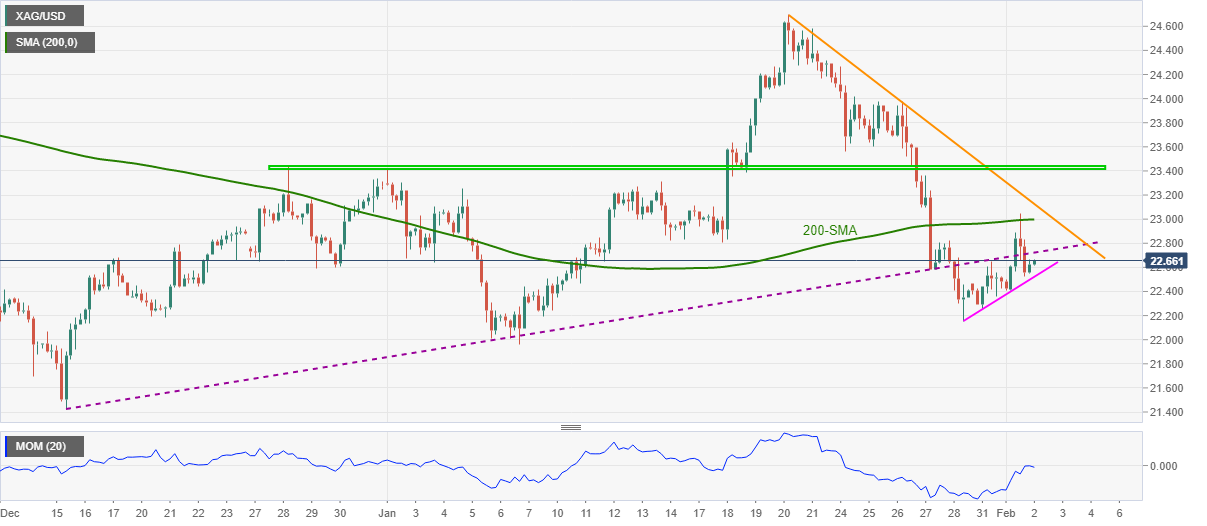
Trend: Further recovery expected
- AUD/USD bulls stay in charge mid-week taking on critical resistance
- AUD/USD bears are monitoring for a deceleration in the bull rally.
AUD/USD bulls have made an impressive advance on the week so far and the following illustrates the market structure and potential outcomes for days, week ahead. The price has rallied into the neckline of the weekly formation where the 50% mean reversion level aligns:
AUD/USD weekly chart
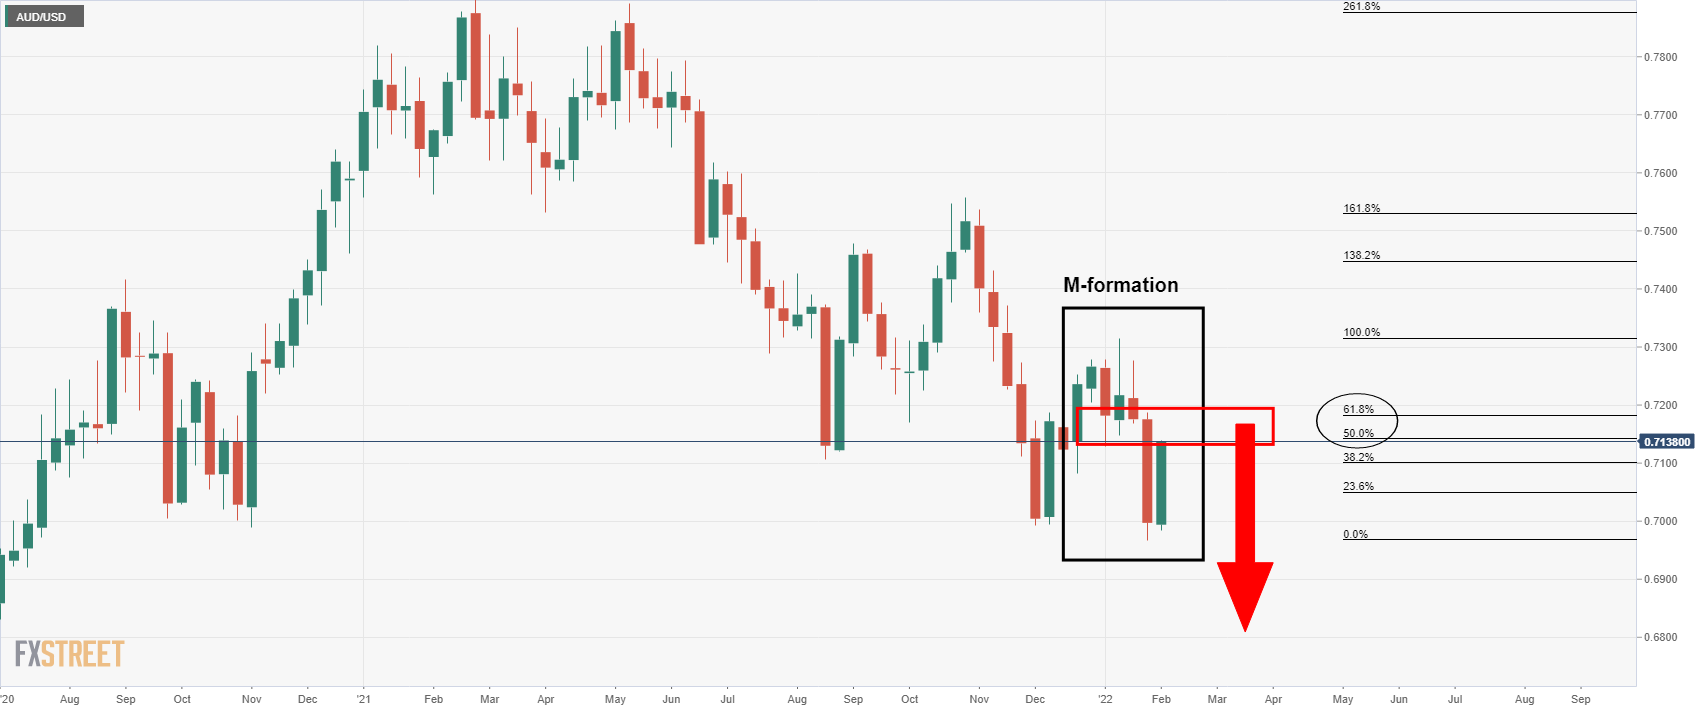
This could offer a firm resistance that would be expected to equate to a bearish structure on the lower time frames for the days ahead.
AUD/USD daily chart

The daily chart shows the price has moved into a potential resistance lock near the 78.6% Fibonacci. This Fibo is extreme and the price action has been very strong to the upside. This could mean that the bulls are intent on taking over control and we could see higher levels to come yet before they throw in the towel and take profits. Nevertheless, the bears will be monitoring for deceleration in the bull's aggressive advance.
- USD/JPY holds lower grounds near weekly low after three-day downtrend.
- US Treasury yields struggle to extend month-start rebound, stock futures track Wall Street gains.
- Japan Monetary Base data came in strong for January, Omicron woes trouble Tokyo.
- US ADP Employment Change for January will be eyed for NFP, risk catalysts are important too.
USD/JPY picks up bids to refresh intraday high around 114.80 as the market’s in Tokyo open for Wednesday. Even so, the risk barometer pair remains depressed around a one-week low after the three-day downtrend.
USD/JPY tracks gold price moves as bears struggle ahead of the key weekly events. In doing so, the quote fails to justify the previous day’s rebound of the US 10-year Treasury yields, recently sluggish around 1.80%.
Read: Gold Price Forecast: Bears wait in the flanks below counter-trendline daily resistance
Behind the moves could be a blend of mixed comments from the US Federal Reserve (Fed) officials and the recently firmer US data, not to forget indecision over the Russia-Ukraine issues.
The US ISM Services PMI for January rose to 57.6 versus 57.5 expected, marking the 20th straight expansion of the manufacturing activity, which in turn allowed the Fed to keep its hawkish bias. However, recent Fedspeak has been confusing and tests the US dollar bulls ahead of the key US jobs report for January, up for publishing on Friday.
Atlanta Fed President Raphael Bostic said on Tuesday that there is a "real danger" of inflation expectations drifting from the Fed's 2.0% target to 4% or higher. On the other hand, St Louis Fed President James Bullard said that he thinks it is an open question whether the Fed will have to become more restrictive (i.e. raise rates above the "neutral" 2.0%-2.5% zone).
Elsewhere, global diplomats escalate pressure on Russia to step back from a war with Ukraine amid increasing military presence at the border. However, the latest updates have been positive.
At home, policymakers worry about the negative impact of the South African covid variant after witnessing Tokyo’s first contraction in the population growth in 26 years. Omicron isn’t the only challenge for Japanese diplomats as the country’s Vice Finance Minister Kanda highlighted the mixed impact of weaker yen on economics. That said, Japan’s Monetary Base for January rose past 8.3% prior and 7.8% forecast to 8.4% YoY.
Looking forward, USD/JPY traders may pay attention to the risk catalysts amid a light calendar heading into the US ADP Employment Change for January, expected 207K versus 807K prior. The reading is well-known as a precursor to Friday’s US Nonfarm Payrolls (NFP) and hence could recall the pair buyers on positive surprise.
Technical analysis
USD/JPY bounced off 21-day EMA, around 114.65 at the latest, to again for crossing the November 2021 peak of 115.52.
| Pare | Closed | Change, % |
|---|---|---|
| AUDUSD | 0.71291 | 0.9 |
| EURJPY | 129.291 | -0.01 |
| EURUSD | 1.12728 | 0.36 |
| GBPJPY | 155.115 | 0.23 |
| GBPUSD | 1.35237 | 0.6 |
| NZDUSD | 0.6638 | 0.99 |
| USDCAD | 1.26817 | -0.16 |
| USDCHF | 0.92099 | -0.64 |
| USDJPY | 114.693 | -0.32 |
- Gold holds in a corrective territory on the daily chart as markets remain in anticipation of NFP.
- The US dollar has been pressured to start the week by a chorus of less hawkish Fed remarks.
At $1,800, gold, XAU/USD, is consolidating within a bullish correction on the daily chart after hitting a 38.% Fibonacci retracement level in Tuesday's trading. The yellow metal has benefitted from a switch in risk appetite and less hawkish rhetoric from a chorus of Federal reserve speakers since the Fed's governors uber hawkish tone.
Several US Federal Reserve officials are playing down the prospects of aggressive rate hikes coming imminently. For instance, although St. Louis Fed president Bullard (hawkish, voter) said that market pricing of 5 rate hikes this year is not a bad bet, he also said that a 50bp move probably is not helpful.
Over the weekend, Raphael Bostic reiterated that he is sticking to his prediction that three 25 bp hikes this year is the most likely outcome whilst warning that “Every option is on the table for every meeting.” Philadelphia Fed President Patrick Harker was equally cautious and he pushed back on a rate increase of half a percentage point in March, saying he would need to be convinced it was needed. Consequently, the dollar index eased to 96.235 (DXY) and off its recent 19-month high of 97.441.
Looking ahead, there will be a focus on the US jobs market in Nonfarm Payrolls. ''The recovery in employment was probably temporarily interrupted by the Omicron-led surge in COVID cases,'' analysts at TD Securities said.
''Many of the employees who had to isolate likely continued to be paid, and thus remained on payrolls, but many were likely not paid. The report will probably show continued strength in wage gains. The report will include the annual revision to the data.''
However, if there is a weak jobs print owing to the virus, it is unlikely to sway the Fed from its decisively hawkish tone. Traders could decide to look past recent weakness as being related to Omicron's fallout, analysts at TD Securities argued in a note on Tuesday.
''In this context, the data doesn't help to inform global macro participants on whether we are facing a new regime at the Fed, or whether they are jawboning to tame inflation expectations. We expect that the precious metals complex will struggle to attract capital in this context.''
''Given that Chinese demand overwhelmingly supported gold in recent weeks, a seasonal lull following Lunar New Year could mark the end of supportive Chinese demand, suggesting prices are vulnerable to a deeper consolidation in support of our tactical short gold position.
Gold daily chart
In a prior analysis, it was stated that ''considering the trendline support and the daily M-formation, the technicians would argue that a significant correction of the bearish impulse could be in play''...
The analysis noted that the M-formation is a reversion pattern. ''In the case above, the 38.2% Fibonacci retracement level near $1,810 has a confluence with prior structure as illustrated.''
''Should this playout,'' it was stated, ''and if the bears commit near to here, then additional supply could be straw that breaks the camelback for a sizeable continuation to crack the trendline support as follows:''

Gold live market
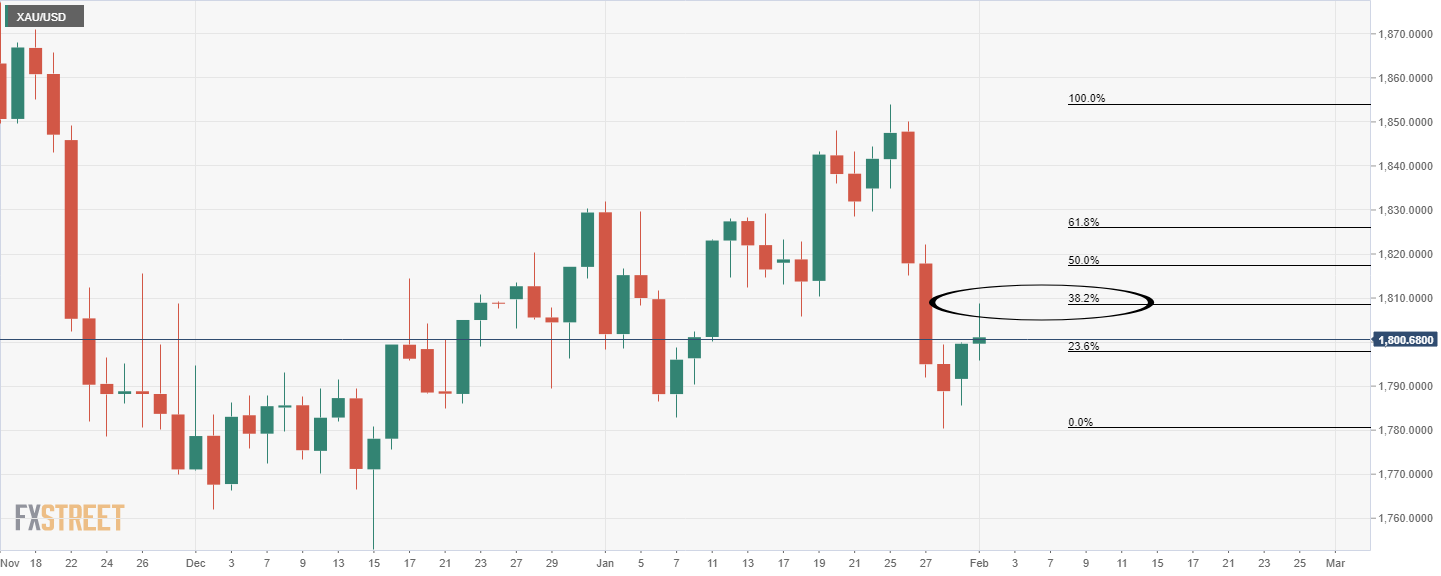
The price hot the target in Tuesday's trade and the bears will be now monitoring for a bearish structure in anticipation of a bearish continuation in the coming days:

- WTI prices remain sluggish around the highest levels in eight years.
- API Weekly Crude Oil Stock dropped below -0.872M prior at the latest.
- DXY prints three-day downtrend amid lackluster markets, easing Russia-linked fears.
- EIA stockpile, risk catalysts can direct short-term moves, bulls pause ahead of the key weekly events.
WTI crude oil prices seesaw around $87.50, grinding higher for the second consecutive day after refreshing the multi-day peak the last Friday.
The US oil benchmark rose to the highest levels since 2014 the previous week amid escalating geopolitical tensions and the market’s hopes of economic recovery. However, the recent indecision over the US Federal Reserve’s (Fed) next move joins pre-NFP caution to test the oil bears. Also challenging the commodity prices could be the Thursday’s Organization of the Petroleum Exporting Countries and allies, together known as OPEC+, meeting.
In doing so, the oil prices also paid little heed to the weekly industry inventory data from the American Petroleum Institute (API). That said, the latest stockpile report marked -1.645M figures for the week ended on January 28, versus -0.872M prior.
It’s worth noting that the US ISM Services PMI for January, 57.6 versus 57.5 expected, joins the Fed’s hawkish halt to test the greenback bears, not to forget expectations of OPEC+ output hike. However, mixed comments from the US Fed officials keep buyers hopeful.
Atlanta Fed President Raphael Bostic said on Tuesday that there is a "real danger" of inflation expectations drifting from the Fed's 2.0% target to 4% or higher. On the other hand, St Louis Fed President James Bullard said that he thinks it is an open question whether the Fed will have to become more restrictive (i.e. raise rates above the "neutral" 2.0%-2.5% zone).
Amid these plays, US Treasury yields stood firmer around 1.80% while the Wall Street benchmarks also closed positive.
Moving on, weekly official inventory data from the US Energy Information Administration (EIA), expected 1.833M versus 2.377M, will join the US ADP Employment Change for January, expected to ease to 207K from 807K, to direct short-term WTI crude oil moves.
It should be noted, however, that a major attention will be given to Thursday’s OPEC+ meeting and ongoing Russia-Ukraine tussles to forecast short-term oil prices.
Technical analysis
Oil prices seesaw between a six-week-old ascending support line and a fortnight-old trend line resistance, respectively around $86.00 and $88.90, with the buyers seemingly losing upside momentum of late.


© 2000-2026. Sva prava zaštićena.
Sajt je vlasništvo kompanije Teletrade D.J. LLC 2351 LLC 2022 (Euro House, Richmond Hill Road, Kingstown, VC0100, St. Vincent and the Grenadines).
Svi podaci koji se nalaze na sajtu ne predstavljaju osnovu za donošenje investicionih odluka, već su informativnog karaktera.
The company does not serve or provide services to customers who are residents of the US, Canada, Iran, The Democratic People's Republic of Korea, Yemen and FATF blacklisted countries.
Izvršenje trgovinskih operacija sa finansijskim instrumentima upotrebom marginalne trgovine pruža velike mogućnosti i omogućava investitorima ostvarivanje visokih prihoda. Međutim, takav vid trgovine povezan je sa potencijalno visokim nivoom rizika od gubitka sredstava. Проведение торговых операций на финанcовых рынках c маржинальными финанcовыми инcтрументами открывает широкие возможноcти, и позволяет инвеcторам, готовым пойти на риcк, получать выcокую прибыль, но при этом неcет в cебе потенциально выcокий уровень риcка получения убытков. Iz tog razloga je pre započinjanja trgovine potrebno odlučiti o izboru odgovarajuće investicione strategije, uzimajući u obzir raspoložive resurse.
Upotreba informacija: U slučaju potpunog ili delimičnog preuzimanja i daljeg korišćenja materijala koji se nalazi na sajtu, potrebno je navesti link odgovarajuće stranice na sajtu kompanije TeleTrade-a kao izvora informacija. Upotreba materijala na internetu mora biti praćena hiper linkom do web stranice teletrade.org. Automatski uvoz materijala i informacija sa stranice je zabranjen.
Ako imate bilo kakvih pitanja, obratite nam se pr@teletrade.global.
транcфери