- Analiza
- Novosti i instrumenti
- Vesti sa tržišta
Forex-novosti i prognoze od 01-02-2022
- GBP/USD grinds higher around weekly top following three-day uptrend.
- A three-week-old resistance line tests buyers ahead of 100-SMA.
- Bullish MACD, sustained break of 50-SMA favor buyers.
- Sellers need validation from 61.8% Fibonacci retracement to take fresh entries.
GBP/USD bulls attack nearby resistance line around the weekly high of 1.3528 during Wednesday’s Asian session.
In doing so, the pair buyers take a breather following a three-day rebound from the 61.8% Fibonacci retracement (Fibo.) of December 2021 to early January 2022 upside.
Other than the bounce from the key Fibo. level, firmer MACD and the cable pair’s ability to stay beyond the 50-SMA level also keeps buyers hopeful to overcome the immediate trend line resistance, stretched from January 13, around 1.3530.
Even so, the 100-SMA level near 1.3560 will act as an extra filter to the north before fueling the GBP/USD prices towards the previous month’s peak of 1.3748.
Alternatively, pullback moves may aim for the 50-SMA level of 1.3470 ahead of highlighting a convergence of the previous resistance line from January 20 and 61.8% Fibonacci retracement level surrounding 1.3385.
It’s worth noting that January’s low of 1.3357 could also test the GBP/USD bears before giving them controls to aim for the sub-1.3300 area.
GBP/USD: Four-hour chart
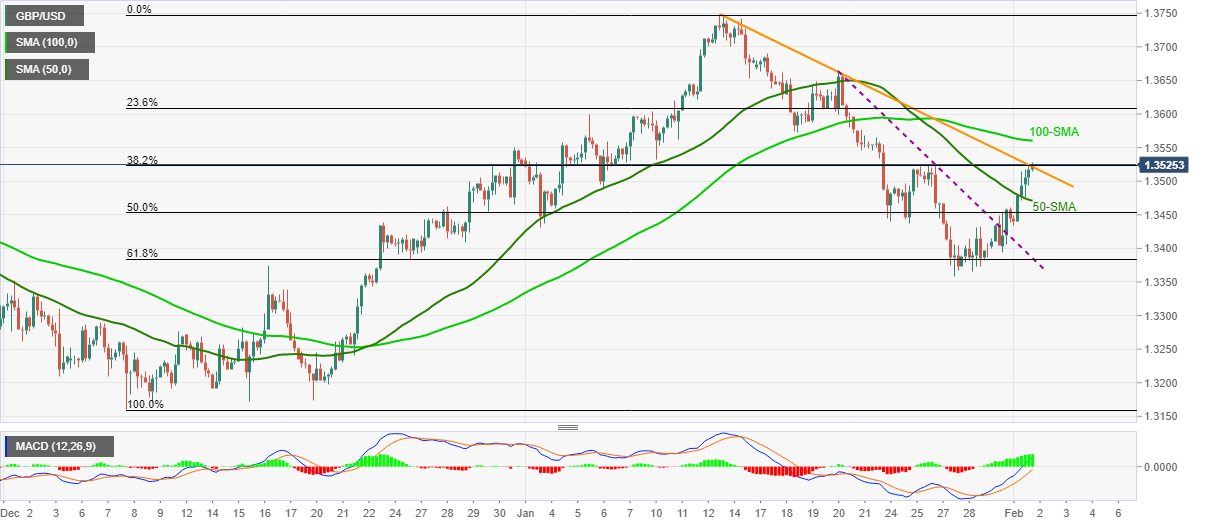
Trend: Further upside expected
US inflation expectations, as measured by the 10-year breakeven inflation rate per the St. Louis Federal Reserve (FRED) data, fade the gradual recovery from September lows tested on January 20, per the FRED website.
In doing so, the inflation gauge eases from the highest level in a fortnight to 2.43% by the end of Tuesday’s North American session.
The easing in inflation expectations could be combined with the recently mixed signals from the Fed to justify the US dollar’s latest weakness. That said, the market’s shift in attention from the Fed ahead of Friday’s US jobs report could also be considered as weighing on the US dollar prices.
However, firmer US ISM Manufacturing PMI for January, 57.6 versus 57.5 expected, joins the Fed’s hawkish halt test the greenback bears.
Moving on, Fedspeak and risk catalysts are important to determine short-term market moves ahead of the US employment report for January.
Read: The US employment report may lose some of its market-moving ability
- On Tuesday, the Australian dollar prolongs its weekly gains.
- A positive market mood kept the AUD in the bid while the USD fell.
- AUD/USD Technical Outlook: in the long-term is downward biased but might print a leg-up before resuming the prevailing trend.
The Australian dollar extends its rally to two straight days during the week, so far up 2.15% vs. the greenback. At press time is trading at 0.7129 during the Asian session.
Wall Street finished Tuesday’s session in the green, while Asian equity futures are set to open in the green. Meanwhile, the greenback keeps dropping, with the US Dollar Index down 0.28%, sitting around 96.26, a tailwind for the AUD/USD as the buck is down 1.09% in the week.
On Tuesday, the AUD shrugged off the initial sell-off, post-Reserve Bank of Australia (RBA) monetary policy decision. Worth noting that the RBA ended the Quantitative Easing (QE) but failed short of hawkish expectations, as market participants waited for hints of a possible rate hike shortly.
Meanwhile, according to the ASX 30 Day Interbank Cash Rate Futures Implied Yield Curve, dated February 1, 2022, market participants are not expecting any rate hikes until the May meeting.
Analysts at Westpac commented that “it was a clearly dovish message. The Governor has certainly gone out of his way to dissuade pricing for a hike in the first half of the year.”
On Wednesday, the Australian economic docket would feature the RBA Chart Pack, and RBA’s Governor Philip Lowe will cross the wires at 01:30 GMT
AUD/USD Price Forecast: Technical outlook
The AUD/USD is downward biased, as depicted by the daily moving averages (DMAs) residing above the spot price. Nevertheless, a leg-up might not be discounted in the near term after the RBA dropped the monetary stimulus, perceived as a hawkish signal.
That said, following the path of least resistance, the AUD/USD first resistance would be the 50-DMA at 0.7163. A breach of the latter would expose 0.7200, followed by the 100-DMA at 0.7254, which, if it gives way, could signal a significant trend shift lying ahead.
“A reduction in the size of the Federal Reserve’s balance sheet could hurt liquidity within the Treasury market, boost volatility and affect how different parts of the U.S. rates market are valued relative to one another, according to Goldman Sachs Group Inc,” per Bloomberg’s latest analytical piece published during Wednesday’s Asian session.
The descriptive reading also quotes Praveen Korapaty follows remarks from Citigroup Inc. who previously said that the process of so-called quantitative tightening -- which is widely expected to follow on the heels of the central bank’s first interest rate increases later this year -- could spark a return of arbitrage opportunities for traders within U.S. interest-rate markets.
“QT is likely to widen the gap between pricing of the most-traded benchmark securities and other, older securities,” Goldman Sachs (GS) adds, “and also to tighten the gap between Treasury yields and swap rates at the shorter-end of the yield curve.”
Bloomberg also said, “The bank’s strategists also expect bigger yield gaps between futures and cash securities and “higher yield dispersion metrics,” they said in a note to clients Tuesday.”
Additional quotes from Bloomberg
Meanwhile, the depletion of excess reserves within the system that stems from a reduction in the Fed’s bond holdings could result in upward pressure on short-term rates, such as the effective fed funds rate and Treasury bill yields, although those moves could be more pronounced in 2023 than in 2022.
The Fed is planning to wind down its buying of Treasuries by March, completing a process that market observers refer to as tapering, and could start shedding its holdings by attrition later this year.
Fed officials, who are currently paving the way for a widely expected interest-rate hike in March, have yet to announce specific plans for balance-sheet reduction, but they did release a set of principles alongside the authority’s most policy decision indicating that it is looking to embrace the broad model it used last time it engaged in QT back in 2017-2019.
Projections are most sensitive to the assumption that ‘levered investors will, over time, replace the Fed as the marginal buyer of USTs.’ Strategists don’t expect QT to ‘materially affect’ cross-currency bases.
Their projections are based on an assumption that the Fed will announce runoff plans in June, quickly ramp it up to a pace of around $100 billion per month and ultimately shrink the balance sheet by between $2.2 trillion to $2.7 trillion over a period of two to two-and-a-half years.
- EUR/USD remains on the front foot, carrying the early breakout of short-term descending trend line.
- Upbeat MACD, firmer RSI adds to the bullish bias but a convergence of 200-SMA, 100-SMA will be the key.
- Sellers will wait for downside break of 1.1200 for fresh entries.
EUR/USD grinds higher around the weekly top near 1.1270 following a three-day uptrend during the initial Asian session on Wednesday.
The major currency pair gained upside momentum after Monday’s upside break of a three-week-old descending resistance line, now support around 1.1205.
The bullish bias then gained support from MACD and RSI to flirt with the 38.2% Fibonacci retracement (Fibo.) level of January 14-28 downside.
It’s worth noting that the EUR/USD buyers aim for 50% Fibo. around 1.1300 as an immediate target during the further advances. However, a confluence of the 100-SMA and 200-SMA around 1.1315-20 will be a tough nut to crack for the pair bulls afterward.
Meanwhile, pullback moves remain elusive until staying beyond the resistance-turned-support and 23.6% Fibonacci retracement level near 1.1200.
Following that, the yearly low around 1.1120 and the 1.1100 threshold may lure EUR/USD bears ahead of the April 2020 peak surrounding 1.1020.
EUR/USD: Four-hour chart
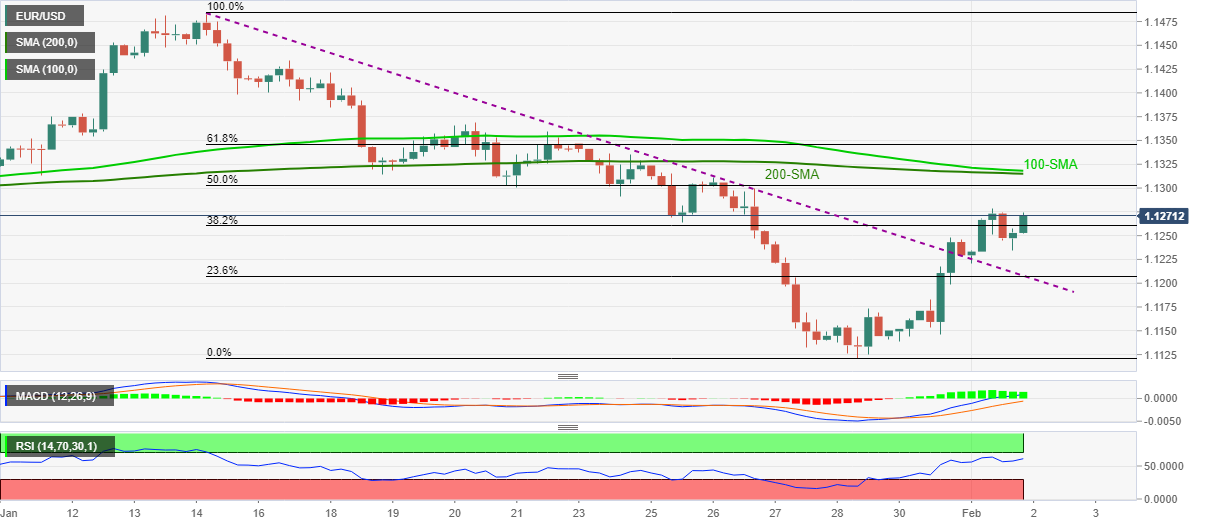
Trend: Further upside expected
- NZD/USD eases from weekly high, probes two-day rebound after New Zealand jobs report.
- NZ Employment Change, Unemployment Rate eased in Q4, Participation Rate softened too.
- NZ Government unveils an unemployment insurance scheme worth $3.54 billion.
- Kiwi bulls tracked Aussie higher post-RBA while softer USD added to the upside momentum, market’s mood stays unclear.
NZD/USD bulls take a breather following the mixed prints of Q4 employment details from New Zealand during early Wednesday morning in Asia. In doing so, the kiwi pair consolidates the recent gains around the weekly top, easing to 0.6635 by the press time. However, the government’s recent assurance to those who lost their jobs during the pandemic times seems to have kept the bulls hopeful of late.
As per the latest New Zealand (NZ) jobs report for the fourth quarter (Q4) of 2021, the Unemployment Rate continues to ease but the softer-than-expected figures of Employment Change, Labour Cost Index and Participation Rate seem to have tested NZD/USD bulls. “We’re “strongest” in the market, expecting unemployment to fall to a historic low of 3.0%. If we’re right, we’d expect the NZD to benefit,” said ANZ bank ahead of the data.
Read: NZ Unemployment Rate beats, but disappointments elsewhere hamsting NZD
A few minutes before the NZ employment data, New Zealand Finance Minister Grant Robertson released employment benefits worth around $3.54 billion, including $1.81b for displacement and $1.73 billion for health condition and disability claims, per NZ Herald. The news reads, “People who are laid off may soon be able to claim support worth as much as 80 percent of their former income, under a Government unemployment insurance plan unveiled today.”
That said, the Kiwi pair tracked the Australia Dollar towards the north the previous day while being on the top-tier of the G10 currency pair winners. The AUD cheered the Reserve Bank of Australia’s (RBA) end to the Quantitative Easing (QE) and revised up the inflation forecasts. Though, the Aussie central bank’s rejection of the immediate rate hike concerns and comments like, “Inflation has picked up, it is too early to conclude that it is sustainably within the target band,” initially weighed on the AUD/USD.
It should be noted that a generally positive risk appetite, upbeat US equities and downbeat US Dollar, despite firmer US Treasury yields, added to the NZD/USD strength earlier.
Moving on, markets remain on the sidelined while waiting for the key data/events, starting from today’s Eurozone Consumer Price Index (CPI) and ending on Friday’s US NFP. However, mixed concerns over Russia-Ukraine may offer intermediate moves. It should be noted that the Fedspeak will be important as well.
Technical analysis
Although oversold RSI conditions triggered NZD/USD bounce during the early week, a three-week-old descending trend line joins the 10-DMA, around 0.6650, to challenge the pair’s immediate upside. Following that, the December 2021 low near 0.6700 will be in focus.
Alternatively, the recently flashed multi-month low near 0.6530 will lure the NZD/USD bears once they conquer the 0.6600 round figure.
- The NZD/JPY advances 0.49% as the North American session ends.
- Mixed NZ macroeconomic data kept the exchange rates unchanged.
- The NZD/JPY path of least resistance is downwards, though the daily close above 76.00 opened the door for a leg-up towards 77.00.
The NZD/JPY climbs as the Asian Pacific session begins, though it faces strong resistance around the 76.00-20 area. At the time of writing, the NZD/JPY is trading at 76.13. Tuesday’s market sentiment was upbeat, as portrayed by US equities finishing in the green. In the Asian Pacific region, equity futures point to a higher open.
NZD/JPY Price Forecast: Technical outlook
On Tuesday, in the Asian session, the NZD/JPY seesawed around the 75.50-75 range. However, in the North American session, a positive market mood spurred a rally towards 76.20. However, positive New Zealand macroeconomic data crossing the wires caused a dip to 76.08 on the pair.
The NZD/JPY remains downward biased. The daily moving averages (DMAs) stay above the spot price, with a downslope, in the case of the 50-DMA. That said, the first support level would be 76.00. A breach of the latter would expose July 20, 2021, daily low at 75.27, followed by August 19, 2021 daily low at 74.56.
Contrarily, in the event of the cross-currency pair holding its ground against JPY bulls, the first resistance would be 76.24. A break above that level could pave the way for further gains. The next resistance would be January 26 daily high at 76.67, followed by January 21 cycle high at 77.05.
The key quarterly labour market data roundup for New Zealand has been released as follows.
The Unemployment Tate fell to 3.2 per cent in the fourth quarter, according to data released by Statistics New Zealand on Wednesday. While this beat expectation, it's not moved the needle on the NZD because the rest of the data was disappointing.
- NEW ZEALAND Q4 S/ADJ UNEMPLOYMENT RATE 3.2 PCT (REUTERS POLL 3.4 PCT)
- NEW ZEALAND Q4 S/ADJ JOBS GROWTH +0.1 PCT Q/Q (REUTERS POLL +0.3 PCT)
- NZ Q4 PARTICIPATION RATE 71.1 PCT (REUTERS POLL 71.2 PCT)
- NZ Q4 LCI PRIVATE SECTOR WAGES (EX-O'TIME) +0.7 PCT ON PVS QTR (REUTERS POLL +0.9 PCT)
- NZ Q4 LCI PRIVATE SECTOR WAGES (EX-O'TIME) +2.8 PCT ON YEAR AGO (REUTERS POLL +2.9 PCT)
Monetary policy implications
The Reserve Bank of New Zealand had viewed the labour market as beyond maximum sustainable employment back in the November MPS. Despite the disappointments today, this is still a highly inflationary labour market, with workers now a scarce commodity, and employers having to pay big bucks to fill vacancies, as analysts at ANZ Bank explained.
''And that’s only going to reinforce the upwards trend in domestic inflation pressures. Inflation is a challenge for household budgets –and it’s particularly hard for lower-income households, for whom essential spending on food, shelter, and transport takes up the bulk of their disposable income. Real wages were likely still falling in Q4 –putting further cash-flow pressure on households, who now need to work longer to be able to afford the same standard of living as one year ago.''
''Higher interest rates are needed to put a lid on surging domestic inflation pressures. And we think that means the RBNZ will lift the OCRin 25bp increments to 3% in April 2023 (assuming no unforecastable shocks knock the economy off course).''
About the employment data
Statistics New Zealand releases employment data on a quarterly basis. The statistics shed a light on New Zealand’s labor market, including unemployment and employment rates, demand for labor and changes in wages and salaries. These employment indicators tend to have an impact on the country’s inflation and Reserve Bank of New Zealand’s (RBNZ) interest rate decision, eventually affecting the NZD. A better-than-expected print could turn out to be NZD bullish.
- USD/CAD bulls could be about to step in again at critical support.
- The 61.8% golden ratio is in view near 1.2650.
As per the prior analysis, USD/CAD Price Analysis: Bears have eyes on 61.8% golden ratio, the bears sank their teeth into the bullish rally and hit the 61.8% target. Since then, the bears gave way to the bulls and a fresh corrective high has been scored. This leaves prospects for a fresh surge to the upside depending on a number of conditions, as illustrated in the analysis below.
USD/CAD, prior analysis
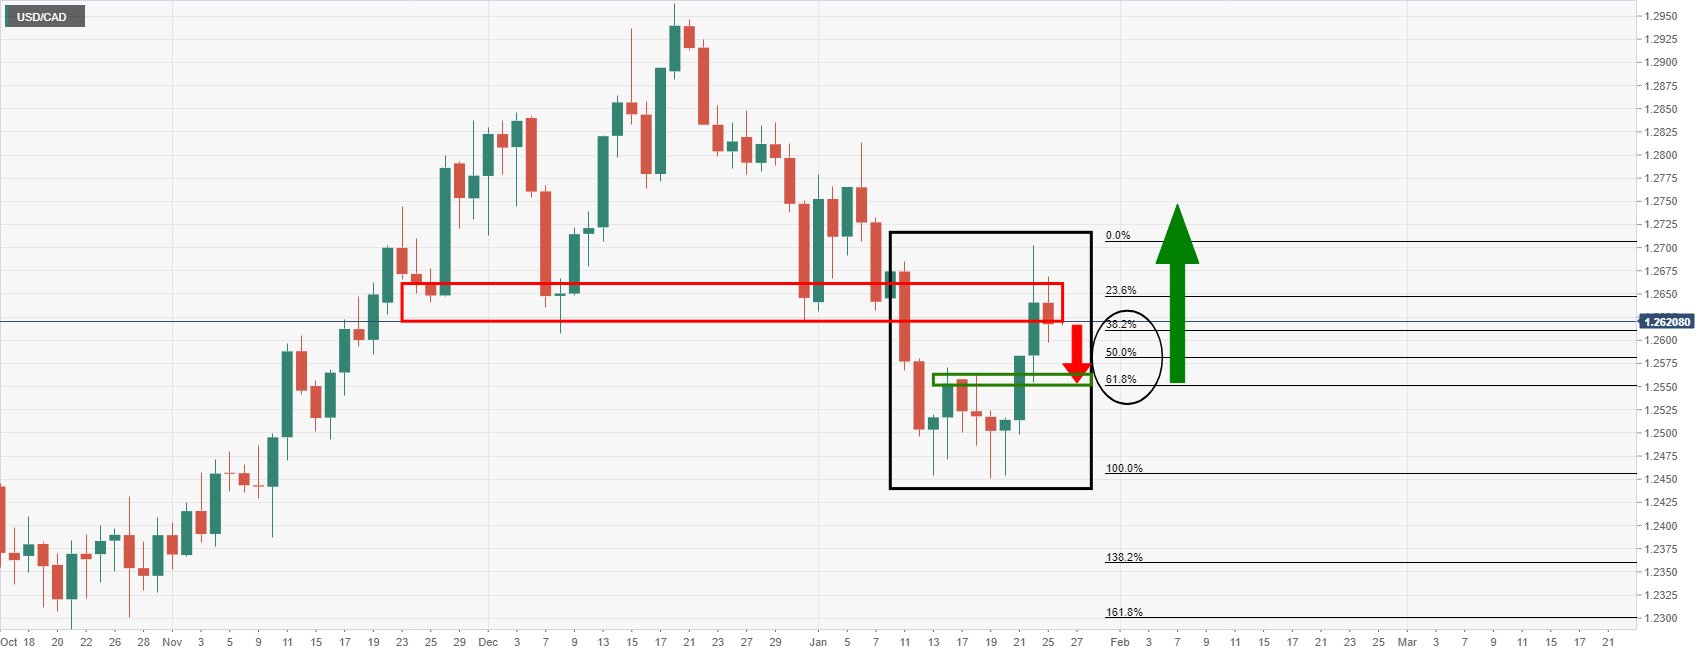
The W-formation's neckline near the 61.8% Fibonacci level was a target area for the imbalance in price which has since been mitigated as follows:
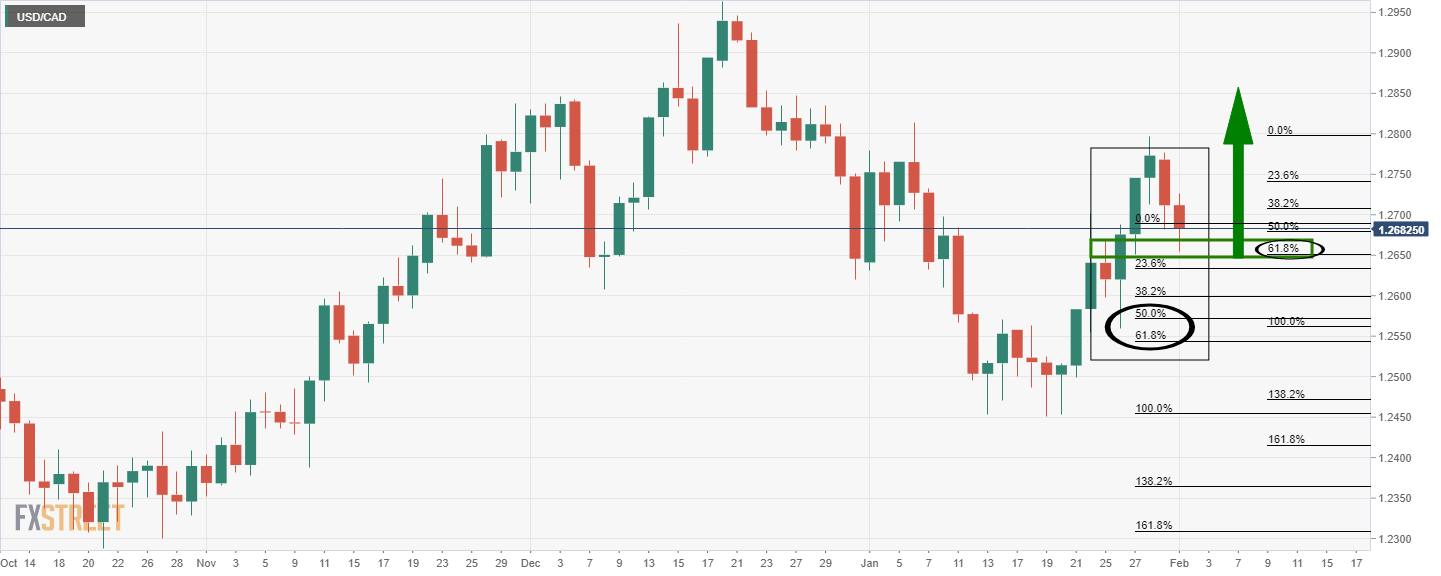
As illustrated, the price tested the area near the neckline and rallied to score a fresh recovery high. The pair is now correcting that rally and is on the verge of making another 61.8% ratio retracement towards 1.2650. If this zone holds, then there will be prospects for an upside extension in the coming days.
- AUD/JPY has reversed sharply higher from its post-RBA lows beneath the 81.00 level to trade in the 81.75 area.
- Attention now turns to an upcoming speech from RBA Governor Philip Lowe at 0130GMT on Wednesday.
AUD/JPY has reversed sharply higher from its post-RBA lows beneath the 81.00 level to trade in the 81.75 area, up roughly 0.5% on the day. The central bank meeting was initially interpreted as dovish given the RBA stuck to its pledge that it would be patient with regard to rate hikes. But a sizeable upwards revision to the bank’s inflation forecasts and a dropping of the reference to rates remaining on hold to at least late 2023 suggests the door has been opened to rate hikes later this year if necessary. As a result, a few local Aussie banks stuck with the H2 2022 first-rate hike calls in wake of the meeting.
Attention now turns to an upcoming speech from RBA Governor Philip Lowe at 0130GMT on Wednesday. If AUD/JPY can rally beyond last Thursday’s highs in the 81.70 area, a move towards the 82.00 level and last week’s highs is on the cards. Against the backdrop of a continued recovery in global equity markets with torrid January trading conditions in the rear-view mirror, the stage may even be set for a more protracted AUD/JPY rebound back towards the 200-day moving average in the mid-82.00s.
Whether that recovery in equities can continue in the coming weeks will depend to a large extent on US data, with the Fed emphasising its data-dependent approach to determining the speed of policy tightening in 2022. The AUD/JPY bulls will be hoping for Friday’s US labour market data and January inflation data out later in the month to ease concerns about wage and cost of living pressures, thus reducing the likelihood of a 50bps March rate hike. A slower pace of Fed tightening in 2022 is seen as better for broad macro risk appetite.
- The AUD/NZD retreated from YTD highs on a dovish RBA monetary policy decision.
- AUD/NZD Technical Outlook: Upward biased but facing strong resistance around 1.0750s.
On Tuesday, the AUD/NZD pare some of its Monday’s gains, during the North American session, after a “dovish” than expected monetary policy statement released by the Reserve Bank of Australia. (RBA). At the time of writing is trading at 1.0722, barely down 0.15%. The market sentiment has improved, with US equity indices recording gains, except for the Nasdaq Composite.
AUD/NZD Price Forecast: Technical outlook
In the overnight session, the AUD/NZD plunged from 1.0750 to 1.0696, courtesy of a dovish RBA monetary policy decision. Even though it came in line with forecasts finalizing their QE program, the central bank’s language was not as hawkish as estimated. However, the downward move stalled at the confluence of the 50 and the 100-hour simple moving averages (SMAs) around the 1.0702-05 region.
That said, the AUD/NZD is upward biased. The daily moving averages (DMAs) reside below the spot price. Furthermore, the price action of the last nine days depicts that the spot price has been seesawing in the mid-point between the top and the central line of Pitchfork’s channel, which traces the price action from November 2021.
To the upside, the AUD/NZD first resistance would be the YTD high at 1.0757. A breach of the latter would expose the top trendline of Pitchfork’s channel around 1.0760-70 area, followed by 1.0800.
Contrarily, the first support would be the mid-point, between the top and the central Pitchfork’s channel around 1.0690. A break under the aforementioned would expose the central trendline of the channel around 1.0630-50, followed by the January 10 daily low at 1.0575.
- Tuesday has thus far been choppy but, as the session’s end approaches, indices have swung back into positive territory.
- The S&P 500 has rallied into the 4530s, up 0.4% on the day, versus previous session lows near 4480.
- Analysts attributed a combination of dip-buying and short-covering as driving the day’s gains.
Tuesday has thus far been a choppy session for US equity markets, but as the end of the session approaches, the major indices have swung back into positive/neutral territory. The S&P 500 has rebounded from 4480ish lows where it was trading 0.7% lower on the day and has pushed into the 4530 area, where it trades around 0.4% up on the day. Having been as much as 1.2% lower earlier in the day, the Nasdaq 100 index is back to flat, though remains unable to crack back above the psychologically important 15K mark. Finally, the Dow is the outperformer on the day, up just over 0.5% and back above the 35K level.
Analysts attributed a combination of dip-buying and short-covering as driving the day’s gains. “A part of the rally is explained by dip-buying from those who believe stocks hit a bottom as a result of aggressive hawkish Fed pricing across the market,” analysts at Swissquote explained. “Part of it is explained by some short covering, which got traders to buy back shares they initially bet against to close their positions,” they continued. Tuesday’s gains mean that the S&P 500 is now more than 7.0% up from last Monday’s lows near 4200, meaning the index has gained back nearly half of the drop from its record highs printed at the start of the year.
But "this will be the year when Fed will pull back support ... the markets will not be on steroids anymore and may go through a phase of detox” cautioned one analyst at Commonwealth Financial Network. Some might argue US equities are currently in the midst of this “detox” phase and that the road ahead remains bumpy amid uncertainty about future Fed policy. On which note, a barrage of Fed speakers this weak have had left markets with the broadly consistent message that, while it is practically guaranteed that tightening will begin soon, the pace and extent of it depends on economic developments.
That means markets (including equities) will be even more sensitive to economic data than usual. The most important US data to look at this week is thus Friday’s January jobs report. Fed policymakers and economists expect a weak headline NFP number as Omicron disrupted usual labour market churn. They (and markets) will be looking most intently at measures of wage growth (average hourly earnings) and labour market slack (unemployment rate, participation rate). As Fed policymakers leave open the possibility of more aggressive tightening in H2 this year, further tightening of the labour market and build-up of wage pressures might encourage markets to add to Fed tightening bets.
This presents the most downside risk to duration-sensitive big tech and growth stocks which are heavily concentrated in the Nasdaq 100. Data on Tuesday (ISM Manufacturing and JOLTs), while making for interesting reading, did not move markets. The former showed the PMI index falling to its lowest level since November 2020 as the spread of Omicron hampered manufacturing output growth, while the latter showed that labour demand remains very robust, with nearly 11M job opening at the end of 2021.
Other risk events to consider this week relate to earnings; Google’s parent company Alphabet is posting earnings after the closing bell ahead of earnings from fellow tech giants Apple and Meta Platforms (Facebook) later in the week. So far, S&P 500 earnings have been broadly positive and supportive of market sentiment. According to Reuters, of the 184 S&P 500 companies to report thus far, 78.8% have beaten analyst earnings forecasts.
- AUD/USD looks like it could have some staying power around 0.71 the fgure.
- The bulls are in control despite a dovish stance at the RBA.
At 0.7114, AUD/USD is 0.68% higher on the day after rallying from a low of 0.7033 to a high of 0.7117 so far which was recently hit as in New York late afternoon trade as the greenback remains on the backfoot.
The Aussie failed to appease the bulls despite yesterday’s Reserve Bank of Australia's dovish outcome. There was some volatility, but no fresh direction for the pair which continues to correct the daily bearish impulse, as illustrated below.
The RBA ended QE but sounded patient on rate increases. What was telling in the muted impact on AUD/USD is that rate differentials are a secondary driver for the pair. Trapped shorts will have added to the upside as well in the aftermath of the event while traders await the full suite of forecasts that will follow in the RBA’s Statement on Monetary Policy this Friday. before then in Asia today, we will hear from the RBA's governor, Philip Lowe.
''The Governor has certainly gone out of his way to dissuade pricing for a hike in 1H2022, which leaves the evolution of the data for the market to assess which meetings are “live,” analysts at Westpac explained.
''Westpac’s August meeting expectation appears well placed in that regard. The forward cash profile will still remain steep, especially given the hawkish Fed backdrop, so while yields at the front end and out to 3yrs will be lower, they will only be marginally so and we remain better sellers into strength, despite the RBA message.''
The US dollar may still prevail
Positioning could be the key when it is all boiled down. AUD should emerge as an outperformer on the back of US dollar weakness and improved risk sentiment for its higher beta staus to global equity performance. From a positioning standpoint, it is highly stretched on the net short side as well. This can support the Aussie for the time being. However, looking forward, the US dollar is going to be supported by the Fed's stance on tightening for most of 2022. Therefore, the resistance on the daily chart should hold initial tests under the status quo.
AUD/USD technical analysis
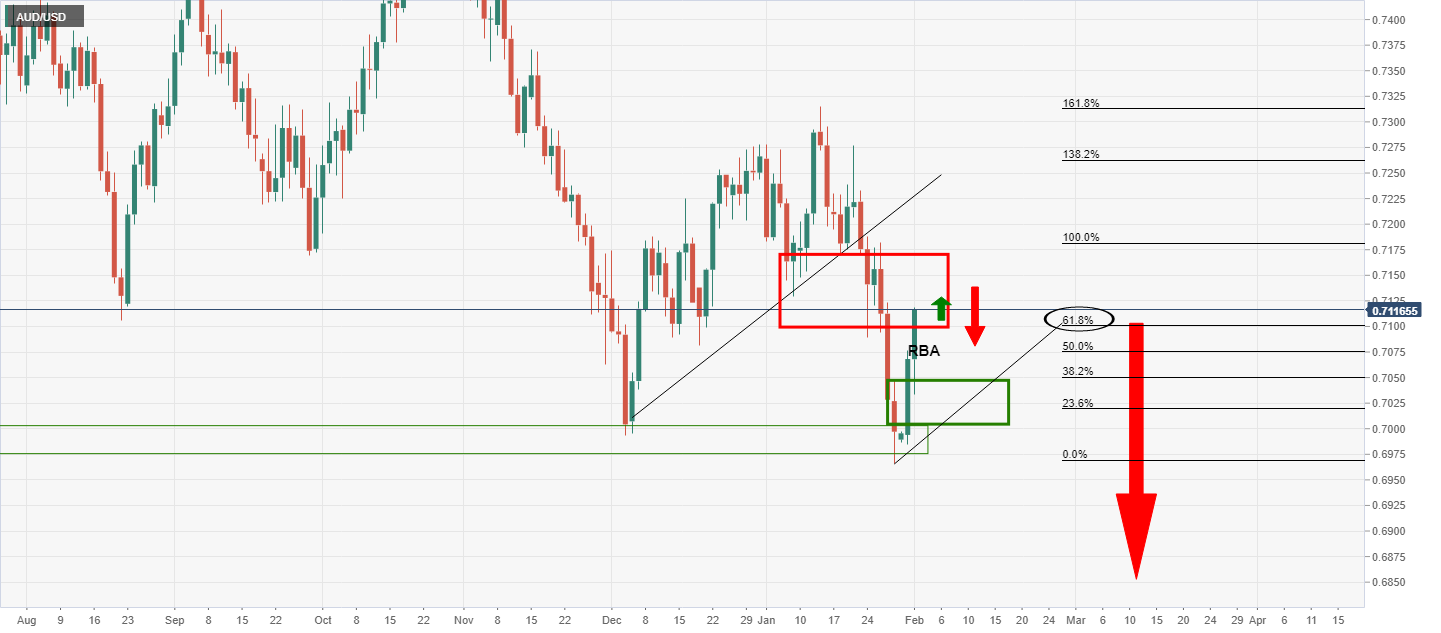
The price has penetrated into resistance territory and is testing above the 61.8% Fibonacci ratio of the prior bearish impulse. The move has been strong which gives rise to the prospects of some staying power near to 0.7100 before the bears might reemerge again.
St Louis Fed President James Bullard on Tuesday said that he thinks it an open question whether the Fed will have to become more restrictive (i.e. raise rates above the "neutral" 2.0%-2.5% zone).
Additional Remarks:
"We will be able to assess our position in a few months' time."
"I think it's premature to be concerned about the yield curve."
"I don't think the market so far thinks we will let inflation get out of control."
"I do consider the slope of the yield curve though."
"I think the unemployment rate will go below 3% this year."
"Firms are scrounging around for workers."
"I think labor force participation has been affected by retirements... and those people are unlikely to return."
"I think the upcoming monthly jobs report will not be good."
What you need to know on Wednesday, February 2:
The greenback remained on the backfoot on Tuesday, although losses were limited across the FX board. The EUR/USD pair is ending the day pretty much unchanged in the 1.1240/50 area after dismal EU data put a cap to the shared currency.
GBP/USD shrugged off UK's political turmoil and retained gains at the end of the day, trading at around 1.3510. The AUD/USD pair also holds near intraday highs in the 0.7110 region despite the RBA refusing to hint at a sooner rate hike. The USD/CAD pair ended the day unchanged amid the weaker tone of oil prices.
Asian and European indexes got to close with gains, but Wall Street spent the day struggling around its opening level, trading mixed but directionless.
Government bond yields started the day on the backfoot, recovering during US trading hours amid generally positive local data. The yield on the 10-year US Treasury note bottomed at 1.73% and currently stands at 1.80%.
US Federal Reserve officials were on the wires, giving mixed signals to those speculating on rate hikes' dates. Bullard said that we would support a hike in March, although he prefers to delay it to May. Earlier in the day, Atlanta's Bostic noted that there is a "real danger" of expectations drifting from the Fed's 2% to 4% or higher. Overall, officials are paving the way to lessen the impact of hikes in stocks.
Gold is hovering around the $1,800 level, incapable of extending gains. Crude oil prices seesawed between gains and losses, ending the day marginally lower. WTI currently trades at $87.90 a barrel.
New Zealand employment figures will bring some action during the Asian session as investors get ready for Thursday's ECB and BOE announcements.
Top 3 Price Prediction Bitcoin, Ethereum, XRP: Cryptos eyes new uptrend in February
Like this article? Help us with some feedback by answering this survey:
St Louis Fed President James Bullard said on Tuesday that he would support a rate increase at the March meeting and would also raise rates at the May meeting if he was to make that decision today. A 50bps rate hike doesn't really help up right now, he added, saying that we are doing a lot here even though we haven't yet raised rates.
Additional Remarks:
"Inflation is quite high right now."
"I am thinking of the March meeting and second quarter for potential rate hikes, and then getting going on balance sheet reduction."
"In July and August, we'll be able to assess how robust inflation seems for the rest of the year and adjust accordingly."
"If inflation ebbs as expected, we may not have to be as aggressive in the second half of the year."
"I think markets pricing in five hikes this year is not too bad a bet."
"I don't think inflation will moderate much before mid-year."
"I am a little pessimistic on inflation compared to the market."
"I see rest of world having more geopolitical risk than in recent years in 2022."
"China's Covid zero policy for Omicron is also a risk."
"I see strong US demand and growth at 4% for 2022."
"But that will meet with continued supply chain disruption."
"That is not too good for inflation numbers this year."
"I would like to guard against that case."
"If we take steps now, we can in the middle of the year see where we are on uncertainties."
"The Fed is data-dependent and this is a fast-moving environment."
"We don't want to disrupt markets but we also need to keep inflation under control."
"Our previous forward guidance suited a different era."
"We are going to have to be more nimble, faster, better at reacting to inflation and other developments this year."
"We are going to be more data-dependent than in the past."
"I could see real returns in the US being higher owing to our success on dealing with the pandemic."
"But it's a global marketplace and it's not nearly so clear for other countries."
"The rest of the world will drag on real rates."
"I'd like to start reducing the balance sheet in Q2."
"Runoff can be faster than last time."
"I think we can get significant balance sheet reduction pretty soon."
"The Fed is not that far from reaching neutral if you consider both rates and balance sheet together."
"If we had to, we could go above the neutral rate."
"I am confident we are not behind the curve."
- Despite US equities recording losses, the NZD rises courtesy of improved market sentiment.
- The USD remains offered across the pond, and the DXY sheds 0.15%.
- The NZD/USD is downward biased but, once 0.6600 was reclaimed, a move towards 0.6700 is on the cards.
The New Zealand dollar advances sharply during the North American session, amid European stocks closing in the red, while US equity indices record losses. At the time of writing, the NZD/USD is trading at 0.6633.
During the day, the greenback has been under intense selling pressure. The US Dollar Index, a gauge of the buck’s value against a basket of six rivals, slides 0.15%, sitting at 96.39, courtesy of a risk-appetite increase in the last couple of days, except for US equities.
The US economy continues in expansion territory
The US economic docket featured the release of the ISM Manufacturing indicators for January on its final reading. The Manufacturing PMI came at 57.6 higher than the 57.5 foreseen by analysts. Although a tenth lower than December’s reading (revised), it showed the resilience of the US economy. Worth noting is the jump in Manufacturing Prices, which crushed expectations and the previous reading, up to 76.1 from 68.1 estimations and 68.2 in December.
That said, it further cements the US central bank hawkish pivot. However, regarding the labor market, Thursday’s Initial Jobless Claims and Friday’s Nonfarm Payrolls could shed light on how it is positioned in the US economy.
On Tuesday, the Philadelphia Fed President Patrick Harker crossed the wires. He commented that he expects a rate hike of 25 basis points in the March meeting, and he foresees at least four increases to the FFR. Harker said that the Fed is not behind the curve and noted that it could begin the Quantitative Tightening (QT) once the Federal Funds Rates (FFR) hit 1% to 1.25%.
Fed speaking continues with St. Louis Fed President Bullard at 19:30 GMT
In the Asian session, the New Zealand economic docket would feature employment figures. HILFS Unemployment Rate is expected at 3.4%, while the Labor Cost Index in a (QoQ) and (YoY) is foreseen at 0.9% and 2.9%, respectively.
NZD/USD Price Forecast: Technical outlook
The NZD/USD is trending downwards, once 0.6700 gave way to USD bulls. The daily moving averages (DMA) show that the downtrend remains intact but, the price action of the last two days might suggest a leg-up is underway and can reach the abovementioned price level.
If the NZD/USD challenges the 0.6700, the next target for NZD bulls would be January 6 low previous support-turned-resistance at 0.6733, immediately followed by the 50-DMA at 0.6768.
Contrarily, and the path of least resistance as the NZD/USD current trend is to the downside, the first support would be 0.6600. A breach of the latter would expose January 28 high, previous resistance-turned-support at 0.6588, followed by the YTD low at 0.6529.
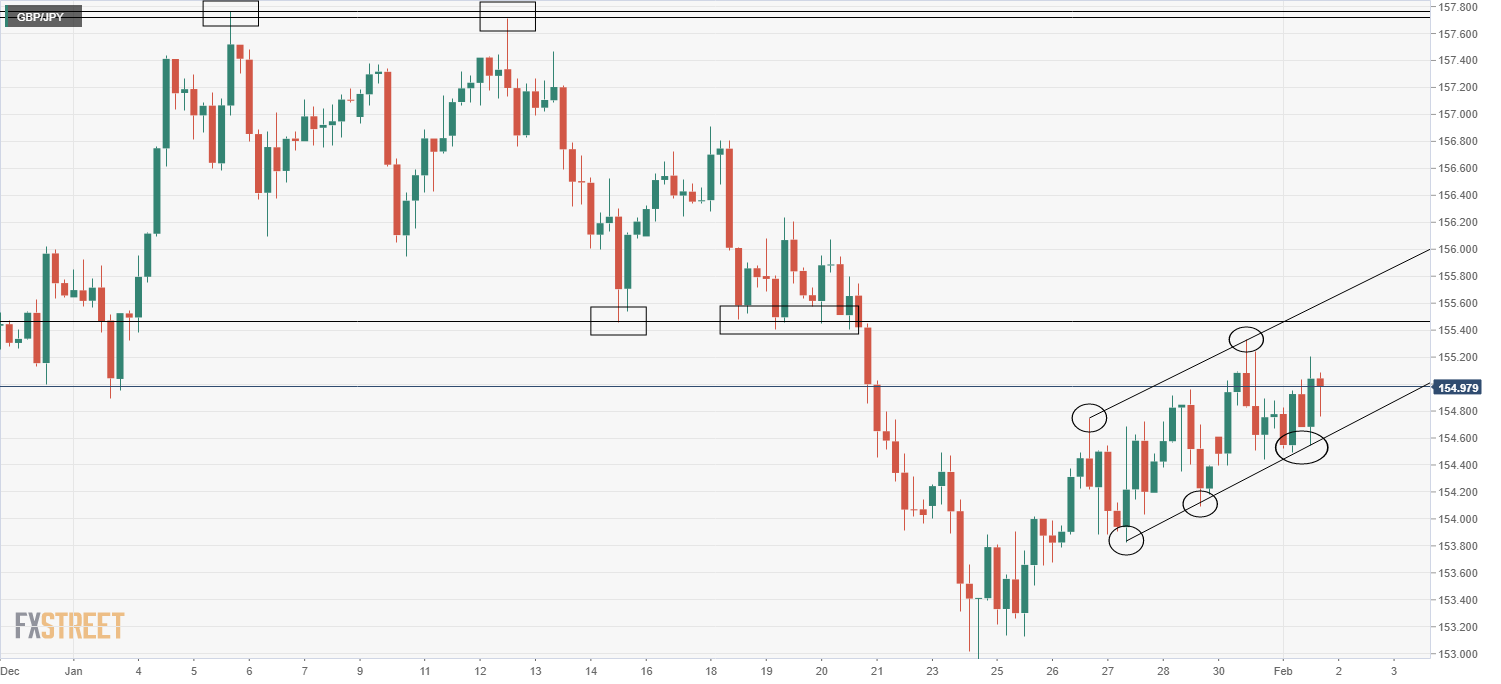
- GBP/JPY continued to trade with a positive bias on Tuesday, though was unable to hold above 155.00.
- GBP/JPY continues to move higher within a short-term bullish trend channel.
- If risk appetite is able to improve in February, yen weakness could propel the pair towards recent highs near 158.00.
GBP/JPY continues to trade with an upside bias on Tuesday against a backdrop of favourable risk appetite, though the pair has been unable to hold above the 155.00 level and in recent trade slipped back below it. A strong start to the year for house price growth according to data from British lender Nationwide, coupled with confirmation that manufacturing PMI had risen to its highest since in six months in January helped keep sterling underpinned. Meanwhile, market commentators also cited investor speculation that the BoE might announce its quantitative tightening plans alongside a 25bps rate hike on Thursday as supportive for the pound.
Ahead of Thursday’s key monetary policy announcement, GBP/JPY continues to move higher within a short-term bullish trend channel that has been guiding the price action for nearly the last week. If the pair can surpass the 155.00 level, its faces solid resistance in the 155.40s area, and the area it failed to get above at the end of last week. A break above this area (perhaps as a result of BoE tightening bets) would open the door to a move above 156.00 and on towards resistance in the 157.00 area. Meanwhile, if February proves to be a better month for risk appetite than last, yen weakness as investor demand for more risk-sensitive assets rises could propel the pair back towards January and Q4 2021 highs in the 158.00 area.
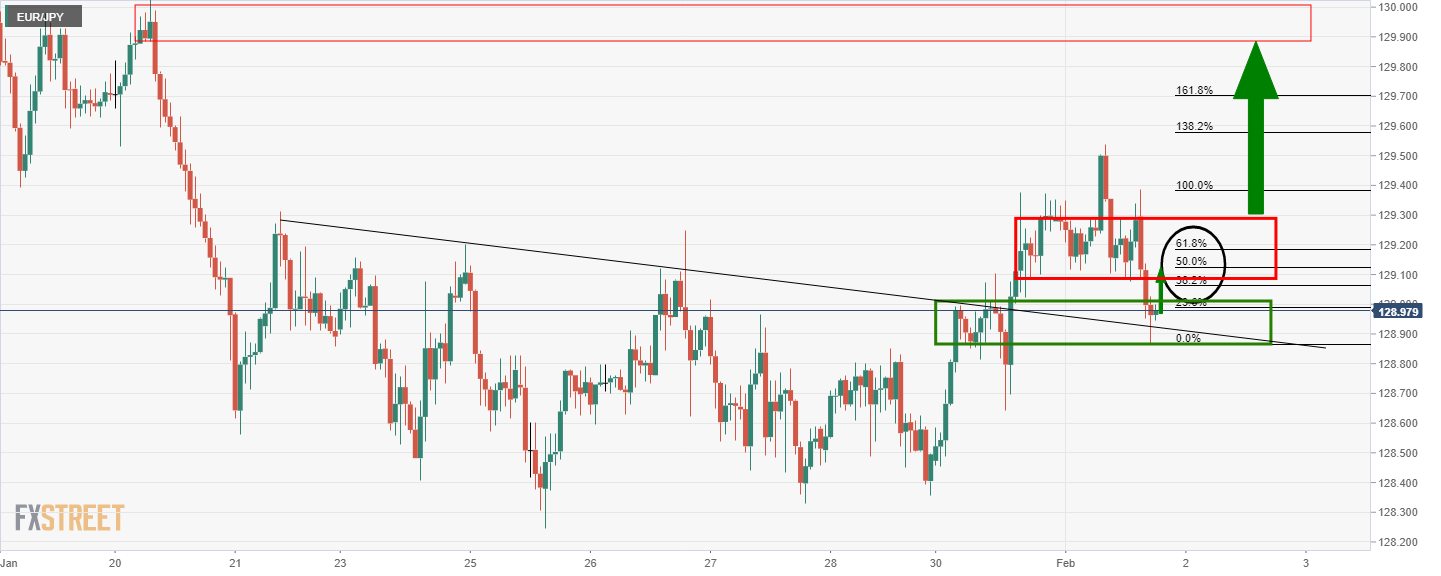
- EUR/JPY bears are moving in on critical support.
- A breakout could be on the cards in the coming sessions.
EUR/JPY bulls are correcting on the ower time frame, but the bears are moving on a critical longer-term support level. The price from a daily perspective has completed a restest of the W-formation's neckline as illustrated below:
EUR/JPY daily chart
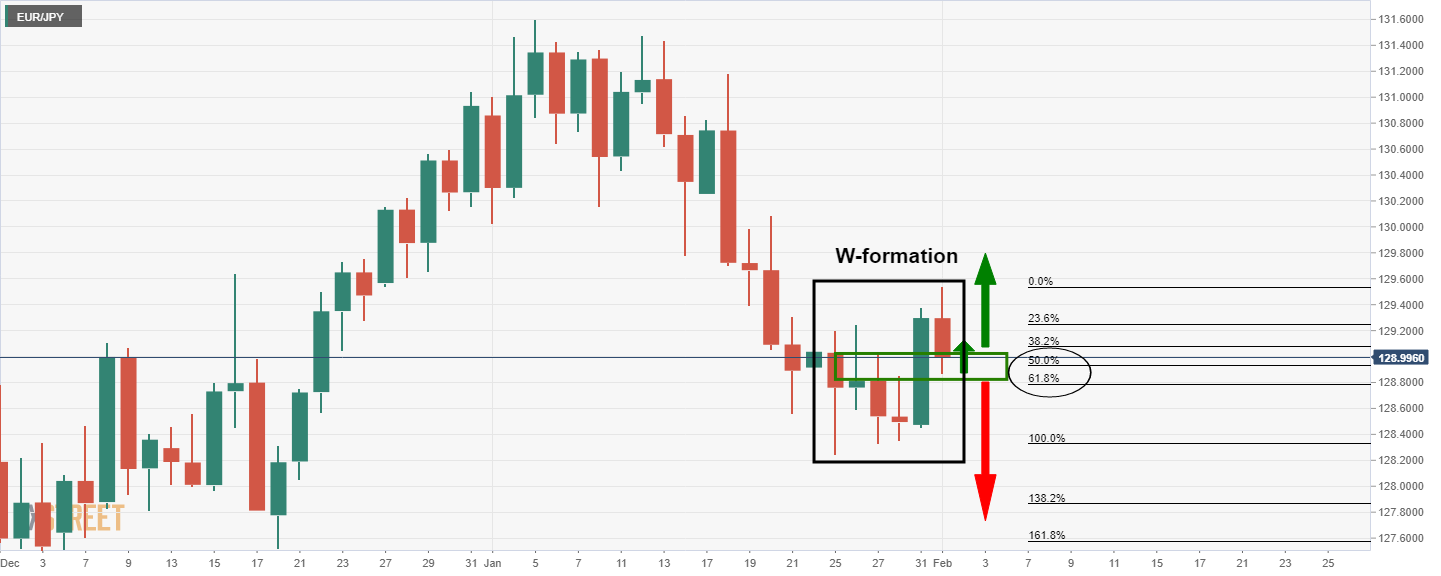
This would be expected to act as support on initial tests where the 50% and 61.8% ratios align with the structure above 128.80. A break of there, however, would open the risk of a downside continuation to test back into the 127.80s
EUR/JPY H1 charts
From a bearish perspective, the hourly market structure is as follows:
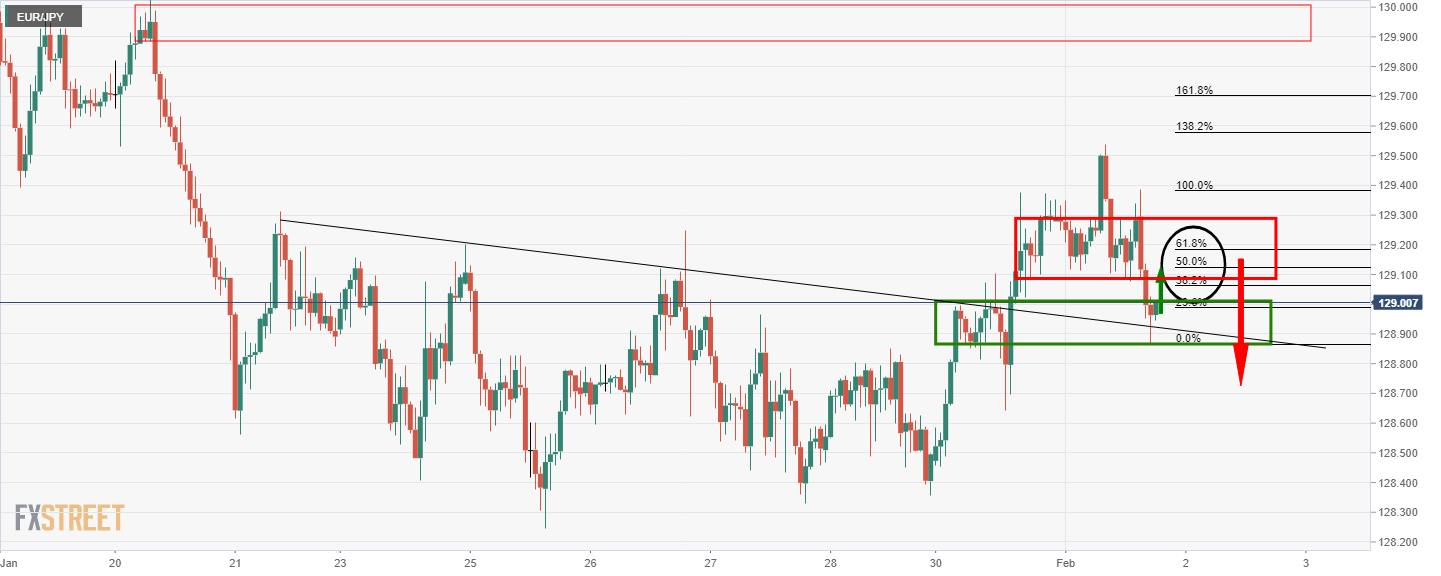
The bullish outlook, on the other hand, requires a break of the 129.30s.
- EUR/USD has eased back under 1.1250 from earlier highs in the 1.1270s, having rejected resistance.
- FX markets are digesting the latest Eurozone and US data releases and Fed speak.
- After upside Eurozone inflation surprises, some analysts have been flagging a risk of a more hawkish ECB on Thursday.
After rejecting resistance in the 1.1270s and reversing back from session highs to underneath the 1.1250 level, it looks as though the EUR/USD bears are making a comeback. Having been as much as 0.4% higher earlier in the session, EUR/USD is back to trading flat in the 1.1240 area, as traders continue to digest the latest Eurozone and US data releases and Fed speak. Recently released US ISM manufacturing PMI survey data for January showed manufacturing activity growth at its weakest since November 2020, with pandemic-related problems such as labour shortages and supply chain holdups worsening last month with the spread of Omicron.
Stronger than expected December JOLTs data showed job openings rising back towards 11M in December, however, seemingly negative any negative impact the ISM survey might have had on the buck. Net-net, Tuesday’s US data has not changed the narrative surrounding the US economy right now; that it is experiencing temporary Omicron-related weakness and that labour markets remain very tigth and inflationary pressures very high. With Tuesday’s data dump out of the way, FX markets turn their focus to the ADP national employment change estimate on Tuesday, ahead of the ISM Services report on Thursday and the official jobs report on Friday.
As usual, the Friday jobs report will be the most important data of the week; the headline NFP number is expected to be weak with Omicron slowing labour market churn. Fed policymakers have this week flagging wage growth and measures of labour market slack as the more important metrics to keep an eye on. Speaking of Fed speak, the message from policymakers this week has been consistent; a March rate hike enjoys wide support, but there is less certainty about the pace of tightening for the rest of 2022. Fed members have expressed a desire to maintain optionality to go slower or faster depending on economic developments and most said a 50bps move in March was possible, but not the expected scenario.
While Fed speak, US data and how these impact Fed tightening expectations will continue to be a key driver of EUR/USD for the remainder of the week, traders should not ignore Eurozone fundamentals. After upside inflation surprises from France, Germany and Spain this week (implying an upside surprise in the Eurozone aggregative inflation figures on Wednesday), some analysts have been flagging a risk of a more hawkish ECB on Thursday. Eurozone money markets were pricing an 80% chance of a 25bps rate hike from the bank as soon as October. Any hint towards the conditions for a rate hike being met in 2022 could light a fire under EUR/USD and send it back towards the 1.1300s.
- GBP/USD is higher on US dollar weakness and improved risk apatite.
- The BoE is the focus for this week and traders will be looking for clues from the MPC.
GBP/USD has printed a fresh high in New York trade. At 1.3519, the price is 0.56% on the day after rallying from a low of 1.3433. Cable is up for a third straight session as strong domestic economic data and hawkish sentiment surrounding the Bank of England coupled with a weak US dollar leaves bulls in control.
Thursday will see a UK Monetary Policy Committee meeting, where a rate hike is likely. Investors have now fully priced a 25-basis-point rise in the BoE's main interest rate to 0.50% on Feb. 3. Therefore, the focus ought to be on what's said, more than what's done.
Pricing for UK rate hikes this year is the same as for the US - 5 in total. The Bank of England is expected to start running down its bond holdings on 7 March. However, amid fears the central bank might be behind the curve when it comes to tackling inflation, there is uncertainty over the pace at which it will raise rates and the level at which they will peak. Traders are also wondering how soon and how fast the bank will start reducing its balance sheet and stop reinvesting maturing gilts.
Encouragingly for sterling bulls, a survey showed British manufacturing output grew at the fastest pace in six months in January. This is supporting the view that the British economy is still handsomely rebounding from the COVID-19 recession. Additionally, the political crisis in Britain over lockdown parties at Downing Street has not had a significant impact on investors appetite for the pound. However, opinion polls showing a majority of voters felt Prime Minister Boris Johnson should resign, so this could come back to bite the bulls once the BoE premium is eventually discounted; The pound might not be able to stay strong on the BoE indefinitely.
''On the assumption that the government does proceed with its tax hike in April, we see the risk that the market will unwind some of its assumptions on BoE rates and this could leave the pound vulnerable in the spring and early summer,'' analysts at Rabobank argued. '' Given our view that the USD will be buoyed as Fed tightening commences, we see a risk that cable could dip below the 1.30 level in the middle of the year.''
US dollar under pressure
Meanwhile, the US dollar is under pressure and has fallen for a second consecutive session on Tuesday. Weaker-than-expected US economic data and less hawkish Federal Reserve officials who have pushed back against aggressive rate hikes this year have weighed. This too has helped the British pound to gain ground as risk appetite returns. Wall Street shares are also higher.
A series of Federal Reserve officials said on Monday that they would raise interest rates in March, but they have spoken cautiously about what might follow. That has taken the sting out of Fed's Powell's more hawkish tone from the recent Fed, meeting and presser that followed.
GBP/USD technical analysis
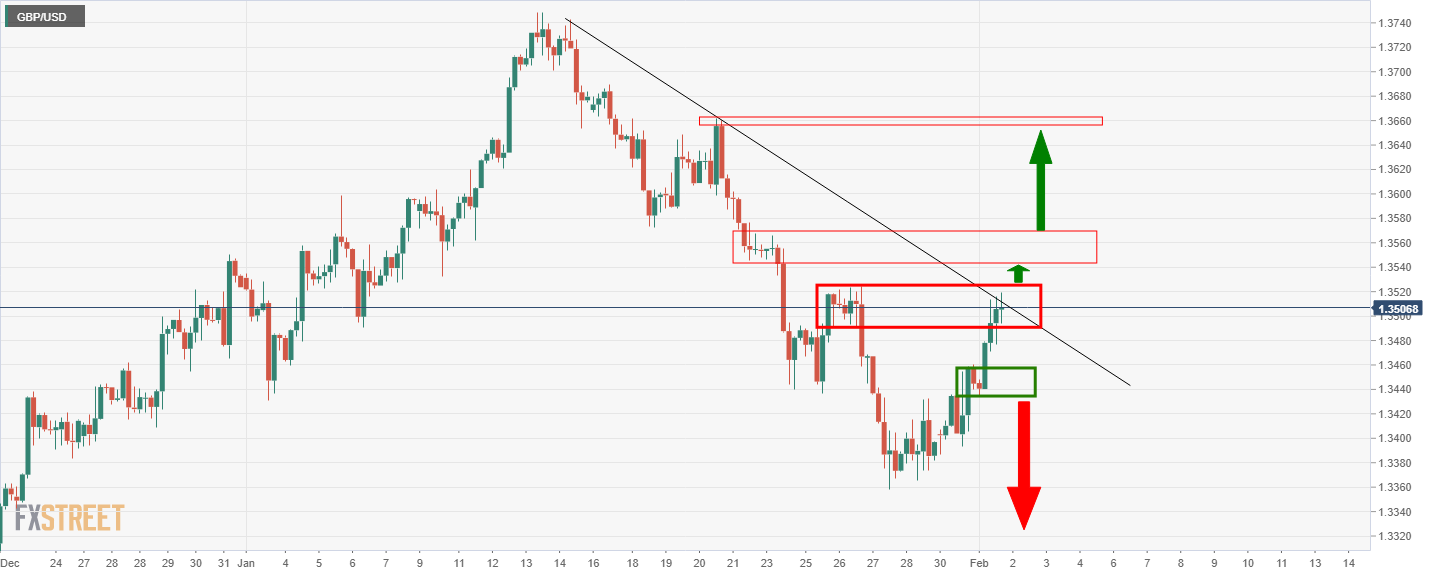
The price has shot into 4-hour liquidity where resistance could see the bulls struggle from here around the descending trendline. Having said that, a break of 1.3525 could open the doors to 1.3575 as the last defence for a significant move high towards 1.3680.
According to analysts at MUFG Bank, the Turkish lira will remain weak against the US dollar during the first half of the year. They forecast USD/TRY at 14.500 by the first quarter and at 16.000 by the second quarter.
Key quotes:
“The lira has been notably more stable at the start of the new year with USD/TRY trading within a relatively narrow range between 12.803 and 13.940. It follows the extreme price action towards the end of last year when USD/TRY traded between 10.251 and 18.363 in December. However, we still believe that the current period of stability is built on shaky foundations.”
“There is no indication yet of shift to more orthodox policy settings in Turkey that would help to restore confidence in the lira on a more sustained basis. To the contrary, President Erdogan has recently called for interest rates to be lowered further. He still believes that lower interest rate will help to bring down inflation that is expected to have reached close to 50% in December. At the same time producer price inflation is expected to have reached close to 100%. The CBRT is still relatively optimistic that inflation will fall back sharply to around 23% by the end of this year.”
“Last month’s decision to transfer FX risk-linked to holding lira deposits from individuals to the government may help to temporarily slow the pace of dollarization in Turkey but does not solve the underlying problems and risks undermining the health of public finances which has been one of the solid domestic fundamentals. At the same time, policymakers in Turkey have stepped up intervention to provide more support the lira in the near-term.”
Data released on Tuesday showed the ISM Manufacturing Index dropped 1.2 to 57.6 in January, below 57.5 of market consensus. Analysts at Wells Fargo point out that despite these headwinds, the ISM manufacturing report continued to signal incremental thawing of supply problems. They expect activity to remain strong.
Key quotes:
“While current activity was weaker amid a 1.2 point drop in the production component, the 3.1 point decline in new orders suggests some pullback in demand as well. The declines in January brought both of these components to their lowest levels in over a year and a half, signaling weaker activity in the sector.”
“The third consecutive monthly decline in the ISM manufacturing index in January signals weaker but still-strong activity in the sector. But, we believe this weakness will partly be temporary. The Omicron variant has shown some signs of subsiding just as fast as it appeared. New daily cases seem to have peaked and the national hospitalization rate looks to have rolled over. Further, even if demand continues to subside in the near-term as the service sector gains more considerable momentum, the expansive backlog of orders means manufacturers will be busy with plenty of product to still deliver on.”
- US dollar stabilizes during the American session, DXY trims losses.
- XAU/USD fails to breaks $1810, remains above $1800.
Gold peaked on European hours at $1809 and then lost strength. It pulled back following the release of US economic data to $1797 and then rose back above $1800. XAU/USD is moving sideways on American hours, capped by $1810 while holding above $1800.
The dollar recovers some strength amid rising US bond yields that rebounded from weekly lows. The DAY is falling for the second day in a row and it stands around 96.50, down 0.18% off lows. The combination of a rebound in yields and also in the DXY weakened XAU/USD that is still in positive ground for the day.
Short-term outlook
Gold’s price recovery found resistance at $1809 and pulled back. If XAU/USD fails to break the $1810 area, the upside would remain limited and a break higher could clear the way for a rally initially to the 20-day moving average at $1816; above the next key barrier is the $1830 area.
A slide back under $1800 would increase the bearish pressure. A daily close under $1790 is needed to suggest more losses ahead. Key support levels are seen at $1780 and $1770.
Technical levels
- The USD continues losing against the safe-haven status of the Japanese yen, 0.26%.
- US ISM PMI Manufacturing Price Index jumped to 78.1 from 68.1.
- USD/JPY is upward biased, despite the 1% drop since last week’s Friday.
During the New York session, the USD/JPY extends to three days its losses, dips 0.26%. At press time, the pair is trading at 114.78, up from 114.56, after a better than expected US ISM Manufacturing report. Market sentiment is mixed. European equity indices rise, while US stock indices fall post-ISM.
In the meantime, the US 10-year Treasury yield edges up two basis points sits at 1.804% post-US ISM.
US ISM Manufacturing came better than expected
On Tuesday, the Institute for Supply Management (ISM) reported the Manufacturing PMI Index for January. The figures at 57.6, better than the 57.5 foreseen, showed that the US economy continues expanding. However, the Manufacturing Prices Index smashed forecasts, climbing to 76.1 from 68.1 estimated, further cementing Fed rate hikes in 2022.
Some minutes before the ISM PMI, the IHS Markit Manufacturing PMI came at 55.5, slightly up than the 55.0 estimated.
Fed speaking continues with regional Presidents, led by Philadelphia’s Harker, followed by St. Louis Bullard at 19:30 GMT
In the meantime, before the North American session began, the Philadelphia Fed President Patrick Harker crossed the wires. Harker commented that the Fed is not behind the curve, and he expects a rate hike of 25 basis points, four in the year. Concerning the balance sheet reduction, he said that the US central bank could begin the Quantitative Tightening (QT) once the Federal Funds Rates (FFR) hit 1% to 1.25%.
USD/JPY Price Forecast: Technical outlook
The USD/JPY is upward biased despite solid resistance around the 115.50-70 area, courtesy of a five-month-old upslope trendline previous support-turned-resistance. A breach of the latter would expose the YTD high at 116.35, followed by January 3, 2017, high at 118.61.
On the flip side, the USD/JPY first support level would be January 27 daily low at 114.47, followed by the 50-day moving average (DMA) at 114.33 and then 114.00.
The Korean won lost ground in January versus a stronger US dollar across the board, explained analysts at MUFG Bank. They see the USD/KRW moving to the downside over the rest of the year and forecast it at 1150.0 by the third quarter and at 1145.0 by year-end.
Key quotes:
South Korea has been facing an elevated number of new daily confirmed Covid-19 cases since mid-January, the country reported a record high 14,518 new cases on 27th January, exceeding the previous peak in mid-December last year of 7,850. The Covid-19 situation pushed the KOSPI to decline by 11% and financial market sentiment was low in January.
“Despite the worsened pandemic situation, South Korea’s economy showed its resilience in exports and construction activities. South Korea’s exports grew strongly by 22%yoy in the first 20 days of January, up from 20% in December. Growth of exports to the US accelerated by 8.9ppts to 28% yoy. Product-wise, semiconductor, a key export, grew by 29.5%yoy. Korean consumers’ sentiment picked up.”
“The government has enforced new containment measures including expanded rapid testing which will help to mitigate the spread of highly transmissible Omicron variant. Also, on January 21st, South Korea proposed an additional budget of 14 trillion won to support small and micro merchants hit by extended Covid-19 management measures caused by the protracted pandemic.”
“We expect USD/KRW to decline to 1,175.0 by Q1 2022.”
- AUD/USD pushed back above 0.7100 on Tuesday despite what analysts said was a “dovish” RBA meeting.
- The US dollar has been falling, risk appetite improving and base metal/energy prices rising, all contributing to AUD’s outperformance.
Against the backdrop of robust risk appetite, favorable moves in base metal and energy prices and a faltering US dollar, the Aussie’s post-“dovish” RBA policy announcement Asia Pacific underperformance is now firmly in the rear-view mirror. The currency has been climbing the G10 rankings throughout the session and is now the second-best on-the-day performer after NZD, with AUD/USD trading about 0.7% back above the 0.7100 level.
The next significant area of resistance for traders to keep an eye on is in the 0.7170 zone, which has acted as both support and resistance since mid-January and also coincides with the 21 and 50-day moving averages. With the RBA policy announcement now old news, AUD/USD is free to focus back on US themes, such as data and Fed speak. There has already been plenty of both this week and will be plenty more in the coming days.
The pair was unfazed by a slightly stronger than expected ISM manufacturing PMI survey that still showed the headline index dropping to its weakest since November 2020 and ignored a surprise rise in monthly job openings in December. While Thursday’s ISM Services PMI survey will also be worth watching, the main event of the week will be Friday’s US jobs report. Fed speakers have been emphasising a new data-dependent approach to determining the pace at which the bank tightens policy in 2022 and beyond.
If Friday’s jobs report contains fresh signs of build wage pressures and of a further tightening of the labour market, that could encourage money markets to start pricing in the chance of a 50bps hike in March again. Of course, this presents downside risks to AUD/USD towards the end of the week and should any Fed-related dollar strength come surging back, traders will be looking for a retest of January lows under 0.7000.
On Tuesday, the Reserve Bank of Australia (RBA) kept rates unchanged and announced the end of its QE program. According to analysts at Well Fargo, the RBA made a modestly hawkish shift. They anticipate modest weakness in the Australian dollar versus the greenback over the medium term.
Key quotes:
“Australia's economy appears to be on a sturdy upturn, with a rebound in activity and quickening of inflation in the final quarter of 2021. Despite some near-term uncertainties, we believe these more solid economic trends can continue in 2022.”
“We believe inflation will remain elevated in the coming quarters and that by late this year the RBA will be confident enough to begin raising rates. Accordingly, we have made a modestly hawkish shift on our own monetary policy outlook, and now forecast an initial 15 bps rate hike in November 2022 and a cumulative 100 bps of rate hikes in 2023.”
“We also forecast an additional 100 bps of rate hikes over the course of 2023. Next year we expect 25 bps rate hikes at each of the RBA's February, May, August, and November meetings, which would take the Cash Rate to 1.25% by the end of 2023. Still, even with a more timely path for monetary tightening, RBA rate hikes should still lag behind those of the Federal Reserve and fall short of monetary tightening currently priced in by market participants. Accordingly, even with an outlook for a solid Australian economy and slightly faster RBA monetary tightening, we still anticipate moderate weakness in the Australian dollar versus the greenback over the medium-term.”
Capital flows may help mitigate downward pressure on the Indian rupee during the next weeks according to analysts at MUFG Bank. They forecast USD/INR at 74.000 by the end of the first quarter and at 73.00 by the second quarter.
Key quotes:
“The magnitude of the Indian rupee’s depreciation against the US dollar in January was the largest since September 2021, mainly driven by US dollar strength on rising market expectations of a more hawkish Fed, higher oil prices, and net equity outflows in part due to a potential delay in the launch of India’s largest IPO beyond March.”
“Downside risks for the rupee have risen as market expectations of more aggressive Fed tightening may result in more capital outflows in the near term, which could be exacerbated by the lack of a substantial pick-up in IPO-related inflows should there be delays in IPO launches. Downward pressure on the rupee can still be mitigated by net inflows into the bond market towards end-Q1 in anticipation of the potential inclusion of Indian sovereign bonds into a few global bond indices, followed by passive inflows following the official announcement.”
“With economic activity affected in the short term, we think it is premature for the RBI to raise the benchmark repo rate as soon as the next meeting on 9th February despite higher levels of inflation. But we think the RBI is likely to take more concrete action to mop up excess liquidity by hiking the reverse repo rate by 20bps to 3.55% in February, thereby narrowing the interest rate corridor.”
Economists at ING think that the European Central Bank (ECB) could disappoint the market’s hawkish expectations and send EUR/USD back to the 1.1200 support.
Downside risks from hawkish expectations
“We think that patience will prevail over panic in the ECB’s message when it comes to inflation, and given the bar for a hawkish surprise is placed quite high after this week’s consumer price index figures, we expect EUR/USD to give up some of its recent gains after the ECB announcement.”
“We expect the pair to pull back to the 1.1200 support, with any recovery in the dollar set to trigger a break below that level.”
Atlanta Fed President Raphael Bostic said on Tuesday that there is a "real danger" of inflation expectations drifting from the Fed's 2.0% target to 4% or higher. If current levels of Fed support are left in place, he added, it could fuel more inflation and thus warrant action "soon" to reduce accommodation.
Additional Remarks:
"The business response to what appeared short-term supply and other problems could change the long-run path of inflation."
"Businesses are now seeking "redundant suppliers" to buffer against future disruptions, adding to their costs."
"The goal of coming policy actions is to ensure expectations about inflation don't become untethered."
"There is a "real danger" of expectations drifting from the Fed's 2% to 4% or higher."
"The pandemic induced price changes could "grind on" long enough to "fundamentally alter" how the public thinks about inflation."
"I will be watching monthly changes in inflation to see if they decline... ready to support more aggressive steps if the pace increases."
- Oil remains supported close to multi-year highs with WTI currently above $88.00 per barrel.
- Speculation about a larger than 400K BPD OPEC+ output hike from March hasn’t weighed on prices.
Oil prices have continued to trade close to multi-year highs and within recently established ranges on Tuesday, with front-month WTI futures undulating between lows in the $86.00s and highs in the $88.00s. At current levels just above $88.00 per barrel, WTI is trading flat on the day and is less than $1.0 below the seven-year highs printed back last Friday at $88.82. Traders were passing round/discussing a note from Goldman Sachs on Tuesday that suggested that OPEC+ could add more supply than expected at the coming meeting amid high oil prices.
OPEC+ meet later in the week to set policy and sources had previously indicated that the group would in March stick to their current policy of increasing oil production quotas by 400K barrels per day each month. However, Goldman Sachs flagged the risk that the group goes further than adding 400K additional daily barrels, saying “we view growing potential for a faster ramp-up at this meeting, given the pace of the recent rally and the likely pressure from importing nations”. They said the outcome of the meeting remained “evenly balanced” between a larger than 400K output hike versus and a continuation of the current policy.
Speculation of a larger supply increase hasn’t dented oil prices. Indeed, OPEC+’s Joint Technical Committee, who always meet the day before the OPEC+ oil ministers, just wrapped up and did not discuss a larger than 400K barrel per day output hike in March, suggesting that a larger hike is unlikely. Meanwhile, even if the group did surprise with a larger than expected output hike announcement later this week, doubts remain about the ability of smaller OPEC+ producers to meet their rising output quotas. A Reuters survey released on Tuesday showed that OPEC+ production in January was 824K barrels per day lower than allowed by the group’s output quotas.
Elsewhere, analysts continue to cite ongoing geopolitical tensions (Ukraine/Russia/NATO), a lack of progress in nuclear negotiations between Western powers and Iran about a potential easing of the latter’s oil export sanctions and robust/recovering global demand as supportive for oil prices. Looking ahead, US weekly private API oil inventory figures are released at 2130GMT and are expected to show another build.
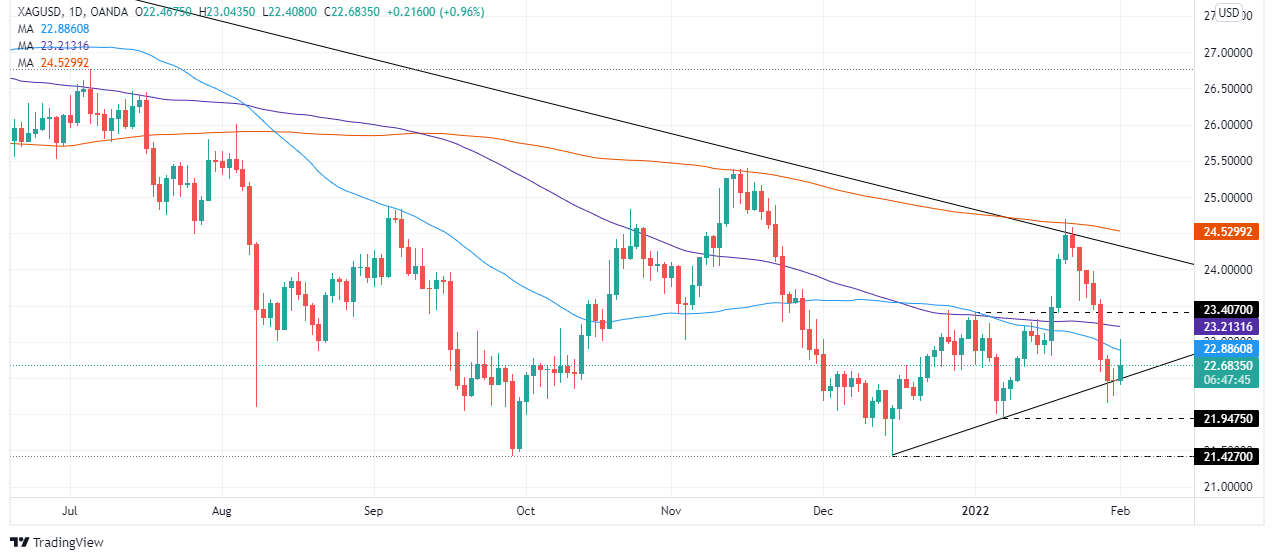
- After several losses held since January 21, the white metal rebound climbs 1.07%.
- A risk-on market mood weighs on the US dollar.
- XAG/USD remains downward biased, which could be cemented by a positive Friday Nonfarm Payrolls report.
Silver (XAG/USD) finally recovered after printing seven straight down days, approaching $23.00, as the North American session begins. At the time of writing, XAG/USD is trading at $22.74. In the meantime, US T-bond yields remain unchanged at 1.78%, while the USD slides 0.21%, sitting at 96.34.
The risk-on market mood keeps investors looking towards riskier assets. Meanwhile, the US dollar has been getting a beating since Monday. The greenback has lost 1.16% after piercing the 97.00 figure for the first time since July 8, 2021.
Fed speakers continue to drive US Dollar
Before Wall Street opened, the Philadelphia Fed President Harker crossed the wires. Harker commented that the Fed is not behind the curve, and he expects a rate hike of 25 basis points, four in the year. Concerning the balance sheet reduction, he said that the US central bank could begin the Quantitative Tightening (QT) once the Federal Funds Rates (FFR) hit 1% to 1.25%.
At 19:30 GMT, St. Louis Federal Reserve President James Bullard (voter 2022) would hit the wires.
Meanwhile, the US economic docket featured the US IHS Markit Manufacturing PMI which came at 55.5 higher than the 55.0 expected. Crossing the wires at press time, the ISM Manufacturing PMI for January came at 57.6, a tick higher than the 57.5 expected. Digging a little deeper on the ISM report, Manufacturing Prices crushed the expectations, rising to 76.1 from 68.1 estimated, while the ISM Manufacturing Employment increased to 54.1 from 53.9 in the previous month.
XAG/USD Price Forecast: Techincal outlook
The XAG/USD remains downward biased, despite the 1,30% jump in the day. The upward move fell short of the $23.00 figure, attributed to the release of US macroeconomic news. Nonetheless, the downward move was capped by a two-month-old upslope support trendline, drawn from December lows, around the $22.50-65 area.
In the event of extending the downtrend, the first support would be the aforementioned trendline, which once breached would expose the January 28, daily low at $22.15. A break below that level would expose the January 7 swing low at $21.94, followed by December 2021 swing low at $21.42.
Contrarily to the upside, XAG/USD first resistance is the 50-DMA at $22.88. If that level gives way for silver bulls, that could send prices towards the 100-DMA at $23.21, followed by the January 3 daily high at $23.40.
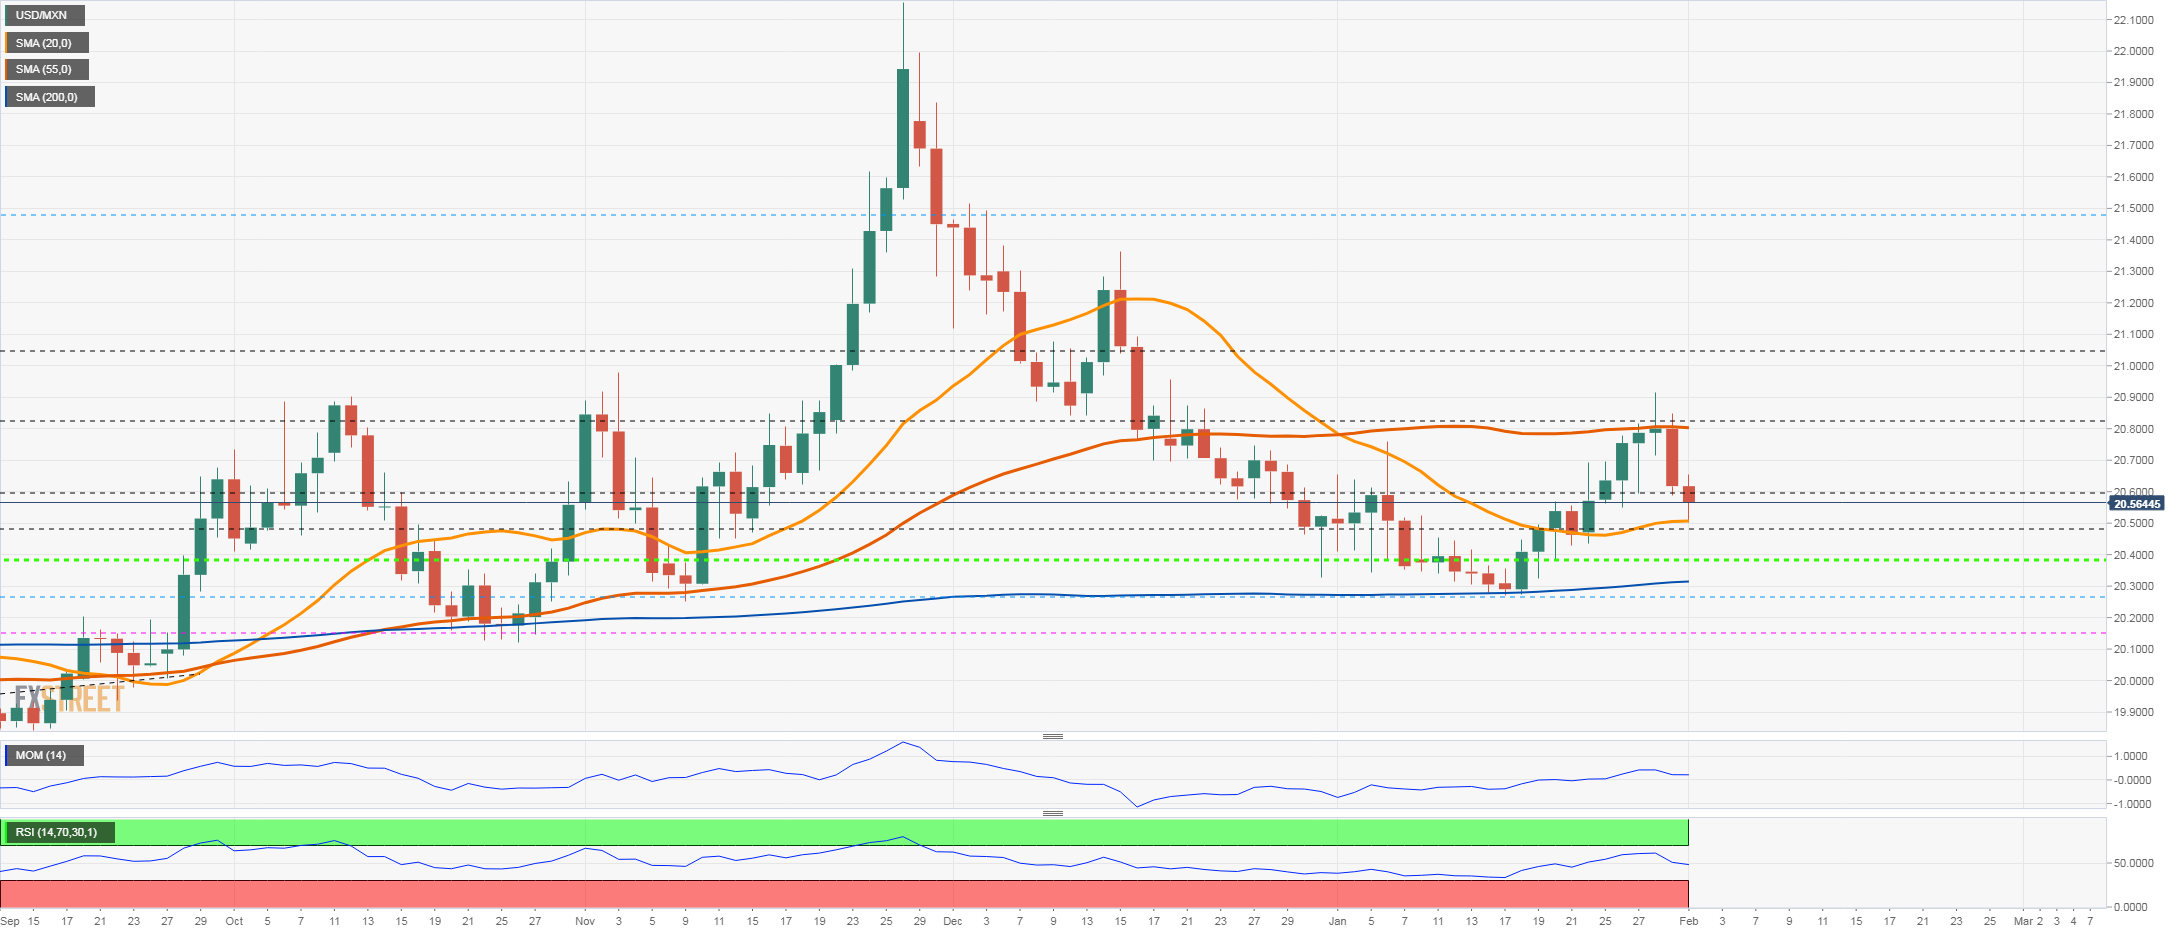
- Mexican peso adds to weekly gains versus the US dollar.
- The greenback continues to correct lower, gains strength after US data.
- Key support in USD/MXN seen at 20.50, resistance at 20.70.
The USD/MXN is falling on Tuesday for the second day in a row, although it moved off lows during the American session. The pair bottomed at 20.50, the lowest since January 24 and then bounced to 20.60 following US data.
Price action continues to be driven by the US dollar. The greenback is correcting lower across the board after last week’s rally. The move to the downside lost momentum following the ISM Manufacturing report as US yields rebounded sharply to the upside. On Friday, the NFP report is due.
Emerging market currencies trimmed gains during the last hours but remain in the positive ground taking into account the last five trading sessions, on the back of the recovery in risk appetite. The performance of the Mexican peso has been below average.
Short-term outlook
The area around 20.50 is a strong short-term support that also contains the 20-day simple moving average. A daily close below could clear the way to more losses, with the following support seen at 20.40 followed by 20.30.
On the upside, the key resistance is located at 20.70 which should limit the upside. If the dollar breaks higher, it could recover the positive bias in the short term. The next key level stands at 20.85.
USD/MXN daily chart
Economists at Rabobank maintain the forecast of a grind towards EUR/USD 1.10 by the middle of the year. But they highlight the risk of pullbacks for the greenback due to the prevalence of long positions and the potential pace of Fed rate hikes this year.
USD to be sensitive to any data disappointments
“While we are on the view that EUR/USD can meander to the 1.10 area by the middle of the year as Fed tightening kicks off, we remain of the view that pullbacks may be an inevitable part of the USD outlook in the coming months.”
“If the Fed tightens policy too quickly, the risk of a hard-landing increases. This would not bode well for the medium-term outlook for the USD as the market could again be focussed on policy accommodation from the Fed in the not too distant future.”
“While the current strength of the US economy is ensuring that recession is only considered to be a tail-risk by most commentators, the build-up of long USD positions in recent months suggests that the USD is set to be sensitive to any data disappointments.”
- There were 10.925M job openings in the US at the end of December, more than the 10.3M expected.
- The data strengthens the narrative that labour demand in the US is currently very strong.
The number of job openings on the last business day of December rose to 10.925 million, the US Bureau of Labor Statistics announced in its latest Job Openings and Labor Turnover Summary (JOLTS) on Tuesday. This reading came in above market expectations for a drop to 10.3 million from November's 10.775 million reading, which had been revised up from 10.562 million.
Market Reaction
The dollar seems to have seen a modestly positive reaction to the latest stronger than expected JOLTs data, with the DXY jumping from the 96.30s to the 96.40s. The data strengthens the narrative that labour demand in the US is currently very strong.
- ISM Manufacturing PMI fell to its weakest since November 2020 in January at 57.6.
- The Employment subindex hit its highest since last March.
According to a survey compiled by the Institute of Supply Management, US Manufacturing PMI fell to 57.6 in January from 58.7 in December. That was a little higher than the expected reading of 57.5, but nonetheless and marked the weakest reading since November 2020.
Subindices:
- Prices Paid rose to 76.1 from 68.2.
- New Orders fell to 57.9 from 61.0, its lowest since June 2020.
- Employment rose to 54.5 from 53.9, its highest since March 2021.
Market Reaction
FX markets did not seemingly react too much to the latest ISM figures.
- DXY remains well on the defensive in the low-96.00s.
- US yields remain largely range bound on Tuesday.
- Markit’s final Manufacturing PMI came at 55.5 in January.
Sellers remain well in control of the sentiment around the greenback and drag the US Dollar Index (DXY) to new 4-day lows in the 96.25/20 band.
US Dollar Index offered ahead of key data
The index extends the rejection from last week’s fresh cycle tops near 97.50, although the downside appears to have met some decent contention in the proximity of 96.20 on Tuesday.
In the US money markets, yields seem to be picking up some pace across the curve and manage to leave behind part of the recent pessimism. Indeed, the short end keep the upper bound of the range intact near 1.18%, while the belly flirt with the 1.80% yardstick.
In the US docket, the final Markit’s Manufacturing PMI came a tad better than estimates at 55.5 for the month of January, all ahead of the key ISM Manufacturing PMI to be released soon.
US Dollar Index relevant levels
Now, the index is losing 0.30% at 96.36 and a break above 97.44 (2022 high Jan.28) would open the door to 97.80 (high Jun.30 2020) and finally 98.00 (round level). On the flip side, the next down barrier emerges at 96.09 (55-day SMA) seconded by 95.41 (low Jan.20) and then 94.62 (2022 low Jan.14).
- EUR/USD keeps the trade in the upper end of the range.
- German 10y Bund yields return to the positive territory near 0.02%.
- US ISM Manufacturing PMI next of note in the US docket.
The single currency keeps the upbeat note intact so far in the session and motivates EUR/USD to navigate near recent peaks in the 1.1270/80 band on Tuesday.
EUR/USD now looks to US data
The persevering offered stance in the dollar continues to sustain the quite strong upside momentum in EUR/USD, which already trades in 4-day highs near 1.1280, an area coincident with the 10-day SMA.
The decline in the buck comes amidst another negative session in US yields vs. the mixed performance in the German money market, where yields of the key 10y Bund alternates gains with losses near 0.02%.
Furthermore, positive releases in the domestic docket also lend legs to the pair ahead of the key US ISM Manufacturing PMI and the final Markit’s Manufacturing PMI due later in the NA session.
EUR/USD levels to watch
So far, spot is gaining 0.32% at 1.1268 and faces the next up barrier at 1.1278 (weekly high Feb.1) seconded by 1.1304 (55-day SMA) and finally 1.1369 (high Jan.20). On the other hand, a break below 1.1121 (2022 low Jan.28) would target 1.1100 (round level) en route to 1.1000 (psychological level).
- Canada Manufacturing PMI fell slightly to 56.2 in January, remaining in robust territory.
- The loonie did not react to the broadly in line with expected data.
Canadian Manufacturing PMI fell to 56.2 in January, indicating continued robust growth in the manufacturing sector. That marked a slight drop from December's 56.5 reading and was a little below expectations for 56.9.
IHS Markit Economic Commentary:
- "Another robust improvement in operating conditions was recorded in Canada's manufacturing sector with the PMI at 56.2 at the start of the year. The headline figure reflected favourable demand conditions, rising employment levels and growth in inventories.
- "Additionally, price pressures showed further signs of easing, with rates of output and input price inflation moderating to ten- and 11-months lows, respectively.
- "That said, COVID-19 yet again hit performance with output growth slowing notably. Tighter restrictions, among other issues, led to weak input availability and poor transportation conditions.
- "Nevertheless, there is a further indication that restrictions will start to ease across the provinces in the months ahead. Fortunately, Canada boasts a high vaccination rate, which has allowed for growth to continue in the manufacturing sector despite a resurgence in cases.”
Market Reaction
The loonie does not appear to have reacted to the latest broadly in line with expected PMI results.
EUR/USD keeps advancing on Tuesday. The pair could keep advancing in the near-term, but the longer-term perspective favors the downside, in the view of economists at Scotiabank.
EUR/USD set to remain in a 1.12-1.14 range
“The EUR’s recovery from the low 1.11s on Friday now seems on track to test its 50-day MA of 1.1307 that stands as resistance alongside the figure zone; 1.1335/50 follows.”
“The relatively quick recovery of the 1.12 handle for the EUR over the past two sessions averts, for now, a move to 1.10 but the broader technical picture remains negative.
“EUR/USD looks set to remain in a 1.12-1.14 range.”
“Support is 1.1250 and 1.1225 ahead of the figure.”
Cable’s three-day positive streak has taken it to near a test of its 100-day moving average (DMA) of 1.3518. A break above here and a subsequent test of the 1.36 level is crucial to see further gains, economists at Scotiabank report.
Failure to break past the 1.35 figure zone to lead to a test of 1.3450
“Buying pressure on the drop under 1.34 has lifted the GBP but a break above the 100-DMA at 1.3518 and then a test of 1.36 will be key to judge whether the pound may reverse its broadly bearish trend since last summer.”
“A failure to break past the 1.35 figure zone could see the GBP head to a test of support at 1.3450 followed by the 1.34 area.”
“Resistance past the figure and the 100-day MA follows at the 1.3550/65 zone and then 1.36.”
- The British pound climbs in the North American session, 0.34%.
- The market sentiment is mixed as European stocks rise while US futures point towards a lower open.
- BoE’s 25 basis points rate hike is fully priced in by investors.
- The GBP/USD remains downward biased, as it failed to breach above the 100-DMA.
After ending January with losses of 0.65%, the British pound snaps three-day losses, climbing 0.31%. At the time of writing, the GBP/USD is trading at 1.3495, though retreating from the 100-day moving average (DMA) lying at 1.3514. As depicted by European stock indices rising, the market sentiment is mixed, but US equity futures underpins the cash market towards a lower open.
Bank of England (BoE) expected to post back-to-back rate hikes
In the meantime, money market futures, as shown per the CME Group BOEWATCH tool, 100% of market participants expect an increase of 25 basis points, from 0.25% to 0.50%. Sources cited by CNBC said that “With the Bank Rate reaching 0.5%, we expect the MPC to confirm that all APF (asset purchase facility) reinvestments will cease following the February decision.”
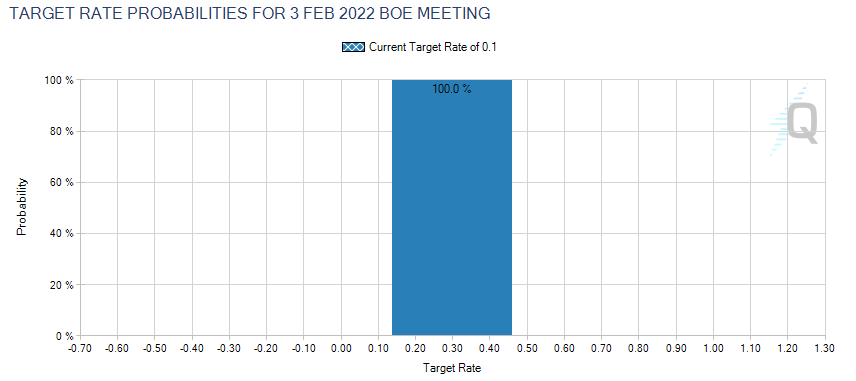
Source: CME Group
Meanwhile, the Philadelphia Fed President Harker crossed the wires. He commented that the Fed is not behind the curve, and he expects a rate hike of 25 basis points, four in the year. Concerning the balance sheet reduction, he said that the US central bank could begin the Quantitative Tightening (QT) once the Federal Funds Rates (FFR) hit 1% to 1.25%.
The UK economic docket featured the BoE Consumer Credit, Mortgage Approvals for December. The former came at £0.8B in line with expectations, while the latter rose to 71.051K, higher than the 66K foreseen. Concerning the Market Manufacturing PMI Final for January, increased to 57.3, a tick more elevated than the 56.9 estimated, though trailed the previous month 57.9, showing some slowing, due to the Omicron hit.
Across the pond, Manufacturing PMI released by IHS Markit and the ISM for January will be closely watched by GBP/USD traders. That alongside the JOLTs Job Opening for December could shed some light, in anticipation of Thursday’s Jobless Claims and Friday’s Nonfarm Payrolls report.
GBP/USD Price Forecast: Technical outlook
The GBP/USD is downward biased. During the European session, the pair retreated at the 100-day moving average (DMA) at 1.3514, but any downward moves might be capped by the 50-DMA lying at 1.3418.
To the upside, the GBP/USD will face resistance at 1.3500, followed by the 100-DMA at 1.3514 and an eight-month-old downslope trendline around the 1.3530-40 region. On the flip side, the 50-DMA at 1.3418 is the first support level, followed by the 1.3400 figure, and then the YTD low at 1.3357.
The loonie recovers ground after strong close Monday sets up a test of the 1.2650 mark, economists at Scotiabank report.
Resistance intraday now seen around 1.2700/15
“The low close on the day for the USD/CAD Monday formed a bearish ‘engulfing line’ on the daily chart; additional losses today will ‘confirm’ the reversal and put a little more pressure on the mid-1.26 support zone.”
“We expect resistance intraday now around 1.2700/15.”
“A break under 1.2650 targets 1.2570.”
- NZD/USD pushed above 0.6600 on Tuesday as the kiwi outperformed in wake of strong NZ trade data and USD weakness.
- Upcoming US data and Fed speak is in focus ahead of key Q4 NZ labour market metrics.
Decent trade figures, which saw New Zealand’s monthly trade deficit post a significantly larger than expected decline in December to under N$ 500M (versus forecasts for N$ 700M) from previously above N$ 1B, are helping NZD to outperform on Tuesday. Up around 0.6% on the day versus the struggling US dollar, the kiwi is one of the best performing G10 currencies alongside NOK and CHF, enough to catapult NZD/USD back above the 0.6600 level.
The dollar, meanwhile, is suffering from a combination of factors including better risk appetite, profit-taking following last week’s surge and a modest paring back on hawkish Fed bets. Fed speakers this week have so far all backed rate hike in March and while none have ruled out a 50bps move, all said a 25bps hike was their base case. Meanwhile, Fed policymakers have been cautious in their remarks about further tightening later in the year. Most expressed a desire to keep their options open to accelerate or decelerate the pace of tightening dependent on economic conditions.
NZD/USD traders did not seem particularly fussed by Fed policymaker Patrick Harker’s latest remarks, which broadly fit into the above categorization. Focus now shifts to US data in the form of the January ISM Manufacturing survey out at 1500GMT ahead of more Fed speak in the form of remarks from St Louis Fed President James Bullard at 1930GMT. Then, at the start of Wednesday Asia Pacific trade at 2145GMT, Q4 2021 New Zealand Employment Change, Unemployment Rate and Labour Cost Index figures will be released. Strong figures could fuel NZD strength if RBNZ tightening bets get a boost. One local NZ bank recently predicted the RBNZ hiking rates to 2.5% by November.
US ISM Manufacturing PMI overview
The Institute of Supply Management (ISM) will release its latest manufacturing business survey result, also known as the ISM Manufacturing PMI at 15:00 GMT this Tuesday. The index is anticipated to decline further from 58.7 in the previous month to 57.5 in January – marking the third successive month of fall. Nevertheless, the gauge will provide a fresh insight into the manufacturing sector activity and the performance of the economy as a whole.
As Joseph Trevisani, Senior Analyst at FXStreet, explains: “Manufacturing sentiment depends on incoming orders. Though the new business index is expected to rise, its precursors and the entire US holiday season were poor. General demand is still expected to be high after 18 months of varying degrees of denial or scarcity but soaring inflation, 7% in December, may be cutting into family budgets and draining consumption.”
How could it affect EUR/USD?
Ahead of the key release, the US dollar was weighed down by the ongoing retracement slide in the US Treasury bond yields. A weaker than expected reading would be enough to exert additional pressure on the buck and assist the EUR/USD pair to build on its recent recovery move from the lowest level since June 2020.
That said, the prospects for a faster policy tightening by the Fed should act as a tailwind for the buck and cap gains for the major. A stronger print will reaffirm hawkish Fed expectations and attract fresh buying around the greenback. The immediate market reaction, however, is likely to remain limited as investors might refrain from placing aggressive bets ahead of the European Central Bank meeting on Thursday.
Key Notes
• ISM Manufacturing PMI January Preview: Fed policy counts on a continuing US expansion
• EUR/USD Outlook: 1.1300 could cap the corrective bounce ahead of ECB on Thursday
• EUR/USD Price Analysis: Immediately to the upside comes 1.1300
About the US ISM manufacturing PMI
The Institute for Supply Management (ISM) Manufacturing Index shows business conditions in the US manufacturing sector. It is a significant indicator of the overall economic condition in the US. A result above 50 is seen as positive (or bullish) for the USD, whereas a result below 50 is seen as negative (or bearish).
- USD/CAD attracted some dip-buying near the 1.2655 area, though lacked follow-through.
- A softer tone around oil prices undermined the loonie and extended support to the major.
- Upbeat Canadian GDP print, the prevalent USD selling bias kept a lid on any further gains.
The USD/CAD pair managed to recover a major part of its intraday losses and climbed back to the 1.2700 mark during the early North American session.
The pair attracted some dip-buying near the 1.2655 area on Tuesday and for now, seems to have stalled its recent pullback from the vicinity of the 1.2800 round-figure mark. A softer tone around crude oil prices undermined the commodity-linked loonie, which, in turn, was seen as a key factor that acted as a tailwind for the USD/CAD pair.
This, to a larger extent, was offset by an upbeat Canadian GDP print, which showed that the economy expanded by 0.6% MoM in November. This marked a slight deceleration from the 0.8% growth recorded in October, though was better than consensus estimates pointing to a reading of 0.3% and extended some support to the Canadian dollar.
On the other hand, a further pullback in the US Treasury bond yields dragged the US dollar away from the 18-month high touched in the aftermath of a more hawkish FOMC last week. The prevalent USD selling bias held back traders from placing fresh bullish bets around the USD/CAD pair and kept a lid on any meaningful upside.
Moving ahead, traders now look forward to the release of the US economic docket, featuring the release of the ISM Manufacturing PMI. This, along with the US bond yields, should influence the USD. Apart from this, traders will take cues from oil price dynamics to grab some short-term opportunities around the USD/CAD pair.
Technical levels to watch
Federal Reserve Bank of Philadelphia President Patrick Harker said on Tuesday that he supports a 25bps rate hike in March and that while the Fed could do a 50bps rate increase, he is a little less convinced of that right now.
Additional Remarks:
"Central banks can influence demand through monetary policy."
"The Fed is not behind the curve but needs to move now to try to control inflation."
"The Fed will stop tapering in March."
"The Fed needs to see how the data turns out in the coming weeks."
"The economy is at maximum employment so it's about inflation."
"25bps rate hikes are appropriate this year, but there's a lot of risk."
"Persistent inflation would continue to worry him."
"If inflation stays where it is and starts to come down he doesn't see a 50bps increase."
"If there was a spike in inflation, the Fed may need to move more aggressively."
"We're probably going to have a bad jobs report at the end of this week because of Omicron."
"Monetary policy does not affect supply constraints."
"The Fed is there on dual mandate with regards to inflation and with regards to employment and needs to act."
"Has to reassert that the fed funds rate is the primary tool for monetary policy."
"Balance sheet reduction will be faster and steeper than the last time the Fed did it."
"Balance sheet normalization should be like watching paint dry."
"The Fed is actively looking at whether it will need to sell assets but no decisions have been made."
"I am committed to making sure the Fed starts reducing the balance sheet this year."
Market Reaction
The dollar was little moved in reaction to the latest remarks from Fed's Harker, who indicated as other Fed members have that the central bank will take a data-dependent approach when deciding upon the speed of monetary stimulus withdrawal.
- Canada GDP expanded at 0.6% MoM in November, above expected.
- Q4 annualised GDP growth likely clocked 6.3%, said StatsCan.
Canada's Real Gross Domestic Product (GDP) expanded at a monthly rate of 0.6% in November, data published by Statistics Canada showed on Tuesday. This reading was well above the consensus market forecast for a growth rate of 0.3% MoM and marked a slight deceleration in the 0.8% MoM growth rate seen in October. Statistics Canada said that GDP was most likely unchanged in December on a MoM basis, implying that Q4 GDP growth likely stood at 6.3% annualised.
Market Reaction
The loonie did not see much of a reaction to the latest strong GDP figures.
- EUR/GBP has stabilised in the 0.8350 area, with traders clearly tentative and constrained in the run-up to “Super Thursday”.
- Upside Eurozone inflation surprises this week raise the risk of a more hawkish ECB, some analysts said.
- But EUR/GBP upside risks are limited by expectations for BoE policy tightening, with ING still targetting a drop below 0.8300.
EUR/GBP has stabilised in the 0.8350 area, with traders clearly tentative and constrained in the run-up to “Super Thursday” when the ECB and BoE will both be announcing monetary policy decisions. The final Eurozone manufacturing PMI survey for January was weaker than expected, but any negative impact on the euro that might have been was canceled out by better-than-expected Eurozone jobless figures, with the unemployment rate dropping to 7.0% in December. That is a new record low for the Eurozone.
Labour market strength is good news for the ECB, but ahead of Thursday’s rate decision, the central bank is also having to digest negative news on the inflation front. Flash data released on Monday revealed that Spanish and German HICP inflation dropped less than expected in January and data on Tuesday revealed the same for France. Attention now turns to the flash Eurozone aggregative HICP inflation reading out on Wednesday for confirmation that inflationary pressures, though lower in January, didn’t drop back as much as hoped.
“If the eurozone inflation data also surprises on the upside tomorrow the market might bet on a more hawkish ECB,” analysts at Commerzbank said on Monday, adding that this could offer the euro some support. But EUR/GBP’s upside risks as a result of potential ECB hawkishness are limited by expectations that the BoE will continue its hiking cycling with another 25bps move. Indeed, with UK interest rates set to hit 0.50%, the BoE is also expected to announce quantitative tightening plans. “While we do not expect the BoE to start QT (Quantitative Tightening) this week, it may signal when it could begin – probably May, in our view," said analysts at Berenberg.
ING thinks that the rebound in EUR/GBP that saw it jump from just above 0.8300 on Monday to current levels around 0.8350 should have “short legs”. “The prospect of BoE hiking on Thursday should keep the appetite for the pound quite elevated, the bank continued, adding that “we keep targeting a move below 0.8300 in the near term”.
- USD/CHF witnessed heavy selling on Tuesday and moved away from an over two-month high.
- The ongoing slide in the US bond yields weighed on the USD and exerted downward pressure.
- Geopolitical tensions benefitted the safe-haven CHF and further contributed to the selling bias.
The USD/CHF pair dived to a four-day low heading into the North American session, with bears awaiting sustained break below the 0.9200 round-figure mark.
The pair extended the previous day's sharp retracement slide from the 0.9340 area, or the highest level since November 26 and witnessed heavy follow-through selling on Tuesday. This also marked the third successive day of a negative move for the USD/CHF pair and was sponsored by a broad-based US dollar weakness.
A further decline in the US Treasury bond yields dragged the USD further away from the highest level since July 2020, touched in reaction to a more hawkish FOMC last week. Apart from this, the conflict between Russia and the West over Ukraine benefitted the safe-haven Swiss franc and contributed to the USD/CHF pair's slide.
With Tuesday's steep fall, the pair has now retreated over 150 pips from the overnight swing high. Some follow-through selling below the 0.9200 mark will be seen as a fresh trigger for bearish traders and suggest that the recent bounce from the 0.9100 neighbourhood has run out of steam, setting the stage for additional losses.
That said, the prospects for a faster policy tightening by the Fed should help limit any deeper losses for the greenback, warranting caution for bearish traders. Investors have been speculating a more aggressive policy response by the Fed to contain stubbornly high inflation and expect that the first hike in March could be 50 bps.
Market participants now look forward to the US economic docket, highlighting the release of the ISM Manufacturing PMI. This, along with the US bond yields, should influence the USD and provide some impetus to the USD/CHF pair. Traders will further take cues from the broader market risk sentiment to grab some short-term opportunities.
Technical levels to watch
- Spot gold has rallied above $1800 and on towards $1810, clearing the 200DMA on its way.
- The precious metal has been boosted by a weakening US dollar and a pullback in US yields.
- But XAU/USD faces risks in the form of US jobs data later this week which could reignite hawkish Fed bets.
Spot gold (XAU/USD) prices breached resistance in the form of the psychologically important $1800 level during Tuesday Asia Pacific trade and have since continued to ebb higher towards the $1810 level. In doing so, spot prices have crossed marginally above the 200-day moving average at $1805.78 and, at current levels around $1807, trade around 0.6% higher on the day. Market commentators have attributed a continued pullback in the US dollar and US bond yields as benefitting the precious metal.
For reference, the DXY is down another 0.4% on Tuesday to trade in the low-96.00s, taking its losses since last Friday’s peaks near 97.50 to nearly 1.2%. US 10-year nominal yields, meanwhile, are down about 4bps on the day to back under 1.75%, around 15bps below January’s highs around 1.90%. Meanwhile, the 10-year TIPS (real) yield is down closer to 6bps and back below -0.70%, now roughly 20bps below January’s near-0.50% highs. A weaker US dollar makes USD-denominated gold cheaper for holders of international currency, while lower yields reduce the opportunity cost of holding non-yielding precious metals.
Some analysts also cited strong ETF demand as helping drive gold’s strong recent gains, which has seen the precious metal bounce roughly 1.5% from last Friday’s near-$1780 lows. Holdings of the world’s largest gold ETF, the SPDR Gold Trust, rose to their highest levels since mid-August on Monday, analysts at Reuters noted. Other analysts said Monday’s chorus of Fed speak has also offered some support for the precious metal. Policymakers stuck to the script in backing near-term tightening and endorsing a March hike, but didn’t seem to hint at a 50bps move next month and were cautious to comment on the longer-term outlook for policy.
Risks Incoming
While it's been a good start to the week for gold, the precious metal continues to face downside risks in the form of US data later this week. Primarily, if Friday’s labour market report shows signs of a further build-up of wage pressures at the start of 2022 and a further tightening of labour market conditions, markets might start betting on a 50bps hike in March again. This could send XAU/USD back towards last week’s $1780 lows. Ahead of Friday, gold traders will also be watching the January ISM surveys, with the Manufacturing report due later this Tuesday.
- EUR/USD pushes higher and retests the 1.1280 area.
- The 55-day SMA around 1.1300 emerges as the next hurdle.
EUR/USD is up for the third session in a row and approaches the key barrier at the 1.1300 region on Tuesday.
The ongoing strength is deemed as corrective only. However, further recovery could attempt a test of the round level at 1.1300, where the 55-day SMA also converges. Above the latter is located the 4-month resistance line near 1.1320, above which the selling pressure is expected to lose some traction.
In the longer run, the negative outlook is seen unchanged below the key 200-day SMA at 1.1687.
EUR/USD daily chart
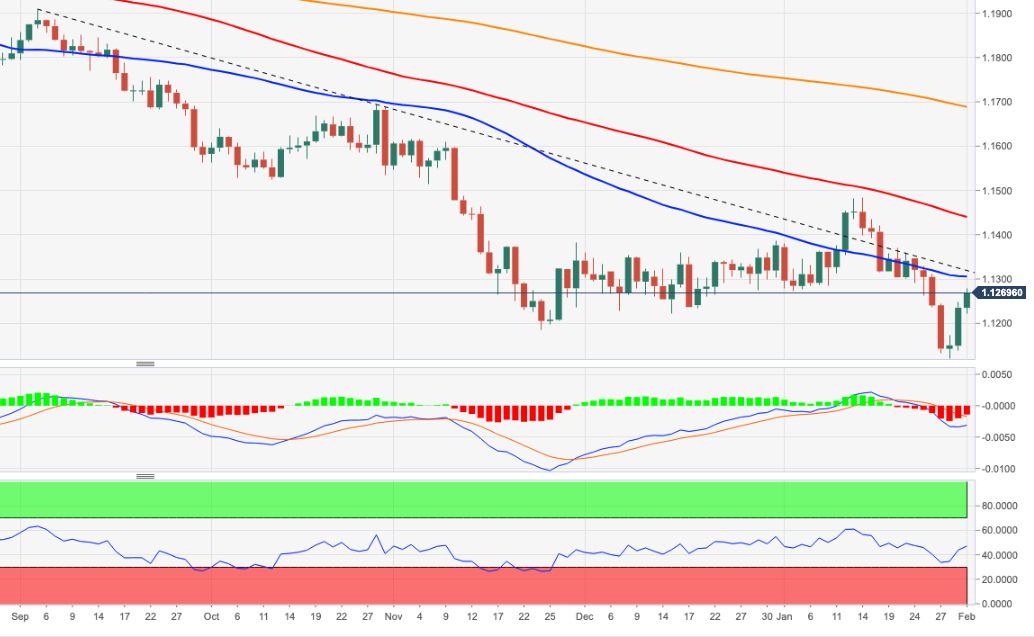
- DXY extends the corrective downside to 96.20.
- Next on the downside emerges the 96.00 zone.
DXY drops for the second session in a row and revisits the low-96.00s on Tuesday.
While the downside is deemed as corrective only, it carries the potential to retest the 96.00 neighbourhood, where the 55-day SMA sits (96.09), ahead of the January 20 low at 95.41.
In the near term, the upside pressure remains intact while above the 4-month line just below 95.00. Looking at the broader picture, the longer-term positive stance in the dollar remains unchanged above the 200-day SMA at 93.40.
DXY daily chart
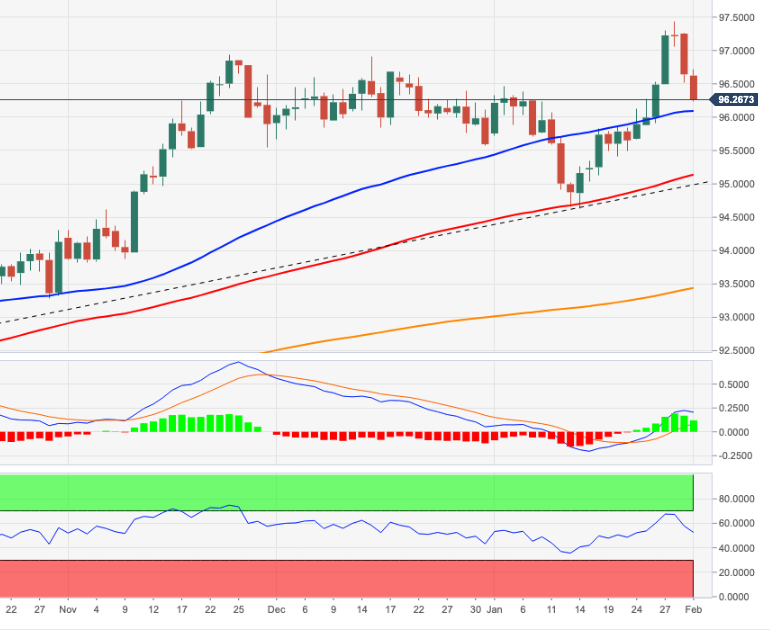
- USD/JPY witnessed heavy selling on Tuesday and drifted lower for the third successive day.
- Retreating US bond yields kept the USD bulls on the defensive and exerted some pressure.
- Investors now look forward to the US ISM Manufacturing PMI for a fresh trading impetus.
The USD/JPY pair continued losing ground through the mid-European session and dropped to a three-day low, around the 114.60 region in the last hour.
The ongoing retracement slide in the US Treasury bond yields dragged the US dollar further away from the highest level since July 2020 touched in the aftermath of a more hawkish FOMC last week. This, in turn, was seen as a key factor that exerted downward pressure on the USD/JPY pair for the third successive day on Tuesday.
Bearish traders further took cues from a weaker tone around the US equity futures, which tends to benefit the safe-haven Japanese yen. The downward momentum took along some short-term trading stops near the key 115.00 psychological mark. Hence, the fall could also be attributed to some technical selling below the said handle.
The USD/JPY pair has now retreated over 100 pips from the 115.70 area, or a near three-week high set on Friday and erased around 50% of last week's strong recovery move from a one-month low. Some follow-through selling will be seen as a fresh trigger for bearish traders and set the stage for a further near-term depreciating move.
That said, growing market acceptance that the Fed will tighten its monetary policy at a faster pace than anticipated should act as a tailwind for the buck and limit losses for the USD/JPY pair. In fact, the money markets have fully priced in an eventual Fed liftoff in March and expect five quarter-point rate hikes by the end of 2022.
Market participants now look forward to the release of the US ISM Manufacturing PMI. This, along with the US bond yields, might influence the USD price dynamics and provide some impetus to the USD/JPY pair. Traders will further take cues from the broader market risk sentiment to grab some short-term opportunities.
Technical levels to watch
- EUR/JPY’s advance ran out of legs in the mid-129.00s on Tuesday.
- Next on the upside comes the 200-day SMA near 130.50.
EUR/JPY gives away some gains following Monday’s sharp improvement.
In light of the recent price action, further recovery in the cross could be in the pipeline. Against this, there is an interim hurdle at the 100-day SMA at 129.87, just ahead of 130.08 (high January 20). The surpass of this area should put a move to the 200-day SMA, today at 130.46, back on the radar.
While below the 200-day SMA, the outlook for the cross is expected to remain negative.
EUR/JPY daily chart
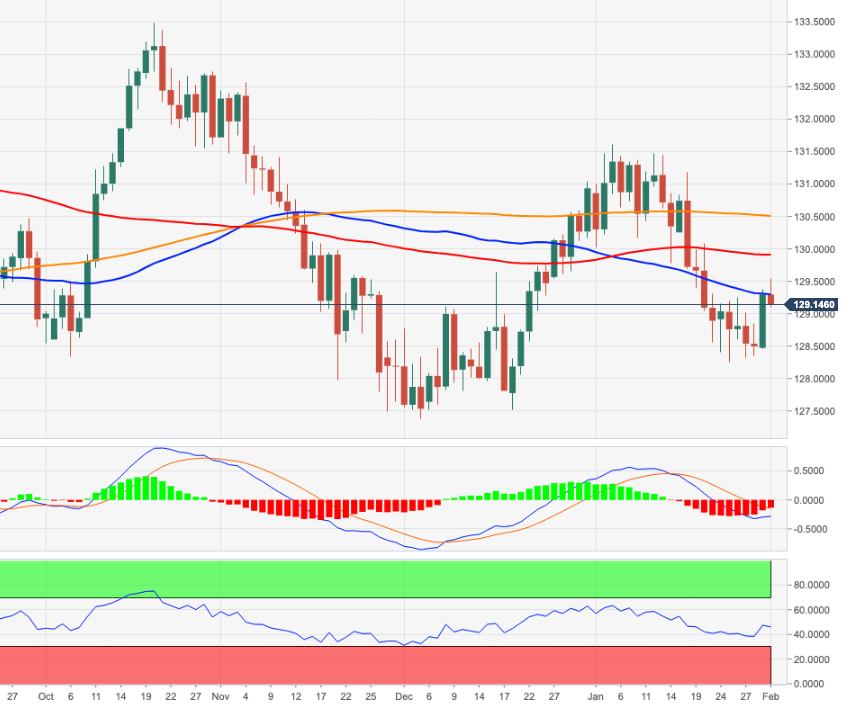
The downtrend in EUR/CHF continues to lose momentum. In the view of economists at Credit Suisse, the trend may be in the process of turning with next resistance seen at 1.0443/51.
Risk to turn lower again on a break below 1.0362/58
“Resistance is seen at 1.0443/51, with this expected to prove tougher mid-range resistance. Above can clear the way for strength back to the 1.0514 January high, but only a sustained move above here would be seen to mark a more important base, with resistance then seen next at 1.0545/52.”
“Support is seen at 1.0376 initially. Below 1.0362/58 can see the risk turn lower again with support seen next at 1.0300 ahead 1.0280 and then medium-term support at the 2015 corrective low and 50% retracement of the recovery from the peg removal spike low at 1.0254/35, which remains our core objective.”
- GBP/USD gained traction for the third successive day on Tuesday and shot to a multi-day high.
- Sustained move beyond the 200-hour SMA/1.3500 mark might have set the stage for further gains.
- Only a convincing break below the 1.3400 round figure will negate the intraday positive outlook.
The GBP/USD pair shot to a four-day high during the first half of the European session, with bulls now looking to build on the momentum beyond the 1.3500 psychological mark.
Following a brief consolidation earlier this Tuesday, the GBP/USD pair gained traction for the third straight day and built on its recent bounce from a one-month low, around the 1.3360-1.3355 area. The uptick was sponsored by the ongoing US dollar retracement slide and expectations that the Bank of England will hike interest rates at its upcoming meeting on Thursday.
From a technical perspective, sustained breakthrough the 23.6% Fibonacci retracement level of the 1.3749-1.3358 downfall was seen as a fresh trigger for intraday bullish traders. Some follow-through buying beyond the 200-day SMA might have already set the stage for additional gains. The outlook is reinforced by positive oscillators on hourly/daily charts.
That said, RSI (14) on the 1-hour chart has just started moving into the overbought territory and warrants some caution before positioning for any further appreciating move. This, in turn, suggests that the ongoing move up is likely to pause near the 38.2% Fibo. level, which is closely followed by resistance near the 1.3520-1.3525 supply zone.
On the flip side, any meaningful pullback now seems to find decent support near the 23.6% Fibo. level, around mid-1.3400s. This is followed by 100-hour SMA, around the 1.3430 region, which if broken would make the GBP/USD pair vulnerable to break below the 1.3400 mark. The downfall could get extended towards last week's swing low, around the 1.3355 area.
GBP/USD 1-hour chart
-637793087059874314.png)
Levels to watch
- EUR/USD remains bid and targets the 1.1300 mark.
- Germany Unemployment Rate ticked lower to 5.1% in January.
- US ISM Manufacturing PMI next of relevance in the NA session.
The optimism around the European currency remains well and sound and EUR/USD clinches new peaks near 1.1270 on turnaround Tuesday.
EUR/USD remains bid on risk appetite, focuses on data
EUR/USD advances for the third session in a row and gradually approaches the key 1.1300 neighbourhood bolstered by the re-emergence of quite firm appetite for riskier assets and the continuation of the downside in the greenback.
Collaborating with the offered stance in the dollar, US yields remain on the defensive, while yields of the German 10y Bund now recede some ground after Monday’s tops past 0.03%.
Further weakness in the buck came after FOMC’s R.Bostic suggested on Monday that a Fed’s 50 bps interest rate hike should be out of the table in March.
In the domestic docket, the German and EMU final Manufacturing PMIs came in a tad softer than the preliminary readings at 59.8 and 58.7, respectively, for the month of January. Still in Germany, encouraging figures from the labour market saw the jobless rate retreating to 5.1% in January, with 2.345M persons unemployed, and the Unemployment Change shrinking by 48K people. Earlier in the session, Retail Sales contracted 5.5% MoM in December and came in flat vs. December 2020.
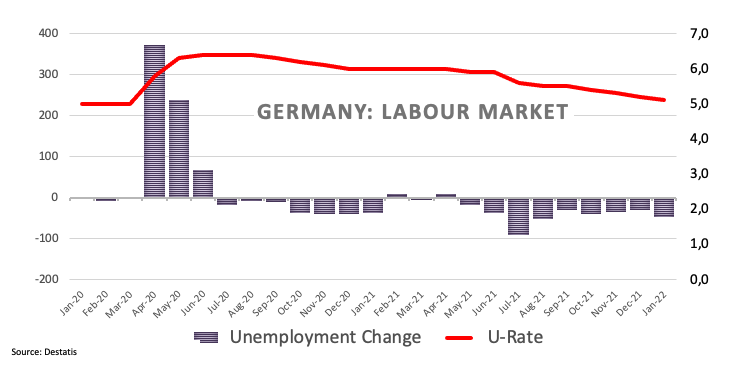
Later in the US data sphere, the ISM Manufacturing PMI will grab all the attention followed by the final January Manufacturing PMI tracked by Markit.
What to look for around EUR
EUR/USD extended the bounce off 1.1120 (January 28) and now re-targets the 1.1300 barrier amidst improved risk appetite trends and the renewed selling mood in the dollar. Moving forward, the outlook for the pair remains far from rosy despite the rebound, particularly in light of the Fed’s imminent start of the tightening cycle vs. the accommodative-for-longer stance in the ECB, despite the high inflation in the euro area is not giving any things of cooling down for the time being. On another front, the unabated advance of the coronavirus pandemic remains as the exclusive factor to look at when it comes to economic growth prospects and investors’ morale in the region.
Key events in the euro area this week: Germany Retail Sales/Unemployment Rate/Unemployment Change/Final January Manufacturing PMI, EMU Unemployment Rate/Final January Manufacturing PMI (Tuesday) – EMU Flash January CPI (Wednesday) – EMU, Germany Final January Services PMI, ECB Meeting (Thursday) – EMU Retail Sales (Friday).
Eminent issues on the back boiler: Asymmetric economic recovery post-pandemic in the euro area. ECB stance/potential reaction to the persistent elevated inflation in the region. ECB tapering speculation/rate path. Italy elects President of the Republic in late January. Presidential elections in France in April. Geopolitical concerns from the Russia-Ukraine conflict.
EUR/USD levels to watch
So far, spot is gaining 0.22% at 1.1257 and faces the next up barrier at 1.1269 (weekly high Feb.1) seconded by 1.1304 (55-day SMA) and finally 1.1369 (high Jan.20). On the other hand, a break below 1.1121 (2022 low Jan.28) would target 1.1100 (round level) en route to 1.1000 (psychological level).
- AUD/USD attracted some dip-buying near the post-RBA swing low, around the 0.7030 area.
- The ongoing USD retracement slide from the 18-month low extended support to the major.
- The Fed’s hawkish stance, a softer risk tone helped limit the USD losses and capped the pair.
The USD selling picked up pace during the early part of the European session and pushed the AUD/USD pair to the 0.7100 neighbourhood, or a three-day high in the last hour.
The pair quickly reversed its intraday slide to the 0.7030 area and moved into the positive territory for the second successive day on Tuesday. The Reserve Bank of Australia (RBA) pushed back against market bets and indicated that it would be patient in terms of raising interest rates despite soaring inflation. This comes on the back of a larger than expected fall in Australian Retail Sales and exerted some pressure around the AUD/USD pair.
On the other hand, the US dollar added to the overnight heavy losses and moved further away from the 18-month high amid a fresh leg down in the US Treasury bond yields. This, in turn, assisted the AUD/USD pair to attract some dip-buying on Tuesday, though the uptick lacked bullish conviction. Expectations that the Fed will tighten its monetary policy at a faster pace than anticipated should help limit any meaningful slide for the greenback.
It is worth recalling that the markets seem convinced about an eventual Fed liftoff in March and have been pricing in the possibility of five quarter-point rate hikes by the end of 2022. Apart from this, a generally weaker tone around the equity markets extended some support to the safe-haven buck and kept a lid on any meaningful upside for the perceived riskier aussie. This warrants some caution for bullish traders and positioning for any further gains.
Nevertheless, the AUD/USD pair, so far, has struggled to make it through the 0.7090-0.7100 strong support breakpoint, now turned resistance. Market participants now look forward to the US economic docket, highlighting the release of ISM Manufacturing PMI. This, along with the US bond yields, will influence the USD and provide some impetus to the AUD/USD pair. Traders will further take cues from the broader market risk sentiment to grab some short-term opportunities.
Technical levels to watch
USD/RUB has pulled back after facing resistance near 80.40. But analysts at Société Générale expect the pair to test the November 2020 high of 80.95 if the 75.50 support holds.
75.50 should be near-term support
“A multi-month ascending trend line near 75.50 should be near-term support.”
“Defending 75.50 can take the pair to November 2020 high of 80.95.”
EUR/CAD remains range-bound above the mid/upper 1.41 zone that has held since late last year. Economists at Scotiabank note that the undertone remains weak.
EUR/CAD needs to make a bit more downside progress sooner rather than later
“The EUR’s inability to recover much – or any – real ground plus the bearish alignment of the DMI oscillators on the daily, weekly and monthly studies maintains our focus on the downside risks facing the cross.”
“The cross could drop to the 1.38-1.40 range in the next few months.”
“We see resistance at 1.4435 (bear channel support-turned-resistance) and (stronger at) 1.4615.”
“Choppy trading in the past three weeks rather suggests that, despite our generally bearish leanings here, the cross needs to make a bit more downside progress sooner rather than later, otherwise the risk of some back-tracking of the Dec slide in the cross will rise.”
USD/CAD defended the trend line since May 2021 and projections at 1.2460 resulting in a bounce. Economists at Société Générale expect the pair to continue its grind higher towards the 1.2950/1.3020 region.
Only removal of support at 1.2460 would be a risk for a deeper down move
“Daily MACD is attempting an entry within positive territory which points towards continuation in rebound.”
“The pair is likely to head towards the graphical levels of 1.2950/1.3020 representing the low of December 2019, January 2020 and high of December 2020, August 2021, December 2021. This is a crucial resistance.”
“Only if the support at 1.2460 gets violated, there would be a risk of a deeper down move.”
Monday’s EUR/GBP strength is not related to political turmoil in the UK, in the view of economists at ING. They still expect the pair to slide below the 0.8300 as the Bank of England is seen hiking rates on Thursday.
Political storm remains a non-factor
“Political risk has been (and should continue to be) a non-factor for the currency market.”
“The rebound in EUR/GBP should have short legs, as the prospect of BoE hiking on Thursday should keep the appetite for the pound quite elevated.”
“We keep targeting a move below 0.8300 in the near-term.”
EUR/USD advances for third day on tighter UST/Bund spread. Economists at Société Générale expect the world’s most popular currency pair to head towards the 1.13 level.
EUR/USD forms a morning star
“The price action dovetails neatly with the narrowing UST/Bund spreads and swaps, led by the belly or 5y portion of the curve.”
“The morning star candlestick pattern in EUR/USD is bullish and points to a possible extension to 1.13.”
The USD failed to hold on to last week's gains. But with markets aggressively speculating on the size and pace of Fed tightening, the dollar may start stabilising today.
Room for USD stabilisation
“Despite increasing speculation around five Fed hikes in 2022, the dollar did not manage to hold on to last week’s gains, with a rebound in global equities offering a chance for profit-taking after an extended USD rally. We struggle to see this as more than just a position-squaring event, as the ambiguity about the pace and size of the tightening cycle after last week’s FOMC is offering very few obstacles to (USD positive) hawkish speculation on Fed policy.”
“We think the dollar may already start stabilising today, even if another good day for risk assets may keep pro-cyclical currencies supported – which incidentally took the biggest hit last week”.
“DXY could consolidate in the middle of the 96.00/97.00 range, although risks remain tilted to the upside.”
The USD/INR rebound has petered out after falling short of the graphical levels of 75.50. Economists at Société Générale note that the pair is at risk of suffering further losses on a dip below 73.80.
Reclaiming 75.50 is crucial for negating head and shoulders pattern
“USD/INR is drifting towards the 200-DMA near 74.30. Interestingly, the pair is evolving within the right shoulder of a possible Head and Shoulders; a pattern that points towards short-term downside.”
“Multi-month ascending trend line and the neckline at 73.80 is a crucial support. In case this breaks, USD/INR could unfold an extended pullback.”
“Reclaiming 75.50 will be crucial for negating this formation.”
EUR/USD gained more than a cent since Friday’s new lows in the 1.1120 region. 1.1200 could be a floor into the European Central Bank (ECB) meeting on Thursday, in the view of economists at ING.
Higher yields in the eurzone may continue to offer a floor to the euro
“Higher yields in the region may continue to offer a floor to the euro heading into the ECB meeting on Thursday. That, however, also raises the bar for a hawkish surprise (and the downside risks for the euro) ahead of the announcement; we continue to see a high probability that President Lagarde will stir well away from signalling a rate hike in 2022.”
“EUR/USD may enjoy a solid floor around 1.1200 before Thursday, even if the dollar starts recovering.”
- DXY keeps correcting lower following cycle tops near 97.50.
- US yields remain side-lined below recent highs on Tuesday.
- Markets’ attention remains on the ISM Manufacturing.
The greenback, in terms of the US Dollar Index (DXY), extends the bearish move further south of the 97.00 mark on Tuesday.
US Dollar Index looks to risk trends, data
The index loses ground for the second session in a row so far on Tuesday on the back of the persistent improvement in the risk complex and further bear flattening of the US yield curve.
Indeed, the dollar came under pressure following last week’s fresh tops near 97.50, levels last traded in June 2020, as market participants continue to digest the hawkish message at the last FOMC event and recalibrate the potential Fed’s interest rate path and timing of the start of the balance runoff.
Comments from Atlanta Fed R.Bostic (2024 voter, dovish) also weighed on the buck on Monday after he practically ruled out a 50 bps rate hike in March. San Francisco Fed M.Daly (2024 voter, centrist) seemed to reinforce that view after she warned against tightening the policy too fast. Surprisingly, KC Fed E.George (voter, hawkish) advocated for a more aggressive action regarding the balance sheet, instead of focusing exclusively on the interest rate path.
In the US calendar, the always relevant ISM Manufacturing PMI is due later in the NA session seconded by Markit’s final Manufacturing PMI for the month of January.
What to look for around USD
The dollar’s corrective move remains well in place following recent 2022 peaks (January 28), always amidst the improved mood in the risk-associated universe and muted US yields. The sharp advance in the index in past sessions followed expectations that the Federal Reserve will start its hiking cycle and quantitative tightening in the relatively short-term horizon. Furthermore, the constructive outlook for the greenback is expected to remain unchanged for the time being on the back of rising yields, persistent elevated inflation, supportive Fedspeak and the solid pace of the US economic recovery.
Key events in the US this week: ISM Manufacturing, Final Manufacturing PMI (Tuesday) – ADP Employment Change (Wednesday) – Initial Jobless Claims, ISM Non-Manufacturing PMI, Factory Orders (Thursday) – Nonfarm Payrolls, Unemployment Rate (Friday).
Eminent issues on the back boiler: Fed’s rate path this year. US-China trade conflict under the Biden administration. Debt ceiling issues. Escalating geopolitical effervescence vs. Russia and China.
US Dollar Index relevant levels
Now, the index is losing 0.28% at 96.37 and a break above 97.44 (2022 high Jan.28) would open the door to 97.80 (high Jun.30 2020) and finally 98.00 (round level). On the flip side, the next down barrier emerges at 96.09 (55-day SMA) seconded by 95.41 (low Jan.20) and then 94.62 (2022 low Jan.14).
According to advanced prints from CME Group for natural gas futures markets, open interest increased for the third session in a row on Monday, this time by around 1.8K contracts. On the other hand, volume dropped by nearly 300K contracts after three daily builds in a row.
Natural gas prices seem capped by $5.00
Natural gas advanced beyond the $5.00 mark per MMBtu on Monday amidst an inconclusive price action, closing the session with marginal gains around $4.88. The move was in tandem with rising open interest, which is indicative that further consolidation might be favoured, although the sharp drop in volume, however, could spark some corrective move in the very near term.
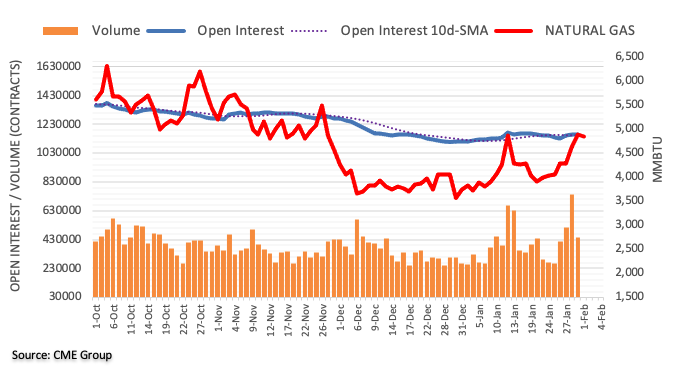
The Reserve Bank of Australia (RBA) ended QE but sounded patient on rate increases. The muted impact on AUD/USD is another indication that rate differentials are a secondary driver for the pair, according to economists at ING who expect the aussie to be capped at the 0.71/72 area.
A patient RBA remains a secondary driver for AUD
“While policymakers decided to end asset purchases, such a decision explicitly ‘does not imply a near-term increase in interest rates’.”
“We think that today’s post-RBA price action clearly indicates that rate differentials have remained a secondary driver for AUD/USD, unable to drive a significant divergence from the general USD/risk environment at the moment.”
“Periods of USD long trimming should still see AUD emerge as an outperformer due to its still extensive net-short positioning, but we think the very USD-supportive Fed stance on tightening will prevent a significant rebalancing in USD positioning for most of 2022.
“A recovery in risk sentiment can help AUD regain some more ground, but we think that any recovery in AUD/USD should stall around the 0.71/0.72 area.”
The Bank of Canada (BoC) and the Federal Reserve each delivered a hawkish hold in January and signalled a likely rate hike in March. Economists at HSBC believe divergent monetary policy should see EUR/USD and EUR/CAD lower over the near-term.
The EUR to weaken against the USD and CAD
“We believe relative central bank stories or divergent monetary policy should play an important role in FX this year, and this will be a key support for the USD this year.”
“The CAD is likely to see some near-term gains against the EUR, as the European Central Bank (ECB) is likely to remain dovish, in contrast to the hawkish holds in North America.”
The NZD/USD is assumed to appreciate steadily to reach the 0.70 level by the end of the 2022 calendar year, economists at ANZ Bank report.
Steady lift in NZ dollar anticipated
“If New Zealand’s interest rates are higher than other countries then we tend to attract more money flowing into New Zealand which puts upward pressure on our exchange rate.”
“We now anticipate the NZD/USD will gradually firm to 0.70 by December 2022.”
In the recent period, the euro has depreciated quite sharply against the US dollar despite the euro zone’s significant external surplus and the United States’ significant external deficit. For the euro to pick up, it would take expectations of catch-up in the European equity market, a reduction in the yield spread between the dollar and the euro and the prospect of stronger growth in the eurozone, as reported by Natixis.
A contest between the euro zone’s external surplus and capital outflows
“We see that the eurozone is affected by significant direct and portfolio capital outflows, which explains the weakness of the euro despite the zone’s external surplus.”
“What is responsible for these capital outflows? The faster rise in US equity markets, due in particular to the weight of technology companies in the US, the long-term yield spread between the US and the eurozone and the greater appeal of the US for direct investment in the recent period.”
“For the euro to recover against the dollar, it would therefore take expectations among investors of catch-up in European equity valuations relative to US equities, an announcement of monetary policy tightening by the ECB and/or expectations of improved growth in the eurozone to attract direct investments.”
CME Group’s preliminary readings for crude oil futures markets noted open interest increased by around 4.5K contracts after two daily pullbacks in a row. Volume, instead, resumed the downside and shrank by around 88.7K contracts.
WTI now looks to $90.00… and $100.00
The rally in WTI prices remained unabated on Monday. Indeed, the commodity managed to finally close above the $88.00 mark per barrel amidst rising open interest and leaves the door open to further upside in the very near term, with the immediate target at the $90.00 mark.
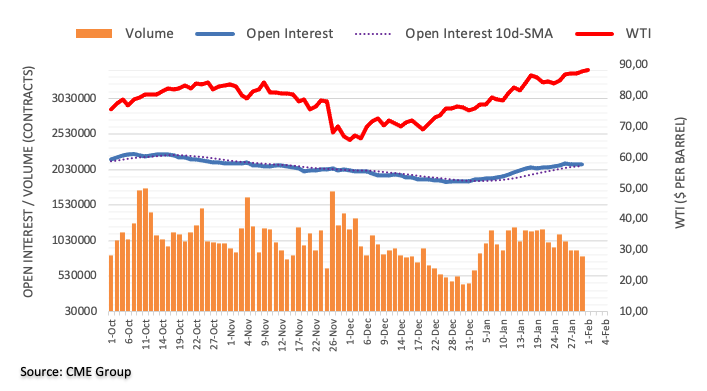
- GBP/USD was seen consolidating in a narrow trading band around mid-1.3400s on Tuesday.
- The UK political crisis acted as a headwind for sterling and capped the upside for the major.
- Modest USD weakness, BoE rate hike expectations extended support and helped limit losses.
The GBP/USD pair seesawed between tepid gains/minor losses and remained confined in a narrow trading band, around mid-1.3400s heading into the European session.
The pair struggled to capitalize on the previous day's strong move up and witnessed subdued/range-bound price moves through the first half of the trading on Tuesday. The UK political drama – amid growing demand for Prime Minister Boris Johnson's resignation over a series of lockdown parties in Downing Street – acted as a headwind for the British pound. That said, expectations that the Bank of England will hike interest rates at its meeting on Thursday continued lending some support to the GBP/USD pair.
On the other hand, the flattening of the US Treasury yield curve kept the US dollar bulls on the defensive and extended additional support to the GBP/USD pair. In fact, the spread between 2 and 10-year US government bonds fell below 60 bps for the first time since early November amid the prospects for a faster policy tightening by the Fed. Speculations that the Fed could raise its benchmark rate by 50 bps to combat stubbornly high inflation dampened future growth prospects, which is playing out in the US bond market.
The mixed fundamental backdrop warrants some caution before positioning for a firm direction ahead of this week's key event/data risks – the BoE decision on Thursday and the US NFP report on Friday. In the meantime, traders on Tuesday will take cues from the release of the final UK Manufacturing PMI. Later during the early North American session, the US ISM Manufacturing PMI, along with the US bond yields will influence the USD price dynamics. This, in turn, should provide some trading impetus to the GBP/USD pair.
Technical levels to watch
- GBP/JPY snaps five-day uptrend, stepping back from seven-day peak.
- Steady RSI can keep buyers hopeful until breaking 153.50 support confluence.
- 20-DMA adds to the upside filters before directing buyers to January tops.
GBP/JPY pares recent gains around 154.65, retreating from a short-term resistance line ahead of Tuesday’s European session.
In doing so, the cross-currency pair not only prints the first daily loss in six days but also eases from the highest levels since January 20, flashed the previous day.
Given the steady RSI conditions, the pair’s latest pullback from the short-term resistance line may aim to retest the 154.00 threshold.
However, a convergence of the 100-DMA and 50-DMA, near 153.50, will challenge GBP/JPY bears afterward.
Following the quote’s weakness past 153.50, January’s low near 152.90 and 61.8% Fibonacci retracement level of September-October upside, near 152.50, will be in focus.
Should GBP/JPY buyers manage to cross the immediate trend line hurdle near 154.90, the 155.00 round figure and the 20-DMA level of 155.60 will act as validation points for the pair’s further upside towards the January 2021 peak of 157.71.
Overall, GBP/JPY remains on the recovery moves above the key moving averages despite the latest pullback.
GBP/JPY: Daily chart
Trend: Bullish
Gold attracted some buying near the $1,785 region on Monday and ended the day in the green, snapping three consecutive days of the losing streak. But as FXStreet’s Haresh Menghani notes, XAU/USD bears have the upper hand below 200-DMA, around $1,805 area.
XAU/USD to alleviate downside pressure above the $1,805 zone
“A move back above the very important 200-day SMA, currently around the $1,805 region might provide some bullish impetus. Gold could then aim to surpass an intermediate barrier near the $1,812 area and accelerate the momentum further towards challenging the $1,830-$1,832 static resistance.”
“On the flip side, the $1,790 area now seems to protect the immediate downside ahead of last week’s swing low, around the $1,780 region.”
“A convincing break below $1,780 will be seen as a fresh trigger for bearish traders and pave the way for a slide towards testing the next relevant support near the $1,768 zone. The downward trajectory could further get extended towards December monthly swing low, around the $1,753 region.”
- Asia-Pacific markets remain mixed amid off in China, Hong Kong.
- Sluggish yields, mixed concern over inflation add to the trading filters.
- Australia’s ASX 200 regains on RBA’s cautious optimism, India’s BSE Sensex cheers government spending plans.
Markets in the Asia-Pacific region remained mostly sluggish, except for Australia and India, as the absence of traders from China and Hong Kong joins mixed concerns over inflation ahead of the key weekly events.
While portraying the mood, MSCI’s index of Asia-Pacific shares ex-Japan rises 0.20% intraday whereas Japan’s Nikkei 225 adds 0.30% intraday heading into Tuesday’s European session.
It’s worth noting that the Fed policymakers’ hesitance in supporting the rate hike trajectory, despite conveying inflation fears, joins comments from the OECD Secretary-General Mathias Cormann and WTO Head, signaling easing price pressure, portray indecisive markets.
Alternatively, Australia’s ASX 200 initially dropped heavily as the Reserve Bank of Australia’s (RBA) end the A$350 billion bond-buying program. However, the rethink on the outcome and the Aussie central bank’s rejection of the immediate rate hike concerns renew upside momentum. As a result, the stated Aussie equity gauge rises 0.30% at the latest.
On the other hand, India’s BSE Sensex rises around 1.5% intraday stay in the top-tier gains of the region as the Indian government tries to please voters with heavy spending. Among the key developments were Finance Minister Nirmala Sitharaman’s hawkish GDP expectations. “The government has projected growth at 8% to 8.5% compared with an estimated 9.2% for the current fiscal year and a 6.6% contraction the previous year,” said Reuters.
“For the next fiscal year starting in April, the government aims for a total capital spending of 7.50 trillion rupees ($101 billion), up from 5.54 trillion rupees planned for this fiscal year,” adds Indian FinMin Sitharaman while suggesting that the outlay will be 2.9% of the GDP.
Elsewhere, stocks in New Zealand were up 1.4% amid upbeat trade numbers while the market in South Korea was off.
Moving on, the US ISM Manufacturing PMI for January, expected 57.5 versus 58.7 prior, will be important for the immediate direction ahead of ECB, BOE and Friday’s US NFP. However, major attention will be given to the Fedspeak and developments concerning Russia.
Open interest in gold futures markets extended the downtrend for the fourth consecutive session on Monday, this time by around 4.2K contracts considering flash data from CME Group. In the same line, volume went down for the third session in a row, now by around 105.1K contracts.
Gold remains supported around $1,780
Gold rebounded moderately on Monday following lows near $1,780 at the end of last week. The corrective upside, however, was amidst shrinking open interest and volume, which is indicative that the move higher could lack conviction. In the meantime, bearish attemtps should remain well contained around the $1,780 zone.
- USD/CAD edged lower for the second straight day and was pressured by a combination of factors.
- Bullish oil prices underpinned the loonie and exerted some pressure amid modest USD weakness.
- The Fed’s hawkish stance should lend some support ahead of Canadian GDP and the US ISM PMI.
The USD/CAD pair traded with a mild negative bias heading into the European session and was last seen hovering near the daily low, just below the 0.2700 mark.
The pair witnessed some selling for the second successive day on Tuesday, with bears looking to extend the recent decline from the 1.2800 neighbourhood, or over three-week high set last week. Crude oil prices stood tall near a multi-year high and continued underpinning the commodity-linked loonie. This, along with modest US dollar weakness, exerted some downward pressure on the USD/CAD pair.
The black gold remained supported by expectations that a limited production increase by major oil producers and the post-pandemic recovery in fuel demand will keep a tight supply condition. Apart from this, geopolitical tensions acted as a tailwind for the commodity. Hence, the focus will remain on the OPEC+ decision and development surrounding the conflict between Russia and the West over Ukraine.
On the other hand, the flattening of the US Treasury yield curve kept the USD bulls on the defensive and further contributed to the offered tone surrounding the USD/CAD pair. In fact, the spread between 2 and 10-year US government bonds fell below 60 bps for the first time since early November amid growing acceptance that the Fed will tighten its monetary policy at a faster pace than anticipated.
The markets have fully priced in an eventual liftoff in March and expect five quarter-point rate hikes by the end of 2022. Adding to this, Atlanta Fed President, Raphael Bostic said that the US central bank could raise its benchmark rate by 50 bps if a more aggressive approach to combat high inflation is needed. This dampened future growth prospects, which is playing out in the US bond market.
Nevertheless, the Fed's more hawkish stance supports prospects for the emergence of some USD dip-buying, which should limit the downside for the USD/CAD pair, at least for the time being. Market participants now look forward to the release of the Canadian GDP report and the US ISM Manufacturing PMI. This, along with oil price dynamics, should produce some trading opportunities around the major.
Technical levels to watch
Here is what you need to know on Tuesday, February 1:
The corrective downside in the greenback appears well and sound for another session on Tuesday, with the US Dollar Index (DXY) keeping the negative mood in the first half of the week. The leg lower in the greenback came after the index clinched new cycle tops near 97.50 last Friday and remains accompanied by the soft tone in US yields across the curve. US equities extended the rebound on Monday against the backdrop of persevering risk-on mood while not-that-hawkish comments from Fed speakers also collaborated with the upbeat tone in stocks.
Later in the session, Germany will publish Retail Sales and the January labour market report, while final PMIs in the rest of the euro area members and the EMU’s Unemployment Rate will also grab attention. Across the Atlantic, the always relevant ISM Manufacturing PMI and Markit’s final Manufacturing PMI will take centre stage.
EUR/USD gained more than a cent since Friday’s new lows in the 1.1120 region, an area last visited in June 2020, following the renewed dollar weakness and the improved sentiment in the risk complex so far this week. German flash inflation figures showed consumer prices rose more than expected in January, although they eased a tad vs. the previous month.
GBP/USD followed the rest of its risk peers and extended the bounce off last week’s lows, always tracking dollar dynamics, while the political turmoil around the “party-gate” seems innocuous to the sterling for the time being. On the latter, the Sue Gray’s inquiry might shed further details on this scandal in the next hours/days. No news from the EU-UK talks around the Northern Ireland Protocol.
In line with the dollar’s bearish move and the retracement in yields in the US cash markets, USD/JPY added to Friday’s losses and gave away further ground following recent peaks near 115.70 (January 28).
Gold reversed three consecutive daily losses and rebounded from as low as the $1,780 region (January 28) and looks to regain the area above the key $1,800 mark per ounce troy.
Bitcoin remains choppy, although it seems to gradually return to the upward path and faces the immediate target at the $40,000 mark in the very near term.
- AUD/USD consolidates RBA-linked losses, bounces off short-term SMA.
- Weekly resistance line, descending trend line from January 13 tests buyers.
- Bears keep eyes on recent lows until witnessing a daily closing beyond 50-DMA.
AUD/USD picks up bids to 0.7070 while reversing the post-RBA losses heading into Tuesday’s European session.
Read: AUD/USD drops towards 0.7000 as RBA tames rate-hike concerns despite ceasing QE
In doing so, the Aussie pair bounces off 20-SMA on the four-hour chart, around 0.7030 at the latest, to aim for a downward sloping resistance line from January 20, at 0.7085 by the press time.
AUD/USD: Four-hour chart
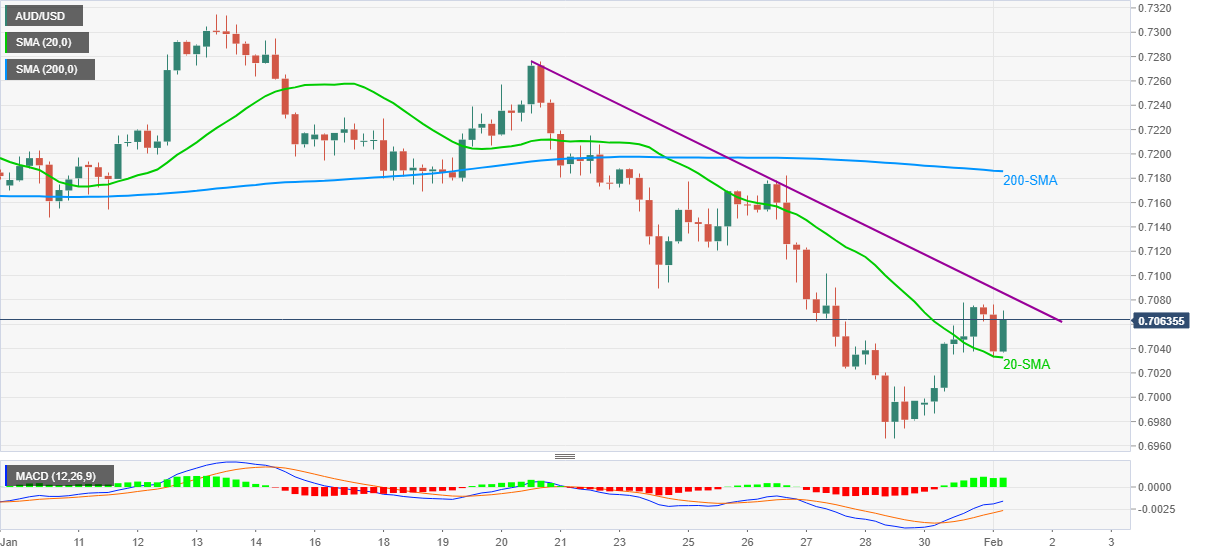
It’s worth noting that the quote’s ability to cross the 0.7085 hurdle will favor AUD/USD bulls to battle the 13-day-old resistance line near 0.7130.
However, the 50-DMA level near 0.7165 and the 200-SMA on the four-hour (4H) chart, close to 0.7185, will challenge the AUD/USD buyers afterward.
AUD/USD: Daily chart
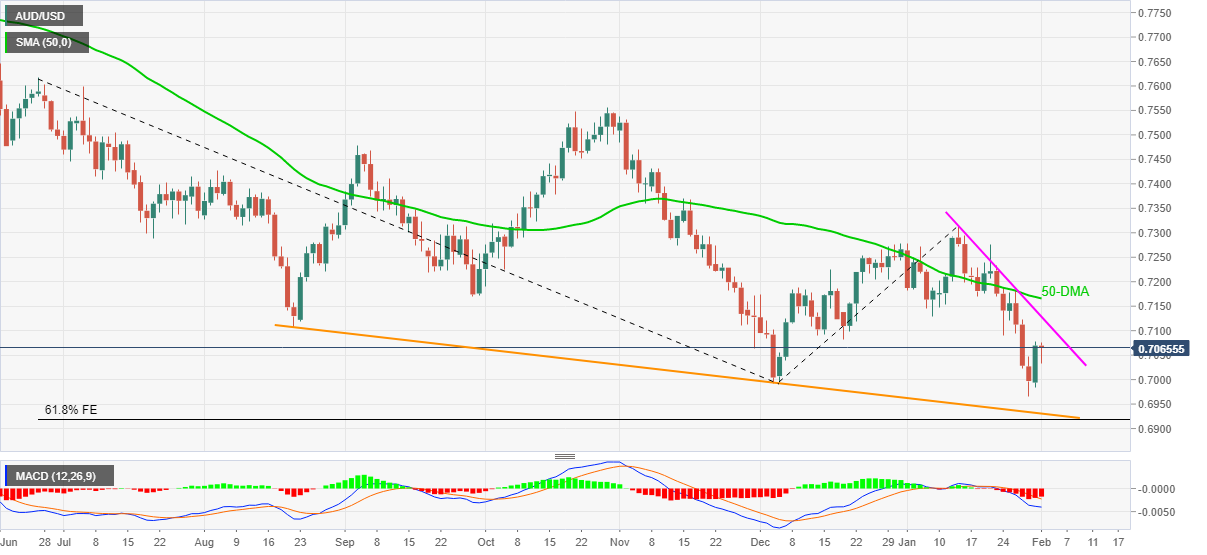
Alternatively, the 0.7000 threshold will precede the year 2021 low and the recent bottom, close to 0.6995 and 0.6965 in that order, to challenge the short-term sellers.
Following that, a downward sloping trend line from August, near 0.6930, will test the quote’s further declines ahead of the 61.8% Fibonacci Expansion (FE) of the late June 2021 to mid-January 2022 upside surrounding 0.6920.
- Gold crosses immediate resistance to consolidate the heaviest weekly loss since late November.
- Mixed Fedspeak weighs on USD, yields but inflation fears keep risk-off mood on the table, challenging gold buyers.
- Gold buyers stay hopeful unless staying beyond $1,781 key support.
- Gold Price Forecast: XAU/USD bears have the upper hand below 200-DMA, around $1,805 area
Gold (XAU/USD) extends the previous day’s recovery moves from a six-week low while piercing the $1,800 as markets brace for the key weekly events during early Tuesday.
In doing so, the gold buyers cheer broad US dollar weakness and sluggish yields, despite inflation fears, to consolidate the last week’s losses, the biggest since late November.
The US Dollar Index (DXY) drops 0.09% intraday around 96.55 after portraying the biggest daily loss in a month. The greenback bears are likely to have benefited from the US Federal Reserve (Fed) policymaker’s hesitance in supporting the rate hike trajectory, despite conveying inflation fears.
Additionally, comments from the OECD Secretary-General Mathias Cormann and WTI Head cited inflation fears, which in turn underpin gold prices amid USD weakness ahead of the US ISM Manufacturing PMI for January, expected 57.5 versus 58.7 prior.
Read: ISM Manufacturing PMI January Preview: Fed policy counts on a continuing US expansion
Gold Price: Key levels to watch
The Technical Confluences Detector shows that the gold prices recently cross the short-term key hurdle around $1,798-99 comprising the Fibonacci 23.6% level on one-month and one-week both.
That said, the upside momentum currently aims for a 38.2% Fibonacci retracement level near $1,810 before the SMA 200 on 4H, close to $1,812, challenging the XAU/USD bulls.
It’s worth noting that the $1,812 acts as a last line of defense for gold sellers, a break of which will renew bullish bias for the precious metal.
On the flip side, a clear break of the $1,799 resistance-turned-support will need validation from the 100-SMA one-day, close to $1,796, to recall the gold sellers.
Following that, pivot point one-day S2 and lower bank of the Bollinger on one-day will become crucial support around $1,781 to watch.
Here is how it looks on the tool
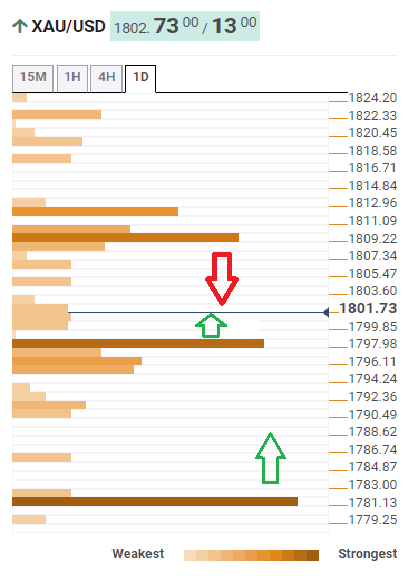
About Technical Confluences Detector
The TCD (Technical Confluences Detector) is a tool to locate and point out those price levels where there is a congestion of indicators, moving averages, Fibonacci levels, Pivot Points, etc. If you are a short-term trader, you will find entry points for counter-trend strategies and hunt a few points at a time. If you are a medium-to-long-term trader, this tool will allow you to know in advance the price levels where a medium-to-long-term trend may stop and rest, where to unwind positions, or where to increase your position size.
- USD/JPY edged lower for the third successive day on Tuesday amid modest USD weakness.
- The divergent Fed-BoJ policy outlooks support prospects for the emergence of dip-buying.
- Traders now look forward to the US ISM Manufacturing PMI for short-term opportunities.
The USD/JPY pair dropped to a three-day low during the Asian session, with bears now looking to extend the downward trajectory further below the key 115.00 psychological mark.
Following an early uptick to the 115.20 area, the USD/JPY pair met with a fresh supply on Tuesday and drifted into the negative territory for the third successive day. The downtick dragged spot prices further away from a near three-week high touched last Friday and was sponsored by modest US dollar weakness.
Expectations that the Fed will tighten its monetary policy at a faster pace than anticipated now seem to have dampened future growth prospects. This played out in the money markets, where the gap between 2 and 10-year US government bonds fell below 60 bps for the first time since early November and undermined the buck.
Atlanta Fed President, Raphael Bostic reinforced speculations and said that the US central bank could raise its benchmark rate by 50 bps if a more aggressive approach to combat stubbornly high is needed. Moreover, the markets have been pricing in the possibility of five quarter-point rate hikes by the end of 2022.
On the other hand, the Bank of Japan has repeatedly reaffirmed to continue with its persistent and powerful monetary easing until further notice. The divergence in the monetary policy stance between the Fed and BoJ favours bullish traders and supports prospects for the emergence of some dip-buying around the USD/JPY pair.
The fundamental backdrop makes it prudent to wait for some follow-through selling before confirming that the recent strong rebound from the 113.45 area has run out of steam. Market participants now look forward to the release of the US ISM Manufacturing PMI for some short-term opportunities around the USD/JPY pair.
Technical levels to watch
- USD/CHF prints three-day downtrend, refreshes intraday low at the latest.
- Clear downside break of weekly resistance, failures to bounce back beyond three-week-long horizontal resistance favor sellers.
- 50-SMA, 50% Fibonacci retracement lures bears, bulls need to refresh monthly high to retake controls.
USD/CHF remains pressured around the daily low of 0.9252 during the three-day downtrend heading into Tuesday’s European session.
In doing so, the Swiss currency (CHF) pair justifies the previous day’s downside break of the one-week-old ascending trend line.
Also favoring the USD/CHF sellers is the pair’s inability to cross the horizontal area from January 10 during the recent corrective bounces, as well as the bearish MACD signals.
With this, the quote drops towards the convergence of the 50-SMA and 50% Fibonacci retracement (Fibo.) level of January 2022 upside, near 0.9220-15.
However, a confluence of the 61.8% Fibo. and 200-SMA near 0.9190 will challenge the USD/CHF bears afterward.
Meanwhile, the immediate horizontal hurdle and the support-turned-resistance line, respectively around 0.9275 and 0.9320, guard the quote’s short-term upside.
However, USD/CHF bulls remain unconvinced until the quoted stays below January’s low of 0.9343.
USD/CHF: Four-hour chart
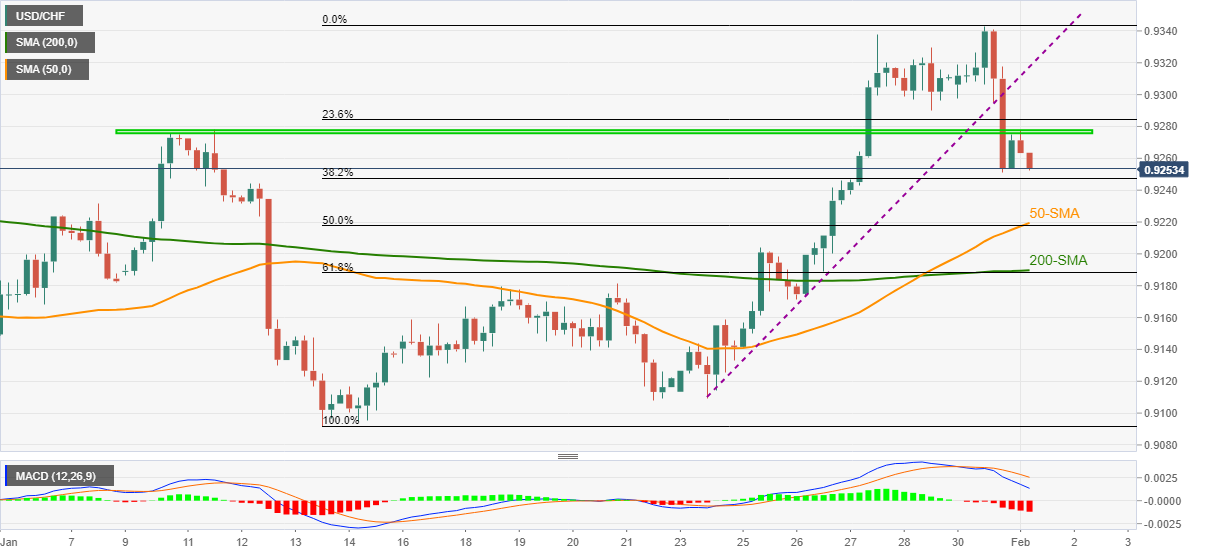
Trend: Further weakness expected
“The crunch in global supply chains will continue longer than originally thought and may persistently marginalize developing countries, said the head of the World Trade Organization (WTO),” said the Financial Times (FT) during early Tuesday in Europe.
The former World Bank second-in-command also said, “We thought the supply chain disruptions would be temporary,” while also mentioning, “We still think that, but they are taking longer to resolve than we expected — maybe by the end of this year or maybe into next year.”
Key quotes from FT
Amid concerns that smaller companies are being pushed out of trading networks because of supply chain friction, the WTO will convene a meeting of business executives, ministers and trade experts in March to discuss how to ease the persistent blockages.
In October last year Okonjo-Iweala told the FT that supply chain pressures would persist for 'several months', and in November said the problems should be 'transitory' and resolved before the end of 2022.
Demand for goods should come down, especially with the inflationary pressures and the winding down of support from pandemic-related fiscal measure.
FX reaction
The news joins the early Asian session comments from OECD to challenge antipodeans and riskier assets. However, the broad US dollar weakness defends the AUD/USD sellers of late, despite the initial drop post-RBA.
Read: AUD/USD drops towards 0.7000 as RBA tames rate-hike concerns despite ceasing QE
- EUR/USD prints three-day uptrend, picks up bids towards intraday high of late.
- Market’s indecision fails to recall USD bulls Fedspeak refrains from hawkish signals.
- German inflation, Eurozone Q4 GDP couldn’t stop bulls during the biggest daily jump since August.
- Germany’s Retail Sales and final prints of Markit PMIs may entertain traders ahead of US ISM Manufacturing PMI.
EUR/USD picks up bids to refresh intraday high around 1.1240 during three-day uptrend heading into Tuesday’s European session. In doing so, the currency major pair cheers the broad US dollar weakness amid inactive markets ahead of the US ISM Manufacturing PMI for January.
The US Dollar Index (DXY) drops 0.09% intraday around 96.55 after portraying the biggest daily loss in a month. The greenback bears are likely to have benefited from the US Federal Reserve (Fed) policymaker’s hesitance in supporting the rate hike trajectory, despite conveying inflation fears. Among the key Fed speakers were Atlanta Fed President Raphael Bostic and Kansas City Fed President Esther George, not to forget Federal Reserve Bank of San Francisco President Mary Daly.
Additionally, comments from the OECD Secretary-General Mathias Cormann, suggesting the global inflation is seen receding over the next two years as central banks normalize monetary policy settings, also seem to have favored EUR/USD bulls of late.
Elsewhere, easing concerns over the Russia-Ukraine tussles, as per the latest news suggesting Moscow’s written report to the US, contrast the Reuters news that the US weighs more troops to Eastern Europe beyond 8,500 on alert, to challenge the market sentiment.
On Monday, Germany’s Harmonized Index of Consumer Prices rose past 4.7% forecast to 5.1% YoY whereas the preliminary readings of the Eurozone Q4 GDP matched 4.47% expectations with 4.6% YoY figures.
Looking forward, German Retail Sales for December, expected -0.6% YoY versus -2.9% prior, will entertain EUR/USD traders ahead of the US ISM Manufacturing PMI for January, expected 57.5 versus 58.7 prior, for immediate direction. However, major attention will be given to the Fedspeak and developments concerning Russia.
Read: ISM Manufacturing PMI January Preview: Fed policy counts on a continuing US expansion
Technical analysis
EUR/USD bulls extend an upside break of a two-week-old descending trend line, around 1.1220 by the press time, to aim for the 1.1305-15 resistance zone comprising the 50-DMA and 21-DMA.
During the run-up, early January swing lows near 1.1275 may offer intermediate halts whereas November 2021 low near 1.1185 acts as an additional downside filter.
- USD/INR bears keep reins near one-week low ahead of the key India Union Budget.
- Hopes of increased spending, tax reliefs favored INR bulls of late.
- Mixed sentiment in Asia adds to the trading filters, US ISM Manufacturing PMI eyed as well.
Having dropped the most since late August the previous day, the USD/INR pair remains on the back foot around 74.50 as traders await India Union Budget during early Tuesday.
“Finance minister Nirmala Sitharaman is expected to announce more spending on roads, railways, besides higher subsidies for affordable housing amid growing public criticism over inadequate relief following the economic disruption after the outbreak of pandemic in 2020,” said Reuters.
It should be noted that the Indian government report warned the previous day of growing risks from global inflation led by rising crude oil prices could hit the economy, while projecting growth of 8% to 8.5% next fiscal year compared to 9.2% in the current fiscal year and 6.6% contraction in the previous year, per Reuters.
In addition to the pre-budget caution, sluggish sentiment in the market and the US dollar’s inability to rebound also weigh on the USD/INR prices.
That said, the Russia-Ukraine tussles join the recent news from Reuters that the US weighs more troops to Eastern Europe beyond 8,500 on alert. Additionally, mixed concerns over the size of the Fed’s rate hike, mainly challenged by the recent Fedspeak highlighting inflation fears but staying away from confirming a 0.50% rate lift, also challenge the risk appetite of late.
Against this backdrop, the US 10-year Treasury yields remain sluggish around 1.77% whereas the S&P 500 Futures drop 0.45% intraday whereas the Asia-Pacific shares trade mixed amid off in China and Hong Kong.
Moving on, the Indian government’s ability to match high hopes amid Omicron woes will be crucial for USD/INR bulls. Following that, the US ISM Manufacturing PMI for January, expected 57.5 versus 58.7 prior, will be important to watch while risk catalysts could keep playing the background music.
Technical analysis
A clear downside break of a three-week-old ascending trend line directs USD/INR sellers towards the 200-DMA level of 74.26.
Alternatively, a clear upside break of the previous support line, near 74.77, will need validation from the 50-DMA and the recent swing high, respectively near 74.90 and 75.34, to convince USD/INR bulls.
The Reserve bank of Australia left its cash rate at a record low of 0.1% on Tuesday and ended its A$275 billion ($194.40 billion) bond-buying campaign as expected.
However, traders were disappointed because the statement has pushed back on market wagers for an early rate rise.
The statement emphasised that ceasing bond purchases did "not imply" a near-term increase in interest rates and the Board was still prepared to be patient.
"As the Board has stated previously, it will not increase the cash rate until actual inflation is sustainably within the 2 to 3% target range," RBA Governor Philip Lowe said in a brief statement. "While inflation has picked up, it is too early to conclude that it is sustainably within the target band."
Key points
Rba says it also decided to cease further purchases under the bond purchase program, with the final purchases to take place on 10 February.
RBA says committed to maintaining highly supportive monetary conditions.
RBA says the RBA's central forecast is for gdp growth of around 4¼ per cent over 2022 and 2 per cent over 2023.
RBA says will not increase the cash rate until actual inflation is sustainably within the 2 to 3% target range.
RBA says board is prepared to be patient as it monitors how the various factors affecting inflation in Australia evolve.
RBA says the central forecast is for the unemployment rate to fall to below 4 per cent later in the year and to be around 3¾ per cent at the end of 2023.
RBA says while inflation has picked up, it is too early to conclude that it is sustainably within the target band
RBA says there are uncertainties about how persistent the pick-up in inflation will be as supply-side problems are resolved
RBA says likely to be some time yet before aggregate wages growth is at a rate consistent with inflation being sustainably at target
RBA says ceasing purchases under the bond purchase program does not imply a near-term increase in interest rates.
RBA says the board will consider the issue of the reinvestment of the proceeds of future bond maturities at its meeting in May.
AUD/USD reaction
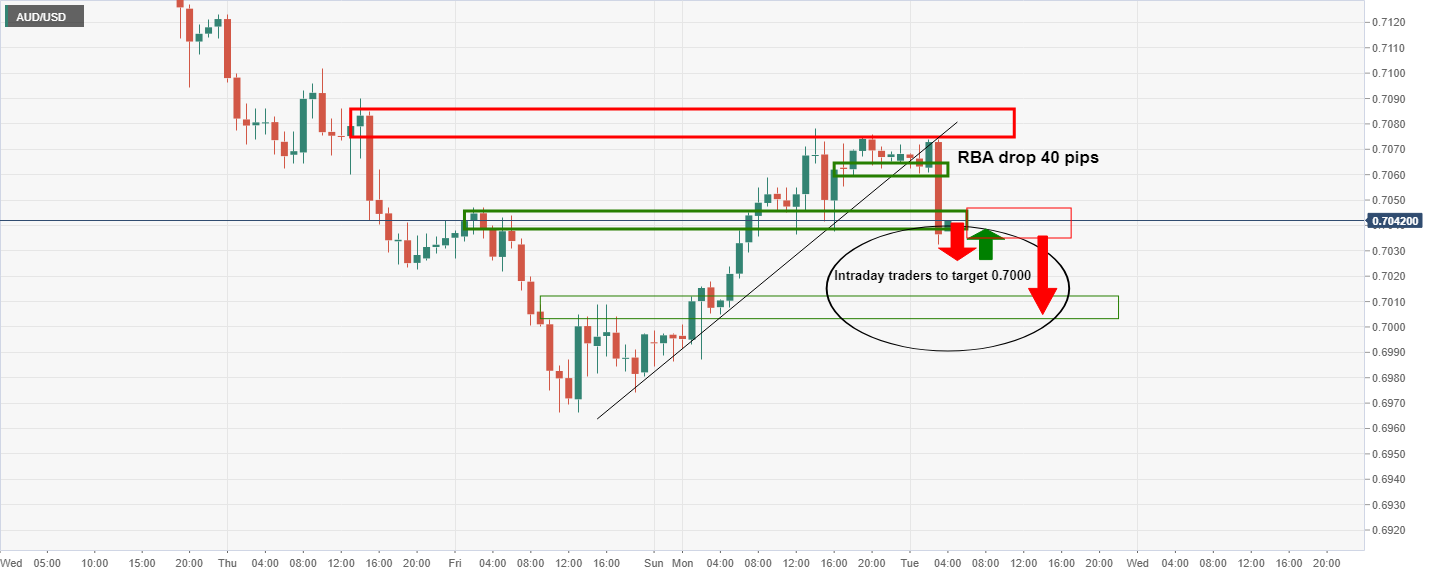
- AUD/JPY drops around 50-pips on RBA rate decision.
- RBA officially ends QE but rejects concerns over immediate rate hike.
- Pullback from 50-SMA, 13-day-old resistance line joins RSI retreat to keep sellers hopeful.
AUD/JPY nosedives to 80.90, down 0.55% intraday, following the Reserve Bank of Australia’s (RBA) cautious optimism during early Tuesday.
The RBA matched wide market expectations of announcing no change to the benchmark interest rate of 0.10% while announcing an end to the A$350 billion bond-buying program. However, the AUD/JPY bulls got disappointed by comments like, “Ceasing purchases under the bond purchase program does not imply a near-term increase in interest rates.”
Read: Breaking: RBA ends QE and holds rates at 0.1%, AUD/USD falls 50 pips on knee-jerk
In doing so, the cross-currency pair extends pullback from the 50-SMA and a descending resistance line from January 13.
The RSI retreat also backs the latest declines, which in turn direct AUD/JPY prices towards a horizontal area from December 20, 2021, near 80.30-35.
It should be noted, however, that the quote’s weakness past 80.25 will be challenged by the 80.00 threshold and December 2020 low surrounding 79.00.
Alternatively, recovery moves will have to cross the stated resistance line, near 81.58, to direct AUD/JPY buyers towards the 200-SMA level around 82.40. During the rise, the 82.00 round figure may offer an intermediate halt.
AUD/JPY: Four-hour chart
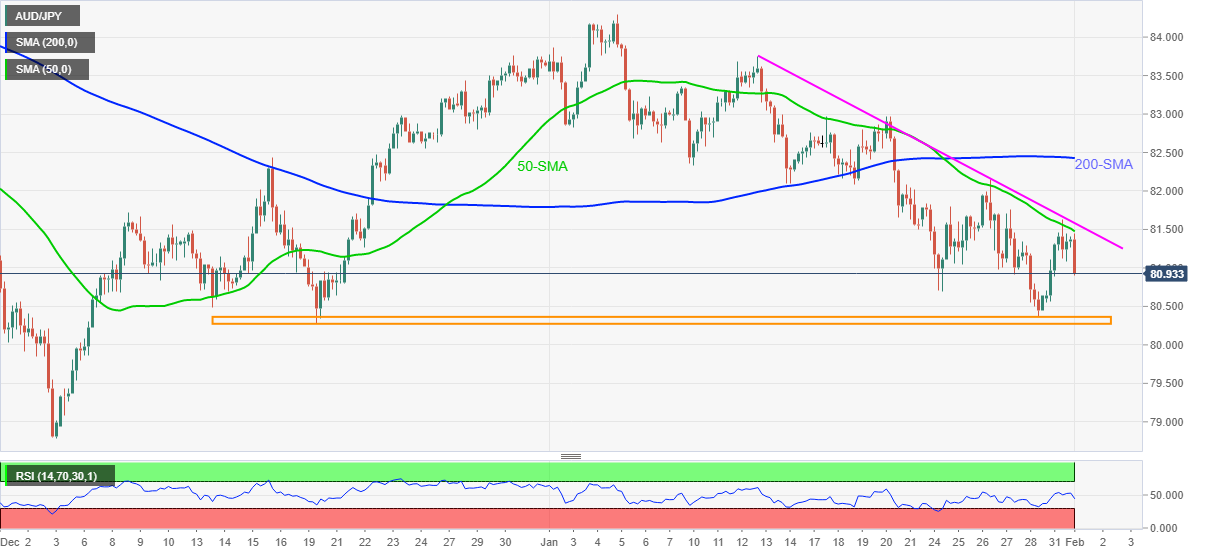
Trend: Further weakness expected
- AUD/USD slumps 50-pips to refresh intraday low following the RBA announcements.
- RBA ends QE but rejects concerns over near-term increase in interest rates,
- Global markets remain sluggish as Fedspeak, updates from Russia test moves ahead of ECB, BOE.
- US ISM Manufacturing PMI, risk catalysts will be important for the day.
AUD/USD stands on the slippery grounds towards 0.7000 as traders fail to respect the Reserve Bank of Australia’s (RBA) announcement of ceasing the Quantitative Easing (QE) on early Tuesday. In doing so, the Aussie pair drops around 0.45% intraday with an immediate fall of near 50-pips following the RBA verdict.
As expected, hawkish hopes of the RBA drowned AUD/USD prices even as the Aussie central banker announced the official end of the bond purchase program, while keeping the benchmark interest rate unchanged at around 0.10%. The reason could be linked to the comments like, “Ceasing purchases under the bond purchase program does not imply a near-term increase in interest rates.”
Read: Breaking: RBA ends QE and holds rates at 0.1%, AUD/USD falls 50 pips on knee-jerk
Earlier in the day, Australia Retail Sales for December marked the lowest prints since mid-2020, to -4.4% MoM versus 3.9% forecast and 7.3% prior, while portraying the virus-led economic impacts. Also decorated the Aussie economic calendar in Asia was the softer-than-forecast Commonwealth Bank of Australia Manufacturing PMI for January, 55.1 versus 55.3.
In addition to the downbeat Aussie data, mixed comments from Australia Prime Minister Scott Morrison during an address to the National Press Club also challenged the AUD/USD pair before the RBA. “We must respect the virus, but we must not live in fear of it,” said Aussie PM Morrison per ABC News. The national leader adds, "You must be prepared to listen to the advice, but also to make the decisions that strike the right balance.” It should be noted that the Aussie covid numbers are on a downtrend since January 13, recently steady around 34,000 infections.
On the other hand, receding fears of the Russia-Ukraine tussles join the recent news from Reuters that the US weighs more troops to Eastern Europe beyond 8,500 on alert. Additionally, mixed concerns over the size of the Fed’s rate hike, mainly challenged by the recent Fedspeak highlighting inflation fears but staying away from confirming a 0.50% rate lift, sour the trading mood and probed the AUD/USD pair’s recovery moves previously.
It’s worth observing that comments from the OECD Secretary-General Mathias Cormann, suggesting the global inflation is seen receding over the next two years as central banks normalize monetary policy settings, seems to have challenged the AUD/USD bears before the RBA.
Against this backdrop, the US 10-year Treasury yields remain sluggish around 1.77% whereas the S&P 500 Futures drop 0.45% intraday whereas the Asia-Pacific shares trade mixed amid off in China and Hong Kong.
Having witnessed the initial reaction of the RBA, AUD/USD traders will wait for the US ISM Manufacturing PMI for January, expected 57.5 versus 58.7 prior, for intraday moves. However, Wednesday’s speech from RBA Governor Adrian Orr and risk catalysts will be more important for the pair traders to watch.
Read: ISM Manufacturing PMI January Preview: Fed policy counts on a continuing US expansion
Technical analysis
AUD/USD consolidates recent losses around the 18-month low as oscillators fade bearish bias of late. Recovery moves, however, need to cross an eight-day-old resistance line and the 50-DMA, respectively around 0.7085 and 0.7130, on a closing basis to recall AUD/USD bulls.
Alternatively, the 0.7000 threshold will precede the year 2021 low and the recent bottom, close to 0.6995 and 0.6965 in that order, to challenge the short-term sellers. Following that, a downward sloping trend line from August, near 0.6930, will test the quote’s further declines ahead of the 61.8% Fibonacci Expansion (FE) of the late June 2021 to mid-January 2022 upside surrounding 0.6920.
- RBA keeps the Cash Rate at 0.10%, as expected.
- RBA to discontinue the bond-buying programme. No surprises there.
- AUD/USD drops 50 pips on the knee-jerk.
The Reserve Bank of Australia's highly anticipated event has just occurred whereby the RBA was expected to end its pandemic-related bond-buying program.
Market participants had speculated that policymakers would bring forward rate hikes’ guidance, potentially offering fresh incentives for AUD traders. The conundrum for the markets was how much of such an outcome has already been priced in and whether Governor Lowe would push back at market expectations of progressive rate hikes this year.
Key takeaways from the RBA, so far
- RBA keeps the Cash Rate at 0.10%, as expected.
- RBA to discontinue the bond-buying programme. No surprises there.
- AUD/USD drops 50 pips on the knee-jerk.
- Sees underlying inflation rising to around 3.25%.
- Sees underlying inflation falling to around 2.75% over 2023.
- Economy to grow 4.25% over 2022, 2% over 2023.
- Omicron outbreak hasn't derailed economic recovery.
- RBA says while inflation has picked up, it is too early to conclude that it is sustainably within the target band. (That's DOVISH, AUD heavy).
Taking these points into consideration, traders can conclude that RBA is in no hurry to raise rates and will not do so until inflation is sustainably within target, adding it will be "patient" on rising prices.
AUD/USD knee-jerk reaction
(15-min chart)
Prior to the event, the following analysis acknowledged the upside correction in the Aussie in the wake of US dollar weakness: AUD/USD Price Analysis: Bulls move in on a critical liquidity zone
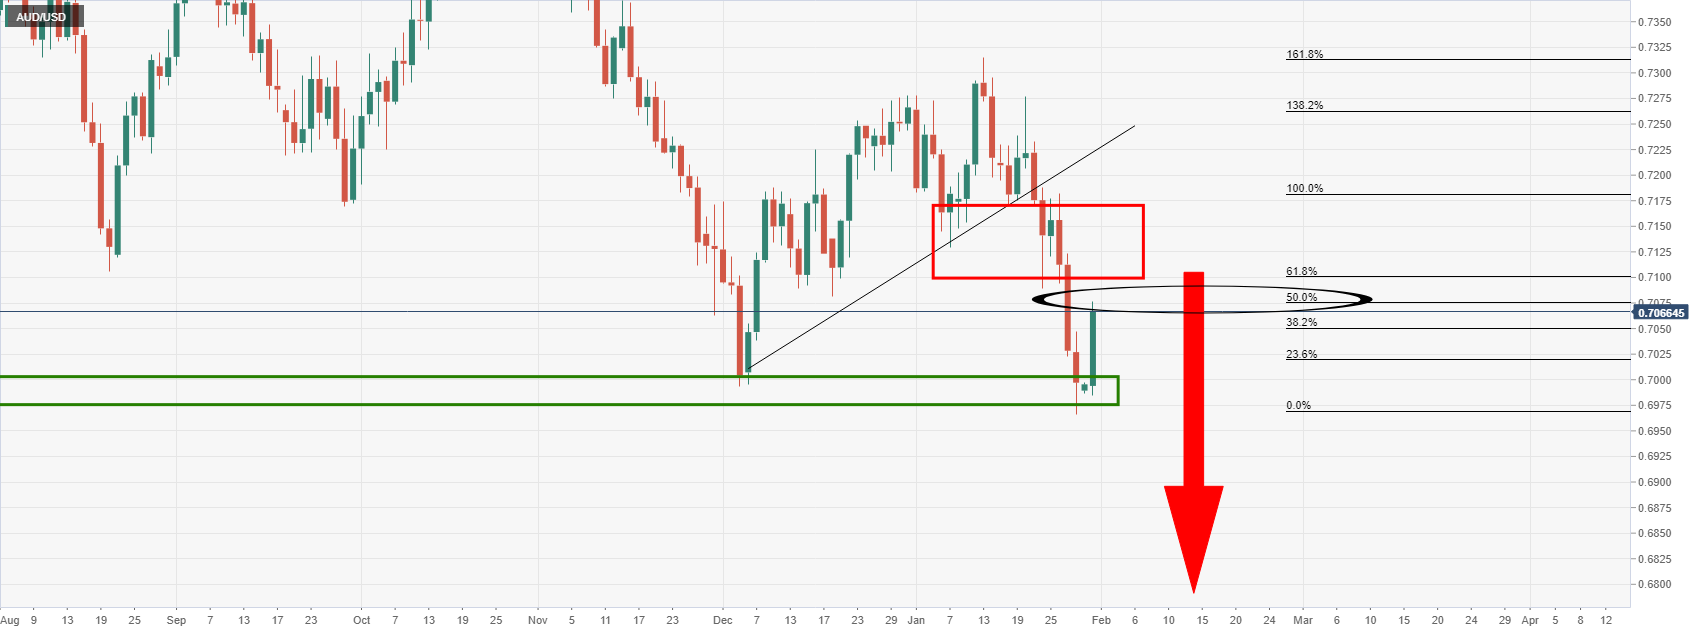
As illustrated, the price had moved in on the forecasted target zone, but more to come from the bulls in the days to come prior to the next test of the 0.6950s was anticipated.
The market reaction, however, could be merely part of the deceleration of the bullish correction, forming structure along the way:
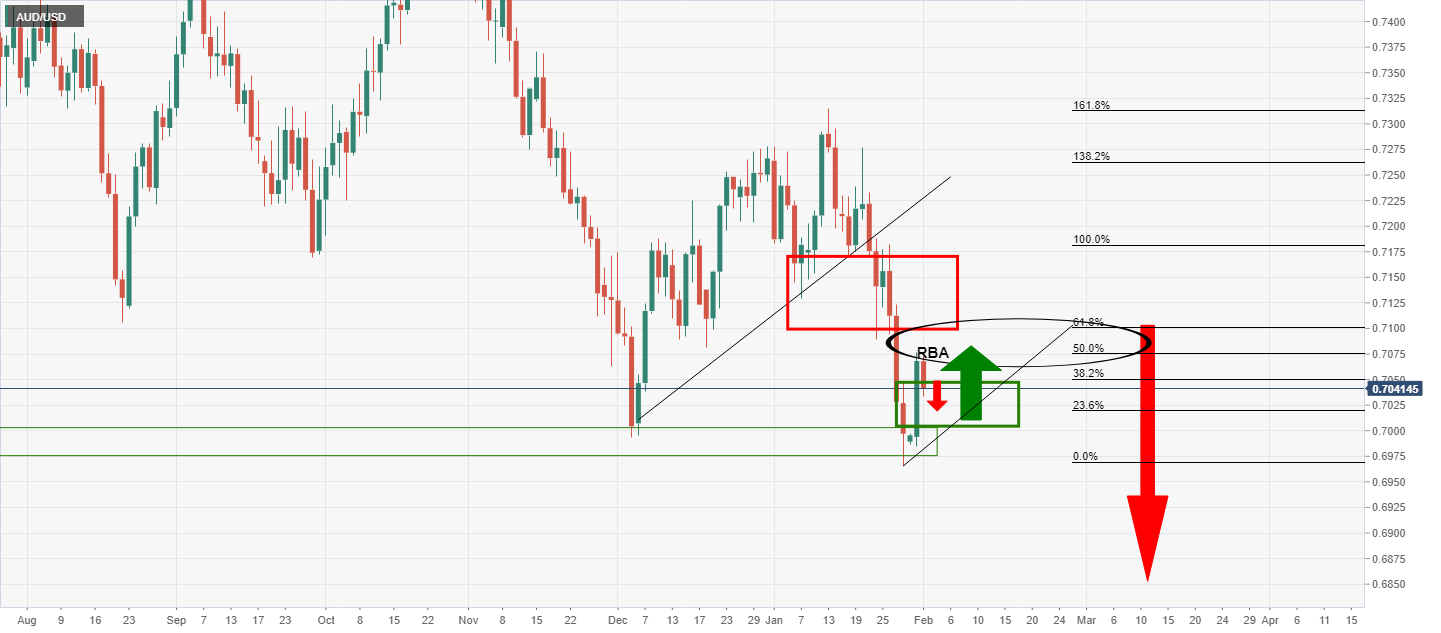
Meanwhile, the intraday traders could be encouraged by the dovishness of the RBA to target 0.70 the figure for the sessions ahead:
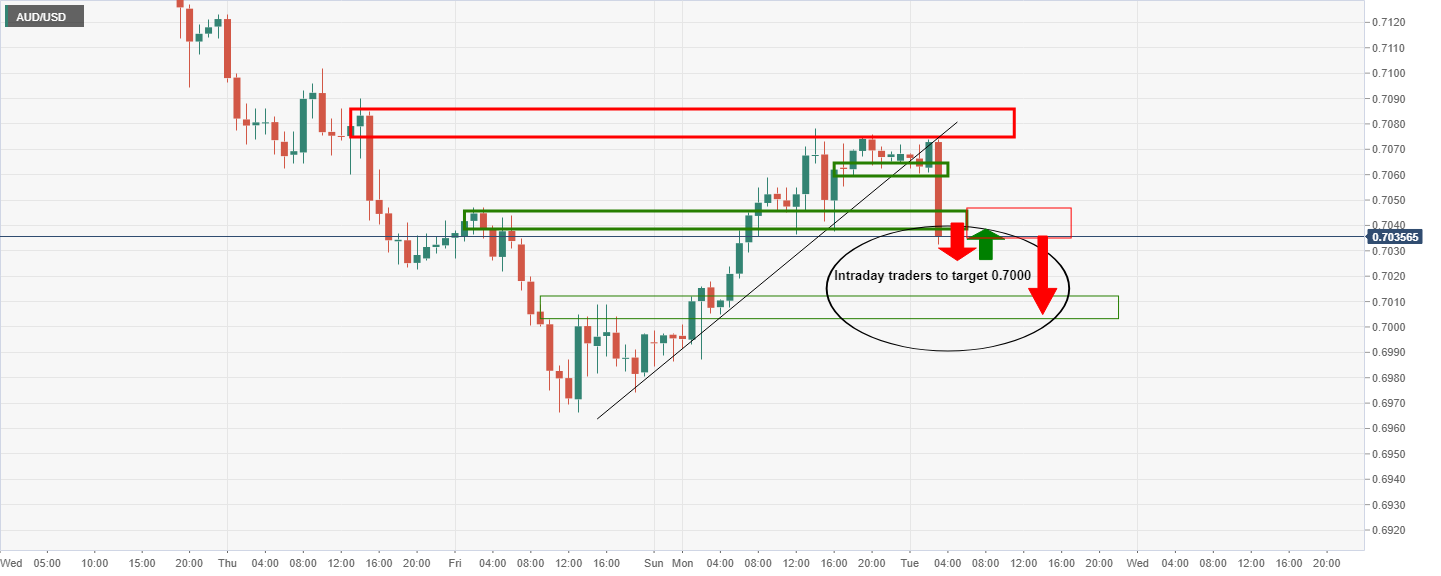
(AUD/USD H1 chart)
About the RBA meeting
RBA Interest Rate Decision is announced by the Reserve Bank of Australia. If the RBA is hawkish about the inflationary outlook of the economy and rises the interest rates it is positive, or bullish, for the AUD. Likewise, if the RBA has a dovish view on the Australian economy and keeps the ongoing interest rate, or cuts the interest rate it is seen as negative, or bearish.
Decisions regarding this interest rate are made by the Reserve Bank Board, and are explained in a media release which announces the decision at 2.30 pm after each Board meeting.
- NZD/USD traders await key events to take place this week.
- The technical outlook is bullish while buyers move in to correct the dominant bearish trend.
It is quite out there in terms of volatility in Asia due to the holidays in the region. However, on a bigger scale, NZD/USD is poised for higher levels in its correction of the daily bearish trend as follows:
NZD/USD daily chart
The M-formation is overextended, but it is a reversion pattern nevertheless and the price would be expected to correct towards the 61.8% Fibonacci retracement level over the course of the comings days.
However, given the number of critical events this week, including the Reserve Bank of Australia at the top of the hour, traders would be prudent to allow these to play out (the cause) in order to decipher the code within the market structures subsequent of the price action (the effect).
The RBA could be the catalyst, on a hawkish outcome, to send the kiwi on the coattails of a rally in the Aussie up to test the 38.2% Fibo near 0.6640 for the day ahead. From a 4-hour basis, the structure is ripe for a run to test the resistance on the way there:
| Raw materials | Closed | Change, % |
|---|---|---|
| Brent | 89.27 | -0.52 |
| Silver | 22.458 | 0.31 |
| Gold | 1796.803 | 0.41 |
| Palladium | 2344.18 | -0.99 |
- USD/TRY holds lower ground near seven-day low after breaking a three-week-old support line the previous day.
- Oversold RSI conditions test bears targeting mid-January lows.
- 50-SMA, monthly horizontal resistance adds to the upside filters.
USD/TRY bears are finally in motion after fortnight-long inaction, grinding lower around $13.30, down 0.10% intraday during early Tuesday.
The Turkish lira (TRY) pair’s latest losses could be linked to the quote’s clear downside break of an ascending trend line from January 12, around $13.38 at the latest.
It should be noted, however, that the oversold RSI conditions challenge USD/TRY bears bracing for the mid-January lows near $13.15.
In a case where USD/TRY remains pressured below the $13.15 level, the 38.2% and 50% Fibonacci retracements of December 23, 2021, to January 03, 2022 upside, respectively near $12.53 and $12.10, will gain the market’s attention.
Meanwhile, corrective pullback remains elusive until the quote stays below the previous support line near $13.38.
Following that, the 50-SMA and a horizontal area comprising multiple levels marked since early January, near $13.50 and $13.68 in that order, should lure USD/TRY buyers before directing them to the yearly peak of $13.94.
USD/TRY: Four-hour chart
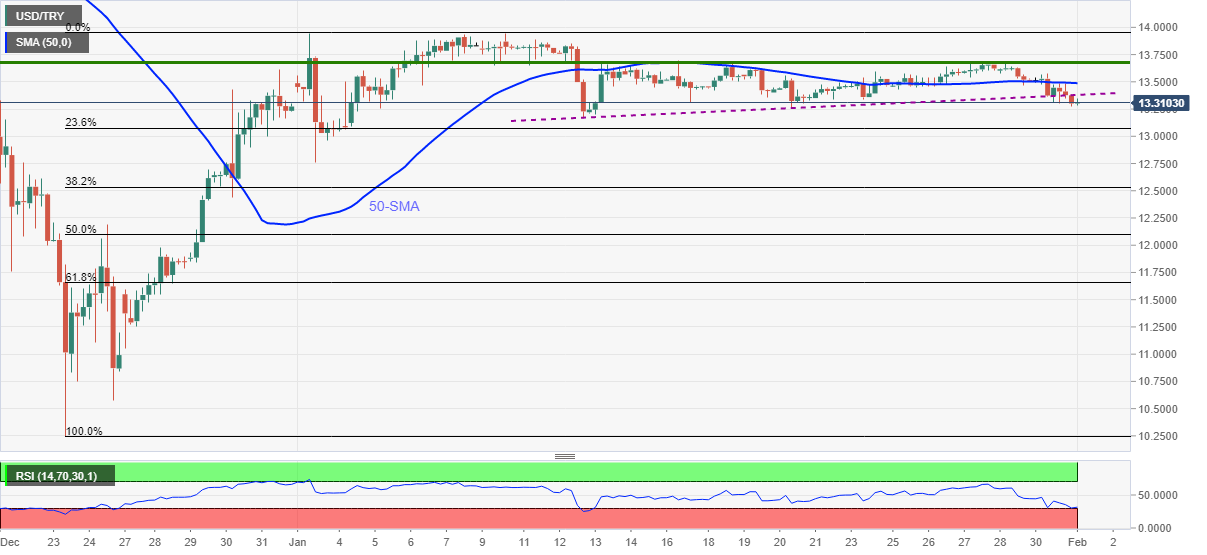
Trend: Further declines expected
Global inflation is seen receding over the next two years as central banks normalize monetary policy settings, OECD Secretary General Mathias Cormann said after the body released its Economic Survey of New Zealand Tuesday.
more to come ....
- GBP/USD is at a crossroads on the charts as traders get set for the BoE.
- A rebound in USD would be the foundation for a considerable bear continuation in cable.
At 1.3440, GBP/USD is firm in Asia but is facing a wall of technical resistance in the build-up to the Bank of England this Thursday. There are hawkish expectations that have been priced into sterling but the improving trend in net GBP positions has come to an abrupt halt, as analysts at Rabobank explained in a note on Tuesday.
''Improving trend in net GBP positions has come to an abrupt halt with net shorts rising last week despite expectations of a February rate hike from the BoE. The money market has been positioned for a fair amount of tightening this year,'' the analysts elaborated. ''That said, fears of a spike in the cost of living in the UK questions whether the BoE be able to match these expectations.''
Nevertheless, the spot market could come unstuck, in tune with positioning ahead of the remaining sessions leading up to the meeting, especially if the US dollar can catch a corrective bid. The US dollar fell around 70 pips on Monday, as investors consolidated gains ahead of the closely-watched monthly Nonfarm Payrolls report this Friday, taking a pause after a furious rally that took the currency to a 1-1/2-year high on Friday. Technically, the index, however, looks poised for a downside extension on the hourly chart as follows:
In such a scenario, the pound will benefit, but there are unlikely to be any fast moves this week before the critical events on both sides of the pond.
The Old Lady meets Thursday. Reuters said in a note on Monday that most economists polled by the news agency expect the BoE to raise rates to 0.5% on Feb. 3 from 0.25%. ''Reaching the 0.5% threshold would also see the bank stop reinvesting maturing gilts and start to reduce its 875 billion-pound government bond holdings.''
''Some reckon the BoE will be even more hawkish than anticipated; Goldman Sachs predicts interest rates at 1% in May and 1.25% in November to show 'the MPC (Monetary Policy Committee) is serious about the inflation target, and will act to ensure the UK does not face the risk of a wage-price spiral.'''
GBP/USD technical analysis
The daily chart shows an imbalance of price to the downside that is yet to be mitigated. A rebound in the greenback would see to that. The bulls have also reached a critical layer of resistance which is being tested. The bears will be prudent to monitor price developments from a lower time frame for bearish structure:
The 4-hour structure is bullish, however, and a break of 1.3450 would likely seal the deal for a run on stops around the psychological 1.35 round level.
1.3525 could be tested at a stretch as the last defence for a significant reversal of the current bearish trend. If, on the other hand, the bears beat down the doors, the dynamic support would come under pressure and a break of there would expose 1.3350 and lower towards 1.3240.
Alike every first Tuesday of the month, the Reserve Bank of Australia (RBA) is up for conveying the latest monetary policy meeting and Interest Rate Decision around 03:30 AM GMT.
The RBA is expected to keep the benchmark interest rate unchanged around 0.10%. However, recently positive employment and inflation figures from Australia raise expectations that the Aussie central bank should announce a formal end to the A$350 billion bond-buying program.
Markets also expect an upward revision to the inflation forecasts and hints for early rate hikes than the previously backed 2024.
Though, fears emanating from the South African covid variant warrant challenge RBA hawks as December Retail Sales dropped to the lowest prints since mid-2020, -4.4% MoM compared to 3.9% forecast and 7.3% prior.
Ahead of the event Westpac said,
We expect the RBA Board to announce the conclusion of the QE bond-buying program but the cash rate to remain at 0.1%. There will be a keen focus on any shift in rhetoric concerning the timing of the tightening cycle, which Westpac expects to begin in August 2022. The statement is likely to reference updated forecasts, with full details in Friday’s quarterly statement. We will also hear from Governor Lowe in a speech tomorrow.
On the other hand, FXStreet’s Valeria Bednarik says,
The central bank has anticipated that it would put an end to its A$350 billion bond-buying programs in this meeting while maintaining the view that rate hikes will remain low at least until 2024. However, market players are anticipating that policymakers will bring forward rate hikes’ guidance to early 2023.
How could the RBA decision affect AUD/USD?
AUD/USD grinds inside the 0.7060-70 daily trading range amid the pair traders’ cautious mood ahead of the key Reserve Bank of Australia (RBA) monetary policy meeting. Also challenging the AUD/USD pair moves are the steady US Treasury yields and downbeat stock futures. It’s worth noting that the Aussie pair cheered the US dollar’s biggest daily fall in a month the previous day as markets shifted attention off hawkish Fed.
That said, AUD/USD traders are likely to pay more attention to today’s RBA verdict than the previous cases amid increased bullish expectations and virus woes. This gives rise to hopes of a pullback should policymakers sound cautious.
Technically, a downward sloping resistance line from January 20, near 0.7085, guards the AUD/USD pair’s immediate recovery ahead of another resistance line from January 13, close to 0.7130.
Alternatively, the 0.7000 threshold will precede the year 2021 low and the recent bottom, respectively around 0.6995 and 0.6965, to challenge the AUD/USD sellers.
Key quotes
AUD/USD ignores downbeat Australia Retail Sales below 0.7100, RBA in focus
Reserve Bank of Australia Preview: A hawkish surprise from Lowe & Co?
About the RBA interest rate decision
RBA Interest Rate Decision is announced by the Reserve Bank of Australia. If the RBA is hawkish about the inflationary outlook of the economy and rises the interest rates it is positive, or bullish, for the AUD. Likewise, if the RBA has a dovish view on the Australian economy and keeps the ongoing interest rate, or cuts the interest rate it is seen as negative, or bearish.
Commenting on the yen, Japan's top currency diplomat Masato Kanda said a weak yen has its merits and demerits for the economy.
Additional quotes
There are both positive and negative effects of a weak yen, it's hard to say which is bigger.
Weak yen pushed up the import cost of energy and food, increasing household burdens.
The value of a weak yen for exporters isn't as strong as in the past because they're not competing on low-cost items on price.
We need to guide policy and understand that the way the exchange rate affects the economy has changed.
Read: USD/JPY snaps two-day downtrend to regain 115.00 as Japan diplomat discusses weak yen
- USD/JPY picks up bids to refresh intraday high, up for the first time in three days.
- Japan’s Vice FinMin Kanda said weak yen has merits and demerits for economy.
- Japan Unemployment Rate eased, Job/Applicants Ratio rises in December.
- Market sentiment stays sluggish with steady US Treasury yields and downbeat stock futures, US ISM Manufacturing PMI eyed.
USD/JPY consolidates recent losses around 115.15 during the initial hours of Tokyo open on Tuesday.
The risk barometer pair’s recent recovery could be linked to the firmer US Treasury yields and downbeat equities, not to forget mixed comments from Japan’s Vice Finance Minister (FinMin) Masato Kanda. In doing so, the quote pair’s a little heed to upbeat Japan employment data for December.
That said, Japan’s Unemployment Rate dropped to 2.7% versus 2.8% forecast and prior readouts whereas the Job/Applicants Ratio rose past 1.15 previous readings to 1.16 during the stated month.
Elsewhere, Japan’s key currency diplomat Kanada said, “The boost a weak yen gives to Japan's export volumes has declined compared with the past, as manufacturers target shipments to high-end, state-of-the-art products overseas rather than compete with price cuts,” per Reuters. The diplomat adds, “The demerits of a weak yen is that it pushes up the import cost of energy and food, thereby increasing household burdens.”
It should be noted that the population in Tokyo is estimated to have registered the first fall in 26 years due to the pandemic, which in turn escalates pressure on the government even if PM Fumio Kishida rejected the calls for another virus-led state of emergency.
On a different page, the Fed policymakers refrained to openly support the expectations of a 50 basis points (bps) of a rate hike in March, which in turn triggered the US dollar pullback the previous day. Also weighed on the greenback were recently improving concerns over the Russia-Ukraine issue. “The Russian government has delivered a written response to a U.S. proposal aimed at de-escalating the Ukraine crisis,” Washington Post (WaPo) quotes Senior US Diplomat. It’s worth noting that UK PM Boris Johnson is also scheduled to visit Ukraine on Tuesday whereas US Secretary of State Antony Blinken and Russian Foreign Minister Sergei Lavrov will also hold meetings today.
Amid these plays, US Treasury yields remain sluggish around 1.77% while the US stock futures drop at the latest. However, Japan’s Nikkei 225 rises 1.0% by the press time.
Moving on, the US ISM Manufacturing PMI for January, expected 57.5 versus 58.7 prior, will be important for immediate direction. However, major attention will be given to the Fedspeak and developments concerning Russia.
Read: ISM Manufacturing PMI January Preview: Fed policy counts on a continuing US expansion
Technical analysis
USD/JPY bears’ inability to conquer the 21-DMA level surrounding 114.85 redirects the pair towards the November 2021 peak near 115.55.
| Time | Country | Event | Period | Previous value | Forecast |
|---|---|---|---|---|---|
| 00:30 (GMT) | Australia | ANZ Job Advertisements (MoM) | January | -5.5% | |
| 00:30 (GMT) | Japan | Manufacturing PMI | January | 54.3 | |
| 00:30 (GMT) | Australia | Retail Sales, M/M | December | 7.3% | |
| 03:30 (GMT) | Australia | Announcement of the RBA decision on the discount rate | 0.1% | 0.1% | |
| 07:00 (GMT) | United Kingdom | Nationwide house price index, y/y | January | 10.4% | 10.8% |
| 07:00 (GMT) | United Kingdom | Nationwide house price index | January | 1% | 0.6% |
| 07:00 (GMT) | Germany | Retail sales, real adjusted | December | 0.8% | -1.4% |
| 07:00 (GMT) | Germany | Retail sales, real unadjusted, y/y | December | -2.1% | 1.1% |
| 07:30 (GMT) | Switzerland | Retail Sales Y/Y | December | 5.8% | |
| 07:30 (GMT) | Switzerland | Retail Sales (MoM) | December | 1.3% | |
| 07:45 (GMT) | France | CPI, m/m | January | 0.2% | -0.2% |
| 07:45 (GMT) | France | CPI, y/y | January | 2.8% | 2.4% |
| 08:00 (GMT) | Switzerland | SECO Consumer Climate | Quarter I | 3.8 | |
| 08:30 (GMT) | Switzerland | Manufacturing PMI | January | 62.7 | 64 |
| 08:50 (GMT) | France | Manufacturing PMI | January | 55.6 | 55.5 |
| 08:55 (GMT) | Germany | Manufacturing PMI | January | 57.4 | 60.5 |
| 08:55 (GMT) | Germany | Unemployment Change | January | -23 | -6 |
| 08:55 (GMT) | Germany | Unemployment Rate s.a. | January | 5.2% | 5.2% |
| 09:00 (GMT) | Eurozone | Manufacturing PMI | January | 58 | 59 |
| 09:30 (GMT) | United Kingdom | Net Lending to Individuals, bln | December | 4.93 | |
| 09:30 (GMT) | United Kingdom | Consumer credit, mln | December | 1.2 | 0.8 |
| 09:30 (GMT) | United Kingdom | Mortgage Approvals | December | 67 | 66 |
| 09:30 (GMT) | United Kingdom | Purchasing Manager Index Manufacturing | January | 57.9 | 56.9 |
| 10:00 (GMT) | Eurozone | Unemployment Rate | December | 7.2% | 7.1% |
| 13:30 (GMT) | Canada | GDP (m/m) | November | 0.8% | 0.3% |
| 14:45 (GMT) | U.S. | Manufacturing PMI | January | 57.7 | 55 |
| 15:00 (GMT) | U.S. | Construction Spending, m/m | December | 0.4% | 0.6% |
| 15:00 (GMT) | U.S. | JOLTs Job Openings | December | 10.562 | 10.3 |
| 15:00 (GMT) | U.S. | ISM Manufacturing | January | 58.7 | 57.5 |
| 21:45 (GMT) | New Zealand | Employment Change, q/q | Quarter IV | 2% | 0.3% |
| 21:45 (GMT) | New Zealand | Unemployment Rate | Quarter IV | 3.4% | 3.4% |
- DXY licks its wounds after biggest daily fall in a month.
- Short-term ascending trend line tests sellers ahead of the key SMA.
- Upbeat Momentum line, sustained trading beyond short-term important supports favor buyers.
US Dollar Index (DXY) picks up bids to 96.70 while consolidating the heaviest daily fall in a month during Tuesday’s Asian session.
In doing so, the greenback gauge bounces off an upward sloping support line from January 14, near 96.55.
Given the halt in the descending Momentum line around important support, DXY bulls stay hopeful until the quote remains above 96.55.
Following that, 50-SMA and 100-SMA, respectively around 96.30 and 96.00, will challenge the DXY bears before giving them controls to aim for the mid-January peak of 95.83.
On the flip side, the 97.00 threshold will restrict the quote’s immediate upside ahead of directing them to the recently flashed multi-month high of 97.44.
Should the US Dollar Index remains firmer past 97.44, the 98.00 round figure may test the bulls before directing them to the early 2020 low near 98.30. It’s worth observing that the June 2020 peak surrounding 97.80 may offer an additional hurdle to the north.
DXY: Four-hour chart
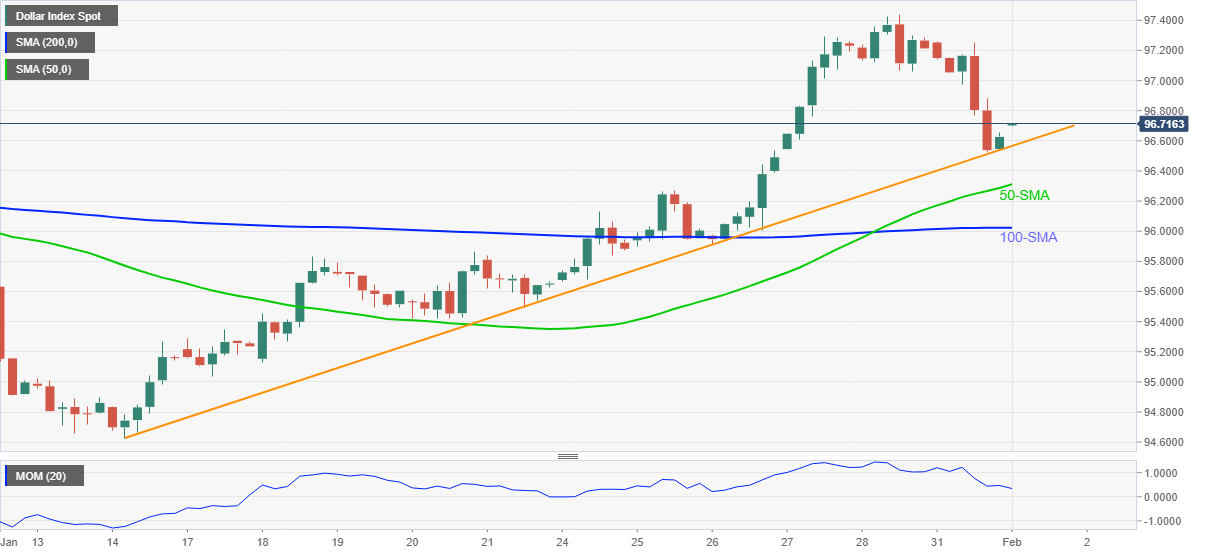
Trend: Further upside expected
- AUD/USD paid a little heed to Aussie Retail Sales for December amid pre-RBA caution.
- Australia Retail Sales shrank 4.4% MoM versus 3.9% expected, 7.3% prior.
- Market sentiment dwindles with firmer US Treasury yields testing equity buyers amid mixed updates concerning Fed, Russia.
- Hawkish expectations from RBA could disappoint bulls, Fespeak, US ISM PMI are eyed as well.
AUD/USD keeps the intraday grind near 0.7060-70 despite a strong miss of the Aussie Retail Sales during Tuesday’s Asian session. In doing so, the Aussie pair portrays the cautious mood among the traders ahead of the key Reserve Bank of Australia (RBA) monetary policy meeting.
Australia Retail Sales for December marked the lowest prints since mid-2020, -4.4% MoM compared to 3.9% forecast and 7.3% prior, while portraying the virus-led economic impacts. Even so, the AUD/USD remains indecisive while consolidating the previous day’s gains in a tight range.
In addition to the pre-RBA cautious, mixed signals from the Fed, also concerning Russia, seem to challenge the AUD/USD pair traders due to its risk-barometer status.
After the Fed’s hawkish halt propelled expectations of the 50 basis points (bps) of a rate hike in March, multiple Fed policymakers’ refrain to back the bold move allowed markets to consolidate the previous week’s moves on Monday. Among the key Fed speakers were Atlanta Fed President Raphael Bostic and Kansas City Fed President Esther George, not to forget Federal Reserve Bank of San Francisco President Mary Daly.
On a different page, the Washington Post (WaPo) conveyed the news of Russian response to the US proposal over Ukraine, citing an anonymous Senior Diplomat. “The Russian government has delivered a written response to a U.S. proposal aimed at de-escalating the Ukraine crisis.” It’s worth noting that UK PM Boris Johnson is also scheduled to visit Ukraine on Tuesday whereas US Secretary of State Antony Blinken and Russian Foreign Minister Sergei Lavrov will also hold meetings today.
It’s worth noting that the market’s wait for the key European Central Bank (ECB) meeting, up for publishing on Thursday and Friday’s US jobs report also challenges the AUD/USD moves as the US Treasury yields remain lackluster while the S&P 500 Futures print mild losses of late.
Moving on, AUD/USD pair traders will keep their eyes on the RBA’s verdict amid hopes of witnessing an upward revision to the inflation forecasts and a message conveying a formal end to the A$350 billion bond-buying program. It’s worth noting that the Aussie central bank isn’t expected to alter the benchmark rate, which it previously said to keep intact at least until 2023. However, Goldman Sachs’ Australia Economist Boak recently mentioned that the Aussie economy matched all the three criteria required for an end of the RBA QE (Quantitative Easing), which in turn keeps AUD/USD bulls hopeful.
Read: Reserve Bank of Australia Preview: A hawkish surprise from Lowe & Co?
Technical analysis
Although AUD/USD bulls bounced off an 18-month low, a downward sloping resistance line from January 20, near 0.7085, guards the immediate recovery ahead of another resistance line from January 13, close to 0.7130.
Alternatively, the 0.7000 threshold will precede the year 2021 low and the recent bottom, respectively around 0.6995 and 0.6965, to challenge the AUD/USD sellers.
December’s Aussie Retail Sales data have been released that were expected to have pulled back from the reopening surge in Oct-Nov. The data has fallen in as follows:
Australian December Retail Sales -4.4% vs +3.9% expected.
''Australian retail sales slid in December as pay back for two months of spectacular gains and a further slowdown was likely this month as a surge in coronavirus cases led to a self-imposed lockdown by many consumers,'' Reuters reported.
''Sales were still up 4.8% on a year ago and sharply higher for the December quarter as a whole, suggesting household spending made a major contribution to economic growth.''
AUD/USD reaction
The price has not reacted despite the shocking outcome.
AUD/USD Price Analysis: Bulls move in on a critical liquidity zone
Traders await the Reserve Bank of Australia.
The RBA is expected to end its pandemic-related bond-buying program. Market participants speculate policymakers will bring forward rate hikes’ guidance.
Reserve Bank of Australia Preview: A hawkish surprise from Lowe & Co?
About Retail Sales
The Retail Sales released by the Australian Bureau of Statistics is a survey of goods sold by retailers is based on a sampling of retail stores of different types and sizes and it's considered as an indicator of the pace of the Australian economy. It shows the performance of the retail sector over the short and mid-term. Positive economic growth anticipates bullish trends for the AUD, while a low reading is seen as negative or bearish.
- WTI picks up bids to poke upper line of the one-week-old trading range.
- Firmer trading above the key HMAs, bullish MACD keeps buyers hopeful.
WTI crude oil stays firmer around $88.50 inside a weekly trading range during Tuesday’s Asian session, following a five-day uptrend.
While picking up bids inside the familiar trading area, WTI bulls keep the reins around the highest levels since October 2014.
Given the firmer MACD signals and the commodity’s sustained trading above the 100-HMA, as well as the 200-HMA, WTI crude oil prices are likely to overcome the immediate hurdle, namely the recent high of $88.22.
Following that, the $90.00 threshold will act as an intermediate halt during the quote’s rally targeting the early 2014 lows surrounding $91.30.
Alternatively, the 100-HMA level of $86.55 will initially challenge the pullback moves ahead of the lower line of the stated range near $85.70.
Also acting as a downside filter is the 200-HMA level of $85.57, a break of which will direct oil buyers towards late January’s swing low near $81.70.
WTI: Hourly chart
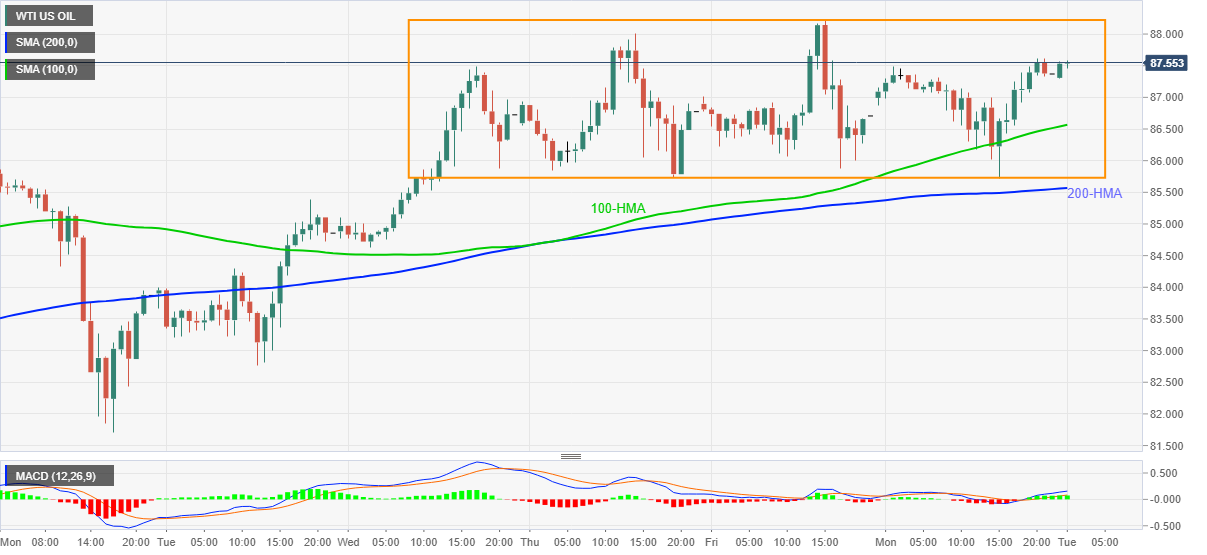
Trend: Bullish
| Pare | Closed | Change, % |
|---|---|---|
| AUDUSD | 0.70671 | 1.11 |
| EURJPY | 129.308 | 0.65 |
| EURUSD | 1.1233 | 0.8 |
| GBPJPY | 154.77 | 0.21 |
| GBPUSD | 1.34439 | 0.36 |
| NZDUSD | 0.65758 | 0.5 |
| USDCAD | 1.27045 | -0.5 |
| USDCHF | 0.92681 | -0.45 |
| USDJPY | 115.12 | -0.14 |
- USD/CAD is moving on a significant portion of the start of the week's supply.
- USD/CAD Bears monitoring the hourly time frame for optimal entry as a discount.
USD/CAD is under pressure at the start of this week and at 1.2707, begins a new trading day in bearish territory on the lower time frames. The greenback was sliding on Monday and the Canadian dollar strengthened as a consequence. USD/CAD fell from near 1.2780 to a low of 1.2681 and now finds resistance in a correction of Monday's downside around 1.2720.
Meanwhile, there are a number of factors related to the loonie which are being priced, from the rise in oil prices, better trade terms between Canada and the US in terms of lumbar, global equities and central banks. For instance, the Bank of Canada Governor Tiff Macklem and Senior Deputy Governor Carolyn Rogers will appear on Wednesday before the Senate banking committee. Last Wednesday, the central bank left its benchmark interest rate on hold at a record low of 0.25%. However, the noise that followed the event has been very hawkish.
"We're starting at ultralow. And it's clear we need to move up,'' Bank of Canada's governor Tiff Macklem said in a subsequent interview with Globe & Mail.
''At first, I think the implications are fairly obvious for interest rates. The further down the path you get, the more finely balanced those decisions will become, the more data-dependent they will become," Mr. Macklem said, seeming to suggest the first few hikes could happen soon.
Later today, we will see the Reserve Bank of Australia's first statement for 2022,'' with significant changes in the outlook likely and a decision to end QE expected,'' analysts at ANZ Bank said.
''With regard to forward guidance, we note that the Board’s December statement removed any specific date reference about the timing of rate hikes,'' the analysts added. ''Rather, the statement ended by saying that for inflation to be sustainably within the 2-3% band requires 'the labour market to be tight enough to generate wages growth that is materially higher than it is currently. This is likely to take some time and the Board is prepared to be patient.' A similar formulation in today’s statement will be seen as pushing back against market expectations of near-term hikes.''
In this light, equity markets have started the week supported by greater clarity on the Federal Reserve's policy normalisation path and buoyed by central banks’ focus on securing a sustainable business cycle. s a consequence, the broader market's tone, which is suggestive of risk appetite is supporting the commodity sector.
Oil prices and yield spreads remain supportive of the Canadian dollar in this regard. West Texas Intermediate crude oil rose to a fresh seven-year high on Monday, pushed up by continuing worries over the security of supply as Russia, the world's No.2 oil exporter, continues to threaten Ukraine.
Meanwhile, the recent news that the US has lowered duties on Canadian lumbar is also a positive factor for the loonie. The US Commerce Dept today issued its third administrative review of duties on Canadian lumber and lowered the rate to 11.64% from 17.99%.
As for positioning, speculators have raised their bullish bets on the Canadian dollar to the highest since July last year, data from the US Commodity Futures Trading Commission showed on Friday.
Looking ahead, Canada's jobs report for January, due on Friday, could provide further clues on the outlook for interest rates.
USD/CAD technical analysis
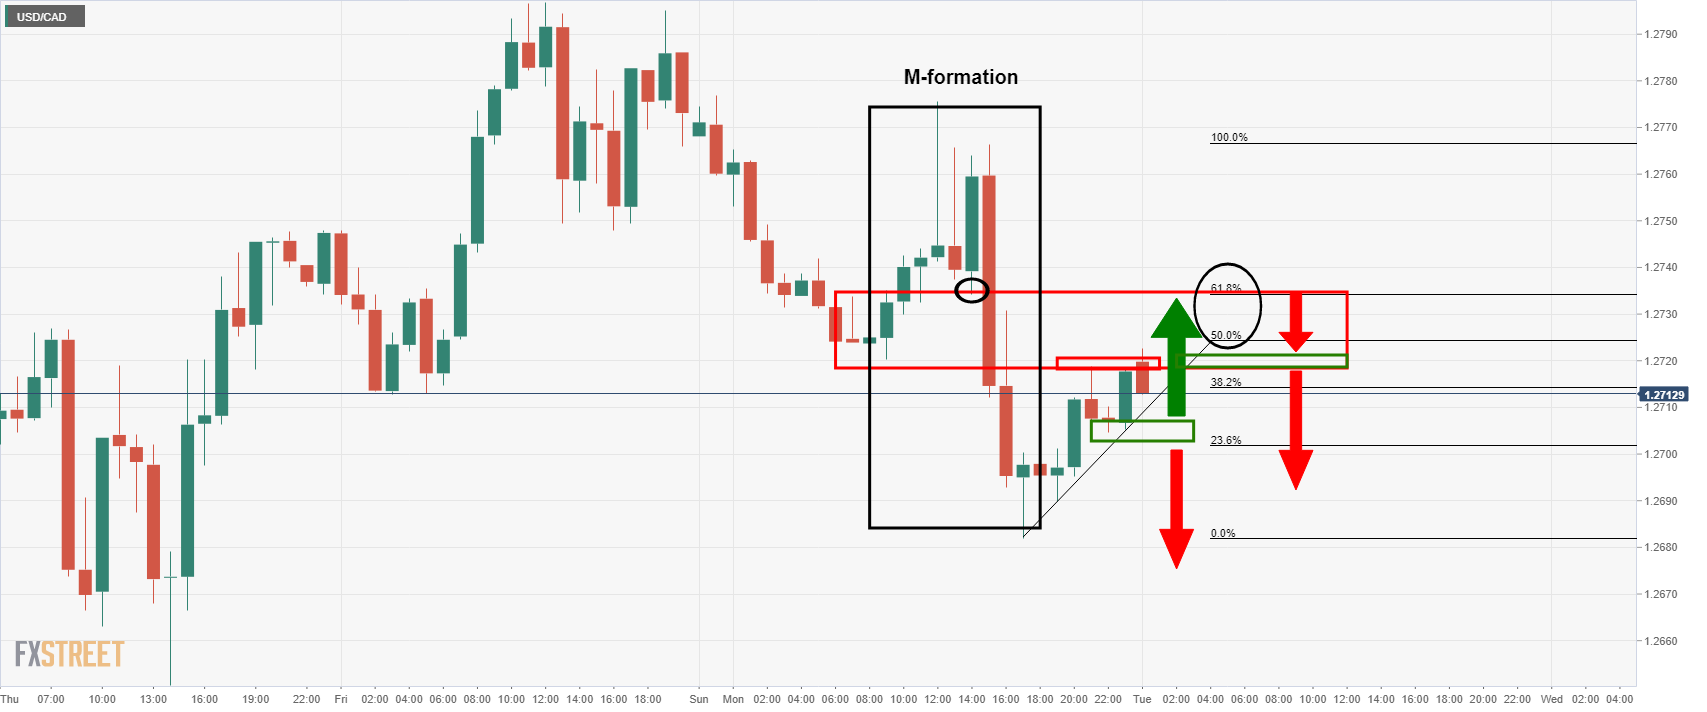
The price is rising in stages towards the neckline of the M-formation on the hourly time frame which has a confluence of the 61.8% Fibonacci retracement level of the prior bearish impulse. First, the bulls need to get past the current resistance near the highs of 1.2722. If this or the 61.8% ratio were to hold initial tests, the bears could start to engage at a discount (near 1.2720/2750) and force a fresh wave of supply to the downside for the coming hours. On the other hand, the price could continue higher if the neckline gives way towards 1.2780 tests.
- EUR/USD eases amid quiet Asian session, mixed updates.
- Fedspeak refrains from clear hawkish communication, Russia-linked fears recede.
- US stock futures fail to track Wall Street, Treasury yields stay firmer.
- German Retail Sales, US ISM Manufacturing PMI to decorate calendar.
EUR/USD struggles to stretch the previous day’s bullish show, retreating towards 1.1200 during a quiet Asian session on Tuesday.
The major currency pair rose the most since mid-November the previous day as the market’s shifted attention from the hawkish Fed, which in turn allowed traders to pare the latest losses.
The risk-on mood favored Wall Street benchmarks and dragged the US Dollar Index (DXY) but the US Treasury yields remained sluggish.
That said, Various Fed policymakers conveyed their dissatisfaction with the higher inflation and favored rate hikes in March. Among the key Fed speakers were Atlanta Fed President Raphael Bostic and Kansas City Fed President Esther George, not to forget Federal Reserve Bank of San Francisco President Mary Daly.
Elsewhere, the Washington Post (WaPo) conveyed the news of Russian response to the US proposal over Ukraine, citing an anonymous Senior Diplomat. “The Russian government has delivered a written response to a U.S. proposal aimed at de-escalating the Ukraine crisis.” It’s worth noting that UK PM Boris Johnson is also scheduled to visit Ukraine on Tuesday whereas US Secretary of State Antony Blinken and Russian Foreign Minister Sergei Lavrov will also hold meetings today.
It’s worth noting that the market’s wait for the key European Central Bank (ECB) meeting, up for publishing on Thursday, also challenges the EUR/USD moves as the US Treasury yields remain lackluster while the S&P 500 Futures print mild gains of late.
Moving on, German Retail Sales for December, expected -0.6% YoY versus -2.9% prior, will entertain EUR/USD traders ahead of the US ISM Manufacturing PMI for January, expected 57.5 versus 58.7 prior, for immediate direction. However, major attention will be given to the Fedspeak and developments concerning Russia.
Read: ISM Manufacturing PMI January Preview: Fed policy counts on a continuing US expansion
Technical analysis
A clear upside break of a two-week-old descending trend line, around 1.1220 by the press time, keeps EUR/USD buyers hopeful to aim for the 1.1305-15 resistance zone comprising the 50-DMA and 21-DMA.


© 2000-2026. Sva prava zaštićena.
Sajt je vlasništvo kompanije Teletrade D.J. LLC 2351 LLC 2022 (Euro House, Richmond Hill Road, Kingstown, VC0100, St. Vincent and the Grenadines).
Svi podaci koji se nalaze na sajtu ne predstavljaju osnovu za donošenje investicionih odluka, već su informativnog karaktera.
The company does not serve or provide services to customers who are residents of the US, Canada, Iran, The Democratic People's Republic of Korea, Yemen and FATF blacklisted countries.
Izvršenje trgovinskih operacija sa finansijskim instrumentima upotrebom marginalne trgovine pruža velike mogućnosti i omogućava investitorima ostvarivanje visokih prihoda. Međutim, takav vid trgovine povezan je sa potencijalno visokim nivoom rizika od gubitka sredstava. Проведение торговых операций на финанcовых рынках c маржинальными финанcовыми инcтрументами открывает широкие возможноcти, и позволяет инвеcторам, готовым пойти на риcк, получать выcокую прибыль, но при этом неcет в cебе потенциально выcокий уровень риcка получения убытков. Iz tog razloga je pre započinjanja trgovine potrebno odlučiti o izboru odgovarajuće investicione strategije, uzimajući u obzir raspoložive resurse.
Upotreba informacija: U slučaju potpunog ili delimičnog preuzimanja i daljeg korišćenja materijala koji se nalazi na sajtu, potrebno je navesti link odgovarajuće stranice na sajtu kompanije TeleTrade-a kao izvora informacija. Upotreba materijala na internetu mora biti praćena hiper linkom do web stranice teletrade.org. Automatski uvoz materijala i informacija sa stranice je zabranjen.
Ako imate bilo kakvih pitanja, obratite nam se pr@teletrade.global.
транcфери