- Phân tích
- Tin tức và các công cụ
- Tin tức thị trường
- Oil Price Analysis: Potential cracks showing in downtrend
Oil Price Analysis: Potential cracks showing in downtrend
- Oil is in a short-term downtrend but is showing signs that could be early evidence of a reversal.
- Oil has formed a bullish Doji candlestick reversal pattern at the day’s lows which could hail a stronger recovery.
- A break above the major trendline would be required for confirmation – as things stand the downtrend remains intact.
West Texas Intermediate (WTI) US Crude Oil is trading up over a percent at $78.01 on Thursday.
The commodity is in a short-term downtrend on the 4-hour chart (below) which given the old saying “the trend is your friend” would be expected to continue, favoring shorts over longs.
WTI Oil, however, is showing some early bullish reversal signs. It formed a Doji Japanese candle at Thursday’s 76.74 lows (shaded rectangle). This was followed by two bullish candles in a row. Although it is too early to say for sure, the candlestick formation could be an indication of a short-term change of trend.
Oil 4-hour Chart
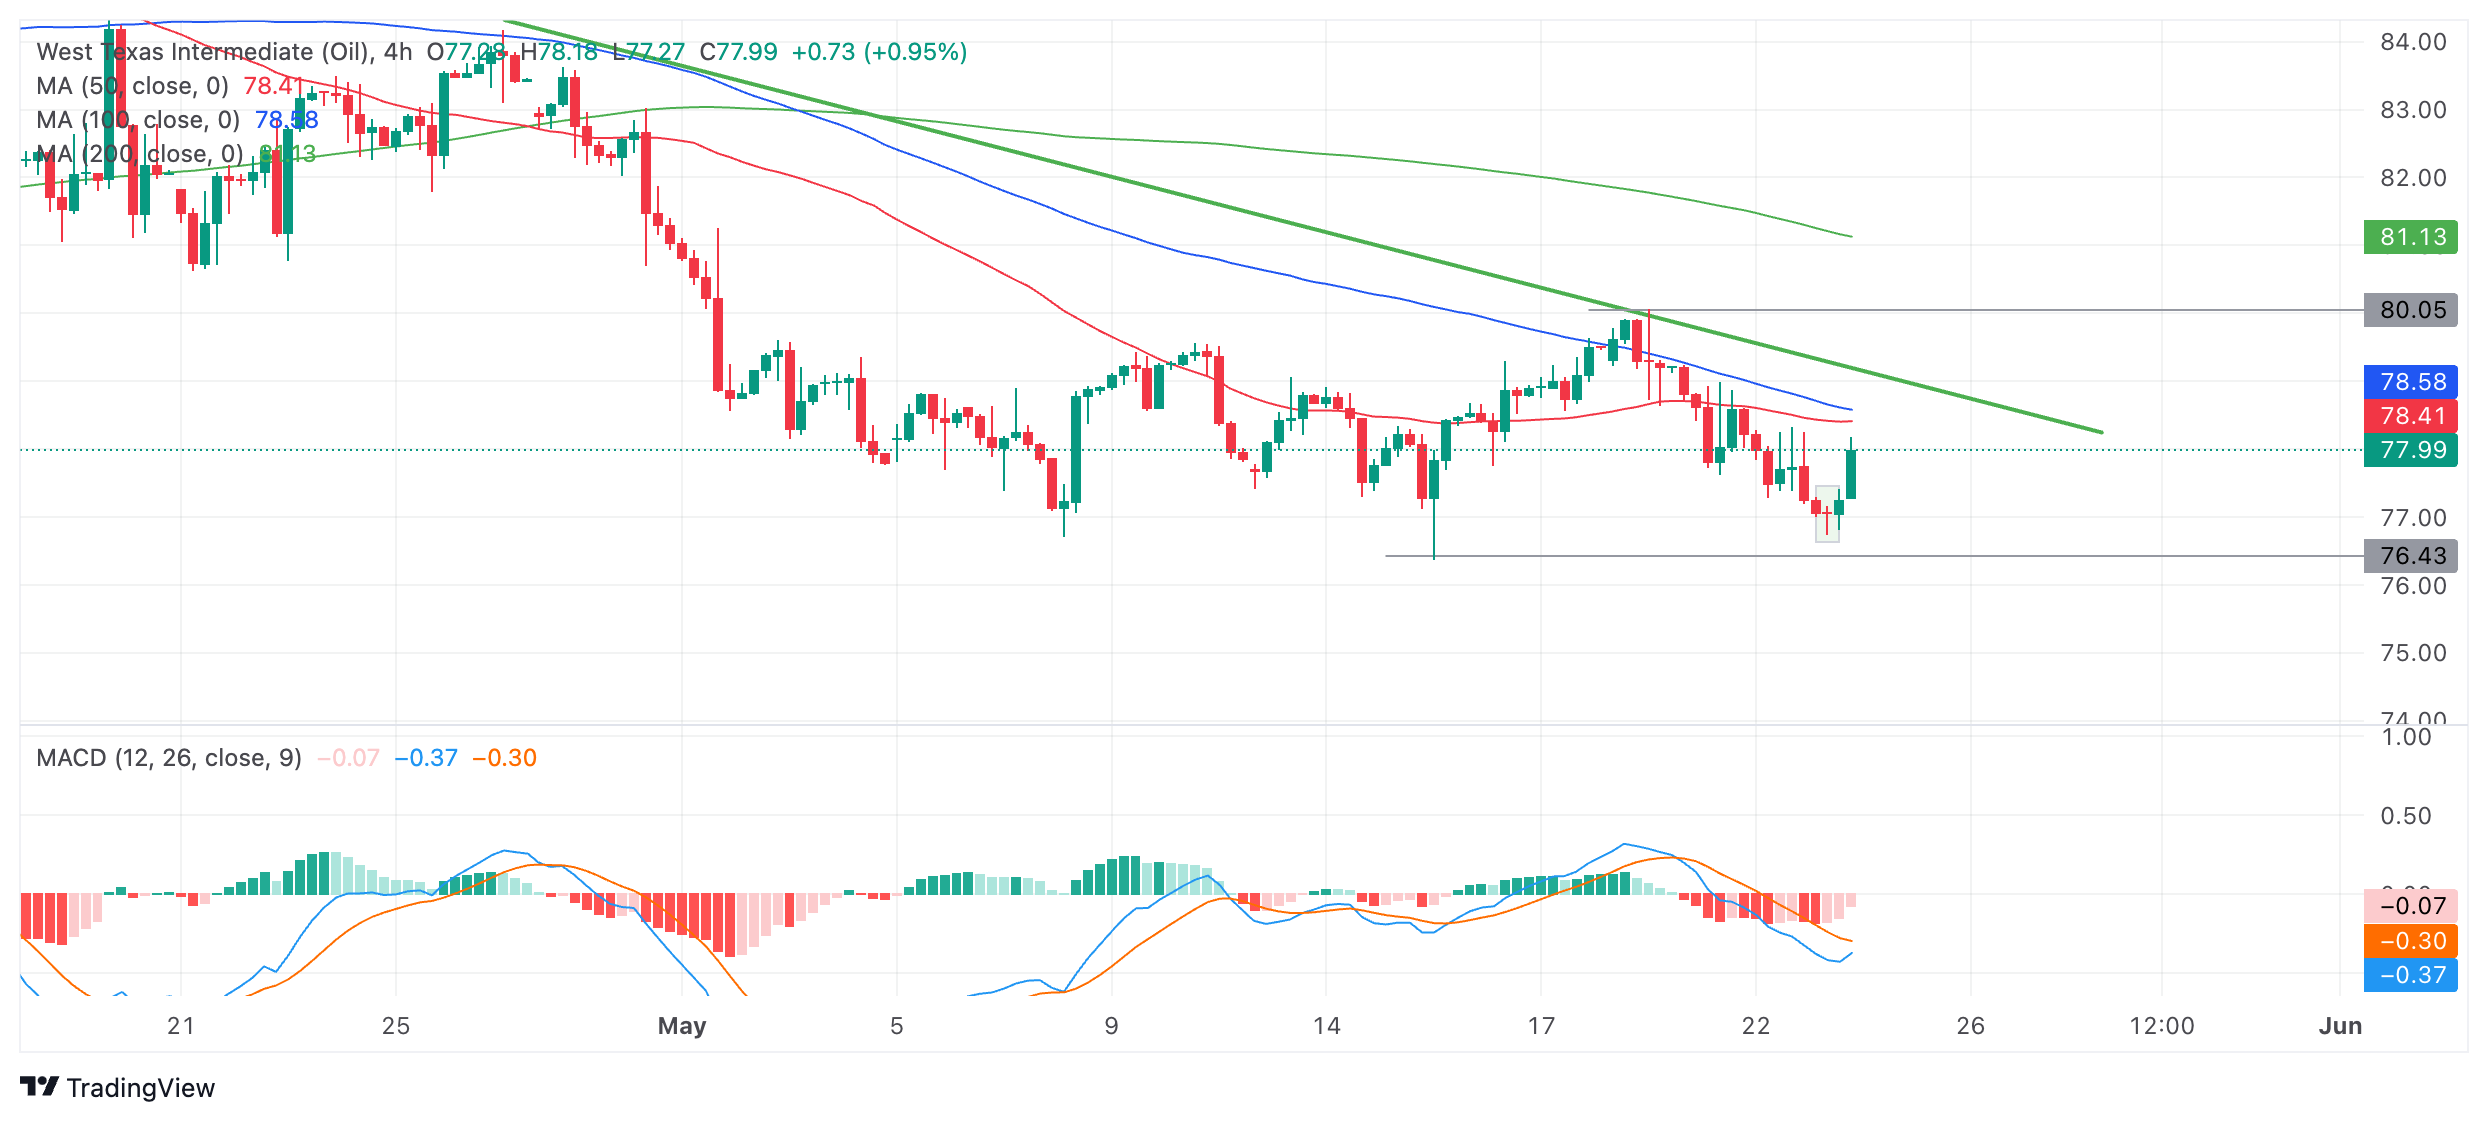
If Oil can continue rising up and definitively pierce above the green down trendline at roughly $79.00 it would be a sign that the short-term trend had reversed.
A definitive break above the trendline would be one accompanied by a longer-than-average green candle that closed near its highs or three green candles in a row that broke above the trendline.
Such a break would be expected to climb to a target at about $80.00, the resistance level of the May 20 lower high.
The Moving Average Convergence Divergence (MACD) momentum indicator is below the zero-line indicating a bearish environment. The blue MACD line is looking like it is about to cross above its red signal line, however, which would give a buy signal in line with the possibility of a reversal indicated by the Japanese candlestick pattern.
Alternatively, a capitulation and continuation of the still-intact downtrend would see WTI Oil price extend lower. A break below the May 15 monthly low at $76.38 would add confirmation to the bear trend and probably result in a move down to support from an older low at roughly $75.75 initially, with deeper declines attacking major historic support at $71.50.


© 2000-2026. Bản quyền Teletrade.
Trang web này được quản lý bởi Teletrade D.J. LLC 2351 LLC 2022 (Euro House, Richmond Hill Road, Kingstown, VC0100, St. Vincent and the Grenadines).
Thông tin trên trang web không phải là cơ sở để đưa ra quyết định đầu tư và chỉ được cung cấp cho mục đích làm quen.
Giao dịch trên thị trường tài chính (đặc biệt là giao dịch sử dụng các công cụ biên) mở ra những cơ hội lớn và tạo điều kiện cho các nhà đầu tư sẵn sàng mạo hiểm để thu lợi nhuận, tuy nhiên nó mang trong mình nguy cơ rủi ro khá cao. Chính vì vậy trước khi tiến hành giao dịch cần phải xem xét mọi mặt vấn đề chấp nhận tiến hành giao dịch cụ thể xét theo quan điểm của nguồn lực tài chính sẵn có và mức độ am hiểu thị trường tài chính.
Sử dụng thông tin: sử dụng toàn bộ hay riêng biệt các dữ liệu trên trang web của công ty TeleTrade như một nguồn cung cấp thông tin nhất định. Việc sử dụng tư liệu từ trang web cần kèm theo liên kết đến trang teletrade.vn. Việc tự động thu thập số liệu cũng như thông tin từ trang web TeleTrade đều không được phép.
Xin vui lòng liên hệ với pr@teletrade.global nếu có câu hỏi.
ngân hàng