- Phân tích
- Tin tức và các công cụ
- Tin tức thị trường
- GBP/USD Price Analysis: Shooting star emerges as sellers eye 1.2600
GBP/USD Price Analysis: Shooting star emerges as sellers eye 1.2600
- GBP/USD slides 0.04%, peaking at 1.2746 in early North American trading.
- Technicals show a bearish trend with a 'shooting star' pattern and momentum with sellers.
- Support on May 21 low of 1.2686, May 16 low of 1.2643, and 1.2600 psychological level.
- Resistance at 50-hour SMA (1.2721), 100-hour SMA (1.2712), weekly high of 1.2761; potential target at 1.2800.
Early during the North American session, the British Pound dropped against the Greenback after data from the United States showed that business activity was picking up. Alongside that, inflationary pressures rose, sparking investors' fears that the Fed would delay cutting rates later during the year. The GBP/USD trades at 1.2711 after hitting a high of 1.2746, down 0.04%
GBP/USD Price Analysis: Technical outlook
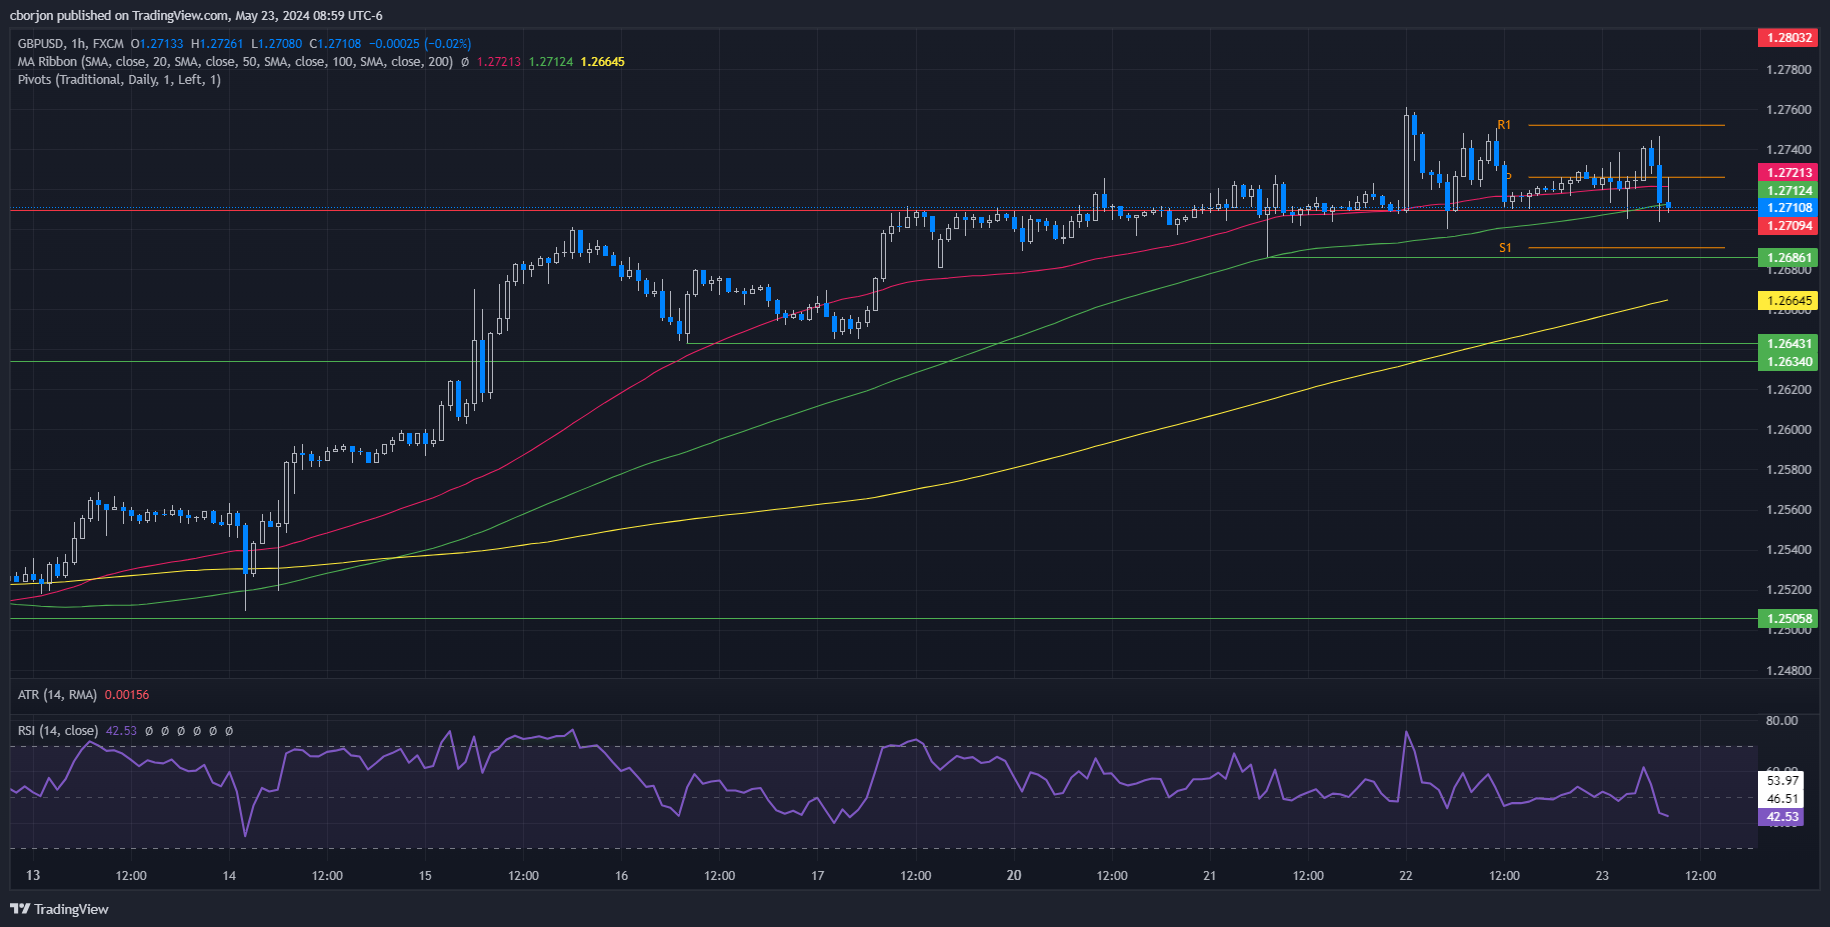
The GBP/USD edges are lower after printing a ‘shooting star’ on Wednesday, a prelude to lower prices. Today’s price action witnessed a jump toward a high of 1.2750, but it still failed to crack the current week’s high of 1.2761, which opened the door for further losses.
In the short term, the GBP/USD one-hour chart suggests the pair is range-bound, capped on the upside by the 50-hour SMA at 1.2721 and the 100-hour SMA at 1.2712. However, momentum supports sellers, as shown by the Relative Strength Index (RSI), which remains bearish and hovers at its lowest level since May 17.
Therefore, if the major drops beneath 1.2700, the next support would be the May 21 low of 1.2686, followed by the May 16 low of 1.2643 and the psychological 1.2600 mark.
Conversely, if buyers lift the exchange rate above 1.2746, that will sponsor a test of the weekly high of 1.2761. Further strength and the pair could aim for 1.2800.
GBP/USD Price Action – Hourly Chart


© 2000-2026. Bản quyền Teletrade.
Trang web này được quản lý bởi Teletrade D.J. LLC 2351 LLC 2022 (Euro House, Richmond Hill Road, Kingstown, VC0100, St. Vincent and the Grenadines).
Thông tin trên trang web không phải là cơ sở để đưa ra quyết định đầu tư và chỉ được cung cấp cho mục đích làm quen.
Giao dịch trên thị trường tài chính (đặc biệt là giao dịch sử dụng các công cụ biên) mở ra những cơ hội lớn và tạo điều kiện cho các nhà đầu tư sẵn sàng mạo hiểm để thu lợi nhuận, tuy nhiên nó mang trong mình nguy cơ rủi ro khá cao. Chính vì vậy trước khi tiến hành giao dịch cần phải xem xét mọi mặt vấn đề chấp nhận tiến hành giao dịch cụ thể xét theo quan điểm của nguồn lực tài chính sẵn có và mức độ am hiểu thị trường tài chính.
Sử dụng thông tin: sử dụng toàn bộ hay riêng biệt các dữ liệu trên trang web của công ty TeleTrade như một nguồn cung cấp thông tin nhất định. Việc sử dụng tư liệu từ trang web cần kèm theo liên kết đến trang teletrade.vn. Việc tự động thu thập số liệu cũng như thông tin từ trang web TeleTrade đều không được phép.
Xin vui lòng liên hệ với pr@teletrade.global nếu có câu hỏi.
ngân hàng