- Phân tích
- Tin tức và các công cụ
- Tin tức thị trường
Tin tức thì trường
- GBP/USD caught a bid on Monday, rising 0.7%.
- PMI figures came in softer on both sides of the Atlantic.
- Easing Greenback flows gave Cable a chance to catch its breath.
- GBP/USD extended into its second day of gains in a row, kicking off the new trading week gaining seven-tenths of one percent and dragging bids back above the 1.2500 handle after last week’s bearish plunge below 1.2400. Purchasing Managers Index (PMI) figures missed the mark on both the UK and US sides. However, a general milieu of rising risk appetite kept safe-haven flows into the Greenback at bay.
UK PMI figures for December entirely missed the mark, printing below Wall Street forecasts and falling back but remaining above the 50.0 watermark for contraction expectations. The Composite PMI in particular fell to a 13-month low, easing to 50.4 from the expected hold at 50.5.
Final US S&P Global PMI figures somewhat missed the mark on Monday, with the Composite and Services PMIs for December both climbing from one month to the next, albeit less than analysts expected. Both indicators saw a slight downward revision from their preliminary prints, but still gained ground as the US economy churns on.
The key print for the midweek window will be Tuesday’s US ISM Services PMI for December. Median market forecasts are expecting an upswing to 53.0 from the previous month’s 52.1. Friday’s Nonfarm Payrolls (NFP) print will cast a long shadow over markets this week as investors anticipate a goldilocks print that will help push the Federal Reserve (Fed) toward more rate cuts, but not too weak or strong toward either side.
GBP/USD price forecast
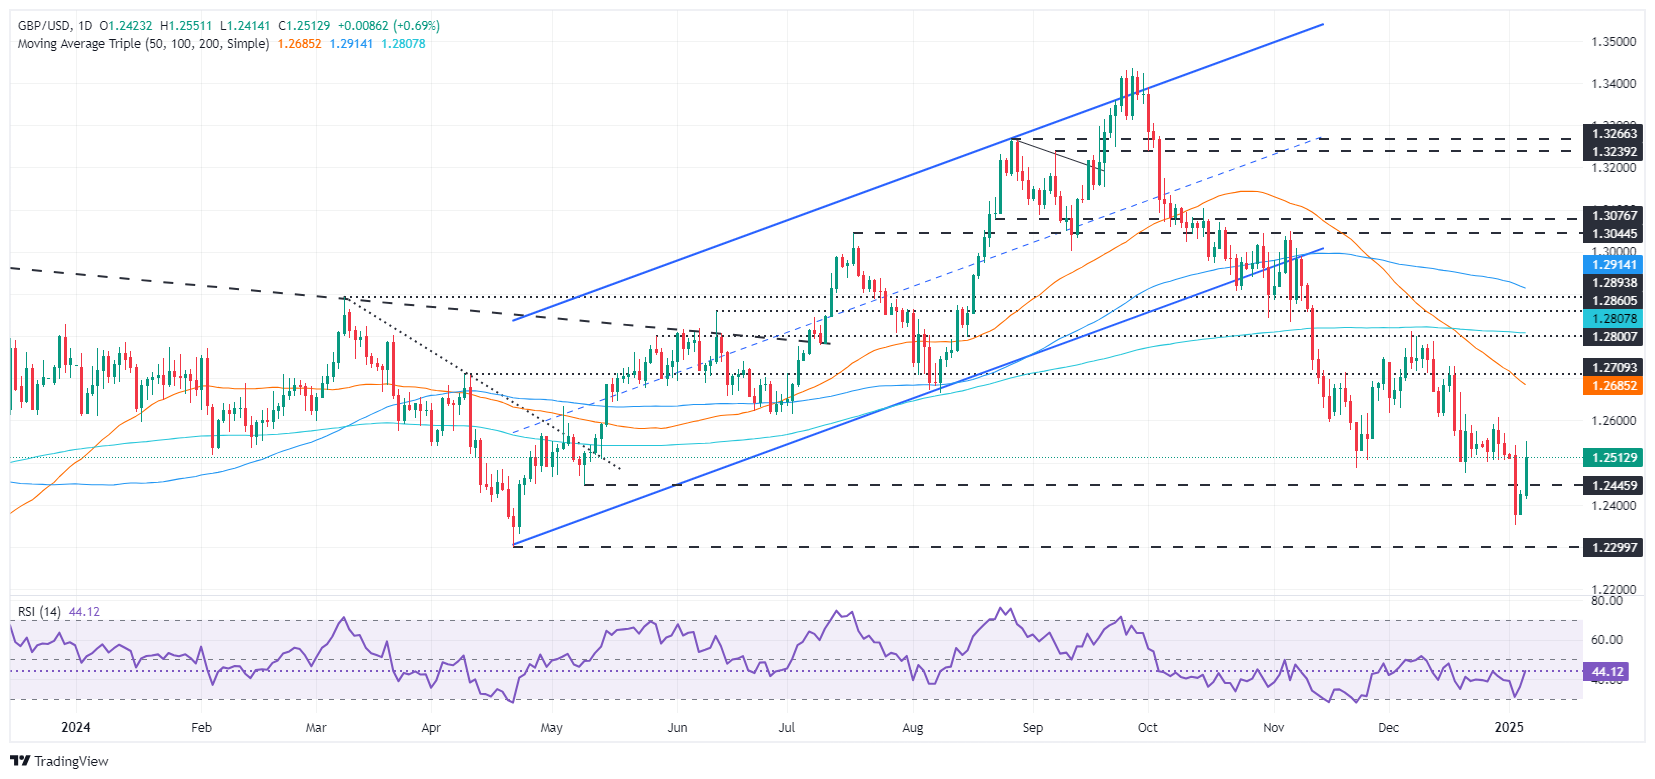
GBP/USD has eased into a two-day rally, a welcome technical turn after the pair plunged to fresh nine-month lows last week below the 1.2400 handle. While selling pressure still has eyes set on the major 1.2000 price level, an exhaustion play could be on the cards as buyers try to muscle price action back up to the 50-day Exponential Moving Average (EMA) falling through the 1.2700 handle.
GBP/USD daily chart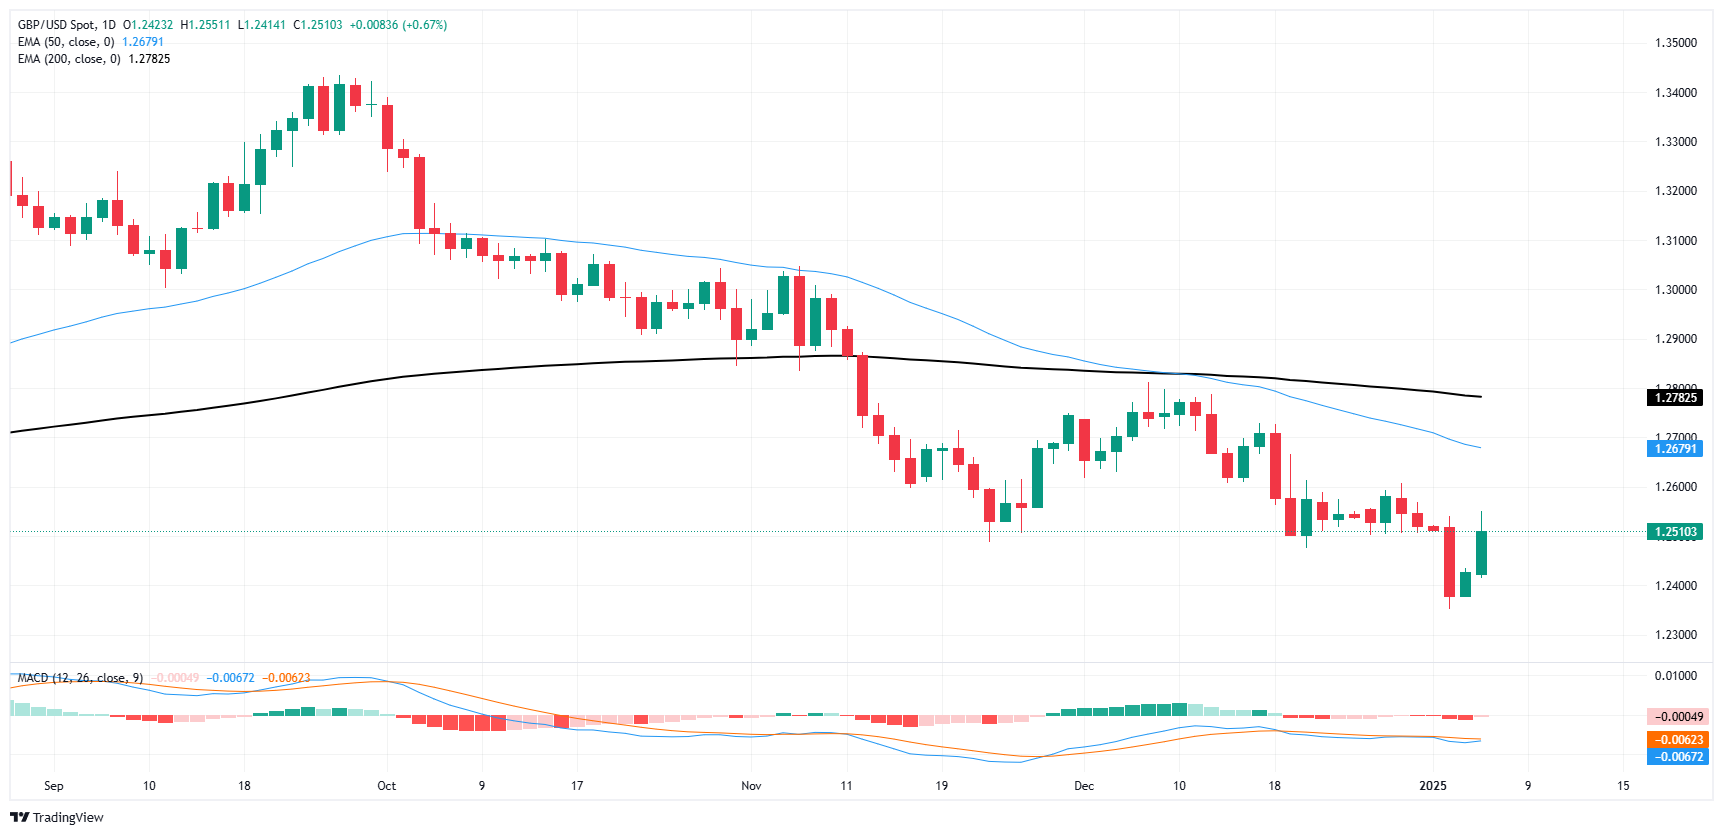
Pound Sterling FAQs
The Pound Sterling (GBP) is the oldest currency in the world (886 AD) and the official currency of the United Kingdom. It is the fourth most traded unit for foreign exchange (FX) in the world, accounting for 12% of all transactions, averaging $630 billion a day, according to 2022 data. Its key trading pairs are GBP/USD, also known as ‘Cable’, which accounts for 11% of FX, GBP/JPY, or the ‘Dragon’ as it is known by traders (3%), and EUR/GBP (2%). The Pound Sterling is issued by the Bank of England (BoE).
The single most important factor influencing the value of the Pound Sterling is monetary policy decided by the Bank of England. The BoE bases its decisions on whether it has achieved its primary goal of “price stability” – a steady inflation rate of around 2%. Its primary tool for achieving this is the adjustment of interest rates. When inflation is too high, the BoE will try to rein it in by raising interest rates, making it more expensive for people and businesses to access credit. This is generally positive for GBP, as higher interest rates make the UK a more attractive place for global investors to park their money. When inflation falls too low it is a sign economic growth is slowing. In this scenario, the BoE will consider lowering interest rates to cheapen credit so businesses will borrow more to invest in growth-generating projects.
Data releases gauge the health of the economy and can impact the value of the Pound Sterling. Indicators such as GDP, Manufacturing and Services PMIs, and employment can all influence the direction of the GBP. A strong economy is good for Sterling. Not only does it attract more foreign investment but it may encourage the BoE to put up interest rates, which will directly strengthen GBP. Otherwise, if economic data is weak, the Pound Sterling is likely to fall.
Another significant data release for the Pound Sterling is the Trade Balance. This indicator measures the difference between what a country earns from its exports and what it spends on imports over a given period. If a country produces highly sought-after exports, its currency will benefit purely from the extra demand created from foreign buyers seeking to purchase these goods. Therefore, a positive net Trade Balance strengthens a currency and vice versa for a negative balance.
Canadian Prime Minister Justin Trudeau is more likely to announce his resignation, but he has yet to make a final decision, a source familiar with Trudeau's thinking said on Sunday.
Reuters reported that they did not know definitely when Trudeau would announce his plans to step down but said it expected it would happen before an emergency meeting of Liberal legislators on Wednesday.
Market reaction
The USD/CAD pair is trading 0.01% higher on the day at 1.4335, as of writing.
Canadian Dollar FAQs
The key factors driving the Canadian Dollar (CAD) are the level of interest rates set by the Bank of Canada (BoC), the price of Oil, Canada’s largest export, the health of its economy, inflation and the Trade Balance, which is the difference between the value of Canada’s exports versus its imports. Other factors include market sentiment – whether investors are taking on more risky assets (risk-on) or seeking safe-havens (risk-off) – with risk-on being CAD-positive. As its largest trading partner, the health of the US economy is also a key factor influencing the Canadian Dollar.
The Bank of Canada (BoC) has a significant influence on the Canadian Dollar by setting the level of interest rates that banks can lend to one another. This influences the level of interest rates for everyone. The main goal of the BoC is to maintain inflation at 1-3% by adjusting interest rates up or down. Relatively higher interest rates tend to be positive for the CAD. The Bank of Canada can also use quantitative easing and tightening to influence credit conditions, with the former CAD-negative and the latter CAD-positive.
The price of Oil is a key factor impacting the value of the Canadian Dollar. Petroleum is Canada’s biggest export, so Oil price tends to have an immediate impact on the CAD value. Generally, if Oil price rises CAD also goes up, as aggregate demand for the currency increases. The opposite is the case if the price of Oil falls. Higher Oil prices also tend to result in a greater likelihood of a positive Trade Balance, which is also supportive of the CAD.
While inflation had always traditionally been thought of as a negative factor for a currency since it lowers the value of money, the opposite has actually been the case in modern times with the relaxation of cross-border capital controls. Higher inflation tends to lead central banks to put up interest rates which attracts more capital inflows from global investors seeking a lucrative place to keep their money. This increases demand for the local currency, which in Canada’s case is the Canadian Dollar.
Macroeconomic data releases gauge the health of the economy and can have an impact on the Canadian Dollar. Indicators such as GDP, Manufacturing and Services PMIs, employment, and consumer sentiment surveys can all influence the direction of the CAD. A strong economy is good for the Canadian Dollar. Not only does it attract more foreign investment but it may encourage the Bank of Canada to put up interest rates, leading to a stronger currency. If economic data is weak, however, the CAD is likely to fall.
- NZD/USD trades with mild gains around 0.5640 in Tuesday’s early Asian session.
- The USD softens in choppy trade on Trump tariff confusion.
- The upbeat economic data and supportive measures from China could support the Kiwi in the near term.
The NZD/USD pair trades on a stronger note around 0.5640 during the early Asian session on Tuesday. The weakening of the US Dollar (USD) on confusion about President-elect Donald Trump’s tariff plans provides some support to the pair. The US ISM Services Purchasing Managers Index (PMI) for December is due later on Tuesday.
The Washington Post reported on Monday that Trump is considering a tariff plan that will narrow the focus to a select set of goods and services. However, Trump denied the report. "The market consensus is that Trump's bark will be worse than his bite, and any news that confirms that concept is fuel for rallying in risk assets and for a decline in the dollar and Treasury yields, but the reality here is that the downside risks remain and there's no clear endpoint for that," said Karl Schamotta, chief market strategist at Corpay in Toronto.
Nonetheless, the hawkish remarks from the US Federal Reserve (Fed) might lift the Greenback and act as a headwind for the pair. On Monday, Fed Governor Lisa Cook said that Fed policymakers could be more cautious with further rate cuts, citing labor market resilience and stickier inflation.
The encouraging Chinese economic data could boost the China-proxy Kiwi. China’s services activity expanded at the fastest pace in seven months in December, Caixin PMI showed on Monday. Additionally, the supportive measures from China might contribute to the NZD’s upside as China is a major trading partner for New Zealand.
New Zealand Dollar FAQs
The New Zealand Dollar (NZD), also known as the Kiwi, is a well-known traded currency among investors. Its value is broadly determined by the health of the New Zealand economy and the country’s central bank policy. Still, there are some unique particularities that also can make NZD move. The performance of the Chinese economy tends to move the Kiwi because China is New Zealand’s biggest trading partner. Bad news for the Chinese economy likely means less New Zealand exports to the country, hitting the economy and thus its currency. Another factor moving NZD is dairy prices as the dairy industry is New Zealand’s main export. High dairy prices boost export income, contributing positively to the economy and thus to the NZD.
The Reserve Bank of New Zealand (RBNZ) aims to achieve and maintain an inflation rate between 1% and 3% over the medium term, with a focus to keep it near the 2% mid-point. To this end, the bank sets an appropriate level of interest rates. When inflation is too high, the RBNZ will increase interest rates to cool the economy, but the move will also make bond yields higher, increasing investors’ appeal to invest in the country and thus boosting NZD. On the contrary, lower interest rates tend to weaken NZD. The so-called rate differential, or how rates in New Zealand are or are expected to be compared to the ones set by the US Federal Reserve, can also play a key role in moving the NZD/USD pair.
Macroeconomic data releases in New Zealand are key to assess the state of the economy and can impact the New Zealand Dollar’s (NZD) valuation. A strong economy, based on high economic growth, low unemployment and high confidence is good for NZD. High economic growth attracts foreign investment and may encourage the Reserve Bank of New Zealand to increase interest rates, if this economic strength comes together with elevated inflation. Conversely, if economic data is weak, NZD is likely to depreciate.
The New Zealand Dollar (NZD) tends to strengthen during risk-on periods, or when investors perceive that broader market risks are low and are optimistic about growth. This tends to lead to a more favorable outlook for commodities and so-called ‘commodity currencies’ such as the Kiwi. Conversely, NZD tends to weaken at times of market turbulence or economic uncertainty as investors tend to sell higher-risk assets and flee to the more-stable safe havens.
- FOMC Minutes due in the midweek as markets weigh Fed rate cut chances.
- BoJ set to begin raising rates, but investors remain unclear about when.
- US NFP jobs data dump looms ahead later in the week.
USD/JPY churned near familiar levels on Monday, easing into the new trading week mostly flat. The pair is cycling near recent highs as investors await moves from either the Federal Reserve (Fed) or Bank of Japan (BoJ). Both central banks are expected to make more moves on interest rates in 2025, with the Fed aimed downward and the BoJ expected to to begin raising rates.
BoJ Governor Kazuo Ueda recently reaffirmed the BoJ’s commitment to reaching a neutral rate. What makes the BoJ unique among the rest of the major developed central banks around the planet is the BoJ’s long-running battle to get inflated started rather than trying to stop it. With BoJ reference rates far below the global median, the Japanese Yen took a hard turn in 2024 as rate differentials widened. With the natural rate of interest likely riding much higher than the current BoJ reference rates, BoJ Governor Ueda and company will have to begin adjusting policy rates up at some point or risk sending the Japanese economy back into a tailspin.
The Fed’s latest Meeting Minutes will be dropping on traders on Wednesday, but the key data print this week will be Friday’s upcoming US Nonfarm Payrolls (NFP) report. With one-half of the Fed’s mandate including full employment, markets will be watching this week’s labor figures from the US with renewed interest.
USD/JPY price forecast
USD/JPY continues to churn chart paper near recent highs, however the pair is still down slightly from decades-long peaks set during 2024 when the Yen plummeted across the board. Unless the BoJ caves on its hyperdovish stance and begins to raise interest rates, there isn’t a policy speech or technical scenario that can be presented that will rock the Yen out of its bearish stance. Global markets continue to favor the Greenback, keeping the Dollar-Yen pairing bid into the high side.
USD/JPY daily chart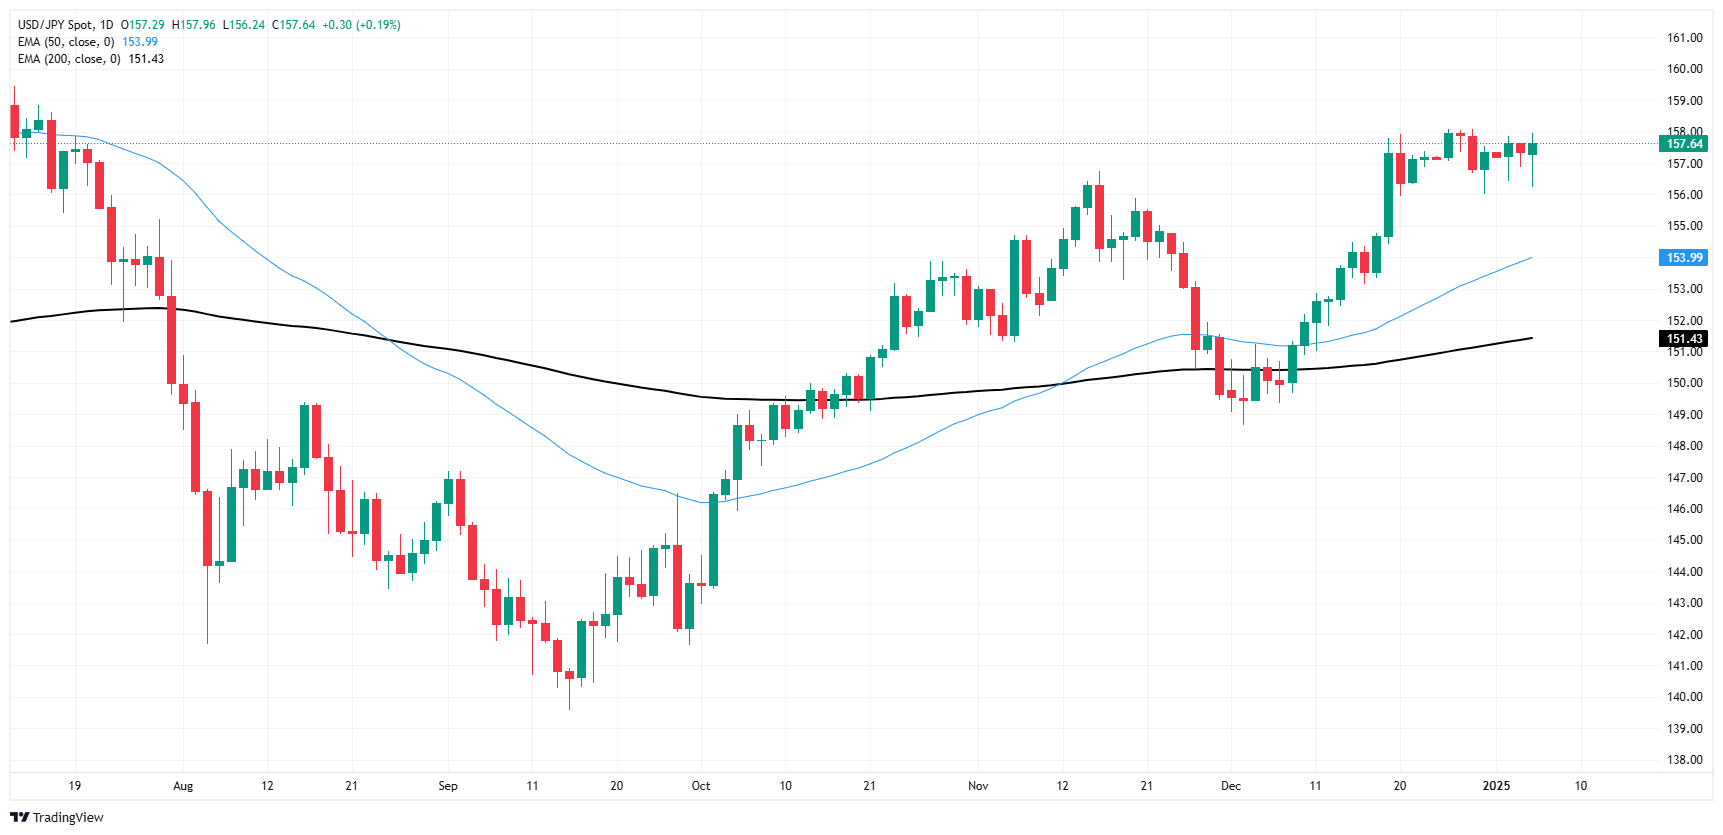
Japanese Yen FAQs
The Japanese Yen (JPY) is one of the world’s most traded currencies. Its value is broadly determined by the performance of the Japanese economy, but more specifically by the Bank of Japan’s policy, the differential between Japanese and US bond yields, or risk sentiment among traders, among other factors.
One of the Bank of Japan’s mandates is currency control, so its moves are key for the Yen. The BoJ has directly intervened in currency markets sometimes, generally to lower the value of the Yen, although it refrains from doing it often due to political concerns of its main trading partners. The BoJ ultra-loose monetary policy between 2013 and 2024 caused the Yen to depreciate against its main currency peers due to an increasing policy divergence between the Bank of Japan and other main central banks. More recently, the gradually unwinding of this ultra-loose policy has given some support to the Yen.
Over the last decade, the BoJ’s stance of sticking to ultra-loose monetary policy has led to a widening policy divergence with other central banks, particularly with the US Federal Reserve. This supported a widening of the differential between the 10-year US and Japanese bonds, which favored the US Dollar against the Japanese Yen. The BoJ decision in 2024 to gradually abandon the ultra-loose policy, coupled with interest-rate cuts in other major central banks, is narrowing this differential.
The Japanese Yen is often seen as a safe-haven investment. This means that in times of market stress, investors are more likely to put their money in the Japanese currency due to its supposed reliability and stability. Turbulent times are likely to strengthen the Yen’s value against other currencies seen as more risky to invest in.
- Silver prices climb over 1%, hitting the crucial 200-day SMA at $29.87.
- Technical forecast suggests resistance at $30.00 and the dual SMA levels of $30.73/77, setting the stage for potential gains to $31.00.
- Support levels loom at December's low of $28.74, with further downside risk at the early September low of $27.69.
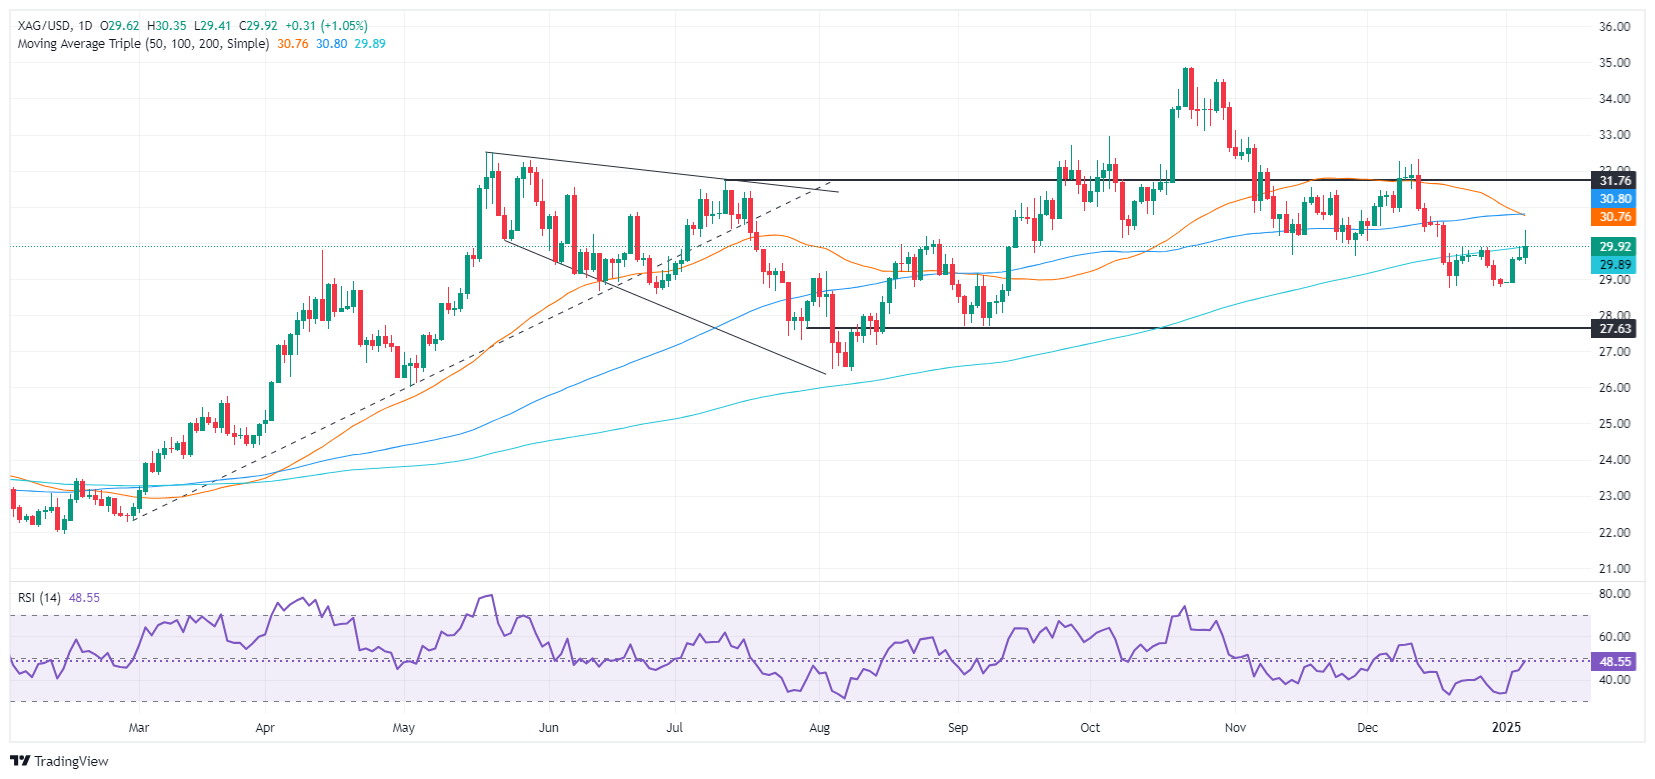
Silver's price rose over 1% on Monday and faces key resistance at the 200-day Simple Moving Average (SMA) at $29.87. At the time of writing, XAG/USD trades at $29.87 after bouncing off a daily low of $29.41 and reaching a high of $30.34.
XAG/USD Price Forecast: Technical outlook
Silver is facing strong resistance at $29.87, the 200-day SMA, which is crucial for buyers if they want to push spot prices higher. The uptrend remains intact, yet bulls need to clear the latter, followed by the $30.00 mark.
Up next is the confluence of the 50 and 100-day SMAs at $30.73/77, followed by $31.00 a troy ounce.
Conversely, if XAG/USD falls short of clearing the 200-day SMA, sellers could challenge the December monthly low of $28.74, followed by the September 6 low of $27.69.
XAG/USD Price Chart – Daily
Silver FAQs
Silver is a precious metal highly traded among investors. It has been historically used as a store of value and a medium of exchange. Although less popular than Gold, traders may turn to Silver to diversify their investment portfolio, for its intrinsic value or as a potential hedge during high-inflation periods. Investors can buy physical Silver, in coins or in bars, or trade it through vehicles such as Exchange Traded Funds, which track its price on international markets.
Silver prices can move due to a wide range of factors. Geopolitical instability or fears of a deep recession can make Silver price escalate due to its safe-haven status, although to a lesser extent than Gold's. As a yieldless asset, Silver tends to rise with lower interest rates. Its moves also depend on how the US Dollar (USD) behaves as the asset is priced in dollars (XAG/USD). A strong Dollar tends to keep the price of Silver at bay, whereas a weaker Dollar is likely to propel prices up. Other factors such as investment demand, mining supply – Silver is much more abundant than Gold – and recycling rates can also affect prices.
Silver is widely used in industry, particularly in sectors such as electronics or solar energy, as it has one of the highest electric conductivity of all metals – more than Copper and Gold. A surge in demand can increase prices, while a decline tends to lower them. Dynamics in the US, Chinese and Indian economies can also contribute to price swings: for the US and particularly China, their big industrial sectors use Silver in various processes; in India, consumers’ demand for the precious metal for jewellery also plays a key role in setting prices.
Silver prices tend to follow Gold's moves. When Gold prices rise, Silver typically follows suit, as their status as safe-haven assets is similar. The Gold/Silver ratio, which shows the number of ounces of Silver needed to equal the value of one ounce of Gold, may help to determine the relative valuation between both metals. Some investors may consider a high ratio as an indicator that Silver is undervalued, or Gold is overvalued. On the contrary, a low ratio might suggest that Gold is undervalued relative to Silver.
- EUR/USD ascends over 0.78%, buoyed by potential US tariff implications and a weak Dollar environment.
- Technical analysis points to a buyer's market as EUR/USD crosses 1.0400, with eyes set on further resistance levels.
- Near-term support and resistance levels defined at 1.0222 and 1.0500, with a critical watch on the 50-day SMA at 1.0558.
The EUR/USD increased over 0.78%, boosted by an article in The Washington Post mentioning three US President-elect Trump aides and saying that tariffs will be applied, focusing on specific sectors. The pair trades at 1.0388, above its opening price.
EUR/USD Price Forecast: Technical outlook
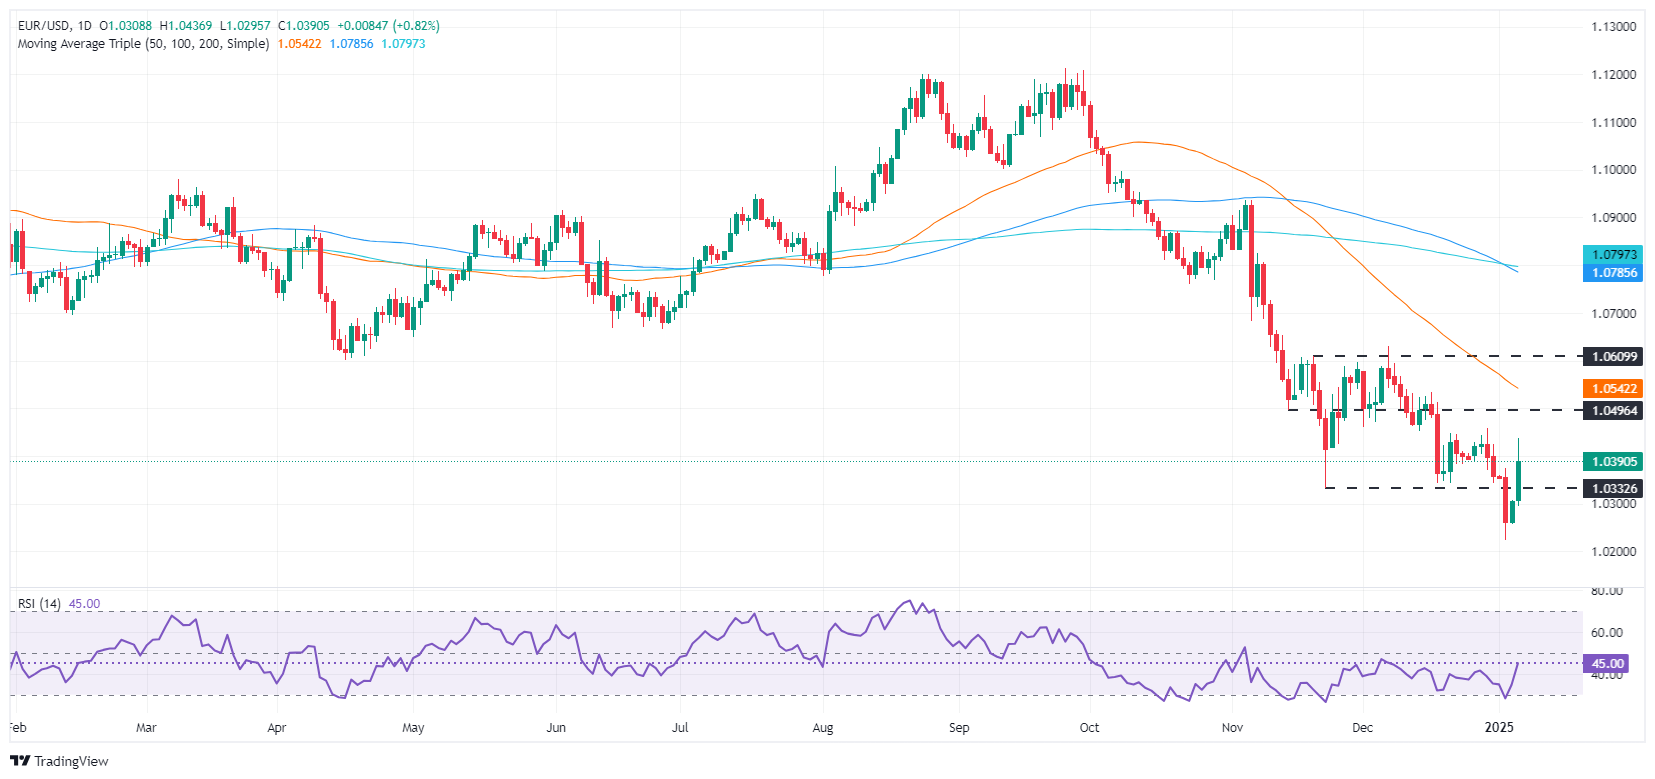
The EUR/USD finished 2024 at around 1.0260, but since then, buyers have stepped in, pushing the exchange rate above 1.0300, hitting a four-day peak of 1.0436 after The Washington Post headline.
Momentum seems to favor buyers, though the Relative Strength Index (RSI), despite edging upwards, remains bearish.
If buyers want to push the EUR/USD higher, they need to decisively clear 1.0400, followed by 1.0500. If surpassed, the next resistance would be the 50-day Simple Moving Average (SMA) at 1.0558, followed by 1.0600.
On the other hand, if bears stepped in, keeping the major below 1.0400, this could exacerbate a pullback toward last year’s low of 1.0222. On further weakness, parity emerges as the next support level.
EUR/USD Price Chart – Daily
Euro PRICE Today
The table below shows the percentage change of Euro (EUR) against listed major currencies today. Euro was the strongest against the Japanese Yen.
| USD | EUR | GBP | JPY | CAD | AUD | NZD | CHF | |
|---|---|---|---|---|---|---|---|---|
| USD | -0.79% | -0.76% | 0.24% | -0.79% | -0.39% | -0.40% | -0.58% | |
| EUR | 0.79% | 0.03% | 1.00% | 0.06% | 0.45% | 0.43% | 0.24% | |
| GBP | 0.76% | -0.03% | 0.99% | 0.03% | 0.42% | 0.40% | 0.21% | |
| JPY | -0.24% | -1.00% | -0.99% | -1.02% | -0.59% | -0.58% | -0.58% | |
| CAD | 0.79% | -0.06% | -0.03% | 1.02% | 0.33% | 0.34% | 0.18% | |
| AUD | 0.39% | -0.45% | -0.42% | 0.59% | -0.33% | -0.01% | -0.20% | |
| NZD | 0.40% | -0.43% | -0.40% | 0.58% | -0.34% | 0.01% | -0.19% | |
| CHF | 0.58% | -0.24% | -0.21% | 0.58% | -0.18% | 0.20% | 0.19% |
The heat map shows percentage changes of major currencies against each other. The base currency is picked from the left column, while the quote currency is picked from the top row. For example, if you pick the Euro from the left column and move along the horizontal line to the US Dollar, the percentage change displayed in the box will represent EUR (base)/USD (quote).
- Gold price holds steady, unfazed by the US Dollar's drop and higher Treasury yields.
- US Dollar Index dips to a five-day low, amidst speculation of fiscal policy changes driving inflation fears.
- Fed's cautious stance on rate cuts highlighted by Governor Cook in light of ongoing economic slowdown and persistent inflation.
Gold prices remained flat at the beginning of the week even though the Greenback is getting battered. Higher United States (US) Treasury bond yields kept the non-yielding metal pressured while US President-elect Donald Trump grabbed the headlines amid confusion on his tariff plans. The XAU/USD trades at $2,638, virtually unchanged.
Yellow Metal failed to capitalize on the sudden weakness of the US Dollar. Speculation that the upcoming Trump administration agenda could reignite inflation spurred a jump in US Treasury yields amid fears that a Republican-controlled Congress could increase the Government’s budget deficit.
The US Dollar Index (DXY), which tracks the buck’s performance against a basket of six currencies, fell to a five-day low of 107.75 and is down 0.60% at 108.27 at the time of writing.
US data revealed during the day reaffirmed that the economy continues to slow down amid a “timid” reacceleration of inflation. S&P Global reported that business activity in the services segment dipped, while the US Census Bureau announced that Factory Orders plunged in November after hitting a record high in the previous month.
In the central bank space, Federal Reserve (Fed) Governor Lisa Cook said they could adopt a gradual approach to reducing interest rates. She explained that due to the resilience of the labor market and persistent inflation, policymakers can be more cautious.
This week, the US economic docket will feature the ISM Services PMI, the Federal Open Market Committee (FOMC) meeting minutes, Initial Jobless Claims and December’s US Nonfarm Payrolls report.
Daily digest market movers: Gold price steadies at around $2,630
- Gold remains pressured as US real yields rise four basis points (bps) up to 2.26%.
- The US 10-year T-note yield edges up two and a half bps to 4.628%.
- US S&P Global Services PMI in December slowed from 58.5 to 56.8, exceeding estimates of 56.1.
- US Factory Orders in November dropped by 0.4% MoM from October’s upwardly revised figures of 0.5%. Economists expected a contraction of -0.3%.
- At the time of writing, the CME Fed Watch Tool shows that investors have pushed back the odds of the Fed's first rate cut until the May 7 meeting.
- Goldman Sachs modified its forecast to gold prices and doesn’t expect the yellow metal to reach $3,000 an ounce by the end of 2025, based on the expectation that the Fed will make fewer rate cuts.
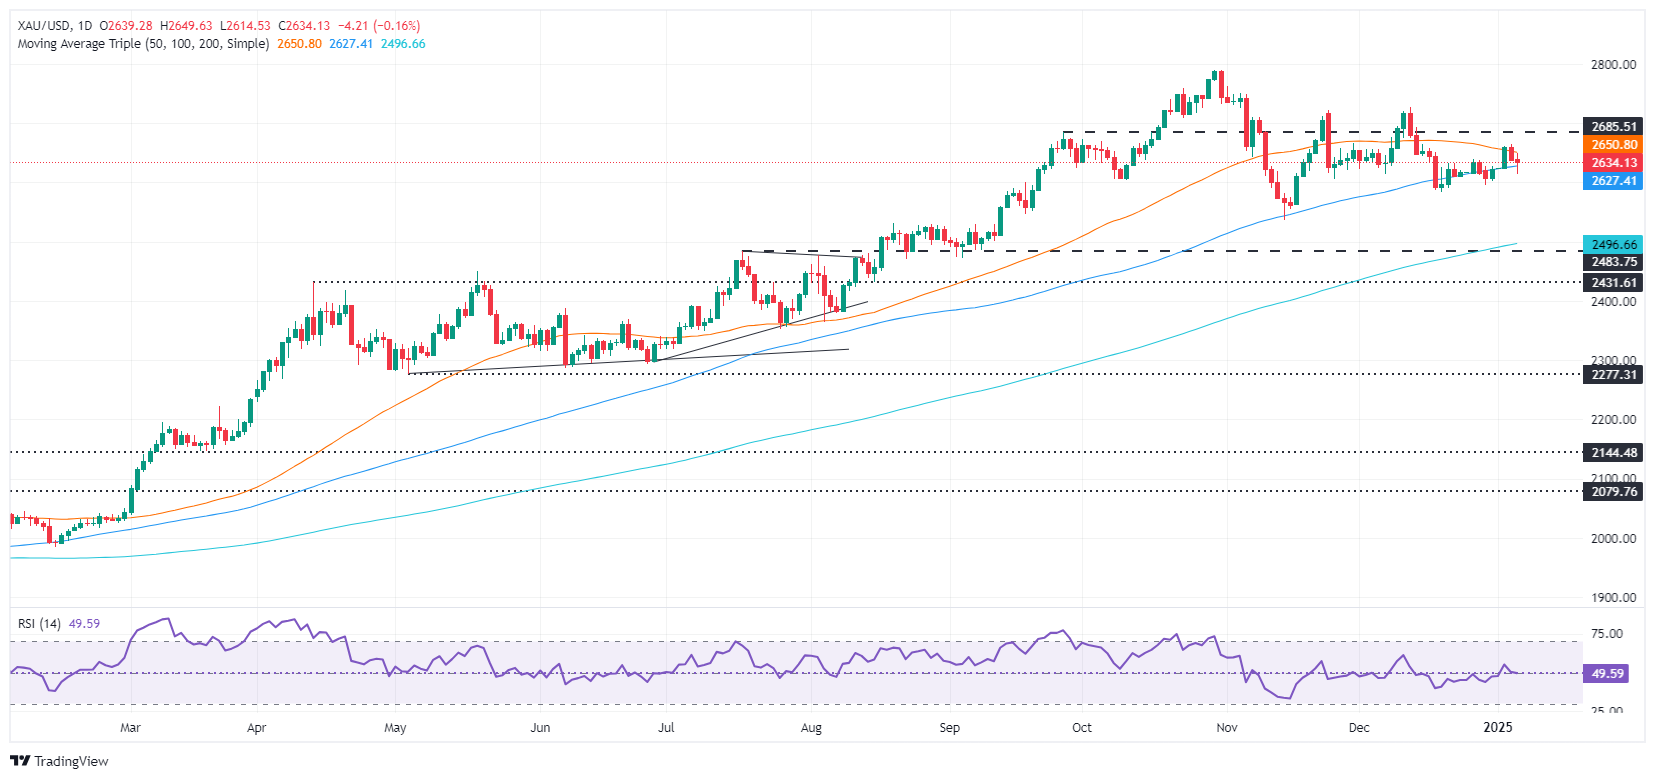
XAU/USD technical outlook: Gold price set to challenge $2,650
Gold price ended 2024 trapped within the $2,600 - $2,620 range amid a robust US Dollar on fears of Trump’s agenda. Nevertheless, the non-yielding metal has broken the top of that range, which opened the door to XAU/USD to exchange hands at around the $2,630 - $2,650 level, with the 50-day Simple Moving Average (SMA) meandering around $2,652.
If bulls clear the 50-day SMA, the next key resistance level would be $2,700 ahead of challenging the December 12 peak at $2,726. If surpassed, the next stop would be the record high at $2,790.
Conversely, if sellers drag the XAU/USD below the 100-day SMA, look for a test of $2,500 before Gold extends its losses to the 200-day SMA at $2,494.
Gold FAQs
Gold has played a key role in human’s history as it has been widely used as a store of value and medium of exchange. Currently, apart from its shine and usage for jewelry, the precious metal is widely seen as a safe-haven asset, meaning that it is considered a good investment during turbulent times. Gold is also widely seen as a hedge against inflation and against depreciating currencies as it doesn’t rely on any specific issuer or government.
Central banks are the biggest Gold holders. In their aim to support their currencies in turbulent times, central banks tend to diversify their reserves and buy Gold to improve the perceived strength of the economy and the currency. High Gold reserves can be a source of trust for a country’s solvency. Central banks added 1,136 tonnes of Gold worth around $70 billion to their reserves in 2022, according to data from the World Gold Council. This is the highest yearly purchase since records began. Central banks from emerging economies such as China, India and Turkey are quickly increasing their Gold reserves.
Gold has an inverse correlation with the US Dollar and US Treasuries, which are both major reserve and safe-haven assets. When the Dollar depreciates, Gold tends to rise, enabling investors and central banks to diversify their assets in turbulent times. Gold is also inversely correlated with risk assets. A rally in the stock market tends to weaken Gold price, while sell-offs in riskier markets tend to favor the precious metal.
The price can move due to a wide range of factors. Geopolitical instability or fears of a deep recession can quickly make Gold price escalate due to its safe-haven status. As a yield-less asset, Gold tends to rise with lower interest rates, while higher cost of money usually weighs down on the yellow metal. Still, most moves depend on how the US Dollar (USD) behaves as the asset is priced in dollars (XAU/USD). A strong Dollar tends to keep the price of Gold controlled, whereas a weaker Dollar is likely to push Gold prices up.
The US Dollar eased on Monday, giving other currencies a chance to recover some much-needed ground as markets gear up for another US NFP jobs print due at the end of the week.
Here’s what you need to know heading into Tuesday, January 7:
The US Dollar Index (DXY) eased lower, falling back below the 109.00 handle and shedding around two-thirds of one percent. Broad-market risk sentiment is back on the rise, pushing the safe haven USD lower across the board. US Nonfarm Payrolls (NFP) due on Friday will be the week’s key reading, however US ISM Services Purchasing Managers Index(PMI) figures are due on Tuesday.
EUR/USD bidders found the buy button on Monday, bolstering Fiber back into the 1.4000- handle. Preliminary European Harmonized Index of Consumer Prices (HICP) inflation is due early in the European market session on Tuesday, and markets will be looking for a slight uptick in headline inflation figures. However, even a bump in near-term inflation numbers are unlikely to spark much fear or greed in traders, as underlying inflation pressures appear to continue to cool.
GBP/USD caught a similar ride at the outside of the new trading week, gaining seven-tenths of one percent and getting muscled back above the 1.2500 handle. UK economic data remains decidedly limited this week, and Cable will be getting pushed around by overall market sentiment in the Greenback more than anything else.
AUD/USD tried to spark a bullish recovery on Monday, but bidding efforts fizzled, dragging Aussie bids back below the 0.6300 handle after briefly tapping the major technical level. Australian Purchasing Managers Index (PMI) figures improved slightly over the weekend, but it still wasn’t enough to firmly push the AUD off of its recent lows.
Economic Indicator
Harmonized Index of Consumer Prices (YoY)
The Harmonized Index of Consumer Prices (HICP) measures changes in the prices of a representative basket of goods and services in the European Monetary Union. The HICP, released by Eurostat on a monthly basis, is harmonized because the same methodology is used across all member states and their contribution is weighted. The YoY reading compares prices in the reference month to a year earlier. Generally, a high reading is seen as bullish for the Euro (EUR), while a low reading is seen as bearish.
Read more.Last release: Wed Dec 18, 2024 10:00
Frequency: Monthly
Actual: 2.2%
Consensus: 2.3%
Previous: 2.3%
Source: Eurostat
Nonfarm Payrolls FAQs
Nonfarm Payrolls (NFP) are part of the US Bureau of Labor Statistics monthly jobs report. The Nonfarm Payrolls component specifically measures the change in the number of people employed in the US during the previous month, excluding the farming industry.
The Nonfarm Payrolls figure can influence the decisions of the Federal Reserve by providing a measure of how successfully the Fed is meeting its mandate of fostering full employment and 2% inflation. A relatively high NFP figure means more people are in employment, earning more money and therefore probably spending more. A relatively low Nonfarm Payrolls’ result, on the either hand, could mean people are struggling to find work. The Fed will typically raise interest rates to combat high inflation triggered by low unemployment, and lower them to stimulate a stagnant labor market.
Nonfarm Payrolls generally have a positive correlation with the US Dollar. This means when payrolls’ figures come out higher-than-expected the USD tends to rally and vice versa when they are lower. NFPs influence the US Dollar by virtue of their impact on inflation, monetary policy expectations and interest rates. A higher NFP usually means the Federal Reserve will be more tight in its monetary policy, supporting the USD.
Nonfarm Payrolls are generally negatively-correlated with the price of Gold. This means a higher-than-expected payrolls’ figure will have a depressing effect on the Gold price and vice versa. Higher NFP generally has a positive effect on the value of the USD, and like most major commodities Gold is priced in US Dollars. If the USD gains in value, therefore, it requires less Dollars to buy an ounce of Gold. Also, higher interest rates (typically helped higher NFPs) also lessen the attractiveness of Gold as an investment compared to staying in cash, where the money will at least earn interest.
Nonfarm Payrolls is only one component within a bigger jobs report and it can be overshadowed by the other components. At times, when NFP come out higher-than-forecast, but the Average Weekly Earnings is lower than expected, the market has ignored the potentially inflationary effect of the headline result and interpreted the fall in earnings as deflationary. The Participation Rate and the Average Weekly Hours components can also influence the market reaction, but only in seldom events like the “Great Resignation” or the Global Financial Crisis.
Federal Reserve (Fed) Board Member and Vice Chair for Supervision will be stepping down from his regulatory role. The announcement came from a Federal Reserve press release and is expected to take place at the end of February.
Fed's Barr to step down from bank oversight role effective February 28, or when a successor is chosen. According to reporting by Reuters, incoming President Donald Trump would be seeking to strip Barr of his position powers. A tactical resignation will make it difficult for Trump to select a 'friendlier' regulatory pick as the resignation means the only candidates on offer are already-existing members of the Fed's board.
Despite resigning from the supervision vice chair position, Barr would remain as part of the Board of Governors until the end of his term in 2026.
As noted by Reuters, "Fed Governor Michelle Bowman, who has been regularly critical of Barr's efforts to impose tougher rules on the banking sector, is widely seen by lobbyists and analysts as a candidate to replace him. Christopher Waller, another Fed governor nominated by Trump in his first term, is viewed as another potential candidate by industry officials."
- The Canadian Dollar gained 0.5% on Monday as the Greenback eases.
- Canada’s Prime Minister has resigned from his post amid fierce criticism.
- CAD markets have responded positively for the time being.
The Canadian Dollar (CAD) caught some wind in its sales on Monday, lifted from recent lows by a market-wide easing in US Dollar flows. CAD markets were further bolstered following the resignation of Canadian Prime Minister Justin Trudeau, at least for the time being.
Canada’s PM Trudeau announced his decision to vacate his position as party leader of the incumbent Liberal party early Monday, leaving the Canadian government in a bit of a lurch as parliament must now prorogue until the Liberal party is able to choose a successor. Key Canadian economic data is due on Friday, but the actual release window will be eclipsed by the US Nonfarm Payrolls (NFP) jobs report due at the same time.
Daily digest market movers: Canadian Dollar lurches higher post-PM resignation
- Canadian Prime Minister Justin Trudeau has resigned as Liberal party leader following over nine years of service as the Prime Minister of Canada.
- Pressure on PM Trudeau to resign was exacerbated in December following Canadian Finance Minister Chrystia Freeland’s resignation, citing Canada’s lack of clear pushback to incoming US President Donald Trump’s tariff threats.
- The Canadian Parliament will now be prorogued until the end of March.
- In their months-long push to oust PM Trudeau, opposition parties within Canada forgot to figure out who would replace him.
- The Canadian Dollar added nearly six-tenths of one percent following the announcement.
Canadian Dollar price forecast
The Canadian Dollar’s bullish bounce to kick off the new trading week pushed price action on the USD/CAD pair back to the 1.4300 handle, but invigorated Loonie bulls weren’t able to hang onto the key technical level. The pair is back into the low side of recent congestion, but CAD is managing to hang onto some of its intraday gains.
The Loonie is struggling to find bidders and recover its stance after a plunge to multi-year lows against the Greenback in recent weeks, and bids continue to churn chart paper near the 1.4400 handle.
USD/CAD daily chart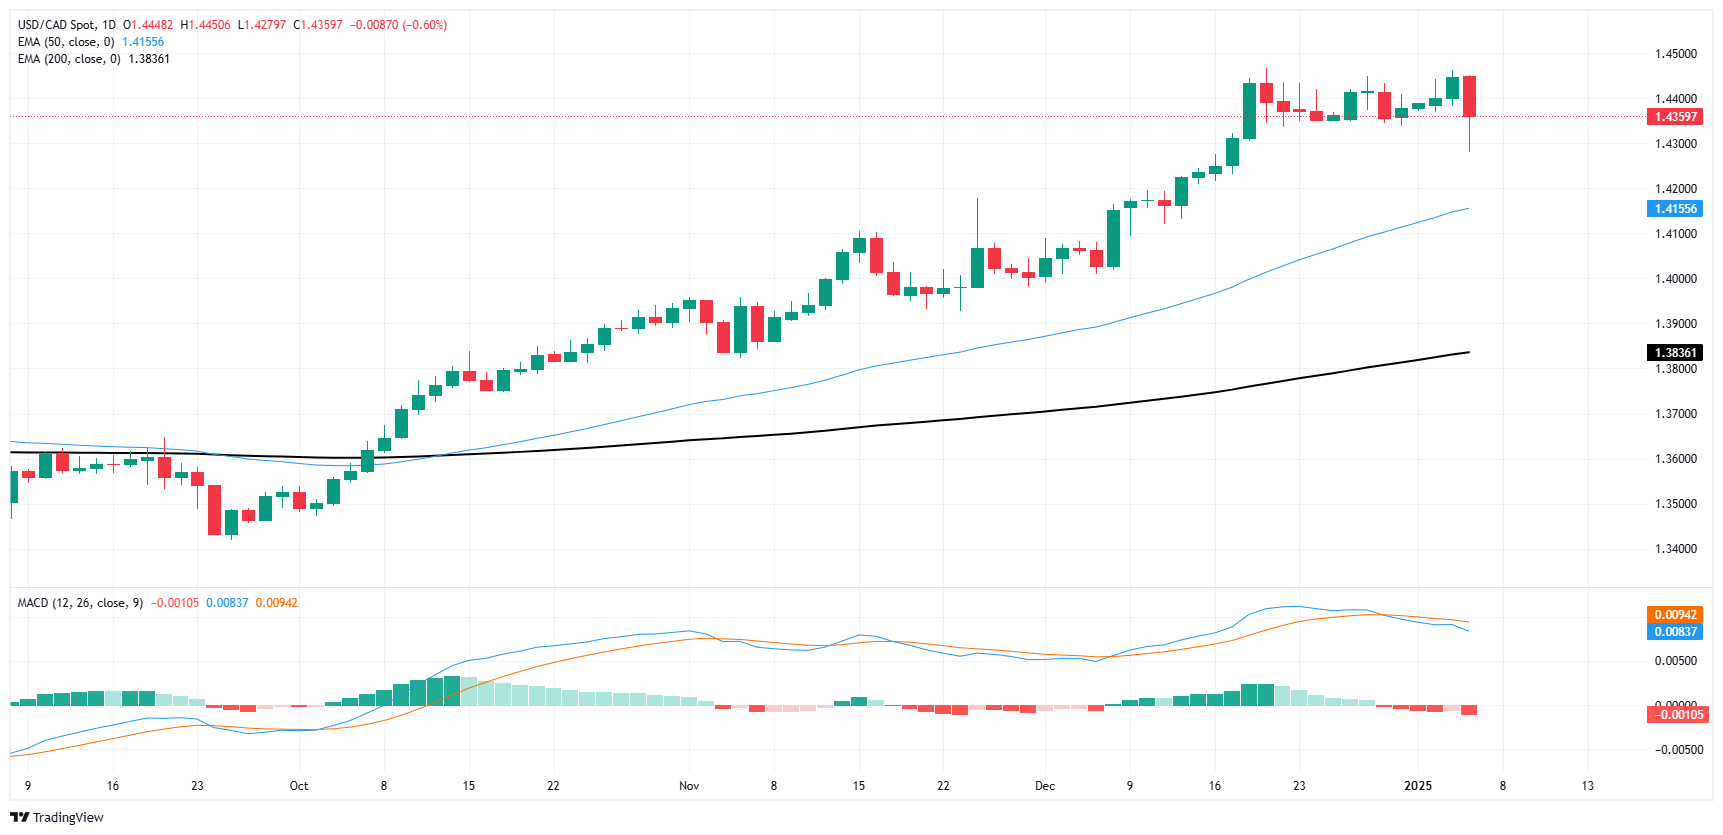
Canadian Dollar FAQs
The key factors driving the Canadian Dollar (CAD) are the level of interest rates set by the Bank of Canada (BoC), the price of Oil, Canada’s largest export, the health of its economy, inflation and the Trade Balance, which is the difference between the value of Canada’s exports versus its imports. Other factors include market sentiment – whether investors are taking on more risky assets (risk-on) or seeking safe-havens (risk-off) – with risk-on being CAD-positive. As its largest trading partner, the health of the US economy is also a key factor influencing the Canadian Dollar.
The Bank of Canada (BoC) has a significant influence on the Canadian Dollar by setting the level of interest rates that banks can lend to one another. This influences the level of interest rates for everyone. The main goal of the BoC is to maintain inflation at 1-3% by adjusting interest rates up or down. Relatively higher interest rates tend to be positive for the CAD. The Bank of Canada can also use quantitative easing and tightening to influence credit conditions, with the former CAD-negative and the latter CAD-positive.
The price of Oil is a key factor impacting the value of the Canadian Dollar. Petroleum is Canada’s biggest export, so Oil price tends to have an immediate impact on the CAD value. Generally, if Oil price rises CAD also goes up, as aggregate demand for the currency increases. The opposite is the case if the price of Oil falls. Higher Oil prices also tend to result in a greater likelihood of a positive Trade Balance, which is also supportive of the CAD.
While inflation had always traditionally been thought of as a negative factor for a currency since it lowers the value of money, the opposite has actually been the case in modern times with the relaxation of cross-border capital controls. Higher inflation tends to lead central banks to put up interest rates which attracts more capital inflows from global investors seeking a lucrative place to keep their money. This increases demand for the local currency, which in Canada’s case is the Canadian Dollar.
Macroeconomic data releases gauge the health of the economy and can have an impact on the Canadian Dollar. Indicators such as GDP, Manufacturing and Services PMIs, employment, and consumer sentiment surveys can all influence the direction of the CAD. A strong economy is good for the Canadian Dollar. Not only does it attract more foreign investment but it may encourage the Bank of Canada to put up interest rates, leading to a stronger currency. If economic data is weak, however, the CAD is likely to fall.
- The Dow Jones clambered back over the 43,000 level on Monday.
- Market sentiment rose after a report that the Trump team might trim tariff plans.
- Final US S&P Global PMIs missed Wall Street forecasts in December but still rose.
The Dow Jones Industrial Average (DJIA) extended into the bullish side to kick off the new trading week, clipping back over the 43,000 handle and lurching 300 points higher after a Washington Post article suggested that incoming President Donald Trump and his team may be considering a more nuanced approach to widespread tariffs the President-elect has threatened to impose shortly after taking office.
Former and returning President Donald Trump was quick to voice resistance to the article, claiming that the Post story was wrong and that the incoming President still intends to impose a sweeping tariff package against most of the US’ closest allies and trading partners. Investors shrugged off the back-and-forth, clinging to the hopes that President Trump will be dissuaded from imposing what amounts to a flat 20% import tax on US consumers.
Final US S&P Global Purchasing Managers Index (PMI) figures somewhat missed the mark on Monday, with the Composite and Services PMIs for December both climbing from one month to the next, albeit less than analysts expected. Both indicators saw a slight downward revision from their preliminary prints, but still gained ground as the US economy churns on.
Dow Jones news
Markets are looking to reignite the tech rally juggernaut in 2025, pushing chipmakers higher and dragging most of the market higher alongside them. Nvidia (NVDA) soared over 4.5%, climbing above $151 per share. A distant second place goes to Goldman Sachs (GS) which rose around 2% to $590 per share.
Dow Jones price forecast
After a tepid start to the new trading year, the bulls are back on the block and the Dow Jones is getting pushed back above the 43,000 handle as bidders try to regain lost ground following the DJIA’s most recent downside plunge. The Dow Jones has rebounded 2.3% from a near-term swing low into the 42,000 region, but bidders still need to drag price action back above the 50-day Exponential Moving Average (EMA) at 43,225 before the bull market can be declared renewed.
Dow Jones daily chart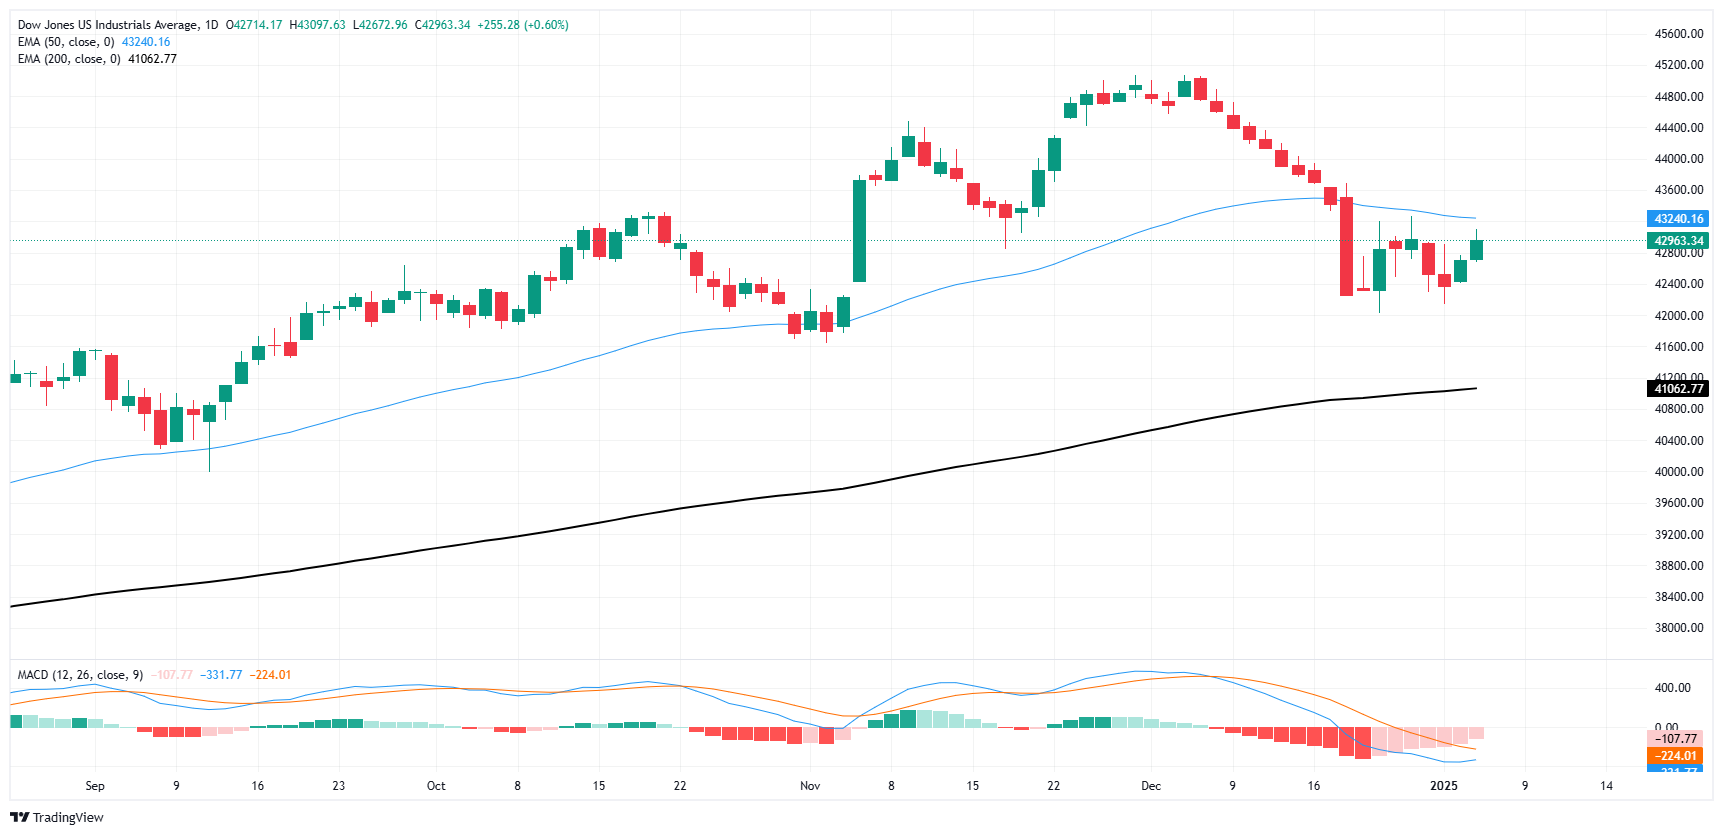
Dow Jones FAQs
The Dow Jones Industrial Average, one of the oldest stock market indices in the world, is compiled of the 30 most traded stocks in the US. The index is price-weighted rather than weighted by capitalization. It is calculated by summing the prices of the constituent stocks and dividing them by a factor, currently 0.152. The index was founded by Charles Dow, who also founded the Wall Street Journal. In later years it has been criticized for not being broadly representative enough because it only tracks 30 conglomerates, unlike broader indices such as the S&P 500.
Many different factors drive the Dow Jones Industrial Average (DJIA). The aggregate performance of the component companies revealed in quarterly company earnings reports is the main one. US and global macroeconomic data also contributes as it impacts on investor sentiment. The level of interest rates, set by the Federal Reserve (Fed), also influences the DJIA as it affects the cost of credit, on which many corporations are heavily reliant. Therefore, inflation can be a major driver as well as other metrics which impact the Fed decisions.
Dow Theory is a method for identifying the primary trend of the stock market developed by Charles Dow. A key step is to compare the direction of the Dow Jones Industrial Average (DJIA) and the Dow Jones Transportation Average (DJTA) and only follow trends where both are moving in the same direction. Volume is a confirmatory criteria. The theory uses elements of peak and trough analysis. Dow’s theory posits three trend phases: accumulation, when smart money starts buying or selling; public participation, when the wider public joins in; and distribution, when the smart money exits.
There are a number of ways to trade the DJIA. One is to use ETFs which allow investors to trade the DJIA as a single security, rather than having to buy shares in all 30 constituent companies. A leading example is the SPDR Dow Jones Industrial Average ETF (DIA). DJIA futures contracts enable traders to speculate on the future value of the index and Options provide the right, but not the obligation, to buy or sell the index at a predetermined price in the future. Mutual funds enable investors to buy a share of a diversified portfolio of DJIA stocks thus providing exposure to the overall index.
- Mexican Peso appreciates, pushing USD/MXN down over 1.5% to 20.28 following tariff speculation in The Washington Post.
- US services sector decelerates in December, compounding investor caution amidst fluctuating equity markets.
- Falling Mexican consumer confidence adds to local economic concerns.
The Mexican Peso begins the week positively, appreciating against the US Dollar on Monday after The Washington Post reported that Trump aides are only considering tariffs on “certain sectors”, a less harsh policy than floated earlier. Nevertheless, US President-elect Trump said the story “incorrectly states that my tariff policy will be pared back.” Despite this, the USD/MXN tumbled over 1.50% to trade at 20.28 at the time of writing.
Market sentiment is upbeat, yet traders remain wary of Trump’s remarks on his social network. US equities wavered after The Washington Post article, yet they are still holding their gains following Trump’s latest remarks.
Recent data revealed that US business activity in the services segment decelerated in December, based on data from S&P Global. Additionally, Factory Orders in November shrank after strong figures in October.
Meanwhile, Federal Reserve Governor Lisa Cook revealed that the US central bank could adopt a cautious approach with additional interest rate cuts, given a solid economy and inflation that is stickier than expected.
Across the south of the border, the Instituto Nacional de Estadistica Geografia e Informatica (INEGI) announced that Mexican consumers turned pessimistic near the end of 2024 as Consumer Confidence fell for the second straight month in December.
Daily digest market movers: Mexican Peso boosted by weak US Dollar
- The US Dollar Index (DXY) is falling to a five-day low of 107.75, a headwind for the USD/MXN exotic pair.
- The DXY weakness was spurred by The Washington Post's article about Trump’s tariff plans.
- US S&P Global Services PMI in December slowed from 58.5 to 56.8, exceeding estimates of 56.1.
- US Factory Orders in November dropped by 0.4% MoM from October’s upwardly-revised figures of 0.5%. Economists expected a contraction of -0.3%.
- Mexico’s Consumer Confidence in December was 47.1, down from 47.6 in the previous month, according to the national statistics agency on Monday.
- S&P Global revealed that the US Services PMI dipped to 56.8 from 58.5, higher than forecasts of 56.1.
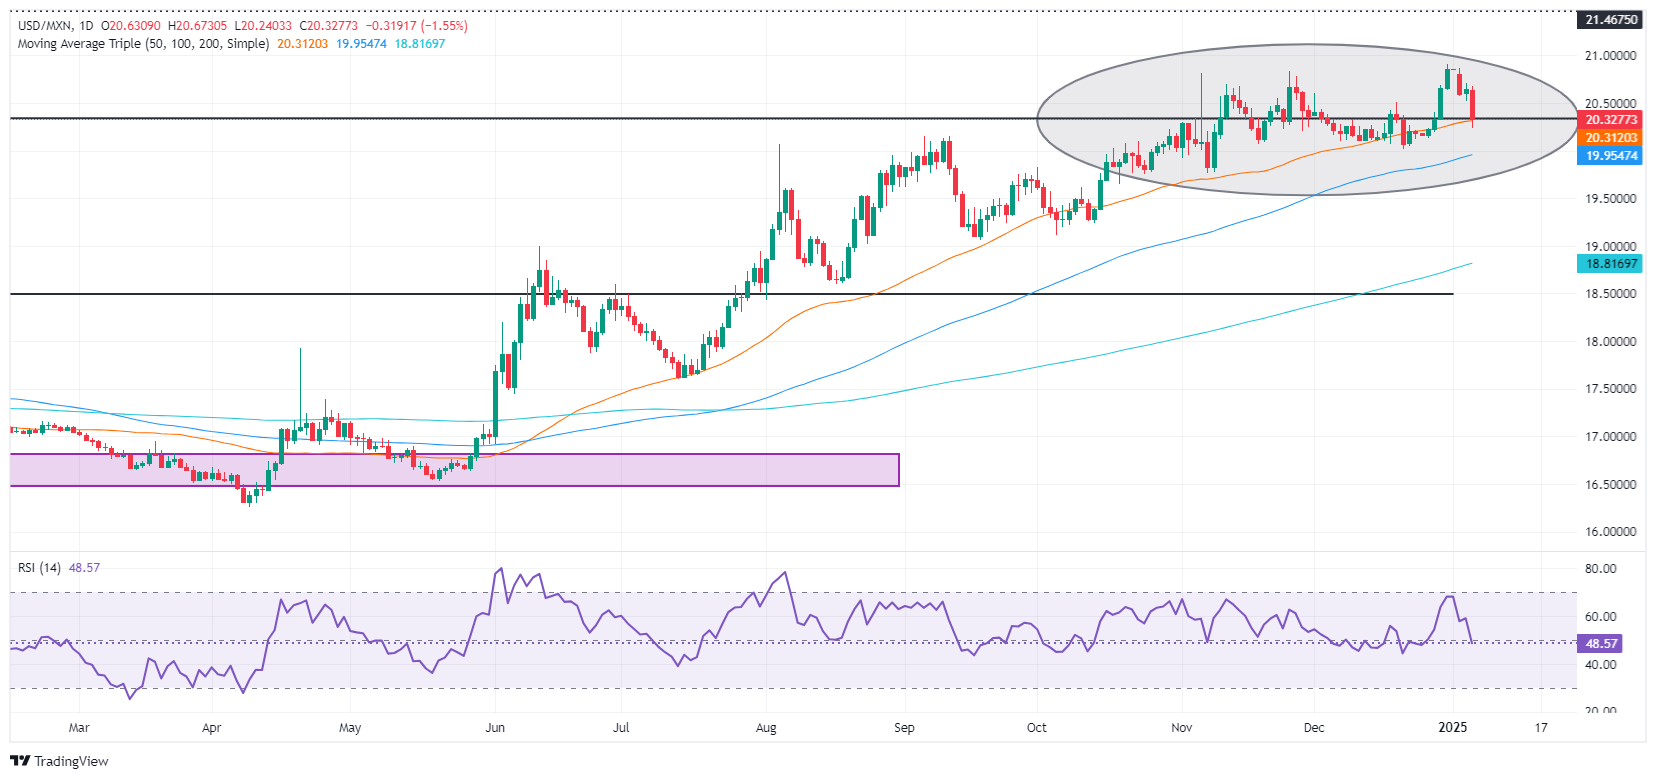
USD/MXN technical outlook: Mexican Peso strengthens, testing key level ahead 20.00
The USD/MXN is falling sharply, testing the 50-day Simple Moving Average (SMA) at 20.26. The Relative Strength Index (RSI) turned bearish, opening the door for further Mexican Peso strength. If sellers push prices below the latter, they could challenge the 20.00 figure. On further weakness, the pair could drop to the 100-day SMA at 19.89, followed by the 19.50 figure.
On the other hand, if buyers stepped in and lifted the USD/MXN above 20.50, the next key resistance would be the year-to-date (YTD) high of 20.90 before testing 21.00. A breach of the latter will expose the March 8, 2022 peak of 21.46.
Mexican Peso FAQs
The Mexican Peso (MXN) is the most traded currency among its Latin American peers. Its value is broadly determined by the performance of the Mexican economy, the country’s central bank’s policy, the amount of foreign investment in the country and even the levels of remittances sent by Mexicans who live abroad, particularly in the United States. Geopolitical trends can also move MXN: for example, the process of nearshoring – or the decision by some firms to relocate manufacturing capacity and supply chains closer to their home countries – is also seen as a catalyst for the Mexican currency as the country is considered a key manufacturing hub in the American continent. Another catalyst for MXN is Oil prices as Mexico is a key exporter of the commodity.
The main objective of Mexico’s central bank, also known as Banxico, is to maintain inflation at low and stable levels (at or close to its target of 3%, the midpoint in a tolerance band of between 2% and 4%). To this end, the bank sets an appropriate level of interest rates. When inflation is too high, Banxico will attempt to tame it by raising interest rates, making it more expensive for households and businesses to borrow money, thus cooling demand and the overall economy. Higher interest rates are generally positive for the Mexican Peso (MXN) as they lead to higher yields, making the country a more attractive place for investors. On the contrary, lower interest rates tend to weaken MXN.
Macroeconomic data releases are key to assess the state of the economy and can have an impact on the Mexican Peso (MXN) valuation. A strong Mexican economy, based on high economic growth, low unemployment and high confidence is good for MXN. Not only does it attract more foreign investment but it may encourage the Bank of Mexico (Banxico) to increase interest rates, particularly if this strength comes together with elevated inflation. However, if economic data is weak, MXN is likely to depreciate.
As an emerging-market currency, the Mexican Peso (MXN) tends to strive during risk-on periods, or when investors perceive that broader market risks are low and thus are eager to engage with investments that carry a higher risk. Conversely, MXN tends to weaken at times of market turbulence or economic uncertainty as investors tend to sell higher-risk assets and flee to the more-stable safe havens.
- GBP/USD fluctuates between 1.2450 and 1.2550 after conflicting reports on US tariff plans by President-elect Trump.
- UK services sector momentum slows as December S&P Global Services PMI drops from 51.4 to 51.1.
- Federal Reserve Governor Lisa Cook hints at cautious rate cuts amidst persistent inflation and strong labor market.
The Pound Sterling begins the week on the front foot against the US Dollar after news emerged that US President-elect Trump's aides are considering tariffs on “certain sectors,” according to the Washington Post. Nevertheless, recent news headlines suggested that Trump backpedaled, saying the Washington Post story was wrong. The GBP/USD is trading volatile within the 1.2450 – 1.2550 range as market players diggest recent news.
GBP/USD sees volatile trading as markets react to mixed signals from the US and UK economic indicators
According to three people familiar with the matter, a Washington Post story revealed that tariffs are considered but only cover critical imports.
Data-wise, the UK economic docket revealed that British business in the services sector had lost momentum, as shown by the December S&P Global Services PMI, which dipped from 51.4 to 51.1.
The British Chambers of Commerce also revealed on Sunday that confidence fell to its lowest level since former PM Liz Truss's “mini-budget” in 2022. According to Reuters, “Businesses were the least happy about taxation since they started asking about this in 2017, while confidence about sales over the next 12 months was the lowest since late 2022.”
In the meantime, Federal Reserve (Fed) Governor Lisa Cook said they can proceed more cautiously in cutting rates due to stickier inflation and labor market resilience.
Recently, S&P Global revealed that the Services PMI for the US dupped to 56.8 from 58.5, higher than forecasts of 56.1
GBP/USD Price Forecast: Technical outlook
The GBP/USD daily chart suggests further downside is seen unless buyers achieve a daily close above November’s 22 swing low of 1.2486. This would shift the bias to neutral-downwards and open the door to challenge the next key resistance at 1.2607, December’s 30 peak.
Conversely, if GBP/USD remains below 1.2500, the pair could consolidate within the 1.2480 – 1.2500 range before sellers push prices towards 1.2400.
British Pound PRICE Today
The table below shows the percentage change of British Pound (GBP) against listed major currencies today. British Pound was the strongest against the Japanese Yen.
| USD | EUR | GBP | JPY | CAD | AUD | NZD | CHF | |
|---|---|---|---|---|---|---|---|---|
| USD | -0.83% | -0.72% | 0.08% | -0.86% | -0.78% | -0.71% | -0.59% | |
| EUR | 0.83% | 0.11% | 0.87% | 0.02% | 0.08% | 0.15% | 0.27% | |
| GBP | 0.72% | -0.11% | 0.79% | -0.09% | -0.02% | 0.05% | 0.16% | |
| JPY | -0.08% | -0.87% | -0.79% | -0.91% | -0.80% | -0.72% | -0.41% | |
| CAD | 0.86% | -0.02% | 0.09% | 0.91% | 0.01% | 0.11% | 0.24% | |
| AUD | 0.78% | -0.08% | 0.02% | 0.80% | -0.01% | 0.07% | 0.19% | |
| NZD | 0.71% | -0.15% | -0.05% | 0.72% | -0.11% | -0.07% | 0.11% | |
| CHF | 0.59% | -0.27% | -0.16% | 0.41% | -0.24% | -0.19% | -0.11% |
The heat map shows percentage changes of major currencies against each other. The base currency is picked from the left column, while the quote currency is picked from the top row. For example, if you pick the British Pound from the left column and move along the horizontal line to the US Dollar, the percentage change displayed in the box will represent GBP (base)/USD (quote).
In response to the Washington Post story that said US President-elect Donald Trump's aides are considering tariffs that would be applied to every country but only cover critical imports, Trump said it was wrong.
"The story in the Washington Post, quoting so-called anonymous sources, which don't exist, incorrectly states that my tariff policy will be pared back. That is wrong. The Washington Post knows it's wrong. It's just another example of Fake News," Trump posted on Truth Social.
Market reaction
The US Dollar Index recovered from session lows following this development and was last seen losing 0.6% on the day at 108.25.
Federal Reserve (Fed) Governor Lisa Cook said on Monday that Fed policymakers could be more cautious with further rate cuts, citing labor market resilience and stickier inflation, per Reuters.
Key takeaways
"Risks to Fed’s inflation and employment goals are roughly in balance."
"US starts the year in strong shape, with a solid job market and growth, and inflation likely to fall gradually to 2%."
"Several reasons including strong business starts, AI investment, to believe productivity growth will continue."
"Private credit, AI, among the areas that could impact financial stability and need to be better understood."
"AI could hold benefits in terms of financial innovation, but also pose risks if models share biases or errors."
Market reaction
The US Dollar Index recover from session lows but remains in negative territory. At the time of press, the index was down 0.5% on the day at 108.38.
The Euro (EUR) is extending gains in early trade, rising more than 1% on the day, Scotiabank’s Chief FX Strategist Shaun Osborne notes.
EUR outperforms on the day
“After steadying late last week following a test of the mid-1.02 area, EUR gains are pushing on strongly today. Final Eurozone Composite and Services PMI data were revised higher for December on solid upgrades to both French and German reports.”
“Initial German state CPI for December are coming in hotter than forecast, meanwhile, adding to EUR support as markets trim ECB easing bets. EURUSD could push on to the 1.0500/50 range.”
“Solid EUR gains on the intraday and daily charts today suggest a little more upside potential in the EUR in the short run at least. Chart signals are not obviously bullish and the broader downtrend persists. But an oversold EUR might be able to extend gains through 1.0460 resistance to test stronger technical resistance at 1.0500/50. Support is 1.0375.”
The Canadian Dollar (CAD) perked up notably overnight on news that PM Trudeau may resign this week. Reports suggesting President-elect Trump might moderate plans for a broad application of tariffs have added to gains, Scotiabank’s Chief FX Strategist Shaun Osborne notes.
Spot losses need to hold this break below 1.4335
“Clarity on the domestic political front would be welcome but if the PM does step down, a lengthy leadership contest for the Liberals would presumably follow. Estimates have indicated that this could take up to three months. Parliament might be suspended while all that is taking place. Opposition parties will press for an election, which will also take time to organize.”
“The CAD is getting some welcome relief from the headlines in the short run but it may yet be some time before the political fog clears at home. On Friday, I noted that the charts were showing no obvious sign of the USD bull trend relenting. The technical outlook has changed dramatically so far today, however.”
“After consolidating around the 1.44 point over the turn of the year, spot is triggering a (1.4465) double top pattern on the daily chart. The break (so far) under the intervening low at 1.4335 suggests a potential drop in the USD back to the 1.4200/10 area in the next 1-2 weeks. Spot losses need to hold this break below 1.4335 though.”
The US Dollar (USD) is down for a second trading session in a row. I noted last week that broad dollar gains were looking stretched, with the DXY trading some two standard deviations above its estimated fair value, based on short-term rate spreads, Scotiabank’s Chief FX Strategist Shaun Osborne notes.
USD dips to remain well supported in the weeks ahead
“That situation persists and may be acting as a restraint on the USD. The week ahead is likely to reaffirm the US exceptionalism narrative surrounding the USD’s recent strength, however, so scope for losses may be limited. Key calendar risks this week take the form of Wednesday’s December FOMC minutes—a ‘closer call’ on the policy hike decision where one policymaker dissented should make for a somewhat hawkish read on the outlook— and Friday’s NFP data should reflect a still resilient US labor market.”
“USD losses are picking up in early trade, however, following reports in the Washington Post that President Trump is mulling a ‘universal tariff’ only on ‘critical imports’. That represents something of a downgrade—perhaps– on the pre-election threat of broad-based tariffs. The CAD was a top-performer in overnight trade but has ceded that spot to the MXN following the tariff report headlines. Stocks have welcomed signs that trade risks might be dialed back. European automakers’ share prices are rising.”
“‘Rightsizing’ the USD’s value to its estimated fair value (105 currently) would reflect a decent correction in the DXY’s late 2024/early 2025 rally (retracement supports sit at 105.95/104.85). Healthy yield spreads, USD-positive seasonals through Q1 and other USD-supportive aspects of the Trump 2.0 platform suggest that USD dips will remain well supported on dips in the weeks ahead.”
- Annual inflation in Germany rose more than expected in December.
- EUR/USD clings to strong daily gains above 1.0400 after the data.
Inflation in Germany, as measured by the change in the Consumer Price Index (CPI), rose to 2.6% on a yearly basis in December from 2.2% in November, Destatis' flash estimate showed on Monday. This reading came in above the market expectation of 2.4%.
On a monthly basis, the CPI rose 0.4% after declining 0.2% in November.
The Harmonized Index of Consumer Prices in Germany, the European Central Bank's preferred gauge of inflation, increased 2.9% on a yearly basis, surpassing the market expectation for an increase of 2.6%.
Market reaction
EUR/USD preserves its bullish momentum after German inflation data and was last seen gaining 1.05% on the day at 1.0415.
Inflation FAQs
Inflation measures the rise in the price of a representative basket of goods and services. Headline inflation is usually expressed as a percentage change on a month-on-month (MoM) and year-on-year (YoY) basis. Core inflation excludes more volatile elements such as food and fuel which can fluctuate because of geopolitical and seasonal factors. Core inflation is the figure economists focus on and is the level targeted by central banks, which are mandated to keep inflation at a manageable level, usually around 2%.
The Consumer Price Index (CPI) measures the change in prices of a basket of goods and services over a period of time. It is usually expressed as a percentage change on a month-on-month (MoM) and year-on-year (YoY) basis. Core CPI is the figure targeted by central banks as it excludes volatile food and fuel inputs. When Core CPI rises above 2% it usually results in higher interest rates and vice versa when it falls below 2%. Since higher interest rates are positive for a currency, higher inflation usually results in a stronger currency. The opposite is true when inflation falls.
Although it may seem counter-intuitive, high inflation in a country pushes up the value of its currency and vice versa for lower inflation. This is because the central bank will normally raise interest rates to combat the higher inflation, which attract more global capital inflows from investors looking for a lucrative place to park their money.
Formerly, Gold was the asset investors turned to in times of high inflation because it preserved its value, and whilst investors will often still buy Gold for its safe-haven properties in times of extreme market turmoil, this is not the case most of the time. This is because when inflation is high, central banks will put up interest rates to combat it. Higher interest rates are negative for Gold because they increase the opportunity-cost of holding Gold vis-a-vis an interest-bearing asset or placing the money in a cash deposit account. On the flipside, lower inflation tends to be positive for Gold as it brings interest rates down, making the bright metal a more viable investment alternative.
- Markets are bouncing around after a quick surge in position last week.
- A Fed interest rate cut in January is mostly out of the cards at the moment.
- Gold price is stuck in a pennant technical formation as pressure builds for a breakout.
Gold’s price (XAU/USD) stabilizes near $2,640 on Monday after a quick sprint higher the first trading day of 2025 as traders were quite eager and quick to reopen their trimmed positions they had ahead of Christmas. Since then, Gold prices have started to soften a touch, despite US yields remaining rather elevated.
Although Gold prices might be consolidating, the number of moving parts on the geopolitical front is picking up. Italian Prime Minister Giorgia Meloni broke out of the European joint stance and visited President-elect Donald Trump on her own accord. Meanwhile, Canadian Prime Minister Justin Trudeau looks set to resign this week, according to Bloomberg News.
Daily digest market movers: Gold still has more room to consolidation
- According to the Washington Post President-elect Donald Trump is mulling to simplify its tariff approach by issuing a global tariff only on critical US imports.
- Markets are heading into the first normal trading week of 2025 with a very crammed economic calendar ahead, with the US Nonfarm Payrolls release on Friday as the focal point of the week.
- The US 10-year yield rallied to 4.639% last week, a fresh 7-month high. This Monday, it is settling down near 4.62%.
- The CME Fedwatch tool is currently only showing a small 10% chance for a 25 basis points (bps) interest rate cut in January. Further on, expectations are for the Fed to remain data-dependent with uncertainties that could influence the inflation path once President-elect Donald Trump takes office on January 20.
- Several European countries released their individual Purchasing Manager Indexes (PMIs) for the Services sector. France, Germany, and Spain saw a nice rebound, with some minor beats on expectations.
Technical Analysis: Gold stuck in broad consolidation
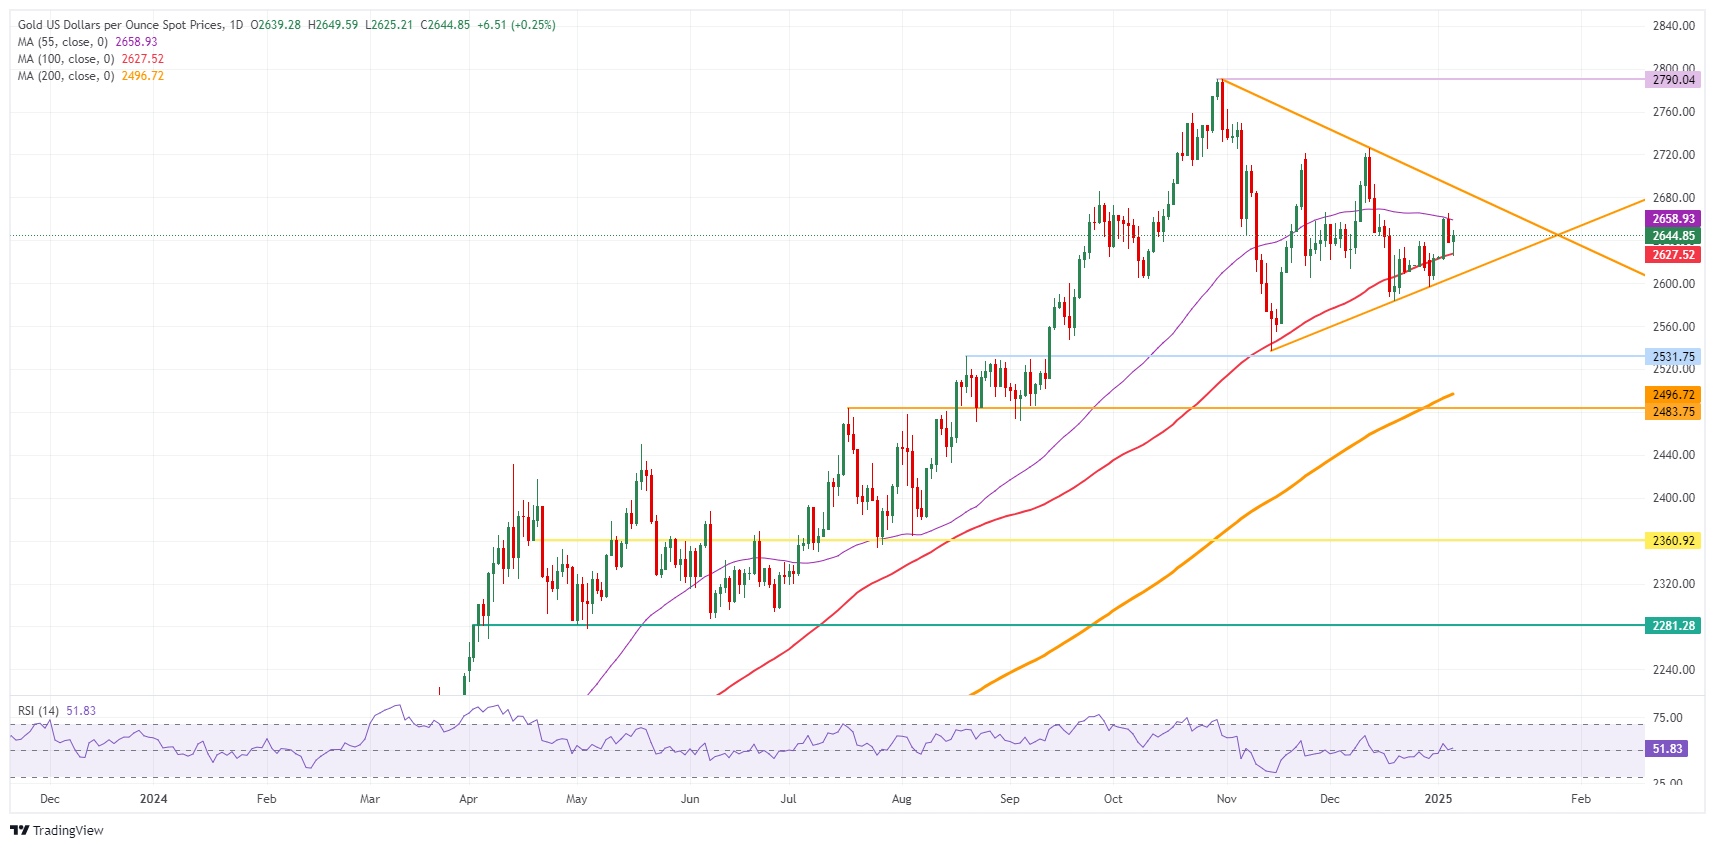
From a technical point of view, Gold price is stuck in a pennant chart formation as it respects an ascending and descending trend line. A breakout could be due at any time, although that is expected a bit later, with buyers and sellers being pushed towards each other.
On the downside, the 100-day Simple Moving Average (SMA) at $2,627is holding for now, although it is under pressure. The ascending trend line of the pennant pattern should provide support around $2,606 as it did in the past three occasions. In case that support line snaps, a quick decline to $2,531 could come back into play as support level.
On the upside, the 55-day SMA at $2,658 is the first level to beat. It will not be an easy task as it was already proved twice last week as a firm resistance. In case it breaks through, $2,690 will be the ultimate upside level in the form of the descending trendline in the pennant formation.
XAU/USD: Daily Chart
Gold FAQs
Gold has played a key role in human’s history as it has been widely used as a store of value and medium of exchange. Currently, apart from its shine and usage for jewelry, the precious metal is widely seen as a safe-haven asset, meaning that it is considered a good investment during turbulent times. Gold is also widely seen as a hedge against inflation and against depreciating currencies as it doesn’t rely on any specific issuer or government.
Central banks are the biggest Gold holders. In their aim to support their currencies in turbulent times, central banks tend to diversify their reserves and buy Gold to improve the perceived strength of the economy and the currency. High Gold reserves can be a source of trust for a country’s solvency. Central banks added 1,136 tonnes of Gold worth around $70 billion to their reserves in 2022, according to data from the World Gold Council. This is the highest yearly purchase since records began. Central banks from emerging economies such as China, India and Turkey are quickly increasing their Gold reserves.
Gold has an inverse correlation with the US Dollar and US Treasuries, which are both major reserve and safe-haven assets. When the Dollar depreciates, Gold tends to rise, enabling investors and central banks to diversify their assets in turbulent times. Gold is also inversely correlated with risk assets. A rally in the stock market tends to weaken Gold price, while sell-offs in riskier markets tend to favor the precious metal.
The price can move due to a wide range of factors. Geopolitical instability or fears of a deep recession can quickly make Gold price escalate due to its safe-haven status. As a yield-less asset, Gold tends to rise with lower interest rates, while higher cost of money usually weighs down on the yellow metal. Still, most moves depend on how the US Dollar (USD) behaves as the asset is priced in dollars (XAU/USD). A strong Dollar tends to keep the price of Gold controlled, whereas a weaker Dollar is likely to push Gold prices up.
US President-elect Donald Trump's aides are considering tariffs that would be applied to every country but only cover critical imports, the Washington Post reported on Monday, per Reuters.
"The current discussions center on imposing tariffs only on certain sectors deemed critical to national or economic security," three people familiar with the matter told the Washington Post.
Market reaction
The US Dollar (USD) came under renewed selling pressure following this report and US stock index futures started to push higher, reflecting a positive impact on risk mood. At the time of press, the USD Index was down 0.9% on the day at 107.95.
Risk sentiment FAQs
In the world of financial jargon the two widely used terms “risk-on” and “risk off'' refer to the level of risk that investors are willing to stomach during the period referenced. In a “risk-on” market, investors are optimistic about the future and more willing to buy risky assets. In a “risk-off” market investors start to ‘play it safe’ because they are worried about the future, and therefore buy less risky assets that are more certain of bringing a return, even if it is relatively modest.
Typically, during periods of “risk-on”, stock markets will rise, most commodities – except Gold – will also gain in value, since they benefit from a positive growth outlook. The currencies of nations that are heavy commodity exporters strengthen because of increased demand, and Cryptocurrencies rise. In a “risk-off” market, Bonds go up – especially major government Bonds – Gold shines, and safe-haven currencies such as the Japanese Yen, Swiss Franc and US Dollar all benefit.
The Australian Dollar (AUD), the Canadian Dollar (CAD), the New Zealand Dollar (NZD) and minor FX like the Ruble (RUB) and the South African Rand (ZAR), all tend to rise in markets that are “risk-on”. This is because the economies of these currencies are heavily reliant on commodity exports for growth, and commodities tend to rise in price during risk-on periods. This is because investors foresee greater demand for raw materials in the future due to heightened economic activity.
The major currencies that tend to rise during periods of “risk-off” are the US Dollar (USD), the Japanese Yen (JPY) and the Swiss Franc (CHF). The US Dollar, because it is the world’s reserve currency, and because in times of crisis investors buy US government debt, which is seen as safe because the largest economy in the world is unlikely to default. The Yen, from increased demand for Japanese government bonds, because a high proportion are held by domestic investors who are unlikely to dump them – even in a crisis. The Swiss Franc, because strict Swiss banking laws offer investors enhanced capital protection.
USD/JPY continued to hover near recent highs. BOJ Governor Ueda reiterated that BOJ will raise policy rate if economic conditions continue to improve this year. Pair was last seen trading at 157.63, OCBC’s FX analysts Frances Cheung and Christopher Wong note.
USD/JPY may face intermittent upward pressure
“He added that timing of rate adjustments will depend on the economy, inflation and financial conditions. He also highlighted that the momentum for wage hike is a key point when considering rate hikes. He has been putting a lot of focus on wages but avoided to hint at timing and pace of rate cut.”
“Chance of hike at the next MPC (24 Jan) is probably still live. But for now, the reluctance of BOJ and the guidance for Fed pause suggests that USD/JPY may continue to face intermittent upward pressure.”
“Bullish momentum on daily chart has faded but dip in RSI also moderated. Pair may consolidation for now until a new catalyst (or hint) comes along. Resistance at 158, 158.90 levels. Support at 156.67 (76.4% fibo retracement of Jul high to Sep low), 155.70 (21 DMA).”
A media report is suggesting the Canada’s prime minister Justin Trudeau will resign as leader of the Liberal Party this week. That would not necessarily lead to early elections, as a leadership contest would take place to select a new prime minister. Anyway, elections will be held in October at the latest, and the opposition Conservative Party has a vast lead in the polls, ING’s FX analyst Francesco Pesole notes.
Upside risks for USD/CAD can extend to 1.50
“The Canadian dollar (CAD) reacted positively to the report and USD/CAD has reversed Friday’s rally. The move was quite small compared to the magnitude of the Loonie’s depreciation in December, signaling only very cautious optimism that this development can lower the risk of Canada being hit by US tariffs.”
“We discuss the outlook for CAD in light of Trump’s protectionism threat in this note, and our bottom line remains that upside risks for USD/CAD could extend to 1.50 in the event of a fully-fledged North American trade war. In the coming days, expect CAD to be very sensitive to any political news and the potential implications for US-Canada trade relationships.”
“Canada’s jobs figures are also released on Friday, but that is now a secondary input for the Bank of Canada compared to the risk of US tariffs.”
US Dollar (USD) eased slightly from the year’s high after while FX flows gradually normalised post-holiday liquidity. DXY was last seen at 108.63. On Fedspeaks, Barkin said they would keep interest rates restrictive for longer if inflation gets stuck but so far the path has been towards 2%, OCBC’s FX analysts Frances Cheung and Christopher Wong note.
Potential bearish divergence on daily RSI
“After a 100-basis point recalibration of the benchmark rate in 2024 it would be sensible to cut again if new data show inflation has sustainably fallen to 2% or if weak demand ensured inflation would fall too. Daly and Kugler stressed that the Fed must continue to battle against post-pandemic price surges while noting progress in lowering price pressures over the past 2 years.”
“Markets are largely expecting Fed to pause at the upcoming FOMC (29 Jan). For the year, markets have already adjusted their expectations – now expecting only 38bp cut in total (less than 2 cuts). There is a slew of data this week, including JOLTS job openings, ISM services (Tue); ADP employment (Wed); FOMC minutes (Thu) and payrolls report (Fri).”
“Given that USD has enjoyed a significant run-up, we caution that downside surprise to US data, in particular payrolls report, may dent USD’s momentum. Daily momentum is mild bullish while RSI eased lower from overbought conditions. Potential bearish divergence on daily RSI observed. Pullback lower not ruled out. Support at 108.60, 107.60 (21 DMA). Resistance at 109.50 levels (recent high), 110.10 levels.”
- The Euro bounces further against the US Dollar on Monday after hitting 1.0224 last week.
- Traders assess the impact of the political turmoil in Italy, Austria, and Canada.
- Markets assess European PMI and preliminary Germany’s inflation data for December this Monday.
The Euro is setting forth a second day of recovery and trades above 1.0350 at the time of writing on Monday, heading further away from the fresh 2-year low of 1.0224 seen on Thursday. The positive move is further bolstered by the December Purchasing Managers Index (PMI) releases, with Spanish, Italian, French, German, and the broader Eurozone data recovering from prior month readings and beating expectations.
Markets are also sending the Euro higher due to global political turmoil. Italian Prime Minister Giorgia Meloni broke the unified European ranks by visiting President-elect Donald Trump at Mar-a-Lago, while Canadian Prime Minister Justin Trudeau is set to resign this week, according to Bloomberg News.
Meanwhile, markets are bracing for the first normal trading week of the year regarding the economic calendar. Traders will return to their trading desks, and financial markets are expected to run back to their normal capacity. It is a very packed calendar for both Europe and the US, with the US Nonfarm Payrolls release on Friday as the main focal point for this week.
Daily digest market movers: Euro strikes back
- The Spanish HCOB PMI for the Services sector came in at 57.3, above the 54.1 expected and the 53.1 previous reading.
- The Italian HCOB Services PMI recovered from contraction and came in at 50.7, above the 50.0 estimate and better than the previous 49.2 reading.
- France’s HCOB Services PMI rebounded to 49.3, coming from 48.2 the previous month and beating the estimate of 48.2.
- Germany’s HCOB Services PMI reading came in at 51.6, above the estimate and previous reading of 51.4.
- The German Consumer Price Index (CPI) is set to be released at 13:00 GMT. The December preliminary reading is expected to tick up by 0.4% on a monthly basis compared to the -0.2% in the prior month. The preliminary CPI is expected to rise to 2.4% year-over-year.
- At 14:45 GMT, S&P Global will publish the US Services PMI reading. The final December reading is expected to remain stable at 58.5.
Technical Analysis: EUR/USD tries to head back to 1.04
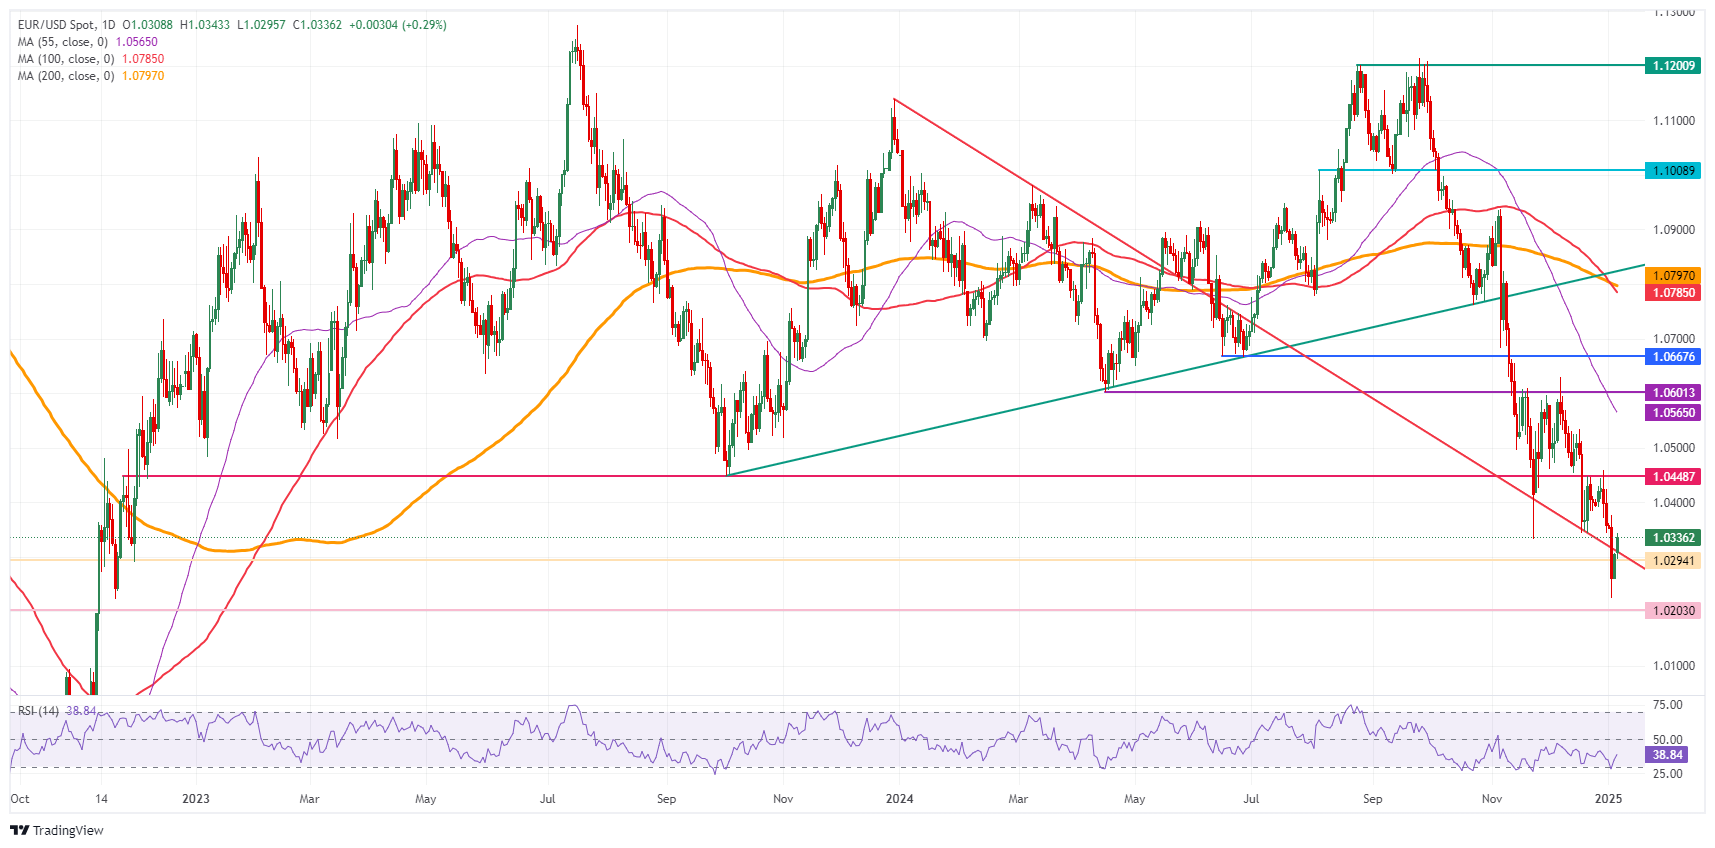
EUR/USD has seen traders quickly add to their short positions that were unwinded before Christmas, triggering a meltdown to 1.0224 last week. With the oversold Relative Strength Index (RSI), a bounce could unfold to 1.04 or even 1.0448 if the current European data adds to the momentum.
On the upside, the 1.04 big figure is the first level to watch for. Next is the pivotal level at 1.0448, the low of October 3rd, 2023. Once through that level, the 55-day Simple Moving Average (SMA) at 1.0565 comes into play.
On the downside, the current two-year low at 1.0224 is the first support to be retested. Further down, the pivotal level at 1.02 would mean a fresh two-year low. That would open up the room to head to parity, with 1.0100 as the last man standing before that magical 1.00 level.
EUR/USD: Daily Chart
Euro FAQs
The Euro is the currency for the 19 European Union countries that belong to the Eurozone. It is the second most heavily traded currency in the world behind the US Dollar. In 2022, it accounted for 31% of all foreign exchange transactions, with an average daily turnover of over $2.2 trillion a day. EUR/USD is the most heavily traded currency pair in the world, accounting for an estimated 30% off all transactions, followed by EUR/JPY (4%), EUR/GBP (3%) and EUR/AUD (2%).
The European Central Bank (ECB) in Frankfurt, Germany, is the reserve bank for the Eurozone. The ECB sets interest rates and manages monetary policy. The ECB’s primary mandate is to maintain price stability, which means either controlling inflation or stimulating growth. Its primary tool is the raising or lowering of interest rates. Relatively high interest rates – or the expectation of higher rates – will usually benefit the Euro and vice versa. The ECB Governing Council makes monetary policy decisions at meetings held eight times a year. Decisions are made by heads of the Eurozone national banks and six permanent members, including the President of the ECB, Christine Lagarde.
Eurozone inflation data, measured by the Harmonized Index of Consumer Prices (HICP), is an important econometric for the Euro. If inflation rises more than expected, especially if above the ECB’s 2% target, it obliges the ECB to raise interest rates to bring it back under control. Relatively high interest rates compared to its counterparts will usually benefit the Euro, as it makes the region more attractive as a place for global investors to park their money.
Data releases gauge the health of the economy and can impact on the Euro. Indicators such as GDP, Manufacturing and Services PMIs, employment, and consumer sentiment surveys can all influence the direction of the single currency. A strong economy is good for the Euro. Not only does it attract more foreign investment but it may encourage the ECB to put up interest rates, which will directly strengthen the Euro. Otherwise, if economic data is weak, the Euro is likely to fall. Economic data for the four largest economies in the euro area (Germany, France, Italy and Spain) are especially significant, as they account for 75% of the Eurozone’s economy.
Another significant data release for the Euro is the Trade Balance. This indicator measures the difference between what a country earns from its exports and what it spends on imports over a given period. If a country produces highly sought after exports then its currency will gain in value purely from the extra demand created from foreign buyers seeking to purchase these goods. Therefore, a positive net Trade Balance strengthens a currency and vice versa for a negative balance.
EUR/USD recovered some ground on Friday, in line with our expectations. From a valuation standpoint, there is still short-term upside potential for the pair, which at current levels embeds a risk premium of around 1.5-2.0%, ING’s FX analyst Francesco Pesole notes.
Risks remain skewed towards the 1.02 area
“The effect of the moderately re-tightened EUR:USD short-term swap spread may, however, prove insufficient to drive the euro back to the 1.040 mark sustainably. We suspect that unless there are some tentatively positive developments in the eurozone growth narrative, any EUR/USD rebound is destined to be quite short-lived, and risks over the coming weeks remain skewed towards the 1.02 area.”
“The recent rise in gas prices after the Ukraine pipeline shutdown is currently pairing with protectionism fears, and any lifeline to the euro at this point would likely need to come from data.”
Euro (EUR) fell to a low of 1.0225 (2 Jan) before rebounding. The large slippage was likely due to poor market liquidity. Pair was last seen trading at 1.0353 levels, OCBC’s FX analysts Frances Cheung and Christopher Wong note.
Dovish expectation on ECB cut trajectory may unwound
“Mild bearish momentum on daily chart shows tentative signs of moderating while RSI rose. Rebound not ruled out.”
“In the event CPI comes in firmer, then dovish expectation on ECB cut trajectory may unwound. And that can add to EUR’s rebound momentum.”
The Christmas holiday period was not particularly eventful for FX markets, but it was again remarkable how the dollar kept finding support, defying both seasonal negative pressure and a brief rally in US Treasuries at the end of December. The new year started with a new dollar rally and European currencies coming under pressure, ING’s FX analyst Francesco Pesole notes.
DXY can reach 110.0 in the coming weeks
“This week will see a return of normal market conditions and a pick-up in FX liquidity. That may lead to some softening in the dollar’s momentum, as the greenback could reconnect with the slight deterioration in its rate advantage over the holiday period. But while technical factors signal that the dollar rally at the start of the year is overdone, the proximity to Donald Trump’s presidential inauguration should prevent a substantial rotation away from defensive dollar longs. Incidentally, January and February are two seasonally strong months for the USD.”
“This will also be the week where data retakes centrality. The hawkish December FOMC has, in our view, set the bar higher for any data disappointments to hurt the dollar, as pricing for a rate cut in March (January looks implausible) may prove sticky. There's currently 12bp priced in for March, 17bp for May and 25bp for June. Adding to the hawkish narrative, we heard two FOMC members (Mary Daly and Adriana Kugler) revamping inflation concerns. An effective re-focus of the Federal Reserve on the price side of its mandate would provide a fresh bullish narrative for the dollar.”
“Our tactical view in FX remains unchanged from last week. Technical factors argue for some correction or at least loss of momentum for the dollar, but we expect strong buying interest in the dips. Ultimately, the 110.0 target remains very much at reach for DXY in the coming weeks.”
The oil market is off to a strong start in 2025 with ICE Brent trading above $76/bbl. This is despite the oil balance for 2025 looking comfortable. The strength in the market appears to be on the back of a stronger physical market in the Middle East. This is well reflected in the Brent/Dubai spread which has traded into negative territory recently, ING’s commodity experts Warren Patterson and Ewa Manthey note.
Natural gas prices in Europe may go up
“There are suggestions that Asian buyers have been looking to other Middle Eastern grades amid broader sanctions against Russia and Iran. There will also be concerns over how hawkish Trump will be towards Iran when he takes office later this month. Stricter enforcement of sanctions against Iran would leave the market tighter than expected. However, it would also leave an opportunity for OPEC+ to increase supply.”
“The natural gas market has also strengthened. TTF broke above EUR50/MWh last week, although finished the week just below this level. This is after confirmation that Russian pipeline flows via Ukraine were halted with the expiration of Gazprom’s transit deal with Ukraine. This means that Europe will lose around 15bcm of annual gas supply. However, this shouldn’t come as too much of a surprise. It has been well-telegraphed for over a year that Ukraine had no intention of extending the deal.”
“Adding further support to European gas is the forecast for colder-than-usual weather over the next two weeks, which could see storage falling at a quicker-than-expected pace. At the moment, storage is a little more than 70% full, well below the 85% seen at the same stage last year and also below the five-year average of around 76%. Storage levels should still mean that Europe gets through this winter comfortably, however, the refilling of storage through the injection season will be a bigger job than last year, which should provide some support to summer prices.”
- Eurozone investors’ morale stays almost unchanged in January.
- EUR/USD holds the rebound above 1.0350 after the Eurozone data.
The Eurozone Sentix Investor Confidence Index came in at -17.7 in January after registering -17.5 in December, the latest survey showed on Monday.
The Current Situation gauge for the bloc fell to its lowest level since October 2022, reaching -29.5 in January from -28.5 in December.
Sentix said, “in the Eurozone, the economic engine is threatening to freeze up for the long term.”
“Germany's recessionary economy "is hanging on to the euro zone like a lead weight," it added.
Market reaction to the Eurozone Sentix data
EUR/USD holds its recovery momentum above 1.0350 after the Eurozone data. As of writing, EUR/USD is trading 0.47% higher on the day.
Silver prices (XAG/USD) rose on Monday, according to FXStreet data. Silver trades at $29.77 per troy ounce, up 0.53% from the $29.61 it cost on Friday.
Silver prices have increased by 3.02% since the beginning of the year.
| Unit measure | Silver Price Today in USD |
|---|---|
| Troy Ounce | 29.77 |
| 1 Gram | 0.96 |
The Gold/Silver ratio, which shows the number of ounces of Silver needed to equal the value of one ounce of Gold, stood at 88.52 on Monday, down from 89.11 on Friday.
Silver FAQs
Silver is a precious metal highly traded among investors. It has been historically used as a store of value and a medium of exchange. Although less popular than Gold, traders may turn to Silver to diversify their investment portfolio, for its intrinsic value or as a potential hedge during high-inflation periods. Investors can buy physical Silver, in coins or in bars, or trade it through vehicles such as Exchange Traded Funds, which track its price on international markets.
Silver prices can move due to a wide range of factors. Geopolitical instability or fears of a deep recession can make Silver price escalate due to its safe-haven status, although to a lesser extent than Gold's. As a yieldless asset, Silver tends to rise with lower interest rates. Its moves also depend on how the US Dollar (USD) behaves as the asset is priced in dollars (XAG/USD). A strong Dollar tends to keep the price of Silver at bay, whereas a weaker Dollar is likely to propel prices up. Other factors such as investment demand, mining supply – Silver is much more abundant than Gold – and recycling rates can also affect prices.
Silver is widely used in industry, particularly in sectors such as electronics or solar energy, as it has one of the highest electric conductivity of all metals – more than Copper and Gold. A surge in demand can increase prices, while a decline tends to lower them. Dynamics in the US, Chinese and Indian economies can also contribute to price swings: for the US and particularly China, their big industrial sectors use Silver in various processes; in India, consumers’ demand for the precious metal for jewellery also plays a key role in setting prices.
Silver prices tend to follow Gold's moves. When Gold prices rise, Silver typically follows suit, as their status as safe-haven assets is similar. The Gold/Silver ratio, which shows the number of ounces of Silver needed to equal the value of one ounce of Gold, may help to determine the relative valuation between both metals. Some investors may consider a high ratio as an indicator that Silver is undervalued, or Gold is overvalued. On the contrary, a low ratio might suggest that Gold is undervalued relative to Silver.
(An automation tool was used in creating this post.)
- AUD/JPY rose as Australia Composite PMI revised upward to 50.2 in December, from the previous reading of 49.9.
- The Caixin China Services PMI increased to 52.2 in December, up from the previous reading of 51.5.
- Japan’s composite and services PMIs for December were revised downward, bolstering a dovish stance on the BoJ policy outlook.
AUD/JPY continues to gain ground for the third consecutive day, trading around 98.50 during the European hours on Monday. This upside of the AUD/JPY cross is attributed to the improved Australian Dollar (AUD) following the release of the Judo Bank Australia Purchasing Managers' Index (PMI) and the Caixin Services PMI for China. Given their close trade relationship, fluctuations in China’s economy often have a notable impact on Australian markets.
The Judo Bank Australia Composite PMI for December 2024 was revised upward to 50.2 from an earlier reading of 49.9, signaling a third consecutive month of modest growth in private sector output. This growth was primarily driven by the services sector, while manufacturing output continued to contract. The Services PMI was also revised higher to 50.8 from 50.5 in November, representing the eleventh consecutive month of expansion in the services sector.
In China, the Caixin Services PMI increased to 52.2 in December 2024, up from 51.5 in November, surpassing market expectations of 51.7. This marks the fastest growth in the Chinese services sector since May, reflecting robust performance.
On Monday, Reuters reported that the Shanghai Stock Exchange has committed to deepen capital markets opening during a meeting with foreign institutions. China’s economy is underpinned by solid fundamentals and demonstrates resilience amid a complex global environment.
In Japan, composite and services PMIs for December were revised lower, reinforcing a dovish outlook on the Bank of Japan’s (BoJ) policy and exerting downward pressure on the Japanese Yen (JPY). The Jibun Bank Japan Services PMI was revised down to 50.9, falling short of the anticipated 51.4. Despite the downward revision, the reading improved from November’s 50.5, marking the second straight month of growth and the fastest pace since September.
Meanwhile, the Jibun Bank Japan Composite PMI rose to 50.5 in December from 50.1 in November, marking the second consecutive month of growth. While indicative of only marginal expansion, this was the strongest reading in three months. The increase was driven by modest growth in the services sector, alongside a softer contraction in manufacturing output.
Interest rates FAQs
Interest rates are charged by financial institutions on loans to borrowers and are paid as interest to savers and depositors. They are influenced by base lending rates, which are set by central banks in response to changes in the economy. Central banks normally have a mandate to ensure price stability, which in most cases means targeting a core inflation rate of around 2%. If inflation falls below target the central bank may cut base lending rates, with a view to stimulating lending and boosting the economy. If inflation rises substantially above 2% it normally results in the central bank raising base lending rates in an attempt to lower inflation.
Higher interest rates generally help strengthen a country’s currency as they make it a more attractive place for global investors to park their money.
Higher interest rates overall weigh on the price of Gold because they increase the opportunity cost of holding Gold instead of investing in an interest-bearing asset or placing cash in the bank. If interest rates are high that usually pushes up the price of the US Dollar (USD), and since Gold is priced in Dollars, this has the effect of lowering the price of Gold.
The Fed funds rate is the overnight rate at which US banks lend to each other. It is the oft-quoted headline rate set by the Federal Reserve at its FOMC meetings. It is set as a range, for example 4.75%-5.00%, though the upper limit (in that case 5.00%) is the quoted figure. Market expectations for future Fed funds rate are tracked by the CME FedWatch tool, which shapes how many financial markets behave in anticipation of future Federal Reserve monetary policy decisions.
- DXY trades with negative bias for the second straight day, though the downside seems limited.
- The Fed’s hawkish shift remains supportive of elevated US bond yields and favors the USD bulls.
- Geopolitical risks and trade war fears might contribute to limiting losses for the safe-haven buck.
The US Dollar Index (DXY), which tracks the Greenback against a basket of currencies, drifts lower for the second straight day on Monday and retreats further from its highest level since November 2022 touched last week. The index retains its negative bias through the first half of the European session and currently hovers around the 108.70-108.65 area, down 0.25% for the day, though the fundamental backdrop warrants caution for bearish traders.
The US ISM Manufacturing PMI improved from 48.4 to 49.3 in December, pointing to signs of economic resilience and potential for growth amid the optimism over US President-elect Donald Trump's expansionary policies. This, in turn, validates the Federal Reserve's (Fed) hawkish shift in December, signaling that it would slow the pace of interest rate cuts in 2025, which remains supportive of elevated US Treasury bond yields. In fact, the yield on the benchmark 10-year US government bond reached its highest point since May 2 and favors the USD bulls.
Apart from this, persistent geopolitical risks stemming from the protracted Russia-Ukraine war and tensions in the Middle East, along with concerns about Trump's tariff plans, support prospects for the emergence of dip-buying around the safe-haven buck. Hence, any subsequent USD fall could be seen as a buying opportunity and remain limited ahead of this week's important US macro releases, including the Nonfarm Payrolls (NFP) on Friday. In the meantime, traders on Monday might take cues from the final US Services PMI and Factory Orders data.
US Dollar FAQs
The US Dollar (USD) is the official currency of the United States of America, and the ‘de facto’ currency of a significant number of other countries where it is found in circulation alongside local notes. It is the most heavily traded currency in the world, accounting for over 88% of all global foreign exchange turnover, or an average of $6.6 trillion in transactions per day, according to data from 2022. Following the second world war, the USD took over from the British Pound as the world’s reserve currency. For most of its history, the US Dollar was backed by Gold, until the Bretton Woods Agreement in 1971 when the Gold Standard went away.
The most important single factor impacting on the value of the US Dollar is monetary policy, which is shaped by the Federal Reserve (Fed). The Fed has two mandates: to achieve price stability (control inflation) and foster full employment. Its primary tool to achieve these two goals is by adjusting interest rates. When prices are rising too quickly and inflation is above the Fed’s 2% target, the Fed will raise rates, which helps the USD value. When inflation falls below 2% or the Unemployment Rate is too high, the Fed may lower interest rates, which weighs on the Greenback.
In extreme situations, the Federal Reserve can also print more Dollars and enact quantitative easing (QE). QE is the process by which the Fed substantially increases the flow of credit in a stuck financial system. It is a non-standard policy measure used when credit has dried up because banks will not lend to each other (out of the fear of counterparty default). It is a last resort when simply lowering interest rates is unlikely to achieve the necessary result. It was the Fed’s weapon of choice to combat the credit crunch that occurred during the Great Financial Crisis in 2008. It involves the Fed printing more Dollars and using them to buy US government bonds predominantly from financial institutions. QE usually leads to a weaker US Dollar.
Quantitative tightening (QT) is the reverse process whereby the Federal Reserve stops buying bonds from financial institutions and does not reinvest the principal from the bonds it holds maturing in new purchases. It is usually positive for the US Dollar.
- USD/CAD retreats from the 1.4467, the highest level since March 2020.
- The bullish bias is in play as the 14-day RSI remains above the 50 mark.
- The nine-day EMA at the 1.4387 level acts as initial support for the pair.
The USD/CAD pair ends its four-day winning streak, trading near 1.4390 during Monday's European session. From a technical perspective, the daily chart shows the pair moving within an ascending channel, signaling a continued bullish bias.
The 14-day Relative Strength Index (RSI) remains above the 50 level, indicating sustained bullish momentum. If the RSI stays above 50, it could strengthen the positive sentiment further.
Additionally, USD/CAD trades above the nine- and 14-day Exponential Moving Averages (EMAs), underscoring a bullish trend and strong short-term price momentum. This alignment reflects solid buying interest and suggests the potential for further gains.
On the upside, USD/CAD continues to challenge the 1.4467, the highest level since March 2020, recorded on December 19. A further resistance level is positioned at the upper boundary of the ascending channel, near the key psychological mark of 1.4500.
The initial support lies around the nine-day EMA at 1.4387, followed by the 14-day EMA at 1.4361. If the pair breaks below these levels, additional support can be found at the lower boundary of the ascending channel, around 1.4310.
USD/CAD: Daily Chart
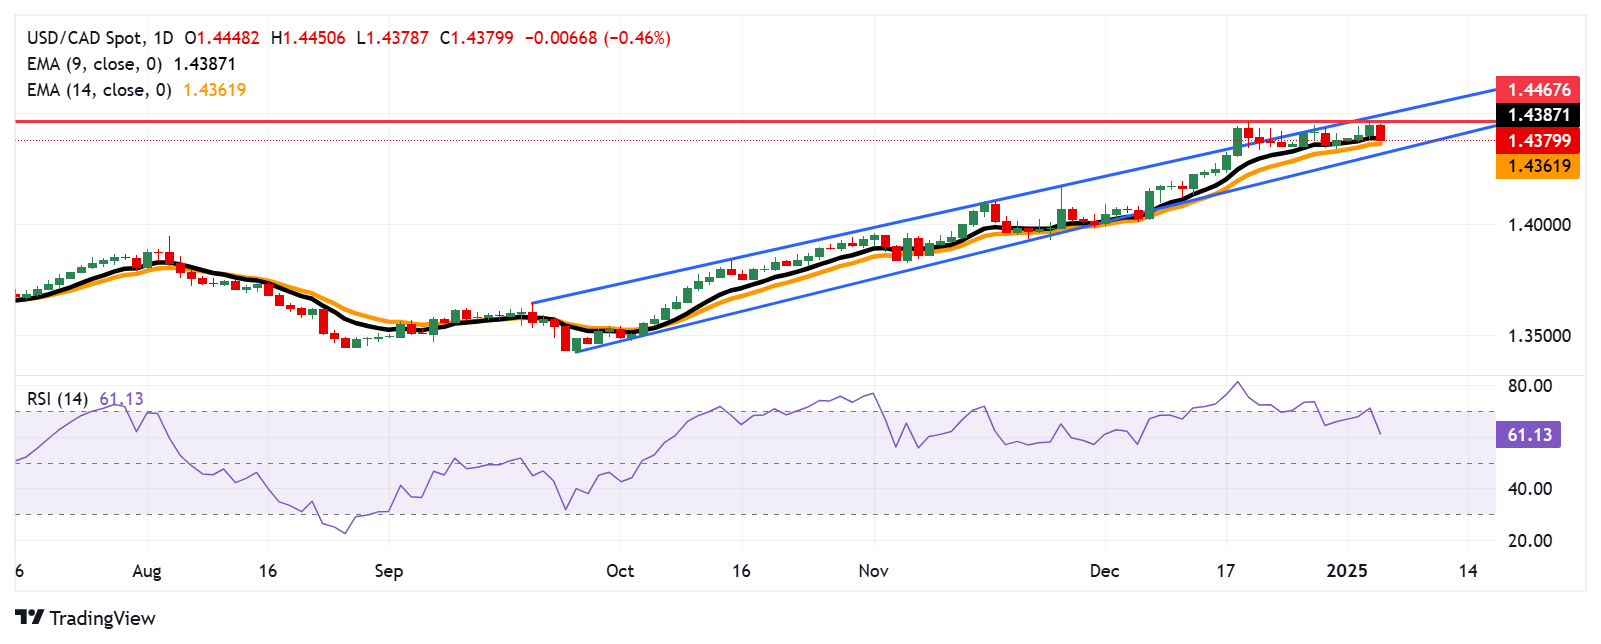
Canadian Dollar PRICE Today
The table below shows the percentage change of Canadian Dollar (CAD) against listed major currencies today. Canadian Dollar was the strongest against the Japanese Yen.
| USD | EUR | GBP | JPY | CAD | AUD | NZD | CHF | |
|---|---|---|---|---|---|---|---|---|
| USD | -0.29% | -0.42% | 0.35% | -0.48% | -0.36% | -0.29% | -0.30% | |
| EUR | 0.29% | -0.12% | 0.60% | -0.13% | -0.01% | 0.05% | 0.03% | |
| GBP | 0.42% | 0.12% | 0.73% | -0.01% | 0.11% | 0.17% | 0.15% | |
| JPY | -0.35% | -0.60% | -0.73% | -0.81% | -0.66% | -0.58% | -0.40% | |
| CAD | 0.48% | 0.13% | 0.00% | 0.81% | 0.05% | 0.15% | 0.16% | |
| AUD | 0.36% | 0.01% | -0.11% | 0.66% | -0.05% | 0.06% | 0.04% | |
| NZD | 0.29% | -0.05% | -0.17% | 0.58% | -0.15% | -0.06% | -0.01% | |
| CHF | 0.30% | -0.03% | -0.15% | 0.40% | -0.16% | -0.04% | 0.01% |
The heat map shows percentage changes of major currencies against each other. The base currency is picked from the left column, while the quote currency is picked from the top row. For example, if you pick the Canadian Dollar from the left column and move along the horizontal line to the US Dollar, the percentage change displayed in the box will represent CAD (base)/USD (quote).
- NZD/USD rose as Caixin China Services PMI marked the fastest growth in December since May 2024.
- The US Dollar strengthens on the Fed’s hawkish shift regarding its policy outlook.
- Fed officials have indicated a cautious approach to rate cuts planned for 2025.
NZD/USD extends its gains for the second successive day, trading around 0.5630 during the European hours on Monday. The pair appreciates as the New Zealand Dollar (NZD) strengthens following the Caixin Services PMI for China, its key trading partner.
The Caixin China Services Purchasing Managers’ Index (PMI) rose to 52.2 in December 2024, up from 51.5 in November, exceeding market expectations of 51.7. This marks the fastest growth in the services sector since May. However, the Caixin Manufacturing PMI, released on Thursday, unexpectedly fell to 50.5 in December, down from 51.5 in November, missing market forecasts of 51.7.
According to Reuters, the Shanghai Stock Exchange has committed to deepen capital markets opening during a meeting with foreign institutions. China’s economy is underpinned by solid fundamentals and demonstrates resilience amid a complex global environment. The Financial Times reported on Friday that the People's Bank of China (PBoC) anticipates an interest rate cut at an appropriate time this year. Given their close trade relationship, fluctuations in China’s economy often have a notable impact on Australian markets.
The upside potential of the NZD/USD pair may remain limited as the US Dollar could strengthen further, with the hawkish shift by the Federal Reserve (Fed), expecting to pause its easing cycle during the January meeting after three consecutive rate cuts. The Fed’s latest Summary of Economic Projections, including the dot plot, indicates that policymakers anticipate the Federal Funds Rate to reach 3.9% by year-end, suggesting expectations for only two rate cuts in 2025.
Fed officials have also signaled a cautious stance on rate reductions for 2025. On Friday, Richmond Fed President Thomas Barkin emphasized that the policy rate should remain restrictive until there is greater confidence that inflation is on track to return to the 2% target. Similarly, Fed Governor Adriana Kugler highlighted the delicate balancing act facing the US central bank as it aims to slow the pace of monetary easing this year.
New Zealand Dollar FAQs
The New Zealand Dollar (NZD), also known as the Kiwi, is a well-known traded currency among investors. Its value is broadly determined by the health of the New Zealand economy and the country’s central bank policy. Still, there are some unique particularities that also can make NZD move. The performance of the Chinese economy tends to move the Kiwi because China is New Zealand’s biggest trading partner. Bad news for the Chinese economy likely means less New Zealand exports to the country, hitting the economy and thus its currency. Another factor moving NZD is dairy prices as the dairy industry is New Zealand’s main export. High dairy prices boost export income, contributing positively to the economy and thus to the NZD.
The Reserve Bank of New Zealand (RBNZ) aims to achieve and maintain an inflation rate between 1% and 3% over the medium term, with a focus to keep it near the 2% mid-point. To this end, the bank sets an appropriate level of interest rates. When inflation is too high, the RBNZ will increase interest rates to cool the economy, but the move will also make bond yields higher, increasing investors’ appeal to invest in the country and thus boosting NZD. On the contrary, lower interest rates tend to weaken NZD. The so-called rate differential, or how rates in New Zealand are or are expected to be compared to the ones set by the US Federal Reserve, can also play a key role in moving the NZD/USD pair.
Macroeconomic data releases in New Zealand are key to assess the state of the economy and can impact the New Zealand Dollar’s (NZD) valuation. A strong economy, based on high economic growth, low unemployment and high confidence is good for NZD. High economic growth attracts foreign investment and may encourage the Reserve Bank of New Zealand to increase interest rates, if this economic strength comes together with elevated inflation. Conversely, if economic data is weak, NZD is likely to depreciate.
The New Zealand Dollar (NZD) tends to strengthen during risk-on periods, or when investors perceive that broader market risks are low and are optimistic about growth. This tends to lead to a more favorable outlook for commodities and so-called ‘commodity currencies’ such as the Kiwi. Conversely, NZD tends to weaken at times of market turbulence or economic uncertainty as investors tend to sell higher-risk assets and flee to the more-stable safe havens.
- EUR/CAD attracts fresh sellers on Monday and erodes a part of Friday’s modest recovery gains.
- The recent breakdown and failure near the 200-day SMA supports prospects for further losses.
- A sustained move and acceptance above the 1.4900 mark is needed to negative the negative bias.
The EUR/CAD cross struggles to capitalize on Friday's recovery move from the 1.4770 area, or the vicinity of a one-month low and meets with a fresh supply at the start of a new week. Spot prices remain depressed through the early European session and currently trade around the 1.4850-1.4845 region, down over 0.25% for the day.
The Canadian Dollar (CAD) strengthened across the board in reaction to reports that Canadian Prime Minister Justin Trudeau will step down as Liberal Party Leader and might announce his resignation as early as Monday. This, along with the recent rally in Crude Oil prices, underpins the commodity-linked Loonie and exerts some downward pressure on the EUR/CAD pair. The shared currency, on the other hand, draws some support from a softer US Dollar (USD), which, in turn, should help limit the downside for spot prices.
From a technical perspective, last week's breakdown below a short-term trading range support, which coincided with the very important 200-day Simple Moving Average (SMA), was seen as a key trigger for bearish traders. Moreover, oscillators on the daily chart have been gaining negative traction and suggest that the path of least resistance for the EUR/CAD cross is to the downside. Hence, a subsequent fall towards the 1.4800 mark, en route to the 1.4770 area or a one-month low, looks like a distinct possibility.
The next relevant support is pegged near the 1.4730 horizontal zone, below which the EUR/CAD pair could weaken further below the 1.4700 mark and accelerate the fall towards the 1.4645-1.4640 region. The downward trajectory could extend towards the 1.4600 round figure before spot prices eventually drop to the 1.4565-1.4560 area en route to the November 2024 swing low – levels just below the 1.4500 psychological mark.
On the flip side, the 200-day SMA, currently near the 1.4880 area, could act as an immediate hurdle ahead of the 1.4900 round figure and the 1.4935-1.4940 region. Some follow-through buying should assist the EUR/CAD cross to reclaim the 1.5000 psychological mark and retest the 1.5050-1.5060 supply zone.
EUR/CAD daily chart
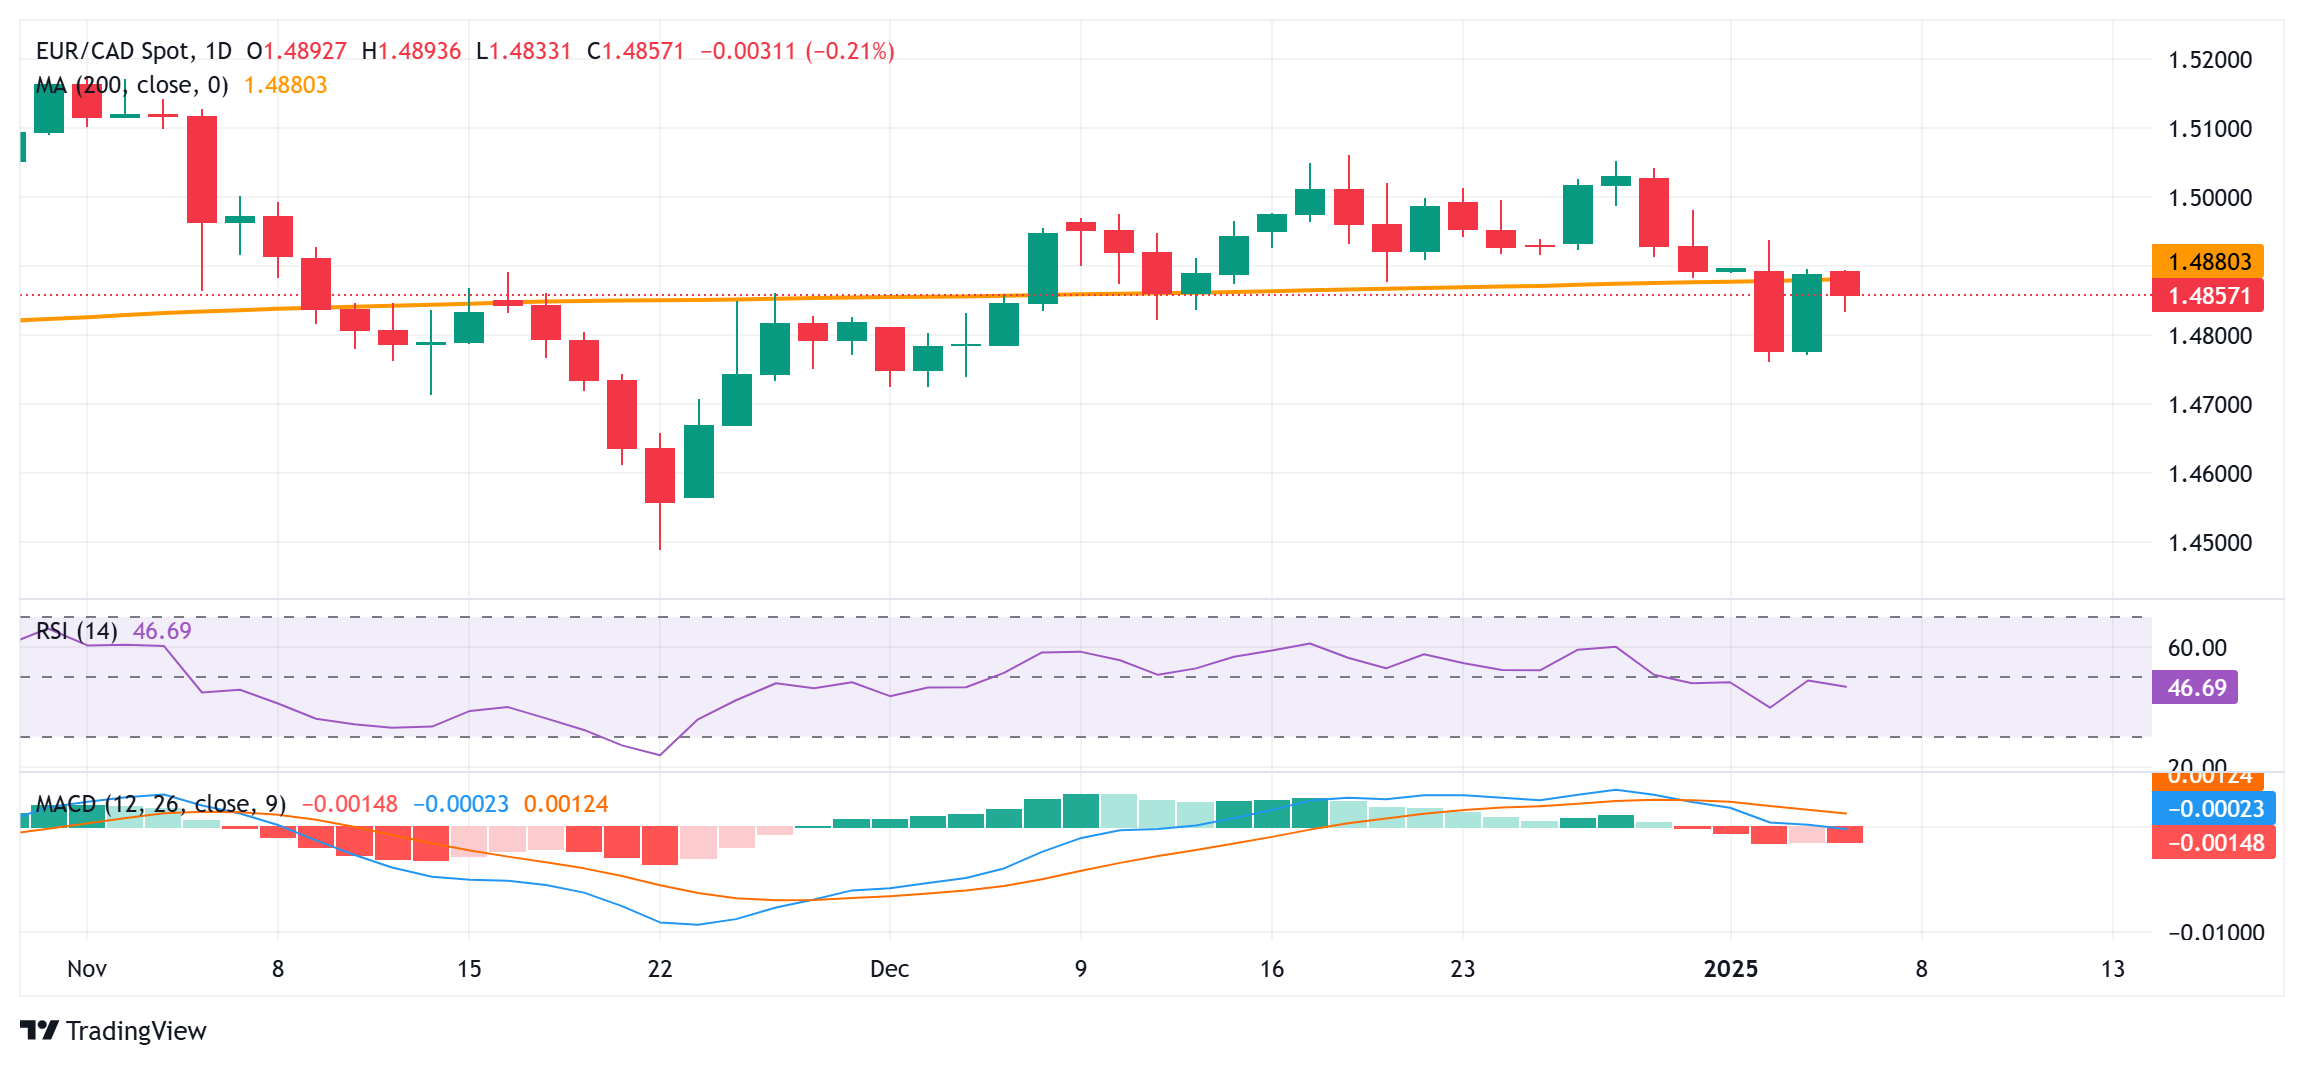
Canadian Dollar FAQs
The key factors driving the Canadian Dollar (CAD) are the level of interest rates set by the Bank of Canada (BoC), the price of Oil, Canada’s largest export, the health of its economy, inflation and the Trade Balance, which is the difference between the value of Canada’s exports versus its imports. Other factors include market sentiment – whether investors are taking on more risky assets (risk-on) or seeking safe-havens (risk-off) – with risk-on being CAD-positive. As its largest trading partner, the health of the US economy is also a key factor influencing the Canadian Dollar.
The Bank of Canada (BoC) has a significant influence on the Canadian Dollar by setting the level of interest rates that banks can lend to one another. This influences the level of interest rates for everyone. The main goal of the BoC is to maintain inflation at 1-3% by adjusting interest rates up or down. Relatively higher interest rates tend to be positive for the CAD. The Bank of Canada can also use quantitative easing and tightening to influence credit conditions, with the former CAD-negative and the latter CAD-positive.
The price of Oil is a key factor impacting the value of the Canadian Dollar. Petroleum is Canada’s biggest export, so Oil price tends to have an immediate impact on the CAD value. Generally, if Oil price rises CAD also goes up, as aggregate demand for the currency increases. The opposite is the case if the price of Oil falls. Higher Oil prices also tend to result in a greater likelihood of a positive Trade Balance, which is also supportive of the CAD.
While inflation had always traditionally been thought of as a negative factor for a currency since it lowers the value of money, the opposite has actually been the case in modern times with the relaxation of cross-border capital controls. Higher inflation tends to lead central banks to put up interest rates which attracts more capital inflows from global investors seeking a lucrative place to keep their money. This increases demand for the local currency, which in Canada’s case is the Canadian Dollar.
Macroeconomic data releases gauge the health of the economy and can have an impact on the Canadian Dollar. Indicators such as GDP, Manufacturing and Services PMIs, employment, and consumer sentiment surveys can all influence the direction of the CAD. A strong economy is good for the Canadian Dollar. Not only does it attract more foreign investment but it may encourage the Bank of Canada to put up interest rates, leading to a stronger currency. If economic data is weak, however, the CAD is likely to fall.
- USD/CHF appreciated as the US Dollar strengthened on the Fed’s hawkish shift regarding its policy outlook.
- Swiss Real Retail Sales increased by 0.8% YoY in November, against the expected 1.2% and prior 1.5%. rise.
- The recent dot plot in the Fed’s Summary of Economic Projections indicated expectations for just two rate cuts in 2025.
USD/CHF steadies after registering losses in the previous session, trading around 0.9100 during the Asian hours on Monday. The pair moves little following the release of Real Retail Sales in Switzerland, which came in at a 0.8% increase year-over-year in November, falling short of the expected 1.2% rise and previous reading of 1.5%. Traders will likely observe the country's Consumer Price Index (CPI) and Foreign Currency Reserves for December on Tuesday.
On Friday, the SVME Manufacturing Purchasing Managers Index (PMI) dipped slightly to 48.4 in December, down from 48.5 in November but marginally exceeding market expectations of 48.3.
The Swiss Franc (CHF), a traditional safe-haven currency, received support from escalating geopolitical tensions in the Middle East and the ongoing Russia-Ukraine conflict. Last week, Russia launched a drone strike on Ukraine's capital, Kyiv, early Wednesday on New Year's Day, causing two fatalities, injuring at least six people, and damaging buildings in two districts.
The USD/CHF pair gains support as the US Dollar Index (DXY), which measures the US Dollar’s (USD) performance against six major currencies, holds its position near 109.00, close to recent highs. On Friday, the US manufacturing sector continued to contract in December, though at a slower pace, as the ISM Manufacturing PMI improved to 49.3 from 48.4 in November. This figure exceeded the market expectation of 48.4.
The US Dollar may further strengthen as the Federal Reserve (Fed) is expected to halt its easing cycle at the January meeting following three consecutive rate cuts. According to the latest dot plot in the Fed’s Summary of Economic Projections, policymakers anticipate the Federal Funds Rate reaching 3.9% by the end of the year, indicating expectations for just two rate cuts in 2025.
Fed officials have also signaled a more cautious approach to rate reductions in 2025. On Friday, Richmond Fed President Thomas Barkin highlighted that the benchmark policy rate should remain restrictive until there is greater confidence that inflation will return to the 2% target. Additionally, Fed Governor Adriana Kugler underscored the challenging balancing act facing US central bankers as they aim to slow the pace of monetary easing this year.
Economic Indicator
Real Retail Sales (YoY)
The Retail Sales data, released by the Swiss Federal Statistical Office on a monthly basis, measures the volume of goods sold by retailers in Switzerland. Changes in Retail Sales are widely followed as an indicator of consumer spending. Percent changes reflect the rate of changes in such sales, with the YoY reading comparing sales volumes in the reference month with the same month a year earlier. Generally, a high reading is seen as bullish for the Swiss Franc (CHF), while a low reading is seen as bearish.
Read more.Last release: Mon Jan 06, 2025 07:30
Frequency: Monthly
Actual: 0.8%
Consensus: 1.2%
Previous: 1.4%
Here is what you need to know on Monday, January 6:
Following the holiday-shortened week that offered some volatility in financial markets, trading conditions finally start to normalize. Regional and nation-wide inflation data from Germany will be watched closely on Monday. In the second half of the day, the US economic calendar will feature Factory Orders data for December. Investors will also scrutinize comments from central bank officials.
US Dollar PRICE Last 7 days
The table below shows the percentage change of US Dollar (USD) against listed major currencies last 7 days. US Dollar was the strongest against the Euro.
| USD | EUR | GBP | JPY | CAD | AUD | NZD | CHF | |
|---|---|---|---|---|---|---|---|---|
| USD | 1.07% | 1.07% | -0.13% | -0.13% | -0.23% | 0.06% | 0.86% | |
| EUR | -1.07% | -0.00% | -1.23% | -1.24% | -1.35% | -1.05% | -0.25% | |
| GBP | -1.07% | 0.00% | -1.22% | -1.23% | -1.35% | -1.04% | -0.27% | |
| JPY | 0.13% | 1.23% | 1.22% | -0.02% | -0.06% | 0.33% | 1.04% | |
| CAD | 0.13% | 1.24% | 1.23% | 0.02% | -0.10% | 0.26% | 0.97% | |
| AUD | 0.23% | 1.35% | 1.35% | 0.06% | 0.10% | 0.31% | 1.09% | |
| NZD | -0.06% | 1.05% | 1.04% | -0.33% | -0.26% | -0.31% | 0.78% | |
| CHF | -0.86% | 0.25% | 0.27% | -1.04% | -0.97% | -1.09% | -0.78% |
The heat map shows percentage changes of major currencies against each other. The base currency is picked from the left column, while the quote currency is picked from the top row. For example, if you pick the US Dollar from the left column and move along the horizontal line to the Japanese Yen, the percentage change displayed in the box will represent USD (base)/JPY (quote).
The US Dollar (USD) gathered strength against its major rivals after the New Year break, with the USD Index rising nearly 1% on a weekly basis. Early Monday, the index stays in a consolidation phase below 109.00, while the benchmark 10-year US Treasury bond yield holds above 4.6%. The US stock index futures trade mixed after Wall Street's main indexes closed in positive territory on Friday.
Earlier in the day, Bank of Japan (BoJ) Governor Kazuo Ueda reiterated that the timing of adjusting monetary support depends on economic, price and financial developments. "We must be vigilant to various risks in deciding timing for adjusting the degree of monetary support," he added. After posting small losses on Friday, USD/JPY edged slightly higher in the Asian session on Monday and was last seen trading above 157.50.
EUR/USD suffered large losses on the first trading days of 2025. After staging a technical correction on Friday, the pair stays relatively quiet slightly above 1.0300 in the European morning on Monday. January Sentix Investor Confidence data for the Eurozone will be published later in the session. In Germany, the annual inflation, as measured by the change in the Consumer Price Index (CPI), is forecast to rise to 2.4% in December from 2.2% in November.
GBP/USD lost more than 1% on Thursday and touched its weakest level since April near 1.2350. Following a rebound on Friday, GBP/USD trades marginally higher on the day at around 1.2450 in the European morning.
The data from Australia showed in the Asian session that the Judo Bank Composite PMI rose to 50.2 in December. AUD/USD showed no reaction to this data and was last seen trading in positive territory at around 0.6230.
Gold benefited from the risk-averse market atmosphere and gained nearly 2% in a two-day rally after the New Year holiday. With the US Treasury bond yields pushing higher ahead of the weekend, XAU/USD erased a portion of its weekly gains on Friday. Early Monday, Gold trades modestly lower on the day near $2,630.
German economy FAQs
The German economy has a significant impact on the Euro due to its status as the largest economy within the Eurozone. Germany's economic performance, its GDP, employment, and inflation, can greatly influence the overall stability and confidence in the Euro. As Germany's economy strengthens, it can bolster the Euro's value, while the opposite is true if it weakens. Overall, the German economy plays a crucial role in shaping the Euro's strength and perception in global markets.
Germany is the largest economy in the Eurozone and therefore an influential actor in the region. During the Eurozone sovereign debt crisis in 2009-12, Germany was pivotal in setting up various stability funds to bail out debtor countries. It took a leadership role in the implementation of the 'Fiscal Compact' following the crisis – a set of more stringent rules to manage member states’ finances and punish ‘debt sinners’. Germany spearheaded a culture of ‘Financial Stability’ and the German economic model has been widely used as a blueprint for economic growth by fellow Eurozone members.
Bunds are bonds issued by the German government. Like all bonds they pay holders a regular interest payment, or coupon, followed by the full value of the loan, or principal, at maturity. Because Germany has the largest economy in the Eurozone, Bunds are used as a benchmark for other European government bonds. Long-term Bunds are viewed as a solid, risk-free investment as they are backed by the full faith and credit of the German nation. For this reason they are treated as a safe-haven by investors – gaining in value in times of crisis, whilst falling during periods of prosperity.
German Bund Yields measure the annual return an investor can expect from holding German government bonds, or Bunds. Like other bonds, Bunds pay holders interest at regular intervals, called the ‘coupon’, followed by the full value of the bond at maturity. Whilst the coupon is fixed, the Yield varies as it takes into account changes in the bond's price, and it is therefore considered a more accurate reflection of return. A decline in the bund's price raises the coupon as a percentage of the loan, resulting in a higher Yield and vice versa for a rise. This explains why Bund Yields move inversely to prices.
The Bundesbank is the central bank of Germany. It plays a key role in implementing monetary policy within Germany, and central banks in the region more broadly. Its goal is price stability, or keeping inflation low and predictable. It is responsible for ensuring the smooth operation of payment systems in Germany and participates in the oversight of financial institutions. The Bundesbank has a reputation for being conservative, prioritizing the fight against inflation over economic growth. It has been influential in the setup and policy of the European Central Bank (ECB).
- GBP/USD rebounds to around 1.2440 in Monday’s early European session.
- Fed officials highlighted a need to balance inflation control with maintaining a strong labor market.
- The dovish BOE bets might cap the upside for the pair in the near term.
The GBP/USD pair extends the recovery to near 1.2440 during the early European session on Monday. However, the potential upside seems limited amid the Federal Reserve's (Fed) hawkish stance. Later on Monday, investors await the Fed’s Governor Lisa Cook speech for more cues about the US interest rate outlook this year.
The US central bank has cut the interest rates by one percentage point since September 2024 and signaled slower rate cuts this year, which supports the US Dollar (USD) broadly. Over the weekend, the Fed officials reinforced the view that the Fed will take a more cautious approach to cutting interest rates this year. Fed policymakers warned the fight against inflation is still with them while also highlighting their need to protect job market stability.
Traders will closely monitor the US December labor market data on Friday. Economists expect 150,000 new jobs for December, while the unemployment rate is expected to remain at 4.2% during the same report period. The Average Hourly Earnings are projected to rise by 0.3% MoM in December. In case of a weaker-than-expected outcome, this could weigh on the USD against the Cable.
On the other hand, the rising Bank of England (BoE) dovish bets could undermine the Pound Sterling (GBP). The markets are now pricing in nearly 60 basis points (bps) interest rate cut by the BoE this year, up from 53 bps seen in the last week of December. Matthew Ryan, head of market strategy at Ebury, said the BOE policymakers appear more divided on the path ahead for UK interest rates and that reflects “the complex outlook for the UK economy, as fragile consumer demand is counterbalanced by the pro-inflationary implications of the Autumn Budget and Trump’s tariff proposals.”
Pound Sterling FAQs
The Pound Sterling (GBP) is the oldest currency in the world (886 AD) and the official currency of the United Kingdom. It is the fourth most traded unit for foreign exchange (FX) in the world, accounting for 12% of all transactions, averaging $630 billion a day, according to 2022 data. Its key trading pairs are GBP/USD, also known as ‘Cable’, which accounts for 11% of FX, GBP/JPY, or the ‘Dragon’ as it is known by traders (3%), and EUR/GBP (2%). The Pound Sterling is issued by the Bank of England (BoE).
The single most important factor influencing the value of the Pound Sterling is monetary policy decided by the Bank of England. The BoE bases its decisions on whether it has achieved its primary goal of “price stability” – a steady inflation rate of around 2%. Its primary tool for achieving this is the adjustment of interest rates. When inflation is too high, the BoE will try to rein it in by raising interest rates, making it more expensive for people and businesses to access credit. This is generally positive for GBP, as higher interest rates make the UK a more attractive place for global investors to park their money. When inflation falls too low it is a sign economic growth is slowing. In this scenario, the BoE will consider lowering interest rates to cheapen credit so businesses will borrow more to invest in growth-generating projects.
Data releases gauge the health of the economy and can impact the value of the Pound Sterling. Indicators such as GDP, Manufacturing and Services PMIs, and employment can all influence the direction of the GBP. A strong economy is good for Sterling. Not only does it attract more foreign investment but it may encourage the BoE to put up interest rates, which will directly strengthen GBP. Otherwise, if economic data is weak, the Pound Sterling is likely to fall.
Another significant data release for the Pound Sterling is the Trade Balance. This indicator measures the difference between what a country earns from its exports and what it spends on imports over a given period. If a country produces highly sought-after exports, its currency will benefit purely from the extra demand created from foreign buyers seeking to purchase these goods. Therefore, a positive net Trade Balance strengthens a currency and vice versa for a negative balance.
FX option expiries for Jan 6 NY cut at 10:00 Eastern Time via DTCC can be found below.
EUR/USD: EUR amounts
- 1.0275 735m
- 1.0300 1.9b
- 1.0350 966m
- 1.0400 820m
GBP/USD: GBP amounts
- 1.2500 755m
USD/JPY: USD amounts
- 156.00 1.4b
USD/CHF: USD amounts
- 0.9100 449m
USD/CAD: USD amounts
- 1.4420 660m
- 1.4450 480m
- 1.4500 565m
- Silver kicks off the new week on a weaker note and seems vulnerable to weakening further.
- The recent failures near the 200-day SMA validate the negative outlook for the XAG/USD.
- A sustained strength beyond the $30.00 mark is needed to negate the near-term bearish bias.
Silver (XAG/USD) extends Friday's modest pullback from the vicinity of the $30.00 psychological mark and edges lower at the start of a new week. The white metal drops below the mid-$29.00s during the Asian session and now seems to have stalled its recovery from a multi-month trough touched in December.
From a technical perspective, the recent breakdown and repeated failures near the 200-day Simple Moving Average (SMA) favor bearish traders. This, along with the fact that oscillators on the daily chart are holding in negative territory, suggests that the path of least resistance for the XAG/USD is to the downside. Some follow-through selling below the $29.40 area will reaffirm the outlook and make the commodity vulnerable to weakening towards the $29.00 mark.
The downside trajectory could extend further towards the $28.75-$28.70 region, or the multi-month low, which should act as a key pivotal point. A sustained break below will set the stage for an extension of a well-established downtrend from the $35.00 neighborhood, or a multi-year peak touched in October.
On the flip side, the $30.00 mark (200-day SMA) might continue to act as an immediate strong barrier, above a bout of a short-covering could lift the XAG/USD to the next relevant hurdle near the $30.50 area. The momentum could eventually allow the white metal to reclaim the $31.00 mark and test the $31.15-$31.20 supply zone.
Silver daily chart
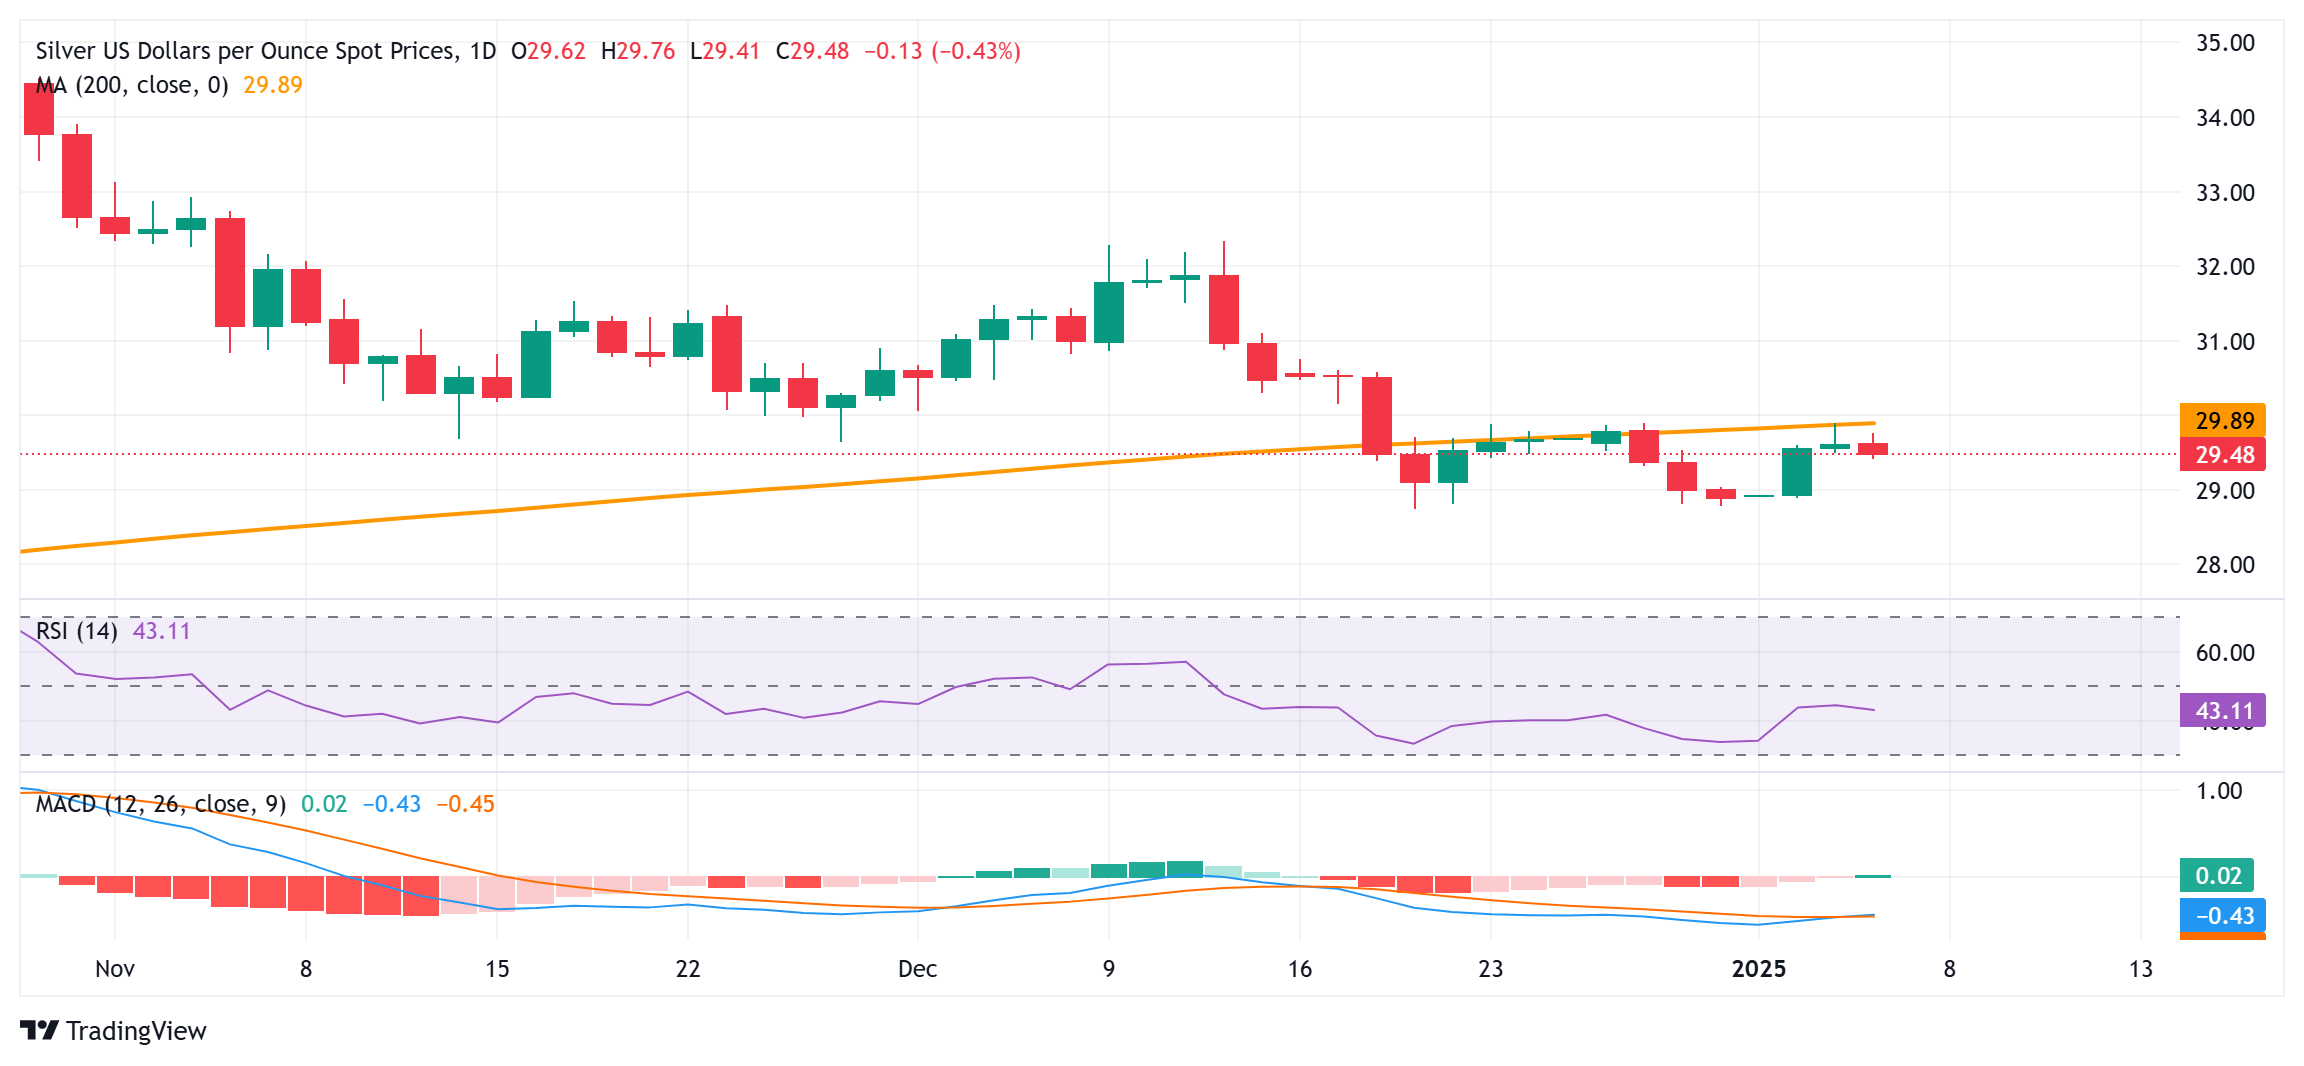
Silver FAQs
Silver is a precious metal highly traded among investors. It has been historically used as a store of value and a medium of exchange. Although less popular than Gold, traders may turn to Silver to diversify their investment portfolio, for its intrinsic value or as a potential hedge during high-inflation periods. Investors can buy physical Silver, in coins or in bars, or trade it through vehicles such as Exchange Traded Funds, which track its price on international markets.
Silver prices can move due to a wide range of factors. Geopolitical instability or fears of a deep recession can make Silver price escalate due to its safe-haven status, although to a lesser extent than Gold's. As a yieldless asset, Silver tends to rise with lower interest rates. Its moves also depend on how the US Dollar (USD) behaves as the asset is priced in dollars (XAG/USD). A strong Dollar tends to keep the price of Silver at bay, whereas a weaker Dollar is likely to propel prices up. Other factors such as investment demand, mining supply – Silver is much more abundant than Gold – and recycling rates can also affect prices.
Silver is widely used in industry, particularly in sectors such as electronics or solar energy, as it has one of the highest electric conductivity of all metals – more than Copper and Gold. A surge in demand can increase prices, while a decline tends to lower them. Dynamics in the US, Chinese and Indian economies can also contribute to price swings: for the US and particularly China, their big industrial sectors use Silver in various processes; in India, consumers’ demand for the precious metal for jewellery also plays a key role in setting prices.
Silver prices tend to follow Gold's moves. When Gold prices rise, Silver typically follows suit, as their status as safe-haven assets is similar. The Gold/Silver ratio, which shows the number of ounces of Silver needed to equal the value of one ounce of Gold, may help to determine the relative valuation between both metals. Some investors may consider a high ratio as an indicator that Silver is undervalued, or Gold is overvalued. On the contrary, a low ratio might suggest that Gold is undervalued relative to Silver.
- EUR/USD drifts lower to around 1.0315 in Monday’s early European session.
- The negative view of the pair prevails below the 100-day EMA with the bearish RSI indicator.
- The initial support level is seen at 1.0267; the immediate resistance level to watch is 1.0458.
The EUR/USD pair weakens to near 1.0315 during the early European session on Monday. The expectation that the European Central Bank (ECB) will further cut the interest rate this year undermines the Euro (EUR) against the Greenback. Later on Monday, investors will take more cues from the Eurozone HCOB Composite Purchasing Managers’ Index (PMI) and the preliminary reading of German Consumer Price Index (CPI) data for December.
Technically, the bearish outlook of EUR/USD remains in play as the major pair remains capped below the key 100-day Exponential Moving Average (EMA) on the daily chart. Furthermore, the downward momentum is supported by the 14-day Relative Strength Index (RSI), which is located below the midline around 35.90, suggesting that the path of least resistance is to the downside.
The lower limit of the Bollinger Band at 1.0267 acts as an initial support level for the major pair. A decisive break below the mentioned level could expose the 1.0200 level. Further south, the next contention level is seen at 1.0160, the low of August 8, 2022.
On the bright side, the first upside barrier for EUR/USD emerges at 1.0458, the high of December 30. Sustained trading above this level could pave the way to 1.0550, the upper boundary of the Bollinger Band. Extended gains could see the next hurdle at 1.0663, the 100-day EMA.
EUR/USD daily chart
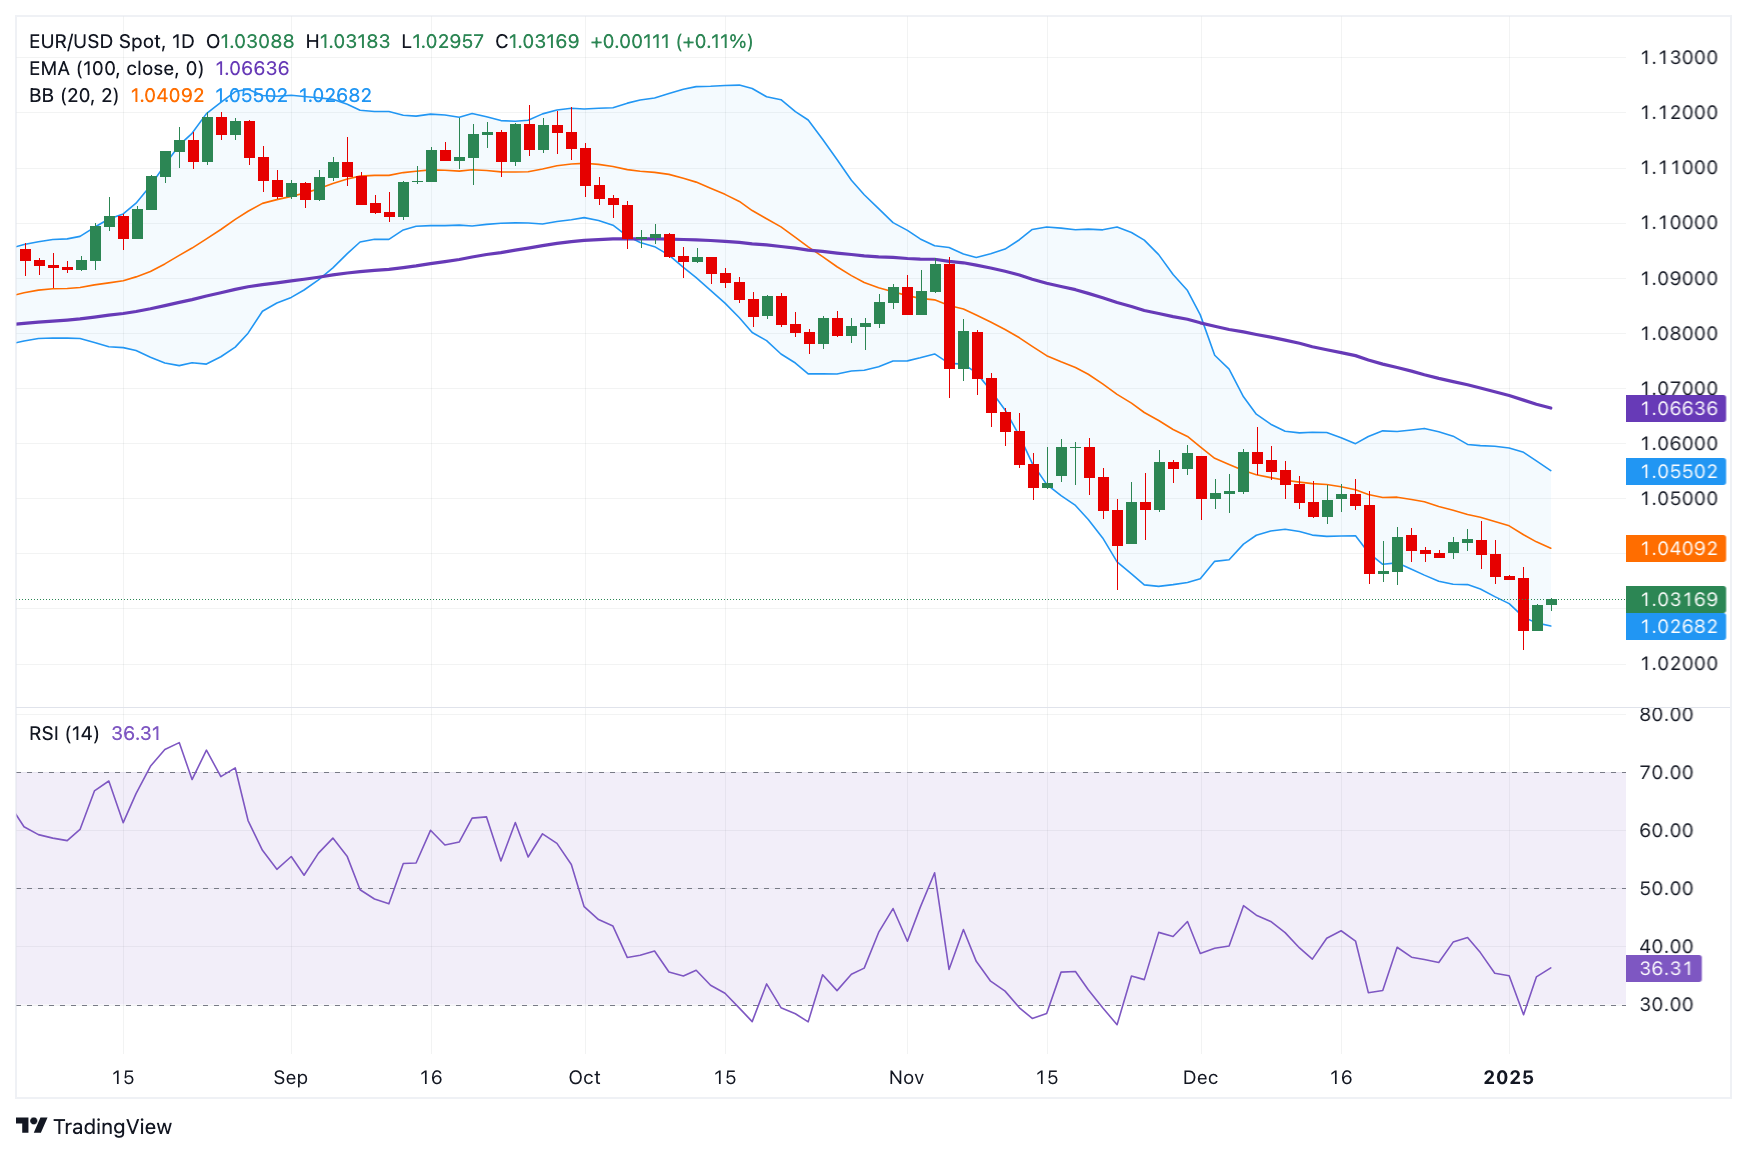
Euro FAQs
The Euro is the currency for the 19 European Union countries that belong to the Eurozone. It is the second most heavily traded currency in the world behind the US Dollar. In 2022, it accounted for 31% of all foreign exchange transactions, with an average daily turnover of over $2.2 trillion a day. EUR/USD is the most heavily traded currency pair in the world, accounting for an estimated 30% off all transactions, followed by EUR/JPY (4%), EUR/GBP (3%) and EUR/AUD (2%).
The European Central Bank (ECB) in Frankfurt, Germany, is the reserve bank for the Eurozone. The ECB sets interest rates and manages monetary policy. The ECB’s primary mandate is to maintain price stability, which means either controlling inflation or stimulating growth. Its primary tool is the raising or lowering of interest rates. Relatively high interest rates – or the expectation of higher rates – will usually benefit the Euro and vice versa. The ECB Governing Council makes monetary policy decisions at meetings held eight times a year. Decisions are made by heads of the Eurozone national banks and six permanent members, including the President of the ECB, Christine Lagarde.
Eurozone inflation data, measured by the Harmonized Index of Consumer Prices (HICP), is an important econometric for the Euro. If inflation rises more than expected, especially if above the ECB’s 2% target, it obliges the ECB to raise interest rates to bring it back under control. Relatively high interest rates compared to its counterparts will usually benefit the Euro, as it makes the region more attractive as a place for global investors to park their money.
Data releases gauge the health of the economy and can impact on the Euro. Indicators such as GDP, Manufacturing and Services PMIs, employment, and consumer sentiment surveys can all influence the direction of the single currency. A strong economy is good for the Euro. Not only does it attract more foreign investment but it may encourage the ECB to put up interest rates, which will directly strengthen the Euro. Otherwise, if economic data is weak, the Euro is likely to fall. Economic data for the four largest economies in the euro area (Germany, France, Italy and Spain) are especially significant, as they account for 75% of the Eurozone’s economy.
Another significant data release for the Euro is the Trade Balance. This indicator measures the difference between what a country earns from its exports and what it spends on imports over a given period. If a country produces highly sought after exports then its currency will gain in value purely from the extra demand created from foreign buyers seeking to purchase these goods. Therefore, a positive net Trade Balance strengthens a currency and vice versa for a negative balance.
- USD/CNH may correct downwards as the 14-day RSI indicates an overbought condition.
- The primary barrier appears at the 7.3600, followed by the rising wedge’s upper slope around the 7.4000 level.
- The pair may test primary support at the nine-day EMA of 7.3346 level.
The USD/CNH pair halts its five-day winning streak, trading around 7.3570 during the Asian hours on Monday. A review of the daily chart suggests that the magnitude of price movement within the rising wedge pattern is decreasing, signaling a pause in the bullish trend.
The 14-day Relative Strength Index (RSI), a crucial momentum indicator, is positioned slightly above the 70 level, indicating an overbought condition and the possibility of a downward correction in the near term.
The USD/CNH pair could find primary resistance at the psychological level of 7.3600 level, followed by the upper slope of the rising wedge around the 7.4000 level. A break above the rising wedge could strengthen the bullish bias and support the pair to continue its rally toward the major level of 7.5000.
On the downside, the USD/CNH pair may initially test the nine-day Exponential Moving Average (EMA) at 7.3346 level, followed by the rising wedge’s lower slope around 7.3070, followed by the psychological level of 7.3000. A break below this level could weaken the bullish momentum and put downward pressure on the pair to approach the next psychological support round 7.2000 level.
USD/CNH: Daily Chart
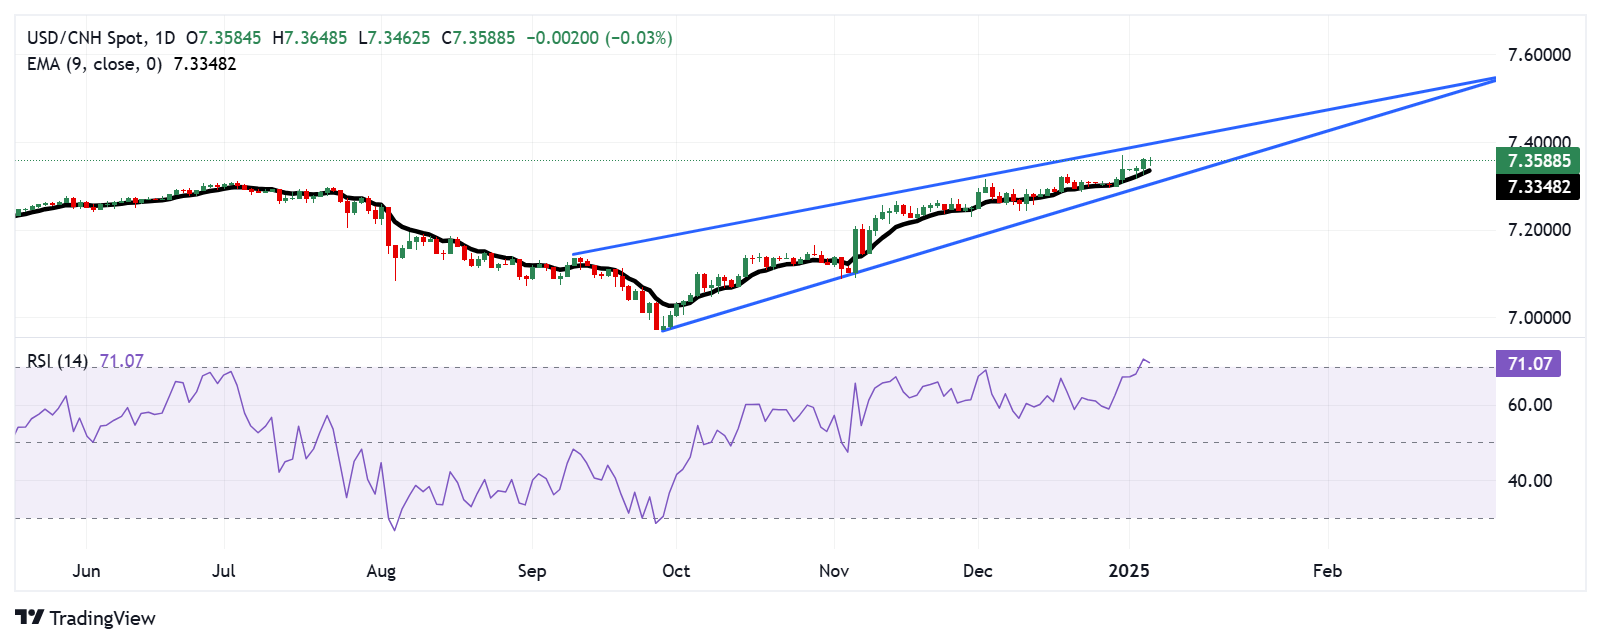
- Gold price turned lower for the second straight day on Monday, though the downside seems limited.
- The Fed’s hawkish signal remains supportive of elevated US bond yields and exerts some pressure.
- Geopolitical risks and trade war fears might continue to offer support to the safe-haven XAU/USD.
Gold price (XAU/USD) struggles to capitalize on its modest Asian session uptick on Monday and currently trades around the $2,635 area, down for the second straight day. The US Dollar (USD) remains close to a two-year high touched last Thursday on the back of the Federal Reserve's (Fed) hawkish signal that there would be fewer rate cuts in 2025. Moreover, the optimism over US President-elect Donald Trump's expansionary policies continues to underpin the Greenback, which, in turn, is seen acting as a headwind for the non-yielding yellow metal.
That said, persistent geopolitical risks stemming from the protracted Russia-Ukraine war and tensions in the Middle East, along with concerns about Trump's tariff plans, should limit losses for the safe-haven Gold price. This, in turn, makes it prudent to wait for a strong follow-through selling before positioning for an extension of Friday's retracement slide from the $2,665 area, or a nearly three-week top. Traders now look forward to the release of the final US Services PMI and Factory Orders data for some impetus later during the North American session.
Gold price is undermined by the prospects of a slower pace of rate cuts by the Fed
- The Institute of Supply Management (ISM) reported on Friday that the US Manufacturing PMI improved from 48.4 to 49.3 in December, pointing to signs of resilience and potential for growth.
- This comes on top of the prospects for a slower pace of rate cuts by the Federal Reserve in 2025 and remains supportive of elevated US Treasury bond yields, undermining the Gold price.
- The yield on the benchmark 10-year US government bond reached its highest point since May 2 and assists the US Dollar in holding steady just below a two-year high touched last Thursday.
- San Francisco Fed President Mary Daly said on Saturday that despite significant progress in lowering price pressures over the past two years, inflation remains uncomfortably above the 2% target.
- Investors this week will confront the release of important US macro releases, including the closely-watched Nonfarm Payrolls report on Friday, ahead of the next Fed meeting later this month.
- Israeli forces continued to attack medical facilities in the Gaza Strip and more Israeli raids were reported in the occupied West Bank on Sunday, while the Houthis have intensified their attacks on Israel.
- Ukraine said on Sunday that it had carried out surprise attacks against Russian forces in several areas in Kursk. The Russian Defence Ministry also confirmed the Ukrainian counterattacks.
Gold price could retest December swing low once the 100-day SMA support is broken
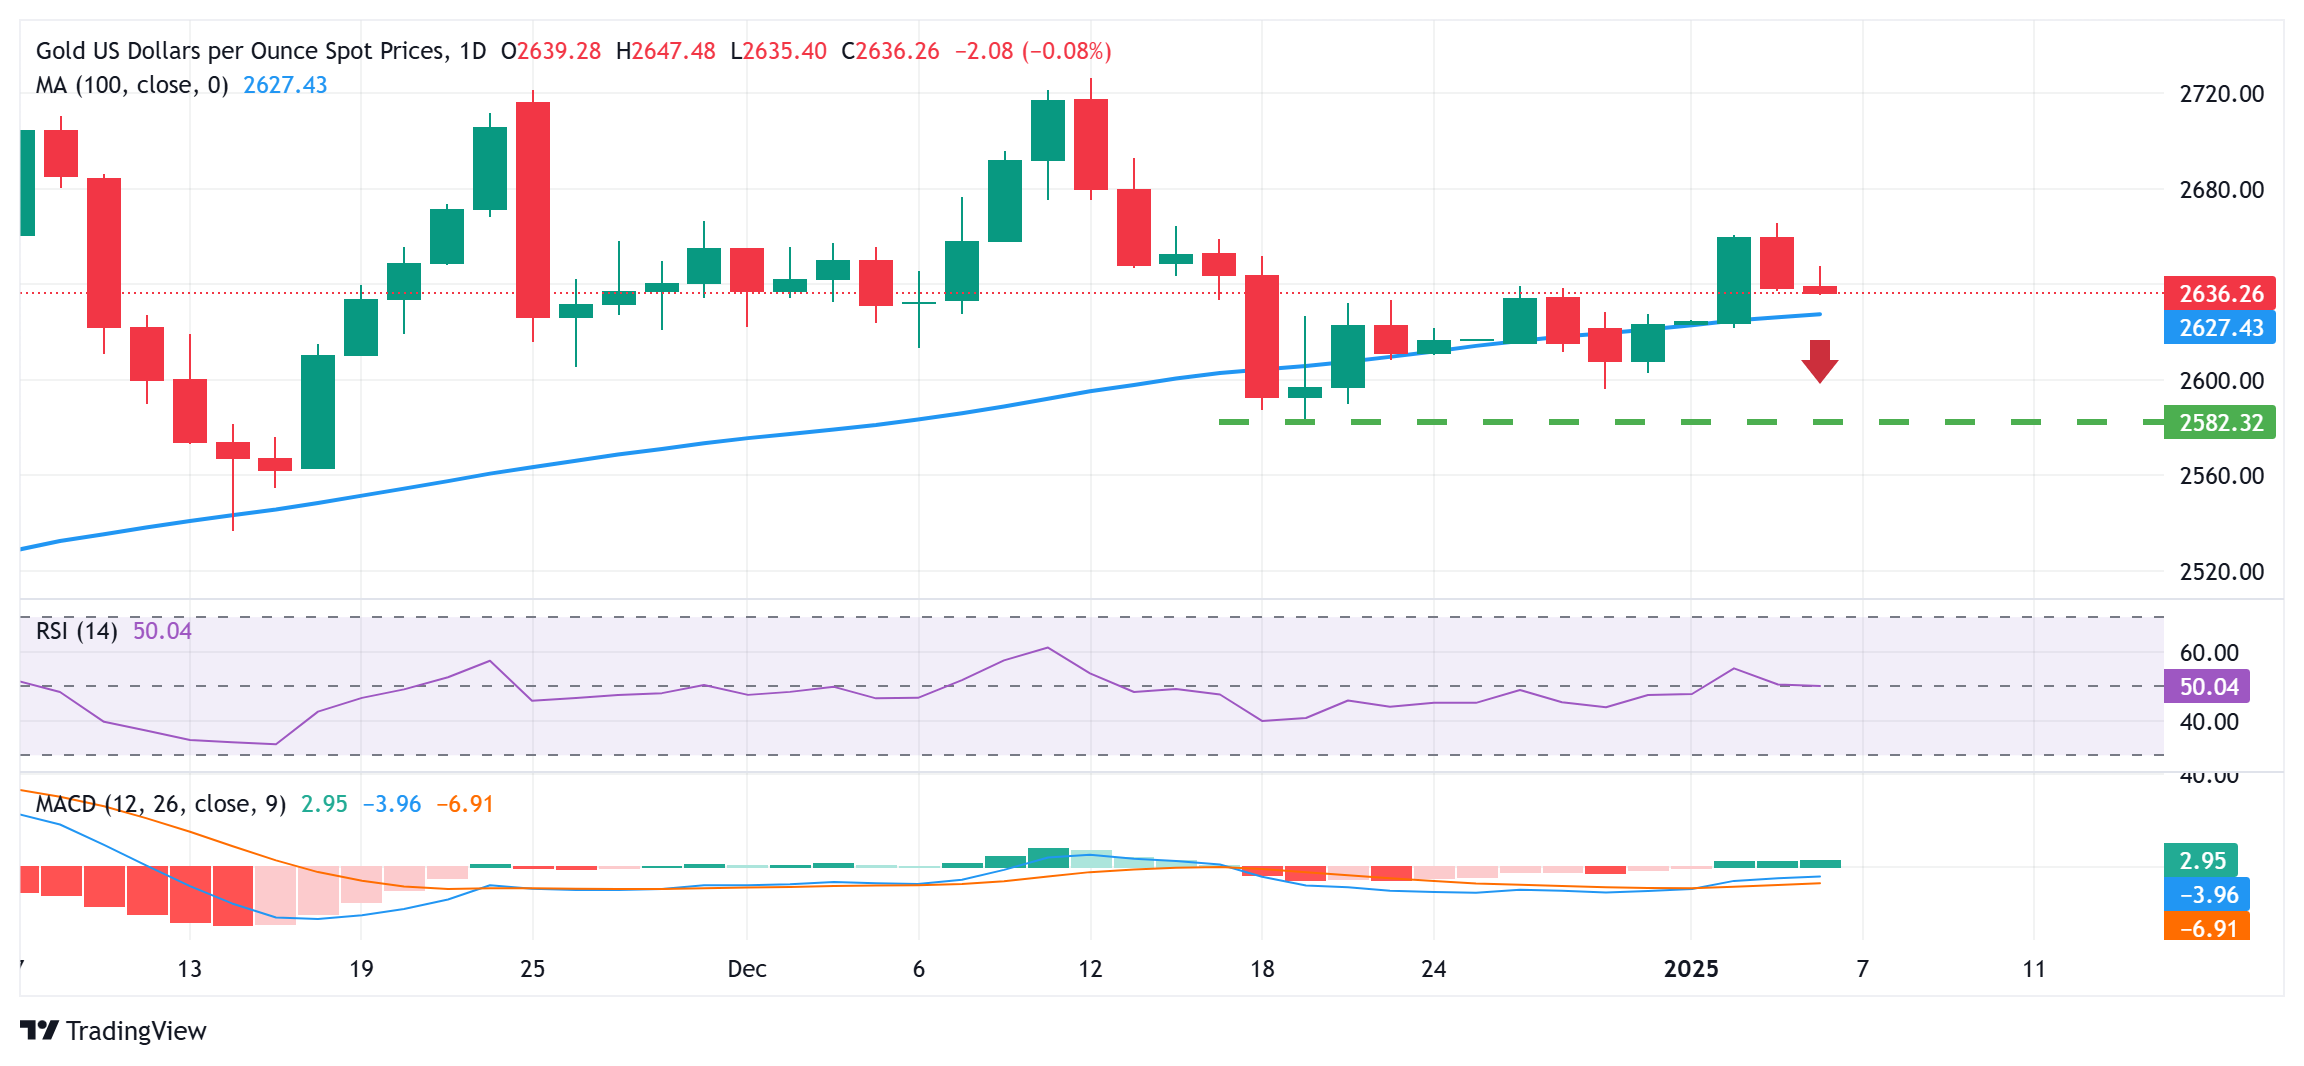
From a technical perspective, any subsequent slide is likely to find decent support near the 100-day Simple Moving Average (SMA), currently pegged near the $2,625 region. This is followed by the $2,600 mark, below which the Gold price could drop to the December monthly swing low, around the $2,583 area. Some follow-through selling will be seen as a fresh trigger for bearish traders and pave the way for deeper losses.
On the flip side, momentum beyond the Asian session high, around the $2,647 region, could lift the Gold price back to the $2,665 area, or the multi-week high. The subsequent move up could extend further towards an intermediate resistance near the $2,681-2,683 zone en route to the $2,700 mark. The latter should act as a pivotal point, which if cleared decisively will set the stage for an extension of a two-week-old uptrend.
Gold FAQs
Gold has played a key role in human’s history as it has been widely used as a store of value and medium of exchange. Currently, apart from its shine and usage for jewelry, the precious metal is widely seen as a safe-haven asset, meaning that it is considered a good investment during turbulent times. Gold is also widely seen as a hedge against inflation and against depreciating currencies as it doesn’t rely on any specific issuer or government.
Central banks are the biggest Gold holders. In their aim to support their currencies in turbulent times, central banks tend to diversify their reserves and buy Gold to improve the perceived strength of the economy and the currency. High Gold reserves can be a source of trust for a country’s solvency. Central banks added 1,136 tonnes of Gold worth around $70 billion to their reserves in 2022, according to data from the World Gold Council. This is the highest yearly purchase since records began. Central banks from emerging economies such as China, India and Turkey are quickly increasing their Gold reserves.
Gold has an inverse correlation with the US Dollar and US Treasuries, which are both major reserve and safe-haven assets. When the Dollar depreciates, Gold tends to rise, enabling investors and central banks to diversify their assets in turbulent times. Gold is also inversely correlated with risk assets. A rally in the stock market tends to weaken Gold price, while sell-offs in riskier markets tend to favor the precious metal.
The price can move due to a wide range of factors. Geopolitical instability or fears of a deep recession can quickly make Gold price escalate due to its safe-haven status. As a yield-less asset, Gold tends to rise with lower interest rates, while higher cost of money usually weighs down on the yellow metal. Still, most moves depend on how the US Dollar (USD) behaves as the asset is priced in dollars (XAU/USD). A strong Dollar tends to keep the price of Gold controlled, whereas a weaker Dollar is likely to push Gold prices up.
Gold prices remained broadly unchanged in India on Monday, according to data compiled by FXStreet.
The price for Gold stood at 7,276.11 Indian Rupees (INR) per gram, broadly stable compared with the INR 7,278.81 it cost on Friday.
The price for Gold was broadly steady at INR 84,867.09 per tola from INR 84,898.62 per tola on friday.
| Unit measure | Gold Price in INR |
|---|---|
| 1 Gram | 7,276.11 |
| 10 Grams | 72,761.08 |
| Tola | 84,867.09 |
| Troy Ounce | 226,312.40 |
FXStreet calculates Gold prices in India by adapting international prices (USD/INR) to the local currency and measurement units. Prices are updated daily based on the market rates taken at the time of publication. Prices are just for reference and local rates could diverge slightly.
Gold FAQs
Gold has played a key role in human’s history as it has been widely used as a store of value and medium of exchange. Currently, apart from its shine and usage for jewelry, the precious metal is widely seen as a safe-haven asset, meaning that it is considered a good investment during turbulent times. Gold is also widely seen as a hedge against inflation and against depreciating currencies as it doesn’t rely on any specific issuer or government.
Central banks are the biggest Gold holders. In their aim to support their currencies in turbulent times, central banks tend to diversify their reserves and buy Gold to improve the perceived strength of the economy and the currency. High Gold reserves can be a source of trust for a country’s solvency. Central banks added 1,136 tonnes of Gold worth around $70 billion to their reserves in 2022, according to data from the World Gold Council. This is the highest yearly purchase since records began. Central banks from emerging economies such as China, India and Turkey are quickly increasing their Gold reserves.
Gold has an inverse correlation with the US Dollar and US Treasuries, which are both major reserve and safe-haven assets. When the Dollar depreciates, Gold tends to rise, enabling investors and central banks to diversify their assets in turbulent times. Gold is also inversely correlated with risk assets. A rally in the stock market tends to weaken Gold price, while sell-offs in riskier markets tend to favor the precious metal.
The price can move due to a wide range of factors. Geopolitical instability or fears of a deep recession can quickly make Gold price escalate due to its safe-haven status. As a yield-less asset, Gold tends to rise with lower interest rates, while higher cost of money usually weighs down on the yellow metal. Still, most moves depend on how the US Dollar (USD) behaves as the asset is priced in dollars (XAU/USD). A strong Dollar tends to keep the price of Gold controlled, whereas a weaker Dollar is likely to push Gold prices up.
(An automation tool was used in creating this post.)
- WTI price could strengthen as colder weather in the Northern Hemisphere are expected to increase heating Oil demand.
- Oil prices increased as a result of Beijing's economic stimulus measures aimed at revitalizing its struggling economy.
- Goldman Sachs projects that Iran's exports will decline by Q2 due to stricter sanctions under the incoming Trump administration.
West Texas Intermediate (WTI) Oil trades around $73.30 per barrel during the Asian hours on Monday, nearing its highest level since October 2024. Investors are closely monitoring the potential impact of colder weather in the United States (US) and Europe is expected to increase heating Oil demand, providing further support to crude Oil prices.
Additionally, Beijing's economic stimulus efforts are bolstering fuel demand in the world's largest crude importer. In a bid to revive its struggling economy, Beijing is ramping up fiscal stimulus, announcing on Friday that it will significantly boost funding through ultra-long-dated treasury bonds in 2025 to stimulate business investment and initiatives aimed at boosting consumer spending.
According to Reuters, the Shanghai Stock Exchange has committed to deepen capital markets opening during a meeting with foreign institutions. China’s economy is underpinned by solid fundamentals and demonstrates resilience amid a complex global environment.
On Friday, the Financial Times reported that the People's Bank of China (PBoC) anticipates an interest rate cut at an appropriate time this year. Given their close trade relationship, fluctuations in China’s economy often have a notable impact on Australian markets.
Goldman Sachs anticipates that Iran's production and exports will decline by the second quarter due to expected policy shifts and stricter sanctions under the administration of incoming US President Donald Trump. Iran's output could decrease by 300,000 barrels per day, falling to 3.25 million bpd by the second quarter, according to their forecast.
WTI Oil FAQs
WTI Oil is a type of Crude Oil sold on international markets. The WTI stands for West Texas Intermediate, one of three major types including Brent and Dubai Crude. WTI is also referred to as “light” and “sweet” because of its relatively low gravity and sulfur content respectively. It is considered a high quality Oil that is easily refined. It is sourced in the United States and distributed via the Cushing hub, which is considered “The Pipeline Crossroads of the World”. It is a benchmark for the Oil market and WTI price is frequently quoted in the media.
Like all assets, supply and demand are the key drivers of WTI Oil price. As such, global growth can be a driver of increased demand and vice versa for weak global growth. Political instability, wars, and sanctions can disrupt supply and impact prices. The decisions of OPEC, a group of major Oil-producing countries, is another key driver of price. The value of the US Dollar influences the price of WTI Crude Oil, since Oil is predominantly traded in US Dollars, thus a weaker US Dollar can make Oil more affordable and vice versa.
The weekly Oil inventory reports published by the American Petroleum Institute (API) and the Energy Information Agency (EIA) impact the price of WTI Oil. Changes in inventories reflect fluctuating supply and demand. If the data shows a drop in inventories it can indicate increased demand, pushing up Oil price. Higher inventories can reflect increased supply, pushing down prices. API’s report is published every Tuesday and EIA’s the day after. Their results are usually similar, falling within 1% of each other 75% of the time. The EIA data is considered more reliable, since it is a government agency.
OPEC (Organization of the Petroleum Exporting Countries) is a group of 12 Oil-producing nations who collectively decide production quotas for member countries at twice-yearly meetings. Their decisions often impact WTI Oil prices. When OPEC decides to lower quotas, it can tighten supply, pushing up Oil prices. When OPEC increases production, it has the opposite effect. OPEC+ refers to an expanded group that includes ten extra non-OPEC members, the most notable of which is Russia.
- The Indian Rupee steadies in Monday’s Asian session.
- A decline in the Chinese Yuan, persistent USD demand and Trump’s tariff threats continue to undermine the INR.
- India’s December HSBC Composite and Services PMI data are due later on Monday.
The Indian Rupee (INR) holds steady on Monday after ending at a record closing low in the previous session. The local currency remains vulnerable amid the weakening of the Chinese Yuan, fewer rate cut expectations by the US Federal Reserve (Fed) and the threat of tariffs from incoming US President-elect Donald Trump’s administration.
Nonetheless, the Reserve Bank of India (RBI) is likely to sell the US Dollar (USD) to prevent the INR from depreciating. Looking ahead, traders brace for India’s HSBC Composite and Services Purchasing Managers Index (PMI) for December. On the US docket, the S&P Global Composite and Services PMI for December will be released. Also, the Fed’s Lisa Cook is scheduled to speak later in the day.
Indian Rupee remains flat ahead of Indian PMI data release
- "Global developments remain the wild card, with the U.S. government due to take office in mid-January 2025," said Radhika Rao, executive director and senior economist at DBS Bank.
- The Indian Rupee is likely to experience slight depreciation in 2025, driven by volatile foreign portfolio investment (FPI) flows and a potentially stronger Greenback, according to the Bank of Baroda report.
- The US Manufacturing PMI climbed to 49.3 in December versus 48.4 prior, according to the Institute for Supply Management (ISM) on Friday. This reading was above the market consensus of 48.4.
- San Francisco Fed President Mary Daly said on Saturday that despite significant progress in lowering price pressures over the past two years, inflation remains uncomfortably above the 2% target, per Bloomberg.
- Fed Governor Adriana Kugler noted on Saturday that inflation remains uncomfortably above the Fed’s target, but the central bank is working on that.
- Richmond Fed President Thomas Barkin stated on Friday that the Fed's benchmark policy rate should stay restrictive until it is more certain that inflation is returning to its 2% goal.
USD/INR’s bullish tone remains in play but overbought RSI warrants caution for bulls
The Indian Rupee trades on a flat note on the day. Technically, the bullish view of the USD/INR pair remains intact as the pair has broken above the ascending trend channel over the past week and is well supported above the key 100-day Exponential Moving Average (EMA) on the daily timeframe.
However, the overbought 14-day Relative Strength Index (RSI) warrants caution for bulls. This suggests that further consolidation cannot be ruled out before positioning for any near-term USD/INR appreciation.
On the upside, the all-time high of 85.81 appears to be a tough nut to crack for bulls. A decisive break above this level could see a rally to the 86.00 psychological mark.
On the flip side, the resistance-turned-support level of 85.55 acts as an initial support level for the pair. Sustained trading below the mentioned level could pave the way to 85.00, en route to 84.43, the 100-day EMA.
Indian Rupee FAQs
The Indian Rupee (INR) is one of the most sensitive currencies to external factors. The price of Crude Oil (the country is highly dependent on imported Oil), the value of the US Dollar – most trade is conducted in USD – and the level of foreign investment, are all influential. Direct intervention by the Reserve Bank of India (RBI) in FX markets to keep the exchange rate stable, as well as the level of interest rates set by the RBI, are further major influencing factors on the Rupee.
The Reserve Bank of India (RBI) actively intervenes in forex markets to maintain a stable exchange rate, to help facilitate trade. In addition, the RBI tries to maintain the inflation rate at its 4% target by adjusting interest rates. Higher interest rates usually strengthen the Rupee. This is due to the role of the ‘carry trade’ in which investors borrow in countries with lower interest rates so as to place their money in countries’ offering relatively higher interest rates and profit from the difference.
Macroeconomic factors that influence the value of the Rupee include inflation, interest rates, the economic growth rate (GDP), the balance of trade, and inflows from foreign investment. A higher growth rate can lead to more overseas investment, pushing up demand for the Rupee. A less negative balance of trade will eventually lead to a stronger Rupee. Higher interest rates, especially real rates (interest rates less inflation) are also positive for the Rupee. A risk-on environment can lead to greater inflows of Foreign Direct and Indirect Investment (FDI and FII), which also benefit the Rupee.
Higher inflation, particularly, if it is comparatively higher than India’s peers, is generally negative for the currency as it reflects devaluation through oversupply. Inflation also increases the cost of exports, leading to more Rupees being sold to purchase foreign imports, which is Rupee-negative. At the same time, higher inflation usually leads to the Reserve Bank of India (RBI) raising interest rates and this can be positive for the Rupee, due to increased demand from international investors. The opposite effect is true of lower inflation.
- USD/CAD depreciates as the commodity-linked CAD receives support from higher Oil prices.
- WTI Oil price hovers near its highest level since October, driven by the potential increase in global fuel demand.
- The US Dollar Index holds its position near 109.00, close to recent highs.
USD/CAD halts its four-day winning streak, trading around 1.4400 during the Asian session on Monday. This downside of the pair could be attributed to the improved Canadian Dollar (CAD) amid higher Oil prices, given that Canada is the largest crude exporter to the United States (US).
West Texas Intermediate (WTI) Oil trades around $73.50 per barrel, nearing its highest level since October 2024. Investors are closely monitoring the potential impact of colder weather in the Northern Hemisphere and Beijing's economic stimulus measures on global fuel demand.
In Politics, Canadian Prime Minister Justin Trudeau is expected to announce his resignation before a national caucus meeting on Wednesday. Citing three sources, The Globe and Mail reported on Sunday that Trudeau is likely to announce as early as Monday that he will step down as Liberal Party Leader.
However, the downside of the USD/CAD pair could be limited as the US Dollar (USD) gains ground amid the Federal Reserve’s (Fed) hawkish policy shift. The US Dollar Index (DXY), which measures the US Dollar’s (USD) performance against six major currencies, holds its position near 109.00, close to recent highs.
After three consecutive rate cuts, the Fed is expected to halt its easing cycle at the January meeting. According to the latest dot plot in the Fed’s Summary of Economic Projections, policymakers anticipate the Federal Funds Rate reaching 3.9% by the end of the year, indicating expectations for just two rate cuts in 2025.
Fed officials have also signaled a more cautious approach to rate reductions in 2025. On Friday, Richmond Fed President Thomas Barkin highlighted that the benchmark policy rate should remain restrictive until there is greater confidence that inflation is on track to return to the 2% target.
Additionally, Fed Governor Adriana Kugler and San Francisco Fed President Mary Daly underscored the challenging balancing act facing US central bankers as they aim to slow the pace of monetary easing this year.
Canadian Dollar FAQs
The key factors driving the Canadian Dollar (CAD) are the level of interest rates set by the Bank of Canada (BoC), the price of Oil, Canada’s largest export, the health of its economy, inflation and the Trade Balance, which is the difference between the value of Canada’s exports versus its imports. Other factors include market sentiment – whether investors are taking on more risky assets (risk-on) or seeking safe-havens (risk-off) – with risk-on being CAD-positive. As its largest trading partner, the health of the US economy is also a key factor influencing the Canadian Dollar.
The Bank of Canada (BoC) has a significant influence on the Canadian Dollar by setting the level of interest rates that banks can lend to one another. This influences the level of interest rates for everyone. The main goal of the BoC is to maintain inflation at 1-3% by adjusting interest rates up or down. Relatively higher interest rates tend to be positive for the CAD. The Bank of Canada can also use quantitative easing and tightening to influence credit conditions, with the former CAD-negative and the latter CAD-positive.
The price of Oil is a key factor impacting the value of the Canadian Dollar. Petroleum is Canada’s biggest export, so Oil price tends to have an immediate impact on the CAD value. Generally, if Oil price rises CAD also goes up, as aggregate demand for the currency increases. The opposite is the case if the price of Oil falls. Higher Oil prices also tend to result in a greater likelihood of a positive Trade Balance, which is also supportive of the CAD.
While inflation had always traditionally been thought of as a negative factor for a currency since it lowers the value of money, the opposite has actually been the case in modern times with the relaxation of cross-border capital controls. Higher inflation tends to lead central banks to put up interest rates which attracts more capital inflows from global investors seeking a lucrative place to keep their money. This increases demand for the local currency, which in Canada’s case is the Canadian Dollar.
Macroeconomic data releases gauge the health of the economy and can have an impact on the Canadian Dollar. Indicators such as GDP, Manufacturing and Services PMIs, employment, and consumer sentiment surveys can all influence the direction of the CAD. A strong economy is good for the Canadian Dollar. Not only does it attract more foreign investment but it may encourage the Bank of Canada to put up interest rates, leading to a stronger currency. If economic data is weak, however, the CAD is likely to fall.
- The Japanese Yen continues to be undermined by wavering BoJ rate hike expectations.
- The au Jibun Bank Japan Services PMI was revised down to 50.9 from 51.4 for December.
- The USD stands near a two-year top amid the Fed’s hawkish shift and supports USD/JPY.
The Japanese Yen (JPY) attracts fresh sellers at the start of a new week and remains close to a multi-month low touched against its American counterpart in December on the back of the Bank of Japan's (BoJ) dovish outlook. Apart from this, the prevalent risk-on environment is seen undermining the safe-haven JPY. Furthermore, a bullish US Dollar (USD), bolstered by the Federal Reserve's (Fed) hawkish signal and the optimism over US President-elect Donald Trump's expansionary policies, acts as a tailwind for the USD/JPY pair.
Meanwhile, data released earlier this Monday showed that the business activity in Japan's service sector expanded for the second straight month in December. This comes on top of a pick-up in Japan's service-sector inflation and backs the case for a January BoJ rate hike. Apart from this, geopolitical risks and concerns about Trump's tariff plans hold back the JPY bears from placing aggressive bets. Moreover, speculations that Japanese authorities might intervene to prop up the domestic currency should help limit deeper JPY losses.
Japanese Yen bulls remain on the sidelines amid BoJ rate-hike uncertainty
- The Bank of Japan last month offered few clues on how soon it could push up borrowing costs again, while stressing the need to be more cautious amid domestic and global uncertainties.
- The au Jibun Bank Service Purchasing Managers' Index (PMI) was revised down to 50.9 for December, from the flash reading of 51.4, still marked expansion for the second straight month.
- The survey further revealed that the subindex of new business rose for a sixth straight month, employment grew for the 15th consecutive month and business sentiment stayed positive.
- BoJ Governor Kazuo Ueda hopes that wages and prices increase at a balanced pace this year and said that the timing of adjusting monetary support depends on economic, price and financial developments.
- Markets expect that the BoJ will raise rates to 0.50% by the end of March from 0.25%. The next BoJ meeting is scheduled on January 23-24 followed by another meeting on March 18-19.
- The Institute of Supply Management (ISM) reported on Friday that the US Manufacturing PMI improved from 48.4 to 49.3 in December, pointing to signs of resilience and potential for growth.
- The Federal Reserve signaled in December that it would slow the pace of interest rate cuts in 2025, which has been pushing the US Treasury bond yields and the US Dollar higher in recent weeks.
- San Francisco Fed President Mary Daly said on Saturday that despite significant progress in lowering price pressures over the past two years, inflation remains uncomfortably above the 2% target.
- Traders now look to the US economic docket – featuring the release of the final Services PMI and Factor Orders data – for some impetus and short-term trading opportunities later today.
- Investors this week will confront other important US macro data – ISM Services PMI, JOLTS Job Openings, the ADP report on private-sector employment and the Nonfarm Payrolls (NFP) report.
USD/JPY remains confined in a familiar range held over the past two weeks
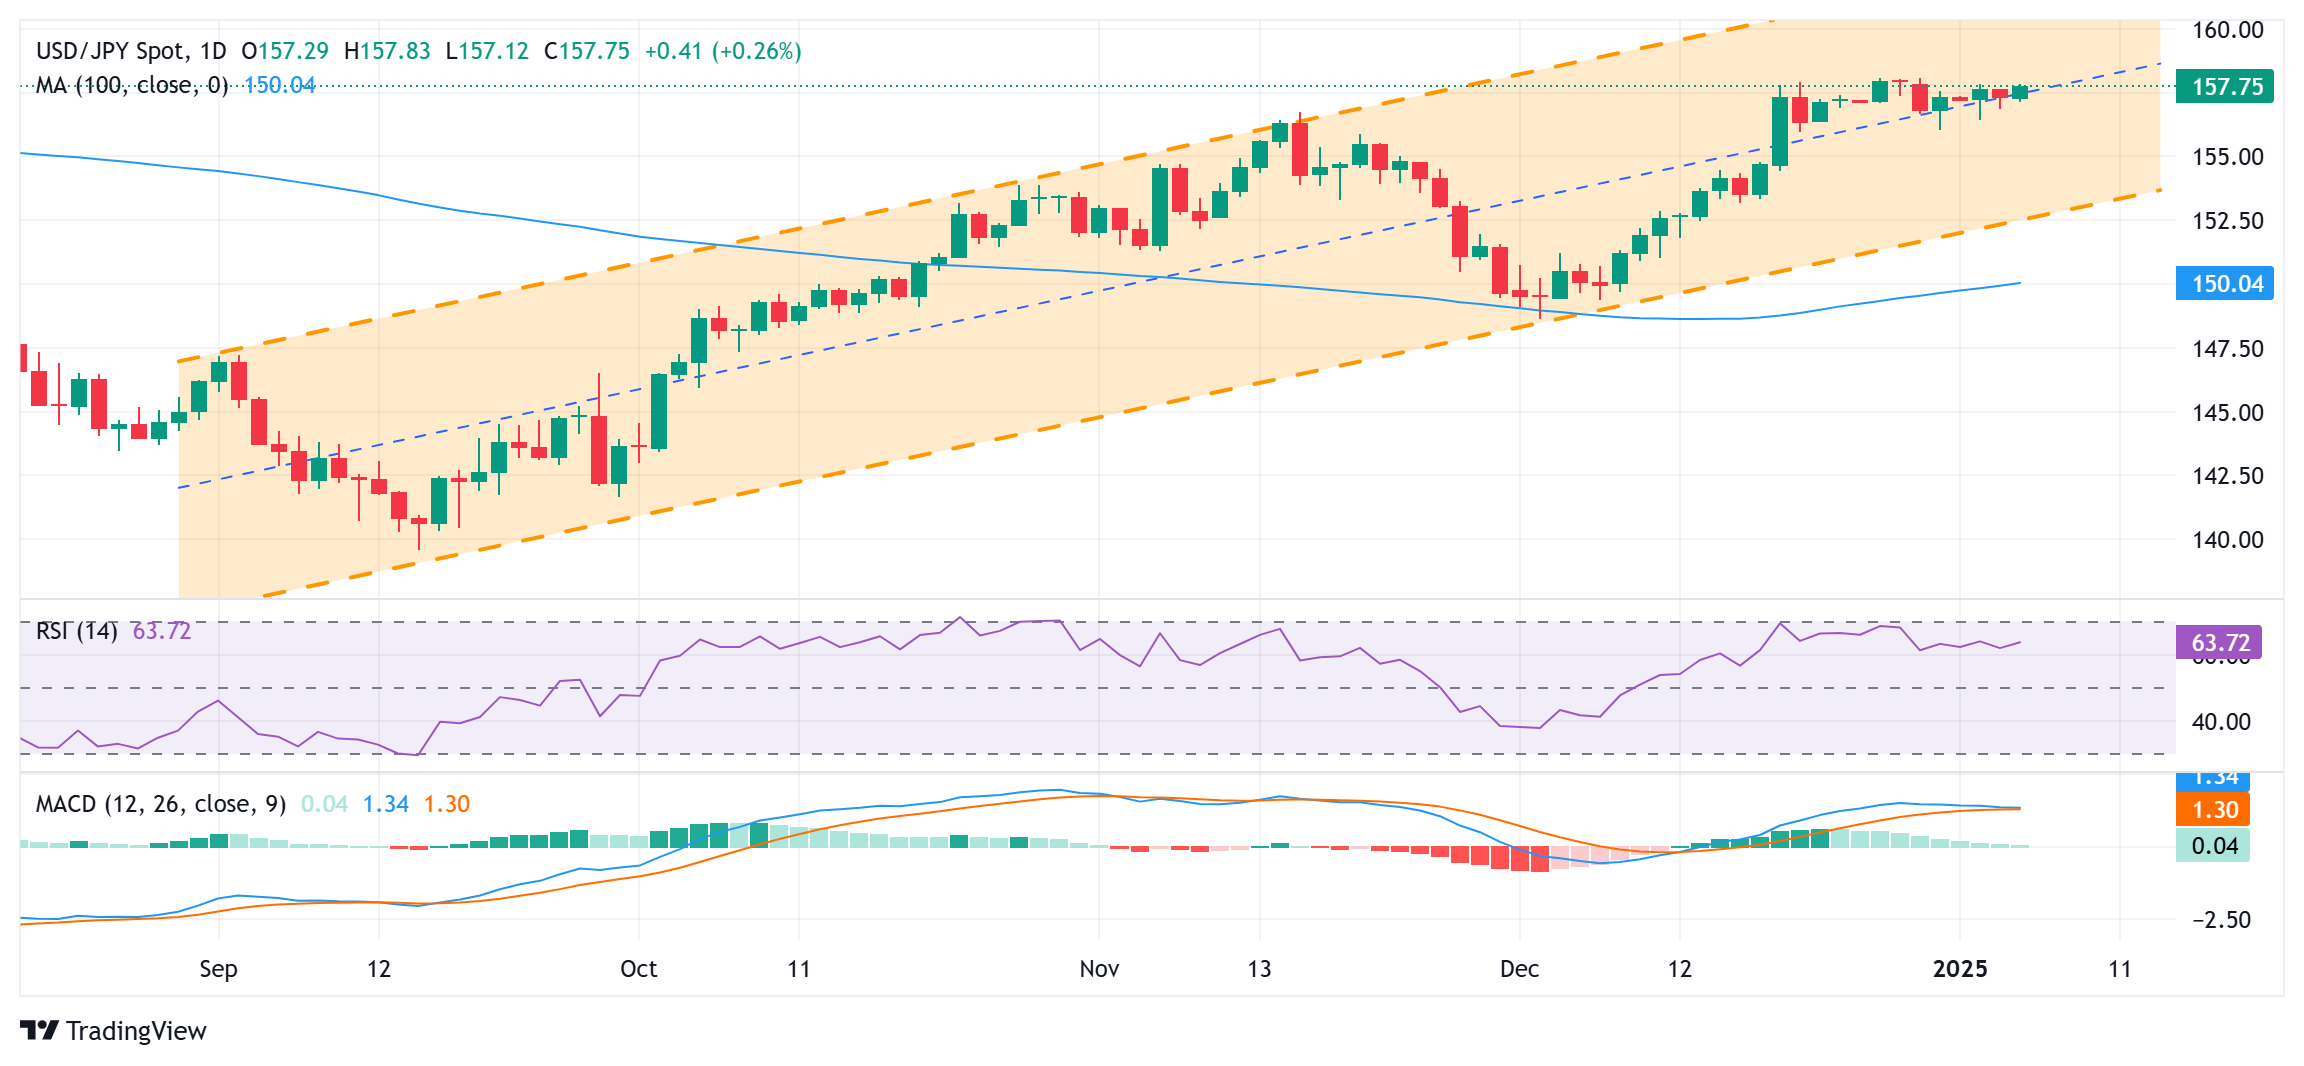
Any subsequent move-up is likely to face some resistance around the 158.00 neighbourhood, or the multi-month peak. A sustained move beyond will be seen as a fresh trigger for bullish traders and pave the way for additional gains amid positive oscillators on the daily chart. The USD/JPY pair might then aim to surpass the 158.45 intermediate hurdle and reclaim the 159.00 mark. The momentum could extend further towards the 160.00 psychological mark en route to the 160.50 area, which coincides with the top end of a multi-month-old ascending channel.
On the flip side, the Asian session low, around the 157.00 mark, now seems to protect the immediate downside ahead of the 156.65 horizontal zone and the 156.00 mark. Any further decline could be seen as a buying opportunity near the 155.50 region and help limit losses for the USD/JPY pair near the 155.00 psychological mark. The latter should act as a strong base for spot prices, which if broken decisively might shift the near-term bias in favor of bearish traders.
Japanese Yen FAQs
The Japanese Yen (JPY) is one of the world’s most traded currencies. Its value is broadly determined by the performance of the Japanese economy, but more specifically by the Bank of Japan’s policy, the differential between Japanese and US bond yields, or risk sentiment among traders, among other factors.
One of the Bank of Japan’s mandates is currency control, so its moves are key for the Yen. The BoJ has directly intervened in currency markets sometimes, generally to lower the value of the Yen, although it refrains from doing it often due to political concerns of its main trading partners. The BoJ ultra-loose monetary policy between 2013 and 2024 caused the Yen to depreciate against its main currency peers due to an increasing policy divergence between the Bank of Japan and other main central banks. More recently, the gradually unwinding of this ultra-loose policy has given some support to the Yen.
Over the last decade, the BoJ’s stance of sticking to ultra-loose monetary policy has led to a widening policy divergence with other central banks, particularly with the US Federal Reserve. This supported a widening of the differential between the 10-year US and Japanese bonds, which favored the US Dollar against the Japanese Yen. The BoJ decision in 2024 to gradually abandon the ultra-loose policy, coupled with interest-rate cuts in other major central banks, is narrowing this differential.
The Japanese Yen is often seen as a safe-haven investment. This means that in times of market stress, investors are more likely to put their money in the Japanese currency due to its supposed reliability and stability. Turbulent times are likely to strengthen the Yen’s value against other currencies seen as more risky to invest in.
US President-elect Donald Trump is back on X (formerly known as Twitter) after Friday’s post, reiterating his plans to ‘MAKE AMERICA GREAT AGAIN’.
Trump said, “members of Congress are getting to work on one powerful Bill that will bring our Country back, and make it greater than ever before. We must Secure our Border, Unleash American Energy, and Renew the Trump Tax Cuts, which were the largest in History, but we will make it even better - NO TAX ON TIPS. IT WILL ALL BE MADE UP WITH TARIFFS, AND MUCH MORE, FROM COUNTRIES THAT HAVE TAKEN ADVANTAGE OF THE U.S. FOR YEARS. Republicans must unite, and quickly deliver these Historic Victories for the American People. Get smart, tough, and send the Bill to my desk to sign as soon as possible. MAKE AMERICA GREAT AGAIN!.”
Market reaction
The US Dollar pays a little heed to these tweets from the Tariff man, trading 0.09% lower on the day at 109.15 against its major currency rivals.
Bank of Japan (BoJ) Governor Kazuo Ueda said on Monday that the “timing of adjusting monetary support depends on economic, price and financial developments.”
Additional comments
Must be vigilant to various risks in deciding timing for adjusting degree of monetary support.
Hope wage, prices increase at balanced pace this year.
Market reaction
USD/JPY seems unperturbed by Ueda’s comments, currently trading 0.29% higher on the day at 157.70.
Bank of Japan FAQs
The Bank of Japan (BoJ) is the Japanese central bank, which sets monetary policy in the country. Its mandate is to issue banknotes and carry out currency and monetary control to ensure price stability, which means an inflation target of around 2%.
The Bank of Japan embarked in an ultra-loose monetary policy in 2013 in order to stimulate the economy and fuel inflation amid a low-inflationary environment. The bank’s policy is based on Quantitative and Qualitative Easing (QQE), or printing notes to buy assets such as government or corporate bonds to provide liquidity. In 2016, the bank doubled down on its strategy and further loosened policy by first introducing negative interest rates and then directly controlling the yield of its 10-year government bonds. In March 2024, the BoJ lifted interest rates, effectively retreating from the ultra-loose monetary policy stance.
The Bank’s massive stimulus caused the Yen to depreciate against its main currency peers. This process exacerbated in 2022 and 2023 due to an increasing policy divergence between the Bank of Japan and other main central banks, which opted to increase interest rates sharply to fight decades-high levels of inflation. The BoJ’s policy led to a widening differential with other currencies, dragging down the value of the Yen. This trend partly reversed in 2024, when the BoJ decided to abandon its ultra-loose policy stance.
A weaker Yen and the spike in global energy prices led to an increase in Japanese inflation, which exceeded the BoJ’s 2% target. The prospect of rising salaries in the country – a key element fuelling inflation – also contributed to the move.
- The Australian Dollar holds gains following the PMI data release on Monday.
- The Caixin China Services PMI increased to 52.2 in December 2024, up from the previous reading of 51.5.
- The US Dollar Index hovers near 109.00, close to recent highs.
The Australian Dollar (AUD) extends its gains for the third successive session against the US Dollar (USD) on Monday. The AUD/USD appreciates as the AUD gains support following the release of the Judo Bank Australia Purchasing Managers' Index (PMI) and the Caixin Services PMI for China, its key trading partner.
The Judo Bank Australia Composite PMI for December 2024 was revised upward to 50.2 from the previous reading of 49.9, indicating a third consecutive month of marginal growth in private sector output. This expansion was driven by the services sector, as manufacturing output continued to contract. Meanwhile, the Services PMI was revised higher to 50.8, up from 50.5 in November, marking the eleventh consecutive month of growth in the services sector.
The Caixin China Services Purchasing Managers’ Index (PMI) rose to 52.2 in December 2024, up from 51.5 in November, exceeding market expectations of 51.7. This marks the fastest growth in the services sector since May. Meanwhile, the Caixin Manufacturing PMI, released on Thursday, unexpectedly fell to 50.5 in December, down from 51.5 in November, missing market forecasts of 51.7.
According to Reuters, the Shanghai Stock Exchange has committed to deepen capital markets opening during a meeting with foreign institutions. China’s economy is underpinned by solid fundamentals and demonstrates resilience amid a complex global environment. The Financial Times reported on Friday that the People's Bank of China (PBoC) anticipates an interest rate cut at an appropriate time this year. Given their close trade relationship, fluctuations in China’s economy often have a notable impact on Australian markets.
Australian Dollar advances despite a stronger US Dollar amid Fed's hawkish policy shift
- The US Dollar Index (DXY), which measures the US Dollar’s (USD) performance against six major currencies, holds its position near 109.00.
- The US ISM Manufacturing PMI improved to 49.3 in December, from 48.4 in November. This reading came in better than the market expectation of 48.4.
- The US Initial Jobless Claims for the week ending December 27 have come in lower than expected. Individuals claiming jobless benefits for the first time were 211K, lower than estimates of 222K and the former release of 220K.
- Traders are cautious regarding President-elect Trump’s economic policies, fearing that tariffs could increase the cost of living. These concerns were compounded by the Federal Open Market Committee’s (FOMC) recent projections, which indicated fewer rate cuts in 2025, reflecting caution amid persistent inflationary pressures.
- Escalating geopolitical tensions in the Middle East and the ongoing Russia-Ukraine war are likely to support the USD, a traditional safe-haven currency, in the near term. Analysts at Action Economics observed, “The greenback has been boosted by rising growth concerns elsewhere against the backdrop of geopolitical risk.”
- The National Development and Reform Commission (NDRC), China's state planner, expressed confidence in achieving continued economic recovery in 2025. In a statement on Friday, it highlighted plans to significantly increase funding from ultra-long treasury bonds to support "two new" programs, with expectations for steady consumption growth throughout the year.
Technical Analysis: Australian Dollar tests 14-day EMA ahead of 0.6250
The AUD/USD pair trades near 0.6230 on Monday, maintaining a bearish outlook as it continues to move within a descending channel on the daily chart. However, the 14-day Relative Strength Index (RSI) climbs above the 30 level, indicating a potential weakening of bearish momentum, despite the ongoing downtrend.
On the upside, the AUD/USD tests immediate resistance at the 14-day Exponential Moving Average (EMA) at 0.6243, followed by the descending channel’s upper boundary, around the psychological mark of 0.6300.
Regarding its support, the AUD/USD pair could navigate the region around the lower boundary of the descending channel, around 0.6020.
AUD/USD: Daily Chart
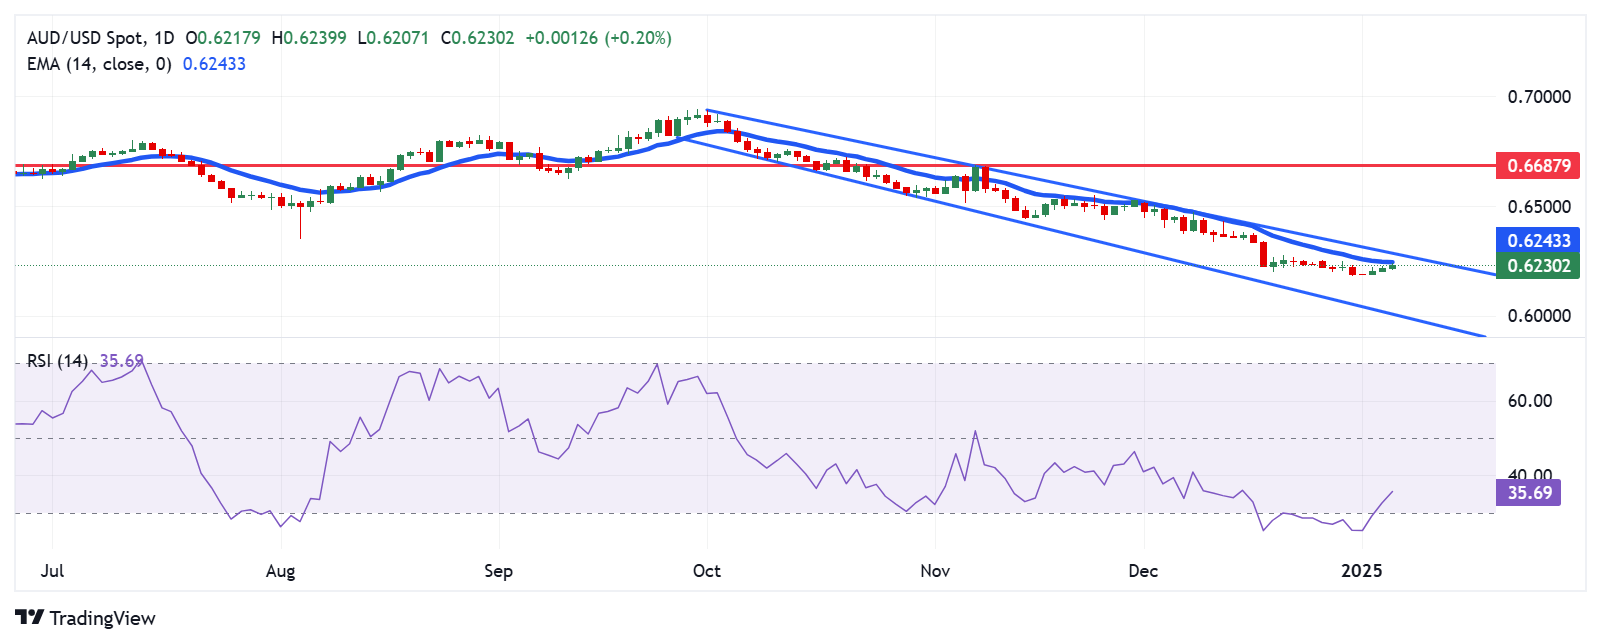
Australian Dollar PRICE Today
The table below shows the percentage change of Australian Dollar (AUD) against listed major currencies today. Australian Dollar was the strongest against the Japanese Yen.
| USD | EUR | GBP | JPY | CAD | AUD | NZD | CHF | |
|---|---|---|---|---|---|---|---|---|
| USD | -0.03% | -0.11% | 0.32% | -0.36% | -0.18% | -0.08% | 0.02% | |
| EUR | 0.03% | -0.08% | 0.33% | -0.26% | -0.10% | -0.00% | 0.09% | |
| GBP | 0.11% | 0.08% | 0.00% | -0.19% | -0.03% | 0.07% | 0.17% | |
| JPY | -0.32% | -0.33% | 0.00% | -0.68% | -0.48% | -0.37% | -0.07% | |
| CAD | 0.36% | 0.26% | 0.19% | 0.68% | 0.11% | 0.24% | 0.35% | |
| AUD | 0.18% | 0.10% | 0.03% | 0.48% | -0.11% | 0.10% | 0.19% | |
| NZD | 0.08% | 0.00% | -0.07% | 0.37% | -0.24% | -0.10% | 0.09% | |
| CHF | -0.02% | -0.09% | -0.17% | 0.07% | -0.35% | -0.19% | -0.09% |
The heat map shows percentage changes of major currencies against each other. The base currency is picked from the left column, while the quote currency is picked from the top row. For example, if you pick the Australian Dollar from the left column and move along the horizontal line to the US Dollar, the percentage change displayed in the box will represent AUD (base)/USD (quote).
Australian Dollar FAQs
One of the most significant factors for the Australian Dollar (AUD) is the level of interest rates set by the Reserve Bank of Australia (RBA). Because Australia is a resource-rich country another key driver is the price of its biggest export, Iron Ore. The health of the Chinese economy, its largest trading partner, is a factor, as well as inflation in Australia, its growth rate and Trade Balance. Market sentiment – whether investors are taking on more risky assets (risk-on) or seeking safe-havens (risk-off) – is also a factor, with risk-on positive for AUD.
The Reserve Bank of Australia (RBA) influences the Australian Dollar (AUD) by setting the level of interest rates that Australian banks can lend to each other. This influences the level of interest rates in the economy as a whole. The main goal of the RBA is to maintain a stable inflation rate of 2-3% by adjusting interest rates up or down. Relatively high interest rates compared to other major central banks support the AUD, and the opposite for relatively low. The RBA can also use quantitative easing and tightening to influence credit conditions, with the former AUD-negative and the latter AUD-positive.
China is Australia’s largest trading partner so the health of the Chinese economy is a major influence on the value of the Australian Dollar (AUD). When the Chinese economy is doing well it purchases more raw materials, goods and services from Australia, lifting demand for the AUD, and pushing up its value. The opposite is the case when the Chinese economy is not growing as fast as expected. Positive or negative surprises in Chinese growth data, therefore, often have a direct impact on the Australian Dollar and its pairs.
Iron Ore is Australia’s largest export, accounting for $118 billion a year according to data from 2021, with China as its primary destination. The price of Iron Ore, therefore, can be a driver of the Australian Dollar. Generally, if the price of Iron Ore rises, AUD also goes up, as aggregate demand for the currency increases. The opposite is the case if the price of Iron Ore falls. Higher Iron Ore prices also tend to result in a greater likelihood of a positive Trade Balance for Australia, which is also positive of the AUD.
The Trade Balance, which is the difference between what a country earns from its exports versus what it pays for its imports, is another factor that can influence the value of the Australian Dollar. If Australia produces highly sought after exports, then its currency will gain in value purely from the surplus demand created from foreign buyers seeking to purchase its exports versus what it spends to purchase imports. Therefore, a positive net Trade Balance strengthens the AUD, with the opposite effect if the Trade Balance is negative.
| Raw materials | Closed | Change, % |
|---|---|---|
| Silver | 29.603 | 0.2 |
| Gold | 2639.2 | -0.7 |
| Palladium | 912.57 | -0.17 |
Citing three sources, a Canadian news outlet, The Global and Mail, reported on Sunday that Prime Minister (PM) Justin Trudeau will likely announce as early as Monday that he will resign as Liberal Party Leader.
The sources said that the timing of Trudeau’s announcement is not definitely known but said they expect it will happen before a key national caucus meeting on Wednesday.
The three sources added that they are unsure about what the Liberal Party national executive plans to do to replace Mr. Trudeau as leader.
However, a fourth source said they believed that Mr. Trudeau would stay in his position until a new leader was chosen.
This comes “as the Prime Minister faces a caucus revolt and dismal public opinion polls that show his party will likely be swept out of power by Pierre Poilievre’s Conservatives in a landslide victory,” the Canadian news agency reported.
Market reaction
USD/CAD sheds 0.35% on the day on the following headlines, breaching the 1.4400 level amid renewed strenth in the Canadian Dollar (CAD).
Canadian Dollar PRICE Today
The table below shows the percentage change of Canadian Dollar (CAD) against listed major currencies today. Canadian Dollar was the strongest against the Japanese Yen.
| USD | EUR | GBP | JPY | CAD | AUD | NZD | CHF | |
|---|---|---|---|---|---|---|---|---|
| USD | -0.03% | -0.11% | 0.33% | -0.37% | -0.20% | -0.11% | 0.02% | |
| EUR | 0.03% | -0.08% | 0.34% | -0.27% | -0.13% | -0.03% | 0.09% | |
| GBP | 0.11% | 0.08% | 0.00% | -0.19% | -0.05% | 0.05% | 0.17% | |
| JPY | -0.33% | -0.34% | 0.00% | -0.69% | -0.51% | -0.41% | -0.08% | |
| CAD | 0.37% | 0.27% | 0.19% | 0.69% | 0.09% | 0.22% | 0.37% | |
| AUD | 0.20% | 0.13% | 0.05% | 0.51% | -0.09% | 0.10% | 0.22% | |
| NZD | 0.11% | 0.03% | -0.05% | 0.41% | -0.22% | -0.10% | 0.12% | |
| CHF | -0.02% | -0.09% | -0.17% | 0.08% | -0.37% | -0.22% | -0.12% |
The heat map shows percentage changes of major currencies against each other. The base currency is picked from the left column, while the quote currency is picked from the top row. For example, if you pick the Canadian Dollar from the left column and move along the horizontal line to the US Dollar, the percentage change displayed in the box will represent CAD (base)/USD (quote).
- NZD/USD gains traction to around 0.5620 in Monday’s Asian session.
- China's Caixin Services PMI rose to 52.2 vs. 51.5 prior, stronger than expected.
- The hawkish remarks from the Fed could underpin the USD and create a headwind for the pair.
The NZD/USD pair attracts some buyers to near 0.5620 on Monday during the Asian trading hours on Monday. The New Zealand Dollar (NZD) strengthens after the Chinese Caixin Services Purchasing Managers Index (PMI) data for December.
China's services activity expanded at a faster pace in December, with the Caixin Services PMI rising to 52.2 from 51.5 in November. This reading came in stronger than the expectation of 51.7. The Kiwi edges higher in an immediate reaction to the upbeat Chinese economic data.
Additionally, the People’s Bank of China (PBOC) said over the weekend that it will use new tools to provide liquidity to the stock market and reaffirmed its commitment to lower interest rates and the reserve requirement ratio for banks “at an appropriate time” to promote growth. The supportive measures from China boost the Kiwi, as China is a major trading partner for New Zealand.
However, the upside for the pair might be limited amid the potential tariff threats by US President-elect Donald Trump. Trump said that he would charge China an additional 10% tariff, above any additional tariffs, after being inaugurated on January 20. The uncertainty and instability in the Chinese economy could weigh on the China-proxy New Zealand Dollar (NZD) as China is a major trading partner for New Zealand.
The US Federal Reserve (Fed) Chair Jerome Powell was suitably hawkish at the December meeting, which has provided some support to the Greenback. However, the decisions remain data-dependent, and a slew of important December data points this week could offer some hints about the interest rate outlook this year. The Federal Open Market Committee (FOMC) Minutes will be published on Wednesday. Later on Friday, the US December labor market data will be closely monitored, including the Nonfarm Payrolls (NFP), Unemployment Rate and Average Hourly Earnings.
New Zealand Dollar FAQs
The New Zealand Dollar (NZD), also known as the Kiwi, is a well-known traded currency among investors. Its value is broadly determined by the health of the New Zealand economy and the country’s central bank policy. Still, there are some unique particularities that also can make NZD move. The performance of the Chinese economy tends to move the Kiwi because China is New Zealand’s biggest trading partner. Bad news for the Chinese economy likely means less New Zealand exports to the country, hitting the economy and thus its currency. Another factor moving NZD is dairy prices as the dairy industry is New Zealand’s main export. High dairy prices boost export income, contributing positively to the economy and thus to the NZD.
The Reserve Bank of New Zealand (RBNZ) aims to achieve and maintain an inflation rate between 1% and 3% over the medium term, with a focus to keep it near the 2% mid-point. To this end, the bank sets an appropriate level of interest rates. When inflation is too high, the RBNZ will increase interest rates to cool the economy, but the move will also make bond yields higher, increasing investors’ appeal to invest in the country and thus boosting NZD. On the contrary, lower interest rates tend to weaken NZD. The so-called rate differential, or how rates in New Zealand are or are expected to be compared to the ones set by the US Federal Reserve, can also play a key role in moving the NZD/USD pair.
Macroeconomic data releases in New Zealand are key to assess the state of the economy and can impact the New Zealand Dollar’s (NZD) valuation. A strong economy, based on high economic growth, low unemployment and high confidence is good for NZD. High economic growth attracts foreign investment and may encourage the Reserve Bank of New Zealand to increase interest rates, if this economic strength comes together with elevated inflation. Conversely, if economic data is weak, NZD is likely to depreciate.
The New Zealand Dollar (NZD) tends to strengthen during risk-on periods, or when investors perceive that broader market risks are low and are optimistic about growth. This tends to lead to a more favorable outlook for commodities and so-called ‘commodity currencies’ such as the Kiwi. Conversely, NZD tends to weaken at times of market turbulence or economic uncertainty as investors tend to sell higher-risk assets and flee to the more-stable safe havens.
China's Services Purchasing Managers' Index (PMI) rose to 52.2 in December from 51.5 in November, according to the latest data published by Caixin on Monday.
The data came above the market forecast of 51.7 in the reported period.
AUD/USD reaction to China’s Services PMI
At the time of writing, the AUD/USD pair is up 0.27% on the day near 0.6230, holding the bounce from the 6210 area.
Australian Dollar FAQs
One of the most significant factors for the Australian Dollar (AUD) is the level of interest rates set by the Reserve Bank of Australia (RBA). Because Australia is a resource-rich country another key driver is the price of its biggest export, Iron Ore. The health of the Chinese economy, its largest trading partner, is a factor, as well as inflation in Australia, its growth rate and Trade Balance. Market sentiment – whether investors are taking on more risky assets (risk-on) or seeking safe-havens (risk-off) – is also a factor, with risk-on positive for AUD.
The Reserve Bank of Australia (RBA) influences the Australian Dollar (AUD) by setting the level of interest rates that Australian banks can lend to each other. This influences the level of interest rates in the economy as a whole. The main goal of the RBA is to maintain a stable inflation rate of 2-3% by adjusting interest rates up or down. Relatively high interest rates compared to other major central banks support the AUD, and the opposite for relatively low. The RBA can also use quantitative easing and tightening to influence credit conditions, with the former AUD-negative and the latter AUD-positive.
China is Australia’s largest trading partner so the health of the Chinese economy is a major influence on the value of the Australian Dollar (AUD). When the Chinese economy is doing well it purchases more raw materials, goods and services from Australia, lifting demand for the AUD, and pushing up its value. The opposite is the case when the Chinese economy is not growing as fast as expected. Positive or negative surprises in Chinese growth data, therefore, often have a direct impact on the Australian Dollar and its pairs.
Iron Ore is Australia’s largest export, accounting for $118 billion a year according to data from 2021, with China as its primary destination. The price of Iron Ore, therefore, can be a driver of the Australian Dollar. Generally, if the price of Iron Ore rises, AUD also goes up, as aggregate demand for the currency increases. The opposite is the case if the price of Iron Ore falls. Higher Iron Ore prices also tend to result in a greater likelihood of a positive Trade Balance for Australia, which is also positive of the AUD.
The Trade Balance, which is the difference between what a country earns from its exports versus what it pays for its imports, is another factor that can influence the value of the Australian Dollar. If Australia produces highly sought after exports, then its currency will gain in value purely from the surplus demand created from foreign buyers seeking to purchase its exports versus what it spends to purchase imports. Therefore, a positive net Trade Balance strengthens the AUD, with the opposite effect if the Trade Balance is negative.
On Monday, the People’s Bank of China (PBoC) set the USD/CNY central rate for the trading session ahead at 7.1876 as compared to Friday's fix of 7.1878 and 7.3035 Reuters estimates.
- EUR/USD could decline to parity due to the divergent monetary policy outlooks between the Fed and the ECB.
- Markets price in a 113 basis point reduction in ECB interest rates for this year.
- The US Federal Reserve is expected to pause its easing cycle during the January meeting.
EUR/USD edges lower after registering gains in the previous session, trading around 1.0300 during the Asian hours on Monday. Traders are expected to closely monitor the HCOB Composite Purchasing Managers’ Index (PMI) for the Eurozone and the preliminary Consumer Price Index (CPI) data for Germany, both of which are scheduled for release later in the day.
The EUR/USD pair faces headwinds as market analysts anticipate further declines, potentially reaching parity, driven by diverging monetary policy outlooks between the Federal Reserve (Fed) and the European Central Bank (ECB).
In the Eurozone, ECB policymakers favor continuing the current pace of monetary easing. Markets have already priced in a 113 basis point (bps) reduction in ECB interest rates for this year, implying at least four 25 bps rate cuts. This outlook reflects growing concerns over the Eurozone's inflation falling short of the ECB's 2% target.
On Thursday, ECB Governing Council member and Bank of Greece Governor Yannis Stournaras stated in an interview with Skai Radio that the central bank’s base interest rates should decline to “around 2%” by the “autumn of this year.” This suggests that the ECB will likely reduce its Deposit Facility rate at each of its next four policy meetings.
In contrast, the US Federal Reserve is expected to pause its easing cycle at the January meeting, following three consecutive rate cuts. According to the latest dot plot in the Fed’s Summary of Economic Projections, policymakers anticipate the Federal Funds Rate reaching 3.9% by the end of the year, indicating expectations for just two rate cuts in 2025.
Fed officials have also signaled a more cautious approach to rate reductions in 2025. On Friday, Richmond Fed President Thomas Barkin highlighted that the benchmark policy rate should remain restrictive until there is greater confidence that inflation will return to the 2% target. Similarly, Fed Governor Adriana Kugler and San Francisco Fed President Mary Daly underscored the challenging balancing act facing US central bankers as they aim to slow the pace of monetary easing this year.
Economic Indicator
Consumer Price Index (MoM)
The Consumer Price Index (CPI), released by the German statistics office Destatis on a monthly basis, measures the average price change for all goods and services purchased by households for consumption purposes. The CPI is the main indicator to measure inflation and changes in purchasing trends. The MoM figure compares the prices of goods in the reference month to the previous month. A high reading is bullish for the Euro (EUR), while a low reading is bearish.
Read more.Next release: Mon Jan 06, 2025 13:00 (Prel)
Frequency: Monthly
Consensus: 0.4%
Previous: -0.2%
- GBP/USD kicks off the new week on a subdued note as USD stands near a two-year high.
- The Fed’s hawkish shift, trader war fears and geopolitical risks underpin the safe-haven buck.
- The fundamental backdrop warrants caution before positioning for any meaningful recovery.
The GBP/USD pair struggles to capitalize on Friday's modest recovery gains and oscillates in a range, above the 1.2400 mark at the start of a new week. Spot prices, meanwhile, remain close to the lowest level since April 2024 touched last week and seem vulnerable to prolonging over a three-month-old downtrend on the back of a bullish US Dollar (USD).
In fact, the USD Index (DXY), which tracks the Greenback against a basket of currencies, stands firm near a two-year high amid the optimism over US President-elect Donald Trump's expansionary policies and the Federal Reserve's (Fed) hawkish outlook. Adding to this concerns over Trump’s sweeping tariffs, along with geopolitical risks stemming from the Russia-Ukraine war and rising tensions in the Middle East, underpins the safe-haven buck and act as a headwind for the GBP/USD pair.
Meanwhile, the sentiment surrounding the British Pound (GBP) remains weak amid a series of weak data from the UK recently and doubts about the newly elected Labour government’s fiscal strategy. Furthermore, the Bank of England's (BoE) relatively dovish stance and a split vote decision to leave interest rates unchanged in December might continue to weigh on the GBP. This validates the negative outlook for the GBP/USD pair as traders look to the final UK Services PMI for a fresh impetus.
Later during the North American session, the US macro data – final Services PMI and Factory Orders – might influence the USD and contribute to producing short-term opportunities. Nevertheless, the fundamental backdrop seems tilted in favor of the USD bulls and suggests that the path of least resistance for the GBP/USD pair is to the downside. Investors, however, might opt to wait for this week's important US economic releases, including the crucial US Nonfarm Payrolls (NFP) on Friday.
Pound Sterling FAQs
The Pound Sterling (GBP) is the oldest currency in the world (886 AD) and the official currency of the United Kingdom. It is the fourth most traded unit for foreign exchange (FX) in the world, accounting for 12% of all transactions, averaging $630 billion a day, according to 2022 data. Its key trading pairs are GBP/USD, also known as ‘Cable’, which accounts for 11% of FX, GBP/JPY, or the ‘Dragon’ as it is known by traders (3%), and EUR/GBP (2%). The Pound Sterling is issued by the Bank of England (BoE).
The single most important factor influencing the value of the Pound Sterling is monetary policy decided by the Bank of England. The BoE bases its decisions on whether it has achieved its primary goal of “price stability” – a steady inflation rate of around 2%. Its primary tool for achieving this is the adjustment of interest rates. When inflation is too high, the BoE will try to rein it in by raising interest rates, making it more expensive for people and businesses to access credit. This is generally positive for GBP, as higher interest rates make the UK a more attractive place for global investors to park their money. When inflation falls too low it is a sign economic growth is slowing. In this scenario, the BoE will consider lowering interest rates to cheapen credit so businesses will borrow more to invest in growth-generating projects.
Data releases gauge the health of the economy and can impact the value of the Pound Sterling. Indicators such as GDP, Manufacturing and Services PMIs, and employment can all influence the direction of the GBP. A strong economy is good for Sterling. Not only does it attract more foreign investment but it may encourage the BoE to put up interest rates, which will directly strengthen GBP. Otherwise, if economic data is weak, the Pound Sterling is likely to fall.
Another significant data release for the Pound Sterling is the Trade Balance. This indicator measures the difference between what a country earns from its exports and what it spends on imports over a given period. If a country produces highly sought-after exports, its currency will benefit purely from the extra demand created from foreign buyers seeking to purchase these goods. Therefore, a positive net Trade Balance strengthens a currency and vice versa for a negative balance.
Federal Reserve Bank of San Francisco President Mary Daly said on Saturday that despite significant progress in lowering price pressures over the past two years, inflation remains uncomfortably above the 2% target, per Bloomberg.
Key quotes
Inflation remains above our target.
Labor market equilibrium maintained, opposes further deceleration.
Notes increased tradeoff between inflation and job market.
Policy rules serve as a beginning point, setting the tone for discussion.
I would not want to see further slowing in the labor market.
So while we do absolutely have to continue to get inflation down to our 2% target, we have to be resolute about that we have to do it in a thoughtful manner so that we can also support the full employment goal.
Market reaction
The US Dollar Index (DXY) is trading 0.11% higher on the day at 109.05, as of writing.
Fed FAQs
Monetary policy in the US is shaped by the Federal Reserve (Fed). The Fed has two mandates: to achieve price stability and foster full employment. Its primary tool to achieve these goals is by adjusting interest rates. When prices are rising too quickly and inflation is above the Fed’s 2% target, it raises interest rates, increasing borrowing costs throughout the economy. This results in a stronger US Dollar (USD) as it makes the US a more attractive place for international investors to park their money. When inflation falls below 2% or the Unemployment Rate is too high, the Fed may lower interest rates to encourage borrowing, which weighs on the Greenback.
The Federal Reserve (Fed) holds eight policy meetings a year, where the Federal Open Market Committee (FOMC) assesses economic conditions and makes monetary policy decisions. The FOMC is attended by twelve Fed officials – the seven members of the Board of Governors, the president of the Federal Reserve Bank of New York, and four of the remaining eleven regional Reserve Bank presidents, who serve one-year terms on a rotating basis.
In extreme situations, the Federal Reserve may resort to a policy named Quantitative Easing (QE). QE is the process by which the Fed substantially increases the flow of credit in a stuck financial system. It is a non-standard policy measure used during crises or when inflation is extremely low. It was the Fed’s weapon of choice during the Great Financial Crisis in 2008. It involves the Fed printing more Dollars and using them to buy high grade bonds from financial institutions. QE usually weakens the US Dollar.
Quantitative tightening (QT) is the reverse process of QE, whereby the Federal Reserve stops buying bonds from financial institutions and does not reinvest the principal from the bonds it holds maturing, to purchase new bonds. It is usually positive for the value of the US Dollar.
- Gold price holds steady around $2,640 in Monday’s early Asian session.
- US Manufacturing PMI improved to 49.3 in December vs. 48.4 prior, stronger than expected.
- Sustained geopolitical risks and a wave of purchases by central banks could lift the Gold price.
The Gold price (XAU/USD) struggles to gain ground near $2,640 during the early Asian trading hours on Monday. The stronger US Dollar (USD) after the US ISM Manufacturing Purchasing Managers Index (PMI) weighs on the yellow metal. All eyes will be on the US labor market data for December on Friday for fresh impetus.
Data released by the Institute for Supply Management (ISM) on Friday showed that the US Manufacturing PMI rose to 49.3 in December from 48.4 in November. This reading was above the market consensus of 48.4. The upbeat data has lifted the Greenback and dragged the USD-denominated commodity price lower.
Furthermore, the US Federal Reserve's (Fed) projection of fewer interest rate cuts could undermine the non-yielding asset. The US central bank decided to cut the interest rates in December but signaled that borrowing costs will fall more slowly than previously expected this year.
On the other hand, economic uncertainties and geopolitical tensions might boost a safe-haven asset like Gold. On Sunday, Israel and Hamas wrangled over a deal to cease violence in the Gaza Strip and return hostages home as Palestinian officials said that Israeli bombardments killed over 100 people over the weekend.
Central bank purchasing activities could contribute to the precious metal’s upside. Central banks are forecast to continue to be net buyers of around 8 million oz. in 2025, roughly unchanged to a bit lower than in 2024.
Gold FAQs
Gold has played a key role in human’s history as it has been widely used as a store of value and medium of exchange. Currently, apart from its shine and usage for jewelry, the precious metal is widely seen as a safe-haven asset, meaning that it is considered a good investment during turbulent times. Gold is also widely seen as a hedge against inflation and against depreciating currencies as it doesn’t rely on any specific issuer or government.
Central banks are the biggest Gold holders. In their aim to support their currencies in turbulent times, central banks tend to diversify their reserves and buy Gold to improve the perceived strength of the economy and the currency. High Gold reserves can be a source of trust for a country’s solvency. Central banks added 1,136 tonnes of Gold worth around $70 billion to their reserves in 2022, according to data from the World Gold Council. This is the highest yearly purchase since records began. Central banks from emerging economies such as China, India and Turkey are quickly increasing their Gold reserves.
Gold has an inverse correlation with the US Dollar and US Treasuries, which are both major reserve and safe-haven assets. When the Dollar depreciates, Gold tends to rise, enabling investors and central banks to diversify their assets in turbulent times. Gold is also inversely correlated with risk assets. A rally in the stock market tends to weaken Gold price, while sell-offs in riskier markets tend to favor the precious metal.
The price can move due to a wide range of factors. Geopolitical instability or fears of a deep recession can quickly make Gold price escalate due to its safe-haven status. As a yield-less asset, Gold tends to rise with lower interest rates, while higher cost of money usually weighs down on the yellow metal. Still, most moves depend on how the US Dollar (USD) behaves as the asset is priced in dollars (XAU/USD). A strong Dollar tends to keep the price of Gold controlled, whereas a weaker Dollar is likely to push Gold prices up.
| Index | Change, points | Closed | Change, % |
|---|---|---|---|
| Hang Seng | 136.95 | 19760.27 | 0.7 |
| KOSPI | 42.98 | 2441.92 | 1.79 |
| ASX 200 | 49.3 | 8250.5 | 0.6 |
| DAX | -118.58 | 19906.08 | -0.59 |
| CAC 40 | -111.54 | 7282.22 | -1.51 |
| Dow Jones | 339.86 | 42732.13 | 0.8 |
| S&P 500 | 73.92 | 5942.47 | 1.26 |
| NASDAQ Composite | 340.89 | 19621.68 | 1.77 |
| Pare | Closed | Change, % |
|---|---|---|
| AUDUSD | 0.62179 | 0.33 |
| EURJPY | 162.059 | 0.4 |
| EURUSD | 1.03049 | 0.47 |
| GBPJPY | 195.474 | 0.35 |
| GBPUSD | 1.24289 | 0.47 |
| NZDUSD | 0.56097 | 0.32 |
| USDCAD | 1.44441 | 0.33 |
| USDCHF | 0.9088 | -0.31 |
| USDJPY | 157.268 | -0.13 |


© 2000-2026. Bản quyền Teletrade.
Trang web này được quản lý bởi Teletrade D.J. LLC 2351 LLC 2022 (Euro House, Richmond Hill Road, Kingstown, VC0100, St. Vincent and the Grenadines).
Thông tin trên trang web không phải là cơ sở để đưa ra quyết định đầu tư và chỉ được cung cấp cho mục đích làm quen.
Giao dịch trên thị trường tài chính (đặc biệt là giao dịch sử dụng các công cụ biên) mở ra những cơ hội lớn và tạo điều kiện cho các nhà đầu tư sẵn sàng mạo hiểm để thu lợi nhuận, tuy nhiên nó mang trong mình nguy cơ rủi ro khá cao. Chính vì vậy trước khi tiến hành giao dịch cần phải xem xét mọi mặt vấn đề chấp nhận tiến hành giao dịch cụ thể xét theo quan điểm của nguồn lực tài chính sẵn có và mức độ am hiểu thị trường tài chính.
Sử dụng thông tin: sử dụng toàn bộ hay riêng biệt các dữ liệu trên trang web của công ty TeleTrade như một nguồn cung cấp thông tin nhất định. Việc sử dụng tư liệu từ trang web cần kèm theo liên kết đến trang teletrade.vn. Việc tự động thu thập số liệu cũng như thông tin từ trang web TeleTrade đều không được phép.
Xin vui lòng liên hệ với pr@teletrade.global nếu có câu hỏi.
ngân hàng