- Phân tích
- Tin tức và các công cụ
- Tin tức thị trường
Tin tức thì trường
- GBP/JPY is set to finish the week with decent losses of 1.28%.
- From a daily chart perspective, the cross-currency GBP/JPY shifted to neutral biased.
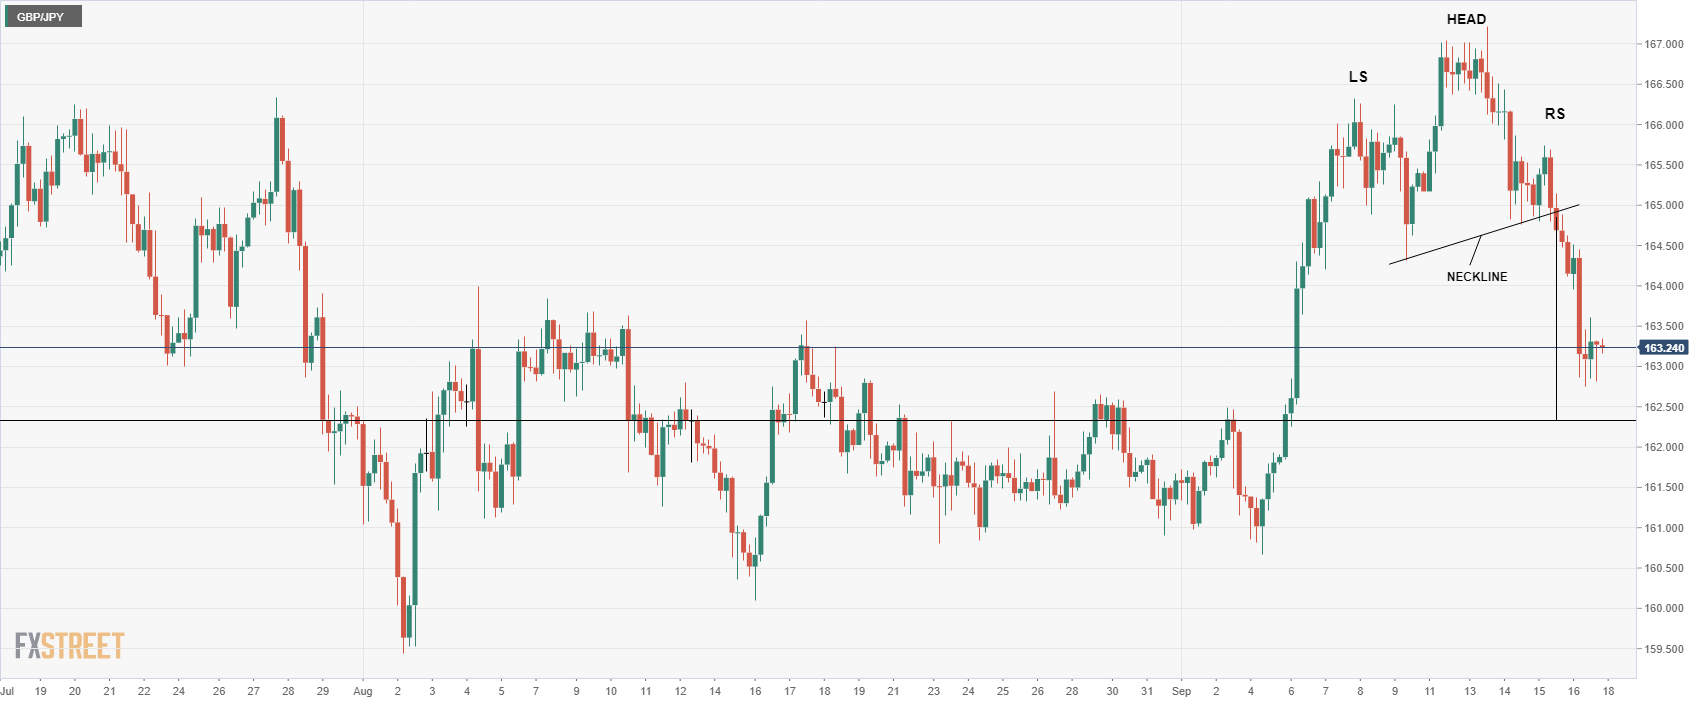
- Short term, the GBP/JPY is about to hit 162.30. the head-and-shoulders target.
The GBP/JPY drops for the four consecutive trading session, down by 0.86% on Friday, after Wall Street finished the last trading day with losses between 0.45% and 0.90%, spurred by a dismal sentiment. In the FX complex, safe-haven peers rose, except for the greenback, which finished unchanged. At the time of writing, the GBP/JPY is trading at 163.24, as Wall Street’s close.
GBP/JPY Price Analysis: Technical outlook
From a daily chart perspective, the GBP/JPY is neutral biased, after sliding below the 55-day EMA. It’s worth noting that the cross, tumbled below the August 17 daily low at 163.55, opening the door for further losses. Even though, the GBP/JPY reached a daily low at around 162.73 and failed to stick below 163.00, the bias shifted to neutral-downwards.
Short term, the GBP/JPY four-hour scale depicts the cross-currency pair formed a head-and-shoulders chart pattern, which targets a drop towards 162.30, as measured from head-to-the-neckline chart pattern. On Friday, the GBP/JPY tumbled from around 164.50, and reached a daily low at 162.73, shy of the target. Nevertheless, the GBP/JPY bias remain downwards, so it might reach the head-and-shoulders target, in the near term.
Therefore, the GBP/JPY first support would be the 163.00 psychological level. A breach of the latter will expose the September 16 cycle low at 162.73, followed by the head-and-shoulders target at 162.30.
GBP/JPY Key Technical Levels
- Silver price is erasing Thursday’s losses up by almost 2% on Friday.
- September’s US economic data justifies the Fed’s 75 bps rate hike.
- The US Consumer Sentiment improved, showing US citizens resilience despite a worsening economic outlook.
The silver price climbed as the Wall Street close looms, gaining 1.85% during the day, caused by a soft US dollar, while US Treasury yields stalled. Positive US economic data relieve investors’ worries about the Federal Reserve hiking 100 bps instead of 75 in the next week’s meeting, while a risk-off impulse keeps global equities in the red. At the time of writing, the XAG/USD is trading at $19.54, back above the $19.00 mark.
XAG/USD climbs due to US T-bond yields unchanged, and a soft US dollar
Earlier, US economic data revealed that US Consumer Sentiment continued improving, despite increasing fears that the US central bank tightening would spark a US recession. The reading ticked to 59.5, lower than estimates but above the prior month’s reading of 58.6.
“After the marked improvement in sentiment in August, consumers showed signs of uncertainty over the trajectory of the economy.” Inflation expectations in the same report for 1-year dropped to 4.6% vs. 4,8% in August,” Joanne Hsu, director of the UoM Survey, said.
Meanwhile, the greenback is fluctuating during the session, about to finish unchanged. The US Dollar Index is down 0.02%, at 109.718, while the US 10-year benchmark note rate is at 3.449%, almost flat.
These previously mentioned factors bolstered appetite for the non-yielding metal, gaining traction, and extending its weekly gains to 3.86%.
Aside from this, US data reported during the current month is giving the green light to Fed officials to raise rates by ¾ of a percent to the 3-3.25% range. Even though there has been speculation that the Fed might go 100 bps, analysts at Societe Generale think otherwise.
“The FOMC meets on the 21 September, and we expect a third 75-bp rate hike. There has been some talk of 100bp, but Fed officials pushed back on that option earlier and we do not expect them to take it now. Longer term, the extension of the SEP through 2025 offers much more insight into their business cycle views,” analysts at Societe Generale wrote.
Silver (XAG/USD) Key Technical Levels
- The Loonie would finish the week with losses above 2%.
- A dismal sentiment weighed on risk-sensitive currencies like the Canadian dollar.
- USD/CAD Price Analysis: A daily close above 1.3300 could pave the way towards 1.3400.
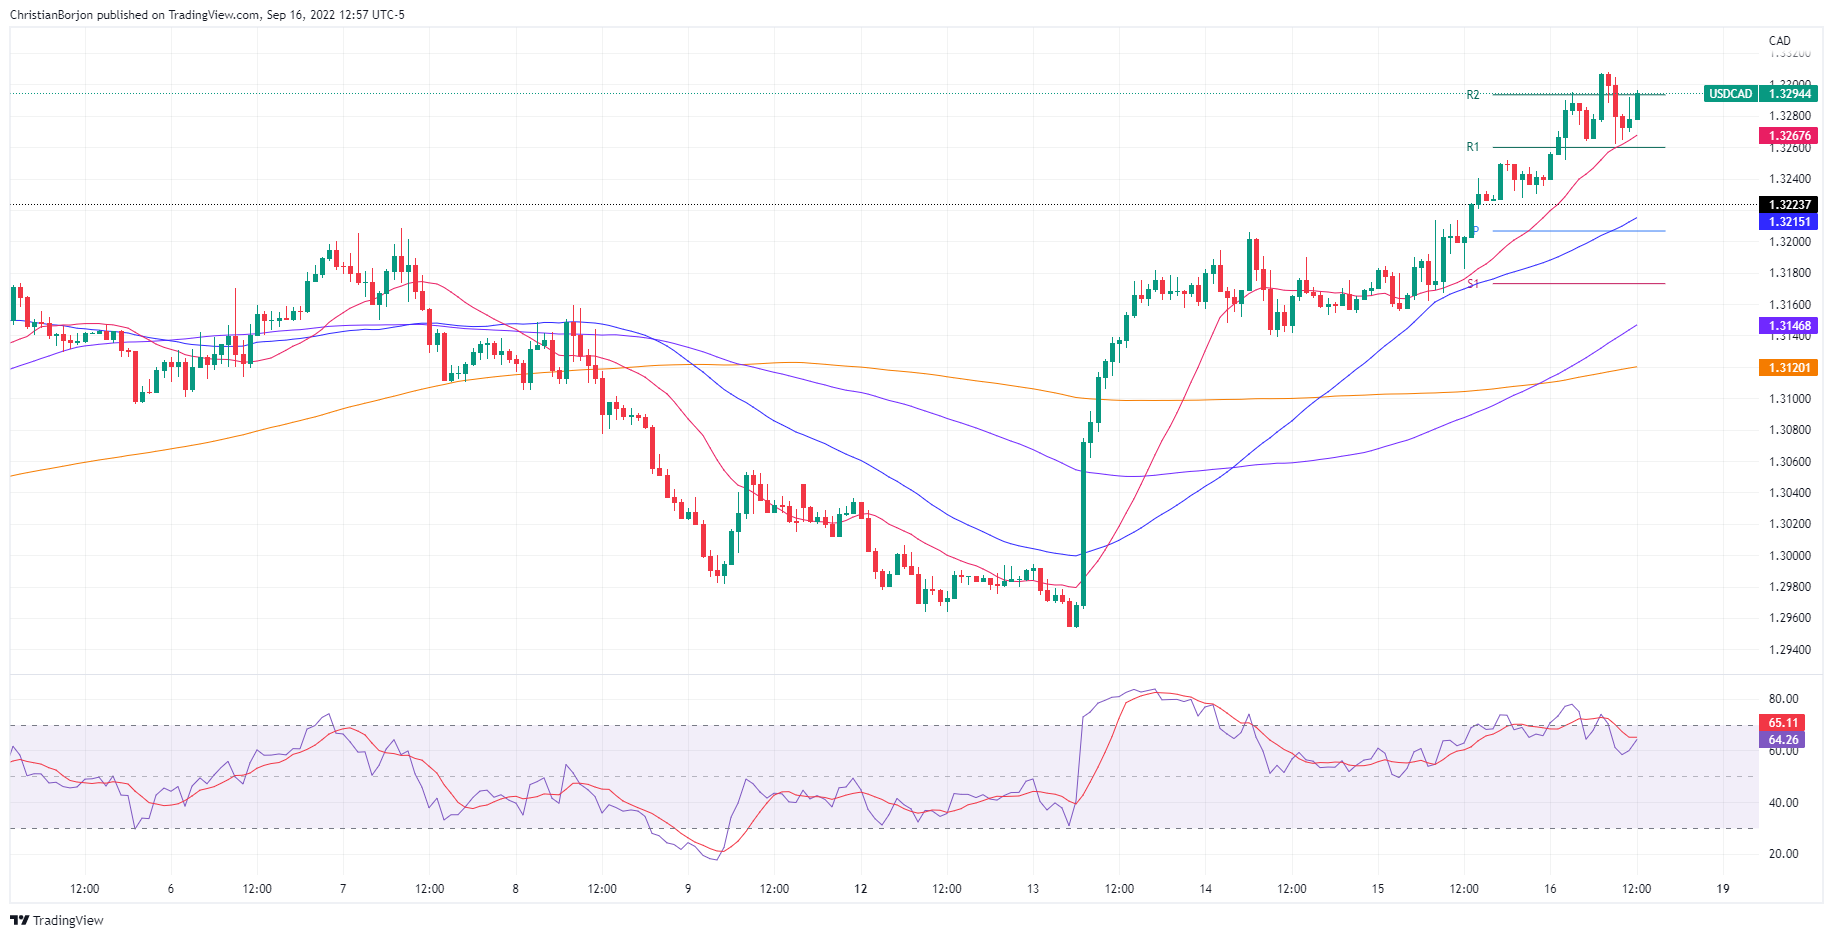
The USD/CAD rallied to a nearly two-year high at around 1.3307, a level last seen in November 2020, spurred by a risk-off impulse as investors worried about an aggressive Federal Reserve hike that could tap the US economy into a recession. At the time of writing, the USD/CAD is trading at 1.3293, above its opening price by 0.51%.
USD/CAD Price Analysis: Technical outlook
The Loonie weakened vs. a solid greenback, piercing the 1.3300 mark briefly during the North American session. Given that the USD/CAD began trending up in April of 2021, the major might continue to extend its gains. Once achieving a daily close above the 1.3300 figure, the following target would be October 29, 2020, a daily high, at around 1.3390. Once cleared, it would expose the September 2020 highs at 1.3418.
Near term, the USD/CAD is poised to the upside, even though it retreated from above the 1.3300 figure. Worth noting that the 20-EMA at 1.3267 capped the retracement; since then, the pair recovered towards the R2 daily pivot at 1.3295. A breach of the latter will re-expose the YTD high at 1.3307, which, once cleared, would open the door toward the R3 pivot point at 1.3347, ahead of the R4 daily pivot at the 1.3400 mark.
USD/CAD Key Technical Levels
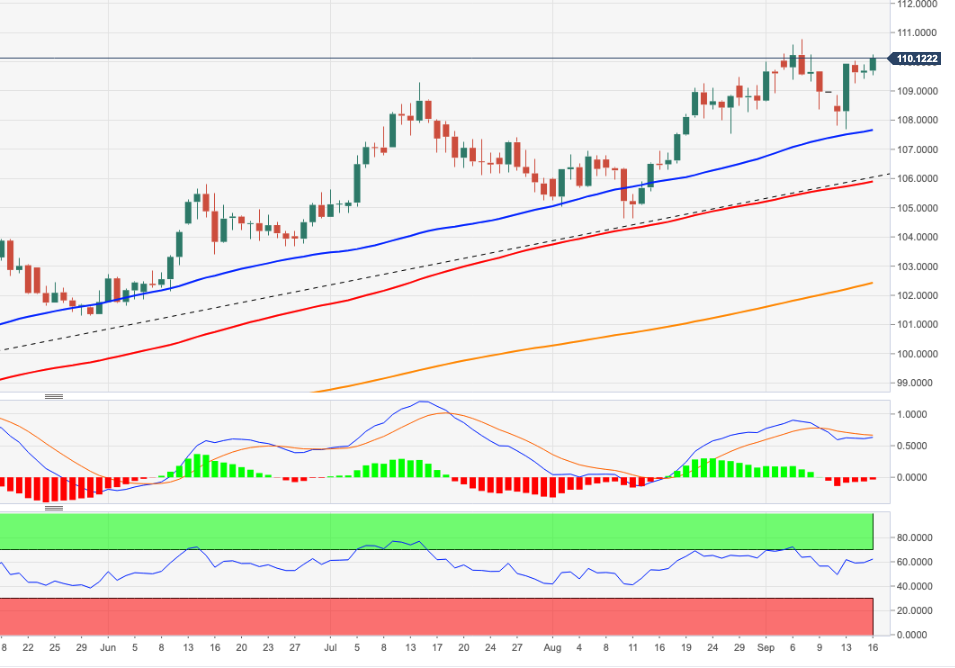
- USD/JPY is set to finish the week with gains of 0.25%.
- From a daily chart perspective, the USD/JPY is trading sideways as Japanese intervention in the FX markets looms.
- Short term, the USD/JPY is neutral-downward biased, but a break below 143.00 could pave the way toward 141.59.
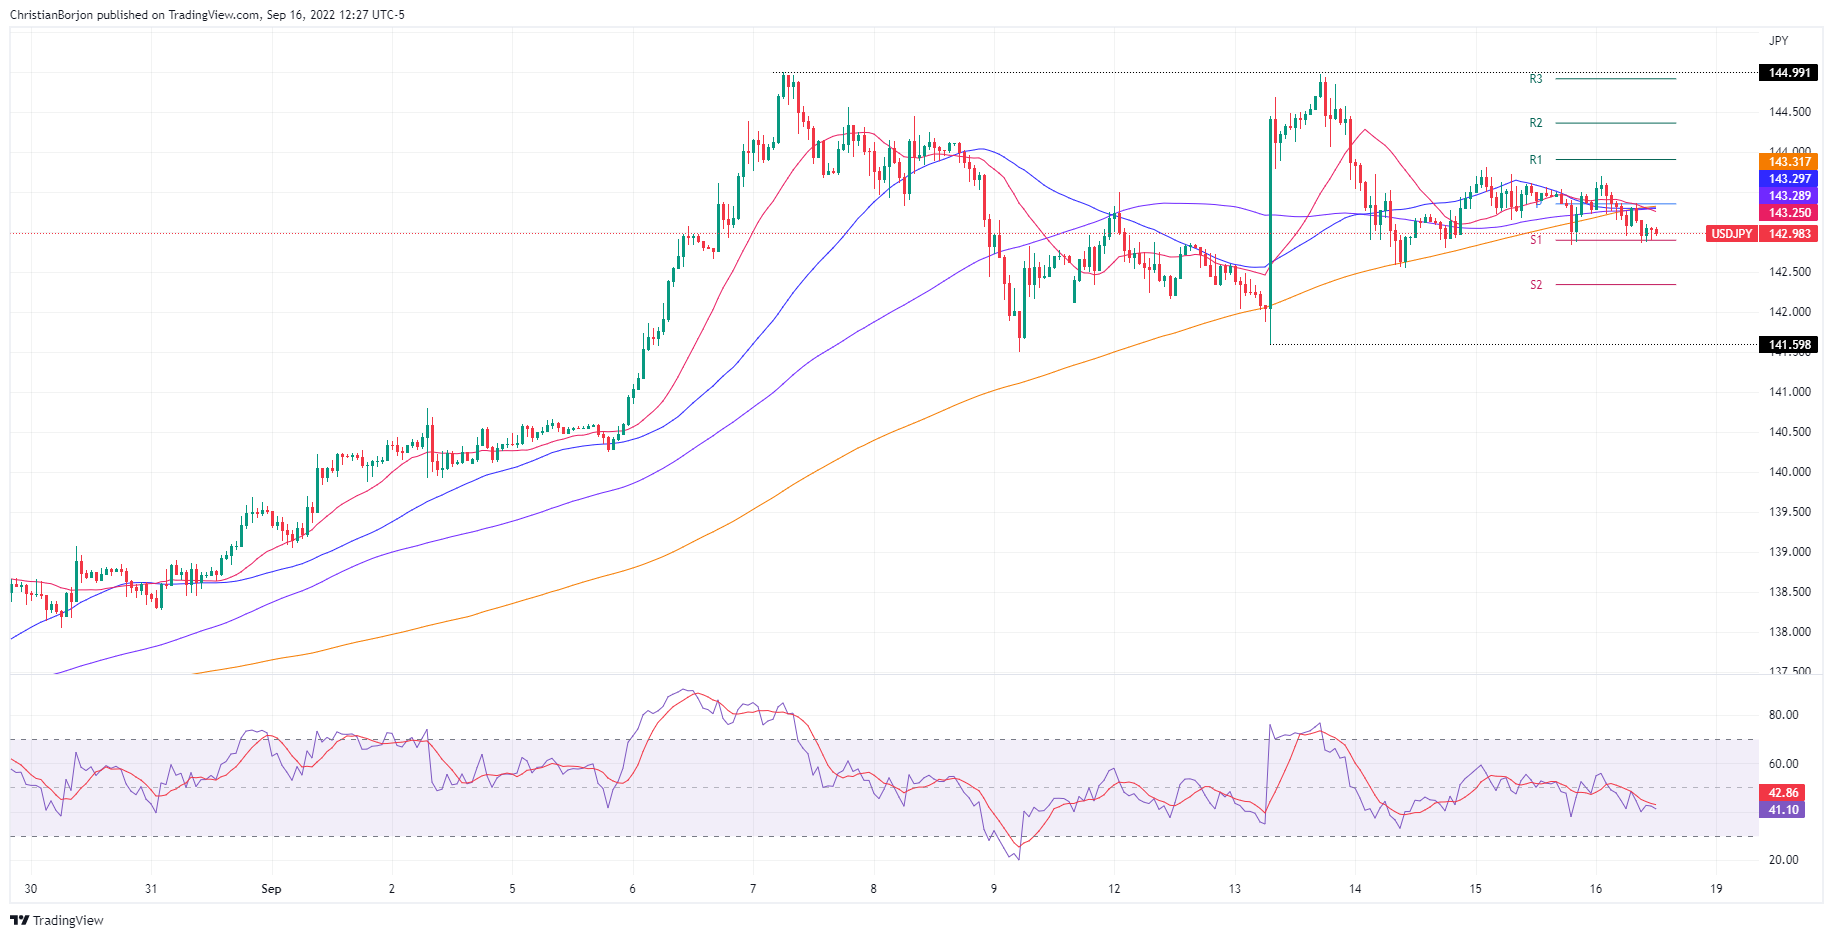
The USD/JPY slumps for the second day in the week after falling short of testing the YTD high at 144.99, but fears of Japanese intervention in the FX markets to bolster the yen kept USD buyers at bay, while the major dipped towards the 143.00 handle. The USD/JPY is trading at 142.98 after hitting a daily high at 143.69, down by 0.30%.
USD/JPY Price Analysis: Technical outlook
The USD/JPY daily chart portrays the pair consolidating in the 140.00-144.99 area for the last couple of weeks. USD/JPY price action is overextended to the upside, while the Relative Strength Index, exited from overbought conditions, crossed below its 7-day RSI’s SMA, meaning sellers begin to gather momentum. However, if USD/JPY sellers want to regain control, they need a decisive break below the 20-day EMA at 140.64.
In the near term, the USD/JPY hourly chart portrays the pair as neutral-to-downward biased. Worth noting that the major, once it fell under the 144.00 figure on September 14, stayed below the 143.50 area, trading sideways in the 143.00/50 range. Oscillators are pointing downwards in bearish territory, which suggests selling pressure is mounting in the pair.
If the USD/JPY tumbles below 143.00, the next support would be the S2 daily pivot at 142.33. Once cleared, the next demand zone would be the 142.00 psychological level, ahead of the weekly low hit on September 13 at 141.59.
USD/JPY Key Technical Levels
Analysts at MUFG Bank, point out that hard landing fears and a hawkish Swiss National Bank (SNB) favour further Swiss franc outperformance. According to them, the Swissy should continue to benefit from the SNB’s desire to dampen upside inflation risks both through faster rate hikes and tolerating a stronger currency.
Key Quotes:
“The CHF has been the top performing G10 currency so far this month as it has strengthened sharply against both the EUR (+2.2%) and USD (+1.5%). It has regained upward momentum against our equally-weighted basket of other G10 currencies after a period of consolidation at higher levels between July and August. The CHF’s renewed upward has once again coincided with an abrupt hawkish repricing of SNB rate hike expectations similar to in June.”
“Market participants are increasingly confident that the SNB will continue to play catch up with major central banks and deliver a larger 100bps hike in the week ahead (Thurs) to combat upside inflation risks. There are currently 86bps of hikes priced in. The SNB has also become more tolerant of currency strength since their last policy meeting in June as it provides another channel to help dampen upside inflation risks.”
“The CHF appears well positioned to extend its recent advance especially against other high beta G10 currencies.”
The key event next week will be the FOMC meeting. As most analysts, at Rabobank, they expect the Federal Reserve to raise the target range for the federal funds rate by 75 bps to 3.00-3.25%. They see the rate peaking at 5.00%.
Key Quotes:
“We have shifted our Fed forecasts further upward. For the September meeting, we now expect 75 bps instead of 50 bps. The risk to this forecast lies toward 100 bps rather than 50 bps. Next year, we expect the top of the target range to peak at 5.00% instead of the 4.50% that we had in our longer term forecasts earlier.”
“The main reason why we remain above consensus in our forecasts for the Fed and money market rates is that we think that a wage-price spiral has started that will keep inflation persistent. With the Fed clearly prioritizing price stability over full employment, this is going to push the FOMC higher than they currently anticipate.”
“Next year we expect the top of the target range to peak at 5.00% and we do not expect the Fed to pivot before 2024.”
- GBP/USD is set to finish the week with more than 1.50% losses, ahead of BoE’s and Fed decisions.
- The University of Michigan Consumer Sentiment improved vs. the last month’s reading, while inflation expectations slid.
- UK Retail Sales added to Britain’s recession worries amidst a change of government.
The British pound trims its earlier losses against the greenback after hitting a 37-year low around 1.1350, and recovers the 1.1400 thresholds after registering weaker-than-estimated retail sales, fueled speculations of the UK’s tapping into a recession. At the time of writing, the GBP/USD is trading at 1.1395, below its opening price, by 0.62%.
A risk-off impulse keeps most G8 currencies heavy. The greenback pared some earlier losses, as shown by the US Dollar Index, almost flat at around 109.704, yet still 0.04% down. US economic data released by the University of Michigan showed that US consumers remain slightly upbeat regarding the US economy. The Consumer Sentiment in September rose to 59.5, below estimates by a notch but better than the 58.6 achieved in August.
Joanne Hsu, director of the UoM Survey, said, “After the marked improvement in sentiment in August, consumers showed signs of uncertainty over the trajectory of the economy.” Inflation expectations in the same report for 1-year dropped to 4.6% vs. 4,8% in August.
In the meantime, US economic data released in September further cements the case for a Federal Reserve’s 75 bps rate hike in the next week. Also, sources quoted by Bloomberg commented that the US central bank might hike by a large size in November.
Elsewhere, the UK docket revealed that retail sales in August tumbled more than the estimated 0.5% contraction, falling 1.6% MoM, adding to recession fears amidst a tightening cycle by the Bank of England.
In the meantime, UK’s Prime Minister Liz Truss announced last week an energy bill that will put a lid on energy prices for two years, which would likely cost about 100 billion pounds.
What to watch
The UK economic docket will feature the Bank of England’s monetary policy decision next week. Money market futures expect a 50 bps hike, but pressures are mounting that the central bank could go 75 bps. The Federal Reserve is expected to raise rates by 75 bps on the US front, with minimal chances of going a full percentage point.
GBP/USD Key Technical Levels
The University of Michigan Consumer sentiment report (September - preliminary) showed a modest decline in inflation expectations and a recovery in the main index. According to analysts at Wells Fargo, the most remarkable aspect of the latest sentiment survey is that inflation expectations remain so well-anchored. They point out that after this week's CPI surprise, Federal Reserve officials might be breathing a little easier.
Key Quotes:
“Coming after the upward surprise from August consumer inflation earlier this week, it's remarkable that inflation expectations remain so well-anchored. Consumer's expectations for inflation over the next year dropped to 4.6% from 4.8% in August, marking the lowest reading in twelve months. Longer-term expectations over the next 5-10 year horizon also inched down, now at a 14-month low of 2.8%. These readings are consistent with other measures of inflation expectations, like that from the Fed's Survey of Consumer Expectations, and they suggest to at least some extent consumers are unfazed by the persistently-high level of inflation today.”
“The Fed will be glad to see that medium- to longer-term expectations remain well within the past decades range, or what it refers to as expectations being "unmoored." As long as expectations remain low, it is one thing to stay the hand of faster rate hikes from the Fed.”
“The FOMC is thus likely to make note of expectations at next week's meeting as one positive development in an otherwise stubborn inflation environment and grim economic backdrop.”
- A pullback of the US dollar boosts gold toward $1680.
- Reversal offers hope for XAU/USD bulls.
- Dollar still remains firm ahead of the FOMC meeting.
After the University of Michigan's report showed a decline in inflation expectations, the dollar and US yields pulled back triggering a rebound in gold that recovered from multi-month lows toward $1680.
XAU/USD broke above $1670 and climbed to $1680, hitting a fresh daily high. It is still holding an important weekly loss and the lowest close since April 2020 but the rebound could favor a short-term reversal. Gold faces a strong resistance area between $1680 and $1695.
The main trend is bearish and currently gold is hovering around $1673, where the 200-week Simple Moving Average stands.
The sharp rebound in gold took place after the September preliminary University of Michigan’s Consumer Sentiment report showed a decline in medium and long-term inflation expectations. The main index recovered from 58.2 in August to 59.2 in September, below the market consensus of 60.
The report triggered a decline in Treasuries and also weight on the greenback that turned negative. The DXY fell to 109.50 down from 110.25. The 2-year yield pulled back from the highest since 2007 at 3.92% to 3.88% and the 10-year from 3.49% to as low as 3.42%.
Gold benefit a staged a sharp rebound. Also silver turned positive with XAG/USD rising toward $19.50. Silver is headed toward a modest weekly gain.
The FOMC meeting next week is critical for gold prices. The central bank is expected to raise rates by 75 basis points and to keep a hawkish tone with inflation as the main concern; all factors that have been supporting the dollar and keeping metals under pressure.
Technical levels
Analysts at Rabobank continue to expect US dollar strength will persist into next year. They see the GBP/USD pair moving to 1.08 on a six-month perspective.
Key Quotes:
“Soft UK retail sales data provide evidence of demand erosion. Additionally, investors are wary about the outlook for public finances. The sensitivity of GBP to UK poor fundamentals is heightened by a huge current account deficit.”
“While the outlook for BoE rates is an important driver for the pound, it has been very clear that higher interest rates are no guarantee of currency strength if the fundamental backdrop is poor. Higher rates from the BoE may lend some support to the pound but sound public finances and policies that offer reassurances in the outlook for international trade, and productivity growth will be needed to repair the outlook for GBP. Against the backdrop of USD strength, we expect further downside pressure on cable towards 1.08 and look for EUR/GBP to tick higher to 0.88 in the months ahead.”
- US dollar reverses late on Friday and turns negative.
- US yields off highs following the Consumer Sentiment report.
- EUR/USD is about to end the week with minor changes.
The EUR/USD rose from 0.9970 and climbed to 1.0035, hitting the highest level since Tuesday amid a reversal of the US dollar across the board following University of Michigan’s Consumer Sentiment report.
On European hours, the EUR/USD hit the lowest level in a week under 0.9950 and a few hours later printed a multi-day high driver by a weaker dollar, affected after UoM Consumer Sentiment. The main index rose to 59.2, below the 60 of market consensus. The key numbers were inflation expectations that dropped across the curve.
The key event ahead is the FOMC decision on Wednesday. A 75 basis points rate hike is expected. The decision, the dot plot and the tone of the Fed will likely determine the next direction of the EUR/USD.
“Narrative shattered – US inflation is unrelenting, throwing the "Fed pivot" story up in the air and boosting the dollar. Europe's efforts to mitigate the energy crisis were insufficient to withstand the greenback's strength. All eyes are now on the world's most important central bank, with everything else playing second fiddle”, said Yohay Elay, analyst at FXStreet.
EUR/USD weekly chart
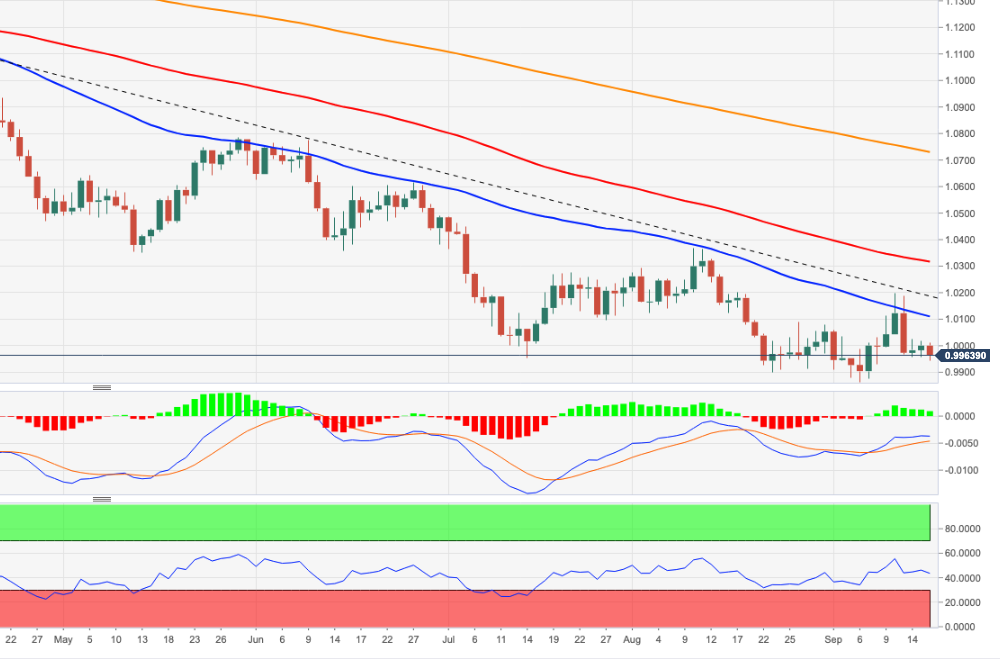
The EUR/USD is about to end the week flat. The trend in the pair is clearly bearish but some so far it had been able to remain above 0.9850/0.9900. If the euro manages to post a close above 1.0070 it could alleviate the negative pressure. The following level is the 1.0300 area that contains the 20-week moving average. On the flip side, support is located at 0.9910 followed by 0.9860 and 0.9730.
-637989381686688192.png)
Technical levels
- The Australian dollar trimmed some of the weekly losses, though it is set to lose almost 2%.
- US Consumer Sentiment continued improving in September, while inflation expectations easied.
- RBA's Lowe: Opened the door for discussing 25 or 50 bps rate hike in the next meeting.
- AUD/USD Price Analysis: A double-bottom surfaced in the daily chart, and risks are skewed to the downside.
The AUD/USD pares some of its earlier losses but refreshed the year-to-date (YTD) low at 0.6670, accumulating weekly losses of more than 2%, spurred by investors positioning ahead of further Fed aggressive tightening, underpinning the greenback.
The Australian dollar began the last trading day of the week, trading around 0.6700 but slipped to new YTD lows, below the S1 daily pivot, before recovering some ground after US economic data showed that inflation expectations dipped, a sign of relief for investors. Therefore, the AUD/USD is trading at 0.6704, above its opening price by 0.04%.
AUD/USD recovered some ground, but RBA's dovish commentary could keep the pair on the defensive
Of late, the University of Michigan (UoM) Consumer sentiment survey in September slightly improved but missed estimations of 60.0. The Consumer Sentiment rose by 59.5 vs. 58.6 in the prior month, while inflation expectations in a 1-year horizon slumped to 4.6% from 4.8% in August.
Even though inflation expectations are lower, market participants have fully priced in a Fed’s 75 bps rate hike in the September meeting. Sources cited by Bloomberg said, “Everything points to another 75 basis-point rate hike by the Fed when it meets next week. The likelihood that it will have to go ‘big’ again in November is elevated, too.”
In the meantime, the US Dollar Index, a measure of the buck’s value, edges lower by 0.21%, down at 109.511, undermined by US Treasury bond yields, taking a respite, with the 10-year benchmark note rate at 3.432%, below the highest level reached around 3.49%.
Aside from this, on the Australian side, the Reserve Bank of Australia (RBA) Governor Philip Lowe said that the bank is committed to returning inflation to the 2-3% bank target over time but trying to achieve it, without damaging the economy. Furthermore, Lowe added that at some point, the RBA would hike in 25 bps increments, adding that they’re getting closer to that point, even opening the door for discussions of 25 or 50 bps in the next meeting.
AUD/USD Price Analysis: Technical outlook
The AUD/USD daily chart depicts the pair as downward biased. It’s worth noting that a double bottom pattern formed, and if buyers keep the exchange rate above 0.6700, it could pave the way for higher prices. If that scenario plays out, the AUD/USD first resistance would be 0.6800, followed by the 20-day EMA at 0.6820 and the 50-day EMA at 0.6885. On the other hand, the AUD/USD’s first support would be the 0.6670 YTD low, followed by May 20, 2020, daily low at 0.6506.
Gold is trading well below the $1,700 mark. For the Fed’s meeting next week, an increase of 75 basis points is already fully priced in. Strategists at Commerzbank analyze how the yellow metal could react to such a move.
Recovery potential in the medium-term
“If the Fed raises its interest rates by more than 75 bps, the gold price risks sliding further. However, this will depend not only on how quickly the Fed hikes its rates in the short-term but on how probable it is that it will stick with high interest rates.”
“If the market is prompted by the meeting to price in higher rates in the short-term but anticipates stronger rate cuts due to recession fears next year, the gold price is likely to suffer less.”
“We still envisage recovery potential in the medium-term because we expect that the Fed will lower its interest rates slightly again next year in response to a contracting economy.”
- Consumer confidence in the US improved modestly in September.
- UoM's long-run inflation outlook edged lower to 2.8% from 2.9%.
Consumer sentiment in the US improved slightly in early September with the University of Michigan's (UoM) Consumer Confidence Index edging higher to 59.5 (flash) from 58.2 in August. This print came in below the market expectation of 60.
The Current Conditions Index edged higher to 58.9 from 58.6 and the Expectations Index rose to 59.9 from 58.
The long-run inflation expectation ticked up to 3% from 2.9% while the 1-year inflation outlook fell to 5% from 5.2%.
The report further revealed that the one-year inflation expectation declined to 4.6% and the five-year inflation expectation edged lower to 2.8% from 2.9%.
Market reaction
The US Dollar Index retreated from daily tops after this report and was last seen trading at 109.95, where it was still up 0.2% on a daily basis.
GBP/USD trades below 1.14 for the first time since 1985. Economists at Scotiabank highlight that the pair could sustain a substantial drop to the early 1985 low at 1.0520.
Minor rallies unlikely to be sustained
“The outlook for the GBP is bleak from a technical point of view – there are no obvious supports for the GBP below the market until the early 1985 low at 1.0520.”
“Trend signals are aligned bearishly for the GBP, suggesting little or no scope for counter trend corrections.”
“Minor rallies are unlikely to be sustained. Look for gains to remain capped in the low/mid 1.14s in the near-term.”
See – GBP/USD: Charts point to a test of the all-time low at 1.0520 – BBH
EUR/USD slid back to the mid-0.99s area. A break below here would clear the way for a fall towards 0.9885/95, economists at Scotiabank report.
Broader outlook remains tilted to the downside
“The EUR is still struggling to advance and, after the early week failure/rejection at key trend resistance around the 1.02 mark, the broader outlook remains tilted to the downside.”
“Intraday gains will remain capped around the 1.0010/15 point.”
“Loss of support at 0.9950/60 targets a drop to 0.9885/95.”
- Gold remains under intense selling pressure for the fourth successive day on Friday.
- Aggressive Fed rate hike bets boost the USD and drive flows away from the metal.
- The risk-off impulse offers some support to the XAU/USD amid oversold conditions.
Gold continues losing ground for the fourth successive day on Friday and drops to its lowest level since April 2020. The selling pressure now seems to have abated, at least for the time being, allowing the XAU/USD to hold above the $1,650 level.
The US dollar catches fresh bids on the last day of the week amid expectations of a hefty rate hike by the Fed and turns out to be a key factor exerting downward pressure on the dollar-denominated gold. In fact, the markets started pricing in the possibility of a full 100 bps rate increase at the upcoming FOMC meeting on September 20-21 following the release of the stronger US CPI earlier this week.
Moreover, market players also expect the US central bank to deliver another supersized 75 bps rate hike in November. This remains supportive of elevated US Treasury bond yields, which offer additional support to the greenback and further contribute to driving flows away from the non-yielding yellow metal. That said, the risk-off impulse helps limit losses for the safe-haven gold, at least for now.
The market sentiment remains fragile amid worries that the rapid rise in borrowing costs will lead to a deeper global economic downturn. This, along with the economic headwinds stemming from fresh COVID-19 lockdowns in China and the protracted Russia-Ukraine war, has been fueling recession fears. This, in turn, tempers investors' appetite for riskier assets and triggers a sell-off in the equity markets.
Apart from this, extremely oversold conditions on the 4-hour chart hold back bearish traders from placing fresh bets around gold. Investors might also prefer to move to the sidelines ahead of next week's key central bank event risks. The Fed is scheduled to announce its decision on Wednesday, which will be followed by the Bank of Japan, Swiss National Bank and the Bank of England meetings on Thursday.
Nevertheless, the fundamental backdrop remains tilted firmly in favour of bearish traders and suggests that the path of least resistance for gold is to the downside. Hence, any meaningful recovery attempt might still be seen as a selling opportunity and runs the risk of fizzling out rather quickly.
Technical levels to watch
A stronger dollar and rates continue to weigh on the precious metal complex. Strategists at TD Securities believe that there is more room on the downside.
Aggressive Fed to hike rates by 200 bps before year-end
“The persistence of inflation continues to support an aggressive effort by the Fed, and we now expect the FOMC to raise the target rate by 75 bps at its meeting next week, deliver another 75 bps hike in November, and hike a further 50 bps in December. In this context, while prices are certainly weak, precious metals' price action could still have further to fall as the restrictive rates regime is set to last for longer.”
“Gold and silver prices have tended to display a systematic underperformance when markets expect the real level of the Fed funds rate to rise above the neutral rate, as estimated by Laubach-Williams.”
- EUR/USD comes under heavy pressure and drops near 0.9940.
- The loss of 0.9900 could accelerates losses to the YD low at 0.9863.
EUR/USD reverses two consecutive daily gains and drops well south of the parity level on Friday.
The sudden slump in the pair now leaves the door open to extra weakness in the short-term horizon. Against that, a convincing breakdown of the 0.9900 level carries the potential to revisit the 20-year low at 0.9863 (September 6).
In the longer run, the pair’s bearish view is expected to prevail as long as it trades below the 200-day SMA at 1.0728.
EUR/USD daily chart
Enrico Tanuwidjaja, Economist at UOB Group, assesses the recently published trade balance figures in Indonesia.
Key Takeaways
“Indonesia’s trade surplus widened again to USD5.8bn in Aug from USD 4.2bn in Jul, an increase of more than USD1.5bn and much higher than market expectations of USD 4.0bn.”
“Exports grew 30.1% y/y, beating market expectations of 20% by a wide margin to achieve almost USD 28bn, driven significantly by non-oil & gas exports that reached more than USD26bn. Import’s growth remained elevated at 32.8% y/y though slowing from 41.2% in Jul. However, imports growth rose faster than consensus estimates of 31.6%, reaching USD 22.2bn.”
“Given the momentum so far, we expect the overall trade surplus to surpass 2021’s record of more than USD35.4bn, amidst consistently stronger exports growth on the back of still-elevated global commodity prices.”
- DXY clinches new multi-day highs past the 110.00 barrier.
- Further advance could see the YTD top revisited near term.
DXY adds to Thursday’s gains and keeps the trade in the upper end of the weekly range near the 110.00 neighbourhood.
Further short-term gains look likely in the index while above the 7-month support line near 106.40. That said, the surpass of the weekly high at 110.26 (September 16) should put the index en route to a probable visit to the YTD top at 110.78 (September 7).
In the longer run, DXY is expected to maintain its constructive stance while above the 200-day SMA at 101.67.
DXY daily chart
After dipping below $90, the price of a barrel of Brent has recovered to $95 again. If neither the Fed nor China’s government resort to unexpectedly tough measures, the oil market is set to take a breather, strategists at Commerzbank report.
Oil price to remain at $95 in the short-term
“The price is likely to remain at $95 in the short-term, which will presumably deter OPEC+ from cutting production.”
“Lower prices can probably only be expected if the Fed hikes interest rates even more sharply or renewed anti-covid measures are put in place in China, which would cool demand in one of the two key markets.”
Citing sources familiar with the matter, Reuters reported on Friday that Saudi Arabia and Russia see $100 a barrel as a fair price for oil that the global economy can absorb.
"Our focus is straightforward - looking at supplies and demand balances over a period of no less than a year and most often a year and a half," one of the sources told Reuters. "There are too many variables outside of human control, case in point COVID in 2020 and the financial crisis of 2008, so we need to be humble."
Market reaction
Crude oil prices showed no immediate reaction to this headline and the barrel of West Texas Intermediate was last seen trading little changed on the day at $85.
- USD/JPY comes under some selling pressure on Friday, though lacks follow-through.
- The risk-off mood, chances of BoJ intervention offer support to the safe-haven JPY.
- Resurgent USD demand helps limit the downside amid the Fed-BoJ policy divergence.
The USD/JPY pair struggles to capitalize on its modest intraday bounce and met with a fresh supply near the 143.70 region on Friday. The pair remains on the defensive through the early North American session and is currently placed near the lower end of its daily trading range, just a few pips above the 143.00 mark.
A fresh wave of the global risk-aversion trade - as depicted by a sell-off around the equity markets - drives some haven flows towards the Japanese yen and exerts some downward pressure on the USD/JPY pair. Despite the upbeat Chinese macro data released earlier this Friday, investors remain concerned about headwinds stemming from fresh COVID-19 restrictions in the world's second-largest economy. Apart from this, the prospects for a more aggressive policy tightening by major central banks and the protracted Russia-Ukraine war has been fueling recession fears. Growing worries about a deeper economic downturn temper investors' appetite for riskier assets and benefit traditional safe-haven currencies.
Furthermore, speculations that the Bank of Japan may soon step in to arrest any further freefall in the JPY further contributes to the offered tone surrounding the USD/JPY pair. The downside, however, remains cushioned amid resurgent US dollar demand, bolstered by hawkish Fed expectations. Investors seem convinced that the Fed will tighten its monetary policy at a faster pace to tame inflation and have been pricing in the possibility of a full 100 bps rate hike at the September meeting. This marks a big divergence in comparison to a more dovish stance adopted by the Japanese central bank and supports prospects for the emergence of some dip-buying at lower levels, warranting caution for bearish traders.
Next on tap will be the release of the Preliminary Michigan US Consumer Sentiment Index for September. This, along with the US bond yields, will drive the USD demand. Apart from this, the broader market risk sentiment should produce short-term trading opportunities around the USD/JPY pair. Traders, however, might refrain from placing aggressive bets and prefer to move to the sidelines ahead of next week's key central bank event risks. The Fed is scheduled to announce its policy decision and will be followed by the BoJ meeting on Thursday. This will play a key role in determining the next leg of a directional move for the USD/JPY pair.
Technical levels to watch
Sterling is underperforming after weak retail sales data and traded near 1.1350, the lowest since 1985. Economists at BBH note that the GBP/USD pair could plummet to the all-time low at 1.0520.
Sterling pounded on anniversary of Black Wednesday
“Headline sales fell -1.6% MoM vs. -0.5% expected and a revised 0.4% (was 0.3%) in July, while sales ex-auto fuel also fell -1.6% MoM vs. 0.4% in July. As a result, the YoY rates fell to -5.4% and -5.0%, respectively. The data confirm what we all know already, and that is the economy is sliding into recession. How long and how deep this downturn will remain a great source of debate.”
“We would be remiss if we did not mention that today is the anniversary of Black Wednesday. Thirty years ago, sterling was unceremoniously ejected from the Exchange Rate Mechanism. Cable is marking the occasion by trading at its weakest level since 1985 near 1.1350. There is literally nothing in the charts until the February 1985 all-time low near 1.0520.”
Gold price has fallen steadily since March as central banks indicate tighter monetary policies for the rest of the year. Subsequently, economists at ANZ Bank have downgraded their XAU/USD short-term forecast to $1,600.
Haven demand remains subdued
“We now think USD strength will last longer than we had thought. Labour resilience means the Fed will have to hike further than the market is expecting. Deteriorating liquidity conditions and higher US yields will feed haven flows and add risk premium.”
“Europe faces a serious energy crisis, which is a headwind for EUR and support for the USD. This makes us thinks the USD will peak in Q1 2023. In the face of sustained dollar strength, we see gold continuing to underperform.”
“Rising geopolitical and economic risks are doing little to entice safe-haven buying, with the USD still asset of choice. Nevertheless, the risk of either stagflation or outright recession could ultimately turn this around. Gold has traditionally outperformed in such environments.”
“We see further downside in the short-term. We have cut our short-term (0-3mth) target to $1,600.”
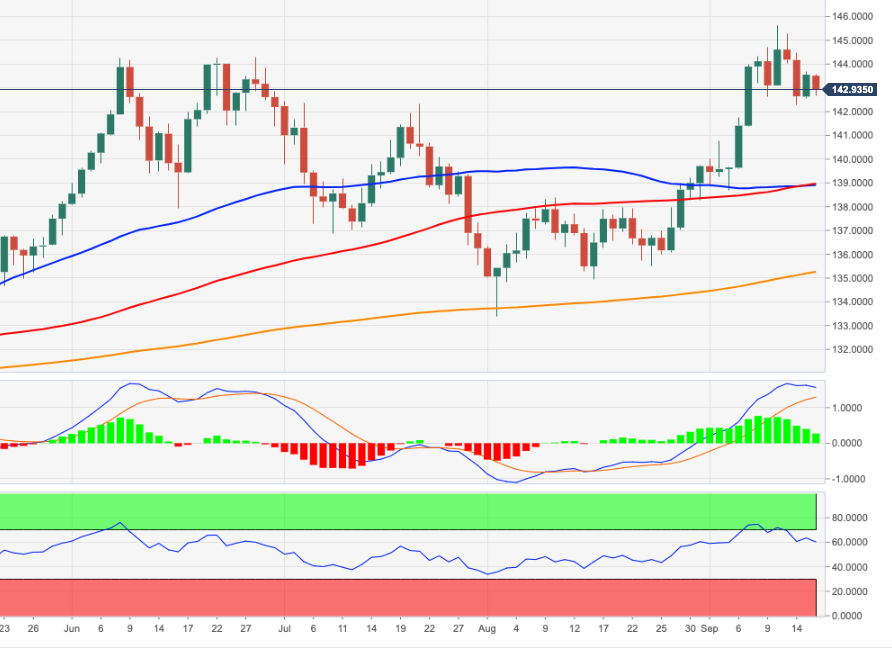
- EUR/JPY fades Thursday’s uptick and keeps the familiar range.
- The cross seems to have moved into a consolidative phase near term.
EUR/JPY trades within the familiar range and leaves behind Thursday’s uptick to the 143.70 region.
The cross keeps the erratic performance so far this week and extends the corrective downside considering the bearish divergence in the daily RSI seen in past sessions. That said, while further decline should not be ruled out, the cross could likely attempt some consolidation ahead of the probable continuation of the uptrend.
In the meantime, while above the 200-day SMA at 135.23, the prospects for the pair should remain constructive.
EUR/JPY daily chart
- GBP/JPY remains under heavy selling pressure for the fourth successive day on Friday.
- The dismal UK Retail Sales fuel recession fears and weigh heavily on the British pound.
- The risk-off Impulse benefits the safe-haven JPY and also contributes to the selling bias.
The GBP/JPY cross extends this week's sharp downfall from levels just above mid-167.00s, or the highest since June 22 and continues losing ground for the third straight day on Friday. The downward trajectory drags spot prices to a nearly two-week low during the first half of the European session, though bulls show some resilience below the 163.00 mark.
The British pound's relative underframe comes amid the worsening outlook for the UK economy, further fueled by Friday's disappointing macro data. The UK Office for National Statistics reported that monthly Retail Sales recorded the biggest fall since December 2021 and fell much more than expected in August. This, in turn, adds to fears about an imminent recession, which weighs heavily on sterling and exerts downward pressure on the GBP/JPY cross.
Apart from this, the risk-off impulse drives some haven flows towards the Japanese yen and aggravates the bearish pressure surrounding the cross. The rapidly rising interest rates, along with headwinds stemming from fresh COVID-19 curbs in China and the protracted Russia-Ukraine war, have been fueling concerns about a deeper global economic downturn. This tempers investors' appetite for riskier assets, which is evident from a fresh leg down in the equity markets.
The ongoing downfall, meanwhile, seems rather unaffected by a big divergence in the monetary policy stance adopted by the Bank of Japan and other major central banks. In fact, the BoJ lags behind other major central banks in the process of policy normalisation and remains committed to continuing with its monetary easing. This has been a key factor behind the recent slump in the JPY witnessed since the early part of this year, though fails to lend support to the GBP/JPY cross.
It will now be interesting to see if bearish traders can maintain their dominant position as the focus now shifts to next week's key central bank event risks. Both the BoJ and the Bank of England are scheduled to announce their respective policy decision on Thursday. The outcome will play a key role in influencing the GBP/JPY cross and help determine the next leg of a directional move.
Technical levels to watch
UOB Group’s Economist Lee Sue Ann comments on the latest release of the Australian labour market report.
Key Takeaways
“Australia’s seasonally adjusted unemployment rate rose to 3.5% in Aug, up from 3.4% in Jul, and back to the same rate as in Jun. Seasonally adjusted employment increased by 33,000 people (0.2%) in Aug, lower than expectations for a gain of 35,000, but rebounding significantly from the fall of 40,900 in Jul.”
“Overall, the Australian labour market remains solid, although slowing growth will likely push the jobless rate higher back towards the 3.8%-4.0% levels. Wage growth is also expected to pick up to over 3% by 2023.”
“The next RBA meeting is on 4 Oct. We now pencil in 25bps hikes for the remaining three meetings in 2022. That will take the OCR to 3.10% by year-end. We then look for a pause thereafter.”
- Silver drifts lower for the second straight day and drops to a fresh weekly low.
- Break below 50 DMA and the $19.00 mark supports prospects for further losses.
- A breakout through a descending trend-line is needed to negate the negative bias.
Silver remains under some selling pressure for the second straight day on Friday and drops to a fresh weekly low during the first half of the European session. The white metal is currently trading just below the $19.00 mark, down over 1% for the day.
Looking at the broader picture, the recent recovery from over a two-year low, the $17.55 area faltered near a descending trend-line resistance earlier this week. A subsequent slide below the 50-day SMA and the $19.00 round figure suggests that the corrective bounce might have already run out of steam. Moreover, technical indicators on the daily chart, so far, have been struggling to gain any meaningful traction and are placed in negative territory. This further adds credence to the near-term bearish outlook and supports prospects for some meaningful near-term depreciating move for the XAG/USD.
From current levels, the $18.45-$18.40 region could act as strong immediate support. A convincing break below will make the XAG/USD vulnerable to accelerating the fall towards the $18.00 mark. Bears might eventually aim to challenge the YTD low, around the $17.55 area touched earlier this month.
On the flip side, momentum back above the $19.00 mark now seems to confront resistance near the $19.25 region (50 DMA). Sustained strength beyond might trigger a short-covering rally and has the potential to lift the XAG/USD towards the next relevant hurdle, around the $19.65-$19.75 supply zone. The latter now coincides with a descending trend-line barrier extending from May monthly swing high. This is closely followed by the $20.00 psychological mark, which if cleared decisively will be seen as a fresh trigger for bullish traders and pave the way for some meaningful appreciating move.
Silver daily chart
-637989188549268570.png)
Key levels to watch
Economist at UOB Group Lee Sue Ann reviews the latest GDP figures in New Zealand.
Key Takeaways
“GDP rose by 1.7% q/q in 2Q22, in contrast to the 0.2% q/q fall in 1Q22, and higher than expectations for a print of +1.0% q/q. Compared to the same period one year ago, GDP rose by 0.4% y/y, following a revised 1.0% y/y print in 1Q22 (1.2% y/y previously), and also more than expectations of 0.0% y/y.”
“Data is still very volatile and is likely to stay that way for the next couple of months, with offsetting effects due to the normalisation and recovery from lingering COVID-19 disruptions against softer domestic demand from higher interest rates. This will set the scene for slower growth towards the end of the year and into 2023. We have thus lowered our GDP forecast for growth in 2022 to 1.8% from 2.4% previously and to 1.8% for 2023, from 3.0% previously.”
“Still, this is unlikely to deter the Reserve Bank of New Zealand (RBNZ) from further increasing borrowing costs to tackle inflation. The next RBNZ meeting is on 5 Oct, where we are pencilling in a 50bps hike in the OCR from 3.00% to 3.50%.”
European Central Bank (ECB) policymaker Francois Villeroy de Galhau said on Friday that “we are attentive about the exchange rate.”
Nothing further is reported so far.
Related reads
- Lagarde speech: Hikes should send signal that we'll meet price goal
- Bears regain control and drag EUR/USD to the 0.9940 region
- USD/CAD gains strong follow-through traction on Friday and climbs to a 22-month high.
- Bearish oil prices undermine the loonie and offer support amid resurgent USD demand.
- The fundamental, technical backdrop supports prospects for a further appreciating move.
The USD/CAD pair prolongs this week's strong rally from the vicinity of mid-1.2900s and gains strong follow-through traction on Friday. The momentum lifts spot prices to the highest level since November 2020, with bulls now eyeing to reclaim the 1.3300 round-figure mark.
Crude oil prices languish near the weekly low and undermine the commodity-linked loonie, which, in turn, acts as a tailwind for the USD/CAD pair. Apart from this, the emergence of fresh buying around the US dollar provides an additional lift to the major and contributes to the bullish momentum.
Investors remain concerned that a deeper global economic downturn and fresh COVID-19 lockdowns in China will dent fuel demand. This, to a larger extent, overshadows worries about tight global supply and weighs on the black liquid, which remains on track to register a third successive week of losses.
The USD, on the other hand, is looking to build on the stronger US CPI-inspired rally amid rising bets for a more aggressive policy tightening by the Fed. This, along with the risk-off impulse, drives some haven flows towards the greenback and offers additional support to the USD/CAD pair.
Friday's strong momentum could also be attributed to some technical buying following the overnight sustained strength and close above the 1.3200 round-figure mark. A subsequent move beyond the previous YTD peak could be seen as a fresh trigger and might have set the stage for further gains.
Market participants now look forward to the Preliminary Michigan Consumer Sentiment Index from the US, due later during the early North American session. This, along with the US bond yields and the broader risk sentiment, will influence the USD and provide a fresh impetus to the USD/CAD pair.
Technical levels to watch
- EUR/USD loses the grip further and revisits the 0.9950/45 area.
- The dollar remains bid and pushes DXY above the 110.00 mark.
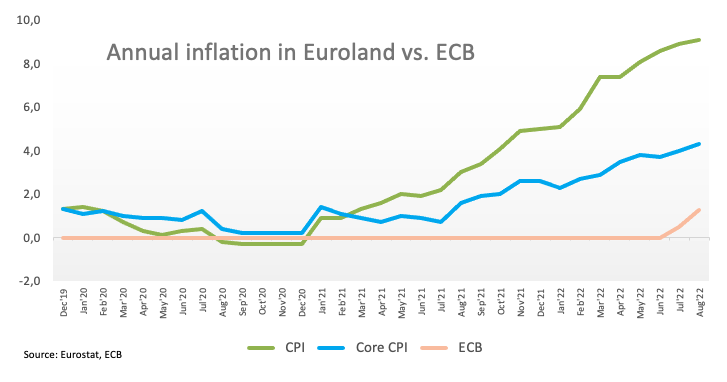
- EMU Final inflation Rate came at 9.1% YoY in August.
The upside bias in the greenback drags EUR/USD to new multi-session lows in the vicinity of 0.9940 at the end of the week.
EUR/USD offered on USD-gains
EUR/USD comes under renewed and quite strong downside pressure following two consecutive daily advances, breaking below the parity level with some conviction and reaching new multi-day lows in the 0.9945/40 band.
Indeed, the unabated strength in the greenback lifts the US Dollar Index 9DXY) back above the 110.00 mark in a context dominated by the rally in US yields and the investors’ adjustment to the tighter-for-longer stance from the Fed.
On the opposite side of the road, ECB’s De Guindos suggested that more rate hikes are in store, while his colleague O.Rehn noted that recession risks in the euro area remain on the rise.
In the domestic calendar, final Inflation Rate in the euro area came at 9.1% in the year to August, in line with the preliminary prints. On a monthly basis, the CPI rose 0.6% and 4.3% YoY when it comes to the Core CPI.
Across the Atlantic, the advanced U-Mich Consumer Sentiment for the month of September will take centre stage later in the NA session.
What to look for around EUR
EUR/USD breaches the parity zone and drops to multi-day lows near 0.9950 following increasing upside momentum in the US dollar.
So far, price action around the European currency is expected to closely follow dollar dynamics, geopolitical concerns, fragmentation worries and the Fed-ECB divergence.
On the negatives for the single currency emerge the so far increasing speculation of a potential recession in the region, which looks propped up by dwindling sentiment gauges as well as an incipient slowdown in some fundamentals.
Key events in the euro area this week: Italy, EMU Final Inflation rate (Friday).
Eminent issues on the back boiler: Continuation of the ECB hiking cycle. Italian elections in late September. Fragmentation risks amidst the ECB’s normalization of its monetary conditions. Impact of the war in Ukraine and the persistent energy crunch on the region’s growth prospects and inflation outlook.
EUR/USD levels to watch
So far, the pair is losing 0.43% at 0.9953 and the breakdown of 0.9944 (weekly low September 16) would target 0.9863 (2022 low September 6) en route to 0.9859 (December 2002 low). On the other hand, the initial barrier emerges at 1.0197 (monthly high September 12) followed by 1.0202 (August 17 high) and then 1.0314 (100-day SMA).
European Central Bank (ECB) President Christine Lagarde said in her appearance on Friday that “hikes should send a signal that we'll meet price goal.”
Additional comments
“We are facing a supply shock but also strong elements on the demand side.”
“We have to react according to the complicated situation on the supply and demand sides.”
“Our actions may way on growth, but it is a risk we have to take because price stability is priority.”
Earlier on, the central bank policymaker Olli Rehn said, “I assume further rate hikes going forward.”
Meanwhile, ECB Vice President Luis de Guindos said that “we do not have any estimates of the terminal rate.”
Market reaction
EUR/USD is off the lows, still down 0.30% on the day at 0.9970 on the above comments.
China's President Xi Jinping delivered a speech at Shanghai Cooperation Organisation (SCO) summit in Uzbekistan on Friday.
Key quotes
Will prevent foreign forces from instigating 'colour revolution'.
Welcome all countries to sign up to china's global security initiative.
China will train 2,000 law enforcement personnel over the next five years for sco member countries.
Will step up cooperation on Belt and Road initiative.
Will provide 1.5 bln yuan worth of humanitarian aid to developing countries.
Urges countries to stop zero sum game and bloc politics.
China's economy remains resilient, full of potential.
Related reads
- PBOC: Will aim to stabilize employment, prices
- AUD/USD breaks below 0.6700, hits the lowest level since June 2020 amid stronger USD
The People's Bank of China (PBOC) said on Friday, it will aim to stabilize employment and prices for a sustained economic recovery.
Key quotes
“Will implement prudent monetary policy.”
“Will stabilize employment, prices.”
“Will consolidate the foundation of economic recovery.’
Market reaction
AUD/USD Is little changed on the above comments, down 0.45% on the day to trade at 0.6672.
Charles Michel, the President of the European Council said on Friday that the bloc must reduce energy consumption and increase supply.
Additional quotes
The EU needs to engage with Algeria, Qatar, UAE and Saudi Arabia to manage the current crises.
For most of these four countries its possible to increase supply, we need to determine conditions.
Good proposals on energy prices are on the table in the EU, but more will be needed.
We discussed with Qatar rerouting gas meant for Asia.
Related reads
- EUR/USD: Sellers to retain control if 0.9950 fails
- ECB’s Rehn: There is a case for frontloading the tightening cycle
- AUD/USD meets with a fresh supply on Friday and drops to over a two-year low.
- Bets for aggressive Fed rate hike boost the USD and exerts downward pressure.
- The risk-off impulse also benefits the buck and weighs on the risk-sensitive aussie.
The AUD/USD pair meets with a fresh supply following an early uptick to the 0.6725 region and turns lower for the second straight day on Friday. This also marks the third day of a negative move in the previous four and drags spot prices to the lowest level since June 2020, around the 0.6670 area during the first half of the European session.
As investors look past upbeat Chinese economic data released earlier this Friday, resurgent US dollar demand turns out to be a key factor exerting downward pressure on the AUD/USD pair. The greenback continues to draw support from expectations that the Fed will tighten its monetary policy at a faster pace and the bets were reaffirmed by the stronger US CPI report.
In fact, the markets have been pricing in the possibility of a full 100 bps rate hike at the upcoming FOMC meeting on September 20-21. Moreover, the US central bank is further expected to deliver another supersized 75 bps rate increase in November. This, along with the risk-off impulse, drives haven flows towards the buck and weighs on the risk-sensitive aussie.
The prospects for rapid interest rate hikes, along with economic headwinds stemming from COVID-19 lockdowns in China and the protracted Russia-Ukraine war, have been fueling recession fears. This, in turn, tempers investors' appetite for riskier assets, which is evident from a fresh leg down in the equity markets and tends to benefit the safe-haven greenback.
With the latest leg down, the AUD/USD pair confirms a fresh breakdown below the 0.6700 round figure. A subsequent fall below the previous YTD low, around the 0.6680 region, might have already set the stage for further losses. Hence, some follow-through weakness towards the 0.6645 intermediate support, en route to the 0.6700 mark, looks like a distinct possibility.
Technical levels to watch
European Central Bank (ECB) Governing Council member Olli Rehn said on Friday, “there is a case for frontloading the tightening cycle.”
More comments
Risks to inflation outlook primarily to upside.
I assume further rate hikes going forward.
There is growing risk of recession in the Eurozone.
There is a case for frontloading the tightening cycle.
Market reaction
Amid risk aversion at full steam and notable US dollar demand, EUR/USD shrugs off the hawkish ECB commentary. The spot is losing 0.35% on the day to trade at 0.9963, as of writing.
EUR/USD has declined to the lower limit of its short-term trading range. A four-hour close below 0.9950 could bring in additional sellers, FXStreet’s Eren Sengezer reports.
Multi-year lows could be targeted if 0.9950 fails
“0.9950 (static level) aligns as key technical support. In case EUR/USD falls below that level and starts using it as resistance, it could extend its slide toward 0.9900 (psychological level) and 0.9865 (September 6 low).”
“In order to convince buyers of a steady recovery, EUR/USD needs to break above 1.0000 (psychological level, 100-period SMA). In such a scenario, resistances are located at 1.0020 (50-period SMA), 1.0040 area (Fibonacci 50% retracement) and 1.0070 (Fibonacci 38.2% retracement, 200-period SMA).”
The dollar continues to benefit from safe-haven flows on the last trading day of the week. Economists at MUFG Bank expect the greenback to stay on a solid foot.
Mixed data, further curve inversion and asset price declines
“Add to that the flow of data this week that indicates a slowing economy there are reasons for the Fed to stick to the current pace of tightening. Retail sales for August revealed no growth in Control Group sales while the July data was revised sharply lower. Manufacturing slowed markedly in August as well and manufacturing sentiment for New York and Philadelphia remained negative. We have not had housing data this week but the housing market is weakening sharply.”
“With the Fed set to hike by possibly another 175 bps before year-end, we would expect financial conditions to remain unfavourable for assets generally and it clearly points to the US dollar being the primary beneficiary.”
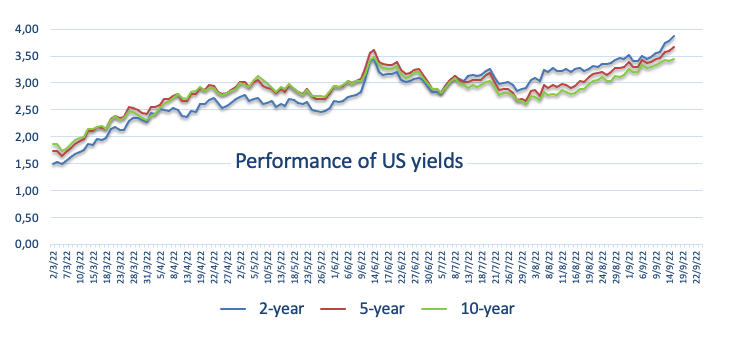
“For 2s10s to break to new levels of inversion (beyond the Aug low of -58 bps) would take us to levels last seen in the early 1980’s. That would certainly likely mean a broadening of the strength of the US dollar.”
GBP/USD has broken below the 1.1406 low. Therefore, economists at MUFG Bank believe that the pair could nosedive towards the all-time low of 1.0520.
Bleak UK economic outlook
“GBP/USD has further to fall in circumstances of increased financial market volatility given the UK’s budget + current account deficit combined is set to head toward an eye-watering 15% of GDP downside GBP pressure will persist.”
“A break below the low of 1.1406 will take us to levels not seen since 1985 when GBP/USD hit an all-time low of 1.0520.”
The GBP/USD pair extends the post-US CPI sharp retracement slide from a two-week high and remains under heavy selling pressure on Friday. The second straight day of a negative move - also marking the third in the previous four - picks up pace during the early European session and drags spot prices below the 1.1400 mark for the first time since 1985.
Can silver continue to outperform gold? In the opinion of strategists at ANZ Bank, any short covering could provide another opportunity for silver to fare better than gold.
Gold’s weaker backdrop does not bode well
“Physical demand for silver is picking up, as the major consuming markets in India and China import more. Industrial demand for silver is holding up well from the solar sector, while jewellery demand is also gaining attention. That said, silver largely tracks gold and gold’s weaker backdrop doesn’t bode well.”
“Its outperformance against gold could be possible as short positions in silver look stretched. So, any short covering could provide another opportunity for silver to fare better than gold.”
Quek Ser Leang at UOB Group’s Global Economics & Markets Research suggests USD/CNH could retest 7.1000 once 7.0500 is cleared.
Key Quotes
“In our last Chart of the Day update from 29 Aug 2022, when USD/CNH was trading at a much lower level of 6.9200, we titled our update ‘USD/CNH could continue to advance, likely at a rapid pace as there are hardly any resistance levels of note until 7.0000’. While our view of a ‘rapid pace of advance’ was not wrong, USD/CNH did not break 7.0000 as it soared to 6.9967 about a week later before pulling back to a low of 6.9100.”
“USD/CNH rebounded sharply from 6.9100 and yesterday (15 Sep 2022), it cracked 7.0000. The break of the ‘psychological level’ resulted in a swift and sharp surge and USD/CNH continues to accelerate higher today. The price actions are not surprising as the next resistance level of note is at 7.0500. Looking ahead, if 7.0500 is broken, the focus will shift to 7.1000. Within these couple of months, the 2019 and 2020 highs, both near 7.1960, are unlikely to come into view.”
“On the downside, the rising trend-line support, currently at 6.9400, is a strong support level but only a breach of the 21-day exponential moving average (at the time of writing, the level is at 6.9260) would indicate the current strong upward pressure has eased.”
- USD/CHF climbs to a fresh weekly high on Friday amid a goodish pickup in the USD demand.
- Bets for aggressive Fed rate hikes, elevated US bond yields continue to underpin the buck.
- The risk-off mood benefits the safe-haven CHF and caps any meaningful upside for the major.
The USD/CHF pair catches fresh bids on Friday and hits a fresh weekly high during the early European session. Bulls, however, struggle to capitalize on the move or find acceptance above the 50-day SMA and the intraday move-up stalls just ahead of the mid-0.9600s.
The US dollar is back in demand and reverses an early dip to a multi-day low, which turns out to be a key factor pushing the USD/CHF pair higher. Expectations that the Federal Reserve will hike interest rates at a faster pace to tame inflation continue to lend support to the USD. The bets were reaffirmed by the stronger US CPI report on Tuesday.
In fact, the markets have been pricing in the possibility of a full 100 bps rate hike at the upcoming FOMC policy meeting on September 20-21 and another supersized 75 bps increase in November. This remains supportive of elevated US Treasury bond yields, which continue to act as a tailwind for the greenback and lend support to the USD/CHF pair.
That said, the risk-off impulse - as depicted by a fresh leg down in the equity markets - drives some haven flows towards the Swiss franc and caps gains for the USD/CHF pair. The market sentiment remains fragile amid concerns that rising interest rates and headwinds stemming from fresh COVID-19 curbs in China will lead to a deeper economic downturn.
Investors might also prefer to move to the sidelines ahead of next week's central bank event risks. The Fed is scheduled to announce its policy decision on Wednesday and will be followed by the Swiss National Bank (SNB) meeting on Thursday. This makes it prudent to wait for some follow-through buying before positioning for any further appreciating move.
Technical levels to watch
- The index adds to Thursday’s small advance and targets 110.00.
- US yields extend further the march north on Friday.
- Advanced Consumer Sentiment gauge next on tap in the docket.
The US Dollar Index (DXY), which gauges the greenback vs. its main competitors, keeps the bid bias well and sound and approaches the 110.00 neighbourhood at the end of the week.
US Dollar Index remains supported by Fed, data
The index keeps the optimism on the rise in the second half of the week and with the immediate target at the 110.00 neighbourhood.
The rebound in the dollar has been exacerbated following Tuesday’s release of higher-than-expected US inflation figures during August and remains well propped up by the unabated move higher in US yields, especially in the short end and the belly of the curve.
Following the publication of US CPI, a full-point interest rate hike by the Fed at the September 21 meeting emerged on the horizon, although its chances seem to have dwindled a tad since then. Currently, CME Group’s FedWatch Tool sees the possibility of a 100 bps rate raise at 24% amidst investors’ preference for a 75 bps move.
In the docket, the preliminary U-Mich Consumer Sentiment for the current month is due next seconded by Net Long-Term TIC Flows.
What to look for around USD
The index appears bid and keeps the post-CPI rebound well in place for the time being.
Bolstering the dollar’s underlying positive stance appears the firmer conviction of the Federal Reserve to keep hiking rates until inflation looks well under control regardless of a likely slowdown in the economic activity and some loss of momentum in the labour market. This view was reinforced by Chair Powell’s speech at the Jackson Hole Symposium.
Looking at the more macro scenario, the greenback appears propped up by the Fed’s divergence vs. most of its G10 peers in combination with bouts of geopolitical effervescence and occasional re-emergence of risk aversion.
Key events in the US this week: Flash Michigan Consumer Sentiment, TIC Flows (Friday).
Eminent issues on the back boiler: Hard/soft/softish? landing of the US economy. Prospects for further rate hikes by the Federal Reserve vs. speculation over a recession in the next months. Geopolitical effervescence vs. Russia and China. US-China persistent trade conflict.
US Dollar Index relevant levels
Now, the index is advancing 0.12% at 109.88 and a break above 110.01 (weekly high September 13) would expose 110.78 (2022 high September 7) and then 111.90 (weekly high September 6 2002). On the other hand, the next support emerges at 107.68 (monthly low September 13) followed by 107.58 (weekly low August 26) and finally 105.76 (100-day SMA).
Gold price failed to break above $1,800 in August, with the downtrend continuing. Key supports of $1,700 and $1,675 have been broken. Strategists at ANZ Bank expect XAU/USD to dive towards $1,600.
Bearish trend is likely to continue
“A weekly close below $1,675 could trigger a heavy sell-off next week. That said, the price could consolidate after Thursday’s sell-off, ahead of the FOMC meeting on 21 September.”
“Bears could extend downside price moves to $1,600 and below.”
“Immediate resistance lies at $1,700 and a break of this level would put the next resistance point at $1,735. While reversal of the trend could be possible if prices break critical level of $1,800.”
USD/JPY has somewhat stabilised after a choppy week. But, maintain economists at Bank of America Global Research, a bullish bias exists targeting a move towards 150.
Still an uptrend
“Still a strong uptrend with potential to see 149.53/150 in the next leg of a broad USD rally. Since the secular breakout in 1Q22, USD/JPY continues to break higher and reach our long list of big upside targets.”
“The next three levels are the 38.2% head and shoulders target of 145.18, the peak in 1999 was in the 147s and an A=C target is 149.53.”
USD/CNY has broken the 7 figure. Economists at OCBC Bank expect the pair to enjoy further gains, eyeing resistance at 7.0350.
Upside Risks
“Daily momentum is mild bullish while RSI rose. Upside risks ahead.”
“Resistance at 7.0350, 7.05.”
“Support at 7.00, 6.9870 levels.”
“PBoC continued to rely on daily fix to manage/guide RMB moves but the bar was raised to 6.93 levels from 6.91. We reiterate that a stronger fix would continue to be featured but could only serve as an attempt to slow the pace of RMB depreciation.”
- USD/JPY reverses an intraday dip and turns positive for the second straight day on Friday.
- Aggressive Fed rate bets, elevated US bond yields boost the USD and remain supportive.
- The risk-off impulse underpins the safe-haven JPY and caps any further gains for the pair.
The USD/JPY pair attracts some dip-buying near the 142.80 area on Friday and steadily climbs to a fresh daily high during the early European session. The pair is currently trading around the 142.65-142.70 area and draws support from a goodish pickup in demand for the US dollar.
The stronger US CPI report released on Tuesday lifted bets for a more aggressive policy tightening by the Fed, which continues to underpin the greenback and acts as a tailwind for the USD/JPY pair. In fact, the markets have started pricing in the possibility of a full 100 bps rate hike at the upcoming FOMC meeting on September 20-21 and another supersized 75 bps increase in November.
The Bank of Japan, on the other hand, has been lagging behind other major central banks in the process of policy normalisation and remains committed to continuing with its monetary easing. The resultant Fed-BoJ policy divergence is seen weighing on the Japanese and turns out to be another factor lending some support to the USD/JPY pair. The uptick, however, lacks bullish conviction.
The prospects for rapid interest rate hikes, along with headwinds stemming from fresh COVID-19 curbs in China and the protracted Russia-Ukraine war, have been fueling recession fears. This, in turn, tempers investors' appetite for riskier assets, which is evident from a fresh leg down in the equity markets. The anti-risk flow benefits the safe-haven JPY and caps gains for the USD/JPY pair.
Traders also seem reluctant and prefer to move to the sidelines ahead of next week's central bank event risks. The Fed is scheduled to announce its policy decision on Wednesday, which will be followed by the Bank of Japan meeting on Thursday. This will play a key role in influencing near-term price dynamics for the USD/JPY pair and help determine the next leg of a directional move.
In the meantime, traders on Friday will take cues from the Preliminary Michigan Consumer Sentiment Index from the US, due for release later during the early North American session. This, along with the
US bond yields, will drive the USD demand. Apart from this, the broader market risk sentiment should produce short-term trading opportunities around the USD/JPY pair on the last day of the week.
Technical levels to watch
EUR/GBP jumps to the 18-month high. Nonetheless, economists at ING expect the pair to struggle around the 0.8750 region.
Bank of England could lend sterling some help next week
“Despite the seemingly unstoppable re-pricing higher in Fed rate expectations, the BoE’s pricing has stalled, now around 65 bps for the September meeting. We currently see a relatively high chance of a 75 bps move next week, which could lend sterling some help, despite a general environment that remains rather unwelcoming for pro-cyclical currencies, and domestic growth fears that are likely set to keep a lid on a large GBP recovery.”
“This morning’s EUR/GBP jump may struggle to extend beyond the 0.8750 mark.”
Here is what you need to know on Friday, September 16:
The dollar continues to benefit from safe-haven flows on the last trading day of the week with the US Dollar Index stretching higher toward 110.00. US stock index futures are down between 0.5% and 0.8% in the early European morning and the benchmark 10-year US Treasury bond yield stays slightly below 3.5%. Eurostat will release revisions for August HICP inflation figures and the University of Michigan will publish the preliminary September Consumer Sentiment Index data ahead of the weekend.
US Consumer Sentiment Preview: Every 0.1% deviation in inflation gauge to trigger wild dollar moves.
Following mixed macroeconomic data releases from the US on Thursday, Wall Street's main indexes ended up closing the day deep in negative territory. Ahead of the Fed's policy announcements next week, the CME Group's FedWatch Tool shows that markets are pricing in a 26% probability of a 100 basis points rate hike, not allowing US stocks to stage a rebound.
Meanwhile, the data from China showed earlier in the day that Retail Sales rose by 5.4% on a yearly basis in August, surpassing the market expectation of 3.5%. Additionally, Industrial Production expanded by 4.2% in the same period, compared to analysts' estimate of 3.8%. Despite these upbeat data, the market mood continues to sour.
EUR/USD managed to post small daily gains on Thursday but failed to stabilize above parity. The pair was last seen trading modestly lower on the day at 0.9985. European Central Bank (ECB) Vice President Luis de Guindos said on Friday that they don't have any estimates of the terminal rate.
GBP/USD lost nearly 100 pips on Thursday and started to push lower toward 1.1400 early Friday with the risk-sensitive British pound struggling to find demand in the current market environment.
Following Wednesday's slump, USD/JPY is having a hard time gathering recovery momentum and trading in a relatively narrow range below 144.00.
A technical selloff got triggered after gold broke below the key $1,680 support on Thursday. XAU/USD was last seen trading at its weakest level in over two years at $1,660. On a weekly basis, the yellow metal is down more than 3%. Rising US Treasury bond yields put additional weight on the pair throughout the week as well.
Gold Price Forecast: XAU/USD refreshes yearly low near $1,660 as strong yields propel US dollar.
Bitcoin broke below the key $20,000 support late Thursday and was last seen trading flat on the day at around $19,750. Ethereum lost nearly 10% on Thursday and seems to have gone into a consolidation phase at around $1,500.
FX option expiries for Sept 16 NY cut at 10:00 Eastern Time, via DTCC, can be found below.
- EUR/USD: EUR amounts
- 0.9900 704m
- 0.9925 206m
- 0.9945-50 350m
- 0.9995-00 434m
- 1.0045-60 877m
- 1.0100 942m
- 1.0150 747m
- GBP/USD: GBP amounts
- 1.1375 404m
- 1.1500 268m
- 1.1600 361m
- USD/JPY: USD amounts
- 142.00 465m
- 144.00 586m
- USD/CHF: USD amounts
- 0.9585 505m
- AUD/USD: AUD amounts
- 0.6650 311m
- 0.6895 565m
- USD/CAD: USD amounts
- 1.3345 297m
- EUR/CHF: EUR amounts
- 0.9700 230m
Today, we will hear from European Central Bank (ECB) President Christine Lagarde. Anyway, economists at ING expect the EUR/USD to struggle to see gains.
How will Lagarde address the energy bill caps?
“So far, post-meeting comments by ECB officials have stayed on the hawkish side of the spectrum and we see no reason for Lagarde to derail from this narrative today. What we’ll be watching closely is how the recent measures by EU members to cap energy bills will be embedded into the ECB’s policy assessment, and this is a factor that may cause a further divergence between the doves and hawks within the Governing Council.”
“The euro has displayed a reduced sensitivity to ECB communication recently and the unstable risk environment mixed with a strong dollar may keep EUR/USD upside capped for now despite the recent decline in gas prices.”
“The 1.0000 level could remain an anchor over the coming days.”
- Gold price takes offers to refresh 29-month low, down for fourth consecutive day.
- Yields reverse Asian session weakness, allowing DXY to cross weekly resistance line.
- Risk catalysts are the key ahead of next week’s FOMC, preliminary readings of Michigan CSI could offer intermediate directions.
Gold price (XAU/USD) stands on slippery ground as it renews the 29-month low around $1659 during the initial hour of Friday’s European session.
That said, the precious metal witnessed a pullback from the yearly low earlier in the day amid the market’s inaction. However, the latest recovery in the US Treasury bond yields seemed to have underpinned the US Dollar Index (DXY) and weighed on the XAU/USD prices.
The US 10-year Treasury yields not only reverse the early Asian session decline but also add 2.5 basis points to refresh the three-month high of around 3.48%. With this, the negative divergence with the two-year bond yields keeps signaling recession fears and weighing on the gold price. That said, the two-year US Treasury bond yields rise to the fresh high since late 2007, to 3.916% by the press time.
Also contributing to the bullion’s weakness are the recent hawkish bets on the US Federal Reserve’s (Fed) next move. The latest readings of the hawkish Fed bets from the CME’s FedWatch Tool suggest the market priced in the Fed’s 0.75% and 1.0% rate hikes during the next week’s Fed meeting with 76% and 24% chances versus 75% and 25% in that order.
Furthermore, downbeat economic forecasts and fears over the transition also weigh on gold prices. World Bank Chief Economist Indermit Gill on Thursday said he was concerned about "generalized stagflation," a period of low growth and high inflation, in the global economy, noting the bank had pared back forecasts for three-fourths of all countries, reported Reuters.
Amid these plays, S&P 500 Futures drop 0.85% to attack a weekly low while equities in the UK and Europe open in the red.
Moving on, preliminary readings of the Michigan Consumer Sentiment Index (CSI), expected 60 versus 58.2 prior. However, major attention will be given to the next week’s Federal Open Market Committee (FOMC) monetary policy meeting.
Technical analysis
Gold price extends downside break of a two-month-old support line, now resistance around $1,693, while refreshing the multi-month low. In doing so, the yellow metal ignores oversold RSI (14) while respecting the bearish MACD signals.
That said, a downward sloping trend line from August 22, close to $1,635 by the press time, is likely to offer immediate support to the XAU/USD.
Following that, the $1,600 threshold and April 2020 low near $1,572 will gain the market’s attention.
Alternatively, a corrective bounce may initially aim for the earlier yearly low, marked in July at around $1,680, before heading towards the previous support line, near $1,693 and the $1,700 threshold.
Gold: Four-hour chart

Trend: Further weakness expected
The Federal Reserve is set to pivot. What is uncertain is the timing and the pace at which Fed will have to reverse the rate hikes. Gold is the favourite asset for strategists at Société Générale ahead of a Fed pivot.
Prefer gold over long-duration equities
“The obvious question is ‘will the Fed pause its rate hikes?’ and the answer is almost certainly yes. We think the likelihood of the Fed pivoting and reversing the rate hikes is a likely scenario at the earliest in Q2 next year when we expect the core inflation will already start falling below 4%.”
“To position for the Fed pivot, instead of buying US equities, we think defensive assets such as gold are preferable, as we expect them to outperform first. The main reason is that the earnings growth outlook for US stocks will likely get worse in 1H23 on back of a strong USD, a weaker oil price, and the likelihood of continued economic slowdown.”
“In the short-term, gold could continue to suffer from higher real yields, themselves pushed up by further Federal Reserve rate hikes.”
“We may think of increasing our gold exposure further, as even our most bearish forecast, at $1,550, is not too far off current levels.”
Economists at Société Générale expect European equities to struggle this winter. However, they have better prospects for the next year and forecast STOXX 600 and EuroSTOXX 50 at 440 and 3,800, respectively.
Inflation should decelerate next year, allowing a rerating of European equities
“This winter could be volatile and choppy for the European equity market, as investors weight up the impact of higher energy prices and the risk of gas shortages and power cuts on the continent.”
“During the next two quarters, lower GDP growth should not prevent the ECB from continuing to hike. As this story is already partly priced into European equity markets and we assume a worst-case scenario could be avoided, the downside should be rather limited (single digits).”
“In our scenario, inflation should decelerate next year, helping the German 10y bond yield to stabilise from spring onwards to around 1.6% and thus allowing a rerating of the European equity market.”
“We see the STOXX 600 Index rising to 440 points (6% higher than current levels) and the EuroSTOXX 50 to 3,800 points (+7% vs the current level) by year-end 2023.”
At its monthly meeting today, Russia’s central bank (CBR) is set to cut rates again. In the opinion of economists at Commerzbank, the rate cut is unlikely to weigh on the rouble.
CBR to continue taking interest rates down
“CBR will likely lower its benchmark rate by 50 bps to reflect slowing inflation and the (relatively) strong rouble exchange rate.”
“A rate cut is unlikely to have any adverse implication for the isolated rouble exchange rate. Why then not a larger cut? CBR has issued a rather hawkish assessment of the inflation outlook recently, which makes this prospect slim.”
- EUR/GBP jumps to the highest levels since February 2021 on downbeat UK Retail Sales.
- UK Retail Sales dropped below market forecast and prior in August.
- Three-month-old previous resistance line limits immediate downside moves.
- Buyers approach an upward-sloping trend line from December 2021.
EUR/GBP portrays the market’s disappointment with the UK’s Retail Sales data during Friday’s early morning in Europe. The cross-currency pair takes the bids to refresh the 18-month high following that downbeat UK data.
UK’s Retail Sales for August marked 5.4% YoY contraction versus -4.2% expected and -3.4% prior. Details suggest that the Retail Sales ex-Fuel printed -5.0% the figure compared to -3.4% market consensus and -3.1% (revised down) previous readings.
Following the data, EUR/GBP crossed the three-month-old horizontal hurdle surrounding 0.8720-25.
The resistance breakout also takes clues from the bullish MACD signals to direct the pair buyers towards an upward sloping resistance line from December 2021, around 0.8780 by the press time.
Meanwhile, pullback moves need to break the resistance-turned-support near 0.8725-20 to recall the EUR/GBP sellers.
Even so, the 10-DMA and a two-week-old ascending support line, respectively near 0.8665 and 0.8640, could challenge the pair’s further downside.
EUR/GBP: Daily chart
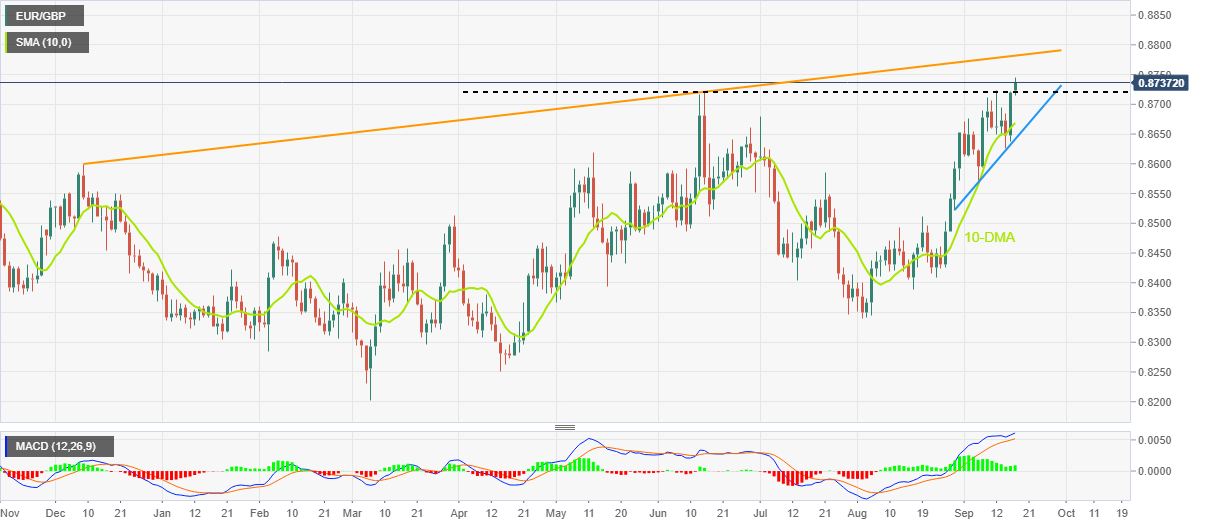
Trend: Further upside expected
NZD/USD has now convincingly broken below key support at 0.60. Economists at ANZ Bank expect the pair to test next support levels at 0.5940 and 0.5915.
Global themes/factors remain dominant ahead of next week’s Fed meeting
“Kiwi has made a more convincing break below 0.60. The more substantive move should quell any debate about whether the 0.60 level has been sustainably breached or not, and technically, it brings 0.5940 (the 76.4% Fibo of the 2020/21 rally) and 0.5915 (the May 2020 low after the April 2020 bounce) into focus.”
“FX sentiment remains USD/globally driven, and the NZD struggled to garner any support from GDP data yesterday. Surprising as that was, given the size of the miss, what that tells you is that the market will be sensitive to next week’s Fed ‘75 or 100 bps’ rate hike decision.”
Today, in addition to the heads of the French and Finnish central bank, Olli Rehn and Francois Villeroy, Christine Lagarde too will have the opportunity to comment once again. Economists at Commerzbank expect her words to cushion the downside in EUR/USD.
Rising interest rate expectations for the European Central Bank
“The ECB bankers are not tired of underlining in their speeches how important decisive action is to control inflation successfully.”
“The market is also betting on rising interest rate expectations for the ECB. Lagarde is likely to be wary of saying anything today that would take away the basis for these expectations. That should limit the downside in EUR/USD.”
USD/JPY keeps pointing to further consolidation in the next weeks, likely between 141.00 and145.00, comment FX Strategists at UOB Group Lee Sue Ann and Quek Ser Leang.
Key Quotes
24-hour view: “We expected USD to ‘dip below 142.50’ yesterday. Our expectations did not materialize as it traded in a relatively quiet manner between 142.77 and 143.80. The price actions appear to be part of a consolidation and USD is likely to trade sideways for today, expected to be within a range of 142.60/143.70.”
Next 1-3 weeks: “There is not much to add to our update from yesterday (15 Sep, spot at 143.10). As highlighted, USD does not appear to be ready to move above 145.00 in a sustained manner. From here, USD is likely to trade between 141.00 and 145.00 for a period of time.”
- GBP/JPY is scaling lower towards 164.00 as UK Retail Sales have contracted by 5.4% vs. 4.2% expected.
- The synergic effect of weaker Retail Sales and skyrocketing inflation will weigh extreme pressure on the BOE.
- Investors are awaiting more developments on BOJ’s intervention plans.
The GBP/JPY pair has sensed selling pressure around 164.40 after the release of downbeat UK Retail Sales data. The asset is declining towards the critical support of 164.00. The UK Retail Sales have contracted by 5.4% vs. 4.2% contraction expected and have remained extremely lower than the prior decline of 3.2% on an annual basis. Also, the annual Retail Sales data that excludes fuel bills has released extremely lower at -5%.
The downbeat Retail Sales data will couple with the inflation monster. The synergic impact will be huge as inflationary pressures are near double-digit figures and energy prices are still not finding resistance. Next week, the interest rate decision by the BOE will be keenly watched. It is worth noting that the BOE has already elevated its interest rates to 1.75% and a further rate hike by 50 basis points (bps) is expected, a poll from Reuters.
Recently announced stimulus packages by new Prime Minister Liz Truss to corner energy bills for households and reduce taxes to support the latter with more funds for catering to the higher payouts. The move will delight the households but will create more issues for the BOE as injecting helicopter money into the economy in times when inflation problems are parallel for a tad longer period.
On the Tokyo front, the depreciating yen has now become a headache for the Bank of Japan (BOJ) and its economy. The nation was enjoying a weaker currency as it was accelerating exports and the tourism industry and companies are facing the heat of currency risk due to costly imported inputs. The BOJ has already shown its intentions of intervening in the Fx moves as it believes that the current price doesn’t justify the fundamentals.
European Central Bank (ECB) Vice President Luis de Guindos said on Friday that “we do not have any estimates of the terminal rate.”
He said that “Eurozone slowdown is not enough to control inflation.”
On Thursday, Guindos said that “the euro area is now facing a challenging outlook.”
Market reaction
At the press time, EUR/USD is on the defensive around 0.9980, keeping its range play intact below parity ahead of the US data.
The Fed rate decision next week will be the next major event for the FX market. In the opinion of economists at Commerzbank, uncertainty continues to benefit the dollar.
Significant upward revision to the rate projections is inevitable
“A significant upward revision to the Fed central bankers' rate projections next week is inevitable – regardless of whether 75 or 100 bps occurs.”
“The main uncertainty is whether the Fed then expects higher median rate levels than the market is currently pricing in (roughly 4.5%). This uncertainty is likely to support the dollar for now.”
- GBP/USD takes offers to refresh intraday low after UK’s Retail Sales for August dropped below market forecasts and prior.
- Risk-aversion and firmer Yields also weigh on Cable prices.
- UK’s record inflation expectations, hawkish Fed bets test bears amid fears of “Black Wednesday”.
- Preliminary Michigan CSI for September should entertain traders before Fed meeting.
GBP/USD refreshes intraday low around 1.1440 after the UK’s Retail Sales dropped more than expected in August, as per the latest published during early Friday. Adding strength to the bearish bias are the hawkish Fed bets and the rebound in the US Treasury yields.
UK’s Retail Sales for August marked 5.4% YoY contraction versus -4.2% expected and -3.4% prior. Details suggest that the Retail Sales ex-Fuel printed -5.0% the figure compared to -3.4% market consensus and -3.1% (revised down) previous readings.
In addition to the downbeat UK data that contribute a lion’s share to the Gross Domestic Product (GDP), hawkish Fed bets and recovery in the US Treasury yields also weigh on the GBP/USD prices.
That said, the latest readings of the hawkish Fed bets from the CME’s FedWatch Tool suggest the market priced in the Fed’s 0.75% and 1.0% rate hikes during the next week’s Fed meeting with 76% and 24% chances.
Elsewhere, the US 10-year Treasury yields reverse the early Asian session decline to regain 3.46% mark by the press time, after rising 1.38% the previous day. With this, the negative divergence with the two-year bond yields keeps signaling recession fears and weighing on the GBP/USD prices. That said, the two-year US Treasury bond yields rise to the fresh high since late 2007, to 3.892% by the press time.
It should be noted that Bloomberg’s piece suggesting the fears of September 16, 1992, known as “Black Wednesday”, seems to also drown the GBP/USD prices.
Alternatively, record high inflation expectations in the UK, as well as the increasing confidence in the BOE, challenged the GBP/USD bears previously.
Having witnessed the initial reaction to the UK data, GBP/USD traders may wait for the preliminary readings of the Michigan Consumer Sentiment Index (CSI), expected 60 versus 58.2 prior. However, major attention will be given to the next week’s Federal Open Market Committee (FOMC) monetary policy meeting.
Technical analysis
A four-month-old downward sloping support line, near 1.1330, remains on the bear’s radar unless the GBP/USD prices cross the 21-DMA hurdle, around 1.1650 at the latest.
Gold price is consolidating Thursday’s massive sell-off on the final trading day of the week. Pre-FOMC adjustments could trigger a brief rebound in XAU/USD, FXStreet’s Dhwani Mehta reports.
Inverted cup and handle breakdown suggest more pain ahead of XAU/USD
“The narrative of hefty Fed rate hike expectations in the coming months could continue playing out this Friday, although gold traders could take profit on their short positions under the pretext of excessive selling and position re-adjustments ahead of next week’s FOMC decision.”
“Gold yielded a daily close below the rising trendline support, then at $1,693, confirming an inverted cup and handle formation. Should the selling pressure gather steam again, then bears could target the $1,650 psychological level following a firm break below the previous day’s low of $1,660.”
“On the flip side, the recovery will need acceptance above the 2022 low of $1,681, above which $1,691 will be challenged. The $1,700 level will be the next upside barrier on the road to recovery.”
- The UK Retail Sales came in at 1.6% MoM in August, a big miss.
- Core Retail Sales for the UK fell by 1.6% MoM in August.
- The cable remains in the red below 1.1450 on the downbeat UK data.
The UK retail sales arrived at -1.6% over the month in August vs. -0.5% expected and 0.3% previous. The core retail sales, stripping the auto motor fuel sales, dropped 1.6% MoM vs. -0.7% expected and 0.4% previous.
On an annualized basis, the UK retail sales plunged -5.4% in August versus -4.2% expected and -3.2% prior while the core retail sales slumped 5% in the reported month versus -3.4% expectations and -3.1% previous.
Main points (via ONS)
All main sectors (food stores, non-food stores, non-store retailing and fuel) fell over the month; this last happened in July 2021, when all legal restrictions on hospitality were lifted.
Food store sales volumes fell by 0.8% in August 2022, which leaves them 1.4% below their pre-coronavirus (COVID-19) levels in February 2020.
Automotive fuel sales volumes fell by 1.7% in August 2022; these were 9.0% below their February 2020 levels.
FX implications
GBP/USD is holding the lower ground on the disappointing UK Retail Sales data. The spot was last seen trading at 1.1441, down 0.19% on the day.
- EUR/JPY has witnessed selling pressure around 143.50 on trending BOJ’s intervention warning.
- It would be worth watching the response from the remaining G7 countries to BOJ’s intervention intentions.
- Investors are blaming the ECB for a delayed response to the inflation mess.
The EUR/JPY pair has declined after sensing firmer hurdles around 143.50 in the early European session. The asset is expected to witness more weakness after dropping below the important cushion of 143.00. The asset has shifted into a correction mode after a warning from the Bank of Japan (BOJ) on intervention in Fx moves to provide support to the depreciating yen.
The Japanese administration is getting panic attacks over the vulnerable yen as it believes that the current price is not justifying its fundamentals. Therefore, the economy has decided to intervene in Fx moves in seldom. It would be worth watching the response from the central banks of other G7 countries. The depreciating domestic currency is impacting the imported-inputs-dependent companies, which are failing to counter the currency risk.
The economists at Nordea cited that the BOJ is needed to shift gears to a neutral stance on interest rates. The policy divergence of BOJ with other central banks is getting wider firmly, which is impacting the Japanese yen. An ultra-loose monetary policy is a major problem for the BOJ and the central bank should look upon revoking the same.
On the Eurozone front, the European Central Bank (ECB) policymakers seem unable to control the soaring price pressures. Investors are blaming the delayed response from the ECB towards bulking inflation rate. ECB President Christine Lagarde is expected to announce more rates further but still keep eye on data for more informed decisions.
- EUR/USD reverses Asian session gains, snaps two-day uptrend.
- US data, yields underpin Hawkish Fed bets, ECB’s rate hike appears slow to reach markets.
- Fears surrounding China, European energy crisis weigh on prices ahead of second-tier US data.
- Final readings of Eurozone inflation data to entertain EUR/USD traders, next week’s FOMC meeting appears the key.
EUR/USD returns to the bear’s table, after a two-day absence, during Friday’s sluggish European morning. That said, the major currency pair prints mild losses as it renews its intraday low around 0.9985. In doing so, the quote reverses the previous day’s upside break of the 21-DMA support amid mixed concerns surrounding the US Federal Reserve (Fed) and the European Central Bank (ECB).
The latest readings of the hawkish Fed bets from the CME’s FedWatch Tool suggest the market priced in the Fed’s 0.75% and 1.0% rate hikes during the next week’s Fed meeting with 77% and 23% chances.
On the other hand, Bloomberg said that a shortage of high-quality assets in the euro area is keeping a lid on short-term borrowing costs, a development that could endanger the European Central Bank’s effort to tighten financial conditions.
Elsewhere, the US 10-year Treasury yields dropped 1.0 basis point (bp) to 3.455% by the press time, after rising 1.38% the previous day. Even so, the negative divergence with the two-year bond yields keeps signaling recession fears and weighing on the EUR/USD prices. That said, the two-year US Treasury bond yields rise to the fresh high since late 2007, to 3.892% by the press time.
It should be noted that the firmer US data propelled the hawkish Fed bets the previous day. That said, the US Retail Sales rose 0.3% in August versus 0.0% expected and July’s revised down -0.4%. Further, NY Fed Empire State Manufacturing Index improved to -1.5 in September compared to -31.3 in August and the market expectation of -13. Alternatively, Philadelphia Fed Manufacturing Index declined to -9.9 for the said month compared to 2.8 expected and 6.2 prior. Additionally, US Industrial Production slid to -0.2% in August versus a market expectation for an expansion of 0.1% and downwardly revised prior to 0.5%.
On the other hand, ECB policymakers like Gabriel Makhlouf, Vice President Luis de Guindos and Mario Centeno all favored the rate hike concerns during their appearances on Thursday.
Moving on, final readings of the Eurozone inflation data for August, expected to confirm the initial forecasts of 9.1% YoY can offer immediate directions ahead of preliminary readings of the Michigan Consumer Sentiment Index (CSI), expected 60 versus 58.2 prior. However, major attention will be given to the economic crisis in China and Europe, which underpins the US dollar’s safe-haven demand, ahead of the Federal Open Market Committee (FOMC) monetary policy meeting.
Technical analysis
Bullish MACD signals and the steady RSI joins the 21-DMA support near 0.9985 to defend EUR/USD buyers before a two-month-old horizontal support region near 0.9945-55.
Considering advanced prints from CME Group for natural gas futures markets, traders scaled back their open interest positions by around 7.3K contracts on Thursday. Volume reversed the previous build and shrank by around 45.7K contracts.
Natural Gas appears supported near $7.50
Prices of natural gas fully faded Wednesday’s intense advance on Thursday on the back of diminishing open interest and volume. Against that, the continuation of the leg lower appears unlikely in the very near term. In the meantime, the $7.50 mark per MMBtu remains a decent support for the time being.
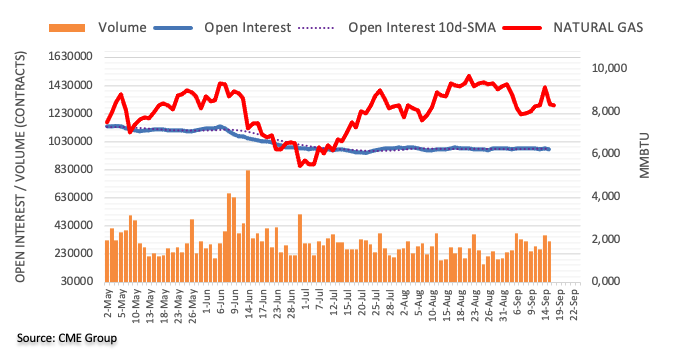
In the opinion of FX Strategists at UOB Group Lee Sue Ann and Quek Ser Leang, further decline in AUD/USD could shift the focus to 0.6640 in the next weeks.
Key Quotes
24-hour view: “We expected AUD to ‘trade between 0.6715 and 0.6785’ yesterday. However, AUD edged to a low of 0.6696 before closing on a soft note at 0.6701 (-0.69%). Downward momentum has improved, albeit not by much. For today, there is room for AUD to drop below 0.6680 but the next support at 0.6640 is unlikely to come under threat. Resistance is at 0.6720 but only a break of 0.6735 would indicate that AUD is not ready to head below 0.6680.”
Next 1-3 weeks: “We turned negative on AUD on Wednesday (14 Sep, spot at 0.6735) even though we were of the view that any weakness is expected to encounter solid support at 0.6680. Shorter-term downward momentum is improving quickly and a break of 0.6680 would not be surprising and would shift the focus to 0.6640. Resistance wise, a breach of 0.6770 (‘strong resistance’ level was at 0.6820 yesterday) would indicate that AUD is unlikely to weaken further.”
Open interest in crude oil futures markets shrank for the second session in a row on Thursday, this time by around 8.3K contracts according to preliminary readings from CME Group. In the same line, volume went down by around 206.6K contracts after two consecutive daily builds.
WTI: Recovery targets $90.00 and above
Thursday’s drop in prices of the WTI was on the back of shrinking open interest and volume, hinting at the idea that a deeper retracement is out of favour for the time being. Against that, bullish attempts should re-target the recent tops past the $90.00 mark per barrel.
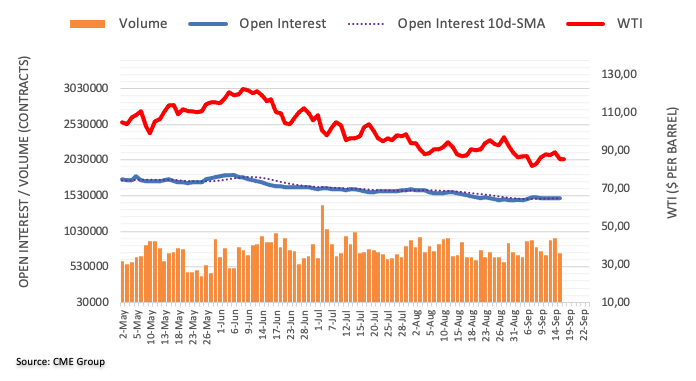
USD/TRY prints mild losses around 18.26 heading into Friday’s European session, consolidating recent gains around the yearly high, amid a broad pullback in the US dollar.
In doing so, the Turkish lira (TRY) pair ignores the strongest bullish bias in the options market in two months.
That said, one-month risk reversal (RR) on USD/TRY, a measure of the spread between call and put prices, snapped a two-day downtrend while rising to 1.395 by the end of Thursday’s North American trading session, per the data source Reuters. With this, the weekly RR is on the way to posting the biggest jump since mid-July.
It should be noted that the USD/TRY pullback appears tepid amid the monetary policy divergence between the US Federal Reserve (Fed) and the Central Bank of the Republic of Türkiye (CBRT).
- NZD/USD is marching towards 0.6000 as value bet triggers inertia for kiwi bulls.
- A higher-than-expected US Michigan CSI will strengthen the DXY further.
- An upbeat Business NZ PMI is supporting the antipodean.
The NZD/USD pair witnessed a rebound after printing a low of 0.5955 in the Tokyo session. The asset has extended its recovery after overstepping the immediate hurdle of 0.5974 and is marching higher to recapture the psychological resistance of 0.6000. Also, the asset has entered into the prior balanced area, which was formed in a narrow range of 0.5977-0.6026.
The major is scaling higher as the US dollar index (DXY) is displaying a subdued performance. Also, the risk-off profile is fading away as investors have shrugged off clouds of uncertainty. As investors have started discounting the fact that the Federal Reserve (Fed) is preparing for a bumper rate hike announcement to cool down the ultra-hot inflation, commodity-linked currencies are gaining strength. The value bet catalyst is bringing bids into the counter.
In today’s session, investors’ entire focus will be on US Michigan Consumer Sentiment Index data, which is seen higher at 60.0 vs. the prior release of 58.2. It is worth noting that the sentiment data is in a recovery mode after dropping to 50 in June. In the past two months, the confidence of consumers is returning led by a solid labor market and falling gasoline prices.
On the NZ front, higher-than-expected Business NZ PMI numbers are supporting the kiwi bulls. The economic data has landed higher at 54.9 against the forecasts of 52.5 and the prior release of 52.7. Next week, the critical trigger for the antipodean will be the interest rate decision by the People’s Bank of China (PBOC). The central bank is expected to trim its Prime Lending Rate (PLR) to scale up inflation. China’s monetary policy has a significant impact on kiwi bulls as NZ is a leading trading partner of China.
GBP/USD risks a deeper decline to the 1.1300 region once 1.1400 is cleared, suggest FX Strategists at UOB Group Lee Sue Ann and Quek Ser Leang.
Key Quotes
24-hour view: “Our expectations for GBP to ‘trade sideways within a range of 1.1500/1.1600’ were incorrect as GBP dropped to a low 1.1461 during NY session. Downward momentum is building quickly and GBP is likely to weaken further. That said, 1.1400 is a solid support and it is left seen if GBP can break this level today. Resistance is a 1.1495 followed by 1.1525.”
Next 1-3 weeks: “Two days ago (14 Sep, spot at 1.1510), we indicated that while GBP is likely to stay under pressure, the chance for a break of the major support at 1.1400 is not high. GBP dropped to 1.1461 yesterday and downward momentum is improving and the risk of a break of 1.1400 has increased. A break of the solid support could potentially trigger a rapid sell-off as there is no significant support until 1.1300. On the upside, a breach of 1.1590 (‘strong resistance’ level was at 1.1630 yesterday) would indicate that the current weakness in GBP has stabilized.”
CME Group’s flash data for gold futures markets noted open interest increased for the second session in a row on Thursday, this time by around 8.3K contracts. Volume followed suit and rose by around 105.9K contracts, the largest single day advance since July 12.
Gold: Further weakness could revisit $1,572
Gold prices sold off sharply and printed new cycle lows near $1,660 on Thursday. The noticeable decline was on the back of rising open interest and volume and opened the door to the continuation of the downtrend in the very near term. That said, the next target of note appears at the April 2020 low at $1,572 per ounce troy.
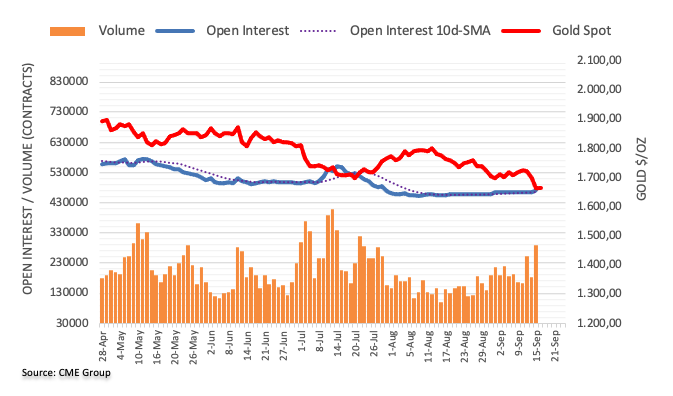
- Silver price remains sidelined after bouncing off 10-DMA.
- Bullish MACD signals, firmer RSI keeps buyers hopeful but upside remains elusive below the descending resistance line from June.
- Multiple supports to test bears before the yearly low.
Silver price (XAG/USD) seesaw around $19.15-20 during early Friday morning in Europe, fading the early Asian session bounce off the 10-DMA.
The bright metal’s latest inaction could be linked to the inability to cross the 50-DMA hurdle, around $19.25 by the press time. Even so, the bullish MACD signals and firmer RSI (14), keep the XAG/USD bulls hopeful.
That said, a downward sloping resistance line from June, around $19.90, appears a tough nut to crack for the bulls.
Following that, the 100-DMA level surrounding $20.35 acts as the last defense for the XAG/USD bears before directing the price towards the previous monthly peak near $20.90 and then to the $21.00 threshold.
Alternatively, pullback moves may initially aim for the 10-DMA support level of $18.90 before directing sellers towards the multiple supports around $18.25 and $18.10.
In the case where silver sellers keep reins past $18.10, the $18.00 round figure and the yearly bottom near $17.55 will be in focus.
Silver: Daily chart

Trend: Limited recovery expected
FX Strategists at UOB Group Lee Sue Ann and Quek Ser Leang note that a continuous decline below the 0.9900 level appears not favoured in EUR/USD.
Key Quotes
24-hour view: “We expected EUR to ‘trade sideways between 0.9950 and 1.0020’ yesterday. Our view for sideway-trading was correct even though EUR traded within a narrower range than expected (0.9954/1.0017). The price actions still appear to be part of a consolidation phase and we continue to expect EUR to trade sideways, albeit likely at a higher range of 0.9965/1.0040.”
Next 1-3 weeks: “EUR traded in a quiet manner the past couple of days and we continue to hold the same view as from Wednesday (14 Sep, spot at 0.9980). As highlighted, EUR is under pressure but at this stage, a sustained decline below the major support at 0.9900 appears unlikely. On the upside, a breach of 1.0070 (no change in ‘strong resistance’ level from yesterday) would indicate that the current downward pressure has eased.”
Although the US Dollar Index (DXY) appears overbought, market strategists stay bullish on the greenback’s gauge versus the six major currencies ahead of preliminary readings of the Michigan Consumer Sentiment Index (CSI) and the next week’s Federal Open Market Committee (FOMC) meeting.
“An overvalued dollar is now the only possible hedge for what’s turning into the biggest destruction of shareholder value since the global financial crisis, according to macro strategists at Citigroup Inc.” reported Bloomberg.
The update also mentioned, “With global equities already down $23 trillion in 2022, the greenback’s inverse relationship to risk assets makes it the only game in town for at least the rest of the year, the strategists wrote in a note dated Sept. 15.”
“It would take a ‘deep recession’ to push US inflation significantly lower, implying a prolonged drop in corporate profits and equities before the Federal Reserve pivots,” stated the Citibank per Bloomberg.
Also read: US Dollar Index bulls approach 110.00 with eyes on Michigan CSI, Fed
- Aussie bulls have defended further downside after picking bids around 0.6680-0.6700 demand zone.
- Declining 20-EMA at 0.6816 favor further weakness in the counter.
- A decline into the bearish range by the RSI (14) will result in a fresh two-year low.
The AUD/USD pair has extended its recovery after overstepping the round-level hurdle of 0.6700 in the Tokyo session. The asset is advancing sharply and is expected to display a sustained pullback. On a broader note, the asset is defending its two-year low at around 0.6680.
The asset has attempted a firmer rebound after sensing a decent buying interest around the demand zone placed in a narrow range of 0.6680-0.6700 on a daily scale. The downward-sloping trendline paced from August 15 high at 0.7125 will act as a major hurdle for the aussie bulls.
The declining 20-period Exponential Moving Average (EMA) at 0.6816 favors the downside bias. Also, the Relative Strength Index (RSI) (14) is on the verge of slipping into the bearish range of 20.00-40.00, which will trigger a downside momentum.
A contra bet at this juncture could create a fortune for the market participants. A minor correction towards an intraday cushion around 0.6710 could be capitalized for initiating longs, which will send the asset towards Thursday’s high at 0.6770, followed by August 29 low at 0.6841.
Alternatively, a break below the above-mentioned demand zone will drag the asset towards the round-level support at 0.6600. A slippage below the latter will drag the asset towards 25 May 2020 low at 0.6520.
AUD/USD daily chart
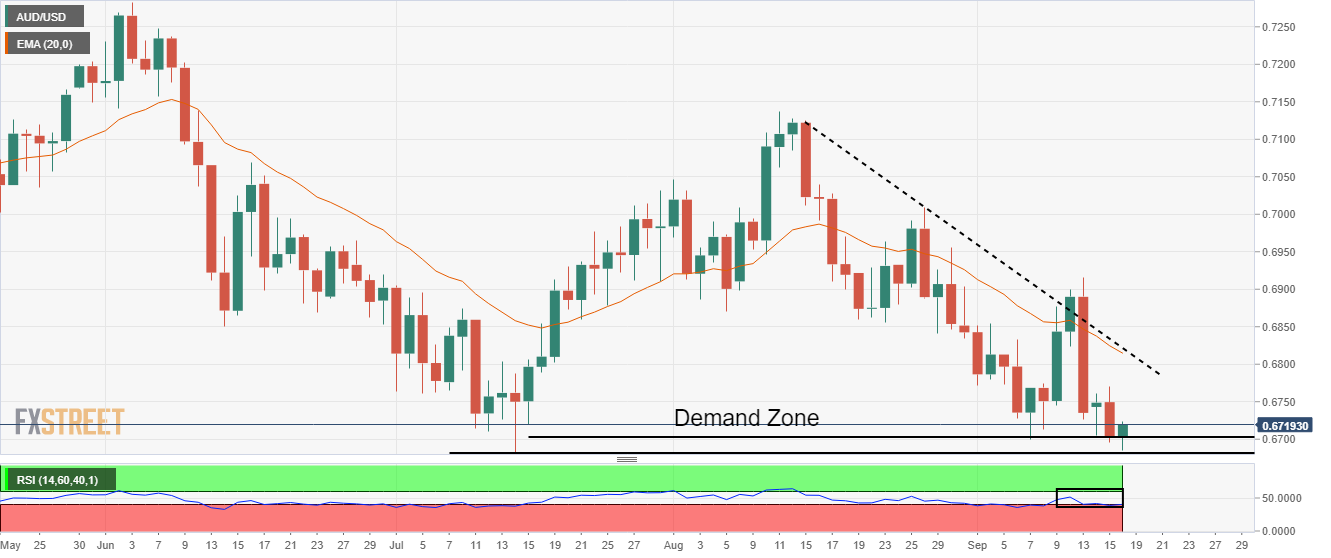
- USD/JPY consolidates weekly gains around two-decade high, sidelined of late.
- Three-day holiday in Tokyo adds strength to yen’s importer demand.
- Risk catalysts, yields could entertain traders ahead of next week’s FOMC.
USD/JPY remains sidelined while consolidating the recent gains, the fifth weekly uptrend, as traders await key data/events amid a sluggish session and cautious mood heading into Friday’s European open.
“Good Japanese importer demand ahead of Tokyo 3-day weekend,” mentioned Reuters as one of the key catalysts behind the latest pullback in the USD/JPY prices.
The latest readings of the hawkish Fed bets from the CME’s FedWatch Tool suggest the market priced in the Fed’s 0.75% and 1.0% rate hikes during the next week’s Fed meeting with 77% and 23% chances. The firmer odds could be linked to the US Retail Sales which rose 0.3% in August versus 0.0% expected and July’s revised down -0.4%. Further, NY Fed Empire State Manufacturing Index improved to -1.5 in September compared to -31.3 in August and the market expectation of -13. Alternatively, Philadelphia Fed Manufacturing Index declined to -9.9 for the said month compared to 2.8 expected and 6.2 prior. Additionally, US Industrial Production slid to -0.2% in August versus a market expectation for an expansion of 0.1% and downwardly revised prior to 0.5%.
Even so, the US 10-year Treasury yields dropped 1.0 basis point (bp) to 3.455% by the press time, after rising 1.38% the previous day.
It should be noted that the comments from Japanese policymakers and the market’s cautious mood ahead of the next week’s Federal Open Market Committee (FOMC) also challenge the USD/JPY pair’s immediate moves. That said, “If sharp yen moves persist, we will take necessary action without ruling out any options,” said Japanese Finance Minister Shunichi Suzuki.
On Thursday, Japan’s ruling Liberal Democratic Party's (LDP) Policy Chief Koichi Hagiuda called for an additional stimulus package worth over JPY 30 trillion ($208.97 billion) to tackle the inflation and weak yen problem, Sankei newspaper reported.
Against this backdrop, S&P 500 Futures track Wall Street’s losses while the prices of oil and gold stabilize.
Moving on, preliminary readings of the Michigan Consumer Sentiment Index (CSI), expected 60 versus 58.2 prior, will be crucial for intraday directions. Also important to watch will be the chatters surrounding the BOJ, China and Europe. However, major attention will be on the next week’s Fed meeting.
Technical analysis
A five-week-old ascending support line, around 143.00 by the press time, restricts the short-term USD/JPY downside. The upside momentum, however, needs validation from the double tops near 145.00 to retake control.
- Steel price remains pressured for the third consecutive day.
- China marked 3.0% increase in steel production, also reports upbeat Industrial Production, Retail Sales.
- Fed rate hike bets remain strong amid firmer US data, yields.
- Metal traders can keep bearish bias intact ahead of next week’s FOMC.
Steel price holds lower ground, printing a three-day downtrend heading into Friday’s London open, as recession woes join China’s higher steel output. Also weighing on the metal prices could be the market’s calls for the US Federal Reserve’s (Fed) aggression.
That said, the most active contracts of steel rebar futures on the Shanghai Futures Exchange (SFE), as well as the London Metal Exchange (LME), dropped near 1.0% and 0.35% in that order by the press time.
“The world's top steelmaker churned out 83.87 million tonnes of the metal last month, according to data from the National Bureau of Statistics (NBS) on Friday, up from 81.43 million tonnes in July,” per Reuters. On a bit broader horizon, the steel output in China during the January-August period dropped 5.7% to 693.15 million tonnes.
China’s Industrial Production rose 4.2% YoY versus 3.8% expected and prior while Retail Sales rose past 3.5% market expectations and 2.7% prior to 5.4%. Reuters also said, “China's new home prices fell in August at the fastest pace since November 2021 as its property sector was plagued by weak demand, a mortgage boycott and strict COVID-19 restrictions.”
Other than the higher steel production amid the economic slowdown fears, the risk-negative headlines surrounding China and Europe also propel the USD/CNH prices. That said, Reuters came out with the news stating that US President Joe Biden to hit China with broader curbs on US chip and tool exports. Previously, Bloomberg ran a piece suggesting that China is likely to witness harder days than it witnessed in 2020. On the same line was the news surrounding the Sino-American tussles and the People’s Bank of China’s (PBOC) inaction.
Elsewhere, the latest readings of the hawkish Fed bets from the CME’s FedWatch Tool suggest the market priced in the Fed’s 0.75% and 1.0% rate hikes during the next week’s Fed meeting with 77% and 23% chances. The firmer odds could be linked to the US Retail Sales which rose 0.3% in August versus 0.0% expected and July’s revised down -0.4%. Further, NY Fed Empire State Manufacturing Index improved to -1.5 in September compared to -31.3 in August and the market expectation of -13. Alternatively, Philadelphia Fed Manufacturing Index declined to -9.9 for the said month compared to 2.8 expected and 6.2 prior. Additionally, US Industrial Production slid to -0.2% in August versus a market expectation for an expansion of 0.1% and downwardly revised prior to 0.5%.
Moving on, higher output, recession woes and hawkish Fed bets could weigh on the steel prices ahead of the preliminary readings of the Michigan Consumer Sentiment Index (CSI), expected 60 versus 58.2 prior. Above all, next week's Federal Open Market Committee (FOMC) will be a crucial event for the metal traders to watch for fresh impulse.
- Asian equities have slipped for the second day following weak trends in the US markets.
- China’s NBS see a pick-up in overall demand and core CPI sooner.
- BOJ’s worry about the depreciating yen has entrenched Nikkei225.
Markets in the Asian domain are displaying a vulnerable performance consecutively, following the footprints of Wall Street as US stocks are facing the sell-off amid soaring odds of a bumper rate hike by the Federal Reserve (Fed).
At the press time, Japan’s Nikkei225 drops 1.09%, ChinaA50 tumbles 1.36%, and Hang Seng eased 0.47%.
Chinese equities are witnessing an intense sell-off despite the positive commentary from the National Bureau of Statistics (NBS). The agency has cited that China's domestic demand is recovering slower than supply. It is difficult to justify whether demand is subdued or supply is gearing faster. However, the agency assures that demand will pick up at a decent pace and low core Consumer Price Index (CPI) will scale better.
Meanwhile, Japanese equities have turned volatile as the Bank of Japan (BOJ)’s warning of intervention in Fx moves has cleared that the depreciating yen is becoming a nightmare for the economy. Companies that are highly dependent on the import of inputs are facing currency risk and are failing to pass on the impact to the end consumers, which is forcing them to halt their operating activities.
The US dollar index (DXY) has recovered its morning losses ahead of the US Michigan Consumer Sentiment Index data. The sentiment data is seen higher at 60 against the prior release of 58.2.
On the oil front, oil prices have been established below $85.00 and are expecting more weakness as Energy Information Administration (EIA) is continuously displaying a build-up of oil inventories. This indicates declining oil demand in the US and soaring odds for a Fed’s bumper rate hike will trim demand further.
- Gold price is licking its wounds after Thursday’s over $30 meltdown.
- The US dollar, yields rally capitalize on big Fed rate hike expectations.
- XAU/USD’s path of least resistance appears down, with eyes on $1,758 and $1,751.
Gold price remains vulnerable amid the hawkish Fed narrative, with hefty rate hikes on the cards in the coming months. Hotter than expected US inflation combined with an unexpected rebound in Retail Sales have convinced markets that higher rates are likely to remain longer, propping up the US dollar alongside the Treasury yields. Rates on the US government bonds across the time horizon remain at multi-month highs, boding ill for the non-yielding gold. Further, India announced a cut in its base import price for gold along with a few other commodities, which renders negative for the metal while China's demand concerns still persist, despite an unexpected growth in the country’s economic activity. Looking ahead, gold bulls could seek a temporary reprieve from the position readjustment ahead of next week’s Fed decision. The end-of-the-week flows could also come into play./
Also read: Gold Price Forecast: Pre-FOMC adjustments could trigger a brief rebound in XAU/USD
Gold Price: Key levels to watch
The Technical Confluence Detector shows that the gold price is looking for a sustained move below the previous day’s low of $1,660.
Selling pressure will intensify below the latter, calling for a test of the pivot point one-week S3 at $1,658.
A fresh downswing towards the pivot point one-day S1 at $1,651 will ensue.
On the flip side, XAU bulls could face a strong hurdle at $1,668 on the road to recovery. That level is the convergence of the Fibonacci 161.8% one-week and Fibonacci 23.6% one-day.
Further up, the Fibonacci 38.2% one-day at $1,675 will challenge bearish commitments. The confluence of the previous year’s low and the pivot point one-month around $1,678 will be the level to beat for gold buyers.
Here is how it looks on the tool
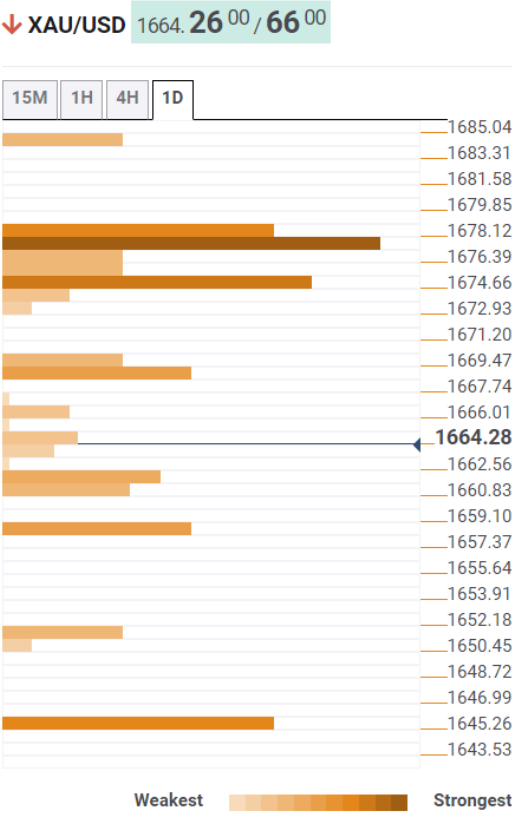
About Technical Confluences Detector
The TCD (Technical Confluences Detector) is a tool to locate and point out those price levels where there is a congestion of indicators, moving averages, Fibonacci levels, Pivot Points, etc. If you are a short-term trader, you will find entry points for counter-trend strategies and hunt a few points at a time. If you are a medium-to-long-term trader, this tool will allow you to know in advance the price levels where a medium-to-long-term trend may stop and rest, where to unwind positions, or where to increase your position size.
- USD/CAD remains sidelined at the highest levels since November 2020.
- RSI (14) conditions, 61.8% FE probe bulls, sellers need validation from two-month-old previous resistance.
- 78.6% FE, late 2020 peak could lure buyers beyond 1.3250.
USD/CAD bulls take a breather at the 22-month high, sidelined around 1.3240 during early Friday morning in Europe, as overbought RSI (14) and a short-term key hurdle challenge further upside of the Loonie pair.
That said, the 61.8% Fibonacci Expansion (FE) of the pair’s moves between August 11 and September 13, close to 1.3250, restricts the quote’s immediate upside.
Even so, successful trading beyond the previous resistance line from mid-July, now support around 1.3200, keeps the USD/CAD buyers hopeful.
That said, the 78.6% FE level near 1.3330 could lure the pair bulls should the prices rally beyond the 1.3250 immediate hurdle. Following that, October 2020 high near 1.3390 will be in focus.
Alternatively, a downside break of the 1.3200 resistance-turned-support could quickly fetch the USD/CAD pair towards the mid-week low of around 1.3150.
Though, the late August swing high and the 200-SMA, respectively near 1.3060 and 1.2990, could challenge the Loonie pair’s further downside.
USD/CAD: Four-hour chart
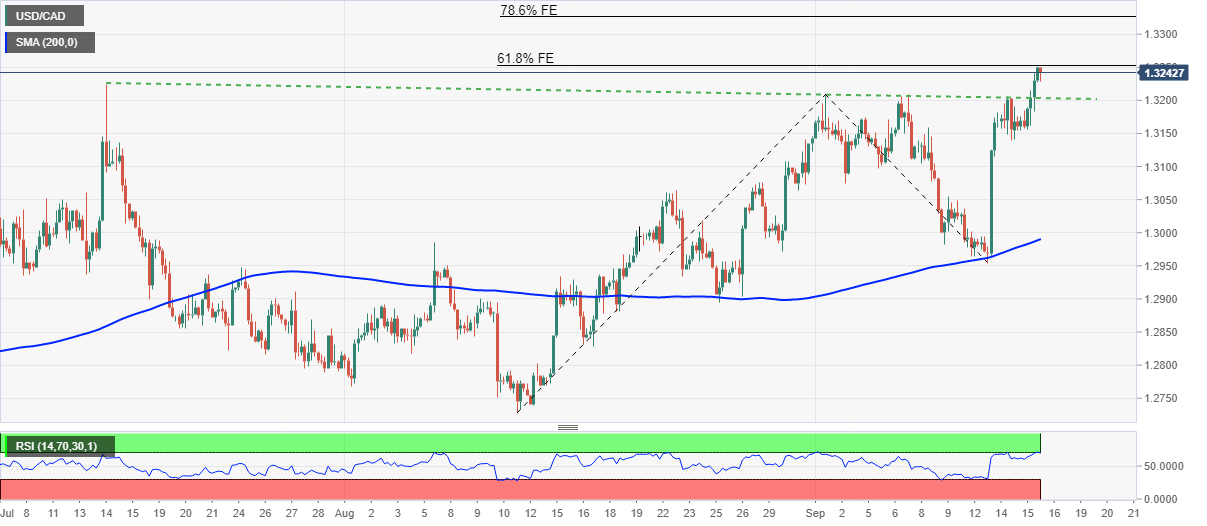
Trend: Pullback expected
- GBP/USD holds lower ground at the yearly low marked in the last week.
- Sluggish yields, short-term technical hurdle probes US dollar bulls ahead of data.
- Hawkish Fed bets jostle with the BOE concerns amid record high UK inflation expectations.
- UK Retail Sales for August, Preliminary Michigan CSI for September will offer immediate direction ahead of next week’s FOMC.
GBP/USD treads water around 1.1460 as bulls and bears jostle ahead of the key UK/US data on Friday. The Cable pair’s latest inaction could also be linked to the recently increasing hawkish bias for the Bank of England (BOE), as well as the firmer odds of the Fed’s aggression.
Record high inflation expectations in the UK, as well as the increasing confidence in the BOE, challenge the GBP/USD bears of late. The quarterly survey conducted by the Bank of England (BOE)/ Ipsos showed that the public's year-ahead inflation expectations jumped to an all-time high of 4.9% for 2023. Also, the net public confidence in BOE-7% vs -3% in May.
Also positive for the GBP/USD prices are the headlines surrounding Brexit as the UK told the European Union (EU) that the border checks between Northern Ireland and the rest of the UK will remain suspended despite legal threats from Brussels, per the UK’s Daily Mail.
On other hand, the US Dollar Index (DXY) retreats to 109.60 as the US 10-year Treasury yields dropped 1.7 basis points to 3.442% after rising 1.38% the previous day.
Even so, the latest readings of the hawkish Fed bets from the CME’s FedWatch Tool suggest the market priced in the Fed’s 0.75% and 1.0% rate hikes during the next week’s Fed meeting with 77% and 23% chances, which in turn keeps DXY bulls hopeful.
Additionally, the risk-negative headlines surrounding China and Europe also favor the GBP/USD bears. That said, Reuters came out with the news stating that US President Joe Biden to hit China with broader curbs on US chip and tool exports. Previously, Bloomberg ran a piece suggesting that China is likely to witness harder days than it witnessed in 2020. On the same line was the news surrounding the Sino-American tussles and the People’s Bank of China’s (PBOC) inaction. Elsewhere, fears that the Eurozone will remain in dire conditions despite having a good stock for winter joined hawkish comments from the European Central Bank (ECB) policymakers to keep the oil traders as pessimists.
Amid these plays, S&P 500 Futures track Wall Street’s losses while the prices of oil and gold stabilize.
Moving on, UK Retail Sales for August, expected -0.5% MoM versus 0.3% prior, will be crucial for the GBP/USD pair considering its lion's share in the UK Gross Domestic Product (GDP). Should the figures manage to offer a positive surprise, the quote could extend the latest rebound.
Though, preliminary readings of the Michigan Consumer Sentiment Index (CSI), expected 60 versus 58.2 prior, will be crucial for intraday directions. Above, the chatters surrounding the UK’s politics and Brexit, as well as the Fed, are crucial for the pair traders to watch for fresh impulse.
Technical analysis
The GBP/USD pair’s U-turn from the 21-DMA, around 1.1650 by the press time, directs the bears towards refreshing the yearly low. As a result, a four-month-old downward sloping support line near 1.1330 gains the market’s attention.
- EUR/USD is juggling around 1.0000 as investors await US Michigan CSI data.
- An upbeat US Retail Sales data will strengthen the Fed in tightening policy further.
- The Eurozone energy crisis is deepening further ahead of the winter season.
The EUR/USD pair is continuously oscillating around the critical figure of 1.0000 amid the unavailability of any potential trigger that could direct a decisive move. Generally, after falling like a house of cards, assets take sufficient time to build a ground for decisive moves. Considering the unavailability of a decent pullback move, the asset is expected to deliver a downside break.
On Thursday, the US dollar index (DXY) hold itself at elevated levels after the release of upbeat Retail Sales data. The economic data landed at 0.3%, higher than the expectations of 0% and the prior release of -0.4%.
The Federal Reserve (Fed) is bound to bring price stability even at the sacrifice of employment generation, growth prospects, and investments. As price pressures are not responding effectively to rising interest rates, it will force the Fed to tighten its policy further. Therefore, chances for a full percent rate hike have advanced significantly. Also, a rebound in retail demand will delight the Fed to restrict monetary policy with full power unhesitatingly.
The US economy will conclude the week with the release of the US Michigan Consumer Sentiment Index, which is seen higher at 60 against the prior release of 58.2. A higher-than-expected reading will strengthen the greenback bulls further.
On the Eurozone front, investors are gearing up for further policy tightening measures. European Central Bank (ECB) policymakers have admitted that the central bank underestimated the pace of inflation and is now facing extreme hurdles in containing the same. This has soared fears of stagflation. Also, the deepening energy crisis ahead of the winter season will keep the shared currency bulls on the tenterhooks.
- A test of a VCP pattern displays the strength of the cross.
- Advancing 50-EMA at 95.00 adds to the upside filters.
- Aussie bulls will drive the asset towards 100.00 after a break above 98.58.
The AUD/JPY pair has attempted a rebound after slipping below the critical support of 96.00 in the Tokyo session. The pair has continued its three-day losing streak after dropping below Wednesday’s low at 95.98. On a broader note, the cross has witnessed an intense sell-off after failing to sustain above the critical hurdle of 98.00.
On a daily scale, a firmer rally after an upside break of the symmetrical triangle has exhausted and a downside move has been observed. A breakout of a volatility contraction pattern has to deliver various tests before joining the bulls’ party. These corrective tests decline where the smart money is allocated by institutional investors.
The asset has already corrected to a 20-period Exponential Moving Average (EMA) at 96.00 but may find reversal action sooner. Also, the 50-EMA at 95.00 is advancing, which adds to the upside filters.
Meanwhile, the Relative Strength Index (RSI (14) has shifted into the 40.00-60.00 but that doesn’t warrant a bearish reversal.
Should the asset break above Thursday’s high at 97.13, aussie bulls will drive the asset towards Tuesday’s high of 98.58. A breach of the latter will drive the cross to its ultimate target of 100.00.
On the contrary, a decisive drop below August 24 low at 94.20 will drag the asset towards August 15 low at 93.07, followed by July 11 low at 92.31.
AUD/JPY daily chart
-637988937870108698.png)
| Raw materials | Closed | Change, % |
|---|---|---|
| Silver | 19.169 | -2.33 |
| Gold | 1664.16 | -1.96 |
| Palladium | 2134.65 | -0.95 |
- USD/CNH remains firmer near the highest levels since July 2020, retreats from top of late.
- China’s August month Industrial Production, Retail Sales and housing data came in firmer.
- Pullback in the US Treasury yields seems to test the buyers amid a sluggish session.
- Second-tier US numbers eyed ahead of the next week’s FOMC.
USD/CNH bulls keep reins around the highest levels in 26 months, despite the latest pullback from the multi-day top, as hawkish Fed bets supersede China’s upbeat data during Friday’s Asian session.
China’s Industrial Production rose 4.2% YoY versus 3.8% expected and prior while Retail Sales rose past 3.5% market expectations and 2.7% prior to 5.4%. Further, Reuters said, “China's new home prices fell in August at the fastest pace since November 2021 as its property sector was plagued by weak demand, a mortgage boycott and strict COVID-19 restrictions.” That said, the consolidation of the US Treasury yields and the sluggish session also seems to challenge the USD/CNH buyers around the two-year top.
However, the latest readings of the hawkish Fed bets from the CME’s FedWatch Tool suggest the market priced in the Fed’s 0.75% and 1.0% rate hikes during the next week’s Fed meeting with 77% and 23% chances.
Other than the hawkish Fed bets, the risk-negative headlines surrounding China and Europe also propel the USD/CNH prices. That said, Reuters came out with the news stating that US President Joe Biden to hit China with broader curbs on US chip and tool exports. Previously, Bloomberg ran a piece suggesting that China is likely to witness harder days than it witnessed in 2020. On the same line was the news surrounding the Sino-American tussles and the People’s Bank of China’s (PBOC) inaction. Elsewhere, fears that the Eurozone will remain in dire conditions despite having a good stock for winter joined hawkish comments from the European Central Bank (ECB) policymakers to keep the oil traders as pessimists.
Amid these plays, S&P 500 Futures track Wall Street’s losses while the prices of oil and gold improve while the US Dollar Index (DXY) retreats to 109.60.
Looking forward, preliminary readings of the Michigan Consumer Sentiment Index (CSI), expected 60 versus 58.2 prior, will be crucial for intraday directions. Also important to watch will be the chatters surrounding China and Europe. However, major attention will be on the next week’s Fed meeting.
Technical analysis
USD/CNH is well on the way to 7.0370-400 resistance zone, comprising the lows marked during April and June 2020, unless it drops back below the previous weekly top near 6.9970.
Following the release of the August activity numbers, China’s National Bureau of Statistics (NBS) released a statement, via Reuters, expressing their view on the economy.
Key quotes
Main indicators show positive changes, but the foundation of economic recoveries is still not solid.
China economy continues recovery trend in Aug despite some factors exceeded expectations.
Improvement in economic performance in Aug 'hard won'.
Recovery in domestic demand still lags behind recovery in production.
Expects domestic demand to pick up, situation of low core CPI may change.
more to come ...
Related reads
- China’s August Retail Sales and Industrial Output surprise positively
- AUD/USD struggles to defend 0.6700 amid upbeat China data, focus on Michigan CSI, Fed
- AUD/USD keeps early Asian session rebound amid upbeat data from Australia’s biggest customer.
- China’s Industrial Production, Retail Sales flashed firmer data for August.
- RBA’s Lowe defends recent rate hikes, praises economic conditions while favoring slower rate hike at some point.
- Risk catalysts, second-tier US will be important ahead of the key FOMC.
AUD/USD treads water around the 0.6700 threshold as mixed catalysts test the bears around the yearly low during Friday’s Asian session. The Aussie pair’s latest hesitance to welcome sellers could be linked to China data.
That said, China’s Industrial Production rose 4.2% YoY versus 3.8% expected and prior while Retail Sales rose past 3.5% market expectations and 2.7% prior to 5.4%. Further, Reuters said, “China's new home prices fell in August at the fastest pace since November 2021 as its property sector was plagued by weak demand, a mortgage boycott and strict COVID-19 restrictions.”
Also read: China’s August Retail Sales and Industrial Output surprise positively
Earlier in the day, Reserve Bank of Australia (RBA) Governor Philip Lowe crossed wires, via Reuters, as he presented a Testimony in front of the Aussie parliament. In doing so, RBA’s Lowe tried defending the aggressive rate hikes while saying, “Now that inflation is as high as it is, we need to make sure that inflation returns to target in a reasonable time.” The policymaker also stated that Australia in much better position than Fed because wages still contained.
Following the update, Bloomberg said, “Australia’s central bank chief Philip Lowe said the case for outsized interest-rate increases has “diminished” now that the cash rate is approaching “more normal settings,” suggesting smaller moves ahead.”
Although the aforementioned catalysts challenge the AUD/USD pair’s downside moves, the bears keep reins amid hawkish Fed bets and firmer US data, not to forget upbeat yields. That said, the latest readings of the hawkish Fed bets from the CME’s FedWatch Tool suggest the market priced in the Fed’s 0.75% and 1.0% rate hikes during the next week’s FOMC with 77% and 23% chances.
Amid these plays, S&P 500 Futures drop 0.65% intraday by the press time, poking the one-week low around 3,990 while the US 10-year Treasury yields dropped 1.7 basis points to 3.442% after rising 1.38% the previous day.
Moving on, preliminary readings of the Michigan Consumer Sentiment Index (CSI), expected 60 versus 58.2 prior, will be crucial for intraday directions. However, major attention will be on the next week’s Fed meeting. Also important to watch will be the chatters surrounding China and Europe.
Technical analysis
AUD/USD buyers need a clear upside break of May’s low near 0.6830 to lure short-term buyers. However, a four-month-old bearish channel between 0.7060 and 0.6535 could keep the pair sellers hopeful.
China’s August Retail Sales YoY, unexpectedly jumped to 5.4% vs. 3.5% expected and 2.7% previous while Industrial Production YoY came in at 4.2% and 3.8% estimated and 3.8% prior.
Meanwhile, the Fixed Asset Investment YoY rises to 5.8% in August vs 5.5% expected and 5.7% last.
Earlier on, the House Price Index dropped 1.3% YoY in August when compared to a 0.9% decline seen in July. The monthly slump in prices was recorded at 0.29%.
Additional details
China Aug nationwide survey-based jobless rate at 5.3%.
China Aug survey-based jobless rate in 31 major cities at 5.4%.
China's economy created 8.98 million new urban jobs in Jan-Aug.
China Aug survey-based jobless rate for 16-24 years old at 18.7%.
Market reaction
The Australian dollar remains unfazed by the release of the unexpectedly strong Chinese data. The AUD/USD pair is holding steady on the day at 0.6700, as of writing.
Japanese Finance Minister Shunichi Suzuki is on the wires now, via Reuters, reiterating his take on the recent depreciation of the yen.
Key quotes
Important for fx to move stably reflecting economic fundamentals.
Sharp currency moves are undesirable.
Concerned about recent sharp, one-sided yen weakening.
If sharp yen moves persist, we will take necessary action without ruling out any options.
Want to closely watch FX moves.
Weak yen has both merits and demerits.
Market reaction
Despite the verbal intervention, the Japanese yen is keeping its pullback intact from session highs of 142.85 against the US dollar. The USD/JPY pair was last seen at 143.25, down 0.19% on the day.
US inflation expectations, as per the 10-year breakeven inflation rate per the St. Louis Federal Reserve (FRED) data, hold lower ground near the weekly bottom, which in turn challenges the Fed hawks ahead of the next week’s key Federal Open Market Committee (FOMC).
That said, the aforementioned inflation cursor eased to 2.43% by the end of Friday.
On the same line was the 5-year breakeven inflation rate per the FRED data, which also reversed from the weekly high to 2.57% at the latest.
Behind the moves could be the mixed US statistics. That said, US Retail Sales rose 0.3% in August versus 0.0% expected and July’s revised down -0.4%. Further, NY Fed Empire State Manufacturing Index improved to -1.5 in September compared to -31.3 in August and market expectation of -13. Alternatively, Philadelphia Fed Manufacturing Index declined to -9.9 for the said month compared to 2.8 expected and 6.2 prior. Additionally, US Industrial Production slid to -0.2% in August versus a market expectation for an expansion of 0.1% and downwardly revised prior to 0.5%.
Even so, the market’s hawkish Fed bets keep the US dollar buyers hopeful, which in turn challenges the commodity and Antipodeans. As per the latest readings of the hawkish Fed bets from the CME’s FedWatch Tool, the market priced in the Fed’s 0.75% and 1.0% rate hikes during the next week’s FOMC with 77% and 23% chances.
- The bird is firming following a significant sell-off.
- NZD/USD bulls eye a move into the 0.6000 area for the day ahead.
NZD/USD bulls have shown up in the final session of the week in Tokyo as the bird grounded in the mid-way point of the 0.59 area. The move was telegraphed in the following analysis and the prospects are for a correction of the bearing impulse into the 38.2% Fibonacci of the bearish impulse as follows:
NZD/USD prior analysis
The W-formation's support was cited as a key feature, but this gave way as the US dollar continue its reign for a little while longer before the bulls threw in the towel:
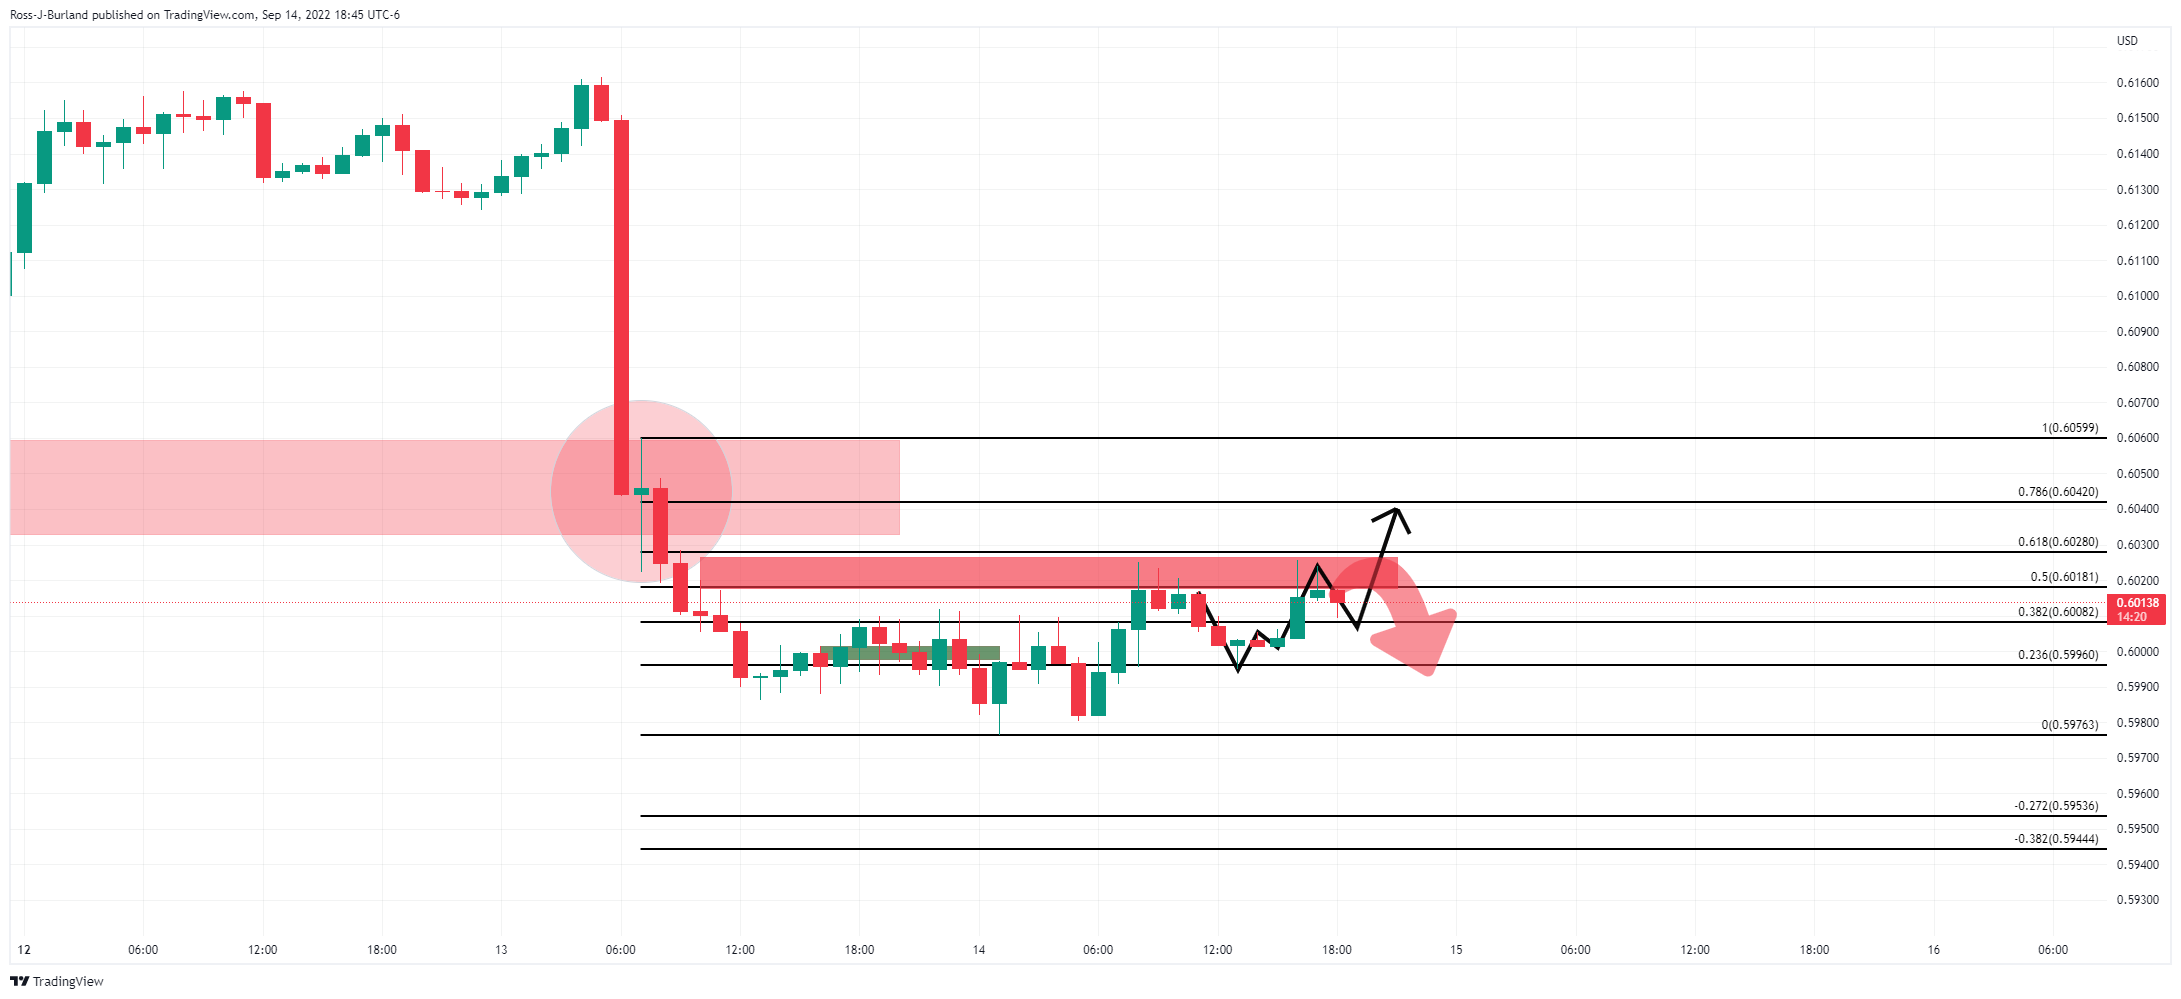
However, the bulls committed and headed into the structure and resistance near the 38.2% Fibonacci level ahead of a 50% retracement thereafter.
NZD/USD H4 chart
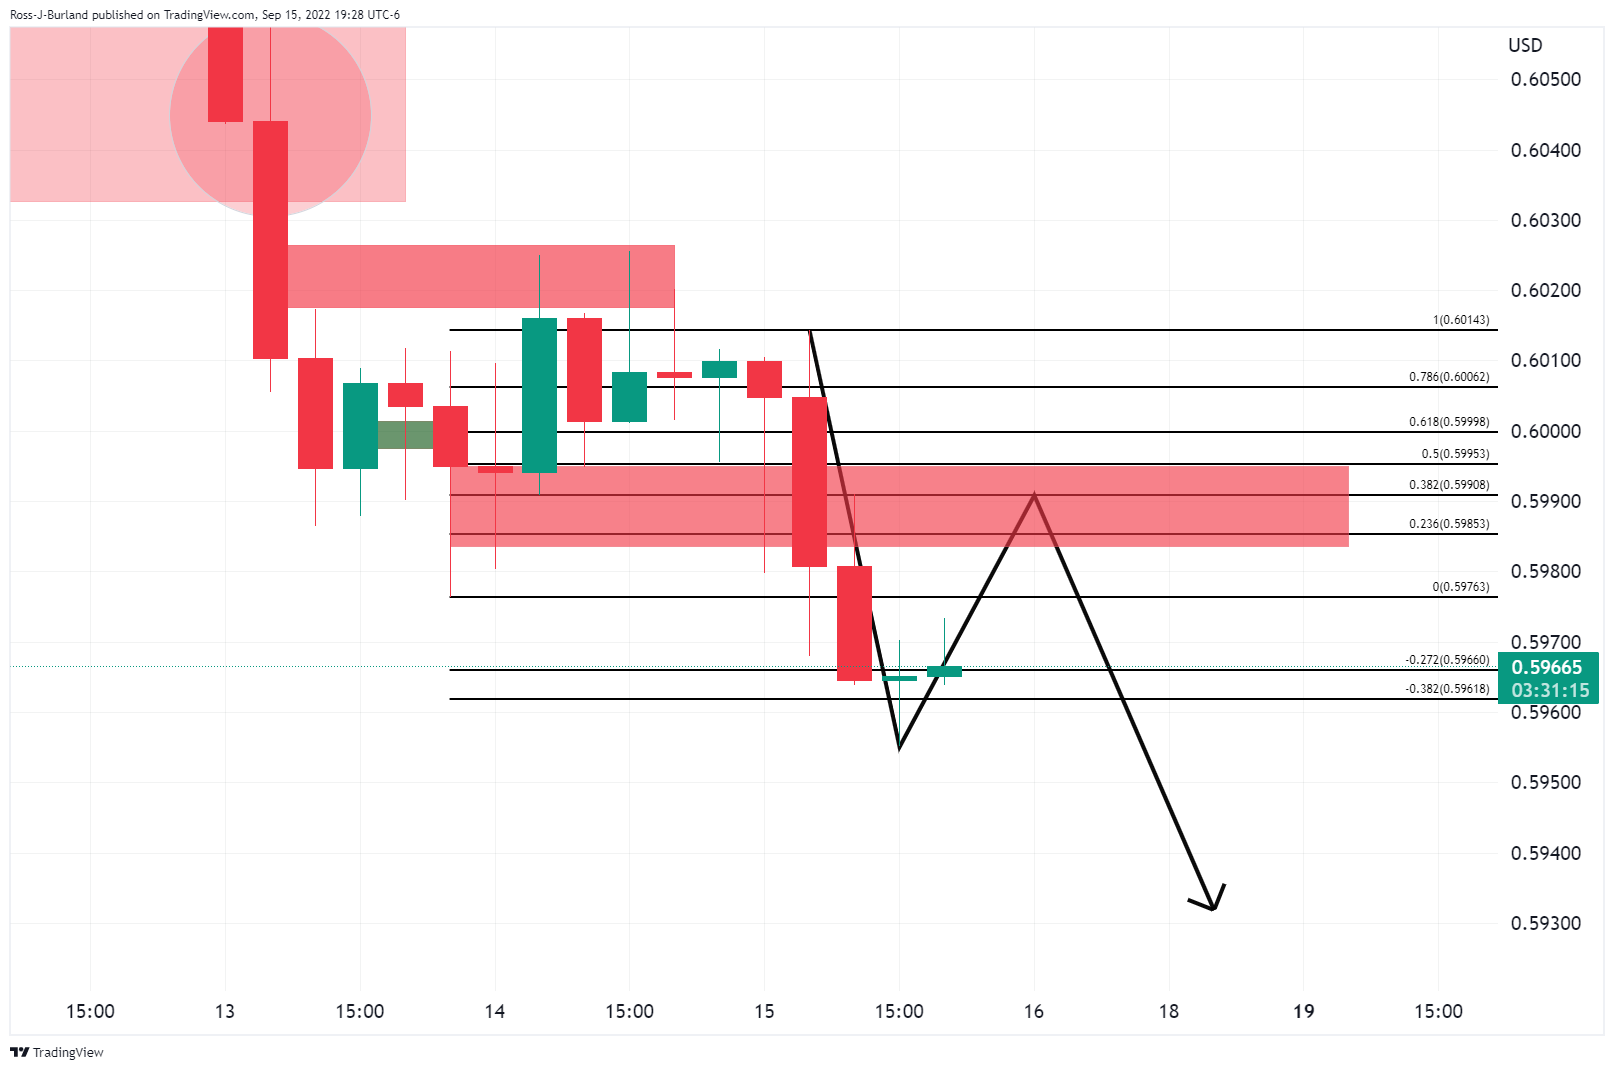
The price is now showing signs of a bullish correction for the session ahead with 0.6000 on the radar.
- Market sentiment remains sluggish despite a pullback in the bond coupons.
- Recession woes, hawkish Fed bets join China-linked headlines to weigh on sentiment.
- S&P 500 Futures stay pressured at weekly low, US 10-year Treasury yields ease.
- Preliminary readings of Michigan CSI for September will decorate calendar, next week’s FOMC is the key.
The risk profile remains unclear during Friday’s Asian session as the stock futures and equity benchmarks resist respecting a pullback in the US Treasury bond yields.
That said, S&P 500 Futures drop 0.65% intraday by the press time, poking the one-week low around 3,990 while the US 10-year Treasury yields dropped 1.7 basis points to 3.442% after rising 1.38% the previous day.
The latest pullback in the US bond coupons could best be considered as a consolidation in the market sentiment ahead of the preliminary readings of the Michigan Consumer Sentiment Index (CSI), expected 60 versus 58.2 prior. However, the risk appetite remains weak as firmer US data bolster the hawkish Fed bets amid recession fears.
US Retail Sales rose 0.3% in August versus 0.0% expected and July’s revised down -0.4%. Further, NY Fed Empire State Manufacturing Index improved to -1.5 in September compared to -31.3 in August and market expectation of -13. Alternatively, Philadelphia Fed Manufacturing Index declined to -9.9 for the said month compared to 2.8 expected and 6.2 prior. Additionally, US Industrial Production slid to -0.2% in August versus a market expectation for an expansion of 0.1% and downwardly revised prior to 0.5%.
Following the US data, the market priced in the Fed’s 0.75% and 1.0% rate hikes during the next week’s Federal Open Market Committee (FOMC), with 77% and 23% chances as per the CME’s FedWatch Tool.
Also, Reuters came out with the news stating that US President Joe Biden to hit China with broader curbs on US chip and tool exports. Previously, Bloomberg ran a piece suggesting that China is likely to witness harder days than it witnessed in 2020. On the same line was the news surrounding the Sino-American tussles and the People’s Bank of China’s (PBOC) inaction. Elsewhere, fears that the Eurozone will remain in dire conditions despite having a good stock for winter joined hawkish comments from the European Central Bank (ECB) policymakers to keep the oil traders as pessimists.
Overall, the risk-off mood is likely to prevail and can favor the US dollar, despite the recent pullback in the US Dollar Index (DXY) from the one-week-old resistance line. That said, the US Michigan CSI may offer intraday directions but major attention will be on the next week’s Fed meeting.
Also read: Forex Today: The greenback keeps on keeping on
- Gold price has slipped below the $1,661.18-1,667.78 demand zone on accelerating hawkish Fed bets.
- Long liquidation has brought a correction in the DXY.
- The US Michigan Consumer Sentiment Index is seen higher at 60 vs. 58.2 reported earlier.
Gold price (XAU/USD) is displaying a balanced profile in a narrow range of $1.661.51-1,666.76 after surrendering the critical support of $1,670.00 in the Tokyo session. The precious metal witnessed a vertical fall on Thursday after delivering a downside break of the consolidation formed in a $1,685.75-1,690.23 range. The yellow metal has refreshed its two-year low at $1,660.44 and is expected to witness more weakness amid soaring bets for a full percent rate hike by the Federal Reserve (Fed).
The Fed is bound to bring price stability to the economy even at the cost of growth prospects. As investors are aware of the fact that the headline Consumer Price Index (CPI) remained higher than expectations for August despite falling gasoline prices, the Fed is at least needed to keep the pace of hiking interest rates. As price pressures are not responding well to the current pace of rate hikes, the Fed is left with no other option than to lift interest rates by 100 basis points (bps).
Meanwhile, the US dollar index (DXY) is declining after displaying a lackluster performance, followed by a juggernaut rally. This could be the case of long liquidation as the upside bias is intact o higher consensus for US Michigan Consumer Sentiment Index. The sentiment data is seen higher at 60 vs. the prior release of 58.2.
Gold technical analysis
Gold price has delivered a downside break of the demand zone placed in a narrow range of $1,661.18-1,667.78 on a weekly scale. This will keep the yellow metal on the tenterhooks for a prolonged period. The precious metal has surrendered the 200-period Exponential Moving Average (EMA) at $1,692.64, which signals that the long-term trend has turned down.
Also, the Relative Strength Index (RSI) (14) has shifted inside the bearish range of 20.00-40.00, which has triggered a downside momentum.
Gold weekly chart
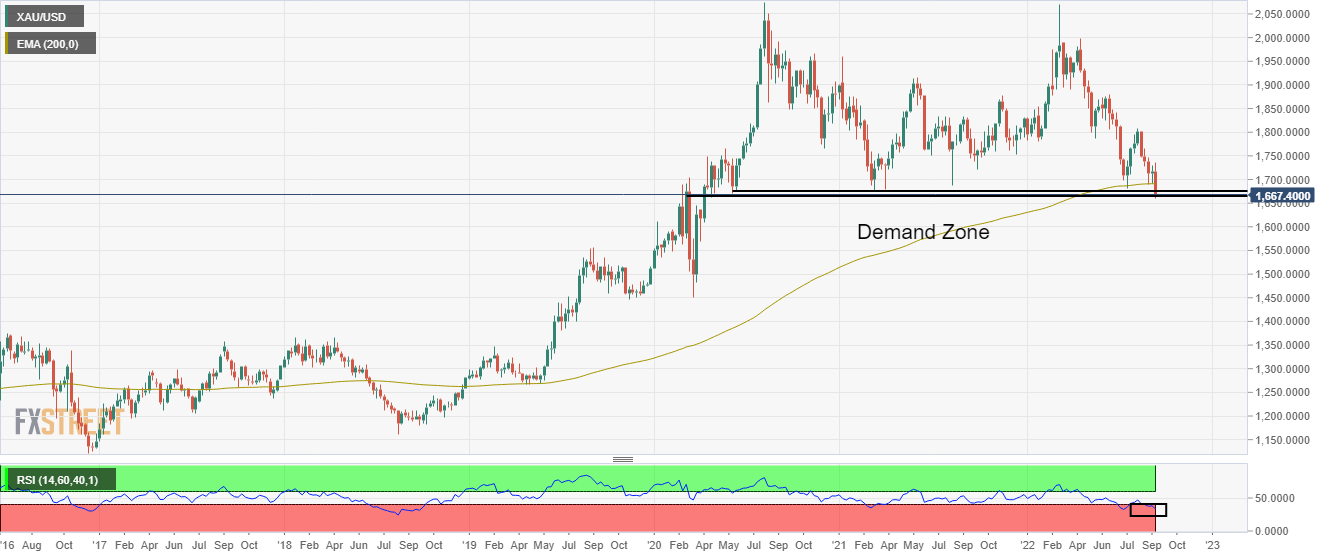
In recent trade today, the People’s Bank of China (PBOC) set the yuan (CNY) at 6.9305 vs. the estimate of 6.9228. Meanwhile, the yuan is trading at the lowest levels since July 2020.
About the fix
China maintains strict control of the yuan’s rate on the mainland.
The onshore yuan (CNY) differs from the offshore one (CNH) in trading restrictions, this last one is not as tightly controlled.
Each morning, the People’s Bank of China (PBOC) sets a so-called daily midpoint fix, based on the yuan’s previous day's closing level and quotations taken from the inter-bank dealer.
- WTI struggles to pares the biggest daily loss in a week, grinds around weekly bottom of late.
- US dollar pullback underpins corrective bounce of the black gold.
- Recession woes, no immediate strike in US and hawkish Fed bets favor oil bears.
WTI crude oil price edges lower during Friday’s Asian session, after falling the most in a week the previous day. That said, the black gold seesaws at around $84.50 by the press time.
The US dollar’s battle with the one-week-old resistance and a retreat in the Treasury yields seem to have tested the energy bears of late. Even so, fears of a recession keep the WTI sellers hopeful. Also likely to challenge the energy prices are the latest headlines suggesting escalation in the Sino-American tussles and pessimism in China, the world’s biggest industrial player.
That said, US Dollar Index (DXY) pare the previous day’s gains around 109.50 as the US 10-year Treasury yields dropped 1.7 basis points to 3.442% after rising 1.38% the previous day.
Elsewhere, Reuters came out with the news stating that US President Joe Biden to hit China with broader curbs on US chip and tool exports. Previously, Bloomberg ran a piece suggesting that China is likely to witness harder days than it witnessed in 2020. On the same line was the news surrounding the Sino-American tussles and the People’s Bank of China’s (PBOC) inaction. Elsewhere, fears that the Eurozone will remain in dire conditions despite having a good stock for winter joined hawkish comments from the European Central Bank (ECB) policymakers to keep the oil traders as pessimists.
Additionally, a tentative agreement that would avert a US rail strike joined updates from the US Department of Energy (DOE) to weigh on the oil prices. The DOE mentioned that their restocking of oil reserves would likely involve deliveries after the fiscal year 2023.
To sum up, oil prices remain on the bear’s radar despite the latest rebound. That said, China’s monthly data dump including the Industrial Production, Retail Sales and housing numbers for August could offer immediate directions. Following that, preliminary readings of the Michigan Consumer Sentiment Index (CSI) will be crucial for nearby directions.
Technical analysis
A clear U-turn from the 21-DMA, around $88.70 by the press time, directs WTI crude oil prices towards the monthly low near $80.95.
Economics at Societe Generale raised doubts on the ability of the Bank of Japan’s (BOJ) intervention to reverse the USD/JPY bull run while citing two needed conditions.
Among them, the BOJ’s abandonment of the curve control becomes the first.
Further, a recession unfolds in the US and causes US Treasury yields to fall was cited as the second necessary action for the USD/JPY to reverse.
It should be noted that the latest chatters over the BOJ intervention were also targeted by the analysts as, “Unilateral intervention could keep USD/JPY from scaling new highs but won’t be enough to reverse the downtrend.”
USD/JPY sellers attack 143.00
USD/JPY remains pressured around the intraday low near 143.00 while paring the consecutive fifth weekly gains.
Also read: USD/JPY oscillates around 143.50 as investors await fresh development on BOJ intervention
- The bulls have stepped in at a critical daily demand area.
- GBP/USD bears are lurking at ket 4-hour resistance.
GBP/USD bulls are stepping in from 1.1450 and the following illustrates the potential for a correction followed by a deeper move into the demand structure on the longer time frames.
GBP/USD daily chart
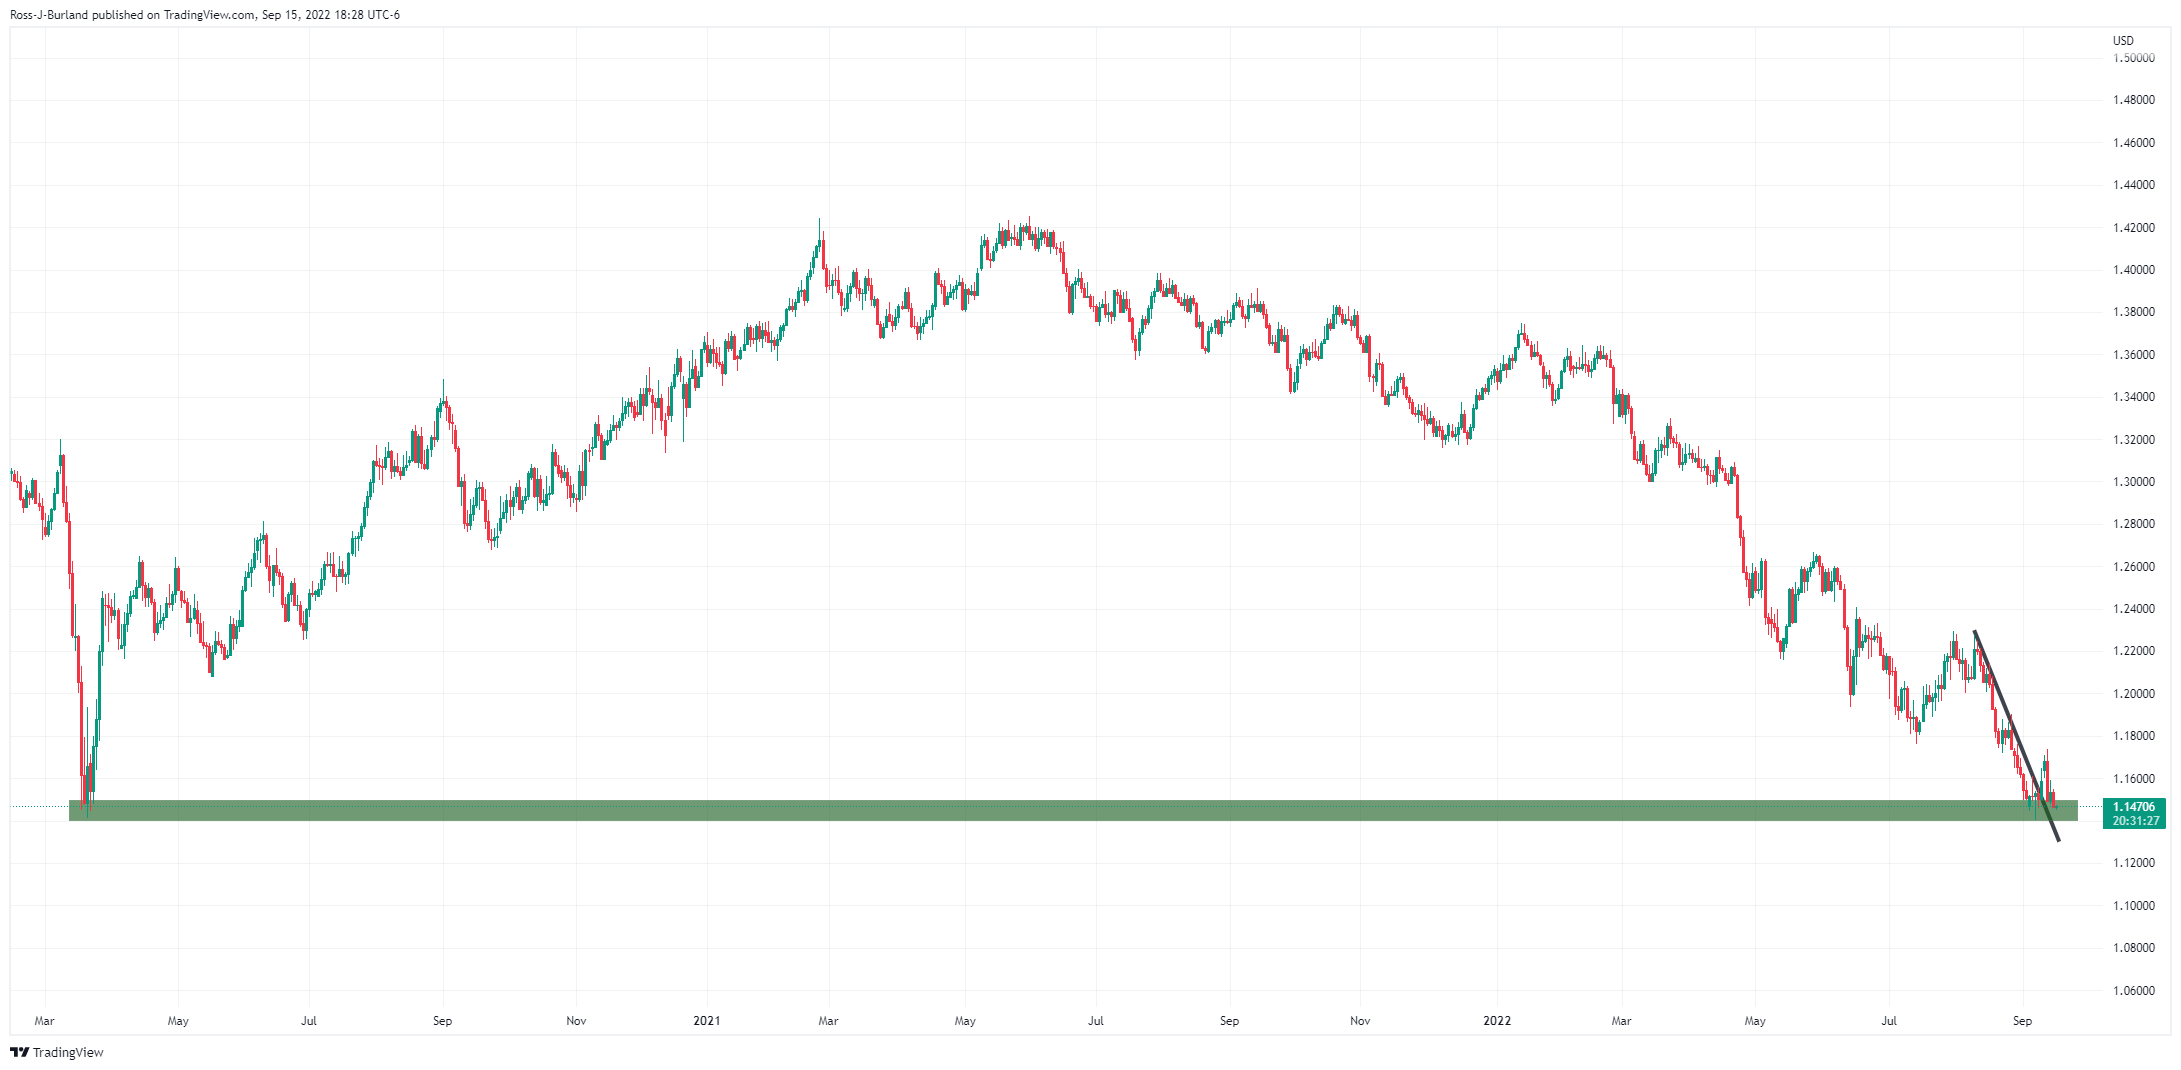
The daily chart shows that the price is at a critical demand area.
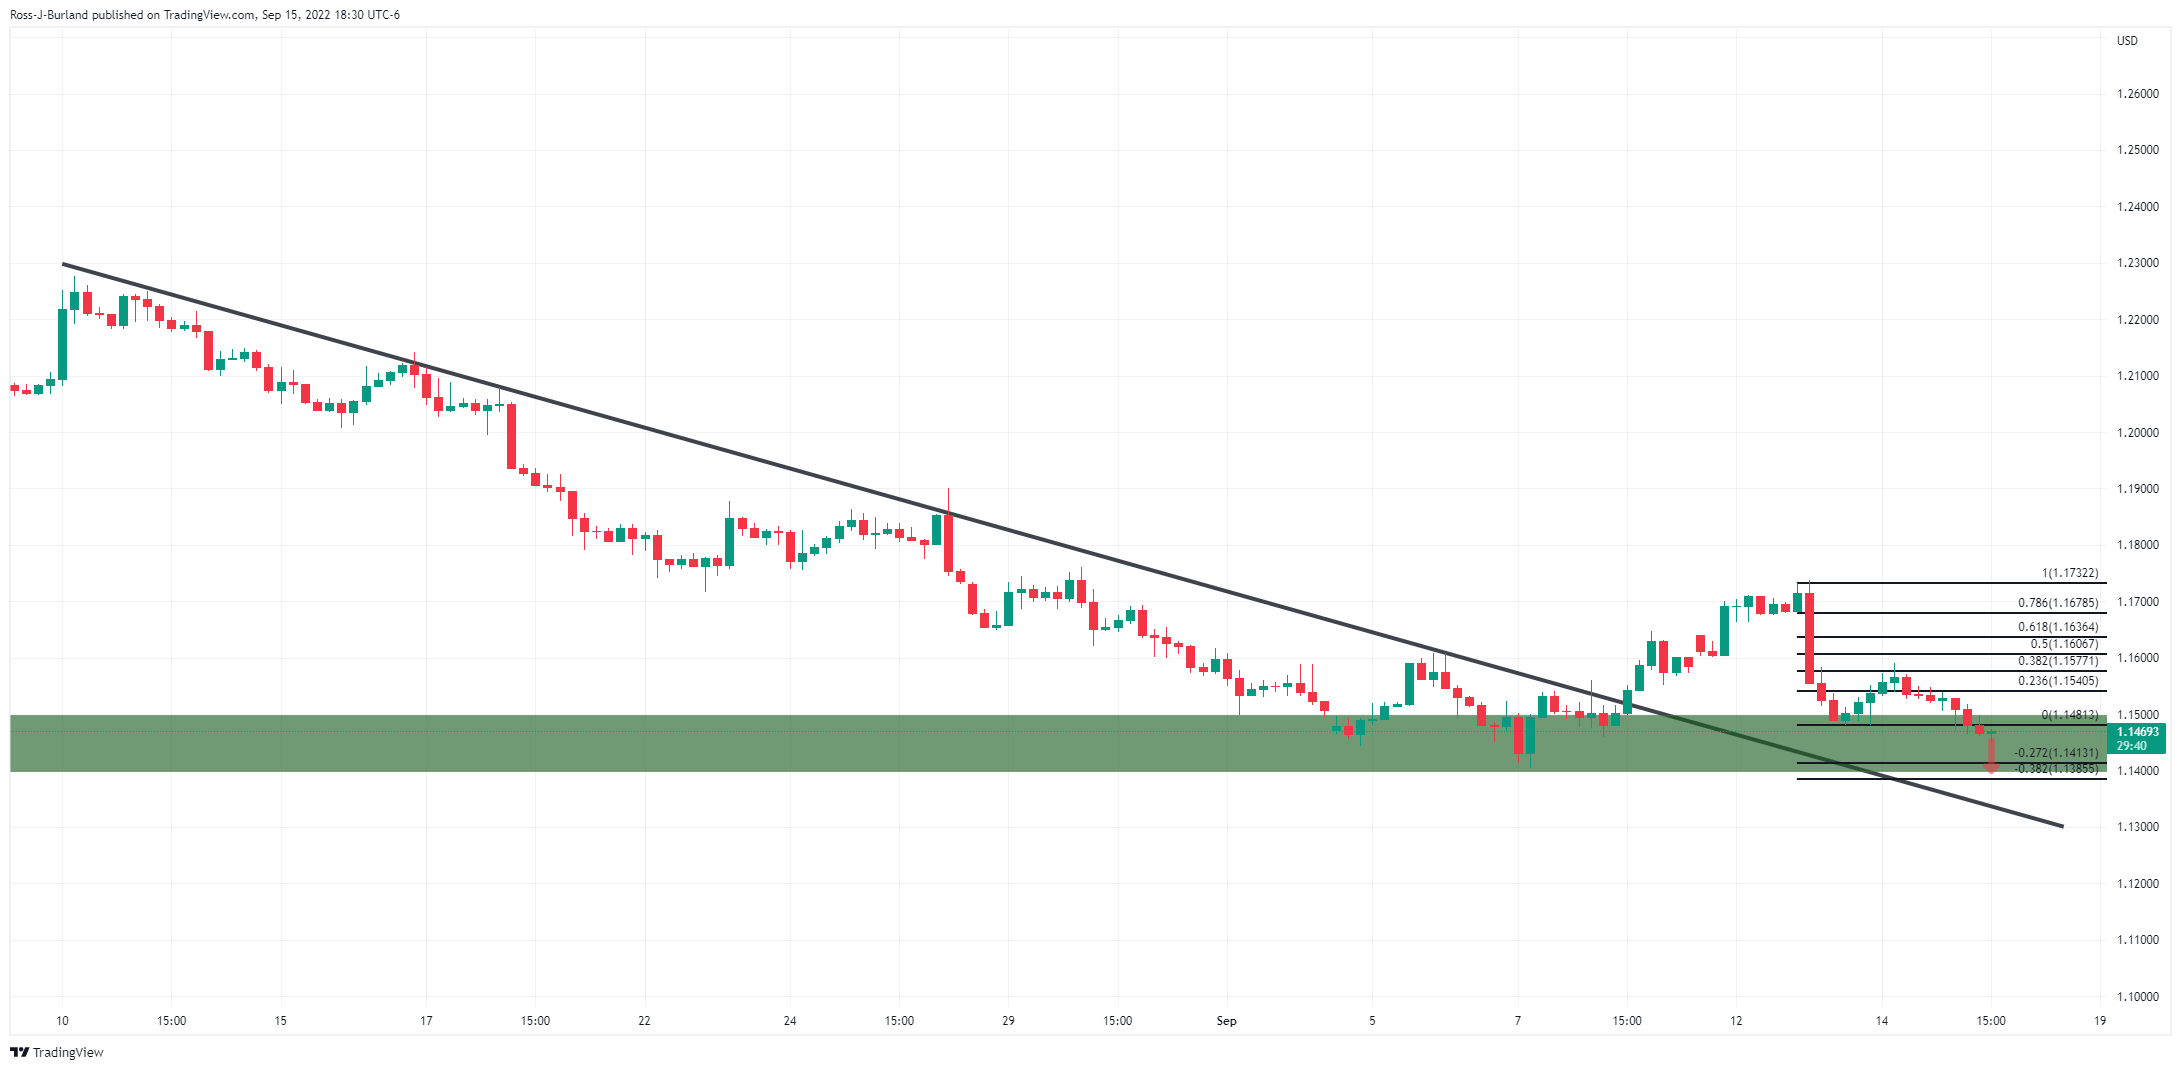
Zooming in, however, there is the potential of a move lower into the demand area.
GBP/USD H4 chart
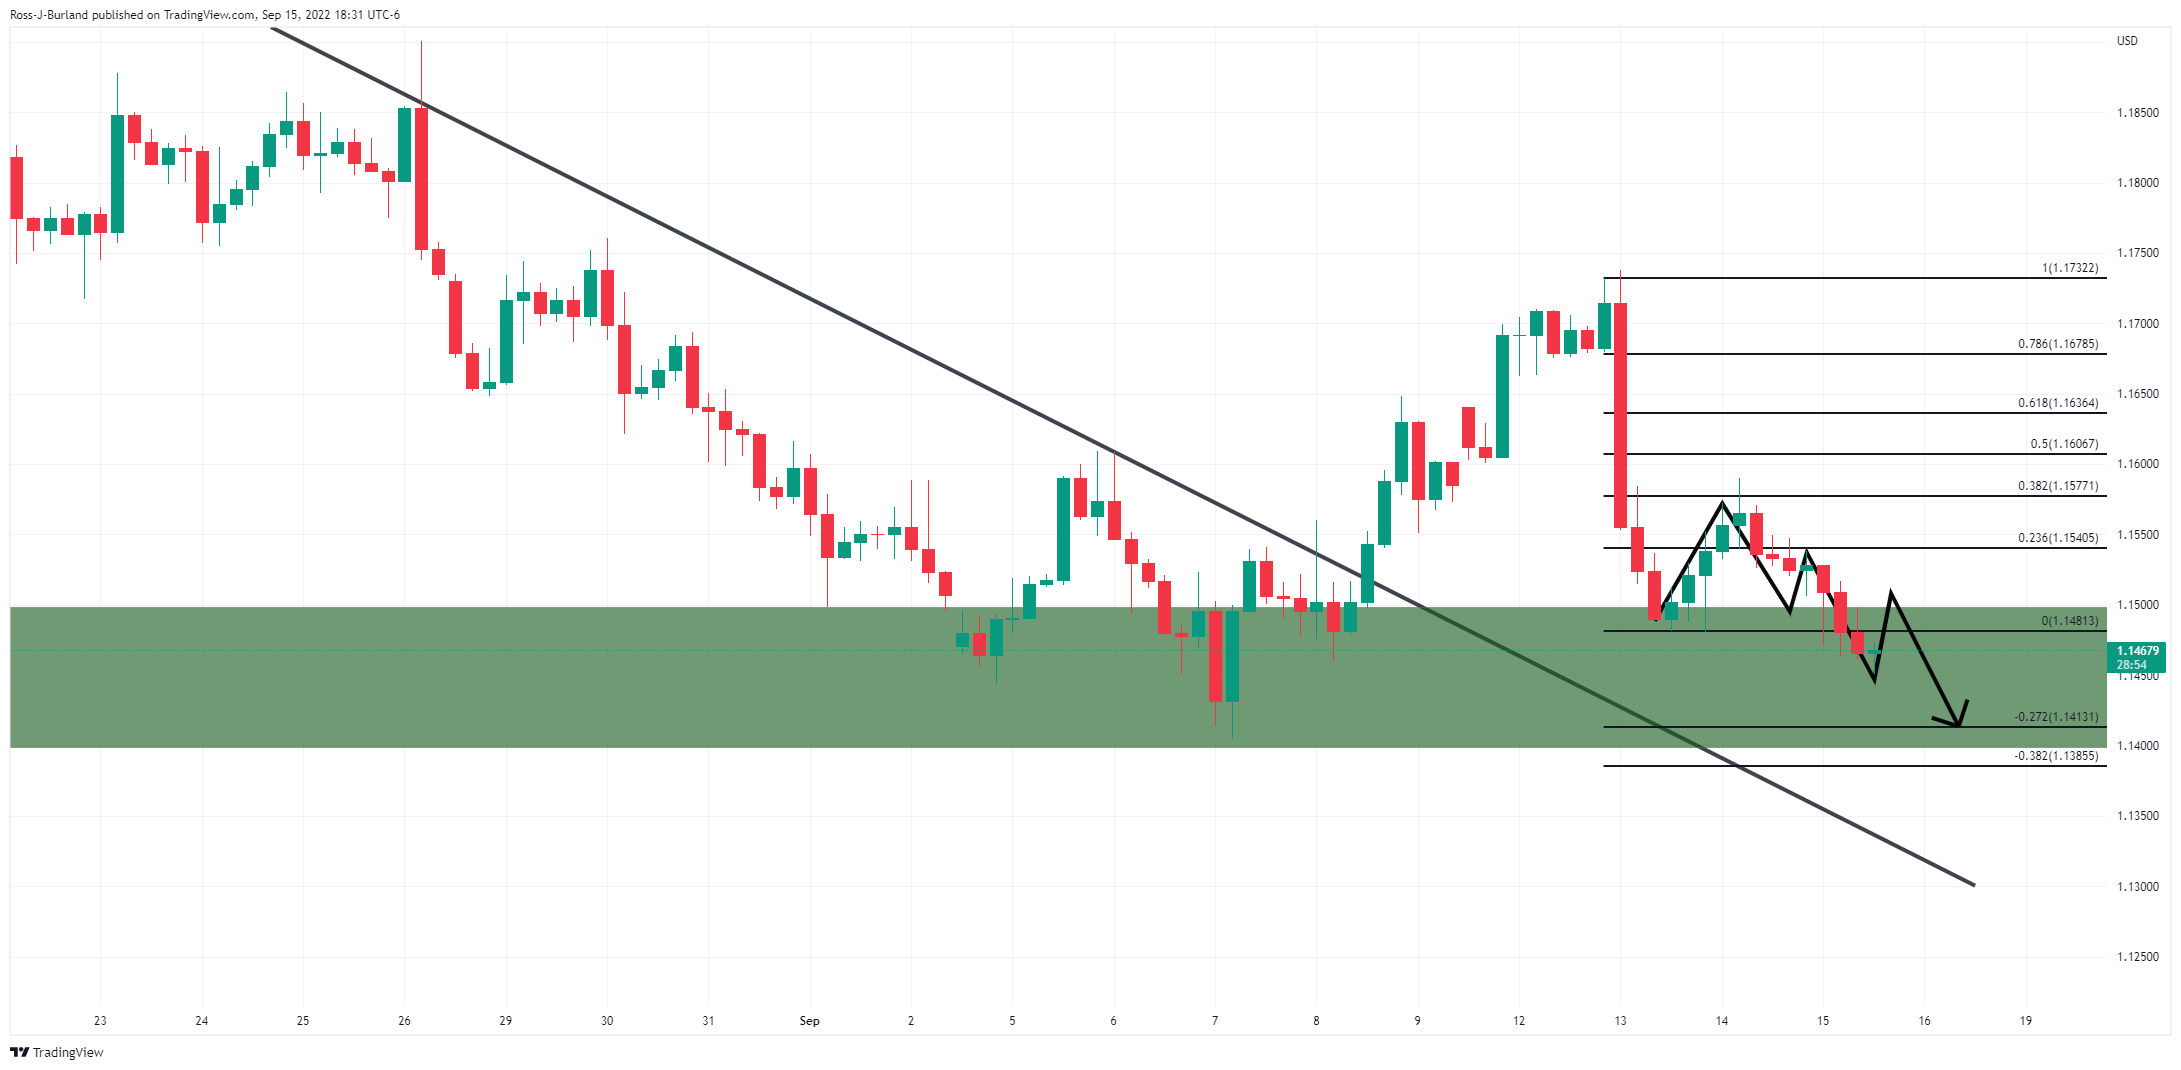
Meanwhile, the price is starting to correct into a 38.2% Fibonacci retracement area:
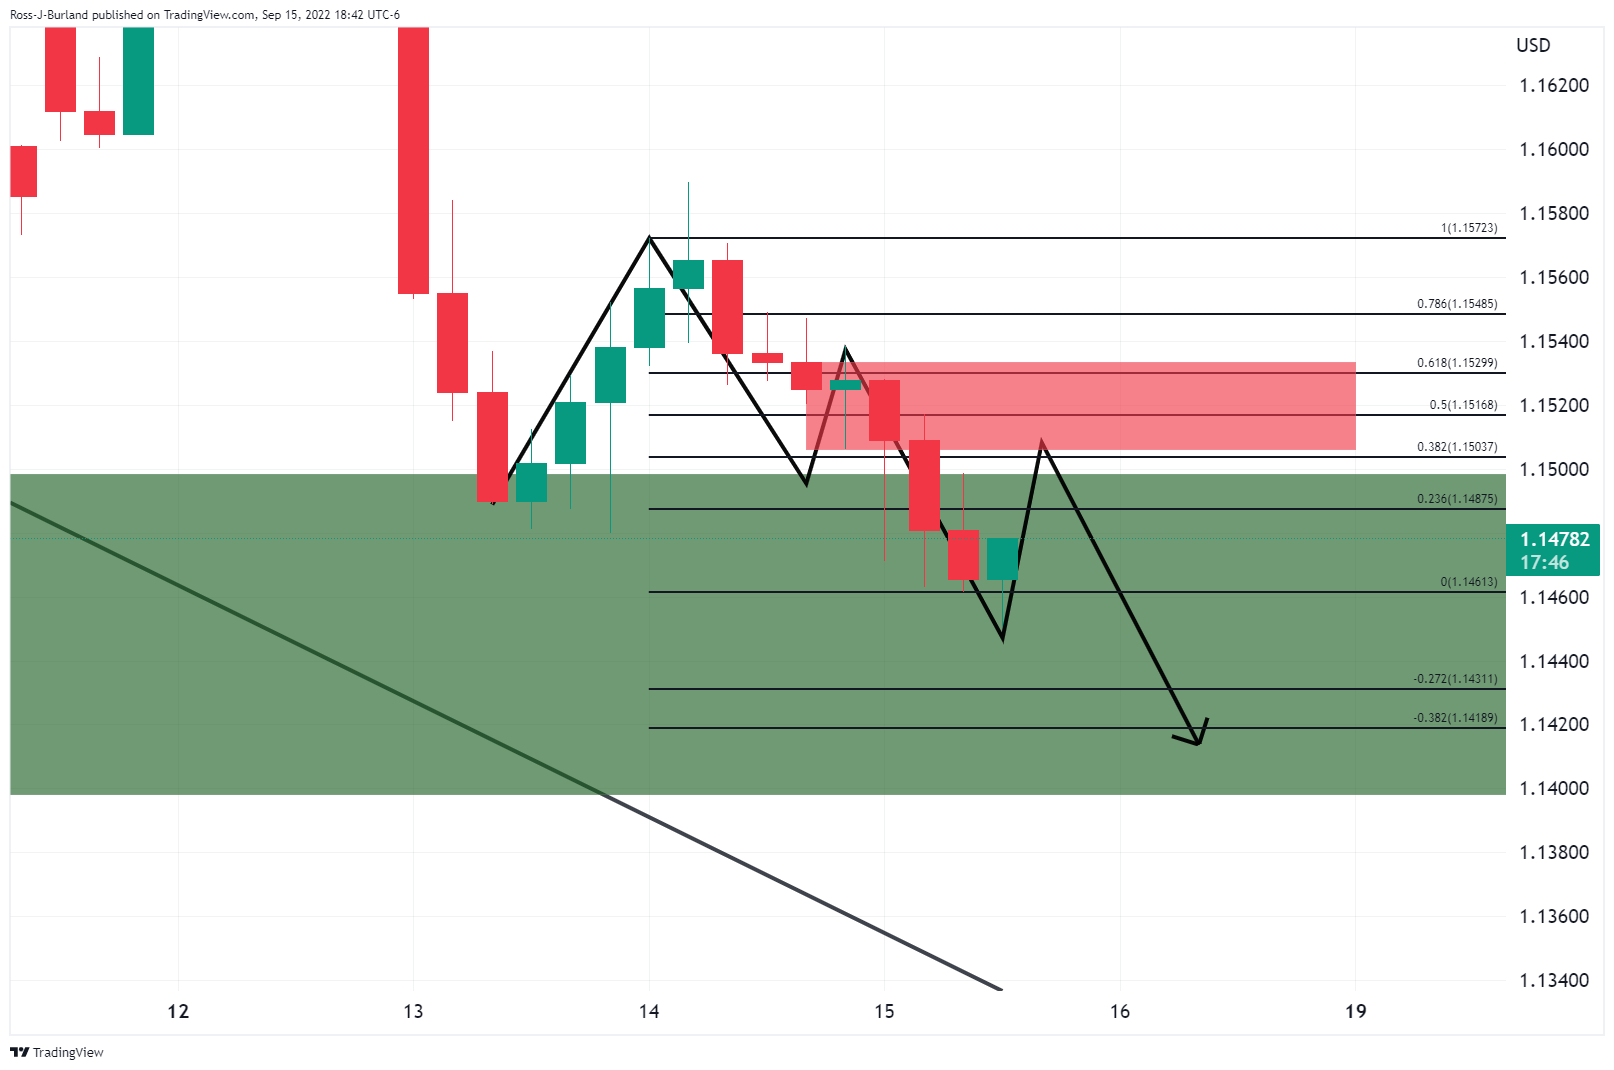
As shown, there is a confluence of the prior lows and the 38.2% and 50% ratios that could act as resistance and result in the next bearish leg.
- AUD/NZD has continued to remain sideways in a 1.1220-1.1232 range despite RBA Lowe’s speech.
- RBA Lowe has provided a gloomy outlook on the economy, however, labor cost growth is consistent.
- Kiwi bulls have failed to capitalize on upbeat Business NZ PMI data.
The AUD/NZD pair is displaying a lackluster performance in the Tokyo session despite the testimony of Reserve Bank of Australia (RBA) Governor Philip Lowe. The asset is auctioning in a narrow range of 1.1220-1.1232 after a modest downside move. The asset slipped lower after attempting to surpass Tuesday’s high at 1.1258. The availability of decent selling pressure at elevated levels has triggered the odds of a bearish reversal.
RBA’s Lowe in his testimony has cleared his intentions of scaling down the inflationary pressures. Unlike other central banks, the RBA is not keen to bring price stability at the cost of growth prospects.
The central bank is not operating on a pre-defined path as cited, however, the market participants should remember that the RBA provided a target for the Official Cash Rate (OCR) at 3.85%. RBA Lowe has provided a gloomy outlook for the economy while he believes that ''Growth in labor costs remains consistent with inflation returning to target.''
Earlier, the ausse bulls witnessed pressure after the release of slightly lower-than-expected Australian employment data. The Employment Change data slipped lower to 33.5k vs. the expectations of 35k. The economy reported a layoff of 40.9k employees in its July report. Also, the jobless rate increased to 3.5% against the forecast and the prior release of 3.4%.
On the NZ front, kiwi bulls have not responded much to the upbeat Business NZ PMI data released in the early Tokyo session. The economic data has landed higher at 54.9 against the forecasts of 52.5 and the prior release of 52.7.
- EUR/USD grinds higher past 21-DMA after printing two-day uptrend in the last.
- Horizontal area comprising multiple levels since mid-July also restricts short-term downside.
- Bulls have a bumpy road to travel before taking control.
EUR/USD picks up bids to refresh intraday high near the 1.0000 parity level during Friday’s Asian session.
In doing so, the major currency pair benefits from the previous day’s upside break of the 21-DMA break amid the bullish MACD signals and the steady RSI.
With this, the quote is likely to extend the latest rebound towards the 50% and 61.8% Fibonacci retracements of the pair’s August-September downside, respectively around 1.0120 and 1.0175.
Following that, the recent swing high near 1.0200 could act as the last defense for the EUR/USD bears.
Meanwhile, a downside break of the 21-DMA level surrounding 0.9985 isn’t an open invitation to the EUR/USD sellers as a two-month-old horizontal support region near 0.9945-55 appears a tough nut to crack.
Should the prices decline below 0.9945, the odds of witnessing the fresh yearly low, currently around 0.9860, can’t be ruled out.
In that case, the late 2002 bottom surrounding 0.9860 will gain the market’s attention.
To sum up, EUR/USD is up for short-term recovery but the bearish trend is likely to prevail.
EUR/USD: Daily chart
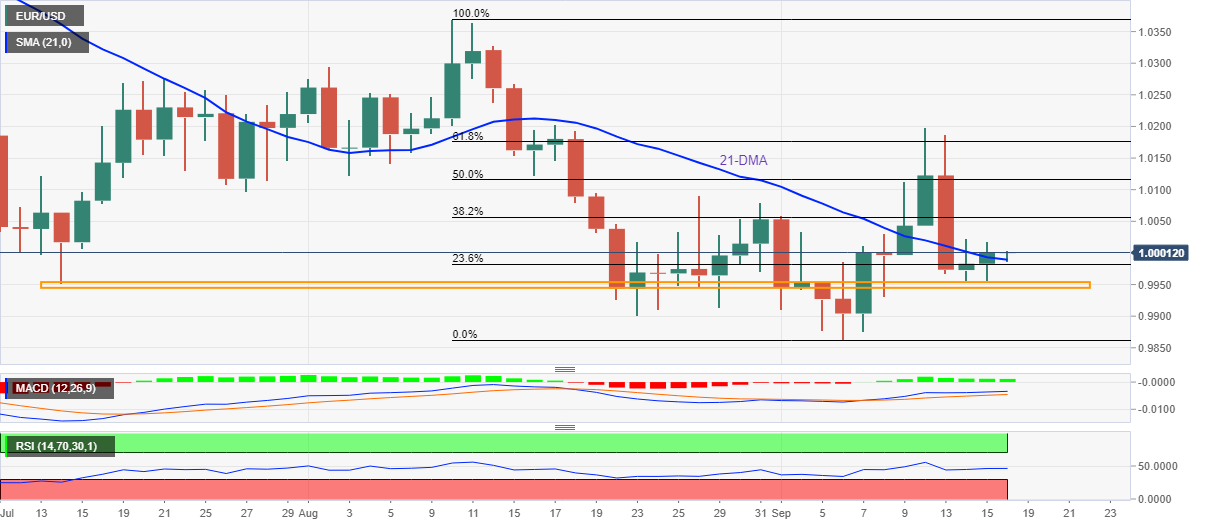
Trend: Limited upside expected
| Index | Change, points | Closed | Change, % |
|---|---|---|---|
| NIKKEI 225 | -0.18 | 15.42 | -1.15 |
| Hang Seng | 83.28 | 18930.38 | 0.44 |
| KOSPI | -9.59 | 2401.83 | -0.4 |
| ASX 200 | 14.3 | 6842.9 | 0.21 |
| FTSE 100 | 4.77 | 7282.07 | 0.07 |
| DAX | -0.18 | 15.42 | -1.15 |
| CAC 40 | -0.18 | 15.42 | -1.15 |
| Dow Jones | -173.27 | 30961.82 | -0.56 |
| S&P 500 | -44.66 | 3901.35 | -1.13 |
| NASDAQ Composite | -167.32 | 11552.36 | -1.43 |
| Pare | Closed | Change, % |
|---|---|---|
| AUDUSD | 0.66972 | -0.77 |
| EURJPY | 143.424 | 0.44 |
| EURUSD | 0.99957 | 0.14 |
| GBPJPY | 164.519 | -0.35 |
| GBPUSD | 1.14676 | -0.64 |
| NZDUSD | 0.59653 | -0.68 |
| USDCAD | 1.32293 | 0.5 |
| USDCHF | 0.9611 | -0.11 |
| USDJPY | 143.484 | 0.3 |
- US Dollar Index grinds higher around a one-week-old descending resistance line.
- Hawkish Fed bets, upbeat US data underpin the DXY run-up.
- Risk-negative catalysts also favor the greenback’s safe-haven demand.
- Second-tier US data eyed ahead of next week’s FOMC.
US Dollar Index (DXY) remains on the front foot at around 109.80 as Fed hawks keep the reins, backed by the upbeat US data, during Friday’s Asian session. Also favoring the greenback’s gauge versus the six major currencies are the economic fears surrounding China and Europe.
The market prices in the Fed’s 0.75% and 1.0% rate hikes during the next week’s Federal Open Market Committee (FOMC), as per the CME’s FedWatch Tool. It should be noted, however, that the US 10-year Treasury yields dropped 1.2 basis points to 3.447% after rising 1.38% the previous day, which in turn tests the DXY bulls of late.
On the other hand, US Retail Sales rose 0.3% in August versus 0.0% expected and July’s revised down -0.4%. Further, NY Fed Empire State Manufacturing Index improved to -1.5 in September compared to -31.3 in August and market expectation of -13. Alternatively, Philadelphia Fed Manufacturing Index declined to -9.9 for the said month compared to 2.8 expected and 6.2 prior. Additionally, US Industrial Production slid to -0.2% in August versus a market expectation for an expansion of 0.1% and downwardly revised prior to 0.5%.
Elsewhere, Bloomberg ran a piece suggesting that China is likely to witness harder days than it witnessed in 2020. On the same line was the news surrounding the Sino-American tussles and the People’s Bank of China’s (PBOC) inaction. Elsewhere, fears that the Eurozone will remain in dire conditions despite having a good stock for winter joined hawkish comments from the European Central Bank (ECB) policymakers to keep the pessimism higher.
Amid these plays, Wall Street closed in the red and the US Treasury bond yields were firmer while the S&P 500 Futures drop 0.65% intraday at the latest.
Moving on, preliminary readings of the Michigan Consumer Sentiment Index (CSI), expected 60 versus 58.2 prior, will be crucial for intraday directions. However, major attention will be on the next week’s Fed meeting. It should be observed that the second-tier data from China may also direct the DXY moves considering the latest recession woes surrounding the world’s biggest industrial play, as well as the second-largest economy.
Technical analysis
A clear upside break of the one-week-old descending resistance line, around 109.85 by the press time, appears necessary for the DXY bulls to aim for the recently flashed 20-year high near 110.80.
- USD/JPY has turned sideways around 143.50 after a firmer decline from 145.00.
- Investors await fresh developments on BOJ’s intervention plans in Fx moves to fix depreciating yen.
- The US Michigan Consumer Sentiment Index is seen higher at 60 vs. 58.2 the prior release.
The USD/JPY pair is displaying back-and-forth moves in a narrow range of 143.15-143.56 in the Asian session. The asset has turned sideways after a firmer decline at around 145.00 as investors are awaiting the latest developments on the Bank of Japan (BOJ)’s intervention in Fx moves.
Awaits more development on BOJ intervention
Investors are aware of the fact that the Japanese administration is worried about depreciating the Japanese yen. Earlier, the Japanese economy was enjoying the falling yen as it was delighting their exports and tourism business. But not the over-riped fruit is creating hurdles for the economy. The corporate is facing the headwinds of costly inputs imported from other countries.
Companies that are highly import-inputs dependent are struggling to keep their operating margins intact. Their failure in passing the impact of higher input prices to the end-consumers due to country risk is forcing them to shut down their production. The impact will be revealed in the upcoming earnings season.
Now, Japanese officials feel that the fundamentals of the economy don’t justify the downside pressure and have discussed intervention in Fx moves with the Bank of Japan (BOJ). A seldom decision of intervening is not expected to be welcomed by other G7 countries. While a change in stance on policy seems to be the potential way to provide a cushion to the falling yen.
US Michigan Consumer Sentiment Index eyed
In today’s session, investors’ entire focus will remain on the US Michigan Consumer Sentiment Index, which is seen higher at 60 against the prior release of 58.2. It is worth noting that the sentiment data is in a recovery mode after dropping to 50 in June. In the past two months, the confidence of consumers is returning led by a solid labor market, falling gasoline prices, and higher growth prospects.
- AUD/USD bounces off two-month low as RBA’s Lowe defends interest rate hike.
- Early-day retreat in yields also underpins corrective bounce from multi-day low.
- Fears of Fed’s aggression join China-linked woes to keep bears hopeful.
AUD/USD licks its wounds around the yearly low near 0.6680 as Reserve Bank of Australia (RBA) Governor justifies the latest rate hikes during the Testimony in front of the Aussie parliament. Also challenging the pair bears is the retreat in the US Treasury yields amid the day-start consolidation moves on early Friday.
“Now that inflation is as high as it is, we need to make sure that inflation returns to target in a reasonable time,” said RBA’s Lowe in the latest testimony. The policymaker also mentioned that Australia in much better position than Fed because wages still contained.
Elsewhere, the US 10-year Treasury yields dropped 1.2 basis points to 3.447% after rising 1.38% the previous day.
Even so, the S&P 500 Futures drop 0.65% intraday by the press time and portrays the risk-off mood, which in turn keeps AUD/USD bears hopeful. Also favoring the Aussie pair sellers are the hawkish Fed bets. That said, the market prices in the Fed’s 0.75% and 1.0% rate hikes in the next week’s Federal Open Market Committee (FOMC), the CME’s FedWatch Tool.
It’s worth noting that fears of China’s slowdown and the European energy crisis join firmer US data to escalate the market’s rush towards the US dollar and weigh on the risk barometer AUD/USD.
Moving on, China’s monthly data dump including the Industrial Production, Retail Sales and housing numbers for August could offer immediate directions. Following that, preliminary readings of the Michigan Consumer Sentiment Index (CSI) will be crucial for nearby directions.
Technical analysis
AUD/USD recovery remains elusive unless crossing the 50-DMA level around 0.6890.


© 2000-2026. Bản quyền Teletrade.
Trang web này được quản lý bởi Teletrade D.J. LLC 2351 LLC 2022 (Euro House, Richmond Hill Road, Kingstown, VC0100, St. Vincent and the Grenadines).
Thông tin trên trang web không phải là cơ sở để đưa ra quyết định đầu tư và chỉ được cung cấp cho mục đích làm quen.
Giao dịch trên thị trường tài chính (đặc biệt là giao dịch sử dụng các công cụ biên) mở ra những cơ hội lớn và tạo điều kiện cho các nhà đầu tư sẵn sàng mạo hiểm để thu lợi nhuận, tuy nhiên nó mang trong mình nguy cơ rủi ro khá cao. Chính vì vậy trước khi tiến hành giao dịch cần phải xem xét mọi mặt vấn đề chấp nhận tiến hành giao dịch cụ thể xét theo quan điểm của nguồn lực tài chính sẵn có và mức độ am hiểu thị trường tài chính.
Sử dụng thông tin: sử dụng toàn bộ hay riêng biệt các dữ liệu trên trang web của công ty TeleTrade như một nguồn cung cấp thông tin nhất định. Việc sử dụng tư liệu từ trang web cần kèm theo liên kết đến trang teletrade.vn. Việc tự động thu thập số liệu cũng như thông tin từ trang web TeleTrade đều không được phép.
Xin vui lòng liên hệ với pr@teletrade.global nếu có câu hỏi.
ngân hàng