- Phân tích
- Tin tức và các công cụ
- Tin tức thị trường
Tin tức thì trường
- Silver prices stay pressured after two-day declines, 12-day-old support line in focus.
- RSI pullback from overbought territory joins failures to cross 200-DMA to favor sellers.
- 100-DMA defends corrective pullback from December’s low, November’s high adds to the upside filters.
Silver (XAG/USD) fades bounce off weekly low under $24.00 during Tuesday’s Asian session.
The bright metal’s failures to keep the late Monday’s recovery could be linked to the failures to cross the 200-DMA and RSI pullback from the overbought region, which in turn signals extension of the latest weakness.
That said, an upward sloping trend line from January 07, near $23.45 by the press time, challenges the metal’s short-term declines ahead of the key 100-DMA support level surrounding $23.25.
Should XAG/USD remains bearish past $23.25, the monthly low near $21.95 and the previous month’s low around $21.40 will be in focus.
On the flip side, a downward sloping trend line from May, at $24.15 by the press time, restricts the metal’s immediate recoveries ahead of the 200-DMA level of $24.60.
If the XAG/USD prices rise past $24.60, November’s high of $25.40 and 61.8% Fibonacci retracement of May-December 2021 downside near $25.95, should lure the bulls.
Silver: Daily chart
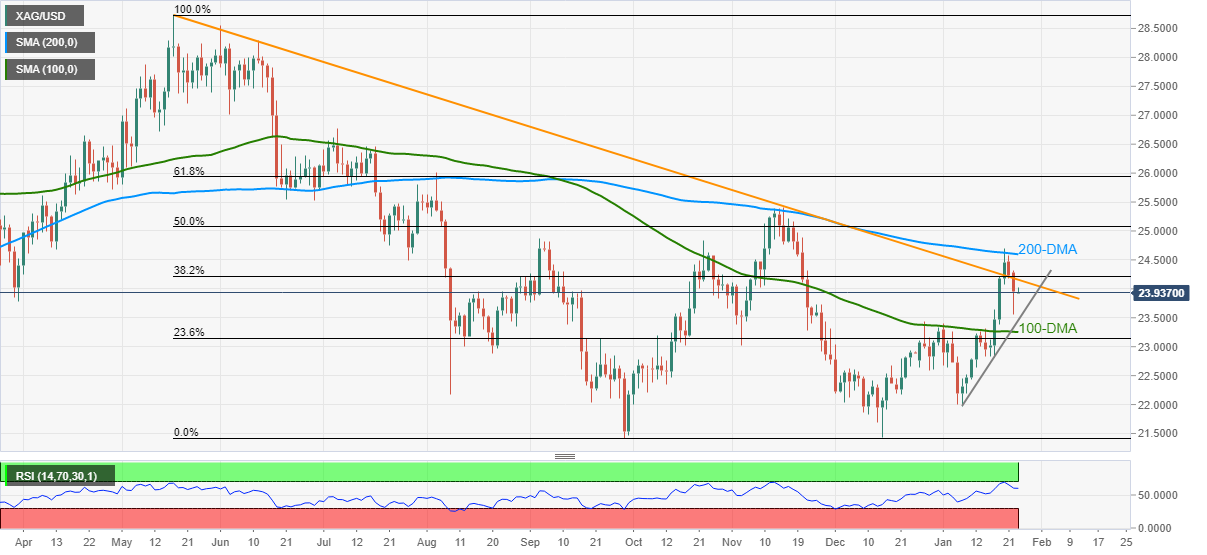
Trend: Further weakness expected
Australian CPI overview
Early on Tuesday, at 00:30 GMT, markets will see the 2021’s fourth quarter (Q4) inflation data for the Australian economy.
The headline Consumer Price Index (CPI) QoQ is likely to rise from 0.8% QoQ to 1.0%, as well as to 3.2% from 3.0% YoY prior.
On the contrary, the Reserve Bank of Australia's (RBA) trimmed-mean CPI is expected to remain unchanged on the QoQ basis at 0.7% but may rise to 2.4% versus 2.1% during the stated period.
Given the recently strong Aussie jobs report and easing covid fears, AUD/USD bulls will pay close attention to the key inflation report for backing their hawkish bias for the Reserve Bank of Australia’s (RBA) rate hike concerns.
Ahead of the release, TD Securities said,
The better than expected outcomes for retail sales, employment and job vacancies in recent weeks means a beat on trimmed mean inflation makes the RBA's dovish stance untenable, setting the RBA on course for rate hikes, potentially a quarter earlier than our Q4 forecast.
On the same line were comments from Westpac stating,
In terms of key drivers, dwelling purchase prices, auto fuel and food will play an important role, and holiday travel will also contribute. There is an upside risk to dwellings as Homebuilder grants expire and cost pressures lift. Uncertainty around durable goods remains. Westpac forecasts a 1.1% q/q and 3.2% y/y rise for the headline CPI (market median is 1.0% and 3.2%). The offsetting soft components in Q4 are seasonal, thereby supporting a solid 0.7% (2.4%yr) gain in the trimmed mean measure.
How could it affect the AUD/USD?
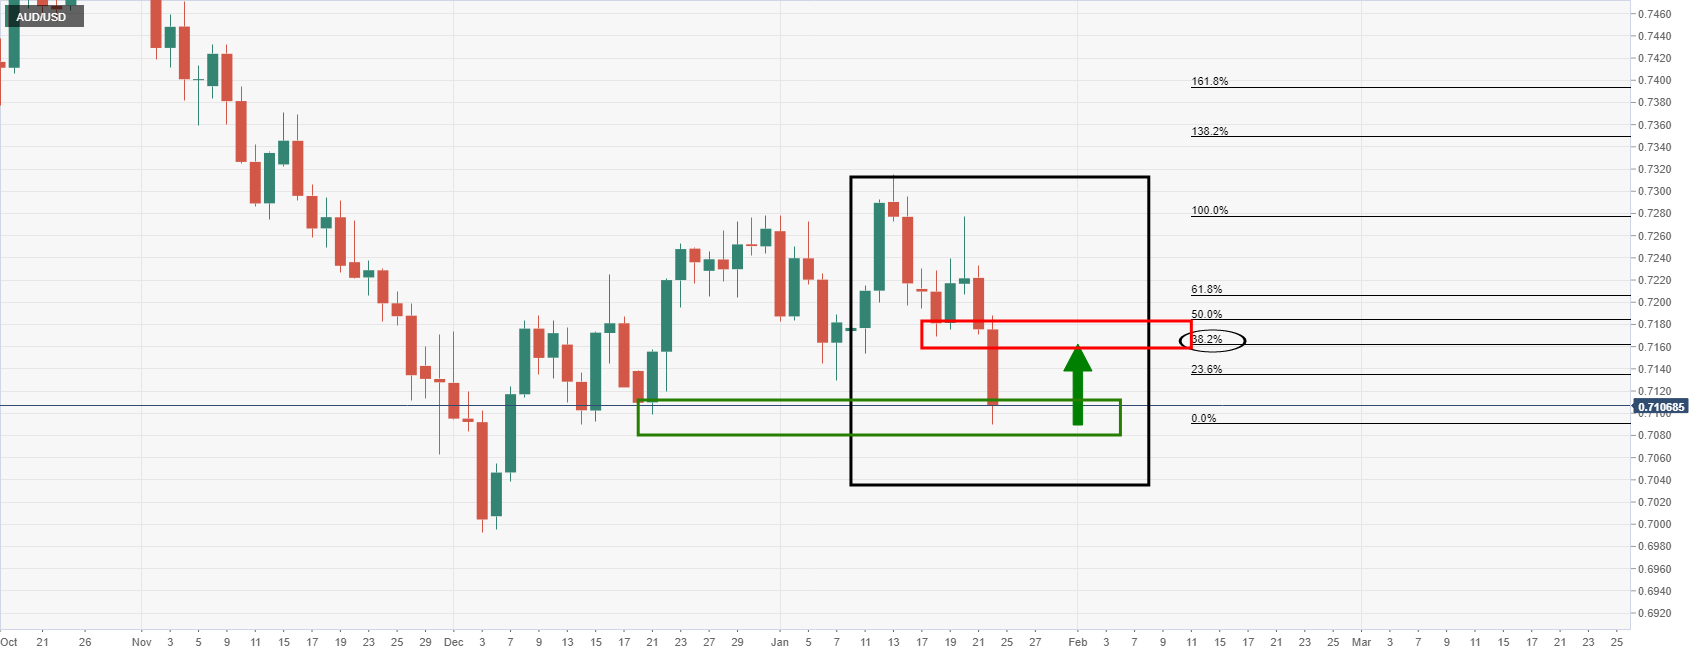
AUD/USD struggles to extend the latest bounce off a five-week low, flashed the previous day, as market players await the key Aussie inflation figures. Also challenging the bulls are the concerns over the Fed’s rate hike and Russia-Ukraine tussles, which in turn weigh on stock futures and propel US Treasury yields to offer additional hurdle to the pair’s recovery moves.
However, the recently positive fundamentals from Australia will get a chance to propel the AUD/USD prices should today’s Q4 CPI data manage to match/surpass the upbeat forecasts. However, Fed becomes more important than the RBA and hence any upside moves may have a short-term life until being too strong.
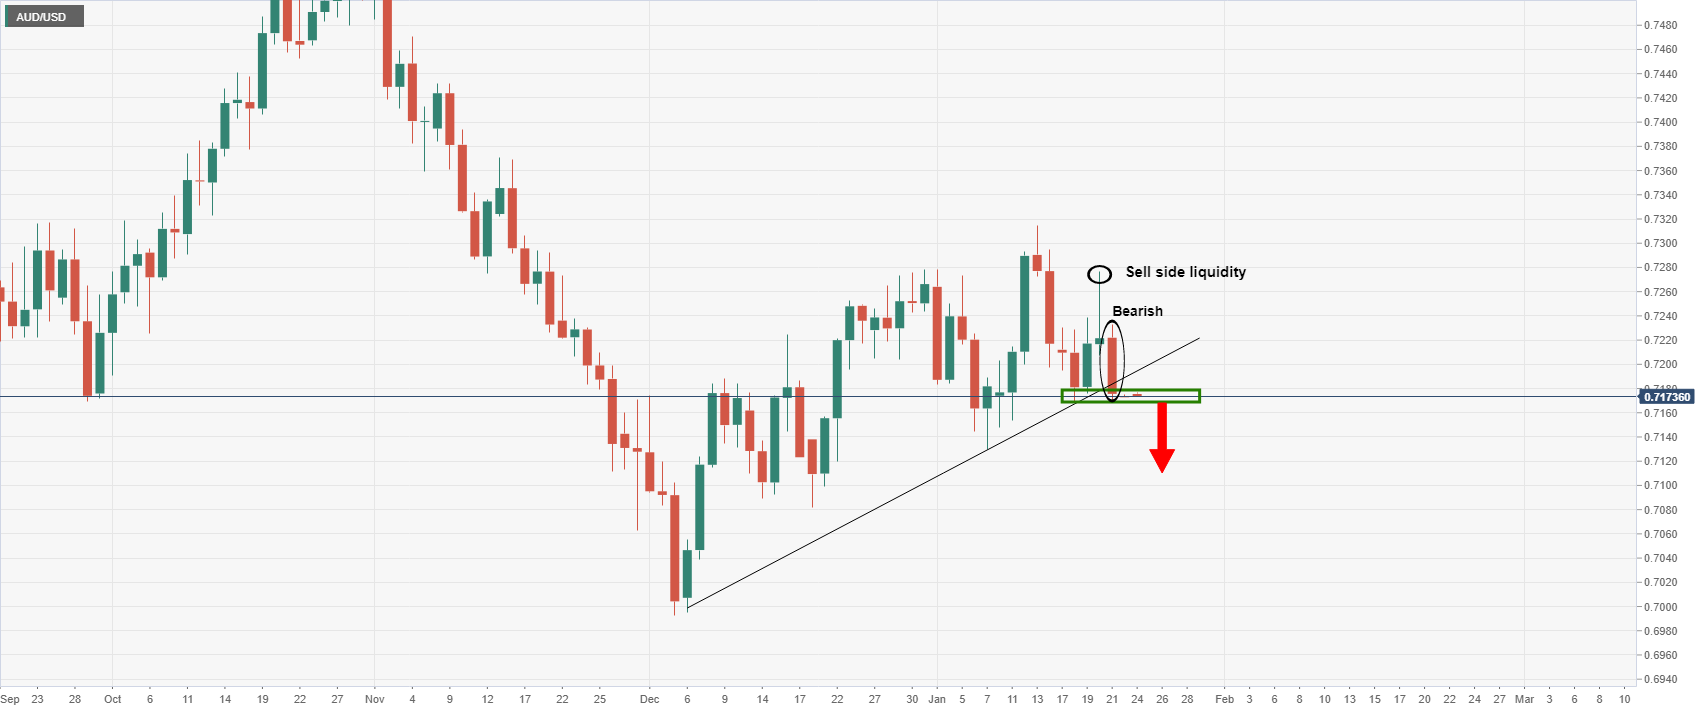
Technically, AUD/USD extends bounce off a multiple support-zone established since late November, around 0.7090-80. However, bearish MACD signals and the support-turned-resistance line from December 20, near 0.7170, pose as the short-term key hurdle followed by the 200-DMA level of 0.7200.
Key Notes
AUD/USD rebound approaches previous support near 0.7170 ahead of Australia inflation
AUD/USD Weekly Forecast: Unreliably optimistic Australian data hides a nearby crisis
About the Australian CPI
The Consumer Price Index released by the RBA and republished by the Australian Bureau of Statistics is a measure of price movements by the comparison between the retail prices of a representative shopping basket of goods and services. The purchasing power of AUD is dragged down by inflation. The CPI is a key indicator to measure inflation and changes in purchasing trends. A high reading is seen as positive (or bullish) for the AUD, while a low reading is seen as negative (or Bearish).
- WTI extends Monday’s corrective pullback from weekly low.
- Bullish Doji above the key SMAs, Momentum line’s rebound favors further recovery.
- Three-day-old resistance line adds to the upside filters.
WTI picks up bids towards $84.00, extending the late Monday’s recovery during the initial Asian session on Tuesday.
The oil benchmark’s latest recovery takes clues from a bullish Doji candlestick and Momentum line.
However, the monthly support line, now resistance around $84.00, precedes a descending trend line from the last Thursday, near $85.30, to test the recovery moves.
Following that, the recent high surrounding $86.95 may offer an intermediate halt during the run-up to the $90.00 psychological magnet.
Alternatively, pullback moves may initially aim for the 100-SMA level of $81.10 before eyeing the $80.00 round figure.
Though, WTI sellers may have a tough time keeping reins past $80.00 as the 200-SMA level of $76.75 will challenge further weakness of the commodity.
WTI: Four-hour chart
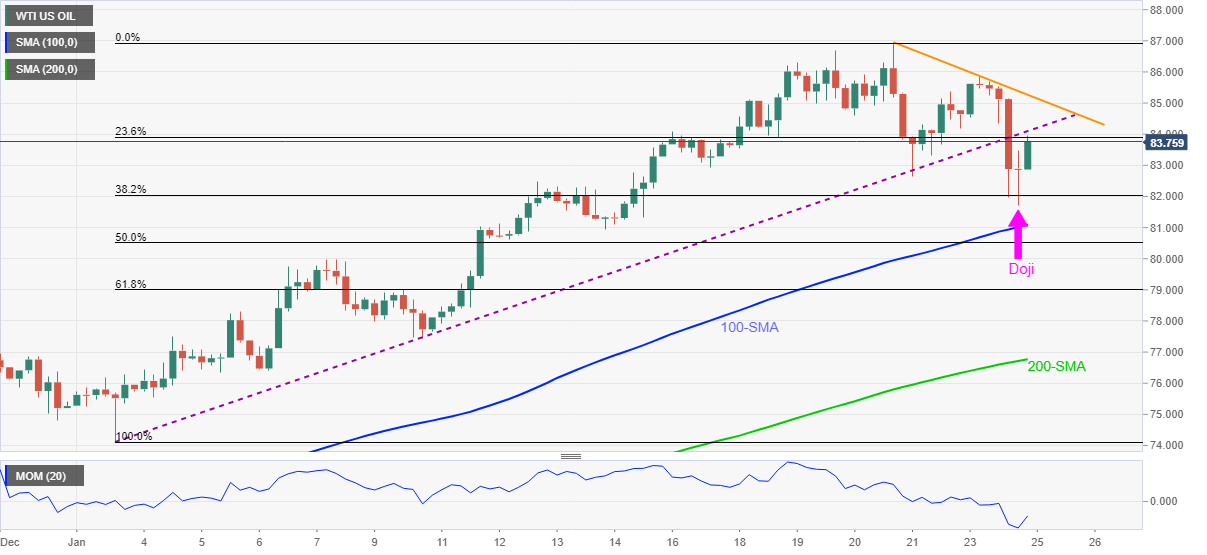
Trend: Further upside expected
US inflation expectations, as measured by the 10-year breakeven inflation rate per the St. Louis Federal Reserve (FRED) data, rose for the second consecutive day to 2.38% by the end of Tuesday’s North American session, per the FRED website.
In doing so, the inflation gauge extends rebound from a four-month low flashed last week ahead of the key Federal Open Market Committee (FOMC) meeting, scheduled for Wednesday.
Given the escalating chatters over hawkish halt by the Fed during this week’s appearance, increasing inflation expectations can help the policymakers to prove right the market expectations, which in turn could propel yields and the US dollar.
In addition to the Fed meeting, US PCE Inflation data and the Q4 Advance GDP also gains major attention for the future actions of the US central bank.
Read: Inflation surge could push the Fed into more than four rate hikes this year
- EUR/USD keeps rebound from two-month-old support line to battle short-term key hurdles.
- 200-SMA, one-week-old descending trend line challenge buyers, steady RSI tests further upside.
- Key Fibonacci retracement levels add to the short-term trading filters.
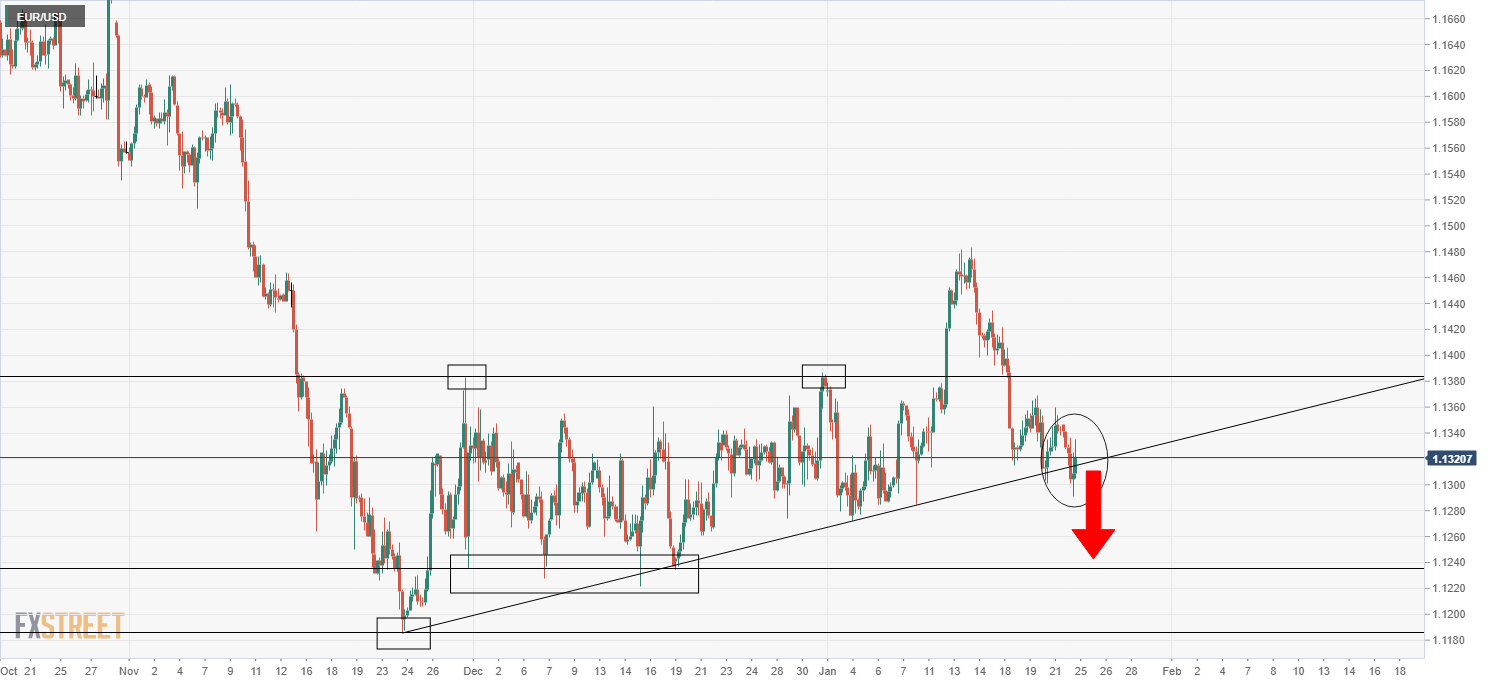
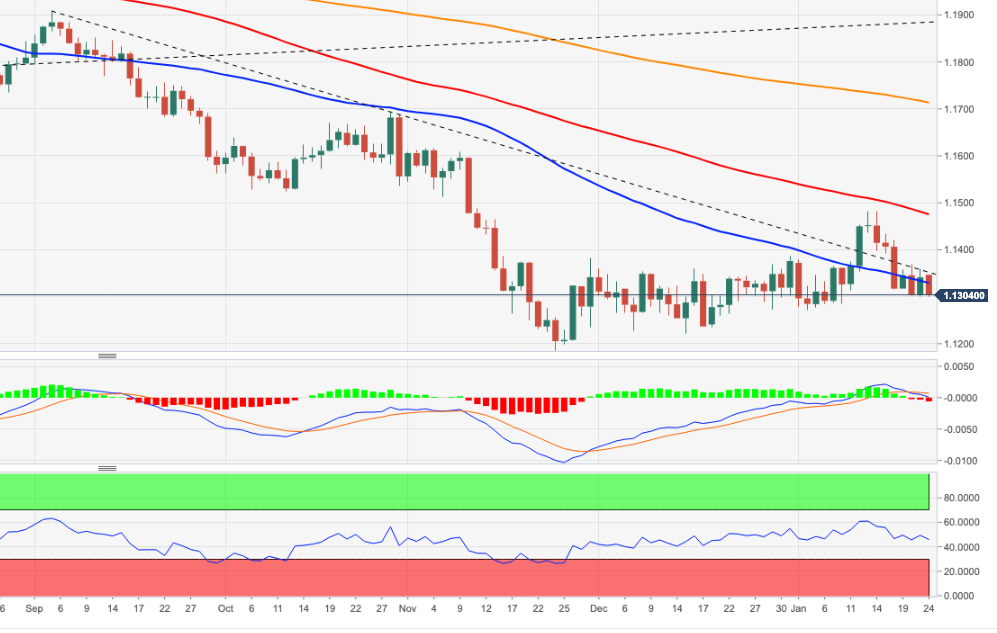
EUR/USD pauses corrective pullback from two-month-old support around 1.1330 during the initial Asian session on Tuesday.
In doing so, the major currency pair battles the 200-SMA, as well as a descending trend line from January 17, by the press time.
Given the lack of firmer RSI and strong resistances, EUR/USD prices are likely to witness a pullback from the 50% Fibonacci retracement (Fibo.) level of November-January advances, near 1.1335.
However, the downside moves need validation from the aforementioned support line from late November, around 1.1300. Also challenging the EUR/USD sellers near the stated round figure is the 61.8% Fibo. level.
If at all the quote remains bearish past 1.1300, odds of its south-run to 1.1270 and 1.1230 can’t be ruled out.
Alternatively, recovery moves need to stay beyond 1.1335 to aim for December 2021 top near 1.1385.
Following that, the 1.1400 threshold and 1.1430 levels may challenge the EUR/USD bulls ahead of the monthly peak surrounding 1.1480.
EUR/USD: Four-hour chart
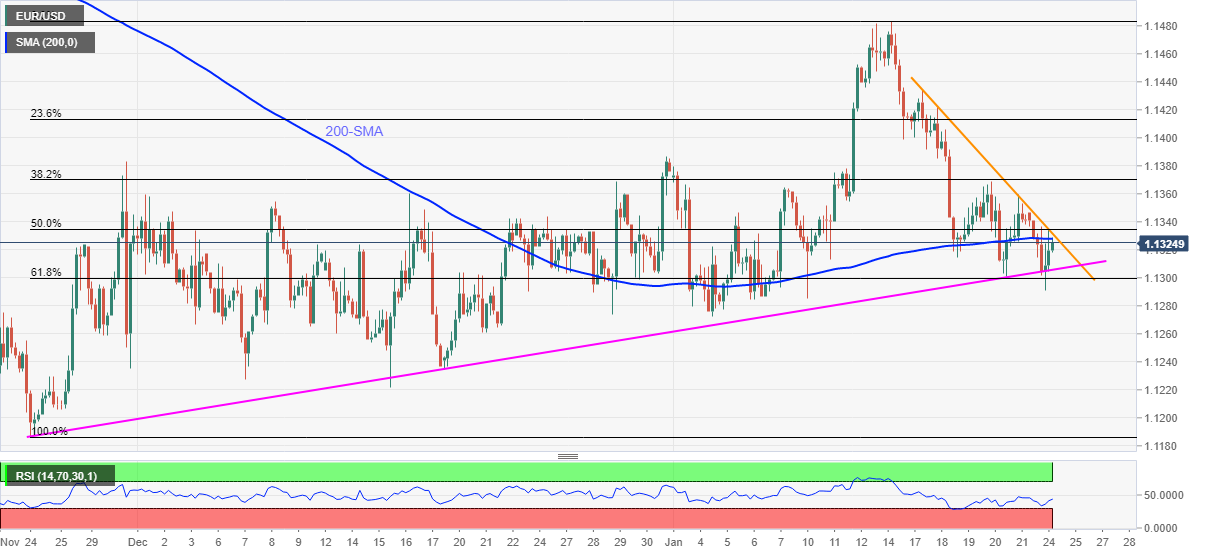
Trend: Pullback expected
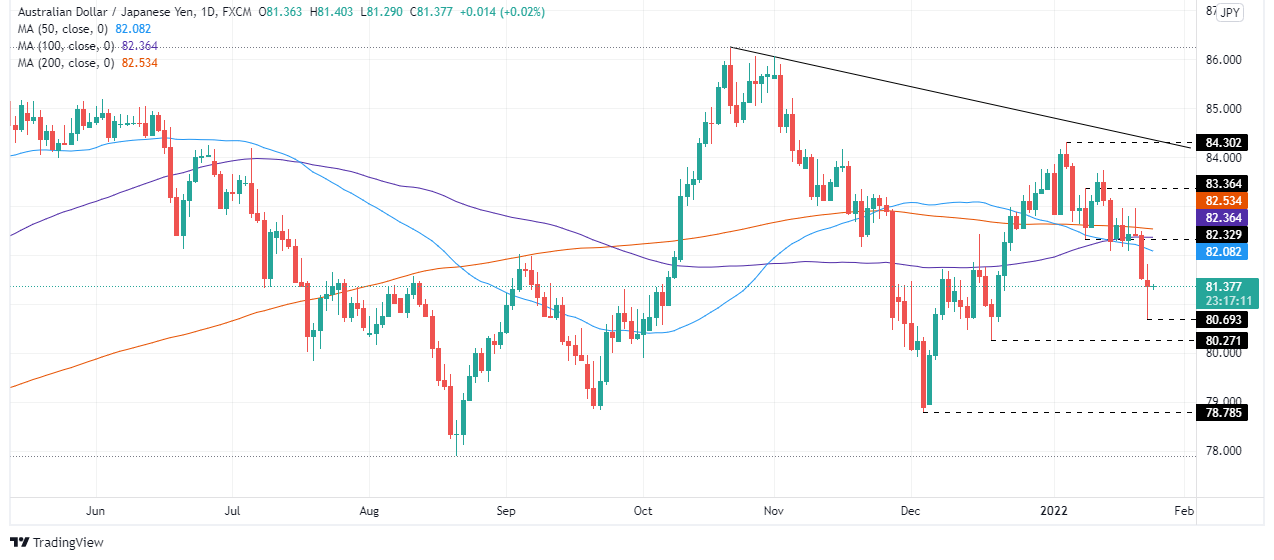
- The Australian dollar got hit by risk-off market sentiment but recovered its earlier losses near the New York close.
- AUD/JPY Price Forecast: The pair is downward biased, though Monday’s price action suggests that buyers lift the cross-currency from 80.69.
The end of the New York session shows a slight improvement in market mood, which witnessed the AUD/JPY dipping to Monday’s daily low at 80.69, to then stage a recovery above the 81.00 figure. At the time of writing, the AUD/JPY is trading at 81.40.
The market mood of the European session, which witnessed worst than expected reported global PMI’s, carried over the North American one. However, increasing tensions in the Ukraine – Russia conflict spurred a sell-off across assets with the “risk” word attached, led by the US stock market. In the FX complex, risk-sensitive currencies like the AUD, the NZD, and the CAD were hit by safe haven peers, though trimmed earlier losses at the end of the session.
AUD/JPY Price Analysis: Technical outlook
The AUD/JPY daily chart depicts the pair as downward biased. The break under December 16, 2021, daily high at 82.44, witnessed the break of the 200, 100, and 50-day moving averages (DMAs), located at 82.53, 82.36, and 82.08, respectively.
Nevertheless, as portrayed by the candlestick chart, Monday’s price action left a large bottom wick that shows that buyers entered the market, lifting the AUD/JPY above the 81.00 figure and beyond it.
That said, the AUD/JPY first resistance level would be the 50-DMA at 82.08. A breach of the latter would expose the 100-DMA at 82.36, immediately followed by the 200-DMA at 82.53.
On the flip side, the first support would be 81.00. A break under that level would open the door for a test of December 3, 2021, a daily low at 78.79, but it would find some hurdles on the way south. Firstly the January 24 low at 80.70, followed by December 20, 2021, daily low at 80.27, and then the aforementioned December 3 daily low at 78.79.
- AUD/USD keeps corrective pullback from five-week low tracking rebound in equities, gold.
- Fears of Fed’s rate-hike, Russia-Ukraine tussles weighed on Aussie prices before the latest rebound.
- Easing covid numbers, PBOC rate cut aid buyers but broad risk-off mood stays on the table.
- Australia Q4 CPI can bolster RBA rate hike concerns after strong employment.
AUD/USD holds onto the corrective pullback from more than a month’s low around 0.7140, after two consecutive days of risk aversion.
The recovery moves could be linked to the consolidation of losses by the risk-sensitive assets while the Aussie pair particularly awaits key inflation data during early Tuesday morning in Asia.
Global markets turned risk-off at the key week’s start as traders piled on more bets over the US Federal Reserve’s (Fed) hawkish appearance during Wednesday’s Federal Open Market Committee (FOMC) meeting. Also souring the sentiment were fears of a war between Russia and Ukraine, as well as mixed data.
Although the US, Europe and the North Atlantic Treaty Organization (NATO) push Russia towards a ceasefire, reports took rounds that Moscow is up for a battle with Ukraine. As per the latest updates from the UK, leaders agreed that if Russia continues its intervention into Ukraine, allies must respond quickly, including through a package of sanctions.
Elsewhere, softer US Markit PMIs for January jostled mixed Aussie activity numbers from the Commonwealth Bank on Monday. However, the fears of supply chain disruptions and inflation woes couldn’t be ignored. US Treasury Secretary Janet Yellen accepted the same and praised Fed efforts, which in turn strengthened bullish bias over the FOMC.
It’s worth noting that the People’s Bank of China’s (PBOC) reverse repo cut should have also favored the buyers to take the risks, despite being too late, as the dragon nation is Australia’s largest customer.
Amid these plays, the US Treasury yields rose 2.9 basis points (bps) to 1.776% whereas Wall Street recovery early-day losses to close with mild gains. Further, gold prices also ended Monday’s North American trading session on a positive side.
Looking forward, Australia’s Consumer Price Index (Q4), expected 1.0% versus 0.8% prior, becomes crucial for the AUD/USD traders after a strong employment report and recently hawkish concerns over the Reserve Bank of Australia’s (RBA) rate lift. Also on the watcher’s list is the National Australia Bank’s (NAB) sentiment numbers and the US Consumer Confidence data.
Technical analysis
AUD/USD extends bounce off a multiple support-zone established since late November, around 0.7090-80. However, bearish MACD signals and the support-turned-resistance line from December 20, near 0.7170, pose as the short-term key hurdle followed by the 200-DMA level of 0.7200.
- USD/CAD bears looking for a strong correction to the neckline of the W-formaiton.
- Bulls are seeking an upside extension from the hourly correction at a discount.
The price of USD/CAD has corrected back to test the 50% mean reversion mark and is decelerating. This leaves prospects of a bullish continuation on the cards for the sessions ahead.
USD/CAD H1 chart
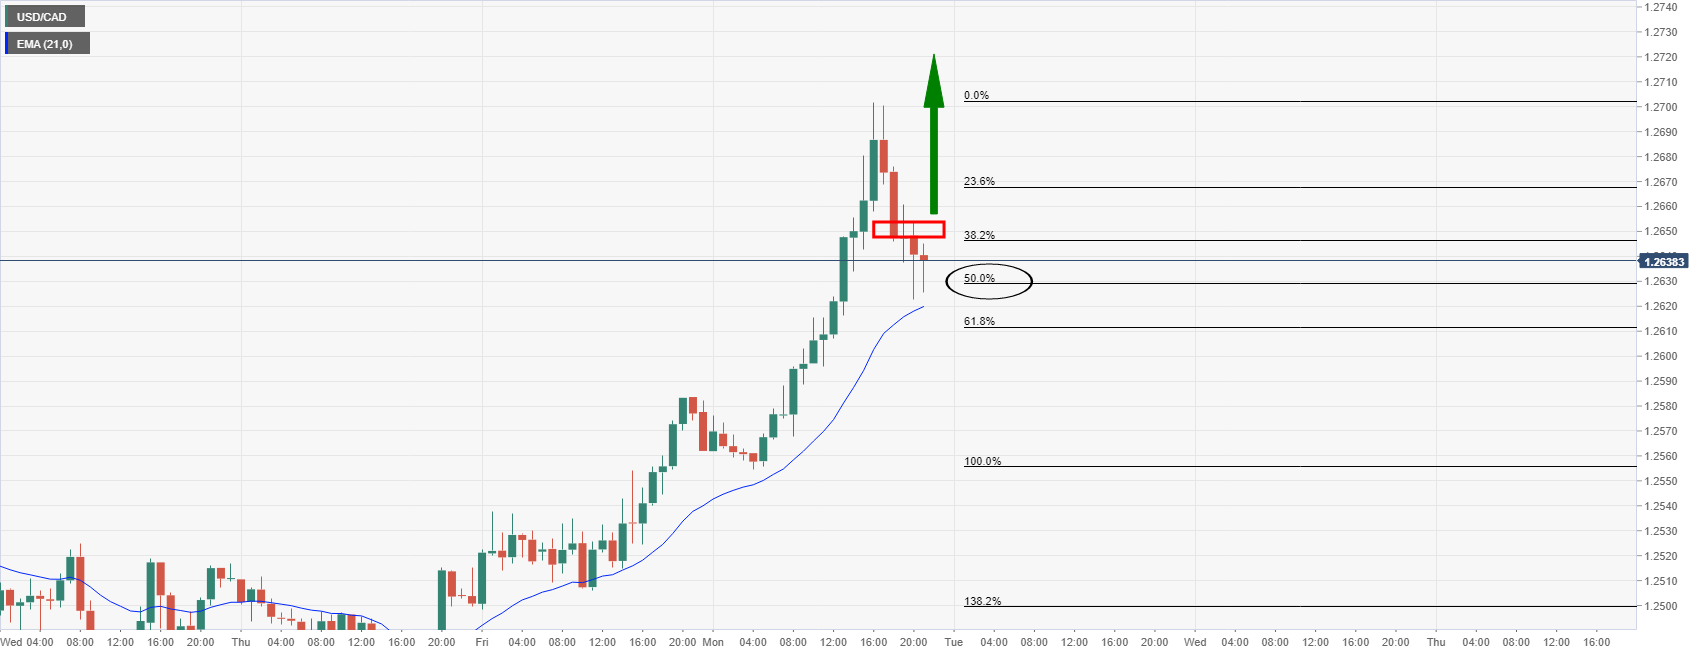
The bulls would target the 1.2720s as being a -0.272% bullish Fibo extension target that aligns with the prior resistance structure as per the daily chart below:
USD/CAD daily chart
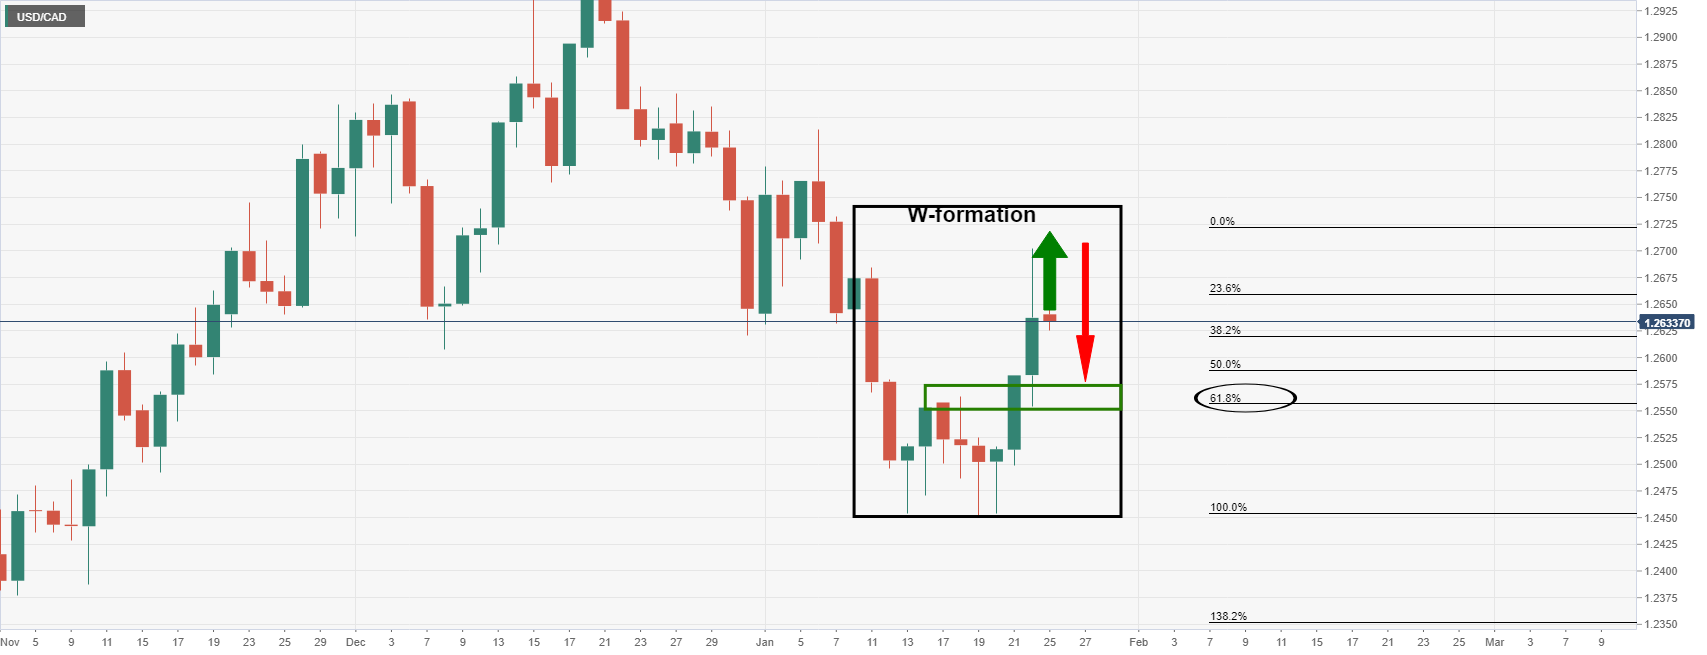
The W-formation is a reversion pattern and the price, after filling the wick of yesterday's business with some change, would be expected to revert back to test the neckline of the 'W' pattern. This would align with a 61.8% golden ratio as well near to 1.2560.
What you need to know on Tuesday, January 25:
Markets were hit by a wave of risk aversion on Monday, benefitting the safe-havens and hurting the risk-sensitive currencies, though the latter group had pared back on much of their earlier underperformance by the end of US trade as risk appetite recovered. Market commentators said that geopolitical concerns about the rising risk of a new Russian/Ukrainian military conflict and equity investor worries about Fed tightening were the main drivers of the broadly downbeat tone on Monday.
As it became clear that the risk asset sell-off (led by US equities) had gone too far, dip-buyers returned to the market and the major US equity indices enjoyed a ferocious intra-day recovery from lows. The S&P 500 ended the session 0.3% higher, up an incredible 4.5% versus earlier intra-day lows.
The hardest risk-sensitive currencies recovered in tandem. AUD/USD, which had dipped as low as the 0.7090s where it traded over 1.1% lower, recovered back to the 0.7140 area, down a comparatively modest 0.5% on the day. Coming up on Tuesday, Aussie traders will be watching key Q4 Consumer Price Inflation data that could, if hotter than expected, bolster hawkish RBA policy bets and further facilitate the rebound.
USD/CAD, which had risen as much as 1.0% to above 1.2700, was last trading in the 1.2630 area, up about 0.4% on the day. NZD/USD, which was last down 0.2%, recovered back to 0.6700 from an earlier dip as low as the 0.6660 mark, which was its lowest point since November 2020. Kiwi traders also await key Consumer Price Inflation data for Q4 out on Thursday.
Finally amongst the more risk-sensitive G10 currencies, GBP/USD recovered back to the 1.3480s from a brief dip below 1.3450, where it continues to trade lower by about 0.5% on the session. Broadly weaker than anticipated flash January PMIs didn’t help sterlings cause, though arguably support the case for more BoE rate hikes given their continued strong inflationary signal.
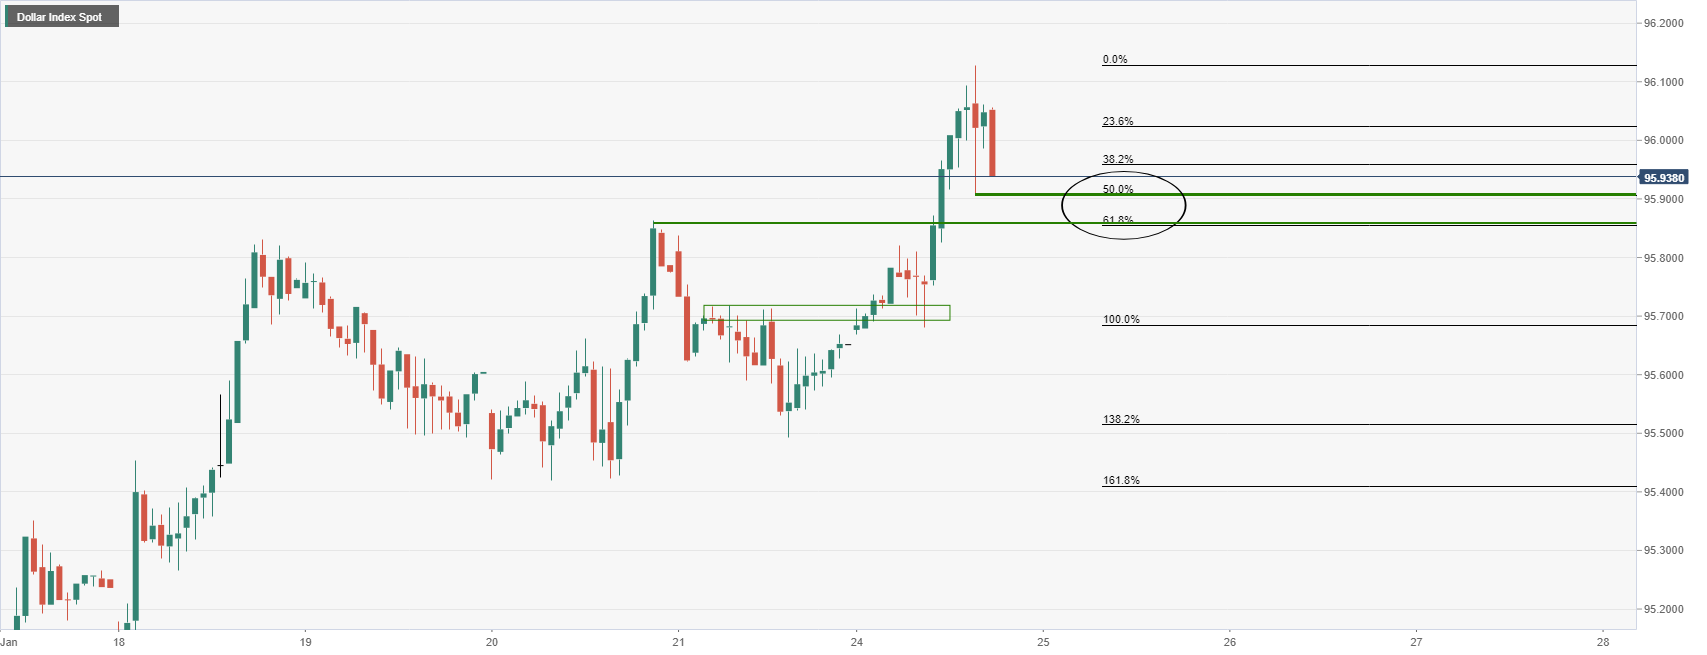
USD was the safe haven of choice and the top-performing G10 currency of the day, with the DXY rising about 0.3%, though in the end failing to hold above the 96.00 level as risk-appetite recovered later in the session. Nonetheless, it reached its highest point in two weeks, aided by hawkish Fed chatter/concerns, while much weaker than expected flash Services PMI data was shrugged off as a result of the temporary Omicron impact rather than any underlying economic weakness.
JPY, EUR and CHF all look on course to end the day about 0.2% lower versus the buck, with EUR/USD holding above 1.1300, USD/JPY rising back to the 114.00 area and USD/CHF rising back towards 0.9150.
- The British pound falls some 0.27% versus the Japanese yen.
- GBP/JPY Price Forecast: Upward biased, despite losing in the day.
In the New York session, the British pound slides against the safe-haven status of the Japanese yen. The GBP/JPY is trading at 153.64, down 0.27% at the time of writing.
The GBP/JPY began in the right foot in the overnight session, though subdued around the daily highs at 154.50. Nevertheless, as the market mood worsened amid rising tensions in eastern Europe, alongside domestic political issues, the GBP/JPY plunged to 153.00.
That said, alongside the UK economic docket, portraying a dismal IHS Markit PMI report, boosted the Japanese yen, which remains the strongest currency of the day, against most of the G8 complex.
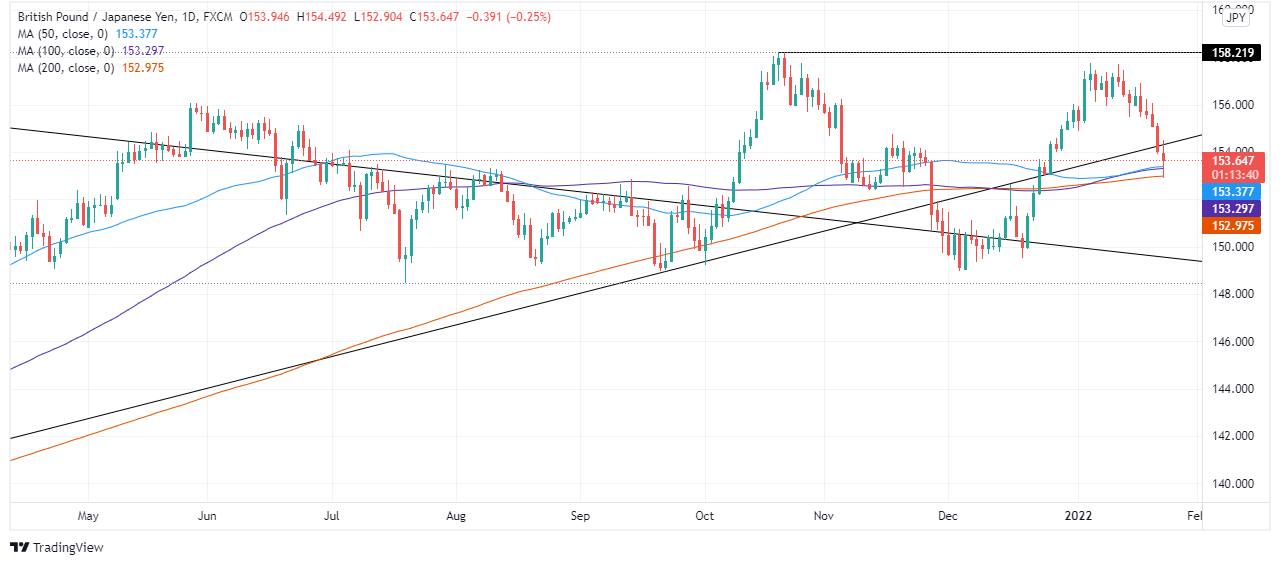
GBP/JPY Price Forecast: Technical outlook
The GBP/JPY has an upward bias despite falling on Monday. The pair faced support around the 200-day moving average (DMA) which lies at 152.98, resuming the upward move, breaching the 100 and the 50-DMA in the upward move.
However, an upslope trendline drawn from October 2021 cycle lows to September 2021 ones, previously breached, is resistance so that any upward moves might be capped around 154.00. A breach of the latter would open the door for further gains. The next resistance would be the psychological 155.00, followed by the January 21 daily high at 155.22, followed by 156.00
On the flip side, the first support would be the DMAs mentioned above. The 50-DMA lies at 153.37, the 100-DMA at 153.28, and the 200-DMA at 152.96.
- EUR/USD held up well on Monday, recovering from an earlier dip under 1.1300 after key support held.
- Traders should be prepared for a potential bearish breakout towards the mid/low 1.1200s.
EUR/USD held up well on Monday despite the market’s deeply risk-off tone, with the pair finding good dip-buying interest when it hit the 1.1300 level earlier in the session and recovering to trade flat on the day in the 1.1320s. Unlike other G10/USD pairs (like AUD/USD and NZD/USD), EUR/USD continues to hold above an uptrend that has supported it since late November/early December. As has been the case for the past four sessions, the price action continues, for the most part, to stick between the 21 and 50-day moving averages at 1.1345 and 1.1315 respectively.
The euro’s defensive qualities as a funding currency seemed to win through on Monday, but FX strategists have warned that the Eurozone is highly vulnerable to a NATO/Ukraine/Russia conflict if it results in further sharp upside in European gas prices. Some have suggested it would make sense for an element of “risk premia” to be priced into the euro as the risk of military conflict rises. That is something traders should be on the lookout for this week and, when combined with expectations for a hawkish Fed meeting on Wednesday and the risk that further risk-off flows continue to benefit the safe-haven US dollar, suggests downside risks for EUR/USD. Traders should watch out for any possible bearish breakout towards the mid/low 1.1200s.
Data appears to be taking more of a backseat as a driver of the price action. Mixed flash Eurozone PMIs for January out in the European morning, where manufacturing held up much better than forecast but services were weak, hardly had an impact on the euro. Equally, a big miss on expectations for the US flash Services PMI, which fell to its lowest since July 2020 and nearly back into contractionary territory (i.e. under 50) didn’t seem to phase the buck much. The main data to watch this week for EUR/USD traders is US GDP on Thursday and some of the individual Eurozone nations (Spain, France and Germany) and US December Core PCE inflation on Friday.
- Geopolitical tensions spurred by the Ukraine – Russia crisis favors the US dollar.
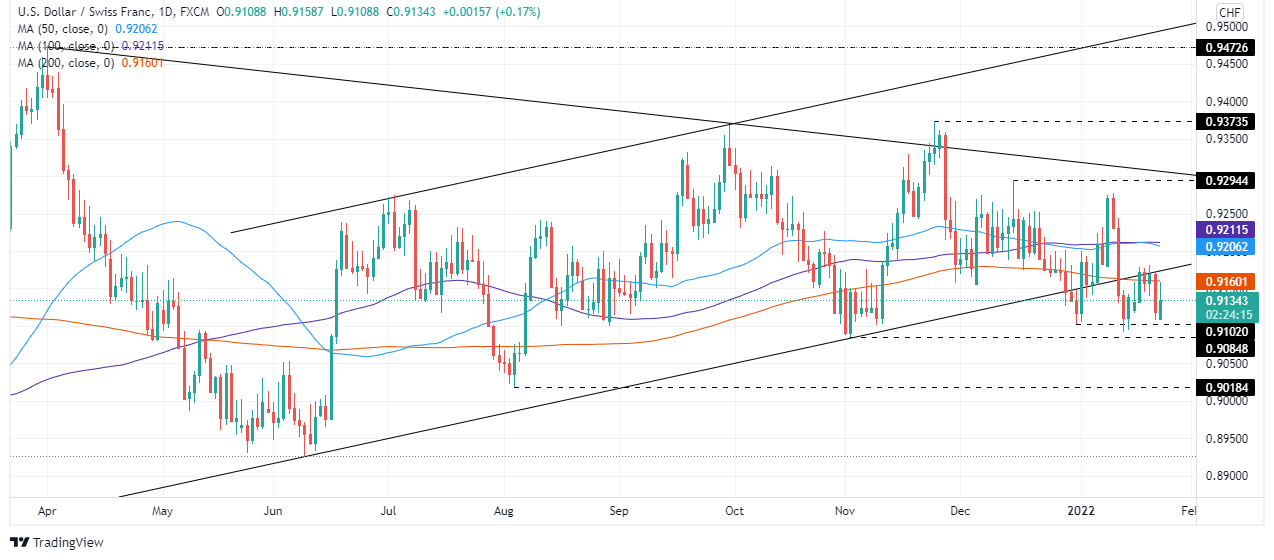
- USD/CHF Technical outlook: Neutral-bearish biased, but a break above 0.9200 would expose the 0.9300 supply zone.
After finishing the last week in the red, the USD/CHF trims some of Friday’s losses amid a risk-off market mood. At press time, the USD/CHF is trading at 0.9135, up some 0.18%.
Factors like the escalating tensions in the Ukraine – Russian conflict and the prospects of the Federal Reserve, tightening monetary policy conditions, boost the greenback to the detriment of the so-called safe-haven status of the Swiss franc.
In the meantime, the US Dollar Index, a gauge of the greenback’s performance against a basket of its rivals, edges up 0.21%, sitting at 95,854. Contrarily, the US 10-year benchmark note rate slides four and a half basis points, down to 1.731%, helped to put a lid on the upside prospects of the USD/CHF.
USD/CHF Price Forecast: Technical outlook
The daily chart shows that the USD/CHF is neutral-bearish biased. The daily moving averages (DMAs) above the spot price express the bearishness of the pair. However, the DMAs horizontal slope leaves the USD/CHF exposed to upward pressure.
To the upside, the USD/CHF first resistance would be the 200-day moving average (DMA) at 0.9160. A breach of the latter would expose the 50-DMA at 0.9206, followed by the 100-DMA at 0.9211.
On the flip side, the USD/CHF first demand zone would be the 0.9100 figure. A break under that level exposed the 2022 YTD low at 0.9095, followed by November 2, 2021, a daily low at 0.9089.
- USD/TRY is now starting to make a move to the upside.
- The bulls will be looking for a break of prior highs for the sessions ahead.
The price of USD/TRY has been consolidating for the entire month above the 21-day moving average and capped below a significant area of resistance:
USD/TRY daily chart
-637786481181166325.png)
However, the bulls are taking control as they take on the first layer of resistance as follows:
-637786486308103759.png)
The M-formation is a reversion pattern and the price has broken the neckline resistance at 13.4241 which would now be expected to act as support. Given the turmoil in markets and probabilities of escalation of tensions in Central Asia, the US dollar's bias is to the upside:
DXY daily chart
The US dollar, as measured vs a basket of major currencies in the DXY index, has been testing the 61.8% ratio that meets with prior highs as a firm layer of potential support for the sessions ahead.
- NZD/USD’s drop continued on Monday with the pair hitting its lowest point since November 2020.
- NZD held up better than its risk-sensitive peers, perhaps amid reluctance to sell it ahead of key Q4 CPI data.
The NZD/USD sell-off that really got kicking last Thursday when the pair breached long-term uptrend support and tumbled below 0.6750 continued on Monday as risk appetite continued to deteriorate. The pair on Monday fell beneath the 0.6700 level for the first time since November 2020 and has stabilised in the 0.6680 region, down about 0.4% on the day, up from its earlier session lows in the 0.6660 area. NZD/USD has for the most part been trading as a function of broader risk appetite and tracking movements in US equity markets, which are substantially lower on the day, though are in fairness also off earlier lows.
Driving the generalised risk-off moves seen in markets on Monday that has hit risk-sensitive currencies (like NZD) particularly hard whilst benefitting safe-haven currencies like USD, JPY and CHF has been renewed focus on Fed tightening as well as geopolitics. The New Zealand dollar, though suffering in the unfavourable market mood, has not been the worst hit amongst the G10, with CAD, GBP, AUD, SEK and NOK all fairing worse. That could be a reflection that, prior to Monday, NZD had already been one of the worst-performing G10 currencies this month and NZD bears were a little tired.
Alternatively, it could be a reflection of reluctance to sell the kiwi ahead of Thursday’s key Q4 2021 Consumer Price Inflation report. This report, which could reveal headline inflation nearing or hitting 6.0% YoY, could pump expectations for RBNZ tightening in a way that might shield NZD from further hawkish Fed-related USD advances. ING commented that “the market’s tightening expectations for the Reserve Bank of New Zealand are already quite aggressive (a 25bp hike in mid-February and at least five more in 2022), but we think that a strong CPI read may fuel speculation that the Bank will go for 50bp in February, which should be translated into a stronger NZD”. The bank does caveat that for NZD/USD to recover, broader risk appetite will need to stabilise.
- GBP/USD bears moved in on the weekly W-formation's target.
- The US dollar is now stalling which could give some support to cable.
As per the prior analysis, GBP/USD Price Analysis: Bears eye a trip to 1.3450 as per weekly chart, cable has indeed move din on the target area as follows:
GBP/USD prior analysis

The above was the W-formation's neckline targetted.
Below was the expected trajectory of the price action on the hourly chart, noting the prospect of a restest of the support (liquidity grab) and subsequent projected decline.
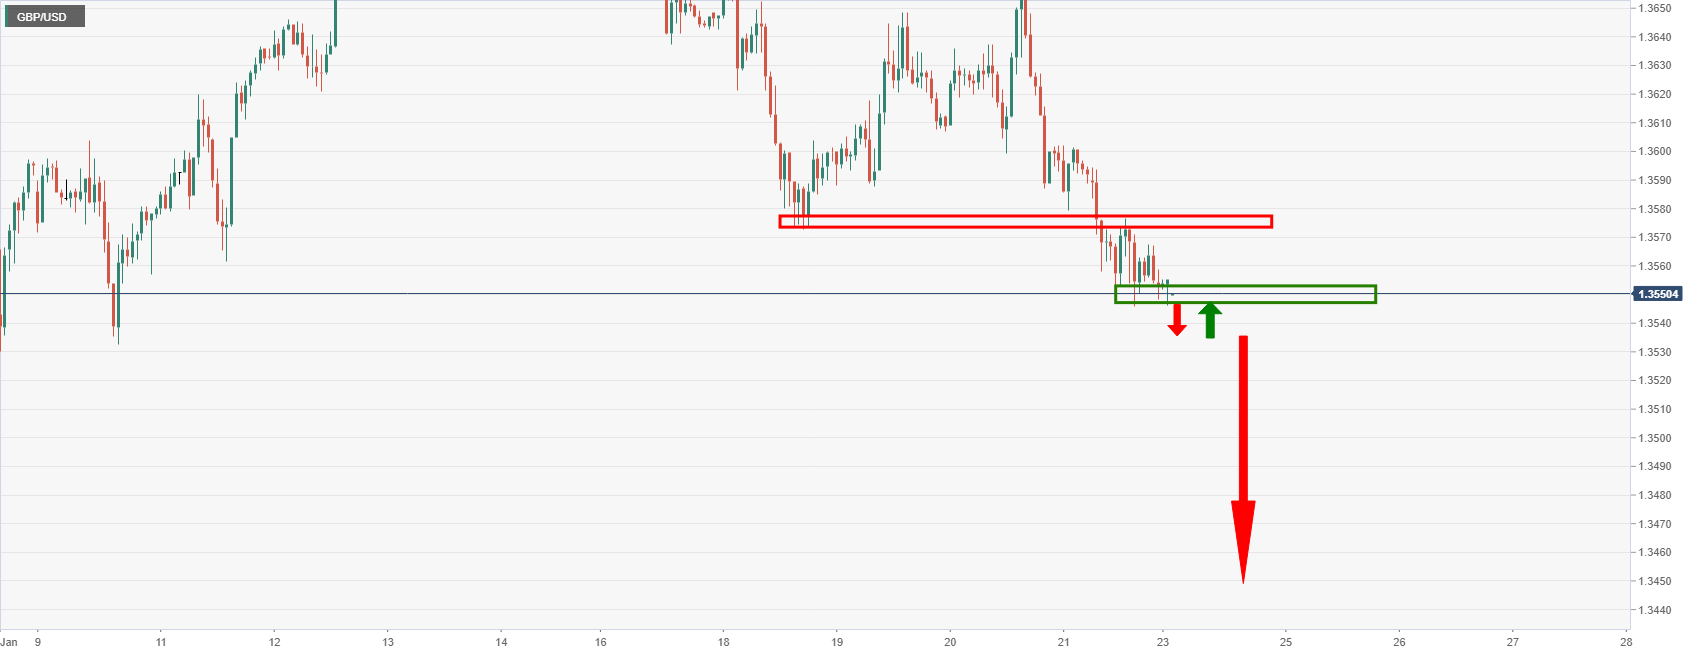
GBP/USD live charts
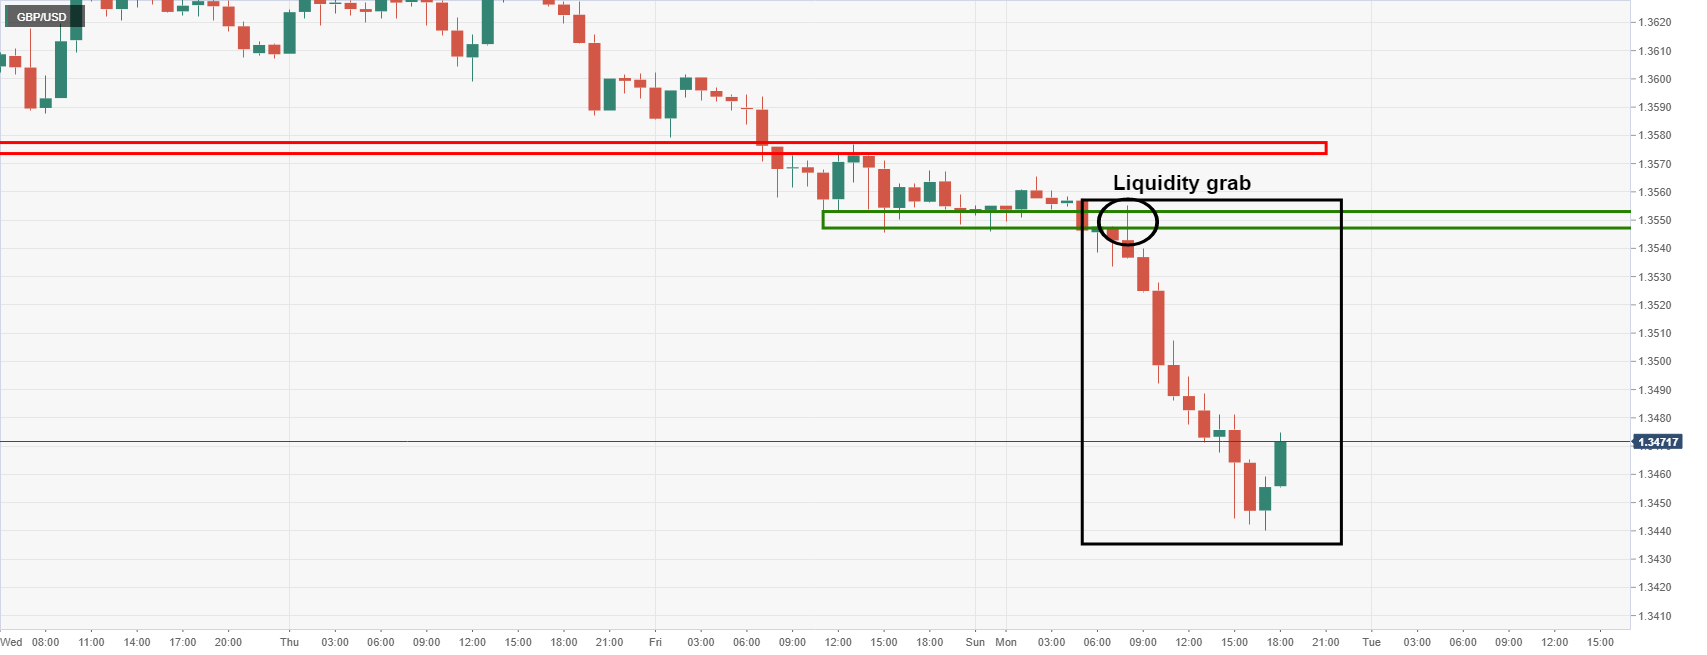
The price action and flight path followed suit into the weekly support target area.
At this juncture, much will now depend on geopolitics, global equities and the US dollar that will benefit from safe-haven flows or any uber hawkish surprise at the Federal Reserve meeting.
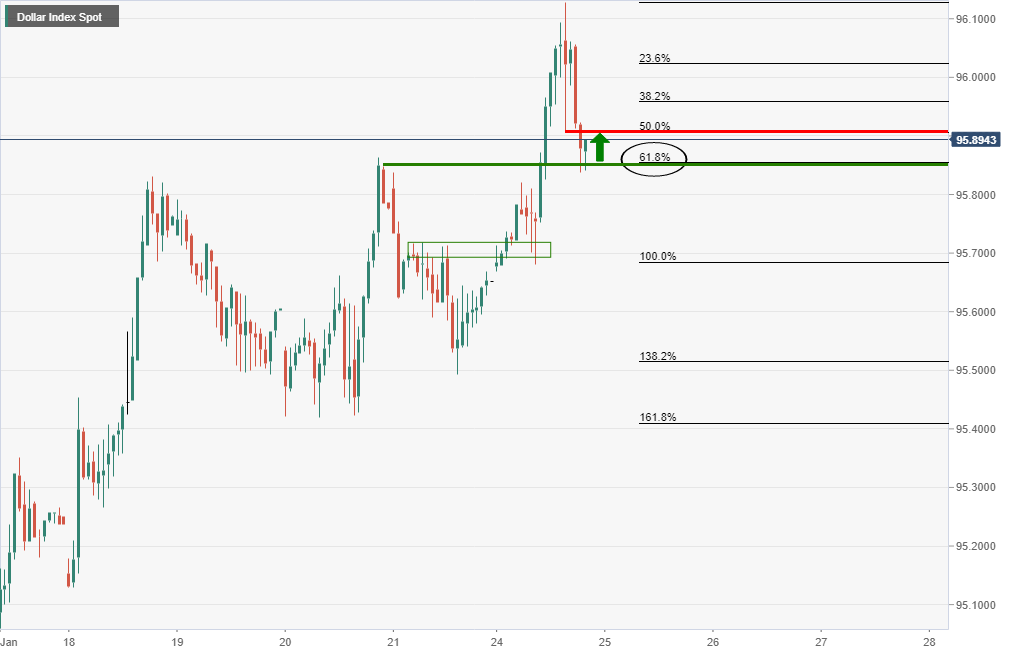
As it stands, the US dollar, as measured by the DXY index, is stalling for now:
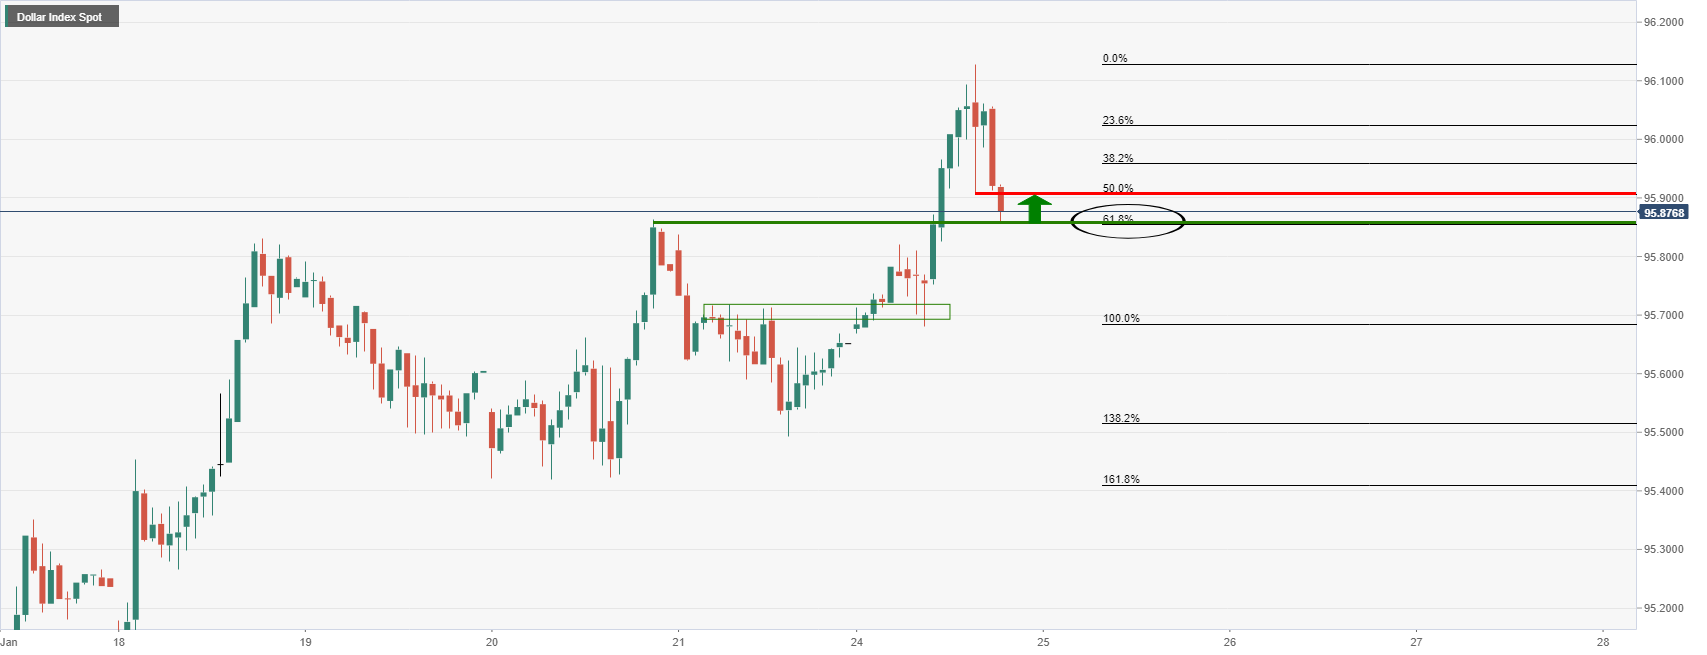
The 61.8% ratio meets with prior highs as a firm layer of potential support for the sessions ahead.
- The non-yielding metal edges up during the New York session, gains 0.29%
- The conflict between Russia and Ukraine escalates, triggering a risk-off market mood.
- XAU/USD Technical Outlook: Neutral-bullish, though a break under $1834 opens the door towards $1800.
In the last two hours, the yellow metal has dropped almost $10.00 amid increasing tensions in the Ukraine – Russian conflict, alongside increasing woes of the US central bank tightening monetary policy conditions. Nevertheless, at writing, gold is trading in the green at $1833.33 a troy ounce.
On Monday, NATO said that it was putting forces on standby and reinforcing eastern Europe military presence, in what Russia denounced an escalation of tensions over Ukraine, according to Reuters. The move responds to Russia’s, which amassed an estimated 100K troops near the Ukrainian border. Russia denies that an invasion is planned, but the deployment of forces from the north, east, and south spurred a crisis similar to the Russian Crimean annexation.
Usually, in geopolitical crises, gold is the ultimate safe-haven asset. However, with the Federal Reserve monetary policy meeting ahead of Wednesday, investors preferred to stay sidelined, awaiting its outcome. Among other investment banks, Goldman Sachs forecast at least four rate hikes in 2022, leaving the Federal Funds Rate (FFR) at 1%.
At press time, the US 10-year Treasury yield is at 1.7245%, down five basis points, while the 10-year Treasury Inflation-Protected Securities (TIPS) sits at -0.628%. In the meantime, the US Dollar Index, a measurement of the greenback’s value vs. a basket of six peers, edges up 0.36%, sitting at 95.983.
XAU/USD Price Forecast: Technical outlook
Gold has achieved to stay above July 15, 2021, daily high at $1,834, in the last three trading days. XAU/USD is neutral-upward biased, as portrayed by the daily moving averages below the spot price, but its horizontal slope leaves the yellow metal under downward pressure.
To the upside, XAU/USD’s first resistance would be the January 20, $1,847.90, followed by Pitchfork’s top trendline around the $1850-60 area, followed by November 16, 2021, daily high at $1,877.18.
On the flip side, gold’s first support is January 21 daily low at $1,828.53. A breach of the latter would expose the Pitchfork’s mid-line around $1,820-25 area, followed by the January 18 daily low at $1,805.75.
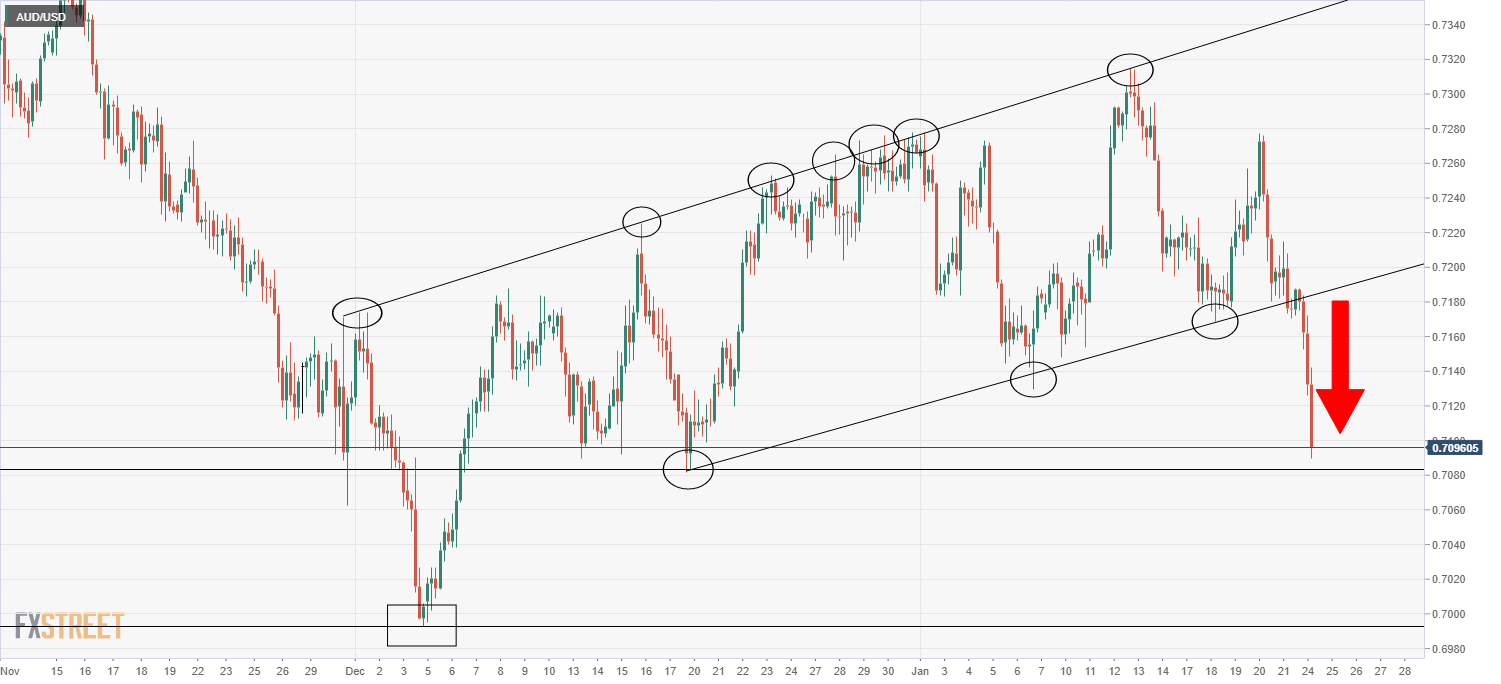
- AUD/USD bears stay in control and now test deeper support.
- Geopolitics could tip AUD/USD over the edge into the abyss and towards the depths of the 0.70 area.
As per the pre-open analysis, AUD/USD Price Analysis: Bears are in control at critical support, the bears have been in control at the start of this week and snapped the critical support.
AUD/USD prior analysis
AUD/USD, live daily chart
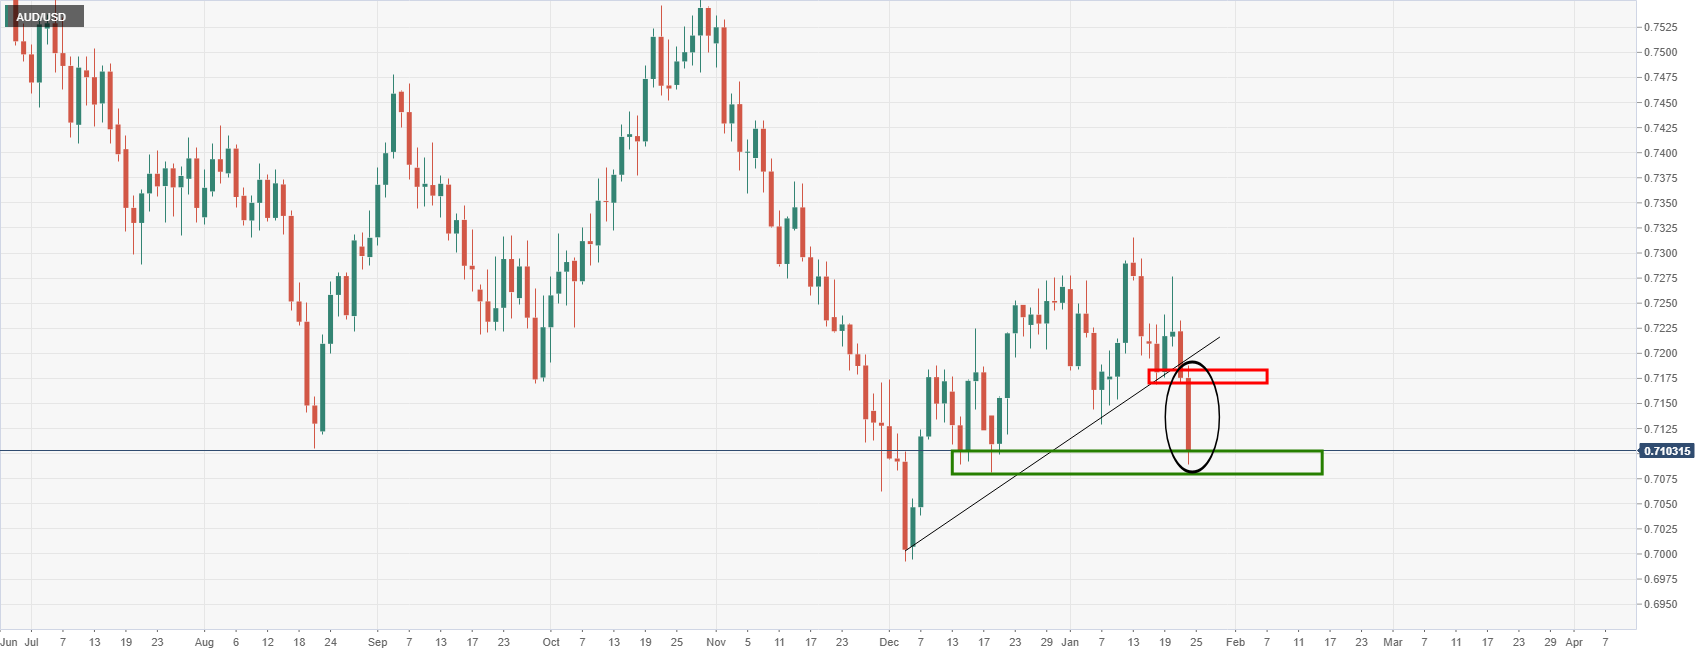
The risk-off tone to markets at the start of this week has seen US stocks plummet and the high beta currencies, such as the Aussie taken along for the ride.
Relatively higher yields in the US and the anticipation of Fed rate hikes this year suggests that USD could continue to benefit in the face of possible conflict in central Asia.
DXY H1 chart
The US dollar, as measured by the DXY index, is stalling for now and looks to be homing in on the 50% retracement of the last bullish impulse. The 61.8% ratio meets with prior highs as a firmer layer of potential support for the sessions ahead.
Meanwhile, AUD/USD's M-formation on the daily chart is a compelling chart pattern for the week ahead. A reversion towards 0.7150/60 would be expected for the days ahead:
However, considering how fluid the geopolitics is, if there is a Russian invasion of Ukraine, the US dollar would be expected to continue higher. In turn, this would be taking the Aussie down with it for a test of bullish commitments in the lower end of the 0.70 areas.
The base case is for a softer Australian dollar over time for analysts at Wells Fargo. However, they point out the risks appear tilted toward a smaller decline than their forecast of AUD/USD at 0.70 by the third quarter and at 0.68 by the end of the year.
Key Quotes:
“The economy is enjoying a solid rebound, and could prove more resilient than expected even in the face of the latest wave of COVID cases, a scenario that should offer some direct support for the Australian currency.”
“A resilient economy could also prompt the Reserve Bank fo Australia to end its bond purchases more quickly, and possibly signal earlier rate increases, both factors that would offer some support for the Australian dollar.”
“While not our base case, should Chinese growth respond in a strong positive fashion to policy easing from Chinese authorities, that would likely also be helpful for Australian dollar. In this more favorable scenario, the AUD/USD exchange rate could fall only moderately, perhaps not weakening much below the $0.7000 level.”
“We expect the RBA to hold its Cash Rate steady at 0.10% through all of 2022. However, we now see rate hikes beginning in early 2023, and expect a 15 bps rate hike in February next year, followed by 25 bps rate hikes in May, August and November.”
- USD/CAD is currently probing the 1.2700 level having rallied from the mid-1.2500s on Monday amid widespread losses for risk assets.
- Safe-haven demand amid geopolitical tensions and amid pre-Fed positioning has boosted the US dollar.
USD/CAD has continued to push higher in recent trade as the global risk asset rout has accelerated during US trading hours. US equities are now leading the downside, with the S&P 500 now down more than 3.0% on the day, and this is taking its toll on risk-sensitive currencies, of which the Canadian dollar is included. USD/CAD is now testing the 1.2700 level having started the day closer to 1.2550 and is on course to post on-the-day gains of about 1.0%. The loonie’s losses are on a similar scale to those being seen in its risk-sensitive G10 peers, like AUD (-1.1%), NZD (-0.8%), GBP (-0.8%) and NOK (-1.5%).
Monday’s swift move higher marks a clean upside break of the 1.2450-1.2550 range that had prevailed over the past week and a half and has seen the pair move above its 21-day moving average at 1.2640. USD/CAD hasn’t yet been able to surpass its 50DMA at just above the 1.2700 level, which is now acting as resistance. But if US stocks keep dropping at the present rate, it's only a matter of time. A break above 1.2700 would open the door to a test of the next major area of resistance around 1.2800.
US dollar strength as market participants look for safe-haven assets (the dollar’s safe-haven G10 peers the yen and Swiss franc are also doing well), but also as markets pre-position for a hawkish Fed meeting this week, is driving the upside. The bank is expected to pave the way for rate lift-off in March and will also continue to discuss its quantitative tightening (QT) options, which Fed Chair Jerome Powell is likely to talk about in the press conference. The minutes of this meeting will also be hotly anticipated a few weeks later for information on the QT discussion.
Some analysts/markets commentators have been going a bit over the top in recent days with their Fed calls (for example, some calling for the bank to hike at every meeting this year), meaning the bar to exceed already very hawkish expectations is high. But in a risk-off, hawkish Fed-dominated market environment, the argument to be short USD this week is not a strong one. One thing to note for USD/CAD is that if geopolitical tensions continue to escalate, this might drive oil prices back up again (they are currently down today in tandem with other risk assets). That could shelter the loonie from dollar strength to a degree.
- US equities have been getting battered on Monday, with the S&P 500 on course to close 10% below recent highs.
- The S&P 500 fell under 4300 to hit its lowest levels since July.
- US equities are suffering from a double whammy of concerns over Fed tightening and about a potential war in Ukraine.
US equity markets are trading sharply lower on Monday, with the S&P 500 index on course to confirm a “correction”, i.e. a close of more than 10% below the recent highs printed back in the first week of 2022. The index slumped below the 4300 level on Monday, to hit its lowest point since last July and is currently trading in the 4270s, down 2.8% on the day and down more than 10% since the start of the year.
The Nasdaq 100 index cratered 2.9% to hit the 14.0K level, taking its on-the-year losses to over 14.0% and its pullback from the November record highs to more than 16.0%. The Dow dropped 1.9% to fall into the mid-36K area, taking its on-the-year losses to 7.5% and losses versus recent record highs to just over 9.0%. The S&P 500 Volatility Index or VIX, meanwhile, continued its recent surge and surpassed its December “Omicron” high at 35.32 to nearly hit 38, its highest level since October 2020.
Driving the day
US equities are suffering from a double whammy of concerns over Fed tightening and concerns about the potentially imminent breakout of war in Eastern Europe. Regarding the former, markets are expecting a hawkish Fed to signal intent to hike interest rates multiple times this year, as well as reveal more details on potential quantitative tightening plans. The exact timing/speed of this tightening is hotly debated, with some analysts going as far as saying the Fed might even hike rates this week and then continue hiking rates at every meeting for the rest of the year.
That is probably a little over the top – since the pandemic, the Jerome Powell-led Fed has delivered clear forward guidance that it has largely stuck to and has been averse to wrong-footing markets. That should take a rate hike this week of the table. But momentum is clearly there for four, or maybe even more, rate hikes in 2022. The rapid shift in Fed direction (no one was talking about multiple 2022 rate hikes even as recently as November) has battered the cheap-money addicted sectors of US equity markets, such as the tech sector.
In terms of geopolitics, Western powers have been making moves to remove diplomats and their families from Ukraine in a signal that they anticipate a Russian invasion to be imminent. NATO leaders have also announced intentions to bolster troop presence in Eastern Europe, signaling fears that any potential conflict could spill across Ukrainian borders and into neighboring countries. Equity markets continue to watch the escalation in rhetoric/actions with concern and strategists note that Eastern European “war risk” could remain embedded in the price for some time.
- The GBP/USD plunges near 100-pips as risk-sentiment worsens in the day.
- Tensions in Eastern Europe, Fed tightening monetary policy conditions, and UK political issues weighed on the GBP.
- Although expansionary, IHS Markit Manufacturing PMI’s showed the impact of the Omicron variant.
At the time of writing, the British pound plunges during the New York session, trading at 1.3456, down almost close to 100-pips, as the Russian – Ukraine crisis escalates, alongside the Federal Reserve monetary policy meeting, which the US central bank could use to set the guidelines regarding tightening policy conditions.
In the meantime, the US stock indices get whipped out, losing between 1.67% and 2.51%, while in the FX market, the low yielders’ Japanese yen, Swiss Franc, the euro, and the greenback, are the gainers of the session.
UK IHS PMI came worse than expected
Early in the European session, the UK’s IHS Markit PMI for January came worse than expected. The Manufacturing PMI came at 56.9 vs. 57.6 expected, while the Services index was at 53.3 vs. 54.0 expected. The composite PMI came at 53.4 vs. 54.0, falling for the third straight month to the lowest since February 2021.
In the meantime, pressures on PM Boris Johnson keep mounting after the so-called Downing Street No 10 “party gate” came known by December of 2021. Johnson’s approval ratings are plunging, and reported by CNN, “there appears to be a growing sense among some parts of his ruling Conservative Party that he is becoming a liability.” In the last week, two polls suggested that two-thirds of voters want him to resign.
Putting this aside, Brexit jitters about the North Ireland protocol and article 16 would further pressure the weakened British pound, which has fallen in the month 0.58%.
Meanwhile, the US economic docket featured the IHS Markit PMI’s. The Manufacturing index came at 55.0 vs. 57.7 in December, while the Services index dropped seven points to 50.9 from 57.6. As a result, the composite hit the 50.8 mark, down from 57.0.
Therefore, GBP/USD trader’s focus is on the Federal Reserve monetary policy meeting, which begins on Tuesday. The monetary policy statement is released on Wednesday, followed by the Fed’s Chair Jerome Powell press conference.
According to analysts at Wells Fargo, the US Dollar should broadly strengthen against most emerging market currencies, including the Indian rupee as the Federal Reserve lifts interest rates and eventually shrinks its balance sheet. They forecast USD/INR at 74.50 by the end of the first quarter and at 75.00 by the third.
Key Quotes:
“India is currently experiencing a third wave of COVID infections lead by the Omicron variant, and early evidence suggests the renewed spread of the virus may be having a negative impact on economic activity. With that said, we do not expect another full-scale lockdown, and believe the economic effects of the current wave will be somewhat mild and rather short-lived. We do, however, expect inflationary pressures to build, and for core inflation to move above the upper bound of the Reserve Bank of India's target range in the near future.”
“As underlying inflation rises above the RBI's target range, we expect the central bank to turn more hawkish. To that point, we now expect policymakers to begin raising interest rates in Q1-2022 and to steadily tighten monetary policy over the course of this year.”
“Despite tighter monetary policy, we continue to believe the Indian rupee will weaken over the long term. Fed tightening should contribute to a weaker rupee; however, we expect depreciation to be gradual as the RBI would likely use its large stockpile of FX reserves to mitigate rupee volatility.”
- US dollar trims losses across the board, DXY back under 96.00.
- Wall Street indices sharply lower, but off lows.
- EUR/USD recovers and rises back to the recent range.
The EUR/USD dropped to 1.1289, reaching the lowest level since January 10 and then rebounded. It is back above 1.1320, still in negative territory but off lows and back above the critical 1.1300 area.
If the pair manages to remain above 1.1300 it would remain in the current range with resistance at 1.1350 (horizontal level and the 20-day moving average). A daily close clearly under 1.1300 should increase the bearish pressure, targeting 1.1270.
The rebound took place as US stocks move off lows and the DXY backed away from weekly highs. The Index peaked at 96.12 and is back under 96.00. Still, caution and risk aversion dominates financial markets, but over the last hours there have been some improvements. Metals and even crypocurrencies trimmed losses.
The euro has been among the top performers of the last hours. It erased losses versus the Swiss franc with EUR/CHF rising from 1.0295 to 1.0350 and it printed fresh weekly highs against the pound as EUR/GBP cling to 0.8400.
Ahead of the key event of the week, the FOMC meeting, US data released on Wednesday came in below expectations with the Service and Manufacturing Markit PMI at 50.9 and 55 respectably, below the 55 and 56.7 of market consensus.
Technical levels
- AUD/USD continued to decline in recent trade in tandem with the broader risk asset sell-off and is now under 0.7100.
- The pair broke below a key level of long-term support earlier in the session, exacerbating the selling pressure.
Since breaking below a key level of long-term uptrend support (in the 0.7180 area), AUD/USD has fallen sharply and, in recent trade, dipped below the 0.7100 level for the first time in more than one month. The pair, which currently trades in the 0.7090s, currently trades about 1.2% lower, with the Aussie one of the worst performing G10 currencies alongside NOK and SEK, though other risk-sensitive G10 currencies (GBP, CAD, NZD) are also fairing poorly.
The risk-off mood to FX market trade is a function of broader risk aversion, with US and European equities experiencing a sharp downturn and most risk-sensitive commodities also being hit. The S&P 500 is nearly 2.5% lower on the day, the Stoxx 600 is nearly 4.0% down on the day, WTI is nearly $2.0 lower and spot copper prices are about 2.5% lower. Market commentators are citing a combination of concerns over NATO/Ukrainian tensions with Russia and the rising risk of a war in Eastern Europe, as well as concerns about Fed tightening. A note from Goldman Sachs on Monday that got a lot of attention speculated the bank might hike interest rates at all of its remaining meetings in 2022.
Focus will switch back to domestic Australian themes during Tuesday’s Asia Pacific session when the all-important Q4 2021 Consumer Price Inflation report is released. Some think the data could bolster expectations for a hawkish RBA policy turn at upcoming meetings. According to Reuters, the median economist forecast is for the headline CPI rate to rise to 3.2% and for the core rate to rise to 2.4%, which would be the highest since 2014. Analysts at two Australian banks said they see the RBA’s preferred “trimmed mean” measure of inflation hitting 2.5%, putting back at the centre of the central bank’s 2-3% target inflation range two years ahead of current forecasts.
Analysts at one of the banks said that this will result in the RBA revising higher their CPI forecasts, with the new forecasts to show trimmed mean inflation remaining at the midpoint of the inflation target for the duration of the forecast horizon. “Come the RBA's February meeting, QE is clearly gone,” analysts at the bank said, adding that as “for the rates view, much depends on its (the RBA’s) willingness to tolerate inflation at or above target as it waits until wages growth is closer to 3% plus”.
Senior Economist Julia Goh and Economist Loke Siew Ting at UOB Group assesses the latest inflation data in the Malaysian economy.
Key Takeaways
“Headline inflation held above the 3.0% level at 3.2% y/y in Dec 2021 (Nov: +3.3%), in line with our estimate and Bloomberg consensus (both at 3.1%). This brought 2021 full-year inflation to an average of 2.5%, matching our full-year projection (MOF est: 2.4%; 2020: -1.2%).”
“December’s inflation outturn primarily reflected higher prices of food, furniture & furnishing, household appliances, recreation services & culture, restaurant & hotels, personal care, and financial services. Food prices as a whole posted the largest gain in nearly 4 years at 3.4% last month, with a broad-based increase across prices of food at home and away from home.”
“We expect inflation to average 3.0% in 2022 (MOF est: 2.1%) amid upside risks coming from prolonged global supply chain bottlenecks, post-pandemic labour shortages, volatile commodity prices, expiry of government’s price control schemes, and potential subsidy rationalization programs. That said, a sanguine outlook on the economic recovery coupled with more aggressive monetary policy tightening by Fed could trigger a more hawkish tilt in Bank Negara Malaysia’s (BNM) policy stance this year.”
- Manufacturing, Services and Composite PMI all fell to their lowest levels since 2020.
- There didn't seem to be much reaction at the time but the downbeat data likely won't help the market's mood improve.
According to a preliminary January survey by IHS Markit, Service PMI fell to 50.9 this month from 57.6 in December. That was much larger than the expected decline to 55.0 and marked the lowest reading since July 2020. IHS Markit's Manufacturing PMI also fell more than expected to 55.0 from 57.7 versus forecasts for a drop to 56.7. That marked the lowest such reading since October 2020. The Composite Index fell to 50.8 from 57.0, its lowest since July 2020.
Market Reaction
The weak US data doesn't seem to have triggered much of an FX or equity market reaction, though will likely contribute to the overarching downbeat market mood.
- USD/TRY keeps the consolidative trade well in place.
- No reaction to the recent steady stance from the CBRT.
- Turkey’s finmin sees inflation at around 40% in the next months.
Consolidation seems to be the new name of the game around USD/TRY, as it continues to trade within the 13.00-14.00 range since the beginning of the new year.
USD/TRY looks stabilized within 13.00-14.00
USD/TRY alternates gains with losses in the mid-13.00s, extending the prevailing side-lined mood for yet another session on Monday.
The lira seems to have derived some strength after Turkey’s finmin N.Nebati hinted at the idea that the domestic inflation could reach 40% in the next months earlier in the session, quite an ambitious target considering that consumer prices rose more than 36% in December vs. the same month of 2020 and Producer Prices gained almost… 80% YoY. Nebati also ruled out further tightening by the CBRT in the form of interest rate hikes.
In the meantime, there was no meaningful reaction in the FX space after the Turkish central bank (CBRT) left the One-Week Repo Rate unchanged at 14.00% at its meeting last Thursday, matching the broad consensus.
What to look for around TRY
The pair keeps the multi-session consolidative theme well in place, always within the 13.00-14.00 range. Higher-than-expected inflation figures released earlier in the year put the lira under extra pressure in combination with some cracks in the confidence among Turks regarding the government’s recently announced plan to promote the de-dollarization of the economy. In the meantime, the reluctance of the CBRT to change the (collision?) course and the omnipresent political pressure to favour lower interest rates in the current context of rampant inflation and (very) negative real interest rates are forecast to keep the domestic currency under pressure for the time being.
Key events in Turkey this week: Capacity Utilization, Manufacturing Confidence (Tuesday) – Economic Confidence Index (Friday).
Eminent issues on the back boiler: Progress (or lack of it) of the government’s new scheme oriented to support the lira via protected time deposits. Constant government pressure on the CBRT vs. bank’s credibility/independence. Bouts of geopolitical concerns. Much-needed structural reforms. Growth outlook vs. progress of the coronavirus pandemic. Earlier Presidential/Parliamentary elections?
USD/TRY key levels
So far, the pair is retreating 0.11% at 13.4107 and a drop below 12.7523 (2022 low Jan.3) would pave the way for a test of 12.7471 (55-day SMA) and finally 10.2027 (monthly low Dec.23). On the other hand, the next up barrier lines up at 13.9319 (2022 high Jan.10) followed by 18.2582 (all-time high Dec.20) and then 19.0000 (round level).
- A downbeat market sentiment favors the safe-haven status of the Japanese yen vs. the greenback, US T-bond yields fall.
- JP Morgan closes its long positions in the Russian rouble as tensions in Eastern Europe arise.
- USD/JPY Technical Outlook: Points upward, but a break under 113.50 could send the pair tumbling to 112.53.
After testing the YTD lows reached on January 14 around 113.48, the USD/JPY edges up, some 0.09%. At the time of writing, the USD/JPY is trading at 113.75 during the New York session.
Market sentiment downbeat amid increasing tensions in Eastern Europe and the Fed monetary policy meeting
The risk-off market mood spurred by increasing tensions in Eastern Europe and the two-day Federal Reserve monetary policy meeting keeps investors unease on mounting expectations that the US central bank would be aggressive tightening its policy conditions amid rising inflation, which reached 7% on December’s report.
According to Reuters, JP Morgan closed all its remaining long positions in the Russian rouble on Monday, “warning the military build-up near Ukraine meant geopolitical uncertainty was now prohibitively high.” That alongside the US 10-year Treasury yield moving lower, from around 1.80% in the last week, at press time plunges almost six basis points, from 1.772% to 1.719%, weighs on the USD/JPY, which has a positive correlation with US T-bond yields.
In the meantime, the US Dollar Index, a gauge of the greenback against six peers, is at 96.00, reached at 14:22 GMT.
The economic docket witnessed a release of Markit PMI’s across the globe. In Japan, the Manufacturing PMI rose to 54.6, but the Services component plummeted to 46.6 from 52.1 in December. As a result, the composite PMI is down to 48.8, the first time below 50 since the September reading. Meanwhile, the Markit PMI for the US will be unveiled at 14:45 GMT in the US. December’s reading portrayed the Manufacturing PMI at 57.7, the Services PMI at 57.6, and the Composite stayed at 57.0.
USD/JPY Price Forecast: Technical outlook
The USD/JPY daily chart witnessed a second touch at the YTD lows around 113.48, near the 78.6% Fibonacci retracement, drawn from November 2021 cycle lows at 112.53 up to January 4 pivot high at 116.34. That alongside the 100-day moving average (DMA) around 113.28 should cape any downward moves in the pair, which in the case of being broken, would expose November 30, 2021, daily low at 112.53.
The USD/JPY first resistance level would be 114.00. A breach of the latter would expose the 50-DMA at 114.32, followed by the January 18 daily high at 115.08.
- WTI has fallen back into the mid-$83.00s from earlier highs around $86.00.
- Oil prices have been selling off recently as the US dollar picks up and other risk assets decline.
Crude oil prices fell sharply on Monday in tandem with a broad risk asset pullback that has also seen US (and European) equities, risk-sensitive currencies and cryptocurrency markets move sharply lower. Front-month WTI futures currently trade in the mid-$83.00s per barrel, down about $1.50 on the day, having been as high as $86.00 earlier in the session. Support in the $83.00 area is for now holding up, but a break below here could open the door to a drop back towards $80.00 per barrel.
Traders have been citing a combination of Fed tightening fears (as this week’s Fed meeting looms) and concerns about geopolitical escalation in Eastern Europe as weighing on the macro mood. Safe-haven assets such as USD, JPY, CHF and bonds have been outperforming and generally seeing solid demand and some are attributing the stronger US dollar as another factor weighing on crude oil prices on Monday. A stronger dollar makes USD-denominated crude oil more expensive for the holders of international currencies, thus weighing on its demand.
Analysts note that, while the broadly downbeat market mood does seem to be weighing on crude oil prices, rising geopolitical tensions between Russia/Ukraine/NATO, as well as in the Middle Ease as the UAE fends off more Houthi militia attacks, are a source of upside risk for crude oil prices. It remains unclear how any NATO (economic) response to a Russian military incursion into Ukraine would impact the country’s more than 11M barrels per day in crude oil output.
EUR/CHF is now back at the December low near 1.0325/1.0310 – removal of which can trigger a dive towards the 1.0225/1.0210 area, economists at Société Générale report.
Break above 1.0450 needed to affirm a meaningful bounce
“Daily MACD is still in negative territory which denotes upside momentum is lacking.”
“The pair has to cross above 1.0450, the 61.8% retracement of recent down move to affirm a meaningful bounce.”
“Failure to defend 1.0325/1.0310 can lead to next leg of decline towards projections of 1.0275 and 1.0225/1.0210.”
The S&P 500 saw an aggressive fall of 5.7% last week and this leaves the market nearly down 9% from its 2021 record high. The weekly close below the 200-day moving average (DMA) at 4429 warns of further weakness to 4345, with scope for the October 2021 lows at 4290/79, analysts at Credit Suisse report.
VIX set to soar towards 35.00
“The S&P 500 closed the week below our corrective of its long-term 200-DMA, currently at 4429, reinforcing its existing top below 4582. With weekly RSI momentum also holding a major top, we look for further weakness yet.”
“Below the 78.6% retracement of the rally from last October at 4396 can see support next at a small price gap from last October at 4387/64, then potential trend/”neckline” support at 4345.”
“We see scope for a move below 4345 to test the key lows of last October at 4290/79, but we look for an attempt to find a floor above here. Below 4279 though would mark a further deterioration with support then seen next at the 38.2% retracement of the rally from October 2020 at 4213.”
“Resistance is seen at 4426/29 initially, then 4455 with the immediate risk seen staying lower whilst below 4495.”
“VIX above 27.40 warns of a further rise to 35.00.”
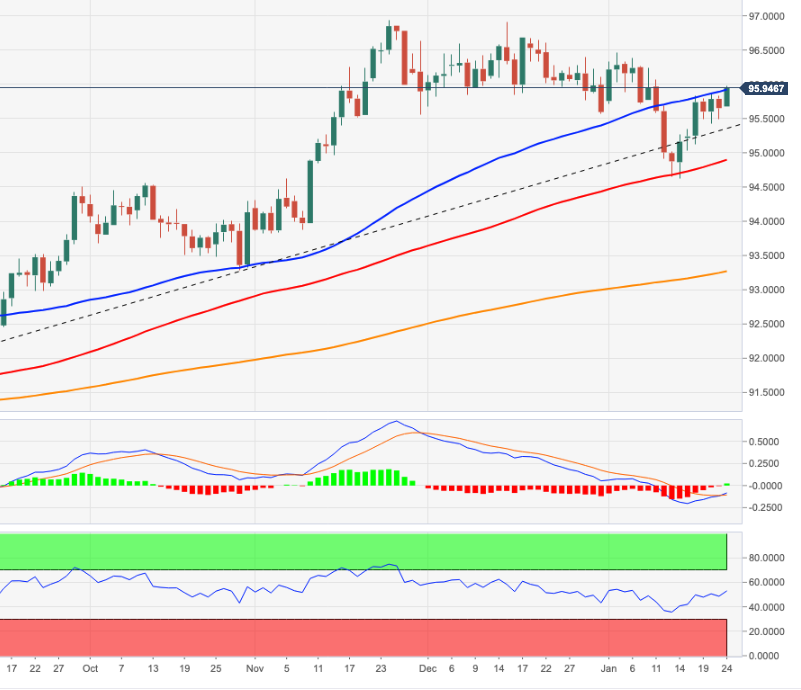
- Spot silver prices have pulled back sharply below the $24.00 level in recent trade, despite gold prices remaining resilient.
- The recent bout of selling pressure has seen XAG/USD hit its lowest levels since last Wednesday.
- Technicians are eyeing a test of support in the $23.70 and $23.40 areas.
Spot silver (XAG/USD) prices have been choppy in recent trade, with prices recently collapsing back to the south of the $24.00 level and towards $23.80, with the precious metal now trading lower by about 2.0% on the day. Silver is seeing divergence with spot gold on Monday, with the latter seemingly catching a bid amid safe-haven demand as a result of geopolitical concerns whilst the former fails to do so. Silver could be suffering as a result of a broadly stronger US dollar, which as (like gold) has been gaining on safe-haven grounds.
Either way, the recent bout of selling pressure has seen XAG/USD hit its lowest levels since last Wednesday. The bears will be eyeing support in the form of the 24, 25 November highs in the $23.70 area ahead of a potential retest of the late December highs in the $23.40 area. If silver does hit these levels, a big question will be whether the recent pullback has been sufficient to attract dip-buyers.
Ahead of this week’s Fed meeting, which is unanimously expected to be a very hawkish affair, the appeal of interest-rate-sensitive assets (such as precious metals) may be somewhat limited. Geopolitics and over-arching risk appetite will of course also be important drivers of silver this week, and US data in the form of Q4 GDP and December Core PCE inflation will be worth watching.
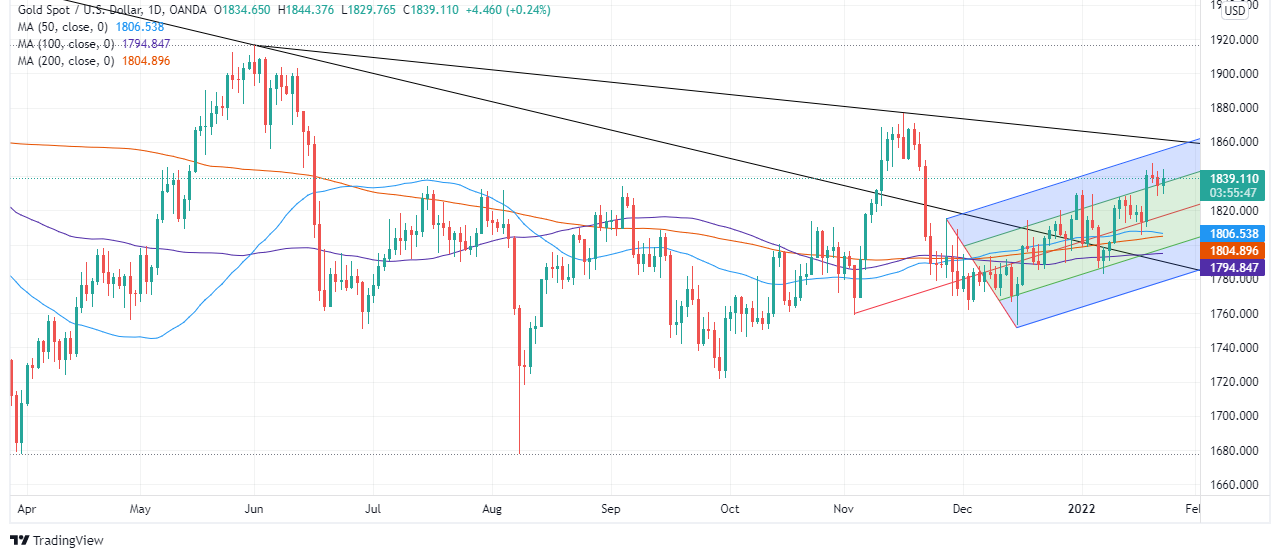
Gold is moving ahead into a time cycle change, which is likely to feature a season of change favouring a better outlook. Technically, gold is trapped within a current triangle pattern that requires prices to break and sustain over $1,876, Benjamin Wong, Strategist at DBS Bank, reports.
Looking for more horsepower
“On the Ichimoku weekly, gold is yet over the cloud’s resistance at $1,863 and the 50% Fibonacci retracement of the $2,075-$1,677 range grip at $1,876 to command a complete bullish outlook. Gold needs to garner more horsepower before it can stage the break of the triangle pattern, which means breaking through $1,876 and last June’s $1,916 peak.”
“Gold has so far peaked at $1,848 (retracing 76.4% the mid-November through mid-December drop), and a minor retracement of the 38.2% Fibonacci order can bring it back to $1,812. Below that rests the 50-day moving average (DMA) and 200-DMA confluence at $1,805.”
- A combination of negative factors dragged NZD/USD to an over one-year low on Monday.
- Hawkish Fed expectations provided a strong boost to the greenback and exerted pressure.
- The risk-off mood further contributed to driving flows away from the perceived riskier kiwi.
The NZD/USD pair edged lower through the early North American session and dropped to the 0.6680 area, or the lowest level since November 2020 in the last hour.
Following a brief consolidation during the first half of the trading on Monday, the NZD/USD pair met with a fresh supply and prolong its bearish trend witnessed over the past two weeks or so. The US dollar made a solid comeback amid growing acceptance that the Fed will tighten its monetary policy at a faster pace than anticipated.
In fact, the markets have fully priced in the prospects for an eventual lift-off in March and expect a total of four rate hikes in 2022. Apart from this, the risk-off mood – as depicted by an extension of the recent fall in the equity markets – further benefitted the safe-haven greenback and drove flows away from the perceived riskier kiwi.
Meanwhile, the combination of factors dragged the NZD/USD pair below the 2021 swing lows support, taking along some trading stops placed near the 0.6700 round-figure mark. Hence, the downfall could further be attributed to some technical selling, which might have already set the stage for a further near-term depreciating move.
Market participants now look forward to the release of the flash US PMI prints (Manufacturing and Services) for a fresh impetus. This, along with the US bond yields, will influence the USD price dynamics. Traders will further take cues from the broader market risk sentiment to grab some short-term opportunities around the NZD/USD pair.
The key focus, however, will remain on the outcome of a crucial two-day FOMC monetary policy meeting, scheduled to be announced during the US session on Wednesday. Investors will look for clues about the likely timing of when the Fed will commence its policy tightening cycle. This, in turn, will drive the USD and determine the near-term trajectory for the NZD/USD pair.
Technical levels to watch
- EUR/GBP hit its highest level in three weeks on Monday, reversing higher from an earlier dip to nearly hit 0.8390.
- Traders have attributed upside as a function of the generalised risk-off tone to broader macro trade.
- Mixed Eurozone and downbeat UK PMIs didn’t have much of an impact.
EUR/GBP hit its highest level in three weeks on Monday, reversing higher from an earlier dip towards the 0.8350 level to come within a whisker of hitting the 0.8390 mark. At current levels in the 0.8380s, the pair is trading with modest on-the-day gains of about 0.1%. Traders have attributed upside as a function of the generalised risk-off tone to broader macro trade. Markets worry that a Russian military incursion into Ukraine might be imminent as Western powers move to remove diplomats from Kyiv and reinforce the NATO presence in neighbouring countries.
US and European equities trade lower as a result and in FX markets, risk-sensitive currencies (like GBP) are the worse performers. Mixed preliminary January PMI results out of both the UK and Eurozone doesn’t seem to have shifted the dial much for EUR/GBP. In the Eurozone, the manufacturing PMI was substantially better than forecast, while services was a little worse. In the UK, the PMIs were worse than forecast across the board, but IHS said that with inflationary pressures remaining elevated near record highs, the BoE remains odds on to hike interest rates again at next week’s meeting.
Meanwhile, FX strategists continue to view the uncertainty about UK PM Boris Johnson’s future in the top spot as not having much of an impact on sterling. Analysts at MUFG said “we do not expect heightened political uncertainty to materially impact pound performance given there is unlikely to be any near-term change in government policies”. Analysts at ING said “politics has yet to hit GBP on the view that even if PM Johnson were to resign, Chancellor Sunak would be seen as a safe pair of hands as an alternative”. Ahead this week, there isn't much by way of notable tier one data aside from Spanish, French and German flash Q4 GDP numbers of Friday.
Economists at ABN Amro expect more weakness in EUR/USD. They forecast the pair at 1.05 and 1.00 by the end of 2022 and 2023, respectively.
Significant policy divergence between the Fed and the ECB over the coming years
“We now expect that the Fed will begin hiking interest rates in March 2022 and to hike four times in 2022.”
“We believe that the ECB is facing a different set of macroeconomic circumstances than faced by the US central bank. The ECB has also explicitly ruled out a rate hike in 2022 and has hinted that it could well be ‘on hold’ for much longer.”
“Our forecast for EUR/USD at year-end 2022 is 1.05 and 1.00 for year-end 2023.”
- USD/CAD gained strong positive traction for the second successive day on Monday.
- Fed rate hike bets, the prevalent risk-off mood boosted the safe-haven greenback.
- An intraday pullback in oil prices undermined the loonie and remained supportive.
The USD/CAD pair built on its intraday ascent and climbed to a nearly two-week high, around the 1.2625 region heading into the North American session.
The pair attracted some dip-buying near the 1.2555 area on Monday and built on the previous session's positive move from the very important 200-day SMA amid a broad-based US dollar strength. The markets have fully priced in the prospects for an eventual Fed lift-off in March and expect a total of four rate hikes in 202. This, along with the prevalent risk-off mood, provided a goodish lift to the safe-haven greenback and assisted the USD/CAD pair to gain traction for the second successive day.
On the other hand, an intraday pullback in crude oil prices undermined the commodity-linked loonie. This was seen as another factor that pushed the USD/CAD pair higher, taking along some short-term trading stops placed near the 1.2600 round-figure mark. Hence, the uptick could further be attributed to some technical buying. That said, any meaningful upside still seems elusive ahead of this week's key central bank event risks – the BoC and the FOMC monetary policy decisions on Wednesday.
The markets have been speculating that the Bank of Canada could increase rates as early as this week amid a jump in Canada’s annual inflation rate to a three-decade high in December. Apart from this, escalating geopolitical tensions between Russia and Ukraine as well as in the Middle East should limit the downside for crude oil prices. The fundamental backdrop makes it prudent to wait for a strong follow-through buying before confirming that the USD/CAD pair has bottomed out already.
Market participants now look forward to the release of the flash US PMI prints (Manufacturing and Services) for a fresh impetus. This, along with the broader market risk sentiment, will drive the USD demand. Traders will further take cues from oil price dynamics to grab some short-term opportunities around the USD/CAD pair.
Technical levels to watch
Enrico Tanuwidjaja, Economist at UOB Group, reviews the latest bank Indonesia (BI) event.
Key Takeaways
“BI kept rates unchanged at its first meeting of the year at 3.5%.”
“However, RRR hike is expected to start in March, signalling normalization has begun.”
“We keep our view for BI to start hiking in H2 2022 to reach 4.5% by the end of this year.”
- Gold is holding near $1840 despite the stronger USD on a heightened safe-haven bid amid geopolitical concerns.
- What is expected to be a very hawkish Fed meeting will test gold’s resilience this week.
As geopolitical concerns mount about a potential Russian military incursion into Ukraine, spot gold (XAU/USD) prices are finding support via safe-haven demand and, for now, shrugging off the negative headwinds from a firmer US dollar. XAU/USD has been gradually rising since the Monday Asia Pacific session open in the mid-$1830s to current levels around $1840. The subdued tone to trade in US government bond markets, where long-term yields are modestly lower (10 and 30-year -1bps), is also acting as somewhat supportive for the yield-sensitive precious metal.
A Goldman Sachs note warning that the Fed might lift interest rates at all of the remaining meetings this year got a lot of attention amongst analysts this morning but doesn’t seem to have moved the needle much for markets. Admittedly, US 2-year yields are about 2bps higher, but as noted, the rest of the yield curve is flat to lower with geopolitics the main topic of discussion so far on the day. That suggests the main driver of Monday’s USD upside (DXY +0.3% to near 96.00, near two-week highs) is safe-haven more than Fed-related, which is why gold has been able to trade on a stronger footing.
Whether gold’s resilience to ongoing dollar advances can last is another question. This week’s Fed meeting is likely to be a hawkish affair, though the bar for the meeting to exceed the market’s very hawkish expectations is seemingly quite higher. Gold bulls will be hoping that at the very least, the precious metal is able to hold within its recent $1830-$1845ish range.
A further escalation in the tense geopolitical situation in Eastern Europe might be enough to send XAU/USD back above $1850 if also coupled with less hawkish than feared Fed vibes. The other major events to watch out for this week include US earnings, which could shift equity and also macro sentiment, and the Advance Q4 GDP growth estimate (on Thursday) and December Core PCE (on Friday).
- EUR/USD resumes the downtrend and challenges 1.1300.
- Sellers aim at another visit to the 2022 low at 1.1272.
EUR/USD fades Friday’s decent advance and shifts the attention to the downside on Monday.
The bias appears tilted to further decline in the very near term. That said, a breach of recent lows in the 1.1300 zone should pave the way for a potential visit to the 2022 low at 1.1272 (January 4).
The longer term negative outlook for EUR/USD is seen unchanged while below the key 200-day SMA at 1.1712.
EUR/USD daily chart
UOB Group’s Senior Economist Julia Goh and Economist Loke Siew Ting comment on the latest interest rate decision by the Bank Negara Malaysia (BNM).
Key Takeaways
“Bank Negara Malaysia (BNM) kept the Overnight Policy Rate (OPR) unchanged at 1.75% … (20 Jan). This came in line with our estimate and market expectations. The next two scheduled monetary policy meetings are on 2-3 Mar and 10-11 May.”
“The overall tone of the latest statement remains optimistic on Malaysia’s growth outlook in 4Q21 and 2022. Key growth drivers include rising global demand, domestic private spending, improved labour market, and ongoing policy support. BNM sees underlying inflation or core inflation rising but to remain modest amid continued slack in the economy and labour market. The inflation outlook, however, is still subject to global commodity price movements and prolonged supply-related disruptions.”
“There was no mention of the need to review the degree of monetary accommodation. BNM continued to judge that the existing monetary policy stance remained appropriate and accommodative. However, given BNM’s sanguine outlook on the economic recovery and to be ahead of the curve, we think BNM may consider normalising interest rates in the coming months. Our view is also backed by improving labour market conditions, progress in vaccinations, and better management of the pandemic. We are revising our OPR view to two 25bps rate hikes, with the first hike in 2Q22 followed by another in 3Q22 (vs. one 25bps rate hike in 3Q22 previously). This will bring the year-end OPR target to 2.25%.”
- DXY advances to multi-day highs and flirts with 96.00.
- The YTD peak at 96.46 emerges as the next hurdle of note.
DXY quickly leaves behind Friday’s downtick and resumes the way up to the proximity of the 96.00 mark on Monday.
The intense upside in the dollar has recently surpassed the 4-month line, today near 95.30, and in doing so it has reinstated the short-term bullish bias. That said, a break above the temporary barrier at the 55-day SMA (95.89) should open the door to a move to the so far 2022 top at 96.46 (January 4).
Looking at the broader picture, the longer-term positive stance in the dollar remains unchanged above the 200-day SMA at 93.24.
DXY daily chart
Quek Ser Leang at UOB Group’s Global Economics & Markets Research noted USD/IDR is predicted to keep the 14,280-14,380 range in the near term.
Key Quotes
“USD/IDR traded between 14,275 and 14,375 for the whole of last week, higher than our expected consolidation range of 14,260/14,360. The relatively quiet price actions offer no fresh clues and we continue to expect USD/IDR to consolidate, likely within a range of 14,280/14,380.”
“Looking ahead, USD/IDR has to break below the rising trend-line support (currently at 14,240) or above the declining trend-line resistance (currently at 14,405) before a sustained directional movement is likely.”
- GBP/USD witnessed selling for the third successive day and dropped to over a two-week low.
- A sustained break below the 1.3535-1.3530 confluence was seen as a fresh trigger for bears.
- The stage now seems all set for a slide towards testing the 50% Fibo., around mid-1.3400s.
The GBP/USD pair added to its intraday losses and dropped to a two-and-half-week low, below the 1.3500 psychological mark during the mid-European session.
The UK political crisis, along with disappointing UK PMI prints undermined the British pound. Apart from this, a strong pickup in the US dollar demand turned out to be a key factor that dragged the GBP/USD pair lower for the third successive day.
From a technical perspective, a sustained break below the 1.3535-1.3530 confluence was seen as a fresh trigger for bearish traders. The mentioned region comprised of the 100-day SMA and the 38.2% Fibonacci retracement level of 1.3161-1.3749 strong move up.
Meanwhile, oscillators on the daily chart have just started drifting into the negative territory and support prospects for further losses. Hence, some follow-through slide towards the 50% Fibo. level, around the 1.3455 region, remains a distinct possibility.
On the flip side, any attempted recovery might now meet with a fresh supply near the 1.3530-1.3535 confluence support breakpoint. This, in turn, should cap the upside for the GBP/USD pair near the 1.3580-1.3585 region, which should now act as a pivotal point.
The latter is closely followed by the 1.3600 mark and the 23.6% Fibo. level, which if cleared decisively will negate the bearish bias. The GBP/USD pair might then accelerate the momentum towards the 1.3660 resistance en-route the 1.3700 round-figure mark.
GBP/USD daily chart
-637786232010138338.png)
Levels to watch
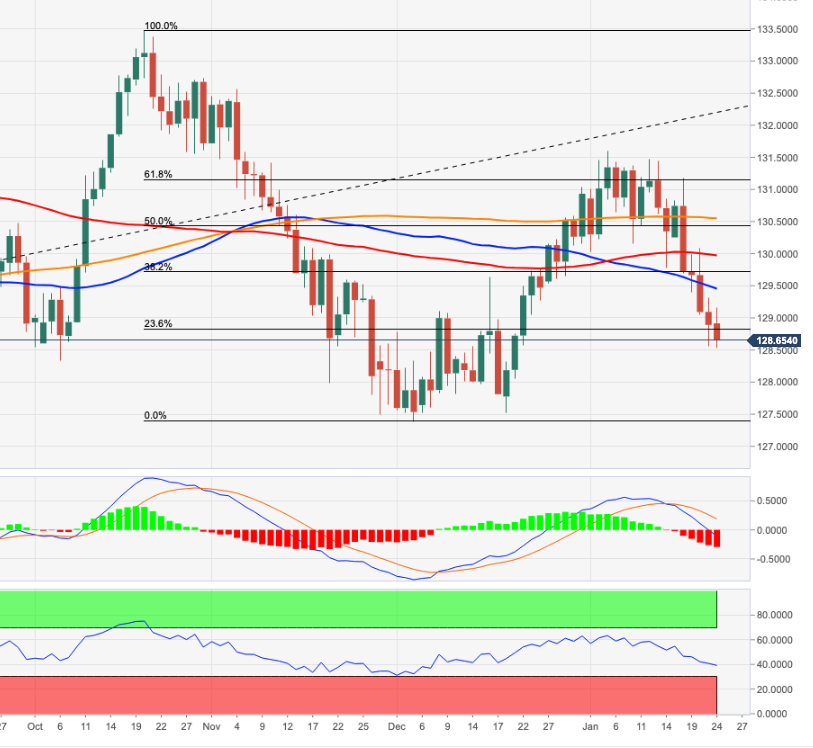
- EUR/JPY extends the leg lower to the mid-128.00s.
- Further south comes the December lows near 127.50.
EUR/JPY comes under further pressure in the 128.50 region at the beginning of the week.
Price action in the cross now seems to favour extra decline in the short-term horizon, particularly after EUR/JPY extended the breakdown of the key 200-day SMA (130.51) in past sessions. Next on the downside should come the December 2021 low near 127.50.
While below the 200-day SMA, today at 130.51, the outlook for the cross is expected to remain negative.
EUR/JPY daily chart
USD/MYR is still expected to navigate within the 4.1700-4.2000 range for the time being, suggested Quek Ser Leang at UOB Group’s Global Economics & Markets Research.
Key Quotes
“USD/MYR traded between 4.1800 and 4.1940 last week, narrower than our expected consolidation range of 4.1680/4.2060. Momentum indicators are mostly neutral and USD/MYR could continue to consolidate this week, expected to be within a range of 4.1700/4.2000.”
“Looking ahead, the risk of USD/MYR breaking below the bottom of the expected range (at 4.1700) first appears to be greater but any weakness is expected encounter solid support at 4.1620 and 4.1560.”
In its monthly report published on Monday, Germany's Bundesbank noted that the German economy likely shrunk in the last quarter of 2021, per Reuters.
Regarding the inflation outlook, Bundesbank said that price pressures could remain exceptionally high in early 2022 due to surging energy costs.
"The adjustments in behaviour and the triggered containment measures in some cases had a significant impact on economic activity in the service sector, especially in December," the Bundesbank noted in its publication. "Germany's real gross domestic product is likely to have fallen slightly in the final quarter of 2021."
Market reaction
The EUR/USD pair remains under bearish pressure during the European trading hours and was last seen losing 0.25% on the day at 1.1310.
Quek Ser Leang at UOB Group’s Global Economics & Markets Research suggested USD/THB could extend the range bound theme between 32.85 and 33.29 for the time being.
Key Quotes
“Last Monday (17 Jan, spot at 33.25), we held the view that USD/THB ‘could dip below 33.25’. We added, ‘the next support at 32.83 is unlikely to come into the picture’. While our view for a weaker USD/THB was not wrong, we did not expect the sharp drop that dipped below 32.83 (low of 32.81). The rebound from the low amid oversold conditions suggest that USD/THB is unlikely to weaken further.”
“For this week, USD/THB is more likely to consolidate and trade sideways between 32.85 and 33.29.”
- AUD/USD witnessed some selling for the second straight day and dropped to over a two-week low.
- Hawkish Fed expectations underpinned the USD and turned out to be a key factor exerting pressure.
- A generally weaker risk tone also contributed to drive flows away from the perceived riskier aussie.
The AUD/USD pair continued losing ground through the first half of the European session and dropped to over a two-week low, further below mid0.7100s in the last hour.
The pair extended last seek's rejection slide from the 100-day SMA resistance and witnessed some follow-through selling for the second successive day on Monday. The US dollar continued drawing some support from expectations that the Fed will tighten its monetary policy at a faster pace than anticipated. This, in turn, was seen as a key factor dragging the AUD/USD pair lower.
The markets seem convinced about an eventual Fed lift-off in March and have been pricing in a total of four hikes in 2022. This has been fueling concerns that rising borrowing costs could dent the earnings outlook for companies. This, along with escalating geopolitical tensions, weighed on investors' sentiment and further collaborated to drive flows away from the perceived riskier aussie.
Apart from this, the downfall could further be attributed to some technical selling below a short-term ascending trend-line support, around the 0.7200 mark, which was broken on Friday. The subsequent downfall might already set the stage for a further near-term depreciating move. Hence, a slide towards testing the next relevant support, around the 0.7100 mark, remains a distinct possibility.
Market participants now look forward to the release of the flash US PMI prints, due later during the early North American session. This, along with the US bond yields and the broader market risk sentiment, will influence the USD and provide some impetus to the AUD/USD pair. The focus, however, will remain on the outcome of the FOMC meeting, scheduled to be announced on Wednesday.
Technical levels to watch
Unfavourable equity market developments have taken away some of the support for the pound from the ongoing hawkish repricing of Bank of England (BoE) rate hike expectations. Economists at MUFG Bank expect the GBP to remain depressed if equity markets continue suffering losses.
Equity weakness hits pound even as BoE moves closer to another hike
“The 30-day correlation between daily % changes in cable and the MSCI’s ACWI equity index has risen back up to +0.65 from a recent low of +0.12 on 10th December. It has been the strongest sustained period of positive correlation between cable and global equity market performance since 2013, and highlights that the pound is vulnerable to further near-term weakness if equity market weakness extends.”
“The BoE is likely to raise rates again at their next meeting on 3rd February backed up as well by last week’s inflation and labour market reports from the UK. The recent earlier than expected rolling back of Plan B COVID-19 restrictions should further help to ease downside risks to growth at the start of this year.”
“The week ahead could prove important for the future of Prime Minster Boris Johnson ahead of the release of the much anticipated internal investigation into ‘partygate’. We do not expect heightened political uncertainty to materially impact pound performance given there is unlikely to be any near-term change in government policies.”
EUR/USD has failed to build on Friday's modest recovery gains and started to edge lower toward 1.1300 at the start of the week. Analysts at Credit Suisse believe that recent strength has been corrective only, with a break below 1.1272 needed to suggest the core downtrend has resumed.
Resistance at 1.1370 caps to keep the immediate risk lower
“With daily MACD momentum now turning lower again, this should add weight to our base case that the consolidation from last November and recent strength remains a corrective phase only ahead of the core downtrend eventually resuming.”
“Key near-term support stays seen at the recent reaction lows and uptrend from November at 1.1292/72. Below here should confirm the completion of a bearish continuation pattern for a resumption of the core downtrend to 1.1234/23 initially, then a retest of 1.1186/68.”
“Big picture, we continue to look for an eventual fall to our 1.1019/02 main objective.”
“Resistance at 1.1370 ideally caps to keep the immediate risk lower. Above can see further range trading and a recovery back to 1.1423/36.”
- GBP/USD continued losing ground for the third successive day on Monday.
- UK political crisis, dismal UK PMIs continued weighing on the British pound.
- Modest USD strength further contributed to the downtick to a two-week low.
The GBP/USD pair remained depressed through the early part of the European session and was last seen trading near a two-week low, around the 1.3535 region post-UK PMIs.
The pair extended its recent pullback from the vicinity of mid-1.3700s, or a two-month high and witnessed some selling for the third successive day on Monday. This also marked the sixth day of a negative move in the previous seven and was sponsored by a combination of factors.
Growing demands for Prime Minister Boris Johnson's resignation over a series of lockdown parties in Downing Street continued undermining the British pound. Apart from this, the emergence of some US dollar buying further contributed to the offered tone surrounding the GBP/USD pair.
On the economic data front, the flash version of the UK PMIs fell short of market expectations and showed that expansion in both the manufacturing and the services sectors slowed notably in January. The data did little to impress bulls or lend any support to the GBP/USD pair.
That said, increasing bets for additional rate hikes by the Bank of England held back traders from placing aggressive bearish bets around sterling. On the other hand, a fresh leg down in the US Treasury bond yields capped the USD gains and helped limit losses for the GBP/USD pair.
Investors also seemed reluctant and preferred to wait on the sidelines ahead of the key central bank event risk – the outcome of a two-day FOMC policy meeting on Wednesday. This makes it prudent to wait for a strong follow-through selling before positioning for any further decline.
Moving ahead, market participants now look forward to the release of the flash US PMI prints, due later during the early North American session. This, along with the US bond yields, will influence the USD price dynamics and produce some trading opportunities around the GBP/USD pair.
Technical levels to watch
NZD/USD is expected to see a clear break of 0.6703/6697 to mark a resumption of the downtrend for a move the lows from August and September 2020 at 0.6511/6488, analysts at Credit Suisse report.
NZD/USD to resume the core downtrend on a clear break of major support at 0.6703/0.6697
“With a major top already in place we continue to look for an eventual clear and sustained break below the lows of 2021 and 38.2% retracement of the entire 2020/2021 bull trend at 0.6703/6697 to mark the completion of a fresh bearish continuation pattern to confirm a resumption of the core downtrend. We would then see support next at the down trendline from March 2021 at 0.6662/60.”
“Whilst we would look for 0.6662/60 to hold at first, an eventual break should see weakness extend to 0.6588 ahead of our core objective at the lows from August and September 2020 at 0.6511/6488.”
“Resistance is seen at 0.6737/50 initially, then 0.6752/60, with 0.6806/19 ideally capping to keep the immediate risk lower. Above can see a recovery back to 0.6839/61, but with fresh sellers expected here again.”
- UK Manufacturing and Services PMIs came in slightly weaker than expected in January.
- GBP/USD continues to edge lower with the initial reaction.
Manufacturing PMI in the UK declined to 56.9 in early January from 57.9 in December, IHS Markit reported on Monday. This print came in worse than the market expectation of 57.9.
Further details of the publication revealed that the business activity in the services sector expanded at a softer pace than it did in December with the Services PMI edging lower to 53.3 from 53.6.
Assessing the survey's findings, "a resilient rate of economic growth in the UK during January masks wide variations across different sectors," explained Chris Williamson, Chief Business Economist at IHS Markit. "Consumer-facing businesses have been hit hard by Omicron and manufacturers have reported a further worrying weakening of order book growth, but other business sectors have remained encouragingly robust."
Market reaction
GBP/USD came under renewed bearish pressure on PMI figures and was last seen losing 0.17% on the day at 1.3529.
GBP/USD has started the new week under bearish pressure. The pair closes in on the key 1.3530 support, removal of which would allow further losses.
Pound looks vulnerable
“On the downside, 1.3530 (Fibonacci 38.2% retracement of the one-month-old uptrend) aligns as the first support. In case this level turns into resistance, cable could target 1.3500 (psychological level) and 1.3460 (200-period SMA).”
“Strong resistance seems to have formed at 1.3600 (fibonacci 23.6% retracement, 100-period SMA). A daily close above that level could be taken as a bullish sign and open the door for a more decisive rebound toward 1.3640 (50-period SMA).”
AUD/USD has broken its short-term uptrend from December to suggest the corrective recovery is over and broader downtrend is resuming. A break below the January YTD low at 0.7129 would clear the way for a fall to 0.6992/91 – the late 2020 and 2021 lows, economists at Credit Suisse report.
Short-term resistance moves to 0.7170
“Key now is the January YTD low at 0.7129, removal of which should reinforce our view to add momentum to the decline for a move back to 0.7089/82 and eventually a retest of medium-term support at .6992/91 – the late 2020 and 2021 lows.”
“Below 0.6992/91 should then open up an eventual move to the 50% retracement of the entire 2020/2021 uptrend at 0.6758, which remains our core medium-term objective.”
“Short-term resistance moves to 0.7170 with resistance at 0.7216/33 ideally now capping to keep the immediate risk lower. A break can clear the way for a move back to the high of last week and downtrend at 0.7277/84, but with fresh sellers expected here.”
- EUR/USD fails to advance further north of 1.1350 on Monday.
- Germany Flash Manufacturing PMI surprises to the upside in January.
- Advanced January PMIs also due across the pond later in the NA session.
EUR/USD trades on the defensive and leaves behind Friday’s decent gains on the back of the renewed buying interest around the US dollar.
EUR/USD remains supported by 1.1300 so far
EUR/USD maintains the consolidation well and sound at the beginning of the week, always underpinned by the 1.1300 neighbourhood amidst the better note in the greenback and despite another downtick in yields.
Indeed, the pair continues to look to dollar dynamics for price direction in the very near term, when the start of the Fed’s tightening cycle and the escalating effervescence in the Russia-Ukraine front keep dictating the sentiment among market participants.
In the domestic tap, Germany Flash Manufacturing PMI is expected to have improved to 60.5 for the current month, while the Services PMI is also seen bettering to 52.2. In the broader Euroland, the Manufacturing PMI came in at 59.0 and the Services gauge is predicted at 51.2.
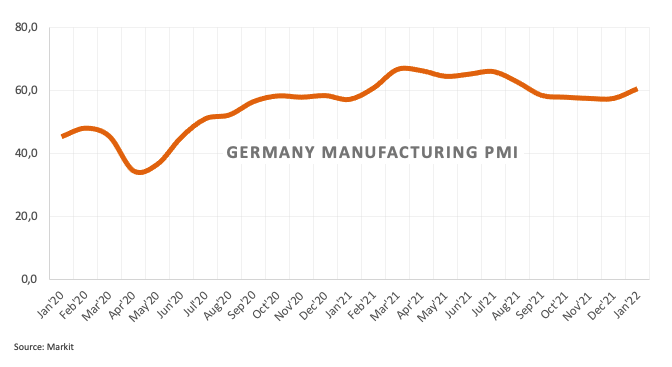
Later in the NA docket, Markit will also publish its manufacturing and services gauges along with the Chicago Fed National Activity Index.
What to look for around EUR
EUR/USD seems to have met a tough barrier in the area below 1.1500 in mid-January, sparking a corrective downside soon afterwards in tandem with the strong recovery in the greenback. Moving forward, there is not much optimism around the pair, particularly in light of the Fed’s imminent start of the tightening cycle vs. the accommodative-for-longer stance in the ECB, despite the high inflation in the euro area is not giving any things of cooling down for the time being. On another front, the unabated advance of the coronavirus pandemic remains as the exclusive factor to look at when it comes to economic growth prospects and investors’ morale in the region.
Key events in the euro area this week: Flash PMIs in Germany, France and EMU (Monday) – Germany IFO Business Climate (Tuesday) – Germany GfK Consumer Confidence (Thursday) – Germany Advanced Q4 GDP, EMU Final Consumer Confidence.
Eminent issues on the back boiler: Asymmetric economic recovery post-pandemic in the euro area. ECB stance/potential reaction to the persistent elevated inflation in the region. ECB tapering speculation/rate path. Italy elects President of the Republic in late January. Presidential elections in France in April.
EUR/USD levels to watch
So far, spot is losing 0.16% at 1.1325 and faces the next up barrier at 1.1372 (10-day SMA) seconded 1.1482 (2022 high Jan.14) and finally 1.1505 (200-week SMA). On the other hand, a break below 1.1300 (weekly low Jan.21) would target 1.1272 (2022 low Jan.4) en route to 1.1221 (monthly low Dec.15 2021).
- German Manufacturing and Services PMIs came in above expectations in January.
- EUR/USD continues to fluctuate in a relatively tight daily range.
The economic activity in Germany's manufacturing sector grew at its strongest pace in five months with Markit Manufacturing PMI jumping to 60.5 from 57.4 in December. This print surpassed the market expectation of 57.
Additionally, Markit Services PMI advanced to 52.2 from 48.7 in December, showing that Germany's service sector moved back into the expansion territory.
Commenting on the data, "January’s flash PMI numbers came in comfortably above consensus to show a surprisingly resilient performance from the German economy at the start of the year," noted Phil Smith, Economics Associate Director at IHS Markit. "Still, rising costs remain a concern for businesses, with the survey data showing that input prices are continuing to rise sharply and on multiple fronts."
Market reaction
The shared currency failed to capitalize on the upbeat PMI readings and the EUR/USD pair was last seen posting small daily losses at 1.1326.
- Markit Manufacturing PMI for eurozone rose slightly in January.
- Service sector lost growth momentum at the start of the new year.
- EUR/USD continues to trade in the negative territory, holds above 1.1300.
The business activity in the eurozone's manufacturing sector expanded at a more robust pace in early January than it did in December with IHS Markit's Manufacturing PMI rising to 59 from 58. This print surpassed the market expectation of 57.5.
On a negative note, Services PMI fell to 51.2 from 53.1 in December, compared to analysts' estimate of 52.2. Finally, Composite PMI edged lower to 52.4 from 53.3.
Commenting on the data, "while the Omicron wave has dented prospects in the service sector, the impact so far looks less severe than prior waves," noted Chris Williamson, Chief Business Economist at IHS Markit. "Prices for goods and services are rising at a joint-record rate as increasing wages and energy costs offset the easing in producers’ raw material prices, dashing hopes of any imminent cooling of inflationary pressures."
Market reaction
The EUR/USD pair stays under modest bearish pressure following these data and was last seen losing 0.12% on the day at 1.1327.
According to FX Strategists at UOB Group, the prospects for USD/CNH to break below 6.3300 seems to have increased as of late.
Key Quotes
24-hour view: “Last Friday, we highlighted that USD ‘could edge higher but any advance is unlikely to break 6.3610’. Instead of edging higher, USD dipped to a low of 6.3380. Downward momentum has improved somewhat and the risk is tilted to the downside. That said, any weakness is expected to encounter solid support at 6.3300. Resistance is at 6.3445 followed by 6.3520.”
Next 1-3 weeks: “In our latest narrative from Monday (17 Jan, spot at 6.3610), we highlighted that odds for further USD weakness are not high. We added, only a breach of 6.3710 (‘strong resistance’ level) would indicate that the downside risk has dissipated. On Friday, USD dropped to a low of 6.3380 and downward momentum is beginning to perk up and the chance for USD to break the major support at 6.3300 has increased. Looking ahead, the next support is at 6.3180. On the upside, the ‘strong resistance’ level has moved lower to 6.3650 from 6.3710.”
- USD/CHF struggled to preserve its modest intraday gains amid the risk-off mood.
- Modest USD strength extended some support to the major and helped limit losses.
- Investors might also prefer to wait on the sidelines heading into the FOMC meeting.
The USD/CHF pair surrendered a major part of its intraday gains and was last seen trading just a few pips above the daily low, around the 0.9120 region.
Having defended the 0.9100 mark, the USD/CHF pair gained some positive traction on the first day of a new week amid the emergence of some US dollar buying. Firming expectations for an eventual Fed lift-off in March turned out to be a key factor that underpinned the greenback and extended some support to the major.
That said, an intraday pullback in the US Treasury bond yields held back the USD bulls from placing aggressive bets. On the other hand, a generally weaker risk tone benefitted the safe-haven Swiss franc. This, in turn, kept a lid on any meaningful upside for the USD/CHF pair, rather prompted fresh selling at higher levels.
The markets remain concerned about the earnings outlook for companies amid the prospects for a faster policy tightening by the Fed. This, along with escalating geopolitical tensions between Russia and Ukraine as well as in the Middle East, further weighed on investors' sentiment and led to a further decline in the equity markets.
That said, the downside is likely to remain limited as investors might prefer to wait on the sidelines ahead of the key central bank event risk. The Fed is scheduled to announce the outcome of a two-day monetary policy meeting on Wednesday. This will influence the USD and provide a fresh directional impetus to the USD/CHF pair.
In the meantime, traders on Monday will take cues from the US economic docket – featuring the release of the flash PMI prints (Manufacturing and Services). This, along with the US bond yields, will drive the USD demand. Apart from this, the broader market risk sentiment might further produce some short-term opportunities around the USD/CHF pair.
Technical levels to watch
- The index kicks in the week on an optimistic mood.
- US yields extend the corrective downside on Monday.
- Flash Markit’s PMIs next of note in the US calendar.
The greenback, in terms of the US Dollar Index (DXY), manages to reverse Friday’s pullback and resumes the upside at the beginning of the new trading week.
US Dollar Index focuses on yields, data, geopolitics
The index extends the consolidative theme in the upper end of the consolidative phase for yet another session on Monday, always tracking the price action in the US money markets, geopolitics and the broad risk appetite trends.
The greenback remains vigilant, albeit so far apathetic when it comes to reaction in prices, on the developments from the US-Russia-Ukraine conflict, where the latest US-Russia talks yielded no progress on this front.
In the meantime, US yields extend the move lower after hitting fresh tops earlier in the past week amidst some profit taking mood and the persistent adjustment from investors to the prospects of a sooner-than-anticipated Fed’s lift-off.
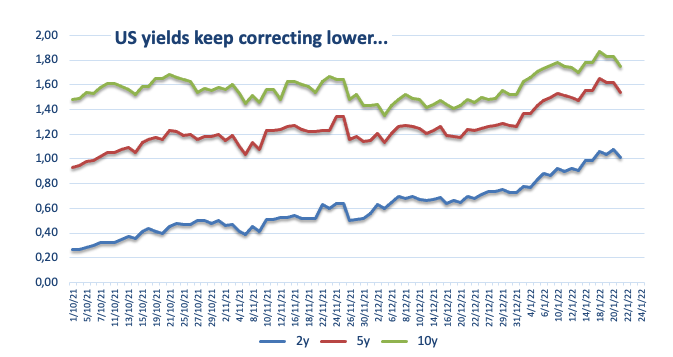
In the US data space, the Chicago Fed National Activity Index is due in the first turn seconded by the more relevant advanced PMIs measured by Markit for the month of January.
What to look for around USD
Despite Friday’s pullback, the index managed to close the week in a positive note well north of the 95.00 barrier. In spite of consensus already priced in a probable move on rates by the Fed at the March meeting, the constructive outlook for the greenback is expected to remain unchanged into this week and ahead of the FOMC event on Wednesday. Looking at the broader scenario, higher US yields, persistent elevated inflation, supportive Fedspeak and the solid pace of the US economic recovery should continue to underpin the buck in the months to come.
Key events in the US this week: Chicago Fed National Activity Index, Flash PMIs (Monday) – House Price Index, CB Consumer Confidence (Tuesday) – Trade Balance, New Home Sales, FOMC Meeting, Powell’s Press Conference (Wednesday) – Durable Goods Orders, Advanced Q4 GDP, Initial Claims, Pending Home Sales (Thursday) – PCE, Personal Income/Spending, Final Consumer Sentiment (Friday).
Eminent issues on the back boiler: Fed’s rate path this year. US-China trade conflict under the Biden administration. Debt ceiling issue. Escalating geopolitical effervescence vs. Russia and China.
US Dollar Index relevant levels
Now, the index is losing 0.08% at 95.64 and a break above 95.83 (weekly high Jan.18) would open the door to 96.46 (2022 high Jan.4) and finally 96.93 (2021 high Nov.24). On the flip side, the next down barrier emerges at 94.75 (100-day SMA) followed by 94.62 (2022 low Jan.14) and then 93.27 (monthly low Oct.28 2021).
Euro stays on the back foot to start the week. Economists at OCBC Bank think the EUR/USD pair is likely to break below the 1.1300 level.
Geopolitical tensions with Russia to have important implications for the euro
“At this juncture, risk-reward likely favours a downside breach of 1.1300, rather than moving higher towards 1.1500.”
“Outright conflict over Ukraine may be a strong directional impetus.”
- NZD/USD was seen consolidating its recent slide back closer to the 2021 swing low.
- Rebounding US bond yields helped revive the USD demand and acted as a headwind.
- The downside seems limited as investors seem reluctant ahead of the FOMC meeting.
The NZD/USD pair languished near monthly low through the early European session, with bears still awaiting a sustained break below the 0.6700 round-figure mark.
The pair, so far, has struggled to gain any meaningful traction and now seems to have entered a bearish consolidation phase near the 2021 low touched in December. The US dollar was back in demand on the first day of a new week amid rebounding US Treasury bond yields and the prospects for a faster policy tightening by the Fed. This, in turn, was seen as a key factor that acted as a headwind for the NZD/USD pair.
Investors seem convinced that the Fed would begin raising interest rates in March to combat high inflation and have been pricing in a total of four hikes in 2022. This has been fueling concerns that rising borrowing costs could dent the earnings outlook for companies. This, along with escalating geopolitical tensions, weighed on investors' sentiment and further capped the upside for the perceived riskier kiwi.
The downside, however, remains cushioned, at least for the time being, as investors seemed reluctant to place aggressive bets ahead of the key central bank event risk. The Fed is scheduled to announce the outcome of a two-day policy meeting during the US session on Wednesday. This will play a key role in influencing the near-term USD price dynamics and help determine the next leg of a directional move for the NZD/USD pair.
In the meantime, traders on Monday will take cues from the release of the flash US PMI prints, due later during the early North American session. Apart from this, the US bond yields and the broader market risk sentiment will drive the USD demand. This, in turn, should allow traders to grab some short-term opportunities around the NZD/USD pair.
Technical levels to watch
New Zealand will release Consumer Price Index (CPI) data on Wednesday. Strong figures could lift the kiwi, which is expected to climb back to the 0.6800 level, according to economists at ING.
Another big jump in inflation
“The market’s tightening expectations for the Reserve Bank of New Zealand are already quite aggressive (a 25bp hike in mid-February and at least five more in 2022), but we think that a strong CPI read may fuel speculation that the Bank will go for 50bp in February, which should be translated into a stronger NZD.”
“We think NZD/USD can make its way back to the 0.6800 mark, although that clearly relies on a stabilisation in the overall risk environment.”
Gold attracted some dip-buying on the first day of a new week and reversed a major part of the previous week's pullback from a two-month high. Economists at TD Securities expect the yellow metal to consolidate around the $1,830 mark this week.
Market continues to pencil in additional Fed rate hikes
“Money managers reduced net length in their gold holdings. As the market continues to pencil in additional Fed rate hikes, with a full 4 hikes priced for 2022 and a near-certain March rate hike priced, precious metals appear vulnerable to a consolidation following this substantial shake-up in position.”
“We expect gold to hold near current $1,830/oz level into next week, with positioning likely moving toward the longs.”
Inflation will actually be high in the United States and the eurozone, probably until the summer of 2022, but this is not necessarily negative for equities, on the contrary. Economists at Natixis believe that in the current configuration, inflation will drive share prices up and not down.
Inflation is not necessarily bad for equities
“If nominal wages react less than proportionately to inflation, a rise in producer prices will push down real wages and drive up earnings. If nominal interest rates rise less than inflation, inflation will push down real interest rates.”
“If inflation leads to higher earnings and lower real interest rates, it is conducive to a rise in stock market indices. So we should stop writing that inflation threatens equity markets.”
Economists at ING expect CAD outperformance as the Bank of Canada (BoC) hikes on Wednesday. The USD/CAD pair could slip to the 1.2450/00 neighborhood.
A 25 bps rate hike by the BoC
“The current restrictions in Ontario – which are however due to be eased at the end of next week – make it a close call, but we think the BoC will hike interest rates by 25 basis points on Wednesday.”
“The market is currently attaching a 70% implied probability of a hike, which leaves some room for the CAD to appreciate after the announcement, especially as that should reinforce the view that the BoC will lead the Fed tightening by 1-2 months and by 25-50 basis points.”
“We expect a drop in USD/CAD to the 1.2400/1.2450 area if our expectation for a hike prove correct.”
Another tick higher in inflation, but the Reserve Bank of Australia (RBA) tightening is still far. Analysts at ING believe that the AUD/USD pair could build some support at 0.72.
Tick-up in inflation to provide some help
“The 4Q inflation report published tonight in Australia should see a mild acceleration in the headline rate from the latest 3.0% read. This could keep hawkish expectations on the Reserve Bank of Australia alive and help build a floor under the Aussie dollar.”
“The current pricing for RBA tightening seems unrealistic, which poses downside risks further down the road for AUD. Until some sort of reality check from the RBA forces some re-pricing of rate expectations, the very oversold AUD could find some support in periods of stable risk sentiment, although the exposure to China and its zero-covid policy should continue to put a curb on any sustained rally.”
“This week, we could see AUD/USD consolidate in the 0.7200/0.7250 area.”
- Rebounding US bond yields revive the USD demand and extended some support to USD/CAD.
- Bullish crude oil prices underpinned the loonie and capped any meaningful gains for the pair.
- Investors seemed reluctant to place aggressive bets ahead of the Fed and BoC on Wednesday.
The USD/CAD pair reversed an intraday dip and climbed to a nearly two-week high, around the 1.2585 region during the early European session.
The pair attracted some dip-buying near the 1.2555 area on Monday and is now be looking to build on the previous session's positive move amid modest US dollar strength. The prospects for a faster policy tightening by the Fed, along with escalating geopolitical tensions revive the USD demand and acted as a tailwind for the USD/CAD pair.
Investors seem convinced that the Fed would begin raising interest rates in March to combat high inflation and have been pricing in a total of four hikes in 2022. Apart from this, concerns about a possible Russian attack on Ukrain further benefitted the greenback's relative safe-haven status and extended some support to the USD/CAD pair.
Meanwhile, crude oil prices remained well supported by worries about supply disruption amid rising tensions in Eastern Europe and the Middle East. Apart from this, speculations that the Bank of Canada could increase rates as early as this week further underpinned the commodity-linked loonie. This, in turn, capped the upside for the USD/CAD pair.
Investors might also prefer to wait on the sidelines ahead of the key central bank event risks – the BoC policy decision and the outcome of a two-day FOMC meeting on Wednesday. The fundamental backdrop makes it prudent to wait for a strong follow-through buying before confirming that the USD/CAD pair has formed a strong base near mid-1.2400s.
In the meantime, traders on Monday will take cues from the release of the flash US PMI prints, due later during the early North American session. Apart from this, the US bond yields and the broader market risk sentiment will influence the USD. This, along with oil price dynamics, should produce some short-term opportunities around the USD/CAD pair.
Technical levels to watch
Economists at ING think some dollar softness after the FOMC can help EUR/USD climb back to the 1.1415/20 area this week.
Russia-Ukraine tensions in focus
“A slightly softer dollar environment around the Fed could see EUR/USD trade up to the 1.1415/20 area, though we do not expect gains to last.”
“The euro seems to be pricing in little to no geopolitical risk, so the downside risks for the common currency are non-negligible if tensions with Russia flare up.”
European Central Bank (ECB) Governing Council member Francois Villeroy de Galhau reiterated on Monday that the ECB stands ready to do what it takes to get inflation back down below 2%, as reported by Reuters.
"We need to progressively normalise the monetary policy," Villeroy further added.
Market reaction
These comments don't seem to be having a noticeable impact on the shared currency's performance against its major rivals. As of writing, the EUR/USD pair was trading at 1.1328, where it was down 0.12% on a daily basis.
USD/JPY could extend the downtrend to the 113.00 neighbourhood if 113.40 is cleared in the near term, noted FX Strategists at UOB Group.
Key Quotes
24-hour view: “Last Friday, we held the view that USD ‘is likely to break 113.70 but the next support at 113.40 is unlikely to come under threat’. Our view was not wrong as USD dropped to 113.68 before recovering. Downward pressure appears to have eased and USD is unlikely to weaken further. For today, USD is more likely to trade sideways between 113.60 and 114.20.”
Next 1-3 weeks: “There is not much to add to our update from last Friday (21 Jan, spot at 113.90). As highlighted, shorter-term downward momentum has improved but USD has to break 113.40 before a decline to 113.00 is likely. The chance for USD to break 113.40 is not high but it would increase further as long as USD does not move above 114.45 (no change in ‘strong resistance level’ from last Friday).”
Gold stays in consolidation mode around $1,840 after rallying to its highest level in two months near $1,850 on Thursday. In the opinion of FXStreet’s Haresh Menghani, XAU/USD bulls are likely to stay on the sidelines.
The $1,830-$1,828 zone to act as immediate support
“Gold showed some resilience below the $1,830 resistance-turned-support and the subsequent strength favours bullish traders. That said, any further move up is likely to confront resistance near last week’s swing high, around the $1,848 region. The next relevant hurdle is pegged near a downward sloping trend-line extending from June 2021 swing high, currently around the $1,860 region. A convincing breakthrough would be seen as a fresh trigger for bullish traders and pave the way for an extension of the recent move up witnessed over the past one month or so.”
“On the flip side, the $1,830-$1,828 zone might continue to act as immediate support, which if broken might prompt some technical selling and accelerate the fall towards the $1,812 horizontal zone. This is followed by the very important 200-day SMA, currently around the $1,805 region, ahead of the $1,800 round figure. Some follow-through selling below an upward sloping trend-line support, extending from the August 2021 swing low, currently around the $1,794 region, will negate any positive bias and turn gold vulnerable.”
- Silver extends pullback from six-week-old resistance line, refreshes intraday low.
- Bearish MACD signals favor declines towards 61.8% Fibonacci retracement.
- Two-day-old resistance line guards immediate upside.
Silver remains on the back foot around $24.10, down 0.50% intraday heading into Monday’s European session.
In doing so, the bright metal extends Thursday’s U-turn from an upward sloping resistance line from December 13.
The pullback moves gain support from the bearish MACD signals to direct silver bears towards the 61.8% Fibonacci retracement (Fibo.) level near $23.90.
However, the commodity’s further declines will be challenged by the 50-SMA surrounding $23.55.
Alternatively, fresh recovery needs to cross the immediate resistance line around $24.30 to recall silver buyers.
Even so, a bit broader resistance line near $24.80 and multiple levels marked during mid-November near $25.00 will challenge the XAG/USD buyers afterward.
Silver: Four-hour chart
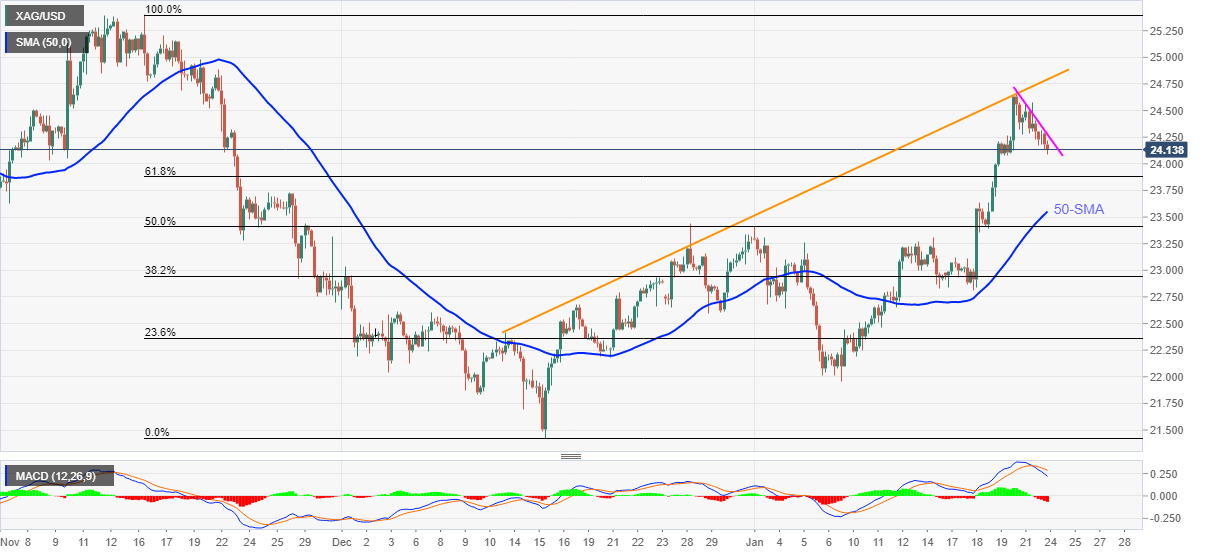
Trend: Further declines expected
- The risk-on impulse undermined the safe-haven JPY and assisted USD/JPY to regain traction.
- Rebounding US bond yields revived the USD demand and remained supportive of the uptick.
- Escalating geopolitical tensions held back bulls from placing aggressive bets and capped gains.
The USD/JPY pair maintained its bid tone heading into the European session, albeit has retreated a few pips from the daily high and was last seen trading around the 113.75 region.
A combination of supporting factors assisted the USD/JPY pair to attract some buying on the first day of a new week and snap three consecutive days of the losing streak. A generally positive tone around the equity markets undermined the safe-haven Japanese yen and acted as a tailwind for the major. Bulls further took cues from a goodish rebound in the US Treasury bond yields, which helped revive the US dollar demand.
Apart from this, the greenback was further underpinned by the growing market acceptance that the Fed will tighten its monetary policy at a faster pace than anticipated. Investors seem convinced that the Fed would begin raising interest rates in March to combat high inflation and have been pricing in a total of four hikes in 2022. Hence, the focus will remain glued to the outcome of a two-day FOMC meeting starting Tuesday.
Heading into the key event risk, escalating geopolitical tensions between Russia and Ukraine capped the upside for the USD/JPY pair. In fact, the US State Department ordered the families of all American staff at the US Embassy in Ukraine to leave the country amid concerns about a possible Russian attack. Moreover, reports suggested that President Joe Biden was considering sending US troops to NATO allies in Europe along with warships and aircraft.
The mixed fundamental backdrop warrants some caution before placing aggressive bullish bets around the USD/JPY pair and confirming that the recent pullback from a multi-year high has run its course. Market participants now look forward to the flash US PMI prints (Manufacturing and Services) for a fresh impetus. This, along with the US bond yields and the broader market risk sentiment, should produce some trading opportunities around the USD/JPY pair.
Technical levels to watch
- Asian equities drift lower even as PBOC announced another rate cut.
- Firmer yields, upbeat US stock futures trouble investors amid softer start to the key week.
- Fears of Russian invasion of Ukraine, wider quasi emergency in Japan also weigh on the sentiment.
Asian equities fail to justify China’s aggressive easing as most markets print losses during early Monday. The reason could be linked to the pre-Fed caution and challenges to the risk appetite emanating from Russia-Ukraine tussles.
That said, the MSCI’s index of Asia-Pacific stocks ex-Japan drops 0.80% whereas Japan’s Nikkei 225 recovers early Asian losses, up 0.20% intraday heading into the European session.
Policymakers in Japan brace for taking more prefectures under quasi-emergency status as covid infections jump to record high during weekends. Even so, a jump in Japan’s Jibun Bank Manufacturing PMI to a four-year high seems to underpin the latest optimism.
Elsewhere, Australia’s Commonwealth Bank PMIs came in mixed and the virus infections also seem to ease of late. Even so, Australia’s ASX 200 drops 0.50% at the latest whereas New Zealand’s NZX 50 drops over 1.0% as the Pacific nation moves ‘red’ alert level for activity restrictions.
On a different page, the People’s Bank of China (PBOC) announced 10 basis points (bps) of a rate cut, the second in nearly a week, to defend the world’s second-largest economy from covid and financial risks. However, markets in China and Hong Kong trade mixed with Hang Seng down 1.0%. Further, shares in Indonesia, South Korea and Indian print losses amid firmer US Treasury yields.
That said, the US 10-year Treasury yields rose two bps to 1.767% by the press time while stock futures in the US and Europe begin the crucial week on a positive.
Moving on, preliminary PMIs for January could entertain intraday traders but major attention will be given to Wednesday’s Federal Open Market Committee (FOMC).
Read: Fed Preview: Three ways Powell could out-dove markets, dealing a blow to the dollar
Open interest in natural gas futures markets shrank for the third consecutive session on Friday, this time by around 2.3K contracts, according to advanced prints from CME Group. Volume reversed two daily builds in a row and went down by around 145.5K contracts.
Natural Gas could retest $3.60/MMBtu
Friday’s decent gains in prices of natural gas was supported by short covering, as noted by declining open interest and volume. Against this, further gains appear not favoured in the very near term, with the door still open to a visit to the $3.60 region per MMBtu, or December lows.
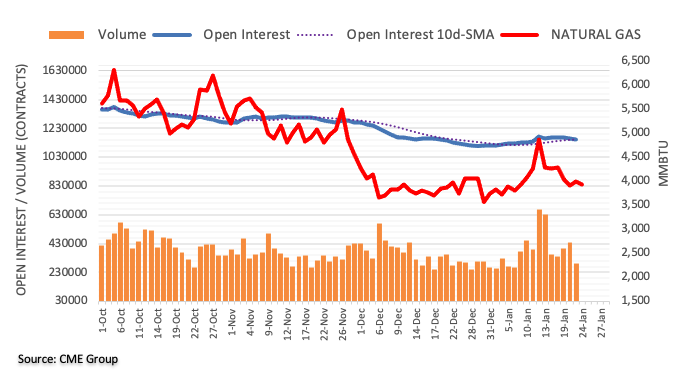
Further downside could force AUD/USD to breach the 0.7140 level in the next weeks, suggested FX Strategists at UOB Group.
Key Quotes
24-hour view: “We highlighted last Friday that the ‘the pullback in AUD has room to extend but any weakness is expected to encounter solid support at 0.7170’. Our view was not wrong as AUD dropped to a low of 0.7172. While oversold, the weakness in AUD has room to extend further even though a break of the major support at 0.7140 appears unlikely. Resistance is at 0.7200 followed by 0.7215.”
Next 1-3 weeks: “Last Monday (17 Jan, spot at 0.7210), we highlighted that the outlook for AUD is mixed and it is likely to trade within a range of 0.7140/0.7285. After a week, downward momentum is showing tentative signs of building as AUD dropped to 0.7172 last Friday. From here, the risk of AUD breaking 0.7140 has increased. On the upside, a breach 0.7240 would indicate that the downside risk has dissipated. Looking ahead, the next support below 0.7140 is at 0.7105.”
Considering preliminary readings from CME Group for crude oil futures markets, traders trimmed their open interest positions by around 2.5K contracts at the end of last week, partially reversing the previous build. Volume followed suit and rose by around 184.5K contracts after two daily builds in a row.
WTI stays focused on tops near $88.00
The barrel of WTI closed Friday’s session with modest gains after dropping to multi-day lows. The price action was in tandem with diminishing open interest and volume, exposing the resumption of the downtrend in the very near term, while recent 2022 highs near the $88.00 mark per barrel remains the immediate magnet for oil bulls.
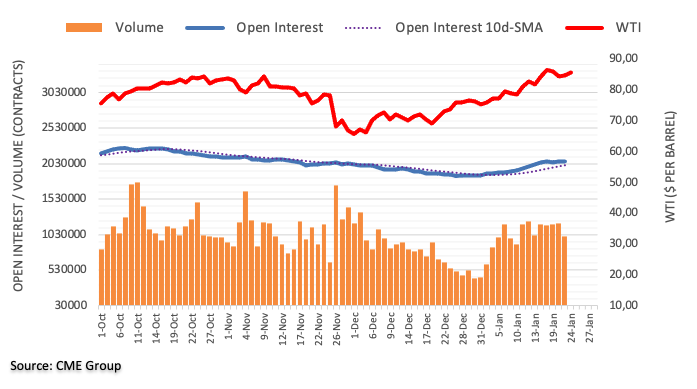
Here is what you need to know on Monday, January 24:
Wall Street's main indexes suffered heavy losses on Friday and the benchmark 10-year US Treasury bond yield fell sharply ahead of the weekend, making it difficult for the dollar to outperform its rivals. Ahead of IHS Markit's preliminary January Manufacturing and Services PMI surveys for Germany, the euro area, the UK and the US, the greenback is holding its ground with the US Dollar Index posting modest gains above 95.70. The Federal Reserve Bank of Chicago's National Activity Index and the Federal Reserve Bank of Dallas' Manufacturing Business SUrvey will also be featured in the US economic docket.
At the start of the week, the market mood seems to be improving. During the Asian trading hours, the People's Bank of China announced that it lowered the rate on the 14-day reverse repo by 10 basis points. Reflecting the risk-positive environment, the US stocks futures indexes are up between 0.65% and 0.85% in the early European morning. Last week, the S&P 500 fell 5.8% and registered its largest one-week drop since the beginning of the coronavirus pandemic.
Week Ahead on Wall Street (SPY) (QQQ): Big earnings week ahead and it is badly needed.
Following the sharp decline witnessed on Tuesday, EUR/USD moved up and down in a relatively tight range for the rest of the week and extends its sideways grind on Monday. The pair was last seen posting small daily losses below 1.1330. While speaking at the Davos World Economic Forum on Friday, European Central Bank President Christine Lagarde noted that they are not seeing signs of wages being bid up and noted that the euro area is not likely to face the same inflation as the US.
GBP/USD broke below the 1.3600 support area on Friday and snapped a four-week winning streak. The pair stays on the back foot slightly below 1.3550 to start the new week. Several news outlets report that civil servant Sue Gray is expected to release the findings on the "Partygate" investigations later in the week.
USD/JPY rose toward 114.00 during the Asian trading hours on Monday but seems to be having a tough time gathering momentum. In case the 10-year US T-bond yield gains traction, the pair could look to extend its rebound in the short term.
AUD/USD is trading at its lowest level in two weeks after the Commonwealth Bank's flash Manufacturing and Services PMIs fell short of analysts' estimates.
Gold stays in consolidation mode around $1,840 after rallying to its highest level in two months near $1,850 on Thursday.
Bitcoin plunged to its weakest level since July at $34,000 late Friday and failed to make a meaningful recovery over the weekend. BTC was last seen losing more than 3% on a daily basis at $35,000. Ethereum lost nearly 25% last week and continues to edge lower while trading below $2,500.
In opinion of FX Strategists at UOB Group, GBP/USD could still grind lower to the 1.3500 region in the near term.
Key Quotes
24-hour view: “We expected GBP to weaken last Friday but we were of the view that ‘any weakness is unlikely to break the major support at 1.3560’. The subsequent weakness exceeded our expectations as GBP fell to 1.3546 before settling on a soft note at 1.3551 (-0.31%). Downward momentum has improved and further weakness appears likely. That said, oversold conditions suggest that 1.3500 is likely out of reach for today (there is another support at 1.3520). On the upside, a breach of 1.3590 (minor resistance is at 1.3570) would indicate that the current weakness has stabilized.”
Next 1-3 weeks: “Last Thursday (20 Jan, spot at 1.3615), we highlighted that while the underlying tone has softened, we continue to expect GBP to trade between 1.3560 and 1.3725. We added, ‘looking ahead, a clear break 1.3540 would indicate that GBP is ready to head lower in a sustained manner’. GBP dropped to 1.3546 on Friday and while 1.3540 is not breached, improved shorter-term downward momentum suggests that GBP is likely to trade with a downward bias towards 1.3500. The downward bias is intact as long as GBP does not move above the ‘strong resistance’ level, currently at 1.3610.”
CME Group’s flash data for gold futures markets noted open interest shrank by around 3.9K contracts on Friday after four consecutive daily builds. In the same line, volume clinched the third drop in a row, now by around 25.5K contracts.
Gold now targets $1,850/oz
Friday’s downtick in prices of gold was on the back of shrinking open interest and volume, leaving the door open for a rebound in the short-term horizon with the immediate target at recent peaks in the $1,850 area per ounce troy (January 20).
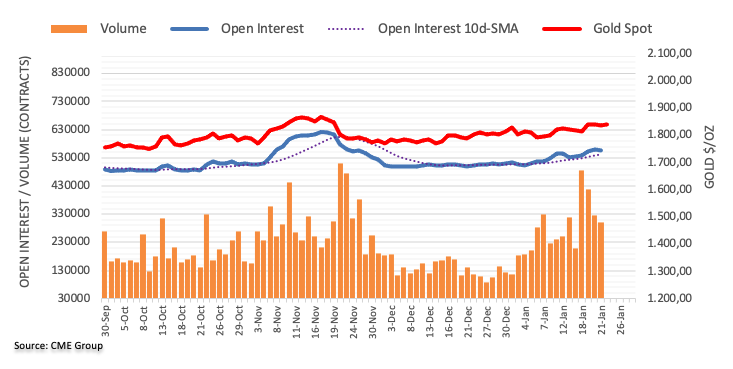
- AUD/USD refreshes two-week low, extends pullback from 100-DMA.
- Downbeat MACD signals, RSI line favor sellers eyeing 2021 bottom.
- Seven-week-old previous support acts as immediate hurdle, 0.7080 can offer nearby support.
AUD/USD takes offers to refresh daily low near 0.7165, down 0.15% intraday, as traders brace for Monday’s European session.
The pair’s latest declines could be linked to a downside break of the five-week-long support line, as well as bearish MACD signals and descending RSI line.
It’s worth noting that the Aussie pair took a U-turn from the 100-DMA, around 0.7275 at the latest, on Thursday and closed below an upward sloping trend line from early December to favor sellers at Friday’s closing.
That said, the quote’s latest declines eye the 0.7100 threshold and 0.7080 support levels ahead of directing AUD/USD sellers towards 2021 bottom surrounding 0.6990.
On the contrary, recovery moves may initially aim for the support-turned-resistance line from December 03, near 0.7195. Also acting as a nearby resistance is the 0.7200 round figure.
Should the quote rises past 0.7200, it becomes capable of challenging the 100-DMA level near 0.7275.
However, the previous support line from August and a descending trend line from May, respectively around 0.7350 and 0.7400, will challenge the further AUD/USD pair’s upside past the 100-DMA. It’s worth noting that the 200-DMA level near 0.7415 acts as an extra filter to the north.
AUD/USD: Daily chart
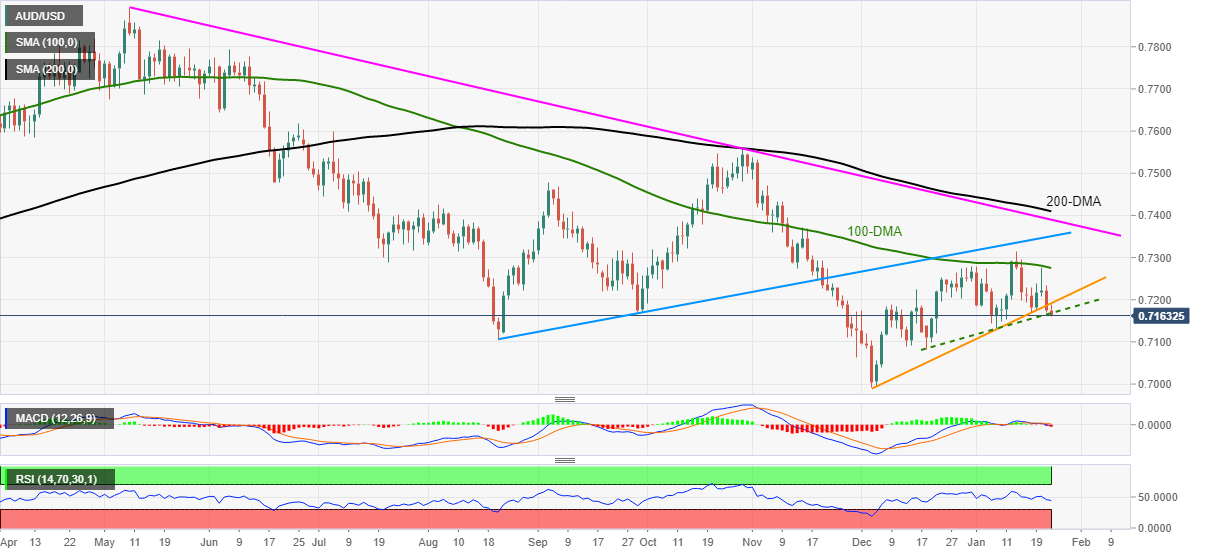
Trend: Further weakness expected
FX Strategists at UOB Group noted EUR/USD risks a potential move lower with support at 1.1285 in the next weeks.
Key Quotes
24-hour view: “We highlighted last Friday that EUR ‘could edge lower but a sustained drop below the major support at 1.1285 is unlikely’. Our expectations did not materialize as EUR dipped to 1.1299 before rebounding. Downward pressure has eased and EUR is likely to consolidate and trade between 1.1310 and 1.1360 for today.”
Next 1-3 weeks: “Our latest narrative from last Thursday (20 Jan, spot at 1.1340) still stands. As highlighted, there is a slight downward bias in EUR but any weakness is likely limited to a test of 1.1285. The downward bias is intact as long as EUR does not move above 1.1385 (no change in ‘strong resistance’ level from last Friday). Looking ahead, if there is a clear break of 1.1285, the next support level to watch is at 1.1240.”
“The economies in the six-member Gulf Cooperation Council will grow at their fastest pace in several years,” per the latest Reuters poll.
The survey results also mentioned, “Nine of 10 economists who answered an additional question said a decline in oil prices and new coronavirus variants were the biggest threats to GCC economic growth this year.”
Key quotes
Saudi Arabia was predicted to top the list with growth of 5.7%, followed by Kuwait and UAE with 5.3% and 4.8% respectively.
Economic growth in Qatar, Oman and Bahrain was expected to average between 3%-4% for 2022. If realised, that would be the best these countries have witnessed in several years.
Eight of ten respondents said risks to their growth forecasts were skewed more to the downside.
Oil prices remain firmer…
The hawkish outlook for energy prices joins the recent geopolitical concerns surrounding Russia and Ukraine to also underpin WTI crude oil prices to gain over 1.0% by the press time of the pre-European session on Monday.
Read: WTI Price Analysis: Extends bounce off 200-HMA towards $86.00 hurdle
- Gold reverses Thursday’s pullback from yearly resistance line.
- Bulls cheer firmer stock futures but yields test further upside ahead of the key FOMC.
- Russia-Ukraine tussles, Omicron headlines add to the risk catalysts, US Q4 Advances GDP, PCE Inflation eyed as well.
- Gold slides and rebounds in 2022
Gold (XAU/USD) begins Fed week on a firmer not around $1,840, extending the previous two-week uptrend.
The precious metal’s latest run-up could be linked to the market’s rush towards risk-safety ahead of the key weekly event, namely Wednesday’s Federal Open Market Committee (FOMC) meeting. The risk-off mood could also be linked to the mixed performance of the US Treasury bonds and mostly downbeat Wall Street.
The yellow metal stepped back from the yearly resistance line on Thursday, also declined on Friday, as markets weighed hawkish Fed concerns while geopolitical tensions surrounding Russia and Ukraine escalated. The pullback moves failed to last long so far on Monday as stock futures
It’s worth noting that the hawkish hopes from the Fed aren’t the only catalysts market players are bracing for this week as a slew of preliminary PMIs and GDP data also weigh on sentiment.
Read: Gold, Chart of the Week: Bulls pining for $1,850+, could be just a Fed away
Gold Price: Key levels to watch
The Technical Confluences Detector shows that the gold price is battling the key hurdle around $1,838 comprising a cluster of SMA 200 on 15-Minutes, Fibonacci 61.8% one-day and previous highs on 1H, as well as 4H.
Given the metal’s ability to stay above multiple support zone surrounding $1,830, gold buyers are likely to keep the reins.
Among the key, supports are the $1,832 level that encompasses Fibonacci 38.2% one-week, 23.6% Fibonacci on one-day and Bollinger Band Lower on 15-Minutes.
Also acting as the key immediate support is the previous low on one-day surrounding $1,828, a break of which will set the tone for the metal’s further downside towards the $1,800 threshold.
Alternatively, the upper band of Bollinger on one-day joins the previous daily high to carve out $1,844 as an immediate upside hurdle.
However, major attention will be given to the $1,856 level including Pivot Point R1 on monthly and R3 on one-day.
It should be noted that a one-year-old resistance line near $1,848 acts as an extra hurdle to the north.
Here is how it looks on the tool
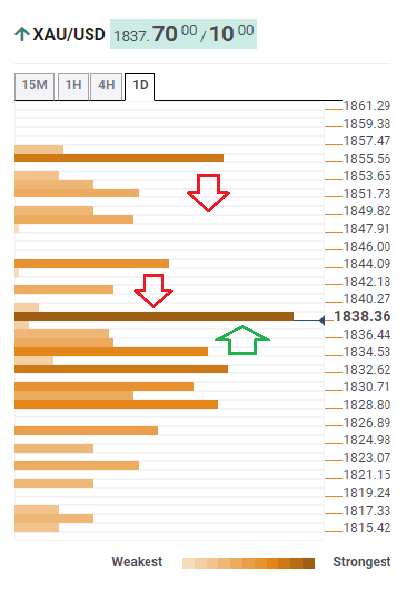
About Technical Confluences Detector
The TCD (Technical Confluences Detector) is a tool to locate and point out those price levels where there is a congestion of indicators, moving averages, Fibonacci levels, Pivot Points, etc. If you are a short-term trader, you will find entry points for counter-trend strategies and hunt a few points at a time. If you are a medium-to-long-term trader, this tool will allow you to know in advance the price levels where a medium-to-long-term trend may stop and rest, where to unwind positions, or where to increase your position size.
- EUR/USD reverses Friday’s corrective pullback from two-week low.
- Yields consolidate the first negative weekly loss in five with eyes on Fed’s verdict, stock futures print mild gains.
- Russia-Ukraine fears, Omicron updates add to the watcher’s list, weigh on prices.
- Preliminary readings of January PMI, inflation data can act as buffers ahead of Wednesday’s FOMC.
EUR/USD extends the previous week’s downbeat performance towards a two-month-old support line, down 0.10% around 1.1330 ahead of Monday’s European session.
The major currency pair’s latest losses could be linked to the market’s risk-off mood ahead of the key weekly event, namely Wednesday’s Federal Open Market Committee (FOMC) meeting. Also weighing on the quote are the geopolitical concerns surrounding Russia and Ukraine, as well as fears of the South African covid variant namely Omicron.
It’s worth noting that the expectations of the Fed’s March rate hike signals recently took clues from the latest comments from US President Joe Biden and International Monetary Fund Managing Director Kristalina Georgieva. Both these key authorities highlighted inflation fears and praised Fed’s push for tighter monetary policies.
On the contrary, ECB Meeting Accounts failed to impress Euro bulls while ECB President Christine Lagarde said on Friday that geopolitics and weather factors are driving energy prices higher, but that the ECB is not seeing wages being bid up. Lagarde added that demand in Europe is not excessive and, as a result, we are unlikely to face the same inflation as the US.
Elsewhere, the US State Department and UK Deputy Prime Minister Dominic Raab both flashed warnings over Russia’s preparations for invading Ukraine, which in turn magnified geopolitical fears and drowned EUR/USD prices.
Amid these plays, the US 10-year Treasury yields rose 3.6 basis points (bps) to 1.783%, snapping a three-day decline, as traders anticipate hawkish Fed verdict, amid firmer inflation, during this week’s key meeting. It should be observed that hopes of the US stimulus and receding virus numbers join the People’s Bank of China’s (PBOC) another rate to underpin mild optimism during the Asian session.
Looking forward, January’s initial activity data will be closely watched for intraday direction. Given the already watered-down hopes from German and Eurozone PMIs, the EUR/USD prices are likely to remain pressured ahead of the US activity numbers. Should Markit figures for the US PMIs match upbeat expectations, inflation fears will have an additional role to weigh on the EUR/USD prices before the Fed’s verdict.
Read: Fed Preview: Three ways Powell could out-dove markets, dealing a blow to the dollar
Technical analysis
In addition to the EUR/USD pair’s failures to cross the 20-DMA level of 1.1350, bearish MACD signals also suggest the bear’s firm determination to break an upward sloping trend line from late November, which has been defending buyers of late around 1.1300.
- GBP/USD fades early Asian session bounce off two-week low.
- UK PM Johnson braces for tough week as Tories voice dislike over ‘Partygate’.
- British covid cases ease but death toll rise, Welsh ports see 30% reduction in traffic due to Brexit.
- UK/US preliminary PMIs for January will direct intraday moves, Fed is the key.
GBP/USD struggles to keep corrective pullback from the 100-DMA, seesaws around 1.3550 heading into Monday’s London open.
In doing so, the cable pair fails to justify the US dollar strength ahead of the key preliminary PMI numbers for January for the UK and the US. Other than the pre-PMI cautious, the pair’s indecision could also be linked to the market’s fears of hawkish Fed during Wednesday’s Federal Open Market Committee (FOMC) meeting.
Additionally, UK PM Boris Johnson is in a political grind amid investigations over holding a booze party during the peak covid lockdowns in Britain. “Johnson would face a confidence vote on his leadership if 54 Tory MPs, or 15% of the total in the House of Commons, submit letters to a key committee calling for him to resign,” said Bloomberg in this regard.
Elsewhere, The Guardian conveyed British citizens’ hardships in the Eurozone as “Thousands of people say their rights have been compromised despite government promises.” It’s worth noting that Independent said, “Two major ports in Wales saw trade plummet by 30 percent in 2021 as a result of post-Brexit changes in the way freight is moved, a ferry operator has said.”
Talking about the virus, the UK’s covid cases have been halved in the last two weeks with the latest updates citing Saturday’s daily infections as 76,807, down by 54% from 176,191 cases detected two weeks ago.
On a different page, the US State Department and UK Deputy Prime Minister Dominic Raab both flashed warnings over Russia’s preparations for invading Ukraine, which in turn magnified geopolitical fears and challenge the GBP/USD buyers. Furthermore, Friday’s downbeat UK Retail Sales, which contrasts with the hopes of the hawkish Fed, also exert downside pressure on the cable pair.
Against this backdrop, US 10-year Treasury yields rose 3.6 basis points (bps) to 1.783%, snapping a three-day decline, as traders anticipate hawkish Fed verdict, amid firmer inflation, during this week’s key meeting.
Moving on, GBP/USD traders are likely to keep the latest rebound amid upbeat expectations from the UK’s monthly PMI data. However, a surprise negative will highlight the Fed’s rate hike woes and exert downside pressure to break the 100-DMA key support.
Technical analysis
GBP/USD recovery gains support from the 100-DMA level surrounding 1.3540. However, the pair bulls remain unconvinced until crossing the weekly resistance line, near 1.3620. It’s worth noting that the 21-DMA level surrounding 1.3575 guards the quote’s immediate upside.
China has delivered another rate cut with the People's Bank of China cutting the rate on 14-day reverse repo by 10 bps.
China’s recent cut of two key policy interest rates opened the door to more monetary easing actions ahead. This is despite the sentiment that the Federal Reserve will probably hike rates from March.
China cut the one-year medium-term lending facility rate and the seven-day reverse repurchase rate for the first time in almost two years earlier this month. The one-year tenor was already dropped by five basis points last month, so all eyes are on whether the five-year rate will decline to allow for cheaper mortgages.
Market implications
Goldman Sachs Group Inc. economists led by Maggie Wei said, “we see a decent possibility for the five-year loan prime rate to be cut by 5 basis points” when it’s announced Thursday, the economists said in a note Monday. The five-year rate is the reference for mortgages and a cut “would send a signal on broad property policy easing.”
- USD/CHF takes the bids to refresh intraday high, bounces off one-week low.
- Oscillators and bear cross favor sellers, fortnight-old descending trend line, key DMAs restrict short-term recovery.
- 78.6% Fibonacci retracement level limits immediate downside.
USD/CHF consolidates recent losses around a one-week low, picking up bids to refresh daily high near 0.9138 amid early Monday morning in Europe.
Even so, bear cross of the 50-DMA to the 100-DMA joins downbeat MACD and Momentum to keep sellers hopeful.
That said, a descending resistance line from January 10, around 0.9165-70, restricts the immediate rebound of the pair ahead of the latest swing high near 0.9180.
Even if the USD/CHF buyers manage to cross the 0.9180 resistance, the stated key DMAs will challenge the pair’s further advances near 0.9210-15.
It’s worth noting that the 61.8% and 50% Fibonacci retracements (Fibo.) of August-November 2021 upside, respectively near 0.9155 and 0.9200, act as additional filters to the north.
On the contrary, the 78.6% Fibo. level near 0.9090 acts as strong support to watch during the quote’s fresh declines.
Should the USD/CHF prices remain weaker past 0.9090, the pair becomes vulnerable to drop towards August 2021 swing low near 0.9020.
USD/CHF: Daily chart
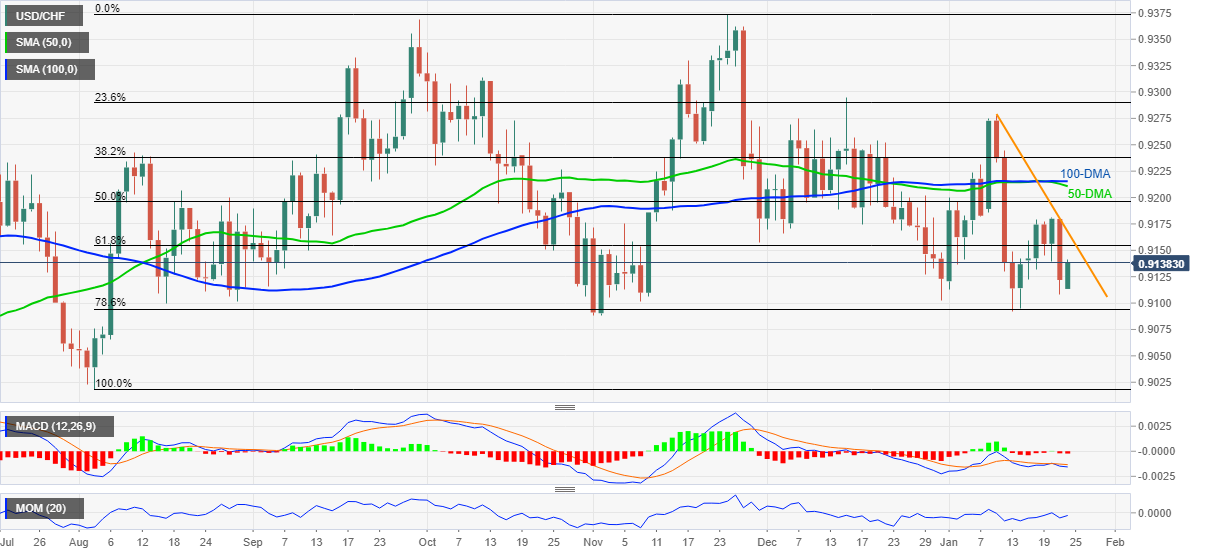
Trend: Bearish
- USD/INR bulls are on the move, but a wall of resistance lies ahead.
- The bears are looking deeper into the picture that involves a bearish prospect in US 10-year yields.
The bulls could well be moving in for the kill soon considering the correction's depth and deceleration at the 38.2% Fibonacci retracement level which is acting as support, currently.
USD/INR daily chart
-637785920732915621.png)
The bulls will look to a 75.20 target where the old structure falls in near prior resistance looking left. A break there would be significantly bullish for the weeks ahead.
USD/INR weekly chart
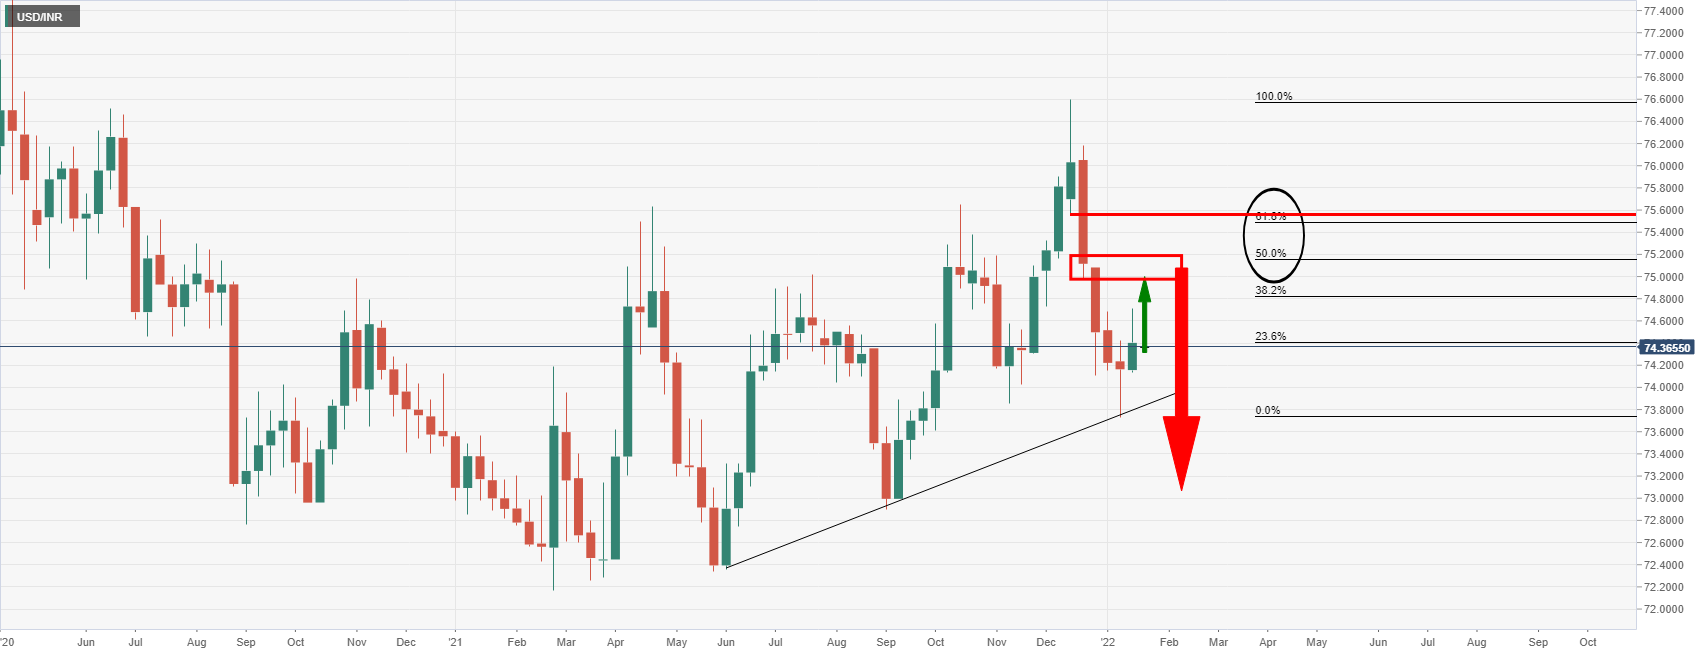
The weekly chart, on the other hand, shows that the price is merely correcting a dominant weekly bearish impulse. A correction into the 50% mean reversion area near the said 75.20 target, could equate to resistance and result in a downside test of the trendline resistance and a potential follow-through for the weeks ahead. 72.80 would be eyed in this scenario.
Looking to the US dollar, there are prospects of a shift to the downside if the market has overpriced the Fed and if yields fall. The weekly chart in Us ten year yields, in this regards is compelling:
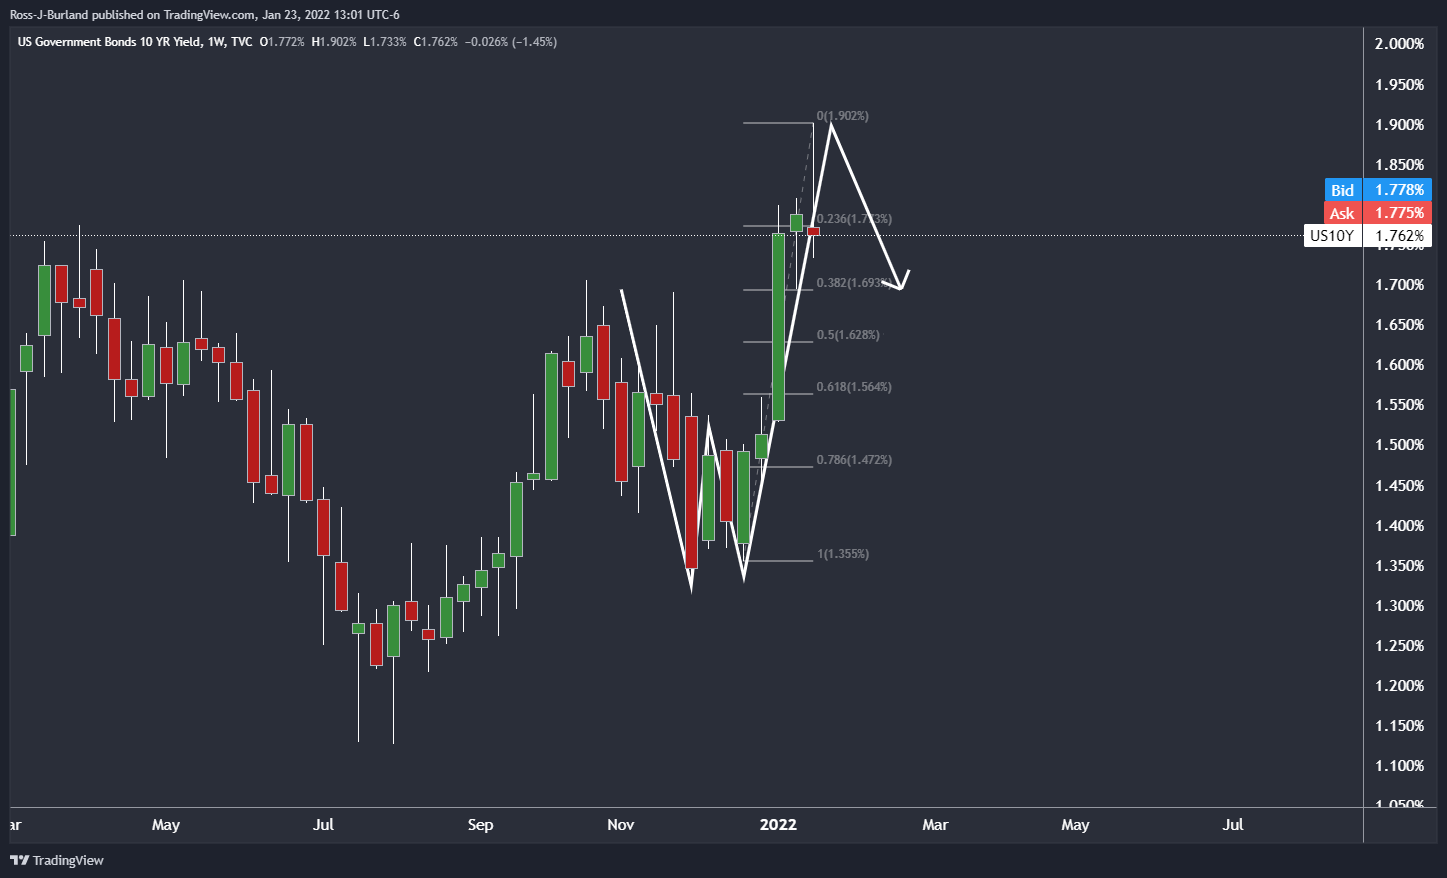
This W-formation is a reversion pattern that has a high completion rate on a fractal basis, ie,e, across all time frames. The price tends to retrace back to the neckline, or, in the case of an overextended-W. In this scenario, the 38.2% Fibonacci aligns with the prior highs around the 1.70s%. that would be highly bearish for the US dollar:
DXY weekly chart
If this is a retest in a low volume rally before the markdown, then the dollar could be headed much lower in the weeks to come.
The weekly chart is compelling in this regard:
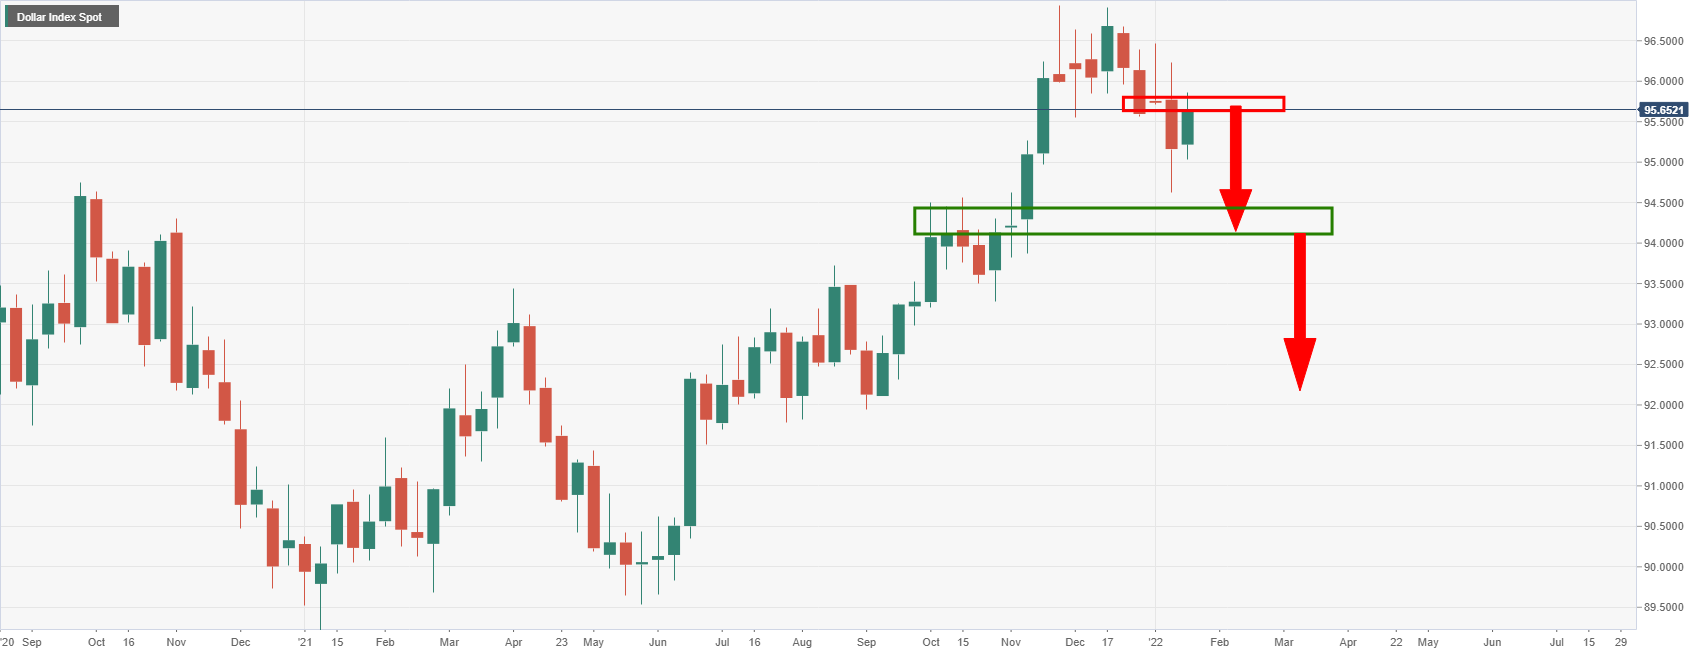
Old highs near 94.50 and then a retest of 92 on the longer-term outlook would significantly dent USD/INR.
- DXY tracks firmer yields to begin the key week but refrains from further advances.
- Market players stay divided over FOMC, March rate hike clues expected.
- Easing fears of Omicron battles escalating concerns over Russia-Ukraine tussles.
- US Markit PMIs can offer immediate direction, US Q4 GDP, PCE Inflation important too.
US Dollar Index (DXY) seesaws around 95.70 as traders brace for crucial week comprising Fed meeting amid early hours of Monday’s Asian session.
In doing so, the greenback gauge tracks firmer yields, although a bit slowly amid mixed concerns over the covid variant Omicron. In addition to the pre-Fed hawkish mood that propels the US Treasury yields of late, geopolitical fears surrounding Russia’s invasion of Ukraine and inflation fears also favor the US Treasury bond coupons.
That said, US 10-year Treasury yields rose 2.7 basis points (bps) to 1.774%, snapping a three-day decline, as traders anticipate hawkish Fed verdict, amid firmer inflation, during this week’s key meeting.
Expectations of the March rate hike signals from the Federal Open Market Committee (FOMC) take clues from the latest comments from US President Joe Biden and International Monetary Fund Managing Director Kristalina Georgieva. Both these key authorities highlighted inflation fears and praised Fed’s push for tighter monetary policies.
Elsewhere, the US State Department and UK Deputy Prime Minister Dominic Raab both flashed warnings over Russia’s preparations for invading Ukraine, which in turn magnified geopolitical fears.
On the positive side, the recently easing virus numbers from the UK, the US and China hint at easing Omicron fears even as Japan and India do struggle with the virus of late.
Additionally, People’s Bank of China’s (PBOC) efforts to keep the world’s second-largest economy fluid joins hopes of the US stimulus to favor the US stock futures despite firmer US T-bond yields, which in turn tests DXY bulls.
Ahead of Wednesday’s FOMC, Bank of America (BoA) expects the first rate hike to take place in March, with 25 by hikes in each of the next eight quarters. The BoA also said, “We now expect QT to be announced at the June FOMC meeting, with risks skewed earlier to the May FOMC meeting.”
Read: Fed Preview: Three ways Powell could out-dove markets, dealing a blow to the dollar
For now, monthly readings of Markit PMIs from the US will decorate today’s calendar. Given the upbeat expectations versus recently mixed US data, a slight miss by the scheduled PMIs may negatively affect the DXY. However, nothing becomes more important than Wednesday’s Fed meeting. Following that, the US Advances Q4 GDP and PCE Inflation data will also be watched for further clarity on the US central bank’s next move.
Technical analysis
US Dollar Index bulls need a clear upside break of a six-week-old resistance line and 50-DMA, around $96.00 by the press time, to retake controls. Until then, the odds of another pullback to 95.50 can’t be ruled out.
| Raw materials | Closed | Change, % |
|---|---|---|
| Brent | 86.76 | 1.39 |
| Silver | 24.206 | -1.11 |
| Gold | 1829.722 | -0.53 |
| Palladium | 2099.77 | 2.35 |
- EUR/USD is pressured in a risk-off start to the week.
- Russia, the Fed and US data are the standout themes.
EUR/USD is under pressure in the opening session for the week and easing off from 1.1345 highs to 1.1332 as risk-off continues on the back of Friday's bearish close on Wall Street. Asian markets are lower on Monday with the Federal Reserve expected to confirm it will soon start draining the massive liquidity that has fulled stock markets for years.
Additionally, a Russian attack on Ukraine is creating angst in financial markets as tensions mount up as per the weekend headlines:
-
US orders families of all American embassy staff in Kyiv to leave Ukraine
-
Russia/Ukraine tensions rising: British gov says it has uncovered a plot by Moscow to install a pro-Russian leader in Kiev
The New York Times reported President Joe Biden was considering sending thousands of U.S. troops to NATO allies in Europe along with warships and aircraft. The news is hurting MSCI's broadest index of Asia-Pacific shares outside Japan (.MIAPJ0000PUS) that eased 0.1% and sent Japan's Nikkei 1.0% lower.
FOMC in focus
Meanwhile, the markets have been trading cautiously ahead of this week’s FOMC statement. Analysts at ANZ bank explained that they are doubtful that the Fed will end QE next week, as some in the market speculate.
''We are also doubtful that the Fed would begin to tighten policy with a 50bps rate rise. Markets may stabilise if the Fed is not as hawkish as some worst case fears suggest. We do expect that Chair Powell will elaborate on quantitative tightening (QT) although it may be the case that no firm decision has yet been made.''
''From a sequencing perspective, it may be too draconian to signal a near term start to QT before QE has finished and rates have started to rise.''
Meanwhile, the prospect of higher borrowing costs and more attractive bond yields are weighing on stock markets and in turn, risk apatite which translates to a bearish outlook for currencies such as the euro.
Looking outside of the Fed, the first reading of U.S. gross domestic product for the December quarter is due this week also. Expectations are for growth running at an annualised 5.4% before Omicron put its foot on the brakes.
Additionally, oil prices are going to be a focus for the euro considering the inflationary pressures that can harm the economy alongside sky-high gas prices imported from Russia. Oil has been rising again having climbed for five weeks in a row to a seven-year peak. The European Central Bank will continue to be second-guessed in this regard.
''To date, the ECB has been keen to push against speculation that it could drop its dovish policy guidance. This week, ECB President Lagarde commented that the Bank has “every reason” not to respond as forcefully as the Fed, with CPI inflation clearly weaker in the Eurozone and the recovery not as advanced,'' analysts at Rabobank explained.
''The market is pricing in a small rate rise in the second half of the year, with more tightening expected next year. Given that the market is short EURs, a renewed focus on the outlook for a change in direction for ECB policy could trigger a move higher in EUR/USD.''
Bloomberg came out with the latest analysis from Goldman Sachs to propel hawkish hopes ahead of Wednesday’s Federal Open Market Committee (FOMC) meeting.
Key quotes (via Bloomberg)
The Goldman Sachs economists led by Jan Hatzius said in a weekend report to clients that they currently expect rates to be increased in March, June, September and December and for the central bank to announce the start of a balance sheet reduction in July.
But they said inflation pressures mean that the ‘risks are tilted somewhat to the upside of our baseline.’
‘We see a risk that the FOMC will want to take some tightening action at every meeting until that picture changes,’ the Goldman Sachs economists said.
This raises the possibility of a hike or an earlier balance sheet announcement in May, and of more than four hikes this year.
The Goldman Sachs economists said if the Fed did decide to be more aggressive, it would likely hike by 25 basis points at consecutive meetings rather than by 50 basis points.
Read: Fed Preview: Three ways Powell could out-dove markets, dealing a blow to the dollar
- USD/TRY prints mild gains to pare two-week losses.
- 100/200-SMA confluence offers strong resistance inside immediate triangle.
- Steady RSI hints at further grinding below the key SMAs.
USD/TRY begins the trading week on a positive note around $13.48, up 0.10% intraday, during Monday’s Asian session.
Even so, the Turkish lira (TRY) pair remains inside a two-week-long symmetrical triangle amid steady RSI.
It should be noted, however, that sustained trading below the 100 and 200 SMA confluence, near $13.55, keeps USD/TRY sellers hopeful.
Should the quote rise past $13.55, the odds of its run-up to cross the stated triangle’s resistance line, near $13.60 by the press time, can’t be ruled out.
Following that, the monthly high around $13.95 and the $14.00 threshold will lure the pair buyers.
On the contrary, pullback moves remain elusive beyond the triangle’s support line, around $13.30 at the latest.
Even if the USD/TRY bears manage to conquer the $13.30 support, the $13.00 threshold will challenge the downside before highlighting the 61.8% Fibonacci retracement of December 24 to January 03 upside, near $12.40.
USD/TRY: Four-hour chart
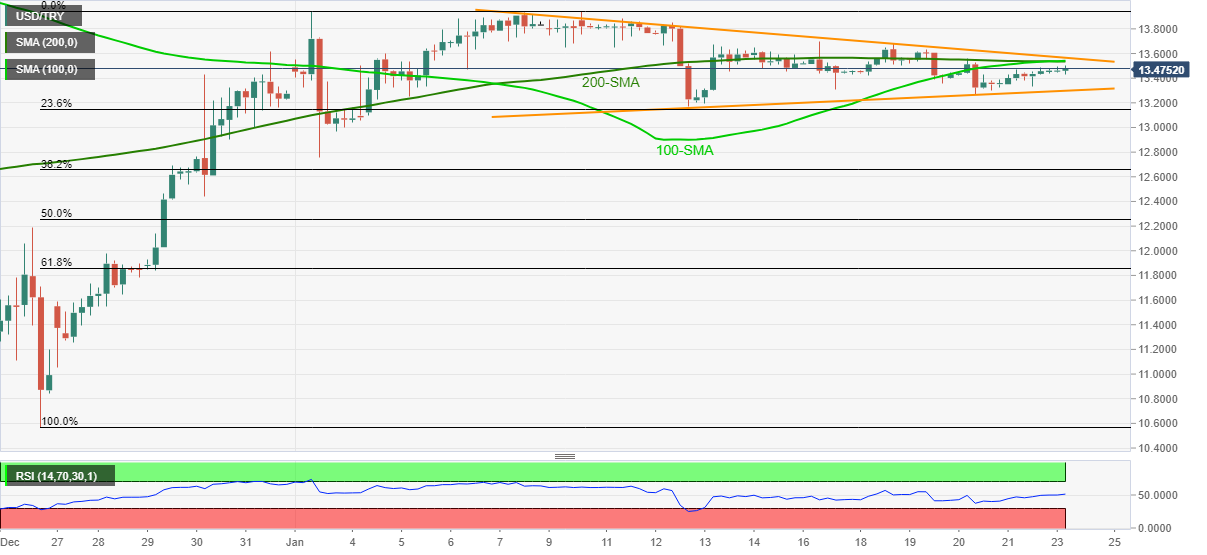
Trend: Further weakness expected
- USD/JPY consolidates the heaviest daily loss around one-week low, recently refreshing intraday high.
- Markets brace for Fed, yields, equities begin the key week on a positive side.
- Japanese government eyes more areas to add to quasi-emergency status amid surging cases.
- US Preliminary Markit PMIs for January eyed for intraday moves, Wednesday’s FOMC is the week’s crucial event.
USD/JPY picks up bids to refresh intraday high near 113.85, up 0.20% intraday, during the initial hours of Tokyo trading on Monday. In doing so, the yen pair rises for the first time in four days while tracking firmer US Treasury yields as traders brace for Wednesday’s Federal Open Market Committee (FOMC) meeting.
At home, preliminary readings of Japan’s Jibun Bank Manufacturing PMI from January rose past 54.3 to 54.6, hitting a four-year high. It’s worth noting. However, the latest prints of Jibun Bank Services PMI slumped to 46.6 versus 52.1 in December. Additionally, “The government of Prime Minister Fumio Kishida is expected to place more prefectures under a COVID-19 quasi-state of emergency as the number of cases continues surging, government sources said Sunday,” per Japanese media Kyodo News.
That said, US 10-year Treasury yields rose 3.6 basis points (bps) to 1.783%, snapping a three-day decline, as traders anticipate hawkish Fed verdict, amid firmer inflation, during this week’s key meeting.
During the last week, US data was mostly mixed but the latest Fedspeak has been hawkish, suggesting that the US central bank is on the way to chart March’s rate hike on Wednesday. Adding to the bullish bias were the chatters concerning Omicron-linked supply chain damage and inflation woes. It’s worth noting that comments from US President Joe Biden and International Monetary Fund Managing Director Kristalina Georgieva were both in support of the Fed’s hawkish bias, which in turn reinforced Fed rate hike concerns.
It’s worth observing that escalating fears of a Russian invasion of Ukraine also favor the US Treasury yields and the USD/JPY prices. Furthermore, mildly bid S&P 500 Futures adds strength to the pair’s rebound even as Nikkei 225 drops 0.80% intraday by the press time.
Moving on, the preliminary readings of January US Markit PMIs will be crucial for intraday trade direction. However, major attention will be given to Wednesday’s FOMC and Thursday’s US Q4 GDP for a clearer view.
Technical analysis
A clear downside break of an ascending support line from early October, near 114.00 by the press time, directs USD/JPY towards the 100-DMA support of 113.27.
| Time | Country | Event | Period | Previous value | Forecast |
|---|---|---|---|---|---|
| 00:30 (GMT) | Japan | Manufacturing PMI | January | 54.3 | |
| 00:30 (GMT) | Japan | Nikkei Services PMI | January | 52.5 | |
| 08:15 (GMT) | France | Manufacturing PMI | January | 55.6 | 55.5 |
| 08:15 (GMT) | France | Services PMI | January | 57 | 55.3 |
| 08:30 (GMT) | Germany | Services PMI | January | 48.7 | 48 |
| 08:30 (GMT) | Germany | Manufacturing PMI | January | 57.4 | 57 |
| 09:00 (GMT) | Eurozone | Manufacturing PMI | January | 58 | 57.5 |
| 09:00 (GMT) | Eurozone | Services PMI | January | 53.1 | 52.2 |
| 09:30 (GMT) | United Kingdom | Purchasing Manager Index Manufacturing | January | 57.9 | 57.9 |
| 09:30 (GMT) | United Kingdom | Purchasing Manager Index Services | January | 53.6 | 54.8 |
| 11:00 (GMT) | Germany | Bundesbank Monthly Report | |||
| 13:30 (GMT) | U.S. | Chicago Federal National Activity Index | December | 0.37 | |
| 14:45 (GMT) | U.S. | Services PMI | January | 57.6 | 55 |
| 14:45 (GMT) | U.S. | Manufacturing PMI | January | 57.7 | 56.7 |
In recent trade today, the People’s Bank of China (PBOC) set the yuan (CNY) at 6.3411 vs. the estimate of 6.3409 and the last close of 6.3396.
About the fix
China maintains strict control of the yuan’s rate on the mainland.
The onshore yuan (CNY) differs from the offshore one (CNH) in trading restrictions, this last one is not as tightly controlled.
Each morning, the People’s Bank of China (PBOC) sets a so-called daily midpoint fix, based on the yuan’s previous day closing level and quotations taken from the inter-bank dealer.
- USD/CAD snaps two-day rebound from eight-week-old descending resistance line.
- 61.8% Fibonacci retracement level can offer immediate support, weekly horizontal area adds to the downside filters.
- 100-DMA, 50% Fibo. probes bulls before giving them controls.
USD/CAD consolidates recent gains around 1.2570, down 0.10% intraday, during Monday’s Asian session.
In doing so, the Loonie pair takes a U-turn from a downward sloping resistance line from late November.
However, easing bearish bias of the MACD and the pair’s sustained trading beyond the 61.8% Fibonacci retracement (Fibo.) level of October-December 2021 upside, near 1.2550, keeps USD/CAD buyers hopeful. Also favoring the pair buyers is the successful trading beyond the 200-DMA.
That said, the quote’s latest pullback remains less important until staying beyond the aforementioned key Fibonacci retracement level and the 200-DMA, respectively around 1.2550 and 1.2500.
Even if the quote drops below 1.2500, a clear downside break of short-term horizontal support near 1.2450 will be necessary to recall bears.
On the flip side, the stated resistance line and the 100-DMA, around 1.2590 and 1.2625 in that order, will restrict the short-term upside of the USD/CAD prices.
It’s worth noting that the 50% Fibo. level near 1.2630 also challenges the pair buyers before directing them to the 1.2700 threshold.
USD/CAD: Daily chart
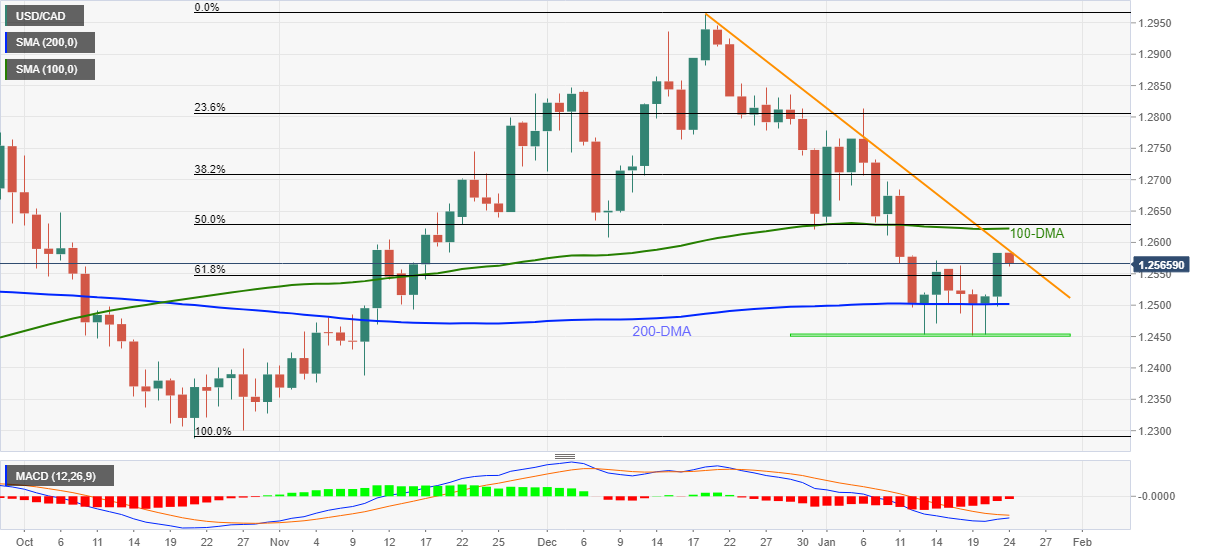
Trend: Further upside expected
Sky News has reported that ''the US has ordered the families of all American embassy staff in Kyiv to leave Ukraine amid heightened fears of a Russian invasion.''
This follows earlier news at the start of the day that 'the UK has accused Russia’s President Vladimir Putin of plotting to install a pro-Moscow figure to lead Ukraine's government,'' as per the BBC:
- Russia/Ukraine tensions rising: British gov says it has uncovered a plot by Moscow to install a pro-Russian leader in Kiev
Meanwhile, the US State Department has told the dependants of staffers at the US embassy in Ukraine's capital that they must leave the country and said that non-essential employees could also leave at government expense, Sky reports.
Additionally, the US President, Joe Biden, is weighing the implications in deploying warships and aircraft to NATO allies well as deploying several thousand US troops in the Baltics and Eastern Europe.
Market implications
The safe havens would be expected to benefit, such as gold and the US dollar, yen and to a lesser degree, CHF (considering the euro's vulnerability to escalating tensions and surging gas prices over tight Russian supplies; any weakness in the euro as a consequence would be a concern to the Swiss National Bank). As it stands, the US dollar is outperforming.
- AUD/USD consolidates the previous weekly losses, retreats from intraday high of late.
- Easing Omicron fears join market’s preparation for hawkish Fed to underpin recent risk-on mood, yields, gold both print mild gains.
- Hawkish bets on RBA gain traction after the last week’s firmer Aussie data.
- Aussie PMIs came in softer, US Markit activity numbers for January in focus.
AUD/USD pares intraday gains around 0.7180, up 0.08% on a day, following an upbeat start to the key week during the early Asian session.
The Aussie pair initially ignored mixed Australia PMIs from Commonwealth Bank (CBA) as virus updates were positive. The recovery moves gained on firmer prices of gold afterward. However, pre-Fed fears and geopolitical tension surrounding Russia-Ukraine tensions recently weighed down the Aussie prices.
That said, preliminary readings of January CBA Manufacturing PMI eased to 55.3, below 55.9 forecast and 57.4 revised down prior readings whereas Services PMI slumped into contraction territory with 45 figure compared to 51.8 expected and 55.1 prior.
Elsewhere, Australia’s daily covid infections ease for the fifth consecutive day, to recently around 28,100. However, the death toll keeps climbing and challenge the optimists.
It’s worth noting that the US State Department and UK Deputy Prime Minister Dominic Raab both flashed warnings over Russia’s preparations for invading Ukraine, which in turn magnified geopolitical fears.
Amid these plays, the US 10-year Treasury yields rose 2.4 basis points (bps) to 1.77%, after posting the first weekly decline in five, whereas the S&P 500 Futures rise 0.50% while licking the previous week’s wounds amid the mostly quiet session.
“Last week we argued the RBA would end quantitative easing in February, despite the uncertainty caused by Omicron. With the December employment report confirming the economy finished 2021 with exceptional momentum, we are even more confident about that call. Given how the labor market finished 2021, an explicit decision to move to QT is likely on the table for the February meeting,” said ANZ.
That said, AUD/USD traders will pay attention to Tuesday’s Australia Consumer Price Index (CPI) for Q4, expected 1.0% versus 0.8% QoQ prior, for fresh impulse. However, Fed’s verdict on the March rate hike will be more important to follow.
Read: Fed Preview: Three ways Powell could out-dove markets, dealing a blow to the dollar
Technical analysis
Having registered multiple failures to cross the 100-DMA, AUD/USD dropped below an ascending support line from early December 2021, forming part of a two-month-old rising wedge bearish pattern.
Given the downbeat MACD and RSI conditions, bears do have upper hands and are likely to dominate on the clear break of 0.7170.
That said, the 0.7100 threshold will be imminent support for the AUD/USD sellers to watch following the 0.7170 breakdowns.
Alternatively, a clear upside break of the 100-DMA level surrounding 0.7280 isn’t a green card for the AUD/USD bulls as the previous support line from August and a descending trend line from May, respectively around 0.7350 and 0.7400, will challenge the further upside.
- GBP/USD is testing critical support on the hourly chart.
- The weekly W-formation is compelling as risk-off takes hold in the open.
GBP/USD's W-formation could see the price continue to correct for the week ahead which puts an emphasis towards 1.3450:
GBP/USD weekly chart
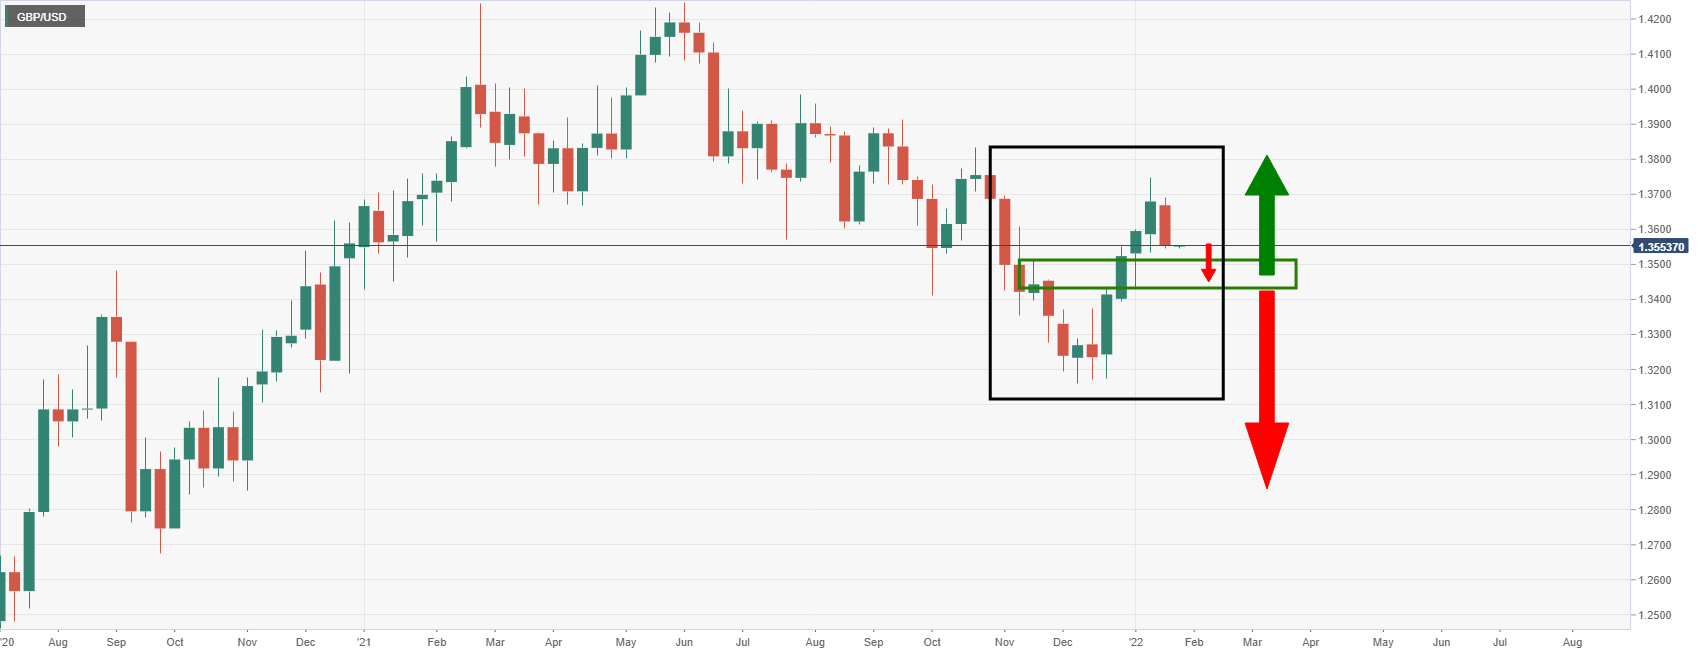
The W-formation is a reversion pattern where the neckline of the W is expected to be retested. Bears can move to a lower time frame in order to gauge for an optimal entry point from where the neckline can be bagged for profit:
GBP/USD H1 chart

The price needs to break the support and on a retest of this area, the bears will be looking for it to hold and confirm the downside bias towards the target area. A continuation higher in the DXY looks to be setting up for the day ahead with the risk-off market profile related to the Russian headlines.
Russia/Ukraine tensions rising: British gov says it has uncovered a plot by Moscow to install a pro-Russian leader in Kiev
DXY H1 chart
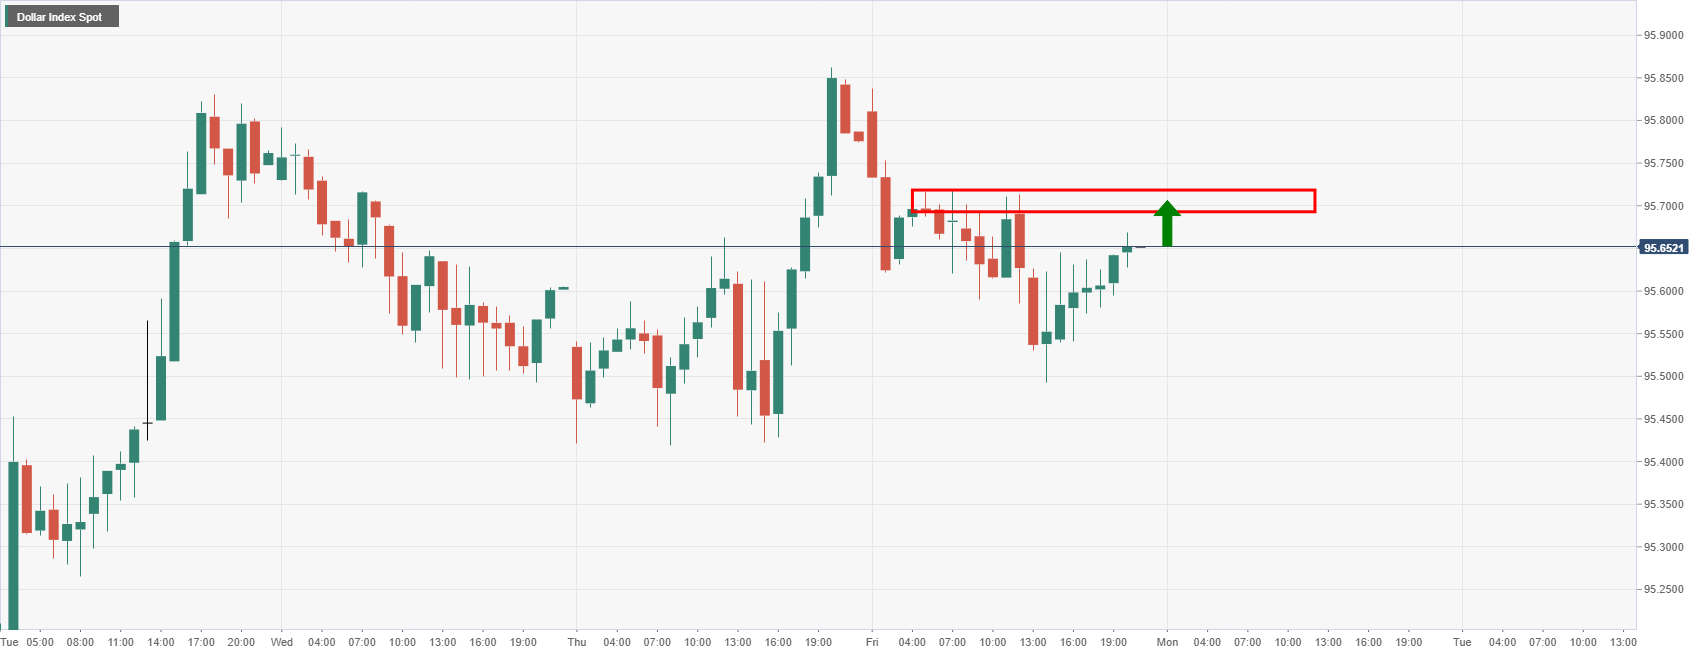
The pound is often regarded as a riskier currency to hold at times of stress due to the nations twin deficits, so this too could tip the balance the bear's favour for the opening sessions this week.
| Pare | Closed | Change, % |
|---|---|---|
| AUDUSD | 0.71752 | -0.7 |
| EURJPY | 128.899 | -0.09 |
| EURUSD | 1.13412 | 0.28 |
| GBPJPY | 154.032 | -0.7 |
| GBPUSD | 1.35525 | -0.32 |
| NZDUSD | 0.67127 | -0.61 |
| USDCAD | 1.25794 | 0.63 |
| USDCHF | 0.91188 | -0.53 |
| USDJPY | 113.655 | -0.38 |


© 2000-2026. Bản quyền Teletrade.
Trang web này được quản lý bởi Teletrade D.J. LLC 2351 LLC 2022 (Euro House, Richmond Hill Road, Kingstown, VC0100, St. Vincent and the Grenadines).
Thông tin trên trang web không phải là cơ sở để đưa ra quyết định đầu tư và chỉ được cung cấp cho mục đích làm quen.
Giao dịch trên thị trường tài chính (đặc biệt là giao dịch sử dụng các công cụ biên) mở ra những cơ hội lớn và tạo điều kiện cho các nhà đầu tư sẵn sàng mạo hiểm để thu lợi nhuận, tuy nhiên nó mang trong mình nguy cơ rủi ro khá cao. Chính vì vậy trước khi tiến hành giao dịch cần phải xem xét mọi mặt vấn đề chấp nhận tiến hành giao dịch cụ thể xét theo quan điểm của nguồn lực tài chính sẵn có và mức độ am hiểu thị trường tài chính.
Sử dụng thông tin: sử dụng toàn bộ hay riêng biệt các dữ liệu trên trang web của công ty TeleTrade như một nguồn cung cấp thông tin nhất định. Việc sử dụng tư liệu từ trang web cần kèm theo liên kết đến trang teletrade.vn. Việc tự động thu thập số liệu cũng như thông tin từ trang web TeleTrade đều không được phép.
Xin vui lòng liên hệ với pr@teletrade.global nếu có câu hỏi.
ngân hàng