- Phân tích
- Tin tức và các công cụ
- Tin tức thị trường
Tin tức thì trường
FXStreet notes that uncertainty related to health, economic and political issues is still very high, and yet stock market indices have already recovered sharply. It is clear that this is explained by the abundant liquidity created by central banks and the long-term real interest rates. When uncertainty declines, then these same monetary conditions will lead to a surge in share prices, according to analysts at Natixis.
“Currently, uncertainty regarding the health situation is still very high as the Covid-19 virus continues to spread. Political uncertainty is also high due to tensions between the United States and China, new protectionist threats and the US presidential election. Yet the equity market has already recovered sharply, and PERs are already well above pre-COVID crisis levels.”
“The role of the highly expansionary monetary policy conducted in OECD countries is well known: thanks to the surge in the money supply, part of the money held is invested in equities; monetary policy is shifting to yield curve control and control of long-term interest rates, which has led to expectations of a long period of negative real long-term interest rates. The excess money supply and negative real long-term interest rates are driving up share prices and equity valuation.”
“Once uncertainty declines (precise date known for a COVID vaccine, visibility on 2021-2022 growth, etc.), share prices will soar due to massive investment of the liquidity in equities and negative real long-term interest rates.”
U.S. stock-index futures fell on Friday, as stronger-than-forecast U.S. July jobs data were not enough to outweigh concerns over a new round of tensions between the U.S. and China, ignited by Trump’s ban on TikTok and WeChat.
Global Stocks:
Index/commodity | Last | Today's Change, points | Today's Change, % |
Nikkei | 22,329.94 | -88.21 | -0.39% |
Hang Seng | 24,531.62 | -398.96 | -1.60% |
Shanghai | 3,354.04 | -32.43 | -0.96% |
S&P/ASX | 6,004.80 | -37.40 | -0.62% |
FTSE | 6,027.96 | +1.02 | +0.02% |
CAC | 4,877.38 | -7.75 | -0.16% |
DAX | 12,631.32 | +39.64 | +0.31% |
Crude oil | $41.81 | -0.33% | |
Gold | $2,074.10 | +0.23% |
(company / ticker / price / change ($/%) / volume)
ALTRIA GROUP INC. | MO | 41.51 | -0.04(-0.10%) | 5638 |
Amazon.com Inc., NASDAQ | AMZN | 3,215.15 | -9.85(-0.31%) | 37160 |
American Express Co | AXP | 95.25 | -0.67(-0.70%) | 5107 |
AMERICAN INTERNATIONAL GROUP | AIG | 29.45 | 0.13(0.44%) | 9176 |
Apple Inc. | AAPL | 453.65 | -1.14(-0.25%) | 882647 |
AT&T Inc | T | 29.8 | -0.04(-0.13%) | 36630 |
Boeing Co | BA | 172 | -0.20(-0.12%) | 93792 |
Caterpillar Inc | CAT | 133.92 | -0.47(-0.35%) | 3980 |
Chevron Corp | CVX | 87.1 | -0.37(-0.42%) | 12244 |
Cisco Systems Inc | CSCO | 47.36 | -0.41(-0.86%) | 24167 |
Citigroup Inc., NYSE | C | 50.99 | 0.10(0.20%) | 46259 |
E. I. du Pont de Nemours and Co | DD | 54.98 | 0.27(0.49%) | 4351 |
Exxon Mobil Corp | XOM | 43.55 | -0.09(-0.21%) | 39105 |
Facebook, Inc. | FB | 263.87 | -1.41(-0.53%) | 221722 |
FedEx Corporation, NYSE | FDX | 172.25 | 0.01(0.01%) | 2876 |
Ford Motor Co. | F | 6.91 | -0.02(-0.29%) | 127145 |
Freeport-McMoRan Copper & Gold Inc., NYSE | FCX | 14.44 | -0.12(-0.82%) | 49113 |
General Electric Co | GE | 6.29 | -0.04(-0.63%) | 369867 |
General Motors Company, NYSE | GM | 26.65 | 0.03(0.11%) | 31017 |
Goldman Sachs | GS | 203.49 | -0.76(-0.37%) | 5827 |
Hewlett-Packard Co. | HPQ | 18.3 | 0.03(0.16%) | 28583 |
Home Depot Inc | HD | 270 | 0.63(0.23%) | 3933 |
HONEYWELL INTERNATIONAL INC. | HON | 153 | 0.42(0.28%) | 2958 |
Intel Corp | INTC | 48.46 | -0.11(-0.23%) | 143180 |
International Business Machines Co... | IBM | 124.2 | -0.29(-0.23%) | 11390 |
International Paper Company | IP | 34.64 | -0.63(-1.79%) | 25567 |
Johnson & Johnson | JNJ | 147.79 | 0.24(0.16%) | 8336 |
JPMorgan Chase and Co | JPM | 97.27 | 0.03(0.03%) | 57150 |
McDonald's Corp | MCD | 203.17 | -0.01(-0.00%) | 2051 |
Microsoft Corp | MSFT | 215.3 | -1.05(-0.49%) | 203196 |
Nike | NKE | 100.24 | -0.21(-0.21%) | 5925 |
Pfizer Inc | PFE | 38.48 | 0.21(0.55%) | 182181 |
Procter & Gamble Co | PG | 132.12 | -0.59(-0.44%) | 2639 |
Starbucks Corporation, NASDAQ | SBUX | 75.59 | -0.07(-0.09%) | 6563 |
Tesla Motors, Inc., NASDAQ | TSLA | 1,501.55 | 11.97(0.80%) | 71725 |
The Coca-Cola Co | KO | 47.41 | -0.07(-0.15%) | 8779 |
Travelers Companies Inc | TRV | 114.02 | 0.28(0.25%) | 810 |
Twitter, Inc., NYSE | TWTR | 37.6 | -0.09(-0.24%) | 19993 |
UnitedHealth Group Inc | UNH | 312.72 | -1.34(-0.43%) | 842 |
Verizon Communications Inc | VZ | 57.76 | -0.07(-0.12%) | 5603 |
Visa | V | 198.58 | -0.19(-0.10%) | 12392 |
Wal-Mart Stores Inc | WMT | 129.58 | 0.23(0.18%) | 9597 |
Walt Disney Co | DIS | 130.4 | -0.42(-0.32%) | 68306 |
Yandex N.V., NASDAQ | YNDX | 59.93 | -0.07(-0.12%) | 1217 |
FXStreet reports that the S&P 500 has broken with ease through the top of the February “pandemic” price gap at 3328/38 and analysts at Credit Suisse look for this to clear the way for a challenge on the 3394 record high.
“S&P 500 strength has extended through our next flagged resistance/’objective’ and to be honest, what we had expected to be tougher initial resistance at the top of the February price gap at 3328/38.”
“Whilst we remain concerned the trend is getting overstretched this suggests we can see strength extend further yet with resistance seen next at 3373 and then and critically the 3394 record high, where we would expect to see at least some form of rejection, even if this proves only to be a brief pullback.”
“Support at 3318/17 needs to hold to keep the immediate risk higher. A break can see a deeper setback to 3307, then what we would look to be a better support from its 13-day average and lows from the beginning of the week at 3286/71.”
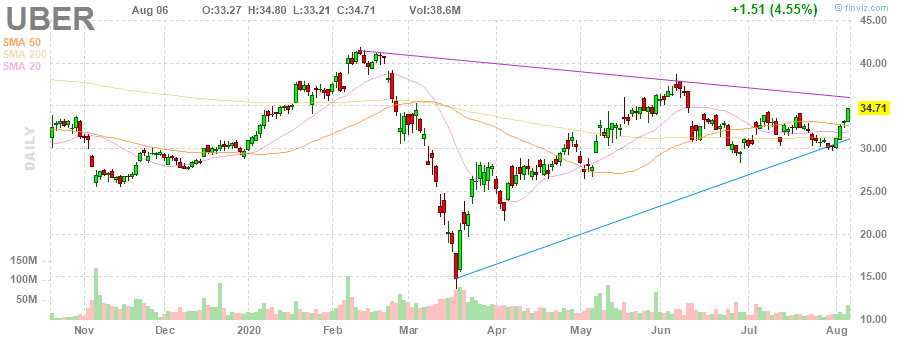
Uber (UBER) reported Q2 FY 2020 loss of $1.02 per share (versus -$4.72 per share in Q2 FY 2019), worse than analysts’ consensus estimate of -$0.88 per share.
The company’s quarterly revenues amounted to $2.241 bln (-29.2% y/y), beating analysts’ consensus estimate of $2.181 bln.
UBER fell to $33.28 (-4.12%) in pre-market trading.
| Index | Change, points | Closed | Change, % |
|---|---|---|---|
| NIKKEI 225 | -96.7 | 22418.15 | -0.43 |
| Hang Seng | -171.96 | 24930.58 | -0.69 |
| KOSPI | 30.75 | 2342.61 | 1.33 |
| ASX 200 | 40.9 | 6042.2 | 0.68 |
| FTSE 100 | -77.78 | 6026.94 | -1.27 |
| DAX | -68.57 | 12591.68 | -0.54 |
| CAC 40 | -48.21 | 4885.13 | -0.98 |
| Dow Jones | 185.46 | 27386.98 | 0.68 |
| S&P 500 | 21.39 | 3349.16 | 0.64 |
| NASDAQ Composite | 109.67 | 11108.07 | 1 |


© 2000-2026. Bản quyền Teletrade.
Trang web này được quản lý bởi Teletrade D.J. LLC 2351 LLC 2022 (Euro House, Richmond Hill Road, Kingstown, VC0100, St. Vincent and the Grenadines).
Thông tin trên trang web không phải là cơ sở để đưa ra quyết định đầu tư và chỉ được cung cấp cho mục đích làm quen.
Giao dịch trên thị trường tài chính (đặc biệt là giao dịch sử dụng các công cụ biên) mở ra những cơ hội lớn và tạo điều kiện cho các nhà đầu tư sẵn sàng mạo hiểm để thu lợi nhuận, tuy nhiên nó mang trong mình nguy cơ rủi ro khá cao. Chính vì vậy trước khi tiến hành giao dịch cần phải xem xét mọi mặt vấn đề chấp nhận tiến hành giao dịch cụ thể xét theo quan điểm của nguồn lực tài chính sẵn có và mức độ am hiểu thị trường tài chính.
Sử dụng thông tin: sử dụng toàn bộ hay riêng biệt các dữ liệu trên trang web của công ty TeleTrade như một nguồn cung cấp thông tin nhất định. Việc sử dụng tư liệu từ trang web cần kèm theo liên kết đến trang teletrade.vn. Việc tự động thu thập số liệu cũng như thông tin từ trang web TeleTrade đều không được phép.
Xin vui lòng liên hệ với pr@teletrade.global nếu có câu hỏi.
ngân hàng