- Phân tích
- Tin tức và các công cụ
- Tin tức thị trường
Tin tức thì trường
- DXY retains the previous day’s pullback from 20-year high.
- Softer chatters over economic slowdown, repeated comments from central bankers help trigger risk-on mood.
- Pre-NFP anxiety, headlines from China also contribute to the DXY pullback.
US Dollar Index (DXY) bulls take a breather around the 20-year high as the quote extends the previous day’s pullback to attack 107.00 during Friday’s Asian session. in doing so, the US dollar gauge versus the six major currencies portrays the market’s consolidation ahead of the key US employment data for June.
In addition to the pre-NFP paring of gains, the market players also benefit from the recent improvement in the risk appetite and drag the US dollar down. That said, repeated comments from the major central bankers and efforts to tame recession fears join headlines from China to help improve the mood.
China is up for $220 billion of stimulus with unprecedented bond sales, per Bloomberg. On the same line was news that diplomats from the US and China are up for meeting personally after the latest virtual meeting cited progress in trade talks. With this, Beijing is optimistic that it can help ease the US its inflation problem by solving the supply-chain riddle, the same gained fewer accolades from the experts though.
Fed speakers, CEO of the Federal Reserve Bank of St. Louis. James Bullard stated, per Reuters, “We've got a good chance at a soft landing.” Additionally, Federal Reserve Governor Christopher Waller said inflation is way too high and does not seem to be easing and the Fed has to apply a more restrictive policy.
Mixed data from the US also weighed on the DXY as US Initial Jobless Claims rose by 4,000 to 235,000 in the week ending July 2, versus 230,000 expected. With this, the 4-week moving average number was 232,500, up 750 from the previous week's average. Further, the US goods and services deficit narrowed by $1.1 billion to $85.5 billion in May, marking the smallest monthly deficit in 2022.
Against this backdrop, the US Treasury yields regain upside momentum and the Wall Street benchmarks closed with gains. However, the S&P 500 Futures print mild losses by the press time.
Technical analysis
Doji candlestick at the multi-year high joins overbought RSI conditions to challenge DXY bulls. The pullback, however, remains elusive until breaking the previous resistance line from May 13, close to 106.30 by the press time.
US inflation expectations, as per the 10-year breakeven inflation rate per the St. Louis Federal Reserve (FRED) data, bounced off the lowest levels since September 2021 by the end of Thursday’s North American session. That said, the inflation gauge recently flashed the 2.33% mark, reversing from the previous day’s multi-month low of 2.29%.
The recently improved inflation expectations fail to defy the recession fears signaled by the inversion of the 2-year and the 10-year Treasury yield curve. That said, the US 2-year Treasury yields are higher around 3.02% while the 10-year bond coupon seesaws near 3.0% at the latest.
The upbeat prints of inflation expectations appear to weigh on the market sentiment and can help the US dollar to remain firm.
It’s worth noting that the US Dollar Index (DXY) retreated from the 20-year high the previous day, even if the daily loss was almost negligible.
Also read: Nonfarm Payrolls Preview: Three dollar-positive scenarios, only one negative one
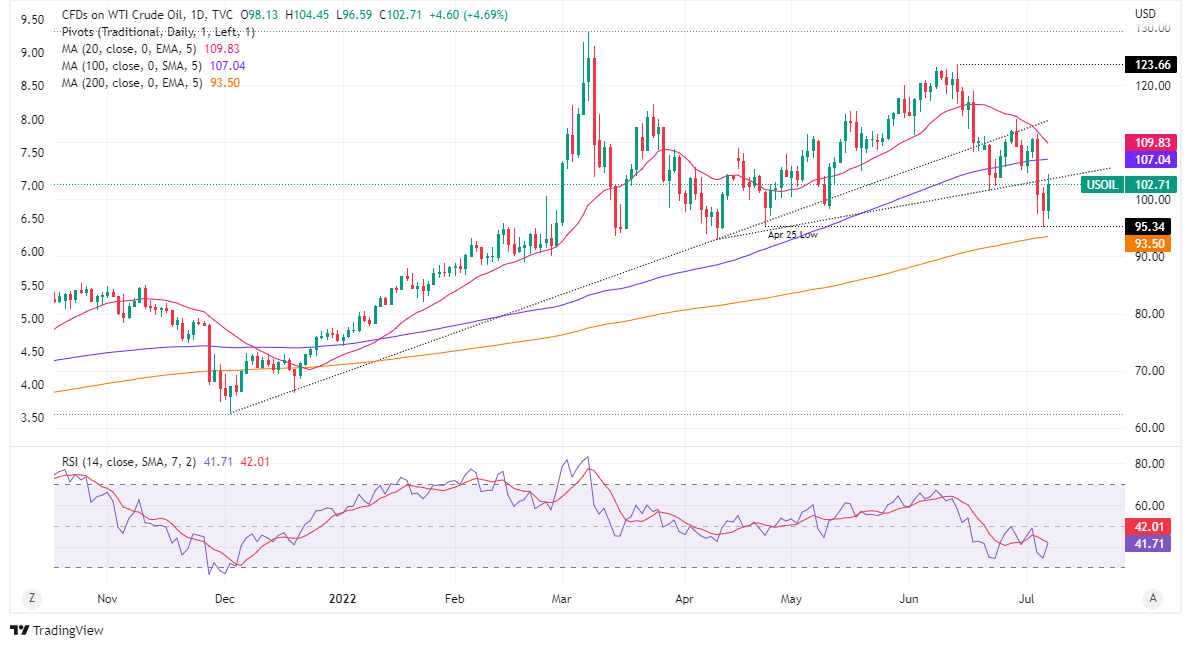
- WTI crude oil prices pare the biggest daily jump in two months.
- Impending bear cross on MACD, RSI retreats hints at further weakness.
- Adjacent support line tests bears, multiple hurdles stand tall to probe buyers.
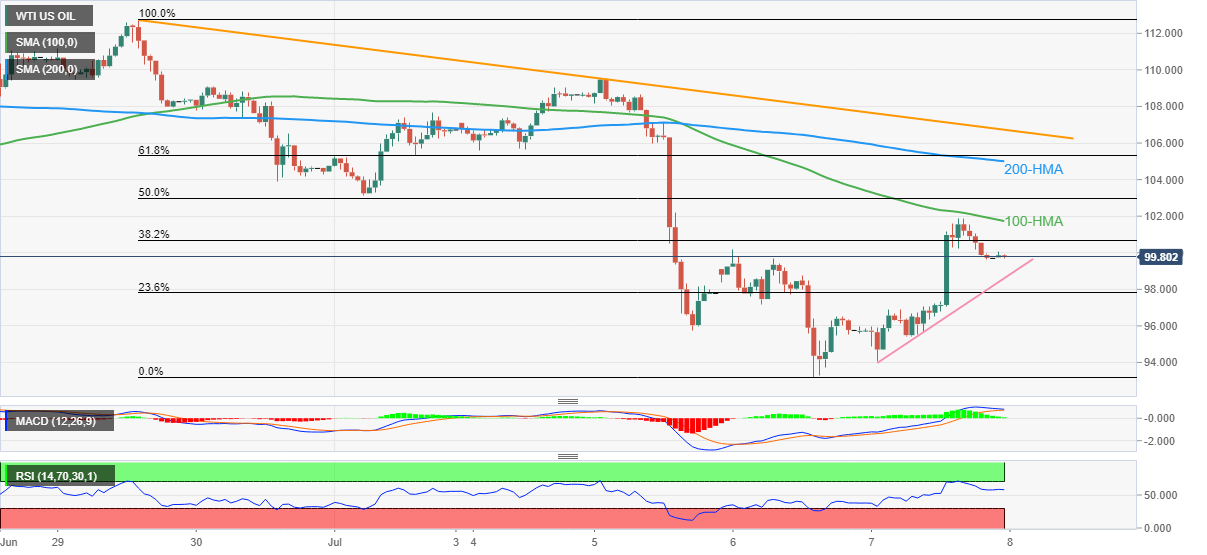
WTI crude oil struggles to extend the previous day’s rebound from a three-month low during Friday’s sluggish Asian session. In doing so, the black gold keeps the pullback from the 100-HMA while taking rounds to $99.75 by the press time.
Given the recent RSI retreat from the overbought territory, not to forget the looming bear cross of the MACD line with the signal line, the energy benchmark is expected to stretch the latest pullback.
However, immediate support around $98.70 could serve as a trigger for the commodity’s fresh selling towards the recently marked multi-day low of $93.20.
Following that, March’s low of $92.35 could act as the last defense of bulls before directing the quote to the October 2021 high near $85.00.
On the flip side, recovery remains elusive below the 100-HMA level surrounding $101.75.
Even if the quote crosses the 100-HMA, a convergence of the 200-HMA and 61.8% Fibonacci retracement of the June 29 to July 06 downturn, near $105.00-105.30, could challenge the WTI bulls.
Also likely to test the energy benchmark’s upside momentum is the one-week-old descending resistance line, close to $106.80 by the press time.
WTI: Hourly chart
Trend: Further weakness expected
- Gold price is witnessing a muted performance as investors await US NFP.
- The DXY is expected to surrender the critical support of 107.00.
- The US employment data is expected to display a vulnerable performance.
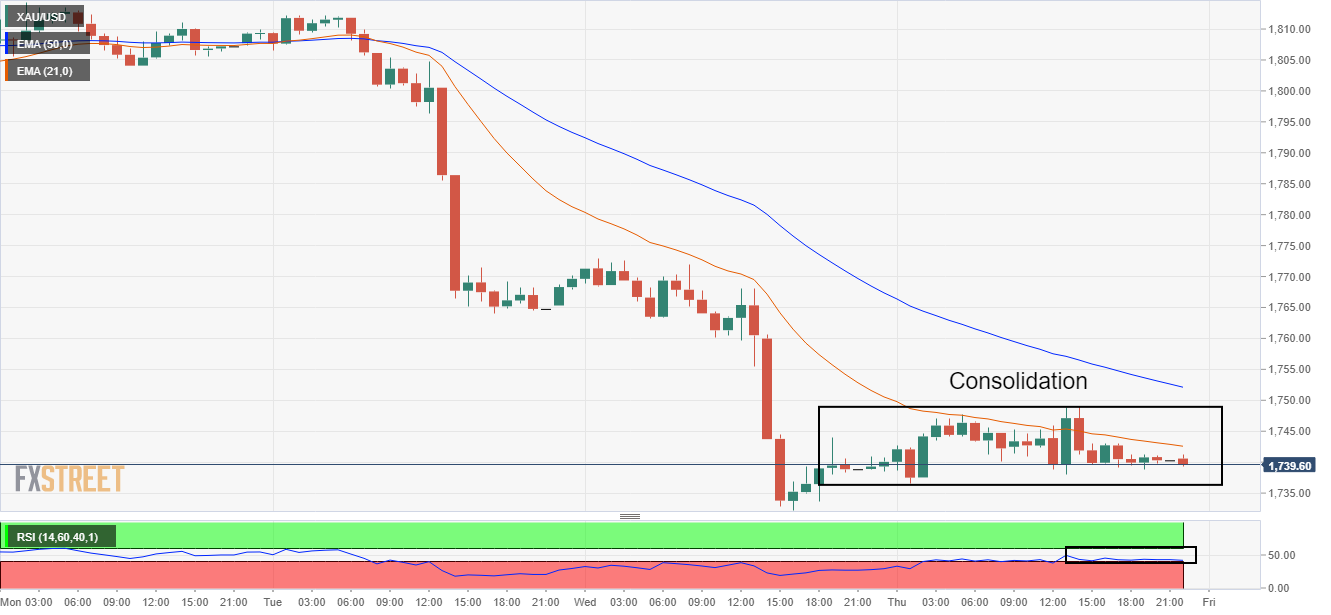
Gold price (XAU/USD) is displaying a lackluster performance in the early Tokyo session. The precious metal is juggling in a minute range of $1,738.79-1,741.16 as the US dollar index (DXY) is trading subdued ahead of the US Nonfarm Payrolls (NFP). On a broader note, the bright metal has turned sideways after a sheer downside move. The absence of recovery signals in the asset is hinting at more downside potential.
Meanwhile, the DXY is likely to surrender the critical support of 107.00 as the asset is displaying exhaustion signals after failing to print a fresh 19-year high. The asset attempted to surpass Wednesday’s high at 107.26, however, a failure on the same is pushing the asset lower.
In today’s session, the release of the US NFP will provide decisive guidance to the gold prices. A preliminary estimate for the US NFP is 270k, lower than the prior print of 390k. While the Unemployment Rate will remain stable at 3.6%. It is worth noting that the economy is maintaining its full employment levels consecutively for the past eight months, which will keep the DXY underpinned.
Gold technical analysis
The gold prices are going through the phase of inventory distribution on an hourly scale. Considering the prior downside moves, a follow-up decline is expected in the counter after the downside break of the consolidation formed in a $1,736.55-1,748.77 range. The precious metal has failed to sustain above the 21-period Exponential Moving Average (EMA) at $1,742.50, which signals the strength of the greenback bulls. Also, the 50-EMA at $1,751.80 is declining, which adds to the downside filters. The Relative Strength Index (RSI) (14) is on the verge of surrendering the support of 40.00, which will fetch a fresh downside fall in the asset.
Gold hourly chart
- USD/CHF retains five-day uptrend, grinds higher of late.
- Risk appetite improved amid absence of fresh catalyst to amplify recession woes.
- Softer data, pre-NFP consolidation also played their roles to adjust market moves.
- US jobs report for June will be important considering hopes of 0.75% rate hike.
USD/CHF grinds higher as the bulls poke the 50-DMA hurdle surrounding 0.9740 for the third consecutive day during Friday’s Asian session. The Swiss currency (CHF) pair recently benefited from the improvement in the market sentiment, as well as the firmer US dollar, ahead of the key US jobs report for June.
Risk-aversion eased the previous day as major policymakers repeated previous comments while trying to tame the recession fears. Also keeping the market hopeful were headlines concerning China and mixed data from the US.
China is up for $220 billion of stimulus with unprecedented bond sales, per Bloomberg. On the same line was news that diplomats from the US and China are up for meeting personally after the latest virtual meeting cited progress in trade talks. With this, Beijing is optimistic that it can help ease the US its inflation problem by solving the supply-chain riddle, the same gained fewer accolades from the experts though.
Talking about the data, US Initial Jobless Claims rose by 4,000 to 235,000 in the week ending July 2, versus 230,000 expected. With this, the 4-week moving average number was 232,500, up 750 from the previous week's average. Further, the US goods and services deficit narrowed by $1.1 billion to $85.5 billion in May, marking the smallest monthly deficit in 2022.
Elsewhere, Fed speakers, CEO of the Federal Reserve Bank of St. Louis. James Bullard stated, per Reuters, “We've got a good chance at a soft landing.” Additionally, Federal Reserve Governor Christopher Waller said inflation is way too high and does not seem to be easing and the Fed has to apply a more restrictive policy.
Amid these plays, the US Treasury yields regain upside momentum and the Wall Street benchmarks closed with gains. However, the S&P 500 Futures print mild losses by the press time.
Moving on, risk catalysts are important for the USD/CHF pair traders to watch ahead of the US employment data. the monthly increase in jobs since April last year, by easing to 268K from 390K for June while the Unemployment Rate is likely to stay unchanged at 3.6% for the said month.
Also read: Nonfarm Payrolls Preview: Three dollar-positive scenarios, only one negative one
Technical analysis
50-DMA challenges USD/CHF bulls around 0.9740 since Wednesday. Given the recently firmer RSI, the odds of the pair’s upside break to the aforementioned hurdle appear high.
“China’s Ministry of Finance is considering allowing local governments to sell 1.5 trillion yuan ($220 billion) of special bonds in the second half of this year, an unprecedented acceleration of infrastructure funding aimed at shoring up the country’s beleaguered economy,” said Bloomberg on Thursday.
More to come
- USD/CAD has displayed a gradual downside move after failing to cross the yearly high at 1.3083.
- The consensus for the employment data by the US and Canada is on the lower side.
- A meaningful recovery in the oil prices over the last two days has supported the loonie bulls.
The USD/CAD pair has witnessed a corrective phase to near the critical support of 1.2960. A corrective move in the asset is followed by greenback bulls’ failure to cross Wednesday’s high at 1.3083. The asset is hovering near the crucial support of 1.2960 and may likely remain vulnerable ahead of the employment data from the US and Canada.
Considering the estimates, the US economy has created 270k jobs in June, lower than the prior release of 390k. The jobless rate may remain stable at around 3.6%. What investors will focus on is the Average Hourly Earnings, as their lower recording against the soaring price pressures will trim the consumer confidence significantly and henceforth the demand for durable goods.
Meanwhile, the US dollar index (DXY) is displaying downside risks after testing the fresh 19-year high at 107.26. The DXY is displaying a subdued performance as lower US NFP won’t allow the Federal Reserve (Fed) to announce bumper rate hikes in a presumptuous manner.
On the loonie front, Statistics Canada is likely to report a Net Change in Employment at 22.5K, lower than the former release of 39.8k. The Unemployment Rate is seen as stable at 5.1%. This will have a substantial impact on the loonie bulls.
The loonie bulls are also performing on recovery in the oil prices. At the press time, oil prices have corrected minutely below $100.00, however, the asset has recovered significantly from the low of $93.20 recorded on Wednesday.
- GBP/USD stays on the front foot inside a bullish chart pattern after rising the most in three weeks.
- Immediate descending trend line challenge buyers ahead of the 1.2155-60 key resistance.
- 20-DMA adds strength to the upside barrier, sellers have a bumpy road to the south.
GBP/USD buyers attack a two-week-old resistance line while extending the previous day’s run-up to Friday’s Asian session. That said, the Cable pair picks up bids to 1.2030 after rising the most in nearly three weeks. In doing so, the quote remains inside a two-month-long falling wedge bullish chart pattern.
Considering the quote’s rebound from the stated bullish formation’s support line, coupled with an improvement in the RSI (14), the latest rebound is expected to overcome the immediate hurdle surrounding 1.2030-35.
The same could propel the pair towards the wedge’s resistance line, also nearing the 20-DMA, around 1.2155-60 key hurdle.
Should the GBP/USD prices rally beyond 1.2160, it could confirm the theoretical run-up beyond 1.2800. However, the highs marked during mid-June and May, respectively around 1.2410 and 1.2665 could challenge the upside momentum.
On the contrary, pullback moves may take a breather near the 1.2000 psychological magnet before revisiting the recent multi-month low of 1.1876.
However, the lower line of the stated wedge, at 1.1861 by the press time, will challenge the GBP/USD bears afterward.
GBP/USD: Daily chart
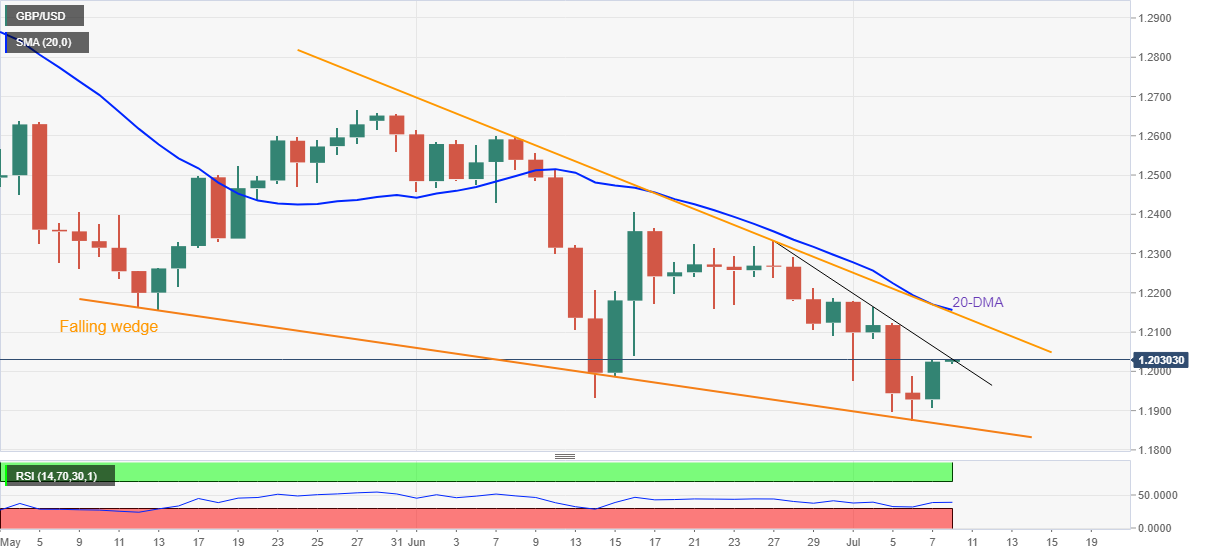
Trend: Further recovery expected
- The EUR/JPY accumulates losses of 2% in the week.
- Despite an upbeat market sentiment, the EUR/JPY could not rally, weighed by the EU’s energy crisis.
- EUR/JPY to tumble towards 137.00 on buyers unable to reclaim 139.00.
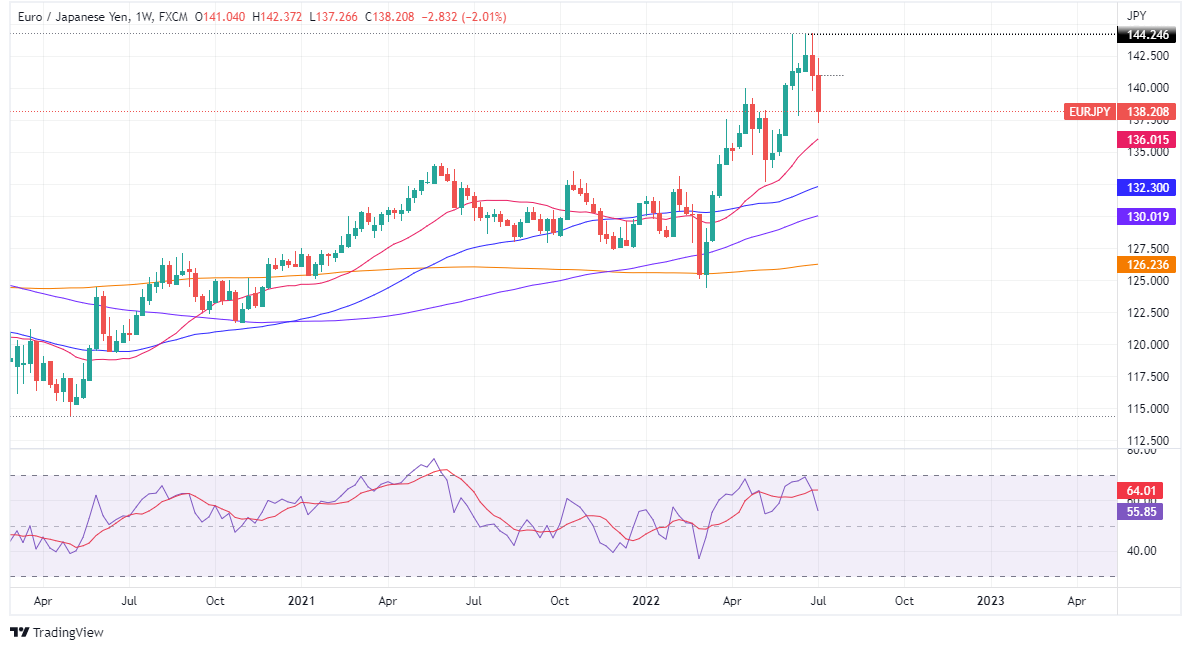
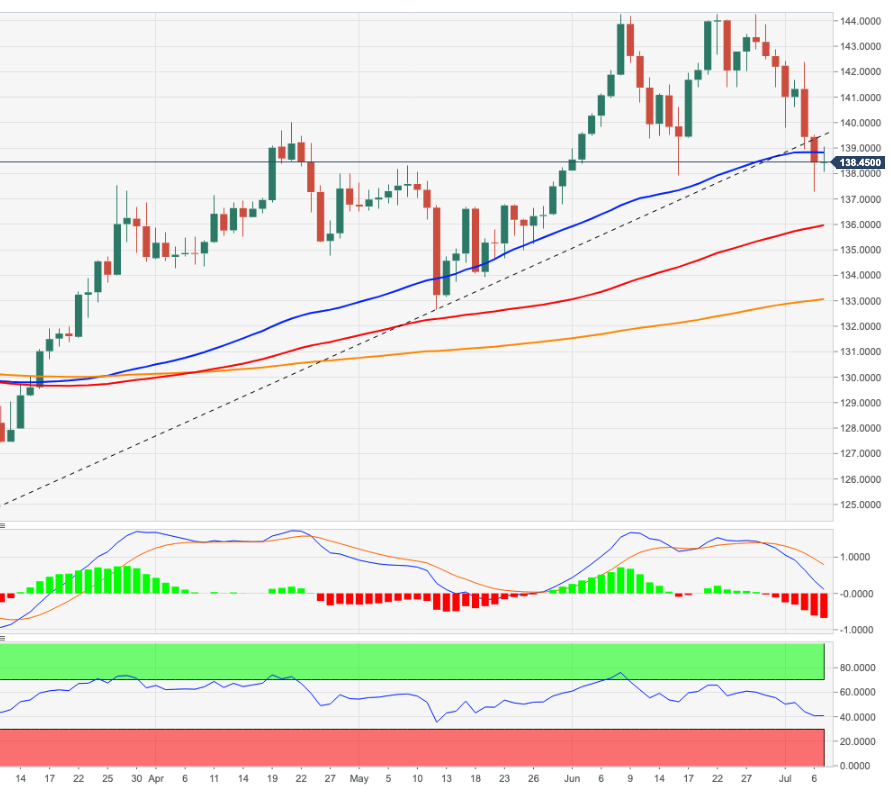
The EUR/JPY keeps tumbling despite an upbeat market sentiment, courtesy of fading recession fears, as US Fed policymakers reiterated recession worries are overblown. At 138.20, the EUR/JPY is barely up 0.11% as the Asian Pacific session begins.
EU energy prices and slower economic growth are a headwind for the EUR/JPY
Futures in Asia are pointing towards a higher open. During the week, concerns of a worldwide recession were the narrative around the financial markets. Nevertheless, on Thursday, Fed’s Waller and Bullard dismissed those fears regarding the US, and both backed a 75 bps rate hike to the Federal funds rate in July.
Talking about the euro area, high energy prices, and the slowing economic path, as depicted by S&P Global PMIs in the bloc about to enter the contractionary territory, weighed on the EUR/JPY.
In the meantime, the EUR/JPY Thursday’s price action depicts the pair was under selling pressure but consolidated around the 138.00-139.00 area, as the Japanese yen weakened throughout the day.
EUR/JPY Daily chart
The cross-currency pair tumbled below the 50 -day EMA around 139.00 on Tuesday, opening the door for further losses. Sellers capitalized on that, dragging the pair towards the weekly low at 137.26, but in the end, the EUR/JPY settled above the 138.00 mark. Meanwhile, with oscillators in bearish territory and EUR/JPY exchange rate below the 20 and 50-day EMA, the EUR/JPY might be headed to the downside.
Therefore, the EUR/JPY’s first support would be the July 6 daily low at 137.26. Break below will expose the May 23 daily high-turned-support at 136.79, followed by a test of the 100-day EMA at 136.00.
EUR/JPY Key Technical Levels
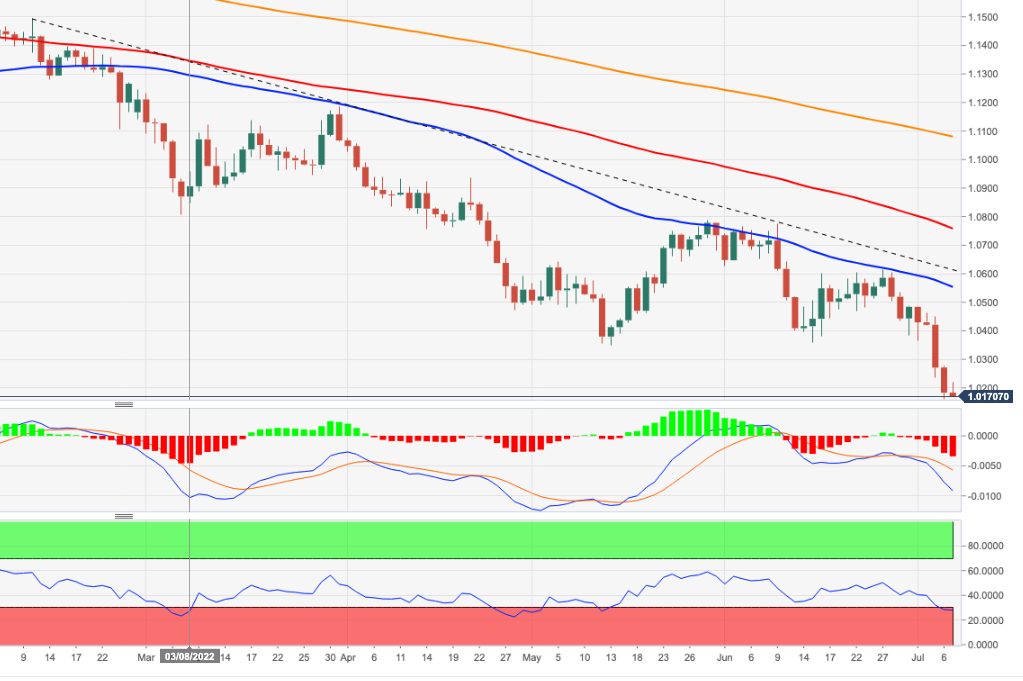
- EUR/USD holds lower grounds at 20-year bottom after five-day downtrend.
- Downbeat German/Eurozone data, unimpressive ECB Meeting Accounts favor sellers.
- Recession fears, mixed US data and Fedspeak defended the USD even as market sentiment improved.
- No major data insight ahead of US jobs report for June, risk catalysts are the key.
EUR/USD fails to cheer the improvement in the market’s mood as it remains depressed around a two-decade low, refreshed the previous day around 1.0150, during Friday’s initial Asian session. In doing so the major currency pair portrays the market’s anxiety ahead of the key US Nonfarm Payrolls (NFP) data.
Market sentiment improved on Thursday as major policymakers repeated previous comments while trying to tame the recession fears. Also keeping the market hopeful were headlines concerning China and mixed data, mostly down from Eurozone and Germany.
That said, diplomats from the US and China are up for meeting personally after the latest virtual meeting cited progress in trade talks. With this, Beijing is optimistic that it can help ease the US its inflation problem by solving the supply-chain riddle, the same gained fewer accolades from the experts though.
On a different page, the upcoming earnings season and recovery in the US Treasury yields also helped to improve the risk profile but failed to propel the EUR/USD prices amid louder economic pessimism in the bloc, mainly due to the energy crisis.
Talking about the data, US Initial Jobless Claims rose by 4,000 to 235,000 in the week ending July 2, versus 230,000 expected. With this, the 4-week moving average number was 232,500, up 750 from the previous week's average. Further, the US goods and services deficit narrowed by $1.1 billion to $85.5 billion in May, marking the smallest monthly deficit in 2022.
On the other hand, German Industrial Production eased on MoM to 0.2%, while improving on YoY to -1.5% whereas the European Central Bank (ECB) Monetary Policy Meeting Accounts highlighted inflation fears and mentioned that some members discussed the need for higher rate hikes. Even so, the emphasis was to deliver 0.25% increase in July.
Elsewhere, ECB Governing Council member Yannis Stournaras noted on Thursday that they are not observing excessive wage demand in Europe, as reported by Reuters. Further, ECB policymaker and Governor of the Central Bank of Cyprus Constantinos Herodotou said that they are not targeting exchange rates while adding that they do take their impact on inflation into account.
In the case of the Fed speakers, CEO of the Federal Reserve Bank of St. Louis. James Bullard stated, per Reuters, “We've got a good chance at a soft landing.” Additionally, Federal Reserve Governor Christopher Waller said inflation is way too high and does not seem to be easing and the Fed has to apply a more restrictive policy.
To sum up, the recent pause in the risk-off mood isn’t a sign of improvement and fails to help the EUR/USD prices ahead of the US jobs report for June. Forecasts suggest the headline US Nonfarm Payrolls (NFP) is expected to post the smallest monthly increase in jobs since April last year, by easing to 268K from 390K for June while the Unemployment Rate is likely to stay unchanged at 3.6% for the said month.
Also read: Nonfarm Payrolls Preview: Three dollar-positive scenarios, only one negative one
Technical analysis
Unless bouncing back beyond June’s low 1.0360, EUR/USD remains vulnerable to testing 1.0000 psychological magnet. The oversold RSI conditions, however, hint at a corrective pullback.
- AUD/USD is likely to display more gains above 0.6850 as the US NFP may display a downbeat performance.
- Lower US Average Hourly Earnings will hurt the paychecks of the households.
- Australia’s upbeat Trade Balance has strengthened aussie against the greenback.
The AUD/USD pair has turned sideways after facing minor resistance around 0.6850 in the late New York session. The asset is likely to extend its recovery and may surpass Thursday’s high at 0.6848 as investors are expecting downbeat US Nonfarm Payrolls (NFP) data.
As per the market consensus, the US economy has added 270k jobs in the labor market, significantly lower than the former release of 390k. Alongside, the Unemployment Rate may remain stable at 3.6%. It is worth noting that the generation of lower employment opportunities by the US economy doesn’t resemble a slowdown. The labor market has reached full employment levels and therefore, less room is available for the creation of more job opportunities.
Apart from that, investors' focus will remain on the Average Hourly Earnings, which will remain flat at 5.2%. The inflation rate in the US economy has jumped to 8.6% while the growth in the wage prices is not lucrative. This may reduce the ‘paychecks’ of the households and eventually their aggregate demand quantity-wise for durable goods. Also this week, the US ISM Services New Orders Index data remained vulnerable, which adds to the downside filters for the overall demand.
On the aussie front, the upbeat Trade Balance data has supported the antipodean. The monthly economic data landed at 15,965M, higher than the estimates of 10,725M and the prior release of 13,248M. Next week, the aussie employment data will remain in focus.
- The AUD/JPY erased Wednesday’s losses on investors’ renewed optimism as Fed officials downplayed a recessionary scenario.
- The cross-currency pair rallied more than 100 pips in the day, breaking above the 93.00 mark.
- AUD/JPY buyers’ failure at 93.40 might open the door for further losses.
The AUD/JPY rises on investors’ positive mood, trimming Wednesday’s losses, up by almost 1% as the New York session ends. At the time of writing, the AUD/JPY is trading at 93.00.
Sentiment remains upbeat as the Asian Pacific session begins, as Fed speakers downplayed recession feats, seeing a soft landing as achievable. Policymakers backed a 75 bps rate increase in July of the Federal funds rate (FFR) while also noting that the US economy is strong.
The AUD/JPY Thursday’s price action shows the pair began trading around 92.20 before dipping toward the daily low at 91.89 during the Asian session. However, European and North American traders sent the cross rallying above the 93.00 figure as the day progressed.
AUD/JPY Daily chart
The daily chart shows that the AUD/JPY is upward biased. However, a rising wedge, already broken the downside, might put a lid on the AUD/JPY jump from weekly lows. Also, on its way north, the confluence of the 20-day EMA, with the July 4 high around the 93.28-93.38 area, would be difficult to overcome, but If AUD/JPY achieves it, it will clear the way for further upside. Therefore, the AUD/JPY’s first resistance would be the July 5 high of around 93.98, followed by the rising wedge’s bottom trendline around 94.80.
Otherwise, the AUD/JPY first support would be the 92.00 figure. A breach of the latter would expose the July 6 daily low at91.52, followed by a challenge of the 100-day EMA at 90.68.

AUD/JPY Key Technical Levels
- NZD/USD is perched in the higher end of the 0.6100 area.
- The focus is on the downside for the session ahead before NFP.
NZD/USD is staring out in Asia on the backfoot in the upper quarter of the 0.6100 area and below the highs of the prior day with a focus on the New York session's low of 0.6162 for the coming Tokyo session.
The driver in the forex space is the US dollar which will come under the micro scope in the coming day with a focus o the US economy as investors await the jobs data ahead of next week'S Consumer Price Index next week. This will all go towards the sentiment that is building around the Federal Reserve when policymakers next meet on July 26-27.
The strength of Nonfarm Payrolls on Friday will help investors to assess the pace of the rise in wages. Analysts at TD Securities explained that employment likely continued to advance firmly in June but at a more moderate pace after three consecutive job gains of around 400k in March-May.
Meanwhile, analysts at ANZ Bank explained that, ''once we are past US jobs data tonight, local factors are likely to rise to the fore heading into next week’s Reserve Bank of New Zealand MPS – and they really have no choice but to be hawkish given the inflation backdrop; that may harm the NZD given hard landing fears?''
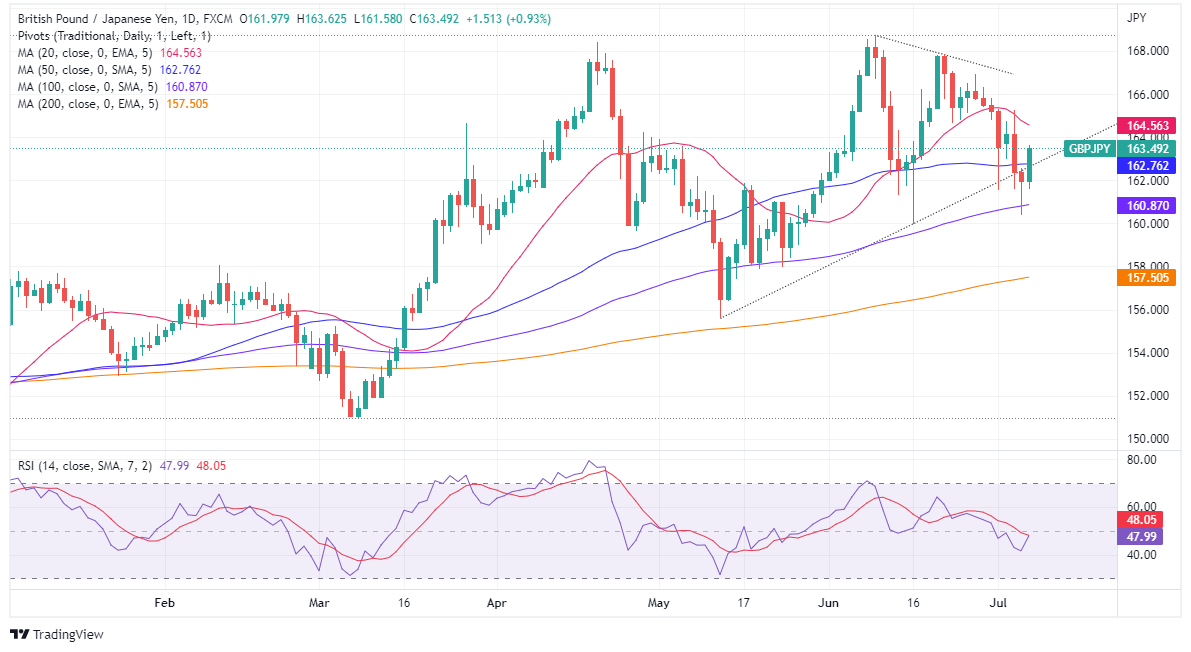
- The GBP/JPY reaches a fresh two-day high at around 163.62.
- Investors’ optimism augmented their appetite for risk-sensitive currencies like the pound.
- GBP/JPY Price Analysis: Unless buyers reclaim 164.60, a re-test towards the 100-day EMA near 160.90 is on the cards.
The GBP/JPY erases Wednesday’s losses and soars on Thursday amidst a risk-on impulse that augmented appetite for riskier assets, meaning safe-haven peers sustaining losses. At 163.49, the GBP/JPY is trading at fresh two-day highs, up almost 1%.
Wall Street is set to finish Thursday’s session in the green, up between 1.14% and 2.22%. Recession fears that the US Federal Reserve would be unable to curb inflation without tipping the US economy into contractionary territory faded. Meanwhile, Fed officials reiterated that a 75 bps rate hike in July is the base case scenario while adding that the US economy is solid.
On Thursday, the GBP/JPY’s price action illustrates the pair opening around 162.00, followed by a dip towards the middle of the 161.00-162.00 area, and then rallying more than 150 pips, reaching a daily high at around 163.62. However, as the New York session ended, the cross-currency pair settled at around 163.52.
GBP/JPY Daily chart
The daily chart shows that the GBP/JPY is upward biased, though oscillators at negative territory might open the door for a reversal move. The RSI at 48 is still below the 50-midline; unless it breaches the latter, a retracement towards the 100-day EMA around 160.87 is on the cards. If buyers want to resume the uptrend, they must reclaim above the 20-day EMA at 164.56.
Otherwise, the GBP/JPY first support would be the 163.00 mark. Break below will expose the 50-day EMA at 162.76, followed by a fall towards the 100-day EMA at 160.87.
GBP/JPY Key Technical Levels
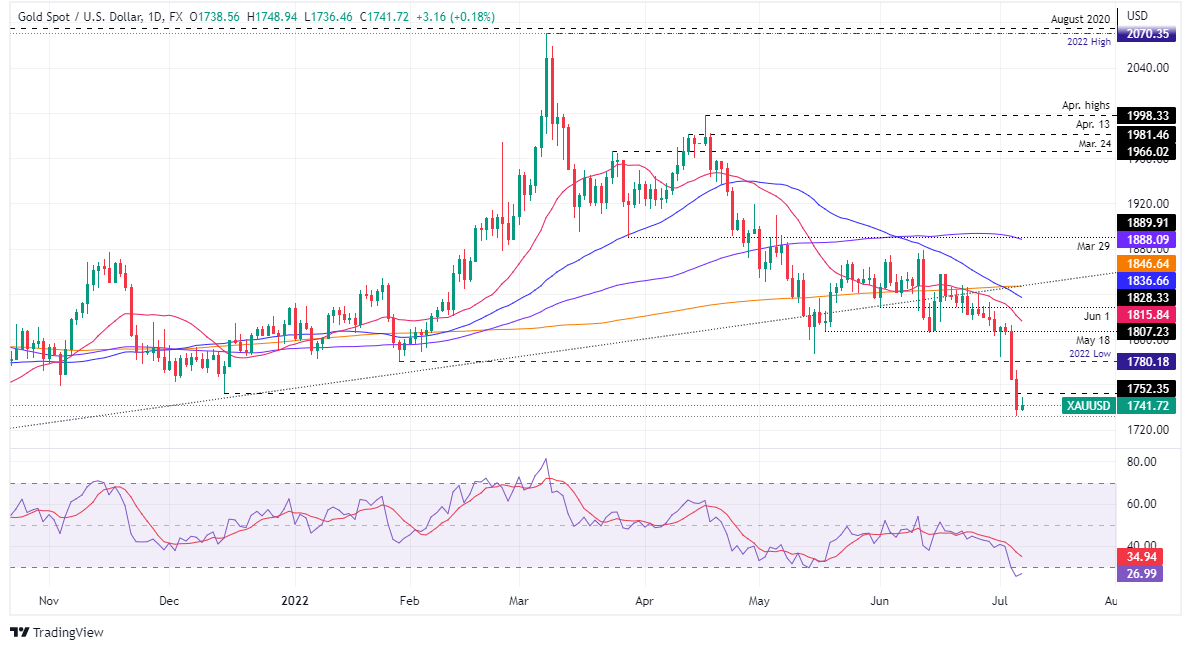
- Gold is correcting from a significant sell-off in the week ahead of NFP.
- The bulls eye a 50% mean reversion but it all comes down to key data on Friday.
The gold price is consolidatred and flat on the day, oscillating around $1,739 after edging up from a nine-month low early on Thursday. The precious metal has climbed from a low of $1,736.58 and has reached a high of $1,749.13 on the day as markets get set for Friday's US Nonfarm Payrolls data.
The data on Friday will be keenly eyed and the gold price will send on it. The yellow metal has been pressured on the back of recession fears and weak stock markets that have seen investors move into the US dollar and bonds instead. With that being said, Wall Street benchmarks have climbed rose on Thursday, as investors reacted positively to the previous day's commentary from Federal Reserve offices that the aggressive pace of interest rate hikes could be tempered if growth suffered.
Meanwhile, the dollar index (DXY), which measures the currency against six counterparts, fell after Wednesday's peak of 107.27, a level not seen since late 2002. Investors are weighing the risks of a recession and whether interest rate hikes will be paused as global demand is under pressure. The Atlanta Fed's GDPNow model estimates seasonally adjusted GDP growth on an annual basis in the second quarter was -2.1%.
Minutes from the central bank's June policy meeting, where the Fed raised interest rates by a surprise 75 basis points, showed on Wednesday a firm restatement of its intent to get prices under control. Nevertheless, there was an acknowledgement that the risk of rate increases having a "larger-than-anticipated" impact on economic growth and judged that an increase of 50 or 75 basis points would likely be appropriate at the policy meeting in July.
For Friday, US Nonfarm Payrolls are expected to rise by 268,000 in June after an increase of 390,000 jobs in May, while the unemployment rate is expected to hold steady just above the pre-pandemic level. ''We expect employment to have continued to recover in February following the unexpectedly strong January report—despite the Omicron-led surge in COVID cases,'' analysts at TD Securities explained.
''That said, we look for some of last month's boost to fizzle, though to a still firm job growth pace. Wage growth likely slowed to a still strong 0.5% m/m, as the lower-wage workers affected by Omicron in January returned to work.''The analysts at TDS explained that a miss on the headline might provide a knee-jerk USD pullback, reflecting hopes of further dialling back of central bank hawkishness.''
Gold technical analysis
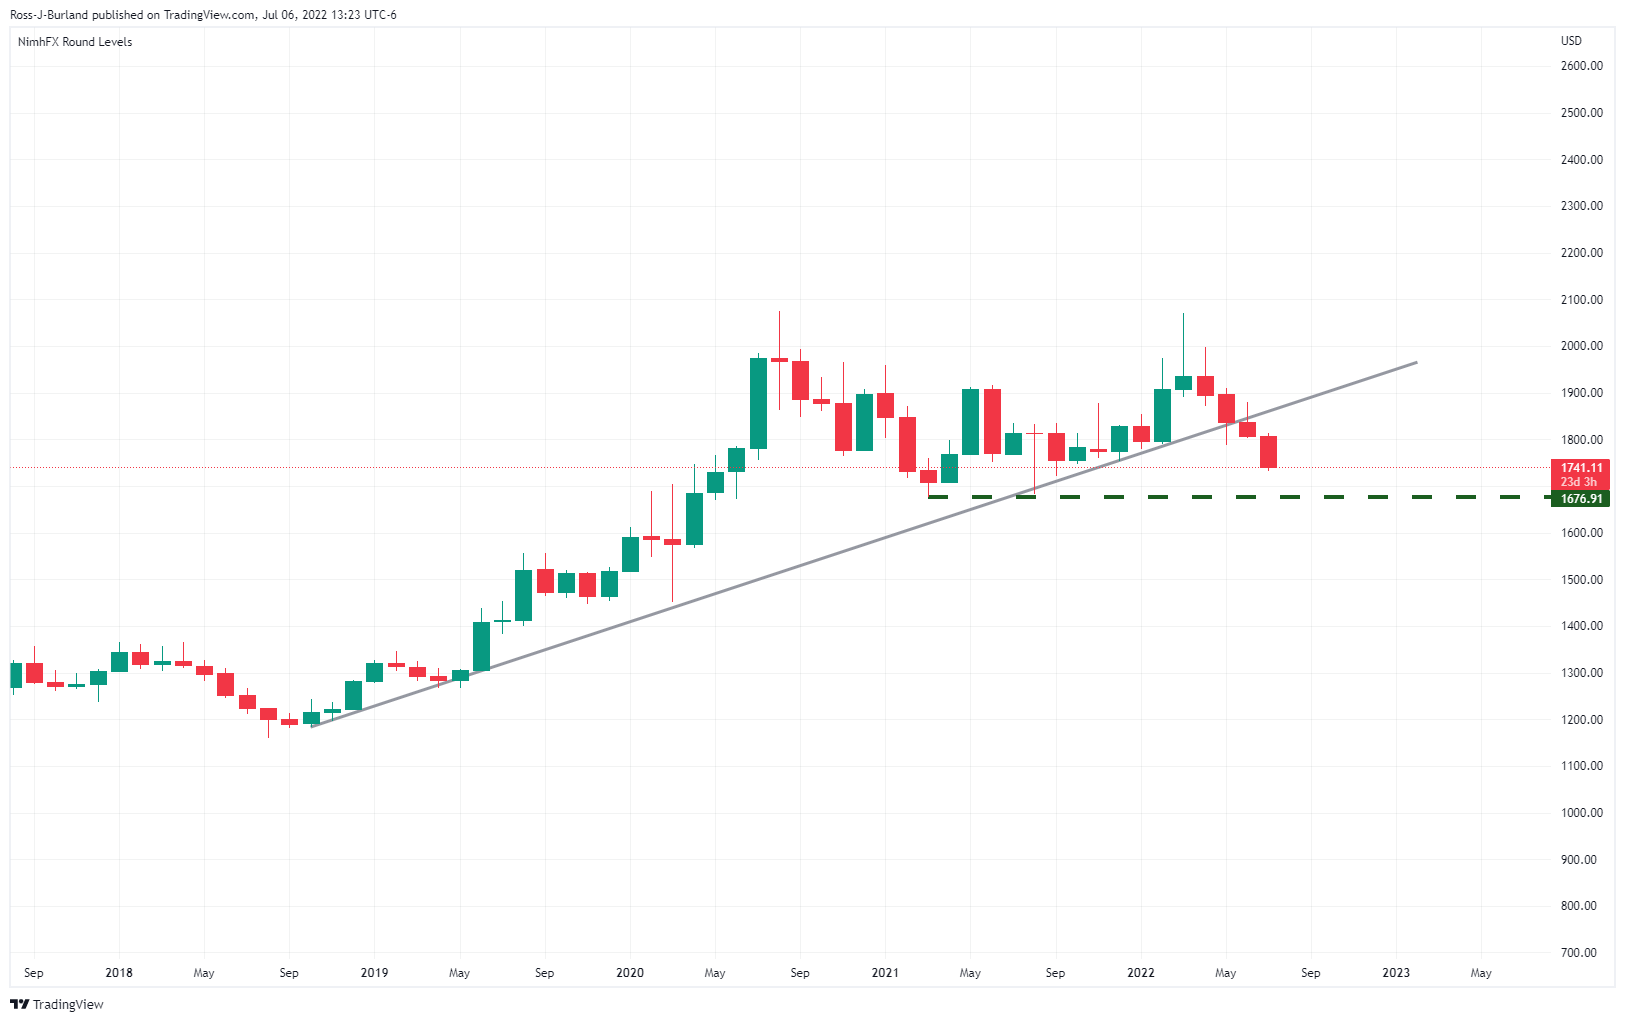
Gold is trading below the rising supporting trendline on the monthly time frame but the critical fractal lows are located at $1,676.
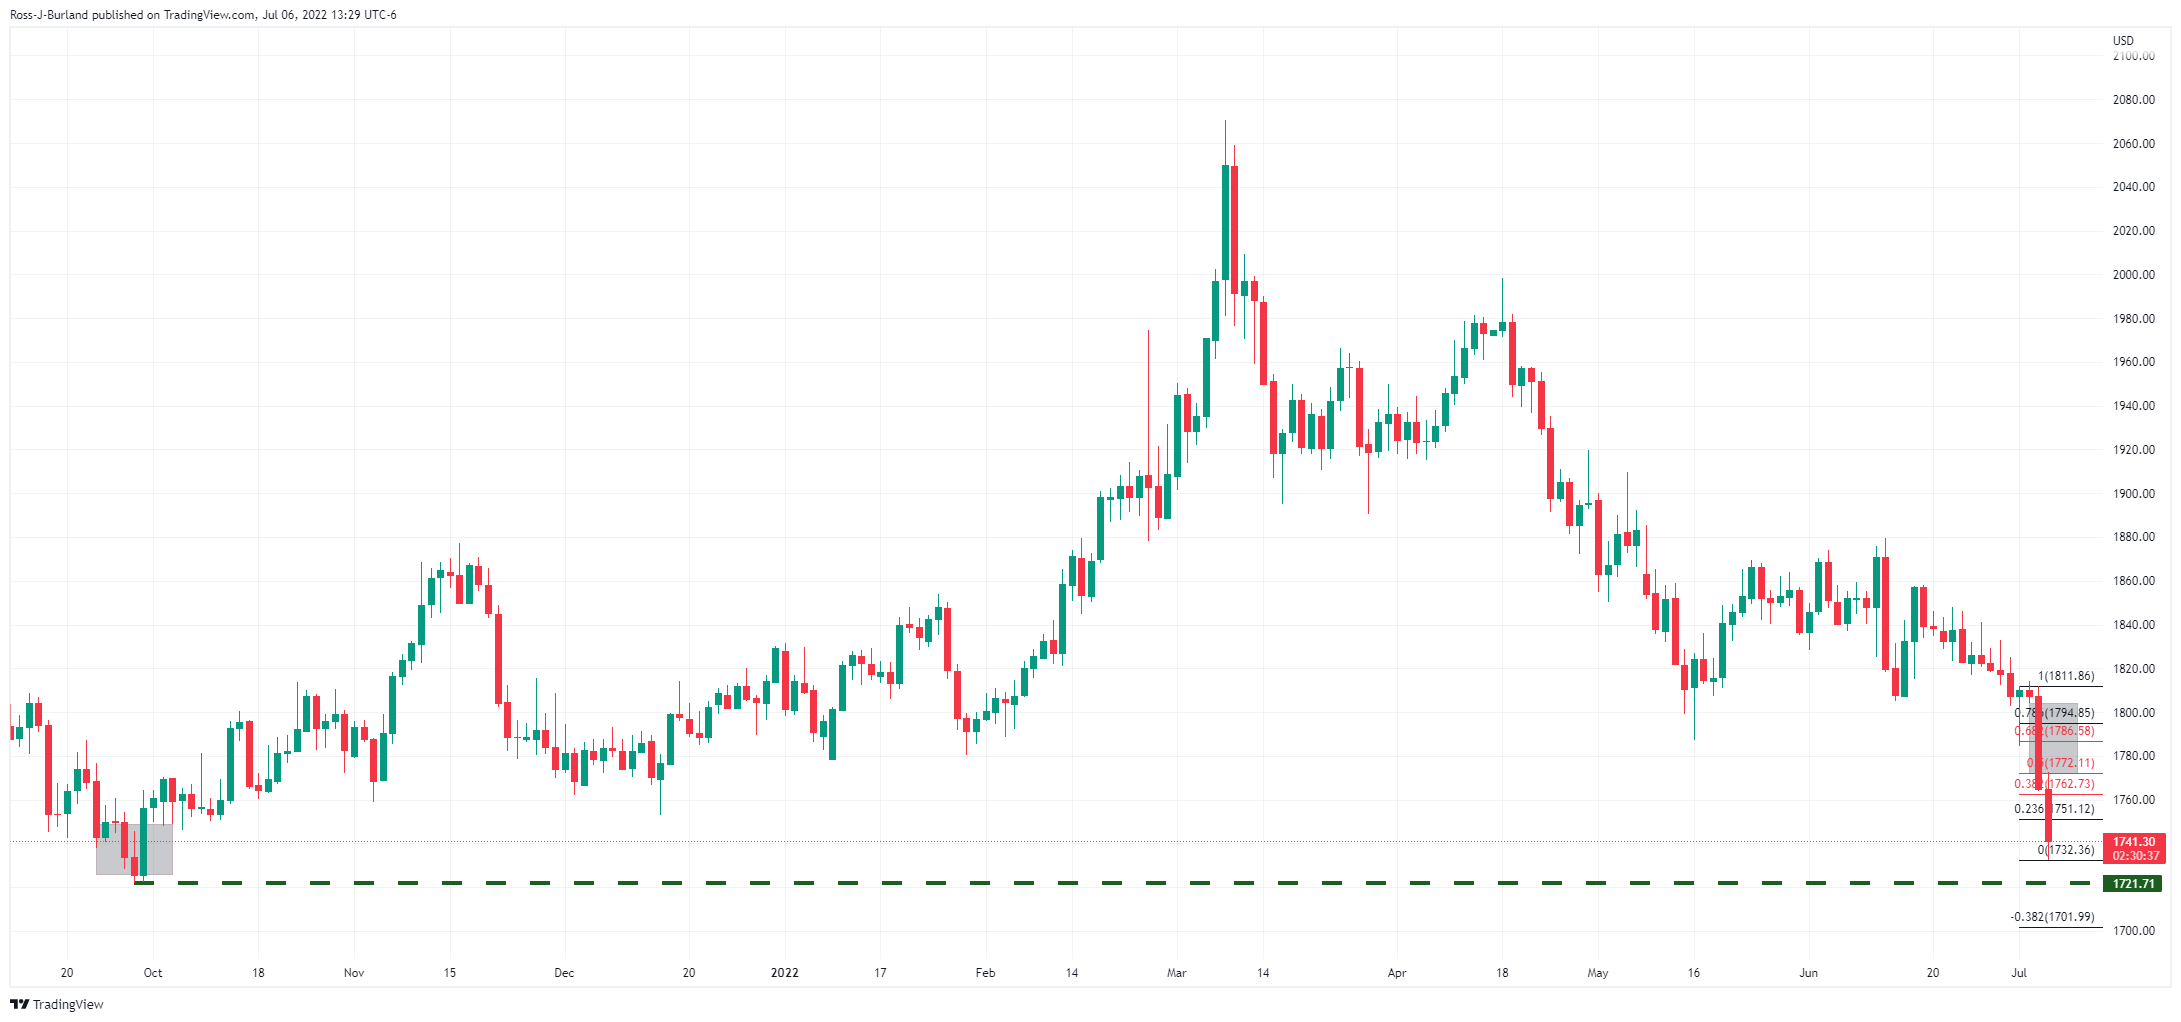
Meanwhile, in the prior day's analysis, it was acknowledged in the above chart that the price has been reaching a key area on the daily chart where bulls were expected to emerge from. A correction to mitigate the imbalance of bids in this sell-off could see the yellow metal correct with a 50% mean reversion on the cards:

What you need to take care of on Friday, July 8:
Financial markets were quieter on Thursday as risk-aversion paused, limiting the dollar’s strength. Global indexes closed in the green, although US Treasury yields soared as the focus remained on recession prospects.
The EUR/USD pair fell to a fresh 20-year low of 1.0143, pressured by the soft German data and the European Central June meeting Accounts. The Governing Council agreed it needed to preserve its credibility “by showing its resolve.” Some members still wanted to keep the door open for a larger rate hike in the July meeting, although President Christine Lagarde affirmed multiple times the hike would be 25 bps.
GBP/USD settled at 1.2020, helped by Prime Minister Boris Johnson's resignation. Following two days of political turmoil, Johnson finally stepped back as Conservative Party leader. He will remain in his charge until September when a replacement will be announced.
Commodity-linked currencies gained against the greenback, helped by the positive tone of equities. AUD/USD trades around 0.6840, while USD/CAD is down to 1.2970.
Crude oil prices were up, although modestly. The barrel of WTI is trading at $102.60 a barrel. US gas prices skyrocketed after the release of the EIA stocks report.
The greenback advanced vs the Swiss Franc, with the pair now at 0.9740. The USD/JPY pair remained within familiar levels, now trading at 136.00.
Overall, concerns about inflation and slowing economic growth remained as the main market motor. There are no changes to the gloom outlook, and risk aversion can soon return.
The focus on Friday will be on the US Nonfarm Payrolls report.
Like this article? Help us with some feedback by answering this survey:
- US crude oil prices, also known as WTI, reclaim the $100 figure on supply issues.
- Russia’s halt of a Kazaks terminal cut supply by 1.2 million BPD.
- WTI Price Analysis: Buyers stepped in around $95.00, eyeing the 100-DMA at around $107.00.
Oil prices rise on Thursday, jumping from weekly lows around $95.13, as the greenback retraces from two-year highs and recession fears abate. At the time of writing, Western Texas Intermediate (WTI) is trading at $102.71, rising almost 5%.
Crude oil prices advance sharply, bolstered by a weaker US dollar
Sentiment remains positive amongst investors. US equities are trading in positive territory while the greenback remains soft, a tailwind for oil prices. Also, Russia’s ordering a halt to a key Kazakh export terminal that usually loads 1.24 million barrels a day in July sparked supply fears amongst traders, spurring a rise in prices.
In the meantime, US energy inventories showed that Gasoline stockpiles fell, as reported by the US EIA on Wednesday. US crude stockpiles increased more than expected as inventories rose 8.23 million barrels last week.
WTI Thursday’s price action depicts that crude prices opened around $98.00 but slid near July’s 6 low around $95.09, but rose sharply, towards a daily high at around $104.45. However, an upslope previous support trendline turned resistance, exerted downward pressure on the black gold, which, although gaining, trades off the highs, above the $100 mark.
WTI Price Analysis: Technical outlook
On Wednesday, WTI prices fell towards the 200-day moving average around $93.50, but the downward move was capped by April’s 22 daily low at $95.34, though the price reached $95.13, bouncing later, and closing above July’s 5 $97.46 daily low.
Nevertheless, oil is upward biased, and a re-test of the $107.00 mark is on the cards. Oil’s first resistance would be $103.00. A breach of the latter will expose July’s 7 high at $104.45, followed by $105.00, and then the 100-DMA at around $107.04.
- USD/JPY bulls have moved in on the 136 area with eyes on slightly higher highs.
- The prospects for the daily char's bearish head & shoulders are eyed.
As per the pre-Topkyo analysis on Thursday, USD/JPY Price Analysis: Bears step on advances above 136.00, the pair dropped in for a brief spell in the 135.50s before claiming all the way back above 136.00. The bulls have reclaimed the area but for how long?
USD/JPY prior analysis, H1 chart
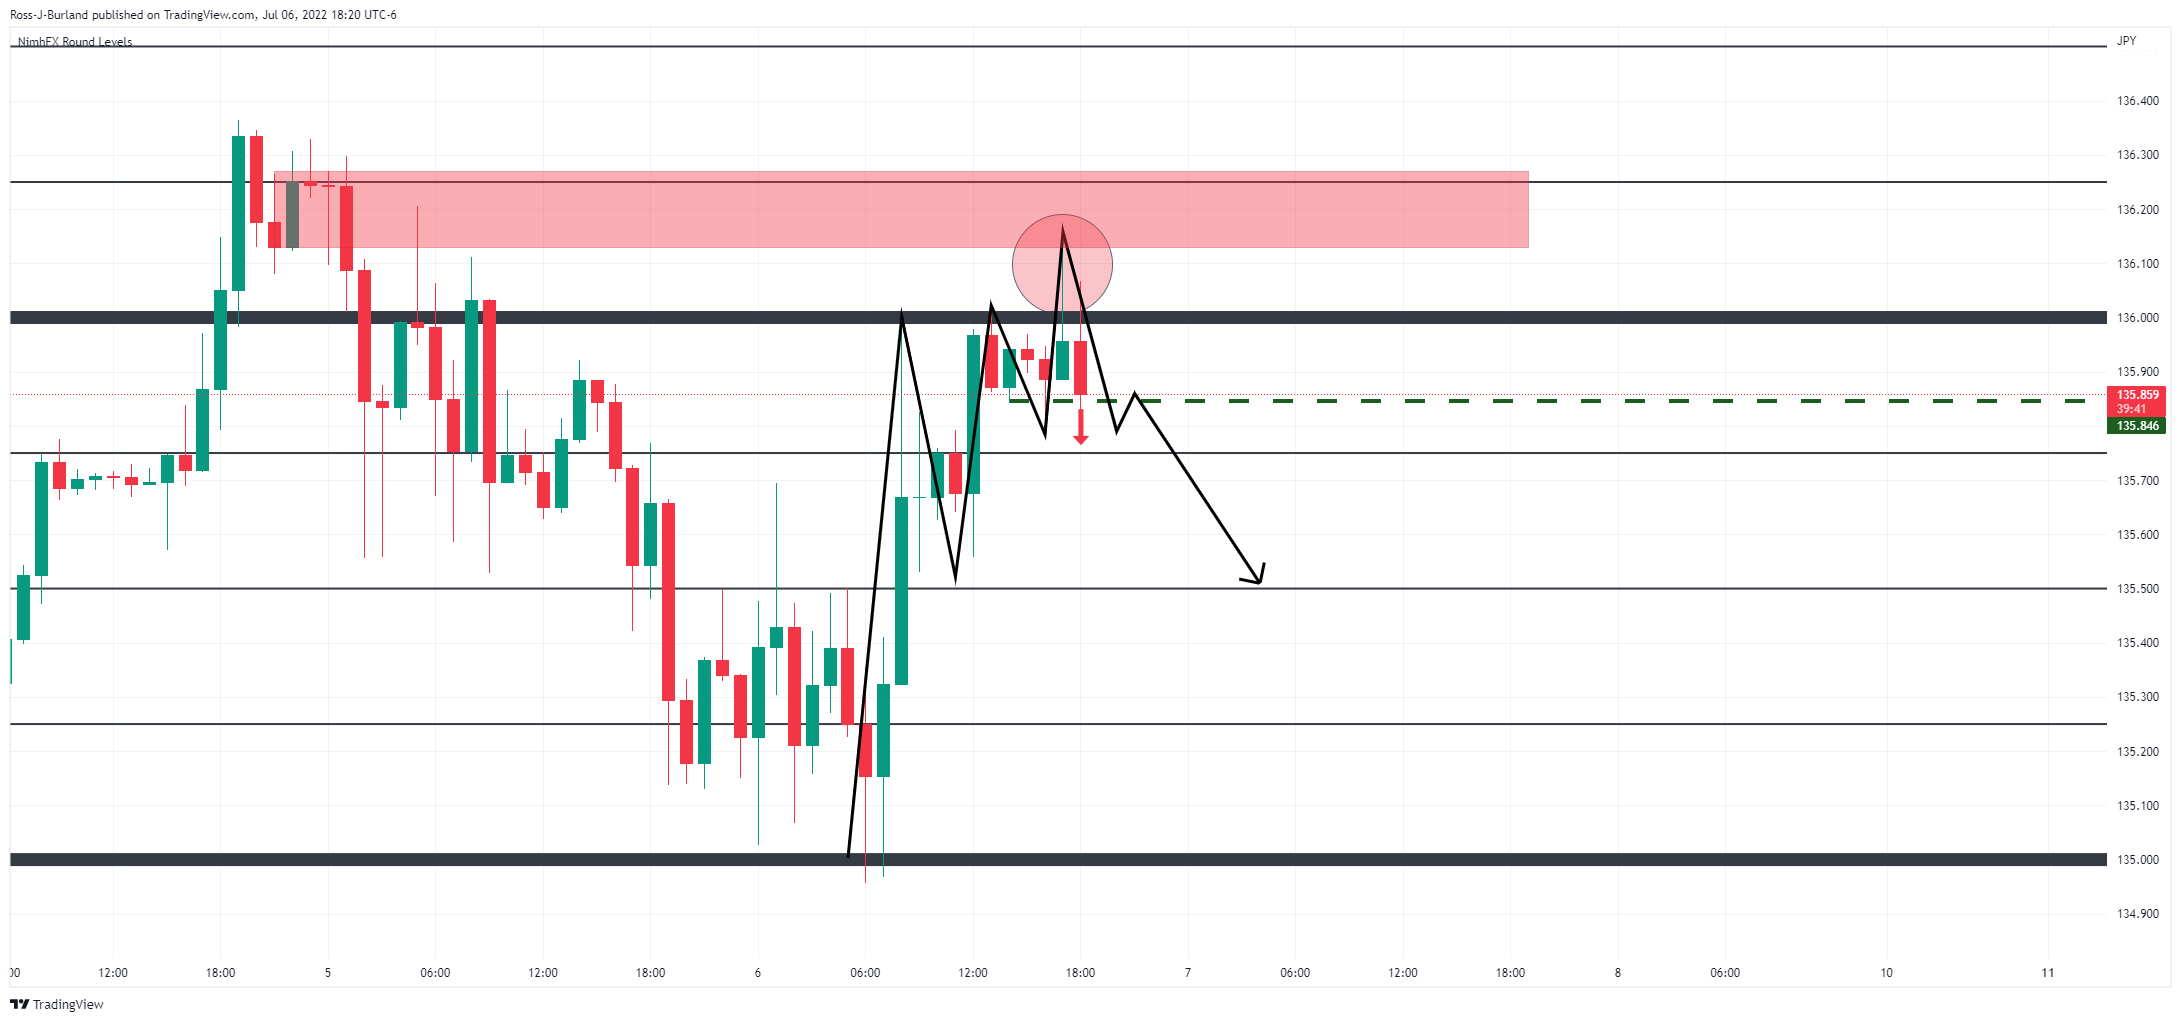
It was noted that the hourly candle has all of the makings for a strong bearish close with a focus on the 135.50s.
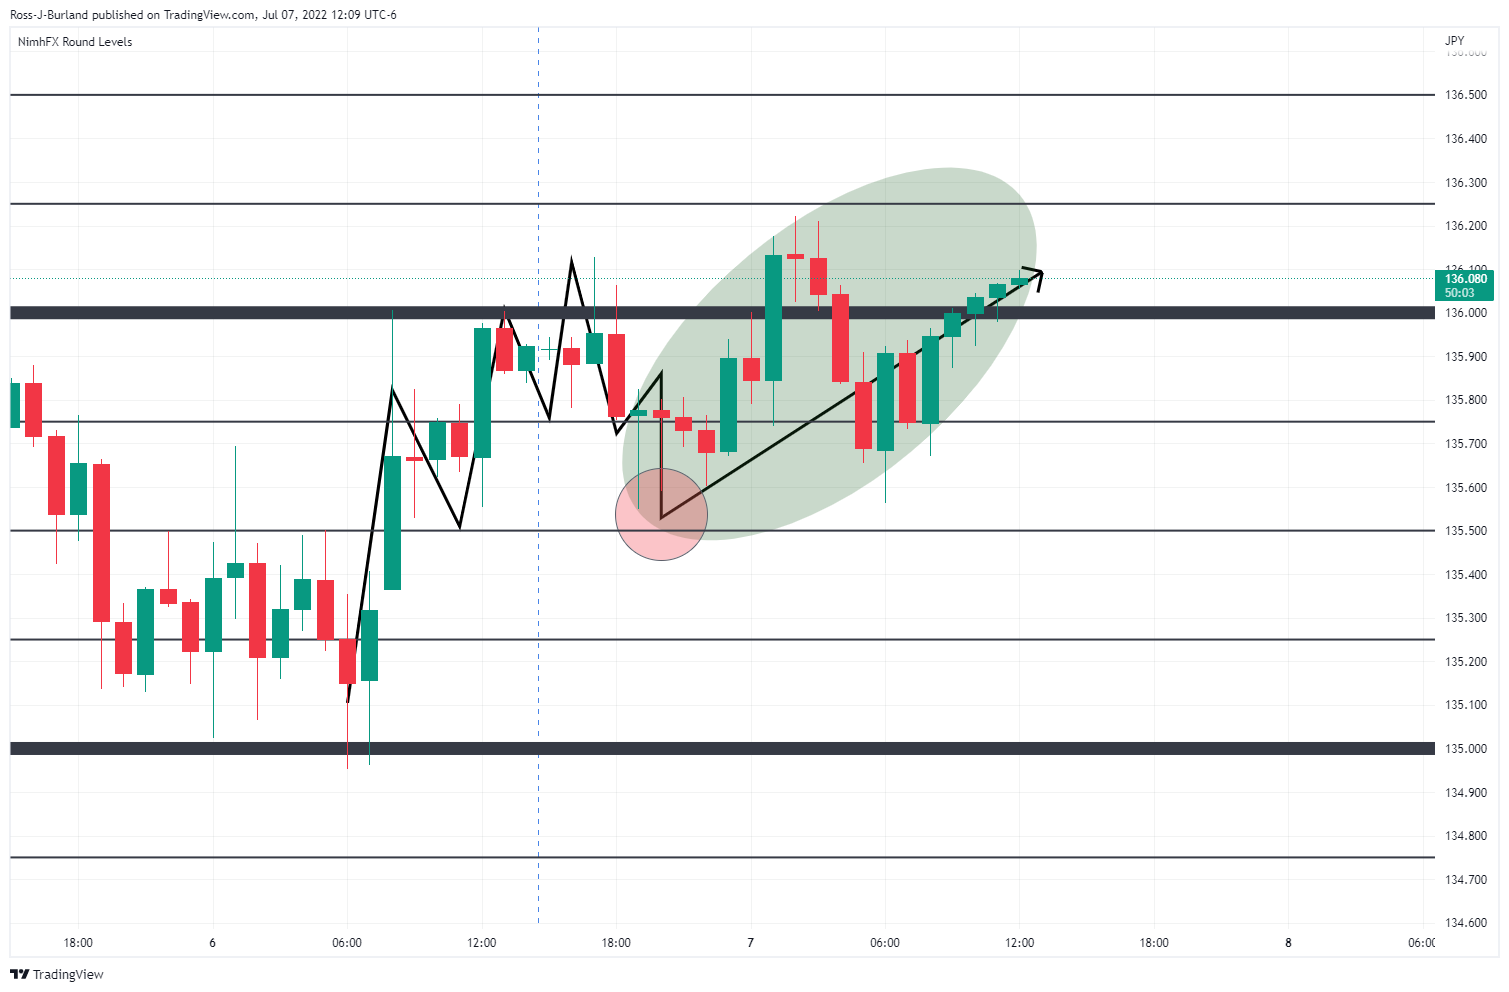
However, following a trip to the downside, the pair has crept higher with a high of 136.22 so far. Thus now begs the question,'' where now?''
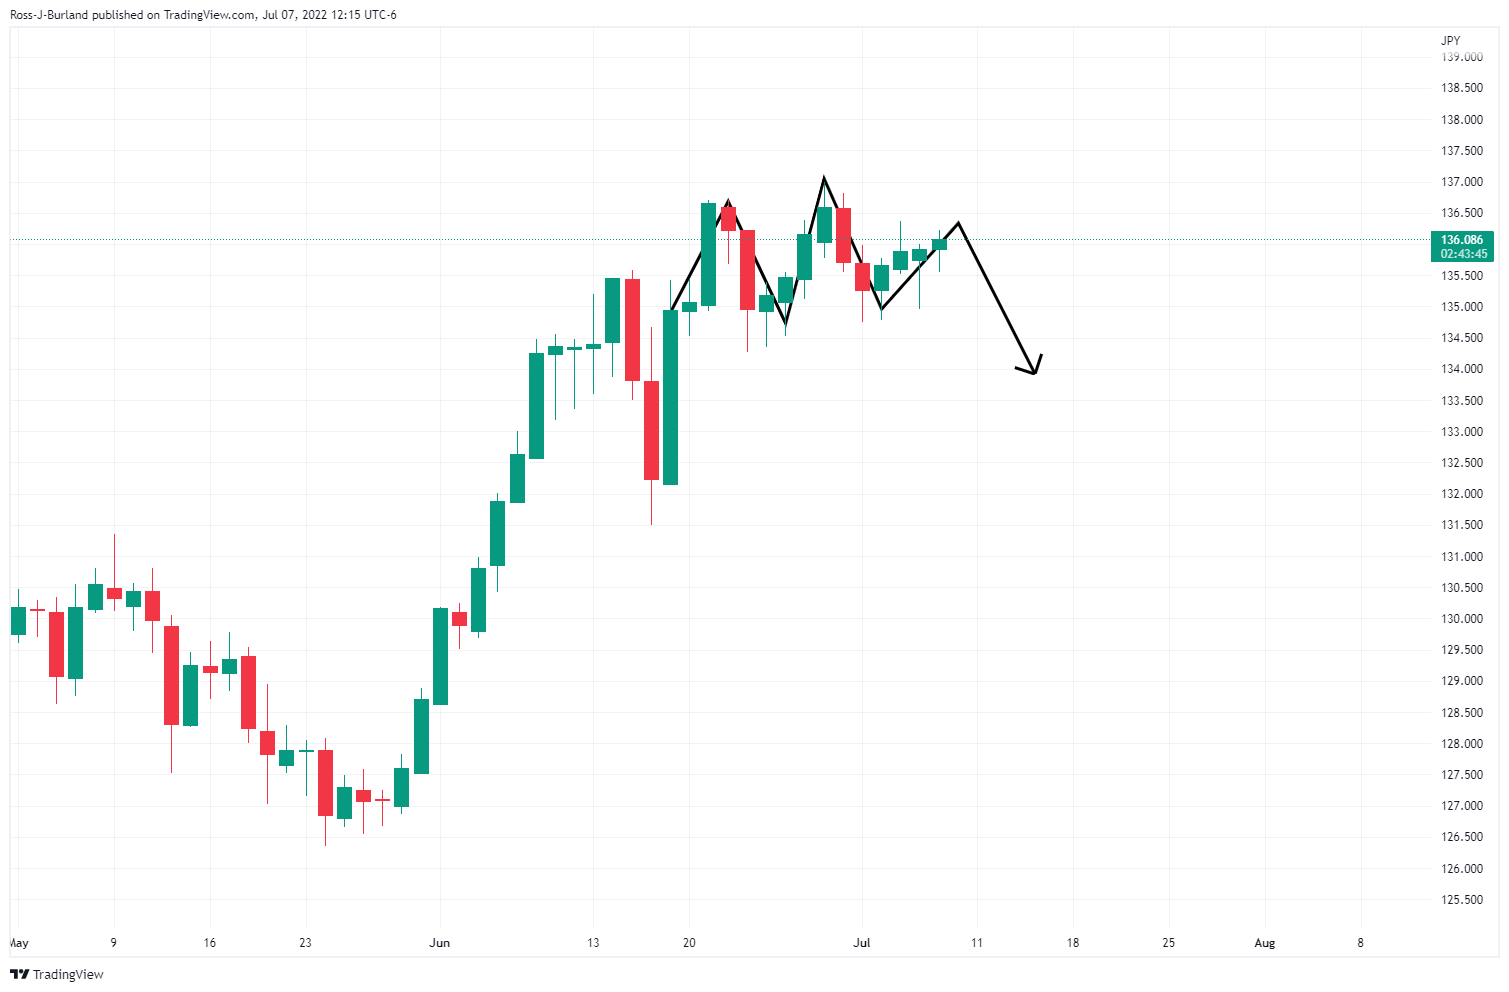
It could be argued that a bearish head and shoulders are being formed on the daily chart:
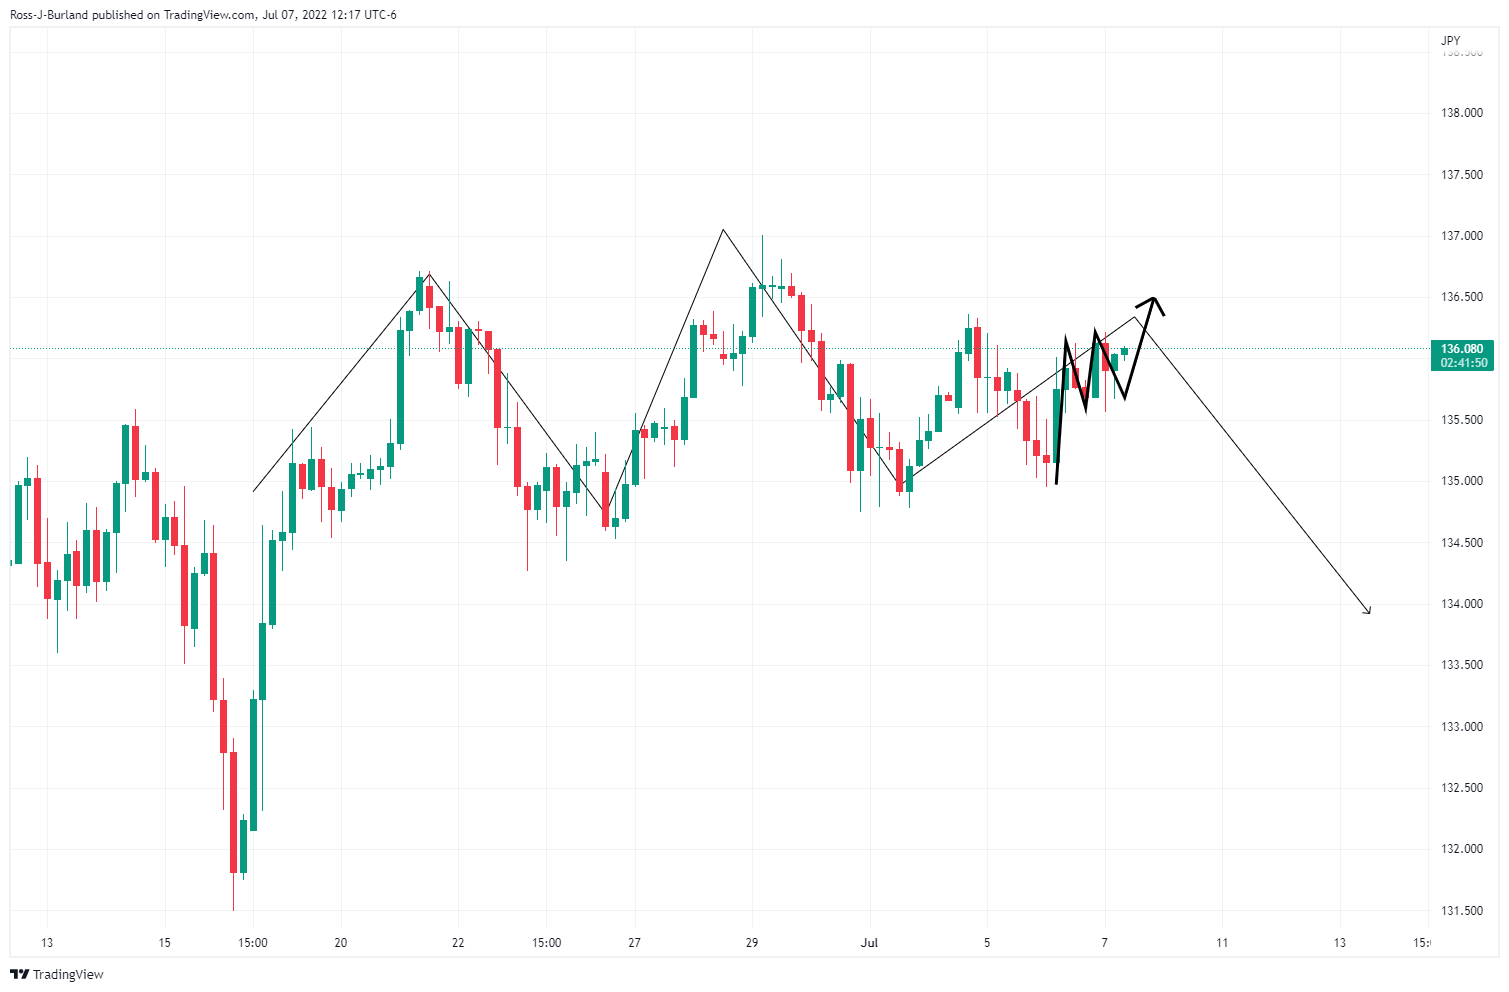
This leaves prospects of higher, but limited moves for the day ahead on the four-hour chart:
CEO of the Federal Reserve Bank of St. Louis. James Bullard is crossing the wires and has said that rather than stagflation, a better bet is growth will slow to trend and that inflation will come under control rapidly.
Key comments
The labor market could cool off a little and still be strong.
We've got a good chance at a soft landing.
- The UK Prime Minister Boris Johnson resigned from his post and will remain until a new PM is elected.
- The greenback is trading soft amidst an increase in risk appetite.
- BoE’s Pill and Mann support a faster pace of rate hikes.
- Fed’s Waller backs 75 bps increases and added that the US economy is strong.
After a rough week in UK politics, the British pound reclaimed the 1.2000 level as UK Prime Minister Boris Johnson announced he would resign in autumn. However, he would remain as Prime Minister and announced that his government would not seek new policies or changes and would be left to the new PM. At the time of writing, the GBP/USD is trading at 1.2000.
GBP/USD advances on a soft US dollar, US Initial Jobless Claims rise
US equities remain positive during the day, reflecting recession fears waning and investors’ positive mood. Meanwhile, US Treasury yields rise, and the greenback retracts from 2-year highs, a tailwind for the GBP/USD. The US Dollar Index, a measure of the greenback’s value vs. its peers, has recovered some, up 013%, back above the 107.000 mark.
The financial markets have been in turmoil over the week. On Wednesday, the Federal Reserve revealed June’s monetary policy minutes, which showed the central bank’s pledging to tackle inflation, even at the expense of slower economic growth. Policymakers reiterated a 50 or 75 bps for the July meeting, and if inflation persists, they will take a “more restrictive” monetary policy stance.
In the meantime, Huw Pill, the Bank of England Chief Economist, said that he would consider a fast pace of interest rate rises to tackle high inflation from becoming entrenched. Also, Catherine Mann, a member of the BoE’s Monetary Policy Committee (MPC), said that she saw a case for faster rate hikes.
At the time of writing, Fed speakers are crossing the wires. St. Louis Fed President James Bullard said the US economic output is expected to continue expanding through 2022. At the same time, Fed’s Governor Christopher Waller backed a 75 bps rate hike in July and would like to step back to a 50 bps increase in September. Waller added that fears of a recession are overblown and that the US economy is strong.
The US economic docket reported Jobless Claims for the week ending on July 2. The figures came higher than expected, though the labor market showed moderation. Furthermore, the Balance of Trade shrank the deficit from -$86.7 billion to -$85.5 billion, spurred by a jump in exports.
What to watch
The US calendar on Friday will feature the New York Fed President John Williams crossing newswires and June’s Nonfarm Payrolls report, expected at 268K, from 390K in the previous reading. A subcomponent to look at is Average Hourly Earnings, expected at 5%, lower than May’s 5.2%.
GBP/USD Key Technical Levels
Federal Reserve's Christopher Waller (voter, hawk), who has been speaking at a virtual NABE event, said inflation is way too high and does not seem to be easing and the Fed has to ply more restrictive policy, Reuters reported.
He supports a 75bp rate hike at the July meeting and said the markets are already expecting hikes so let’s front-load rate hikes.
*Waller said that moves after the July rate hike will put the Fed into a more restrictive policy, so a 50bps hike in September is what he would favor. He added that recession worries are "overblown".
- Positive risk sentiment, Canadian trade data and crude oil prices favor the loonie.
- USD/CAD rejected again from above 1.3050.
- US and Canadian employment reports are due on Friday.
The USD/CAD dropped further during the American session and printed a fresh daily low at 1.2960. An improvement in risk sentiment weighed on the pair ahead of the key economic data.
Markets recovers, dollar retreats
Data released in Canada showed an unexpected sharp widening in the trade surplus that helped the loonie. Also, higher equity prices contribute to weakening the dollar. The Dow Jones is up by 0.85% and the S&P 500 gains 1.19%. Commodity prices are also higher. Crude oil prices are up by more than 5%, adding to CAD strength.
Traders will continue to look at market sentiment as a key driver in USD/CAD’s price action. On Friday, economic data will also play a critical role. Employment numbers are due in both, Canada and the US.
Another failure above 1.3000
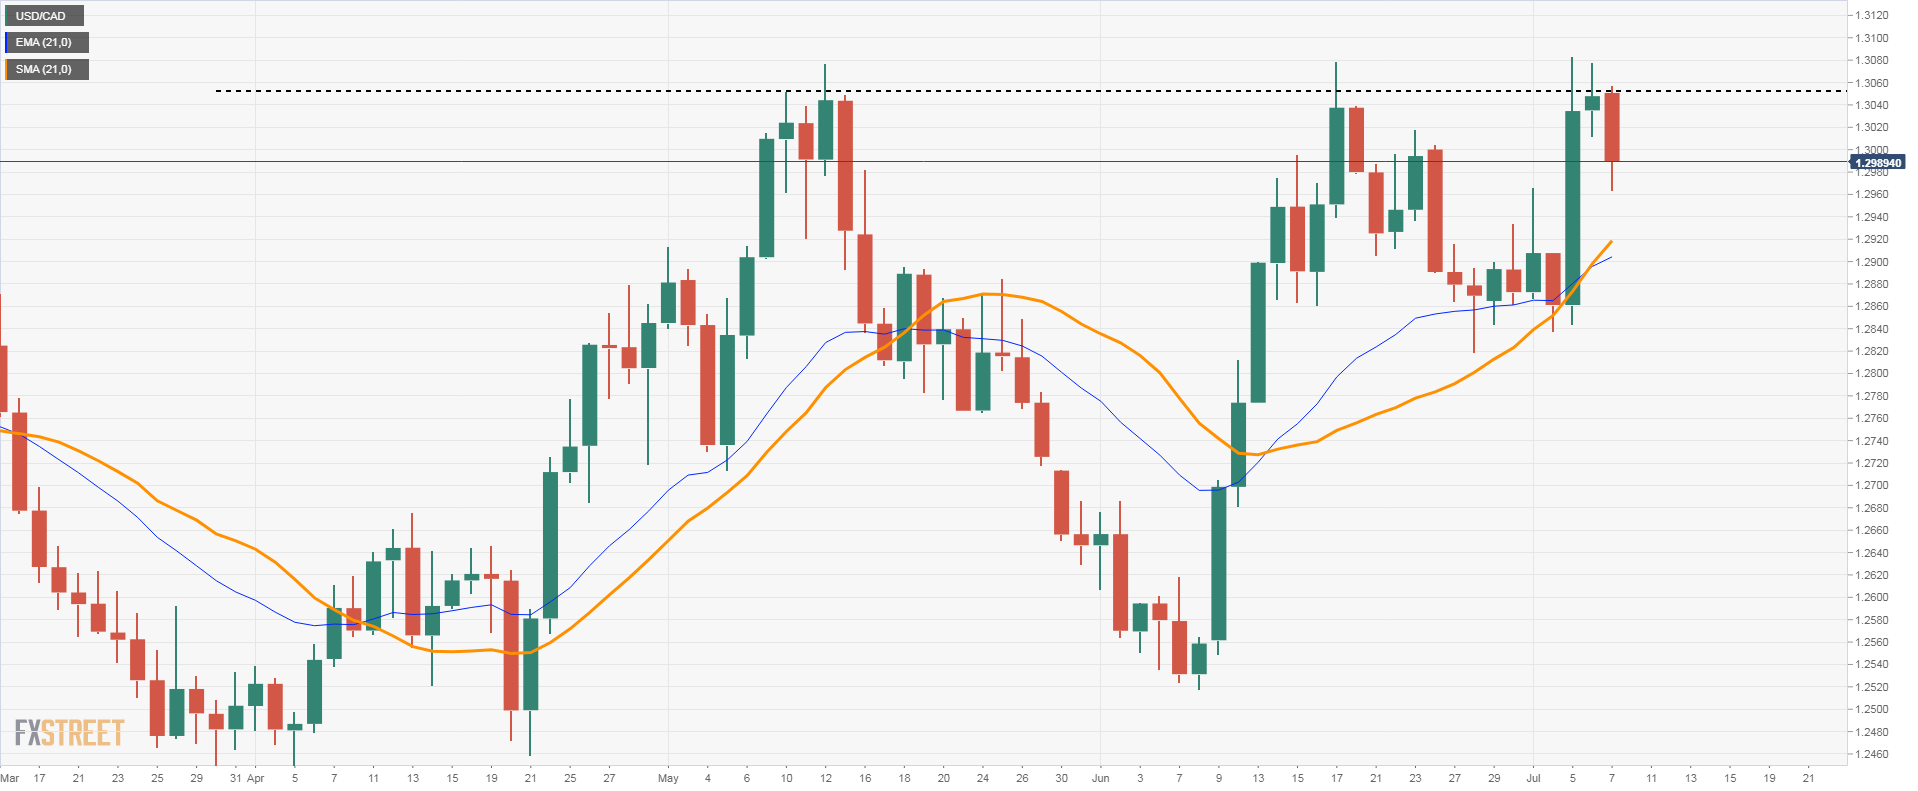
The USD/CAD once again was rejected from above 1.3050 like what happened in May and June. The ongoing correction below 1.2960 could extend to the 20-day Simple Moving Average at 1.2930.
On the upside, the dollar faces immediate resistance at 1.3015, followed by 1.3045. A daily close well above 1.3050 should open the doors to more gains.
- Australia’s Trade Balance surplus, China’s stimulus, and a soft US dollar propelled the AUD/USD higher.
- US Initial Jobless Claims rose more than expected, showing moderation in the labor market.
- Fed’s Waller and St. Louis Fed President Bullard to cross wires later.
The Australian dollar erases Wednesday’s losses and is rising towards the June 14 swing low at around 0.6850, but has faced some resistance and retraced some 25 pips towards the 0.6820s region. At 0.6839, the AUD/USD portrays an upbeat market mood, which augments the appetite for riskier assets.
AUD/USD is rising on positive sentiment, higher Iron ore prices and a soft US dollar
Worldwide equities are trading in the green, bolstered by waning recession fears and China’s allowing local governments to issue $220 USD billion of debt in an infrastructure program to boost 2022 GDP. Meanwhile, a senior US official at the Secretary of State said that Secretary Blinken would not announce lifting tariffs to China’s products at his meeting with a Chines Foreign Minister.
The AUD/USD got bolstered by positive data in the Asian session. Australia’s Trade Balance printed a 9.5% MoM surplus in May, exceeding expectations, fueled by a jump in coal, coke, and briquette exports. Also, Iron Ore prices uptick to $115.14 a ton, a tailwind for the Aussie.
That said, the AUD/USD rose above the 0.6800 mark and extended its gains to print the daily high around the R2 daily pivot at 0.6848.
Meanwhile, the US calendar reported Jobless Claims for the week ending on July 2. The figures came higher than expected, though the labor market showed moderation. Furthermore, the Balance of Trade shrank the deficit from -$86.7 billion to -$85.5 billion, spurred by a jump in exports.
What to watch
The US calendar will feature Fed speakers in the week ahead, with Christopher Waller and St. Louis Fed President James Bullard, on Thursday. By Friday, the New York Fed President John Williams would cross wires, and the US Nonfarm Payrolls report for June will shed some light regarding the labor market conditions. Traders should also note the Average Hourly Earnings to check for hints of a wage-price spiral that could keep US inflation higher.
AUD/USD Key Technical Levels
Bank of England Chief Economist Huw Pill said on Thursday that he would be willing to adopt a faster pace of policy tightening if needed, as reported by Reuters.
"My focus of attention will be on indications of more persistent inflationary pressures," Pill added.
Earlier in the day, BOE policymaker Catherine Mann argued that the uncertainty about the inflation process was strengthening the case for front-loading interest rate rises.
Market reaction
The British pound edged slightly higher against its major rivals on these hawkish comments. As of writing, the GBP/USD pair was trading at 1.2007, where it was up 0.65% on a daily basis.
The US trade gap narrowed to the smallest deficit in six months as export growth outpaced imports for the second consecutive month, point out analysts at Wells Fargo. They see that the tide is turning on domestic demand, which should continue to quell import growth from the breakneck pace that took place throughout the pandemic.
Key Quotes:
“As domestic demand for goods continues to roll over, however, overall import growth should continue to cool. Total goods imports remain a whopping 42% above pre-pandemic February 2020 levels as of May (chart). The need to restock inventory and obtain seasonal product ahead of the holiday season will keep imports rolling in, but we expect import growth to cool from the breakneck pace seen throughout the pandemic which helped meet rapid demand for consumer goods.”
“Crude oil represented the largest dollar gain of both exports (+$1.1 billion) and imports (+$950 million) in May, but as with most economic data today, we must consider these gains in the context of higher prices.”
“More broadly, the real U.S. goods trade deficit widened to $116.6 billion in May. After adjusting for higher prices, both real goods exports and imports declined, but exports did so at a faster rate, slipping 1.3% compared to the 0.7% drop in real goods imports. Still, the trade data for April and May positions net exports to provide a sizable positive contribution to headline growth in the second quarter, likely somewhere around a 1.0 percentage point contribution to top-line.”
“With domestic demand having outpaced demand in many of America's major trading partners throughout the pandemic, Q2 will mark the first time in seven quarters trade has positively contributed to headline growth.”
According to the Federal Reserve Bank of Atlanta's GDPNow model, the US economy is expected to contract by 1.9% in the second quarter, up slightly from the July 1 forecast of -2.1%.
"After this week's releases from the Institute for Supply Management, the US Census Bureau, and the US Bureau of Economic Analysis, the nowcasts of second-quarter real personal consumption expenditures growth and real gross private domestic investment growth increased from 0.8% and -15.1%, respectively, to 1.3% and -14.9%, respectively, while the nowcast of the contribution of the change in real net exports to second-quarter GDP growth decreased from 0.38 percentage points to 0.21 percentage points," Atlanta Fed explained in its publication.
Market reaction
The greenback preserves its strength after this report and the US Dollar Index was last seen rising 0.05% on the day at 107.10.
Data released on Thursday showed an increase in the trade surpluses from CAD 2.17 billion to 5.32 billion in May. Analysts at CIBC warn the increase could be temporary considering it was driven in part by a strengthening in oil prices which has reversed more recently.
Key Quotes:
“The goods trade surplus widened sharply in May, although the move was driven in part by a strengthening in oil prices which has reversed more recently. The $5.3bn surplus was up from a revised $2.2bn in April (prior $1.5bn), was the widest since August 2008 and was well above the consensus forecast. On the services side, the deficit narrowed slightly from $1.3bn in April to $1.1bn in May. That left the overall trade surplus at $4.2bn, from $900mn in the prior month.”
“Today's sharp widening in the Canadian trade surplus could be as good as it gets for now, given that energy prices have fallen relative to where they stood in May and that imports will likely rebound ahead alongside the reopening in China. However, some of the strength in non-energy exports, such as potash, copper and other metals/minerals could persist if Canadian companies are able to raise production and offset some of the holes left in the global supply chain by the sanctions imposed on Russia following its invasion of Ukraine.”
- The yellow metal got bolstered by an upbeat sentiment and a soft US dollar.
- Gold’s recovery might be short-lived as US Treasury yields rise, a headwind for XAUUSD’s prices.
- Gold Price Forecast (XAUUSD): Could uptick towards $1760 before continuing to the downside.
Gold (XAUUSD) spot bounces off the multi-month lows at around $1730s and grinds higher during the North American session as recession fears fade, and investors cheered China’s stimulus. At the time of writing, XAUUSD is trading at $1741.48 a troy ounce, slightly up 0.17%.
Positive sentiment and a soft greenback boosts gold's demand
Global equities are rallying, while the Fed’s last monetary policy minutes further cemented the case for a 75 bps rate hike in July, and the greenback recedes from 2-year highs, as shown by the US Dollar Index, back below the 107.000 figure. The yellow metal price jumped as relief, though any upward moves might be capped by rising US Treasury yields, with the US 10-year yield rising four bps, at 2.970%.
On Monday, rumors that the US might lift tariffs on China’s products remain as that. A Senior US Department of State said that no announcement is expected from Secretary Blinken at his meeting with China’s Foreign Minister Wang Yi. Earlier during the Asian session, according to Bloomberg, China was considering allowing local governments to sell $220 billion of special bonds in an infrastructure program, shifting sentiment positively, which weighed on the US dollar.
In the meantime, the US economic docket unveiled the Initial Jobless Claims for the week ending on July 2, which rose by 235K, higher than the 230K, and 4K more than the 231K in the previous week. The report shows some moderation in the tight labor market, as claims spiked the most since January. At the same time, the Balance of Trade showed the deficit contracted to -$85.5 billion, vs. -$86.7B in the previous month, courtesy of an uptick in Exports.
In the week ahead, the US calendar will feature Fed speakers, with Christopher Waller and St. Louis Fed President James Bullard. On Friday, the US Nonfarm Payrolls report, and the New York Fed President John Williams.
Gold Price Forecast (XAUUSD): Technical outlook
From the daily chart perspective, the XAUUSD bias is downwards. However, oscillators meandering around the oversold territory, with RSI at 27.27, might open the door for traders to book profits ahead into the weekend. If that scenario plays out, the XAUUSD’s first resistance would be December 15, 2021, low at $1752.35, followed by the July 5 daily low at $1763.82, before resuming to the downside.
- ECB minutes show some members want to keep the door open to a larger increase in July.
- Markets hold onto gains, S&P 500 up by 1.09%.
- EUR/USD heads for lowest daily close since December 11, 2002.
The EUR/USD failed to hold onto daily gain and fell to test the 1.0160 area. A weaker euro pushed the pair to the downside despite a recovery in equity prices.
The immediate support is the 1.0160 area and a break lower would expose 1.0120. On an intraday basis, a recovery above 1.0190 should help the euro return to 1.0200. The next resistance levels are located at 1.0220 followed by 1.0235.
EUR/USD unable to recover
Despite the improvement in market sentiment, that continues to be among the weakest currencies and facing forecasts of a slide to parity in EUR/USD. Doubts about the anti-fragmentation instrument weigh on the euro. The US Dollar Index is falling marginally hovering around 107.00.
US yields are higher supporting the greenback. The US 10-year yield stands at 2.99%, and the 30-year at 3.17%. The Dow Jones rises by 0.95% and the S&P 500 gains 1.22%.
The European Central Bank released the minutes from its latest meeting. According to economists at Commerzbank, the document revealed strong discontent among members regarding the inflation outlook. “Given the reasoning of Council members at the June meeting, a 50 basis point increase in policy rates cannot be ruled out at the upcoming July meeting. We are sticking to 25 basis points in our baseline scenario mainly because a majority of recent statements by Council members still signals this.”
In the US, economic data showed an increase in Initial Jobless Claims and a narrower trade deficit in May. The numbers were ignored by market participants. On Friday, the official employment report is due. Market consensus is for an increase of 270K in jobs and the unemployment rate to remain at 3.6%. “Recession has dominated market psychology. A stronger payrolls report will challenge the risk of that near-term. We look for this to add to USD resilience particularly with EURUSD inevitably en route to parity,” said analysts at TD Securities.
Technical levels
European Central Bank (ECB) Governing Council member Yannis Stournaras noted on Thursday that they are not observing excessive wage demand in Europe, as reported by Reuters.
In the meantime, ECB policymaker and Governor of the Central Bank of Cyprus Constantinos Herodotou said that they are not targeting exchange rates while adding that they do take their impact on inflation into account.
Market reaction
The shared currency stays on the back foot following these comments and the EUR/USD pair was last seen posting small daily losses at 1.0172.
The US Bureau of Labor Statistics (BLS) will release the May jobs report on Friday, July 8 at 12:30 GMT and as we get closer to the release time, here are the forecasts by the economists and researchers of 10 major banks regarding the upcoming employment data.
Expectations are for a 270K rise in Nonfarm Payrolls following the 390K increase in May. Meanwhile, the Unemployment Rate is set to remain unchanged at 3.6%.
NBF
“Payrolls may have increased 225K. The household survey is expected to show a similar gain, a development which could leave the unemployment rate unchanged at 3.6%, assuming a one-tick increase in the participation rate to 62.4%.”
RBC Economics
“We expect an increase of 300K jobs in the US in June fuelled by the recovery in close-contact service industries. As in Canada, tight labour markets will continue to limit employment growth. The unemployment rate is expected to hold steady at 3.6%.”
Commerzbank
“We expect an increase of a still solid 250K. That said, it is probably only a matter of time before bad numbers come from the labor market as well.”
CIBC
“A slowdown in the interest-sensitive construction and real estate sectors could have combined with worries about domestic demand, as inflation erodes purchasing power, to slow hiring to 200K in the US in June. With a rise in the participation rate possible, the unemployment rate could have remained at 3.6%, which could also reflect slower job growth in the household survey, as it’s closer to its pre-pandemic level than its payrolls counterpart. Wage growth likely continued at a 0.3% monthly pace, well below growth in prices. We’re below the consensus which could be negative for the USD and see bond yields fall.”
TDS
“Employment likely continued to advance firmly in June but at a more moderate pace after three consecutive job gains of around 400K in March-May. We also look for the UE rate to stay unchanged at 3.6% for a fourth straight month, and for wage growth to remain steady at 0.3% MoM (5.0% YoY).”
ING
“We think payrolls may grow somewhere in the 250-300K range, which should still be enough to keep the unemployment rate at 3.6% and wages continuing to tick higher. For us to seriously consider changing our July Fed call we would need to see payrolls growth fall with the unemployment rate moving a couple of tenths higher and wage growth showing signs of stagnating. Even then we would still probably need to see a surprisingly large decline in inflation the following week.”
SocGen
“Employment gains are slowing, and we view this as inevitable as more of the unemployed have found jobs and the unemployment rate has dropped well below 4%. Strong employment, however, is how we interpret an increase of nearly 300K jobs in a month. Trucking, delivery, food services and healthcare remain areas of recovery and growth for job markets. We expect the unemployment rate to edge back down to 3.5% for June, possibly very soon. A rising labor force participation rate (more people entering the labor force) is one pro-growth factor that can steady the unemployment rate, preventing a decline, even when the economy is strong. Later, as businesses reduce their demand for labor, smaller job gains are why the unemployment rate stabilizes or begins to rise.”
Deutsche Bank
“We expect payrolls to slow to 225K but with unemployment falling a tenth to 3.5%.”
Citibank
“Citi: 290K, prior: 390K; Private Payrolls – Citi: 240K, prior: 333k; Average Hourly Earnings MoM – Citi: 0.4%, prior: 0.3%; Average Hourly Earnings YoY – Citi: 5.1%, prior: 5.2%; Unemployment Rate – Citi: 3.5%, prior: 3.6%. We expect a continued slowing in the average monthly pace of job gains, with 290K jobs added in June. This would still be a strong monthly increase, but in line with expectations that job growth should slow over the course of this year. Much of this expectation has been based on the idea that lack of supply of workers will limit the pace of hiring but the impact of weaker growth expectations could also start to weigh on demand for workers.”
Wells Fargo
“We forecast NFP to rise 240K in June and look for the unemployment rate to hold steady at 3.6%. Labor demand is showing signs of topping out, albeit at an elevated level, as evidenced by the job openings rate hovering around 7.0% since the beginning of the year. With a larger pool of available candidates, small business compensation plans have softened. We forecast average hourly earnings to rise 0.3% month-over-month in June.”
- USD/TRY extends further the breakout of the 17.00 level.
- The lira remains weak in line with the rest of the risk complex.
- Current Account and End Year CPI Forecast next on Friday.
Another day, another drop in the Turkish lira, and this time lifting USD/TRY further north of the recently broken 17.00 yardstick.
USD/TRY up on stronger dollar
USD/TRY advances for the sixth session in a row so far, gaining already 8% since the lows near the 16.00 neighbourhood on June 27 in response to the Turkish banking watchdog (BDDK) announcement of a ban on lira loans to certain companies with strong FX positions.
In the meantime, the strong upside momentum in the greenback continues to heavily weigh on the risk complex and the EM FX universe, putting TRY under extra selling pressure.
No releases on Thursday in Türkiye should leave all the attention to Friday’s publication of May’s Current Account and End Year CPI Forecast for the month of July.
It is worth recalling that markets in Türkiye will close earlier on Friday in observance of the Eid-al-Adha holiday.
What to look for around TRY
USD/TRY keeps heading north – and the lira continues to give away gains - after bottoming out in the 16.00 zone in late June, as investors appear to have already digested the latest announcement by the BDDK.
So far, the lira’s price action is expected to keep gyrating around the performance of energy prices, the broad risk appetite trends, the Fed’s rate path and the developments from the war in Ukraine.
In addition, the effects of this new measure aimed at supporting the de-dolarization of the economy will also have its say, at least in the very short term.
Extra risks facing the Turkish currency also come from the domestic backyard, as inflation gives no signs of abating, real interest rates remain entrenched in negative figures and the political pressure to keep the CBRT biased towards low interest rates remain omnipresent.
Key events in Türkiye this week: Inflation Rate, Producer Prices (Monday) – Current Account, End Year CPI Forecast (Friday).
Eminent issues on the back boiler: FX intervention by the CBRT. Progress (or lack of it) of the government’s new scheme oriented to support the lira via protected time deposits. Constant government pressure on the CBRT vs. bank’s credibility/independence. Bouts of geopolitical concerns. Structural reforms. Presidential/Parliamentary elections in June 23.
USD/TRY key levels
So far, the pair is gaining 0.32% at 17.2441 and faces the immediate target at 17.3759 (2022 high June 23) seconded by 18.2582 (all-time high December 20) and then 19.00 (round level). On the other hand, a breach of 16.0365 (monthly low June 27) would pave the way for a test of 15.6684 (low May 23) and finally 15.4281 (100-day SMA).
- Silver edged higher on Thursday and moved further away from a two-year low touched overnight.
- Last week’s breakdown through descending trend-channel support still favours bearish traders.
- Oversold RSI on the daily chart warrants some caution before positioning for any further decline.
Silver gained some positive traction on Thursday and built on the previous day's modest rebound from sub-$19.00 levels or a two-year low. The XAG/USD held on to its gains through the early North American session and was last seen trading near the daily high, just below the mid-$19.00s.
Given last week's convincing breakthrough a nearly one-month-old descending channel, the bias remains tilted in favour of bearish traders. That said, RSI (14) on the daily chart is still flashing oversold conditions and warrants some caution before positioning for any further losses.
This makes it prudent to wait for some near-term consolidation or a further recovery before the XAG/USD resumes its downward trajectory. Hence, any subsequent move up is more likely to remain capped near the descending channel support breakpoint, around the $20.00 psychological mark.
The said handle is followed by the weekly high, around the $20.20 region, which if cleared decisively would suggest that the XAG/USD has formed a near-term bottom and prompt some short-covering. Spot prices might then accelerate the recovery towards the $20.65 horizontal resistance.
On the flip side, the $19.25-$19.20 area now seems to protect the immediate downside ahead of the YTD low, around the $19.00-$18.90 region. Some follow-through selling would make the XAG/USD vulnerable to testing the $18.00 mark before eventually dropping to the $17.65 support zone.
Silver 4-hour chart
-637927989206329530.png)
Key levels to watch
The Bank of England (BOE) should have heightened awareness of the roles of the sterling at the time of high inflation, BOE policymaker Catherine Mann said on Thursday, as reported by Reuters.
"In the near term, tighter US monetary policy tends to boost UK inflation because of the weaker pound," Mann further elaborated. "A robust policy response to avoid near-term augmentation of inflation dynamics is appropriate in today's environment."
Market reaction
The GBP/USD pair edged slightly higher on these comments and was last seen gaining 0.5% on the day at 1.1988.
- NZD/USD staged modest recovery from the YTD low and snapped a two-day losing streak.
- A positive risk tone prompted some USD profit-taking and benefitted the risk-sensitive kiwi.
- The technical setup supports prospects for an extension of a well-established bearish trend.
The NZD/USD pair gained some positive traction on Wednesday and moved away from the YTD low touched earlier this week. The uptick assisted spot prices to snap a two-day losing streak, though lacked bullish conviction and stalled just ahead of the 0.6200 round-figure mark.
A slight recovery in the global risk sentiment prompted some profit-taking around the safe-haven US dollar and extended support to the risk-sensitive kiwi. That said, the prospects for more aggressive Fed rate hikes helped limit the USD downfall and capped gains for the NZD/USD pair.
Looking at the broader picture, the recent decline witnessed over the past three weeks or so has been along a downward sloping channel and point to a well-established short-term bearish trend. Moreover, bearish oscillators on the daily chart are still away from being in the oversold territory.
The technical set-up suggests that any subsequent move up might still be seen as a selling opportunity and runs the risk of fizzling out quickly. Hence, any subsequent move up is likely to remain capped near the descending channel resistance, currently around the 0.6225 region.
The said barrier is followed by the 0.6260 supply zone, which now coincides with the 100-period SMA on the 4-hour chart and should act as a key pivotal point. Sustained strength beyond would indicate that the NZD/USD pair has formed a near-term bottom and trigger a short-covering move.
On the flip side, the 0.6135-0.6125 region (YTD low) now seems to protect the immediate downside ahead of the descending channel support, just ahead of the 0.6100 mark. A convincing break below would be seen as a fresh trigger for bearish traders and pave the way for further losses.
NZD/USD 4-hour chart
-637927967637954032.png)
Key levels to watch
Bank of England (BOE) policymaker Catherine Mann noted on Thursday that they are seeing very high inflation expectations over a one-year horizon in the UK, as reported by Reuters.
"High inflation expectations may feed into inflation today," Mann added. "The uncertainty about inflation process strengthens the case for front-loading interest rate rises."
Market reaction
These comments don't seem to be having a significant impact on the British pound's performance against its major rivals. As of writing, the GBP/USD pair was up 0.3% on a daily basis at 1.1965.
S&P 500 is edging higher. However, analysts at Credit Suisse look for key resistance at 3946/70 to cap the market to keep the short-term risks skewed lower over the next two-four weeks.
Technical indicators point to further weakness on a 2-4 week horizon
“S&P 500 is expected to remain capped below the top of this trend channel at 3946/70, with further short-term weakness over the next 2-4 weeks.”
“Support is seen at 3842/39, below which would open up a retest of the 3637/33 low 2022 low. We note that the next support below here is seen at 3600/3594, then the key 50% retracement support at 3522/3500, which now coincides with the bottom of the aforementioned trend channel.”
“Resistance is seen at 3946, then the bottom of the price gap from June and the channel top at 3970/74, which we look to cap to maintain the short-term downward pressure on equity markets. A break would significantly improve the short-term technical outlook, with the next key resistance seen at 4017/19, then 4074/4088, which includes the 63-day average.”
- EUR/USD’s bullish attempt runs out of gas near 1.0220.
- Further retracements look likely in the near term.
EUR/USD climbs as high as the 1.0220 region, although the move lacks follow through.
The pair’s bearish stance stays everything but abated for the time being. Against that, there is a minor support level at 1.0060 (low December 11 2002) prior to a test of the key parity area.
In the longer run, the pair’s bearish view is expected to prevail as long as it trades below the 200-day SMA at 1.1078.
EUR/USD daily chart
- Goods and services deficit in the US narrowed at a softer pace than expected in May.
- US Dollar Index holds steady at around 107.00.
The data published by the US Census Bureau showed on Thursday that the goods and services deficit narrowed by $1.1 billion to $85.5 billion in May. This reading came in slightly higher than the market expectation for a deficit of $85 billion.
"May exports were $255.9 billion, $3.0 billion more than April exports," the publication further read. "May imports were $341.4 billion, $1.9 billion more than April imports."
Market reaction
This report doesn't seem to be having a noticeable impact on the dollar's performance against its rivals. As of writing, the US Dollar Index was posting small daily losses at 106.95.
- Initial Jobless Claims rose by 4,000 in the week ending July 2.
- US Dollar Index consolidates weekly gains near 107.00 after the data.
There were 235,000 initial jobless claims in the week ending July 2, the weekly data published by the US Department of Labor (DOL) showed on Thursday. This print followed the previous week's print of 231,000 and came in slightly higher than the market expectation of 230,000.
Further details of the publication revealed that the advance seasonally adjusted insured unemployment rate was 1% and the 4-week moving average was 232,500, an increase of 750 from the previous week's average.
"The advance number for seasonally adjusted insured unemployment during the week ending June 25 was 1,375,000, an increase of 51,000 from the previous week's revised level," the publication read.
Market reaction
The US Dollar Index showed no immediate reaction to these figures and was last seen moving sideways around 107.00.
- USD/JPY edged lower on Thursday amid a modest USD pullback from a two-decade high.
- A positive risk tone undermined the safe-haven JPY and acted as a tailwind for the pair.
- The divergent Fed-BoJ policy stance supports prospects for the emergence of dip-buying.
The USD/JPY pair attracted some selling on Thursday and retreated nearly 70 pips from the daily high, around the 136.20 region. The pair remained on the defensive through the early North American session and was last seen hovering near the lower end of its intraday trading range, just above mid-135.00s.
Following the recent strong bullish run to a 20-year peak, modest US dollar profit-taking turned out to be a key factor that exerted downward pressure on the USD/JPY pair. The downside, however, remains cushioned amid a recovery in the risk sentiment, which tends to undermine the safe-haven Japanese yen.
Reports indicated that China is looking at a $220 billion fiscal stimulus program in the second half of 2022 to shake off the ongoing real estate crisis and revive consumer demand in the economy. This boosted investors' confidence, which was evident from a generally positive tone around the equity markets.
Apart from this, the divergent monetary policy stance adopted by the Federal Reserve and the Bank of Japan supports prospects for the emergence of some dip-buying around the USD/JPY pair. In fact, the June FOMC meeting minutes indicated that another 50 or 75 bps rate hike is likely at the July meeting.
In contrast, the BoJ is expected to retain its ultra-low interest rate policy at the next meeting later this month. Meanwhile, the prospects for a more aggressive policy tightening by the Fed, along with reduced safe-haven demand, lifted the US Treasury bond yields, which further validates the positive outlook.
On the economic data front, the US Weekly Initial Jobless Claims unexpectedly rose to 235K during the week ended July 1 as against the 230K anticipated. The data failed to provide any meaningful impetus to the USD/JPY pair, though the fundamental backdrop seems tilted in favour of bullish traders.
Technical levels to watch
Gold bugs are falling like dominoes. Economists at TD Securities highlight that the yellow metal could suffer a major capitulation event.
Price slump catalyzes massive CTA shot acquisiton program
“We see evidence that the steepest outflows from broad commodity funds since the covid crisis may be catalyzing a series of cascading liquidations from various speculative groups. This argues for substantial downside for gold in coming sessions as participants are forced to sell in a vacuum.”
“Indiscriminate selling by broad commodity funds has weighed on price action in gold. Moreover, it has likely catalyzed a massive CTA selling program as trend followers respond to deteriorating momentum.”
“We have cautioned that the substantial size accumulated by proprietary traders during the pandemic appears complacent. In a liquidation vacuum, these positions are now vulnerable.”
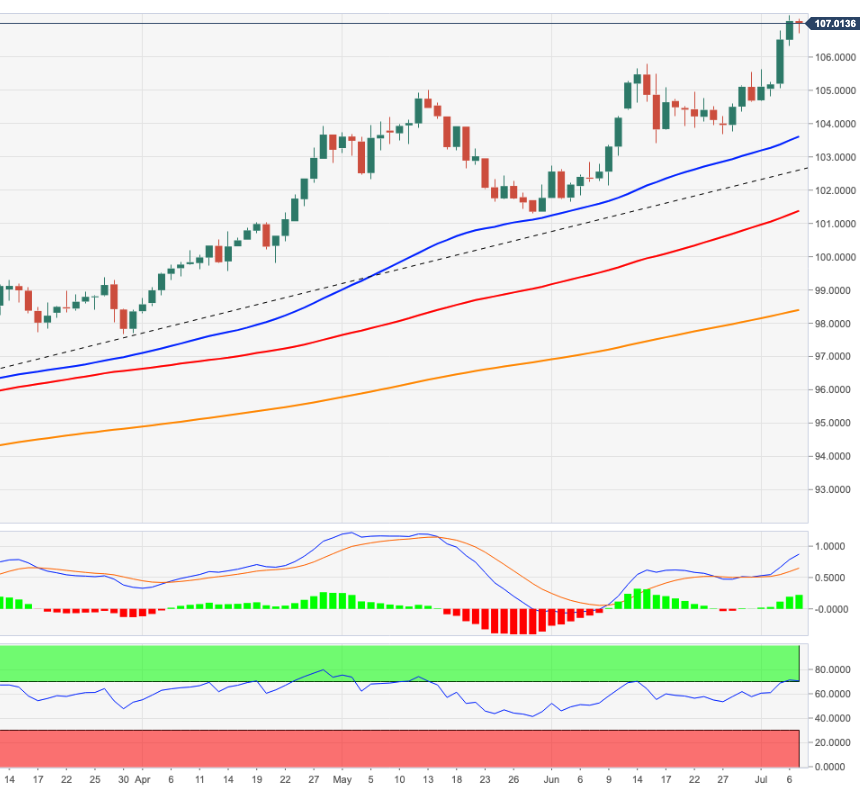
- DXY retreats from recent cycle tops near 107.30 (July 7).
- Overbought conditions spark the current technical drop.
DXY comes under selling pressure following four consecutive daily advances and revisits the sub-107.00 area on Thursday.
Further upside in the dollar remains in store in the short-term horizon, however. Against that, the index could now look to revisit the December 2002 top at 107.31 ahead of the October 2002 high at 108.74.
As long as the 4-month line near 102.60 holds the downside, the near-term outlook for the index should remain constructive.
In addition, the broader bullish view remains in place while above the 200-day SMA at 98.39.
Of note, however, is that the index trades in the overbought territory and it therefore could extend the corrective decline to, initially, the 105.80 region (high June 15).
DXY daily chart
- A combination of factors dragged EUR/GBP to a nearly four-week low on Thursday.
- Recession fears continued weighing on the shared currency and acted as a headwind.
- Reduced political uncertainty lifted sterling and further contributed to the selling bias.
The EUR/GBP cross prolonged its recent pullback from the 0.8680 region and continued losing ground for the fourth successive day on Wednesday. The downward trajectory dragged spot prices to a nearly four-week low, with bears now awaiting sustained weakness below the 0.8500 psychological mark.
The shared currency continued with its relative underperformance amid the ongoing energy crisis in Europe, which could drag the region's economy faster and deeper into recession. The market worries were further fueled by European Commission chief Ursula von der Leyen's warning on Wednesday, saying that the EU needs to make emergency plans to prepare for a complete cut-off of Russian gas.
On the other hand, the British pound drew some support from modest US dollar pullback from a two-decade high and the prospect of reduced political uncertainty. In the latest development, UK Prime Minister Boris Johnson announced his resignation, marking the end of the recent political drama in the country. Johnson's departure, however, was almost a certainty and largely priced in by markets.
Furthermore, investors remain worried that the UK government's controversial Northern Ireland Protocol Bill could trigger a trade war with the European Union. Apart from this, expectations that the Bank of England would adopt a gradual approach towards raising interest rates amid growing recession fears acted as a headwind for sterling. This, in turn, should limit losses for the EUR/GBP cross.
Hence, any subsequent downfall is more likely to find decent support near a technically significant 200-day SMA, currently around the 0.8445 region, which should act as a strong base for the EUR/GBP cross. That said, a convincing break below would be seen as a fresh trigger for bearish traders and set the stage for a further near-term depreciating move.
Technical levels to watch
The accounts of the European Central Bank's (ECB) June policy meeting showed on Thursday that Governing Council members agreed the revised medium-term inflation outlook required further steps to be taken in normalising monetary policy.
Key takeaways as summarized by Reuters
"Members agreed that it was imperative for the ECB to preserve its credibility by showing its resolve."
"Members saw important differences, however, with price pressures in the United States more related to overheating domestic demand and those in the euro area reflecting, to a larger extent, imported inflation."
"Determined action was judged to be needed."
"If the monetary policy stance were normalised too slowly, monetary policy risked adding to demand pressures."
"Question was raised whether the assumptions behind the baseline were too benign."
"Most measures of longer-term inflation expectations appeared to be still broadly anchored."
"Risk that there would eventually be a deterioration in employment."
"It was generally considered that stagflation was an unlikely outcome."
"Inflationary pressures from re-opening in the tourism sector, which had been prominent in the may figures, were likely to continue in the coming months as tourism opened up more widely."
"Necessary to avoid gradualism being seen as precluding interest rate steps in excess of 25 basis points.."
"Taking the indirect effects of energy prices out of the core inflation projection would result in a 2.0% projection for core inflation in 2024."
"Necessary to look beyond negotiated wage growth and consider all elements affecting actual wage growth."
"Gradualism should not necessarily be interpreted as slow action in small steps."
"Remark was made that a normalisation of monetary policy according to the rate path currently priced by markets, which was already included in the technical assumptions, would not be sufficient to bring inflation back to 2% over the medium term."
"A number of members expressed an initial preference for keeping the door open for a larger hike at the July meeting."
"The implied “delay” in raising interest rates should, in principle, be offset by implementing a larger rate hike in July or by indicating more explicitly the possibility of a larger interest rate move later in the third quarter."
Market reaction
The shared currency failed to benefit from the ECB's publication and was last seen posting small daily gains at 1.0185.
- EUR/JPY attempts a mild rebound following Wednesday’s pullback.
- Immediately to the downside appears the 100-day SMA.
EUR/JPY manages to regain some composure and advances beyond 139.00 the figure, although gains did not stick so far.
The cross now faces prospects for extra decline after breaking below the 4-month support line, today around 139.45. That said, the next contention appears at the July low at 137.26 (July 6) ahead of the 100-day SMA, today at 135.93.
In the longer run, the constructive stance in the cross remains well propped up by the 200-day SMA at 133.03.
EUR/JPY daily chart
In a statement delivered outside Number 10 Downing Street on Thursday, British Prime Minister Boris Johnson announced his resignation, saying that it was clear the Conservative Party needed a new leader.
Key takeaways
"The timetable will be announced next week."
"I will serve until there is a new leader in place."
"The reason I have fought so hard is because I felt it was my duty."
"I am immensely proud of my achievements."
"We will continue to back Ukraine."
"The economic scene is difficult."
"It is painful not to see my term through."
"In politics no one is indispensable."
Market reaction
The GBP/USD pair showed no immediate reaction to this development and was last seen rising 0.4% on the day at 1.1980.
UOB Group’s Senior Economist Julia Goh and Economist Loke Siew Ting comment on the recent interest rate decision by the BNM.
Key Takeaways
“Bank Negara Malaysia (BNM) delivered a back-to-back interest rate hike for the first time since 2010 today (6 Jul) with the Overnight Policy Rate (OPR) rising by 25bps to 2.25%. The decision was in line with market expectations, whereby 18 (including us) out of 19 polled by Bloomberg expected a 25bps hike while one expected no change.”
“In the latest monetary policy statement (MPS), BNM continued to cast a positive view on Malaysia’s economy despite rising global headwinds. Malaysia’s economy showed signs of firmer growth supported by the transition to endemicity, easing of restrictions and reopening of international borders. BNM signaled that headline inflation may be higher in some months due to base effect from electricity prices. However, upward inflation pressures are expected to be partly contained by existing price controls, fuel subsidies, and continued spare capacity.”
“BNM reiterated a ‘measured and gradual’ rate hike path going forward and its pledge to keep the OPR ‘accommodative and supportive of growth’ in the latest MPS. The current growth and inflation dynamics would allow BNM to deliver another 25bps rate hike at the next MPC meeting on 7-8 Sep. We maintain our OPR target at 2.50% by year-end, and 3.00% by mid-2023.”
The Chinese economy is recovering but the foundation for recovery is not solid yet, Chinese Premier Li Keqiang told the state media on Thursday, as reported by Reuters.
"We will keep economic operations within a reasonable range," Li added. "China will keep opening up no matter how the international situation changes."
Market reaction
These comments were largely ignored by market participants. As of writing, US stock index futures were up between 0.3% and 0.4% on the day, suggesting that Wall Street's main indexes are likely to open in positive territory.
The European Central Bank (ECB) is still working on the details of the new anti-fragmentation tool, Bloomberg reported on Thursday.
ECB policymakers are said to not show certainty that the new tool will be ready by the next policy meeting on July 21st.
Market reaction
This headline doesn't seem to be having a significant impact on market sentiment. As of writing the Euro Stoxx 600 Index was up 1.5% on a daily basis. Meanwhile, the shared currency is having a difficult time finding demand with the EUR/USD pair continuing to move sideways below 1.0200.
- Gold Price gained some traction on Thursday and snapped a three-day losing streak to the YTD low.
- Modest USD pullback from a 20-year high was seen as a key factor that benefitted the commodity.
- Fed rate hike bets, rebounding US bond yields and a positive risk tone might cap any further gains.
Gold Price edged higher on Thursday and for now, seems to have snapped a three-day losing streak to its lowest level since September 2021, around the $1,732 area touched overnight. The XAUUSD held on to its modest recovery gains through the first half of the European session and was last seen trading near the $1,744-$1,745 region.
The US dollar witnessed some profit-taking following the recent strong bullish run to a 20-year high. This, in turn, was seen as a key factor that offered some support to the dollar-denominated gold. The attempted recovery, however, lacked bullish conviction and runs the risk of fizzling out quickly amid hawkish Fed expectations.
The markets seem convinced that the Fed would retain its aggressive policy tightening path to combat stubbornly high inflation. The bets were reaffirmed by the unsurprisingly hawkish minutes of the June 14-15 FOMC meeting, where policymakers emphasized the need to fight inflation even if it results in an economic slowdown.
Policymakers indicated that another 50 or 75 bps rate hike is likely at the July meeting. This, along with some follow-through recovery in the US Treasury bond yields, should act as a tailwind for the USD. Apart from this, a positive risk tone might further contribute to capping any meaningful upside for the safe-haven gold.
The fundamental backdrop still seems tilted firmly in favour of bearish traders and supports prospects for the emergence of fresh selling at higher levels. Hence, it would be prudent to wait for strong follow-through buying before confirming that Gold Price have formed a near-term bottom and positioning for any meaningful gains.
Market participants now look forward to the US Weekly Initial Jobless Claims, due later during the early North American session. This, along with Fed Governor Christopher Waller and St. Louis Fed President James Bullard's scheduled speeches, will influence the USD price dynamics and produce short-term opportunities around gold.
Technical levels to watch
The Bank of Japan (BOJ) is expected to raise the FY2022 inflation forecast to slightly above 2% from the current 1.9% in the quarterly outlook report due July 21, Reuters reports, citing sources.
Also read: BOJ to raise inflation view for fiscal 2022 to above 2% - Jiji
Additional takeaways
BOJ expected to cut fiscal 2022 economic growth forecast from current +2.9% in quarterly report.
BOJ to warn of risks from global slowdown at quarterly report.
Report may tone up view on inflation expectations.
BOJ likely to maintain ultra-low interest rates, dovish policy bias.
Market reaction
USD/JPY is off the daily highs of 136.23, currently trading at 135.95, almost unchanged on the day.
Following the news that UK Prime Minister Boris Johnson will announce his resignation, a Downing Street spokesman said that the Conservative Party leader will "make a statement to the country" Thursday.
Chatters surrounding his resignation built up after he was abandoned by over 50 ministers and Tory lawmakers, withdrawing support following Johnson’s involvement in many scandals.
Speculations are rife that Trade Minister Penny Mordaunt and Attorney General Suella Braverman are leading the succession race.
Bloomberg reported, “a close ally said Johnson had shown in the last 48 hours he would go down fighting but he's conceded he must resign. He will stay on as caretaker prime minister until October, with a new Conservative leader set to be installed in time for the party's annual conference.”
Market reaction
GBP/USD has faded the latest leg down, as bulls are back in the game amid the renewed US dollar selling and UK political drama.
The pair is now trading at 1.1994, adding 0.54% on the day, awaiting Johnson’s speech.
- AUD/USD staged a goodish bounce from a two-year low and snapped a two-day losing streak.
- Recession fears, Fed rate hike bets should underpin the USD and cap the risk-sensitive aussie.
- A three-week-old descending channel also points to a well-established short-term downtrend.
The AUD/USD pair once again showed resilience near the 0.6765-0.6760 area and staged a goodish bounce from over a two-year low set this week. Spot prices extended the steady intraday ascent through the early part of the European session and climbed to the 0.6830-0.6835 area, reversing weekly losses.
Upbeat Australian trade balance data, along with recovery in iron ore prices, offered some support to the resources-linked aussie. Adding to this, a slight improvement in the risk sentiment prompted some profit-taking around the safe-haven US dollar and benefitted the risk-sensitive Australian dollar.
That said, growing fears about a possible global recession should keep a lid on any optimistic move in the markets. Apart from this, the prospects for more aggressive Fed rate hikes should act as a tailwind for the greenback and further contribute to capping the AUD/USD pair, at least for the time being.
From a technical perspective, the recent downfall since mid-June along a downward sloping trend channel points to a well-established short-term bearish trend. Hence, any subsequent move up is more likely to meet with a fresh supply near the top end of the said channel, currently around the 0.6865 area.
This is closely followed by the 0.6900 mark, which coincides with the 100-period SMA on the 4-hour chart. Some follow-through buying would suggest that the AUD/USD pair has formed a bottom and trigger an aggressive short-covering move, which should lift spot prices towards the 0.6955-0.6960 supply zone.
On the flip side, the 0.6800 round figure now seems to protect the immediate downside ahead of the 0.6765-0.6760 area. Failure to defend the said support levels would make the AUD/USD pair vulnerable to slide further, towards challenging the ascending channel support, currently around the 0.6715-0.6710 area.
A convincing breakthrough the latter, leading to a subsequent fall below the 0.6700 mark would be seen as a fresh trigger for bearish traders and pave the way for additional losses. The AUD/USD pair might then accelerate the fall towards the next relevant support near the 0.6655-0.6650 region.
AUD/USD 4-hour chart
-637927833098875754.png)
Key levels to watch
Economist at UOB Group Lee Sue Ann reviews the latest RBA event on July 5.
Key Takeaways
“The Reserve Bank of Australia (RBA), at its meeting on Tue (5 Jul), decided to increase the official cash rate (OCR) target by 50bps to 1.35%. It also increased the interest rate on Exchange Settlement balances by 50bps to 1.25%.”
“In light of the RBA’s persistent reference to ensure that inflation in Australia returns to target over time; we now think the RBA is open to a third 50bps rise in Aug. We then look for a further 25bps increase in Nov to take the OCR to 2.10% by year-end. In 2023, we are looking for a 25bps increase in Feb and a 15bps increase in May. This should take the OCR to 2.50%, with a pause thereafter, and our end-2023 forecast unchanged at 2.50%.”
“Financial markets have priced in aggressive tightening, with the OCR rising above 3.5% by 2Q23. We think the Australian economy does not require such a rapid tightening, and our view is also based on several uncertainties flagged by the RBA. The next RBA meeting is on 2 Aug, and 2Q22 CPI data, to be published on 27 Jul, will be a crucial update a little less than a week prior to that meeting.”
EUR/USD has gone into a consolidation phase after having plunged to its weakest level since December 2002 at 1.0161 on Wednesday. 1.0130 aligns as next target unless euro steadies above 1.0200, FXStreet’s Eren Sengezer reports.
Rise above 1.0200 needed to avoid further falls
“In case Wall Street's main indexes stage a decisive rebound, EUR/USD losses could remain limited. The pair, however, is unlikely to break out of its downtrend in the current market environment.”
“1.0200 (psychological level, static level) aligns as initial resistance and in case the pair manages to flip that level into support, it could extend its recovery toward 1.0250 (upper limit of the descending regression channel, static level).”
“On the downside, 1.0160 (multi-decade low set on Wednesday) forms interim support ahead of 1.0130 (static level from November 2002, former resistance) and 1.0100.”
- GBP/USD bears looking to kill bulls’ recovery attempts on Thursday.
- UK PM Johnson is set to resign, political uncertainty heightens.
- The US dollar index recaptures 107.00 despite positive equities.
GBP/USD is preserving a major part of the intraday gains in the European session this Thursday, having found buyers once again near 1.1950.
Cable extended its recovery from 28-month lows of 1.1876 earlier in the day and almost tested the 1.2000 psychological mark before running into fresh offers. The pound was hit by news that UK Prime Minister Boris Johnson is set to announce his resignation. Johnson received another blow after Home Secretary Priti Patel joined the mutiny and demanded his resignation. Also, the newly appointed Finance Minister Nadhim Zahawi said that “PM Johnson Must Go.”
Also read: UK PM Johnson will reportedly announce his resignation
Uncertainty over who will be the next PM of the Kingdom heightened and weighed heavily on the sterling. Meanwhile, the US dollar index stalled its correction and found renewed demand amid looming recession fears and hawkish FOMC minutes, collaborating with the latest leg down in the major.
The UK political drama and broad dollar demand will likely keep the further upside elusive in GBP/USD. Investors look forward to the speeches from the Fed and BOE officials due later this Thursday. Cable, however, paid little heed to the latest BOE decision maker panel survey, which highlighted lofty inflation expectations, per Reuters.
Brexit concerns continue to dent the sentiment around GBP bulls, especially after European commissioner Maros Sefcovic told the European Parliament in Strasbourg, there is "no legal or political justification whatsoever" for Britain to change the Northern Ireland protocol that was part of its divorce agreement with the European Union (EU).
GBP/USD: Technical levels
The latest survey conducted by the Bank of England (BOE) decision maker panel (DMP) showed that inflation expectations are seen bumping up sharply in the coming months, per Reuters.
Key findings
Over the past 12 months to June, average unit costs were estimated to have increased by 9.5%.
Over the next 12 months, firms expected unit cost growth to be 8.2%.
Perceptions of current CPI inflation averaged 8.7% in the June survey, 0.3pp lower than the official ONS CPI inflation rate.
Looking ahead, DMP members expected CPI inflation to be 7.4% one-year ahead and 4.0% in three years' time.
88% of firms reported they were finding it harder to recruit new employees compared to normal.
58% of respondents reported that uncertainty for their business was 'high' or 'very high' at the moment, 4 percentage points higher than in May.
Market reaction
GBP/USD is unperturbed by the BOE survey results, as the pound continues to sink on news that UK PM Boris Johnson is set to announce his resignation amidst the ongoing political drama.
The pair is trading at 1.1965, still up 0.32% on the day, having faced rejection at 1.1995.
- A combination of factors assisted GBP/JPY to build on the overnight bounce from a multi-week low.
- A positive risk tone, dovish BoJ weighed on the safe-haven JPY and acted as a tailwind for the cross.
- Reports that UK PM Johnson will resign provided a modest lift to the GBP and remained supportive.
The GBP/JPY cross built on the previous day's strong rebound from the 160.40-160.35 region, or a nearly three-week low and gained strong positive traction on Thursday. The recovery momentum extended through the early part of the European session and pushed spot prices back above the 163.00 round-figure mark.
Against the backdrop of the divergent monetary policy stance adopted by the Bank of Japan and other major central banks, a slight recovery in the risk sentiment undermined the safe-haven Japanese yen. On the other hand, the British pound drew some support from a modest US dollar pullback from a two-decade high, which, in turn, acted as a tailwind for the GBP/JPY cross.
The latest leg up followed reports that the British Prime Minister will announce his resignation. This marks the end of the recent political drama in the UK and offered some respite to the GBP bulls. That said, worries that the UK government's controversial Northern Ireland Protocol Bill could trigger a trade war with the European Union might continue to act as a headwind for sterling.
Apart from this, expectations that the Bank of England would adopt a gradual approach towards raising interest rates amid growing recession fears capped the upside for the GBP/JPY cross. Furthermore, the worsening global economic outlook should keep a lid on any optimistic move in the markets and supports prospects for the emergence of fresh selling around the pair at higher levels.
From a technical perspective, spot prices have repeatedly shown resilience and bounced from the very important 200-day SMA. The mixed set-up warrants some caution for aggressive traders and before positioning for any firm near-term direction for the GBP/JPY cross.
Technical levels to watch
The price of Brent crude suffered its largest one-day fall since March on Tuesday. But following the recent slide, economists at UBS expect the oil price to rebound as a shortfall in supply relative to demand reasserts itself.
Oil price slide looks likely to be reversed
“Many OPEC+ oil producers continue to struggle to reach their production targets, and the group’s spare capacity to deal with future supply interruptions is dwindling.”
“Disruption of oil from Russia could further restrict global supply.”
“China appears to be transitioning toward a less disruptive policy on COVID-19, reducing the likely drop in energy demand.”
“Crude prices should rise as supply growth lags demand growth over the coming months. We see the price of Brent crude rising to $130 a barrel by September and trading around $125 through to the middle of 2023. This underlines our positive view on energy equities.”
- USD/CAD witnessed some selling on Thursday and was pressured by a combination of factors.
- Rebounding oil prices underpinned the loonie and exerted pressure amid a modest USD pullback.
- Recession fears could cap oil prices; Fed rate hike bets to lend support to the USD and the pair.
The USD/CAD pair maintained its offered tone through the early European session and slipped below the 1.3000 psychological mark, hitting a fresh daily low in the last hour.
The US dollar paused its recent strong bullish run and eased a bit from a fresh two-decade high touched the previous day amid a slight improvement in the risk sentiment. Adding to this, a modest bounce in crude oil prices - bolstered by concerns about tight global supplies - underpinned the loonie and exerted downward pressure on the USD/CAD pair. This comes on the back of this week's failures near the 1.3075-1.3085 area and marks a near-term bearish breakdown.
That said, growing fears of a global recession, along with fresh COVID-19 lockdowns in China, have raised concerns about the fuel demand outlook and might cap oil prices. Furthermore, the worsening economic outlook should keep a lid on any optimistic move in the markets. Apart from this, the prospects for more aggressive Fed rate hikes should act as a tailwind for the safe-haven buck and lend support to the USD/CAD pair, warranting some caution for bearish traders.
Expectations that the Fed would stick to its faster policy tightening path were reaffirmed by the unsurprisingly hawkish minutes of the June 14-15 FOMC meeting released on Wednesday. Policymakers emphasized the need to fight inflation even if it meant slowing an economy and indicated that another 50 or 75 bps rate hike is likely at the July meeting. This, in turn, favours the USD bulls and supports prospects for the emergence of some dip-buying around the USD/CAD pair.
Hence, it will be prudent to wait for strong follow-through selling before confirming that spot prices have topped out and positioning for a deeper corrective pullback. Traders now look forward to the US Weekly Initial Jobless Claims. This, along with Fed Governor Christopher Waller and St. Louis Fed President James Bullard's scheduled speeches, will influence the USD. Apart from this, oil price dynamics should produce short-term trading opportunities around the USD/CAD pair.
Technical levels to watch
The US Dollar Index (DXY) uptrend remains intact, next targeting the 108 area. Positive momentum is likely to persist until the Fed’s front-loaded policy tightening cycle is nearer conclusion, according to economists at Westpac.
DXY technicals remain bullish
“The USD should remain underpinned by key events during the week ahead, with neither likely to derail the Fed from hiking by 75 bps later this month.”
“The DXY uptrend should remain intact until the Fed’s cycle is mostly complete.”
“Some resistance may be encountered at 108, but technicals alone suggest even higher potential given the break in June above a five-year old contracting range.”
Several news outlets reported on Thursday that British Prime Minister Borish Johnson is expected to announce his resignation.
According to the BBC Johnson is set to make a statement within hours. The PM will reportedly stay on as the leader of the Conservative Party until a new leader is chosen this summer.
Market reaction
With the initial reaction, the GBP/USD pair edged slightly higher and was last seen trading at 1.1972, where it was up 0.35% on a daily basis. Meanwhile, the UK's FTSE 100 Index is up more than 1% on this headline.
- EUR/USD’s bullish attempt runs out of steam around 1.0220.
- The ECB will release its Accounts later in the session.
- Initial Claims and Trade Balance figures next on tap in the NA session.
EUR/USD clings to the so far modest gains around the 1.0200 region on Thursday.
EUR/USD remains under pressure… and close to parity
EUR/USD bounces off lows in the 1.0160 region, an area revisited for the first time since December 2002 on Wednesday.
The sharp pullback in spot came on the back of unabated recession talks, which at the same time remain underpinned by prospects for further tightening by major central banks. On the latter, the ECB is expected to hike rates by 25 bps at its meeting later in the month, although a larger move is not ruled out for the time being.
In the German money market, the 10y bund yields gather some traction and leave behind two daily drops in a row in the wake of the opening bell in Euroland.
In the docket, Germany’s Industrial Production expanded less than expected 0.2% MoM in May. Later in the session, ECB’s Board member P.Lane is due to speak followed by the publication of the ECB Accounts.
What to look for around EUR
Bears maintain the EUR/USD under heavy pressure and the acceleration of the downside opens the door to a probable visit to the parity level sooner rather than later.
Indeed, the pair’s price action remains depressed and keeps closely following rising speculation around a probable recession in the region, dollar dynamics, geopolitical concerns, fragmentation worries and the Fed-ECB divergence.
Key events in the euro area this week: ECB Accounts (Thursday) – ECB Lagarde (Friday).
Eminent issues on the back boiler: Fragmentation risks. Kickstart of the ECB hiking cycle in July? Asymmetric economic recovery post-pandemic in the euro bloc. Impact of the war in Ukraine on the region’s growth prospects and inflation.
EUR/USD levels to watch
So far, spot is up 0.08% at 1.0189 and a breakout of 1.0551 (55-day SMA) would target 1.0615 (weekly high June 27) en route to 1.0773 (monthly high June 9). On the other hand, the next support lines up at 1.0161 (2022 low July 6) seconded by 1.0100 (round level) and finally 1.0060 (low December 11 2002).
Here is what you need to know on Thursday, July 7:
The greenback continued to outperform its rivals and the US Dollar Index climbed to its highest level in nearly two decades above 107.00 on Wednesday before going into a consolidation phase early Thursday. The market mood seems to be improving in the European morning with US stock index futures posting modest daily gains. Later in the session, the European Central Bank (ECB) will release the minutes of its June policy meeting. The US economic docket will feature the weekly Initial Jobless Claims data and the trade balance figures for May. It's worth noting that the ADP announced that it will suspend its private employment report while revamping the methodology. During the American trading hours, several FOMC policymakers will be delivering speeches.
The minutes of the Fed's June policy meeting showed that participants 'concurred' that high inflation warranted 'restrictive' interest rates, with the possibility of a 'more restrictive stance' if inflation persists.
Meanwhile, Shanghai is widely expected to go into another coronavirus-related lockdown with the city's Health Commission reporting 32 new cases. Additionally, Japanese news outlets have reported that authorities were planning to tighten restrictions in Tokyo.
EUR/USD lost nearly 100 pips on Wednesday and touched a multi-decade low of 1.0161. The pair is staging a modest rebound toward 1.0200 in the early European session. Earlier in the day, the data from Germany showed that Industrial Production expanded by 0.2% in May, missing the market expectation of 0.4%.
GBP/USD is having a difficult time erasing its losses and stays relatively quiet near 1.1950 amid the ongoing political drama in the UK. The Conservative Party's 1922 Committee will reportedly hold an internal election to appoint a new executive, who can then decide whether to change the rules surrounding the grace period following the no-confidence vote.
Gold slumped to its lowest level since September 2021 at $1,731. Growing recession fears and the broad-based dollar strength weigh on gold's demand outlook. XAU/USD was last trading in positive territory above $1,740.
USD/JPY struggles to find direction on Thursday and continues to move sideways near 136.00. Although the 10-year US Treasury bond yield gained more than 4% on Wednesday, the pair failed to capitalize with the JPY finding demand as a safe haven.
Bitcoin gained 2% on Wednesday and seems to have settled above $20,000 for the time being. Ethereum consolidates Wednesday's recovery gains and fluctuates above $1,100.
Economists at Westpac see potential for further NZD weakness during the month ahead. Kiwi is likely to test 0.6200 and possibly fall lower.
Potential for NZD/USD to rebound towards 0.68 by end-2022
“NZD/USD remains vulnerable to a decline towards the 0.6000 area.”
“The RBNZ MPR next week has the potential to surprise the NZD in either direction. For example, a hawkish surprise could comprise expressed discomfort with the falling NZD lifting tradables inflation. A dovish surprise could comprise concerns regarding the global economic outlook.”
“By year-end, assuming sentiment stabilises, there is potential for the NZD to rebound towards 0.68. By then, the Fed story should be fully priced into the USD, while the spotlight could shift to higher NZ commodity prices.”
- GBP/USD built on the overnight bounce from over a two-year low and edged higher on Thursday.
- A positive risk tone prompted some profit-taking around the safe-haven USD and extended support.
- The UK political crisis, Brexit woes should act as a headwind for the GBP and cap gains for the pair.
The GBP/USD pair gained some positive traction on Thursday and moved further away from its lowest level since March 2020, around the 1.1875 region touched the previous day. The pair maintained its bid tone through the early European session and was last seen trading near the daily high, just above the mid-1.1900s.
A slight improvement in global risk sentiment prompted some profit-taking by traders of the safe-haven US dollar, especially after the recent strong bullish run to a two-decade high. This, in turn, extended some support to the GBP/USD pair, though a combination of factors might hold back bulls from placing aggressive bets.
Recession fears remain the key theme and should keep a lid on any optimistic move in the markets. Apart from this, expectations for more aggressive Fed rate hikes should limit the USD pullback. Furthermore, domestic issues should act as a headwind for the British pound and contribute to capping the upside for the GBP/USD pair.
British Prime Minister Boris Johnson faces mounting pressure to step down following the resignations of key Tory MPs over the past few days. This comes amid worries that the UK government's controversial Northern Ireland Protocol Bill could trigger a trade war with the European Union amid the ongoing cost of living crisis.
Apart from this, expectations that the Bank of England would adopt a gradual approach towards raising interest rates supports prospects for the emergence of fresh selling around the GBP/USD pair. This makes it prudent to wait for strong follow-through buying before confirming that spot prices have formed a near-term bottom.
Market participants now look forward to the US Weekly Initial Jobless Claims, due later during the early North American session. This, along with Fed Governor Christopher Waller and St. Louis Fed President James Bullard's scheduled speeches, will influence the USD price dynamics and provide some impetus to the GBP/USD pair.
Technical levels to watch
Record trade surplus and solid growth outlook reinforce the multi-month scope for AUD revival. Near-term though, the resilient USD suggests risks as far as 0.6650, in the view of economists at Westpac.
Recession talk cannot seriously be applied to Australia for now
“Coal and LNG export revenue led the way as exports jumped 9.5% in the month. We expect sustained high prices for energy products, providing some insulation for the Aussie. Admittedly, insulation is needed, with talk of US recession gathering steam and weakness in metals prices implying a lack of confidence in the China H2 recovery story (a jump in China’s June services PMI was brushed aside).”
“Recession talk cannot seriously be applied to Australia for now, reinforcing the multi-month scope for AUD revival. Near-term though, the resilient USD suggests risks as far as 0.6650.”
There is an increasing likeliness that USD/CNH could break above the 6.7400 level in the next few weeks, commented FX Strategists at UOB Group Lee Sue Ann and Quek Ser Leang.
Key Quotes
24-hour view: “Our expectations for USD to ‘rise to 6.7270’ did not materialize as it traded within a range of 6.7033/6.7190 before closing largely unchanged at 6.7162 (+0.06%). The movement appears to be part of a consolidation and USD is likely to trade sideways for today, expected to be between 6.7050 and 6.7250.”
Next 1-3 weeks: “We continue to hold the same view as yesterday (06 Jul, spot at 6.7140). As highlighted, after consolidating for a few weeks, shorter-term upward momentum is beginning to build and the risk of a break of 6.7400 has increased. The upside risk would remain intact as long as USD does not move below the ‘strong support’ level, currently at 6.6850. Looking ahead, the next resistance above 6.7400 is at 6.7600.”
- DXY comes under some selling pressure in the sub-107.00 area.
- The risk complex regains some composure following the recent sell-off.
- Weekly Claims, Trade Balance next of relevance in the US calendar.
The greenback, when tracked by the US Dollar Index (DXY), faces some selling bias following Wednesday’s tops in levels last seen back in October 2002 past 107.00.
US Dollar Index looks to risk trends, recession talks
The index loses some ground following four consecutive daily advances, including new cycle highs north of the 107.00 hurdle on July 6.
The so far corrective move in the greenback comes in response to the mild recovery in the risk complex and the mixed performance in US yields, which sees further upside in the belly and the long end of the curve, while the short end drops marginally.
In the meantime, recession talks and prospects for further tightening remain in centre stage, particularly after the release of the FOMC Minutes on Wednesday noted that participants prioritized price stability and acknowledged that a more restrictive policy could be on the table in the next periods. In addition, members favoured a 50 bps-75 bps rate hike at the next meeting.
Regarding the likelihood of a US recession, Atlanta Fed’s GDPNow tool sees the economy contracting 2.1% in Q2, which means that the economy is already in a technical recession following the 1.6% contraction of the January-March period.
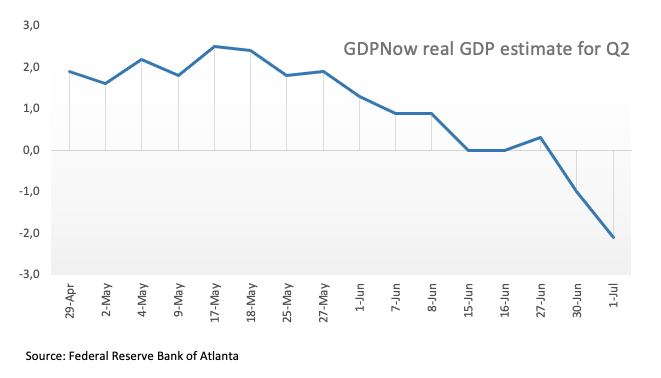
In the US data space, Balance of Trade for the month of May are due seconded by the usual weekly Claims in the week to July 2.
What to look for around USD
The index rose to nearly 2-decade peaks close to 107.30 amidst the sharp deterioration in prospects for the risk-linked assets.
Further support for the dollar is expected to come from the Fed’s divergence vs. most of its G10 peers (especially the ECB) in combination with bouts of geopolitical effervescence and the re-emergence of the risk aversion among investors. On the flip side, chatter of US recession could temporarily undermine the uptrend trajectory of the dollar somewhat.
Key events in the US this week: Initial Claims, Balance of Trade (Thursday) – Non-farm Payrolls, Unemployment Rate, Wholesale Inventories, Consumer Credit Change (Friday).
Eminent issues on the back boiler: Hard/soft/softish? landing of the US economy. Escalating geopolitical effervescence vs. Russia and China. Fed’s more aggressive rate path this year and 2023. US-China trade conflict. Future of Biden’s Build Back Better plan.
US Dollar Index relevant levels
Now, the index is down 0.09% at 106.94 and faces the next support at 103.67 (weekly low June 27) seconded by 103.41 (weekly low June 16) and finally 101.29 (monthly low May 30). On the other hand, a break above 107.26 (2022 high July 6) would expose 107.31 (monthly high December 2002) and then 108.74 (monthly high October 2002).
The pound has not been significantly impacted so far by the heightened state of political uncertainty in the UK. Instead, economists at MUFG Bank expect GBP to move downward due to recession woes.
Heightened political uncertainty unlikely to be the main driver
“The heightened political uncertainty will continue to hang over pound performance in the near-term but is unlikely to be the main driver.”
“The pound should continue to underperform while global growth fears are mainly driving price action in the FX market.”
See – British pound: Forecasts from seven major banks, downside risks to persist
The Eurozone has a challenging growth outlook and also faces growing risks to external balances. What’s more, the European Central Bank (ECB) will likely deliver rate hikes at a slower and more gradual pace when comparing to many others. All this points to a weak outlook for the EUR, in the view of economists at HSBC.
The regional economic news is very challenging
“EUR bulls had held out hope that the obvious and sharp manufacturing slowdown would be offset by stronger services. However, it does not appear that this shift in demand away from goods towards services (such as travel and leisure) is materialising. Indeed, signs of travel disruption across Europe may limit how much this sector can positively contribute through summer.”
“The risks to the Eurozone’s external balances are growing. Export growth remains weak and high commodity prices are pushing the import bill up for the region.”
“With the ECB sticking to its line, we will only see a 25 bps hike at its 21 July meeting – at a time when others are hiking much faster – and wait for its 8 September meeting to deliver a faster tightening, while there is little support coming from higher yields. All in all, this adds up to a weak outlook for the EUR.”
Gold is under renewed short-term pressure but still remains in a broad range. Strategists at Credit Suisse expect the bright metal to test support at $1,616.
Gold to complete a large top on dip below $1,616
“We expect a test of the 38.2% retracement of the whole 2018/2020 uptrend around $1,724. Below there would the open the door for a test of the indicated $1,684/76 weekly lows, before the more important 50% retracement at $1,616, where we would expect a fresh floor again to be established to keep the market in a range. Failure to hold here though would complete a large top.”
“Above the intersection of the key 55 and 200-day averages at $1,847 would be seen to stabilize the market more meaningfully again.”
EUR/USD is attempting to extend its recovery above 1.02. Economists at ING expect the pair to consolidate before sliding below parity.
Parity within striking distance
“We would continue to back Fed tightening holding up better in this summer's equity bear market and there are no signs yet of a significant floor in EUR/USD.”
“Expect shallow consolidation now – likely to be capped by a maximum 1.0350/70, or more likely 1.0270 – before the assault comes on parity. Tomorrow's NFP or next week's US CPI look the best candidates to trigger the test of parity.”
“We can expect the ECB to threaten more aggressive rate hikes, e.g. 50 bps at the July meeting, but given the global and European growth environment, hawkish rhetoric looks unlikely to deliver much of a euro bounce.”
GBP/USD advances to 1.1960 despite Downing Street’s political play. Still, economists at ING note that the pair could fall as low as 1.15.
Political mayhem leaves GBP very volatile
“It seems unlikely that Prime Minister Boris Johnson will be able to hang onto the keys of Number 10 into next week. This will then prompt a Conservative leadership election and possibly some earlier fiscal stimulus than had been expected. That makes sterling a tricky sell.”
“GBP/USD remains vulnerable to the global recession/equity bear market story – bias to 1.17 maybe 1.15 here – while EUR/GBP looks more volatile in a 0.8550-0.8650 range, where the Bank of England looks more aggressive on tightening than the ECB.”
Copper (LME) has established a fresh year-to-date low. Economists at Credit Suisse expect the metal to find support at $6,844.
Key resistance aligns at $8,740
“Copper remains clearly below the intersection of the key 55 and 200-day averages and below the indicated $8,740/8,570 monthly chart lows. We would expect the 61.8% retracement at $6,844 to floor the market at least temporarily, with the industrial metal already recovering intraday from its $7,291 established YTD low.”
“Key resistance is now seen at the recent breakdown point at $8,740.”
- USD/JPY lacked any firm directional bias and oscillated in a narrow trading band on Thursday.
- The Fed-BoJ policy divergence, a positive risk tone undermined the JPY and extended support.
- Modest USD pullback held back bulls from placing fresh bets and capped the upside for the pair.
The USD/JPY pair seesawed between tepid gains/minor losses and remained confined in a narrow band around the 136.00 mark through the early European session.
Media reports that the Bank of Japan will raise its view of inflation for 2022 to above 2% prompted some intraday selling around the USD/JPY pair on Thursday. The early downtick was quickly bought into near the 135.55 region after the BoJ reiterated that it is fully committed to the current ultra-lose monetary policy stance.
In contrast, the minutes of the June 14-15 FOMC meeting, released on Wednesday, reaffirmed market bets for more aggressive rate hikes by the US central bank. In fact, policymakers emphasized the need to fight inflation even if it meant slowing an economy and indicated that another 50 or 75 bps rate hike is likely at the July meeting.
The divergent BoJ-Fed policy outlook, along with a generally positive tone around the equity markets, undermined the safe-haven JPY and acted as a tailwind for the USD/JPY pair. That said, a modest US dollar pullback from a fresh two-decade high touched on Wednesday held back bulls from placing fresh bets and capped the upside for the major.
Nevertheless, the fundamental backdrop supports prospects for a further near-term appreciating move for the USD/JPY pair. Market participants now look forward to the US Weekly Initial Jobless Claims for a fresh impetus. Traders will further take cues from Fed Governor Christopher Waller and St. Louis Fed President James Bullard's scheduled speeches.
Apart from this, the broader risk sentiment should assist traders to grab short-term opportunities around the USD/JPY pair. The focus, however, will remain glued to the closely-watched US monthly jobs report - popularly known as NFP - due for release on Friday, which will play a key role in influencing the near-term USD price dynamics.
Technical levels to watch
The month of June has not been good for gold, with a top to bottom drop of 4%, and against June’s $1,878 peak, further declines has led to post a sharp 7.7% loss. As Benjamin Wong, Strategist at DBS Bank notes, there remain risks of further liquidation of longs if the trend support line that rises from $1,160 (the August 2018 lows) breaks.
Bears still hold the ace cards
“The bearish path is clear as the weekly Ichimoku chart’s cloud path has turned determinedly bearish with resistance sturdy at $1,880 and $1,915. The measure of intermediate resistance via the Tenkan resistance is also lowered to $1,809.”
“The danger is now a break of the trend support line that rises from $1,160, the August 2018 lows that would generate further capitulation risks, and opens the lower price band at $1,626 as a possibility (this itself is near $1,618 a Fibonacci retracement) – this requires a break of 200-week moving average at $1,650. The issue is the form and substance – if we get an evolving triangle, the drop would be a ‘controlled decline’ for $1,691-$1,677.”
“There remain risks of further liquidation of longs if the trend support line that rises from 1160 (the August 2018 lows) break.”
- EUR/GBP consolidates the biggest daily fall in three weeks.
- Bears remain hopeful until the quote bounces back beyond the previous support line from April.
- March’s high, 100-DMA could lure bears during downside break of the immediate moving average.
EUR/GBPsnaps three-day downtrend while picking up bids to 0.8550 during the early Thursday morning in Europe. In doing so, the cross-currency pair takes a U-turn from the 50-DMA.
However, bearish MACD signals and the quote’s sustained break of a three-month-old ascending trend line keep the sellers hopeful until the quote rises past 0.8600 level.
Even if the EUR/GBP rises past the support-turned-resistance surrounding 0.8600, May’s top near 0.8620 and the monthly high near 0.8680 could entertain the buyers.
In a case where the pair remains firmer above 0.8680, the odds of witnessing the fresh 2022 high, currently around 0.8720, can’t be ruled out.
Alternatively, a downside break of the 50-DMA, around 0.8538 by the press time, could direct EUR/GBP towards March’s high of 0.8512.
Following that, the 100-DMA and the 61.8% Fibonacci retracement of the March-June upside, respectively near 0.8450 and 0.8400, could challenge the EUR/GBP sellers.
If at all the EUR/GBP prices remain weak past 0.8400, April’s low of 0.8250 could lure the bears.
Overall, EUR/GBP prints a corrective pullback but the overall weakness is likely to prevail.
EUR/GBP: Daily chart
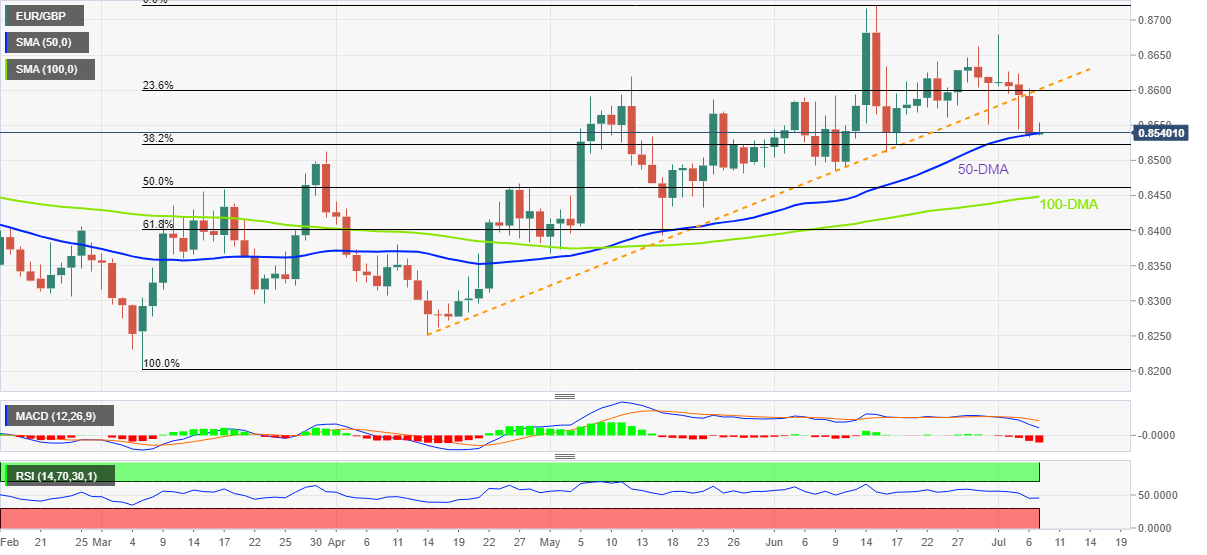
Trend: Pullback expected
USD/ZAR has breached a major resistance at 16.3630/86, reasserting the uptrend from Q2 of 2021 and providing a platform for a move to 17.0709/2617 initially, and above here potentially to 17.7836, analysts at Credit Suisse report.
USD/ZAR reasserts the uptrend from Q2 of 2021
“With the uptrend from Q2 of 2021 now reaffirmed and with our bullish outlook for the DXY index in mind, we look for the strength to continue to the 61.8% retracement at 17.0709/2617 initially, with a break here looking to extend the upside to the high of August 2020 at 17.7836.”
“Note that the Credit Suisse House View is currently neutral on USD/ZAR on a three-six month horizon.”
EUR/CHF has confirmed a move below parity. Economists at Credit Suisse look for quick weakness to their long-held objective at 0.9839/30, ahead of a deeper decline to 0.9609/00.
Both daily and weekly MACD momentum indicators turn lower
“With both daily and weekly MACD momentum indicators turning lower and with the 55-week and 200-day moving averages continuing to fall, we stick with our bearish view and look for an eventual fall to long-held objective at 0.9839/30.”
“A break below 0.9839/30 now looks increasingly likely, which would see scope for the weakness to extend all the way to the ‘measured triangle objective’ at 0.9609/00.”
FX option expiries for July 7 NY cut at 10:00 Eastern Time, via DTCC, can be found below.
- EUR/USD: EUR amounts
- 1.0100 1.08b
- 1.0185 408m
- 1.0215-25 1.46b
- 1.0275 830m
- 1.0290-00 1.14b
- 1.0325 578m
- 1.0350 1.1b
- GBP/USD: GBP amounts
- 1.1800 203m
- 1.1950 316m
- 1.2000 850m
- USD/JPY: USD amounts
- 133.95-05 1.64b
- 134.15 220m
- 135.00 1.07b
- 136.00 1.07b
- 136.15-20 433m
- 137.00 760m
- USD/CHF: USD amounts
- 0.9700 450m
- AUD/USD: AUD amounts
- 0.6800 363m
- 0.6845-50 670m
- 0.6920 305m
- USD/CAD: USD amounts
- 1.2915 200m
- 1.2950 390m
- 1.3000 681m
- NZD/USD: NZD amounts
- 0.6280 632m
The US Dollar Index (DXY) has advanced firmly last week. The DXY itself maintains a five-year bullish ‘triangle’ continuation pattern and from a technical perspective, analysts at Credit Suisse look for eventual strength to 109.25/110.25, with a fresh pause seen as likely here.
DXY getting closer to the top of its typical extreme zone again
“With a five-year bullish triangle continuation pattern confirmed, we continue to look for further upside from a technical perspective to the September 2002 high and the 78.6% retracement of the 2001/2008 downtrend at 109.25/110.25.”
“Whilst we remain bullish for 109.25/110.25, we continue to see 9% above the 40-week average as the upper end of the ‘typical’ extreme for the DXY, currently seen at 107.47 and we would thus be alert to a fresh interim pause in the uptrend here.”
The political crisis in the UK may be the final nail in the coffin for the pound. Economists at Commerzbank expect the GBP/USD to remain below the 1.20 level.
Things are getting tight for PM Boris Johnson
“Within two days, 40 MPs resigned from their posts in protest, including Rishi Sunak (finance minister) and Sajid Javid (health minister). Next week, Prime Minister Johnson might face a vote on his post within his own ranks. Things are getting tight for Johnson.”
“We still have on the list bleak economic prospects with interest rates continuing to rise in all likelihood, persistently high inflation, and increasing Brexit trouble (apart from the economic consequences already being felt). All no arguments in favor of the pound.”
“After GBP/USD already broke through the 1.20 mark to the downside at the beginning of the week, I see little chance that the pound will be able to surpass this mark again so quickly. Especially as long as recession fears prevail on the market.”
GBP/USD is testing below the prior YTD low at 1.1932, which analysts at Credit Suisse look to break to provide a platform for further downside to 1.1500/1.1404 in due course.
Neutral on GBP/USD on a three-six month horizon
“With GBP holding a top in Trade Weighted Terms and with the DXY index edging strongly higher, we think that a close below 1.1932 is imminent and that a move below here will provide a platform for further downside to the bottom of the 6-year range at the low of 2020 at 1.15/14.”
“Note that the Credit Suisse House View is currently neutral on GBP/USD on a three-six month horizon.”
- Market sentiment dwindles as China’ covid woes battle short-covering moves amid absence of major data/events.
- Yields fade bounce off multi-day low, stock futures print gains.
- Second-tier US data, risk catalysts are the key for intermediate directions ahead of Friday’s US NFP.
The risk profile improves during Thursday’s sluggish session as traders await more clues while consolidating the recent moves. In doing so, the chatters surrounding China’s readiness for more stimulus and softer US data helped to improve the sentiment.
While portraying the mood, the US 10-year Treasury yields struggle to extend the previous day’s rebound from a five-week low, taking rounds to 2.93% by the press time. Additionally, the S&P 500 Futures rise 0.30% whereas the Euro Stoxx 50 Futures gain over 1.0% heading into Thursday’s European session.
Comments from China’s Commerce Ministry, suggesting measures to increase vehicle consumption, follow the 500 billion yuan infrastructure plan to challenge the market’s pessimism. On the same line could be a lack of major data, mainly due to the cancellation of the US ADP Employment Change for June and July.
Furthermore, softer US data prints also allowed the bears to take a breather. That said, US ISM Services PMI for June dropped to 55.3 versus 55.9 in May. The actual figure, however, came in better than the market expectation of 54.5. It’s worth noting that the US JOLTS Job Opening for May declined to 11.25 million versus 11.00 million expected and 11.68 million prior.
It’s worth mentioning that the inverse yields curve of the 2-year and 10-year Treasury bonds previously signaled recession fears and drowned the sentiment. The same propelled the US dollar and weighed on the prices of commodities and Antipodeans.
Looking forward, weekly US Jobless Claims and the monthly trade numbers could join ECB Minutes to entertain traders. However, major attention will be given to recession talks and the US Nonfarm Payrolls (NFP) for June as the Federal Open Market Committee (FOMC) Minutes signaled that the Fed policymakers are determined to announce another 75 basis points (bps) of a rate hike. That said, the latest Fed Minutes highlighted the need for the “restrictive stance of policy” while also saying, “even more restrictive stance could be appropriate if elevated inflation pressures were to persist”.
USD/JPY is predicted to keep the 134.75-137.00 range well in place for the time being, noted FX Strategists at UOB Group Lee Sue Ann and Quek Ser Leang.
Key Quotes
24-hour view: “We highlighted yesterday that USD ‘is likely to drift lower and test 135.10’. We added, ‘the major support at 134.75 is unlikely to come under threat’. However, USD declined more than expected as it dropped to 134.94 before rebounding strongly to end the day little changed at 135.93 (+0.04%). Downward pressure has eased and the current movement appears to be part of a consolidation phase. For today, and USD is likely to trade within a range of 135.30/136.30.”
Next 1-3 weeks: “We continue to hold the same view as from Tuesday (05 Jul, spot at 135.95). As highlighted, the current movement appears to be part of a broad consolidation phase and USD is likely to trade between 134.75 and 137.00 for now.”
Considering advanced prints from CME Group for natural gas futures markets, open interest rose by around 1.1K contracts following three consecutive daily drops on Wednesday On the flip side, volume remained choppy and went down by around 84.5K contracts.
Natural Gas remains side lined around the 200-day SMA
Prices of natural gas added to Tuesday’s losses and revisited once again the area of recent lows near $5.30 per MMBtu on Wednesday. The move was in tandem with rising open interest, indicative that the commodity could face extra downside pressure in the very near term. So far, natural gas has been consolidating near the 200-day SMA around $5.60.
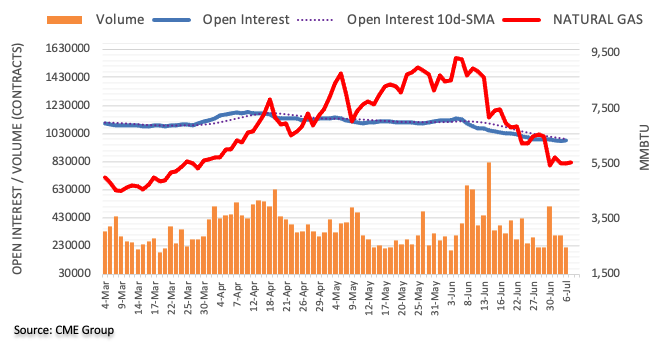
- Gold prices have climbed above $1,740.00 comfortably amid weakness in the DXY.
- Lower US NFP estimates and the downbeat US ISM New Orders Index are responsible for the DXY’s fall.
- The US ISM New Orders Index reflects the forward demand by the households.
Gold price (XAU/USD) is auctioning above the crucial support of $1,740.00. The precious metal has attracted bids as the US dollar index (DXY) has surrendered more than half of Wednesday’s gains. The DXY has tumbled on lower expectations for the US Nonfarm Payrolls (NFP) and the downbeat US ISM New Orders Index data released on Wednesday.
As per the market consensus, the US economy added 270k jobs in June, higher than the former release of 390k. However, the Unemployment Rate may remain stable at 3.6%. It is worth noting that lower additions to the labor market do not resemble a slowdown in the job market. The US employment level is optimal and has less room for more jobs. However, this might trim the confidence of the Federal Reserve (Fed) in announcing extreme restrictive policy measures.
The US ISM New Orders Index landed at 55.6, significantly lower than the estimates and the prior print of 62.1 and 57.6 respectively. The corresponding data reflects the forward demand by the households and eventually, the lower New Orders Index indicates lower demand ahead.
Gold technical analysis
At the lower timeframe, the gold prices are forming an Inverted Flag that signals a continuation of a bearish momentum after a rangebound phase. The downward sloping trendline plotted from $1,812.15 is acting as a barricade for the counter. The declining 200-period Simple Moving Average (SMA) at $1,787.75 adds to the downside filters. It is worth noting that the momentum oscillator, Relative Strength Index (RSI) (14) is displaying overbought signals. Also, the Moving Average Convergence Divergence (MACD) (12,29,9) is portraying exhaustion in the pullback move.
Gold intraday chart
-637927709739686100.png)
In the opinion of FX Strategists at UOB Group Lee Sue Ann and Quek Ser Leang, NZD/USD could slip back to the 0.6100 region in the next few weeks.
Key Quotes
24-hour view: “We expected NZD to ‘trade between 0.6145 and 0.6210’ yesterday. NZD subsequently traded within a lower range of 0.6132/0.6191. The price actions still appear to be part of a consolidation and we expect NZD to trade between 0.6125/0.6185 for today.”
Next 1-3 weeks: “There is no change in our view from yesterday (06 Jul, spot at 0.6175). As highlighted, despite the recent decline, downward momentum has not improved by much. That said, there is scope for NZD to weaken further to the next support at 0.6100. Only a break of 0.6230 (no change in in ‘strong resistance’ level was from yesterday) would indicate that the NZD weakness that started the middle of last week has ended.”
CME Group’s flash data for crude oil futures markets noted traders added around 1.3K contracts to their open interest positions on Wednesday. On the other hand, volume, partially reversed the previous daily build and dropped by around 330.2K contracts.
WTI: Immediately to the downside emerges the 200-day SMA
Prices of the barrel of the WTI extended the sharp weekly pullback on Wednesday amidst increasing open interest. That said, further retracements remain in store for the commodity in the short term and with the next contention of note at the 200-day SMA at $93.48.
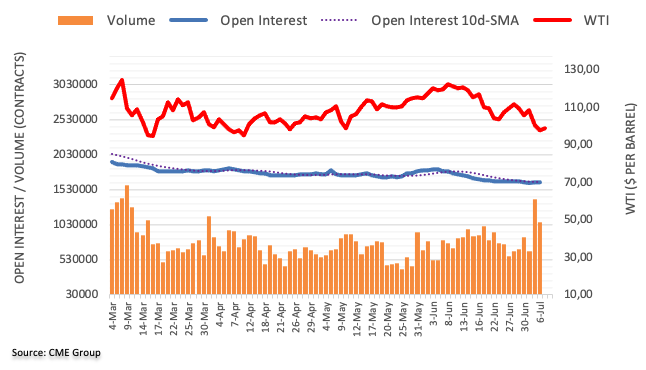
Industrial Production in Germany rose less than expected in May, the official data showed on Wednesday, suggesting that the manufacturing sector activity is losing its recovery momentum.
Eurozone’s economic powerhouse’s industrial output increased by 0.2% MoM, the federal statistics authority Destatis said in figures adjusted for seasonal and calendar effects, vs. a 0.4% expected and 0.7% last.
On an annualized basis, German industrial production dropped 1.5% in May versus a -2.2-decline booked previously. The market consensus was for a drop of 3.3%.
FX implications
The shared currency is trading strongly bid just above 1.0200 on the mixed German industrial figures.
At the time of writing, EUR/USD is trading at 1.0205, up 0.28% on the day.
About German Industrial Production
The Industrial Production released by the Statistisches Bundesamt Deutschland measures outputs of the German factories and mines. Changes in industrial production are widely followed as a major indicator of strength in the manufacturing sector. A high reading is seen as positive (or bullish) for the EUR, whereas a low reading is seen as negative (or bearish).
Gold Price is attempting a minor recovery towards $1,750. The yellow metal is oversold but selling not over yet, with $1,722 still in sight, FXStreet’s Dhwani Mehta reports.
Bears bide time before next push lower
“On the daily chart, gold price remains on track to challenge the rising channel target aligned at $1,722, as the latest bounce is only seen as temporary.”
“The renewed upside in the metal could be attributed to the oversold conditions on the 14-day Relative Strength Index (RSI), which is currently at 28.40.”
“The ongoing road to recovery could be immediately capped by the $1,750 psychological level, above which a fresh upswing towards the powerful hurdle around $1,775 cannot be ruled. That level is the confluence of the January 28 low and the previous day’s high.”
“If sellers regain control, then the $1,700 mark will be at risk on a
Downward pressure could force GBP/USD to revisit the 1.1850 area in the near term, according to FX Strategists at UOB Group Lee Sue Ann and Quek Ser Leang.
Key Quotes
24-hour view: “Yesterday, we were of the view that ‘the weakness in GBP could extend to 1.1880 before stabilization is likely’. GBP subsequently dropped to 1.1877 before rebounding. The rebound amidst oversold conditions suggest that the weakness in GBP has stabilized. In other words, GBP is unlikely to weaken further. For today, GBP is more likely to trade between 1.1870 and 1.1980.”
Next 1-3 weeks: “Our update from yesterday (06 Jul, spot at 1.1955) still stands. As highlighted, the boost in downward momentum after the sharp drop on Tuesday is likely to lead to further GBP weakness. The next support is at 1.1850. Overall, only a break of 1.2030 (‘strong resistance’ level was at 1.2075 yesterday) would indicate that the weak phase in GBP that started one week ago has run its course. Looking ahead, the next support below 1.1850 is at 1.1800.”
- EUR/USD snaps four-day downtrend at 20-year low, renews intraday high of late.
- Firmer RSI, MACD joins bullish chart pattern’s confirmation to favor buyers.
- 100-HMA lures buyers, sellers have a bumpy road to the south.
EUR/USD buyers return to the table after a four-day absence as the quote renews its intraday high near 1.0215 heading into Thursday’s European session. The major currency pair’s latest gains could be linked to the confirmation of a bullish chart pattern called a falling wedge.
The wedge breakout gains strength as it takes place at the lowest levels in nearly 20 years. Also favoring the upside momentum are the firmer RSI (14) and bullish MACD signals.
That said, the latest recovery could initially aim for the 1.0280 hurdle before directing buyers to battle the 100-HMA level of 1.0340.
In a case where EUR/USD remains firmer past 1.0340, the odds of its rally towards the weekly high near $1.0465 can’t be ruled out.
On the contrary, an immediate ascending support line near 1.0180 restricts nearby declines of the EUR/USD pair.
Following that, the recent low of 1.0161 could test the bears before directing them to the 1.0100 round figure.
Should EUR/USD remains bearish past 1.0100, the bears may aim for the 1.0000 psychological magnet.
EUR/USD: Hourly chart
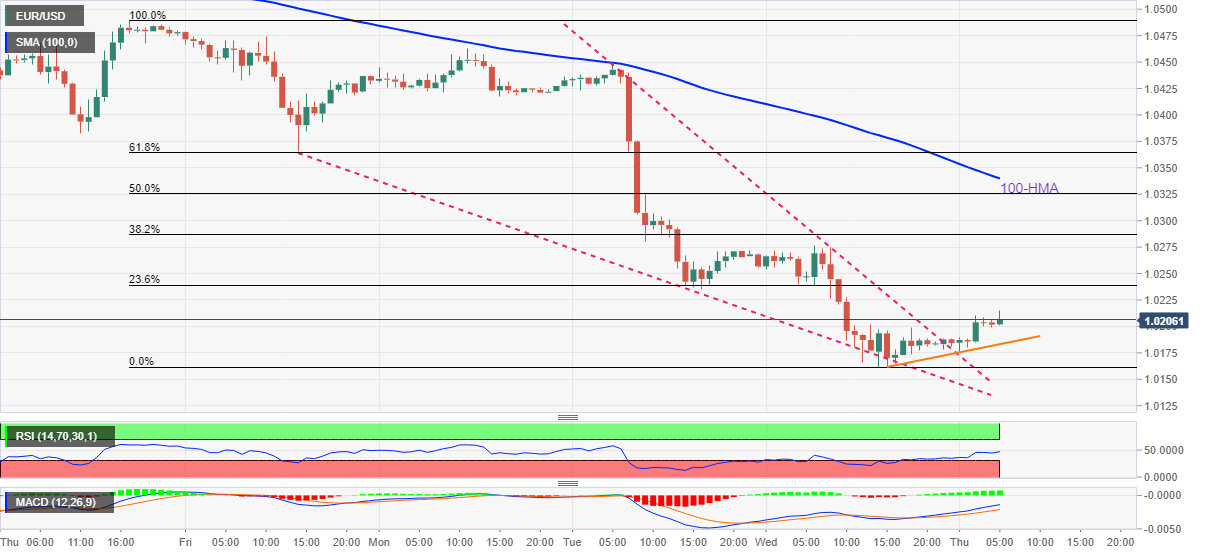
Trend: Further recovery expected
- Advancing 20-and 50-period EMAs add to the upside filters.
- The formation of a Bullish Flag is indicating a sheer upside momentum ahead.
- A bullish range shift by the RSI (14) is hinting for more upside.
The USD/TRY pair has witnessed a firmer rebound in the early European session after hitting a low of 17.19. The asset observed a vertical upside on Wednesday from a low of 16.98. A follow-up buying has turned into a sideways move in a narrow range of 17.17-17.25.
On an hourly scale, the asset is forming a Bullish Flag that signals a continuation of bullish momentum after a rangebound phase. Usually, a consolidation phase denotes intensive buying interest from the market participants, which prefer to enter an auction after the establishment of the trend.
The greenback bulls have successfully defended the 20-period Exponential Moving Averages (EMA) at 17.20. Also, the 50-EMA at 17.11 is scaling higher, which favors an upside bias.
Meanwhile, the Relative Strength Index (RSI) (14) is oscillating majorly in a range of 60.00-80.00, which signals that bullish momentum is still intact.
A break above Wednesday’s high at 17.26 will trigger the upside break of the Bullish Flag chart pattern, which will drive the asset towards the round level resistance at 17.50, followed by the 20 December 2021 high at 18.26.
On the flip side, Turkiye lira bulls could gain momentum if the asset drops below the 50-EMA at 17.11. This will drag the asset towards Wednesday’s low at 16.98. Violation of Wednesday’s low will further push the asset lower to Monday’s low at 16.73.
USD/TRY hourly chart
-637927688613869402.png)
Open interest in gold futures markets went up for the second session in a row on Wednesday, this time by more than 5K contracts according to preliminary readings from CME Group. Volume, instead, reversed four consecutive daily builds and shrank by around 34.7K contracts.
Gold: Next on the downside comes $1,721
Gold prices tumbled to levels last seen in September 2021 near $1,730 per ounce troy on Wednesday. The sharp pullback was amidst rising open interest, which leaves the door open to extra decline in the very near term. The marked drop in volume coupled with oversold levels could, however, encourage a technical rebound. The next level to watch on the downside emerges at the September 2021 low at $1,721 (September 29).
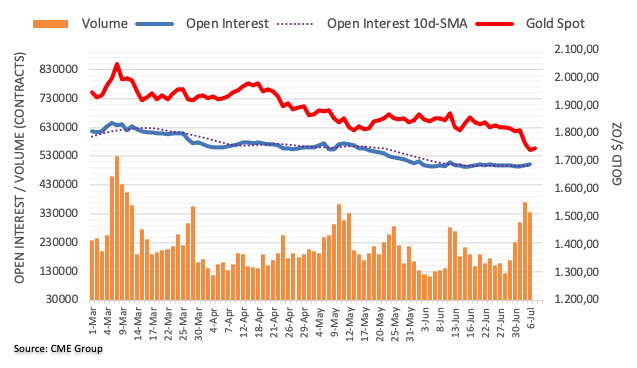
- AUD/USD takes the bids to refresh intraday high, prints the first daily gains in three.
- Softer yields, upbeat Aussie trade numbers favor buyers, recovery in iron ore joins USD pullback to extend gains.
- Fears of economic slowdown, covid-linked lockdown in China challenge corrective pullback.
- Updates over recession, China’s covid conditions will be the key, US ADP Employment Change to decorate calendar.
AUD/USD consolidates recent losses around a two-year low as it takes the bids to refresh its intraday high around 0.6830 heading into Thursday’s European session.
The Aussie pair’s latest recovery could be linked to the upbeat Australian employment data and the US dollar’s pullback. Also favoring the pair buyers is the recovery in prices of Australia’s key export item, namely iron ore.
As per the latest trade numbers from the Australian Bureau of Statistics, the headline Trade Balance rose to 15,965M in May versus 10,725M expected and 10,495M prior. Further details reveal that Exports rose 9.0% from 1.0% prior and Imports grew 6.0% compared to the previous contraction of 1.0%.
Elsewhere, US Dollar Index (DXY) retreats from the 20-year high, marked the previous day, while flashing 0.20% intraday losses around 106.90 level. The greenback’s gauge versus six major currencies tracks downbeat US Treasury yields to pare recent gains ahead of the key employment data.
Additionally, Reuters stated that the most-traded iron ore on the Dalian Commodity Exchange climbed 5% to 764 yuan ($114.02) a tonne as of 04:29 GMT and the August contract on the Singapore Exchange gained 1.9% at $113.30 a tonne. The news marked the consolidation of the previous 5.0% slump and US dollar weakness as the key catalysts for the metal’s latest recovery.
It’s worth noting that the recently higher covid numbers from Shanghai and mass testing in Beijing renew China lockdown fears and keep AUD/USD buyers on their toes. On the same line are fears of global economic slowdown and the Fed’s aggressive rate hikes.
Looking forward, fears of global recession can exert downside pressure on the AUD/USD prices and the same could magnify if the US ADP Employment Change for June prints strong numbers, expected 200K versus 128K prior.
Technical analysis
AUD/USD directs bounce off a downward slopping trend line from January, around 0.6750, to aim for the monthly resistance line near 0.6845 at the latest. However, bears remain hopeful until the quote stays below the previous support line from May, close to 0.6865 by the press time.
FX Strategists at UOB Group Lee Sue Ann and Quek Ser Leang suggested EUR/USD could still drop further and test 1.0100 ahead of 1.0000 in the next weeks.
Key Quotes
24-hour view: “We highlighted yesterday that ‘the weakness in EUR has not stabilized’ and we were of the view that ‘there is scope for EUR to weaken to 1.0200’. The anticipated weakness exceeded our expectations as EUR dropped to a low of 1.0160. Downward momentum has slowed a tad and this coupled with deeply oversold conditions suggests EUR is unlikely to weaken much further. From here, EUR could dip to 1.0145 first before stabilization is likely. For today, EUR is unlikely to challenge the next major support at 1.0100. On the upside, a breach of 1.0260 (minor resistance is at 1.0220) would indicate that the current weakness in EUR has stabilized.”
Next 1-3 weeks: “Yesterday (06 Jul, spot at 1.0265), we highlighted that solid downward momentum is likely to lead to further EUR weakness. We indicated, the next levels to focus on are at 1.0200 and 1.0100. EUR subsequently took out 1.0200 as it dropped to a low of 1.0160. Further EUR weakness still appears likely even though oversold conditions could slow the pace of any further decline. Overall, only a break of 1.0310 (‘strong resistance’ level was at 1.0380 yesterday) would indicate the downside risk in EUR that started one week ago has run its course. Looking ahead, the next support below 1.0100 is at the rather critical psychological level of 1.0000.”
- WTI bounces off three-month low, snaps two-day downtrend.
- US dollar retreats from 20-year high as traders await fresh clues.
- API printed surprise oil inventory build, US tightens sanctions on Iran.
- Weekly EIA stockpiles, US ADP Employment Change could entertain intraday traders.
WTI prints the first daily gains in three around $96.50, portraying a corrective pullback near the three-month low, amid softer US dollar. Adding strength to the recovery moves are the US sanctions on Iran and global ire over Russian oil output.
US Dollar Index (DXY) retreats from the 20-year high, marked the previous day, while flashing 0.20% intraday losses around 106.90 level. The greenback’s gauge versus six major currencies tracks downbeat US Treasury yields to pare recent gains ahead of the key employment data.
Also weighing on the greenback could be the recently softer US numbers. That said, US ISM Services PMI for June dropped to 55.3 versus 55.9 in May. The actual figure, however, came in better than the market expectation of 54.5. It’s worth noting that the US JOLTS Job Opening for May declined to 11.25 million versus 11.00 million expected and 11.68 million prior.
Additionally, the US tightens its grip over Iran’s energy business while the Group of Seven (G7) nations keep trying to tame Russian oil exports. “The United States on Wednesday imposed sanctions on a network of Chinese, Emirati and other companies that it accused of helping to deliver and sell Iranian petroleum and petrochemical products to East Asia, pressuring Tehran as it seeks to revive the 2015 Iran nuclear deal.”
On the contrary, weekly oil stockpile data from the American Petroleum Institute (API) marked an increase of 3.825 million barrels versus the previous reduction of 3.799 million barrels.
Additionally, the yield curve inversion, a condition where near-term bond yields are higher than the longer-dated ones, appears to highlight the recession fears and weigh on the black gold prices. That said, the 2-year bond coupon retreats to 2.96% while showing the inverse gap with the 10-year yields and hints at the global recession. On the same line, International Monetary Fund (IMF) Managing Director Kristalina Georgieva also said, per Reuters, “Global economic outlook has 'darkened significantly' since last economic update.” the IMF chief also added, “Cannot rule out the possible global recession in 2023.”
Moving on, the official weekly oil inventory data from the Energy Information Administration (EIA), prior -2.762 million barrels, will join the US ADP Employment Change for June, expected 200K versus 128K prior, to direct short-term WTI moves.
Technical analysis
Unless breaking the $92.65-70 horizontal support area, established since March, WTI prices are likely to march towards June’s low of $101.17.
- Asian equities have jumped firmly as a correction in the DXY has underpinned the risk-on mood.
- Escalating lockdown fears in China have failed to strengthen bears.
- Oil prices are attempting to reclaim the psychological resistance of $100.00.
Markets in the Asian domain have surged firmly as slippage in the US dollar index (DXY) has underpinned the positive market sentiment. The DXY has slipped below the critical support of 107.00 in the Asian session after hitting a fresh 19-year high of 107.24 on Wednesday. The asset has surrendered the majority of its gains as the hawkish Federal Open Market Committee (FOMC) minutes have been discounted by the market participants.
At the press time, Japan’s Nikkei225 jumped 1.27%, China 50 gained 1.05%, and Nifty50 added 0.65% while Hang Seng eased 0.42%.
Only one FOMC member didn’t participate in supporting the announcement of 75 basis points (bps) rate hike. The guidance is hawkish as expected if higher price pressures persist for longer. The catalyst which is impacting the DXY prices is the downbeat US ISM New Orders Index data released on Wednesday. The economic data landed at 55.6, significantly lower than the estimates and the prior print of 62.1 and 57.6 respectively. The corresponding data reflects the forward demand by the households and the lower New Orders Index indicates lower demand ahead.
Meanwhile, Asian indices have ignored the soaring lockdown fears in China. The economy is facing the resurgence of Covid-19 again and again. This is dampening the sentiment of the market participants. No doubt, the restrictions on the movement of men, materials, and machines will halt the production process.
On the oil front, oil prices are attempting a rebound and a pullback move might lift them to near the psychological figure of $100.00. The escalating recession fears brought an extreme sell-off in the asset this week.
- USD/CAD snaps two-day uptrend, remains pressured inside immediate trading range near two-year high.
- Convergence of monthly support line, previous resistance from mid-June, restricts short-term downside.
- Bulls need to cross two-month-old resistance to retake control.
- Multiple failures to cross immediate hurdle, RSI conditions hint at further weakness.
USD/CAD stays depressed around the intraday low of 1.3012 during the first negative daily performance in three. In doing so, the Loonie pair extends pullback from the upward sloping resistance line from May.
Given the RSI pullback from overbought territory joining the recent profit-booking of the USD/CAD prices, the quote is likely to extend the short-term weakness.
However, a confluence of the one-month-old support line joins descending trend line from June 17 to highlight 1.2885 as the key support. Also acting as a downside filter is the 200-SMA level surrounding 1.2820.
Alternatively, an ascending resistance line from May, near 1.3080, guards the immediate upside of the USD/CAD pair.
Following that, the 1.3100 threshold can act as an additional filter to the north before directing the buyers towards the late November 2020 highs near 1.3170.
Overall, USD/CAD retains its uptrend unless breaking 1.2885 level. However, the short-term pullback can’t be ruled out.
USD/CAD: Four-hour chart
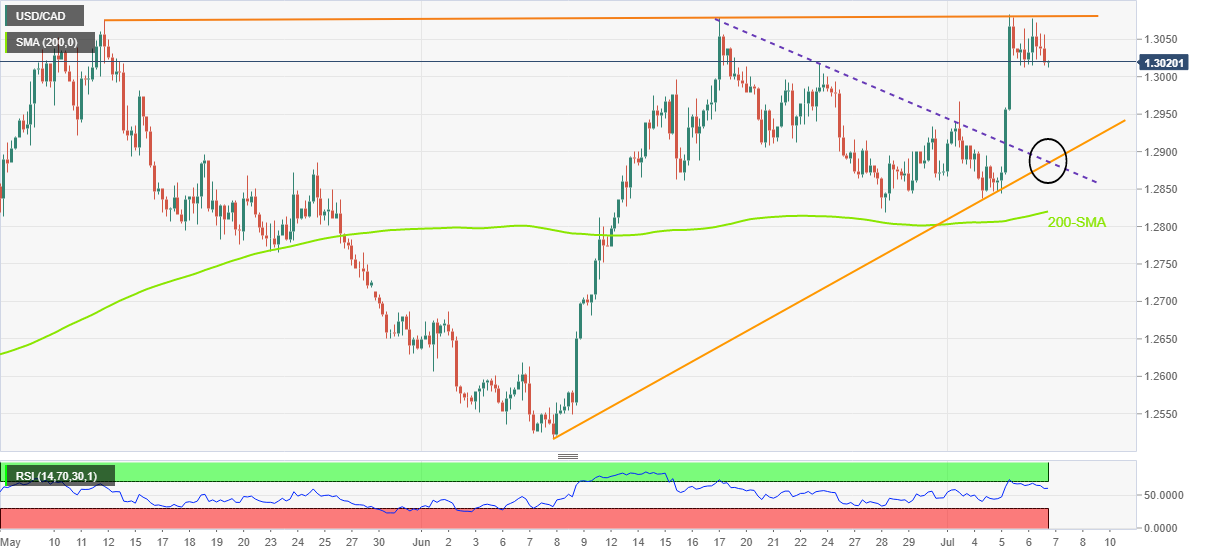
Trend: Limited downside expected
- Steel Price seesaw around intraday high holds onto recovery moves from yearly low.
- US dollar pullback joins China’s readiness to spend more to underpin corrective pullback.
- Jump in Shanghai covid numbers, inverted yield curve exert downside pressure.
- US employment numbers will be crucial after the Fed showed readiness for higher rates.
Steel Price benefits from the US dollar’s pullback from a multi-year high as it seesaws around the intraday high during early Thursday morning in Europe. However, fears of global economic slowdown join fears of another covid lockdown wave to challenge the bulls.
That said, prices of the most active Steel rebar contract on the Shanghai Futures Exchange (SFE) take rounds to 4,255 yuan metric tonne ($650.00) by the press time.
It should be noted that the chatters surrounding China’s 500 billion yuan infrastructure plan and measures to increase vehicle consumption underpinned the metal’s rebound the previous day.
Shanghai recently reported a big jump in the daily covid cases to 32 locally transmitted confirmed cases. The same propels lockdown fears, previously propelled by China’s order of mass testing. Also positive were previous supply chain disturbances, mainly in Chile, as well as improvements in steel materials.
On a broader front, the yield curve inversion, a condition where near-term bond yields are higher than the longer-dated ones, appears to highlight the recession fears. That said, the 2-year bond coupon retreats to 2.96% while showing the inverse gap with the 10-year yields and hints at the global recession. On the same line, International Monetary Fund (IMF) Managing Director Kristalina Georgieva also said, per Reuters, “Global economic outlook has 'darkened significantly' since last economic update.” the IMF chief also added, “Cannot rule out the possible global recession in 2023.”
Additionally, the fears of oversupply, mainly due to a jump in the Asian steel inventories and higher production in the Asia-Pacific region, also exert downside pressure on the metal.
Moving on, Steel Price may remain pressured amid global slowdown fears, as well as an imbalance of the demand-supply crunch. The metal can witness further downside if China’s covid-led lockdown returns, also if the US employment data manage to print upbeat figures.
- Gold Price sees a dead cat bounce before the next downside kicks in.
- Hawkish FOMC minutes and recession fears to keep the USD buoyed.
- XAU bulls face a wall of resistance while support levels appear weak.
Recession fears will continue lingering, as the US Fed remains on track for an aggressive tightening path to fight raging inflation. Meanwhile, concerns over renewed covid lockdowns in China and Japan could also accentuate economic slowdown worries. In times of market unrest and panic, the US dollar remains the go-to safety net, which will keep the USD-priced Gold under immense selling pressure. Any temporary reprieve in the bright metal could be viewed as a good selling opportunity, especially with investors awaiting the all-important US Nonfarm Payrolls for fresh bets on the Fed rate hike expectations. The FOMC Minutes on Wednesday revealed that the Fed sees a ‘more restrictive’ policy as likely, as they remain concerned that inflation will become more entrenched.
Also read: Still more inflation expectations nonsense in the latest Fed minutes
Gold Price: Key levels to watch
The Technical Confluence Detector shows that Gold Price is looking to regain the strong resistance at $1,749 on its road to recovery. That level is the confluence of the SMA5 four-hour and the Fibonacci 38.2% one-day.
Acceptance above the latter will put the pivot point one-month S2 at $1,754 under threat. Further up, the confluence of the Fibonacci 61.8% one-day and the pivot point one-week S2 around $1,757 will hold the guard.
The last line of defense for XAU sellers appears at SMA10 four-hour at $1,762.
On the flip side, the immediate support is seen at the Fibonacci 23.6% one-day at $1,742, below which the previous low four-hour at $1,736 will be tested.
Selling resurgence will threaten the previous day’s low at $1,732, opening floors towards the pivot point one-week S3 at $1,727.
Here is how it looks on the tool
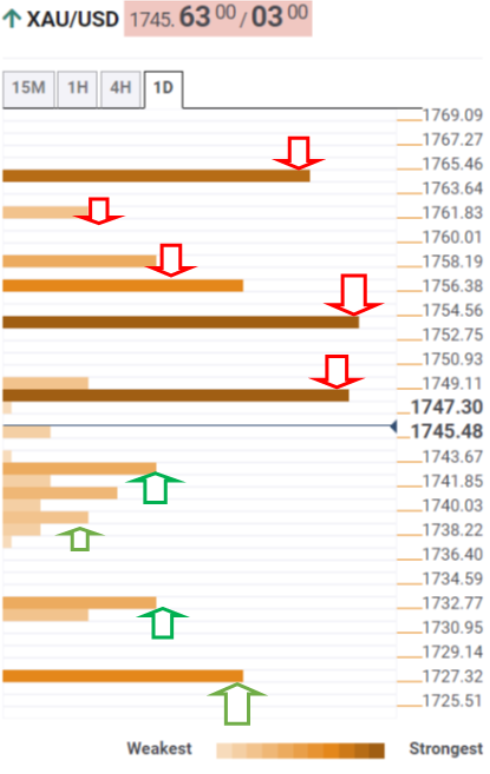
About Technical Confluences Detector
The TCD (Technical Confluences Detector) is a tool to locate and point out those price levels where there is a congestion of indicators, moving averages, Fibonacci levels, Pivot Points, etc. If you are a short-term trader, you will find entry points for counter-trend strategies and hunt a few points at a time. If you are a medium-to-long-term trader, this tool will allow you to know in advance the price levels where a medium-to-long-term trend may stop and rest, where to unwind positions, or where to increase your position size.
- Copper prices are expected to extend their gains after overstepping the critical hurdle of $3.50.
- The asset is aiming higher despite the accelerating lockdown fears in China.
- The arrival of the monsoon in Asia is not impacting the copper bulls.
Copper price, as per the COMEX Futures, has given an upside break of the consolidation range of $3.27-3.46 formed in the past two trading sessions. The base metal futures have displayed a sheer upside to near the psychological resistance of $3.50 and are expected to display more gains after establishing above the same.
The asset is scaling higher despite the escalating lockdown fears in China. The resurgence of Covid-19 is indicating a halt in economic activities. The restrictions on the movement of men, materials, and machines will result in lower production activities and also lower demand for durable goods. Therefore, the demand for copper will fall significantly and may face barricades on elevated levels.
On the demand side, China announced a state infrastructure investment fund that would be worth the Chinese Yuan (CNY) 500 billion ($74.69 billion) to boost infrastructure spending and to bring a revival to the flagging economy, as per Reuters. The usage of copper in infrastructure building remains extremely high and higher infrastructure development in the Chinese economy will spurt the demand for copper.
Meanwhile, investors are worried about the arrival of the monsoon in Asia. The demand for base metals slips firmly in monsoon as construction activities and real estate development get halted.
On the dollar front, the US dollar index (DXY) is facing a mild correction after printing a high of 107.24. This has also supported the copper bulls. A slippage in the DXY has underpinned the risk-on impulse for a while.
- GBP/USD snaps two-day downtrend at the lowest levels since March 2020.
- UK PM Johnson refrains from stepping down despite political push, slew of Tory resignations.
- EU’s Šefčovič rejects the UK’s NIP efforts, inversion of the yield curve highlights recession fears.
US ADP Employment Change, Brexit headlines and UK’s political news will be crucial to watch for fresh impulse.
GBP/USD grinds higher around the intraday top near 1.1950, snapping a two-day downtrend at the lowest levels since 2020. The cable pair’s latest strength could be linked to the UK’s political and Brexit problems. However, the recent pullback in the US dollar appears to challenge the pair sellers during Thursday’s sluggish Asian session.
Despite witnessing over 30 resignations, including key personnel like Health Minister and Chancellor, UK PM Boris Johnson failed to accept the Tory backbenchers’ push to leave the position. Recently, Michael Gove, one of the most senior ministers in the British government, earlier told Prime Minister Boris Johnson he must quit.
Elsewhere, EU Commissioner for Interinstitutional Relations and Foresight Maroš Šefčovič said on Wednesday that the UK bill on altering the Northern Ireland Protocol is unacceptable. It should be noted that UK PM Johnson is widely talked to have Brexit power that saved his positions multiple times and can do during these turbulent times.
It should be noted that the yield curve inversion, a condition where near-term bond yields are higher than the longer-dated ones, appears to highlight the recession fears. That said, the 2-year bond coupon retreats to 2.96% while showing the inverse gap with the 10-year yields and hints at the global recession. On the same line, International Monetary Fund (IMF) Managing Director Kristalina Georgieva also said, per Reuters, “Global economic outlook has 'darkened significantly' since last economic update.” the IMF chief also added, “Cannot rule out the possible global recession in 2023.” Also exerting downside pressure on the GBP/USD prices were the FOMC Minutes that signaled the Fed policymakers’ readiness to do more to tame inflation.
On the other hand, the softer US data could be linked to the recently easy US Dollar Index (DXY), down 0.10% around 107.00. The greenback gauge jumped to the highest in 20 years the previous day amid the market’s rush to risk safety. US ISM Services PMI for June dropped to 55.3 versus 55.9 in May. The actual figure, however, came in better than the market expectation of 54.5. It’s worth noting that the US JOLTS Job Opening for May declined to 11.25 million versus 11.00 million expected and 11.68 million prior.
Against this backdrop, the US Treasury yields fade the previous day’s recovery from the monthly low whereas the S&P 500 Futures print mild gains by the press time.
Having witnessed a mild short-covering, GBP/USD traders need more clues to extend the latest moves, which in turn highlight the UK’s political updates and the recession news for clear directions. Also important to watch is the US ADP Employment Change for June, expected 200K versus 128K prior.
Also read: ADP Net Employment Change June Preview: Can employment stave off a recession?
Technical analysis
Oversold RSI (14) joins a two-month-old support line, near 1.1765, to restrict short-term GBP/USD downside. The corrective pullback, however, needs to cross the monthly resistance line, near 1.2090 by the press time, to recall the buyers.
- USD/INR remains pressured inside a bullish chart pattern after reversing from all-time high.
- RBI takes measures to boost USD inflow, tame current account deficit.
- Reuters’ poll signals 33% of respondents favor 80.00 level, no respite for India’s rupee.
- US ADP Employment Change, economic slowdown chatters eyed for fresh impulse.
USD/INR remains defensive above 79.00, after reversing from the record high the previous day, as the Reserve Bank of India (RBI) intervenes. That said, the US dollar pullback and sluggish markets also challenge the recent USD/INR moves during Thursday’s Asian session.
“India's central bank took a slew of measures on Wednesday to boost foreign exchange inflows, including allowing overseas investors to buy short-term corporate debt and opening of more government securities under the fully accessible route,” said Reuters.
The news also mentioned that the steps came after the Reserve Bank of India's foreign exchange reserves fell by more than $40 billion over the past nine months, largely due to the RBI's intervention in the currency market to cap rupee losses.
Elsewhere, a Reuters poll stated India's rupee will trade near its historic low in three months, battered by widening trade and current account deficits. The July 1-6 poll of over 40 foreign exchange analysts also mentioned that nearly one in three analysts expected it to weaken to 80 per dollar by September.
It’s worth noting that the recent rebound in oil prices, from a 12-week low, joins the market’s recession fears to keep USD/INR buyers hopeful. That said, WTI crude oil prices eyes to regain the $100.00 level, around $96.60 by the press time. In doing so, the black gold ignores the market’s fears of economic slowdown and a build in the US inventories, as per the weekly oil stockpile data from the American Petroleum Institute (API).
Moving on, the US ADP Employment Change for June, expected 200K versus 128K prior, will be important to watch as it becomes the early signal for Friday’s Nonfarm Payrolls (NFP).
Technical analysis
USD/INR stays inside a weekly ascending trend channel amid a steady RSI (14). However, bearish MACD signals challenge the buyers.
That said, the 50-SMA level of 78.93 adds to the immediate downside filters, other than the stated channel’s support line near 78.95.
Even if the quote drops below 78.95, a convergence of the monthly support line and early June’s swing high could test the pair sellers around 78.40.
Alternatively, 79.10 and the aforementioned channel’s upper line, near 79.45 could challenge USD/INR buyers on their way to refreshing the record high with the 80.00 threshold.
USD/INR: Four-hour chart
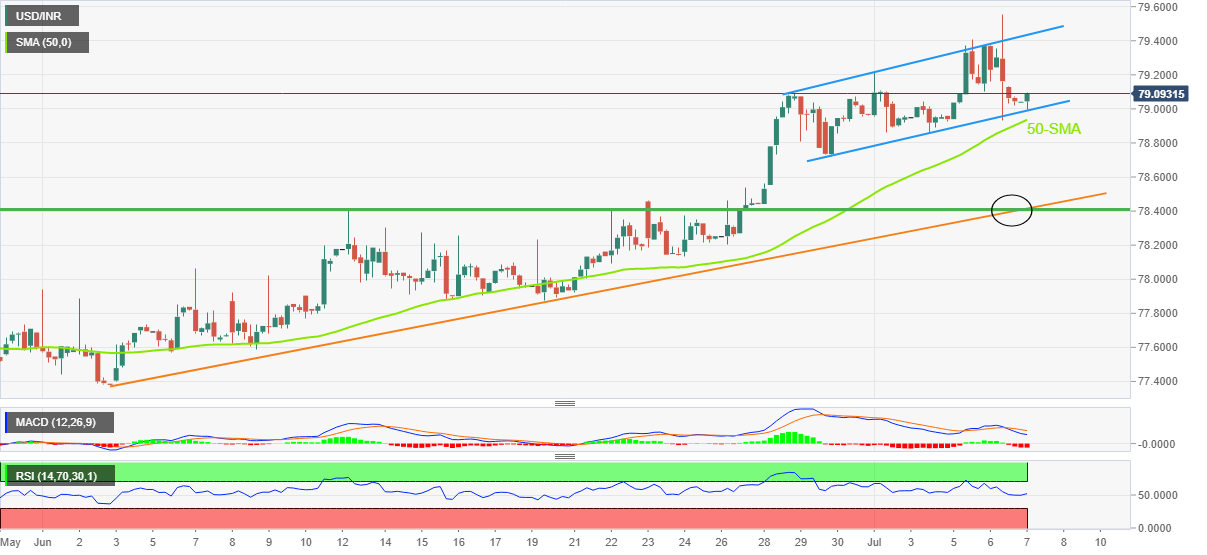
Trend: Bullish
- EUR/USD is attempting to extend its recovery above 1.0200 as investors expect a downbeat US NFP.
- A preliminary estimate for the US NFP is 270k, lower than the prior print of 390k.
- Stable Average Hourly Earnings in the US may hurt the paychecks of the households.
The EUR/USD pair has attracted some bids after sensing exhaustion signals near 1.01610. A dead cat bounce is supporting the shared currency bulls and now the same are attempting to extend their recovery above 1.0200. The asset has rebounded modestly as the US dollar index (DXY) is facing the corrective phase after printing a fresh 19-year high at 107.24 on Wednesday. The DXY has surrendered the critical support of 107.00.
The DXY witnessed decent attention on Wednesday after the release of the hawkish Federal Open Market Committee (FOMC) minutes. Only one FOMC member was not in support of announcing a 75 bps rate hike by the Federal Reserve (Fed). The guidance is also highly restrictive if price pressures persist for longer.
Going forward, the spotlight will remain on the US employment data. As per the market consensus, the US economy has flooded the job market with additions of 270k fresh jobs in June. The figure is lower than the prior release of 390k. The Unemployment Rate is seen unchanged at 3.6%. The catalyst which could hurt the market sentiment is the Average Hourly Earnings. The economic data may remain stable at 5.2%, however, the inflation rate has climbed to 8.6%. This will hurt the paychecks of the households further and eventually will dampen the overall demand.
On the eurozone front, recession fears are hurting the shared currency bulls on a broader note. The gas supply tensions between Europe and the UK economy are haunting the shared currency bulls. The UK administration announced that the economy will stop supplying gas to mainland Europe if it hits shortages in the coming months.
According to the latest Reuters poll of foreign exchange analysts, the US dollar is likely to extend its bullish momentum for at least the next three months, in the face of aggressive Fed rate hike expectations and demand for safe-haven assets.
Key takeaways
A three-quarters majority of analysts, 37 of 48, in a separate question from the July 1-6 Reuters FX poll expect that trend to continue for at least another three months.
Of those, 19 said three to six months, 10 said six to 12 months, four said at least a year and four said at least two years. Only 11 respondents said less than three months.
The median forecast from the latest poll of nearly 70 analysts doggedly clings to a long-held view that the dollar will weaken in the coming 12 months.
The euro is forecast to gain nearly 8.0% to around $1.10 by mid-2023.
Sterling is expected to regain around half of its lost ground in 2022 over the next year as the Bank of England looks set to continue raising interest rates.
While China's tightly controlled yuan, the Indian rupee and the Malaysian ringgit were predicted to trade around where they are now over the next three to six months, the Russian rouble and Turkey's lira were expected to fall.
Also read: BOJ to raise inflation view for fiscal 2022 to above 2% - Jiji
Despite the speculation of a likely lockdown to be imposed on Shanghai city, risk sentiment appears to be in a better spot in Thursday’s Asian trading. Markets see a fresh lockdown in China’s financial hub coming up soon, as the city reports a big jump in new coronavirus cases on Thursday.
Shanghai Health Commission announced that the city reported 32 locally transmitted confirmed cases and 11 imported confirmed cases.
developing story ....
- A short-term volatility contraction looks likely on a descending triangle formation.
- An establishment above the 50-period EMA will strengthen the aussie bulls.
- The RSI (14) is oscillating in a 40.00-60.00 that indicates a consolidation ahead.
The AUD/USD pair is scaling firmly higher after oscillating in a range of 0.6764-0.6787 in early Tokyo. The asset has rebounded strongly after defending its weekly lows at 0.6766. A responsive buying action has pushed the asset above the critical hurdle of 0.6800.
On an hourly scale, the aussie bulls have attracted significant bids after multiple tests of the crucial support placed from the July 1 low at 0.6766. The formation of the Descending Triangle is hinting for a consolidation going forward. The downward-sloping trendline of the aforementioned chart pattern is plotted from June 16 high at 0.7070.
The asset has crossed the 20-period Exponential Moving Average (EMA) at 0.6789 and is now attempting to sustain above the 50-period EMA, which is trading at 0.6802.
Meanwhile, the Relative Strength Index (RSI) (14) is oscillating in the 40.00-60.00 range, which indicates a consolidation ahead.
The context is still not bullish on a broader note. Therefore, investors should wait for a violation of Tuesday’s high at 0.6896 to initiate fresh longs. An occurrence of the same will drive the asset towards June 30 high at 0.6920, followed by June 28 high at 0.6965.
On the flip side, the greenback bulls could regain strength if the asset drops below July 1 low at 0.6766, which will drag the asset towards the 29 May 2020 high at 0.6683. A breach of the latter will drag the asset towards the 30 April 2020 high at 0.6570.
AUD/USD hourly chart
-637927586725126449.png)
| Raw materials | Closed | Change, % |
|---|---|---|
| Brent | 102.41 | -4.87 |
| Silver | 19.201 | -0.32 |
| Gold | 1739 | -1.58 |
| Palladium | 1909.32 | -0.84 |
- USD/JPY fades bounce off intraday low during the first daily fall in four days.
- US Treasury bond yields recover as China’s covid conditions worse, recession fears escalate.
- BOJ is expected to revise inflation forecasts to the north.
- Second-tier Japan data, US ADP Employment Change could direct intraday moves, risk catalysts are the key.
USD/JPY snaps a three-day uptrend, retreating to 135.70 during Thursday’s Asian session. The yen pair’s latest weakness could be linked to the pullback in the US Treasury yields, as well as hawkish hopes from the Bank of Japan (BOJ) amid a sluggish session. However, fears of recession and covid woes in China keep underpinning the US dollar’s safe-haven demand.
That said, Shanghai recently reported a big jump in the daily covid cases to 32 locally transmitted confirmed cases. The same propels lockdown fears, previously propelled by China’s order of mass testing.
Elsewhere, the Bank of Japan (BOJ) is expected to revise its inflation forecast to the north, which in turn teases the central bank hawks. However, the BOJ turned down any such moves by reiterating its commitment to easy money policies. It should be noted that the Japanese media mentioned that the BOJ is likely to consider lowering its GDP forecast for fiscal 2022.
On a broader front, the yield curve inversion, a condition where near-term bond yields are higher than the longer-dated ones, appears to highlight the recession fears. That said, the 2-year bond coupon retreats to 2.96% while showing the inverse gap with the 10-year yields and hints at the global recession. On the same line, International Monetary Fund (IMF) Managing Director Kristalina Georgieva also said, per Reuters, “Global economic outlook has 'darkened significantly' since last economic update.” the IMF chief also added, “Cannot rule out the possible global recession in 2023.”
It should be noted that the softer US data could be linked to the recently easy US Dollar Index (DXY), down 0.10% around 107.00. The greenback gauge jumped to the highest in 20 years the previous day amid the market’s rush to risk safety. US ISM Services PMI for June dropped to 55.3 versus 55.9 in May. The actual figure, however, came in better than the market expectation of 54.5. It’s worth noting that the US JOLTS Job Opening for May declined to 11.25 million versus 11.00 million expected and 11.68 million prior.
Amid these plays, the US Treasury yields fade the previous day’s recovery from the monthly low whereas the S&P 500 Futures drop 0.20% by the press time.
To sum up, Japan’s preliminary readings of the Coincident Index and Leading Economic Index for June may entertain USD/JPY traders ahead of the US ADP Employment Change for June, expected 200K versus 128K prior. However, major attention will be given to the risk catalysts and yields for clear directions.
Technical analysis
A successful rebound from the two-week-old support line, around 135.00, keeps USD/JPY buyers hopeful of refreshing the multi-year high, currently around 137.00.
According to Jiji Press, the Bank of Japan (BOJ) is seen raising Japan’s view on inflation for fiscal 2022/23 to above the central bank price target of 2%.
more to come ...
- EUR/GBP is rising in the Asian session and eyes are on a break of 0.8550.
- UK politics and economics are weighing on the pound.
EUR/GBP is higher by some 0.9% at the time of writing to trade at 0.8544 with the pound being hampered by troubles at Number 10 Downing Street. A slew of scandals has begged the question as to whether British prime minister Boris Johnson’s term is going to come to an abrupt end.
Two parliamentary by-election losses proved Boris Johnson's unpopularity. Now, an avalanche of resignations from various government members has left Johnson struggling for political survival. Nevertheless, the pound has held up reasonably well so far this week. Against the US dollar, the pound has managed to hold on to the 1.1900s for the most part but is failing to convince in the Tokyo session, with any advancements quickly met by sellers below 1.1930. This is helping EUR/GBP higher as the US dollar gives back a little ground to its peers in Asia.
Meanwhile, the economic conditions in the Uk are dire. Analysts at Rabobank explained that, arguably, the challenges facing policymakers in the UK are among the most complex in the developed world. ''UK CPI inflation has not yet peaked, and labour market strife indicates that higher inflation expectations may be already entrenched. However, UK consumer confidence has plunged, and, more recently, measures of business sentiment have also started to dive.''
Additionally, the analysts said, ''if expectations regarding BoE policy moves do not keep step with the hawkish guidance of the Federal Reserve, it can be argued there is a risk that GBP could weaken further. Yet, GBP is also proving sensitive to fears regarding growth. We see the risk of dips to GBP/USD1.18 on a 3-month view. We expect EUR/GBP to end the year at 0.88.''
- AUD/JPY remains pressured towards five-month-old support line despite upbeat Aussie data.
- Bearish MACD signals, sustained trading below 50-DMA keeps sellers hopeful.
- Monthly resistance line adds to the upside filters.
AUD/JPY fails to justify upbeat Australia trade statistics for May as it keeps flirting with the short-term key support near 92.00 during Thursday’s Asian session.
That said, Australia’s Trade Balance rose to 15,965M in May versus 10,725M expected and 10,495M prior. Further details reveal that Exports rose 9.5% from 5.0% prior and Imports grew 5.8% compared to the previous contraction of 0.8%.
The reason for the AUD/JPY pair’s weakness could be linked to its sustained downside break of the 50-DMA, as well as bearish MACD signals and a descending RSI (14), not oversold.
However, the sellers need validation from the aforementioned support line from late January, at 91.90 by the press time.
Following that, a mid-May swing high near 91.20 could probe the AUD/JPY bears before directing them to the May month’s low of 87.30.
On the flip side, a successful break of the 50-DMA level of 92.50 becomes necessary for the pair before challenging the monthly resistance line, at 93.45 by the press time.
Even if the quote rises past 93.45, it needs to surpass April’s peak of 95.74 to please AUD/JPY bulls.
AUD/JPY: Daily chart
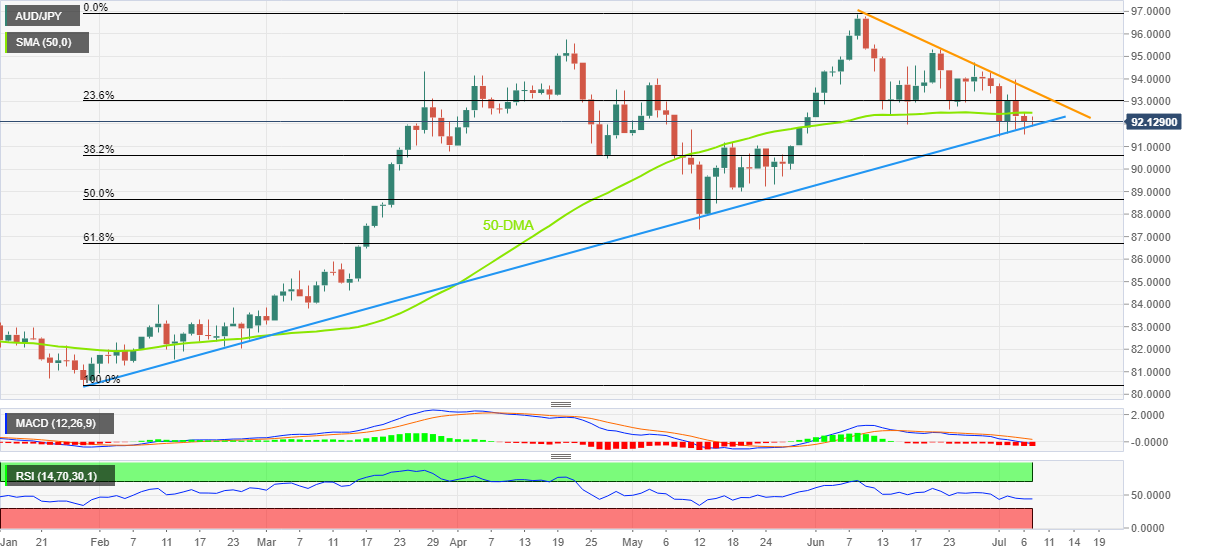
Trend: Further weakness expected
Citing a poll of economists, Yicai.com reported on Thursday that “the Chinese economy is likely to have expanded about 0.9% in Q2, and should set a 4.3% pace this year in a slow recovery from the disruptions caused by COVID-19 outbreaks.”
Key takeaways
Infrastructure investment, which could reach at least 6-8% in 2022, will be the main driver, followed by resilient exports and a marginal consumption rebound.
But unemployment and weak property investment would still slow down the recovery process.
Economists also raised their expectations for the yuan against the U.S. dollar to 6.68 by the end of July, compared with the 6.7114 reading on June 30.
Market reaction
USD/CNY remains better bid so far this Thursday’s Asian trading, as renewed covid concerns from China weigh on the domestic currency. The pair is currently trading at 6.7105, up 0.05% on the day.
- AUD/USD picks up bids to consolidate recent losses on upbeat Australia trade numbers.
- Aussie Trade Balance, Exports and Imports improved during May.
- Market sentiment dwindles as recession fears jostle with softer USD, pullback in yields.
- US ADP Employment Change, NFP could entertain traders, economic slowdown, central banks are the key catalysts.
AUD/USD picks up bids to refresh intraday high near 0.6790 on strong Australia trade numbers during Thursday’s Asian session. Also keeping buyers hopeful are headlines from China and softer US data. However, fears of recession and anxiety ahead of the key US data/events keep buyers in check.
Australia’s Trade Balance rose to 15,965M in May versus 10,725M expected and 10,495M prior. Further details reveal that Exports rose 9.5% from 5.0% prior and Imports grew 5.8% compared to the previous contraction of 0.8%.
The quote’s recovery could also be linked to news from China suggesting more efforts to boost the economic transition from the pandemic. Recently, China’s Commerce Ministry hints at taking measures to increase vehicle consumption.
It should be noted that the previous day’s softer US data could also be held responsible for challenging the AUD/USD sellers. That said, US ISM Services PMI for June dropped to 55.3 versus 55.9 in May. The actual figure, however, came in better than the market expectation of 54.5. It’s worth noting that the US JOLTS Job Opening for May declined to 11.25 million versus 11.00 million expected and 11.68 million prior.
Even so, fears of virus-led lockdowns, due to the recent mass testing, join the global recession woes to weigh on the AUD/USD prices. The 2-year US Treasury bond coupon retreats to 2.96% but shows the inverse gap with the 10-year bond yields, which in turn portrays the global recession fears. International Monetary Fund (IMF) Managing Director Kristalina Georgieva also said, per Reuters, “Global economic outlook has 'darkened significantly' since last economic update.” the IMF chief also added, “Cannot rule out the possible global recession in 2023.”
Also, the Federal Open Market Committee (FOMC) Minutes favored the Fed hawks and keep the AUD/USD bulls at bay. From the latest monetary policy meeting minutes, the Fed policymakers appear determined to announce another 75 basis points (bps) of a rate hike. That said, the latest Fed Minutes highlighted the need for the “restrictive stance of policy” while also saying, “even more restrictive stance could be appropriate if elevated inflation pressures were to persist”.
Having witnessed the initial reaction to the domestic data, AUD/USD traders may pay attention to the risk catalysts for fresh impulse. Though, major attention will be given to the US ADP Employment Change for June, expected 200K versus 128K prior, as it becomes the early signal for Friday’s Nonfarm Payrolls (NFP).
Also read: ADP Net Employment Change June Preview: Can employment stave off a recession?
Technical analysis
A downward slopping trend line from January, around 0.6750 by the press time, restricts immediate AUD/USD downside ahead of the late 2019 low near 0.6670. However, recovery remains elusive unless crossing the previous support line from May, close to 0.6865 at the latest.
Australia's Trade Balance has been released by the Australian Bureau of Statistics as follows:
- Australia May balance goods/svcs A$+15,965 mln, s/adj (Reuters poll: A$+10,725 mln).
- Australia May goods/services exports +9 .5pct m/m, seasonally adjusted.
- Australia May goods/services imports +5.8 pct m/m, seasonally adjusted.
AUD/USD update
The data has failed to move the needle in forex by any significant margin, although it has put a 6 pip bid into AUD/USD so far which is sticking within a familiar range, trading around 0.21% at 0.6790.
About the Aussie Trade Balance
The trade balance released by the Australian Bureau of Statistics is the difference in the value of its imports and exports of Australian goods. Export data can give an important reflection of Australian growth, while imports provide an indication of domestic demand. Trade Balance gives an early indication of the net export performance. If a steady demand in exchange for Australian exports is seen, that would turn into a positive growth in the trade balance, and that should be positive for the AUD.
In recent trade today, the People’s Bank of China (PBOC) set the yuan (CNY) at 6.7143 vs the previous fix of 6.7246 and the prior close of 6.7068.
About the fix
China maintains strict control of the yuan’s rate on the mainland.
The onshore yuan (CNY) differs from the offshore one (CNH) in trading restrictions, this last one is not as tightly controlled.
Each morning, the People’s Bank of China (PBOC) sets a so-called daily midpoint fix, based on the yuan’s previous day's closing level and quotations taken from the inter-bank dealer.
- Gold Price portrays a corrective pullback from the lowest levels since September 2021.
- Oversold RSI favors recovery moves targeteeing 78.6% Fibonacci Retracement level.
- Fears of global economic slowdown, hawkish Fed bets weigh on the prices but a lack of catalysts triggers rebound.
- US ADP Employment Change, ECB Minutes will be crucial for intraday directions, NFP is the key.
Gold Price (XAU/USD) consolidates the recent losses around a 10-month low, picking up bids near $1,742 during Thursday’s Asian session.
The yellow metal’s recent rebound could be linked to the lack of major data/events during the Asian session, as well as the trader’s anxiety ahead of today’s ECB Monetary Policy Meeting Accounts (mostly known as ECB Minutes), as well as the US ADP Employment Change for June, expected 200K versus 128K prior.
Also likely to have favored the XAU/USD could be the US Treasury yields as they reverse the previous day’s recovery from a five-week low. That said, the US 10-year Treasury yields declined one basis point (bp) to 2.90% by the press time.
It’s worth noting that the 2-year bond coupon retreats to 2.96% while showing the inverse gap between the 10-year and 2-year yields, which in turn hints at the global recession fears. International Monetary Fund (IMF) Managing Director Kristalina Georgieva also said, per Reuters, “Global economic outlook has 'darkened significantly' since last economic update.” the IMF chief also added, “Cannot rule out the possible global recession in 2023.”
Additionally, softer US data could also be blamed for the gold’s latest rebound. US ISM Services PMI for June dropped to 55.3 versus 55.9 in May. The actual figure, however, came in better than the market expectation of 54.5. It’s worth noting that the US JOLTS Job Opening for May declined to 11.25 million versus 11.00 million expected and 11.68 million prior.
However, the Federal Open Market Committee (FOMC) Minutes favored the Fed hawks as the Fed policymakers appear determined to announce another 75 basis points (bps) of a rate hike. That said, the latest Fed Minutes highlighted the need for the “restrictive stance of policy” while also saying, “even more restrictive stance could be appropriate if elevated inflation pressures were to persist”.
Amid these plays, the Wall Street benchmarks closed with mild gains whereas the S&P 500 Futures print mild losses at around 3,850 by the press time.
Moving on, gold traders should pay attention to the monthly print of the US ADP Employment Change for June, expected 200K versus 128K prior, as it becomes the early signal for Friday’s Nonfarm Payrolls (NFP). Additionally important will be the recession signals and other second-tier US data, like weekly jobless claims and monthly trade numbers.
Technical analysis
Gold Price justifies oversold RSI (14) to portray a corrective pullback towards the 78.6% Fibonacci retracement of August 2021 to March 2022 upside, near $1,753.
It should be noted, however, that the XAU/USD upside past $1,753, could challenge the previously key horizontal support from late 2021, now resistance around $1,780-85. Following that, a convergence of the 21-DMA and a downward sloping resistance line from April 14, near $1,817, will be important to watch.
Alternatively, a horizontal area comprising lows marked since August 2021, near $1,720, restricts the immediate downside of the Gold Price.
Should the quote remains below $1,720, the odds of its slump to the late 2021 low surrounding $1,687 can’t be ruled out.
Gold: Daily chart
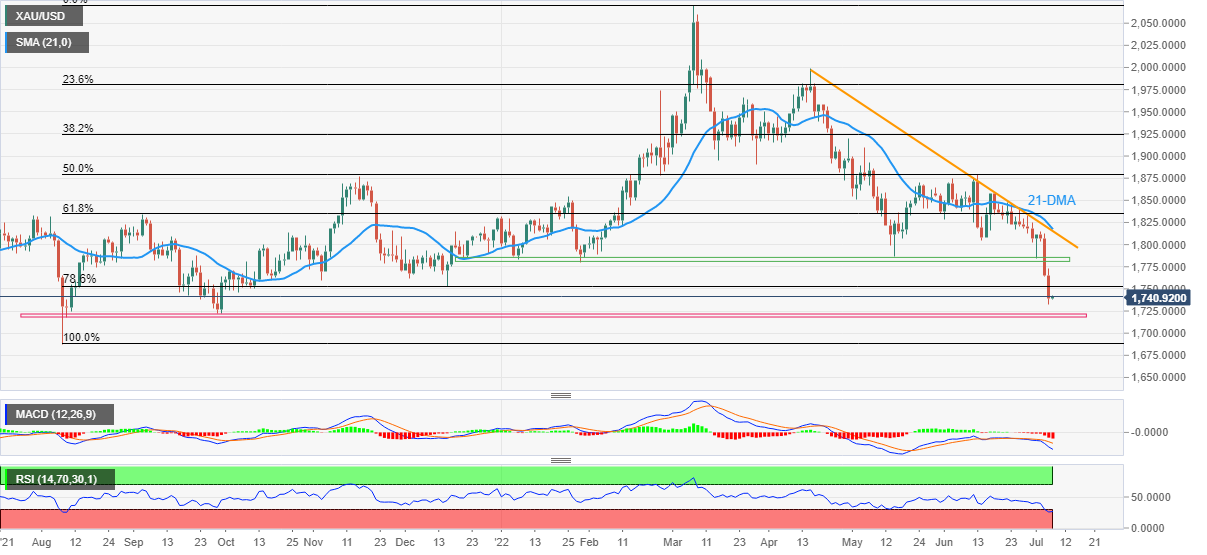
Trend: Further recovery expected
- EUR/JPY is attempting to hold itself above 138.00 after a rebound from 137.27.
- The shared currency bulls are worried over the gas supply tensions between the UK and Europe.
- The BOJ is worried over the muted wage-price hike as it may restrict the inflation rate.
The EUR/JPY pair is displaying a lackluster performance in the Tokyo session. The cross is trading back and forth in a narrow range of 138.26-138.60 after a rebound from Wednesday’s low at 137.27. On a broader note, the asset is in the grip of bears. The pair is declining over the past week after failing to cross the four-week-old resistance at 144.00.
The odds of a recession situation in the eurozone are accelerating firmly after the pessimist statement from the Bank of England (BOE) on the global outlook. The BOE believes that volatility in the oil and raw-material prices may bring economic shocks in the future. A gloomy outlook by a Western central bank is itself a negative for the FX domain. No doubt, the impact of the economic shocks will have adverse effects on the eurozone too as it has prohibited oil from Russia.
Apart from the recession fears, the gas supply tensions between Europe and the UK economy are haunting the shared currency bulls. The UK administration announced that the economy will stop supplying gas to mainland Europe if it hits shortages in the coming months.
On the Tokyo front, the Bank of Japan (BOJ) is worried about the underperformance of the wage-price concept. The BOJ believes that wage prices are needed to be hiked in order to keep the inflation rate near the desired levels. Otherwise, the households will face the heat of higher price pressures and aggregate demand will tumble quantity-wise.
- GBP/USD bulls have moved in for the kill in the Tokyo open.
- There is a bullish bias so long as the price can stay above 1.1890.
GBP/USD has been propped up in the Tokyo open despite the bearish run for the start of the month that has taken the pair to the edge of the abyss at 1.1900 the figure. GBP/USD was as low as 1.1876, its lowest point in the past 52 weeks, down 4.85% for the month and 1.62% for the week. However, the bulls are stepping in at this juncture and there is a bullish bias for the day ahead.
GBP/USD H1 chart
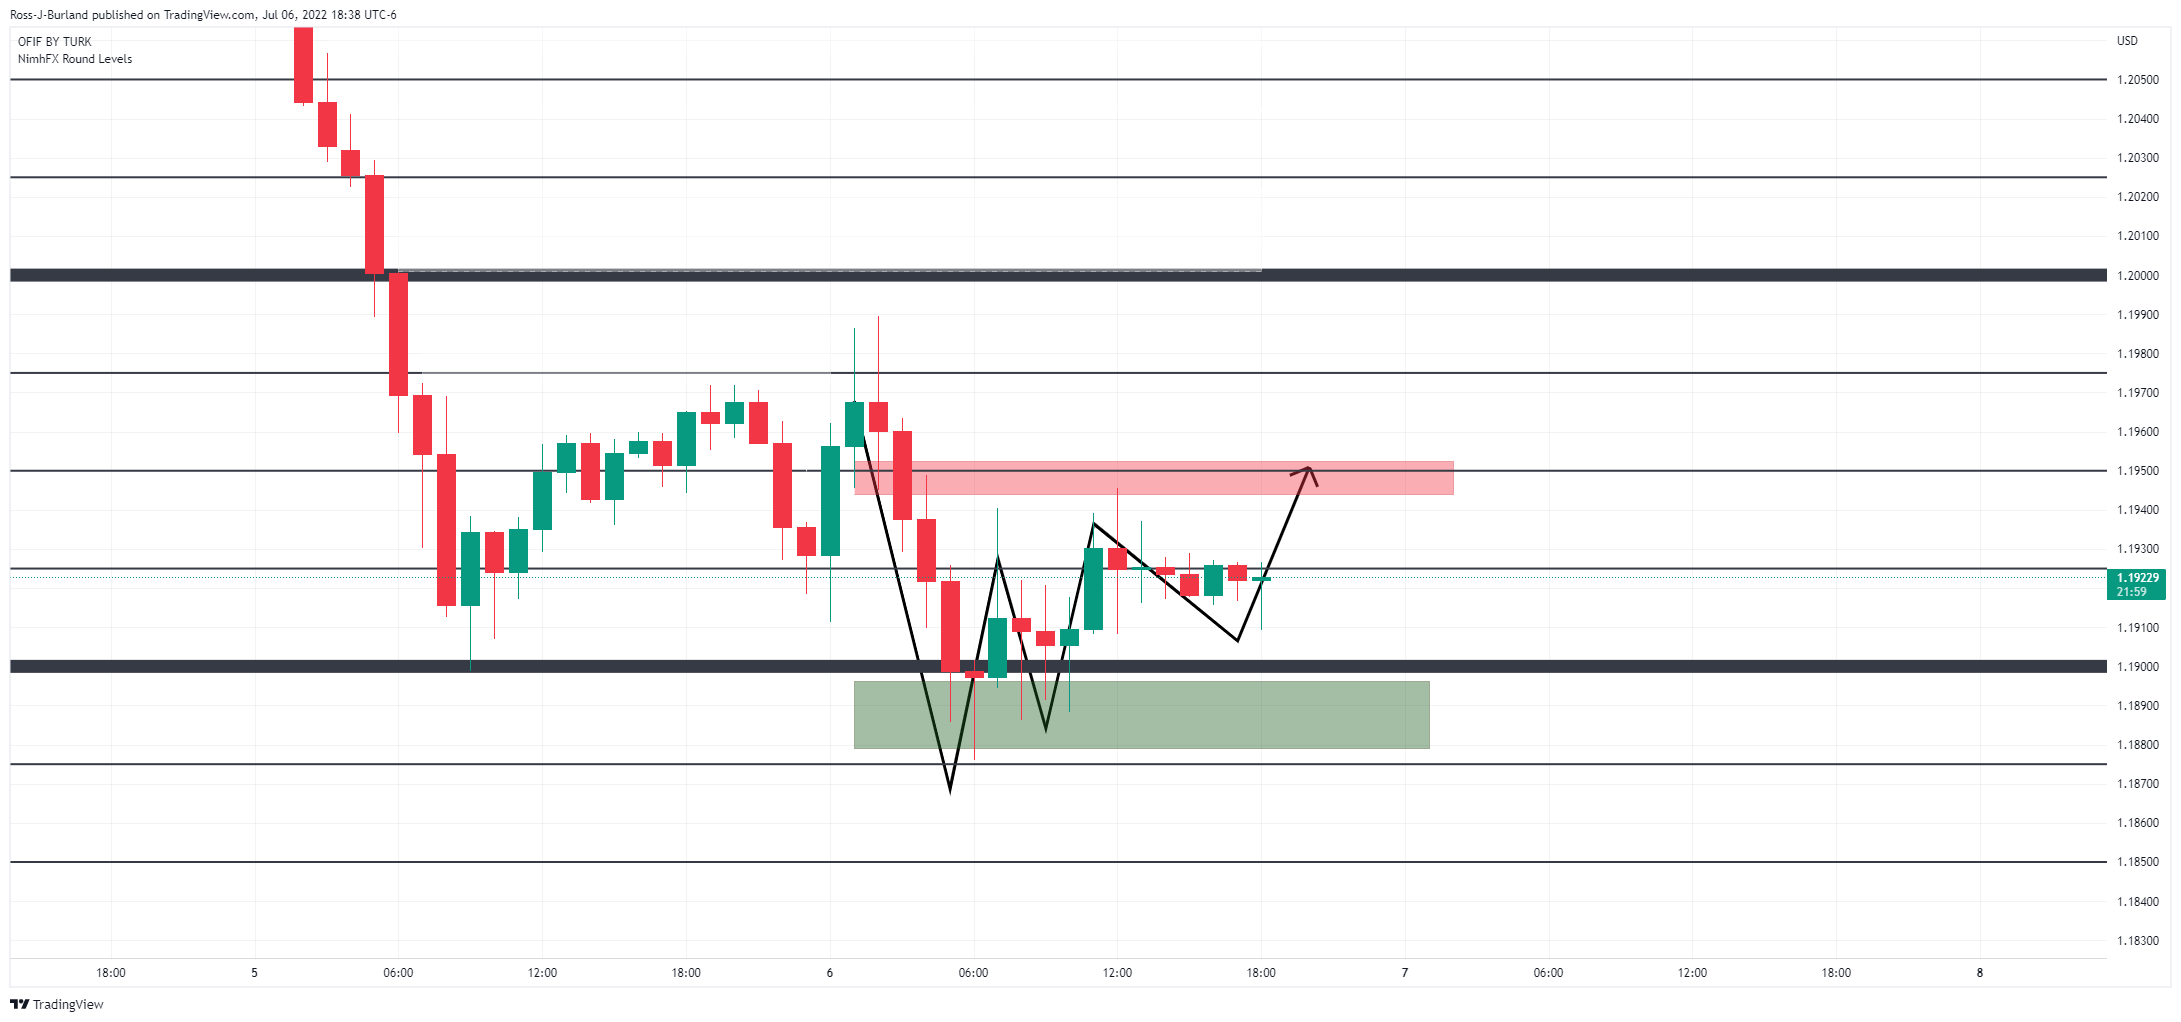
The double bottom at the round number is a peak formation and a failure by the bears to keep control below 1.1900. The W-formation is a reversion pattern and the price has already been supported by the neckline which makes for a bullish thesis for the sessions ahead. A trip back below 1.1890, however, would nullify the bullish outlook for the day ahead.
- USD/CHF struggles to extend four-day uptrend inside a short-term bullish chart pattern.
- Successful break of 200-SMA keeps buyers hopeful but RSI conditions hint at a pullback.
- Recovery remains elusive unless crossing 0.9780 hurdle, sellers could wait for 0.9630 break.
USD/CHF buyers flirt with the 0.9700 threshold inside a one-week-old bullish channel during Thursday’s Asian session.
In doing so, the Swiss currency (CHF) pair takes rounds to the three-week high, also snapping a four-day uptrend inside, amid overbought RSI conditions.
Given the quote’s latest pullback from the stated channel’s resistance, backed by the oversold RSI, the USD/CHF prices may decline further. However, the 200-SMA support near 0.9670 could offer a strong challenge to the sellers.
Even if the pair drops below 0.9670, it needs to defy the bullish channel by breaking the 0.9630 support to convince the bears.
Following that, a south-run towards the monthly low of 0.9495 can’t be ruled out.
Alternatively, the upper line of the aforementioned channel, near 0.9740, could challenge the immediate USD/CHF advances ahead of the 50% Fibonacci retracement of its downturn from mid-May, around 0.9780.
In a case where the pair rises past 0.9780, the 0.9820 level may act as a buffer during the run-up targeting the 61.8% Fibonacci retracement level of 0.9846 and mid-June swing low around 0.9875.
USD/CHF: Four-hour chart
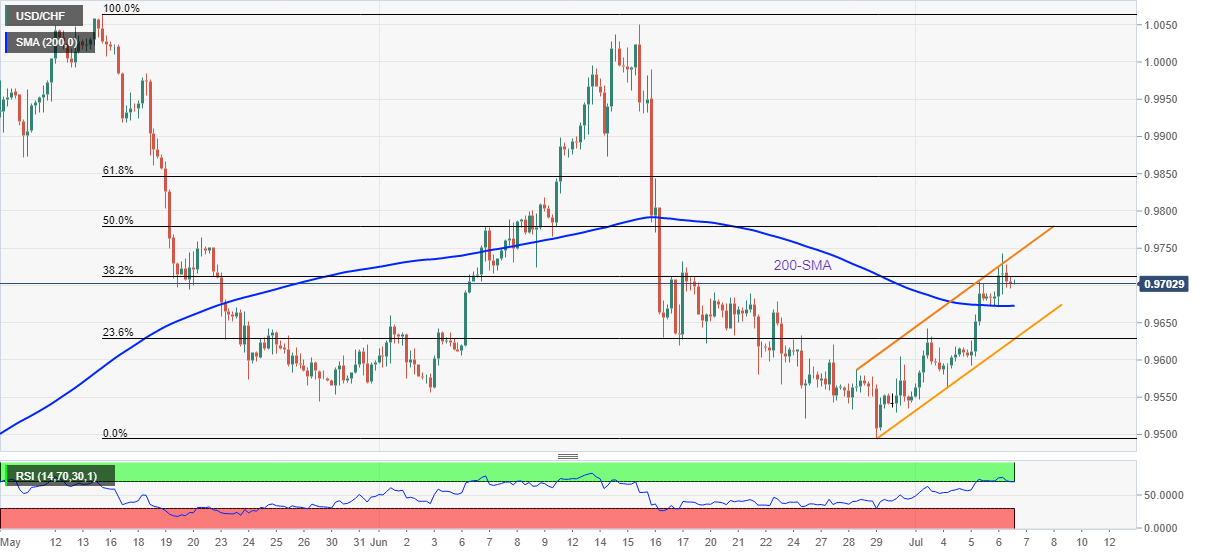
Trend: Pullback expected
- AUD/JPY has surrendered the crucial support of 92.00 as lockdown fears in China escalate.
- Western central banks are set for another leg of raising interest rates this month.
- In today’s session, Aussie Trade Balance data will be of utmost importance.
The AUD/JPY pair has witnessed a steep fall while attempting to recapture Wednesday’s high at 92.50. The risk barometer has faced significant offers in the opening session of Tokyo and downside potential remains favored amid the souring market mood.
Recession fears are escalating further as Western central banks have moved to another leg of raising interest rates at a bumper rate. In relation to that, the Reserve Bank of Australia (RBA) has already announced a consecutive rate hike by 50 basis points (bps) on Tuesday.
RBA Governor Philip Lowe has elevated its Official Cash Rate (OCR) to 1.35% and the guidance is still hawkish. The increments in policy tightening measures by the RBA dictate that the central bank is focused on bringing price stability sooner.
Meanwhile, the resurgence of Covid-19 in China has spooked the market sentiment. A back-to-back resurgence of the coronavirus in China is hurting their economic activities and eventually the operations with their trading partners. It is worth noting that Australia is a leading exporter to China and a halt in Chinese economic activities also affects the antipodean.
Going forward, the release of the Aussie Trade Balance data will be of significant importance. As per the market consensus, the economic data is seen at 10,725M, higher than the prior print of 10,495M.
On the Tokyo front, yen bulls have strengthened on rising expectations for higher price pressures. Seisaku Kameda, a former chief economist at the Bank of Japan (BOJ) on Tuesday said that the sharp decline in the yen on a broader note will lift the inflation outlook. The inflation rate may remain well above 2% this year.
EUR/USD struggles for clear directions while taking rounds to 1.0180-70 during Thursday’s Asian session, after bouncing off the lowest levels since late 2002 the previous day. The major currency pair’s latest inaction could be linked to the cautious mood of traders ahead of the key data/events, as well as options market signals.
That said, the daily risk reversal (RR) for the EUR/USD, the spread between the call options and the put options, eases to -0.055 by the end of Wednesday’s North American trading session.
It’s worth noting that the EUR/USD RR slumped the most on a day since June 13 during Monday.
Given the options market player’s indecision, EUR/USD traders should wait for today’s ECB Monetary Policy Meeting Accounts (mostly known as ECB Minutes), as well as the US ADP Employment Change for June, expected 200K versus 128K prior, for clear directions.
Read: EUR/USD dribbles at multi-year low below 1.0200, ECB Minutes, US ADP Employment eyed
| Index | Change, points | Closed | Change, % |
|---|---|---|---|
| NIKKEI 225 | -315.82 | 26107.65 | -1.2 |
| Hang Seng | -266.41 | 21586.66 | -1.22 |
| KOSPI | -49.77 | 2292.01 | -2.13 |
| ASX 200 | -34.8 | 6594.5 | -0.52 |
| FTSE 100 | 82.27 | 7107.77 | 1.17 |
| DAX | 193.32 | 12594.52 | 1.56 |
| CAC 40 | 117.42 | 5912.38 | 2.03 |
| Dow Jones | 69.86 | 31037.68 | 0.23 |
| S&P 500 | 13.69 | 3845.08 | 0.36 |
| NASDAQ Composite | 39.61 | 11361.85 | 0.35 |
- USD/JPY bears have forced the bulls back below 136.00.
- Price remains capped below a 68.2% daily Fibo.
USD/JPY is bearish on the daily and lower time frames and has been sent off a cliff in the Tokyo open. The following illustrates the bearish bias and prospects of a move into 135.50 for the session ahead.
USD/JPY daily chart
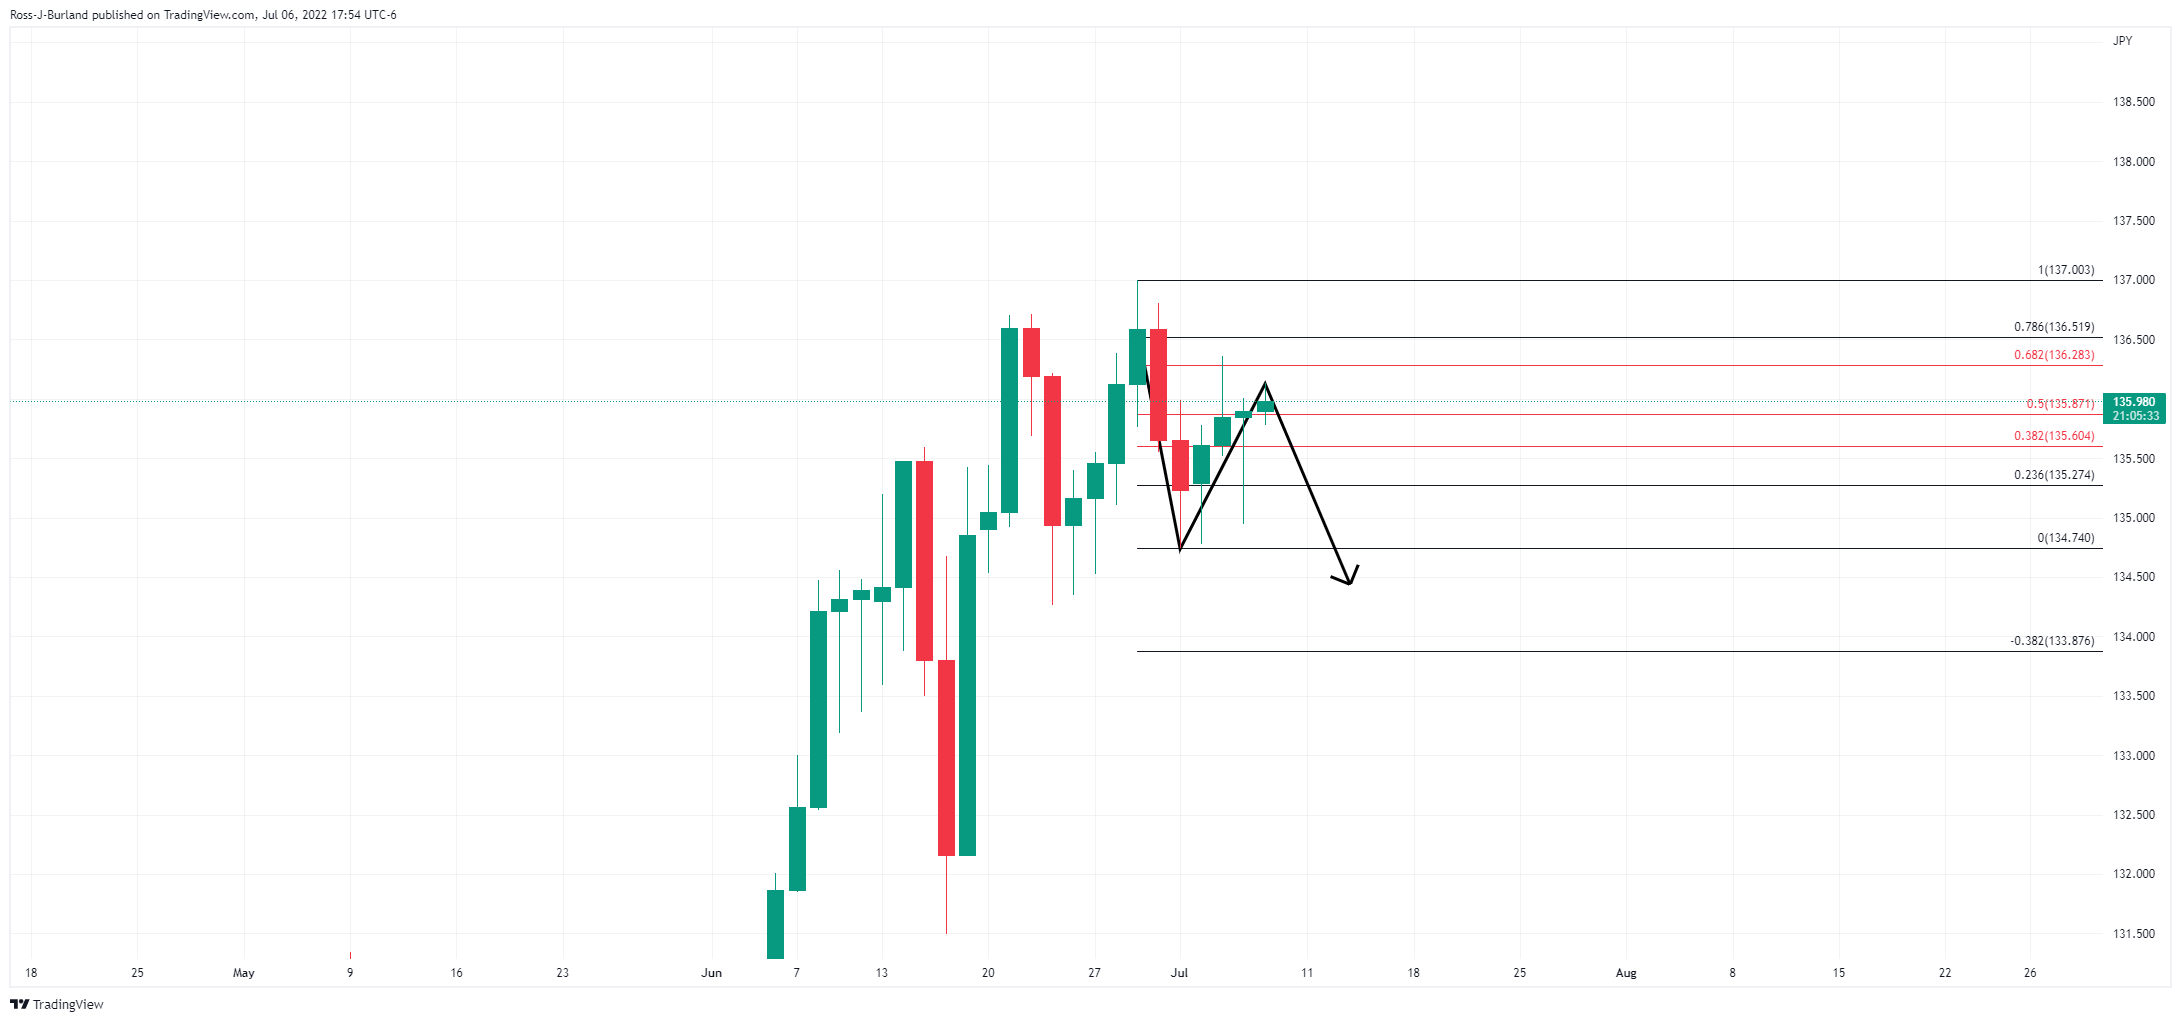
USD/JPY H1 chart
The price has made three pushes to the upside but from an hourly perspective, but the price has failed through the 136.00 and was rapidly shot down by the bears in the open. The hourly candle has all of the makings for a strong bearish close which will break the horizontal structure and leave prospects of a red day on the table.
- Silver fades the previous day’s corrective pullback from two-year low.
- Doji candlestick above February 2020 high, oversold RSI challenge sellers.
- Bulls need validation from previous support line from February.
Silver Price (XAG/USD) retreats to $19.16, fading the corrective pullback from a two-year low, during Thursday’s Asian session. In doing so, the bright metal struggles to justify the previous day’s Doji candlestick, as well as oversold RSI (14) conditions.
However, the quote’s further downside is likely to witness multiple hurdles as the highs marked during February and January 2020, respectively around $18.95 and $18.85, could challenge the XAG/USD bears.
Even if the quote drops past $18.85, the June 2020 peak of $18.39 and late 2019 high surrounding $18.33 could test the sellers before directing them to the late 2020 bottom near $16.95.
On the contrary, recovery moves need to cross the support-turned-resistance line surrounding $19.55 to tease silver buyers.
Following that, an eight-day-old resistance line near $19.75 and the $20.00 round figure could challenge the XAG/USD recovery.
Should the metal prices rally beyond $20.00, the 21-DMA level of $20.85 and the previous monthly peak near $22.50 are likely to gain the market’s attention.
To sum up, silver prices remain pressured near the multi-month low but the downside appears to have limited room to the south.
Silver: Daily chart
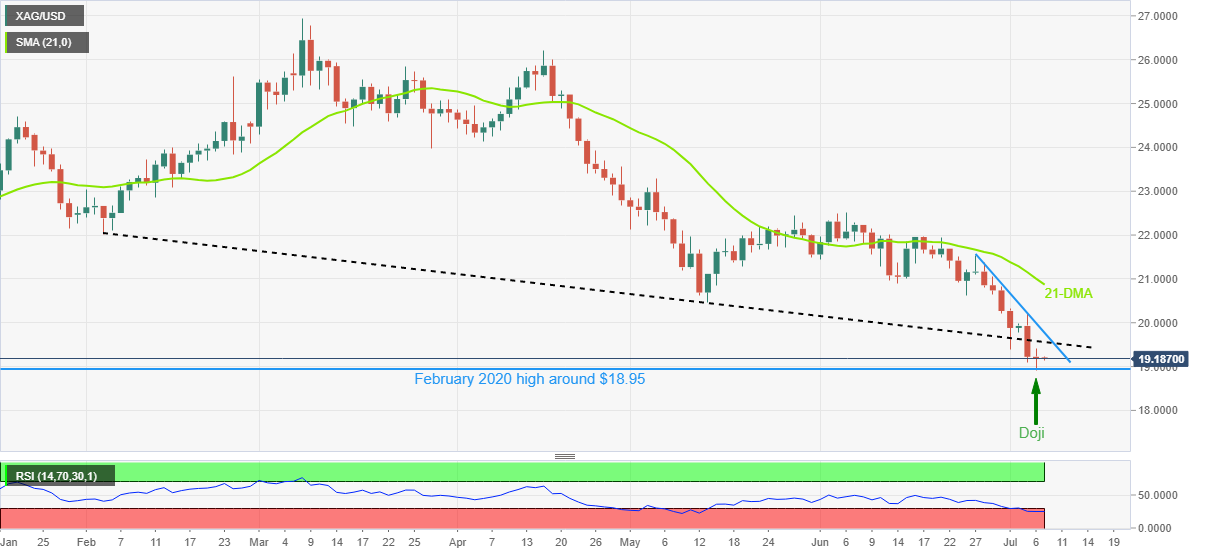
Trend: Limited downside expected
| Pare | Closed | Change, % |
|---|---|---|
| AUDUSD | 0.67813 | -0.32 |
| EURJPY | 138.393 | -0.79 |
| EURUSD | 1.01825 | -0.83 |
| GBPJPY | 161.962 | -0.27 |
| GBPUSD | 1.19137 | -0.35 |
| NZDUSD | 0.61457 | -0.43 |
| USDCAD | 1.30371 | 0.1 |
| USDCHF | 0.97007 | 0.18 |
| USDJPY | 135.925 | 0.06 |


© 2000-2026. Bản quyền Teletrade.
Trang web này được quản lý bởi Teletrade D.J. LLC 2351 LLC 2022 (Euro House, Richmond Hill Road, Kingstown, VC0100, St. Vincent and the Grenadines).
Thông tin trên trang web không phải là cơ sở để đưa ra quyết định đầu tư và chỉ được cung cấp cho mục đích làm quen.
Giao dịch trên thị trường tài chính (đặc biệt là giao dịch sử dụng các công cụ biên) mở ra những cơ hội lớn và tạo điều kiện cho các nhà đầu tư sẵn sàng mạo hiểm để thu lợi nhuận, tuy nhiên nó mang trong mình nguy cơ rủi ro khá cao. Chính vì vậy trước khi tiến hành giao dịch cần phải xem xét mọi mặt vấn đề chấp nhận tiến hành giao dịch cụ thể xét theo quan điểm của nguồn lực tài chính sẵn có và mức độ am hiểu thị trường tài chính.
Sử dụng thông tin: sử dụng toàn bộ hay riêng biệt các dữ liệu trên trang web của công ty TeleTrade như một nguồn cung cấp thông tin nhất định. Việc sử dụng tư liệu từ trang web cần kèm theo liên kết đến trang teletrade.vn. Việc tự động thu thập số liệu cũng như thông tin từ trang web TeleTrade đều không được phép.
Xin vui lòng liên hệ với pr@teletrade.global nếu có câu hỏi.
ngân hàng