Eurozone’s investor sentiment deteriorated sharply in July; the latest data published by the Sentix research group showed on Monday.
The gauge came in at -26.4 in July from -15.8 in May vs. -19.9 expected.
Australian Treasury bonds remain offered, keeping the yields firmer, heading into the key Reserve Bank of Australia (RBA) Interest Rate Decision during the early Asian session on Tuesday. In addition to the pre-RBA caution, the Aussie bond coupons appear to have tracked their Western counterparts while extending the week-start rebound from a one-month low.
That said, Australia’s benchmark 10-year Treasury bond yields take the bids to refresh intraday high around 3.609%, up 1.0% on a day, while stretching Monday’s rebound from the lowest levels since June 01.
It’s worth observing that the Aussie equities and the US stock futures are also on the front foot while portraying the market’s cautious optimism at the latest. That said, Australia’s key equity gauge ASX 200 rises 1.10% while the S&P 500 Futures rise 0.60% by the press time.
The mildly positive risk profile could be linked to the US holiday on Monday, as well as the chatters surrounding the US discussion on removing the Trump-era tariffs on China.
Elsewhere, an absence of impressive Aussie data could also be connected to the latest run-up in the Aussie bond coupons. Australia’s AiG Performance of Construction Index for June also eased to 46.2, below 50.4 prior, whereas S&P global Composite PMI and Services PMI confirmed the 52.6 initial forecasts for June.
Moving on, the RBA’s Rate Statement will be more important than the widely anticipated third rate hike, worth 50 basis points (bps), as fears of economic slowdown and fresh covid woes from China’s Anhui province challenge the hawks.
Also read: Reserve Bank of Australia Preview: Will a 50 bps rate hike rescue AUD bulls?
AUD/NZD portrays the market’s anxiety ahead of the key monetary policy decision from the Reserve Bank of Australia (RBA) during Tuesday’s Asian session. In doing so, the cross-currency pair pokes a two-week-old resistance line as buyers flirt with the 1.1065 level at the latest.
New Zealand’s quarterly release of the NZIER Business Confidence slumped to the lowest levels since March 2020, to -65% versus -40% expected, during the second quarter (Q2) of 2022.
On the other hand, Australia’s AiG Performance of Construction Index for June also eased to 46.2, below 50.4 prior, whereas S&P global Composite PMI and Services PMI confirmed the 52.6 initial forecasts for June.
It should be noted, however, that hopes of US President Joe Biden’s administration allowing China to get rid of Trump-era tariffs join the recently firmer market sentiment, mainly due to the US holiday, appears to have favored the AUD/NZD bulls of late. Furthermore, an absence of major data/events from New Zealand (NZ) joins hawkish hopes from the RBA to keep buyers hopeful.
That said, The Aussie central bank is up for announcing the third rate hike, expected worth 0.50%, as it struggles to tame inflation fears at home. However, the latest challenges to global economic growth could probe the RBA hawks and hence highlight the importance of today’s RBA Rate Statement.
Also read: Reserve Bank of Australia Preview: Will a 50 bps rate hike rescue AUD bulls?
AUD/NZD bulls attack a 13-day-old resistance line around 1.1070 while defending the week-start bounce of an upward sloping support line from late April, near 1.0960 by the press time.
WTI bulls flirt with $109.00, around $108.65-70 by the press time of Tuesday’s Asian session, after rising for the last two days.
In doing so, the black gold not only snaps the two-day uptrend but also dribbles below the short-term key hurdle surrounding $110.00, comprising the 50-DMA and a three-week-old descending trend line.
However, recently improving MACD and RSI join the energy benchmark’s recovery moves from an upward sloping support line from early April to keep the buyers hopeful.
That said, a clear upside break of the $110.00 hurdle appears necessary for the bulls to keep reins.
Following that, a run-up towards June’s peak of $121.35 can’t be ruled out. Though, $113.20 and $120.00 levels may offer intermediate halts during the anticipated rally.
On the flip side, the aforementioned support line from April, near $102.70 at the latest, appears a tough nut to crack for the WTI bears.
Should the quote drop below $102.70, the odds of its fall towards June’s low of $101.17 can't be ruled out.
However, the commodity’s downside past $101.17 hinges on the bear’s ability to conquer the $100.00 threshold.
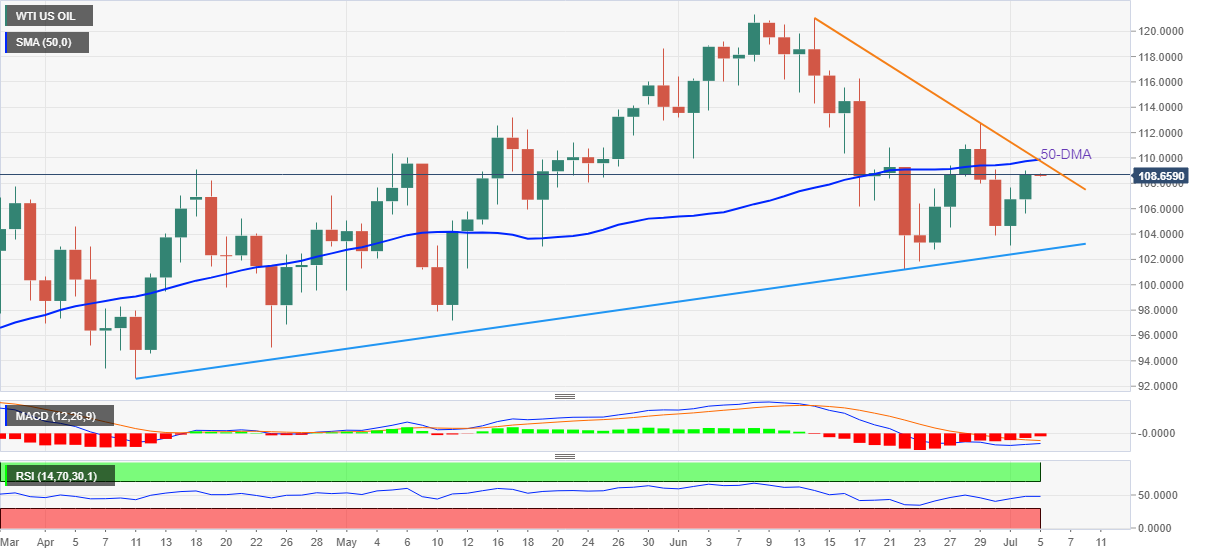
Trend: Further upside expected
The USD/CAD pair has witnessed a mild correction to near 1.2850 after facing barricades below 1.2900 in the New York session. The asset has remained in the grip of bears from Friday after failing to sustain above the critical hurdle of 1.2950. The major may correct further if it violates Monday’s low at 1.2837.
This week, the major event which will drive the FX domain is the release of the Federal Open Market Committee (FOMC) minutes on Wednesday. Investors community is aware of the fact that the Federal Reserve (Fed) elevated its interest rates by 75 basis points (bps) in its June monetary policy meeting. Prior to that, Fed chair Jerome Powell stated that the central bank doesn’t see rate elevation above 50 basis points (bps) at all.
By all means, Fed went beyond its statement and dictated a bumper rate hike. Therefore, it is necessary to get a detailed view of the ideology behind announcing a giant rate hike.
On the oil front, oil prices are heading to recapture their weekly high at $112.73 amid soaring fears of supply worries. Considering the prohibition of massive oil imports from Russia, it is understood that the oil market will remain tight for a prolonged period. Also, many OPEC members do not have the required infrastructure to accelerate the output except Saudi Arabia and UAE. And, these nations are already producing near to their maximum capacity.
This week, the employment data will be of utmost significance. The US economy will report the US Nonfarm Payrolls (NFP) at 270k for June, significantly lower than the former release of 390k. Also, the Canadian agencies are expected to report lower employment generation at 22.5k, lower than the prior release of 39.8k.
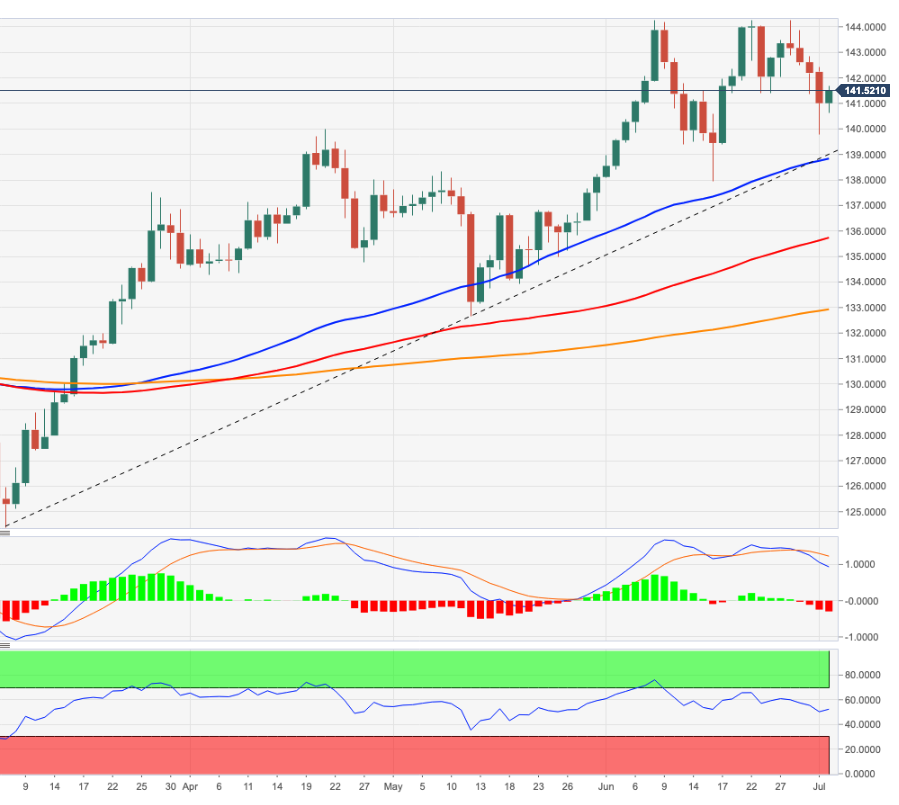
The EUR/JPY escalates as the Asian Pacific session gets underway on Tuesday. On Monday, the cross-currency pair seesawed in a 100-pip range between 140.60-141.60 during a peaceful trading session, courtesy of a bank holiday in the US. At the time of writing, the EUR/JPY is trading at 141.56, near the top of the abovementioned range.
Futures of Asian stocks prepare to open higher, carrying on Europe’s Monday session mood. Nevertheless, shifted mixed through the North American session, that albeit slow, witnessed a drop in the DAX 40 and the IBEX 35, European bourses.
Some reasons behind a fragile sentiment is the global economy’s slowing down and high inflationary pressures. Investors assess that high energy prices might get the Euro area into a recession, even before that in the States, as rumors that Russia will halt Natural gas flows ahead of the winter looms. That, alongside
The EUR/JPY daily chart is neutral-upward biased, partly for the 20-day EMA sitting above the exchange rate, just five pips shy of the 142.00 figure. EUR/JPY traders should note that albeit a bullish harami has formed, sellers begin to mount around 142.00, which might send the cross-currency pair tumbling toward the July 1 low at 139.80.
Therefore, the EUR/JPY first resistance would be 142.00. Break above, and the pair’s next resistance would be the confluence of the R2 daily pivot point and the June 30 high at 142.43.
On the flip side, the EUR/JPY first support would be 141.00. A breach of the latter exposes the 140.00 mark, followed by the July 1 daily low at 139.80.

NZD/USD sellers attack 0.6200, after a positive start to the week, on disappointing New Zealand (NZ) sentiment data, as well as the return of full markets, during Tuesday’s initial Asian session.
That said, NZIER Business Confidence slumped to the lowest levels since March 2020, to -65% versus -40% expected, during the second quarter (Q2) of 2022.
The NZ data also joins the return of risk-aversion amid the full markets, after the US holiday allowed bears to catch a breather the previous day.
It’s worth noting that the hopes of the US tariff relief to China and improvement in the Bund yields also underpinned the NZD/USD pair’s corrective pullback the previous day. However, the recession fears and China’s covid woes joined Russia’s claim of winning total control in Lysychansk, which appears to have probed the pair buyers.
Additionally favoring the Kiwi pair’s corrective pullback was news suggesting hawkish expectations from the Reserve Bank of New Zealand (RBNZ) amid bullish forecasts over dairy prices, as well as upbeat inflation woes.
Moving on, NZD/USD traders will pay attention to China’s Caixin Services PMI for June, expected 47.3 versus 41.4 prior, as well as risk catalysts, for intermediate directions ahead of the Reserve Bank of Australia’s (RBA) monetary policy decision. Given the hawkish hopes from the RBA, the quote may track AUD/USD moves on the widely anticipated 0.50% rate hike.
NZD/USD rebound needs to cross the one-month-old resistance line, around 0.6235 by the press time, to convince buyers. Until then, the downward trajectory towards refreshing the multi-month low marked the last week, near 0.6145, can’t be ruled out.
GBP/USD holds onto the previous day’s breakout of a weekly resistance despite taking rounds to 1.2100 during Tuesday’s initial Asian session. In doing so, the Cable pair teases an inverse Head and Shoulders (H&S) formation.
However, buyers need to cross the 1.2155 neckline hurdle to gain the market’s acceptance. Even so, the 200-HMA and the 61.8% Fibonacci retracement level of June 27 to July 01 downside, around 1.2200, appears a tough nut to crack for the bulls.
Given the steady RSI and the GBP/USD pair’s successful trading beyond the previous resistance line, now support around 1.2090, the bullish bias is likely to prevail.
That said, a sustained run-up beyond 1.2200 could open the door for the pair’s rally towards the theoretical target of the H&S confirmation, around 1.2350. Though, tops marked during June 27 and 16, respectively around 1.2330 and 1.2410, could act as additional filters to the north.
Meanwhile, pullback remains elusive until the quote stays beyond 1.2090 resistance-turned-support.
Following that, the 1.2000 psychological magnet can probe the GBP/USD bears before directing them to the latest swing low surrounding 1.1975 and the yearly bottom marked in June near 1.1933.
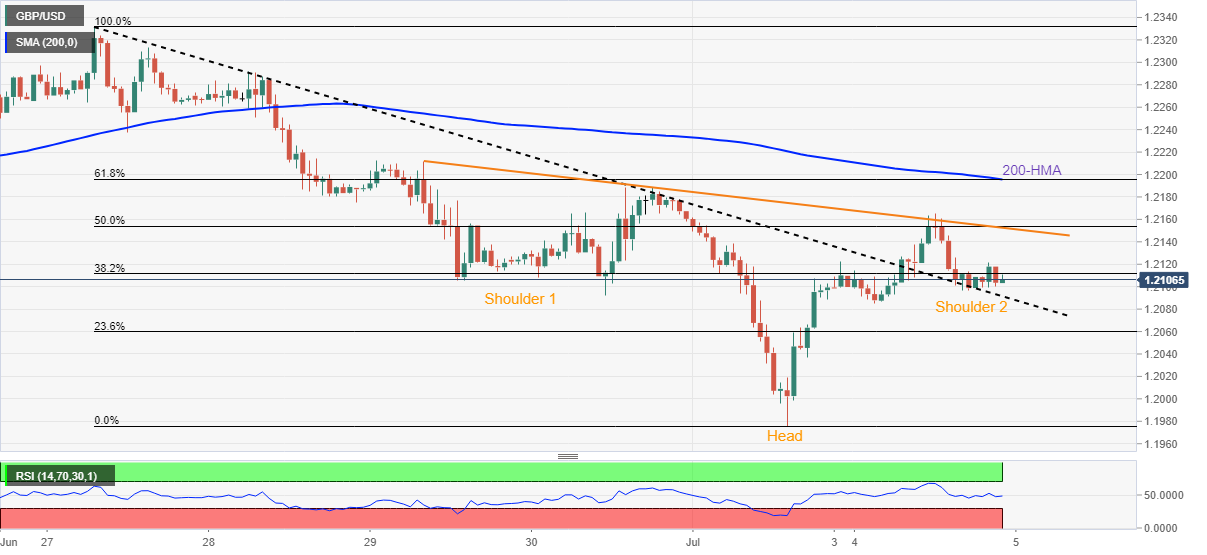
Trend: Further recovery expected
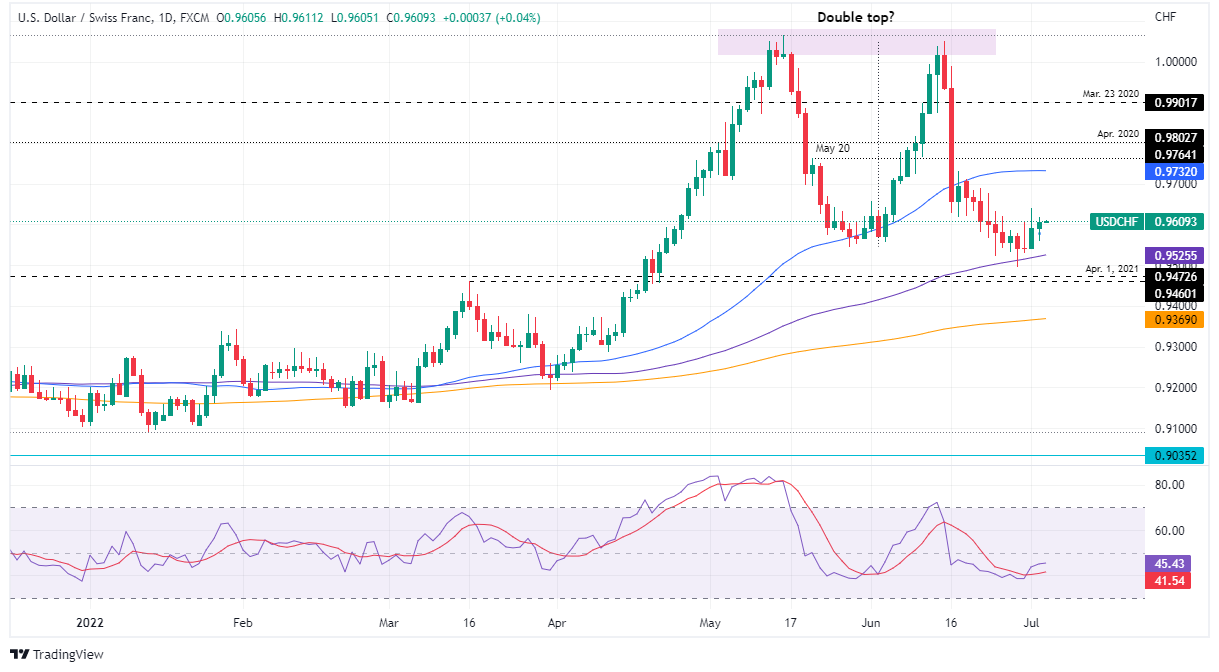
The USD/CHF is barely advancing as the Tuesday Asian session begins; after Monday’s calm session witnessed buyers overcoming sellers and the USD/CHF staying afloat above the 0.9600 mark. At the time of writing, the USD/CHF is trading at 0.9609.
Asian equity futures are set to open mixed on Tuesday’s session. The market narrative hasn’t changed, with high inflation and global economic slowdown, keeping investors uneasy. In the meantime, US President Joe Biden could announce a rolling back of some tariffs on China, as reported by Dow Jones.
In the meantime, the US Dollar Index, a gauge of the greenback’s value, edges up 0.07%, sitting at 105.193, a tailwind for the USD/CHF.
The USD/CHF is upward biased, despite the recent downtrend originated by the Swiss National Bank (SNB) hiking rates 0.50%, a headwind for the pair, which tumbled from the parity towards 0.9495. Since then, the USD/CHF has been staging a comeback and has broken resistance levels, like the May 27 swing low at 0.9544. the double top neckline, which opened the door to current price levels.
Oscillators aim higher, though within negative territory, but accelerate to the upside, as shown by the Relative Strenght Index (RSI).
Therefore, the USD/CHF first resistance would be the Jule 1 high at 0.9641, which, once broken, would expose the 0.9700. Break above will clear the way toward the 50-day moving average (DMA) at 0.9732.
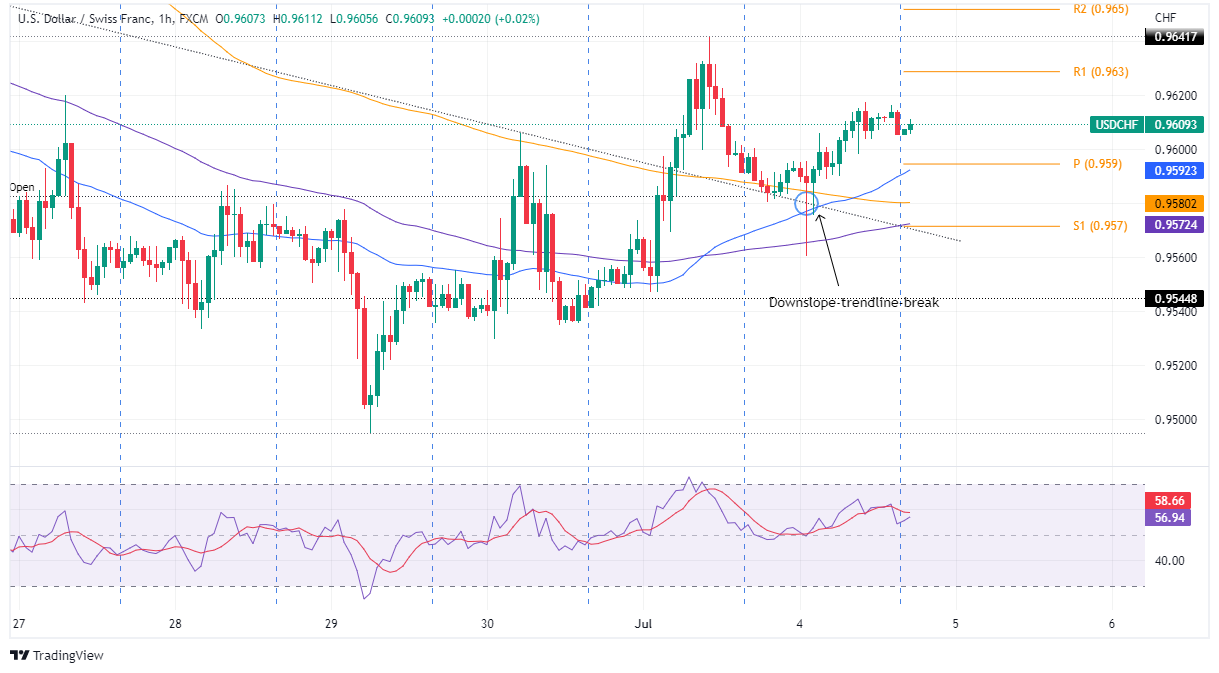
The USD/CHF has a clear pathway to the upside in the near term. The Relative Strenght Index (RSI) at bullish territory and price action above the simple moving averages (SMAs), and a break of a three-week-old downslope trendline around 0.9775 further cement the upward bias.
Hence, the USD/CHF first ceiling level will be the R1 daily pivot at 0.9630. A breach of the latter will expose the July 1 daily high at 0.9641, followed by the R2 daily pivot point at 0.9652.
The EUR/USD pair is hoping for a bullish ride after violating the minor hurdle of 1.0430 as investors are expecting a rate hike announcement by the European Central Bank (ECB) in its July monetary policy. On Monday, the asset displayed a corrective action after hitting a high of 1.0463.
The odds of a rate hike by the ECB are soaring as escalating price pressures are compelling to halt the accommodative stance and turn to policy tightening measures aggressively. Last week, the eurozone Harmonized Index of Consumer Prices (HICP) landed at 8.6%, higher than estimates of 8.4% and the prior print of 8.1%.
Higher price pressures have resulted in a very large real income shock for the households in Europe. Therefore, the roaring inflation is highly needed to be tamed by featuring rate hikes. It is worth noting that the ECB has not elevated its interest rates in the past 11 years. Now, the Russia-Ukraine crisis and supply chain bottlenecks have accelerated the oil and food prices and the ECB is left with no other option than to raise interest rates.
Meanwhile, the US dollar index (DXY) has given a downside break of the consolidation range, which is placed in a 5-pips range in the Tokyo session. The market participants are awaiting the release of the Federal Open Market Committee (FOMC) minutes, which are due on Wednesday. This will unlock the ideology of the Federal Reserve (Fed) policymakers behind announcing the 75 basis points (bps) rate hike in June. Also, it will provide the absolute situation of the macro-indictors in the US economy.
AUD/JPY takes the bids to refresh intraday high around 93.20 as traders await the key Reserve Bank of Australia (RBA) Interest Rate Decision during early Tuesday in Asia.
The cross-currency pair rose the most in two weeks the previous day, also bounced off the lowest levels since late May, amid the market’s consolidation in the absence of the US traders. Also likely to have favored the pair buyers were mildly positive prints of the second-tier Aussie data.
That said, Australia’s Building Permits for May marked a surprise jump to 9.0% MoM versus -1.8% expected and -3.9% prior while Home Loans also improved to 2.1% from -7.3% previous readout and -2.0% market consensus.
It’s worth noting that the chatters surrounding the US discussion on removing the Trump-era tariffs on China also underpinned the AUD/JPY rebound considering the strong trader ties between Canberra and Beijing.
On the contrary, fears of the economic recession continue to weigh on the AUD/JPY prices even if the absence of US bond traders restricted the pair’s momentum.
While the US markets were off, German bund yields began the week on a positive note and favored AUD/JPY run-up. That said, the yields on the 10-year German Bund rose over 10 basis points to 1.32% at the latest.
Looking forward, the pair traders will pay attention to China’s Caixin Services PMI for June, expected 47.3 versus 41.4 prior, as well as risk catalysts, for intermediate directions ahead of the RBA.
The Aussie central bank is up for announcing the third rate hike, expected worth 0.50%, as it struggles to tame inflation fears at home. However, the latest challenges to global economic growth could probe the RBA hawks and hence highlight the importance of today’s RBA Rate Statement.
Also read:
AUD/JPY bulls need to cross the monthly resistance, around 93.85 by the press time, to convince buyers. Otherwise, a pullback towards an upward sloping support line from late January, close to 91.65 at the latest, can’t be ruled out.
AUD/USD, from a bullish perspective, could be on the verge of a considerable move higher towards prior session highs around 0.6905/20 in the first instance ahead of 0.6965 and the 0.70 area thereafter.
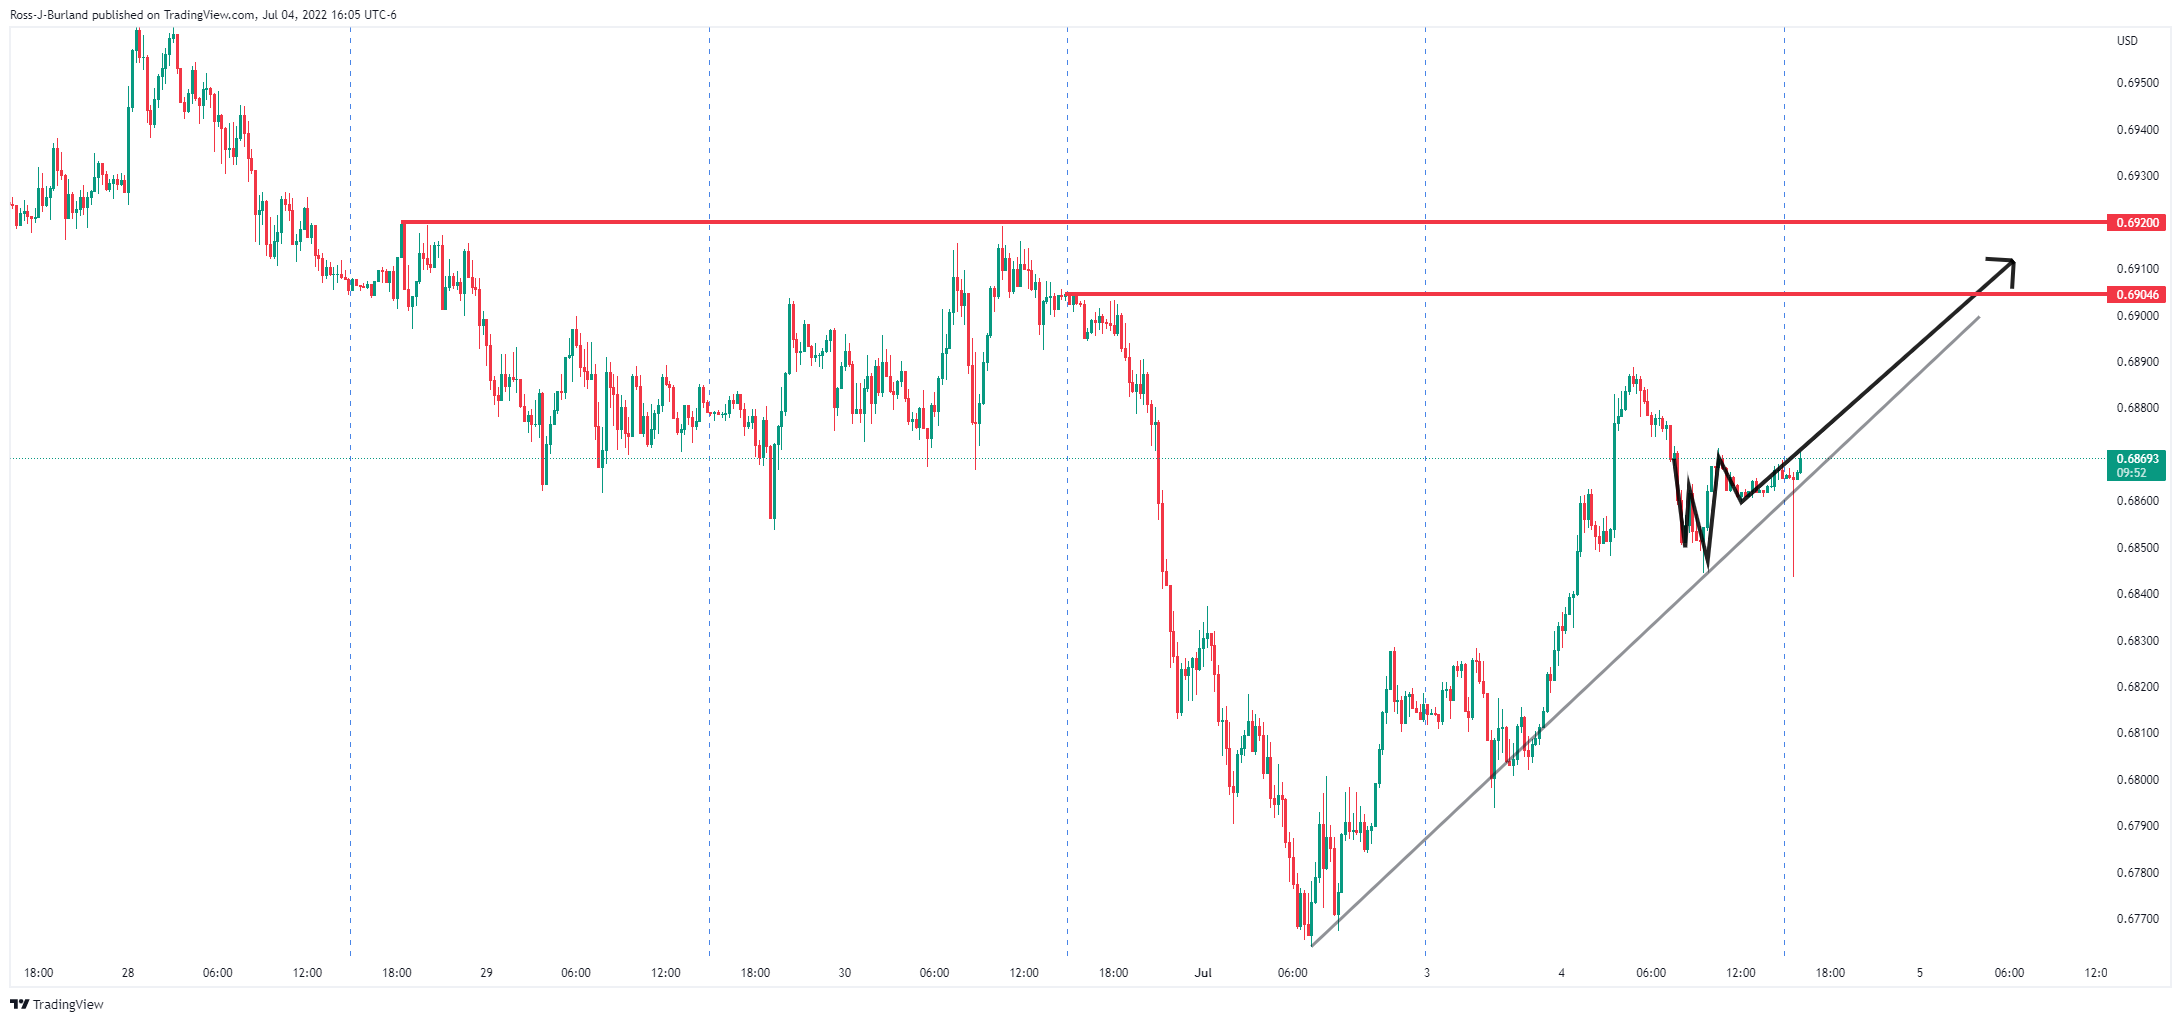
The 15 min time frame's W-formation could lead to a move higher within the confines of the bullish trendline.
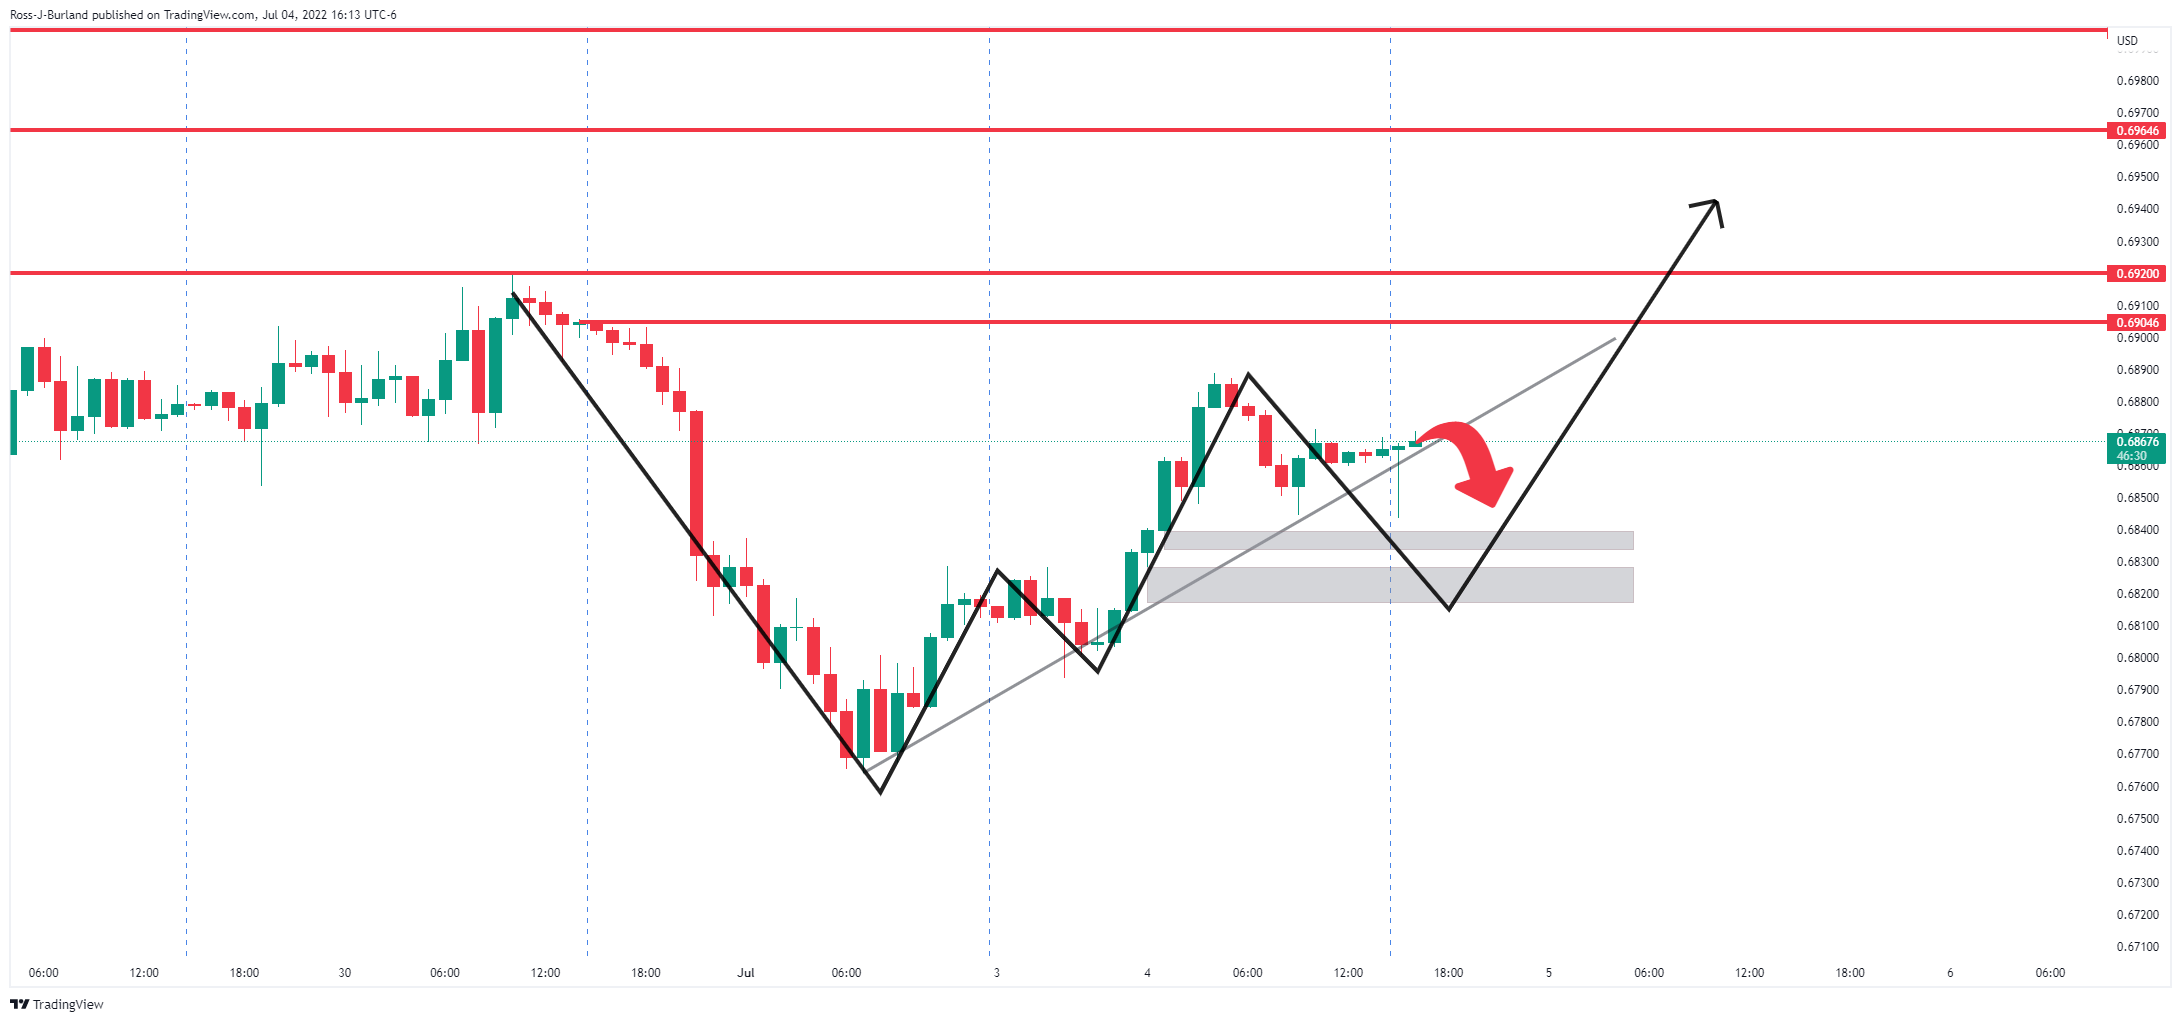
In the same vein, but with a variation of the bullish bias, traders can take into account the price imbalance on the hourly chart below. This is an area which may need to be mitigated in the coming sessions prior to the main move higher which exposes the 0.6820s for a 100 pip move higher thereafter. In doing so, it will complete the hourly W-formaiton.
Gold price (XAU/USD) is displaying a rangebound move below the critical resistance of $1,810.00 in the early Asian session. The precious metal has turned sideways, following the footprints of the US dollar index (DXY). The upcoming event of the Federal Open Market Committee (FOMC) minutes on Wednesday has shifted the gold prices into the consolidation trajectory.
The FOMC minutes will provide a detailed view behind the bumper rate hike announcement by the Federal Reserve (Fed). Fed chair Jerome Powell announced a 75 basis point (bps) interest rate hike in June monetary policy to fix the inflation mess. And, thanks to the solid growth prospects and tight labor market, which provide the Fed the required support to announce a rate hike without much hesitation.
Meanwhile, the US dollar index (DXY) is oscillating in a narrow range of 105.15-105.23 in the Asian session. Investors are awaiting the release of the US Nonfarm Payrolls (NFP), which are due on Friday. A preliminary estimate for job additions in June is 250k, extremely lower than the former additions of 390k in May.
On an hourly scale, the gold prices are juggling in a narrow range of $1,804.00-1,814.37. The downward sloping trendline placed from June 12 high at $1,879.26 will act as a major barrier for the precious metal. The 50-period Exponential Moving Average (EMA) at $1,807.92 is overlapping with the gold prices, which signals an ongoing consolidation phase. Meanwhile, the Relative Strength Index (RSI) (14) is oscillating in a 40.00-60.00 range, which indicates a directionless move further.

NZD/USD was shot out of the sky on Monday in the New York session in a bid for the greenback. The bird fell from a high of 0.6252 and made a low of 0.6193 before bulls stepped in to take it back to 0.6207 where it trades at the time of writing, flat on the day.
The US dollar firmed after a brief spell on the back foot, potentially on reports relating to the White House's proposed announcements of an easing to some of Chinese tariffs later this week in an attempt to dampen elevated inflation helped inject some optimism back into markets on Monday.
Meanwhile, Speculation is beginning to emerge that the market may have over-estimated the extent to which the Federal Reserve may have to hike rates this cycle. ''Whilst this may have softened net USD positions last week, safe-haven demand is USD supportive,'' analysts at Rabobank explained.
Additionally, we had data on Friday that showed euro zone inflation was surging to another record. This has hardened the case for the European Central Bank to raise interest rates later this month for the first time in a decade. However, moderate action is expected in comparison to the Fed.
For the week's calendar, Nonfarm Payrolls is expected to show that Employment likely continued to advance firmly in June but at a more moderate pace after three consecutive job gains of around 400k in March-May, analysts at TD Securities said.
Minutes of the Federal Reserve's June meeting will also be eyed.
''Persistent high CPI inflation and nascent signs of de-anchoring inflation expectations forced the Fed to amp the pace of rate tightening. The meeting minutes are likely to offer further colour around the Fed's more hawkish reaction function,'' the analysts at TD Securities said.
''The focus this week remains on US data, and that potentially speaks to more volatility (and possibly a further downward skew in risk to the NZD) now that markets have taken the view that US payroll growth will be soft (expectations are calling for a 275k lift) and with US bond yields this low. FX markets will recalibrate tonight when US cash bond and stock markets re-open after the holiday,'' analysts at ANZ Bank argued.
What you need to take care of on Tuesday, July 5:
Slow start to the week, as US markets were closed due to the Fourth of July Holiday. The dollar gathered some strength by the end of the day, but action was limited as traders stayed away from their desks.
Asian shares posted modest gains, but European indexes hardly maintained the green, reflecting persistent growth and inflation concerns. Wall Street futures edged marginally lower.
GBP/USD trades around 1.2100, as Brexit woes undermined demand for the Pound. The Labour party is willing to fight Prime Minister Boris Johnson over his Brexit legacy at the next election. The agreement created turmoil within the UK that exacerbates price pressures amid trade disruption. Entire industries in Germany could collapse due to natural-gas supply cuts from Moscow, according to Yasmin Fahimi, the country’s top union official.
The EUR/USD pair trades around 1.0420, not far from its Friday close. Dismal European data undermined demand for the shared currency, as the May Producer Price Index was up by 36.3% YoY. The energy crisis also hurt the EUR amid the Russian invasion of Ukraine.
Commodity-linked currencies advanced against the greenback. USD/CAD trades around 1.2860, while the AUD/USD pair is now at 0.6860. The Reserve Bank of Australia will announce its monetary policy decision early on Tuesday and will surely revive volatility after a quiet Monday.
In the US, attention remains on the Biden administration as officials are discussing whether or not to remove Chinese tariffs imposed by former President Donald Trump. A decision on the matter may be out this week.
The dollar advanced against its safe-haven rivals, with USD/CHF now trading at 0.9610 and USD/JPY at 135.70.
Gold Price saw limited activity, now changing hands at around $1,807 a troy ounce. Crude oil, on the other hand, is up, with WTI trading at $110.45 a barrel.
Like this article? Help us with some feedback by answering this survey:
During the North American session, the British pound is subdued, clinging to the 1.2100 mark after retracing from daily highs around 1.2165 in a quiet trading session. At the time of writing, the GBP/USD is trading around 1.2104.
European equities finished mixed in the session, while in the FX complex, safe-haven peers fell. The rule exception is the greenback, which is gaining vs. the pound. Given that the UK Gfk consumer confidence dropped to its lowest level since records began in 1974 and high inflationary pressures are rising, the GBP/USD might weaken ahead due to its stagflation scenario.
Elsewhere, Brexit jitters are back in the headlines once the UK wants to break the Brexit deal agreed with the EU two years ago. Meanwhile, expectations of the Bank of England hiking rates aggressively eased the tone for the August 4 meeting. The odds of a 50 bps rate hike lie at 65% vs. 75% in the last week, and expectations for the subsequent meetings were lowered, as shown by STIR’s money market futures.
In the meantime, Scotiabank analysts, in a note, wrote that they see limited upside potential for the GBP, given the backdrop of “a weak economy and at risk of continued losses from overextended BoE hike expectations.”
“There is no major data out this week that could improve the GBP’s fortunes, and the currency should mostly follow the USD tone. The BoE publishes its semi-annual Financial Stability Report tomorrow, with Tenreyro (dove) speaking later in the day, while other addresses from Pill (neutral), Cunliffe (dove), and Mann (hawk) later in the week will also help to refine expectations for BoE tightening over the next few meetings,” analysts at Scotiabank added.
Data-wise, in the week ahead, the UK economic docket will feature S&P Global/CIPS UK Services and Composite PMIs for June, alongside the Financial Stability Report. Also, the Bank of England (BoE) Governor, Andrew Bailey, will cross news wires. On the US front, the US calendar will reveal Factory Orders for May, ISM Non-Manufacturing PMIs, Fed speakers, and the US Nonfarm Payrolls report for June
The price is making a double top on the daily chart and the bearish engulfing candle followed by a subsequent drive into the demand structure could be the foundation for a significant bearish correction in the coming days. 134.265 is the last defence of a breakdown that could move in towards the imbalances of price on the lower time frames to the downside as follows:

The price is making a double top on the daily chart and the bearish engulfing candle followed by a subsequent drive into the demand structure could be the foundation for a significant bearish correction in the coming days. 134.265 is the last defence of a breakdown that could move in towards the imbalances of price on the lower time frames to the downside as follows:
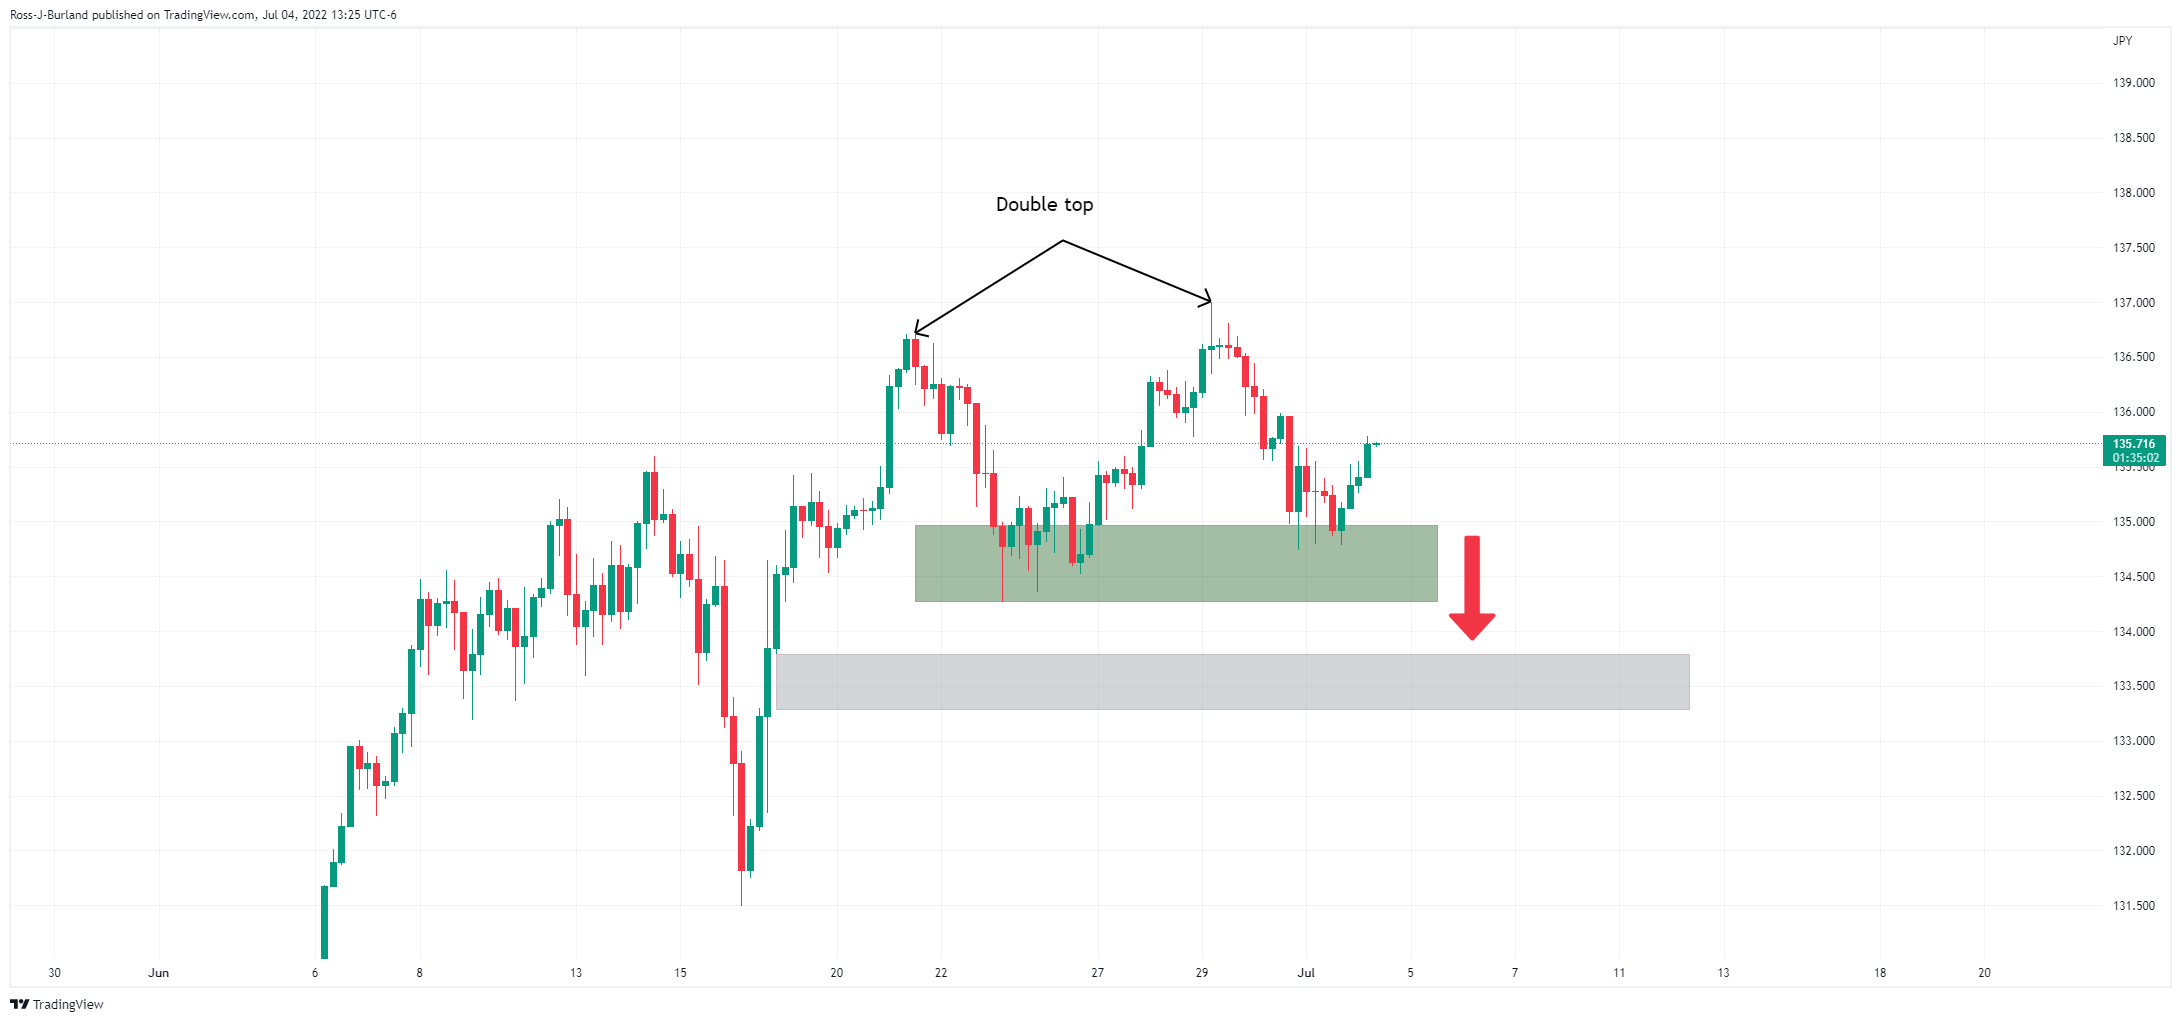
The 4-hour time frame shows that there is a price imbalance lower down starting from 133.29 that could well be mitigated in the forthcoming sessions. However, there is plenty of ground that he bears will need to cover first of all and there are prospects of a move higher as follows:
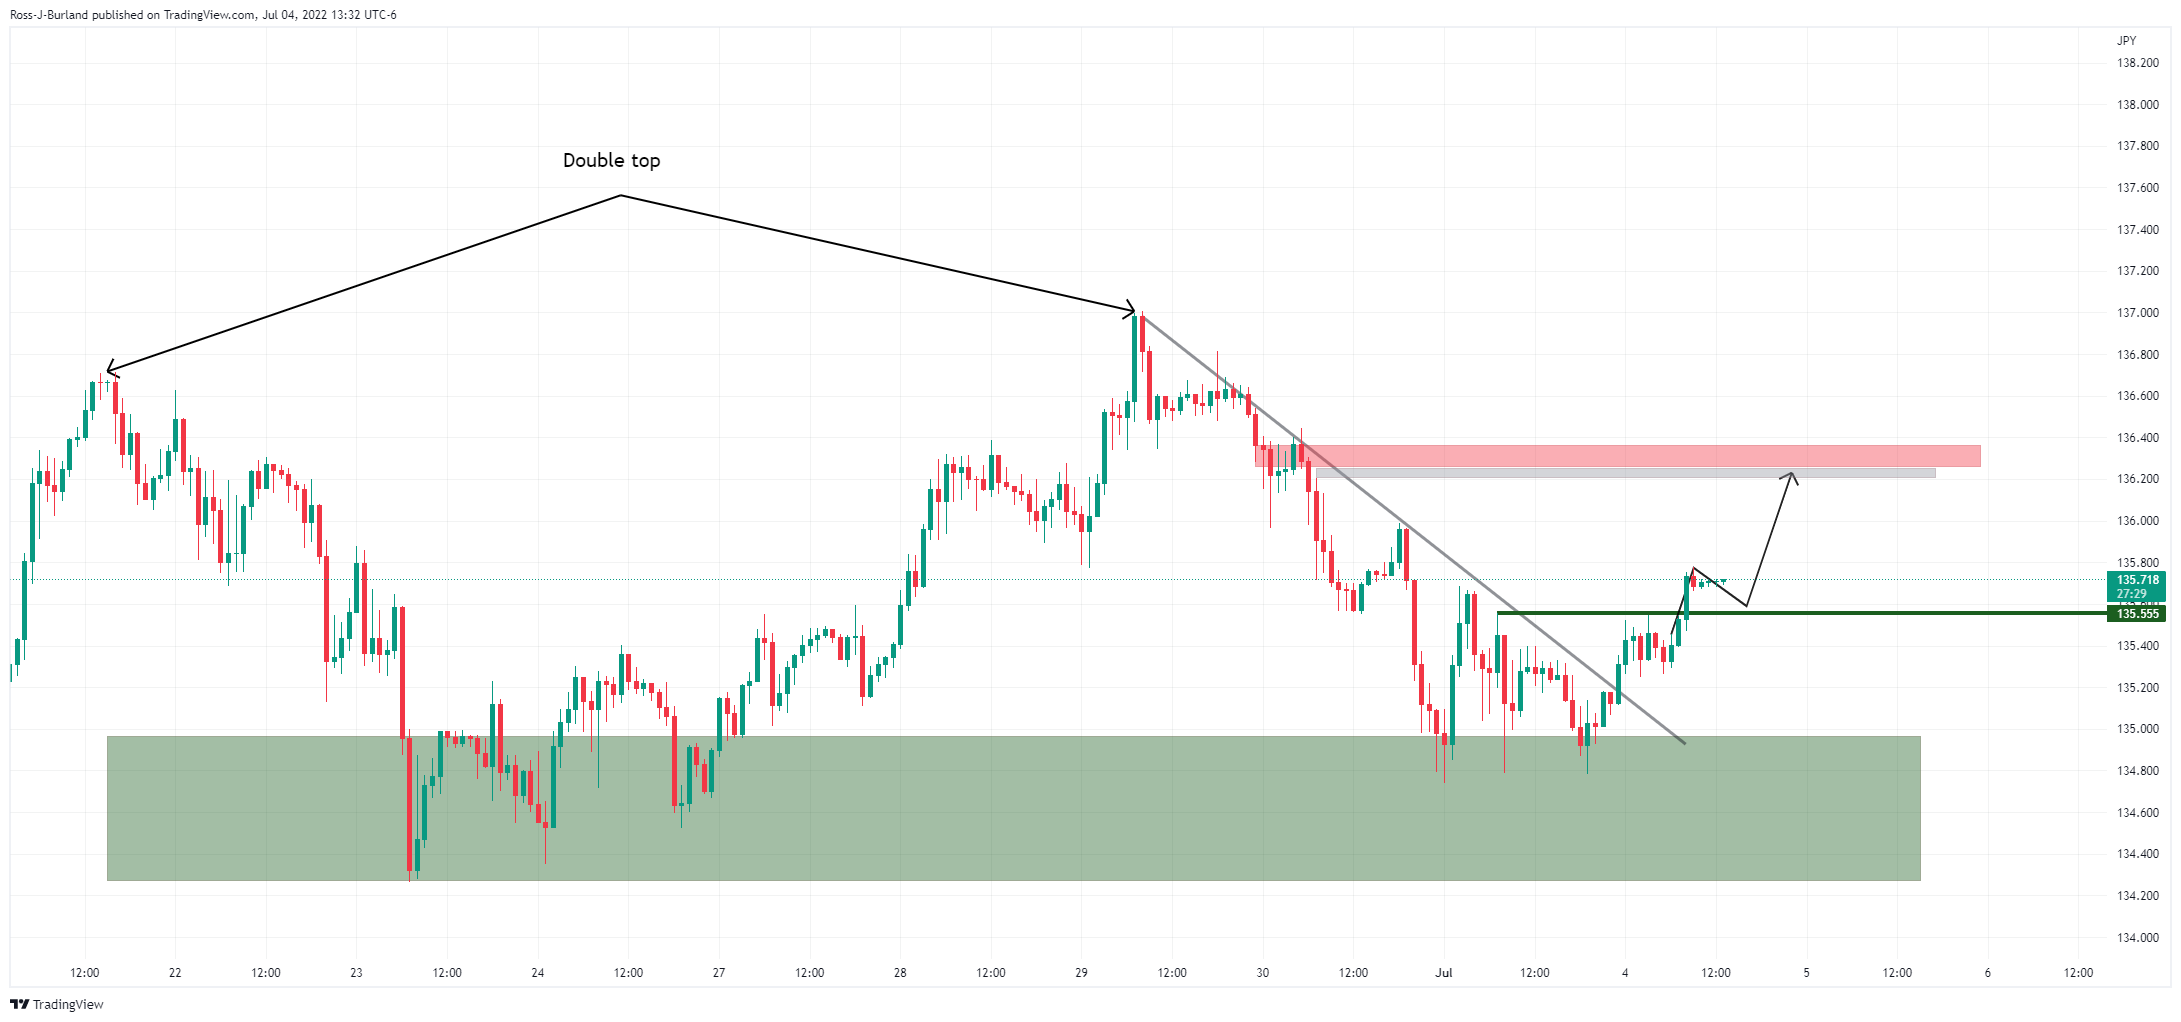
The price has broken out of the descending trendline resistance and a horizontal fractal resistance that makes the case for a meanwhile move towards 136.20 and a touch higher even.
At $1,807.17, the gold price is slightly underwater in the midday North America session and holiday markets. Bond markets have been closed for the US Independence Day holiday but the greenback has seen two-way action which has both supported and sunk gold at the start of the week.
Despite being down on the day, the gold price remains above its lowest level scored since early February which was made on Friday amid a risk-off environment that had supported the greenback. The yellow metal was also pressured after India unexpectantly increased its import tax after a ballooning trade gap pushed the rupee to a record low. ''This could weaken demand just as outflows from gold-backed ETFs pick up,'' analysts at ANZ bank argued. ''Rising inflation has raised the likelihood that central banks will aggressively hike rates, dampening the appeal of the precious metal.''
Despite the yellow metal's safe-haven allure, gold is a non-interest-bearing asset class which is keeping a lid on advancements in gold at times of risk-off. ''Gold prices have disconnected altogether from market pricing for Fed hikes over the past month, and have instead grown their relationship with the USD, pointing to a smaller magnitude of idiosyncratic flows for the yellow metal,'' analysts at TD Securities have argued.
''Liquidity is being sapped from global markets, and gold flows have not been spared. After all, the massive amount of potentially complacent speculative length from proprietary traders in the yellow metal does not appear to be associated with a Fed narrative nor with a stagflationary view of the world, considering that this length was accumulated as early as 2020,'' the analysts explained, saying, ''in turn, while the bias remains to the downside in gold, participants will need a catalyst to shake out the complacent longs in precious metals.''
Meanwhile, the US dollar at the start of the week was weaker until the start of the New York session, bleeding out from the two-week high made on Friday. Reports that the White House will announce an easing of some Chinese tariffs later this week in an attempt to dampen elevated inflation helped inject some optimism back into markets on Monday.
Additionally, we had data on Friday that showed euro zone inflation was surging to another record. This has hardened the case for the European Central Bank to raise interest rates later this month for the first time in a decade. However, moderate action is expected in comparison to the Fed and the divergence between the two central banks could be perceived to be more favourable for the US dollar in the medium term.
For the week's calendar, Nonfarm Payrolls is expected to show that Employment likely continued to advance firmly in June but at a more moderate pace after three consecutive job gains of around 400k in March-May, analysts at TD Securities said.
Meanwhile, the minutes of the Federal Reserve's June meeting will also be eyed.
''Persistent high CPI inflation and nascent signs of de-anchoring inflation expectations forced the Fed to amp the pace of rate tightening. The meeting minutes are likely to offer further colour around the Fed's more hawkish reaction function,'' the analysts at TD Securities said.
The yellow metal is trapped in a consolidation range, moving within a $10.29 range around Friday's highs. A break of today's lows could entice a long squeeze and potentially encourage more selling for a downside continuation below $1,785 for the sessions ahead:
The Aussie dollar pares last Friday’s losses and edges up on the second trading day of July, gaining 0.76%, amidst a quiet North American session. At 0.6864. the AUD/USD reflects an upbeat market mood in the FX space.
European equities bounced, as well as the Asian ones, except for the China A-50 and the Hang Seng. That said, it depicts a mixed mood tilted slightly positively, maintaining the AUD bid. Also, better-than-expected manufacturing PMIs from China, mainly Caixin’s, is back in expansionary territory, despite late developments surrounding the coronavirus zero tolerance.
Another factor keeping the Australian dollar strong is the Reserve Bank of Australia’s monetary policy decision. The RBA is expected to hike 25 or 50 bps, though the base scenario for most analysts is the larger one.
In a note, analysts at TD Securities wrote, “We believe the RBA should hike the cash rate by more than 50bps at tomorrow’s meeting in light of strong domestic data prints. We had forecast a 65bps hike for the July meeting, but listening to Governor Lowe’s most recent guidance, explicitly stating the Board will discuss 25 or 50 at the July meeting, we shifted our call last week and expect the RBA to hike 50bps tomorrow.”
Elsewhere, the greenback recovered some ground, with the US Dollar Index (DXY) up 0.08%, sitting at 105.201. Australian dollar traders should be aware of Iron Ore prices, which have tumbled to $114.45 a ton from YTD highs around $160.00.
In the week ahead, the Australian economic calendar will feature the S&P Global Services and Composite PMIs for June, alongside the AIG Construction Index and the RBA’s monetary policy decision. Across the pond, the US docket will feature Factory Orders for May, ISM Non-Manufacturing PMIs, Fed speakers, and the US Nonfarm Payrolls report for June
The Consumer Price Index Türkiye rose in June by 4.98%, and the annual rate approached 8%. The Research Department at BBVA expects consumer inflation to accelerate above 90% in the coming months led by loose economic policies and significantly deteriorating inflation expectations. They have revised their year-end inflation forecast to near 70%, still with risks clearly on the upside.
“Consumer prices increased by 4.95% in June, slightly lower than market consensus (5.7%) and our expectation (5.5%), which resulted in an annual figure of 78.6%. The downside surprise was due to lower food prices, particularly processed food conflicting with the recent hikes in certain administrative food prices.”
“Domestic consumption stays strong on top of credit impulses and other loose economic policies and keeps pressure high on consumer prices without any anchor on price setting mechanism. Besides, longer than expected war conditions and post-pandemic supply side problems keep global commodity prices high. As a result, stronger cost push factors lead companies to easily pass them to consumer prices. Also, reinforced external financing needs and high dollarization in the economy keep the pressure on the exchange rate, which might well fuel the negative loop by means of both inflation expectations and production costs. Last but not least, wage adjustments remain crucial so it is obvious that inflationary pressures will likely strengthen more until a clear policy reaction is taken.”
“We expect consumer inflation to accelerate above 90% in the coming months led by loose economic policies and significantly deteriorating inflation expectations. By year-end, we expect inflation to slow down to near 70% given positive base effects in the last two months of the year, assuming no substantial shocks on the foreign exchange rate.”
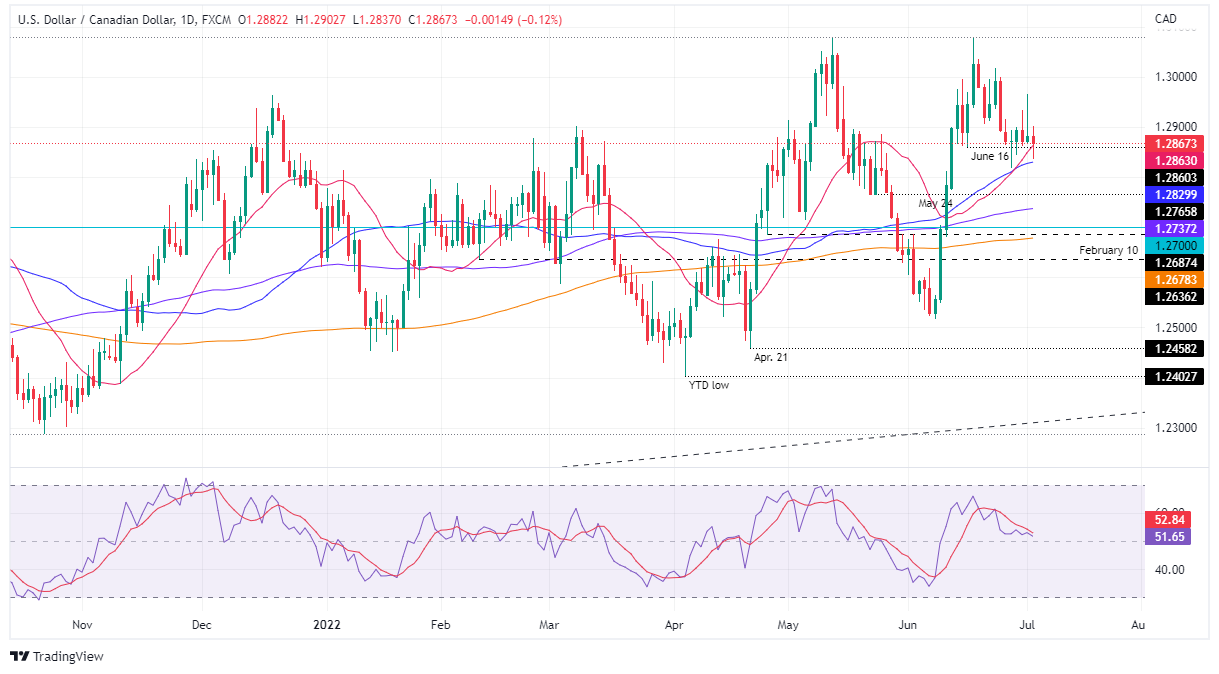
The USD/CAD bounces off the 50-day EMA at 1.2830 and approaches the 1.2870 mark on Monday’s trading session, characterized by thin liquidity conditions as North American traders are on a long holiday in the observance of the US Independence day. At 1.2867, the USD/CAD is down 0.11% at the time of writing.
Sentiment is mixed, slightly tilted risk-on. In the FX complex, safe-haven peers remain heavy, except for the greenback, which is up against its major counterparties. The Canadian S&P Global Manufacturing PMI for June dropped to its lowest level in 17 months, to 54.6 from 56.8. According to Shreeya Patel, an S&P Global Market Intelligence economist, “Global supply issues and steep price pressures were at the heart of the issue and are expected to continue to disrupt the manufacturing economy this year.”
Later, the Bank of Canada (BoC) Business Outlook Survey shows concerns over near-term inflation is increasing and is expected to run at a higher for longer than the Q1 survey. According to the survey, businesses plan to raise wages, hire and retain workers and anticipate that inflation will exceed 3% on average for the next two years.
The USD/CAD edged lower, but as the North American session advanced, the major gained ground and reached a daily high at around 1.2902 before retracing to the 1.2870s amidst the lack of fresh impetus, which could threaten USD/CAD sellers around the 1.2900 mark.
In the meantime, high crude oil prices were of little help to the Loonie, whose imports amount to 10% of Canada’s GDP in a year. The Western Texas Intermediate (WTI’s) is up almost $2, up at $110.33 per barrel, putting a lid on upward prices on USD/CAD.
In the week ahead, the Canadian economic docket will feature the Balance of Trade and significant Employment Data. On the US front, data that could shed some light on the US economy will be revealed, led by Factory Orders for May, ISM Non-Manufacturing PMIs, Fed speakers, and the US Nonfarm Payrolls report.
The USD/CAD is upward biased in the medium term, but last Friday’s price action formed a huge inverted hammer in an uptrend, and the Relative Strength Index (RSI) accelerating downwards to the midline opened the door for further losses.
Therefore, the USD/CAD first support would be the 50-day EMA at 1.2830. Break below would expose 1.2800, and the 100-day EMA at 1.2737.
The EUR/USD dropped from 1.0461 to 1.0416, approaching the Asian session low as the US dollar recovered strength. Volatility remains limited amid low volume. US markets are closed on Monday.
The EUR/SUD shows no surprises on a quiet session across financial market amid a holiday in the US. The pair approached 1.0470 earlier on Monday but it lost momentum and pullback to the levels it closed on Friday.
The key driver has been the US dollar. After spending the day in negative territory, the DXY turned positive, rising back above 105.00. Wall Street futures are modestly lower, while European markets finished mixed.
Economic data from the Eurozone showed the Producer Price Index rose 0.6% in May, below the 1% of market consensus. The annual rate dropped from 37.2% to 36.3%, a level that continues to warrant rate hikes from the European Central Bank. The Sentix Investor Confidence tumbled from -15.8 to -26.4 in July.
Activity will return to normal on Tuesday. The next key event in the US will be on Wednesday with the FOMC minutes of its latest meeting. On Friday, the official employment report is due.
The EUR/USD was unable to recover 1.0470, and it remains vulnerable. The lack of strength in the recovery keeps the door open to a decline to 1.0400. Below the next support is 1.0380, the last defence to the year-to-date low of 1.0350.
If the euro rises above 1.0470, it could gain momentum, and extend the move higher to 1.0490, alleviating the bearish pressure. At 1.0520, awaits the 20-day Simple Moving Average.
The USD/MXN is practically unchanged on Monday, hovering slightly below 20.30, holding onto last week's gains. With US markets closed, price action will likely remain limited.
The bias in USD/MXN continues to point to the upside. While above 20.20, a test of 20.45, the next strong barrier seems likely. Above the next resistance is located at 20.70. On the flip side under 20.20, the strong support lies at 20.05, followed by an uptrend line at 19.90.
Risk sentiment will likely continue to be the key driver in USD/MXN. Key events for the week will be the release of the FOMC minutes on Wednesday, the ADP employment report on Thursday and the Non-farm payroll on Friday.
Mexico will report June inflation on Thursday. The annual rate is seen near 8%, reaching the highest since early 2001, well above Banxico’s 2-4% target. “The central bank just hiked rates 75 bp to 7.75% on June 23 and signaled more hikes were needed. Next policy meeting is August 11 and another 75 bp hike seems likely. Looking ahead, the swaps market is pricing in 200 bp of tightening over the next 6 months that would see the policy rate peak near 9.75%. Banco de Mexico minutes will also be released Thursday”, explained analysts at Brown Brothers Harriman.
-637925453093907664.png)
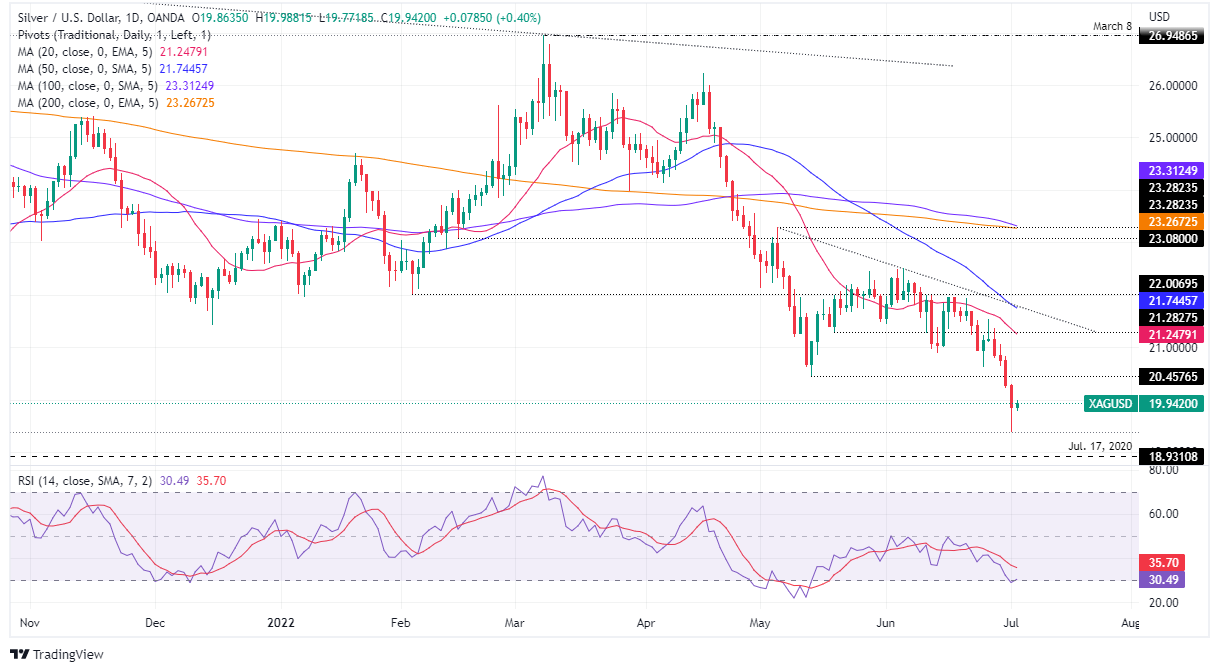
Silver (XAGUSD) is under pressure on Monday, amidst a liquidity-thin trading session, on the observance of the US Independence day. Portraying the aforementioned is XAGUSD which stays within a narrow $19.82-$19.88 range during the North American session. At the time of writing, XAGUSD is trading at $19.95.
The sentiment is mixed, as portrayed by rising equities except for the Dax 40, while safe-haven peers drop in the FX space. The greenback is almost flat, while the US bond market will remain close. That said, US Treasury yields remained parked, while the silver price fell last Friday to a new 2-year low at around $19.38.
Despite that, the XAGUSD formed a hammer last Friday, which means that the silver price might be headed to the upside, and might re-test the May 13 swing low at $20.45. But first, silver buyers must lift the white metal price above the July 1 high at $20.30.
In the meantime, the US Dollar Index, a measure of how the US dollar performs against a basket of six rivals, barely climbs 0.06% and sits at 105.186.
Commerzbank analysts wrote that the gold/silver ratio has risen to nearly 90, meaning that the XAGUSD price is low compared to gold. They added that silver was being dragged down by falling gold prices and stated: “is being additionally depressed by the very weak base metals prices – this is because silver is not only an investment metal but to an equal extent also an industrial metal.”
In the week ahead, the US economic calendar will feature on Wednesday the US ISM Non-Manufacturing PMIs for June, Fed speaking with New York Fed President John Williams, and the FOMC’s last meeting minutes.
The white metal remains downward biased. However, the magnitude of the fall in the last week might be subject to a mean reversion move, further cementing the previously mentioned oscillators showing positive divergence between price action and the Relative Strength Index (RSI).
If the latter scenario plays out, XAGUSD’s first resistance would be $20.00. Break above will open the path towards $20.30, followed by a challenge of the May 16 low at $20.45. Otherwise, a re-test of the 2-year low at $19.38 is on the cards.
European Central Bank (ECB) Vice President Luis de Guindos said on Monday that they have seen inflationary pressures broaden and intensify across many goods and services in recent months, as reported by Reuters.
"The headwinds from high energy costs, the deterioration of terms of trade and the adverse impact of high inflation on disposable income pose elevated risks to our medium-term growth outlook."
"Elevated inflation will remain with us for some time."
"The risks surrounding inflation are on the upside."
"Our commitment to fighting fragmentation should thus not interfere with, but rather enable, a greater focus on the monetary policy stance."
"We are still expecting positive growth rates throughout our projection horizon."
"In the coming months, we will have to navigate this challenging combination of shocks which is reducing growth and pushing up inflation."
"A change in the monetary policy stance should lead to a similar reaction in their financing conditions, no matter in which country they are domiciled."
"We will react to prevent fragmentation with suitable safeguards to prevent moral hazard."
"Excessive divergence in government bond yields makes credit conditions inconsistent with the uniform transmission of monetary policy impulses and could cause financial instability."
"Fiscal policy should do its part by guaranteeing sound public finances in the medium term and delivering targeted and temporary support to vulnerable groups."
EUR/USD showed no immediate reaction to these remarks and was last seen trading flat on the day at 1.0430.
The Bank of Canada's (BOC) Business Outlook Survey and Survey of Consumers for the second quarter showed inflation expectations climbed to record highs for 1-year and 2-years from now, with low-income consumers most concerned, per Reuters.
"Survey shows concern over near-term inflation has increased and inflation is expected to run higher for longer than the previous survey."
"Many businesses plan to raise wages to hire and retain workers; they expect an average wage increase of 5.8% over the next 12 months."
"Most businesses anticipate inflation will exceed 3% on average for the next two years, with a quarter of businesses expecting inflation above 2% for three years or more."
"Businesses reporting record-high number of labor and supply-chain constraints, with about half of firms expecting supply chain challenges to persist until the end of 2023 or beyond."
"Survey indicates many firms to increase investment and hiring over the next year, and many expect significant wage and price increases."
"Firms anticipate that sales growth will begin to moderate from exceptionally high rates amid greater uncertainty."
"Inflation expectations have risen alongside concerns about food, gas and rent costs."
"Canadians plan to spend significantly more over the next 12 months, with about a quarter planning on spending some excess savings."
"Expectations for 1-year ahead inflation increased in Q2 to 6.8% from 2.2%."
The USD/CAD pair edged lower from session highs after this report and was last seen posting small daily losses at 1.2875.
German Chancellor Olaf Scholz said on Monday that they will continue to meet regularly with unions on energy price and inflation issues while noting that the current crisis will not be over in a few months, as reported by Reuters.
"We face a historic challenge."
"Agreed with social partners today on an understanding of the current situation, will develop tools in coming weeks."
"We stand together with social partners."
These comments don't seem to be having a noticeable impact on the shared currency's performance against its rivals. As of writing, EUR/USD was up 0.05% on the day at 1.0433.
European Central Bank (ECB) Governing Council member and German central bank head Joachim Nagel said on Monday that the ECB's very accommodative monetary policy stance should swiftly be abandoned, as reported by Reuters.
"Cautioning against using monetary policy tools to limit risk premia of indebted states."
"Virtually impossible to establish whether widened spread is fundamentally justified."
"Monetary policy measures to combat fragmentation can be justified only in exceptional circumstances."
"Anti fragmentation tool must have narrowly-defined conditions, must be strictly temporary."
"A restrictive monetary policy stance may be necessary to achieve objective."
"De-anchoring of inflation expectations has to be prevented no matter what."
"Our current focus must be on the very high inflation rates."
The EUR/USD pair showed no immediate reaction to these comments and was last seen posting small daily gains at 1.0435.
EUR/USD lost more than 100 pips last week. Economists at ING believe that the pair could retest May's lows.
“The data calendar is rather quiet this week in the eurozone and several ECB speakers may still fail to generate any material jitters in EUR/USD.”
“We think the pair runs a bigger risk of retesting the 1.0380 May lows in the coming days rather than returning to the 1.0500-1.0600 area, given the still unstable global risk environment.”
The USD/CHF pair attracted some dip-buying near the 0.9560 region on Monday and refreshed the daily high during the mid-European session, albeit lacked any follow-through strength. The pair was last seen hovering around the 0.9600 mark, well below a one-week high touched on Friday.
Signs of stability in the financial markets undermined demand for safe-haven assets, including the Swiss franc, which turned out to be a key factor that extended some support to the USD/CHF pair. That said, the emergence of some selling around the US dollar failed to impress bullish traders or provide any meaningful impetus to the major.
Investors remain concerned that rapidly rising interest rates and tightening financial conditions would pose challenges to global economic growth. Adding to this, the ongoing Russia-Ukrain war and the latest COVID-19 outbreak in China have been fueling worries about a possible economic recession, which dragged the US bond yields to a multi-week low.
On the other hand, the CHF continued drawing support from the Swiss National Bank's shocker on June 16, when it unexpectedly raised interest rates by 50 bps to curb soaring inflation. This warrants caution before positioning for any meaningful upside for the USD/CHF pair amid relatively lighter trading volumes on the back of a holiday in the US.
Investors also seemed reluctant and might prefer to wait for a fresh catalyst from this week's release of the FOMC monetary policy meeting minutes on Wednesday. Apart from this, the closely-watched US monthly jobs report (NFP) on Friday will influence the USD price dynamics and help determine the near-term trajectory for the USD/CHF pair.
The business activity in Canada's manufacturing sector expanded at a softer pace in June than in May with the S&P Global Manufacturing PMI dropping to 54.6 from 56.8. This print came in weaker than the market expectation of 56.6.
Commenting on the data, "there were signs of difficulty in Canada’s manufacturing sector in June," noted Shreeya Patel, Economist at S&P Global Market Intelligence.
"The PMI dipped to the lowest for 17 months amid softer uplifts in output, new orders, purchases and employment," Patel added. "Global supply issues and steep price pressures were at the heart of the issue, and are expected to continue to disrupt the manufacturing economy this year."
The USD/CAD pair showed no immediate reaction to these comments and was last seen losing 0.17% on the day at 1.2860.
A basing process in underway for EUR/GBP, in the view of analysts at Credit Suisse, and the pair is set to hold support at 0.8581/50 for an eventual rise to the “neckline” to the 2020 top formation at 0.8861/76.
“Key resistance remains seen at the recent and April 2021 high at 0.8722, with the 50% retracement of the fall from September 2020 at 0.8747. Beyond here in due course should then add weight to our view that a broader basing process is underway, with resistance seen next at the ‘neckline’ to the 2020 top and 61.8% retracement at 0.8861/76.”
“Below 0.8550 can see the uptrend break sustainably for a fall back to next support at 0.8514/11, which coincides with the rising 55-day average, which we would look to hold if reached.”
EUR/USD gains to mid-1.04s. Still, economists at Scotiabank expect the world’s most popular currency to drop under the 1.04 level.
“EUR/USD remains saddled by a bearish trend that points to a re-test of sub-1.04 levels.”
“Daily gains have stalled around the mid-1.04s that stands as key resistance prior to 1.0475 and 1.0490, with the 1.05 area generally acting as a firm ceiling.”
“Support is 1.0415/20 (daily low) and the big figure zone, with the 1.0366 Friday low following.”
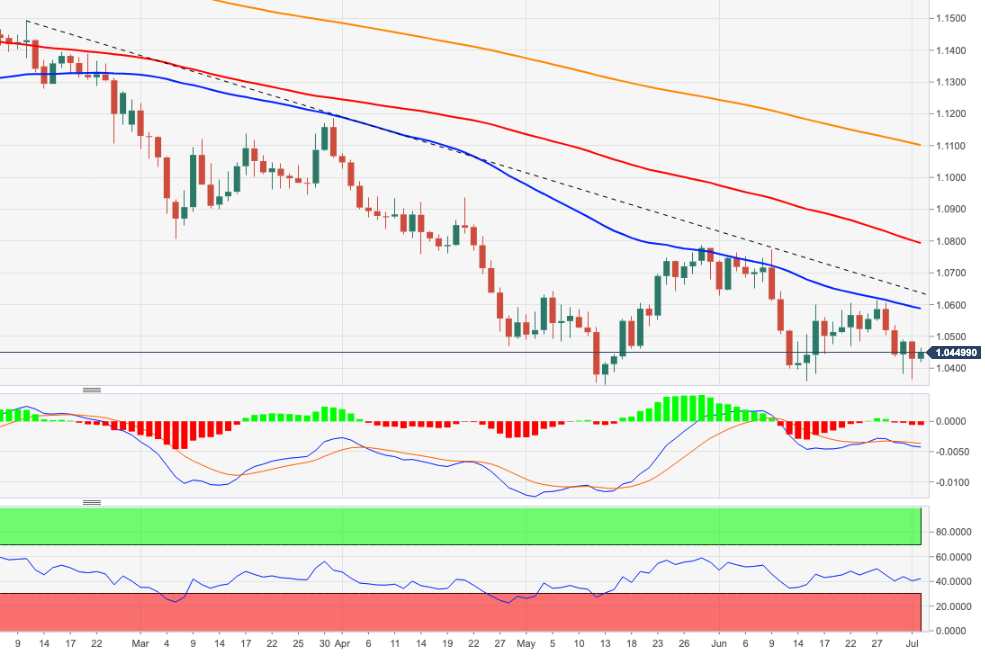
USD/JPY looks disconnected from US Yields and may break short-term support at 134.28/24, prior to an eventual test of the 137.21 high of September 1998, economists at Credit Suisse report.
“USD/JPY is dramatically losing momentum in the short-term, with a large momentum divergence and cross lower in daily MACD, with the market also looking disconnected from the recent fall in US Bond Yields.”
“We believe the market is vulnerable to breaking short-term support at 135.14/134.27. A close below here would warn of a deeper corrective setback, with support seen next at 133.21/15, then 132.18.”
“With a multi-year ‘secular’ base completed earlier this year in April, we continue to view any weakness as corrective though and look for an eventual break above the recent and September 1998 high at 137.02/21. This would trigger further strength to 139.00/10 next and eventually our ultimate objective in the 147.62/153.01 zone.”
Cable is following its peers higher. However, economists at Scotiabank expect the GBP/USD pair to test the 1.20 level.
“The pound remains at risk of testing 1.20 and losses from there mounting to a new low since 2020.”
“The GBP’s sharp rejection of the 1.22 area (high 1.21s) on Thursday that then saw it slide on Friday signals limited upside potential for the GBP.”
“Resistance is ~1.2150/65 followed by the Thursday high of 1.2189 and the big figure area generally.”
“Support is 1.2085 after the big figure, followed by the mid-1.20s.”
EUR/USD may see further short-term consolidation above the 2017 and YTD lows at 1.0350/41. Nonetheless, economists at Credit Suisse look for an eventual breakdown below here.
“EUR/USD has now fallen to very key price support from the YTD and 2017 lows at 1.0350/41. Our bias is for further consolidation above here, over the coming days, prior to an eventual breakdown, which would trigger further weakness in our view, with support seen next at 1.0217/09 and eventually parity/0.99.”
“Key short-term resistance moves to 1.0489, above which would confirm that the range bottom has held for now to reinforce our bias for further consolidation.”
“Only a close above the 55-day average at 1.0588/0615 would raise the prospect of a lengthier consolidation phase and a deeper recovery and open the door to a test of the key 1.0774/88 May/June highs.”
USD/CAD is trading in the mid-1.28s, its weakest level since last Tuesday. A slump to the 1.28 level would signal a clearer worsening of its technical picture, in the view of economists at Scotiabank.
“The pair remains relatively far from a test of 1.28 that would signal a clearer worsening of its technical picture.”
“USD support stands at the 50-day MA of 1.2832, Tuesday’s low of 1.2819, and the big figure area.”
“Resistance is 1.2880/00 followed by ~1.2925 and Friday’s peak of 1.2966.”
The GBP/USD pair witnessed some short-covering on the first day of a new week and build on Friday's late recovery from the 1.1975 region, or the lowest level since June 14. The momentum extended through the mid-European session and pushed spot prices to a fresh daily high, around the 1.2165 region in the last hour.
The recent decline in the US Treasury bond yields, along with signs of stability in the equity markets, undermined the safe-haven US dollar. This, in turn, was seen as a key factor that acted as a tailwind for the GBP/USD pair. That said, any meaningful positive move still seems elusive, warranting caution for bulls.
Fed Chair Jerome Powell last week reaffirmed market bets for more aggressive rate hikes and said that the US central bank remains focused on getting inflation under control. Powell added that the US economy is well-positioned to handle tighter policy. Apart from this, growing recession fears should limit the USD losses.
On the other hand, the Bank of England is expected to adopt a gradual approach toward raising interest rates amid the worsening economic outlook. Furthermore, fresh tensions between the UK and the European Union over the Northern Ireland Protocol of the Brexit agreement might hold back the GBP bulls from placing aggressive bets.
The fundamental backdrop makes it prudent to wait for strong follow-through buying before confirming that the GBP/USD pair has bottomed out in the near term and positioning for any further gains. Traders might also be reluctant amid relatively lighter volumes on the back of a holiday in the US and ahead of this week's key releases.
The minutes of the FOMC meeting are due on Wednesday and will be followed by the key US jobs data on Friday. Investors will closely scrutinize the FOMC minutes and the NFP report for clues about the Fed's policy tightening path. This will play a key role in influencing the USD price dynamics and provide a fresh impetus to the GBP/USD pair.
EUR/USD extends the bounce off last week’s lows in the 1.0385/80 band on Monday.
The inability of the pair to leave behind the 5-month line near 1.0630 on a convincing fashion should keep the downside pressure well in place around the pair for the time being. That said, there is a minor support at the weekly low at 1.0365 (July 1) ahead of the June low at 1.0358 (June 15). A deeper pullback should put a visit to the 2022 low at 1.0348 (May 13) back on the radar.
In the longer run, the pair’s bearish view is expected to prevail as long as it trades below the 200-day SMA at 1.1099.
DXY faces some moderate selling pressure and breaks below the 105.00 support at the beginning of the week.
Further upside in the dollar remains in store in the short-term horizon. Against that, the index could attempt another visit to the so far yearly highs near 105.80 recorded in the wake of the FOMC event on June 15. If cleared, then the next hurdle of relevance is seen at the December 2002 at 107.31.
As long as the 4-month line near 102.45 holds the downside, the near-term outlook for the index should remain constructive.
The broader bullish view remains in place while above the 200-day SMA at 98.19.
Gold closed the week in the red despite a late rebound on Friday. This week, the calendar features FOMC Minutes and US Nonfarm Payrolls data. A dovish tone could weigh on the dollar and open the door for a rebound, according to FXStreet’s Eren Sengezer.
“On Wednesday, the FOMC will release the minutes of its June policy meeting. According to the CME Group FedWatch Tool, markets are currently pricing in a 66.5% probability of another 75 basis points (bps) Fed rate hike in July, compared to 84% a week ago. In case the FOMC’s publication boosts the odds of a 75 bps hike, gold could face additional bearish pressure. On the other hand, a dovish tone could weigh on the dollar and open the door for a rebound.”
“On Friday, the labor market is expected to show a loss of growth momentum in June with the NFP rising by 250K following May’s increase of 390K. Investors will also pay close attention to wage inflation data. On a yearly basis, Average Hourly Earnings are expected to rise by 5.2%, same as in May. Unless there is a negative surprise in the NFP print, a higher-than-forecast wage inflation growth could boost the greenback and vice versa.”
EUR/JPY leaves behind four consecutive daily pullbacks and reclaims the area above the 141.00 yardstick on Monday.
The bullish bias in the cross remains well in place as long as the support line around 138.80 holds the downside. This area of contention is currently reinforced by the 55-day SMA. That said, the next target of note emerges at the 2022 peak at 144.27 (June 28).
In the longer run, the constructive stance in the cross remains well propped up by the 200-day SMA at 132.89.
The NZD/USD pair witnessed a short-covering move on the first day of a new week and built on Friday's late rebound from the 0.6150-0.6145 region, or the lowest level since May 2020. The intraday positive move prolonged through the mid-European session and pushed spot prices to the mid-0.6200s.
The recent slump in the US Treasury bond yields turned out to be a key factor that continued acting as a headwind for the US dollar. Apart from this, signs of stability in the financial markets further undermined the greenback's safe-haven status and benefitted the risk-sensitive kiwi.
That said, the worsening global economic outlook might keep a lid on any optimistic move in the markets and offer some support to the buck. This, along with the prospects for a more aggressive policy tightening by the Fed, favours the USD bulls and might cap the upside for the NZD/USD pair.
Investors remain sceptical that major central banks would be able to raise interest rates to curb soaring inflation without affecting global economic growth. Addin to this, the ongoing Russia-Ukraine war and the latest COVID-19 outbreak in China have been fueling worries about a possible recession.
Fed Chair Jerome Powell, meanwhile, reaffirmed last week that the US central bank remains focused on getting inflation under control. Powell added that the US economy is well-positioned to handle tighter policy. This, in turn, should back traders from placing bearish bets around the USD.
Investors might also prefer to wait on the sidelines amid relatively lighter trading volumes on the back of a holiday in the US and wait for this week's key releases from the US. The minutes of the FOMC meeting are due on Wednesday and will be followed by the US jobs data on Friday.
Investors will closely scrutinize the FOMC minutes and the NFP report for clues about the Fed's policy tightening path. This, in turn, will influence the near-term USD price dynamics and help determine the next leg of a directional move for the NZD/USD pair.
The USD/CAD pair attracted fresh selling near the 1.2900 mark on the first day of a new week and extended Friday's sharp retracement slide from the 1.2965 region. The modest intraday weakness dragged spot prices to a four-day low, around the 1.2840 region during the first half of the European session.
The recent sharp decline in the US Treasury bond yields, along with signs of stability in the financial markets, dented demand for the safe-haven US dollar. This, in turn, acted as a headwind for the USD/CAD pair and exerted downward pressure, though a combination of factors should help limit deeper losses.
Speaking at the ECB Forum in Sintra last Wednesday, Fed Chair Jerome Powell reaffirmed bets for more aggressive rate hikes and said that the US economy is well-positioned to handle tighter policy. The Fed’s non-stop chatter about interest rate hikes might continue to lend some support to the greenback.
Apart from this, the worsening global economic outlook, which could stall fuel demand recovery, led to a fresh leg down in crude oil prices. This could undermine the commodity-linked loonie and hold back traders from placing aggressive bearish bets around the USD/CAD pair, at least for the time being.
Investors remain concerned that rapidly rising interest rates and tightening financial conditions would pose challenges to global economic growth. Adding to this, the ongoing Russia-Ukrain war and the latest COVID-19 outbreak in China have been fueling worries about a possible economic recession.
This makes it prudent to wait for strong follow-through selling before traders start positioning for any further depreciating move. Given that the US markets are closed on Monday in observance of Independence Day, the USD/oil price dynamics might provide some impetus to the USD/CAD pair.
The AUD/USD pair kicked off the new week on a positive note and built on Friday's late rebound from the 0.6765-0.6760 region, or its lowest level since June 2020. The recovery momentum extended through the first half of the European session and lifted spot prices back above the mid-0.6800s.
Against the backdrop of the recent sharp decline in the US Treasury bond yields, signs of stability in the financial markets acted as a headwind for the safe-haven US dollar. This, in turn, was seen as a key factor that extended some support to the risk-sensitive aussie. Apart from this, some repositioning trade ahead of the Reserve Bank of Australia policy meeting on Tuesday prompted traders to lighten their bearish bets around the AUD/USD pair.
That said, the prospects for a more aggressive policy tightening by the Fed and growing recession fears should act as a tailwind for the greenback. This, along with sinking commodity prices should keep a lid on any meaningful upside for the resources-linked Australian dollar. This makes it prudent to wait for strong follow-through buying before confirming that the AUD/USD pair has formed a near-term bottom and positioning for any further gains.
The US markets will remain closed on Monday in observance of Independence Day. Hence, the focus will remain on the RBA policy decision, scheduled to be announced during the Asian session on Tuesday. Traders will further take cues from the FOMC monetary policy meeting minutes on Wednesday. Apart from this, the closely-watched US monthly jobs report (NFP) on Friday will help determine the near-term trajectory for the AUD/USD pair.
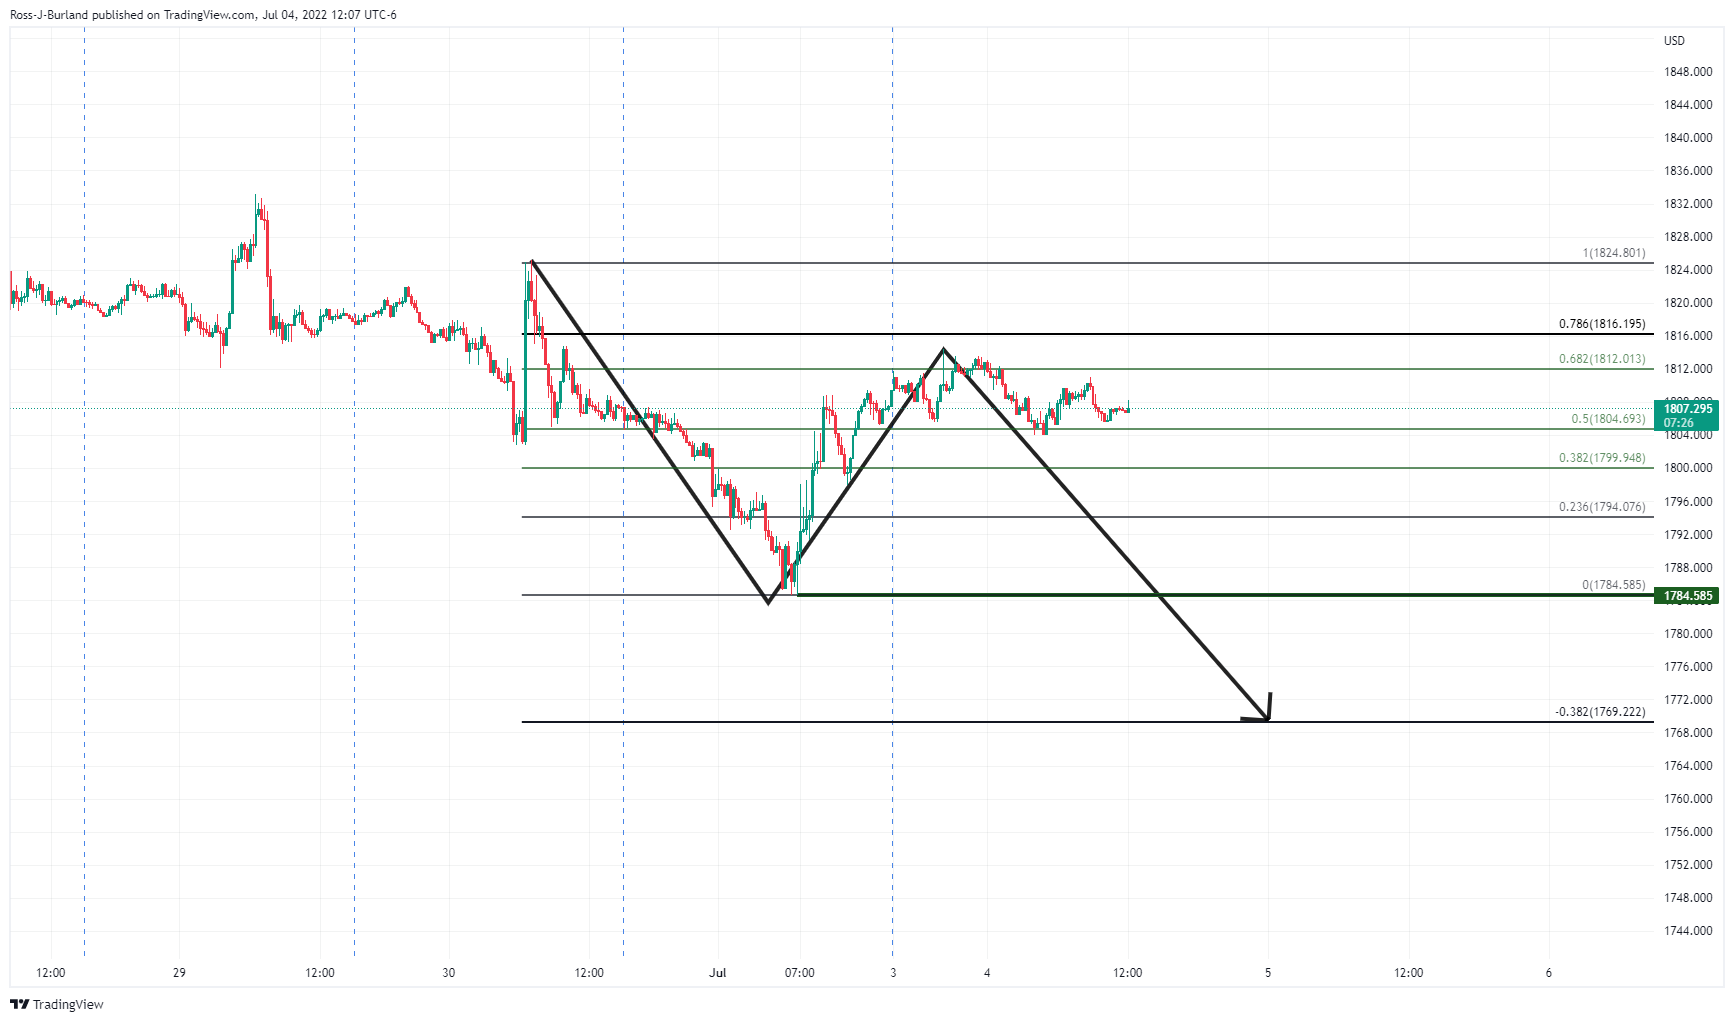
Gold Price is resuming its downside momentum at the start of a fresh week, having witnessed an impressive rebound on Friday. The US dollar is consolidating the minor rebound amid the renewed downtick in the Treasury yields and falling S&P 500 futures. The mixed market mood and holiday-thinned trading have kept gold bulls at bay. A death cross lurking on the daily chart is offering the much-needed boost to XAUUSD sellers. Attention now turns towards Wednesday’s FOMC June meeting’s minutes for the next price direction in the bright metal. In the meantime, the Fed rate hike expectations and recession fears will continue to dominate markets and influence the dynamics of the bullion price.
Also read: Gold Price Forecast: Death cross to ring knell for XAUUSD, as eyes turn to Fed Minutes
Gold Price: Key levels to watch
The Technical Confluence Detector shows that Gold Price is testing support at the Fibonacci 38.2% one-week at $1,806, below which the next downside target is aligned at the previous month’s low of $1,803.
The confluence support of the Fibonacci 23.6% one-week and Bollinger Band one-day Lower at $1,798 will then come to XAU buyers’ rescue. The last line of defense for gold bulls is seen around $1,794, the convergence of the Fibonacci 61.8% one-day and the pivot point one-day S1.
On the flip side, Friday’s high of $1,812 will lure byers, above which they will need to recapture the SMA5 one-day at $1,816. The intersection of the Fibonacci 23.6% one-month, SMA50 four-hour and the pivot point one-day R1 at $1,820 will be a tough nut to crack for bulls.
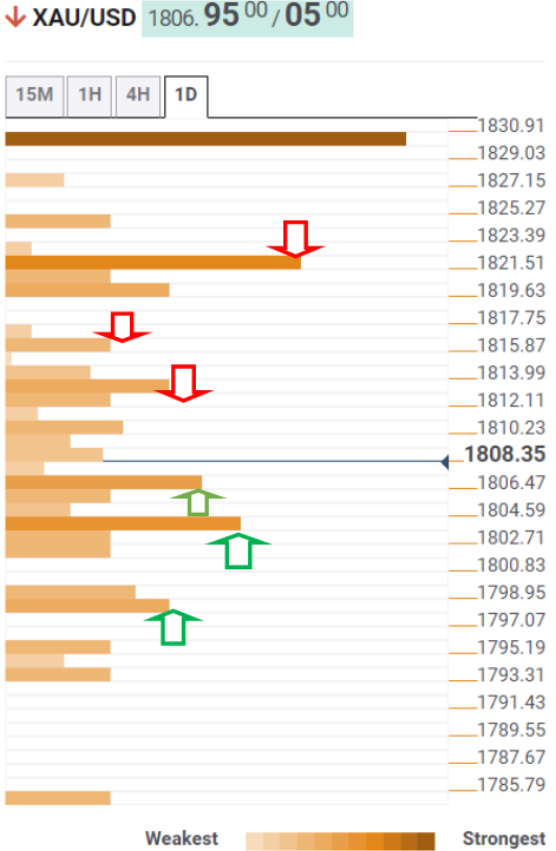
The TCD (Technical Confluences Detector) is a tool to locate and point out those price levels where there is a congestion of indicators, moving averages, Fibonacci levels, Pivot Points, etc. If you are a short-term trader, you will find entry points for counter-trend strategies and hunt a few points at a time. If you are a medium-to-long-term trader, this tool will allow you to know in advance the price levels where a medium-to-long-term trend may stop and rest, where to unwind positions, or where to increase your position size.
The single currency starts the week on a positive note and pushes EUR/USD back to the 1.0450 region on the back of renewed dollar weakness.
EUR/USD manages to regain some ground lost following Friday’s strong pullback and extend the rebound north of the 1.0400 hurdle on Monday.
The uptick in the pair comes amidst the inactivity in the US markets and against the backdrop of reduced trade conditions and scarce volatility.
Positive ECB speak saw Board member Müller advocating for a 25 bps rate raise at the July meeting followed by 50 bps hike at the September’s event. In line with these comments, his colleague Vasle said further rate hikes appear likely after September.
In the domestic calendar, trade balance figures in Germany showed a €1B deficit in May. In Spain, the Unemployment Change shrank by 42.409K in June and Producer Prices in the broader Euroland rose 36.3% in the year to May.
EUR/USD remains under pressure and still unable to gather serious upside traction, another proof that sellers remain well in control of the sentiment surrounding the European currency for the time being.
Indeed, the pair is still far away from exiting the woods and it is expected to remain at the mercy of dollar dynamics, geopolitical concerns, fragmentation worries and the Fed-ECB divergence.
Among positives for the euro can be found, however, in higher German yields, persistent elevated inflation in the euro area and a decent pace of the economic recovery in the region. Collaborating with this view also appears the generalized hawkish chatter around ECB’s rate-setters.
Key events in the euro area this week: Germany Balance of Trade (Monday) – Germany, EMU Final Services PMI (Tuesday) – Germany Construction PMI, EMU Retail Sales (Wednesday) – ECB Accounts (Thursday) – ECB Lagarde (Friday).
Eminent issues on the back boiler: Fragmentation risks. Kickstart of the ECB hiking cycle in July? Asymmetric economic recovery post-pandemic in the euro bloc. Impact of the war in Ukraine on the region’s growth prospects and inflation.
So far, spot is gaining 0.11% at 1.0438 and a break above 1.0615 (weekly high June 27) would target 1.0773 (monthly high June 9) en route to 1.0786 (monthly high May 30). On the other hand, immediate contention emerges at 1.0382 (weekly low June 30) seconded by 1.0358 (monthly low June 15) and finally 1.0348 (2022 low May 13).
USD/IDR progressively headed higher in June. Nevertheless, economists at MUFG Bank see some reasons to be positive about the Indonesian rupiah in the coming months.
“We anticipate underlying core inflation to be close to the upper end of BI’s 2-4% inflation target by the end of the year. We see BI raising the benchmark rate when underlying inflation moves within a 3-4% YoY range in Q3 or Q4 this year.”
“The trade balance outlook is positive despite a temporary setback in May. The palm oil export ban in May partially caused the trade balance to dip to USD2.9 bn from a record high of USD7.57 bn in April. We look for a rebound in the coming months after the ban has been lifted, from June onwards.”
“We still see elevated commodity prices in the coming months, which will be supportive of the IDR in the next few quarters.”
“We move our USD/IDR forecast profile higher, but forecast USD/IDR to move lower from 14,700 in Q3 to 14,500 in Q1-23 and Q2-23.”
The krona has continued to weaken over the past month resulting in EUR/SEK hitting an intra-day high of 10.740 in June. As economists at MUFG Bank note, global growth concerns offset support from a hawkish Riksbank.
“The krona has been undermined over the past month by building fears over a sharper slowdown in global growth. As a small and open economy, Sweden’s economy and the krona are more sensitive to the outlook for global growth.”
“The negative external environment has outweighed support from domestic developments. The Riksbank plans to raise the policy rate to close to 2.00% at the start of next year, and will speed up balance sheet shrinkage during the 2H of this year by allowing around SEK28 billion of maturing QE holdings to roll off without replacing.”
“The shift to tighter monetary policy should provide more support for the krona but only when growth concerns ease. In the near-term though growth concerns keep risks titled to the downside for the krona.”
Eurozone’s investor sentiment deteriorated sharply in July; the latest data published by the Sentix research group showed on Monday.
The gauge came in at -26.4 in July from -15.8 in May vs. -19.9 expected.
The USD/JPY pair attracted some dip-buying near the 134.80-134.75 region on Monday and climbed to a fresh daily high during the early European session. The intraday uptick, however, lacked follow-through beyond the mid-135.00s and remained capped amid subdued US dollar price action.
Last week's sustained breakdown below a two-week-old ascending trend-line and a subsequent fall below the 200-hour SMA was seen as a key trigger for bearish traders. The latter, currently around the 135.60 area, should act as a pivotal point and determine the USD/JPY pair's intraday move.
Technical indicators, meanwhile, are still far from confirming a negative bias on the daily chart. This makes it prudent to wait for strong follow-through selling before confirming that the USD/JPY pair has topped out in the near term and positioning for any further depreciating move.
From current levels, weakness below the 135.00 mark might continue to find decent support near the 134.80-134.75 region. This is closely followed by mid-134.00s, which if broken decisively would trigger fresh technical selling and make the USD/JPY pair vulnerable to slide further.
Spot prices might then break through the 134.00 round figure and accelerate the fall towards testing the next relevant hurdle near the 133.60 area. The corrective decline could further get extended towards the 133.00 mark before the USD/JPY pair drops to the 132.40-132.30 support zone.
On the flip side, momentum beyond 200-hour SMA has the potential to lift the USD/JPY pair back above the 136.00 mark. Any further move up is likely to attract fresh sellers near the 136.60 heavy supply zone and fizzle out ahead of the 137.00 mark, or a 24-year high touched last week.
-637925205798752756.png)
During June, the USD/CAD pair rose from 1.2657 to 1.2878. Economists at MUFG Bank expect the Canadian dollar to regain some ground but at a slow pace.
“The BoC meeting in July will be important and if the BoC follows the Fed’s lead, it will limit near-term downside risks. However, the global backdrop for risk is set to remain unfavourable and that points to broader US dollar strength. However, aggressive BoC action and a rebound in crude oil prices like we expect should limit the scope for USD/CAD to move higher in Q3.”
“The risk of a downturn in 2023 is increasing and given Canada’s closer links to the US where the Fed’s actions make a recession there more likely, it could result in a more muted recovery for the Canadian dollar.”
“We expect crude oil prices to decline in Q4 which could further undermine the extent of CAD recovery.”
“So while we expect CAD recovery from current levels, we have become a little more cautious over the extent of the recovery.”
EUR/USD has gone into a consolidation phase following last week's decline. In the absence of high-tier macroeconomic data releases, the pair could find it difficult to make a decisive move in either direction in the near term, FXStreet’s Eren Sengezer reports.
“Stock and bond markets in the US will be closed in observance of the Independence Day holiday and EUR/USD's trading action is likely to remain subdued.”
“On the upside, 1.0440 (static level, 20-period SMA) forms interim resistance ahead of 1.0470 (Fibonacci 23.6% retracement of the latest downtrend) and 1.0500 (psychological level, 100-period SMA).”
“Initial support is located at 1.0400 before 1.0380 (static level) and 1.0360 (static level).”
During June, the New Zealand dollar depreciated against the US dollar from 0.6502 to 0.6227. Economists at MUFG Bank expect the NZD/USD pair to remain under pressure in this quarter before turning back higher by the end of the year.
“As fears mount globally over recession risks, currencies like NZD that are further along the tightening path could suffer. The RBNZ is committed to lifting rates toward 4.00% although similar to other G10 countries, will likely not deliver what current guidance suggests.”
“Of benefit for NZD will be a favourable terms of trade with global food prices rising while we also expect a gradual improvement in China’s economic growth.”
“Beyond the likely period of tighter financial conditions in Q3, we see reason for NZD to gradually appreciate from Q4 onwards.”
European Central Bank (ECB) Governing Council member Madis Muller told Bloomberg that it would be appropriate for the ECB to hike its policy rate by 25 basis points in July.
"We should continue with a further hike of 50 basis points in September," Muller added and noted that the rate path was in line with most other ECB officials' views.
The EUR/USD pair edged slightly lower on these comments and was last seen trading at 1.0424, where it was down 0.05% on a daily basis.
Silver failed to capitalize on Friday's goodish recovery move from a two-year low and witnessed subdued/range-bound price action on the first day of a new week. The XAG/USD remained confined in a narrow band through the early European session and was last seen trading around the $19.85-$19.80 area, down over 0.20% for the day.
Given Friday's convincing break below a one-month-old descending trend channel support, the near-term bias still seems tilted in favour of the XAG/USD bears. That said, RSI (14) on 4-hour/daily charts is flashing oversold conditions and warrants some caution before positioning for an extension of a nearly one-month-old descending trend.
The mixed technical set-up makes it prudent to wait for some near-term consolidation or modest rebound before the next leg down. Nevertheless, the XAG/USD remains vulnerable to retest the YTD low, around the $19.40-$19.35 region touched on Friday, and prolong the depreciating move towards the next relevant support near the $19.00 mark.
On the flip side, any meaningful positive move beyond the $20.00 psychological mark might confront hurdle near the descending trend-channel support breakpoint, currently around the $20.25 region. The said area should now act as a pivotal point, above which the XAG/USD could extend the recovery momentum towards the $20.55-$20.60 horizontal zone.
Some follow-through buying beyond the latter would negate the near-term bearish outlook and trigger a short-covering rally. The XAG/USD might then surpass the $21.00 mark and aim to challenge the $21.40-$21.45 confluence, comprising the top end of the aforementioned descending channel and the 200-period SMA on the 4-hour chart.
-637925183595696544.png)
During June, the Australian dollar depreciated against the US dollar from 0.7167 to 0.6888. Beyond some near-term challenges, the outlook for AUD is better. Therefore, economists at MUFG Bank expect the aussie to recover by the end of the year.
“We see risk potentially deteriorating further with corporate earnings coming under pressure, corporate credit worsening and inflation remaining elevated over the short-term. The speed in which the Fed and other central banks are now hiking will have a negative impact on risk, the global growth outlook and hence AUD.”
“Easier policy in China and the lift to growth as lockdowns end should boost AUD demand into year-end and in 2023. By then too, the inflation angst undermining investor confidence should also have eased and with by then asset prices more aligned with downside growth risks, there will be scope for some AUD recovery.”
“The market is currently priced for around 225 bps of RBA rate hikes which we do not believe will be delivered. But it will be similar for the Fed as well and that will be the catalyst for some broader reversal of US dollar strength, helping lift AUD/USD.”
The Chinese yuan appreciated slightly despite a stronger US dollar in June. Economists at MUFG Bank expect the USD/CNY to move downward anf forecast the pair at 6.60 by year-end.
“We maintain an appreciation bias towards CNY against the US dollar for July and the rest of this year, due to further recovery of the economy helped by potentially more easing policies.”
“The potential improving sentiment could help attract inflows and push CNY stronger, we see USD/CNY to be 6.65 by the end of Q3, 6.60 by the end of Q4, 6.57 by the end of Q1 2023, and 6.54 by the end of Q2 2023.”
Here is what you need to know on Monday, July 4:
Following Friday's volatile action, markets stay relatively quiet on Monday. Stock and bond markets in the US will be closed in observance of the Fourth of July holiday. The European economic docket will feature Producer Price Index (PPI) data for July and the Bank of Canada will release its Business Outlook Survey in the second half of the day. The US Dollar Index, which gained nearly 1% last week, was last seen moving sideways slightly above 105.00 and US stock index futures were posting small losses.
The data published by Eurostat showed on Friday that the Core Harmonised Index of Consumer Prices (HICP) edged lower to 3.7% on a yearly basis in June from 3.8% in July. Later in the day, the US data revealed that the ISM Manufacturing PMI dropped to 53 in June from 56.1 in May. The Employment and New Orders components of the ISM's survey came in below 50, showing monthly contractions. The benchmark 10-year US Treasury bond yield broke below 3% after this data and ended up losing nearly 8% on a weekly basis.
USD/CHF came under modest bearish pressure and was last seen trading below 0.9600 after the data from Switzerland showed that the Consumer Price Index climbed to 3.4% on a yearly basis in June from 2.9% in May.
EUR/USD moves sideways below 1.0450 early Monday. The pair lost more than 100 pips last week with investors reassessing the European Central Bank's policy outlook amid mixed inflation data.
GBP/USD is trading modestly higher on the day above 1.2100 in the European morning. Over the weekend, foreign ministers of Germany and Ireland said in a joint statement there was no legal or political justification for the UK to unilaterally change the terms of the Northern Ireland Protocol.
USD/JPY clings to gains near 135.50 early Monday after having closed the last two days of the previous week in negative territory. Kazuo Momma, a former top official in charge of monetary policy at the Bank of Japan (BOJ), told Bloomberg TV on Monday that he expects the BOJ to keep its easy monetary policy for many quarters to come.
Gold dropped to its lowest level since January at $1,784 on Friday but managed to stage a rebound amid plunging US yields. XAU/USD moves sideways in a relatively tight range near $1,810 in the early European session.
Bitcoin failed to reclaim $20,000 on Sunday and was last seen losing nearly 2% on the day at $19,100. Ethereum fluctuated in a tight channel over the weekend but came in under renewed bearish pressure at the start of the week. ETH/USD is edging lower toward $1,000, losing 2.5% on a daily basis.
The Turkish lira remains on the defensive and lifts USD/TRY to new daily highs in the 16.80 region at the beginning of the week.
USD/TRY advances for the third session in a row on Monday and slowly approaches the key barrier at the 17.00 yardstick. Indeed, after bottoming out near 16.00 on June 27, the lira already depreciated more than 4%, reflecting the persistent scepticism in the FX community regarding any attempt of the government/central bank to fight the bearishness surrounding the currency.
The pair edges higher despite the dollar gives away part of recent gains and after inflation figures in Türkiye showed consumer prices rising at an annualized 78.62% in the year to June and 4.95% on a monthly basis. The Core CPI rose 64.42% YoY and Producer Prices increased 138.31% over the last twelve months.
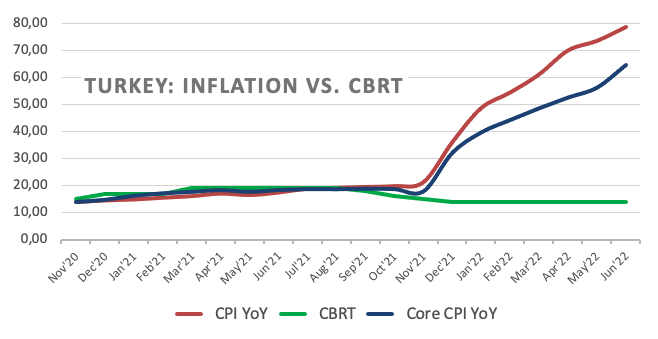
USD/TRY looks to consolidate the sharp rebound from 16.00 neighbourhood, as investors continue to digest the latest announcement by the Turkish banking watchdog (BDDK) on June 27.
So far, the lira’s price action is expected to keep gyrating around the performance of energy prices, the broad risk appetite trends, the Fed’s rate path and the developments from the war in Ukraine.
In addition, the effects of this new measure aimed at supporting the de-dolarization of the economy will also have its say, at least in the very short term.
Extra risks facing the Turkish currency also come from the domestic backyard, as inflation gives no signs of abating, real interest rates remain entrenched in negative figures and the political pressure to keep the CBRT biased towards low interest rates remain omnipresent.
Key events in Türkiye this week: Inflation Rate, Producer Prices (Monday) – Current Account (Friday).
Eminent issues on the back boiler: FX intervention by the CBRT. Progress (or lack of it) of the government’s new scheme oriented to support the lira via protected time deposits. Constant government pressure on the CBRT vs. bank’s credibility/independence. Bouts of geopolitical concerns. Structural reforms. Presidential/Parliamentary elections in June 23.
So far, the pair is gaining 0.37% at 16.7900 and faces the immediate target at 17.3759 (2022 high June 23) seconded by 18.2582 (all-time high December 20) and then 19.00 (round level). On the other hand, a breach of 16.0365 (monthly low June 27) would pave the way for a test of 15.6684 (low May 23) and finally 15.3019 (100-day SMA).
The US Dollar Index (DXY) jumped by close to 3.0% in June. Economists at MUFG Bank expect the greenback to remain on solid foot before reversing back lower by year-end and more evident in 2023.
“We can now say that the FOMC rates guidance (dots profile) has become much more aligned with market pricing of what is required to bring inflation back under control. This suggests that the rate spread dynamic that helped fuel US dollar strength could now be reaching an end. However, the window for US dollar strength is not closed yet and the consequences of market rates reaching the levels consistent with fighting inflation risks mean the negative growth implications that still lie ahead.”
“Tighter financial conditions will likely fuel further US dollar demand as equities decline and risk aversion increases.”
“Tighter financial conditions in Q3 mean further US dollar strength is likely but the start of a pause before the scope for some monetary easing in summer 2023 means the trend of US dollar appreciation should turn before the end of this year and become clearer in 2023.”
See – US dollar: Forecasts from seven major banks, strength to fade next year
The GBP/USD pair edged higher on the first day of a new trading week and built on Friday's late rebound from the 1.1975 region, or the lowest level since June 14. The pair held on to its modest gains through the early European session and was last seen trading near the daily high, just above the 1.2100 mark.
The recent sharp decline in the US Treasury bond yields kept the US dollar bulls on the defensive, which, in turn, offered some support to the GBP/USD pair. That said, the Federal Reserve’s non-stop chatter about rate hikes to curb soaring inflation, along with the prevalent risk-off mood, acted as a tailwind for the safe-haven buck.
Speaking at the ECB Forum in Sintra last Wednesday, Fed Chair Jerome Powell lifted market bets for more aggressive rate hikes and said that the US economy is well-positioned to handle tighter policy. Powell further added that the Fed remains focused on getting inflation under control and that the market pricing is pretty close to the dot plot.
The Fed's hawkish outlook added to growing market concerns that rapidly rising rates and tightening financial conditions would pose challenges to global economic growth. Adding to this, the ongoing Russia-Ukraine war and a fresh COVID-19 outbreak in China, have stoked fears of a possible recession and continued weighing on investors' sentiment.
Furthermore, concerns about fresh UK-EU tensions over the Northern Ireland Protocol of the Brexit agreement should hold back traders from placing bullish bets around the British pound. In the latest development, the UK House of Commons last week voted in favour of a bill that would unilaterally overturn part of Britain's divorce deal from the EU.
Given that the US markets are closed in observance of Independence Day, the fundamental backdrop warrants some caution for aggressive bullish traders. Hence, it will be prudent to wait for strong follow-through buying before confirming that the GBP/USD pair has formed a near-term bottom and positioning for any meaningful upside.
During June, the yen weakened sharply versus the US dollar from 128.61 to 135.87. Economists at MUFG Bank now expect USD/JPY to correct lower.
“We expect the US dollar more broadly to strengthen in Q3 on tightening financial conditions and with inflation remaining high, and the Fed to tighten further, the scope for a near-term correction lower in USD/JPY is not large. However, yields have begun to fall sharply which if sustained in these fast moving markets could see USD/JPY correct more quickly than we expect.”
“Still, overall the macro and financial market backdrop points to USD/JPY lower, not higher.”
The pound weakened against the US dollar in June. But the pound also weakened versus the euro. Economists at MUFG Bank highlight GBP’s downside risks.
“The OECD forecast for growth in 2023 was put at zero percent. Consumer confidence hit another record low, retail sales over April and May were weaker than expected while real GDP contracted by 0.3% MoM in April, weaker than expected. Terrible current account data for Q1 is likely to undermine GBP sentiment further. It highlights the vulnerability of GBP to increased risk aversion that we expect over the coming months.”
“Voting legislation through the House of Commons allowing the UK to unilaterally change the Northern Ireland Protocol may be well-timed politically (to deflect from Boris’ other troubles like a record swing against the Tories in a by-election) but will only add to the negative sentiment. Increased conflict with the EU will only raise uncertainty and undermine trade further.”
“The risks for GBP/USD over Q3 is to the downside given GBP tends to perform poorly as financial conditions tighten. Beyond then, even as GBP/USD recovers, GBP will remain weak versus EUR.”
The Reserve Bank of Australia (RBA) will announce its next policy decision on Tuesday, July 5 and as we get closer to the release time, here are the forecasts by the economists and researchers of eight major banks regarding the upcoming central bank's decision.
The RBA is set to hike the Official Cash Rate (OCR) by another 50 basis points (bps) to 1.35% in July vs. June’s 0.85%.
“We see the RBA tightening by 50 bps taking the cash rate target to 1.35%. The accompanying statement will likely repeat June’s wording that ‘the Board expects to take further steps in the process of normalising monetary conditions in Australia over the months ahead.’ This is a clear signal of future rate hikes.”
“We see the RBA hiking the cash rate target by 50 bps to 1.35%. Inflation expectations have continued to rise, while supply-side pressures, particularly energy prices, remain high. Wage demands are likely to rise meaningfully unless hiring intentions start to fall. Excess household savings, which we estimate at c.11% of GDP, and the tight labour market should sustain spending in the earlier stage of monetary policy normalisation amid higher inflation and mortgage rates.”
“We expect the Board will decide to lift the cash rate by 50 bps from 0.85% to 1.35%. We will be particularly interested in any guidance the Governor may provide about the August meeting, where we expect a third consecutive 50 bps move prior to a pause in September. The June quarter inflation data, to be published on Wednesday, July 27, will be a key update a little less than a week prior to the August Board meeting.”
“We expect the RBA to hike rates by 50 bps on the back of still persistent global inflation pressures.”
“Given the strong data prints and upside inflation risks, we expect the RBA to take decisive action and hike by 50 bps. However, we see a low likelihood of the RBA sounding more hawkish in the statement after the Governor's successful attempt in paring back aggressive OIS pricing.”
“The RBA faces a dilemma at its forthcoming meeting. To hike by 25 bps or 50 bps? We feel the odds are stacking up firmly for 50 bps. Even in the event of a hawkish surprise, expect very limited benefits for AUD in the near term.”
“We expect the RBA to increase the cash rate target from 0.85% to 1.35%, which would mark two consecutive big-step hikes. The RBA will continue to say that it expects to take further steps in the process of normalising monetary conditions over the months ahead, which we interpret to mean that the policy rate will be raised to a neutral level of 2.5% by the year-end. The RBA will continue to highlight near-term upside potential in inflation from both global and domestic factors. Its upbeat assessment of economic growth and labour market conditions combined with a cautious approach on consumption will also be the same as in June.”
“We expect the central bank to hike by 50 bps.”
During June the euro weakened versus the US dollar moving from 1.0723 to 1.0463. In the view of economists at MUFG Bank, we could see a period of EUR/USD trading below the key psychological level of 1.00.
“We suspect the risk for US and global equities remains to the downside in Q3 as inflation remains elevated; growth slows; and the Fed and other central banks continue to tighten. That suggests further downside risks to EUR/USD over the short-term as financial conditions tighten further.”
“Our near-term view for EUR to drift lower is also based on the primary risk for near-term growth in the eurozone – a further spike higher in natural gas prices. As natural gas prices rise, recession risks will increase putting downward pressure on the euro.”
“We have lowered our Q3 EUR/USD forecast notably (from 1.0600) and consider a breach of parity this quarter as now a very plausible risk.”
“Assuming risk conditions slowly turn more favourable and inflation risks recede, EUR/USD has greater scope to move higher beyond Q3/Q4.”
The People’s Bank of China (PBoC) and the Hong Kong Monetary Authority (HKMA) intend to launch a new “Swap Connect”. At the same time, PBoC upgrades currency swap with HKMA. The yuan received a bit of a boost but is still seen struggling to strengthen due to PBoC’s tight controls on capital flows, economists at Commerzbank report.
“A new ‘Swap Connect’ will allow international investors to participate in the China onshore interest rate derivative market. PBoC also said it has upgraded the currency swap facility with Hong Kong to a permanent agreement and expanded it to CNY800 bn. The aims are to provide long-term liquidity support to the Hong Kong market, help stabilize market expectations, and importantly, promote the development of the offshore CNY market in Hong Kong.”
“We see the latest initiatives as another small and incremental step from China to promote the internationalization of CNY. It will aim to promote greater settlement of bilateral trade in CNY. However, it still has a long way to go for CNY to be an investment vehicle because of PBoC’s tight controls on capital flows.”
“The divergent path for USD and CNY rates is still likely to keep USD/CNY well supported for now.”
USD/CHF fades bounce off intraday low as sellers flirt with three-day-old support heading into Monday’s European session. That said, the Swiss currency (CHF) pair trades around 0.9585 by the press time.
The quote renewed its daily low after the Swiss Consumer Price Index (CPI) rose to 0.5% MoM and 3.4% YoY versus the respective market consensus of 0.3% and 3.2%.
It’s worth noting that the USD/CHF weakness also takes clues from the failures to cross the 100-EMA, around 0.9640 by the press time.
However, sellers not only need to break the immediate support line surrounding 0.9575 but also keep reins past a downward sloping trend line from May 27, close to 0.9515 at the latest, to reject the bulls.
Following that, the south-run can aim for March’s high of 0.9460.
Alternatively, recovery moves need to cross the 100-EMA level of 0.9640 to convince short-term USD/CHF buyers.
Even so, the 38.2% and 50% Fibonacci retracement levels, around 0.9715 and 0.9780 in that order, could challenge the pair buyers.
Overall, strong prints of the Swiss inflation data add strength to the bearish bias over the USD/CHF pair.
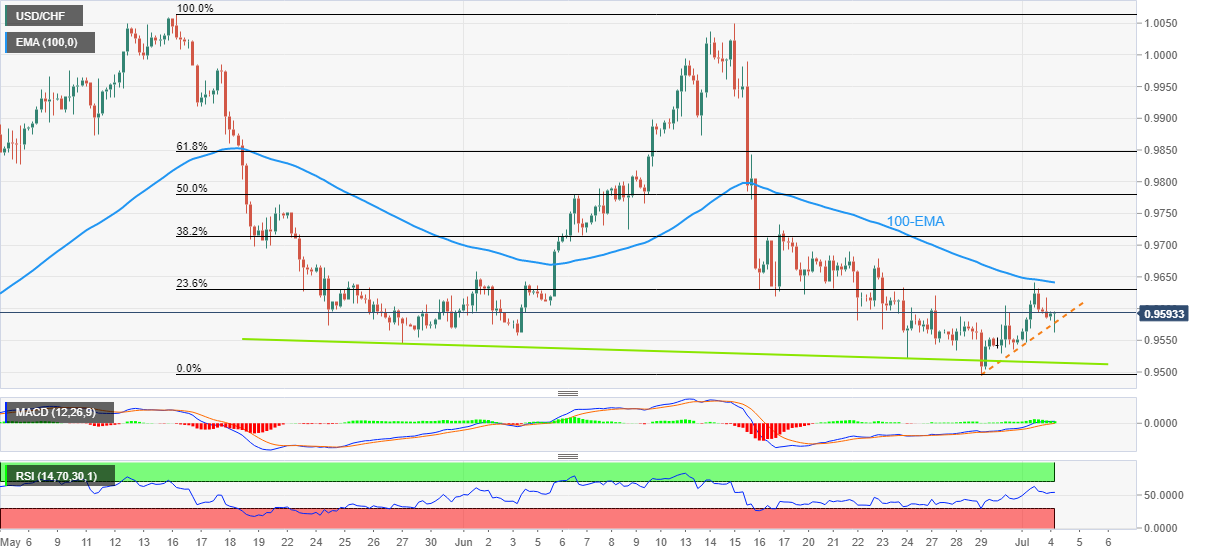
Trend: Further weakness expected
It seems clear that the prospects for Europe are not rosy at present. In the event of a gas supply crisis, the EUR/USD could slump below parity, economists at Commerzbank report.
“A gas supply crisis would be a Europe-specific problem. If things turn out as badly as that, it would only affect Europe, would only affect the ECB’s monetary policy and would therefore constitute a reason for idiosyncratic EUR weakness.”
“If it does happen, I expect EUR/USD levels below parity. The fact that in our projections I expect rising EUR/USD levels is only due to the fact that based on our bank’s central scenario there will not be a gas crisis in Europe.”
The US Dollar Index (DXY), which gauges the greenback vs. a bundle of its main rivals, alternates gains with losses near the key 105.00 mark at the beginning of the week.
The index trades within a tight range at the beginning of the week against the backdrop of marginal trading conditions in response to the inactivity in the US markets due to the Independence Day holiday.
In the meantime, and while a 75 bps rate hike by the Fed at the July meeting looks almost fully priced in, the dollar is expected to follow market chatter around a probable US recession and alternating risk appetite trends.
Later in the week, all the attention will be on the publication of the FOMC Minutes and US labour market, as the ADP report and Initial Claims are due on Thursday ahead of the more relevant Nonfarm Payrolls for the month of June on Friday.
Renewed risk-off sentiment motivated the index to reclaim the area around the 105.00 zone in past sessions, all in spite of declining US yields.
The dollar, in the meantime, remains well supported by the Fed’s divergence vs. most of its G10 peers (especially the ECB) in combination with bouts of geopolitical effervescence, higher US yields and a potential “hard landing” of the US economy, all factors suggesting a stronger dollar in the next months.
Key events in the US this week: Factory Orders (Tuesday) – MBA Mortgage Applications, Final Services PMI, ISM Non-Manufacturing, FOMC Minutes (Wednesday) – ADP Report, Initial Claims, Balance of Trade (Thursday) – Non-farm Payrolls, Unemployment Rate, Wholesale Inventories, Consumer Credit Change (Friday).
Eminent issues on the back boiler: Hard/soft/softish? landing of the US economy. Escalating geopolitical effervescence vs. Russia and China. Fed’s more aggressive rate path this year and 2023. US-China trade conflict. Future of Biden’s Build Back Better plan.
Now, the index is down 0.02% at 105.09 and faces the next support at 103.67 (weekly low June 27) seconded by 103.41 (weekly low June 16) and finally 101.29 (monthly low May 30). On the other hand, a break above 105.54 (weekly high June 30) would expose 105.78 (2022 high June 15) and then 107.31 (monthly high December 2002).
Gold trades slightly aboe the $1,810 mark. Economists at ANZ Bank expect the yellow metal to find suppor at current levels and move toward $1,900.
“Rising expectations of aggressive rate hikes and a stronger dollar are headwinds for gold. Still, equity market weakness and ongoing geopolitical uncertainty should support investor demand.”
“We expect gold to find its floor near current levels, with upside potential of $1,900/oz.”
FX option expiries for July 4 NY cut at 10:00 Eastern Time, via DTCC, can be found below.
- EUR/USD: EUR amounts
- GBP/USD: GBP amounts
- USD/JPY: USD amounts
- AUD/USD: AUD amounts
Gold Price defends minor recovery gains above $1,800 amid US holiday. As FXStreet’s Dhwani Mehta notes, death cross is set to ring knell for the yellow metal.
“Gold is faltering on its recovery momentum, as the 50-Daily Moving Average (DMA) is crossing the 200 DMA for the downside. If the bearish crossover is confirmed on a daily closing basis, it would validate a death cross, suggesting a beginning of a new downtrend in the yellow metal.”
“A daily candlestick close below the $1,800 mark will open up additional declines towards the critical horizontal support, now aligned at $1,785. The next downside target is seen at $1,780 the figure.”
“On the flip side, the rebound in XAUUSD could face strong offers at the falling trendline resistance at $1,822, above which bulls will call for a test of the bearish 21 DMA at $1,832 should the $1,830 level give way.”
Steel Price recalls bears after a brief absence during the last week as economic fears join the imbalance of the demand-supply matrix.
That said, the Construction steel rebar on the Shanghai Futures Exchange (SFE) fell more than 3.0% to 4,181 yuan per metric tonne while hot-rolled coil dropped around 3.5% and stainless steel dipped 0.9% per the data source Reuters.
The industrial metal’s latest weakness ignores the US dollar pullback from a two-week top as demand from the largest customer China and Europe appears limited of late.
The American Metal Market (AMM) source mentioned that bearish sentiment in the market due to falling scrap feedstock prices has limited buying activity for several weeks, per Reuters. Another AMM source from China stated, “Many mills are cutting production due to the summer holidays, low demand and high energy costs.”
It’s worth noting that the recession fears gained more strength after Friday’s US ISM Manufacturing PMI for June. The US ISM Manufacturing PMI for June slumped to the lowest levels in two years, to 53.0 versus 54.9 expected and 56.1 prior. Considering the data, analysts at the ANZ Bank said, “Surveyed data from both PMIs and the US ISM are all pointing to faltering orders growth, lower backlogs of work indices and softer production over the summer. It is hard to escape the growing growth pessimism, which is also fanning expectations of a peak in both inflation and central bank hawkishness.”
Further, fresh covid-led activity restrictions in China’s Anhui province join Russia’s claim of having complete control over Lysychansk also weighing on the Steel Price.
Additionally, a strong downside in the steel raw material markets also exerts downside pressure on the metal. On Monday, iron ore slumped more than 6.0% to 716 yuan ($106.98) a tonne on China’s Dalian Commodity Exchange.
It should be observed that increased metal exports from Australia and Brazil also weigh on steel inventories and lure the bears ahead of this week’s key events, namely Federal Open Market Committee (FOMC) Minutes and the US Jobs report for June.
CME Group’s flash data for natural gas futures markets noted open interest dropped for the second session in a row on Friday, this time by just 303 contracts. Volume followed suit and remained choppy after retreating by around 210.7K contracts.
Natural gas prices charted an inconclusive session on Friday, navigating around the 200-day SMA near $5.60 following the sharp pullback recorded on June 30. Shrinking open interest and volume amidst the current lack of direction in the commodity could be the prologue to some consolidative phase around current levels.
The EUR/USD pair is oscillating in a narrow range of 1.0424-1.0445 in the early European session. The asset has turned sideways as the US dollar index (DXY) is trading lackluster. Earlier, the asset witnessed a responsive buying action after hitting a low of 1.0365 on Friday. A firmer rebound in the major was backed by weakness in the DXY and a higher Eurozone Harmonized Index of Consumer Prices (HICP) print.
The eurozone agency reported the HICP at 8.6%, higher than estimates and the prior print of 8.4% and 8.1% respectively and similar to the inflation rate in the US economy. The inflation rate is scaling continuously higher in the eurozone and the European Central Bank (ECB) has yet not elevate its interest rates. However, this time a jumbo rate hike announcement cannot be ruled out as safeguarding households from the real income shock is invincible. It is worth noting that the ECB has yet not followed the footprints of Western leaders and may announce its first rate hike in 11 years.
On the dollar front, the DXY is awaiting the release of the Federal Open Market Committee (FOMC) minutes, which are due on Tuesday. The FOMC minutes will display the detailed ideology behind announcing the 75 basis point (bps) rate hike by the Federal Reserve (Fed). Apart from that, the US Nonfarm Payrolls (NFP) figures will remain in focus. A preliminary estimate for job additions in June is 250k, extremely lower than the former additions of 390k in May.
Gold Price (XAU/USD) picks up bids around $1,812 while stretching the previous day’s recovery from a multi-day low heading into Monday’s European session. In doing so, the precious metal rises for the second consecutive day as the US dollar buyers take a breather amid the US holiday.
That said, the US Dollar Index (DXY) remains pressured around 105.00 after refreshing a two-week top the previous day. The DXY’s latest consolidation could be linked to the US Independence Day holiday and the market’s preparations for the week’s key data/events, including the week’s Federal Open Market Committee (FOMC) Minutes and the US Jobs report for June.
It should be noted that the gold price dropped to the lowest level in five weeks after the US ISM Manufacturing PMI data propelled recession woes on Friday. The US ISM Manufacturing PMI for June slumped to the lowest levels in two years, to 53.0 versus 54.9 expected and 56.1 prior.
Considering the data, analysts at the ANZ Bank said, “Surveyed data from both PMIs and the US ISM are all pointing to faltering orders growth, lower backlogs of work indices and softer production over the summer. It is hard to escape the growing growth pessimism, which is also fanning expectations of a peak in both inflation and central bank hawkishness.”
Elsewhere, the options market indicator called the risk reversal (RR), calculated by the difference between calls and puts, portrays a bearish bias as the daily RR dropped for the fourth consecutive day to -0.195, the lowest in over a week, whereas the weekly figure marked third negative in a row with -0.5000 level. Further, the monthly RR slumped to the lowest since February during June, to -1.220, marking a three-month fall.
While portraying the mood, the S&P 500 Futures drop half a percent while the US Treasury yields remain unchanged after the biggest weekly fall since February due to the US holiday.
Moving on, the US holiday may allow gold prices to consolidate recent losses but the bears remain hopeful ahead of Wednesday’s Federal Open Market Committee (FOMC) Minutes and the US Jobs report for June, up for publishing on Friday.
A clear upside break of the three-day-old descending trend line hints at short-term recovery moves in the Gold Price. The hopes favoring corrective pullback also take clues from the firmer RSI and bullish MACD signals on the four-hour chart.
However, a convergence of the 100-SMA and 12-day-old descending trend line appears a tough nut to crack for the metal buyers, around $1,830 by the press time.
Alternatively, pullback moves need validation from the 23.6% Fibonacci retracement of June 12 to July 01 downside, near $1,806, to recall gold sellers.
Following that, the $1,800 threshold may act as an extra filter to the south before directing the bears towards the $1,780 and $1,760 static supports.
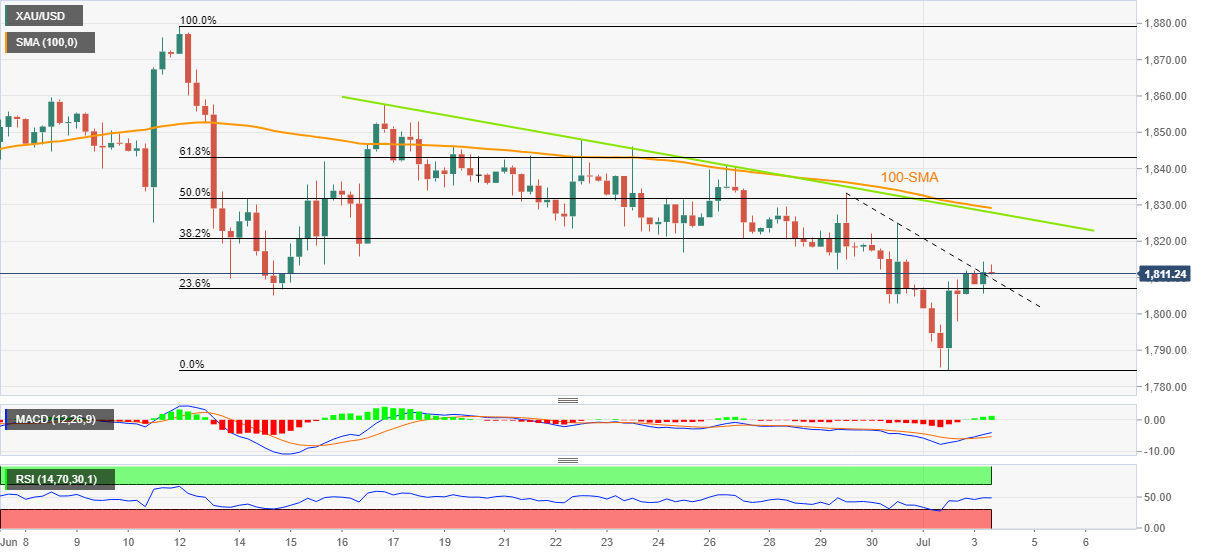
Trend: Corrective pullback expected
Gold closed the third straight week in negative territory. As FXStreet’s Eren Senfgezer notes, the technical outlook shows that the bearish bias stays intact in the short-term.
“The Relative Strength Index (RSI) indicator on the daily chart stays near 40, suggesting that gold remains bearish and has more room on the downside before turning technically oversold. Sellers, however, might stay on the sidelines until XAUUSD makes a daily close below $1,800 (psychological level). In that scenario, $1,780 (static level) aligns as the next bearish target ahead of $1,767 (static level).”
“On the upside, $1,810 (static level, former support) aligns as first technical hurdle before $1,832 (20-day SMA). The descending trend line coming from early March stays intact and forms stiff resistance at $1,840, where the 200-day SMA is located.”
The USD/CAD pair is facing barricades around the round-level resistance of 1.2900 as expectations of lower growth forecasts in the US economy have weakened the US dollar index (DXY). The major has traded in a narrow range of 1.2874-1.2903 in the Asian session and a similar performance is expected in the European session.
The downbeat US Institute of Supply Management (ISM) has bolstered the odds of a recession in the US economy. The US ISM delivered a vulnerable performance on all fronts: Manufacturing PMI, New Orders Index, and Employment Index.
In comparison with the Western leaders, the Federal Reserve (Fed) has been accelerating interest rates without much hesitation as firmer growth prospects and tight labor market were supporting the Fed policymakers to sound extremely hawkish. Now, the downbeat US ISM economic data has raised questions over the growth prospects. Apart from that, the consensus for the US Nonfarm Payrolls (NFP) has been cut significantly to 250k from the prior print of 390k. Therefore, higher policy rates have also started impacting the job market.
In the current scenario, an expectation of a consecutive 75 basis point (bps) interest rate hike is not lucrative. Therefore, bracing for a 50 bps or 25 bps rate hike would be justified.
On the loonie front, the spotlight is on the employment data, which will release on Friday. A preliminary estimate for the Unemployment Rate is 5.2% vs. the prior print of 5.1%. Meanwhile, the oil prices are extending their recovery as the asset is attempting to cross Friday’s high at $107.65. An occurrence of the same will drive the oil prices towards the critical hurdle of $109.00.
Advanced prints from CME Group for crude oil futures markets noted investors trimmed their open interest positions for the third straight session on Friday, this time by around 2.7K contracts. In the same line, volume shrank by 188K contracts after three consecutive daily pullbacks.
Prices of the barrel of WTI attempted a rebound following two sessions trading with losses on Friday. The move was amidst shrinking open interest and volume, hinting at the idea that further gains lack conviction in the very near term at least.
NZD/USD pares recent losses at a 26-month low, up 0.80% around 0.6210 heading into Monday’s European session, as the US dollar retreats from a two-week top amid the US holiday.
In doing so, the Kiwi pair ignores bearish signals from the options market as sellers lick their wounds ahead of the key US data/events.
That said, the NZD/USD risk reversal (RR), the spread between the call options and the put options, dropped the most in three weeks the previous day, to -0.260, after the US ISM Manufacturing PMI propelled the recession woes. The daily RR was fierce enough to drown the weekly print back in favor of the bears.
Given the lack of major data/events and the US holiday, NZD/USD can consolidate the latest downside move ahead of the Federal Open Market Committee (FOMC) Minutes and the US Jobs report for June.
Also read: NZD/USD regains 0.6200 but bulls need validation from Fed Minutes, US NFP
Open interest in gold futures markets recorded the second daily drop in a row on Friday, now by just 330 contracts according to preliminary readings from CME Group. Volume, instead, increased for the third consecutive session, this time by around 68.4K contracts.
Friday’s drop in gold to the proximity of the 2022 low at $1,780 and subsequent rebound was on the back of a small drop in open interest. That said, a more serious bounce looks not favoured for the time being, while the so far YTD low at $1,780 (January 28) is expected to hold the downside for the time being.
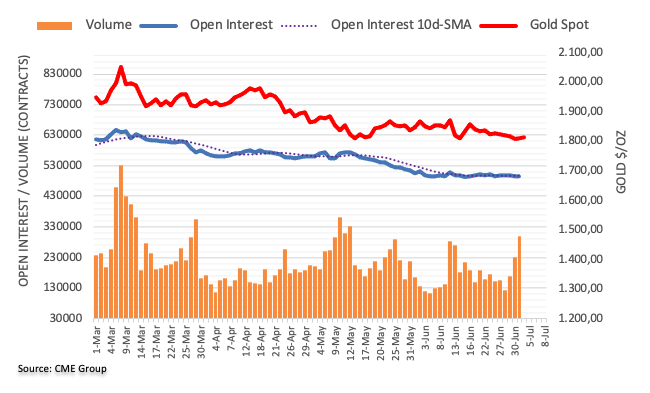
The USD/JPY pair has remained subdued in the Asian session, following the footprints of the US dollar index (DXY). The major slipped lower at the open to the crucial support of 134.78, however, the asset rebounded firmly and is now attempting to sustain above the round-level support of 134.78.
The DXY has turned sideways after sensing bids below the psychological support of 105.00. Also, the market participants are awaiting the release of the Federal Open Market Committee (FOMC) minutes. A modest rebound after a sheer downside move doesn’t resemble a bullish reversal. For the same, the asset needs more meaningful filters. Friday’s sell-off in the DXY is backed by the vulnerable performance of the US Institute of Supply Management (ISM).
The US ISM Manufacturing PMI landed at 53, lower than the expectations and the prior print of 54.9 and 56.1 respectively. Apart from that, the Employment Index and New Orders Index displayed a vulnerable performance. The downbeat economic data trimmed the odds of a bumper rate hike announcement by the Federal Reserve (Fed).
Traders should be aware of the fact that the catalysts behind Fed’s confidence in announcing extreme policy tightening measures were strong growth prospects and a tight labor market. Now, the overall demand and employment numbers will be affected by the Fed’s tightening measures. For more clarity, the consensus for the US Nonfarm Payrolls (NFP) has cut significantly to 250k from the prior print of 390k.
On the Tokyo front, the continuation of an ultra-loose monetary policy will weigh pressure on the yen bulls as other nations are suiting up for more rate hike announcements this month. The economy is facing the headwinds of soaring oil and food prices, which have elevated their plain-vanilla inflation rate but not the core Consumer Price Index (CPI).
USD/TRY braces for Turkish inflation data as it snaps a two-day uptrend around the highest levels in a week during early Monday morning in Europe. That said, the Turkish lira (TRY) pair stays pressured around the intraday low near $16.70 by the press time.
TurkStat is up for conveying June’s Consumer Price Index (CPI) data for Turkiye at 07:00 AM GMT. The nation’s inflation number rallied to the all-time high of 73.5% YoY in May. However, President Recep Tayyip Erdogan refrained from rate hikes, as always, while fueling the USD/TRY prices.
However, the recent qualitative moves by the Turkish government appear to have challenged the USD/TRY buyers.
Also, the US holiday and a pullback in the US Dollar Index (DXY) from a two-week high exert additional downside pressure on the pair ahead of the key Turkish data.
Ahead of the day, a Reuters poll mentions that Turkey's inflation is expected to rise above 78% in June and it was seen declining to just below 70% by end-2022. The survey also adds the reason as pricing behavior deteriorates across the board due to a weak currency and a loose monetary policy.
Elsewhere, news suggesting an increase in covid cases in China’s Anhui province joins Russia’s claim of having complete control over Lysychansk to weigh on the market sentiment and probe the USD/TRY bears.
It should be noted that the US ISM Manufacturing PMI for June slumped to the lowest levels in two years on Friday, to 53.0 versus 54.9 expected and 56.1 prior. The details suggested the Employment Index declined to 47.3 from 49.6 and New Orders Index fell to 49.2 from 55.1. Finally, Prices Paid Index dropped to 78.5 from 82.2, versus market forecasts of 81.0. It should be noted that the final readings of the S&P Global Manufacturing PMI for June dropped to the lowest level since July 2020, to 52.7 versus the flash estimate of 52.4 and 57 in May.
Following the data release, ANZ Bank said, “Surveyed data from both PMIs and the US ISM are all pointing to faltering orders growth, lower backlogs of work indices and softer production over the summer. It is hard to escape the growing growth pessimism, which is also fanning expectations of a peak in both inflation and central bank hawkishness.”
Hence, recession fears and cautious sentiment ahead of the key US data/events can keep the USD/TRY on the front foot even if the Turkish CPI manages to surprise traders, which is less likely.
21-day EMA guards immediate upside of the USD/TRY pair around $16.80 before highlighting the previous support line from early May, near $17.18 by the press time. Alternatively, a May month high near $16.45 could lure the bears during the quote’s further weakness.
Economist at UOB Group Lee Sue Ann suggests the Bank Negara Malaysia would hike the policy rate by 25 bps at its event later this week.
“BNM has signalled a more positive view on Malaysia’s economy amid signs of firmer economic growth which is supported by the easing of restrictions and reopening of international borders. This is why we think there is room for BNM to follow-through with another 25bps rate hike at both the Jul and Sep meetings.”
“Thus our updated OPR forecasts are 2.50% by end-2022 and 3.00% by mid-2023 (vs. 2.25% and 2.50% previously).”
Markets in the Asian domain are displaying mixed responses to falling S&P 500 futures in the Asian session. Friday’s gains in Wall Street were expected to infuse fresh blood in the Asian equities, however, the morning downside in the US indices futures has turned the asst cautious.
At the press time, Japan’s Nikkei225 has added 0.58%, Nifty50 and China A50 are trading flat, while Hang Seng slipped 0.60%.
Meanwhile, the US dollar index (DXY) is trading flat after a firmer correction on Friday. Last week, the asset witnessed a steep fall on the weekend as the downbeat US Institute of Supply Management (ISM) triggered recession fears. The economic data remained vulnerable on all fronts: Manufacturing PMI, Employment Index, and New Orders Index. This has also trimmed the odds of a mega rate hike announcement by the Federal Reserve (Fed).
On Tuesday, the Federal Open Market Committee (FOMC) will release June monetary policy minutes, which will dictate the detailed ideology behind the announcement of 75 basis points (bps) rate hikes.
On the oil front, the black gold is displaying subdued performance in the Asian session. However, the fossil fuels rebounded on Friday as investors shifted their focus on the supply worries. Oil remain will remain tight as the Western leaders have prohibited Russian oil imports. And, out of the OPEC cartel, Saudi Arabia and UAE have the infrastructure to accelerate oil production. However, they are already operating at full capacity.
The Bank of Japan (BOJ) will continue with its current monetary easing program “for many quarters to come” to ensure economic recovery and pursue a still remote target of sustainable 2% inflation, Kazuo Momma, a former top official in charge of monetary policy at the central bank, said in a Bloomberg TV interview on Monday.
Momma said, “there’s a good case for the BOJ to be sticking to the current yield curve control for the rest of this year or even after that.”
At the time of writing, USD/JPY has paused its rebound, now keeping its range near 135.10, down 0.06% on the day.
Copper Price stays on the bear’s radar around the lowest levels in 1.5 years as economic slowdown fears weigh on the industrial metal during Monday’s Asian session.
That said, the red metal prices as the three-month future contract on the London Metal Exchange (LME) dribble around $8,040, after hitting the lowest since February 2021 the previous day at $7,955. Further, the most-traded August copper contract in Shanghai fell more than 2.0% to 61,250 yuan a tonne by the press time.
It’s worth noting that the recent activity numbers suggest that PMIs from the US to Eurozone, economics revisit the levels last seen during the initial wave of the pandemic. Considering this, the ANZ Bank said, “Surveyed data from both PMIs and the US ISM are all pointing to faltering orders growth, lower backlogs of work indices and softer production over the summer. It is hard to escape the growing growth pessimism, which is also fanning expectations of a peak in both inflation and central bank hawkishness.”
It should be noted that Russia’s claim of having complete control over Lysychansk and news suggesting an increase in covid cases in China’s Anhui province exerts additional downside pressure on the metal prices.
On the contrary, news that Chile, the world’s largest copper producer, is up for changing the tax and royalty system for copper producers seems to have put a floor under the prices. However, an increase in production and higher stocks appear to keep the metal prices under pressure. "Chile's finance minister, Mario Marcel, on Friday introduced a tax reform bill that increases copper mining royalties on companies that produce more than 50,000 tonnes a year and raises taxes on high-income earners to fund the government's proposed social programs and reforms," said Reuters.
Looking forward, the US Independence Day holiday restricts the market’s immediate moves but this week’s Federal Open Market Committee (FOMC) Minutes and the US Jobs report for June appear crucial for short-term directions.
The USD/INR pair has rebounded from 78.90 after witnessing a corrective move. The asset was corrected after printing all-time highs at 79.22 on Friday. However, the major has reclaimed the psychological resistance of 79.00 on expectations of hawkish Federal Open Market Committee (FOMC) minutes for June monetary policy, which will release on Tuesday.
It is worth noting that the Federal Reserve (Fed) elevated its interest rates by 75 basis points (bps) in June. The Fed announced a bumper rate hike as price pressures are soaring in the US economy. The plain-vanilla inflation rate has reached 8.6%, which is hurting the households. The higher inflation rate has diminished the real value of the ‘paychecks’ of the general public.
Meanwhile, the US dollar index (DXY) is oscillating above 105.00 after a corrective move from Friday’s high at 105.63. This week, the release of the US employment data will also keep the FX domain on a volatile note. It is expected that the US economy has added 250k jobs in June, significantly lower than the former release of 390k. While the Unemployment Rate is seen as stable at 3.6%.
On the oil front, a firmer recovery in the oil prices has impacted the Indian rupee. The oil prices are holding themselves above $106.00. On Friday, the black gold displayed a strong rebound as bears exhausted. Meanwhile, investors have shifted their focus back to supply worries. Oil remain will remain tight as the Western leaders have prohibited Russian oil imports. And, out of the OPEC cartel, Saudi Arabia and UAE have the infrastructure to accelerate oil production. However, they are already operating at full capacity.
EUR/USD remains pressured around 1.0425-30, fading late Friday’s bounce off a fortnight low inside a falling wedge bullish chart formation.
In doing so, the major currency pair not only retreats from the upper line of the stated wedge but also steps back from the 50-HMA. However, the bullish MACD signals the lows marked since May 13 keep buyers hopeful.
However, the intraday sentiment hints at the pair’s further weakness towards the 1.0400 threshold.
Following that, the stated wedge’s support line, around 1.0355 and the yearly low of 1.0349, marked in May, will be important to watch for the bears.
In a case where the EUR/USD drops below 1.0349, the January 2017 bottom of 1.0340 could act as validation points for the further south-run.
Alternatively, buyers need to provide a successful break of the 50-HMA and the wedge’s upper line, around 1.0445, to retake controls.
Even so, the 200-HMA level surrounding 1.0515 could act as an extra filter to the north before directing the north-run towards the late June swing high near 1.0615.
Overall, EUR/USD is likely to witness intrday weakness but could portray a corrective pullback in the short-term.
-04072022-637925043573687621.png)
Trend: Corrective pullback expected
GBP/USD seesaws around 1.2100 as traders struggle for clear directions amid downbeat UK catalysts and the US dollar pullback. That said, the Cable bears take a breather around the two-week low during early Monday morning in Europe.
The US Dollar Index (DXY) remains pressured around 105.00 after refreshing a two-week top the previous day. The DXY’s latest consolidation could be linked to the US Independence Day holiday and the market’s preparations for the week’s key data/events, including the week’s Federal Open Market Committee (FOMC) Minutes and the US Jobs report for June.
Alternatively, chatters surrounding another attempt by the UK policymakers to oust Prime Minister (PM) Boris Johnson weigh on the GBP/USD prices. “Opponents of the Prime Minister will try to overhaul 1922 Committee rules so that another leadership challenge can be triggered immediately,” said the UK Telegraph.
Elsewhere, the latest survey from the British Chambers of Commerce (BCC) mentioned that 54% of more than 5,700 companies it surveyed between May 16 and June 9 expected turnover to increase over the next 12 months. This is down from 63% in the previous survey and the lowest share since late 2020, when many businesses were under some form of COVID restrictions, per Reuters. The news also stated, “British companies have turned increasingly glum about the outlook, with inflation surging and investment plans looking stagnant.”
It’s worth noting that the US dollar gauge refreshed its multi-day top the previous day after the US data propelled the recession woes. That said, the US ISM Manufacturing PMI for June slumped to the lowest levels in two years, to 53.0 versus 54.9 expected and 56.1 prior. The details suggested the Employment Index declined to 47.3 from 49.6 and New Orders Index fell to 49.2 from 55.1. Finally, Prices Paid Index dropped to 78.5 from 82.2, versus market forecasts of 81.0. It should be noted that the final readings of the S&P Global Manufacturing PMI for June dropped to the lowest level since July 2020, to 52.7 versus the flash estimate of 52.4 and 57 in May.
Additionally favoring the greenback is Russia’s claim of having complete control over Lysychansk and doubts over China’s ability to regain the economic transition, not to forget fresh covid woes from China’s Anhui province.
Against this backdrop, the US 10-year Treasury yields marked the biggest weekly fall since February whereas Wall Street benchmarks struggled for clear directions after Friday’s surprise gains. Further, S&P 500 Futures drop half a percent to portray the risk-off mood by the press time.
Looking forward, a lack of major data/events could restrict GBP/USD but the risk-off mood and negatives from the UK could keep the bears hopeful.
GBP/USD is expected to stretch the gradual south-run within a seven-week-old falling wedge bullish chart pattern, between 1.1780 and 1.2235 at the latest. It’s worth noting that the bears are likely to have run out of steam and hence further downside appears less favorable.
Gold price (XAU/USD) has overstepped the crucial resistance of $1,810.00 and is aiming to sustain above the same amid a weaker US dollar index (DXY). As investors have shifted to the sidelines ahead of the release of the June meeting minutes, the gold prices and the DXY are expected to display wild moves till then.
The DXY has displayed a repulsive action after slipping below the psychological support of 105.00 in the early Tokyo session. A modest rebound is expected to turn into a downside move sooner as odds of a bumper rate hike by the Federal Reserve (Fed) have trimmed.
Considering the soaring inflation in the US economy, investors were hoping for a consecutive 75 basis point (bps) rate hike by the Fed. Now, the downbeat US Institute of Supply Management (ISM) has trimmed the growth forecasts and the Fed might resort to a 50 bps rate hike or even less.
Apart from the Fed minutes, the US Nonfarm Payrolls (NFP) will hog the limelight. A preliminary estimate for the US NFP is 250k, significantly lower than the prior print of 390k.
The gold prices have taken support from the horizontal support placed on June 14 at $1,805.11. Going forward, the downward sloping trendline placed from June 12 high at $1,879.26 will act as a major barrier for the precious metal. The bright metal is firmly stable above the 20-period Exponential Moving Average (EMA) at $1,806.18. Meanwhile, the Relative Strength Index (RSI) (14) is attempting to violate 60.00, which will strengthen the gold bulls further.

The AUD/USD pair has given a downside break of the consolidation formed in a narrow range of 0.6808-0.6828 in the early Tokyo session. The asset displayed a rebound after hitting a low of 0.6764 on Friday. However, the pessimism on the broader timeframe is expected to guide the asset confidently.
On a four-hour scale, the aussie bulls have faced barricades around the potential demand zone that is placed in a narrow range of 0.6828-0.6850, which coincides with a fresh two-year-low.
The antipodean has failed to overstep the 10-period Exponential Moving Average (EMA) after attacking it at 0.6828 in the Tokyo session. Also, the 20-period EMA at 0.6850 is declining which adds to the downside filters.
Meanwhile, the Relative Strength Index (RSI) (14) has shifted into the bearish range of 20.00-40.00 for the first time in the past two weeks. An establishment into the bearish range b the RSI (14) indicates further weakness in the counter.
Should the asset violates Monday’s low at 0.6793, the greenback bulls will drag the asset towards the 29 November 2019 low at 0.6754. A breach of the latter will fetch more offers for the asset and will further drag the major towards the 2 October 2019 low at 0.6670.
Alternatively, a break of Wednesday’s high at 0.6965 will strengthen the aussie bulls. This will drive the asset towards the psychological resistance at 0.7000, followed by June 13 high at 0.7035.
-637924996322412831.png)
USD/CNH takes rounds to 6.6700 while trying to defend buyers during Monday’s Asian session. The offshore China yuan (CNH) currency pair’s latest gains could also be linked to the market’s risk-off mood and a light calendar. However, the US holiday and the People’s Bank of China’s (PBOC) move appear to have challenged the momentum traders of late.
That said, the PBOC announced on Monday that it has upgraded a currency swap facility with Hong Kong to a standing swap agreement and expanded the size to 800 billion yuan ($119.40 billion) from 500 billion yuan, per Reuters.
The Chinese central bank also hinted, per China Press, to aim for a lower Loan Prime Rate (LPR).
However, news suggesting an increase in covid cases in China’s Anhui province joins Russia’s claim of having complete control over Lysychansk to weigh on the market sentiment and challenge the USD/CNH bulls.
It’s worth noting that the US PMIs triggered risk-aversion the previous day and propelled the USD/CNH prices. That said, the US ISM Manufacturing PMI for June slumped to the lowest levels in two years, to 53.0 versus 54.9 expected and 56.1 prior. The details suggested the Employment Index declined to 47.3 from 49.6 and New Orders Index fell to 49.2 from 55.1. Finally, Prices Paid Index dropped to 78.5 from 82.2, versus market forecasts of 81.0. It should be noted that the final readings of the S&P Global Manufacturing PMI for June dropped to the lowest level since July 2020, to 52.7 versus the flash estimate of 52.4 and 57 in May.
Following the data, the ANZ Bank said, “Surveyed data from both PMIs and the US ISM are all pointing to faltering orders growth, lower backlogs of work indices and softer production over the summer. It is hard to escape the growing growth pessimism, which is also fanning expectations of a peak in both inflation and central bank hawkishness.”
Looking forward, a light calendar and the US holiday could challenge the market players ahead of this week’s Federal Open Market Committee (FOMC) Minutes and the US Jobs report for June.
Although the lower high since mid-June keep sellers hopeful, USD/CNH bears need validation from the monthly support line, around 6.6955 by the press time.
| Raw materials | Closed | Change, % |
|---|---|---|
| Brent | 114.47 | 1.6 |
| Silver | 19.846 | -2.1 |
| Gold | 1808.41 | 0.09 |
| Palladium | 1950.04 | 0.73 |
The People's Bank of China (PBOC) may further guide down the Loan Prime Rate (LPR), mainly the five-year one, in the second half of the year to help boost housing mortgages and stabilize market expectations, the Securities Daily reported, citing analysts.
"The PBOC will also use structural monetary policy tools, such as issuing additional re-lending tools for industries affected by the pandemic."
"The PBOC may also increase loan support for private enterprises faced with the dilemma of closing down or reducing production which in turn causes supply chain interruptions."
USD/JPY remains on the back foot despite the latest U-turn from the intraday low, around 135.00 during Monday’s Asian session. In doing so, the yen pair recovers from the 20-DMA support amid a sluggish session.
However, the quote’s sustained trading below the support-turned-resistance line from late May, around 135.45, joins bearish MACD signals and the RSI (14) pullback from the overbought territory to keep sellers hopeful.
That said, the fresh downside needs confirmation from the 20-DMA level surrounding 134.90.
Following that, the mid-June swing low and the 50-DMA could lure the USD/JPY bears around 131.50 and 131.40 in that order.
Also acting as the downside filter is the April 2022 high surrounding 131.25, a break of which could easily direct USD/JPY towards the 130.00 psychological magnet.
On the contrary, recovery remains elusive until crosses the 135.45 resistance line, previous support, a break of which could direct the pair buyers towards an upward sloping resistance line from June 21, around 137.10 by the press time.
Should the USD/JPY manage to remain firmer past 137.10, the odds of witnessing a run-up towards the 140.00 round-figure can’t be ruled out.
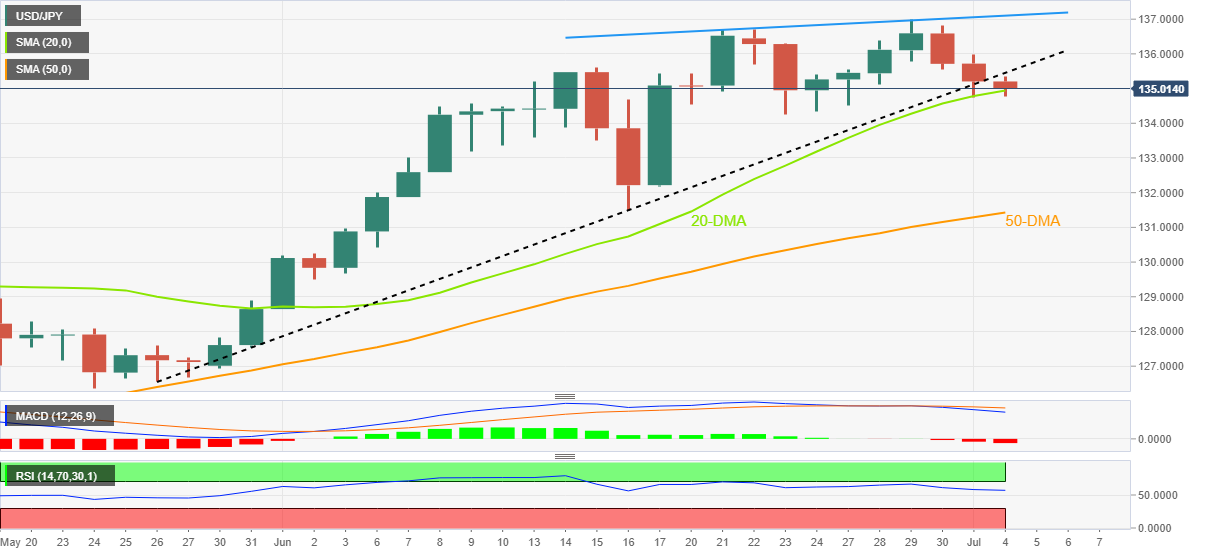
Trend: Further weakness expected
USD/CAD is on the verge of a move lower according to the daily market structure and so long as the recent highs continue to hold. The following illustrates the bearish bias from both a daily and hourly perspective.
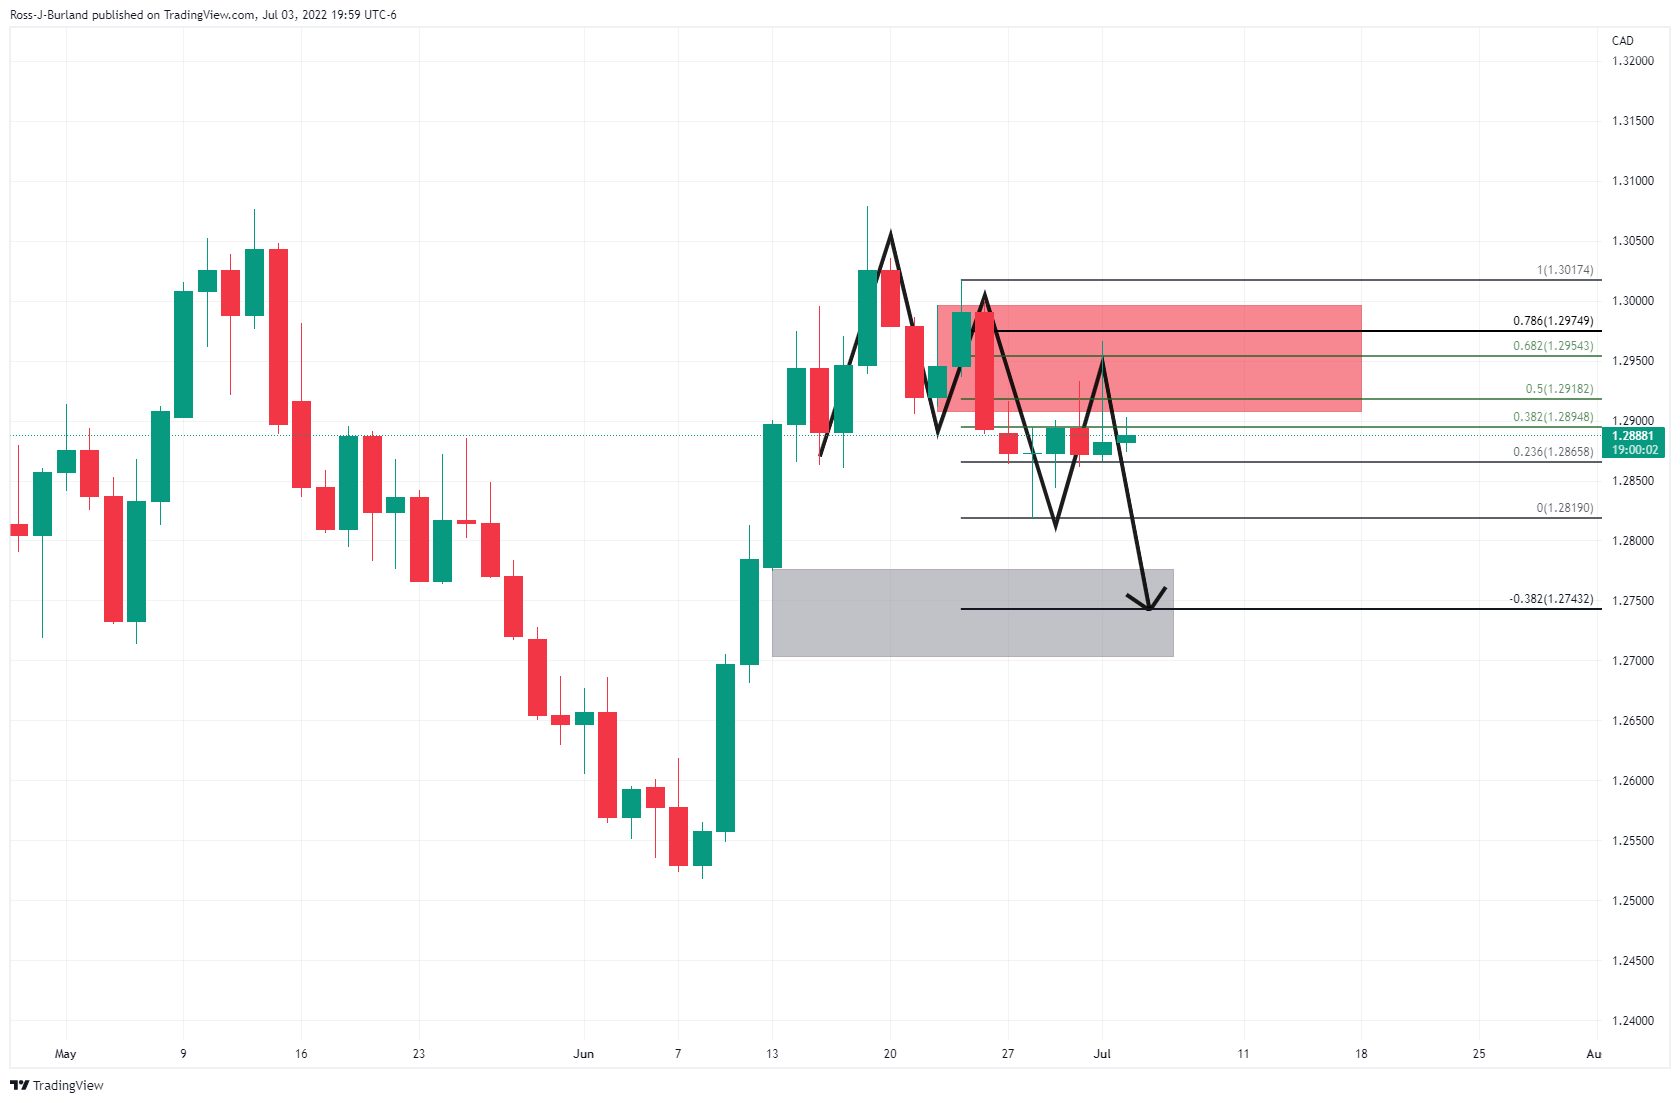
The price has been testing the daily M-formation's neckline with a rejection near a 61.8% Fibonacci level which puts the bias into the hands of the bears to start the week. There is an area of imbalance to the downside that cold be mitigated in the forth coming days.
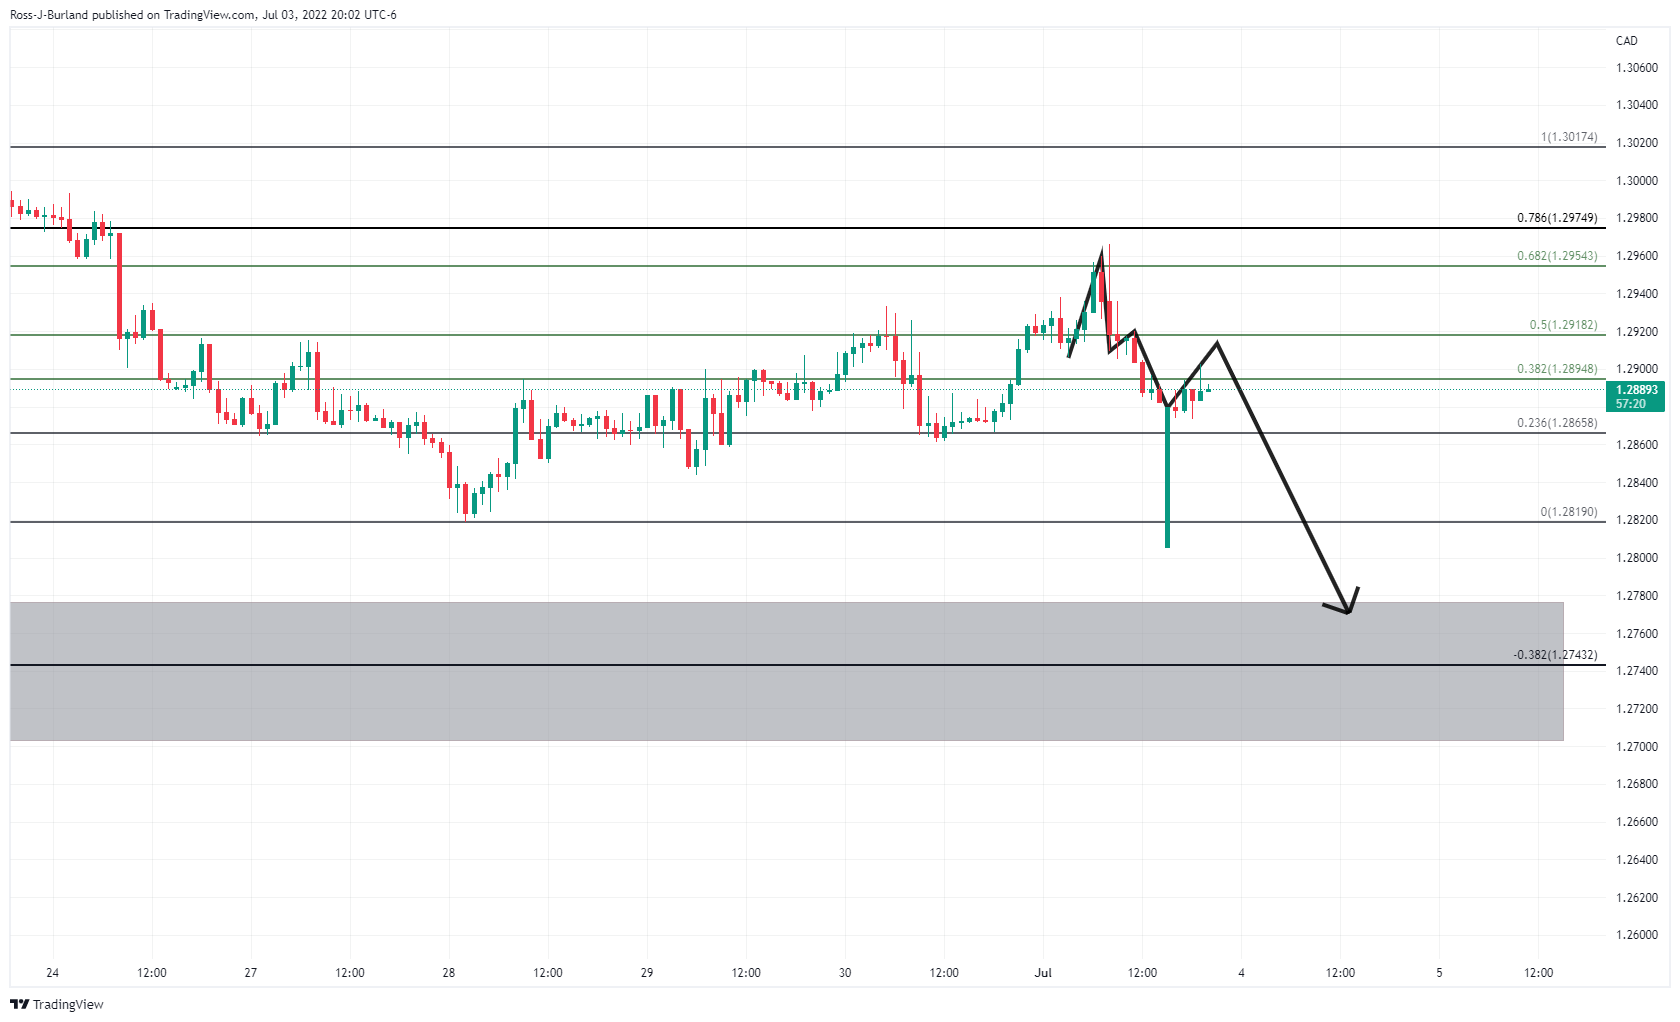
There is a bearish schematic playing out on the hourly chart with the M-formation's neckline vulnerable but resistance would be expected around there which could lead to a melt towards the daily imbalance as illustrated.
The People’s Bank of China (PBOC) announced on Monday, it has upgraded a currency swap facility with Hong Kong to a standing swap agreement and expanded the size to 800 billion yuan ($119.40 billion) from 500 billion yuan, per Reuters.
The agreement was signed by the People's Bank of China (PBOC) and the Hong Kong Monetary Authority (HKMA).
The upgraded agreement could provide more stable and long-term liquidity support to the Hong Kong market.
Will help stabilize market expectations and promote the development of Hong Kong's offshore yuan market.
USD/CNY was last seen trading at 6.6962, down 0.06% on the day.
Market sentiment remains fragile during Monday’s Asian session as traders await the key data/events while struggling for fresh impetus during the US holiday.
While portraying the mood, the S&P 500 Futures drop 0.80% intraday to 3,800, reversing the previous day’s corrective pullback from a two-week low.
It’s worth noting that Wall Street managed to cheer softer US PMIs while bracing for the Q2 earnings session. However, the market’s economic pessimism and cautious mood ahead of this week’s Monetary Policy Meeting Minutes from the Fed and the European Central Bank (ECB), as well as the US jobs report for Jun, appear to weigh on the risk profile of late.
Further, Russia’s claim of having complete control over Lysychansk and news suggesting an increase in covid cases in China’s Anhui province exerts additional downside pressure on the market sentiment.
On Friday, the US ISM Manufacturing PMI for June slumped to the lowest levels in two years, to 53.0 versus 54.9 expected and 56.1 prior. The details suggested the Employment Index declined to 47.3 from 49.6 and New Orders Index fell to 49.2 from 55.1. Finally, Prices Paid Index dropped to 78.5 from 82.2, versus market forecasts of 81.0. It should be noted that the final readings of the S&P Global Manufacturing PMI for June dropped to the lowest level since July 2020, to 52.7 versus the flash estimate of 52.4 and 57 in May.
It’s worth noting that the ANZ Bank said, “Surveyed data from both PMIs and the US ISM are all pointing to faltering orders growth, lower backlogs of work indices and softer production over the summer. It is hard to escape the growing growth pessimism, which is also fanning expectations of a peak in both inflation and central bank hawkishness.”
Following the data, Wall Street posted surprise gains but the US Treasury yields remained pressured below 3.0% to mark the biggest weekly fall since February.
Moving on, the US Independence Day holiday could restrict market moves but the economic fears and fresh fears could keep the risk profile weak, which in turn might help the US dollar to remain firmer.
GBP/JPY renews intraday low around 163.00 as risk-aversion intensifies during Monday’s Asian session. The bearish bias also takes clues from the downbeat signals surrounding the UK’s political and economic plays.
Having failed to remove UK Prime Minister (PM) Boris Johnson in their first attempt, the Conservative Party members eye another effort to oust the British leader, as signaled by the UK Telegraph. The news mentioned, “Opponents of the Prime Minister will try to overhaul 1922 Committee rules so that another leadership challenge can be triggered immediately.”
Elsewhere, the latest survey from the British Chambers of Commerce (BCC) mentioned that 54% of more than 5,700 companies it surveyed between May 16 and June 9 expected turnover to increase over the next 12 months. This is down from 63% in the previous survey and the lowest share since late 2020, when many businesses were under some form of COVID restrictions, per Reuters. The news also stated, “British companies have turned increasingly glum about the outlook, with inflation surging and investment plans looking stagnant.”
In Japan, news from Nikkei suggests that the elections are likely to favor the ruling party in Japan. The same hints at fewer challenges for the Bank of Japan’s (BOJ) easy money policies, which in turn could have probed the GBP/JPY bears but did not.
It’s worth noting that the market’s risk-off mood recently cheered the downbeat US PMIs as the ISM Manufacturing PMI for June slumped to the lowest levels in two years, to 53.0 versus 54.9 expected and 56.1 prior. Following the data, ANZ Bank said, “Surveyed data from both PMIs and the US ISM are all pointing to faltering orders growth, lower backlogs of work indices and softer production over the summer. It is hard to escape the growing growth pessimism, which is also fanning expectations of a peak in both inflation and central bank hawkishness.
Moving on, the US holiday and a light calendar may restrict GBP/JPY moves but sour sentiment can keep the sellers hopeful.
Unless bouncing back beyond the 21-DMA hurdle surrounding 165.35, GBP/JPY bears keep eyes on the seven-week-old support line, near 162.00 by the press time.
EUR/USD struggles to defend intraday gains around 1.0430 as risk-aversion challenges the markets during Monday’s Asian session. Additionally, chatters surrounding the European Central Bank (ECB) appear to have exerted additional downside pressure on the major currency pair as traders await the key data/events from Eurozone and the US.
The Financial Times (FT) came out with the news suggesting that the European Central Bank (ECB) is looking at ways to stop banks from earning billions of euros of extra profit from the ultra-cheap lending scheme it launched during the pandemic once it starts to raise interest rates later this month.
Other than the fears of negative actions for the European banks, chatters surrounding the global economic slowdown and the ECB’s hawkish moves also play their roles to confuse the traders as the US holiday restricts the market moves.
On Friday, the annualized figures of the Eurozone’s key inflation gauge, namely the Harmonised Index of Consumer Prices (HICP), surged by 8.6% in June compared to the 8.4% marked expectations and previous reading of 8.1%. The record inflation data fanned expectations of a 0.5% ECB rate hike during July. However, downbeat US PMIs appeared to have propelled recession risks and drowned the EUR/USD pair the previous day.
That said, the US ISM Manufacturing PMI for June slumped to the lowest levels in two years, to 53.0 versus 54.9 expected and 56.1 prior. The details suggested the Employment Index declined to 47.3 from 49.6 and New Orders Index fell to 49.2 from 55.1. Finally, Prices Paid Index dropped to 78.5 from 82.2, versus market forecasts of 81.0. It should be noted that the final readings of the S&P Global Manufacturing PMI for June dropped to the lowest level since July 2020, to 52.7 versus the flash estimate of 52.4 and 57 in May.
Against this backdrop, the US 10-year Treasury yields marked the biggest weekly fall since February whereas Wall Street benchmarks struggled for clear directions after Friday’s surprise gains. Further, S&P 500 Futures drop 0.65% to portray the risk-off mood by the press time.
Moving on, EUR/USD traders may struggle for clear directions amid the US holiday. However, German trade numbers for May can entertain intraday players. However, major attention will be given to Wednesday’s Federal Open Market Committee (FOMC) Minutes, Thursday’s ECB Minutes and the US Jobs report for June, up for publishing on Friday.
Even if EUR/USD remains around a two-week low, flashed on Friday, its moves from May 13 appear not in favor of the sellers. That said, the higher low in the prices has gained support from the higher low in the RSI (14), which in turn suggests a gradual reduction in a bearish bias.
In recent trade today, the People’s Bank of China (PBOC) set the yuan (CNY) at 6.7071 vs. the previous fix of 6.6863 and prior close of 6.7020.
China maintains strict control of the yuan’s rate on the mainland.
The onshore yuan (CNY) differs from the offshore one (CNH) in trading restrictions, this last one is not as tightly controlled.
Each morning, the People’s Bank of China (PBOC) sets a so-called daily midpoint fix, based on the yuan’s previous day's closing level and quotations taken from the inter-bank dealer.
The GBP/USD pair is attempting to overstep the potential resistance of 1.2106 in order to turn the rebound into a bullish reversal. The pound bulls are hovering around the above-mentioned potential resistance from the early Tokyo session.
The cable has witnessed a responsive buying action after testing the two-week-old support of the June 14 low at 1.1970. Usually, a responsive buying action in the asset indicates that the asset has become a value bet now. Currently, the potential resistance of Wednesday’s low at 1.2106 is acting as a major barricade for the pound bulls.
An establishment above the 20-period Exponential Moving Average (EMA) at 1.2090 adds to the upside filters. Also, the cable has attacked the 50-EMA at 1.2115. However, sustainability above the same will strengthen the pound bulls further.
Meanwhile, the Relative Strength Index (RSI) (14) has shifted into a 40.00-60.00 range, which signals a consolidation ahead.
A decisive move above Monday’s high at 1.2122 will send the asset towards Friday’s high at 1.2188. A breach of the latter will drive the cable towards Tuesday’s high at 1.2292.
Alternatively, the greenback bulls could regain their glory if the asset drops below Friday’s low at 1.1976. An occurrence of the same will drag the asset towards the round-level support at 1.1900, followed by a 26 March 2020 low at 1.1777.
-637924940978143539.png)
NZD/USD is higher by some 0.1% in the opening hour of Tokyo and has travelled from a low of 0.6193 to a high of 0.6216 so far.
Pessimism about the global economic outlook had boosted demand for the safe-haven U.S. dollar but equities rallied nonetheless, supporting the high beta currencies such as the kiwi.
''While it recovered ~40bps from the night’s low, it still closed below 0.62. That was not just another record low close for 2022, but it represented a clear break of 0.6230 (first breached on Thursday), which is the 61.8% Fibo of the 2020/21 move from 0.5470 to 0.7463,'' analysts at ANZ bank argued. ''That’s quite a worrying sign from a technical perspective, especially with the USD DXY holding up despite growing fears of a US recession.''
Meanwhile, it is going to be another big week for the US dollar and the schedule on the calendar has the Federal Reserve minutes, ISM Services and Nonfarm Payrolls.
''It'll likely be another week where global events and technicals dominate, but next week’s Reserve Bank New Zealand MPR will bring the focus back onshore (hopefully),'' the analysts at ANZ Bank said.
Nonfarm Payrolls is expected to show that Employment likely continued to advance firmly in June but at a more moderate pace after three consecutive job gains of around 400k in March-May, analysts at TD Securities said.
Meanwhile, the minutes of the Federal Reserve's June meeting will also be eyed.
''Persistent high CPI inflation and nascent signs of de-anchoring inflation expectations forced the Fed to amp the pace of rate tightening. The meeting minutes are likely to offer further colour around the Fed's more hawkish reaction function,'' the analysts at TD Securities said.
AUD/USD renews intraday high around 0.6830 as it consolidates the biggest weekly loss in four around a two-year low. The Aussie pair’s latest rebound could also be linked to the US dollar’s pullback amid a quiet session and the US holiday.
The quote slumped to the lowest levels in two years as the recession risks intensified on Friday. The risk-aversion wave took clues from the downbeat US PMI, as well as fears of economic recession. However, recessing hawkish bets on the Fed’s next move appears to have triggered the Aussie pair’s corrective pullback amid a sluggish session.
Talking about data, Australia's TD Securities Inflation for June eased to 0.3% MoM and 4.7% YoY, versus 1.1% and 4.8% respective priors.
The US ISM Manufacturing PMI for June slumped to the lowest levels in two years, to 53.0 versus 54.9 expected and 56.1 prior. The details suggested the Employment Index declined to 47.3 from 49.6 and New Orders Index fell to 49.2 from 55.1. Finally, Prices Paid Index dropped to 78.5 from 82.2, versus market forecasts of 81.0. It should be noted that the final readings of the S&P Global Manufacturing PMI for June dropped to the lowest level since July 2020, to 52.7 versus the flash estimate of 52.4 and 57 in May.
On the other hand, a reduction in the market’s bets for the Fed’s 0.75% rate hike in July, as per the CME’s FedWatch tool, probes the US dollar buyers.
Even so, the Commonwealth Bank of Australia (CBA) anticipates the AUD/USD prices to drop to as low as 0.6200 amid cautious prediction of the economic growth and the Reserve Bank of Australia’s (RBA) next moves. That said, the Aussie pair is well-set for a 0.50% rate hike on Tuesday but the recent recession fears may challenge the pair buyers.
That said, the AUD/USD traders may keep consolidating the recent losses around the multi-month low amid the US holiday and the US dollar pullback. However, the broad risk-off mood can exert downside pressure on the pair ahead of the key RBA, Federal Open Market Committee (FOMC) Minutes and the US Jobs report for June.
Despite bouncing off the 61.8% Fibonacci Expansion (FE) of April-June moves, near 0.6770, AUD/USD remains on the bear’s radar unless crossing the previous support line from May 12, around 0.6870 by the press time.
The EUR/JPY pair is experiencing stiff resistance from 141.00 in the Asian session. The cross is expected to see more downside after slipping below the intraday low at 141.84. On a broader note, the asset is declining from the past week after sensing offers while testing June 22 high at 144.25.
The asset is declining in a Falling Channel on an hourly scale. The upper and lower portion of the chart pattern is placed from June 29 high and low at 143.86 and 142.49 respectively. For the shared currency bulls, the horizontal resistance at 141.40 will be a critical hurdle.
The 20-period Exponential Moving Average (EMA) at 141.16 has been smoothly defended by the Japanese yen bulls. Also, the 50-period EMA at 141.65 is scaling lower firmly which adds to the downside filers.
Meanwhile, the Relative Strength Index (RSI) (14) is attempting to slide below 40.00, which will strengthen the yen bulls further.
A pullback move towards the critical hurdle of the June 24 low at 141.40 will be a bargain sell for the market participants, which will drag the asset towards June 16 high at 139.96, followed by June 1 high at 138.98.
On the flip side, the shared currency bulls could regain strength if the asset oversteps Wednesday’s low at 142.03. This will drive the asset towards Tuesday’s high at 142.98. A breach of Tuesday’s high will unleash the eurozone bulls to recapture June 22 high at 144.25.
-637924924709339922.png)
| Index | Change, points | Closed | Change, % |
|---|---|---|---|
| NIKKEI 225 | -457.42 | 25935.62 | -1.73 |
| KOSPI | -27.22 | 2305.42 | -1.17 |
| ASX 200 | -28.2 | 6539.9 | -0.43 |
| FTSE 100 | -0.6 | 7168.7 | -0.01 |
| DAX | 29.26 | 12813.03 | 0.23 |
| CAC 40 | 8.2 | 5931.06 | 0.14 |
| Dow Jones | 321.83 | 31097.26 | 1.05 |
| S&P 500 | 39.95 | 3825.33 | 1.06 |
| NASDAQ Composite | 99.11 | 11127.85 | 0.9 |
Gold Price (XAU/USD) prints mild losses while trying to defend the $1,800 during Monday’s Asian session, after declining for the last three weeks. In doing so, the yellow metal justifies the risk-off mood amid economic slowdown fears but remains dormant amid the US holiday, as well as a cautious mood ahead of this week’s key data/events.
Recession fears escalated on Friday after the US ISM Manufacturing PMI slumped to two-year lows. Adding to the risk-off mood was the further geopolitical tension between Russia and Ukraine, as well as China’s failure to impress the buyers.
That said, the US ISM Manufacturing PMI for June slumped to the lowest levels in two years, to 53.0 versus 54.9 expected and 56.1 prior. The details suggested the Employment Index declined to 47.3 from 49.6 and New Orders Index fell to 49.2 from 55.1. Finally, Prices Paid Index dropped to 78.5 from 82.2, versus market forecasts of 81.0. It should be noted that the final readings of the S&P Global Manufacturing PMI for June dropped to the lowest level since July 2020, to 52.7 versus the flash estimate of 52.4 and 57 in May.
Additionally, Russia’s claim of having complete control over Lysychansk and doubts over China’s ability to regain the economic transition appear to exert downside pressure on gold prices.
Amid these plays, the US 10-year Treasury yields marked the biggest weekly fall since February whereas Wall Street benchmarks struggled for clear directions after Friday’s surprise gains. Further, S&P 500 Futures drop half a percent to portray the risk-off mood by the press time.
Looking forward, the US Independence Day holiday could restrict the XAU/USD moves and so do recently easing hawkish bets on the Fed’s next moves. However, this week’s Federal Open Market Committee (FOMC) Minutes and the US Jobs report for June will be crucial to watch.
Also read: Gold Weekly Forecast: Recovery hopes fade ahead of key US events
Gold Price struggles to defend Friday’s bounce off the key horizontal support from late December 2021 as the downward sloping RSI and bearish MACD signals join the moving average crossover that favors sellers, namely the death cross.
As the 50-DMA pierces the 200-DMA from above, backed by the aforementioned oscillators, the XAU/USD is likely to retest the multi-month-old support area near $1,780. However, the sellers need validation from the immediate resistance-turned-support around $1,800.
Following that, the downward trajectory towards the late 2021 bottom surrounding $1,760 could lure the bears.
On the contrary, recovery remains elusive until crossing the downward sloping resistance line from April 18, close to $1,825 by the press time.
Following that, the 50-DMA and the 200-DMA could challenge the gold price at around $1,845, a break of which appears a good signal for the XAU/USD bull’s return.
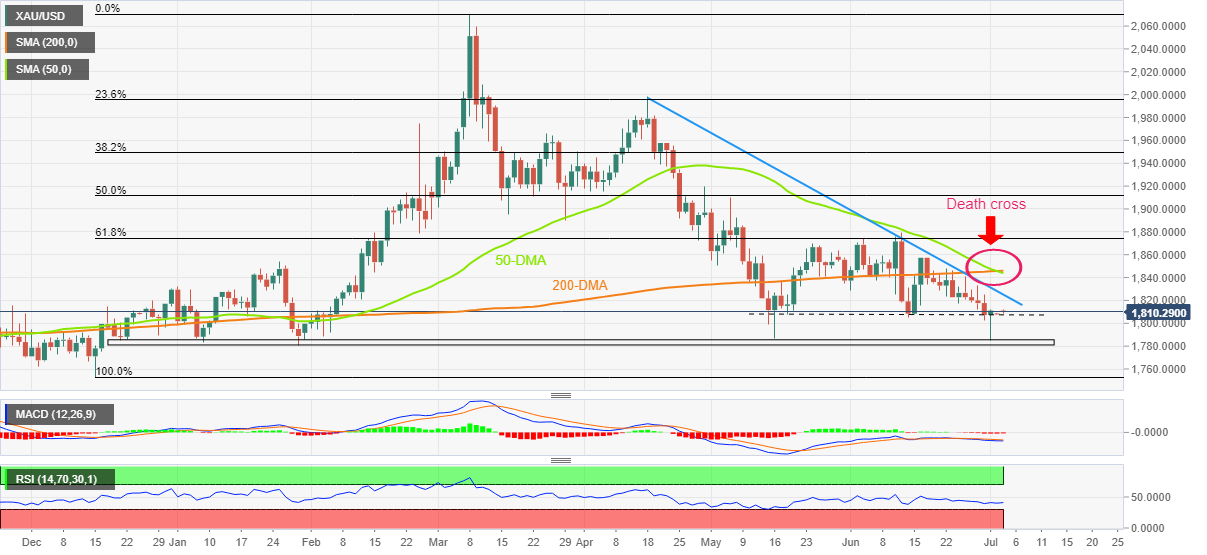
Trend: Further weakness expected
USD/JPY is being pressured at the start of the week, trading down around 0.13% and has pierced below 135 the figure in recent trade ahead of the equities open in Tokyo. The Japanese yen was strongest in the G10 on Friday and is continuing on that path. USD/JPY steadied down a net 40 pips at 135.25.
Meanwhile, the 10-year US yield is trading near 2.96% and is below 3.0% for the first time since June 10 which is benefitting the yen. yen bulls are in anticipation of a clean break below 3.0% sets up a test of the May 26 low near 2.70%.
''Given where inflation and the Fed are right now, we find it hard to justify a 10-year yield much below 3.0% but here we are,'' analysts at Brown Brothers Harriman explained. ''As long as recession fears dominate, this move lower hasn't run its course yet. And it's a global phenomenon, as 10-year yields everywhere are also down significantly in recent days. Yet we continue to feel that the US is best-positioned as we enter this new phase for global investors. As such, we believe the dollar uptrend remains intact.''
Indeed, the USD/JPY bears are taking control ahead of what is scheduled to be a busy week on the US calendar. The first full week Friday of the month, as per usual, holds the critical Nonfarm Payrolls. The data is expected to show that Employment likely continued to advance firmly in June but at a more moderate pace after three consecutive job gains of around 400k in March-May, the analysts at TD Securities said. ''High-frequency data, including Homebase, still point to above-trend job creation. We also look for the UE rate to stay unchanged at 3.6% for a fourth straight month, and for wage growth to remain steady at 0.3% MoM (5.0% YoY).''
Before then, we have the Federal Reserve minutes of the June meeting that will also be eyed. ''Persistent high CPI inflation and nascent signs of de-anchoring inflation expectations forced the Fed to amp the pace of rate tightening. The meeting minutes are likely to offer further colour around the Fed's more hawkish reaction function,'' the analysts at TD Securities said.
| Pare | Closed | Change, % |
|---|---|---|
| AUDUSD | 0.68156 | -1.21 |
| EURJPY | 141.004 | -0.88 |
| EURUSD | 1.04264 | -0.5 |
| GBPJPY | 163.579 | -0.98 |
| GBPUSD | 1.20926 | -0.62 |
| NZDUSD | 0.62022 | -0.57 |
| USDCAD | 1.28834 | 0.05 |
| USDCHF | 0.95965 | 0.52 |
| USDJPY | 135.263 | -0.36 |
© 2000-2026. Bản quyền Teletrade.
Trang web này được quản lý bởi Teletrade D.J. LLC 2351 LLC 2022 (Euro House, Richmond Hill Road, Kingstown, VC0100, St. Vincent and the Grenadines).
Thông tin trên trang web không phải là cơ sở để đưa ra quyết định đầu tư và chỉ được cung cấp cho mục đích làm quen.
Giao dịch trên thị trường tài chính (đặc biệt là giao dịch sử dụng các công cụ biên) mở ra những cơ hội lớn và tạo điều kiện cho các nhà đầu tư sẵn sàng mạo hiểm để thu lợi nhuận, tuy nhiên nó mang trong mình nguy cơ rủi ro khá cao. Chính vì vậy trước khi tiến hành giao dịch cần phải xem xét mọi mặt vấn đề chấp nhận tiến hành giao dịch cụ thể xét theo quan điểm của nguồn lực tài chính sẵn có và mức độ am hiểu thị trường tài chính.
Sử dụng thông tin: sử dụng toàn bộ hay riêng biệt các dữ liệu trên trang web của công ty TeleTrade như một nguồn cung cấp thông tin nhất định. Việc sử dụng tư liệu từ trang web cần kèm theo liên kết đến trang teletrade.vn. Việc tự động thu thập số liệu cũng như thông tin từ trang web TeleTrade đều không được phép.
Xin vui lòng liên hệ với pr@teletrade.global nếu có câu hỏi.


