- Phân tích
- Tin tức và các công cụ
- Tin tức thị trường
Tin tức thì trường
- The USD/CAD ended the week almost flat amidst a volatile’s Friday session.
- Canada’s May GDP contracted by 0.2%, on its preliminary reading, a headwind for the CAD.
- US manufacturing data showed signs of slowing down; will the Fed slow its tightening pace?
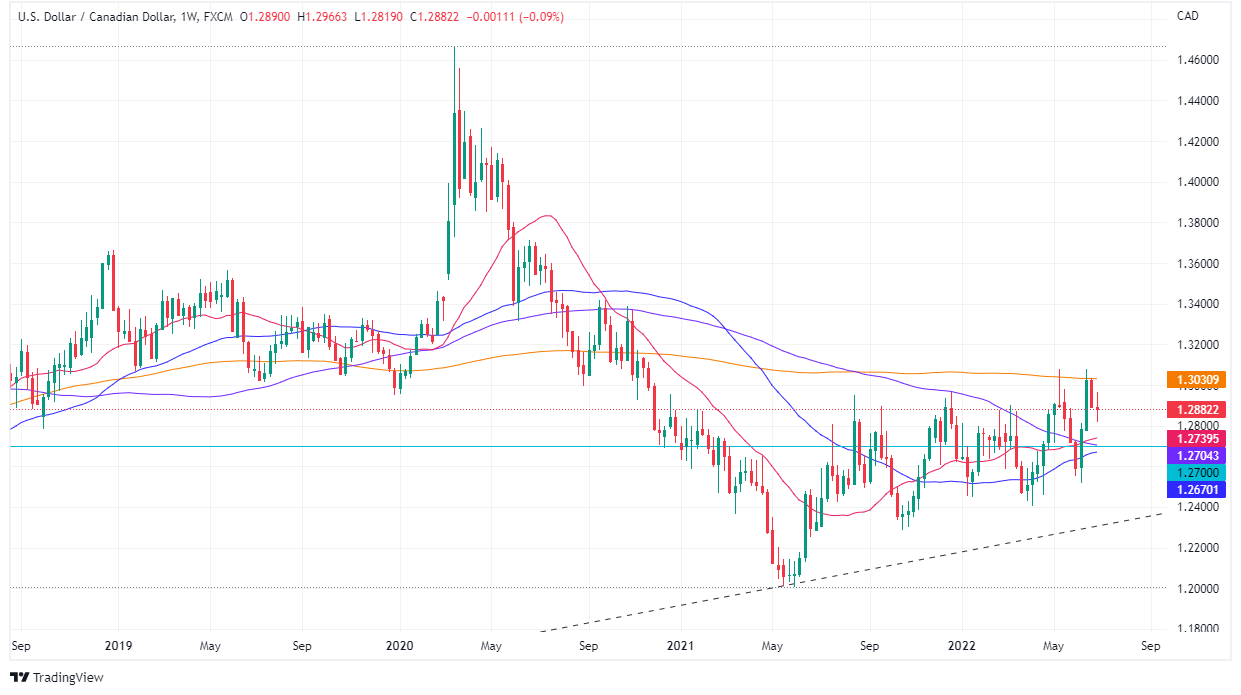
The USD/CAD pares some of Thursday’s losses after reaching a weekly high of around 1.2960s but retraced below 1.2900 as the greenback weakened ahead into a long weekend, courtesy of the US Independence day. At 1.2882, the USD/CAD records minimal gains of 0.08% and finishes the week with losses of 0.09%.
Sentiment shifts, and the USD/CAD retreats from weekly highs to familiar levels
US equities finished with solid gains after the S&P 500 slumped by 20% since its peak in 2022. US manufacturing data, as reported by the Institute for Supply Management, released June’s Manufacturing PMI at 53.0, lower than the 54.9 expected prior at 56.1. Investors’ reaction was a counter-cyclical, buying the US dollar as a safe-haven play as fears of a US and a global recession increased.
On the USD/CAD side, the pair rallied sharply, from around 1.2900s to 1.2966, amidst falling US Treasury yields, as bond traders bought US Treasuries, which sent short-term US bond yields plunging more than ten basis points, in the case of 2s, 5s, and 10s. The US 10-year benchmark note finalized around 2.889%, down twelve basis points and 70 bps from the 2022 peak near 3.5%.
Data-wise, during the week, the Canadian docket revealed a GDP contraction of 0.2% MoM on May’s preliminary reading, while April was downward revised from 0.7% to 0.3% MoM. The data could deter the Bank of Canada (BoC) from hiking rates aggressively, though, at the time of writing, Short Term Interest Rates (STIRs) markets have priced in a 92% chance of a 75 bps rate hike in the July 13 meeting.
On the US front, June’s Consumer Confidence reported by the Conference Board, downtick towards 98.7, missing expectations of 100.4, and trailed May’s 103.2. Furthermore, US inflation, as measured by the Personal Consumption Expenditure (PCE), and the Fed’s favorite gauge of inflation for May, rose by 6.3% YoY, lower than the 6.7% estimated. Meanwhile, the so-called core PCE, excluding volatile items, rose by 4.7% YoY, lower than foreseen and less than April’s 4.9%.
The week ahead, the Canadian economic calendar will feature S&P Global Manufacturing PMIs and Employment data. On the US front, the docket will reveal the ISN Non-Manufacturing PMI for June, the US Federal Reserve’s last meeting minutes, and the US Nonfarm Payrolls report for June.
USD/CAD Weekly chart
USD/CAD Key Technical Levels
- The EUR/GBP seesawed in a volatile 100-pip trading session on Friday.
- Weak data from the UK and the EU left traders undecided on which direction to take.
- The EUR/GBP daily chart depicts the pair as upward biased, but the 4-hour illustrates the cross might correct towards 0.8550 before resuming the uptrend.
The EUR/GBP advances during the day, though retraced from near two-week highs around 0.8678 on Friday, amidst an upbeat market mood that triggered support for risk-sensitive currencies in the FX space, the British pound one of them. At 0.8621, the EUR/GBP is trading in the green by just 0.19%.
A volatile session characterized EUR/GBP Friday’s price action. Weaker than expected, UK’s factory data lifted the cross-currency. Nevertheless, it began to pare its losses of late after hot Eurozone inflation, alongside languish factory output, was reported, painting a gloomy scenario for the EU.
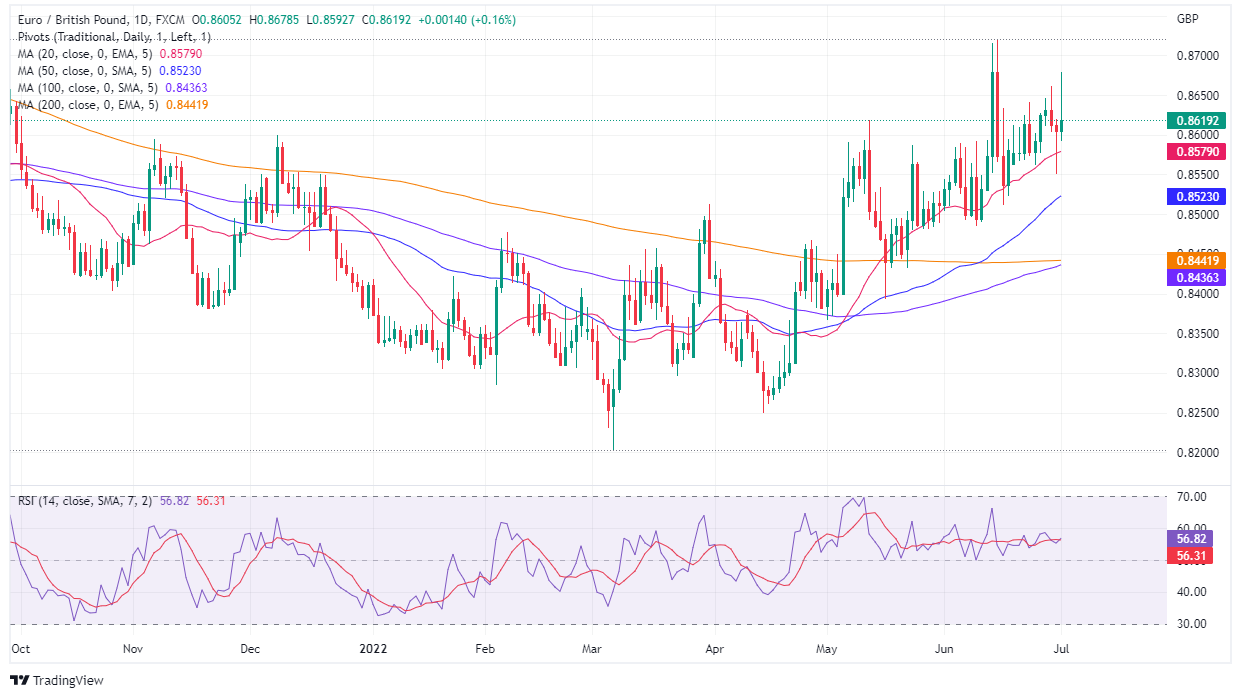
EUR/GBP Daily chart
The EUR/GBP daily chart depicts the pair as neutral-upward biased. Traders should note how the Relative Strength Index (RSI) stayed steady between 50 and 70 since May, while the EUR/GBP rallied from 0.8250 to the YTD high above 0.8700. Therefore, the EUR/GBP might extend its rally in the near term and even challenge the YTD high above 0.8700, but a break above 0.8678 is needed. On the other hand, if EUR/GBP sellers plunge prices below 0.8550, that could pave the way to the 200-day EMA at 0.8442.
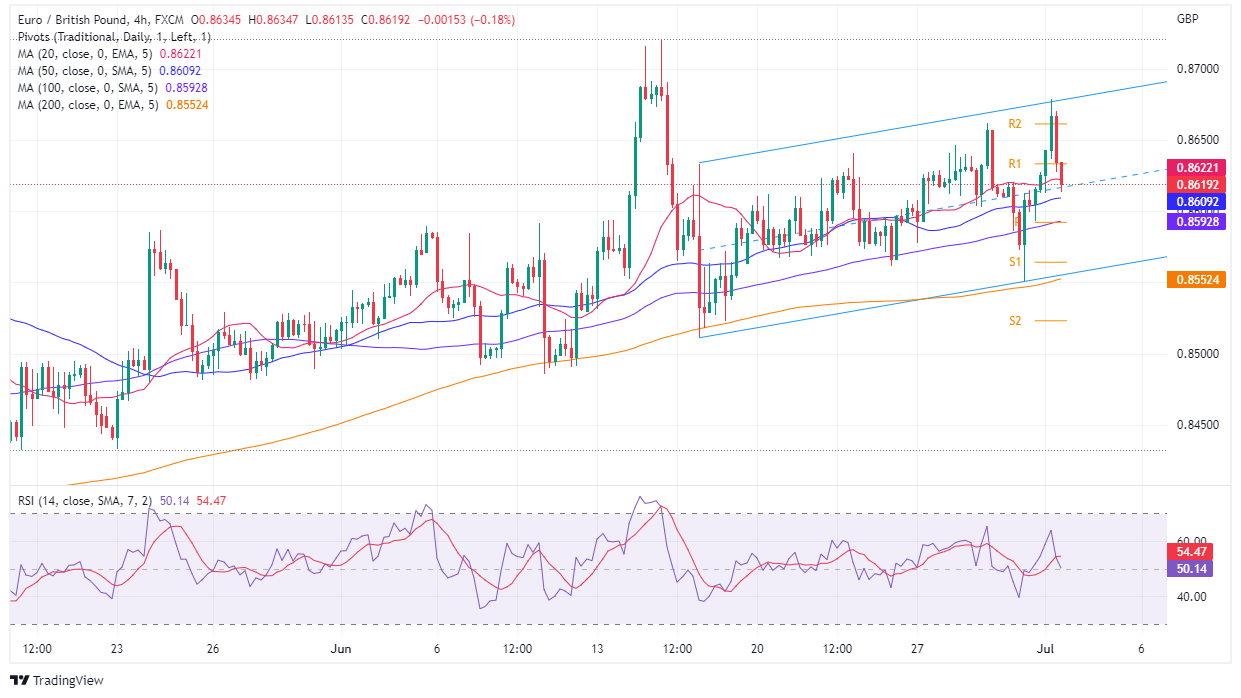
EUR/GBP 4-Hour chart
In the near term, the EUR/GBP 4-hour chart depicts the pair trading inside an ascending channel that has kept the cross-currency pair trading within a 100-pip range. On Friday, the cross reached the top of the range and reversed, piercing the R2 and R1 daily pivots, each at 0.8662 and 0.8633, before settling around the 20-EMA at 0.8622. Also, the Relative Strength Index (RSI) at 50.72 accelerates its fall towards the mid-line, and a cross below would pave the way for further downside in the EUR/GBP pair.
Therefore, the EUR/GBP’s first support would be the 50-EMA at 0.8609. Break below would expose the 100-EMA at 0.8592, followed by the June 30 swing low at 0.8551.
EUR/GBP Key Technical Levels
- AUD/USD reached a new YTD low at around 0.6776.
- US ISM Manufacturing PMI for June continued expanding but at a slower rhythm.
- Australia and China’s PMI came better than expected, but a jump in US bond yields kept the pair from further recovery.
The AUD/USD nose-dive to fresh YTD lows near 0.6776, on harmful US manufacturing data, thought as the New York session progressed has recovered some ground, and is closing to the 0.6800 figure. At 0.6821, the AUD/USD stays depressed and ready to finish the week with substantial losses of 2%.
A mixed market mood and a pullback in the US Dollar Index capped AUD/USD losses
Sentiment has improved as Friday’s session begins to wane. US equities pare earlier losses except for the heavy-tech Nasdaq, falling 0.19%, after slowing on a weaker than expected US ISM manufacturing data, which expanded though reached a two-year low, as new orders shrank. That sounded investors’ alarms, who also flew towards haven assets and bought US Treasuries, as depicted bu US Treasury yields plunging, with the 2-year at a time dropped 25 bps, as traders priced in a “less” aggressive than expected US Federal Reserve.
In the meantime, Timothy R. Fiore, Chair of the Institute for Supply Management, commented on the report that the manufacturing sector is being “powered” by demand while has been “held back by supply chain constraints.” Furthermore, the employment index, despite contracting, shows progress, according to the survey. Prices eased for the third month in a row while new orders fell.
During the Asian session, AUD/USD traders took cues from Australia S&P Global Manufacturing PMI, which came at 56.2, higher than foreseen, capping the AUD/USD fall. Late in the session, China’s Caixin Manufacturing PMI rose to 51.7 for June versus 50.1 expected and 48.1 prior.
AUD/USD Key Technical Levels
- The USD/CHF to finish the week with decent gains of 0.39%.
- Risk-aversion dominates Friday’s session, as throughout the whole week.
- The USD/CHF double top in the daily chart is still in play, but failure at 0.9544, paves the way for further gains as buyers eye 0.9700.
- In the near term, the major is upward biased, eyeing the 100-DMA.
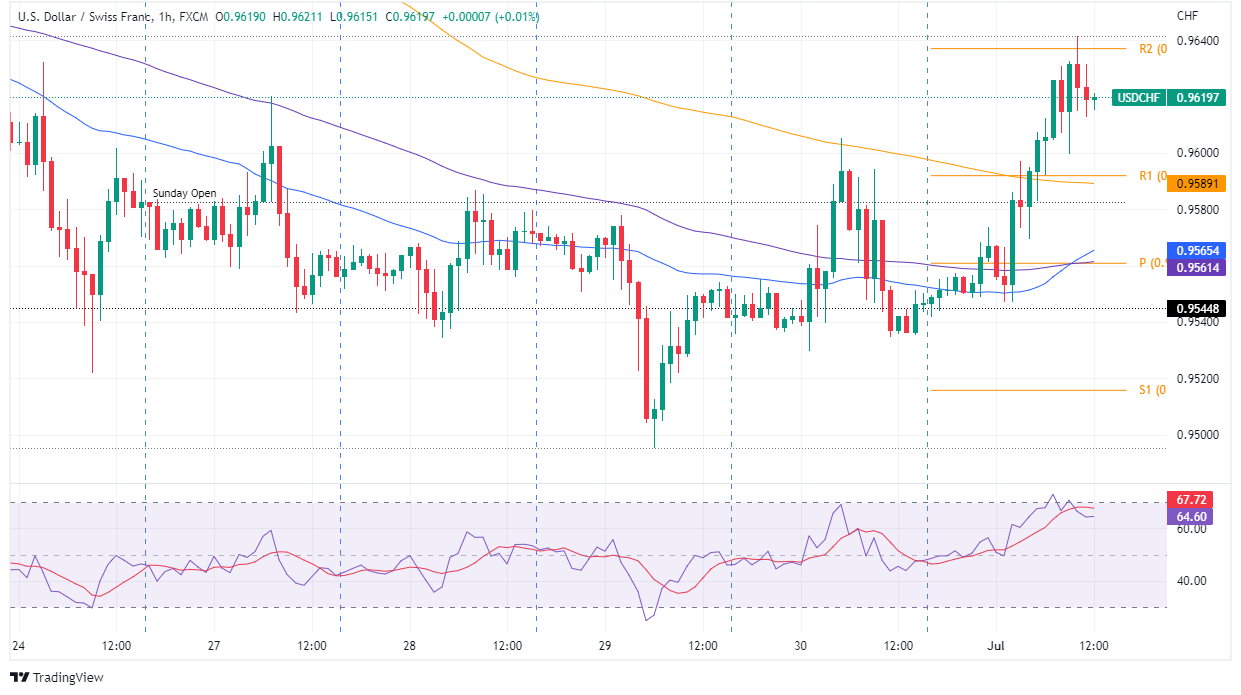
The USD/CHF accelerates and reclaims the 0.9600 figure after harmful US economic data, showing that the economy, although expanding, is doing it at a slower pace than estimated amidst a US Federal Reserve tightening cycle. At the time of writing, the USD/CHF is trading at 0.9624.
US equities are falling, preparing to finish the week with substantial losses. Meanwhile, US Treasury yields have recovered some ground, while the greenback remains in the driver’s seat, as shown by the US Dollar index, up 0.58%, at 105.340.
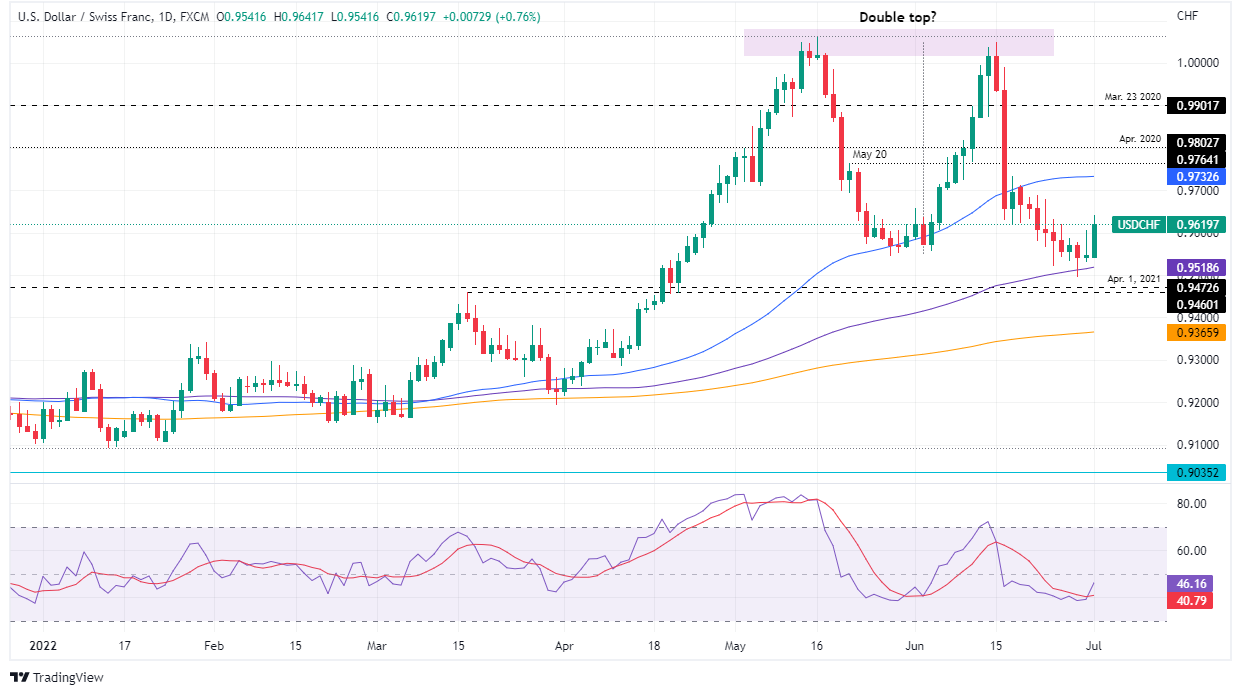
USD/CHF Daily chart
The USD/CHF regained some composture and is trading near the week highs around 0.9641. USD/CHF traders should note that sellers failed to break below the 100-day moving average (DMA) at 0.9518, exposing the pair to additional buying pressure. Also, the Relative Strenght Index (RSI) at 46 aimed upward and broke above the RSI’s 7-day moving average, meaning that buying pressure is mounting.
Therefore, the USD/CHF first resistance would be 0.9641. Break above would expose the 0.9700 mark, followed by the 50-DMA at 0.9732.
USD/CHF 1-Hour chart
In the 1-hour chart, the USD/CHF found its floor around 0.9500 on June 29, and since then, it has not looked back, achieving successive series of higher lows and higher highs, paving the way for further gains. It is worth noting that the major on its way north broke above the simple moving averages (SMAs), further cementing the case of recovery to the upside.
Hence, the USD/CHF first resistance will be the R2 daily pivot at 0.9640. A breach of the latter would expose the June 23 high at 0.9678, followed by the 0.9700 figure.
USD/CHF Key Technical Levels
Analysts at MUFG Bank, point out that the South Korean won will likely remain affected by the ongoing concerns on global economic growth and the tightening from the Federal Reserve. They forecast USD/KRW at 1250.00 by the end of the second quarter, and at 1230.00 by the fourth quarter.
Key Quotes:
“KRW depreciated this June on resuming capital outflows amid global growth and recession worries, with foreign investors sold about a net USD4.2 bn of Korea’s local equities in the month after a net buying of USD170 mn in May. Notably, the won even breached the 1,300-mark for the first time in 13 years on June 23. As an export-driven economy, a negative exports growth in its early trade data also dragged on the KRW.”
“To counter growing inflationary pressure, the South Korean government on June 19 announced a package of emergency measures, including expanding tax cuts on fuel consumption to a legal cap of 37% from the current 30%, starting July 1 until the end of this year, and doubling tax deduction rates on credit card use for public transit services to 80%. These new measures could at least offer some support to domestic consumers and businesses amid the uncertain economic environment, in turn supporting the economy and the KRW.”
“Risk appetite is likely to remain highly volatile in the near term as uncertaiinties over external factors including global stagflation and the Fed’s policy trajectory could continue to drive KRW’s movement.”
Analysts at MUFG Bank, point out that higher crude oil imports could lead to a larger trade deficit and weigh on the Indian rupee. They forecast USD/INR at 79.500 by the end of the third quarter and at 80.000 by the end of 2022.
Key Quotes:
“The Indian rupee depreciated for the sixth consecutive month to new record lows against the USD in June. A confluence of factors such as renewed US dollar strength, mounting fears of an “anti-goldilocks” scenario and wider trade deficits pressured the rupee lower.”
“With risk sentiments to remain weak, we see risks of further outflows from the equity market which would then add strains on the rupee. Prospects of further rate hikes by the RBI are unlikely to help stem rupee losses as real yields remain entrenched in negative territory due to high inflation for at least the next three quarters.
“Other factors that are likely to keep the rupee fundamentally weak in the coming months is the widening of trade and current account deficits as import costs of oil and other commodities become more expensive.”
“The latest available data from the PPAC show an increase in the average price of Indian basket crude oil to USD116.02/bbl in June versus USD109.51/bbl in May in part due to the increase in premiums charged by Saudi Arabia. India’s current account deficit narrowed to 1.3% of GDP in Q1 from Q4’s 2.6% of GDP, but it is likely to widen to levels above 2% of GDP again thereafter due to larger trade deficits.”
According to analysts from Rabobank, if the Bank of England (BoE) do not keep step with the hawkish guidance of the Federal Reserve (Fed) there is a risk that the pound could weaken further. They see the risk of dips in the GBP/USD pair to 1.18 on a three-month view.
Key Quotes:
“In recent sessions, the market has started to switch its focus to the risks of a deteriorating growth outlook in the US. Various economic indicators suggest that the economy may already have slowed. The UK slowdown is more advanced, with the cost of living crisis having been evident for months. Arguably the challenges facing policymakers in the UK are among the most complex in the developed world. UK CPI inflation has not yet peaked, and labour market strife indicates that higher inflation expectations may be already entrenched. However, UK consumer confidence has plunged, and, more recently, measures of business sentiment have also started to dive.”
“If expectations regarding BoE policy moves do not keep step with the hawkish guidance of the Federal Reserve, it can be argued there is a risk that GBP could weaken further. Yet, GBP is also proving sensitive to fears regarding growth. We see risk of dips to GBP/USD 1.18 on a 3 month view. We expect EUR/GBP to end the year at 0.88.
“The BoE was out of the traps much earlier than either the Fed or the ECB in terms of policy tightening. However, this has failed to give the pound much of a lift, with GBP one of the poorer performing G10 currencies in the year to date. In our view, the inability of GBP to benefit substantially from the BoE’s early rate hiking cycle is due to the market’s focus on the poor growth outlook for the UK.”
Data released on Friday showed the ISM Manufacturing PMI dropped more than expected in June to 53, the lowest level in two years. According to analysts at Wells Fargo details of the report demonstrate slower activity in the manufacturing sector, but also that supply problems continue to slowly ease.
Key Quotes:
“The ISM manufacturing index slid 3.1 points to 53.0 in June. Notably, this was still above the 50-threshold signaling expansion, but marked the lowest reading in nearly two years and is consistent with a slower pace of activity. There were multiple signs of supply constraints easing, but weakness on the demand side pulled the overall index lower as new orders tumbled.”
“New orders tend to lead growth in industrial production (IP)—ISM new orders led growth in IP heading into the 2001 and the 2007 recessions. In short, this contraction-territory print for new orders is not good news for activity in the sector and could foreshadow coming weakness in actual output. One potential offset today, however, is the fact that manufacturers still have a record amount of backlog to move through, which may help support manufacturing activity even amid a pullback in new demand.”
“The June ISM piles onto weaker consumer data received this week. Investment spending is starting to weaken, which only adds to the evidence that the U.S. economy is rapidly slowing.”
- The GBP/USD prepares to finish the week with losses close to 1.80%.
- Worst than estimated, US manufacturing figures propelled the US dollar higher, a headwind for the GBP/USD.
- Investors start to price in a less aggressive Fed, as illustrated by US Treasury yields plunging more than ten bps.
The British pound trips below the 1.2000 mark, reaching a two-week low near 1.1975, after a US manufacturing report showed that, albeit expanding, the economy keeps hitting the brakes amidst growing concerns about a stagflation scenario. However, GBP/USD buyers reclaimed the figure, and at the time of writing, the GBP/USD is trading at 1.2055, down 0.98%.
Negative sentiment and US data showing that the economy is slowing bolstered the US dollar
Risk-off impulse witnessed by global equities sliding, increased appetite for safe-haven assets. The Institute for Supply Manufacturing reported that June’s Manufacturing index expanded to 53.0, lower than the 56.1 reported in May. Albeit showing that the economy stats in expansionary territory for the 25th month in a row, it’s slowing at the time that the Federal Reserve is front-loading aggressive rate hikes to the Federal funds rate (FFR).
Timothy R. Fiore, Chair of the Institute for Supply Management, commented on the report that the manufacturing sector is being “powered” by demand while has been “held back by supply chain constraints.” Furthermore, the employment index, despite contracting, shows progress, according to the survey. Prices eased for the third month in a row while new orders fell.
Meanwhile, an absent UK economic docket left GBP/USD traders adrift to US market data. The major reacted to the downside on the release, to fresh two-week lows, but of late, recovered some ground and has bounced close to 80 pips since.
In the bond market, US Treasury yields are plummeting, led by 2s, 5s, and 10s, tumbling more than ten basis points, as traders begin to price in a less aggressive US Federal Reserve. This means that financial analysts’ focus shifted towards growth amidst a time of aggressive rate hikes by worldwide central banks, which are fighting inflation levels at 40-year highs. Nevertheless, the above-mentioned shows that central banks are behind the curve and, if their scenario looks cloudy, are trying to tackle inflation without getting the economy into a recession.
GBP/USD Key Technical Levels
- Emerging market currencies extend weekly losses on Friday.
- US dollar firm on risk aversion, DXY up 0.65%.
- USD/MXN testing critical resistance that contains the 100-week SMA.
The US dollar is rising against emerging market currencies on Friday, extending weekly gains boosted by global concerns about the growth outlook and as central banks raise interest rates. The Mexican peso is among the worst performers.
The USD/MXN jumped on Friday to 20.46, reaching the highest level in two weeks. It then pulled back to the 20.30 level. High volatility is likely to remain elevated as panic continues to drive price action.
After a brief pause, USD/MXN resumed the upside on Friday, adding to weekly gains. It started to move higher from 20.05 (20-day SMA). The rally found resistance at the 20.45 strong barrier that contains the 100-week SMA. A consolidation above should point to more gains. The next strong resistance is located at 20.70.
Fear almost everywhere
In Wall Street, the main indexes are in red but off lows. Bond yields are sharply lower, reflecting risk aversion and softer expectations about monetary tightening. Economic data from the US showed a larger than expected decline in ISM Manufacturing in June that fueled recession fears.
Despite the slowdown in activity, high inflation pressures the Fed and other central banks to tighten aggressively monetary policy. Higher rates are usually negative for emerging markets.
USD/MXN weekly chart
-637922868447044425.png)
- Gold prices trim daily losses as the dollar soars on risk aversion.
- US yields collapse amid fears of a recession.
- Silver also rebounds, down “just” 2.60%.
Metals rebounded during the American session, amid a collapse in US yields. The rally in Treasuries boosted gold that dragged silver to the upside. XAU/USD is hovering around $1,800/oz, far from the daily low.
Yields tumble helping gold that helps silver
US yields spiked to the downside. The US 10-year dropped to as low as 2.79%, the lowest since late May (earlier on Friday, it traded above 3.00%), while the 30-year tumbled to 3.02%.
Recession fears are softening Fed’s tightening expectations. The bond market on Friday is showing more concerns than the equity market. In Wall Street, the Dow Jones is falling by 0.56% and the Nasdaq by 0.49%.
The sharp slide in yields pushed gold back above $1,800, alleviating the bearish pressure. XAU/USD bottomed at $1,784, the lowest since late January. It is still down for the day and about to post the lowest weekly close in months. The area around the 2022 low at $1,780 is a critical support.
Silver also trimmed losses dragged to the upside by gold. XAG/USD bottomed at $19.38, level not seen since July 2020 and it is trading at $19.75, down 2.60%. Price is under the 200-week Simple Moving average for the first time since May 2020.
Technical levels
- EUR/USD collapsed more than 100 pips after the US ISM missed the street’s forecasts but remained at expansionary territory at 53.0
- The greenback got bolstered by a counter-cyclical move, meaning that bad US data related to growth could lift the US dollar.
- EU’s inflation rose above 8.5% YoY, in line with France, Spain, and Germany’s figures.
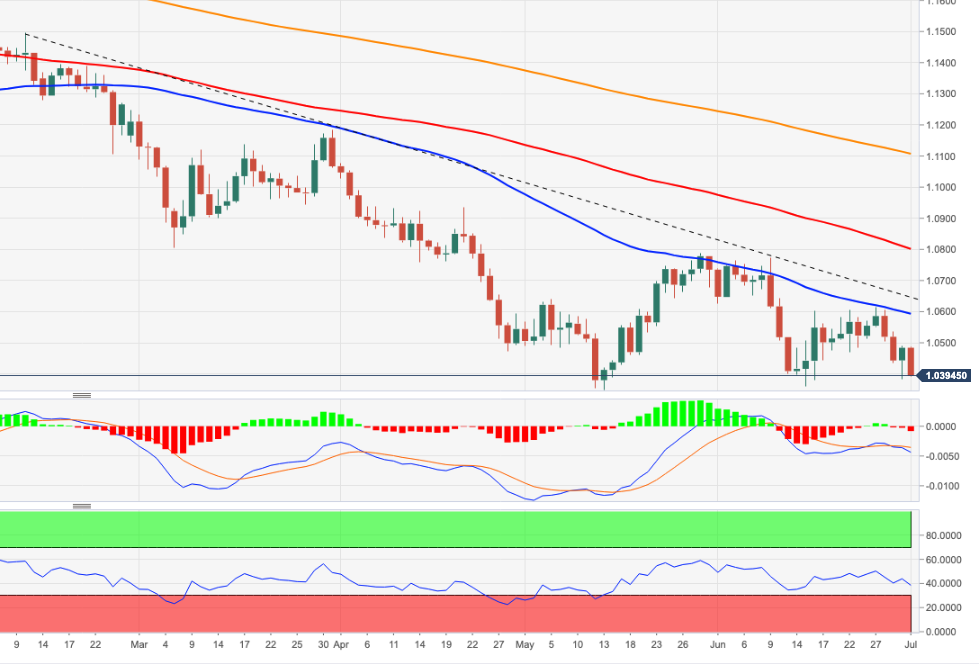
The EUR/USD plunges as the second half of 2022 begins, breaking on its way south below the 1.0400 mark, reaching a fresh two-week high amid increasing concerns shifting towards economic growth, which now appears to be dented by an aggressive tightening of global central banks. At the time of writing, the EUR/USD is trading at 1.0396.
US ISM Manufacturing missed expectations, but the greenback rose
Sentiment remains dismal, with global equities falling. Meanwhile, the US ISM Manufacturing PMI fell below expectations to a two-year low as new orders contracted. The US Dollar, struck by a counter-cyclical move, rose on the report and hit a two-week high around 105.635 but retraced some towards 105.490. That was a headwind for the EUR/USD extending its losses, despite a hotter-than-expected EU inflation report.
Timothy Fiore, the ISM Manufacturing Business Survey Committee chair, said that manufacturing growth was “held back by supply chain constraints.” Fiore added, “Prices expansion slightly eased for a third straight month in June, but instability in global energy markets continues. Sentiment remained optimistic regarding demand, with three positive growth comments for every cautious comment. Panelists continue to note supply chain and pricing issues as their biggest concerns.”
Earlier during the European session, the Euro area reported June’s inflation, which rose 8.6% YoY, beating estimations, while the core readings expanded by 3.7% YoY, lower than foreseen. The previous report shows the high inflationary pressures reported by France, Span, and Germany, though the downtick in core figures offers a ray of hope that inflation may be close to its peak.
In the meantime, US Treasury yields are slumping sharply as investors’ focus shifted toward growth. Now that central banks are trying to tame inflation, financial analyst chatter begins to assess if the US Federal Reserve would achieve a soft landing, meaning avoiding a recession. Per the bond market reaction, sending 2s, 5s, and 10-year yields tumbling more than ten basis points illustrates that investors expect a less aggressive Fed, with money market futures expectations waiting for the first rate cut by the end of Q3 2023.
EUR/USD Key Technical Levels
- ISM Manufacturing PMI fell at a stronger pace than expected in June.
- US Dollar Index continues to push higher after the data.
The business activity in the US manufacturing sector expanded at a much softer pace in June than it did in May with the ISM Manufacturing PMI dropping to 53 from 56.1. This print came in weaker than the market expectation of 54.9.
Further details of the publication showed that Employment Index declined to 47.3 from 49.6 and New Orders Index fell to 49.2 from 55.1. Finally, Prices Paid Index dropped to 78.5 from 82.2, compared to analysts' estimate of 81.
Commenting on the data, "the US manufacturing sector continues to be powered — though less so in June — by demand while held back by supply chain constraints," noted Timothy R. Fiore, Chair of the ISM Manufacturing Business Survey Committee.
"Despite the Employment Index contracting in May and June, companies improved their progress on addressing moderate-term labor shortages at all tiers of the supply chain, according to Business Survey Committee respondents' comments," Fiore added. "Panelists reported lower rates of quits compared to May. Prices expansion slightly eased for a third straight month in June, but instability in global energy markets continues."
Market reaction
Wall Street's main indexes erased daily gains after the disappointing data and the dollar continued to gather strength as a safe haven. As of writing, the US Dollar Index was up 0.85% on the day at 105.62.
AUD/USD slipped around 9% in the second quarter. The pair approaches the July Reserve Bank of Australia (RBA) meeting with mostly headwinds. Therefore, even in the event of a hawkish surprise, economists at ING expect very limited benefits for the aussie in the near term.
Major headwinds for AUD to persist
“A significantly weakened link between domestic monetary policy dynamics and AUD/USD suggests that a rebound towards the 0.70 mark is unlikely to materialise soon even in the event of a hawkish surprise by the RBA (markets are not fully pricing in a 50 bps hike).”
“A more aggressive RBA tightening can suggest a wider room for AUD/USD recovery towards the end of this year and the start of next year (assuming that’s when market sentiment begins to recover), but a number of other factors – especially related to China’s demand and the USD outlook – will continue to be playing a big role too. All this makes any consideration about the AUD outlook purely based on rates dynamics still reductive.”
“Our baseline scenario for now is a gradual return to above-0.70 levels in AUD/USD for the remainder of the year, with most gains likely concentrated in 4Q, when the USD could start giving up some gains.”
- S&P Global Manufacturing PMI for US declined to 52.7 in June.
- S&P 500 posts modest daily gains after the data.
The S&P Global Manufacturing PMI for the US dropped to its lowest level since July 2020 at 52.7 in June from 57 in May. This print came in slightly better than the market expectation and the flash estimate of 52.4.
Commenting on the data, "the PMI survey has fallen in June to a level indicative of the manufacturing sector acting as a drag on GDP, with that drag set to intensify as we move through the summer," noted Chris Williamson, Chief Business Economist at S&P Global Market Intelligence. "Forward-looking indicators such as business expectations, new order inflows, backlogs of work and purchasing of inputs have all deteriorated markedly to suggest an increased risk of an industrial downturn."
Market reaction
The market mood remains upbeat after this report with the S&P 500 Index rising more than 0.5% on a daily basis.
- USD/TRY adds to Thursday’s advance near 17.00.
- Türkiye Manufacturing PMI eased to 48.10 in June.
- Investors’ attention shifts to Monday’s CPI release.
The Turkish lira loses further ground and pushes USD/TRY to new multi-day highs near 16.75 on Friday.
USD/TRY remains supported around 16.00
USD/TRY advances for the second straight session at the end of the week and slowly approaches the key barrier at the 17.00 yardstick.
The pair thus continues to reclaim ground lost following the sharp drop recorded on Monday, all in response to Friday’s measure by the banking watchdog (BDDK) to shore up the domestic currency.
It is worth recalling that the BDDK banned commercial loans in Turkish lira for companies with a strong FX holdings. Companies could therefore access loans in liras by converting FX currency into the government’s currency-protected time deposits or by acquiring securities.
Moving forward, all the attention will be on Monday’s release of the June’s inflation figures tracked by the CPI (73.50% YoY prev.).
Earlier in Türkiye, the Manufacturing PMI edged lower to 48.10 in June (from 49.20).
What to look for around TRY
USD/TRY keeps digesting the recent sharp decline and subsequent rebound following Friday’s announcement by the Turkish banking watchdog.
So far, price action in the Turkish currency is expected to gyrate around the performance of energy prices, the broad risk appetite trends, the Fed’s rate path and the developments from the war in Ukraine, although the effects of this new measure aimed at supporting the de-dolarization of the economy will also have its say.
Extra risks facing TRY also come from the domestic backyard, as inflation gives no signs of abating, real interest rates remain entrenched in negative figures and the political pressure to keep the CBRT biased towards low interest rates remain omnipresent.
Key events in Türkiye this week: Trade Balance (Thursday) – Manufacturing PMI (Friday).
Eminent issues on the back boiler: FX intervention by the CBRT. Progress (or lack of it) of the government’s new scheme oriented to support the lira via protected time deposits. Constant government pressure on the CBRT vs. bank’s credibility/independence. Bouts of geopolitical concerns. Structural reforms. Upcoming Presidential/Parliamentary elections.
USD/TRY key levels
So far, the pair is gaining 0.41% at 16.7509 and faces the immediate target at 17.3759 (2022 high June 23) seconded by 18.2582 (all-time high December 20) and then 19.00 (round level). On the other hand, a breach of 16.0365 (monthly low June 27) would pave the way for a test of 15.6684 (low May 23) and finally 15.2702 (100-day SMA).
As we enter the second half of the year, some analysts have updated their US dollar forecasts. Here you can find the expectations of seven major banks regarding the greenback’s outlook for the coming months.
Wells Fargo
“Our short to medium term view on the US dollar is unchanged, and we continue to forecast a stronger greenback against most foreign currencies through early 2023. With the US economy now likely to fall into recession and the Fed to start cutting policy rates, we now believe the dollar will peak in mid-2023 and start to gradually weaken in the second half of next year.”
Credit Suisse
“The core source of USD strength has been a hawkish Fed in the face of upside US inflation surprises and a still-resilient real economy, despite soggy financial markets. Still, some reasons are finally emerging for a pause in the USD strength trend. US exporters are noting a material negative impact from USD strength. Also, US yield curve inversion starting in 2023 points to genuine fears of a US recession taking hold in that year. Despite these US-specific risks, we still see ex-US problems that should keep the USD on the front foot. In the case of commodity currencies, a world facing a 2023 growth shock is not one that boosts their case, whether DM or EM. Meanwhile, JPY and GBP remain hindered by defensive central banks, while the EUR is in need of ECB alchemy to convince markets it can resist fragmentation pressures. And it’s still possible that the market is underpricing the likely end-point for the US terminal rate.”
TDS
“We continue to expect a resilient USD through the early parts of the summer. That said, the following months and quarters present increasing downside USD risks, especially as we see correlations and themes changing once again. Excessive Fed tightening could start to turn on the USD, especially as US equities and growth continue to come under pressure.”
Commerzbank
“We expect the USA to slide into recession next year. This risk is already visibly increasing. We, therefore, assume that an initially aggressive Fed will no longer have a sustained USD-positive effect. Admittedly, a US recession would not be detrimental to the USD if the Fed nevertheless maintained its high-interest rate level in consideration of inflation risks. However, we no longer expect this to happen. On the contrary. We expect a significant Fed rate cut cycle (to 2.5%) in 2023. Assuming that this view gradually spreads in the market, the looming US recession will thus increasingly become a burdening factor for the US currency.”
HSBC
“Our USD framework has rested on two forces coming together causing it to strengthen, namely a hawkish Fed and slower global growth. These have underpinned and will continue to support our strong USD view for the months ahead.”
MUFG
“While spreads have worked against the dollar, the sharp decline in global equity markets has provided support. We remain of the view that current market conditions are supportive of the dollar but that later in the year the US dollar is likely to weaken on a more sustained basis.”
CIBC
“We ultimately see slowing growth and a turn in inflation as convincing the Fed to back away from what its most hawkish members are now advocating, paving the way towards a softer greenback in 2023. But that's not going to be apparent in the next few months, leaving the near term risks still tilted towards the USD retaining or even building further on its recent gains.”
US ISM Manufacturing PMI overview
The Institute of Supply Management (ISM) will release its latest manufacturing business survey result, also known as the ISM Manufacturing PMI at 14:00 GMT this Friday. The index is anticipated to decline from 56.1 in the previous month to 54.9 in June. The gauge will provide a fresh update on the manufacturing sector activity and the health of the economy amid growing worries about a possible recession.
According to Yohay Elam, Senior Analyst FXStreet: “The more important data point is Prices Paid, which is a snapshot of purchasing managers' inflation expectations. The economic calendar is pointing to a slide from 82.2 to 80.5 points. However, with rising prices being on everybody's minds – television sets and gas stations serving as billboards – there is room for an upside swing rather than a downside one.”
How could it affect EUR/USD?
Ahead of the key release, the US dollar jumped back closer to a 20-year high touched in June and dragged the EUR/USD pair back below the 1.0400 round-figure mark. Stronger-than-expected PMI print would be enough to provide an additional boost to the buck.
Conversely, any disappointment is unlikely to derail the Fed's policy tightening path or impress the USD bears amid concerns about the global economic slowdown. This, in turn, suggests that the path of least resistance for the EUR/USD pair is to the downside.
Eren Sengezer, Editor at FXStreet, offered a brief technical outlook and outlined important technical levels to trade the major: “the Relative Strength Index (RSI) indicator on the four-hour chart stays below, confirming the view that sellers look to retain control. 1.0470 (Fibonacci 23.6% retracement of the latest downtrend) aligns as initial resistance. As long as this level stays intact, buyers are likely to remain uninterested.”
“Above 1.0470, 1.0500 (psychological level, 100-period SMA) and 1.0520 (Fibonacci 38.2% retracement) could be seen as next technical hurdles,” Eren added further.
Key Notes
• ISM Manufacturing PMI Preview: High inflation component steal the show, boost dollar
• EUR/USD Forecast: Euro remains vulnerable after mixed eurozone inflation data
• EUR/USD Price Analysis: Further decline remains on the cards
About the US ISM manufacturing PMI
The Institute for Supply Management (ISM) Manufacturing Index shows business conditions in the US manufacturing sector. It is a significant indicator of the overall economic condition in the US. A result above 50 is seen as positive (or bullish) for the USD, whereas a result below 50 is seen as negative (or bearish).
- EUR/USD resumes the downside and flirts with a breach of 1.0400.
- The June low at 1.0358 should offer decent contention initially.
EUR/USD maintains the bearish bias unchanged and keeps navigating the area of 2-week lows on Friday.
The inability to surpass the 4-month line near 1.0640 should keep the downside pressure well in place around the pair for the time being. Against that, there is a minor support at the weekly low at 1.0382 (June 30) ahead of the June low at 1.0358 (June 15). A deeper pullback should put a visit to the 2022 low at 1.0348 (May 13) back on the radar.
In the longer run, the pair’s bearish view is expected to prevail as long as it trades below the 200-day SMA at 1.1106.
EUR/USD daily chart
- DXY leaves behind Thursday’s pullback and regains 105.00.
- Further up aligns the 2022 top near 105.80 (June 15).
DXY resumes the upside and reclaims the area beyond 105.00 the figure at the end of the week, managing well to keep the trade in the 2-week highs zone.
Further upside in the dollar is forecast to motivate the index to attempt another visit to the so far yearly highs near 105.80 recorded in the wake of the FOMC event in June. If cleared, then a test of the December 2002 at 107.31 could start emerging on the horizon.
As long as the 4-month line near 102.40 holds the downside, the near-term outlook for the index should remain constructive.
Looking at the longer run, the outlook for the dollar is seen bullish while above the 200-day SMA at 98.13.
DXY daily chart
- EUR/JPY drops further and breaches 141.00 to multi-session lows.
- Next on the downside comes the June low at 137.86 (June 15).
EUR/JPY comes under further selling pressure and prints new 2-week lows in the sub-141.00 region on Friday.
Despite the ongoing correction, the bullish bias in the cross remains well in place as long as the support line around 138.70 holds the downside. This area of contention is currently reinforced by the 55-day SMA.
The current bearish move, however, carries the potential to revisit the June low at 137.86 recorded on June 15, where it is expected to hold the downside.
EUR/JPY daily chart
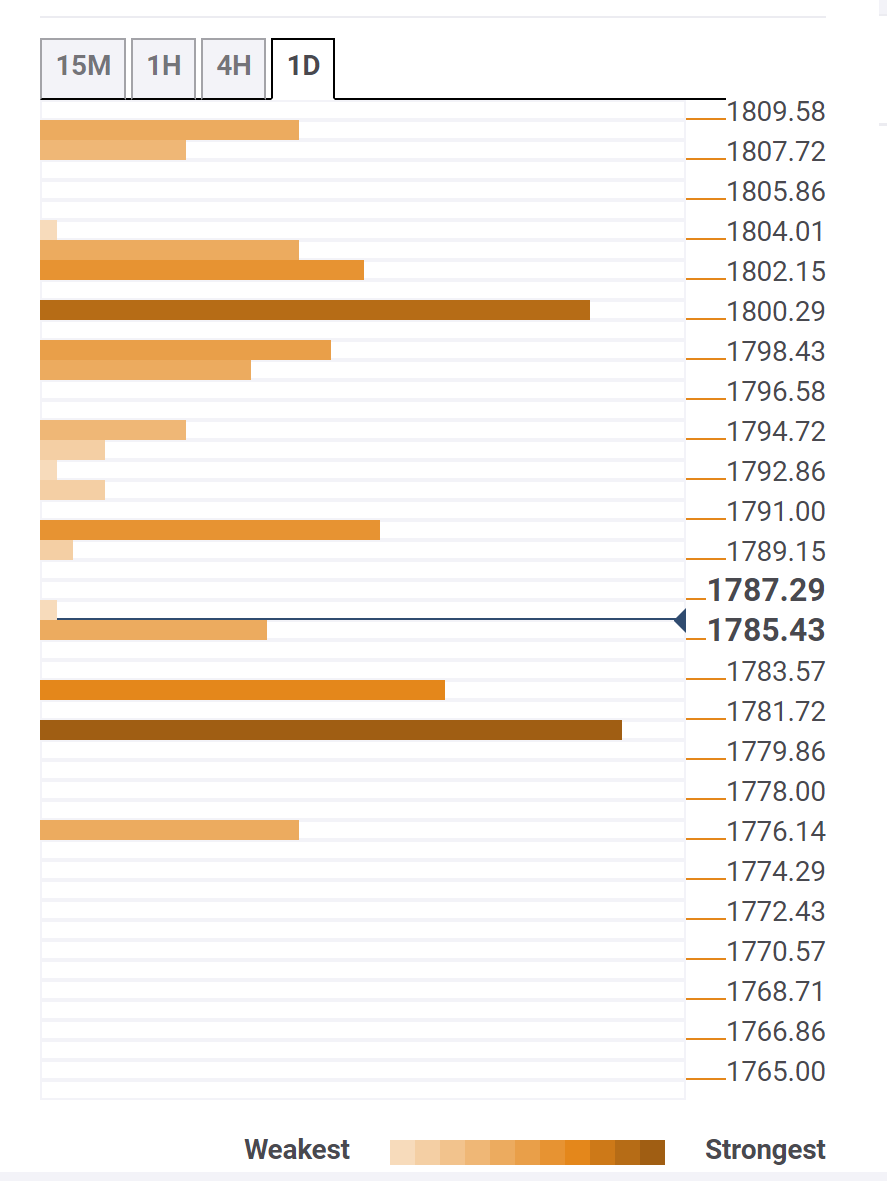
- A combination of factors dragged Gold below the $1,800, back closer to the YTD low on Friday.
- Aggressive Fed rate hike bets, broad-based USD strength exerted heavy downward pressure.
- Recession fears did little to impress bulls or lend any support to the safe-haven commodity.
The prospects for a more aggressive policy tightening by major central banks to curb soaring inflation continued taking its toll on the non-yielding gold. Apart from this, the underlying bullish tone around the US dollar was seen as another factor that weighed heavily on the dollar-denominated commodity. Spot prices broke through the $1,800 psychological mark and tumbled back closer to the YTD low during the early North American session. Meanwhile, growing worries about a possible global recession did little to impress bullish traders or lend any support to the safe-haven XAUUSD. This, in turn, suggest that the path of least resistance for the precious metal is to the downside.
Gold Price: Key levels to watch
The Technical Confluence Detector shows that Gold Price could find decent support near the YTD low, around the $1,780 region. The said area coincides with Pivot Point one month S1 and is closely followed by Pivot Point one day S3. A convincing break below the latter would be seen as a fresh trigger for bearish traders and pave the way for an extension of the ongoing downward trajectory.
On the flip side, the $1,790 region - the convergence of Pivot Point one day S2 and Bollinger Band one-hour Lower and SMA - now seems to act as immediate resistance. Sustained strength beyond might trigger a short-covering bounce and lift Gold Price back towards the $1,798-$1,800 area. The said hurdle comprises Pivot Point one week S2, Pivot Point one day S1 and 5-period SMA 4-hour.
About Technical Confluences Detector
The TCD (Technical Confluences Detector) is a tool to locate and point out those price levels where there is a congestion of indicators, moving averages, Fibonacci levels, Pivot Points, etc. If you are a short-term trader, you will find entry points for counter-trend strategies and hunt a few points at a time. If you are a medium-to-long-term trader, this tool will allow you to know in advance the price levels where a medium-to-long-term trend may stop and rest, where to unwind positions, or where to increase your position size.
- GBP/USD witnessed aggressive selling on Friday and dived to over a two-week low.
- Technical selling below the 1.2100 mark aggravated the intraday bearish pressure.
- Descending trend-channel breakdown supports prospects for a further near-term fall.
The GBP/USD pair added to its heavy intraday losses and tumbled to over a two-week low, around the 1.2030 region heading into the North American session.
The prospects for more aggressive Fed rate hikes, along with growing recession fears, boosted demand for the safe-haven US dollar and prompted fresh selling around the GBP/USD pair on Friday. This marked the third day of a sharp fall in the previous four and took along some short-term trading stops placed near the 1.2100 mark.
The subsequent decline below a two-week-old descending trend-channel support confirmed a fresh bearish breakdown and supports prospects for a further near-term depreciating move. The negative outlook is reinforced by the fact that bearish technical indicators on the daily chart are still away from being in the oversold territory.
That said, RSI (14) on the 4-hour chart is already flashing overstretched conditions and warrants some caution for aggressive bearish traders. Nevertheless, the GBP/USD pair still seems poised to prolong the downward trajectory and challenge the 1.2000 psychological mark before eventually dropping to the YTD low, around the 1.1935 zone.
On the flip side, the aforementioned ascending channel support breakpoint, around the 1.2085 region, now seems to act as an immediate resistance ahead of the 1.2100 mark. Any further move up could be seen as a selling opportunity near the 1.2140-1.2150 region. This, in turn, should cap the GBP/USD pair near the 1.2180-1.2185 supply zone.
GBP/USD 4-hour chart
-637922746834317044.png)
Key levels to watch
- USD/JPY witnessed selling for the second successive day and dropped closer to the weekly low.
- The overnight break through an ascending trend-line and 200-hour SMA favours bearish traders.
- Mixed technical indicators warrant some caution before confirming a near-term top for the pair.
The USD/JPY pair extended its retracement slide from the 137.00 mark, or a fresh 24-year high touched on Wednesday and witnessed heavy selling for the second successive day on Friday. The corrective slide dragged spot prices back closer to the weekly low, though bulls showed some resilience below the 135.00 psychological mark.
Given the overnight breakdown through a two-week-old ascending trend-line, subsequent weakness below the 200-hour SMA was seen as a fresh trigger for bearish traders. The latter, currently around the 135.70 region, capped the USD/JPY pair's intraday recovery move and should now act as a key pivotal point for short-term traders.
Technical indicators, meanwhile, are holding deep in the bearish territory on hourly charts, though are still far from confirming a negative bias on the daily chart. This makes it prudent to wait for strong follow-through selling before confirming that the USD/JPY pair has topped out and positioning for any further depreciating move.
From current levels, any further decline below the 135.00 mark is likely to find decent support near the mid-134.00s, which if broken would trigger a fresh wave of technical selling. The USD/JPY pair might then weaken further below the 134.00 round figure and accelerate the fall towards testing the next relevant hurdle near the 133.60 area.
On the flip side, momentum beyond the 135.70 area (200-hour SMA) now seems to confront some resistance near the 136.00 round-figure mark. Any further recovery is more likely to attract fresh sellers and remain capped near the aforementioned ascending trend-line support breakpoint, now turned resistance, near the 136.35-136.40 region.
USD/JPY 1-hour chart
-637922727432240174.png)
Key levels to watch
Economist at UOB Group Lee Sue Ann suggests the RBA would continue its hiking cycle at the July 4 meeting.
Key Takeaways
“The RBA has now embarked on a more aggressive front-loading hiking cycle. We continue to expect a series of rate hikes over the coming months.”
“We now see the RBA hiking by another 90bps for the remainder of 2022 to bring the OCR to 1.75% by year-end (compared to 1.25% previously), before continuing to rise more gradually over 2023.”
European Central Bank (ECB) executive board member Fabio Panetta said on Friday that the ECB's policy normalization should remain gradual, as reported by Reuters.
Additional takeaways
"Surge in prices does not reflect excess demand in the euro area."
"Acting against fragmentation is necessary for us to fulfil that mandate."
"Inflation expectations stand at around 2% and wage increases remain moderate."
"Vulnerable countries, fragmentation would lead to capital outflows and an increase in yields, resulting in financing conditions that would be too tight."
"Least vulnerable countries would experience capital inflows that would compress yields."
"Action to prevent fragmentation is therefore not at odds with the normalisation."
"Beyond ending negative rates, further adjustments to our monetary policy stance will depend on the evolution of the outlook."
Market reaction
These comments failed to help the shared currency find demand and the EUR/USD pair was last seen losing 0.2% on a daily basis at 1.0460.
- A combination of factors dragged gold below the $1,800 mark, or its lowest level since May 16.
- Aggressive Fed rate hike bets and a goodish pickup in the USD demand exerted some pressure.
- Recession fears and the risk-off mood did little to lend any support to the safe-haven XAUUSD.
Gold prolonged this week's bearish trend and witnessed heavy follow-through selling on Friday, marking the fifth successive day of a negative move. The downward trajectory extended through the early part of the European session and dragged spot prices to the lowest level since May 16, around the $1,792 region in the last hour.
The prospects for more aggressive rate hikes by the US central bank were reaffirmed by Fed Chair Jerome Powell's remarks on Wednesday, saying that the US economy is well-positioned to handle tighter policy. Speaking at the ECB Forum in Sintra, Powell added that the Fed remains focused on getting inflation under control and the market pricing is pretty close to the dot plot. This, in turn, continued driving flows away from the non-yielding gold. Apart from this, broad-based US dollar strength further exerted downward pressure on the dollar-denominated commodity.
The combination of factors overshadowed the prevalent risk-off environment, which tends to benefit the safe-haven precious metal. The market sentiment remains fragile amid concerns that rapidly rising rates and tightening financial conditions would pose challenges to global economic growth. Adding to this, the ongoing Russia-Ukraine war has been fueling fears about a possible recession. This, in turn, tempered investors' appetite for perceived riskier assets, though did little to impress bullish traders or ease the bearish pressure surrounding gold.
The anti-risk flow was reinforced by the recent slump in the US Treasury bond yields, which, again, failed to lend any support to the yellow metal. With the latest leg down, spot prices now seem to have confirmed a fresh bearish breakdown below the $1,800 round-figure mark. Furthermore, acceptance below the said handle might have already set the stage for an extension of the depreciating move towards the YTD low, around the $1,780 region. The downward trajectory could get extended towards the next relevant support near the $1,755-$1,750 zone. Traders now look forward to the release of the US ISM Manufacturing PMI for a fresh impetus.
Technical levels to watch
Economist at UOB Group Ho Woei Chen, CFA, reviews the latest PMI results in the Chinese economy.
Key Takeaways
“China’s official manufacturing and non-manufacturing Purchasing Manager’s Indexes (PMIs) rebounded into the expansion territory (defined as reading above 50) in Jun after three months in contraction as Shanghai lifted lockdowns.”
“This reaffirms expectation of an economic recovery in China that will likely pick up momentum in the second half of the year alongside stimulus measures rollout. Underlying weakness in employment and selling/ output prices (for both manufacturing and non-manufacturing) indicate that the recovery remains fragile.”
“Given the fragile outlook, we maintain our view that there is room for further monetary policy easing. PBoC Governor Yi Gang recently suggested this will likely be via boosting credit rather than interest rate cuts as China’s ‘real interest rate is pretty low’.”
- EUR/GBP gained strong positive traction on Friday and shot back to the weekly high.
- Stronger Eurozone CPI figures reaffirmed ECB rate hike bets and boosted the euro.
- Cautious BoE, Brexit woes undermined the GBP and contributed to the strong move.
The EUR/GBP cross built on the overnight goodish rebound from mid-0.8500s, or a nearly two-week low and gained strong positive traction on the last day of the week. The buying interest picked up pace during the early part of the European session and pushed spot prices to the 0.8650-0.8655 region, back closer to the weekly high.
The shared currency's relative outperformance comes amid a clear signal by the European Central Bank that it would begin the rate hike cycle in June. Furthermore, a 50-bps hike in September is seen as an almost done deal and the bets were reaffirmed by stronger Eurozone consumer inflation figures released earlier this Friday.
According to the preliminary estimate published by Eurostat, the annualized Eurozone Harmonised Index of Consumer Prices (HICP) accelerated to 8.6% in June. This was well above market expectations for a rise to 8.4% from the 8.1% reported in May, which, in turn, was seen as a key factor that provided a fresh lift to the EUR/GBP cross.
On the other hand, the British pound was pressured by expectations that the Bank of England would adopt a gradual approach toward raising interest rates amid growing recession fears. Apart from this, concerns about fresh UK-EU tensions over the Northern Ireland Protocol of the Brexit agreement should act as a headwind for sterling.
The fundamental backdrop supports prospects for a further near-term appreciating move for the EUR/GBP cross. Hence, some follow-through strength towards reclaiming the 0.8700 mark, en-route the YTD peak around the 0.8720 region, remains a distinct possibility.
Technical levels to watch
- GBP/USD came under renewed selling pressure on Friday amid a goodish pickup in the USD demand.
- Aggressive Fed rate hike bets, recession fears and the risk-off mood underpinned the safe-haven buck.
- Expectations for a cautious BoE and Brexit jitters support prospects for a further depreciating move.
The GBP/USD pair met with a fresh supply on Friday and dropped back closer to a two-week low touched the previous day, with bears still awaiting sustained weakness below the 1.2100 mark.
A combination of supporting factors assisted the US dollar to regain positive traction on the last day of the week, which, in turn, exerted some downward pressure on the GBP/USD pair. The Federal Reserve’s non-stop chatter about rate hikes to curb soaring inflation, along with the prevalent risk-off mood, drove some haven flows towards the greenback.
Speaking at the ECB Forum in Sintra earlier this week, Fed Chair Jerome Powell lifted market bets for more aggressive rate hikes and said that the US economy is well-positioned to handle tighter policy. Powell further added that the Fed remains focused on getting inflation under control and that the market pricing is pretty close to the dot plot.
The Fed's hawkish outlook added to growing market concerns that rapidly rising rates and tightening financial conditions would pose challenges to global economic growth. Apart from this, a further escalation in tensions between the West and Russia - in response to the latter's invasion of Ukraine - has stoked fears of a possible recession.
This, in turn, continued taking its toll on the global risk sentiment and forced investors to take refuge in traditional safe-haven assets, including the buck. The global flight to safety was reinforced by the recent slump in the US Treasury bond yields, which acted as a headwind for the USD and helped limit losses for the GBP/USD pair, at least for now.
The bias, however, remains tilted in favour of bearish traders amid expectations that the Bank of England would adopt a more gradual approach to raising interest rates. Apart from this, the risk of fresh UK-EU tensions over the Northern Ireland Protocol of the Brexit agreement supports prospects for a further depreciating move for the GBP/USD pair.
Market participants now look forward to Friday's US economic docket, featuring the release of the US ISM Manufacturing PMI for a fresh impetus later during the early North American session. This, along with the US bond yields and the broader market risk sentiment, might influence the USD price dynamics and produce short-term opportunities around the GBP/USD pair.
Technical levels to watch
The annualized Eurozone Harmonised Index of Consumer Prices (HICP) surged by 8.6% in June vs. the previous reading of 8.1%, the latest data published by Eurostat showed on Friday. The market expected the bloc’s inflation to accelerate by 8.4%.
The core figures dropped to 3.7% YoY in June when compared to 3.9% expectations and 3.8% booked in May.
The Euro area figures are reported a day after Germany’s annual inflation for June eased from a record high, arriving at 8.2% while missing expectations of 8.8% following an 8.7% increase reported in May.
The bloc’s HICP figures hold significance, as it helps investors assess the European Central Bank’s (ECB) monetary policy normalization path. The ECB inflation target is 2%.
Key details (via Eurostat)
Looking at the main components of euro area inflation, energy is expected to have the highest annual rate in June (41.9%, compared with 39.1% in May), followed by food, alcohol & tobacco (8.9%, compared with 7.5% in May), non-energy industrial goods (4.3%, compared with 4.2% in May) and services (3.4%, compared with 3.5% in May).
EUR/USD reaction
EUR/USD caught a fresh bit on the mixed Eurozone inflation figures. The spot is now losing 0.14% on the day, trading at 1.0466. Hotter inflation will provide further headaches for the ECB ahead of the July 21 meeting, increasing the calls of the hawks for a 50 bps hike in July.
- EUR/USD resumes the downside well south of 1.0500.
- Germany June Final Manufacturing PMI came at 52.0.
- The US ISM Manufacturing will be the salient event later.
The selling bias re-emerged in the risk complex and drags EUR/USD back to the mid-1.0400s on Friday.
EUR/USD weak on risk-off trade, looks to data
EUR/USD rapidly fades Thursday’s rebound and refocuses on the downside on the back of the resumption of the buying pressure in the greenback, while the German 10y Bund yields attempt a mild rebound at the end of the week.
In the meantime, the risk aversion continues to dictate the price action around spot and the rest of the global assets, mainly in response to rising fears surrounding a potential global slowdown. In addition, the recent inaction of the ECB when it comes to its plans regarding the fragmentation issue also collaborates with the sour sentiment around the European currency.
In the domestic calendar, final figures saw the German and EMU Manufacturing PMI at 52.0 and 52.1, respectively, in June. Later in the session, ECB Board member F.Panetta us due to speak while the release of EMU flash inflation figures for the month of June will also be in the limelight.
Across the Atlantic, the final June Manufacturing PMI is due along the more relevant ISM Manufacturing.
What to look for around EUR
EUR/USD faces the re-emergence of the risk-off mood and the subsequent drop to the area well below 1.0500 so far this week.
In the meantime, the single currency continues to digest news from the ECB Forum in Portugal as well as any developments surrounding the bank’s plans to design a de-fragmentation tool in light of the upcoming start of the hiking cycle.
However, EUR/USD is still far away from exiting the woods and it is expected to remain at the mercy of dollar dynamics, geopolitical concerns and the Fed-ECB divergence, while higher German yields, persistent elevated inflation in the euro area and a decent pace of the economic recovery in the region are also supportive of an improvement in the mood around the euro.
Key events in the euro area this week: EMU, Germany Final Manufacturing PMI, EMU Flash Inflation Rate (Friday).
Eminent issues on the back boiler: Fragmentation risks. Kickstart of the ECB hiking cycle in July? Asymmetric economic recovery post-pandemic in the euro bloc. Impact of the war in Ukraine on the region’s growth prospects.
EUR/USD levels to watch
So far, spot is retreating 0.27% at 1.0454 and faces immediate contention at 1.0382 (weekly low June 30) seconded by 1.0358 (monthly low June 15) and finally 1.0348 (2022 low May 13). On the upside, a break above 1.0615 (weekly high June 27) would target 1.0773 (monthly high June 9) en route to 1.0786 (monthly high May 30).
- NZD/USD witnessed heavy selling on Friday and dived to its lowest level since May 2020.
- Aggressive Fed rate hike bets revived the USD demand and exerted downward pressure.
- Recession fears, the risk-off mood further drove flows away from the risk-sensitive kiwi.
The NZD/USD pair struggled to capitalize on the overnight modest recovery move and came under intense selling pressure on Friday. The intraday bearish trend extended through the early European session and dragged spot prices to the lowest level since May 2020, around the 0.6165 region in the last hour.
Speaking at the ECB's annual forum in Sintra on Wednesday, Fed Chair Jerome Powell lifted bets for more aggressive rate hikes and said that the US economy is well-positioned to handle tighter policy. Powell further added that the Fed remains focused on getting inflation under control and that the market pricing is pretty close to the dot plot. Adding to this, the prevalent risk-off environment boosted demand for the safe-haven US dollar and weighed on the risk-sensitive kiwi.
The prospects for a faster policy tightening by major central banks to curb soaring inflation, along with the ongoing Russia-Ukraine war, have been fueling fears about a possible recession. This, in turn, tempered investors' appetite for perceived riskier assets, which was evident from an extended sell-off in the equity markets. The combination of supporting factors assisted the USD to inch back closer to a 20-year high touched in June and exerted heavy downward pressure on the NZD/USD pair.
With the latest leg down, spot prices confirmed a fresh bearish breakdown below the 0.6200 round-figure mark. This was seen as another factor that aggravated the bearish pressure surrounding the NZD/USD pair and might have already set the stage for further losses. Furthermore, bearish technical indicators are still away from flashing oversold conditions and add credence to the negative outlook. Hence, some follow-through weakness, towards the next relevant support near the 0.6100 mark, remains a distinct possibility. Traders now look forward to the US ISM Manufacturing PMI for a fresh impetus.
Technical levels to watch
Gold has generally been fluctuating between $1,800 and a good $1,850 since mid-May. In the view of strategists at Commerzbank, nothing much is likely to unsettle the gold market in any serious way next week.
Gold will find it difficult to recover unless there is a reversal of ETF flows
“Gold is currently being held in check on two sides: higher interest rates and the firm US dollar are limiting gold’s upside potential as a non-interest-bearing investment, while the high inflation rates are preventing gold – in its capacity as a store of value – from sliding. This is not likely to change next week either, which is when the Fed will be publishing its latest meeting minutes.”
“The minutes will doubtless reflect the Fed’s determination to regain control of the high inflation by implementing sizeable rate hikes.”
“ETF investors have been turning their backs on gold again of late and selling shares. Unless there is a reversal of ETF flows, the gold price will likely find it difficult to recover.”
- Eurozone Manufacturing PMI dropped to a fresh 22-month low in June.
- EUR/USD trades deep in negative territory near 1.0450.
Economic activity in the eurozone's manufacturing sector expanded at its weakest pace in 22 months with the S&P Global Manufacturing PMI dropping to 52.1 (final) from 54.6 in May. This print came in slightly better than the market expectation and the flash estimate of 52.
Assessint the survey findings, "eurozone manufacturing has moved into decline in June, with production dropping for the first time for two years amid a steepening downturn in demand," said Chris Williamson, Chief Business Economist at S&P Global Market Intelligence. "Orders for goods have fallen at an accelerating rate over the past two months, dropping in June in every country surveyed with the exception of the Netherlands, and even here the rate of growth has weakened markedly in recent months."
Market reaction
The EUR/USD pair showed no immediate reaction to this report and was last seen losing 0.35% on the day at 1.0445.
- S&P Manufacturing PMI for Germany declined to 52 in June.
- Markets remain relatively calm ahead of EU inflation data.
Business activity in Germany's manufacturing sector expanded at a soft pace in June with the S&P Global Manufacturing PMI retreating to 52 (final) in June from 54.8 in May. This reading matched the previous estimate and the market expectation.
Commenting on the data, "we're seeing a rapid correction in underlying demand for German goods," said Phil Smith, Economics Associate Director at S&P Global Market Intelligence. "Inflows of new orders across the sector showed a deepening decline in June, as firms reported a degree of demand destruction from higher prices, growing market uncertainty, and multiple headwinds to export sales."
Market reaction
This report doesn't seem to be having a significant impact on risk sentiment with Germany's DAX 30 Index trading flat on the day at 12,787 points.
GBP/USD has failed to build on Thursday's modest recovery gains. As FXStreet’s Eren Sengezer notes, 1.2050 aligns as next bearish target amid risk aversion.
Cable remains technically bearish
“Investors continue to stay away from risk-sensitive assets ahead of the weekend.”
“On the downside, 1.2100 (static level, psychological level) aligns as immediate support. With a four-hour close below that level, additional losses toward 1.2050 (static level) and 1.2000 (psychological level) could be witnessed.”
“First resistance is located at 1.2120 (Fibonacci 23.6% retracement of the latest downtrend) ahead of 1.2170 (static level, 20-period SMA) and 1.2200 (Fibonacci 38.2% retracement).”
See: GBP/USD to retest the 1.1950 on a break under 1.21 – ING
- Silver continued losing ground on Friday and dived to a two-year low, below the $20.00 mark.
- The downward trajectory confirmed a fresh bearish break through an ascending trend channel.
- Oversold oscillators warrant some caution for bearish traders and positioning for further losses.
Silver remained under intense selling pressure on the last day of the week and weakened further below the $20.00 psychological mark during the early part of the European session. The downward trajectory dragged spot prices to the lowest level since July 2020, around the $19.85 region in the last hour.
With the latest leg down, the XAG/USD now seems to have confirmed a fresh breakdown through a one-month-old descending trend channel and seems vulnerable to extending the negative momentum. That said, oscillators on hourly/daily charts are flashing oversold conditions and warrant some caution for bearish traders.
This makes it prudent to wait for some near-term consolidation or a modest bounce before positioning for any further depreciating move. Nevertheless, the technical set-up supports prospects for an extension of the bearish trend and a fall to the next relevant support near the $19.60-$19.55 region.
On the flip side, any attempted recovery back above the $20.00 mark would attract fresh selling and remain capped near the ascending trend-channel support breakpoint, around the $20.25 region. The latter should now act as a pivotal point, which if cleared might trigger a near-term short-covering move.
The XAG/USD might then accelerate the momentum towards an intermediate hurdle near the $20.45-$20.50 area en-route the $21.00 round-figure mark.
Silver 4-hour chart
-637922583730106256.png)
Key levels to watch
No changes to the consolidation theme around USD/CNH in the near term, commented FX Strategists at UOB Group Lee Sue Ann and Quek Ser Leang.
Key Quotes
24-hour view: “We highlighted yesterday that ‘momentum indicators are neutral’ and we expected USD to ‘trade sideways within a range of 6.6900/6.7200’. Our view for sideway trade sideways was not wrong even though USD traded within a narrower range than expected (6.6902/6.7116). Further sideway-trading still appears likely, expected to be within a range of 6.6850/6.7080.”
Next 1-3 weeks: “We have expected USD to trade sideways between 6.6600 and 6.7400 since last Monday (20 Jun, spot at 6.7080). While shorter-term downward momentum has improved somewhat, there is no change in our view for now.”
- DXY starts the month in a positive tone around 105.00.
- US yields extend the downtrend across the curve.
- Flash Manufacturing PMI, ISM Manufacturing next of tap.
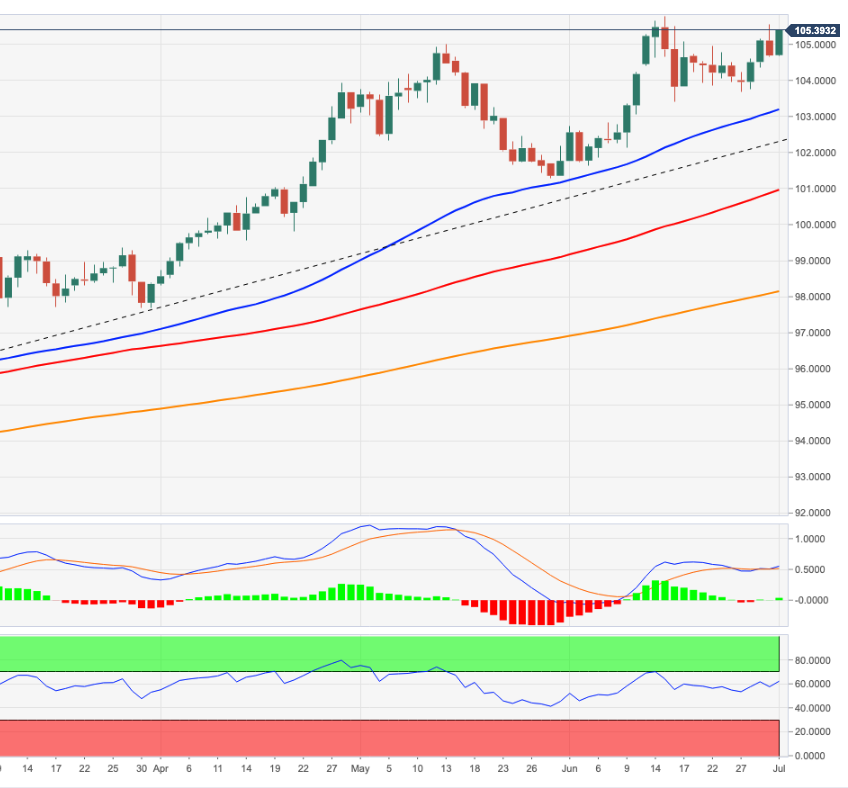
The greenback, in terms of the US Dollar Index (DXY), regains some composure and trespasses the 105.00 yardstick on Friday.
US Dollar Index now looks to data
The index keeps the weekly upside well in place and leaves behind Thursday’s pullback, as the selling pressure seems to have returned to the risk-associated universe at the end of the week.
The dollar, in the meantime, remains on track to close the week with moderate gains and at shouting distance from the cycle peaks around 105.80 recorded in June 15 on the back of the resumption of the risk aversion, recession fears, a corrective downside in US yields and expectations of further tightening by not only the Fed, but also from the other major central banks.
In the US data space, the manufacturing sector will take centre stage with the releases of the final June S&P Global Manufacturing PMI and the always relevant ISM Manufacturing.
What to look for around USD
Renewed risk-off sentiment motivated the index to reclaim the area around the 105.00 zone despite US yields continued to trend lower.
The dollar, in the meantime, remains well supported by the Fed’s divergence vs. most of its G10 peers (especially the ECB) in combination with bouts of geopolitical effervescence, higher US yields and a potential “hard landing” of the US economy, all factors suggesting a stronger dollar in the next months.
Key events in the US this week: ISM Manufacturing, Final Manufacturing PMI (Friday).
Eminent issues on the back boiler: Hard/soft/softish? landing of the US economy. Escalating geopolitical effervescence vs. Russia and China. Fed’s more aggressive rate path this year and 2023. US-China trade conflict. Future of Biden’s Build Back Better plan.
US Dollar Index relevant levels
Now, the index is up 0.35% at 105.05 and a break above 105.54 (weekly high June 30) would expose 105.78 (2022 high June 15) and then 107.31 (monthly high December 2002). On the other hand, the next contention emerges at 103.67 (weekly low June 27) seconded by 103.41 (weekly low June 16) and finally 101.29 (monthly low May 30).
The first six months of 2022 have been marked by the dominance of the dollar. In the new quarter, economists at ING expect to see the same old dollar strength.
USD still in demand
“Our view remains that the dollar should continue to count on a rather solid floor in the third quarter thanks to the Fed’s front-loaded rate hikes and a still challenging environment for global risk assets due to tighter liquidity and fears of a global slowdown.”
“Some moderate dollar weakness may start to emerge in the fourth quarter when US rates peak.”
The GBP/USD pair was last seen retreating toward 1.21. Below here, cable could retest the 1.1950 low, economists at ING report.
Downside risks persist
“Brexit-related headlines should continue to come in over the coming days, but the pound may remain little touched by them for now.”
“A re-pricing of aggressive Bank of England expectations is the biggest risk for the pound, which also remains exposed to further risk sentiment instability.”
“Should we see a break below 1.21 in cable, the 1.1950 low could be re-tested soon.”
“When it comes to EUR/GBP, an almost equally unattractive euro should keep the pair around 0.86.”
EUR/USD continues to trade very close to the 1.05 gravity line. Today, all eyes will be on the eurozone-wide CPI figures for June. However, inflation figures are unlikely to impact the shared currency, economists at ING report.
EUR/USD may end the week in the 1.0430-1.0500 range
“The euro appeared to have a reduced sensitivity to the inflation prints this week, and this may well be the case today as markets seem to have cemented their ECB tightening expectations.”
“EUR/USD should remain mostly a function of global risk sentiment and USD dynamics and may end the week in the 1.0430-1.0500 range.”
See – EUR/USD: Eurozone inflation data unlikely to lift the shared currency – Commerzbank
FX option expiries for July 1 NY cut at 10:00 Eastern Time, via DTCC, can be found below.
- EUR/USD: EUR amounts
- 1.0400-05 937m
- 1.0425 287m
- 1.0450 521m
- 1.0475-80 914m
- 1.0500-05 454m
- 1.0520-25 363m
- 1.0540-55 2.0b
- 1.0565-75 2.6b
- 1.0590-00 2.53b
- 1.0615 611m
- 1.0630 994m
- GBP/USD: GBP amounts
- 1.2000 408m
- 1.2100 259m
- 1.2150 222m
- 1.2200 248m
- USD/JPY: USD amounts
- 133.50 1.47b
- 134.00 1.58m
- 135.25 295m
- 135.50 571m
- USD/CHF: USD amounts
- 0.9450 750m
- 0.9650-60 450m
- AUD/USD: AUD amounts
- 0.6800 754m
- 0.6900-10 816m
- 0.6950 337m
- 0.7000 400m
- 0.7050 1.96b
- NZD/USD: NZD amounts
- 0.6400 1.153b
EUR/GBP: EUR amounts
- 0.8600 329m
- 0.8635-40 276m
- USD/JPY lost ground for the second straight day and retreated further from a 24-year peak.
- Sliding US bond yields, recession fears benefitted the safe-haven JPY and exerted pressure.
- The Fed-BoJ policy divergence warrants some caution for bears amid modest USD strength.
The USD/JPY pair witnessed heavy selling for the second successive day on Friday and retreated further from its highest level since September 1998, around the 137.00 mark set on Wednesday. The corrective fall dragged spot prices further below the 135.00 psychological mark, closer to the weekly low during the early European session.
The prevalent risk-off environment - as depicted by a sea of red across the equity markets - drove haven flows towards the Japanese yen and exerted downward pressure on the USD/JPY pair. The market sentiment remains fragile amid concerns that a more aggressive move by major central banks to curb soaring inflation would pose challenges to global economic growth. Apart from this, a further escalation in tensions between the West and Russia - in response to the latter's invasion of Ukraine - has stoked fears of a possible recession.
The worsening global economic outlook forced investors to take refuge in traditional safe-haven assets, which was reinforced by the recent slump in the US Treasury bond yields. This resulted in the narrowing of the US-Japan yield differential, which further benefitted the JPY and prompted traders to lighten their bullish bets around the USD/JPY pair. That said, the divergent monetary policy stance adopted by the Federal Reserve and the Bank of Japan held back traders from placing aggressive bearish bets amid modest US dollar strength.
Speaking at the ECB Forum in Sintra on Wednesday, Fed Chair Jerome Powell said that the US central bank remains focused on getting inflation under control. Powell further added that the market pricing is pretty close to the dot plot and that the US economy is well-positioned to handle tighter policy. This, in turn, reaffirmed bets that the Fed would retain its faster policy tightening path and underpinned the USD. In contrast, the BoJ has repeatedly signalled that it would stick to its ultra-accommodative policy and keep borrowing costs at "present or lower" levels.
The mixed fundamental backdrop warrants some caution before confirming that the USD/JPY pair has topped out in the near term and positioning for a deeper correction in spot prices. Market participants now look forward to the release of the US ISM Manufacturing PMI, due later during the North American session. Apart from this, the US bond yields, the USD price dynamics and the broader market risk sentiment might provide a fresh impetus, which should allow traders to grab short-term opportunities around the major.
Technical levels to watch
AUD/NZD has rallied to recent highs of 1.1174. Benjamin Wong, Strategist at DBS Bank, retains constructive bias on the pair.
Terms of trade divergence favours the AUD over the NZD
Terms of trade divergence favours the AUD over the NZD, and unless the cross sustains losses under 1.0806, buying pullbacks is preferred.”
“Further upside targets a neckline calibrated target at 1.1251, followed by 1.1324.”
Here is what you need to know on Friday, July 1:
Following a volatile American session amid soft US inflation data and month-end flows on Thursday, markets stay relatively calm early Friday. Nevertheless, investors remain cautious ahead of June inflation figures for the euro area. In the second half of the day, the ISM Manufacturing PMI report will be featured in the US economic docket. The US Dollar Index recovers modestly toward 105.00 and the US stock index futures trade deep in negative territory.
ISM Manufacturing PMI Preview: High inflation component steal the show, boost dollar.
In an interview with Austrian newspaper Oberoesterreichische Nachrichten, European Central Bank (ECB) policymaker Robert Holzmann noted that he would have preferred the bank to hike its policy rate earlier. Eurostat is expected to report that the annual Harmonised Index of Consumer Prices (HICP) rose to 8.3% in June from 8.1% in May.
Eurozone Inflation Preview: Core holds the keys, with 4% set to trigger a EUR/USD rally.
Earlier in the day, the data from China showed that the Caixin Manufacturing PMI improved to 51.7 in June from 48.1 in May but this print doesn't seem to be having a positive impact on market sentiment in the early European session.
Meanwhile, cure oil prices fell sharply after OPEC+ decided to stick to its current plan of increasing the output by 648,000 barrels per day in August. The group refrained from discussing the output strategy from September. The barrel of West Texas Intermediate (WTI), which fell more than 3% on Thursday, was last seen losing 0.8% on the day at $105.15.
EUR/USD staged a decisive rebound during the American session and ended up closing in positive territory on Thursday. The pair stays on the back foot early Friday and edges lower toward 1.0450.
GBP/USD registered small daily gains on Thursday but turned south early Friday. The pair was last seen retreating toward 1.2100.
USD/JPY fell sharply on Thursday amid falling US Treasury bond yields. With the benchmark 10-year US T-bond yield losing nearly 2% below 3% so far on the day, the pair trades in negative territory below 135.00 in the European morning.
Gold failed to take advantage of falling yields and closed the fourth straight day in negative territory. Sellers continue to dominate XAU/USD's action early Friday with the pair trading below $1,800 for the first time since mid-May.
Although Bitcoin climbed above $20,000 on Friday after having dropped below that level on Thursday, it failed to preserve its recovery momentum and was last seen trading near $19,300. Ethereum continues to trade within a touching distance of $1,000.
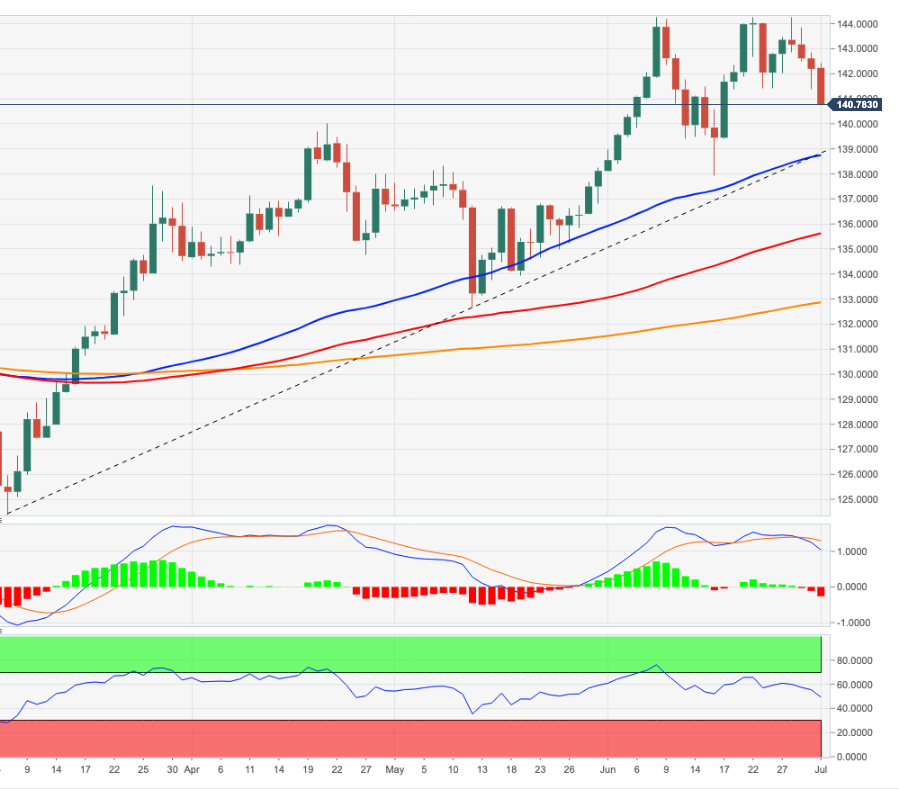
The Japanese yen is the worst performing currency among the majors so far this year. But economists at Scotiabank believe that JPY’s slide may be slowing.
140 may be around the limit of the USD rise in this cycle
“We think that the apparent cap on US yields should be modestly JPY supportive and help stabilize the recent yen decline.”
“We noted that USD/JPY spot trends (higher highs) is diverging with the daily RSI (lower highs). This divergence is a classic sign that a move may be poised to reverse. There are scant signs of a reversal in terms of pure price action, however.”
“Firmer resistance is developing in 136.75/00 but the USD will have to trade below 134 at the moment in order to signal some (even modest) downside pressure is developing.”
“Given the extent of the USD rally so far this year, we are attentive to signs of a more significant reversal ahead of the 140 zone which we think may be around the limit of the USD rise in this cycle.”
- EUR/JPY drops for the fourth consecutive day as bears keep reins at the lowest levels in fortnight.
- Rush to risk-safety underpins bond, USD buying ahead of EU inflation data.
- Japan data join weak yields to exert additional downside pressure.
- Preliminary readings of Eurozone HICP for June will be important to watch, risk catalysts are the key.
EUR/JPY takes offers to refresh the fortnight low around 140.90 during early Friday morning in Europe. The yen cross traces moves of the Treasury yields amid the market’s pessimism surrounding the economic path forward.
That said, the US 10-year Treasury yields reverse the early Asian session rebound during the four-day downtrend to 2.967%, the lowest level in three weeks. In doing so, the benchmark US Treasury yields portray around 50 basis points (bps) of a fall from June’s peak, suggesting a heavy rush towards bond-buying, mainly due to its safe-haven status.
The risk-off mood could also be witnessed via a nearly 1.0% intraday loss of the S&P 500 Futures and the Euro Stoxx 50 Futures.
Earlier in the day, Japan’s Tokyo Consumer Price Index (CPI) rose to 2.3% versus 2.2% expected and 2.4% prior in June while the nation’s Unemployment Rate for May increased to 2.6% compared to 2.5% market forecast and previous readings. Further, the Tankan Large Manufacturing Index for the second quarter (Q2) of 2022 slumped to 9 versus 13 expected and 14 prior.
Additionally, Nikkei came out with the news suggesting that Japan's tax revenue in the Financial Year 2021 reached a record 67 trillion yen.
On the other hand, German Retail Sales for May dropped below -2.0% market forecast to -3.6% YoY, versus -0.4% previous readings whereas the Eurozone Unemployment Rate declined to 6.6% versus 6.8% expected and 6.7% prior.
Looking forward, the flash estimations of the Eurozone key inflation gauge, Harmonised Index of Consumer Prices (HICP), expected to refresh all-time high with 8.3% figure versus 8.1% prior, will be important to watch for clear directions.
Should the inflation data continue to rise faster, the recent comments from European Central Bank (ECB) policymaker Robert Holzmann could push the buyers to take risks as the Bank of Japan (BOJ) is determined to keep the status-quo. During an interview with Austrian newspaper Oberoesterreichische Nachrichten, ECB’s Holzmann also said, per Reuters, “From my Austrian point of view, I would have preferred earlier moves on interest rates but I am only one of 25 at the European Central Bank (Governing Council)."
Also read: Eurozone Inflation Preview: Core holds the keys, with 4% set to trigger a EUR/USD rally
Technical analysis
EUR/JPY justifies a clear downside break of the 142.00 support confluence, now resistance, comprising 20-DMA and an ascending support line from May 12.
That said, the latest downside eyes a confluence of the 50-DMA and four-month-old support line near 138.80. During the fall, the 140.00 round figure may offer an intermediate halt.
The kiwi has had a torrid year, and June added insult to injury as markets wiped another 3 cents off it, rounding out a decline of 9% for the year. Economists at ANZ Bank doubts whether NZD/USD will be able to reach the 0.66 level by year-end.
Global drivers eclipse local factors
“The USD itself has been playing a bigger role as US and global drivers eclipse local factors, and there is no obvious reason to expect that to change ahead of the next round of US data, and ahead of the Fed’s next meeting at the end of July (where another 75 bps hike is expected by many). “
“Our forecasts assume that the USD will soften as the Fed tightening cycle progresses (as it has in past cycles), but this continues to be challenged, and if the NZD doesn’t fire before more tangible evidence of slowing domestic growth appears, our forecast (of 0.66 by year-end) will be more difficult to achieve.”
Turkey’s trade data for May, published on Thursday, did not bring many surprises. Economists at Commerzbank expect continued widening of the deficit to weigh on the lira.
Turkiye's current-account deficit to widen further
“At headline level, the trade deficit ratcheted up to $10.6bn versus just $4.2bn a year ago – but, this widening trend is a well-known result of higher raw material prices.”
“The current-account deficit, excluding energy and gold, is widening, which implies that the prices of all imports are up, not just that of oil imports.”
“Following Turkiye’s successive exchange rate crises since 2018, the weaker lira had helped the current-account balance (excluding energy and gold) turn positive during 2019 and 2020, but this improvement is now behind us. And a worsening current-account balance is obviously negative for the lira.”
Recent downside in USD/JPY poured cold water over the probable move to the mid-137.00s in the next weeks, suggested FX Strategists at UOB Group Lee Sue Ann and Quek Ser Leang.
Key Quotes
24-hour view: “Our view that USD ‘could rise above 137.00’ yesterday was incorrect as it dropped to a low of 135.54. Despite the decline, downward momentum has not improved by much and USD is unlikely to weaken further. For today, USD is more likely to trade between 135.55 and 136.45.”
Next 1-3 weeks: “We turned positive USD two days ago (29 Jun, spot at 136.05). After USD soared to a high of 136.99, we indicated yesterday (30 Jun, spot at 136.65) that USD could advance to 137.50. We did anticipate the sharp pullback to a low of 135.54 during NY session. While our ‘strong support’ level is still intact, waning upward momentum suggests that the odds for USD to move to 137.50 have diminished. In order to rejuvenate the flagging momentum, USD has to move and stay above 136.45 within these 1 to 2 days or a break of 135.50 would not be surprising.”
Riksbank hiked its policy rate by 50 bps on Thursday. The Swedish krona was unable to benefit significantly from the decision. Economists at Commerzbank are bearish on the SEK in the near-term due to the dampened sentiment.
Riksbank does not surprise
“The Swedish Riksbank hiked its key rate from 0.25% to 0.75% as had been widely expected, while at the same time sounding very hawkish – which also did not come as a surprise.”
“It now expects inflation to remain above 7% for the rest of the year. Against this background, it still sees the need for monetary policy action and now expects a key rate close to 2% at the start of next year. That means that at the two remaining meetings this year it will probably once again hike its key rate by 50 bps. Depending on inflation developments a larger step could not be excluded either, according to Riksbank.”
“It is a supporting factor for the Swedish krona that Riksbank wants to take more decisive action against inflation.”
“Due to the dampened sentiment SEK is likely to struggle for now.”
- EUR/GBP is aiming to capture 0.8640 as the focus shifts to the odds of first rate hike by the ECB.
- The eurozone HICP is expected to elevate to 8.3% from the prior print of 8.1%.
- The UK economy is operating at the highest inflation rate at 9.1% vs. its G7 peers.
The EUR/GBP pair is expected to display a minor correction as the cross has scaled northwards swiftly in the Asian session. However, the upside remains favored as the cross as witnessed a responsive buying action after hitting a low of 0.8511 on Thursday. The asset has overstepped Thursday’s high at 0.8620 and is attempting to sustain confidently above the same.
The eurozone bulls are performing well against sterling despite higher expectations for the eurozone Harmonized Index of Consumer Prices (HICP). As per the market consensus, an escalation is expected in the inflation rate to 8.3% from the prior print of 8.1%. Thanks to the soaring energy bills and food prices that have resulted in a large real income shock for the households in Europe.
On a broader note, the shared currency bulls are performing better against pound on advancing hopes of a rate hike by the European Central Bank (ECB) in its July monetary policy meeting. It is worth noting that the ECB has yet not followed the footprints of Western leaders and will announce its first rate hike in 11 years.
Meanwhile, the pound is underperforming as investors are trimming the demand forecasts. The UK economy has reported the highest inflation rate at 9.1% in comparison with its G7 peers. No doubt, the households in the UK economy would be facing the extreme consequences of diminished value ‘paychecks’. In today’s session, the IHS Markit will report the UK Manufacturing PMI, which is expected to remain stable at 53.4.
Considering advanced prints from CME Group for natural gas futures markets, open interest rose by just 98 contracts on Thursday, adding to the previous day’s build. Volume followed suit and increased sharply by around 295.3K contracts after two consecutive daily drops.
Natural Gas faces a probable technical rebound
Prices of natural gas plummeted more than 16% on Thursday, revisiting levels last seen back in mid-March around $5.30. The sharp decline was in tandem with increasing open interest and volume, leaving the prospects for further losses unchanged in the very near term despite the proximity of the oversold territory could spark a technical bounce.
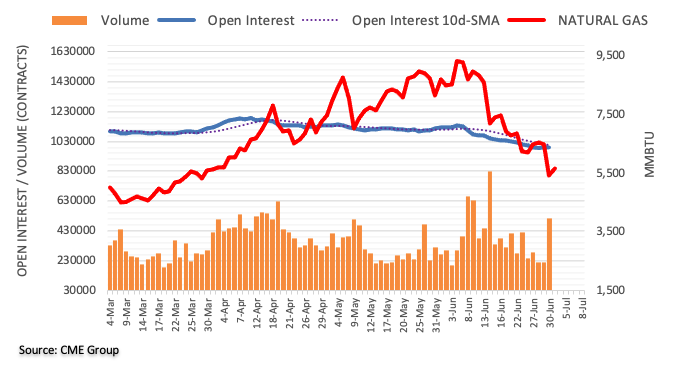
EUR/USD has fallen over the past few days. In the view of economist at Commerzbank, inflation data from the eurozone is unlikely to change the Euopean Central Bank’s (ECB’s) cautious course, therefore, the pair is set to stay under pressure.
Difficult for EUR to appreciate significantly against USD for now
“Today’s inflation data from the eurozone is unlikely to provide any new momentum. Some inflation data from individual countries has already been published, and it looks as if the rate of inflation in the eurozone might have crept up further in June.”
“Even an upside surprise is not likely to cause the ECB to implement a larger rate step in July. The majority on the monetary policy council seems to prefer a cautious start, which today’s data is unlikely to change.”
“Medium-term, we assume that USD will ease against EUR as, contrary to the eurozone, we are projecting a recession for the US next year, which is likely to cause the Fed to implement rate cuts.
“At present, however, the market is also likely to see recession risks for the eurozone (energy crisis). And as the ECB is significantly lagging behind the other central banks it is likely remain difficult for EUR to appreciate significantly against USD for now.”
- USD/CHF struggles to defend the first daily gains in three.
- Nearby support line challenges sellers ahead of directing them to 61.8% FE.
- Convergence of 50-SMA, fortnight-old resistance line guards recovery moves.
USD/CHF pares intraday losses around 0.9550 heading into Friday’s European session. In doing so, the Swiss franc (CHF) pair pokes a two-day-old support line by the press time.
That said, the MACD signals keep buyers hopeful but a convergence of the 50-SMA and a downward sloping resistance line from June 17, around 0.9590, restrict short-term advances of the pair.
Even if the quote rises past 0.9590, the 0.9600 threshold and the early June peak surrounding 0.9660 could test the USD/CHF bulls before giving them control. In that case, an area comprising levels marked during early May and mid-June, around 0.9725-30, will be crucial to watch.
On the contrary, a downside break of the immediate support line, close to 0.9550 at the latest, will renew the declines targeting the monthly low of 0.9495.
It’s worth noting, however, that the USD/CHF weakness past 0.9495 could aim for the 61.8% Fibonacci Expansion (FE) of June 17-30 moves, near 0.9470. Also increasing the strength of the 0.9470 support is the April 2021 high.
Overall, the USD/CHF prices are likely to decline further but the bears may have a tough time breaking the 0.9470 support.
USD/CHF: Four-hour chart
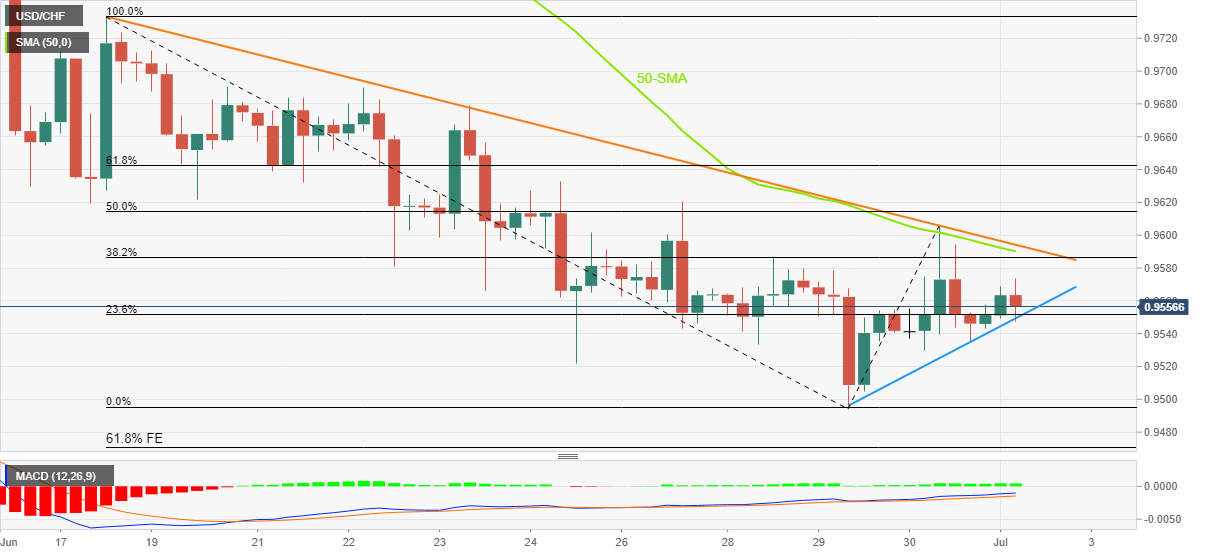
Trend: Further weakness expected
In the opinion of FX Strategists at UOB Group Lee Sue Ann and Quek Ser Leang, AUD/USD could slip back to the 0.6830 region in the next weeks.
Key Quotes
24-hour view: “We highlighted yesterday that AUD ‘could dip below 0.6860 but the major support at 0.6830 is likely out of reach for now’. AUD dipped briefly to 0.6954 before rebounding to trade in a relatively choppy manner. The price actions appear to be part of a consolidation and AUD is likely to trade between 0.6865 and 0.6925 for today.”
Next 1-3 weeks: “Yesterday (30 Jun, spot at 0.6860), we highlighted that shorter-term downward momentum is beginning to build again and AUD could break 0.6860. While AUD subsequently breached 0.6860, there was not much follow through (AUD rebounded from 0.6854). There is no change in our view for now and only a break of 0.6940 (no change in ‘strong resistance’ from yesterday) would indicate that the downside risk has dissipated.”
Gold prolonged this week's bearish trend and continued losing ground for the fifth successive day on Friday. As FXStreet’s Haresh Menghani notes, bearish traders await a sustained break below $1,800.
The $1,815-$1,817 region seems to act as immediate strong resistance
“Sustained weakness below the $1,800 handle will reaffirm the near-term bias and pave the way for additional losses. Gold might then turn vulnerable to challenge the YTD low, around the $1,780 region touched in January. The downward trajectory could further get extended towards the next relevant support near the $1,755-$1,750 zone.”
“The $1,815-$1,817 region now seems to act as immediate strong resistance. Any subsequent move up might still be seen as a selling opportunity near the $1,833-$1,835 area. This, in turn, should continue to cap the XAUUSD near the 200-DMA. The latter, currently around the $1,845 zone, would act as a key pivotal point, which if cleared decisively will negate any near-term bearish bias and trigger a near-term short-covering move.”
- The asset has tumbled below seven-week-old support at 0.6829 and has renewed a two-year low at 0.6812.
- Vertically declining 10- and 20-period EMAs are hinting at a severe weakness in the counter.
- The RSI (14) is attempting to shift into the bearish range of 20.00-40.00.
The AUD/USD pair has witnessed a sigh of relief after displaying a sheer downside move. The greenback bulls have dragged the asset firmly to near 0.6813 in the early European session after violating Thursday’s low at 0.6854.
The prolonged weakness in the asset has compelled us to shift to a higher time frame. On the daily scale, the greenback bulls have attacked the seven-week-old critical support of 0.6829, recorded on May 12, and have recorded a fresh two-year low at 0.6812. Meanwhile, the potential supply area has shifted to near January 28 low at 0.6966.
The 10- and 20-period Exponential Moving Averages (EMAs) at 0.6915 and 0.6967 respectively are declining perpendicularly, which signals an intense sell-off ahead.
Meanwhile, the Relative Strength Index (RSI) (14) is on the verge of shifting into the bearish range of 20.00-40.00, which will fetch a downside impulsive wave. The momentum oscillator, RSI (14) is not displaying any signs of divergence and oversold.
A minor rebound to near June 14 low at 0.6850 will be a bargain sell for the market participants. An occurrence of the same will activate sellers and will drag the asset towards the round-level support and 15 June 2020 low at 0.6800 and 0.6776 respectively.
Alternatively, the aussie bulls could lift the asset price higher if the major overstep Wednesday’s high at 0.6965. This will drive the asset towards the psychological resistance at 0.7000, followed by June 13 high at 0.7035.
AUD/USD daily chart
-637922524540595588.png)
CME Group’s flash data for crude oil futures markets noted traders trimmed their open interest positions for the second session in a row on Thursday, this time by around 9.2K contracts. Volume, instead, went up for the third straight session, now by around 166.3K contracts.
WTI: Next support comes at $101.56
Prices of the WTI remained on the defensive on Thursday amidst shrinking open interest. Against that, a deeper retracement appears unlikely in the very near term, while there is decent contention at the June low at $101.56 (June 22).
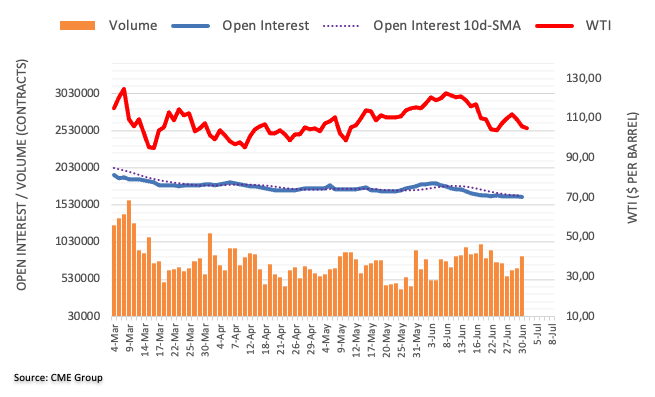
A deeper pullback in GBP/USD appears to be running out of steam, suggested FX Strategists at UOB Group Lee Sue Ann and Quek Ser Leang.
Key Quotes
24-hour view: “We highlighted yesterday that ‘while GBP could continue to weaken, conditions remain oversold and the next support at 1.2040 is likely out of reach for now’. GBP subsequently dropped to 1.2093 before staging a surprisingly sharp rebound (high of 1.2189 in NY). Momentum indicators are turning flat and GBP is likely to consolidate from here. Expected range for today, 1.2120/1.2205.”
Next 1-3 weeks: “We turned negative on GBP two days (29 Jun, spot at 1.2185). As GBP dropped, we highlighted yesterday that GBP could decline further to 1.2040. GBP subsequently dropped to 1.2093 before rebounding strongly. Shorter-term downward momentum is beginning to wane and a break of 1.2205 (no change in ‘strong resistance’ level from yesterday) would indicate that 1.2040 is out of reach this time round.”
- Gold Price dribbles around seven-week low as bears attack nearby support amid oversold RSI.
- Yields extend south-run, US dollar regains upside momentum as fears of economic slowdown intensify.
- US ISM Manufacturing PMI, updates surrounding inflation, recession will be important.
Gold Price (XAU/USD) stands on slippery grounds as it slides to the lowest levels since early May, around $1,797 by the press time of early Friday morning in Europe. In doing so, the yellow metal drops for the fifth consecutive day amid fears of escalating inflation and economic slowdown.
The risk-off mood takes clues from the recent supply crunch and allying prices, mainly due to the Russia-Ukraine crisis, as well as due to China’s covid resurgence.
The sour sentiment directs markets toward the US dollar and bond-buying, which in turn drown Gold Price. That said, the US Dollar Index (DXY) picks up bids to reverse the previous day’s pullback from a two-week top as market sentiment worsens over growth fears. The DXY reversed from a 12-day high to snap a two-day uptrend by the end of Thursday’s trading around 104.75, near 104.80.
On Thursday, the downbeat US personal spending and softer prints of the Fed’s preferred inflation gauge raised concerns over the health of the world’s largest economy and drowned the US dollar. The greenback’s previous retreat could also be linked to the downbeat US Treasury yields as the benchmark 10-year bond coupons dropped below 3.0%, before recovering to 3.01% at the closing, to portray around 50 basis points (bps) of a fall from June’s peak.
While portraying the mood, the S&P 500 Futures drop 0.80% to mark a five-day downtrend whereas the US 10-year Treasury yields reverse early Asian session rebound to 2.967%, refreshing the three-week low.
Moving on, risk catalysts are the key for gold traders to watch while also keeping eyes on the US ISM Manufacturing PMI for June, expected 55.0 versus 56.1 prior, as well as risk catalysts, for fresh impulse. Also important will be the initial readings of the Eurozone key inflation gauge, Harmonised Index of Consumer Prices (HICP), for June.
Also read: ISM Manufacturing PMI Preview: High inflation component steal the show, boost dollar
Technical analysis
Gold Price remains on the back foot after breaking one-month-old horizontal support surrounding $1,807. Adding strength to the bearish bias is the downside break of the $1,800 threshold.
That said, a south-run towards $1,786 appears imminent before the bears can aim for a one-month-old descending support line near $1,775.
Meanwhile, corrective pullback needs validation from the $1,807 support-turned-resistance to aim for the three-week-old descending trend line, at $1,825 by the press time.
Gold: Four-hour chart
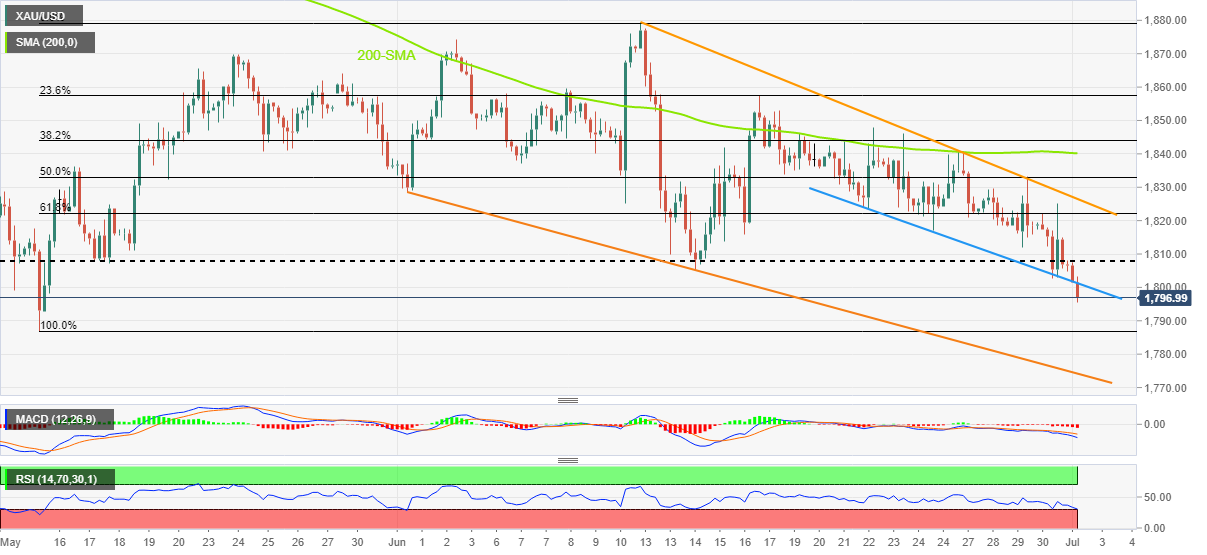
Trend: Further weakness expected
Open interest in gold futures markets increased for the second session in a row on Thursday, this time by around 4.6K contracts according to preliminary readings from CME Group. In the same line, volume went up by nearly 63K contracts., also recording the second build in a row.
Gold: Door open to a drop to $1,780
Gold prices extended the corrective downside for yet another session on Thursday and threatens to break below the key contention area around $1,800. The move was on the back of rising open interest, which is supportive of extra losses in the very near term and with the potential target at the 2022 low at $1,780 per ounce troy.
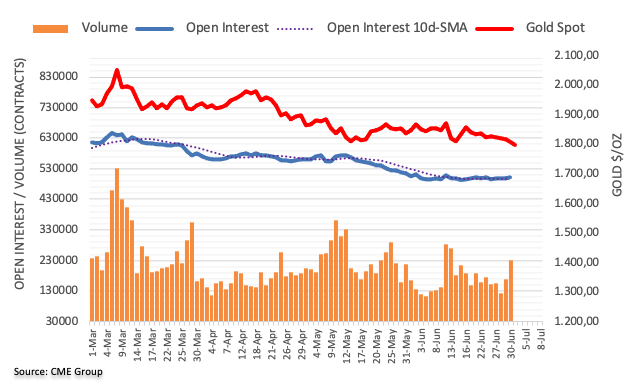
- USD/CAD has established above 1.2900 firmly as oil prices fall and DXY rebounds.
- The odds of the maintenance of the status quo by the Fed in July have advanced significantly.
- Oil prices have reported their first monthly losses in CY22 on escalating recession fears.
The USD/CAD pair has surged strongly above the critical hurdle of 1.2920 as the US dollar index (DXY) has extended its recovery after overstepping 104.86 in the Asian session. The loonie bulls are sensing extreme selling pressure on souring market mood and falling oil prices.
The DXY is attempting to reverse its entire losses recorded on Thursday on expectations of a bumper rate hike by the Federal Reserve (Fed). The Fed is expected to maintain its status-quo and will announce a rate hike by 75 basis points (bps) in its July monetary policy meeting.
What is worst for the risk-perceived currencies now are the expectations of a higher interest rate environment for a prolonged period? The troublesome job for Fed chair Jerome Powell in times when the inflation rate has comfortably established above 8% is that higher interest rates have failed to make a significant impact on price pressures till now. No doubt, the DXY will remain on the seventh cloud for now and the risk-sensitive assets will remain on the tenterhooks.
Meanwhile, the oil prices are looking to extend their losses if it violates the critical support of $105.00. The escalating recession fears have shifted the oil prices into the grip of bears. Also, the oil prices have reported their first monthly losses in CY22.
On the loonie front, Canadian markets are closed on Friday on account of the Canada Day bank holiday. Next week, Canada’s employment numbers will be of key importance. The Unemployment Rate may increase to 5.2% from the prior print of 5.1%.
According to FX Strategists at UOB Group Lee Sue Ann and Quek Ser Leang, EUR/USD could attempt some consolidation ahead of a probable move to 1.0350.
Key Quotes
24-hour view: “Yesterday, we highlighted that the ‘rapid decline in EUR could extend to 1.0400’. We added, ‘a sustained decline below this level appears unlikely’. While our view was not wrong as EUR subsequently dropped to 1.0381, we did not expect the sharp bounce from the low (NY high of 1.0488). The strong rebound could test 1.0505 first before easing (strong resistance at 1.0535 is not expected to come under threat). On the downside, a breach of 1.0430 (minor support is at 1.0450) would indicate that EUR is unlikely to rebound further.”
Next 1-3 weeks: “We highlighted yesterday (30 Jun, spot at 1.0445) that risk for EUR has shifted to the downside. We indicated that a break of 1.0400 would not be surprising but strong support can be expected at 1.0350. EUR subsequently cracked 1.0400, dropped to 1.0381 before rebounding strongly. Shorter-term downward momentum has eased somewhat and EUR could consolidate for a couple of days first before attempting to move towards 1.0350 (note that 1.0380 is acting as a solid support now). On the upside, a break of 1.0535 (no change in ‘strong resistance’ level from yesterday) would indicate that 1.0350 is not coming into the picture.”
- Steel Price drops for the first time in seven days.
- China Caixin Manufacturing PMI follows official activity data to portray optimism for June.
- Chinese steel mills adopt ways to reduce high inventories amid weak domestic demand.
Steel Price justifies the market’s pessimism surrounding the economic slowdown as the benchmark rebar prices slump nearly 1.0% to mark the first daily loss in seven. In doing so, the industrial metal ignores firmer China data during Friday’s Asian session.
Construction steel rebar on the Shanghai Futures Exchange (SFE) was down 1.2% around 4,320 yuan per metric tonne after six straight sessions of gains. Further, the hot-rolled coil shed 1.3% and Stainless steel dropped 2% by the press time.
China’s Caixin Manufacturing PMI rose to 51.7 for June versus 50.1 expected and 48.1 prior. The private activity gauge tracked the official PMIs for the said month that offered positive surprises the previous day.
“Steel mills in China, the world's biggest producer of the manufacturing and construction material, have idled dozens of blast furnaces recently in a bid to reduce high inventories amid weak domestic demand,” mentioned Reuters. The news adds, “The production slowdown is also due to China's resolve to continue reducing annual steel output in line with its decarbonization goals.”
In addition to China-linked catalysts, escalating fears of the economic slowdown and cautious sentiment ahead of the key US ISM Manufacturing PMI for June, expected at 55.0 versus 56.1 prior, also weigh on the metal prices of late.
Amid these plays, the S&P 500 Futures drop 0.80% to mark a five-day downtrend whereas the US 10-year Treasury yields reverse early Asian session rebound to 2.967%, refreshing the three-week low.
Looking forward, steel traders may keep their eyes on the US data, as well as Chinese production scheduled for fresh impulse amid recession woes. Should the fears escalate, the metal prices are likely to revisit the yearly low tested the last week.
- Asian equities have tumbled amid a strong rebound in DXY ahead of US ISM PMI.
- Oil prices have recorded their first monthly loss after a spell of six monthly gains.
- Chinese equities have displayed less underperformance on the upbeat Caixin Manufacturing PMI data.
Markets in the Asian domain have witnessed a steep fall as the US dollar index (DXY) has rebounded formerly in the Asian session after a sheer downside move on Thursday. The DXY tumbled after failing to recapture a 19-year high at 105.79. However, a decent recovery in the asset has driven it to near the critical resistance of 105.00.
At the press time, Japan’s Nikkei225 tumbles 1.86%, China A50 eased 0.67%, Hang Send slipped 0.62%, and Nifty50 surrendered 1.44%.
Chinese equities have fallen less in proportion to other indices amid the upbeat Caixin Manufacturing Purchase Managers Index (PMI). The economic data has landed at 51.7, higher than the estimates and the former release of 50.1 and 48.1 respectively. A higher-than-expected economic data indicate that the production activities are operating at a decent pace and the aggregate demand for the manufactured products is advancing firmly.
On the oil front, escalating recession fears have overshadowed the supply worries again. The black gold has recorded monthly losses for the first time after a spell of six monthly gains. Western central banks have ridiculously trimmed their demand forecasts amid advancing price pressures. The households in the western countries are facing the consequences of a real income shock. Higher price pressures have lowered their ‘paychecks’ and henceforth the overall spending quantity-wise.
For further guidance, the US Institute of Supply Management (ISM) PMI data will be of utmost importance. As per the preliminary estimates of 55 vs. 56.1 previously reported, an underperformance is expected by the market participants.
- GBP/USD reverses the previous day’s bounce off two-week low.
- UK government braces for VAT relief but fails to impress GBP bulls amid economic woes.
- Doubts over ‘partygate’ investigation take rounds, Irish deputy PM accuses No10 over NIP.
- Final readings of UK PMI, US ISM Manufacturing PMI for June will be important for fresh impulse.
GBP/USD returns to the bear’s radar, after a one-day absence, as Brexit, politics and economic pessimism weigh on the Cable pair during early Friday morning in Europe.
Starting with the presently key issue, namely the economic slowdown fears, the United Kingdom reported no change in the Gross Domestic Product (GDP) for Q1 2021 during the final announcements published the previous day. That said, the UK GDP matched initial forecasts of 0.8% QoQ and 8.7% YoY. It’s worth noting that the fears of UK recession growth stronger as a jump in inflation joins Brexit woes, not to forget pessimism surrounding the Russia-Ukraine crisis and China’s covid resurgence.
To battle the economic pessimism, the UK government plans to ease the Value Added Tax (VAT). Prime Minister Boris Johnson's chief of staff Steve Barclay suggested reducing the 20% headline rate of the tax, The Times said, adding a temporary cut would reduce the tax bill for millions, per Reuters.
Elsewhere, UK Foreign Secretary Liz Truss defended the privileges committee inquiry into PM Johnson’s ‘partygate’ scandal as Tory backbenchers term it a 'kangaroo court'.
On the Brexit front, Irish deputy PM Leo Varadkar accused Number 10 of "siding" with unionists in seeking to scrap parts of the deal agreed in 2019, per the BBC. Additionally, The Guardian conveys a 14% fall in the UK exports to the European Union (EU) in 2021, mainly due to Brexit.
Alternatively, the risk-off mood joins cautious sentiment ahead of the key US ISM Manufacturing PMI for June, expected at 55.0 versus 56.1 prior, also propelling the US dollar’s demand. That said, the US Dollar Index (DXY) reversed from a 12-day high to snap a two-day uptrend by closing Thursday’s trading around 104.75, near 104.80 by the press time.
While portraying the mood, the S&P 500 Futures drop 0.80% to mark a five-day downtrend whereas the US 10-year Treasury yields reverse early Asian session rebound to 2.967%, refreshing the three-week low.
Moving on, the final reading of the UK S&P Global Manufacturing PMI for June precedes the UK ISM Manufacturing PMI for the said month to direct intraday moves. However, major attention will be given to the chatters surrounding recession, Brexit and politics for clear directions.
Technical analysis
The 61.8% Fibonacci retracement of June 14-16 upside, near 1.2110, restricts immediate GBP/USD downside before directing the bears to the yearly low of 1.1933. Meanwhile, recovery remains elusive until the quote stays below the aforementioned resistance line of around 1.2180. Even if the GBP/USD pair rises past 1.2180, it needs to cross the 200-HMA hurdle surrounding 1.2235 to recall the buyers.
- A double top formation strengthens the odds of a bearish reversal in the asset.
- An establishment below the 20-and 50-period EMAs adds to the downside filters.
- The RSI (14) is attempting to shift into the bearish range of 20.00-40.00.
The USD/JPY pair has witnessed a significant fall after violating the crucial support of 135.55 in the Asian session. The asset has challenged its three-day low of 135.00 and is expected to remain in the grip of bears.
On a four-hour scale, the formation of Double Top has brought an intense sell-off for the greenback bulls. The greenback bulls witnessed stiff resistance while attempting to breach the 23-year high around 137.00.
It is worth noting that the asset has established below the 20- and 50-period Exponential Moving Averages (EMAs) at 135.84 and 135.54 comfortably. This signals the strength of the yen bulls, which will result in more downside ahead.
Meanwhile, the Relative Strength Index (RSI) (14) has slipped into the bearish range of 20.00-40.00, which adds to the downside filters.
A downside break of the critical support of the June 23 low at 134.26 will trigger the formation of the double top and will drag the asset towards June 13 low at 133.59, followed by June 7 high at 133.00.
On the flip side, the greenback bulls could regain control if the asset oversteps Friday's high at 136.00. This will strengthen the greenback bulls to recapture its 23-year high at 137.00. A breach of a 23-year high will drive the asset towards the round-level resistance at 138.00.
USD/JPY four-hour chart
-637922462102196419.png)
- USD/IDR prints four-day uptrend to print the highest level since October 2020.
- Indonesia Inflation came in firmer for June, FinMin Sri Mulyani Indrawati tries to defend the currency buyers.
- US dollar cheers broad risk-off mood ahead of ISM Manufacturing PMI for June.
USD/IDR refreshes a two-year high of around $14,988 as risk-aversion underpins the US dollar buying during Friday’s Asian session. In doing so, the Indonesia Rupiah (IDR) pair fails to cheer upbeat inflation data and economic updates from home, conveyed recently by Finance Minister (FinMin) Sri Mulyani Indrawati.
Indonesia's Inflation for June rose to 4.35% YoY versus 4.17% forecast and 3.55% prior. However, the Core Inflation eased below 2.72% market consensus to 2.63% YoY. That said, the Inflation print rose to 0.61% MoM compared to 0.44% expected and 0.40% prior.
Following the inflation report, Indonesia FinMin Indrawati crossed wires, via Reuters, while conveying hopes of a lesser fiscal deficit in 2022 due to strong revenue. “Indonesia will likely book a 2022 fiscal deficit of 732.2 trillion rupiah, or 3.92% of gross domestic product, smaller than the government's previous forecast of 4.5% of GDP, due to strong revenue forecasts,” said the policymaker.
Reuters adds details while mentioning, “Sri Mulyani Indrawati told a hearing with parliament's budget committee this meant the government would cut debt issuance to 757.6 trillion rupiah ($50.64 billion), from 943.7 trillion rupiah in her previous target.”
Elsewhere, the US Dollar Index (DXY) picks up bids to reverse the previous day’s pullback from a two-week top as market sentiment worsens over growth fears. That said, the US Dollar Index (DXY) reversed from a 12-day high to snap a two-day uptrend by closing Thursday’s trading around 104.75, near 104.80 by the press time.
On Thursday, the downbeat US personal spending and softer prints of the Fed’s preferred inflation gauge raised concerns over the health of the world’s largest economy and drowned the US dollar. The greenback’s previous retreat could also be linked to the downbeat US Treasury yields as the benchmark 10-year bond coupons dropped below 3.0%, before recovering to 3.01% at the closing, to portray around 50 basis points (bps) of a fall from June’s peak.
While portraying the mood, the S&P 500 Futures drop 0.80% to mark a five-day downtrend whereas the US 10-year Treasury yields reverse early Asian session rebound to 2.967%, refreshing the three-week low.
Given the risk-aversion wave and the US dollar strength, the USD/IDR may extend the latest run-up. However, the US ISM Manufacturing PMI for June, expected 55.0 versus 56.1 prior, as well as risk catalysts, for fresh impulse.
Technical analysis
Multiple hurdles marked during 2020 challenge the USD/IDR bulls targeting the $15,000 round figure. However, the sellers have the least scope of entry unless breaking the previous resistance line from mid-May, around $14,925 by the press time.
USD/INR refreshes all-time high at 79.20 during Friday’s Asian session, bracing for the biggest weekly jump since late February.
In doing so, the Indian rupee (INR) pair justifies the hawkish signals flashed by the options market, in addition to the broad US dollar strength amid a risk-off mood.
That said, the one-month risk reversal (RR) for the USD/INR, a difference between the call and put options, jumps the most on the daily basis, to 0.175 on Thursday, per Reuters data.
The weekly RR, however, eyes the strongest figure since early May, at 0.105 by the press time.
It’s worth noting that the fears of economic slowdown and the market’s anxiety ahead of the US ISM Manufacturing PMI appear to have recalled the US dollar bulls after the greenback declined from a two-week high the previous day.
Read: US Dollar Index bulls approach fortnight high around 105.00, US ISM PMI in focus
- EUR/USD has corrected to near 1.0453 as DXY has rebounded after a significant fall.
- Underperformance in the US ISM PMI may fade reversal signals in the DXY.
- As per the estimates of the eurozone HICP, the economic data is eyeing an establishment above 8%.
The EUR/USD pair has recorded a minor correction after hitting a high of 1.0489 on Thursday. The major has modestly corrected to near 1.0453 and is expected to remain on the sidelines as investors are awaiting the release of the US ISM PMI and eurozone Harmonized Index of Consumer Prices (HICP).
Earlier, the asset displayed a responsive buying action after the US dollar index (DXY) reported a significant fall on Thursday. The DXY tumbled on failing to kiss the 23-year high at 105.79. Also, the US core Personal Consumption Expenditure (PCE) Price Index remained in line with the expectations. The economic data landed at 4.7%, in line with its estimates but lower than the former release of 4.9%.
The Federal Reserve (Fed) is elevating its interest rates from the last three monetary policy meetings and not even a minute impact has been recorded on the price pressures. This time, a slippage in the inflation indicator bolstered the hopes that the inflation rate will get contained.
In today’s session, the US ISM PMI will remain in the limelight. As per the market consensus, the economic data may fall to 55 from the prior release of 56.1.
On the eurozone front, the spotlight will remain on the eurozone HICP figures. The annual HICP may step up to 8.3% from the prior print of 8.1%. It is worth noting that the European Central Bank (ECB) has not elevated its interest rates yet despite the inflation rate stabilizing above 8%. More delay in the policy tightening process may enlarge the real income shock in Europe.
- Gold price is hovering above $1,800.00, downside looks likely as DXY rebounds.
- Fed Powell is unable to deliver any guarantee on bringing the inflation rate down to 2%.
- Investors are expecting an underperformance on the US ISM PMI front.
Gold price (XAU/USD) is holding itself above the psychological support of $1,800.00. The precious metal is declining gradually and is expected to remain in the grip of bears as the US dollar index (DXY) has rebounded modestly. Considering the price action, the gold prices are expected to violate $1,800.00 and the bears will show their true colors.
Traders should understand the fact that the commentary from Federal Reserve (Fed) chair Jerome Powell in his speech at ECB’s annual Forum on Central Banking has underpinned the DXY for a prolonged period. Fed Powell mentioned that the Fed will focus on returning the inflation rate at 2% by deploying the quantitative measures but there is no guarantee of that. This indicates that investors should start admitting that higher rates are for a prolonged period now and the employment tenure of Fed chair Jerome Powell will be full of troubles and challenges.
In today’s session, the spotlight will remain on the US Institute of Supply Management (ISM) Purchase Managers Index (PMI) data. As per the preliminary estimates of 55 vs. 56.1 previously reported, an underperformance is expected by the market participants.
Gold technical analysis
On an hourly scale, the gold prices are on a verge of giving a downside break of Thursday’s low at $1802.79 which will activate the descending triangle formation and will drag the precious metal vertically lower. Declining 20- and 50-period Exponential Moving Averages (EMAs) at $1,809.23 and $1,814.00 respectively add to the downside filters. The Relative Strength Index (RSI) (14) has tumbled below 40.00, which signals a fresh bearish impulsive wave ahead.
Gold hourly chart
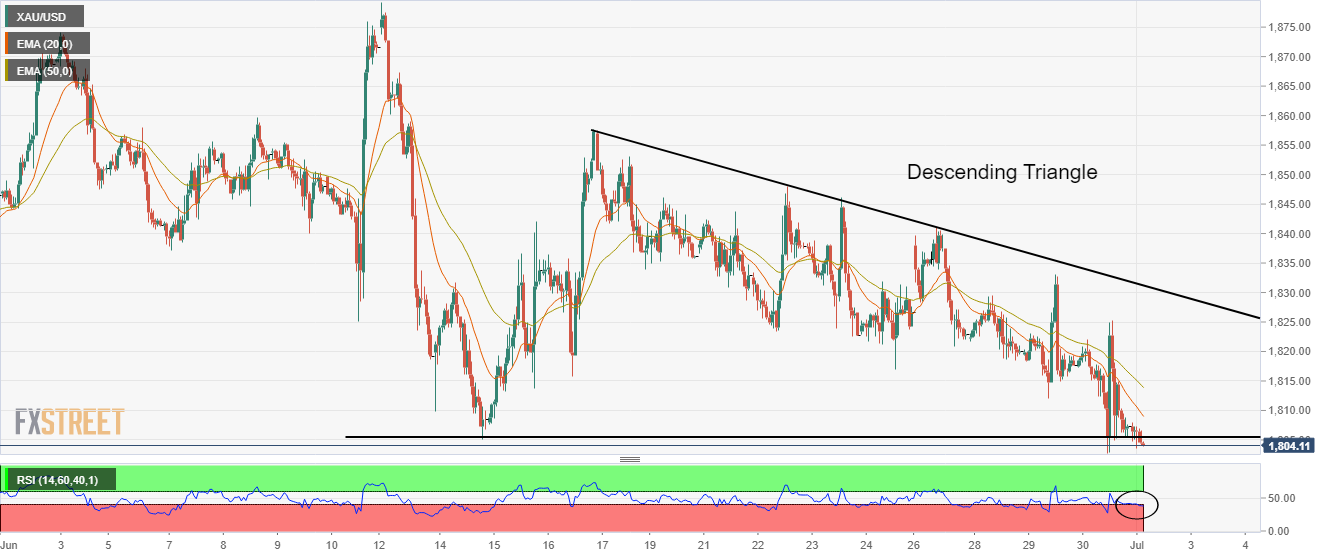
- AUD/USD renews intraday low while consolidating recent gains around two-week low.
- China Caixin Manufacturing PMI for June came in better than expected, prior.
- Rebound in yields, USD exerts additional downside pressure on the pair.
AUD/USD takes offers to refresh intraday low around 0.6870 as risk-aversion recalled bears after a one-day absence. In doing so, the Aussie pair remains pressured around the fortnight bottom while consolidating the previous gains.
That said, the Aussie pair’s latest moves ignore China’s upbeat activity numbers for June. China’s Caixin Manufacturing PMI rose to 51.7 for June versus 50.1 expected and 48.1 prior. The private activity gauge tracked the official PMIs that offered positive surprises the previous day.
The risk-off mood takes clues from the escalating fears of the economic slowdown and drowns the AUD/USD prices, due to its risk-barometer status.
It’s worth noting that the recovery in the US 10-year Treasury yields appears to have helped the US dollar, in addition to the risk-off mood, to reverse the pullback from a two-week top.
That said, the US Dollar Index (DXY) reversed from a 12-day high to snap a two-day uptrend by closing Thursday’s trading around 104.75, near 104.80 by the press time.
On Thursday, the downbeat US personal spending and softer prints of the Fed’s preferred inflation gauge raised concerns over the health of the world’s largest economy and drowned the US dollar. The greenback’s previous retreat could also be linked to the downbeat US Treasury yields as the benchmark 10-year bond coupons dropped below 3.0%, before recovering to 3.01% at the closing, to portray around 50 basis points (bps) of a fall from June’s peak. The benchmark US Treasury yields rise 1.1 bps by the press time.
Looking forward, AUD/USD traders will pay close attention to the US ISM Manufacturing PMI for June, expected 55.0 versus 56.1 prior, as well as risk catalysts, for fresh impulse.
Also read: ISM Manufacturing PMI Preview: High inflation component steal the show, boost dollar
Technical analysis
Unless breaking the fortnight-long resistance line, near 0.6930 by the press time, AUD/USD remains on the way to a seven-week-old important support line, around 0.6860.
| Raw materials | Closed | Change, % |
|---|---|---|
| Brent | 112.28 | -2.73 |
| Silver | 20.279 | -2.3 |
| Gold | 1807.17 | -0.61 |
| Palladium | 1930.06 | -1.16 |
- Silver seesaws around the lowest levels since July 2020 during the four-day downtrend, sidelined of late.
- Oversold RSI, key support lines from 2021 challenge bears.
Silver Price (XAG/USD) dropped to the lowest levels in two years before portraying the latest inaction at around $20.30 during Friday’s Asian session. In doing so, the bright metal remains on the back foot for the fourth consecutive day.
However, the oversold RSI (14) line joins downward sloping support lines from September and December 2021, respectively around $20.30 and $20.15, to restrict the quote’s further downside.
The same suggests the short-covering move targeting the mid-June low near $20.90.
However, a downward sloping resistance line from June 06, at $21.50 by the press time, precedes the 50-DMA hurdle of $21.85 to challenge the XAG/USD buyers.
In a case where the bullion prices rally beyond $21.85, June’s peak of $22.51 will be in focus.
Alternatively, the $20.00 psychological magnet will act as an extra filter to the south, other than the aforementioned support lines around $20.30 and $20.15.
During the quote’s weakness past $20.00, the year 2019 high near $19.65 could test the silver sellers before directing them to a 2021 peak surrounding $18.85.
Overall, silver prices remain bearish but a short-term rebound can’t be ruled out.
Silver: Daily chart
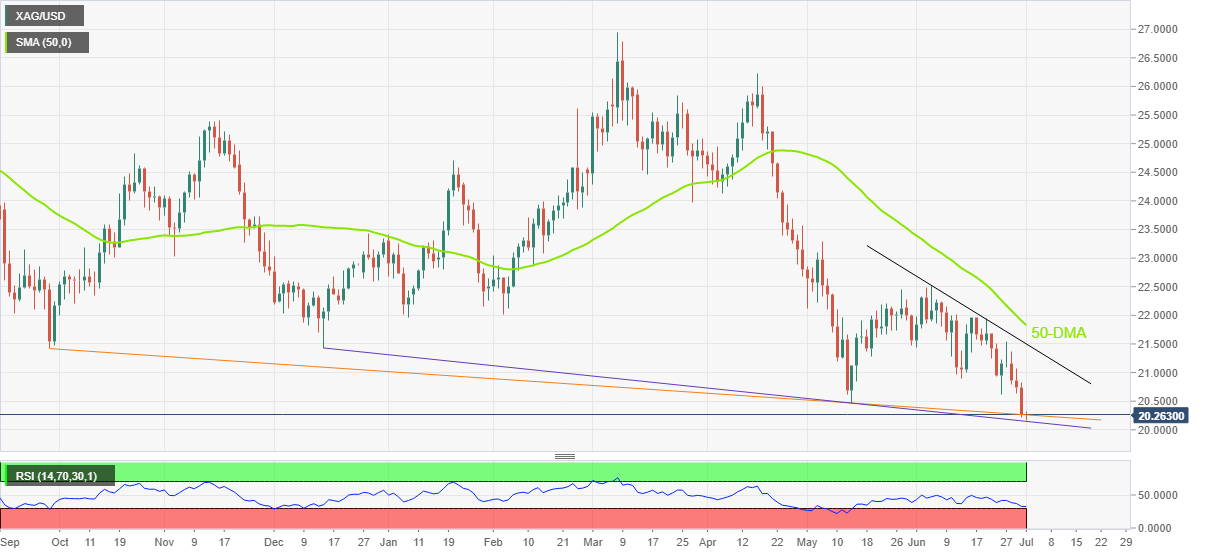
Trend: Corrective pullback expected
- USD/CNH renews intraday high while paring the previous day’s losses.
- China’s Caixin Manufacturing PMI rose past market expectations and previous readings.
- Risk-off mood underpins the US dollar’s safe-haven demand ahead of US ISM Manufacturing PMI for June.
USD/CNH struggles to justify firmer prints of the Chinese activity data during Friday’s Asian session. In doing so, the offshore Chinese yuan (CNH) pair refreshes its intraday high at 6.7025 to consolidate the biggest daily fall in a week amid a risk-off mood.
China’s Caixin Manufacturing PMI rose to 51.7 for June versus 50.1 expected and 48.1 prior. The private activity gauge tracked the official PMIs that offered positive surprises the previous day.
It’s worth noting, however, that market’s escalating economic pessimism, amid rising inflation, recalls the US dollar buyers, which in turn propel the USD/CNH prices.
While portraying the mood, the S&P 500 Futures as it drops for the fifth consecutive day to refresh the weekly low.
In addition to the risk-off mood, cautious sentiment ahead of the key US ISM Manufacturing PMI for June, expected 55.0 versus 56.1 prior, also propel the US dollar’s demand. That said, the US Dollar Index (DXY) reversed from a 12-day high to snap a two-day uptrend by closing Thursday’s trading around 104.75, near 104.80 by the press time.
On Thursday, the downbeat US personal spending and softer prints of the Fed’s preferred inflation gauge raised concerns over the health of the world’s largest economy and drowned the US dollar on Thursday. The greenback’s previous retreat could also be linked to the downbeat US Treasury yields as the benchmark 10-year bond coupons dropped below 3.0%, before bouncing off to 3.01% at the closing, to portray around 50 basis points (bps) of a fall from June’s peak.
Moving on, the US ISM Manufacturing PMI will be important for fresh impulse but major attention will be given to the economic slowdown concerns. Even so, any more weakness in the US data won’t hesitate to offer a negative month-start to the greenback.
Also read: ISM Manufacturing PMI Preview: High inflation component steal the show, boost dollar
Technical analysis
The 50-DMA level surrounding 6.7000 guards immediate upside of the USD/CNH. However, the sellers need validation from previous support line from mid-June, around 6.6740, to retake control.
- USD/JPY bears move in and the price heads towards overnight lows.
- The US dollar is under pressure and markets are risk-off.
USD/JPY is trading at 135.69 and virtually flat for the day as it moves back towards the overnight lows from a high of 135.98. The pair fell to 135.55 on Wall Street but the yen was down 15% against the US dollar for the first six months of 2022, which makes for the worst first-half of year performance for the currency since 2013.
The yen regathered below the 24-year peak of 137 vs. the dollar although the gap between a hawkish Federal Reserve and a dovish Bank of Japan continues to weigh heavily on the Japanese currency.
The US dollar, which extended above 105.000 recently, fell sharply with the Yen regrouping as yields drop. The firmness in the greenback rally remains largely intact, however, considering the ongoing worries about a global recession.US economic data on Thursday confirmed the negative bias and the concerns about the US economy that is sinking towards a recession. US stocks dropped Thursday due to consumer spending that rose at half the projected pace for May while Federal Reserve's preferred inflation gauge showed continued signs of a slowdown.
The highlights of Thursday's data schedule were a faster monthly pace of growth in the PCE price index, steady personal income expansion, and slower spending growth. Personal income was up 0.5% in May, right on expectations after a 0.5% gain in the previous month.
In other data, the Chicago PMI fell to 56.4 in June from 60.3 in May. Other manufacturing data already released have suggested slower growth or outright contraction. The ISM's national index will be released on Friday. Initial jobless claims decreased by 2,000 to 231,000 in the week ended June 25, but the four-week moving average rose by 7,250 to 231,750, continuing the string of gains.
Caixin China Manufacturing PMI has been released as follows:
- 51.7 vs. 48.1 in May
''China's manufacturing activity expanded at its fastest in 13 months in June, buoyed by a strong rebound in output, as the lifting of COVID lockdowns sent factories racing to meet recovering demand, a private sector poll showed on Friday.
The Caixin/Markit manufacturing purchasing managers' index (PMI) rose to 51.7 in June, also indicating the first expansion in four months, from 48.1 in the previous month. That was well above analysts' expectations for an up-tick to 50.1.
The 50-point index mark separates growth from contraction on a monthly basis,'' Reuters reports.
AUD/USD update
AUD/USD is being popping higher on the data but is overall pressured as the US dollar corrects from overnight lows and the bears have 0.6850s in their sights as a potential range demand area on the lower time frames:
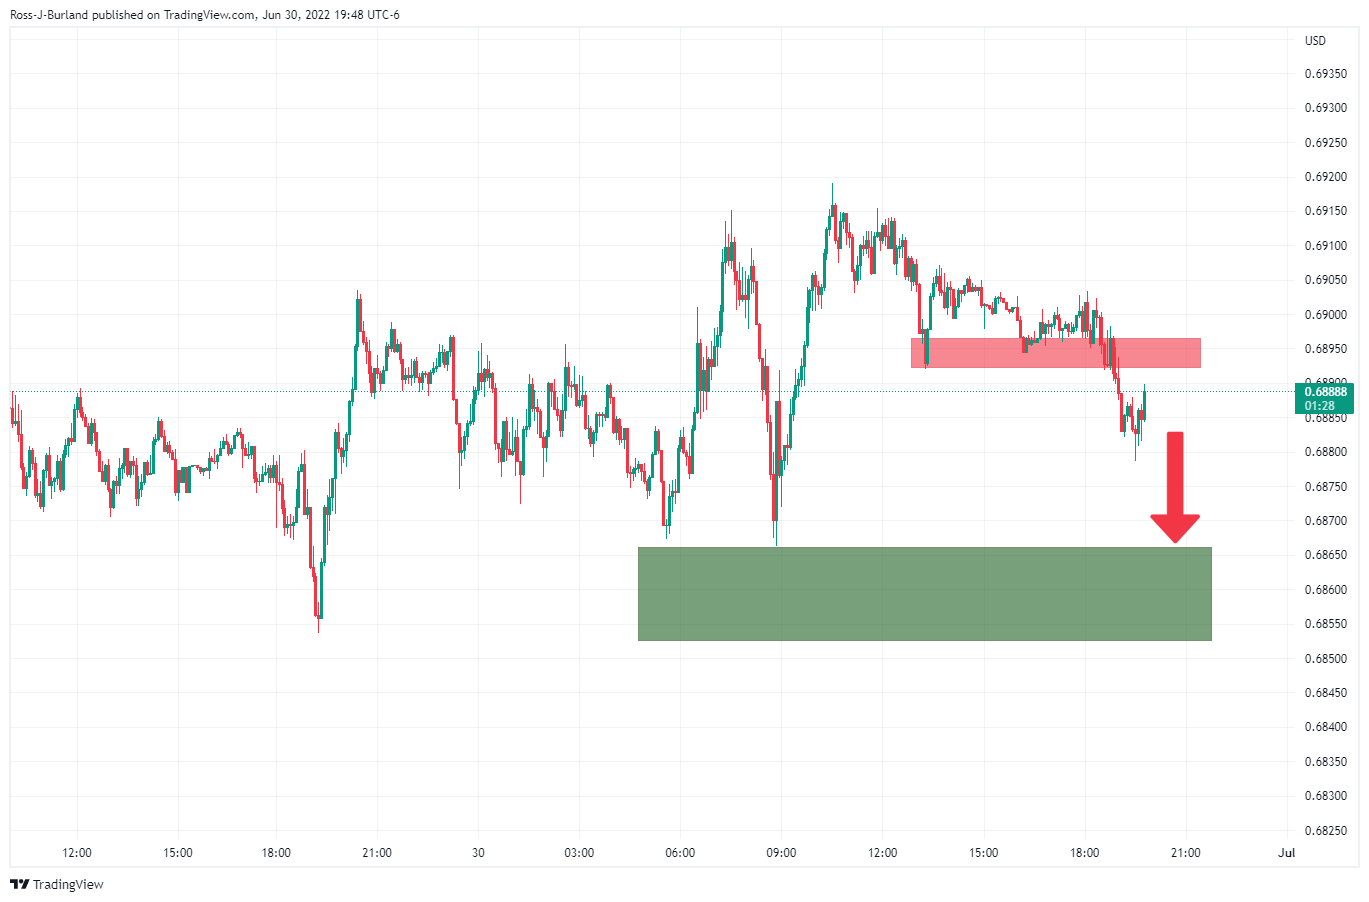
About Caixin China Manufacturing PMI
The Caixin China Manufacturing PMI™, released by Markit Economics, is based on data compiled from monthly replies to questionnaires sent to purchasing executives in over 400 private manufacturing sector companies.
- GBP/USD takes offers to refresh intraday low, looks set to refresh fortnight bottom.
- One-week-old resistance line restricts short-term advances, immediate support line on RSI tests bears targeting 61.8% Fibonacci retracement support.
- 200-HMA acts as the tough nut to crack for the bulls.
GBP/USD reverses the previous day’s corrective pullback from a two-week low, refreshing intraday bottom around 1.2150 during Friday’s Asian session.
In doing so, the Cable pair extends the previous day’s pullback from a one-week-long resistance line, at 1.2180 by the press time.
The bearish bias also gains momentum due to the RSI (14) pullback from the oversold territory.
However, a two-day-long support line on the RSI (14) may challenge the GBP/USD pair’s further downside targeting the 61.8% Fibonacci retracement of June 14-16 upside, near 1.2110. Also acting as the downside filter is the 1.2100 threshold.
Meanwhile, recovery remains elusive until the quote stays below the aforementioned resistance line of around 1.2180.
Even if the GBP/USD pair rises past 1.2180, it needs to cross the 200-HMA hurdle surrounding 1.2235 to recall the buyers.
Following that, a run-up towards the 1.2330 resistance level and the mid-June swing high near 1.2410 appears more likely.
Overall, GBP/USD is likely to remain pressured unless crossing the 1.2235.
GBP/USD: Hourly chart
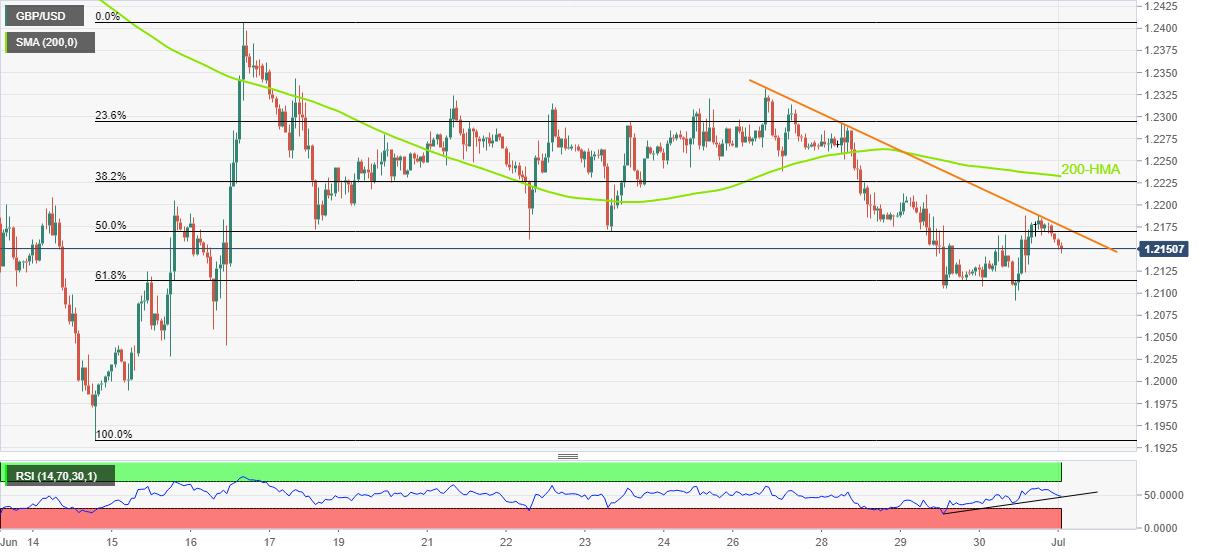
Trend: Further weakness expected
- NZD/USD is underwater as the US dollar corrects Thursday's sell-off.
- Markets are fixated on the US growth story, key data is eyed.
NZD/USD is down a touch by some 0.17% at the time of writing and has fallen on Friday from a high of 0.6246 to a low of 0.6228 so far. The US dollar is firming from overnight lows, putting some heat into the kiwi.
''The Kiwi bounced back to the mid-0.62s overnight as the USD came under pressure against most peers in a move that looks like it was driven by fears of slowing growth. Equity markets are lower, but not by much and it’s arguable that they (and risk appetite in general) have been saved a bit by the sharp fall in US bond yields,'' analysts at ANZ Bank explained.
The highlights of Thursday's data schedule were a faster monthly pace of growth in the PCE price index, steady personal income expansion, and slower spending growth. Personal income was up 0.5% in May, right on expectations after a 0.5% gain in the previous month.
In other data, the Chicago PMI fell to 56.4 in June from 60.3 in May. Other manufacturing data already released have suggested slower growth or outright contraction. The ISM's national index will be released on Friday. Initial jobless claims decreased by 2,000 to 231,000 in the week ended June 25, but the four-week moving average rose by 7,250 to 231,750, continuing the string of gains.
- AUD/USD takes offers to refresh intraday low, pares the biggest daily gains in week.
- Improvements in Aussie PMI, escalating chatters over RBA’s another 50 bps rate hike fail to recall bulls.
- Inflation/recession fears weigh on market sentiment ahead of the key US activity data.
AUD/USD renews intraday low around 0.6880, reversing the previous day’s rebound from a fortnight trough, as sour sentiment weighs on the risk barometer pair during Friday’s Asian session.
In doing so, the Aussie pair ignores upbeat second readings of activity data for June and escalating calls for the Reserve Bank of Australia’s (RBA) aggressive rate hikes. The reason could be linked to the market’s economic pessimism amid rising inflation and recently downbeat data. The risk-off mood could be witnessed via the S&P 500 Futures as it drops for the fifth consecutive day to refresh the weekly low.
That said, the second reading of Australia’s S&P Global Manufacturing PMI for June rose past the initial forecasts of 55.8 to 56.2, versus the previous month’s final print of 55.7.
Elsewhere, Reuters’ latest poll mentioned that Australia's central bank (RBA) will deliver another half percentage-point interest rate hike on Tuesday as it fights to tame surging inflation, marking the first time it has ever raised the cash rate by that magnitude in consecutive meetings.
It should be noted that the US dollar’s rebound ahead of the key US ISM Manufacturing PMI for June, expected 55.0 versus 56.1 prior, exert downside pressure on the AUD/USD prices. That said, the US Dollar Index (DXY) reversed from a 12-day high to snap a two-day uptrend by closing Thursday’s trading around 104.75, near 104.80 by the press time.
The downbeat US personal spending and softer prints of the Fed’s preferred inflation gauge raised concerns over the health of the world’s largest economy and drowned the US dollar on Thursday. The greenback’s previous retreat could also be linked to the downbeat US Treasury yields as the benchmark 10-year bond coupons dropped below 3.0%, before bouncing off to 3.01% at the closing, to portray around 50 basis points (bps) of a fall from June’s peak.
Being the risk barometer, AUD/USD is likely to remain depressed amid the market’s sour sentiment. However, today’s US ISM PMI will be important to watch after the recently softer US data.
Also read: ISM Manufacturing PMI Preview: High inflation component steal the show, boost dollar
Technical analysis
AUD/USD bears again target a seven-week-old important support line, around 0.6860 by the press time. The corrective pullback, if any, needs to cross the fortnight-long resistance line near 0.6930 to convince buyers.
In recent trade today, the People’s Bank of China (PBOC) set the yuan (CNY) at 6.6863 vs. the last close of 6.7001.
About the fix
China maintains strict control of the yuan’s rate on the mainland.
The onshore yuan (CNY) differs from the offshore one (CNH) in trading restrictions, this last one is not as tightly controlled.
Each morning, the People’s Bank of China (PBOC) sets a so-called daily midpoint fix, based on the yuan’s previous day's closing level and quotations taken from the inter-bank dealer.
- EUR/USD has displayed a responsive buying action around 1.0382.
- The RSI (14) is attempting to breach 60.00 which will bring a fresh impulsive wave.
- The trendline placed from June 17 low a 1.0444 will act as a critical hurdle for the counter.
The EUR/USD pair is facing a time correction after hitting a high of 1.0489 on Thursday. The asset displayed a firmer responsive buying action after hitting a low of 1.0382. A responsive buying action indicates the initiation of significant longs by the market participants after they consider the asset a value bet.
The shared currency bulls have defended the critical support of 1.0382, recorded on June 16 comfortably, which has resulted in a firmer bullish reversal in the counter. The upward sloping trendline placed from June 17 low a 1.0444 will act as a critical hurdle for the counter.
The asset has crossed the 20- and 50-period Exponential Moving Averages (EMAs) at 1.0465 and 1.0473 respectively. It is worth noting that the asset’s price is auctioning above the short-term EMAs while the 20-EMA is trading lower than the 50-EMA. This indicates that the buying action in the asset is very much firmer.
Meanwhile, the Relative Strength Index (RSI) (14) is attempting to cross the 60.00 mark to confirm a fresh leg of the rally. An occurrence of the same will expose the asset to more upside. A firmer range shift by the RSI (14) signifies that the asset is no more bearish now.
A decisive move above June 23 low at 1.0483 will drive the asset towards Wednesday’s high at 1.0535, followed by Tuesday’s high at 1.0606.
On the flip side, the greenback bulls could strengthen further if the asset drops below Thursday’s low at 1.0433. An occurrence of the same will drag the asset towards June 14 low at 1.0397. A slippage below June 14 low will expose the asset to more downside levels of the Jun 15 low at 1.0359.
EUR/USD hourly chart
-637922344620011727.png)
Australia's central bank will deliver another half percentage-point interest rate hike on Tuesday as it fights to tame surging inflation, marking the first time it has ever raised the cash rate by that magnitude at consecutive meetings, a Reuters poll found.
More to come
- DXY consolidates the biggest daily loss in a fortnight.
- Fears of US recession joined downbeat data to weigh on the greenback before the latest rebound.
- Rebound in US Treasury yields offer extra strength to the US dollar.
- US ISM Manufacturing PMI, chatters over economic slowdown appear important for fresh impulse.
US Dollar Index (DXY) picks up bids to refresh its intraday high around 105.00, after falling the most in two weeks the previous day. The greenback gauge appears to trace the US Treasury yields while bouncing off the fortnight low during Friday’s Asian session.
In doing so, the DXY seems to cheer the broad risk of global slowdown as well as the market’s anxiety ahead of the key US ISM Manufacturing PMI for June, expected 55.0 versus 56.1 prior.
The downbeat US personal spending and softer prints of the Fed’s preferred inflation gauge raised concerns over the health of the world’s largest economy and drowned the US dollar on Thursday. The greenback’s previous retreat could also be linked to the downbeat US Treasury yields as the benchmark 10-year bond coupons dropped below 3.0%, before bouncing off to 3.01% at the closing, to portray around 50 basis points (bps) of a fall from June’s peak.
While portraying the mood, the S&P 500 Futures remain pressured for the fifth consecutive day around a one-week low.
Talking about the data, the US Personal Income for May matched market forecasts and upwardly revised figures of 0.5% MoM but Personal Spending dropped to a three-month low, to 0.2% versus 0.5% expected and 0.6% downwardly revised previous readings. Further, the Personal Consumption Expenditure (PCE) Price Index reprinted 6.3% YoY figures for May.
More importantly, the Core PCE Price Index, the Fed’s preferred inflation gauge, matched expectations of 4.7% YoY versus 4.9% prior.
Having witnessed the return of the US dollar buyers, the traders should wait for the US ISM Manufacturing PMI for June to better forecast the moves. Also important will be the chatters surrounding inflation and recession.
Technical analysis
Unless providing a daily closing below the 21-DMA, surrounding $104.00 by the press time, US Dollar Index is likely staying on the way to refresh the yearly top, currently around 105.80.
- EUR/JPY is sensing resistance around 143.30 despite an improvement in Japan’s jobless rate to 2.6%.
- The economy has recorded higher employment opportunities amid ongoing prudent monetary policy.
- The shared currency bulls are worried over higher forecasts for eurozone HICP data.
The EUR/JPY pair is sensing barricades around 143.30 despite the increment in Japan’s Unemployment Rate. The Statistics Bureau of Japan has reported the jobless rate at 2.6%, higher than the estimates and the prior print of 2.5%. Moving further, the Jobs/Applicants ratio has improved to 1.24, higher than the former print of 1.23 but in line with the consensus of 1.24.
Rising job opportunities in the Japanese economy indicate that the prudent monetary policy adopted by the Bank of Japan (BOJ) is generating employment. The availability of cheap money in the economy is delighting the corporate sector to invest vigorously. Also, the rising exports by the economy amid the weak Japanese yen are supporting the labor market. Meanwhile, Japan's tax revenue in FY2021 reached a record 67 trillion yen - Nikkei. Higher tax revenue by the economy may support the yen bulls going further.
On the eurozone front, the shared currency bulls are awaiting the release of the Harmonized Index of Consumer Prices (HICP). As per the estimates, the annual inflation rate may improve to 8.3% from the prior figure of 8.1%. In this context, European Central Bank (ECB) President Christine Lagarde stated that the odds of returning to a lower inflation environment despite a spree of rate hike announcements are extremely lower.
| Index | Change, points | Closed | Change, % |
|---|---|---|---|
| NIKKEI 225 | -411.56 | 26393.04 | -1.54 |
| Hang Seng | -137.1 | 21859.79 | -0.62 |
| KOSPI | -45.35 | 2332.64 | -1.91 |
| ASX 200 | -132.1 | 6568.1 | -1.97 |
| FTSE 100 | -143.02 | 7169.28 | -1.96 |
| DAX | -219.58 | 12783.77 | -1.69 |
| CAC 40 | -108.62 | 5922.86 | -1.8 |
| Dow Jones | -253.88 | 30775.43 | -0.82 |
| S&P 500 | -33.45 | 3785.38 | -0.88 |
| NASDAQ Composite | -149.15 | 11028.74 | -1.33 |
- Gold Price remains pressured around the lowest levels in seven weeks after breaking the key support.
- US Dollar regains upside momentum after falling the most in a fortnight as recession woes favor the greenback.
- US ISM Manufacturing PMI for June could direct market moves, Eurozone inflation is important too.
Gold Price (XAU/USD) holds onto the previous day’s bearish bias, despite taking rounds to the multi-day low surrounding $1,805 during Friday’s Asian session.
In doing so, the yellow metal bears the burden of the US dollar rebound ahead of the key US ISM Manufacturing PMI for June, expected 55.0 versus 56.1 prior. Also important is today’s Eurozone inflation gauge, Harmonised Index of Consumer Prices (HICP), likely to refresh the record top to 8.3% versus 8.1% marked previously. In addition to the pre-data anxiety, the US dollar’s latest gains could be linked to the broad recession fears.
That said, the US Dollar Index (DXY) reversed from a 12-day high to snap a two-day uptrend by closing the day around 104.75, near 104.80 by the press time.
The downbeat US personal spending and softer prints of the Fed’s preferred inflation gauge raised concerns over the health of the world’s largest economy and drowned the US dollar on Thursday. The greenback’s previous retreat could also be linked to the downbeat US Treasury yields as the benchmark 10-year bond coupons dropped below 3.0%, before bouncing off to 3.01% at the closing, to portray around 50 basis points (bps) of a fall from June’s peak.
Amid these plays, the S&P 500 Futures remain pressured for the fifth consecutive day around one-week low.
To sum up, Gold Price is likely to witness further downside as the fears of inflation and recession underpin the US dollar’s safe-haven demand, which in turn has inverse relations with the yellow metal. However, today’s US PMI will be important to watch after Thursday’s disappointment from the US data.
Technical analysis
Gold remains on the way to the yearly low surrounding $1,786 as it keeps the previous day’s downside break of the monthly support near $1,807. However, the $1,800 threshold may test the XAU/USD bears.
That said, the 61.8% Fibonacci Expansion (FE) of April-May moves, near $1,748, appears the key level to watch past $1,786.
Alternatively, recovery remains elusive below the support-turned-resistance level of $1,807.
Gold: Daily chart
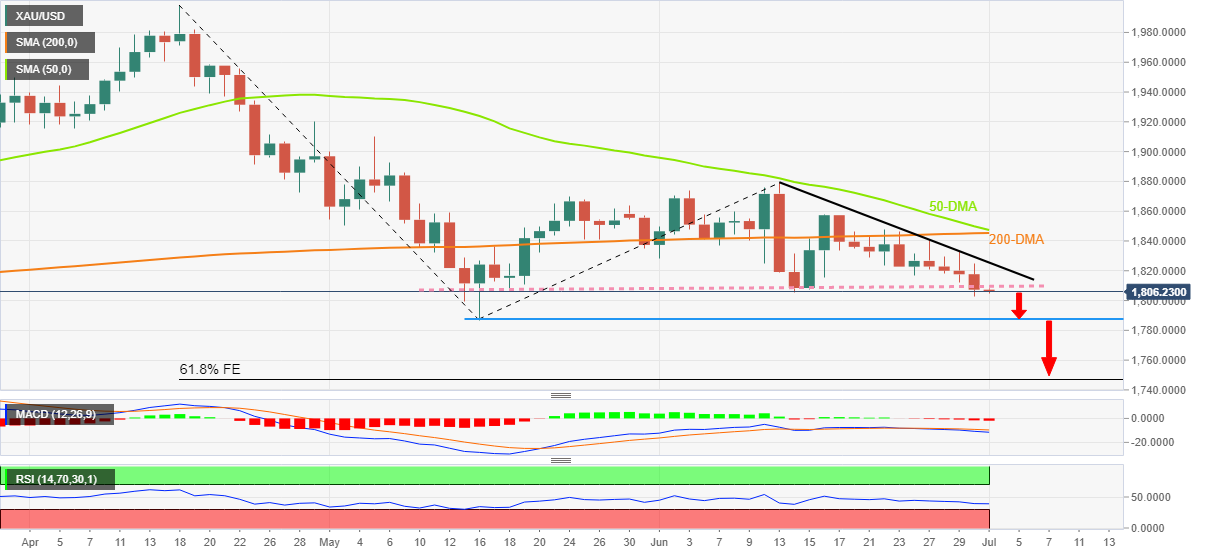
Trend: Further weakness expected
| Pare | Closed | Change, % |
|---|---|---|
| AUDUSD | 0.69019 | 0.33 |
| EURJPY | 142.251 | -0.25 |
| EURUSD | 1.04796 | 0.35 |
| GBPJPY | 165.324 | -0.14 |
| GBPUSD | 1.21716 | 0.41 |
| NZDUSD | 0.62425 | 0.34 |
| USDCAD | 1.28743 | -0.14 |
| USDCHF | 0.95465 | 0.01 |
| USDJPY | 135.736 | -0.62 |
- WTI pares the biggest daily loss in a week around important support.
- Bearish MACD signals, downbeat RSI and failures to cross 21-day EMA favor sellers.
- Convergence of the 100-day EMA, two-month-old support line restricts further downside.
WTI licks its wounds around $104.80 as sellers take a breather after cheering the week’s biggest fall the previous day. In doing so, the black gold bounces of short-term key support confluence comprising the 100-day EMA and an upward sloping trend line from late May.
Given the bearish MACD signals and an absence of oversold RSI, not to forget the quote’s sustained trading below the 21-day EMA, bears are likely to keep the reins.
That said, a clear downside break of the $103.70 support confluence becomes necessary to witness the south-run targeting the monthly low near $101.70.
During the fall, the 61.8% Fibonacci retracement of late February to early March upside, around $102.30, may offer an intermediate halt.
Alternatively, an upside break of the 21-day EMA, at $109.55 by the press time, needs validation from the weekly high of $112.72 to recall the WTI buyers.
Following that, the commodity prices can aim for the monthly peak of $121.35 before challenging the yearly top surrounding $126.50.
WTI: Daily chart
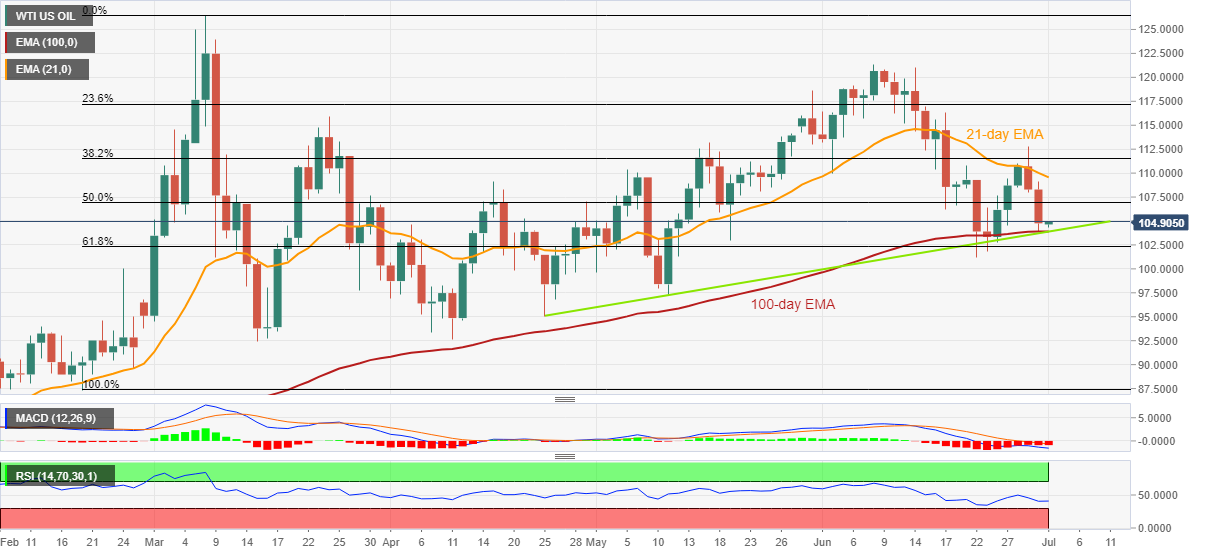
Trend: Further downside expected


© 2000-2026. Bản quyền Teletrade.
Trang web này được quản lý bởi Teletrade D.J. LLC 2351 LLC 2022 (Euro House, Richmond Hill Road, Kingstown, VC0100, St. Vincent and the Grenadines).
Thông tin trên trang web không phải là cơ sở để đưa ra quyết định đầu tư và chỉ được cung cấp cho mục đích làm quen.
Giao dịch trên thị trường tài chính (đặc biệt là giao dịch sử dụng các công cụ biên) mở ra những cơ hội lớn và tạo điều kiện cho các nhà đầu tư sẵn sàng mạo hiểm để thu lợi nhuận, tuy nhiên nó mang trong mình nguy cơ rủi ro khá cao. Chính vì vậy trước khi tiến hành giao dịch cần phải xem xét mọi mặt vấn đề chấp nhận tiến hành giao dịch cụ thể xét theo quan điểm của nguồn lực tài chính sẵn có và mức độ am hiểu thị trường tài chính.
Sử dụng thông tin: sử dụng toàn bộ hay riêng biệt các dữ liệu trên trang web của công ty TeleTrade như một nguồn cung cấp thông tin nhất định. Việc sử dụng tư liệu từ trang web cần kèm theo liên kết đến trang teletrade.vn. Việc tự động thu thập số liệu cũng như thông tin từ trang web TeleTrade đều không được phép.
Xin vui lòng liên hệ với pr@teletrade.global nếu có câu hỏi.
ngân hàng