- Phân tích
- Tin tức và các công cụ
- Tin tức thị trường
Tin tức thì trường
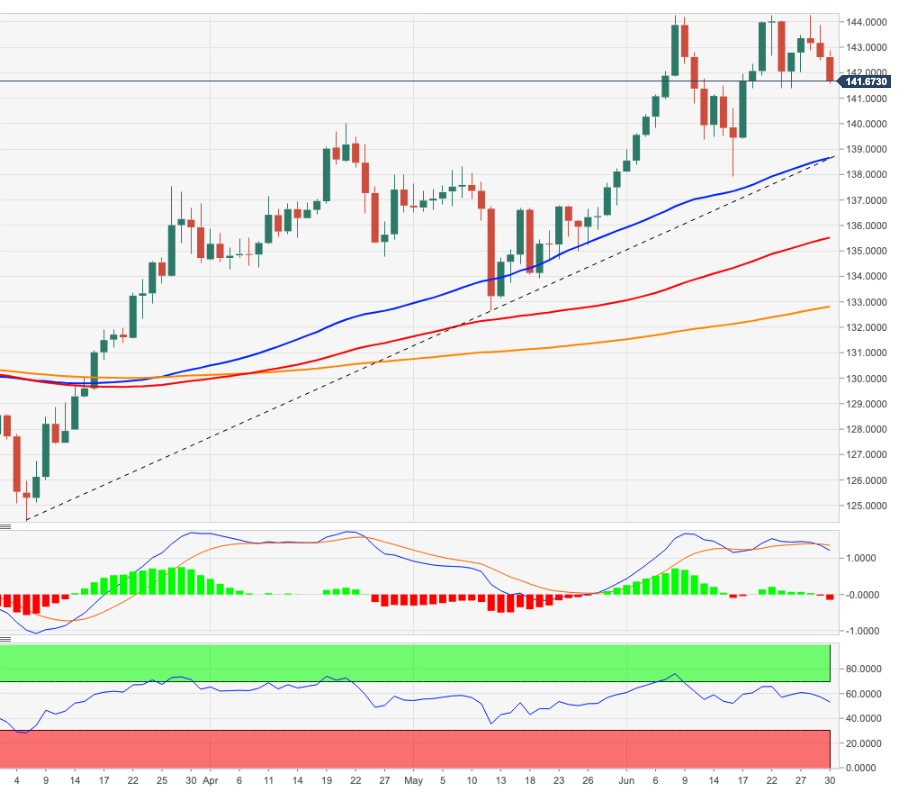
- USD/JPY has moved marginally higher on downbeat Japan’s jobless data.
- The Unemployment data has landed at 2.6% while the Jobs/Applicants data has improved to 1.24.
- Investors’ focus will remain on US ISM PMI which is seen lower to 55.
The USD/JPY pair is aiming towards 136.00 as the Statistics Bureau of Japan has reported higher-than-expected Unemployment data. The jobless rate has improved to 2.6%, higher than the estimates and the prior print of 2.5%. While, the Jobs/Applicants ratio has improved to 1.24, higher than the former print of 1.23 but remains in line with the consensus of 1.24.
The higher jobless rate has weakened the Japanese yen against the greenback. The Bank of Japan (BOJ) has been keeping its ultra-loose monetary policy intact for a prolonged time to keep accelerating the aggregate demand. However, accelerating unemployment levels may force the BOJ to keep up with the prudent monetary policy as a tight labor market will always remain crucial for the Japanese economy.
Coming to the Tokyo inflation rate, the economic data has remained in a mid of estimates and the prior print of 2.2% and 2.4% respectively. A sustained inflation rate is lucrative for the yen bulls in the longer horizon.
On the dollar front, the US dollar index (DXY) is displaying some signs of exhaustion in the downside move and the pullback move is on the cards. The DXY witnessed an intense sell-off after the US CORE Personal Consumption Expenditure (PCE) Price Index landed along with the expectations of 4.9% but lower than the prior release of 4.9%. Even a minor fall in the inflation indicator seems lucrative for the risk-perceived assets. In today’s session, the spotlight will remain on the US ISM PMI numbers. The economic data is seen lower at 55 vs. 56.1 recorded previously.
- GBP/JPY prints four-day downtrend amid fears of recession, inflation.
- Japan’s inflation, unemployment rate increased, Tankan Large Manufacturing Index slumps.
- British government plans to cut VAT to battle the rising prices.
- UK Manufacturing PMI, risk catalysts will be crucial for immediate directions.
GBP/JPY remains pressured around 165.00 during the four-day downtrend amid early Friday morning in Asia.
The cross-currency pair’s latest moves could be linked to the downbeat US Treasury yields, as well as the UK’s failure to impress pound buyers despite announcing the plans to cut the Value Added Tax (VAT). Also exerting downside pressure on the GBP/JPY prices is news from Tokyo suggesting the record tax collection and mixed data.
Japan’s Tokyo Consumer Price Index (CPI) rose to 2.3% versus 2.2% expected and 2.4% prior in June while the nation’s Unemployment Rate for May increased to 2.6% compared to 2.5% market forecast and previous readings. Further, the Tankan Large Manufacturing Index for the second quarter (Q2) of 2022 slumped to 9 versus 13 expected and 14 prior.
Elsewhere, Nikkei came out with the news suggesting that Japan's tax revenue in the Financial Year 2021 reached a record 67 trillion yen.
On the other hand, Prime Minister Boris Johnson's chief of staff Steve Barclay suggested reducing the 20% headline rate of the tax, The Times said, adding a temporary cut would reduce the tax bill for millions, per Reuters. The news fails to impress the GBP/USD buyers as the actual outcome is yet to witness and the official announcement is pending as well.
Additionally, the final readings of the UK Gross Domestic Product (GDP) for Q1 2021 matched initial forecasts of 0.8% QoQ and 8.7% YoY.
It should be noted that the escalating fears of recession direct traders towards the US government bonds, which in turn exert downside pressure on the Treasury yields. That said, the US 10-year bond coupons dropped below 3.0%, before bouncing off to 3.01% at the closing, to portray around 50 basis points (bps) of a fall from June’s peak.
Looking forward, the final reading of the UK S&P Global/CIPS Manufacturing PMI for June, expected to confirm 53.4 initial forecasts, will be important to watch for fresh impulse. However, risk catalysts will be the key.
Technical analysis
The first daily closing below the 21-DMA in five weeks keeps GBP/JPY bears hopeful of revisiting the 50-DMA support, around 162.80 by the press time.
Alternatively, a one-week-old resistance line, near 166.20, adds to the upside filters even if the buyers manage to cross the immediate 21-DMA hurdle of 165.45.
- USD/CAD struggles inside the key DMA envelope after dropping the previous day.
- Fortnight-old descending trend line adds to the upside filters, bearish MACD favors further downside.
- 21-DMA holds the key to seller’s welcome, 10-DMA guards recovery.
USD/CAD fades bounce off intraday low around 1.2880 during Friday’s Asian session. In doing so, the Loonie pair remains pressured inside the familiar trading range between the 10-DMA and the 21-DMA by the press time.
It’s worth noting that the quote dropped the most in a week while reversing from the confluence of the 10-DMA and a two-week-old resistance line, around 1.2915-20 at the latest.
The pullback also gains support from the bearish MACD signals, which in turn challenge the quote’s corrective bounce afterward.
However, the 21-DMA support of 1.2837 precedes the weekly low near 1.2820 to challenge the short-term downside of the USD/CAD prices.
In a case where the pair stays weak past 1.2820, the odds of witnessing a south-run towards the 50% Fibonacci retracement of April-June upside, near 1.2740, can’t be ruled out.
On the contrary, a clear upside break of the 1.2920 hurdle could propel the USD/CAD pair towards the 1.3000 psychological magnet.
Following that, the double tops surrounding 1.3080 appear tough nut to crack for the bulls.
USD/CAD: Daily chart
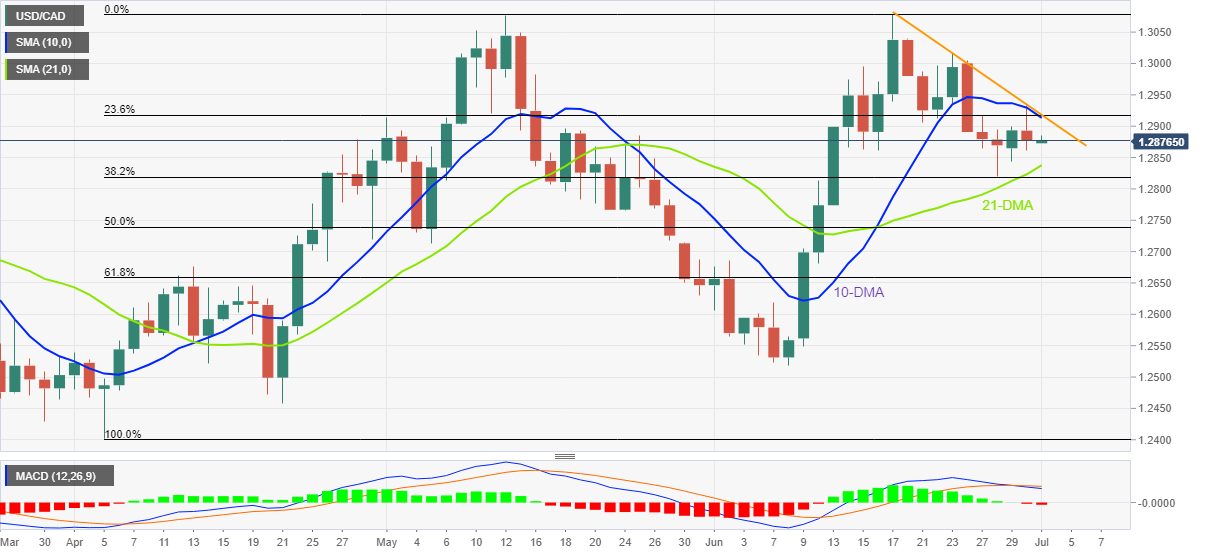
Trend: Further weakness expected
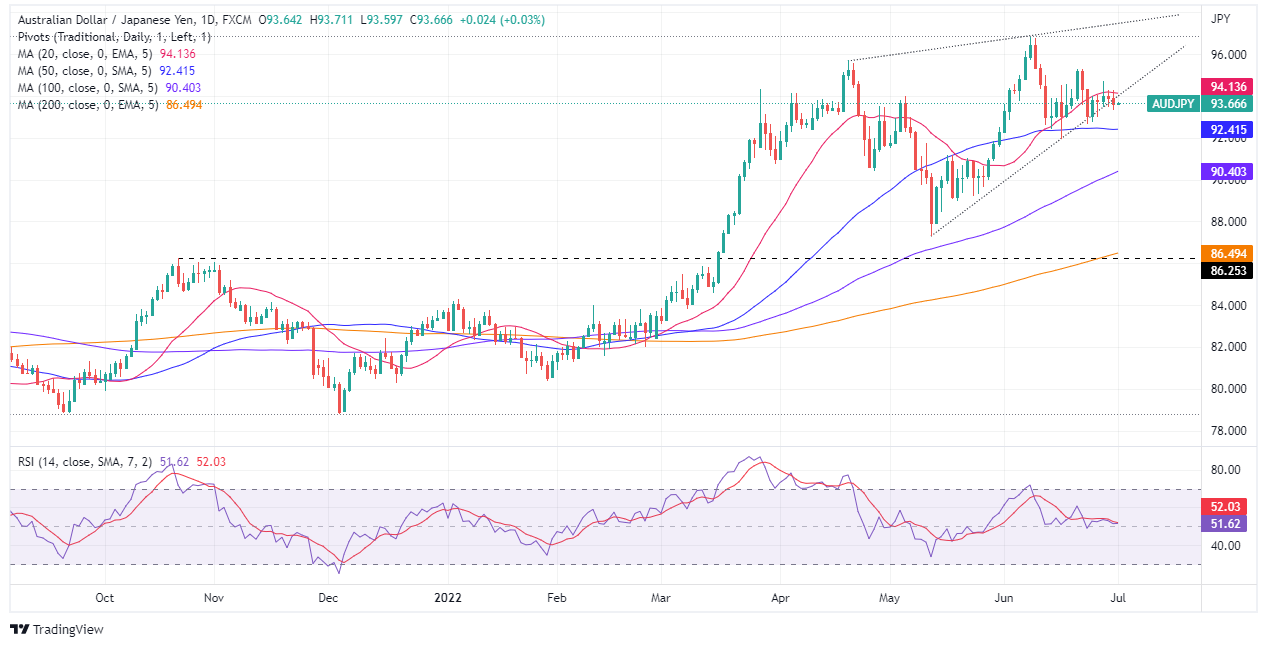
- The AUD/JPY registered gains of almost 1.50% in June.
- A rising wedge in the AUD/JPY’s daily chart targets a fall towards 86.20s.
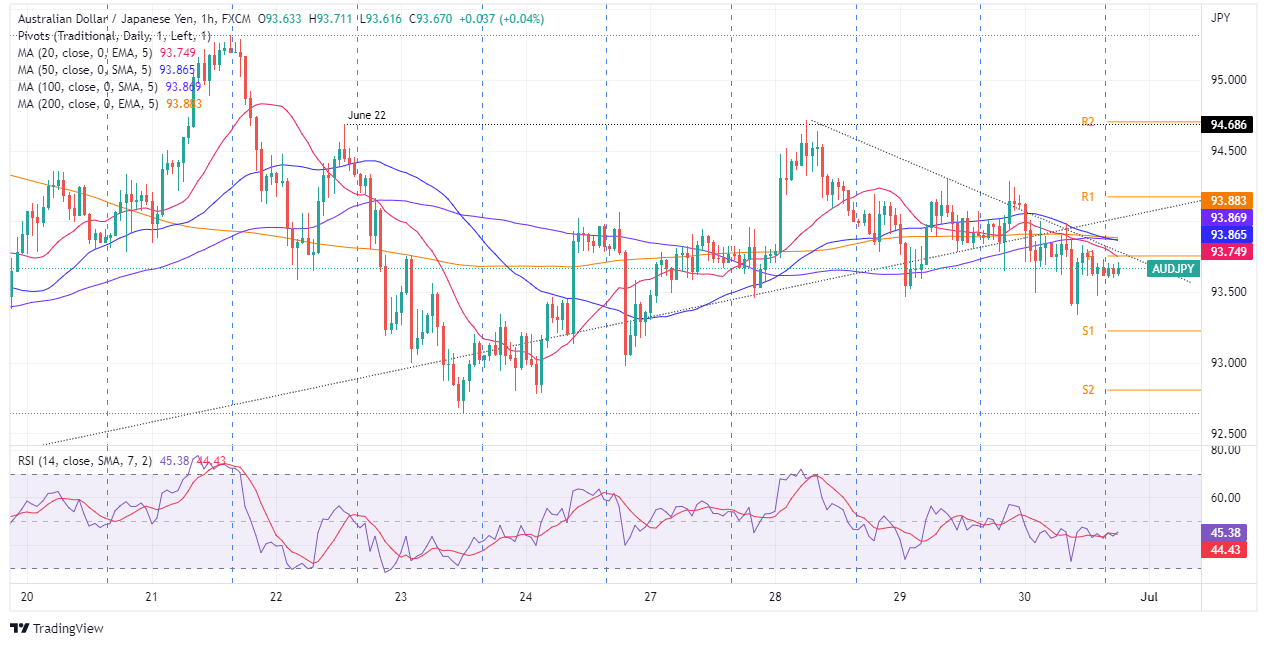
- The AUD/JPY in the near term is neutral-downward biased.
AUD/JPY prolongs its losses amidst a risk-off impulse weighing on global equities, sending investors scrambling toward safe-haven assets; in the FX complex being the Japanese yen and the Swiss franc, except the US dollar, undermined by falling US Treasury yields. At 93.67, the AUD/JPY is almost flat as the Asian Pacific session begins.
AUD/JPY Thursday’s price action illustrates consolidation in the last few days, within the 93.40-94.30 range, which buyers/sellers have been unable to break. AUD/JPY traders should note that the cross exchange rate is below the exponential moving averages (EMAs) in the 1-hour chart, signifying that downside risks remain in the short term.
AUD/JPY Daily chart
The AUD/JPY daily chart illustrates that the uptrend remains in play. Nevertheless, the pair’s falling below the 20-day EMA leaves it vulnerable to selling pressure, but the “damage” could be limited by the 50-day EMA at 92.41, followed by the June 16 swing low at 91.96. If that scenario plays out, it will also confirm the break of a rising wedge that targets the October 21, 2021 swing high-turned-support at 86.25.
AUD/JPY 1-Hour chart
In the near term, the AUD/JPY depicts a neutral-downward bias, confirmed by the EMAs and the Relative Strenght Index (RSI), which albeit almost trendless, remains below the 50-midline, in negative territory. Furthermore, a four-times tested downslope trendline suggests the pair is consolidating.
If the AUD/JPY breaks to the downside, its first support would be the June 30 daily low at 93.33. Once cleared, it would expose the S1 daily pivot at 93.23, followed by the June 26 low at 92.97. Contrarily, if the cross heads north, the AUD/JPY’s first resistance would be the 20-EMA at 93.74. Break above would expose the confluence of the 50, 100, and 200-EMAs, in the 93.85-88 range, followed by the R1 daily pivot at 94.20, followed by the June 22 high at 94.68.
AUD/JPY Key Technical Levels
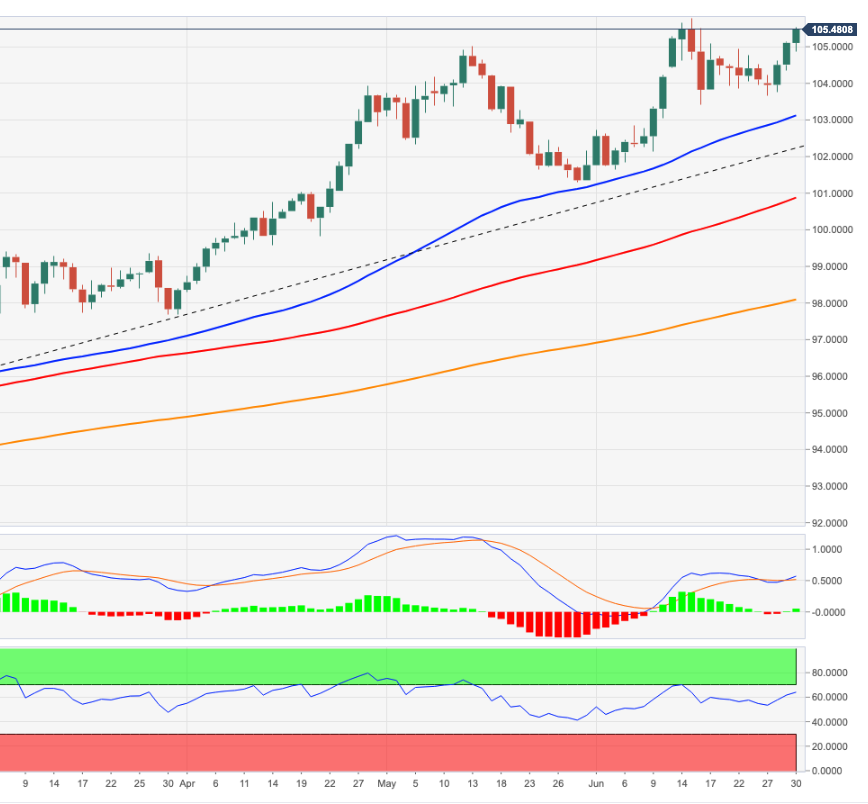
- USD/CHF is inching higher after extending its recovery as DXY attempts a rebound.
- A decline in the US core PCE Price Index has resulted in a significant fall in the DXY.
- The improved Swiss Real Retail Sales have failed to support the Swiss franc bulls.
The USD/CHF pair has witnessed a modest rebound after hitting a low of 0.9535 in the New York session. The asset has successfully defended the responsive buying action recorded on Wednesday as the US dollar index (DXY) is eyeing a rebound after displaying a significant fall on Thursday.
The DXY witnessed a vertical downside move after attempting to renew its 23-year high at 105.78. The asset is trying to hold itself around 104.70 and may attempt a rebound amid its broader strength. A significant fall in the DXY is backed by an in-line rerelease of the US core Personal Consumption Expenditures (PCE) Price Index.
It is worth noting that the critical indicator of price levels has been advancing for the past few months and a minor slippage from the prior release of 4.9% indicates that the policy tightening measures have started showing their impact. However, the odds of a consecutive rate hike by 75 basis points (bps) are intact as the inflation rate at 8.6% is still more than four times higher than the desired rate of 2%.
In today’s session, investors’ focus will remain on the release of the US ISM PMI. As per the market consensus, the economic data may slip to 55 from the prior release of 56.1.
On the Swiss franc front, the release of the improved Real Retail Sales data has failed to provide any support to the Swiss franc bulls. The economic data released at -1.6%, higher than the prior print of -5.5% but lower than the estimates of 3.8%.
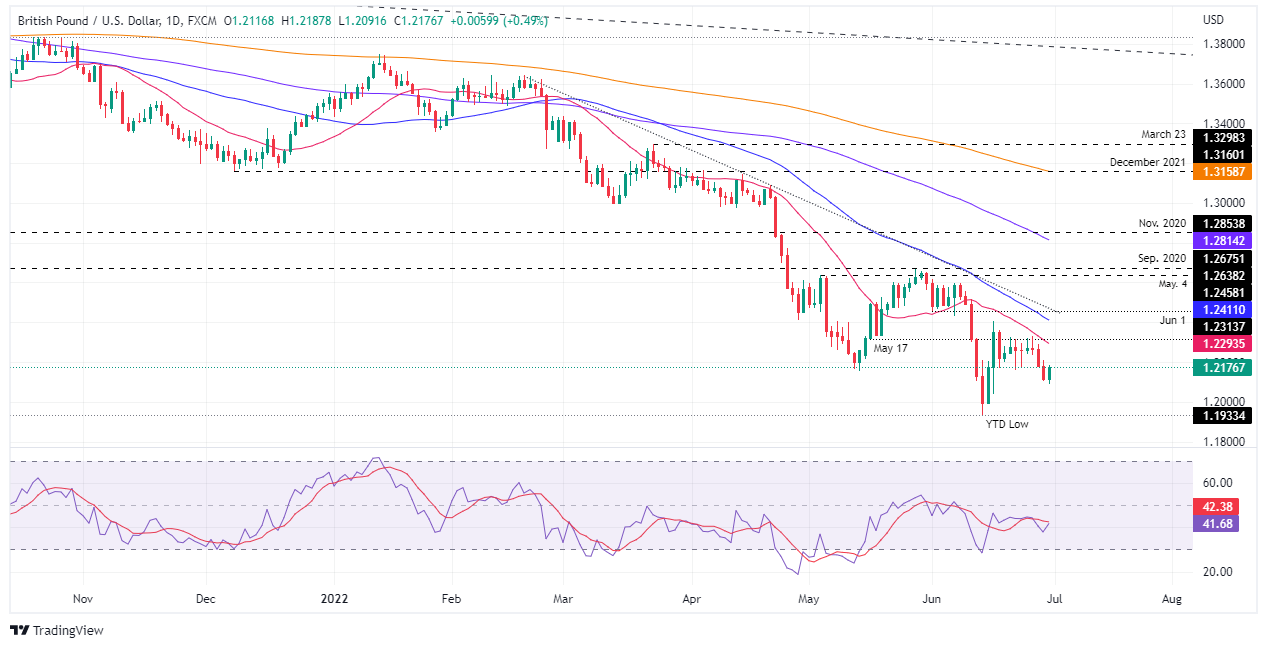
- GBP/USD fails to extend the corrective rebound from two-week low.
- No10 eyes reduction in VAT to battle inflation woes.
- Softer US spending, inflation weighed on the US dollar but broad pessimism put a floor under the fall.
- Fears of economic slowdown can keep grinding the pair lower, PMIs for June will be important for the day.
GBP/USD takes offers to refresh the intraday low around 1.2165, paring the biggest daily gains in a fortnight during Friday’s initial Asian session. In doing so, the Cable pair fails to cheer the news suggesting the UK government’s plan to ease the Value Added Tax (VAT) to counter the risk emanating from the price rise.
Prime Minister Boris Johnson's chief of staff Steve Barclay suggested reducing the 20% headline rate of the tax, The Times said, adding a temporary cut would reduce the tax bill for millions, per Reuters. The news fails to impress the GBP/USD buyers as the actual outcome is yet to witness and the official announcement is pending as well.
On the other hand, downbeat US personal spending and softer prints of the Fed’s preferred inflation gauge raised concerns over the health of the world’s largest economy and drowned the US dollar on Thursday. The greenback’s retreat could also be linked to the downbeat US Treasury yields as the benchmark 10-year bond coupons dropped below 3.0%, before bouncing off to 3.01% at the closing, to portray around 50 basis points (bps) of a fall from June’s peak.
That said, the US Dollar Index (DXY) reversed from a 12-day high to snap a two-day uptrend by closing the day around 104.75.
The recession fears, alternatively, kept the market’s risk appetite weak and weighed on the equities even as the yields were down and the dollar too.
It’s worth noting that the US Personal Income for May matched market forecasts and upwardly revised figures of 0.5% MoM but Personal Spending dropped to a three-month low, to 0.2% versus 0.5% expected and 0.6% downwardly revised previous readings. Further, the Personal Consumption Expenditure (PCE) Price Index reprinted 6.3% YoY figures for May.
More importantly, the Core PCE Price Index, the Fed’s preferred inflation gauge, matched expectations of 4.7% YoY versus 4.9% prior.
On the other hand, the final readings of the UK Gross Domestic Product (GDP) for Q1 2021 matched initial forecasts of 0.8% QoQ and 8.7% YoY.
Looking forward, the final reading of the UK S&P Global Manufacturing PMI for June precedes the US ISM Manufacturing PMI for the said month to direct intraday moves.
Also read: ISM Manufacturing PMI Preview: High inflation component steal the show, boost dollar
Technical analysis
Unless crossing a three-week-old resistance line, near 1.2250, GBP/USD remains vulnerable to refresh yearly low, currently around 1.1933.
- EUR/USD fades bounce off two-week bottom, pares biggest daily gains in a fortnight.
- Softer US spending, PCE inflation propelled growth concerns and weighed on the USD.
- Market sentiment remains weak amid recession, inflation fears.
- Eurozone inflation, US ISM Manufacturing PMI for June will be important to watch for the day.
EUR/USD fails to extend the previous day’s corrective pullback from a fortnight low, easing around 1.0480-75 during Friday’s initial Asian session. The major currency pair benefited from the broad US dollar pullback on Thursday before retreating ahead of another round of important data points.
Softer US spending and inflation figures amplified recession concerns for the world’s largest economy and drowned the US dollar on Thursday. The greenback’s retreat could also be linked to the downbeat US Treasury yields as the benchmark 10-year bond coupons dropped below 3.0%, before bouncing off to 3.01% at the closing, to portray around 50 basis points (bps) of a fall from June’s peak.
It should be noted, however, that the equities couldn’t cheer downbeat Treasury yields, nor the softer US dollar, amid fears of economic slowdown.
That said, the US Dollar Index (DXY) reversed from a 12-day high to snap a two-day uptrend by closing the day around 104.75.
Talking about the data, On Thursday, the US Personal Income for May matched market forecasts and upwardly revised figures of 0.5% MoM but Personal Spending dropped to a three-month low, to 0.2% versus 0.5% expected and 0.6% downwardly revised previous readings. Further, the Personal Consumption Expenditure (PCE) Price Index reprinted 6.3% YoY figures for May.
More importantly, the Core PCE Price Index, the Fed’s preferred inflation gauge, matched expectations of 4.7% YoY versus 4.9% prior.
On the other hand, German Retail Sales for May dropped below -2.0% market forecast to -3.6% YoY, versus -0.4% previous readings whereas the Eurozone Unemployment Rate declined to 6.6% versus 6.8% expected and 6.7% prior.
Looking forward, the initial readings of the Eurozone key inflation gauge, Harmonised Index of Consumer Prices (HICP), will precede the US ISM Manufacturing PMI for June to direct short-term EUR/USD moves.
Technical analysis
A daily closing below the ascending trend line support from May 13, near 1.0440 by the press time, appears necessary for the EUR/USD bears to refresh the yearly low. Otherwise, a three-week-old resistance line, near 1.0565, could lure the counter-trend traders.
- A double bottom formation is signaling a bullish reversal going forward.
- Aussie bulls are attempting to balance above the 50-period EMA.
- The RSI (14) is oscillating in a 40.00-60.00 range which signals a consolidation ahead.
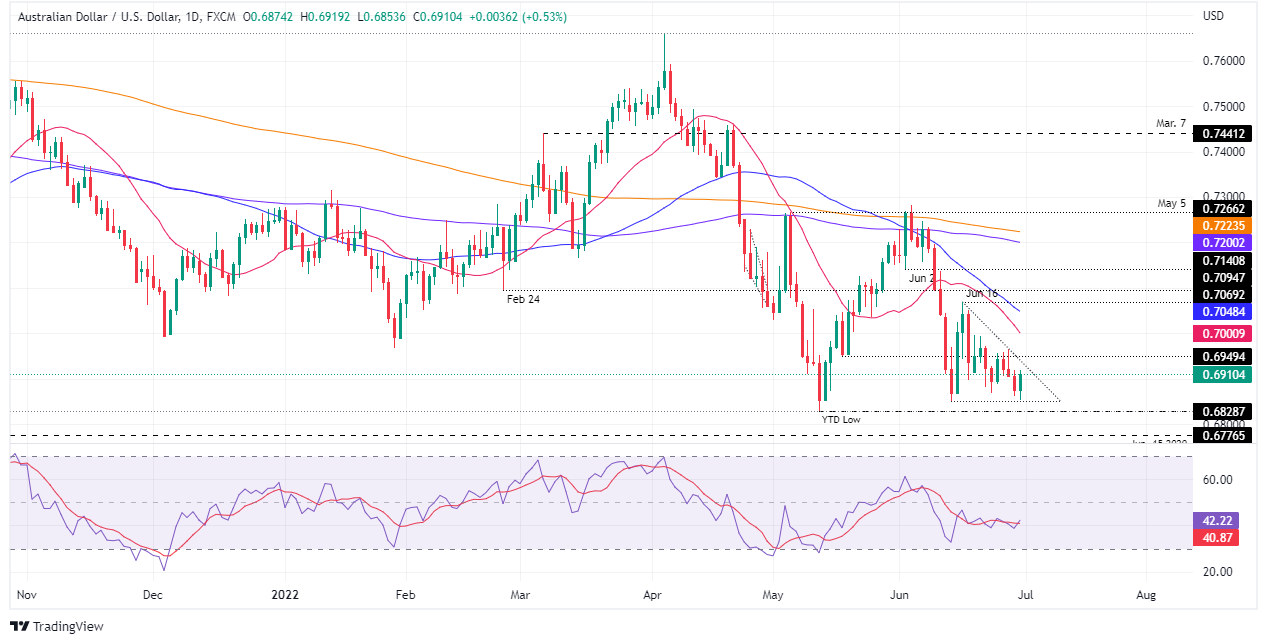
The AUD/USD pair is going through a correction phase after facing barricades around 0.6920 in the New York session. The asset displayed some signs of reversal on Thursday after finding bids while testing two-week-old support at 0.6850.
Aussie bulls have displayed a Double Bottom formation after sensing lower selling pressure while attempting to violate June 14 low at 0.6850. The appearance of a light selling pressure while testing the prior crucial support results in a short-term bounce that demands more filters to turn into a bullish reversal. The trendline placed from June 16 high at 0.7070 will act as a major resistance for the counter.
The antipodean is attempting to sustain above the 50-period Exponential Moving Average (EMA) at 0.6896, which will strengthen the aussie bulls further. While the 200-period EMA at 0.6925 is higher than the asset, which clears that the long-term trend is still down.
Meanwhile, the Relative Strength Index (RSI) (14) is oscillating in the 40.00-60.00 range, which signals the consolidation phase ahead.
The aussie bulls could lift the asset price higher if the major overstep Wednesday’s high at 0.6965. This will drive the asset towards the psychological resistance at 0.7000, followed by June 13 high at 0.7035.
On the flip side, the aussie bulls could lose their grip if the asset drops below June 23 low at 0.6868. This will drag the asset towards May 12 low and the round-level support at 0.6829 and 0.6800 respectively.
AUD/USD hourly chart
-637922254002071346.png)
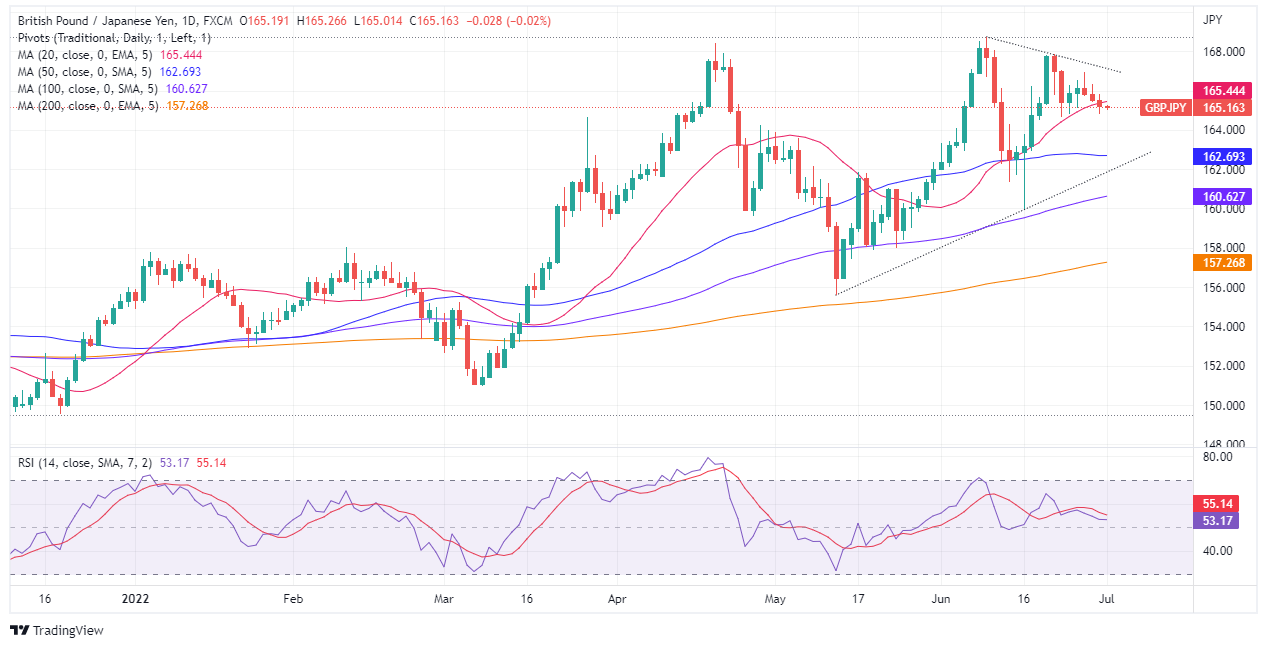
- The GBP/JPY closed in June with solid gains of almost 2%, as depicted by the weekly chart.
- From the daily chart perspective, the GBP/JPY is upward biased, but the pair tumbling below the 20-day EMA exposes the GBP/JPY to further selling pressure.
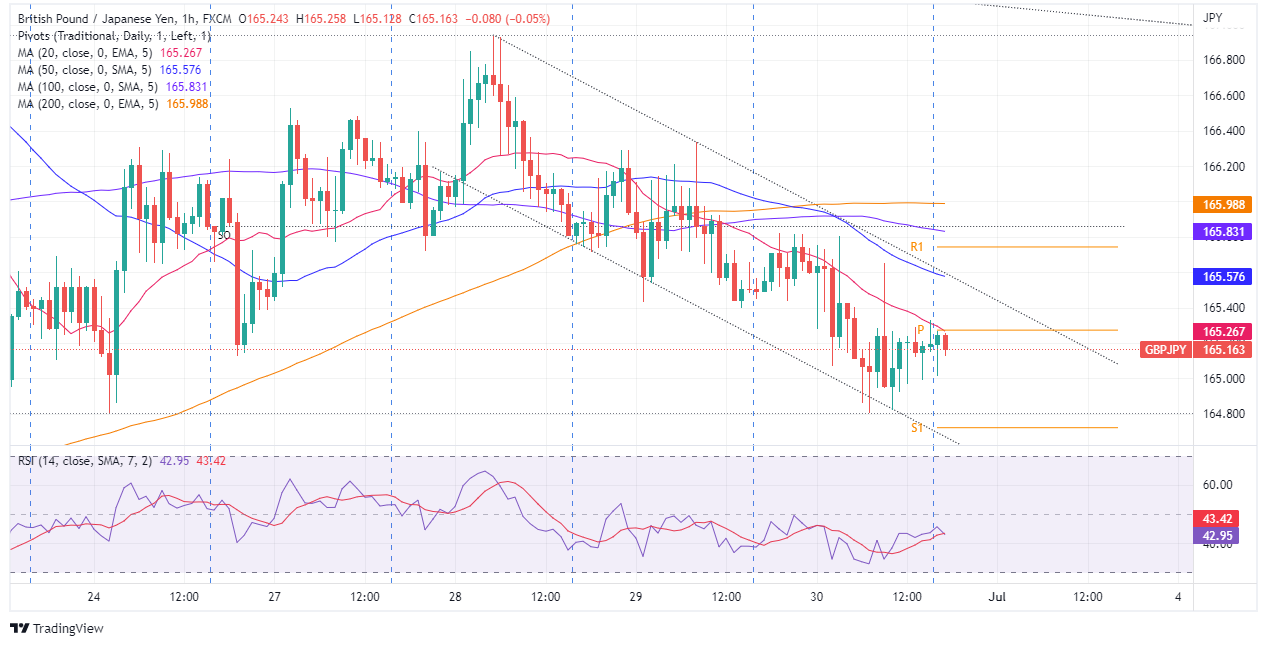
- GBP/JPY in the near term is neutral-downward biased and might accelerate its losses if sellers reclaim 164.65.
The British pound ended June with gains of almost 2% against the Japanese yen, but on the last trading day of the month, it recorded a loss of 0.19%, extending its fall to three straight days in the middle of a dampened market mood. At the time of writing, the GBP/JPY is trading at 165.24, barely up 0.04% as the Friday Asian session begins.
On Thursday, the GBP/JPY extended its fall, which began on June 28, when the pair reached a weekly high of around 166.94 and made a U-turn, which sent the pair tumbling towards a June 29 low at 169.39. That said, the GBP/JPY opened near the day’s highs and dropped towards the current week’s low around 164.80.
GBP/JPY Daily chart
The GBP/JPY daily chart illustrates the pair as upward biased in the long term, but a break below the 20-day EMA, at 165.44, leaves the cross-currency pair exposed to selling pressure. GBP/JPY sellers need to reclaim the June 23 daily low at 164.65 if they would like to extend the fall. If that scenario plays out, the next support would be the 50-day EMA at 162.69. Otherwise, the GBP/JPY’s first resistance would be the 20-day EMA at 165.44, followed by the June 28 high at 166.94.
GBP/JPY 1-Hour chart
In the 1-hour chart, the GBP/JPY illustrates a negative story in the short term. Since June 28, the pair fell 1.28%, more than 200-pips, courtesy of the Sterling weakness, which has bolstered the yen. In fact, price action is within a descending channel, showing the formation of a bullish flag. Nonetheless, further losses are expected if the GBP/JPY breaks below 164.65. Otherwise, the GBP/JPY first resistance would be the 20-EMA at 165.26, followed by the R1 daily pivot at 165.83, followed by the 200-EMA at1 65.98.
GBP/JPY Key Technical Level
"European Central Bank (ECB) policymaker and fiscal hawk Robert Holzmann would have preferred earlier action on interest rates than the ECB's current plan to raise them in July for the first time in more than a decade, he said in remarks published on Thursday,” per Reuters.
During an interview with Austrian newspaper Oberoesterreichische Nachrichten, ECB’s Holzmann also said, per Reuters, “From my Austrian point of view, I would have preferred earlier moves on interest rates but I am only one of 25 at the European Central Bank (Governing Council)."
Additional comments
We do not know how wage negotiations will go.
It will take some time to reach 2% inflation target.
Market reaction
The news appears to have failed in favoring Euro as the EUR/USD was last seen paring the biggest daily gains in a fortnight at around 1.0480.
- Gold price is likely to slip below $1,800.00 as odds of a 75 bps rate hike by the Fed have advanced.
- Fed’s focus is on bringing price stability to the economy.
- The activation of the descending triangle will send the gold prices deep into the negative trajectory.
Gold price (XAU/USD) is establishing below $1,810.00 after facing a steep fall while attempting a bullish reversal on Thursday. The precious metal is hovering near a fresh two-week low at $1,802.78 and is aiming to balance below the psychological support of $1,800.00. The release of the US core Personal Consumption Expenditures (PCE) Price Index at 4.7% has bolstered the odds of one more 75 basis points (bps) interest rate hike by the Federal Reserve (Fed) in July.
The US core PCE Price Index remained in line with the estimates but lower than the prior release of 4.9%. This indicates that the elevation of interest rates by the Fed to 1.50-1.75% in its past three monetary policy meetings has failed to make a substantial change in the price levels. Also, the Fed is ‘unintentionally committed’ to bringing price stability to the economy. Therefore, it will do ‘whatever it takes’ to cool off the red-hot inflation.
Going forward, the focus will remain on the US ISM PMI. A preliminary estimate for the economic data is 55, lower than the prior release of 56.1.
Gold technical analysis
On an hourly scale, the gold prices are expected to slip significantly below the psychological support of $1,800.00, which will activate the Descending Triangle formation. The downward sloping trendline of the chart pattern is placed from June 16 high at $1,857.58 while the horizontal support is plotted from June 14 low at $1,805.11. The gold bears have defended the 100-period Exponential Moving Average (EMA) at $1,820.11. Meanwhile, the Relative Strength Index (RSI) (14) will bring a fresh downside move after slipping below the 40.00.
Gold hourly chart

Here is what you need to know for Friday, July 1:
Risk-off was the theme on Thursday across most markets. Being the final day of the month, quarter, and half-year, there were some important developments which keep the outlook for the new quarter concerning global growth.
Weak inflation-adjusted consumer spending in the US only adds to these concerns and in turn, equities and rates lower are being pushed lower. US yields fell, with the 10-year down to a low of 2.97%, below the 3.00% psychological level, around 50bp below the peaks hit earlier in June. Equities were also weaker, with the S&P 500 down 1%.
In FX, DXY extended above 105.000 but fell sharply with the Yen regrouping as yields drop. The dollar rally remains largely intact, given rising worries about a global recession, although data on Thursday was far from impressive and did nothing to allay concerns about the US economy sinking towards a recession.
The highlights of Thursday's data schedule were a faster monthly pace of growth in the PCE price index, steady personal income expansion, and slower spending growth. Personal income was up 0.5% in May, right on expectations after a 0.5% gain in the previous month.
In other data, the Chicago PMI fell to 56.4 in June from 60.3 in May. Other manufacturing data already released have suggested slower growth or outright contraction. The ISM's national index will be released on Friday. Initial jobless claims decreased by 2,000 to 231,000 in the week ended June 25, but the four-week moving average rose by 7,250 to 231,750, continuing the string of gains.
The euro recovered on Thursday from a two-week low against the dollar, which sputtered after fresh inflation data showed US consumer spending rose less than expected in May. EUR/USD hit a high of 1.0488 and closed the North American session within that vicinity after reversing a decline sparked by increasing recession jitters in the eurozone and the energy crisis stoked by the war in Ukraine. For the start of the quarter, traders are going to be looking at eurozone inflation figures due on Friday which could give some insight as to how aggressive the ECB might be in hiking rates.
The yen regathered below the 24-year peak of 137 vs. the dollar although the gap between a hawkish Federal Reserve and a dovish Bank of Japan continues to weigh heavily on the Japanese currency. USD/JPY fell to 135.55. The yen was down 15% against the US dollar for the first six months of 2022, which makes for the worst first-half of year performance for the currency since 2013.
Gold declined in its worst quarter since early 2021 and is back to test $1,800. In cryptocurrencies, bitcoin fell below the $20,000 milestone level and the US Securities and Exchange Commission rejected a proposal to list a spot bitcoin exchange-traded fund by digital asset manager Grayscale. Bitcoin last fell to $18,595 and is down some 58% in the first six months of 2022, its worst first-half of year showing ever. West Texas Intermediate (WTI) crude oil also dropped sharply as concerns of a recession.
- A soft US dollar boosts appetite for risk-sensitive currencies in the FX space, so the NZD rises.
- The US 10-year Treasury yield dips below the 3% threshold, undermining the greenback.
- US recession fears increased after GDP for the first quarter contracted -1.5%, while Atlanta’s Fed GDPNow projections for the Q2 lie at -1.0%.
Broad US dollar weakness bolstered the New Zealand dollar on Thursday after mixed US economic data was released, which did not change the sour mood surrounding the financial markets since the beginning of the week. At 0.6247, the NZD/USD climbs nearly 0.50% during the North American session at the time of writing.
The greenback dipped on lower inflation expectations and falling US Treasury yields
As mentioned above, a soft US dollar is the main reason for the NZD/USD gains. The fall in US Treasury yields and lower US inflation expectations, as shown by the five and 10-year FRED Breakevens, undermined the greenback. Investors are backpedaling an aggressive Fed, and as illustrated by STIRs money market futures, traders expect the Federal funds rate to end at around 3.50% in twelve months.
Sentiment-wise, increased fears that the US could hit a recession were exacerbated by a weaker than expected consumer spending in May, alongside the Atlanta Fed’s GDPNow for the Q2, which plunged to -1.0%. Meanwhile, Wall Street is about to finish the first half of 2022 with substantial losses. The US Dollar Index, a gauge of the buck’s value, retreated from weekly highs near 105.541 and slid 0.35% down to 104.733.
On Thursday, US economic data was released. The US Bureau of Economic Analysis reported the PersonaLConsumption Expenditure (PCE) Price Index for May, which climbed by 6.3% YoY, less than estimations, while core PCE, the Fed’s favorite reading for inflation, heightened by 4.7% YoY, lower than expected.
At the same time, the US Department of Labour released the Initial Jobless Claims for the week ending on June 25, which topped above the 228K expected, and rose by 231K.
In the meantime, the Federal Reserve chair Jerome Powell crossed wires. He said policymakers’ job is to find price stability, even during the new forces of inflation, while adding that the US economy is solid and can withstand monetary policy adjustments.
The New Zealand economic calendar will feature the ANZ Roy Morgan Consumer Confidence for June is expected at 8, alongside the New Zealand Building Permits for May. On the US front, the calendar will reveal the S&P Global Manufacturing PMIs alongside the ISM Manufacturing PMI.
NZD/USD Key Technical Levels
- Gold bears are putting pressure on the bulls at a critical area on the daily chart.
- Gold prices are under pressure despite rising recession odds.
At $1,806, the gold price is lower by some 0.66% after falling from a high of $ $1,825.21 to a session low of $1,802.77, breaking out of its consolidation range. Traders have moved out of the yellow metal even as stocks, the dollar and bond yields fell.
The drop came even as investors moved out of equities, with the S&P 500 Index last seen down 1.25% on what has been a mixed week in sentiment and data. The highlights of Thursday's data schedule were a faster monthly pace of growth in the PCE price index, steady personal income expansion, and slower spending growth. Personal income was up 0.5% in May, right on expectations after a 0.5% gain in the previous month.
After an adjustment for a 0.6% increase in the PCE price index, real personal consumption was down 0.4% in May after a 0.3% increase in April. Core PCE prices rose by 0.3% for the fourth straight month, slowing the year-over-year rate to 4.7% from 4.9% in the previous month. Gold briefly bounced after the US data but quickly moved back into the tight range it has been in for the past few sessions.
In other data, the Chicago PMI fell to 56.4 in June from 60.3 in May. Other manufacturing data already released have suggested slower growth or outright contraction. The ISM's national index will be released on Friday. Initial jobless claims decreased by 2,000 to 231,000 in the week ended June 25, but the four-week moving average rose by 7,250 to 231,750, continuing the string of gains.
Meanwhile, the US dollar also fell, making gold more affordable for international buyers, with the DXY dropping to 104.645 the low of the day so far. US bond yields fell sharply, which is offering a lifeline to the precious metal since it pays no interest. The yield on the US 10-year note was last seen down at 2.980%, near its three-week low made earlier at 2.97%
''Gold prices are under pressure despite rising recession odds, in contrast to recent price action pointing to safe-haven flows supporting the yellow metal,'' analysts at TD Securities said.
''In fact, gold prices have disconnected altogether from market pricing for Fed hikes over the past month, and have instead grown their relationship with the USD, pointing to a smaller magnitude of idiosyncratic flows for the yellow metal.
''While the bias remains to the downside in gold, participants will need a catalyst to shake out the complacent longs in precious metals.''
Gold technical analysis
The bears have moved in on a critical area that could be broken that will give way to the potential of a deeper run towards $1,720.
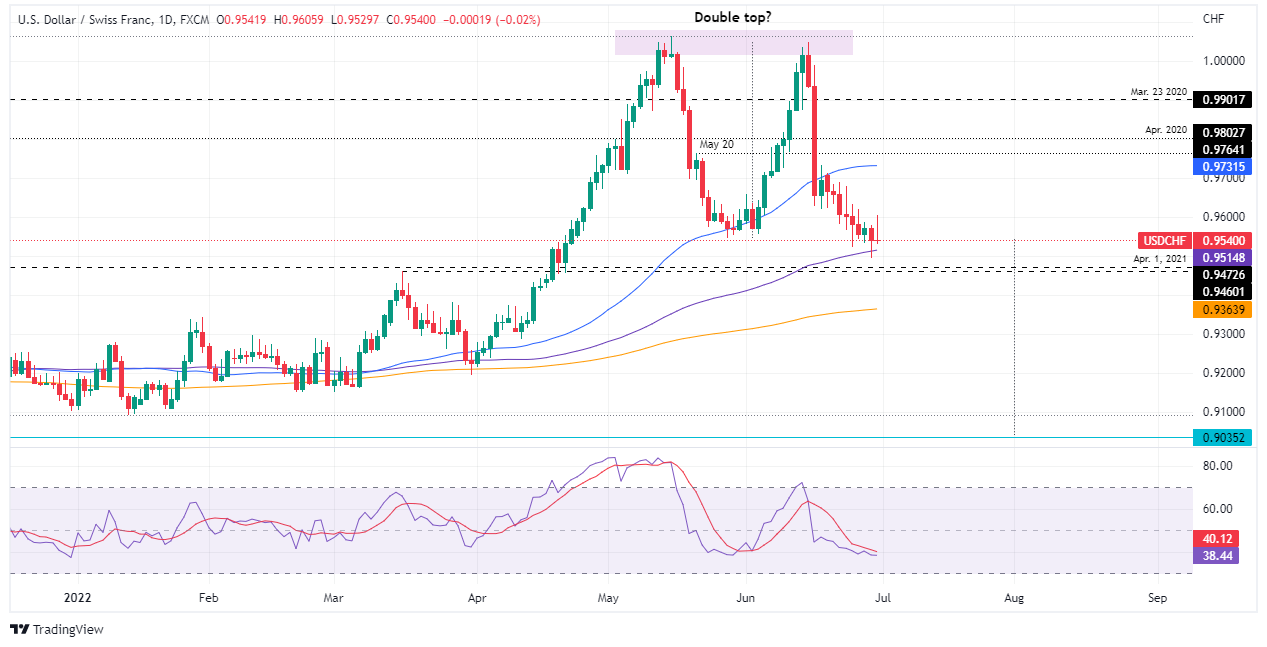
- The USD/CHF daily chart illustrates a double top formation, but solid buying pressure below 0.9540s capped any downward moves.
- Risk-off impulse bolstered the appetite for the Swiss franc and weighed on the US dollar.
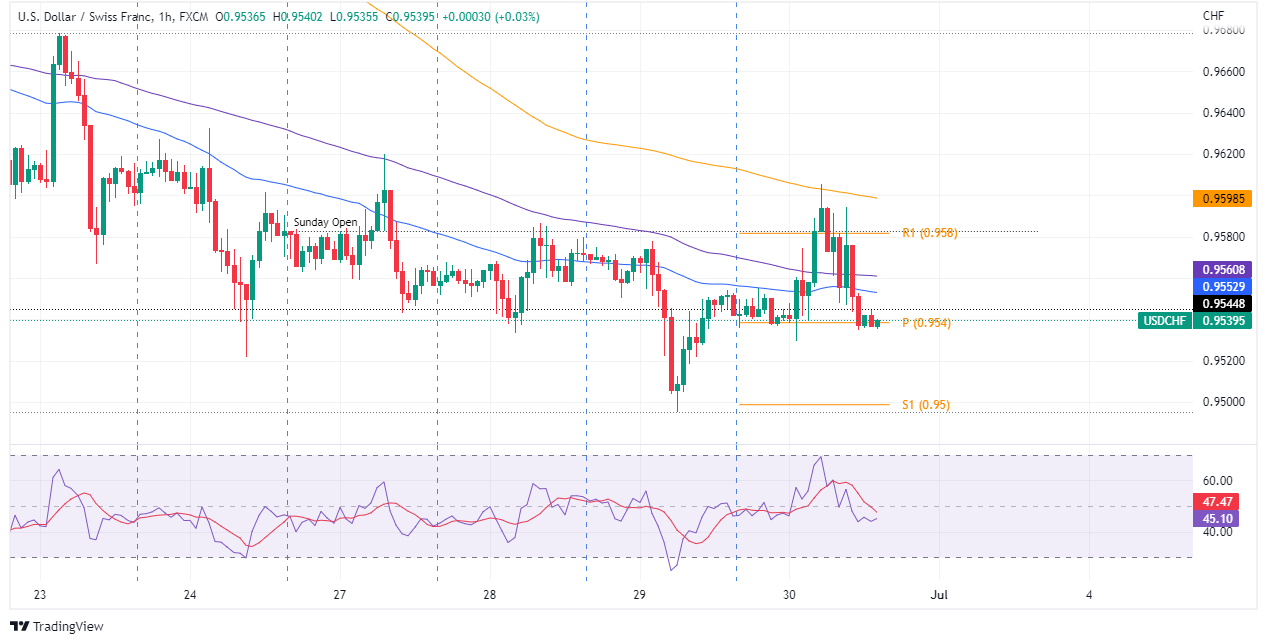
- USD/CHF 1-hour chart is tilted to the upside, but unless buyers reclaim 0.9600, the major is vulnerable to selling pressure.
The USD/CHF retreats from the 0.9600 figure after an earlier USD rally that faltered to break above the former figure, and so far has retraced just above the 100-day moving average (DMA), which lies near 0.9514. At the time of writing, the USD/CHF is trading at 0.9540 in the North American session.
Sentiment is still dismal due to renewed fears that high inflation and a global economic slowdown are a stagflation scenario. US equities are under pressure for their worst percentage fall since the 1970s, while the US Dollar turned negative and remains below the 105.000 figure, losing 0.38%.
That said, the USD/CHF seesawed around the 0.9546-0.9594 on mixed US economic data, followed by a drop towards Thursday’s central daily pivot point at 0.9540, a level where the major settled in.
USD/CHF Daily chart
The double top in the USD/CHF daily chart is still in play, though USD/CHF sellers are struggling to achieve a decisive break below the May 27 daily low at 0.9544. USD/CHF traders should be aware that the 100-DMA is meandering around that price level, though some 15 pips above the 0.9500 figure. A decisive break would send the major to probe the 100-DMA, followed by 0.9500, and then the March 16 high at 0.9460.
USD/CHF 1-Hour chart
The USD/CHF, hourly time frame depicts the pair as consolidating but slightly tilted to the upside. The weekly low recorded Wednesday, around 0.9495, propelled the major upwards. However, the confluence of the 50 and 100-simple moving averages (SMAs) around 0.9553-61 capped the pair upside after the major dropped on mixed US data. Break below 0.9529 would send the USD/CHF towards 0.9495; otherwise, the major would be vulnerable to buying pressure. In that scenario, if USD/CHF buyers reclaim the 200-SMA at 0.9599, that would clear the way for further gains.
USD/CHF Key Technical Levels
- USD/CAD is under pressure as the US dollar slides from recent highs.
- The price of oil, one of Canada's major exports, fell sharply, but hawkish BoC eyed.
USD/CAD is trading at 1.2868 and is off by some 0.2% after falling from a high of 1.2933 to a low of 1.2861 and is on track for a steep quarterly decline. On Thursday, the US fell from a two-week high against a basket of peers, with the index last down 0.38% at 104.70.
Both stocks and the US dollar came under pressure and data showed that Chicago-area business activity fell more than expected in June, according to data released Thursday. The Chicago Business Barometer slid to 56.4 this month from May's reading of 60.3, according to the Institute for Supply Management and Market News International. The consensus on Econoday was for a print of 58.4. Investors worry that the latest show of central bank determination to tame inflation will cause economies to slow rapidly.
Domestically, Canada's economy likely declined 0.2% in May, following a gain of 0.3% in April which matched estimates. This leaves the Bank of Canada on track to hike interest rates by three-quarters of a percentage point at its next policy decision on July 13, which would be its biggest hike in 24 years.
Meanwhile, the price of oil one of Canada's major exports fell sharply on Thursday on recession worries and signs US gasoline demand may be easing amid high prices. WTI crude oil for August delivery closed down US$4.02 to settle at US$105.76 per barrel, Marketwatch reported. August Brent crude, the global benchmark, was down US$1.44 to US$114.82, while Western Canada Select was down US$3.86 to US$87.63 per barrel.
The slide comes after the Energy Information Administration on Wednesday reported US oil inventories fell more than expected last week. However, price action still isn't pointing to demand-side constraints, given the still-extremely elevated crack spreads suggest that demand for crude oil will remain elevated nonetheless, analysts at TD Securities argued. ''Product inventories are at critically low levels, which also suggests restocking will keep crude oil demand strong.''
According to analysts at Wells Fargo, the mix of measured monetary tightening and rapid inflation, combined with the slowdown in UK economy, provides an underwhelming backdrop for the pound. They revised their forecast for the GBP/USD lower and now see it around 1.1700 in mid-2023.
Key Quotes:
“We expect the U.K. central bank to begin lowering its policy interest rate during the second half of 2023, by a cumulative 50 bps to 1.50% by the end of next year.”
“Overall, this mix of gradual monetary tightening and rapid inflation (meaning that real U.K. policy interest rates will remain substantially in negative territory), combined with a U.K. economic downturn, provides an underwhelming backdrop for the U.K. currency. We have revised our forecast for the pound lower, and now see a trough in the GBP/USD exchange rate around $1.1700 in mid-2023.”
“Even as the U.S. economy falls into its own recession and the Fed begins to lower interest rates by late next year, we believe that headwinds facing the U.K. economy will mean only a modest rebound for the pound, and we target a GBP/USD exchange rate of $1.1900 by the end of 2023.”
Data released on Thursday showed Canada’s Real GDP rose 0.3% in April on a monthly basis in line with market consensus. Analysts at CIBC point out the Canadian economy is slowing down but not in a way that suggests inflation will do the same.
Key Quotes:
“Growth in the Canadian economy is cooling, but not entirely in a way that will convince policymakers that inflation will do the same. Monthly GDP increased by 0.3% in April (in line with the consensus forecast), but advance data for May points to a decline of 0.2% during that month. However, declines in mining, oil & gas and manufacturing suggest that the monthly drop in May was at least partly due to supply issues rather than slowing demand, which could add to, rather than subtract from, current inflationary pressures.”
“For Q2 as a whole, GDP appears to be tracking just below a 4% annualized pace, compared to the 6% rate the Bank of Canada had forecast in its April MPR. However, other than perhaps a quicker retreat in housing activity, the slower than projected growth appears to be due to supply rather than demand side factors. As a result, it will do little to ease the Bank of Canada's concerns regarding current inflationary pressures. A slowing in other elements of domestic demand, including in retail sales and consumer-facing services, is expected to show up more during the second half of the year, with households currently able to use the excess savings put aside during the pandemic to cushion the blow of high inflation and interest rate increases.”
- The AUD/USD grinds higher despite a dampened market mood on a weaker greenback.
- Fed’s favorite gauge of inflation eases, but also consumer spending takes a hit, could the US economy support higher rates?
- Atlanta Fed’s GDPNow for the Q2 plunges towards -1.0%.
- AUD/USD Price Forecast: Seesawing around 0.6850-0.6950 as the pair consolidates in that area.
AUD/USD stages a recovery after plunging to fresh two-week lows around 0.6850s, reclaiming the 0.6900 figure, nearly gaining 0.60% on Thursday, after US inflation shows some signs of topping. At the time of writing, the AUD/USD trades at 0.6910 during the North American session.
A risk-off mood struck the financial markets on the last day of the first half of 2022. US equities extend their losses, and the greenback is falling, as shown by the US Dollar Index slumping 0.39%. Meanwhile, the US 10-year Treasury yield nosedives below the 3% threshold as recession fears increase, as illustrated by the Atlanta Fed’s GDPNow for the Q2 plunges towards -1.0%.
US inflation shows signs of easing; consumer spending falls
The US calendar reported inflation figures, which showed that it is slowing down. The Personal Consumption Expenditure (PCE) Price Index for May climbed by 6.3% YoY, less than foreseen, while core PCE, the Fed’s favorite reading for inflation, heightened by 4.7% YoY, lower than estimated, the US Bureau of Economic Analysis reported. Albeit a good sign for the US economy, the same report highlighted that American consumers spent less in May, for the first time in 2022, and previous numbers were downward revised, indicating that the economy is not as strong as thought.
At the same time, the US Department of Labour released the Initial Jobless Claims for the week ending on June 25, which topped above the 228K expected, and rose by 231K.
In the meantime, the Federal Reserve chair Jerome Powell crossed wires. He said policymakers’ job is to find price stability, even during the new forces of inflation, while adding that the US economy is solid and can withstand monetary policy adjustments.
Australia’s economic docket will feature the S&P Global Manufacturing PMI for June. Across the pond, the US docket will reveal S&P Global Manufacturing PMIs alongside the ISM Manufacturing PMI.
AUD/USD Price Forecast: Technical outlook
The AUD/USD remains in a downtrend, though slightly consolidating n the 0.6850-0.6950 range. Further confirmation of the previously-mentioned is the location and slope of the Relative Strength Index (RSI), albeit, at negative readings, it is almost horizontal. Nevertheless, the major’s price action on Thursday is rising sharply, and a break above the June 30 high at 0.6920 might open the door for further gains, but solid resistance near 0.7000 will be challenging to overcome. Contrarily, a continuation to the downside is in play, though it would accelerate once sellers reclaim 0.6850, which will send the pair tumbling towards the YTD low near 0.6828, followed by 0.6800.
- The greenback makes a U-turn and begins to weaken; after the London Fix, the pound recovers.
- Stagflation fears keep investors’ flows going through safe-haven assets, except the US dollar.
- GBP/USD Price Forecast: Range-bound, but a break above 1.2212 might open the door for further upside; otherwise, a re-test of YTD lows is on the cards.
The British pound recovered from two-week lows and is advancing just above 1.2150, after sliding below the 1.2000 mark, for the first time since mid-June, when the GBP/USD collapsed towards 1.1933 YTD lows. At 1.2176, the GBP/USD records solid gains, as the year’s first half is near to end.
Half/quarter/month-end flows finished; consequently, the buck drops
The market mood remains negative, though it was not an excuse for the pound to recover some ground. US equities are tumbling, and US Treasury yields followed suit, boosting the GBP/USD upside. In the meantime, the US Dollar Index, a measure of the greenback’s performance vs. six peers, after reaching a weekly high at around 105.541, dives 0.34%, sitting at 104.736, undermined by the fall in US bond yields.
Worries about a global recession and stagnation scenario keep investors on their toes. On Thursday, US inflation showed some signs of slowing down, as the US Bureau of Economic Analysis reported. The US Personal Consumption Expenditure (PCE) Index for May, rose 6.3% YoY, lower than expected. The so-called core PCE, the Fed’s preferred gauge of inflation, downtick from 4.8% YoY foreseen to 4.7%.
At the same time, the US Department of Labour released the Initial Jobless Claims for the week ending on June 25, which topped above the 228K expected, and rose by 231K.
In the meantime, the Federal Reserve chair Jerome Powell crossed wires. He said policymakers’ job is to find price stability, even during the new forces of inflation, while adding that the US economy is solid and can withstand monetary policy adjustments.
In the same event hosted by the ECB, the Bank of England Governor Andrew said the pound was “one of the many influences on inflation” and added that he was not surprised by its recent weakness. Bailey acknowledged that the UK’s economy is weakening sooner and somewhat more than other counterparties.
The UK economic calendar will feature June’s S&P Global/CIPS Manufacturing PMI readings in the week ahead. Across the pond, the US docket will reveal S&P Global Manufacturing PMIs alongside the ISM Manufacturing PMI.
GBP/USD Price Forecast: Technical outlook
From a technical perspective, the GBP/USD is still downward biased, but sellers unable to re-test the YTD lows, near 1.1933, has opened the door for further gains. If the GBP/USD breaks above the June 29 high at 1.2212, that will pave the way for a rally to the 20-day EMA at 1.2293. Otherwise, the major will consolidate until GBP sellers can drag the pound towards the YTD lows near the 1.1930s.
Data released on Thursday, showed real consumer spending fell 0.4% in May while April’s numbers were revised lower. Today's details on monthly spending figures show a much weaker profile for spending in the first five months of the year and sets the scenario for a weaker growth in the second quarter than the data would have suggested just 48 hours ago, explained analysts at Wells Fargo.
Key Quotes:
“Yesterday's GDP revisions that lowered estimates for first quarter consumer spending was just a jab; today's May personal income and spending report was the uppercut. Real consumer spending dropped 0.4% in May and prior monthly spending figures were revised lower. At least inflation did not get materially worse; the headline PCE deflator rose less than expected to 6.35%.”
“There is not much that is good about today's report, but something that is at least “less bad” is that the PCE deflator rose “just” 0.6% in May which only marginally lifted the year-over-year rate of inflation to 6.35% from 6.29% previously.”
“With the third estimate of first-quarter GDP, which revised real personal consumption expenditures (PCE) lower to reflect a 1.8% annualized pace of growth, and this sharp decline in May, estimates for second quarter PCE growth will likely be coming down. Even so, our overall expectations for consumer spending have not materially changed. We continue to expect consumers will increasingly rely on their balance sheets to fund spending in the near term despite persistently higher inflation.”
- USD/MXN turns negative, after hitting weekly highs near 20.30.
- A recovery in market sentiment helped the Mexican peso during the American session.
- A consolidation above 20.20 is likely to trigger more gains.
Emerging market currencies recovered ground during the American session from multi-day lows. They remain under pressure affected by the sharp decline in global stocks. The negative growth outlook and monetary tightening from the Fed weigh on currencies like the Mexican peso.
The USD/MXN peaked on Thursday at 20.26, the highest level in a week. Later as stocks recovered, pulled back erasing gains. Despite moving off highs, the outlook is biased to the upside. At the first attempt, the dollar was rejected from above 20.20. If it posts a daily close above it could rise further to the next resistance at 20.45. The 20.20 area is reinforced by the 100-day Simple Moving Average.
While under 20.20, some consolidation between 20.20 and 20.00 seems likely before the next directional move. A decline back to 20.00 should be seen as a normal correction after the rally from 19.80 to 20.20.
A decline under 20.00 and below the 20-day SMA should strengthen the Mexican peso, favoring an extension toward the weekly low at 19.81. The key support below is the 19.70 area that if reached, could likely trigger a rebound.
USD/MXN daily chart
-637922014430807648.png)
According to the Federal Reserve Bank of Atlanta's GDPNow model, the US economy is expected to contract by 1% in the second quarter, down from the June 27 forecast of +0.3%.
"After recent releases from the US Bureau of Economic Analysis and the US Census Bureau, the nowcasts of second-quarter real personal consumption expenditures growth and real gross private domestic investment growth decreased from 2.7% and -8.1%, respectively, to 1.7% and -13.2%, respectively, while the nowcast of the contribution of the change in real net exports to second-quarter GDP growth increased from -0.11 percentage points to 0.35 percentage points," Atlanta Fed explained in its publication.
Market reaction
The US Dollar Index showed no immediate reaction to this report and was last seen losing 0.27% on the day at 104.81.
- On a volatile session, gold reaffirms bearish bias.
- Gold falls sharply even as US yields move lower.
- XAU/USD testing $1805, below attention would turn to the YTD low at $1785.
- Gold is back below 1810$, under pressure and looking vulnerable to the downside. The price hit earlier a one-month low at $1802 and then spiked to $1825. The recovery was short-lived as gold resume the decline falling below 1810$.
XAU/USD is testing the $1805 area, and a consolidation below would expose $1800. Below that area, a test of the year-to-date low at $1786 seems likely.
On the upside, if gold manages to remain above $1820 it could alleviate the bearish pressure. A key level is seen currently at $1831, a short-term downtrend line that if broken, should open the doors to the weekly high at $1841 and to $1848 (June 22 high).
Volatile session between lower yields and risk aversion
The demand for Treasuries rose amid risk aversion. The US 10-year yield dropped to 3.00% and the 30-year fell to 3.12%, the lowest level in weeks. The decline in yields supports gold but at the same time, risk aversion is pushing commodity prices to the downside and the dollar higher.
In Wall Street, the Dow Jones is falling 0.87% and the Nasdaq 1.15%, both indexes off lows. Crude oil tumbles 2.70%.
Technical levels
- Risk-off impulse dominates the last trading day of June, boosting safe-haven peers.
- The USD/JPY falls from 137.00 below the 136.00 mark, weighted by the drop in US Treasury yields.
- The US Federal Reserve’s favorite inflation gauge, the core PCE came lower than the previous reading, signaling the effects of higher rates begin to feel.
The USD/JPY slides on Thursday, following a lower-than-expected inflation report, which could deter the US Federal Reserve from tightening at a faster pace amidst odds increasing of recession, keeping investors uneasy. At 135.85, the USD/JPY retreats from daily highs shy of 137.00, back below the 136.00 mark.
Negative sentiment and falling yields, a headwind for the USD/JPY
Risk aversion dominates the markets, as half/quarter/month-end flows bolstered the greenback. US equities remain heavy; the greenback rises shown by the US Dollar Index up by 0.04%, at 105.135, while US Treasury yields drop, led by the 10-year T-note rate at 3.00%, diving nine bps.
Besides that, fears of a recession as global growth stagnated, alongside high inflation, spurred a flight to safe-haven. Particularly in the USD/JPY, the yen remains bid, boosted by the fall in US Treasury yields, weighed by falling US inflation expectations, as illustrated by the five and 10-year break-even inflation rates, easing from YTD highs around 3.59% and 3.02% each, down to 2.59% and 2.36%, respectively.
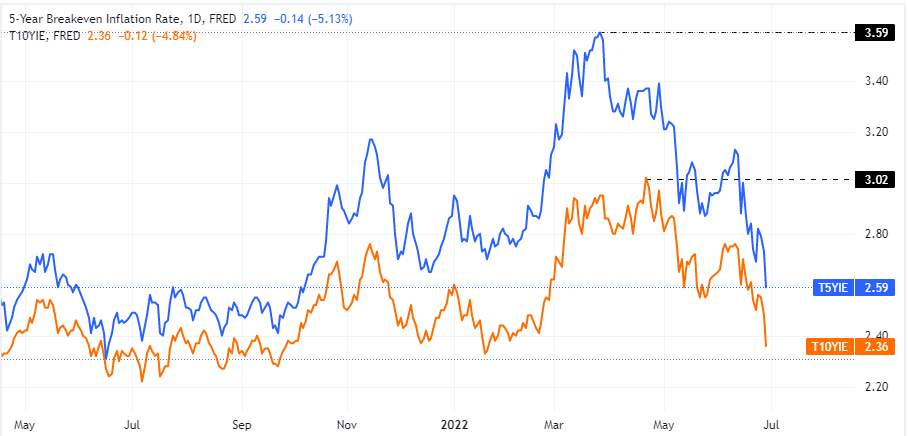
Source: Tradingview/St. Louis FRED
In the meantime, US inflation, as measured by the Personal Consumption Expenditure (PCE), rose by 6.3% YoY, unchanged in May, the US Bureau of Economic Analysis reported. Meanwhile, the Fed’s favorite gauge of inflation, the core PCE, which excludes volatile items, grew 4.7%, YoY, lower than the 4.9% in April.
On the Japanese front, the docket revealed Industrial Production, which shrank faster than expected -1.3% MoM to -7.2%. Annually based, recovered some ground but stayed negatively at -2.8%, from a previous reading at -4.9%.
USD/JPY Key Technical Levels
Following its meeting on Thursday, OPEC+ announced on Thursday that it will stick to its plan of increasing oil output by 648,000 barrels per day (bpd) in August, as reported by Reuters. The group refrained from discussing the output strategy from September.
Meanwhile, Russian Deputy Prime Minister Alexander Novak said that the next meeting is planned to take place early August.
Market reaction
Crude oil prices continued to fall following this development. As of writing, the barrel of West Texas Intermediate (WTI) was trading at $105.90, losing 3.4% on a daily basis.
- Silver lost ground for the fourth straight day and dropped to a nearly two-year low on Thursday.
- Spot prices managed to find some support near the lower end of a downward sloping channel.
- The set-up still favours bearish traders and supports prospects for a further depreciating move.
Silver witnessed selling for the fourth successive day on Thursday and dived to a nearly two-year low, around the $20.30 region during the early North American session.
The downward trajectory, however, stalled near the lower boundary of a downward sloping trend channel extending from the beginning of this month. The XAG/USD did attempt a minor recovery from the said support, though lacked any follow-through beyond the $20.70-$20.75 region.
Given the recent repeated failures to find acceptance above the 200-period SMA on the 4-hour chart, the descending channel supports prospects for further losses. The negative outlook is reinforced by bearish oscillators, which are still far from being in the oversold territory.
That said, bearish traders are likely to wait for a convincing break through the trend-channel support before placing fresh bets. The XAG/USD might then turn vulnerable to weaken further below the $20.00 psychological mark and test the next relevant support near the $19.60-$19.55 area.
On the flip side, any meaningful bounce could be seen as a selling opportunity and remain capped near the $21.00 mark. The said handle should act as a key pivotal point, which if cleared decisively might trigger a short-covering rally and lift the XAG/USD towards the $21.50 supply zone.
The latter marks a confluence barrier, comprising the top end of the ascending channel and the 200-period SMA on the 4-hour chart. Sustained strength beyond would negate any near-term negative bias and pave the way for some meaningful near-term upside for the XAG/USD.
Silver 4-hour chart
-637921939354828923.png)
Key levels to watch
- USD/TRY leaves behind Wednesday’s advance and tests 16.70.
- Türkiye trade deficit widened to TL10.61B.
- Focus now shifts to Monday’s CPI release.
The Turkish lira sheds some ground and pushes USD/TRY to the area of 3-day peaks around 16.70 on Thursday.
USD/TRY appears supported near 16.00
USD/TRY extends the choppy trade so far and regains ground lost following Wednesday’s pullback, aiming once again for the upper-16.00s amidst the persistent upside momentum in the greenback as well as the increasing risk-off mood.
The lira continues to give away part of Monday’s strong gains, which saw the pair slip back to the 16.00 neighbourhood in response to the Turkish banking watchdog’s announcement to ban commercial loans denominated in lira for companies with a strong position in foreign currency (on Friday).
In the domestic calendar, the trade deficit widened to TL10.61B in May (from TL6.11B).
Next on the docket will be the release of key inflation figures for the month of June, due on July 4.
What to look for around TRY
USD/TRY keeps digesting the recent sharp decline and subsequent rebound following Friday’s announcement by the Turkish banking watchdog.
So far, price action in the Turkish currency is expected to gyrate around the performance of energy prices, the broad risk appetite trends, the Fed’s rate path and the developments from the war in Ukraine, although the effects of this new measure aimed at supporting the de-dolarization of the economy will also have its say.
Extra risks facing TRY also come from the domestic backyard, as inflation gives no signs of abating, real interest rates remain entrenched in negative figures and the political pressure to keep the CBRT biased towards low interest rates remain omnipresent.
Key events in Türkiye this week: Trade Balance (Thursday) – Manufacturing PMI (Friday).
Eminent issues on the back boiler: FX intervention by the CBRT. Progress (or lack of it) of the government’s new scheme oriented to support the lira via protected time deposits. Constant government pressure on the CBRT vs. bank’s credibility/independence. Bouts of geopolitical concerns. Structural reforms. Upcoming Presidential/Parliamentary elections.
USD/TRY key levels
So far, the pair is gaining 0.67% at 16.6867 and faces the immediate target at 17.3759 (2022 high June 23) seconded by 18.2582 (all-time high December 20) and then 19.00 (round level). On the other hand, a breach of 16.0365 (monthly low June 27) would pave the way for a test of 15.6684 (low May 23) and finally 15.2373 (100-day SMA).
The money market has pared back expectations regarding the extent of European Central Bank (ECB) rate rises. Therefore, the outlook for the euro has worsened. Economists at Rabobank still expect the EUR/USD pair to test 2022’s low at the 1.1350 area.
Window of opportunity for ECB rate hikes could be narrow
“On the back of risks to gas supply over the winter, we expect the Eurozone to fall into recession in late 2022/early 2023. Not only does this suggest that the window of opportunity for ECB rate hikes could be narrow but, even more worrying for EUR bulls, this suggests the worries regarding fragmentation in Europe are likely to be enhanced.”
“We continue to see scope for a dip back to the year’s low in the EUR/USD 1.035 area on a one to three-month view.”
Economists at Danske Bank expect Brent Oil prices to ease moderately towards 2023. However, the black gold is set to remain elevated in the near-term.
Tight supply supports spot despite rising growth risks
“While looming demand slowdown points towards easing commodity prices in 2023, the limited spare capacity in global markets could support the current steep backwardation and high spot prices in the near-term.”
“We continue to forecast Brent Oil at $120/bbl in Q3, $100/bbl in Q4 and $95/bbl in 2023.”
“Potential outcome space remains very wide amid mixed drivers affecting both global demand and supply outlooks.”
Economists at TD Securities expect the GBP/USD pair to continue its downfall. Although the Bank of England (BoE) could offer some support, cable is set to break under 1.20 in the near-term.
GBP vulnerable on the crosses
“The near-term GBP trajectory is biased to the downside, even though it maintains a pretty heft discount.”
“The BoE plus fiscal support may help to put a floor in cable but not before a near-term break below 1.20. Still, BoE pricing seems too aggressive relative to our forecast, leaving GBP vulnerable on the crosses.”
The EUR/USD slide is set to continue. Economists at Scotiabank expect the pair to retest the 1.04-1.0350 support zone.
Intraday trends look soft
“The EUR has failed to break through the low 1.06 area three times since mid-month, leaving markets little technical choice but to retest the 1.04-1.0350 support zone for the EUR.”
“Intraday trends look soft, with the EUR unable to reverse any of Wednesday’s losses.”
“We spot resistance at 1.0450 and 75.”
“Support is 1.0400 and 1.0350/60.”
USD/CAD is extending Tuesday’s sharp squeeze higher from the 1.2820 area. Economists at Scotiabank note that the pair could reach the 1.30 level on a break past 1.2950.
USD gains unlikely to extend much above the 1.30 area
“Gains through the 20s target intraday strength to 1.2950 and, above here, spot would have a free run at 1.30+ again. We still see limited scope for USD gains to extend much above the 1.30 area, however.”
“Intraday support is 1.2865 and 1.2820.”
Economists at TD Securities expect another push lower in the EUR/USD targeting a level around 1.03. However, the pair is set to rebound later in the year.
Lower oil would benefit the euro
“The EUR's near-term outlook remains challenging, reflecting, in part, the sluggish backdrop for risk sentiment.”
“The wall of worry around European and global growth risks remains elevated, while China is only starting to emerge from its growth slumber.”
“Oil prices are another key factor to watch in the months ahead, where lower oil would benefit EUR.”
“We expect EUR/USD to hold the 1.03/1.07 range before pushing higher in H2.”
Gold trades with a mild negative bias for the fourth successive day on Thursday. Despite increasing recession fears, the yellow metal is set to remain under downside pressure, economists at TD Securities report.
Liquidity is being sapped from global markets
“Gold prices are under pressure despite rising recession odds, in contrast to recent price action pointing to safe-haven flows supporting the yellow metal.”
“Gold prices have disconnected altogether from market pricing for Fed hikes over the past month, and have instead grown their relationship with the USD, pointing to a smaller magnitude of idiosyncratic flows for the yellow metal.”
“Liquidity is being sapped from global markets, and gold flows have not been spared.”
The European Central Bank (ECB) will divide eurozone countries as donors, recipients and neutrals for the reinvestment of the Pandemic Emergency Purchase (PEPP) Programme proceeds, Reuters reported on Thursday, citing sources familiar with the matter.
The list of recipients will reportedly include Italy, Spain, Portugal and Greece while Germany, France and Netherlands will be among the donors.
ECB is said to review these lists monthly, focusing on the size and the speed of the bond-spread moves.
Market reaction
EUR/USD recovered modestly from two-week lows in the last hour and was last seen losing 0.22% on the day at 1.0417.
USD/CAD remains in a range. Economists at TD Securities expect the pair to continue trading within 1.27 and 1.31.
BoC rate hikes start to rattle the housing market
“USD/CAD should continue to maintain the 1.27/1.31 range in the short-term. The bias, though, remains to the upside, especially as BoC rate hikes start to rattle the housing market and risk appetite remains shaky.”
“We also downplay the importance of the oil factor given limited longer-term investment implications.”
“While the consensus view around USD/CAD seems less varied than other pairs, we're generally more bearish CAD in the months ahead.”
- Gold staged a solid recovery from the $1,800 neighbourhood or its lowest level since May 16.
- Softer US PCE inflation data led to a modest USD pullback and extended support to the metal.
- Sliding US bond yields, growing recession fears further benefitted the safe-haven commodity.
- The prospects for faster Fed rate hikes held back bulls from placing fresh bets and capped gains.
Gold witnessed a dramatic turnaround during the early European session and rallied over $20 from the vicinity of the $1,800 mark or the lowest level since May 16. The momentum pushed spot prices to a fresh daily high, around the $1,825 region, though lacked follow-through buying.
Data released from the US showed that the Core Personal Consumption Expenditures (PCE) Price Index - the Fed's preferred inflation gauge - moderated to the 4.7% YoY rate in May from the 4.9% previous. Additional detail revealed that Personal Spending growth slowed significantly in May to just 0.2% during the reported month. The softer data, along with the ongoing decline in the US Treasury bond yields, forced the US dollar to trim a part of its intraday gains and offered some support to the dollar-denominated gold.
Apart from this, concerns that rapidly rising rates and tighter financial conditions would hurt global economic growth continued weighing on investors' sentiment and further benefitted the safe-haven gold. That said, the prospects for aggressive Fed rate hikes held back traders from placing fresh bullish bets around the non-yielding metal. In fact, Fed Chair Jerome Powell said on Wednesday that the US central bank remains focused on getting inflation under control and the market pricing is pretty close to the dot plot.
Even from a technical perspective, the recent repeated failures near the very important 200-day SMA support prospects for a further near-term depreciating move. That said, the emergence of some buying near the $1,800 mark warrants some caution. Nevertheless, the bias still seems tilted in favour of bearish traders and any subsequent move up might still be seen as a selling opportunity. This makes it prudent to wait for strong follow-through buying before confirming that gold price might have formed a near-term bottom.
Technical levels to watch
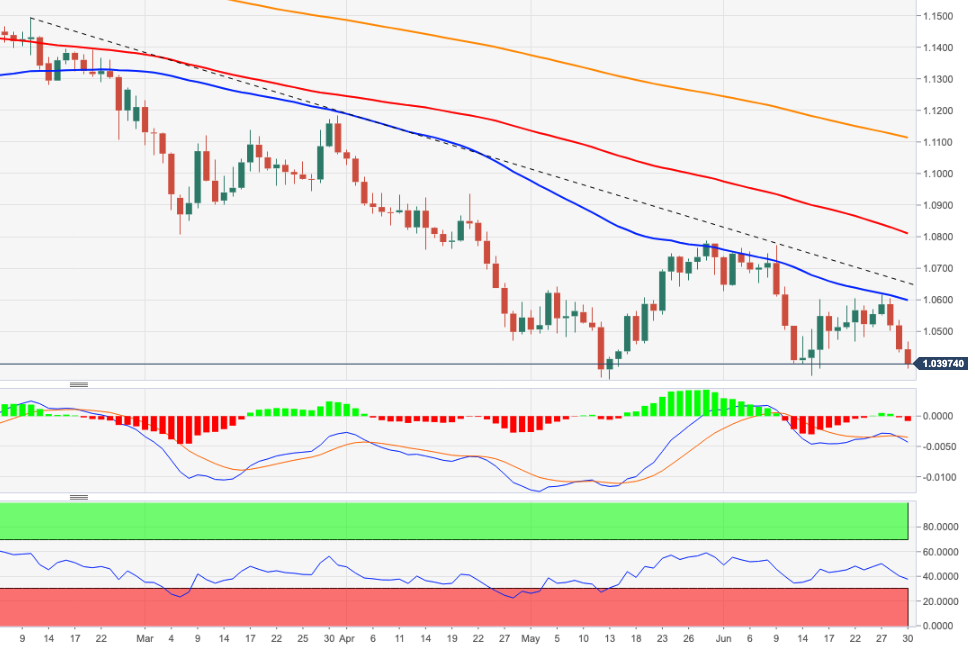
- EUR/USD remains offered and breaches 1.0400.
- Next on the downside comes the June low at 1.0358.
EUR/USD keeps the leg lower well in place so far this week and now breaks below the 1.0400 support to print new 2-week lows.
The inability to leave behind the 4-month line near 1.0640 should keep the downside pressure unchanged around the pair. That said, if the selling bias gathers further impulse, then another visit to the June low at 1.0358 (June 15) could start emerging on the horizon ahead of the 2022 low at 1.0348 (May 13).
In the longer run, the pair’s bearish view is expected to prevail as long as it trades below the 200-day SMA at 1.1112.
EUR/USD daily chart
- USD/CAD trimmed a part of its intraday gains amid modest USD pullback post-US PCE inflation data.
- The ongoing decline in crude oil prices undermined the loonie and continued lending some support.
- The backwards-looking monthly Canadian GDP report did little to provide any impetus to the major.
The USD/CAD pair quickly retreated a few pips from the weekly high post-US/Canadian macro data and was last seen trading around the 1.2900 mark during the early North American session.
The US Bureau of Economic Analysis reported that the Core Personal Consumption Expenditures (PCE) Price Index - the Fed's preferred inflation gauge - rose 0.3% MoM in May. This was slightly below the 0.4% anticipated and matched the previous month's reading. Furthermore, the yearly rate moderated in line with expectations, to 4.7% from 4.9% in April.
Additional details revealed that personal spending growth slowed notably to 0.2% in May and the previous month's reading was also revised down to 0.6% from 0.9% reported originally. The softer data, along with a further decline in the US Treasury bond yields, forced the US dollar to trim a part of its intraday gains and capped the USD/CAD pair.
The downside, however, remains cushioned amid the ongoing retracement slide in crude oil prices, which tend to undermine the commodity-linked loonie. The worsening global economic outlook, which could stall fuel demand recovery, and a rise in the US fuel stocks dragged crude oil prices further away from a one-and-half-week high touched the previous day.
This, to a larger extent, overshadowed mostly in-line monthly Canadian GDP report, showing that the economy expanded by 0.3% in April. This marked a sharp deceleration from the 0.7% growth recorded in the previous month. The backwards-looking data, however, did little to provide any meaningful impetus to the Canadian dollar or influence the USD/CAD pair.
Technical levels to watch
- Canadian economy expanded by 0.3% in April as expected.
- The USD/CAD pair retreated toward 1.2900 after this data.
Led by growth in goods-producing industries, the real Gross Domestic Product of Canada grew by 0.3% on a monthly basis in April, Statistics Canada reported on Thursday. This print followed March's expansion of 0.7% and came in line with the market expectation.
Market reaction
The USD/CAD pair, which touched a six-day high of 1.2933 earlier in the day, lost its traction after this data and was last seen posting small daily gains at 1.2906.
- Initial Jobless Claims declined by 2,000 in the week ending June 25.
- US Dollar Index clings to strong daily gains above 105.00.
There were 231,000 initial jobless claims in the week ending June 25, the weekly data published by the US Department of Labor (DOL) showed on Thursday. This print followed the previous week's print of 233,000 (revised from 229,000) and came in slightly higher than the market expectation of 228,000.
Further details of the publication revealed that the advance seasonally adjusted insured unemployment rate was 0.9% and the 4-week moving average was 231,750, an increase of 7,250 from the previous week's revised average.
"The advance number for seasonally adjusted insured unemployment during the week ending June 18 was 1,328,000, a decrease of 3,000 from the previous week's revised level," the DOL said.
Market reaction
These figures don't seem to be having a noticeable impact on the dollar's performance against its rivals. As of writing, the US Dollar Index was up 0.3% on the day at 105.40.
Inflation in the US, as measured by the Personal Consumption Expenditures (PCE) Price Index, stayed unchanged at 6.3% on a yearly basis in May, the US Bureau of Economic Analysis announced on Thursday.
The Core PCE Price Index, the Federal Reserve's preferred gauge of inflation, declined to 4.7% in the same period from 4.9% in April. This print came in line with the market expectation.
Further details of the publication revealed that Personal Income and Personal Spending rose by 0.5% and 0.2%, respectively, on a monthly basis in May.
Market reaction
The US Dollar Index edged slightly lower from session highs after this data but was last seen rising 0.2% on the day at 105.30.
- AUD/USD staged modest bounce, though struggled to find acceptance above the 0.6900 mark.
- Recession fears weighed on investors’ sentiment and undermined the perceived riskier aussie.
- The Fed’s hawkish outlook lifted the USD closer to a 20-year peak and favours bearish traders.
- Investors now look forward to the US Core PCE Inflation for May for a fresh directional impetus.
The AUD/USD pair struggled to capitalize on its modest intraday bounce from the vicinity of the monthly low and remained below the 0.6900 mark heading into the North American session.
Concerns that a more aggressive move by major central banks would pose challenges to global economic growth continued weighing on investor' sentiment. This was evident from a generally weaker tone around the equity markets, which provided a fresh lift to the safe-haven US dollar and acted as a headwind for the risk-sensitive aussie.
In fact, the USD shot closer to a two-decade high and was also underpinned by Fed Chair Jerome Powell's overnight hawkish remarks, reaffirming a faster policy tightening path. Speaking at the ECB's annual forum, Powell said that the Fed remains focused on getting inflation under control and the market pricing is pretty close to the dot plot.
Hence, the market focus will remain glued to the release of the Fed's preferred inflation gauge, the Core PCE Price Index. The data would influence the USD price dynamics and provide a fresh impetus to the AUD/USD pair. In the meantime, the USD bulls seemed rather unaffected by the ongoing decline in the US Treasury bond yields.
The fundamental backdrop supports prospects for an extension of the recent depreciating move for the AUD/USD pair, though bearish traders might wait for sustained weakness below the 0.6850 area. Spot prices might then aim to challenge the YTD low, around the 0.6830-0.6825 region touched in May, before eventually dropping to the 0.6800 mark.
Technical levels to watch
- DXY surpasses the 105.00 hurdle with certain conviction.
- The 2022 peak near 105.80 (June 15) comes next.
DXY advances for the third consecutive session and looks to consolidate the recent breakout of the 105.00 barrier on Thursday.
The index has rapidly left behind the weekly high near 105.00 (June 22) and in doing so it has opened the door to a relatively quick potential visit to the YTD highs around 105.80 (June 15).
As long as the 4-month line near 102.30 holds the downside, the near-term outlook for the index should remain constructive.
Looking at the longer run, the outlook for the dollar is seen bullish while above the 200-day SMA at 98.08.
DXY daily chart
- EUR/JPY extends the corrective downside below 142.00.
- Above 138.60, further gains in the cross are likely.
EUR/JPY drops for the third session in a row on Thursday, this time breaking below the key 142.00 support.
Despite the ongoing correction, the bullish bias in the cross remains well in place as long as the support line around 138.60 holds the downside. This area of contention is currently reinforced by the 55-day SMA.
The resumption of the upside bias could see the YTD top at 144.27 (June 28) returning to the radar ahead of the round level at 145.00 and prior to the 2015 high at 145.32 (January 2).
EUR/JPY daily chart
US PCE Price Index Overview
Thursday's US economic docket highlights the release of the Core Personal Consumption Expenditure (PCE) Price Index for May, scheduled later during the early North American session at 12:30 GMT. The Fed's preferred inflation gauge is expected to rise by 0.4% MoM during the reported month as compared to the 0.3% in April. The yearly rate, however, is anticipated to moderate to 4.7% in May from the 4.9% previous.
How Could it Affect EUR/USD?
Speaking at the ECB's forum on Wednesday, Fed Chair Jerome Powell reaffirmed a faster policy tightening path and said that the US central bank remains focused on getting inflation under control. Higher-than-expected PCE results will reinforce the Fed's hawkish policy outlook and provide a fresh lift to the US dollar. Conversely, the softer print would still be far above Fed’s official 2% target and is more likely to be overshadowed by growing recession fears. This, in turn, favours the USD bulls and suggests that the path of least resistance for the EUR/USD pair is to the downside.
Eren Sengezer, Editor at FXStreet, outlined important technical levels to trade EUR/USD: “The pair is facing immediate resistance at 1.0470 (Fibonacci 23.6% retracement of the latest downtrend). In case the pair fails to reclaim that level, it is likely to extend its slide toward 1.0400 (psychological level), 1.0380 (end-point of the latest downtrend) and 1.0360 (June 15 low).”
“On the upside, the pair could recover toward 1.0500 (psychological level) and 1.0520 (Fibonacci 38.2% retracement, 50-period SMA, 100-period SMA on the four-hour chart) if buyers managed to flip 1.0470 into support,” Eren added further.
Key Notes
• US PCE Inflation May Preview: Inflation becomes moot
• EUR/USD Forecast: Euro's recovery prospects diminish
• EUR/USD Price Analysis: Sees a downside below the crucial support of 1.0430
About the US PCE Price Index
The Personal Spending released by the Bureau of Economic Analysis, Department of Commerce is an indicator that measures the total expenditure by individuals. The level of spending can be used as an indicator of consumer optimism. It is also considered as a measure of economic growth: While Personal spending stimulates inflationary pressures, it could lead to raise interest rates. A high reading is positive (or Bullish) for the USD.
"The likelihood of gas rationing in Europe has increased significantly following the recent disruption of Russian natural gas supplies through the Nord Stream 1 pipeline," Fitch Ratings said in a report published on Thursday. "A technical recession in the eurozone is now an increasing possibility."
Market reaction
The shared currency stays under selling pressure on Thursday and the EUR/USD pair was last seen losing 0.3% on the day at 1.0408. Meanwhile, Euro Stoxx 600 Index is down more than 2%, pointing to a risk-averse market environment.
- USD/JPY witnessed some selling on Thursday and moved further away from a 24-year high.
- Recession fears, the risk-off mod benefitted the safe-haven JPY and exerted some pressure.
- Sliding US bond yields kept the USD bulls on the defensive and contributed to the selling bias.
- The Fed-BoJ policy divergence helped limit losses and supports prospects for some dip-buying.
The USD/JPY pair witnessed some selling on Thursday and snapped a four-day winning streak to its highest level since September 1998, around the 137.00 mark touched the previous day. The pair remained depressed through the first half of the European session, though showed resilience below the 136.00 mark and has now recovered a few pips from the daily low.
Investors remain concerned that rapidly rising interest rates and tighter financial conditions would pose challenges to global economic growth. This was evident from the prevalent risk-off mood and benefitted the safe-haven Japanese yen. The anti-risk flow, along with recession fears, dragged the US Treasury bond yields, which kept the US dollar bulls on the defensive and exerted downward pressure on the USD/JPY pair.
That said, the divergent policy stance adopted by the Fed and the Bank of Japan acted as a tailwind for spot prices. Speaking at the ECB's annual forum on Wednesday, Fed Chair Jerome Powell reaffirmed bets for more aggressive rate hikes and said that the US economy is well-positioned to handle tighter policy. Powell added that the Fed remains focused on getting inflation under control and the market pricing is pretty close to the dot plot.
In contrast, the BoJ has signalled that it would stick to its ultra-accommodative policy and reiterated its guidance to keep borrowing costs at "present or lower" levels. The Japanese central bank had also pledged to guide the 10-year yield to around 0% and intervene to keep rates from moving higher. This, in turn, helped limit any further losses and assisted the USD/JPY pair to rebound around 25-30 pips from the daily low.
Market participants now look forward to the US economic docket, featuring the Core PCE Price Index - the Fed's preferred inflation gauge - and the usual Weekly Initial Jobless Claims. Apart from this, the US bond yields, the USD price dynamics and the broader risk sentiment should provide some impetus to the USD/JPY pair. Nevertheless, the fundamental backdrop still seems tilted firmly in favour of bullish traders.
Technical levels to watch
- EUR/USD looks stuck in the 1.0430 region.
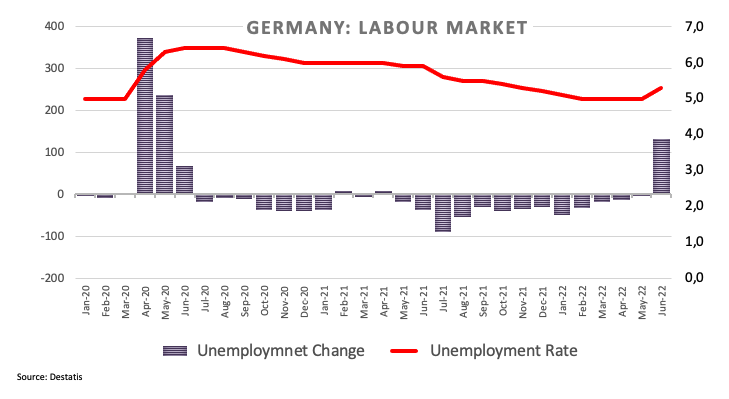
- Germany labour market report surprised to the downside.
- EMU jobless rate ticked lower to 6.6% in May.
The single currency remains under pressure and motivates EUR/USD to navigate in the lower end of the range around 1.0430 on Thursday.
EUR/USD looks to data, risk trends
EUR/USD remains offered and extend the leg lower after being rejected from the 1.0615 region earlier in the week. The corrective downside in the pair comes in response to the resurgence of the risk aversion sentiment and the resumption of the buying bias in the greenback.
In addition, the decline in the German 10y Bund yields - now approaching the 1.40% zone – also collaborates with the sour mood around the European currency on Thursday.
Further selling hurt the euro after the inaction seen in Chair Lagarde in recent comments, as she only reiterated the bank’s intention to raise rates by 25 bps next month, while further rate hikes would hinge on the progress of domestic fundamentals.
Earlier in Germany, Retail Sales contracted 3.6% in the year to May, the Unemployment Rate ticked higher to 5.3% and the Unemployment Change increased by 133K persons, both prints for the month of June.
Across the ocean, the publication of inflation figures measured by the PCE will take centre stage seconded by usual Initial Claims and Personal Income/spending.
What to look for around EUR
EUR/USD faces the re-emergence of the risk-off mood and the subsequent drop to the sub-1.0500 area so far this week.
In the meantime, the single currency continues to closely follow news from the ECB Forum in Portugal as well as any developments surrounding the bank’s plans to design a de-fragmentation tool in light of the upcoming start of the hiking cycle.
However, EUR/USD is still far away from exiting the woods and it is expected to remain at the mercy of dollar dynamics, geopolitical concerns and the Fed-ECB divergence, while higher German yields, persistent elevated inflation in the euro area and a decent pace of the economic recovery in the region are also supportive of an improvement in the mood around the euro.
Key events in the euro area this week: Germany Retail Sales, Unemployment Change, Unemployment Rate. EMU Unemployment Rate, ECB Lagarde (Thursday) – EMU, Germany Final Manufacturing PMI, EMU Flash Inflation Rate (Friday).
Eminent issues on the back boiler: Fragmentation risks. Kickstart of the ECB hiking cycle in July? Asymmetric economic recovery post-pandemic in the euro bloc. Impact of the war in Ukraine on the region’s growth prospects.
EUR/USD levels to watch
So far, spot is retreating 0.11% at 1.0427 and faces immediate contention at 1.0358 (monthly low June 15) followed by 1.0348 (2022 low May 13) and finally 1.0300 (psychological level). On the upside, a break above 1.0615 (weekly high June 27) would target 1.0773 (monthly high June 9) en route to 1.0786 (monthly high May 30).
- Gold languished near a two-week low amid the prospects for aggressive Fed rate hikes.
- Recession fears, sliding US bond yields, modest USD weakness extended some support.
- The recent repeated failures near the 200-day SMA support prospects for further losses.
Gold traded with a mild negative bias for the fourth successive day on Thursday and languished near a two-week low touched the previous day. The XAUUSD was last seen hovering around the $1,816 region and was pressured by the prospects for more aggressive rate hikes by the Fed.
Speaking at the ECB's annual forum on Wednesday, Powell said that the US economy is well-positioned to handle tighter policy and that the US central bank remains focused on getting inflation under control. Adding to this, Cleveland Fed President Loretta Mester said that policymakers should act forcefully to curb price pressures. This, in turn, was seen as a key factor that continued acting as a headwind for the non-yielding gold.
That said, a combination of factors held back traders from placing aggressive bearish bets and limit any deeper losses for the XAUUSD. at least for the time being. Despite the Fed's hawkish outlook, the US dollar struggled to capitalize on its two-day-old positive trend amid the ongoing decline in the US Treasury bond yields. This, along with the prevalent risk-off mood, offered some support to the safe-haven gold amid recession fears.
The market sentiment remains fragile amid concerns that rapidly rising interest rates and tighter financial conditions would pose challenges to global economic growth. This continued weighing on investors' sentiment, which was evident from a sea of red across the equity markets and underpinned traditional safe-haven assets.
The mixed fundamental backdrop warrants some caution before positioning for any further depreciating move, through the technical set-up favours bearish traders. The recent attempted recovery moves have repeatedly faced rejection near the very important 200-day SMA and suggest that the bearish trend for gold prices might still be far from being over.
Market participants now look forward to the US economic docket, featuring the Core PCE Price Index - the Fed's preferred inflation gauge - and the usual Weekly Initial Jobless Claims. This, along with the US bond yields, will influence the USD price dynamics. Apart from this, the broader risk sentiment might provide a fresh impetus to gold.
Technical levels to watch
EUR/USD has turned bearish following Wednesday's sharp decline. The pair is likely to stay on the back foot with safe-haven flows dominating the financial markets on Thursday, FXStreet’s Eren Sengezer reports.
Euro's recovery prospects diminish
“Unless there is a significant positive shift in market mood, sellers are likely to retain control of EUR/USD action.”
“In case EUR/USD fails to reclaim 1.0470 (Fibonacci 23.6% retracement of the latest downtrend), the pair is likely to extend its slide toward 1.0400 (psychological level), 1.0380 (end-point of the latest downtrend) and 1.0360 (June 15 low).”
On the upside, the pair could recover toward 1.0500 (psychological level) and 1.0520 (Fibonacci 38.2% retracement, 50-period SMA, 100-period SMA on the four-hour chart) if buyers managed to flip 1.0470 into support.”
- Unemployment Rate in the euro area edged lower in May.
- EUR/USD continues to trade below 1.0450 after the data.
The seasonally-adjusted Unemployment Rate in the euro area declined to 6.6% in May from 6.7% in April, the data published by Eurostat showed on Thursday. This reading came in better than the market expectation of 6.8%.
In the EU, the unemployment rate stayed unchanged at 6.1% in May. "Eurostat estimates that 13.066 million men and women in the EU, of whom 11.004 million in the euro area, were unemployed in May 2022," the publication further read.
Market reaction
These figures failed to help the shared currency find demand. As of writing, the EUR/USD pair was flat on the dy at 1.0437.
The inflation figures for the eurozone in June will be published tomorrow. The European Central Bank (ECB) could leave the euro under downside pressure – weighing on gold as well – if sticks to hike just by 25 basis points (bps) at its next meeting, strategists at Commerzbank report.
ECB risks falling further behind other central banks
“We will be interested to see whether the ECB will rethink its stance if the inflation rate turns out to be higher than expected and whether it will consider raising interest rates by more than 25 bps at its next meeting on 21 July after all.”
“On just 25 bps rate hike, the ECB risks falling further behind other central banks that have already hiked their interest rates considerably. In this case, the euro would presumably remain weak, which would weigh further on the gold price.”
- GBP/USD staged modest recovery from the 1.2100 mark, or a nearly two-week low.
- Sliding US bond yields kept the USD bulls on the defensive and extended support.
- Hawkish Fed outlook, recession fears limited the USD losses and capped the major.
The GBP/USD pair managed to defend and attract some buying near the 1.2100 mark on Thursday, stalling its recent downfall to a nearly two-week low. The pair maintained its bid tone through the early part of the European session and was last seen trading just above mid-1.2100s.
Despite Fed Chair Jerome Powell's overnight hawkish remarks, the ongoing decline in the US Treasury bond yields failed to assist the US dollar to capitalize on its two-day-old positive trend. This was seen as a key factor that extended some support to the GBP/USD pair, though the attempted recovery lacked bullish conviction and runs the risk of fizzling out rather quickly.
Speaking at the ECB's annual forum on Wednesday, Powell reaffirmed bets for more aggressive rate hikes and said that the US economy is well-positioned to handle tighter policy. Furthermore, concerns that rapidly rising interest rates would pose challenges to global economic growth continued weighing on investors' sentiment, which should act as a tailwind for the safe-haven USD.
In contrast, the Bank of England Governor Andrew Bailey sounded a bit cautious and noted that there were clear signs that the economy is slowing. This, in turn, suggested that the BoE would opt for a more gradual approach toward hiking interest rates amid growing recession fears. This, along with Brexit woes, might hold back traders from placing bullish bets around sterling.
It is worth recalling that the UK House of Commons on Monday voted in favour of a controversial bill that would unilaterally overturn part of Britain's divorce deal from the EU agreed in 2020. This has raised the risk of fresh tensions with the EU amid the cost of living crisis in the UK, which supports prospects for a further near-term depreciating move for the GBP/USD pair.
On the economic data front, the final UK GDP print matched previous estimates and showed that the economy expanded by 0.8% during the first quarter of 2022. Adding to this, the UK Office for National Statistics reported that the current account deficit ballooned to £51.7 billion or 8.3% of the gross domestic product in the first three months of the current year.
The data, however, did little to provide any meaningful impetus, with the USD price dynamics turning out to be an exclusive driver of the GBP/USD pair's intraday move. Traders now look forward to the US economic docket - featuring the release of the Core PCE Price Index (Fed's preferred inflation gauge) and Weekly Initial Jobless Claims - for short-term opportunities.
Technical levels to watch
USD/CNH is seen still trading between 6.6600 and 6.7400 for the time being, commented FX Strategists at UOB Group Lee Sue Ann and Quek Ser Leang.
Key Quotes
24-hour view: “Our expectations for USD to ‘head higher’ did not quite materialize as it traded between 6.6930 and 6.7176 before closing little changed at 6.7087 (+0.09%). Momentum indicators are neutral and USD is likely to trade sideways. Expected range for today, 6.6900/6.7200.”
Next 1-3 weeks: “We have expected USD to trade sideways between 6.6600 and 6.7400 since last Monday (20 Jun, spot at 6.7080). While shorter-term downward momentum has improved somewhat, there is no change in our view for now.”
- DXY keeps the trade near recent peaks around 105.00.
- US yields extend the corrective downside on Thursday.
- PCE, Initial Claims next of relevance in the docket.
The US Dollar Index (DXY), which tracks the greenback vs. a bundle of its main competitors, alternates gains with losses in the 105.00 neighbourhood on Thursday.
US Dollar Index focuses on data
The index looks to add to the recent advance beyond 105.00 the figure in the second half of the week amidst so far alternating risk appetite trends and the persistent decline in US yields across the curve.
Recent gains in the dollar were sustained by the re-emergence of the risk aversion among market participants, particularly following rising concerns over a probable global slowdown/US recession derived from the tighter monetary conditions carried on by the Federal Reserve and other major central banks, always amidst the unabated march higher in inflation.
Quite interesting session in the US docket, as inflation tracked by the PCE is due for the month of June seconded by usual weekly Claims, Personal Income and Personal Spending.
What to look for around USD
Renewed risk-off sentiment motivated the index to reclaim the area above the 105.00 mark on Wednesday despite US yields continue to trend lower.
The dollar, in the meantime, remains well supported by the Fed’s divergence vs. most of its G10 peers (especially the ECB) in combination with bouts of geopolitical effervescence, higher US yields and a potential “hard landing” of the US economy, all factors suggesting a stronger dollar in the next months.
Key events in the US this week: PCE, Core PCE, Personal Income, Personal Spending, Initial Claims (Thursday) – ISM Manufacturing, Final Manufacturing PMI (Friday).
Eminent issues on the back boiler: Hard/soft/softish? landing of the US economy. Escalating geopolitical effervescence vs. Russia and China. Fed’s more aggressive rate path this year and 2023. US-China trade conflict. Future of Biden’s Build Back Better plan.
US Dollar Index relevant levels
Now, the index is down 0.07% at 105.02 and faces the next contention at 103.67 (weekly low June 27) seconded by 103.41 (weekly low June 16) and finally 101.29 (monthly low May 30). On the other hand, a break above 105.18 (weekly high June 30) would expose 105.78 (2022 high June 15) and then 107.31 (monthly high December 2002).
- Unemployment Rate in Germany rose unexpectedly in June.
- EUR/USD continues to trade near the 1.0450 area after the data.
The Unemployment Rate in Germany rose to 5.3% in June from 5% in May, the data published by Germany's Destatis showed on Thursday. This print came in worse than the market expectation of 5%.
In the same period, the number of unemployed increased by 133,000, missing analysts' estimate for a decrease of 6,000 by a wide margin.
Market reaction
The EUR/USD pair is struggling to stage a decisive rebound after this report and was last seen trading flat on the day at 1.0443.
Here is what you need to know on Thursday, June 30:
Safe-haven flows dominate the financial markets early Thursday and major European equity indexes suffer heavy losses. The US Dollar Index stays relatively quiet near 105.00 following the two-day rally. The US Bureau of Economic Analysis will release the Personal Consumption Expenditures (PCE) Price Index data, the Fed's preferred gauge of inflation, alongside Personal Spending and Personal Income figures for May. Unemployment data for the euro area will be featured in the European economic docket before Statistics Canada releases monthly GDP data for April in the early American session.
While speaking at the European Central Bank's (ECB) Forum on Central Banking on Wednesday, FOMC Chairman Jerome Powell reiterated that the US economy could withstand the policy mover. Powell further noted that the dollar strength was "disinflationary at the margins." At the same panel, ECB President Lagarde refrained from committing to a specific rate hike size in July. Finally, Bank of England (BOE) Governor Andrew Bailey acknowledged that they were being hit by a "very large income shock." Following this event, the dollar continued to gather strength against its rivals.
Central Bankers' Panel puts Powell, dollar on top, Lagarde, euro lagging, Bailey, pound behind.
During the Asian trading hours, the data from China showed that the business activity in the private sector expanded in June following April and May's contraction. This development, however, failed to help the market mood improve. As of writing, US stock index futures were down between 1.2% and 1.5%.
EUR/USD broke below 1.0500 on Wednesday and was last seen trading at its lowest level in two weeks at around 1.0450.
GBP/USD lost 60 pips on Wednesday before going into a consolidation phase above 1.2100 early Thursday. Earlier in the day, the UK's Office for National Statistics reported that the GDP in the first quarter grew at an annualized pace of 8.7%. This print matched the flash estimate and the market expectation.
Fueled by the broad-based dollar strength, USD/JPY climbed to fresh multi-decade highs above 137.01. Early Thursday, the JPY seems to be finding demand as a safe haven, causing the pair to retreat toward 136.00.
Gold failed to take advantage of falling US Treasury bond yields and closed below $1,820 on Wednesday. XAU/USD stays on the back foot and edges lower toward $1,810 in the European morning.
Bitcoin came under heavy selling pressure and broke below $20,000 early Thursday. Ethereum is down more than 4% on the day so far but continues to trade above $1,000 for the time being.
- NZD/USD attracted some buying in the vicinity of the YTD low amid subdued USD demand.
- The Fed’s hawkish outlook should help limit losses for the USD amid growing recession fears.
- Investors look forward to the US Core PCE Price Index for some meaningful trading impetus.
The NZD/USD pair showed some resilience below the 0.6200 mark on Thursday and staged modest recovery from the vicinity of the YTD low. The pair traded with a mild positive bias through the early European session and was last seen hovering near the top end of its daily range, around the 0.6225-0.6230 area.
The US dollar struggled to capitalize on its strong gains recorded over the past two trading sessions and was seen consolidating in a range near a two-week high touched the previous session. This was seen as a key factor that offered support to the NZD/USD pair, though any meaningful upside seems elusive.
Fed Chair Jerome Powell reaffirmed bets for a more aggressive policy tightening to combat stubbornly high inflation and added to worries about a possible recession. In fact, market participants remain concerned that rapidly rising interest rates would pose challenges to global economic growth.
This continued weighing on investors' sentiment, which was evident from the prevalent risk-off mood and a sea of red across the equity markets. The anti-risk flow, along with the Fed's hawkish outlook, should act as a tailwind for the safe-haven greenback and cap any further gains for the risk-sensitive kiwi.
Hence, it will be prudent to wait for strong follow-through buying before confirming that the NZD/USD pair has formed a near-term bottom and placing fresh bullish bets. Market participants now look forward to the US macro data for short-term trading impetus later during the early North American session.
Thursday's US economic docket features the release of the Core PCE Price Index - the Fed's preferred inflation gauge - and the usual Weekly Initial Jobless Claims. This, along with the broader risk sentiment, will drive the USD demand and produce some trading opportunities around the NZD/USD pair.
Technical levels to watch
The US dollar remains on a sound footing. This trend is set to persist until the Fed’s frontloaded policy tightening cycle is near concluding, according to economists at Westpac.
US to avert recession
“Escalating recession risk will periodically undercut the USD, but the US has a couple of cards up its sleeve, among them $2.5trn in accumulated covid household savings and 40-year highs in the US’ terms of trade. That, and the prospect of increased supply in constrained labour and product markets should see the US avert recession.”
“While the US is contending with supply constraints and excess demand, the eurozone is dealing primarily with supply-side issues and the outlook remains fragile. The US is operating substantially further beyond capacity than the Eurozone. Yet, rates markets expect the Fed-ECB cash spread to reverse materially into 2023.”
“DXY a buy the 104 zone, the medium-term uptrend likely to persist until the Fed’s frontloaded policy tightening cycle is nearer conclusion.”
The aussie is middle of the pack over the past week. Economists at Westpac expect the AUD/USD pair to drop under 0.68.
Reserve Bank of Australia should hike and sound upbeat
“The domestic calendar returns to focus with the RBA debating +25 bps versus +50 bps according to Governor Lowe last week. Westpac expects 50 bps in both July and August, with market pricing only a little short of this. The statement should include a positive view on the economy, unlike legitimate recession talk in the likes of the US and UK.”
“Near term, the poor equity and metals prices mood should see 0.6800 give way but back to 0.72 by Sep.”
Last week, economists at Westpac said we “look for a run at 137.” Now, they expect the USD/JPY pair to reach the 138 level.
The Bank of Japan is increasingly lonely
“As central bankers met in Portugal this week to swap notes on their fight against surging inflation, the BoJ is increasingly lonely. But it can point to ‘core-core’ inflation of 0.8% yr, hardly cause to declare victory after such a long battle to reach sustained 2% inflation.”
“The pullback in the US 10yr yield on recession talk means that the post-1998 spot USD/JPY highs are not backed by the 10-year Tsy – JGB spread. But with CFTC data suggesting specs are not stretched and USD/JPY dips meeting keen demand, we can’t call a high yet.”
“We see scope to at least 138 as the FOMC meeting edges nearer.”
In the United Kingdom, political pressures are rising while monetary challenges are exacerbated. Economists at Westpac note that the GBP/USD pair could tumble to test the 1.120 level.
UK’s political backdrop remains precarious
“UK is facing extreme monetary policy challenges with inflation at the top of major economy rankings while growth forecasts from bodies such as OECD are at the bottom of those major economies.”
“PM Johnson will return to the UK from a series of key overseas summits (Commonwealth, G7, NATO) to yet further pressure on his leadership from a disgruntled Conservative Party. UK is also brandishing a bill on the N.I. Protocol which is divisive with EU and Scotland’s First Minister Sturgeon has started an equally divisive plan for an independence referendum in Oct. 2023. Unions plan further strikes through the summer and Govt. approval is at its lowest since the Brexit Agreement was finally reached.”
“GBP/USD rebounds have been limited and it remains vulnerable to flushing below 1.20.”
The US Dollar Index (DXY) is steady near 105.00. Economists at ING expect the greenback to stay resilient.
Market prices a peak in dollar rates around year-end
“Today sees the May US PCE inflation data. The May US CPI data (released 10 June) really hit bond and US rate markets meaning that today's PCE may not have that large of an effect. Yet any upside surprise could nudge the dollar and US rates a little firmer.”
“Money markets now price US short-end rates peaking around year-end at 3.50% and being 25 bps lower by next summer. For us, it seems far too early to be playing the dollar bear market story. Let's see whether sticky inflation this summer needs to price Fed funds back at 4% again. But into 2023 our baseline view is that the dollar does indeed start to turn lower.”
“Barring quarter and half-year end portfolio balancing flows today, we would expect the dollar to stay strong.”
Markets expect a 50 basis points (bps) rate hike from the Riksbank. This decision is unlikely to be a game-changer for the Swedish krona, according to economists at ING.
50 bps hike by the Riksbank today
“The Riksbank announces monetary policy today and we expect a 50 bps rate hike, in line with the economists’ consensus and market expectations. Most focus will be on the rate projections, where we expect the Bank to pencil in a 50 bps hike also in September and potentially another 50 bps in November, with the latter possibly coming as a partly hawkish surprise to markets.
“The Riksbank would most likely welcome a re-appreciation of the krona to fight imported inflation. However, the near-term outlook for SEK remains quite clouded given its high exposure to the unstable risk environment – including most recently its looming entry to NATO.”
“Even in the event of a hawkish surprise today, we struggle to see EUR/SEK sustaining a break below 10.60.”
“A stabilisation in sentiment in the latter part of the year may be the trigger for EUR/SEK to re-connect with short-term rate dynamics, which clearly point to a much stronger SEK. We still target a return to 10.10-10.30 by year-end.”
See: Market might seem disappointed and sell krona if Riksbank were to hike by 50 bps – Commerzbank
GBP/USD rebounds to 1.2150. However, economists at ING expect cable to remain under pressure and test 1.1950 if the 1.2115/00 support is removed.
EUR/GBP to remain near 0.86
“The Bank of England (BoE) is going to have to stay pretty hawkish - or at least not protest against current market pricing of the BoE curve – if it wants to keep sterling supported.”
“GBP/USD to stay vulnerable. Under 1.2100/2115 could see the 1.1950 low retested.”
“And sterling is doing very well to retain EUR/GBP levels near 0.8600.”
According to FX Strategists at UOB Group Lee Sue Ann and Quek Ser Leang, further upside momentum could lift USD/JPY to the 137.50 region in the near term.
Key Quotes
24-hour view: “We highlighted yesterday ‘further USD advance is not ruled out but in view of the overbought conditions, a sustained rise above the major resistance at 136.50 is unlikely’. While USD advanced as expected, it soared to a high of 136.99 before pulling back. Conditions remain overbought and while USD could rise above 137.00, it is unlikely able to maintain a foothold above this level (next resistance is at 137.50). Support is 136.40 followed by 136.15.”
Next 1-3 weeks: “Yesterday (30 Jun, spot at 136.05), we turned positive USD but we were of the view that the year-to-date high at 136.70 may not be easy to break. However, USD cracked 136.70 and popped to a high of 136.99 before easing. The outlook is still positive and USD could advance to 137.50. Overall, only a break of 135.50 (‘strong support’ level was at 135.20 yesterday) would indicate that the current upward pressure has eased.”
Does investing in European equities still make sense? Gabriela Santos, Global Market Strategist at JP Morgan, lays out three key reasons to not ignore the opportunity in European equities.
While recession fears in Europe are elevated, investing in Europe is not a bet on the European economy
“Over 50% of Europe's revenue comes from outside its borders. For example, LVMH (French-listed, global luxury brand) sources revenue from all other the world, with over 40% coming from EM, where there is growing demand from the rise of the middle class.”
Most consider Europe as a cyclical play, but it also represents structural growth opportunities
“European markets experienced a significant change in sector composition since the Global Financial Crisis. Looking at the Euro Stoxx 50, financials dominated the index at ~35% of market capitalization in 2008, dropping to under 15% today. Meanwhile, technology has risen from 6% to over 20% of the index. This share is expected to grow further with 20% of the EUR750 billion European recovery fund allocated to digitalize economies.”
Investing in Europe offers exposure to opportunities not available in the US
“Europe dominates the luxury goods space and is at the forefront of the energy transition. 75% of offshore wind capacity is installed in Europe. The EU is focused on phasing out its dependence on Russian oil and pushing forward with the "REPowerEU Plan.” This plan will cut EU dependency of Russian oil by two-thirds by the end of 2022 and entirely by 2030.”
- USD/CAD gained traction for the second straight day and climbed closer to the weekly high.
- Retreating crude oil prices undermined the loonie and remained supportive of the move up.
- Hawkish Fed, recession fears favour the USD bulls and support prospects for further gains.
The USD/CAD pair built on the previous day's positive move and gained some follow-through traction for the second successive day on Thursday. The momentum lifted spot prices further beyond the 1.2900 mark, back closer to the weekly high during the early European session.
The overnight sharp pullback in crude oil prices undermined the commodity-linked loonie and turned out to be a key factor that acted as a tailwind for the USD/CAD pair. It is worth recalling that the black liquid on Wednesday witnessed an intraday turnaround from a one-and-half-week high after the US Energy Information Administration (EIA) reported a rise in fuel stocks. The report also showed that the US refiners ramped up production and are operating at 95% of capacity. This comes on the back of worries about slowing economic growth and eased concerns about tight supplies, which continued weighing on the commodity.
That said, modest US dollar weakness might keep a lid on any meaningful upside for the USD/CAD pair, though the bias seems tilted in favour of bullish traders. Fed Chair Jerome Powell, speaking at the central bank's annual forum on Wednesday, reaffirmed bets for more aggressive rate hikes and said that the US economy is well-positioned to handle tighter policy. Powell added that the Fed remains focused on getting inflation under control and the market pricing is pretty close to the dot plot. This, along with growing recession fears and the prevalent risk-off environment, should continue to offer support to the safe-haven buck.
Market participants now look forward to the US economic docket - featuring the Core PCE Price Index (Fed's preferred inflation gauge) and the usual Weekly Initial Jobless Claims. This, along with the US bond yields and the broader market risk sentiment, will drive the USD demand and provide some impetus to the USD/CAD pair. Traders will further take cues from oil price dynamics to grab short-term opportunities around the major.
Technical levels to watch
Open interest in natural gas futures markets reversed a multi-week downtrend and rose by around 1.3K contracts on Wednesday, according to advanced prints from CME Group. On the flip side, volume dropped for the second straight session, this time by just 515 contracts.
Natural Gas cold revisit $6.00
Natural gas prices climbed to the proximity of the $7.00 mark on Wednesday, although it ended up reversing that move and closing the day with decent losses. The move was accompanied by rising open interest, which opens the door to the resumption of the downside with the immediate target at recent lows in the $6.00 mark per MMBtu.
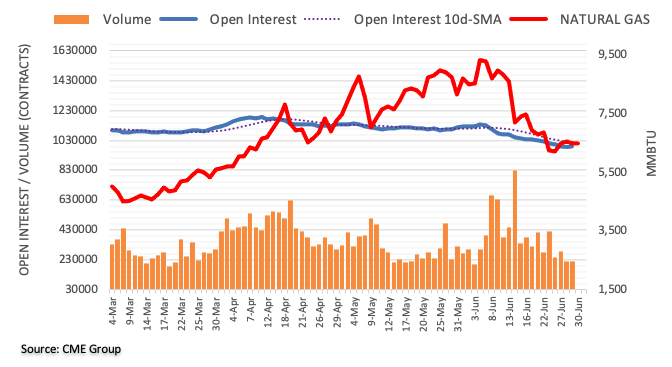
- USD/CHF picks up bids to refresh daily tops, extends bounce off the multi-day bottom marked the previous day.
- US dollar pares intraday losses as Treasury yields reverse early Asian session gains.
- Downbeat Swiss Real Retail Sales appears to have played their role ahead of Fed’s preferred inflation data.
USD/CHF takes the bids to refresh intrday high near 0.9560, extending the previous day's rebound from the lowest levels since April, as the US dollar pullback jostles with the risk-off mood during early Thursday in Europe.
In doing so, the Swiss currency (CHF) pair also justifies the recently released Swiss Real Retail Sales, -1.6% versus 3.8% expected and upwardly revised -5.5% prior.
The US Dollar Index (DXY) regains 105.00 while extending the two-day rebound near the highest levels in a fortnight. The greenback’s recent strength appears connected to the US 10-year Treasury yields as the key bond coupons refresh the weekly low to 3.07%, down by 2.2 basis points (bp) by the press time.
It’s worth noting that the risk-off mood, as portrayed by more than 1.0% intraday loss of the US and the European stock futures, also underpin the US dollar buying.
The reason could not be linked to the market’s consolidation of the weekly gains ahead of the Fed’s preferred inflation gauge, namely the Core Personal Consumption Expenditure (PCE) Price Index, as well as the quarter-end positioning. The inflation precursor is expected to rise to 0.4% MoM in May versus 0.3% prior.
The US data could propel the Fed towards aggressive rate hikes and can renew USD/CHF buying as Fed Chairman Jerome Powell repeated his pledge to battle inflation with readiness to announce another 0.75% rate hike, if needed, during Wednesday’s ECB Forum. The Fed Boss also praised the US economic strength and helped the US dollar to remain firmer. It’s worth noting that Powell’s comments suggesting challenges for US jobs data during the battle with inflation, as well as Deutsche Bank’s fears of no respite to inflation woes, appear to have weighed on the risk profile of late.
Given the CHF’s safe-haven status, the pair’s reaction to the risk-off mood appears mixed. Also favoring the USD/CHF bears is the Swiss National Bank’s (SNB) comparatively more hawkish bias than the Fed.
Technical analysis
Despite bouncing off the 100-DMA, around 0.9520 at the latest, USD/CHF remains below a two-week-old resistance line near 0.9610, which in turn keeps sellers hopeful. Even if the pair manages to cross the 0.9610 hurdle, the support-turned-resistance trend line from late March, around 0.9710, appears a tough nut to crack for the pair buyers.
After trading just below $125/bbl in early June, Brent crude oil fell more than 10% to $110/bbl. Strategists at ANZ Bank see solid support at the $100 level.
Oil well-positioned to withstand an economic slowdown
“Previous recessions have seen oil demand fall by 0-3% (peak to trough), but that would still not be enough to offset the supply-side disruptions.”
“For the moment, oil demand is improving. Traffic numbers remain strong despite high prices in Europe and the US. Congestion is also rising in China as restrictions ease. Combined with ongoing supply-side issues, we expect inventories to continue to fall in 2023. This should support upside moves.”
“We see support for oil at $100/bbl under a typical global recession. That would fall to $80/bbl in the unlikely event of global demand falling by 5%, as inventories would build to cover around nine days of consumption.”
USD/CNY holds around the 6.6960 level. Economists at TD Securities expect the pair to move upward over the coming months.
USD/CNY to pivot around 6.70 over near term
“We continue to expect further CNY depreciation vs USD and on a trade-weighted basis in the months ahead as a likely weakening in China's current account position, and reduced inflows will weaken underlying support for the currency.”
“Over the near term, USD/CNY is likely to continue to pivot around 6.70, with PBoC CNY fixings indicating no clear bias vs. USD while the CFETS CNY index is likely to drift lower.”
Here are the results of Deutsche Bank’s June 2022 global financial market sentiment survey conducted from June 27-29 covering 475 market professionals across the world.
June 2022 market survey results
“Inflation expectations have stabilised across both sides of the Atlantic. Marginally lower in the US and marginally higher in Europe over the last month. The former comes as the +75 bps Fed hike closed the gap between our respondents' beliefs and expectations about Fed's resolve to bring down inflation – 72% now expect the central bank to try and reign in prices notwithstanding recession risks, up from 61% in May.”
“90% (vs 78% in May) expect a US recession by the end of 2023 or considerably earlier. For those opting for 2022 (20%), the timing was roughly evenly split between now, Q3 and Q4. We've tracked this over the last several months. Market views are reflecting this too, as 72% see the S&P 500 hitting 3,300 before 4,500.”
“While 56% expect the 10y JGB yield to stay the same by year-end, 43% believe they will have to break out higher. The spread between BTPs and Bunds is seen breaching +240 bps before +160 bps by a 70/30 split.”
“94% claim they have factored in some risk of a cut-off of Russian gas into Europe into their market view.”
In the opinion of FX Strategists at UOB Group Lee Sue Ann and Quek Ser Leang, NZD/USD could accelerate losses on a close below 0.6200.
Key Quotes
24-hour view: “Yesterday, we indicated that ‘rapid build-up in downward momentum is likely to lead to further NZD weakness but expect solid support at 0.6200’. Our view was not wrong as NZD dropped to 0.6207 before rebounding slightly. While downward momentum has waned somewhat, NZD could dip below 0.6200. The next support at 0.6170 is unlikely to come under threat. Resistance is at 0.6240 but only a break of 0.6260 would indicate that the current downward pressure has eased.”
Next 1-3 weeks: “We turned negative NZD yesterday (29 Jun, spot at 0.6240) and expected NZD to trade with a downward bias towards 0.6200. NZD subsequently dropped to 0.6207. While downward momentum has not improved by much, NZD could drop below 0.6200. That said, NZD has to close below this solid support before further sustained decline is likely. The next support is at 0.6170. The downside risk is intact as long as NZD does not move above 0.6280 (‘strong resistance’ level was at 0.6300 yesterday).”
The Swedish central bank (Riksbank) is likely to hike its key rate by 50 bps to 0.75%. In this case, economists at Commerzbank expect the krona to come under selling pressure.
Will Riksbank surprise?
“If Riksbank were to hike by 50 bps, the market might seem disappointed and sell krona. A 75 bps step would come as a surprise for the majority and is likely to support krona.”
“In view of the nonetheless very negative real interest rates the krona’s appreciation potential is likely to be limited though. Moreover, market sentiment is likely to remain subdued due to recession fears, thus not providing a suitable environment for a stronger krona.”
See – Riksbank Preview: Forecasts from five major banks, joining the 50 bps club
USD/JPY reached new highs at levels around 137 on Wednesday. Economists at Commerzbank expect the pair to extend its substantial rise.
Japan’s June inflation data unlikely to lift the yen
“It seems unlikely that the June inflation data, due for publication tomorrow, will change this decade-long phenomenon.”
“I merely want to point out that the causes of lowflation in Japan were clearly different from those in the rest of the G10. And as a result, the fact that lowflation is over in most countries is not a reason to assume that the same will happen in Japan.”
FX option expiries for June 30 NY cut at 10:00 Eastern Time, via DTCC, can be found below.
- EUR/USD: EUR amounts
- 1.0400 301m
- 1.0500 338m
- 1.0750 473m
- 1.0865 707m
- 1.0900 606m
- USD/JPY: USD amounts
- 133.00 245m
- 135.00 260m
- 136.00 225m
- USD/CHF: USD amounts
- 0.9600 360m
- 0.9800 250m
- USD/CAD: USD amounts
- 1.2635 261m
- 1.2650 274m
- 1.2700 303m
- 1.2750 1b
- 1.3000 555m
- EUR/GBP: EUR amounts
- 0.8255 425m
- 0.8650 652m
- 0.8825 548m
EUR/CHF is trading below parity. Economists at Commerzbank expect the Swiss franc to continue its appreciation dynamic.
Violent EUR/CHF volatilities expected
“If EUR/CHF levels below parity are accepted by the SNB without intervention, FX traders are likely to take that as an invitation to increase the pace of appreciation. Until the SNB has to intervene with CHF sales after all. Then there should be another jump upward.”
“In the end, violent EUR/CHF volatilities are likely to be the result.”
“I expect increasing CHF appreciation dynamics for the next few days. You can also put it this way: The market should now sound out the SNB pain threshold on the EUR/CHF downside. That's just how the market works when a central bank sets unclear limits for exchange rates.”
- WTI pares the biggest daily losses in a week inside a bullish chart pattern.
- Pullback from 200-SMA, bearish MACD signals challenge buyers.
- Bears need validation from $106.40, RSI hints at gradual recovery.
WTI crude oil prices consolidate the week’s biggest daily loss while picking up bids to $108.70 heading into Thursday’s European session.
The black gold dropped the most in over a week the previous day while stepping back from the 200-SMA. However, the support line of a one-week-old bullish trend channel triggered recovery moves earlier in the day.
That said, the bearish MACD signals challenge the upside momentum, suggesting the need for an upside break of the 38.2% and 50% Fibonacci retracement levels of June 08-22 downside, respectively around $108.85 and $111.25, to recall the buyers.
Even so, the 200-SMA level of $112.25 will precede a convergence of the stated channel’s upper line and 61.8% Fibonacci retracement, near $113.60, to challenge the commodity’s further upside.
Meanwhile, pullback moves should break the channel’s support line, close to $108.00 by the press time, to tease WTI sellers.
Though, multiple levels marked since June 20, between $107.00 and $106.40, could challenge the quote’s further downside before highlighting the monthly low of $101.17 for oil bears.
Overall, WTI remains in the recovery mode but the upside momentum has multiple speed breakers.
WTI: Four-hour chart
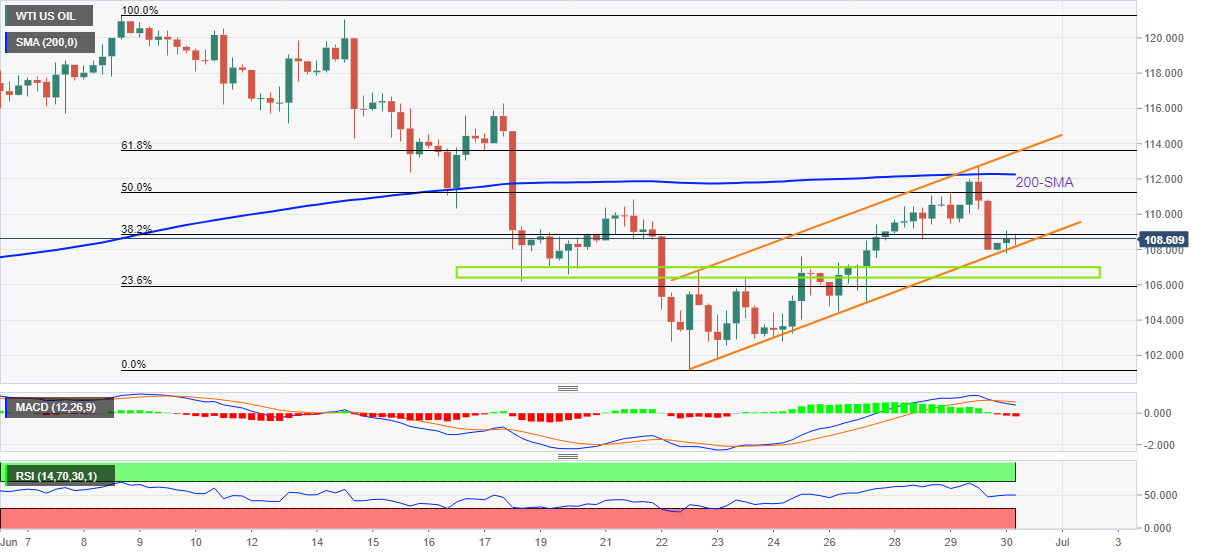
Trend: Further upside expected
- German Retail Sales arrived at -3.6% YoY in May vs. -2.0% expected.
- Retail Sales in Germany stood at 0.6% MoM in May vs. 0.5% expected.
Germany's Retail Sales rose by 0.6% MoM in May versus 0.5% expected and -5.4% last, the official figures released by Destatis showed on Thursday.
On an annualized basis, the bloc’s Retail Sales came in at -3.6% in May versus -2.0% expected and -0.4% booked in April.
FX implications
The euro is little changed on the mixed German data. At the time of writing, the major trades at 1.0457, adding 0.18% on the day.
About German Retail Sales
The Retail Sales released by the Statistisches Bundesamt Deutschland is a measure of changes in sales of the German retail sector. It shows the performance of the retail sector in the short term. Percent changes reflect the rate of changes of such sales. The changes are widely followed as an indicator of consumer spending. The positive economic growth is usually anticipated as "bullish" for the EUR, while a low reading is seen as negative, or bearish, for the EUR.
- Declining 20- and 50-period EMAs add to the downside filters.
- The RSI (14) has shifted into the bearish range of 20.00-40.00.
- EUR/USD may re-test June’s low after violating the critical support of 1.0433.
The EUR/USD pair has displayed a poor rebound after hitting a low of 1.0433 in the Asian session. The asset is attempting to sustain above 1.0450. However, the overall trend is bearish as the asset surrendered its psychological support of 1.0500 on Wednesday.
The shared currency bulls are attempting to defend the two-week-old crucial support of 1.0444, recorded on June 17. The trendline placed from Tuesday’s high at 1.0606 will act as a major resistance for the eurozone bulls.
The 20- and 50-period Exponential Moving Averages (EMAs) at 1.0463 and 1.0494 respectively are declining, which adds to the downside filters.
Meanwhile, the Relative Strength Index (RSI) (14) has shifted into the bearish range of 20.00-40.00, which indicates more downside ahead. Investors should not initiate aggressive shorts now as the RSI (14) is attempting to 40.00, which may turn the asset sideways.
The greenback bulls could strengthen further if the asset drops below Thursday’s low at 1.0433. An occurrence of the same will drag the asset towards June 14 low at 1.0397. A slippage below June 14 low will expose the asset to more downside levels of the Jun 15 low at 1.0359.
On the flip side, a decisive move above June 22 low at 1.0469 will drive the asset towards Wednesday’s high at 1.0535, followed by Tuesday’s high at 1.0606.
EUR/USD hourly chart
-637921658541483810.png)
The UK economy expanded 0.8% on quarter in the first quarter of 2022, confirming the 0.8% growth reported in the first readout and meeting forecasts of 0.8%, the final revision published by the Office for National Statistics (ONS) showed Thursday.
The annual figures showed that the UK GDP rose by 8.7% in Q1 vs. 8.7% previous and 8.7% expected.
Meanwhile, the Current Account data for the first quarter of 2022 came in at GBP-51.7B vs. GBP-39.8B expected and GBP-7.3B previous.
Market reaction
As of writing, GBP/USD is holding higher ground near 1.2150, 0.18% up on the day.
Considering preliminary readings from CME Group for crude oil futures markets, traders scaled back their open interest positions by around 3.5K contracts after two consecutive daily pullbacks on Thursday. Volume, instead, went up for the second session in a row, now by almost 30K contracts.
WTI now retargets $114.00
Wednesday’s corrective downside in prices of the WTI was against the backdrop of diminishing open interest, which is indicative that extra losses appear not favoured in the very near term. That said, the commodity could attempt another visit to the weekly high at $114.00 per barrel.
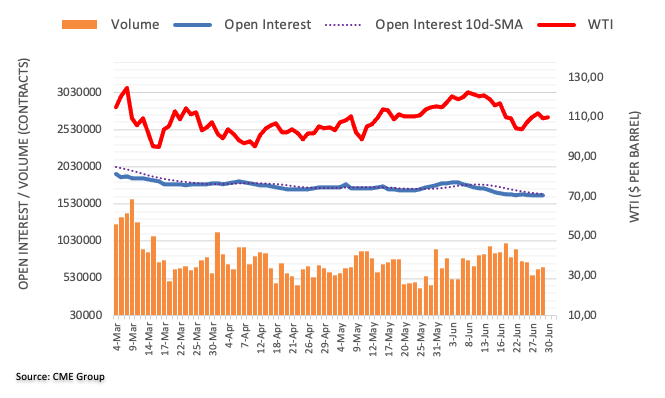
Gold Price was knocked down to its lowest level since mid-June at $1,812. As FXStreet’s Dhwani Mehta notes, the yellow metal remains exposed to downside risks.
XAUUSD awaits US PCE inflation for a sustained move lower
“The Core PCE inflation is seen easing to 4.7% YoY in May vs. 4.9% previous. Softer core figures could suggest that inflation is peaking, prompting investors to believe that Fed could go slow on its tightening cycle. Thus, gold could attract fresh demand in line with expectations or below forecasts reading, as it would down the dollar alongside the yields.”
“Wednesday’s low of $1,1812 could offer immediate support to bulls, below which the June 15 low of $1,808 will be under threat, as a breach of the $1,800 mark remains on the table.”
“Any upside attempt would need buyers to recapture the pennant support turned resistance, now at $1,824. Acceptance above the latter will fuel a decent bounce towards the $1,836 area.”
- USD/TRY picks up bids to mild gains, pares weekly losses.
- Turkish Parliament passes $53 billion supplementary budget to battle inflation.
- Fears of recession escalate as global central banks stay ready for aggressive rate hikes.
- Turkish trade numbers, CBRT Minutes and the US PCE Price Index will be important to watch for fresh impulse.
USD/TRY consolidates weekly losses around 16.67 heading into Thursday’s European session. In doing so, the Turkish lira (TRY) pair ignores the Turkiye’s supplementary budget approval, as well as the US dollar’s pullback, amid inflation and economic slowdown fears.
“Turkiye's parliament approved an 880 billion lira ($52.73 billion) supplementary budget,” Turkish Finance Minister (FinMin) Nureddin Nebati said late on Wednesday per Reuters. Turkish FinMin Nebati also mentioned the objective for such a step as to cover the rising costs of a currency slide, soaring energy prices and rampant inflation.
On a different page, the US Dollar Index (DXY) retreats to 104.99 while snapping a two-day rebound at the highest levels in a fortnight. The greenback’s losses appear linked with the fresh uptick in the US Treasury yields. the US 10-year Treasury yields snap a two-day downtrend as the key bond coupons rebound from the weekly low to 3.10%, up one basis point (bp) by the press time.
Even so, downbeat prints of the US stock futures and fears that the inflation woes will last longer, which in turn could trigger a recession, seem to propel the USD/TRY prices. Recently, the first major US bank to call the recession, namely Deutsche Bank, signaled that the US inflation could keep disappointing the Fed as the policymakers expected a gradual reduction in price pressure.
On Wednesday, the major central bankers’ readiness to battle inflation, even at the cost of short-term economic slowdown. The moves raised concerns over the recession and gain more attention of the USD/TRY traders amid multi-year high Turkish inflation and President Recep Tayyip Erdogan’s rejection of rate hikes.
Moving on, Turkish trade numbers for May and Minutes of the latest Central Bank of Republic of Turkiye (CBRT), when the rates remain unchanged, will be important for the USD/TRY traders. Above all, the US the Core Personal Consumption Expenditure (PCE) Price Index, expected 0.4% MoM versus 0.3% prior, will be an important catalyst to watch for short-term directions.
Technical analysis
Unless providing a daily close below an upward sloping support line from late December 2021, around 16.58 by the press time, USD/TRY remains on the buyer’s radar.
- Aussie bulls have defended the demand zone in a range of 0.6850-0.6867.
- The RSI (14) has reclaimed the 40.00-60.00 range, which signals a responsive buying action.
- The trendline placed from 0.7070 will act as a major hurdle for the pair.
The AUD/USD pair has witnessed a firmer rebound after failing to sustain below 0.6860. A responsive buying action has driven the asset strongly above 0.69000. However, a mild correction has turned the asset sideways.
On an hourly scale, aussie bulls have attracted some significant bids after testing the critical demand zone placed in a narrow range of 0.6850-0.6867. A responsive buying action has been witnessed, which strengthened the asset to attack the 50-period Exponential Moving Average (EMA) at 0.6898. While, the 200-period EMA at 0.6930 is still higher than the asset, which indicates that the long-term trend is still down.
Meanwhile, the Relative Strength Index (RSI) (14) has reclaimed the 40.00-60.00 range, which signals that the aussie bulls are no weaker now.
It is worth noting that trendline placed from June 16 high at 0.7070, adjoining Tuesday’s high at 0.6965 will continue to act as major resistance for the counter.
The aussie bulls could lift the asset price higher if the major overstep Wednesday’s high at 0.6965. This will drive the asset towards the psychological resistance at 0.7000, followed by June 13 high at 0.7035.
On the flip side, the aussie bulls could lose their grip if the asset drops below June 23 low at 0.6868. This will drag the asset towards May 12 low and the round-level support at 0.6829 and 0.6800 respectively.
AUD/USD hourly chart
-637921642800800911.png)
- EUR/GBP keeps the previous day’s pullback from fortnight high, pressured around intraday low.
- Multiple SMAs, ascending trend line from mid-May joins steady RSI to keep buyers hopeful.
- Weekly resistance line adds to the upside filters.
EUR/GBP remains depressed around 0.8615 heading into Thursday’s European session, extending the previous day’s pullback from a two-week top below 21-SMA.
Given the bearish MACD signals and the cross-currency pair’s break of immediate SMA, the EUR/GBP prices are likely to drop towards the 100-SMA level of 0.8590.
However, an ascending trend line from May 17, near 0.8565, joins a steady RSI to keep the pair buyers hopeful.
Even if the quote drops below 0.8565 support, the 50% Fibonacci retracement of the May-June upside and the 200-SMA, respectively near 0.8560 and 0.8550, will challenge the EUR/GBP bears before giving them control.
Meanwhile, the 21-SMA level of 0.8621 guards the quote’s immediate recovery ahead of the 23.6% Fibonacci retracement level of 0.8645.
Following that, an upward sloping resistance line from the last Thursday, at 0.8668 by the press time, could act as the last defense of the EUR/GBP sellers.
In a case where the pair rises past 0.8668, the odds favoring a run-up towards the 0.8700 and then to the monthly high of 0.8721 can’t be ruled out.
EUR/GBP: Four-hour chart
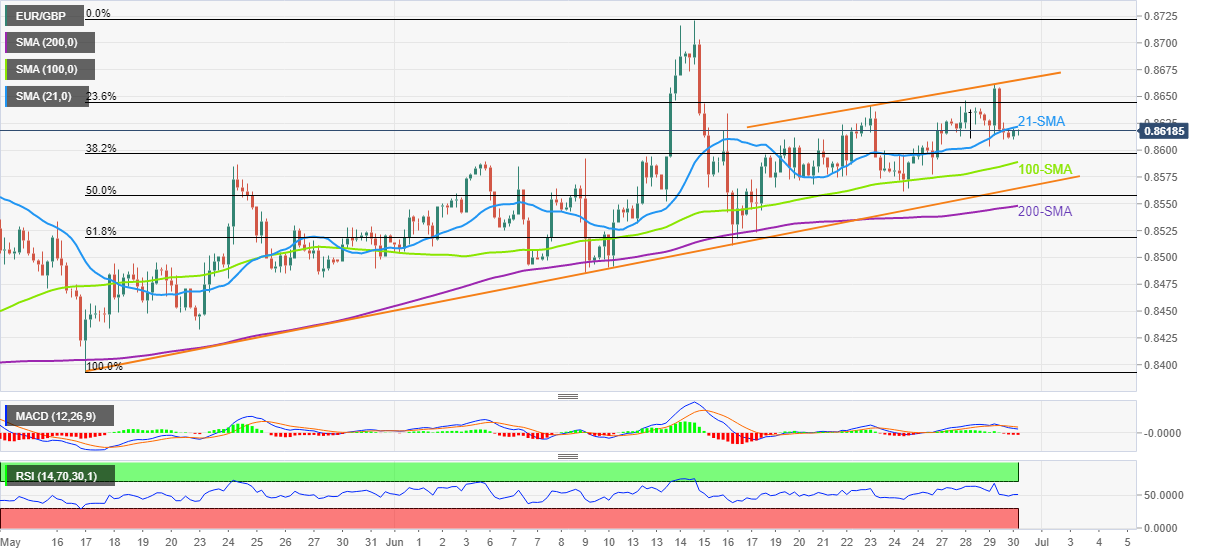
Trend: Bullish
GBP/USD could now grind lower and revisit the 1.2040 region in the next weeks, suggested FX Strategists at UOB Group Lee Sue Ann and Quek Ser Leang.
Key Quotes
24-hour view: “We highlighted yesterday that the ‘the rapid decline in GBP appears to have room to break the major support at 1.2165’. We added, ‘oversold conditions suggest that the next support at 1.2120 is unlikely to come into the picture’. Our view for a weaker GBP was not wrong even though the extent of the decline exceeded our expectations as GBP dropped sharply to 1.2106. While GBP could continue to weaken, conditions remain oversold and the next support at 1.2040 is likely out of reach for now. On the upside, a break of 1.2175 (minor resistance is at 1.2150) would indicate that the current weakness has stabilized.”
Next 1-3 weeks: “Yesterday (29 Jun, spot at 1.2185), we indicated that the recent consolidation phase. We highlighted that downward momentum is only beginning to build and any weakness from here could be limited to 1.2120 for now. While our view for a weaker GBP was correct, the pace of the decline was more rapid than expected as GBP plummeted to a low of 1.2106. Downward momentum has improved considerably and GBP could decline further to the next support at 1.2040. On the upside, a break of the ‘strong resistance’ at 1.2205 (level was at 1.2285 yesterday) would indicate that the current downward pressure has eased.”
CME Group’s flash data for gold futures markets noted open interest increased by around 2.2K contracts on Wednesday. In the same line, volume went up by around 45.6K contracts, extending the erratic performance for yet another session.
Gold now targets $1,800
Gold prices remained on the defensive on Thursday amidst rising open interest and volume. Against that, the precious metal now shifts its focus to the key support at the $1,800 zone per ounce troy.
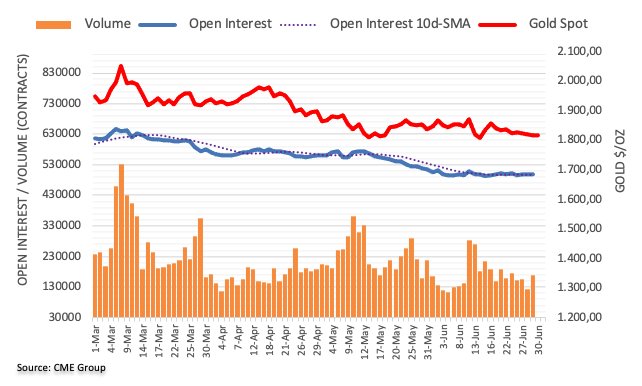
- Gold Price prints four-day downtrend despite recent rebound from intraday low.
- US dollar retreat, two-week-old support line restrict immediate downside.
- Bulls need validation from market sentiment, US PCE Price Index data.
Gold Price (XAU/USD) licks its wounds around the intraday low of $1,815 as traders await the key US data during early Thursday morning in Europe. Even so, the risk-off mood exerts downside pressure on the bullion.
The metal’s hesitance to decline further could be linked to the US dollar’s pullback from the highest levels in two weeks. That said, the US Dollar Index (DXY) retreats to 104.99 while snapping a two-day rebound at the highest levels in a fortnight.
The greenback’s losses appear linked with the fresh uptick in the US Treasury yields. the US 10-year Treasury yields snap a two-day downtrend as the key bond coupons rebound from the weekly low to 3.10%, up one basis point (bp) by the press time.
It should be noted, however, that the downbeat prints of the US stock futures and fears that the inflation woes will last longer, which in turn could trigger a recession, seem to exert downside pressure on the Gold Price.
Recently, the first major US bank to call the recession, namely Deutsche Bank, signaled that the US inflation could keep disappointing the Fed.
On Wednesday, the major central bankers’ readiness to battle inflation, even at the cost of short-term economic slowdown, drowned market sentiment and XAU/USD.
Among them, Fed Chairman Jerome Powell repeated his latest pledge to battle inflation with readiness to announce another 0.75% rate hike if needed. The Fed Boss also praised the US economic strength and helped the US dollar to remain firmer. It’s worth noting that Powell’s comments suggesting challenges for US jobs data during the battle with inflation appears to have weighed on the risk profile of late.
Looking forward, the US the Core Personal Consumption Expenditure (PCE) Price Index, expected 0.4% MoM versus 0.3% prior, will be an important catalyst to watch for short-term directions.
Also read: US PCE Inflation May Preview: Inflation becomes moot
Technical analysis
Gold Price extends pullback from the 61.8% Fibonacci retracement (Fibo.) of May 16 to June 12 upside amid sluggish MACD signals and downbeat RSI line, not oversold.
That said, the precious metal sellers presently flirt with a six-week-long support line near $1,814 with eyes on the monthly bottom surrounding $1,805.
Following that, the $1,800 round figure and the yearly low of $1,786 could lure XAU/USD bears.
On the contrary, an upside break of the 61.8% Fibo. level of $1,822 could escalate the corrective pullback towards a convergence of the 50% Fibonacci retracement level and a fortnight-old resistance line, near $1,833.
Also acting as an upside hurdle is the 200-SMA and the mid-month monthly peak, respectively near $1,840 and $1,858.
Gold: Four-hour chart
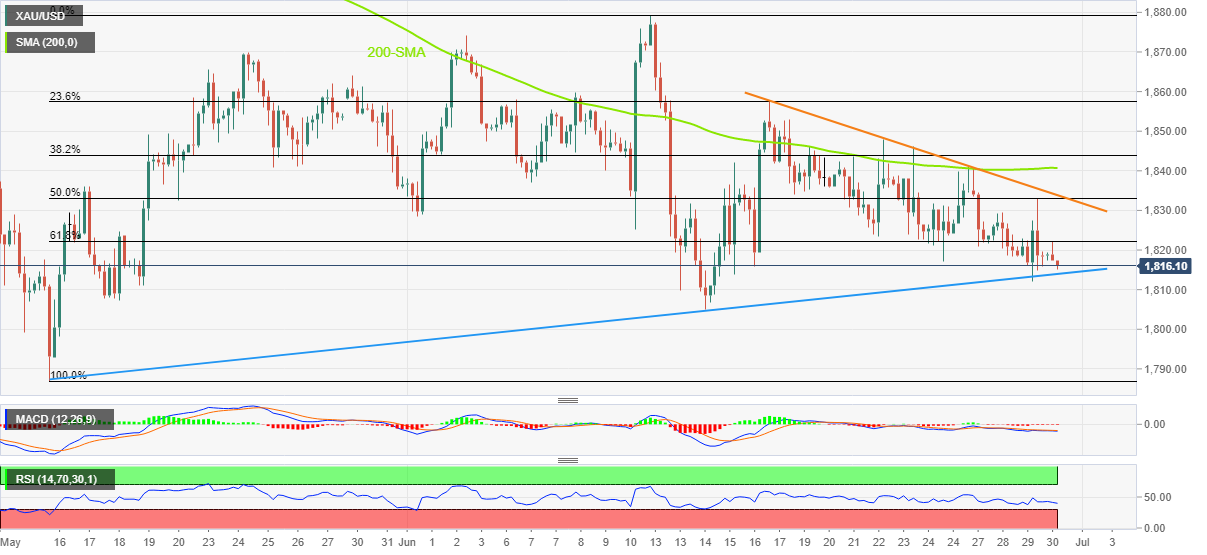
Trend: Further weakness expected
FX Strategists at UOB Group Lee Sue Ann and Quek Ser Leang noted EUR/USD faces a solid support around 1.0350 for the time being.
Key Quotes
24-hour view: “We highlighted yesterday that ‘downward momentum has improved and the risk is on the downside’. We added, ‘any weakness is likely to face solid support at 1.0485’. The anticipated weakness exceeded our expectations as EUR easily cracked 1.0485 and plummeted to 1.0433. While oversold, the rapid decline could extend to 1.0400. For today, a sustained decline below this level is unlikely. Resistance is at 1.0475 followed by 1.0505.”
Next 1-3 weeks: “We have expected EUR to consolidate for close to 2 weeks. Our view was not wrong as EUR consolidated until yesterday (29 Jun) when it plummeted below the bottom of our expected 1.0460/1.0630 range (low of 1.0433). The price actions suggest that the consolidation phase has ended. The risk has shifted to the downside and a break of 1.0400 would not be surprising. That said, 1.0350 is expected to offer solid support. Overall, only a break of the ‘strong resistance’, currently at 1.0535 would indicate that the downside risk has dissipated.”
- GBP/USD has attracted some bids around 1.2106 as the DXY has surrendered 105.00.
- The pound bulls are weakened as the UK economy is facing a very large real income shock.
- UK’s GDP numbers are seen stable while the annual US core PCE Price Index may slip to 4.7%.
The GBP/USD pair has attempted a rebound after sensing less selling pressure while testing Wednesday’s low at 1.2106. To make the rebound a little more trustworthy, the pound bulls need to drive the cable above the intraday high at 1.2140.
On Wednesday, the pound bulls were hammered strongly by the market participants after Bank of England (BOE) Governor Andrew Bailey uncovered inflation risks. BOE Bailey commented that the UK economy is facing a very large real income shock. Well, a country that is operating at a 9.1% inflation rate must be facing harsh consequences of accelerating price pressures.
A higher inflation rate in the UK economy has diminished the value of ‘paychecks’ received by the households. Individuals are spending significantly higher on fossil fuels and food products despite the quantity remaining constant or lower. This has reduced their real income and henceforth, the overall demand. No doubt, the BOE will resort to more rate hike announcements going forward. Going forward, the focus will remain on Gross Domestic Product (GDP) numbers, which are seen as stable at 0.8% and 8.7% for the first quarter on a quarterly and yearly basis.
Meanwhile, the US dollar index (DXY) is expected to extend losses intraday as the asset has surrendered the psychological support of 105.00. In today’s session, investors' focus will remain on the core US Personal Consumption Expenditure (PCE) Price Index. The annual figure may decline to 4.7% from the prior print of 4.9%. However, the monthly figure is seen higher to 0.4% vs. 0.3% reported earlier.
- Steel Price pares intraday gains as traders fears more supplies, economic slowdown.
- China’s official PMIs fail to please metal buyers amid broad pessimism.
- US dollar retreat probes bears ahead of the Fed’s preferred inflation gauge.
Steel Price struggle to extend the weekly gains, bracing for the quarterly loss, as fears of recession join supply woes during Thursday’s Asian session. Even so, industrial metal manages to react to the firmer activity numbers from China.
That said, construction steel rebar on the Shanghai Futures Exchange (SFE) edged up 0.1% around 4,370 yuan per metric tonne, while hot-rolled coil decline 0.1% by the press time. Further, Stainless steel rose 0.8% intraday but stays pressured of late.
Talking about China data, the preliminary readings of official PMIs for May came in better than previous readings. That said, the headline NBS Manufacturing PMI rose to 50.2 versus 49.6 prior, versus 50.4 forecasts. Further, Non-Manufacturing PMI rallied to 54.7 versus 52.5 expected and 47.8 in previous readings.
However, the major central bankers’ readiness to battle inflation, even at the cost of short-term economic slowdown, recently exerts downside pressure on the market sentiment.
Among them, Fed Chairman Jerome Powell repeated his latest pledge to battle inflation with readiness to announce another 0.75% rate hike if needed. The Fed Boss also praised the US economic strength and helped the US dollar to remain firmer. It’s worth noting that Powell’s comments suggesting challenges for US jobs data during the battle with inflation appears to have weighed on the risk profile of late.
While portraying the mood, the US 10-year Treasury yields snap a two-day downtrend as the key bond coupons rebound from the weekly low to 3.10%, up one basis point (bp). The same seems to probe the US dollar buyers as the US Dollar Index (DXY) retreats from a two-week high to 105.00. Further, the S&P 500 Futures drop 0.30% intraday to 3,810 at the latest.
Elsewhere, increasing steel production in Asia and the recent increase in the output appears to have exerted additional downside pressure on Steel Price.
Moving on, the metal prices are likely to remain pressured with today’s US the Core Personal Consumption Expenditure (PCE) Price Index, expected 0.4% MoM versus 0.3% prior, being an important catalyst to watch for short-term directions. Should the Fed’s preferred inflation index remain firmer, the odds of witnessing aggressive rate hikes can’t be ruled out, which in turn appears negative for commodities. Additionally, the higher rates also negatively affect the growth and demand for the industrial metal, offering a double-barrel attack on the metal if today’s US data came in firmer.
- Asian equities are performing mixed as Nikkei225 has tumbled on mixed data.
- A minor correction in the DXY has supported the Asian indices.
- Oil prices have rebounded minutely after a significant correction from $114.00.
Markets in the Asian domain are trading mixed as the Nikkei225 has tumbled on mixed Industrial Production data. Other indices are performing well on subdued performance from the US dollar index (DXY) in the Asian session.
At the press time, China A50 added 1.80%, Hang Seng remained mute, Nifty50 added 0.50% while Japan’s Nikkei225 tumbled 1.52%.
Japan’s indices are underperforming on account of mixed Industrial Production data. The Ministry of Economy, Trade, and Industry from Japan have reported the monthly Industrial Production figure -7.2%, extremely lower vs. -0.3% estimated and the prior release of -1.5%. While the annual figure has improved to -2.8% from the consensus and the former release of -5.9% and -4.9% respectively.
Meanwhile, the US dollar index (DXY) is displaying a subdued performance in the Asian session after a bullish Wednesday. The DXY displayed a firmer upside move after Federal Reserve (Fed) chair Jerome Powell stated that "There are pathways to go back to 2% inflation with a strong labor market; no guarantee." The unavailability of confirmation from Fed Powell on bringing the inflation rate to 2% strengthened the DXY bulls. Going forward, the release of the US core Personal Consumption Expenditure (PCE) Price Index will remain in focus.
On the oil front, the black gold witnessed a steep correction on Wednesday after the comments from central banks in ECB’s annual Forum on Central Banking diminished the growth forecasts. However, a strong rebound has been witnessed in Tokyo.
- USD/RUB licks its wounds around multi-year low amid sluggish session.
- Ukraine hints at no end to Russian grain blockade, Fed’s Powell repeats latest hawkish comments.
- Fears of recession underpin risk-off mood but rebound in Treasury yields probe USD bulls ahead of the key data.
USD/RUB picks up bids to refresh intraday high around 52.82, after falling to the lowest levels since May 2015 the previous day. That said, the Russian ruble (RUB) pair’s latest rebound could be linked to the market’s anxiety before the key inflation number from the US.
On Tuesday, the major central bankers’ readiness to battle inflation, even at the cost of short-term economic slowdown, recently exerts downside pressure on the market sentiment.
Among them, Fed Chairman Jerome Powell repeated his latest pledge to battle inflation with readiness to announce another 0.75% rate hike if needed. The Fed Boss also praised the US economic strength and helped the US dollar to remain firmer. It’s worth noting that Powell’s comments suggesting challenges for US jobs data during the battle with inflation appears to have weighed on the risk profile of late.
ECB President Christine Lagarde, on the other hand, signaled chances of a heavier rate increase in September while also expecting positive growth rates. Further, BOE Governor Andrew Bailey raised concerns about real income shock.
At home, “A deal to end Russia’s blockade of Ukrainian seaports and grain exports remains distant because Moscow is using talks to push its war aims and ambition to dominate the Black Sea, Kyiv’s top negotiator said,” per the Financial Times (FT).
It’s worth noting that the US 10-year Treasury yields snap a two-day downtrend as the key bond coupons rebound from the weekly low to 3.10%, up one basis point (bp). The same seems to probe the US dollar buyers as the US Dollar Index (DXY) retreats from a two-week high to 105.00.
Even so, fears that central bankers are firm in their determination to battle the inflation woes, even at the cost of short-term economic slowdown, seem to weigh on the risk appetite and drown the S&P 500 Futures, down 0.30% to 3,825 at the latest.
Given the scheduled release of the Fed’s preferred inflation gauge for May, namely the Core Personal Consumption Expenditure (PCE) Price Index, expected 0.4% MoM versus 0.3% prior, nothing matters more than the data. However, Russia's ruble-for-oil strategy and the latest jump in energy prices appear to weigh on the USD/RUB prices.
Technical analysis
USD/RUB remains bearish unless crossing the weekly resistance line near 54.00.
- USD/INR picks up bids to reverse the previous day’s pullback from a record high.
- Risk-aversion, firmer USD join INR NDFs, rebound in oil prices to keep pair buyers hopeful.
- US Core PCE Price Index awaited, recession fears hint at the further upside.
USD/INR regains upside momentum, after stepping back from a record top near 79.00 the previous day, even as the USD retreats during Thursday’s Asian session. That said, the pair picks up bids to 78.92 at the latest, following the all-time high of 79.09 marked on Wednesday.
The Indian rupee (INR) pair’s latest gains could be traced to the firmer oil prices, up 0.40% around $110.00 by the press time. Given the Indian dependence on energy imports, strong oil prices weigh on the INR amid a record budget deficit.
At home, the bullish bets on the Non-Deliverable Forwards (NDF) hint at the further USD/INR upside. Reuters conveys the latest USD/INR NDFs around 79.10.
Elsewhere, the risk-off mood challenges the INR prices, even if the US dollar retreats from a two-week high. That said, the major central bankers’ readiness to battle inflation, even at the cost of short-term economic slowdown, recently exerts downside pressure on the market sentiment. Fed Chairman Jerome Powell mostly repeated his latest pledge to battle inflation with readiness to announce another 0.75% rate hike if needed. The Fed Boss also praised the US economic strength and helped the US dollar to remain firmer. ECB President Christine Lagarde, on the other hand, signaled chances of a heavier rate increase in September while also expecting positive growth rates. Further, BOE Governor Andrew Bailey raised concerns about real income shock.
While the USD/INR buyers are bracing for the fresh record high, they would wait for the Fed’s preferred inflation gauge for May, namely the Core Personal Consumption Expenditure (PCE) Price Index, expected 0.4% MoM versus 0.3% prior, for fresh impulse.
Technical analysis
Any pullback remains elusive until USD/INR stays above the previous resistance line from early March, at 78.60 by the press time.
- USD/CAD is likely to display some losses as DXY skids and oil rebounds.
- As per Fed Powell, even a spree of rate hikes doesn’t guarantee the return of the inflation rate to 2%.
- Oil prices witnessed a significant correction as comments from central banks diminishes demand forecasts.
The USD/CAD pair has sensed barricades around the round-level resistance of 1.2900 in the Asian session. The asset has witnessed offers as the US dollar index (DXY) is going through a mild correction after failing to cross the critical hurdle of 105.19. The loonie bulls may drive the asset lower if it slips below the crucial support of 1.2877.
On a broader note, the DXY is principally strong as the Federal Reserve (Fed) looks bound to step up the interest rates further. Fed chair Jerome Powell is dictating on a repetitive note that the Fed is ‘unintentionally committed’ to bringing price stability to the economy. To fulfill the objective, interest rate elevation is the only measure as balance sheet reduction has already been announced.
The Fed has raised its interest rates to 1.50-1.75% in its last three monetary policy meetings, however, no impact has been recorded on the inflation rate. Therefore, more rate hikes look possible in the upcoming policy meets. One thing that has bolstered the DXY for a prolonged period is the statement by Fed Powell that even a spree of rate hikes doesn’t guarantee that the inflation rate will return to 2% from a whopping figure of 8.6% recorded for May.
On the oil front, a firmer rebound has been witnessed in the oil prices. The oil prices witnessed a steep correction on Wednesday after the comments from central banks in ECB’s annual Forum on Central Banking diminished the growth forecasts. It is worth noting that Canada is a leading exporter of oil to the US and a rebound in oil prices may support the loonie bulls.
- USD/JPY dribbles around multi-year high as overbought RSI tests buyers.
- Last weekly top, seven-week-old resistance line guard immediate upside.
- Convergence of 20-SMA, fortnight-old support line restricts short-term declines.
USD/JPY dribbles around the highest levels since 1998, taking rounds to 136.60 during Thursday’s Asian session.
Although overbought RSI and nearly hurdles challenge intraday buyers, the yen pair remains on the bull’s radar after rising for four consecutive days.
That said, the previous multi-year high around 136.70, marked during the last week, appears to restrict the USD/JPY pair’s immediate upside.
Following that, the one-week-old ascending resistance line can challenge the bulls at around 137.00.
In a case where the USD/JPY remains firmer past 137.00, the 61.8% Fibonacci Expansion (FE) of June 16-23 moves, near 137.50, will be in focus.
On the contrary, the 20-SMA and an upward sloping support line from June 16 restrict immediate downside around 135.85. Also challenging the bears are the upbeat MACD signal and bullish RSI divergence.
It’s worth noting that the downside break of 135.85 won’t hesitate to direct USD/JPY bears toward the 100-SMA support of 134.90 while the last Thursday’s low around 134.25 could challenge the sellers afterward.
Overall, USD/JPY remains on the bull’s radar despite recent inaction around the multi-year top.
USD/JPY: Four-hour chart
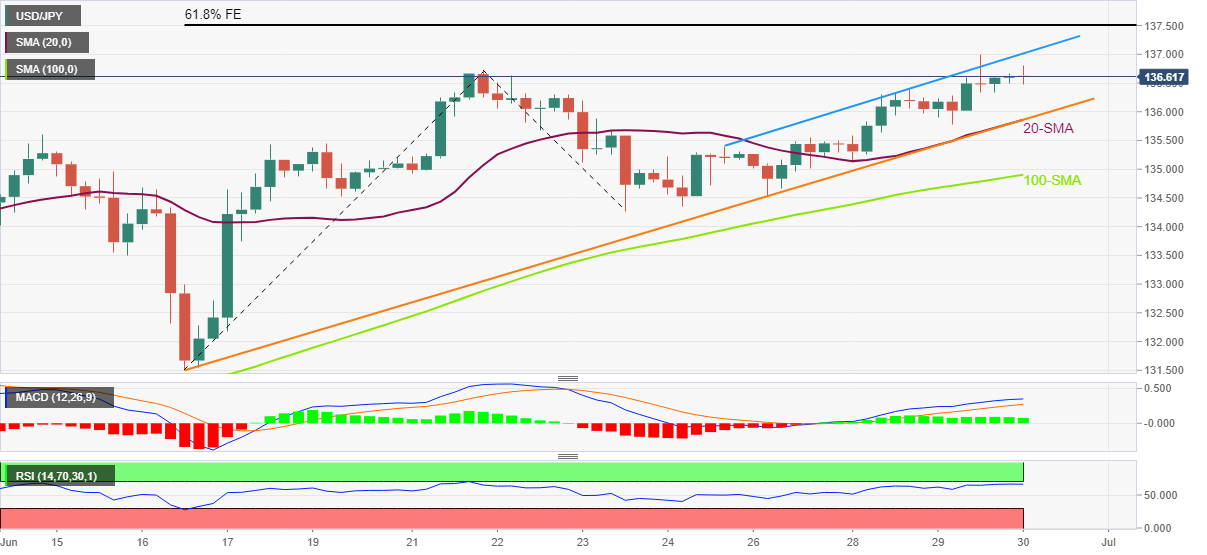
Trend: Further upside expected
- EUR/USD has displayed a modest rebound on a minor correction in the DXY.
- The central banks do not see the return of a lower inflation environment.
- The US PCE Price Index may slip to 4.7% vs. 4.9% recorded earlier.
The EUR/USD pair has witnessed a minor rebound after hovering around 1.0430 in the early Tokyo session. In the past two trading sessions, the asset has fallen like a house of cards after failing to sustain above the round-level resistance of 1.0600. The major extended its losses on Wednesday after violating the psychological support of 1.0500.
The initiation of significant shorts by the market participants escalated on Wednesday after pessimist commentary from European Central Bank (ECB) President Christine Lagarde. In the ECB’s annual Forum on Central Banking, ECB Lagarde cleared that the economy is not going to return to the low inflation environment. Also, the inflation expectations will remain elevated further.
Russia’s invasion of Ukraine and supply chain bottlenecks have resulted in soaring food and energy prices, which have diminished the real income of the households significantly.
Meanwhile, the US dollar index (DXY) has witnessed a minor fall after failing to cross the critical resistance of 105.19. The odds of a consecutive 75 basis point (bps) rate hike by the Federal Reserve (Fed) have advanced as the Fed is ‘unintentionally committed’ to cool the hot-red inflation. This will compel the Fed to announce more rate hikes.
In addition to ECB Lagarde, Fed Powell has also delivered no guarantee of returning higher inflation to the targeted rate of 2%.
Going forward, investors will focus on the release of the US Core Personal Consumption Expenditure (PCE) Price Index, which may decline to 4.7% from the prior print of 4.9% on an annual basis. However, the monthly figure is seen higher to 0.4% vs. 0.3% reported earlier.
OPEC”s top oil exporter, Saudi Arabia, is reported to raise prices of light crude grades to Asia for the second straight month in August, Reuters cites.
The price surge by Saudi comes on the back of record distillate margins and strong spot premiums for Middle Eastern oil this month.
Additional details
The official selling price (OSP) for Saudi's flagship Arab Light crude could rise by about $2.4 a barrel from the previous month, according to nine refining sources surveyed by Reuters on June 28-29.
The price hike would drive the August OSP close to record levels, set when May Arab Light crude reached $9.35 a barrel.
Market reaction
WTI was last seen up 0.48% on the day at $108.80.
- WTI stabilizes below $110.00 ahead of OPEC meeting, oil stockpiles plunge
- The end-of-quarter flows could save the day for Gold Price.
- Policy panel at ECB Forum powered the US dollar, ahead of PCE inflation.
- XAUUSD bulls jump in even as US Treasury yields rebound amid mixed markets.
Fed Chair Jerome Powell’s pledge to control inflation by resorting to aggressive tightening powered the US dollar across the board while widening the policy divergence between the ECB and BOE. This weighed heavily on the non-interest-bearing Gold Price even though the US Treasury yields tumbled amid risk-off flows. With the ECB Sintra Forum out of the way, the end-of-the-quarter flows and the US inflation data will drive the metal’s price action. Any reprieve in gold price is likely to remain temporary amid hawkish Fed stance and growing recession fears, which are likely to keep the safe-haven demand for the dollar buoyed.
Also read: Attention turns to inflation data
Gold Price: Key levels to watch
The Technical Confluence Detector shows that Gold Price is witnessing a dead cat bounce after three straight days of losses. On its recovery mode, the bright metal is challenging strong resistance around $1,822, which is the convergence of the SMA5 one-day and SMA1o four-hour.
The confluence of the Fibonacci 61.8% one-day and the Fibonacci 23.6% one-week at $1,825 will threaten XAU bulls. Further up, bulls will need to crack the $1,831 barrier, where the SMA10 one-day, pivot point one-day R1 and SMA50 four-hour.
The next critical resistance around $1,835 will test the bearish commitments. That level is the meeting point of the SMA100 four-hour, Fibonacci 38.2% one-month and Fibonacci 61.8%
On the flip side, the immediate support is seen at the Fibonacci 38.2% one-day at $1,819, below which the 23.6% Fibonacci level one-day at $1,817 will be probed.
developing story ....
- Copper prices have continued their rangebound moves ahead of Caixin Manufacturing PMI.
- The base metal may display more losses as comments from central banks have lowered the demand forecasts.
- The inflation rate is not expected to return to 2% despite a solid US economy.
Copper Price, per the COMEX Futures, is displaying topsy-turvy moves in the Asian session. The base metal is oscillating in a narrow range of $3.7155-3.8455 this week after remaining in the grip of bears for the whole month. A sigh of relief doesn’t warrant a reversal as advancing recession fears are underpinning more slippage in the overall demand, and eventually in the copper prices.
The commentary from central banks in European Central Bank (ECB)'s annual Forum on Central Banking has cleared that a higher inflation rate will stay for a prolonged period and currently, the households are facing the headwinds of diminished real income.
ECB President Christine Lagarde has cleared that after recognizing the inflation rate above 8%, it is unlikely to return to the environment of low inflation rates. Also, Federal Reserve (Fed) chair Jerome Powell dictated that to cool down the hot-red inflation, a quick rate hiking process is necessary. However, that doesn’t guarantee an inflation rate of around 2%. It will take time but the market participants will start understanding that high inflation rates are a new normal now. Also, this will keep the US dollar index (DXY) at elevated levels for a longer period.
Going forward, investors are focusing on the release of the Caixin Manufacturing PMI, which is due on Friday. A preliminary estimate for the economic data is 50.1, higher than the former figure of 48.1. A higher-than-estimated figure will support the copper prices as it will dictate higher usage of copper in June.
| Raw materials | Closed | Change, % |
|---|---|---|
| Brent | 115.34 | -1.6 |
| Silver | 20.746 | -0.4 |
| Gold | 1818.2 | -0.07 |
| Palladium | 1957.09 | 4.55 |
- AUD/JPY takes the bids to refresh intraday high but stays inside short-term trading range.
- China’s official PMIs for June came in better than previous, yields bounce off weekly low.
- Downbeat Japan data adds strength to the corrective pullback.
- Market sentiment remains sour amid recession, inflation fears.
AUD/JPY renews intraday high around 94.15 as the quote cheers upbeat data from China, as well as a rebound in the US Treasury yields, during Thursday’s Asian session.
That said, China’s preliminary readings of official PMIs for June came in better than previous with the headline NBS Manufacturing PMI rising to 50.2 versus 49.6 prior, versus 50.4 forecasts. Further, Non-Manufacturing PMI rallied to 54.7 versus 52.5 expected and 47.8 in previous readings.
Earlier in the day, preliminary readings of Japan’s Industrial Production for May slumped to -7.2% MoM versus -0.3% expected and -1.5% prior.
It’s worth noting that the US 10-year Treasury yields snap a two-day downtrend as the key bond coupons rebound from the weekly low to 3.10%, up one basis point (bp).
Even so, fears that central bankers are firm in their determination to battle the inflation woes, even at the cost of short-term economic slowdown, seem to weigh on the risk appetite and drown the S&P 500 Futures, down 0.30% to 3,825 at the latest.
In addition to the recession fears, AUD/JPY buyers also witness hardships due to the market’s anxiety ahead of the Fed’s preferred inflation gauge, namely the Core Personal Consumption Expenditure (PCE) Price Index, for May, expected 0.4% MoM versus 0.3% prior.
Technical analysis
Bearish MACD signals and steady RSI keeps AUD/JPY sellers hopeful even though the quote seesaws between the monthly support line and a three-week-long resistance line, respectively around 93.60 and 94.40.
- GBP/USD remains pressured around two-week low, prints four-day downtrend.
- Clear downside break of seven-week-old horizontal area joins bearish MACD signals, downbeat RSI to favor sellers.
- Bulls to remain skeptical unless crossing monthly resistance line.
GBP/USD struggles around a fortnight low while defending 1.2100 during Thursday’s Asian session. In doing so, the Cable pair portrays the mixed sentiment of traders ahead of the UK Gross Domestic Product (GDP) and the Fed’s preferred inflation gauge, namely the Core Personal Consumption Expenditure (PCE) Price Index.
Despite the recent corrective pullback, the quote maintains the previous day’s downside break of a horizontal support since May 12, now resistance around 1.2155-70. Also keeping the pair sellers hopeful area the bearish signals from the MACD and the RSI (14).
That said, the 23.6% Fibonacci retracement (Fibo.) of May-June fall, around 1.2100, challenge the quote’s immediate downside ahead of the 1.2000 psychological magnet.
Following that, the GBP/USD south-run could aim for the yearly low of 1.1933 before declining further.
Alternatively, recovery remains elusive until the quote stays below 1.2170, a break of which could direct the pair towards the 38.2% Fibonacci retracement level of 1.2215.
It should be noted, however, that the confluence of the 20-DMA, fortnight-old resistance line and 50% Fibonacci retracement appears a tough nut to crack for GBP/USD bulls around 1.2300.
GBP/USD: Daily chart
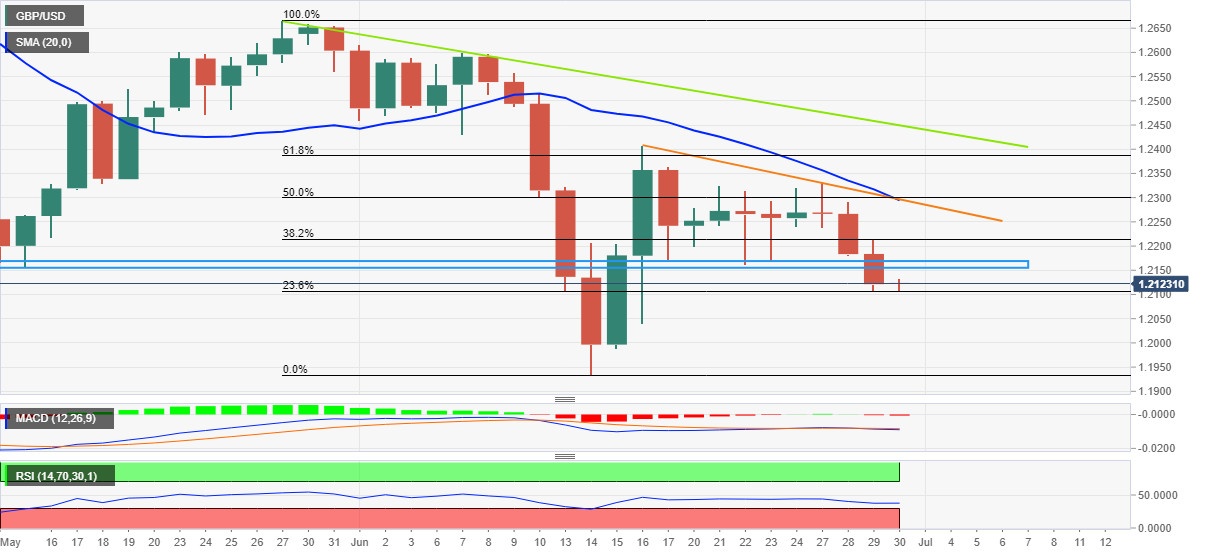
Trend: Bearish
- NZD/USD bounces off two-week low after better-than-previous China PMI data.
- NZ Business Confidence remains downbeat, RBNZ’s Conway failed to impress bulls.
- China’s NBS Manufacturing PMI eased below forecasts, Non-Manufacturing PMI came stronger.
- Risk-off mood challenges pair buyers ahead of Fed’s preferred inflation gauge.
NZD/USD bears take a breather around a fortnight's low after China’s monthly PMI data during Thursday’s Asian session. The kiwi pair initially dropped to the two-week low of 0.6198 before bouncing back to 0.6215. However, the risk-aversion wave and downbeat business confidence at home keep sellers hopeful.
China’s preliminary readings of official PMIs came in better than previous for May. That said, the headline NBS Manufacturing PMI rose to 50.2 versus 49.6 prior, versus 50.4 forecasts. Further, Non-Manufacturing PMI rallied to 54.7 versus 52.5 expected and 47.8 in previous readings.
At home, ANZ Business Confidence dropped to -62.6 versus -33.2 forecast and -55.6 prior whereas the ANZ Activity Outlook slipped below 1.7% forecast and -4.7% previous readings to -9.1% for June.
Earlier in the day, Reserve Bank of New Zealand (RBNZ) Chief Economist Paul Conway tried to defend the central bank’s hawkish bias while suggesting that it will help the domestic housing market. However, the policymaker failed to impress buyers amid macro fears of economic slowdown and a firmer US dollar.
“Policy tightening will likely see actual house prices move back towards sustainable levels more in line with market fundamentals,” said RBNZ’s Conway.
The risk-off mood could also be witnessed via the US stock futures and the Treasury yields. That said, S&P 500 Futures print a four-day downtrend while the US 10-year Treasury yields drop for the third consecutive day, down one basis point (bp) to 3.087% at the latest. It should be noted that Wall Street closed mixed the previous day even as central bankers reiterated their readiness to battle inflation, even at the cost of short-term economic slowdown.
Moving on, the Fed’s preferred inflation gauge, namely the Core Personal Consumption Expenditure (PCE) Price Index, for May, expected 0.4% MoM versus 0.3% prior, will be a crucial catalyst for the NZD/USD prices.
Technical analysis
A clear downside break of the seven-week-old horizontal support area, now resistance around 0.6215-20 keeps NZD/USD bears hopeful to refresh the yearly low.
- AUD/USD remains pressured around intraday low, despite the latest rebound.
- China’s NBS Manufacturing PMI came in softer than expected, Non-Manufacturing PMI crossed forecasts and prior during May.
- Yields stay pressured but stock futures dwindle amid sluggish markets despite recession, inflation fears.
- US Core PCE Price Index for May will be crucial after Fed’s Powell sounds hawkish.
AUD/USD welcomes upbeat China PMI while picking up bids at around a two-week low during Thursday’s Asian session. In doing so, the Aussie pair leans recovers from the recently flashed bottom of 0.6853, at 0.6873 by the press time.
China’s preliminary readings of official PMIs came in better than previous for May. That said, the headline NBS Manufacturing PMI rose to 50.2 versus 49.6 prior, versus 50.4 forecasts. Further, Non-Manufacturing PMI rallied to 54.7 versus 52.5 expected and 47.8 in previous readings.
It’s worth noting that the trader’s anxiety ahead of the Fed’s preferred inflation gauge, namely the Core Personal Consumption Expenditure (PCE) Price Index, for May, expected 0.4% MoM versus 0.3% prior, weighs on the market sentiment and the AUD/USD prices.
While portraying the mood, S&P 500 Futures print a four-day downtrend while the US 10-year Treasury yields drop for the third consecutive day, down one basis point (bp) to 3.087% at the latest. It should be noted that Wall Street closed mixed the previous day even as central bankers reiterated their readiness to battle inflation, even at the cost of short-term economic slowdown.
In addition to the pre-data caution, fears of recession and recently downbeat numbers from China also challenge market optimists and allow AUD/USD bears to keep reins. Even so, the quote is near to the important supports and the pre-data mood signals the corrective pullback ahead of the US PCE inflation numbers.
Also read: US PCE Inflation May Preview: Inflation becomes moot
Technical analysis
Any AUD/USD rebound needs validation from the 10-DMA and a two-week-old resistance line, respectively around 0.6920 and 0.6935. That said, the pair’s sustained trading below a fortnight-old descending trend line and the 10-DMA, not to forget the bearish MACD signals, direct the quote towards the yearly low of 0.6828 even if the adjacent key support line from May 12, near 0.6860, precedes the monthly low of 0.6850 to challenge immediate downside.
The official purchasing managers' index (PMI) for China's manufacturing sector expanded to 50.2 in June from 49.6 in May, the latest data published by the National Bureau of Statistics (NBS) showed on Thursday. The actual data missed the consensus estimate of 50.5.
Meanwhile, the country’s Non-Manufacturing PMI rebounded firmly to 54.7 in June vs. 52.5 expected and 47.8 booked in May.
A reading above 50 indicates expansion, while a reading below suggests contraction.
Market reaction
Mixed NBS PMI numbers put a fresh bid under the aussie dollar, with AUD/USD popping up 10-pips to near 0.6875. The pair is down 0.15% on the day at the time of writing.
- GBP/JPY takes offers to refresh intraday low, prints three-day downtrend.
- Bearish MACD signals hint at further downside below immediate DMA support.
- Weekly resistance line holds the key to buyer’s entry, seven-week-long support line appears crucial for bears.
GBP/JPY remains on the back foot for the third consecutive day, despite the sellers' recent struggle to break the 20-DMA support during Thursday’s Asian session. That said, the cross-currency pair refreshes intraday low near 165.50 by the press time.
Given the quote’s sustained weakness, as portrayed by the bearish MACD signal, coupled with the trading below the one-week-old descending resistance line, the GBP/JPY prices are likely to remain weak.
It’s worth noting, however, that a clear downside break of the 20-DMA support near 165.50 becomes necessary for the intraday sellers before they aim for the ascending support line from May 12, at 164.25 by the press time.
Should the GBP/JPY prices remain weak past 164.25, the 50-DMA level of 162.77 can challenge the bears before directing them to the monthly low of 160.00.
Meanwhile, recovery moves need validation from the weekly resistance line, close to 166.40 at the latest.
Following that, the recent swing high and the monthly top, surrounding 167.85 and 168.75 in that order, will challenge the GBP/JPY bulls.
If at all the quote rises past 168.75, the odds of witnessing a run-up towards the 170.00 threshold can’t be ruled out.
GBP/JPY: Daily chart
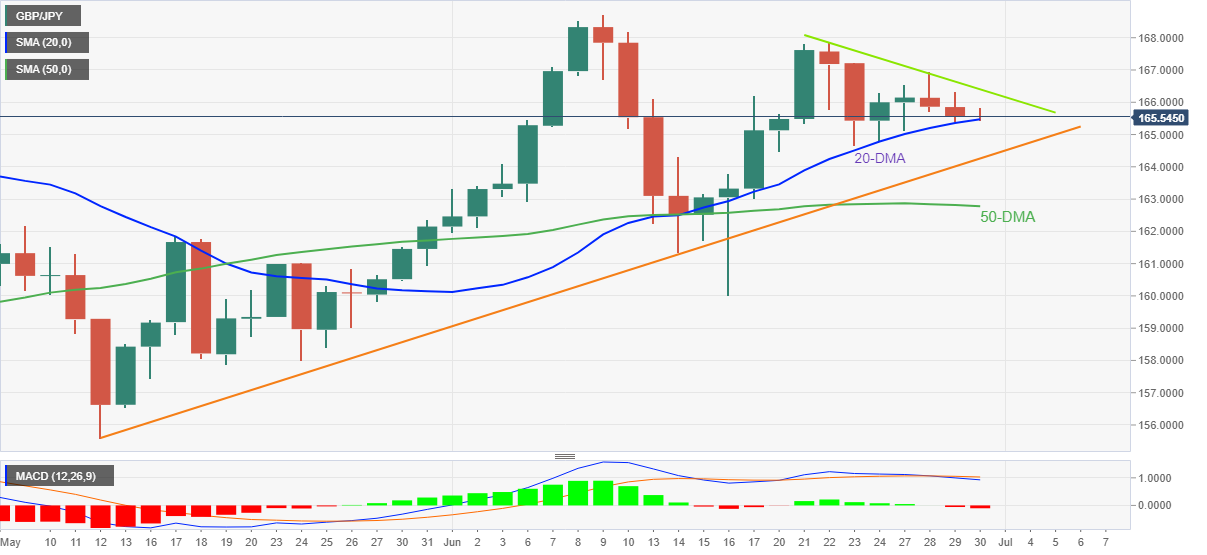
Trend: Further weakness expected
The People’s Bank of China (PBOC) set the USD/CNY reference rate at 6.7114 on Thursday when compared to the previous fix and the previous close at 6.7035 and 6.7000 respectively.
China’s central bank injected 80 billion yuan via seven-day reverse repos at 2.10% vs prior 2.10%.
- USD/JPY is inching higher to recapture its fresh 23-year high around 137.00.
- The DXY has strengthened on the expectations of a prolonged higher rates scenario in the US.
- Japan’s mixed Industrial production data has weakened the yen bulls further.
The USD/JPY pair is aiming to recapture its fresh 23-year high around 137.00 as the US dollar index (DXY) has strengthened on hawkish commentary from Federal Reserve (Fed) chair Jerome Powell. In his speech at European Central Bank (ECB)'s annual Forum on Central Banking, Fed Powell has continued dictating the Fed’s objective of bringing price stability to the US economy.
As per remarks from Fed Powell, the US economy is rock solid considering the overall demand and the tight labor market. This makes it efficient to bear the consequences of the rapid rate hiking process. Accelerating price pressures have hit the real income of the households, however, the economy is strong enough to face the headwinds.
To contain the soaring price rise, the only measure is the announcement of interest rate hikes. However, the statement from Fed Powell that they don’t guarantee an inflation rate near 2% has spooked the market sentiment. This uncovers a prolonged upside for the US dollar index (DXY) as lower interest rates in the developed economy will be a bed-time story for the market participants. The DXY is advancing to reclaim its 19-year high at 105.79.
On the Tokyo front, mixed economic data has weakened the yen bulls further. The monthly Industrial Production figures have plunged to -7.2% vs. -0.3% estimated and the prior release of -1.5%. While the annual figure has improved to -2.8% from the consensus and the former release of -5.9% and -4.9% respectively.
- US dollar holds in the bullish territory following a mixed US session.
- US data will be important for the remainder of the week, PCE eyed.
The US dollar was higher on Wednesday following the Federal Reserve Chairman Jerome Powell explaining that there is a risk the US central bank's interest rate hikes will slow the economy too much.
US stocks were jittery due to the concerns about the economy and on the back of data that showed the US economy shrank more than previously estimated. The Dow Jones Industrial Average rose 0.3% to 31,029.31, while the S&P 500 fell 0.1% at 3,818.83 and the Nasdaq Composite ended in the red also to11,177.89. The US 10-year yield sank 10.5 basis points to 3.10% as inflation worries hounded investors.
The dollar index (DXY), which measures the greenback against six counterparts, rallied to a high of 105.149 from a low of 104.356 as investors sought safety in US assets as stocks declined globally due to the mounting risk of a recession. Nevertheless, the US dollar index stayed below the two-decade high of 105.79 pinged two weeks ago.
Looking ahead, data will be key and analysts at Westpac explained, ''weakness in personal income is raising concerns over purchasing power as households run down savings for personal spending.''
''Although PCE inflation looks to have crested, price pressures will only slowly abate through 2022. Initial jobless claims are set to remain at a low level and concerns around supply issues will remain prominent in June’s Chicago PMI.''
Meanwhile, from a positioning standpoint, speculators’ net long USD index positions ticked a little higher having surged to their highest levels since March 2017 the previous week as the market prepared for this month’s 75 bp rate hike from the Fed.
''Speculation is beginning to emerge that the market may have over-estimated the extent to which the Fed may have to hike rates. This could soften net USD positions in forthcoming data,'' analysts at Rabobank argued.


© 2000-2026. Bản quyền Teletrade.
Trang web này được quản lý bởi Teletrade D.J. LLC 2351 LLC 2022 (Euro House, Richmond Hill Road, Kingstown, VC0100, St. Vincent and the Grenadines).
Thông tin trên trang web không phải là cơ sở để đưa ra quyết định đầu tư và chỉ được cung cấp cho mục đích làm quen.
Giao dịch trên thị trường tài chính (đặc biệt là giao dịch sử dụng các công cụ biên) mở ra những cơ hội lớn và tạo điều kiện cho các nhà đầu tư sẵn sàng mạo hiểm để thu lợi nhuận, tuy nhiên nó mang trong mình nguy cơ rủi ro khá cao. Chính vì vậy trước khi tiến hành giao dịch cần phải xem xét mọi mặt vấn đề chấp nhận tiến hành giao dịch cụ thể xét theo quan điểm của nguồn lực tài chính sẵn có và mức độ am hiểu thị trường tài chính.
Sử dụng thông tin: sử dụng toàn bộ hay riêng biệt các dữ liệu trên trang web của công ty TeleTrade như một nguồn cung cấp thông tin nhất định. Việc sử dụng tư liệu từ trang web cần kèm theo liên kết đến trang teletrade.vn. Việc tự động thu thập số liệu cũng như thông tin từ trang web TeleTrade đều không được phép.
Xin vui lòng liên hệ với pr@teletrade.global nếu có câu hỏi.
ngân hàng