- Phân tích
- Tin tức và các công cụ
- Tin tức thị trường
Tin tức thì trường
- Silver holds lower ground as it fades Friday’s rebound from six-week low.
- Sluggish MACD, downbeat RSI favor sellers targeting fresh yearly lows.
- Two-month-old resistance line, monthly high and 200-DMA challenge buyers.
Silver (XAG/USD) prices remain pressured around $21.15, after reversing from $21.53 the previous day, as bears keep reins during Tuesday’s quiet Asian session.
In doing so, the bright metal remains below the downward sloping resistance line from late April amid sluggish MACD and RSI conditions, which in turn suggest the metal’s further downside.
That said, a mid-June swing low near $20.90 can offer immediate support to the XAG/USD before directing it to the $20.60-45 horizontal support area including the yearly low.
Although the RSI (14) may challenge the silver bears around the $20.60-45 zone, a clear break of the same support region won’t hesitate to direct the quote towards the 61.8% Fibonacci Expansion (FE) of April 20 to June 06 moves, near $19.45.
Meanwhile, recovery remains elusive below the aforementioned two-month-old resistance line, at $21.85 by the press time.
Following that, the monthly high and the 200-DMA, respectively near $22.51 and $23.30, will be important to watch.
In a case where the silver buyers keep reins past $23.30, the odds of witnessing a rally towards April’s peak of $26.22 can’t be ruled out.
Silver: Daily chart
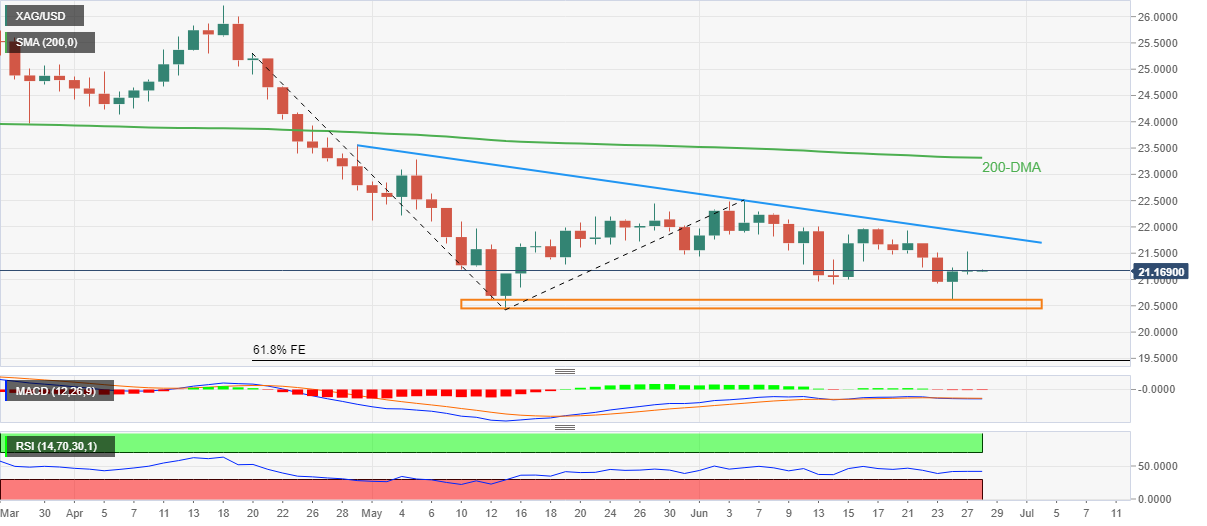
Trend: Further downside expected
- USD/JPY is failing to surpass 135.50 as the DXY is trading lackluster.
- The US Consumer Confidence will bring a significant action in the asset.
- A mixed performance is expected from Japan's Retail Trade.
The USD/JPY pair has slipped below 135.40 after struggling to overstep the critical hurdle of 135.50 multiple times on Monday. On a broader note, the asset is oscillating in a range of 134.27-135.55 for the past week amid the unavailability of any potential trigger that could fetch significant bids/offers on the counter.
The US dollar index (DXY) is struggling to contain the round-level resistance of 104.00 despite the upbeat US Durable Goods Orders. The US Census Bureau reported the economic data at 0.5%, significantly higher than the forecasts of 0.1% and the former release of 0.5%.
Investors were worried over the aggregate demand structure as lower estimates for the Durable Goods Orders were intensifying the recession fears. Now, the upbeat figures may provide more freedom to the Federal Reserve (Fed) to announce more policy tightening measures without much hesitation.
Going forward, investors will keep an eye over the release of the US Consumer Confidence data, which will dictate the confidence of the consumers in the economic activities. A higher print determines strong demand from the households, which will further support the greenback.
On the Tokyo front, Wednesday’s Retail Trade data will keep investors busy. A preliminary estimate for the yearly Retail Trade is 3.3%, higher than the former print of 2.9%. While the monthly Retail Trade may drop to -0.1% vs. 0.8% recorded earlier.
- WTI picks up bids to refresh intraday high, pokes one-week high during three-day uptrend.
- OPEC+ forecasts, US emergency oil reserve updates join fears of ban on Russian oil imports to favor bulls.
- Risk-off sentiment, US dollar rebound challenge upside momentum.
- Weekly inventory numbers, US CB Consumer Confidence to direct intraday moves, risk catalysts are the key.
WTI bulls attack $109.00 during a three-day uptrend to the initial Asian session on Tuesday. The black gold’s latest advances could be linked to the headlines concerning fears of a supply crunch, mainly emanating from the US and due to the sanctions on Russia. Adding to the energy benchmark’s strength could be the chatters surrounding OPEC+ forecasts for 2022 market surplus.
As per the latest updates from Reuters, “US crude inventory in the Strategic Petroleum Reserve (SPR) fell by 6.9 million barrels in the week to June 24, according to data from the Department of Energy.” The news also mentioned that stockpiles in the Strategic Petroleum Reserve (SPR) fell to 497.9 million barrels, the lowest since April 1986, according to the data.
Elsewhere, Reuters came out with the news citing an internal report prepared for the upcoming Joint Technical Committee (JTC) meeting, scheduled for Thursday, to report a revised down forecast of the oil market surplus for 2022. “OPEC+ trimmed its oil market surplus forecast for 2022 to 1 million barrels per day (bpd) from 1.4 million bpd previously,” said the news.
Furthermore, the Group of Seven (G7) leaders showed readiness to increase hardships for Russian oil and gold while political turmoil in Libya also contributed to the black gold’s upside momentum.
On the contrary, recession fears join the likely US-Iran talks to challenge the WTI crude oil buyers. On the same line are concerns surrounding central bank aggression.
Moving on, weekly prints of the oil inventories by the American Petroleum Institute (API) and the Energy Information Administration (EIA), as well as the US CB Consumer Confidence for June, could entertain oil traders. However, major attention will be given to risk catalyst and OPEC meeting for clear directions.
Technical analysis
A clear upside break of the previous support line from early April, around $107.50 by the press time, keeps WTI bulls hopeful. However, the 50-DMA hurdle surrounding $109.30 guards the recovery moves.
- GBP/USD extends pullback from one-week high as NIP Bill passes the UK’s House of Commons vote.
- Convergence of 50-SMA, two-week-old ascending trend line restricts immediate downside.
- RSI retreat, pullback from 100-SMA adds strength to the bearish bias.
- 200-SMA adds to the upside filters, sellers can aim for fresh monthly low.
GBP/USD remains pressured around 1.2260 as bears jostle with the short-term key supports following the fresh Brexit news during late Monday, early Tuesday for Asia.
That said, the UK’s House of Commons had enough votes to pass the controversial Northern Ireland Protocol (NIP) even as the European Union (EU) warned of trade wars if the British policymakers progress with the actions.
Read: Northern Ireland Protocol (NIP) Bill passes UK House of Commons vote
Technically, the cable pair keeps the previous day’s pullback from the 100-SMA towards challenging a convergence of the 50-SMA and a fortnight-long support line, near 1.2255 by the press time.
Given the RSI (14) retreats and the failure to cross key SMA, not to forget Brexit news, the GBP/USD prices are likely to break the immediate support.
Following that, the 1.2200 round figure and 23.6% Fibonacci retracement (Fibo.) of May 27 to June 14 downside, near 1.2108, could probe the bears on their way to refresh the monthly low, currently around 1.1935.
Meanwhile, the 100-SMA level near 1.2310 guards the immediate recovery of the GBP/USD pair ahead of the 61.8% Fibonacci retracement level near 1.2390.
In a case where the Cable pair rises past 1.2390, the 200-SMA level of 1.2400 could act as the last defense of the bears.
GBP/USD: Four-hour chart
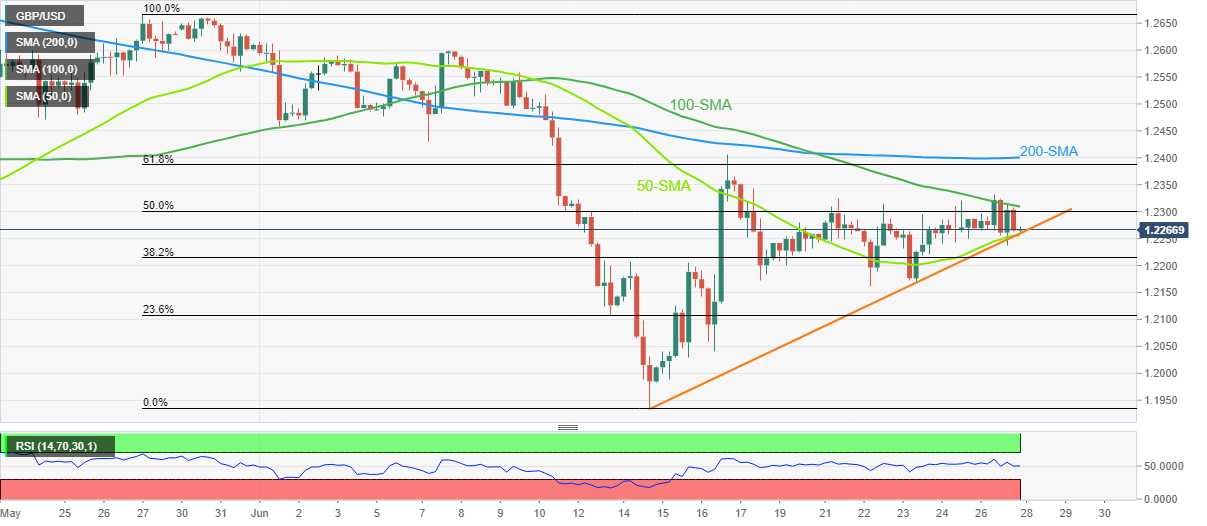
Trend: Further weakness expected
- A slippage below 0.9545 will trigger the M-formation and eventually strengthen the Swiss franc bulls.
- The Falling Channel formation indicates that the asset is biased towards the south-side move.
- Declining 50-EMA at 0.9652 adds to the downside filters.
The USD/CHF pair is displaying back and forth moves in a narrow range of 0.9552-0.9556 in the early Tokyo session. The major has turned sideways after a perpendicular downside move, which signals a phase of inventory distribution.
The formation of a Falling Channel on a four-hour scale is advocating the Swiss franc bulls. The upper portion and lower portion of the chart pattern are plotted from June 17 high and & low at 0.9733 and 0.9628 respectively. Investors should keep May 27 low at 0.9545 on their radar as a violation of the same may trigger the formation of the M-pattern.
The 50-period Exponential Moving Average (EMA) at 0.9652 is declining strongly, which adds to the downside filters.
Meanwhile, the Relative Strength Index (RSI) (14) has shifted into a bearish range of 20.00-40.00, which indicates more downside ahead.
Should the asset drop below Friday’s low at 0.9522, the M-formation will get activated, which will strengthen the Swiss franc bulls for a downside move towards April 21 low at 0.9458, followed by April 14 low at 0.9413.
On the flip side, the Swiss franc bulls could lose their grip if the asset oversteps Wednesday’s high at 0.9690. This will drive the asset towards June 17 high at 0.9733. A breach of the June 17 high will expose the asset to more upside towards June 9 high at 0.9817.
USD/CHF four-hour chart
-637919670185914036.png)
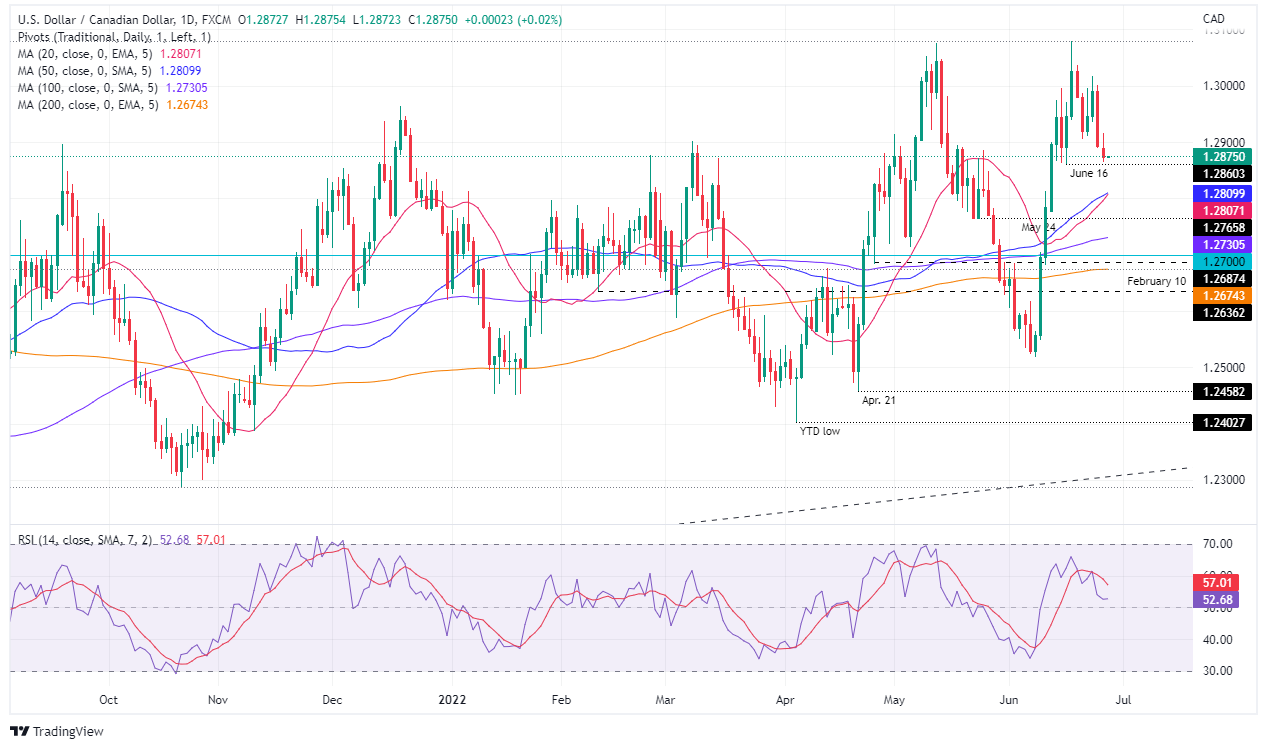
- The Loonie extended its gains on Monday, as shown by the USD/CAD falling 0.16%.
- The USD/CAD fell courtesy of a dismal sentiment and higher crude oil prices.
- USD/CAD Price Forecast: Might further extend its losses once it breaks below 1.2860.
The USD/CAD extends its losses to two consecutive days, bolstered by rising US crude oil prices, which benefits the Canadian dollar, a headwind for the USD/CAD. At around 1.2875, the USD/CAD reached a fresh two-week low on Monday.
Sentiment remains negative after Wall Street’s finished with minimal losses. Portfolio rebalancing, amongst news of Russia’s default, dragged equities lower. In the meantime, the Loonie benefitted from WTIs extended recovery, with the US crude oil benchmark clinging to the $109.90s area after reaching a weekly high of around $110.22 per barrel.
In the meantime, the US Dollar Index is heavy, losing 0.17%, at around 103.944, as it tries to stage a recovery above the 104.000.
Over the weekend, the Canadian Finance Minister Chrystia Freeland said the economy still has a path to a “soft landing,” where it could stabilize economically after the blow of the COVID-19 pandemic without facing a severe recession that many fear.
In the meantime, US economic data, which market participants mainly ignored, US Durable Good Orders surprised to the upside, rising 0.7% MoM, higher than the 0.1% estimations. Additionally, US Pending Home Sales rose in May by 0.7% MoM, smashing the expectations of a -3.9% contraction, as mortgage applications remain down weighed by higher mortgage rates, spurred by the US Federal Reserve tightening cycle.
In the week ahead, the Canadian docket will feature the GDP on Thursday. Markets anticipate further monetary policy tightening at the Bank of Canada’s July 13 meeting after June’s 50 basis point increase.
On the US front, the docket will feature CB Consumer Confidence for June, estimated at 100.4, less than May’s 106.4. that alongside Wholesale inventories, Trade Balance, Regional Fed Indices reports, and Fed speakers.
USD/CAD Price Forecast: Technical outlook
Daily chart
At the time of writing, the USD/CAD is pressing towards the June 16 daily low at 1.2860, a level that, once broken, would pave the way for further losses, exposing the confluence of the 20 and 50-day exponential moving averages (EMAs) around 1.2807-09. A decisive break would send the pair tumbling to the May 24 swing low at 1.2765, followed by a test of the 100-EMA at 1.2730.
“Proposed legislation to allow the UK to unilaterally rip up Brexit arrangements for Northern Ireland at the risk of a trade war with the EU passed the second reading stage in the House of Commons on Monday night,” said The Guardian (TG).
Key quotes
As expected the Northern Ireland protocol bill passed its first hurdle, with MPs voting 295 to 221 in favor despite heavy criticism from some Conservative backbenchers, including former Prime Minister Theresa May, who said the move is illegal and unnecessary.
The second reading was the first opportunity MPs have had to vote on the controversial proposals, which the Foreign Secretary, Liz Truss, said were “legal and necessary”.
It is now expected to be fast-tracked through parliament with a condensed committee stage of just three days, instead of the usual two or three weeks.
The bill would create a “green channel”, free of checks, for goods passing from Great Britain to Northern Ireland that are not destined for the Irish republic; allow products to be sold in Northern Ireland under either EU or UK rules; and give UK ministers more power to alter tax and spending policies in Northern Ireland.
Market reaction
GBP/USD extends pullback from over a week’s high towards refreshing intraday low near 1.2265 following the news.
- EUR/USD bulls take a breather around two-week high, pauses two-day uptrend.
- US dollar recovers on fresh fears of inflation/recession emanating from the US data.
- Headlines surrounding Russia, anxiety ahead of ECB Forum adds strength to the risk-off mood.
- US CB Consumer Confidence, comments from ECB policymakers eyed for intraday directions.
EUR/USD holds onto the pullback from a two-week high as bulls get rejections from short-term key resistances, as well as risk-off mood, during Tuesday’s Asian session. That said, the major currency pair remains pressured around 1.0585 by the press time, after reversing from a fortnight top before a few hours.
The quote managed to extend Friday’s recovery moves amid cautious optimism in the markets, considering mixed US data and optimism ahead of this week’s key European Central Bank (ECB) Forum. However, challenges to risk appetite emanated from the headlines surrounding Russia and China, which later on joined upbeat US economics to weigh on the sentiment and exerted fresh downside pressure on the EUR/USD.
Russia rejects default on paying external debt by saying Euroclear not accepting Russia’s euro bond transaction 'is not our problem'. “Russian gold and forex reserves are blocked unlawfully. Russia made payment on euro bond coupons in May,” adds Kremlin in a statement.
Recently, global rating agency Moody’s mentioned that Russia's failure to make its coupon payment results in a default. Additionally, former Russian President Dmitry Medvedev also crossed wires, via Reuters, while saying, “Any attempt by a NATO nation to encroach upon Crimea constitutes a declaration of war against Russia and may trigger the outbreak of world war III.”
Elsewhere, US Durable Goods Orders rose to 0.7% in May, versus 0.1% expected and 0.4% prior. That said, the widely tracked Nondefense Capital Goods Orders ex Aircraft also cross 0.3% market forecasts and previous readings to increase by 0.5% during the stated month. Further, the US Pending Home Sales also surprised the USD bulls with 0.7% MoM figures for May versus -3.7% expected and -4.0% prior. The YoY figures, however, came in negative to -13.6% versus -9.8% prior. Further, Dallas Fed Manufacturing Business Index for June dropped to the lowest level since May 2020, to -17.7 versus -3.1 forecasts and -7.3 prior.
Amid these plays, Wall Street closed in the red, after an upbeat start, whereas the US 10-year Treasury yields gained nearly seven basis points (bps) to end Monday at around 3.20%.
Moving on, US CB Consumer Confidence for June, prior to 106.4, will join the ECB policymakers’ comments, including President Christine Lagarde, to entertain EUR/USD traders.
Technical analysis
EUR/USD battles the 21-DMA hurdle around 1.0585 following a failure to cross a four-month-old descending resistance line, at 1.0161 by the press time. Also acting as an upside hurdle is the 1.0640-45 horizontal area comprising multiple level marked since early March. That said, the gradual recovery of the RSI (14) line hints at the EUR/USD pair’s further upside.
Meanwhile, pullback moves remain elusive until breaking a two-week-old support line near 1.0545.
- AUD/USD is leaning bullish for the day ahead as the greenback toys with 104 DXY.
- A break of current highs 0.6925 will put the bias in the bull's hands.
AUD/USD is consolidated at the start of the Asian day following some back and forth at the start of the week. The Aussie is trading at 0.6922 and will be dependent on the trajectory of the greenback in the absence of domestic data this week other than Retail Sales tomorrow.
''While consumer sentiment has slumped given rising inflation and a lower confidence around the economic outlook, household balance sheets are in good shape,'' analysts at TD Securities said in respect of today's data. ''Further, a strong labour market should keep household spending elevated. A strong retail beat will boost the case for another aggressive move by the RBA in July after their outsized 50bps hike.''
Meanwhile, the greenback has been a head-turner. Speculators’ net long USD index positions ticked a little higher having surged to their highest levels since March 2017 the previous week as the market prepared for this month’s 75 bp rate hike from the Fed. However, the spot market, as per the DXY, has been testing below 104 which opens the risk of a deeper move into 103.
''Speculation is beginning to emerge that the market may have over-estimated the extent to which the Fed may have to hike rates. This could soften net USD positions in forthcoming data,'' analysts at Rabobank argued.
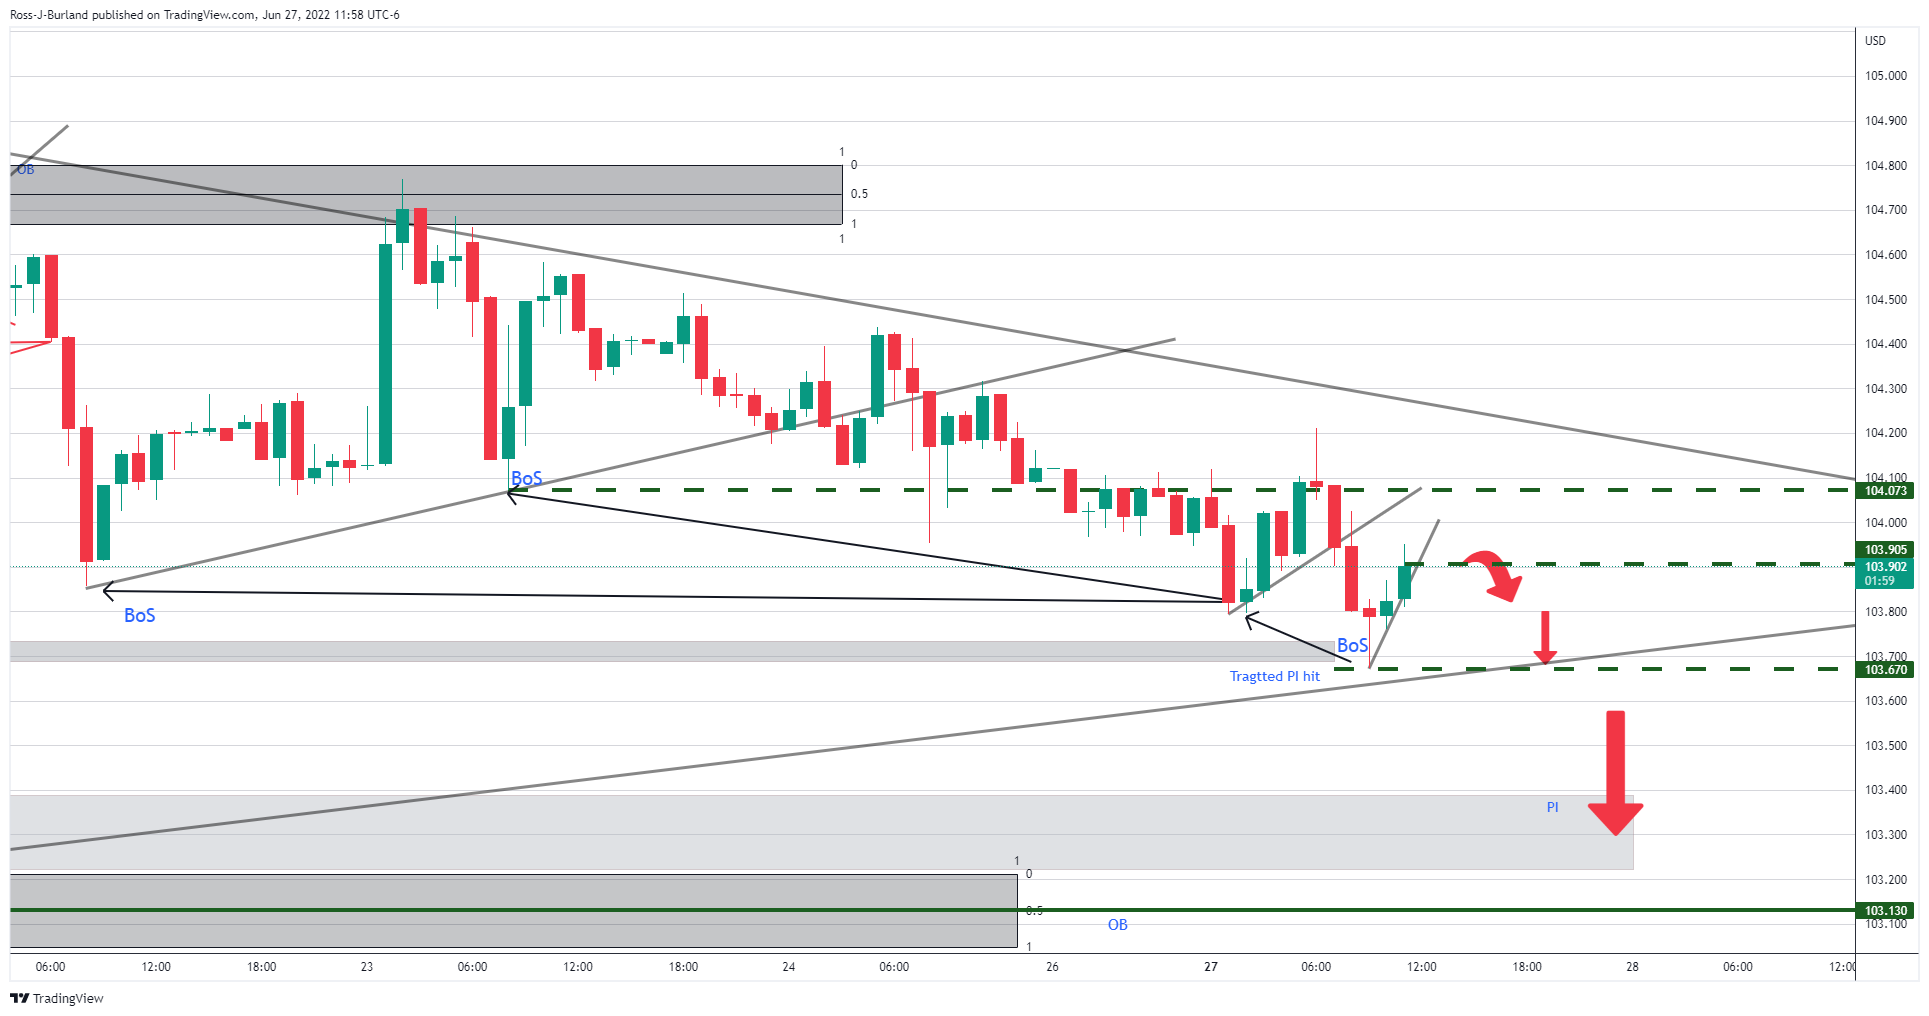
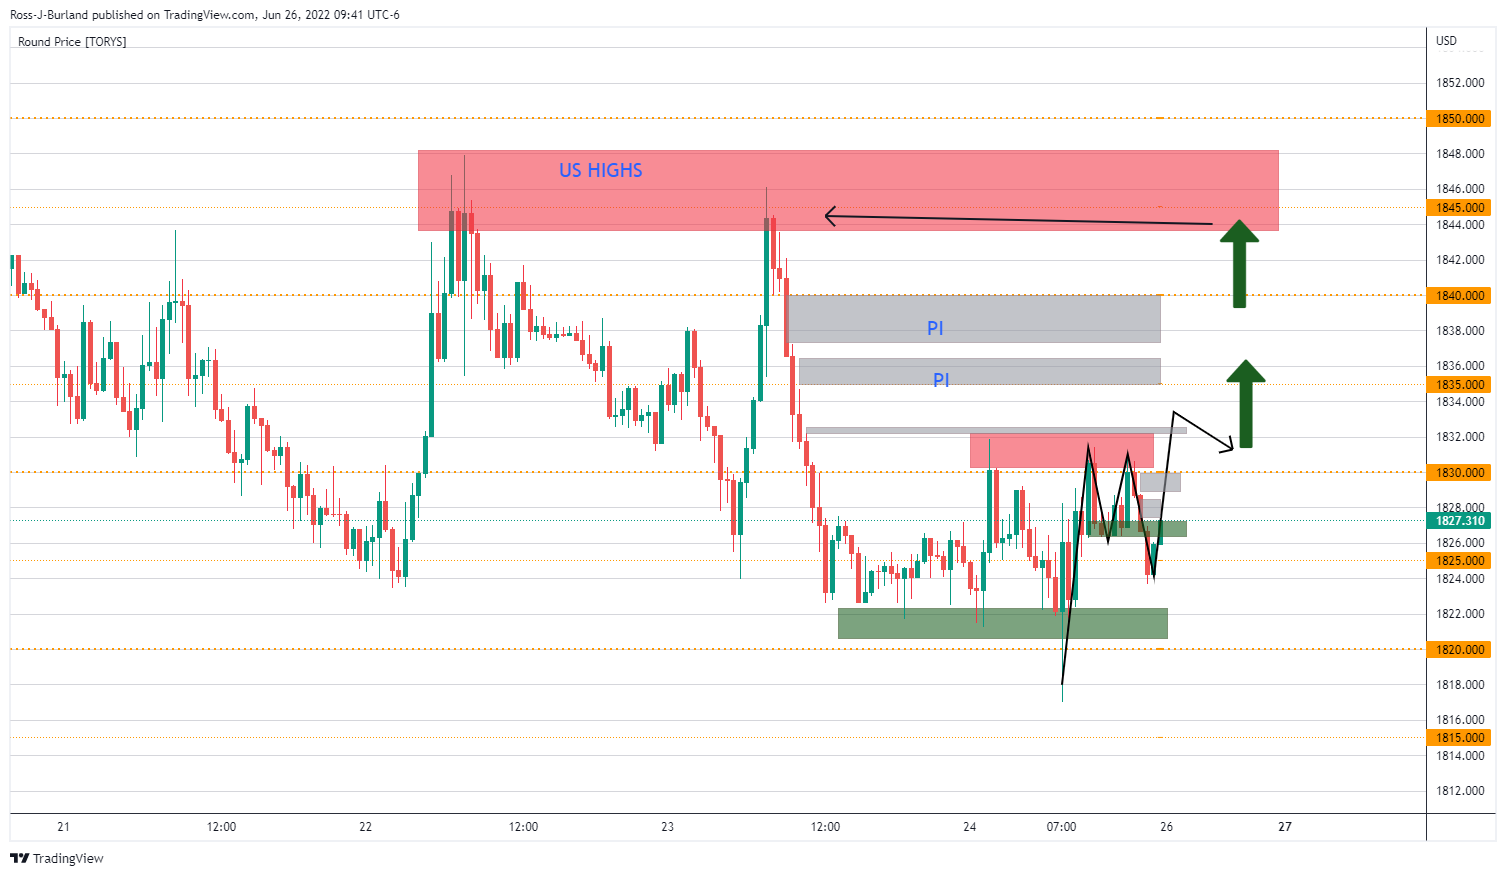
DXY H1 chart
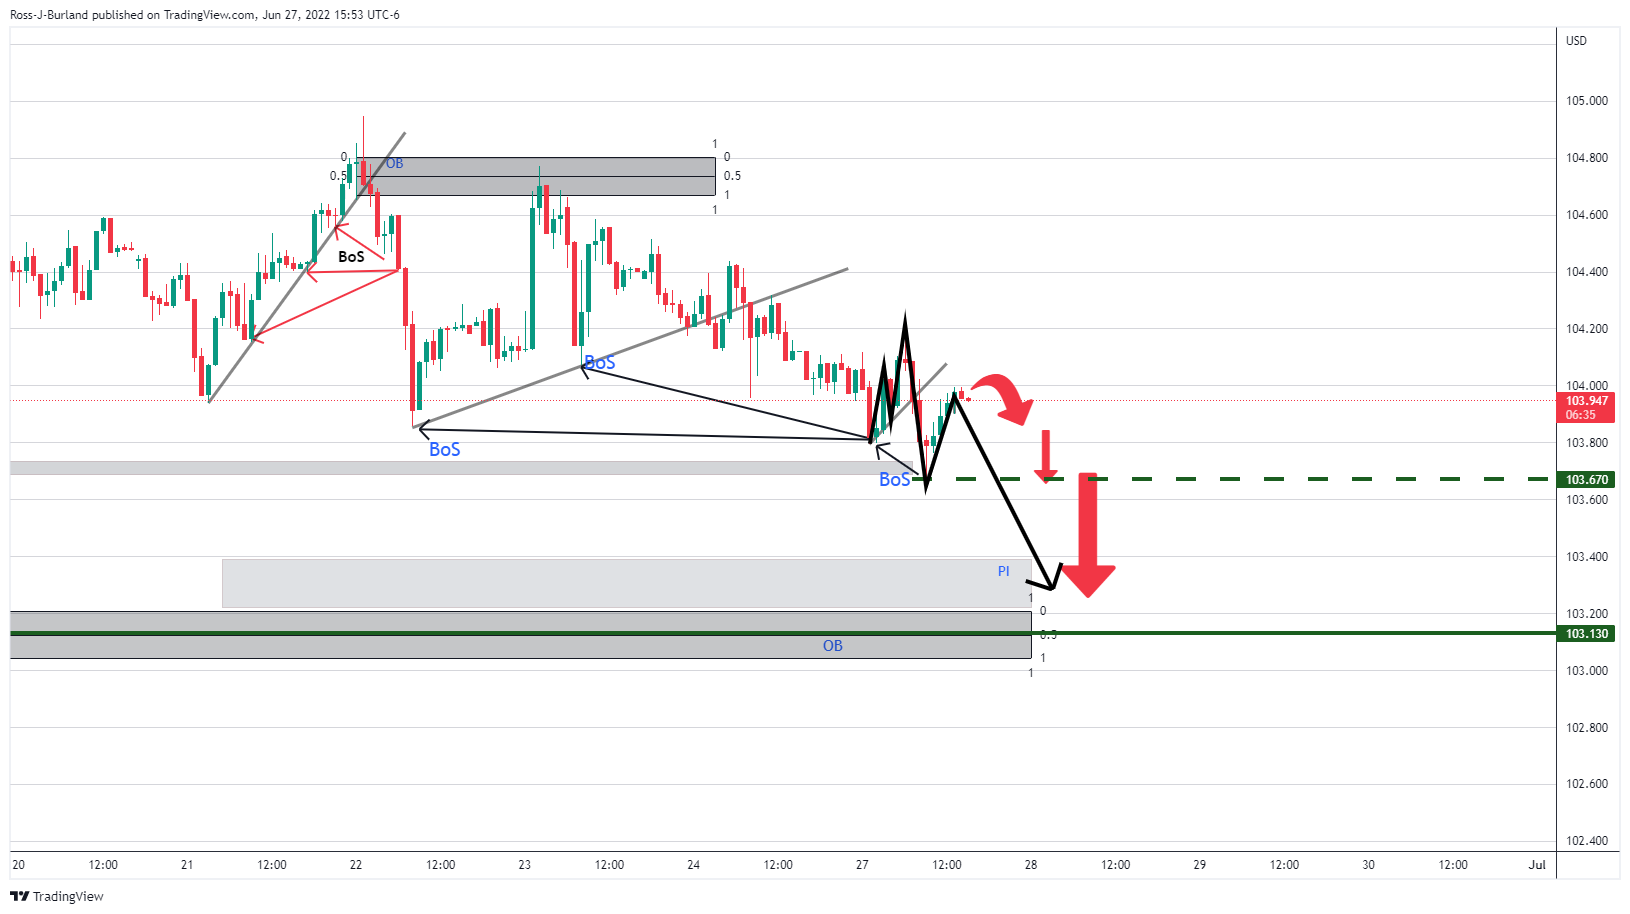
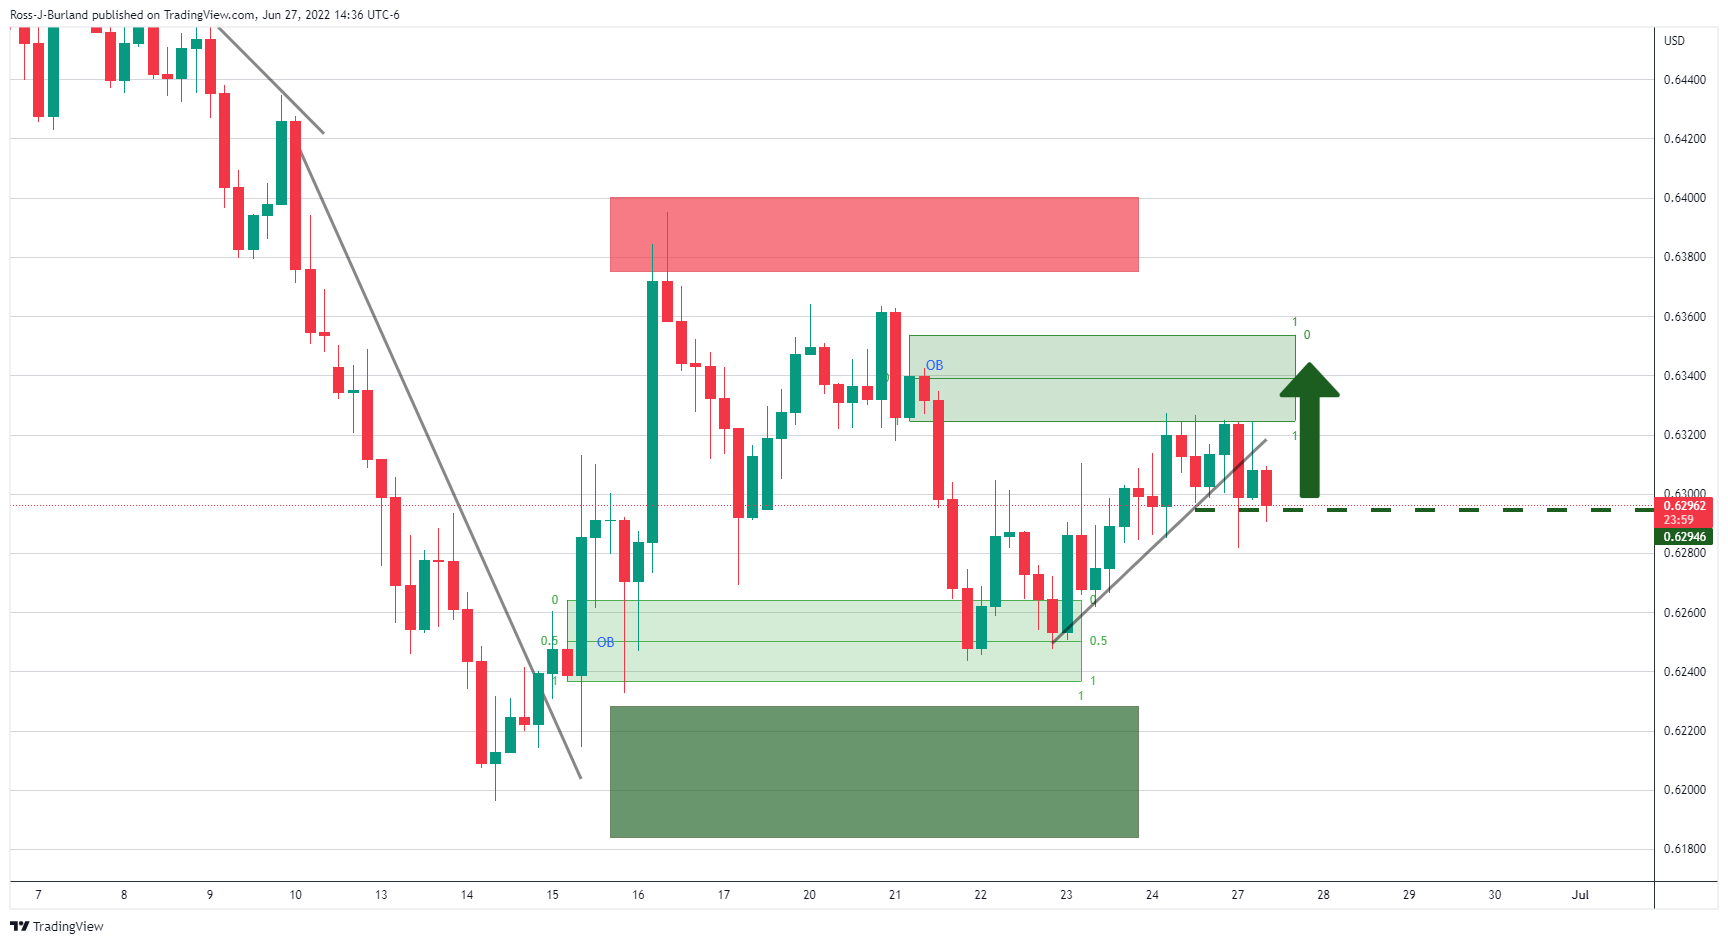
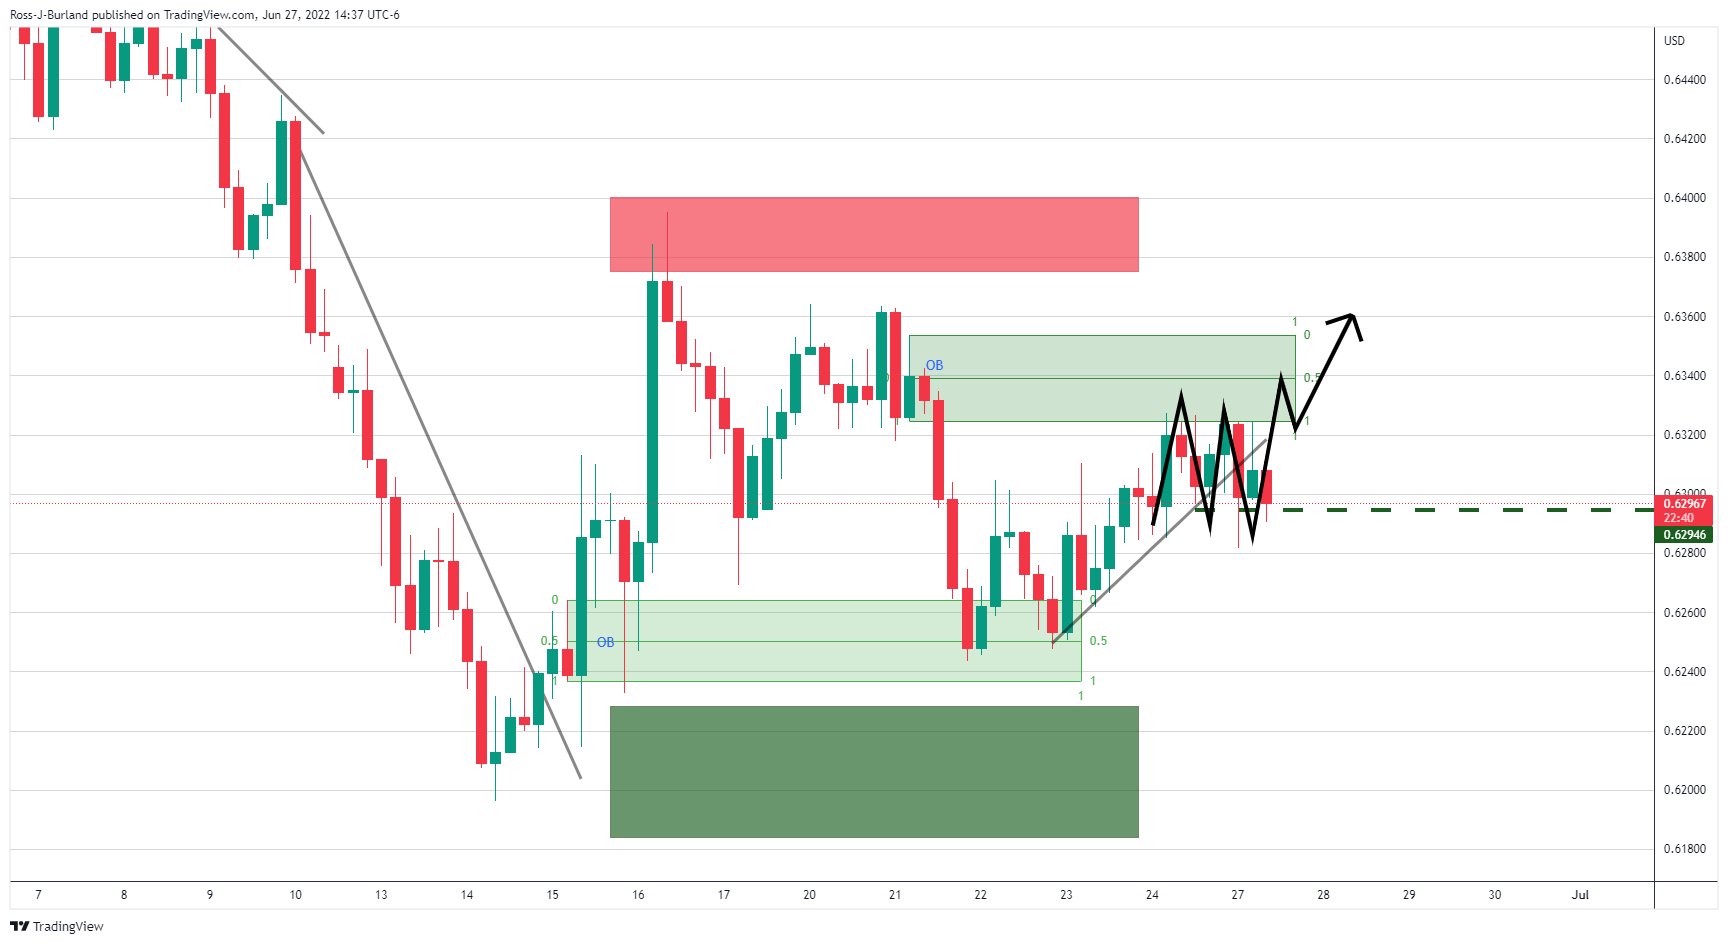
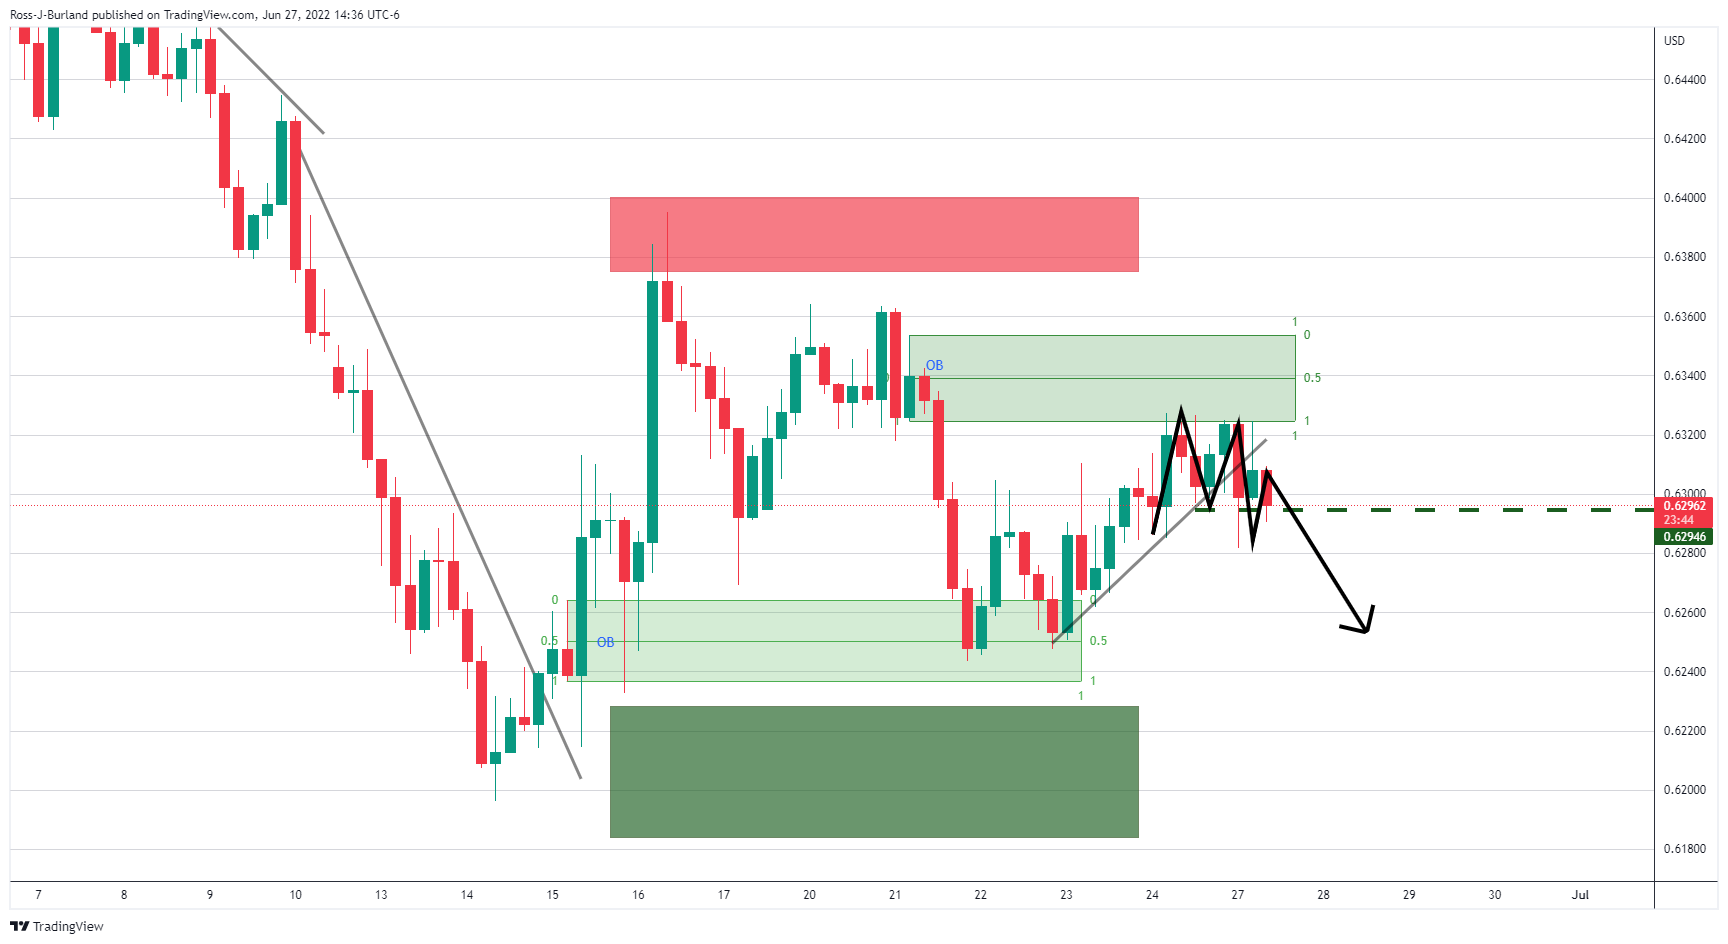
The price of DXY has been breaking structure (BoS) to the downside and the latest formation could be the makings of an M-formation's resistance and a buy-to-sell scenario from the neckline to the price imbalance (PI) and order block (OB) below. In turn, this would be expected to support AUD in a bullish correction out of consolidation for the sessions ahead:
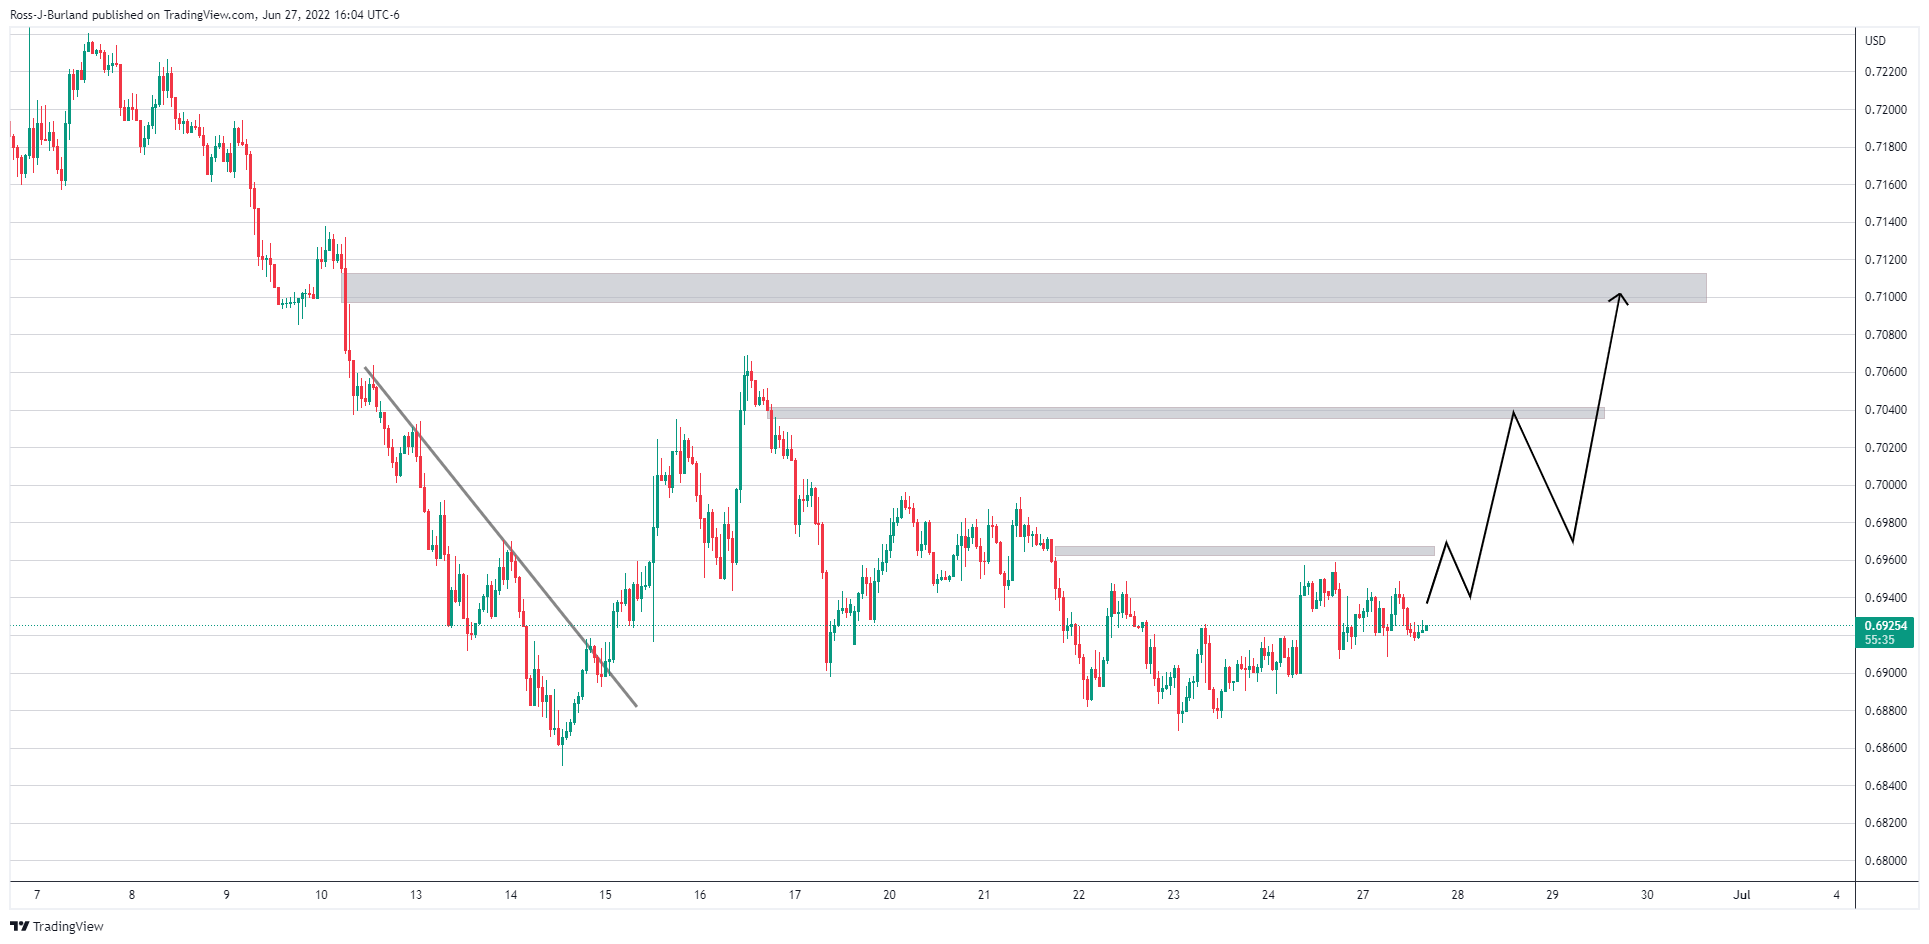
Zooming in:
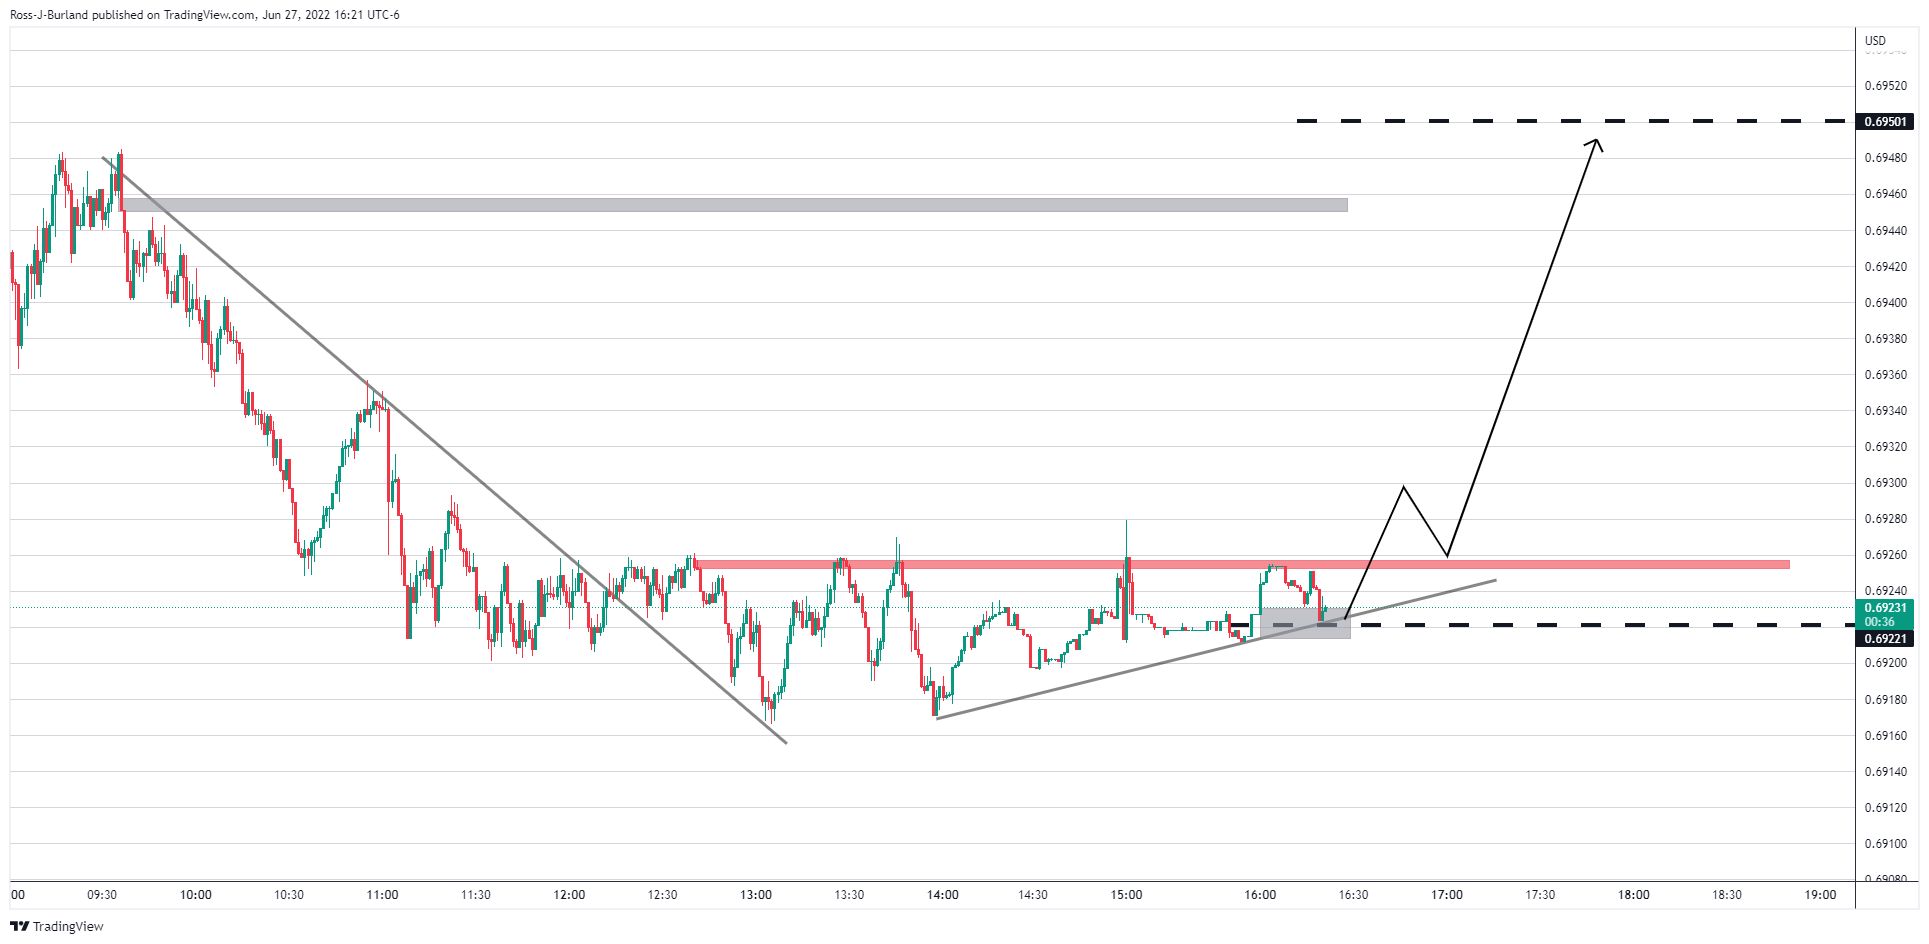
The short-term schematic is bullish on a break of the 0.6925 resistance for a run to 0.6950.
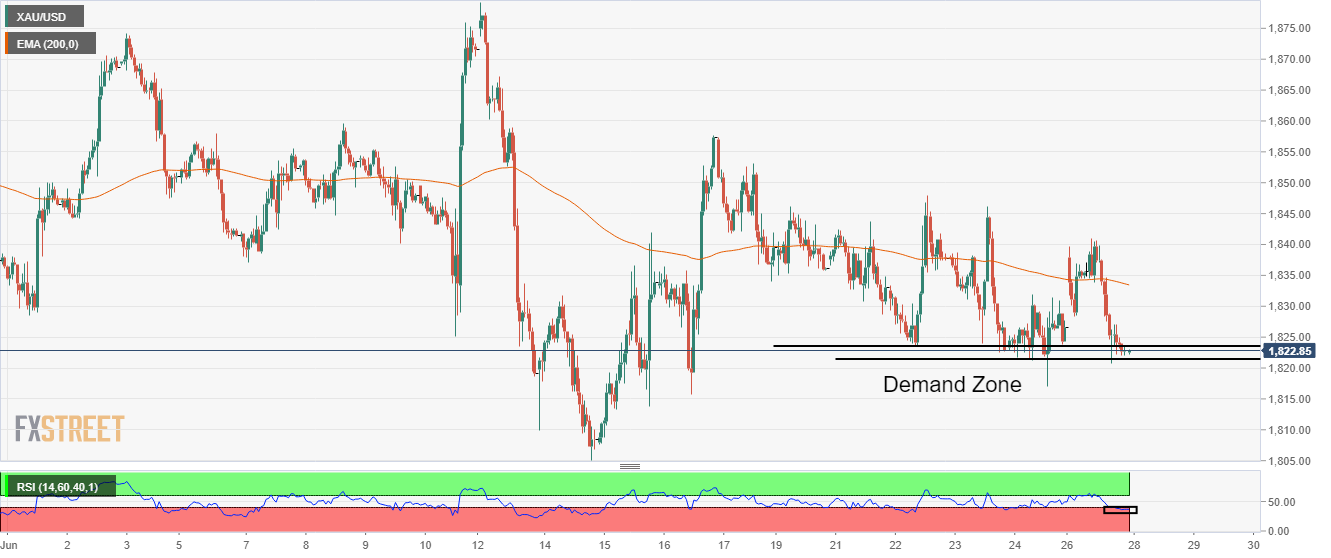
- Gold price is trading near the demand zone placed in a narrow range of $1,821.45-1,823.57.
- The impact of prohibiting Russian gold exports by the G7 countries is faded now.
- The upbeat US Durable Goods Orders have strengthened the DXY.
Gold price (XAU/USD) displayed a failed attempt to sustain above the critical resistance of $1,840.00 on Monday. The precious metal has turned sideways after a sheer downside move and is expected to extend its losses after violating the crucial support of $1,820.85. It looks like the headline of banning Russian gold exports by the G7 countries has lost its significance and investors have started focusing on the solid fundamentals of the US dollar index (DXY) again.
The DXY is hovering below the round-level resistance of 104.00 after displaying a responsive buying action around 103.70. The release of the upbeat Durable Goods Orders has supported the DXY bulls. The economic data landed at 0.7%, higher than the estimates of 0.1% and the prior release of 0.5%. This has cleared that the overall demand structure in the US economy is rock solid. The demand prospects are resilient despite the headwinds of soaring price pressures.
Going forward, investors’ focus will remain on the speech from Federal Reserve (Fed) chair Jerome Powell, which is due on Wednesday. Fed Powell is expected to dictate the likely monetary policy action of July.
Gold technical analysis
Gold prices are oscillating near the potential demand zone, which is placed in a narrow range of $1,821.45-1,823.57 on an hourly scale. The precious metal is auctioning below the 200-period Exponential Moving Average (EMA) at $1,833.56, which adds to the downside filters. Meanwhile, the Relative Strength Index (RSI) (14) has shifted into a bearish range of 20.00-40.00, which signals that a fresh leg of selling is on its way.
Gold hourly chart
- The AUD/JPY finished almost flat down by 0.06% on Monday.
- Quarter and month-end flow dominated the session weighing on US equities and also in risk-sensitive currencies.
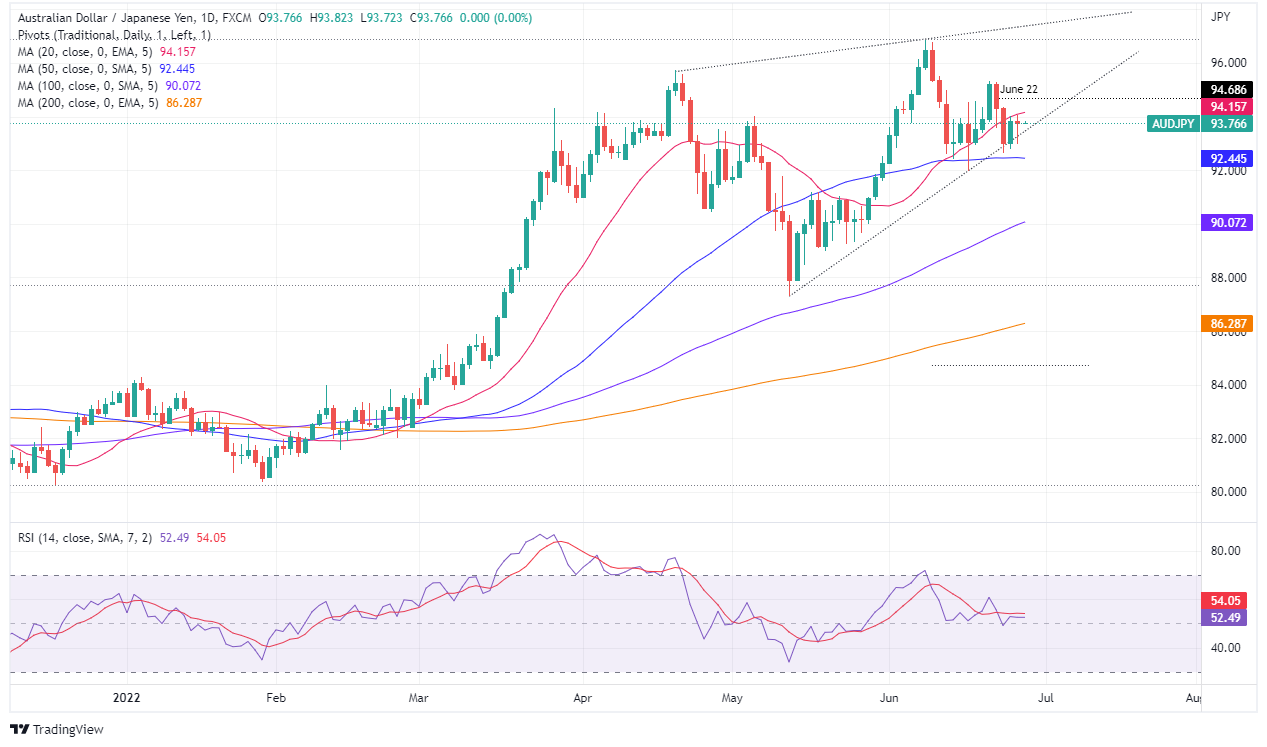
- AUD/JPY Price Forecast: The cross is upward biased, but downside risks remain if it stays below 94.00.
The AUD/JPY began the week on the wrong foot, slightly down in the day, though recovered from daily lows at 92.97 and reached a daily high at around 93.94, finally settling near 93.74, as market sentiment turned sour and US equities recorded losses.
As quarter and month-end approached, Monday’s session witnessed portfolio rebalancing. That sparked the fall in equities, while US Treasury yields bounced off daily lows, led by the US 10-year Treasury yield, which gained eight basis points and is back above the 3.20% threshold.
In the meantime, the AUD/JPY opened near 93.70 and dipped sharply below the 93.00 mark once the Monday Asian session began. Nevertheless, late in the same session, the cross marched firmly and was finally lifted near the 94.00 figure.
AUD/JPY Daily chart
The cross-currency faced strong support at the 20-EMA around 94.15, capping AUD/JPY upward intentions, as the pair continues its consolidation within familiar ranges around 92.60-94.30. Further confirmation of the previously mentioned is the Relative Strenght Index (RSI) at 52.38 flat for the last couple of trading sessions, meaning that despite that the moving averages (MAs) are below the exchange rate, the lack of a fresh upward impulse, keeps the pair constrained in the area mentioned above.
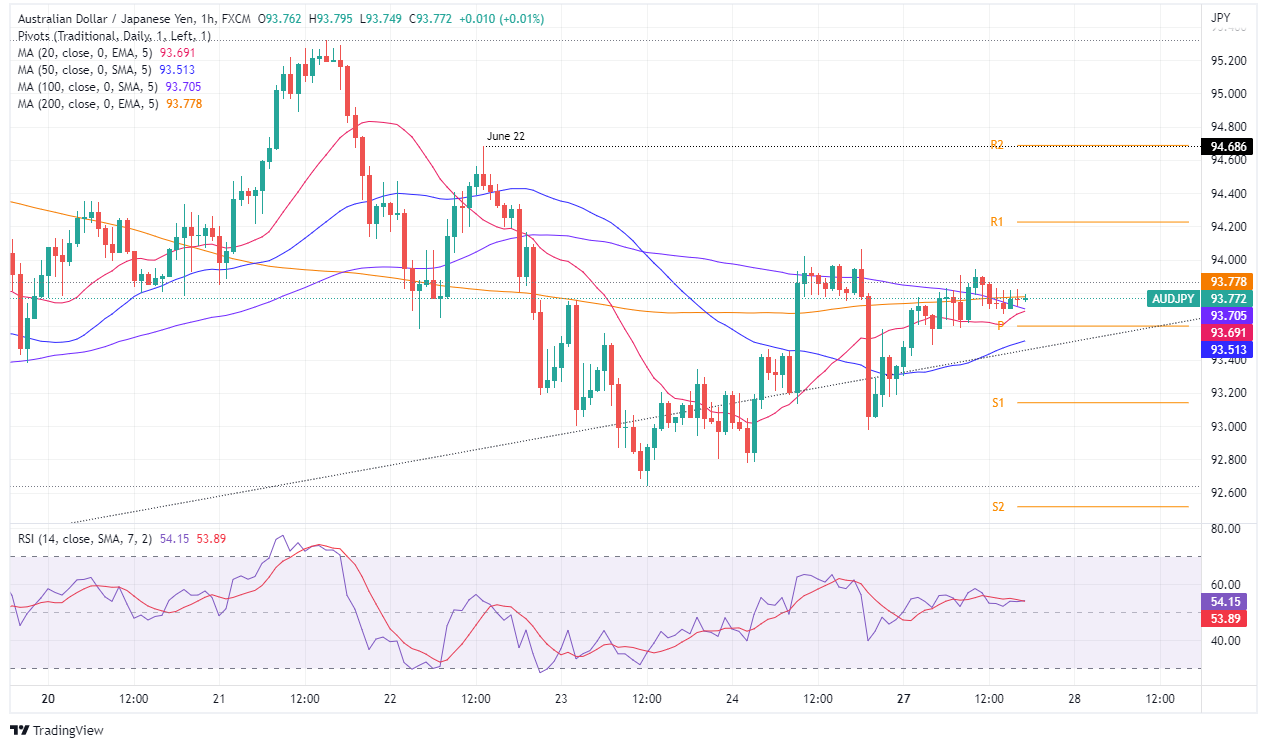
AUD/JPY 1-Hour chart
The AUD/JPY hourly chart illustrates the pair is consolidating but slightly moving to the upside, though at the time of writing, AUD/JPY buyers unable to break above the 200-EMA at 93.77 will leave the pair vulnerable to selling pressure. If that scenario plays out, the AUD/JPY first support would be the daily pivot at 93.60. Break below will expose the 50-EMA at 93.49, followed by the S1 pivot at 93.20.
On the other hand, and on the path of least resistance, the AUD/JPY’s first resistance would be the 200-EMA at 93.77. A breach of the latter would expose 94.00, followed by the R1 daily pivot at 94.23, followed by the confluence of June 22, and the R2 daily pivot at 94.68.
AUD/JPY Key Technical Levels
- NZD/USD bears are moving in despite the softness in the greenback.
- The week is premature and we are yet to see the bias unfold.
At 0.6295, NZD/USD has been pressured despite the growing consensus of a weaker US dollar. The bird is down some 0.28% at the time of writing and has fallen from a high of 0.6326 to a score a low of 0.6281.
The US session was mixed and the greenback was bought back across the board in the absence of anything fundamentally bearish for the greenback on the day other than a terrible miss in the manufacturing data. The Dallas Fed Manufacturing Index fell to -17.7 in June, down from -7.3 in May, putting it at its lowest level since May 2020. ''However, labour market indicators continue to show robust growth in employment and longer workweeks. Prices and wages both continued to increase, but manufacturers are less optimistic about the future,'' analysts at ANZ Bank explained.
''The Kiwi is lower this morning as risk assets take a breather and US bond yields resume their slow upward march,'' analysts at ANZ Bank added. Indeed, US stocks pulled back, lacking a catalyst while investors remain concerned over inflation and tightening Fed policy.
The Dow Jones Industrial Average, which is down 13.5% so far in 2022, is on pace for its worst first half of a year since 2008 and the higher beta currencies continue to be at risk. The Nasdaq, as well, is down 26.5% so far this year and is on track for its biggest first-half of a year slide ever. Nevertheless, the NZD remains fairly range-bound, bouncing around with the general vibe of global sentiment and there are limited data releases. Investors will instead keep an eye on the risk associated with Russia which has now technically defaulted on its external sovereign bond payments.
NZD/USD technical analysis
There are a couple of scenarios besides sideways consolidation and the following illustrate the bearish and bullish prospects:
Above and below are the bullish outlooks.
The following is noting of the M-formation's neckline and prospects of a sell-off below the structure.
What you need to take care of on Tuesday, June 28:
Major pairs seesawed between gains and losses but held on to familiar levels. The dollar is down against most of its rivals, but no technical breakout has taken place. The EUR/USD pair trades just below the 1.0600 level, while GBP/USD stands in the 1.2260 area.
Market players are juggling with mounting inflation and recession concerns, and central bankers juggling to tame inflation without halting economic progress. The mood was generally positive at the weekly opening but soured after S&P downwardly reviewed economic growth. It now expects the EU economy to advance a modest 2.6%, while foresees US growth at 1.6%, well below the estimated potential growth rate of around 2%.
Stock markets managed to hold on to positive territory in Europe and Asia, but Wall Street closed in the red. US government bond yields continue to seesaw up and down alongside market fears. The yield on the 10-year Treasury note peaked at 3.21%, now hovering nearby, up for the day.
The USD/CAD pair edged lower, now trading at around 1.2870, helped by higher crude oil prices, as WTI is now changing hands at $109.50 a barrel. AUD/USD, on the other hand, is under pressure, trading at around 0.6920.
Gold advanced at the beginning of the day, but finishes it in the red at around $1,824.00 a troy ounce.
The European Central Bank hosts this week the Forum on Central Banking in Portugal. President Christine Lagarde offered the welcoming remarks. On Tuesday, several ECB members will be on the wires as per their participation in the aforementioned forum, while leaders from around the world will speak on Wednesday.
Like this article? Help us with some feedback by answering this survey:
- On Monday, the EUR/JPY is advancing some 0.47%.
- The sentiment is mixed, which helped put a lid on EUR/JPY elevated prices.
- EUR/JPY Price Analysis: The formation of a double top in the daily chart would open the door for further losses.
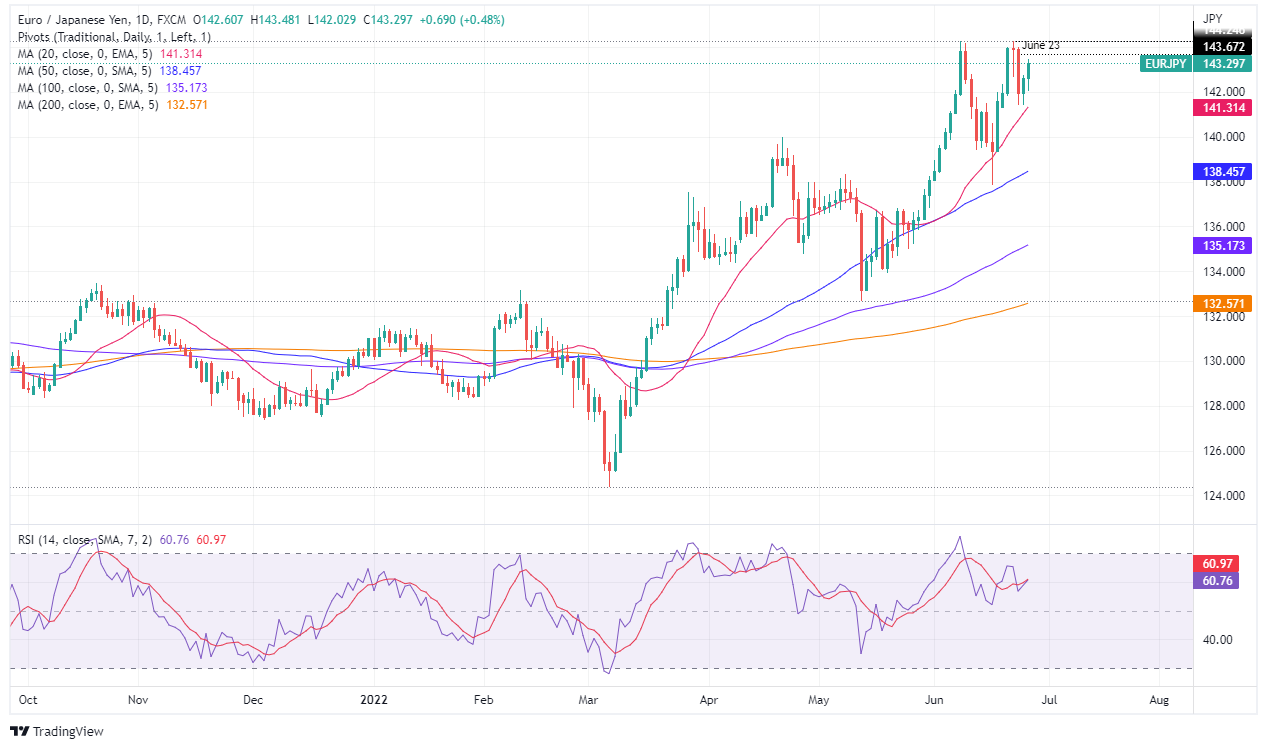
The EUR/JPY advances for the second consecutive day and is looking to extend to its seven straight week rally, which would lift the cross-currency pair towards fresh yearly highs above 144.25. At 143.29, the EUR/JPY is printing gains of 0.54% at the time of writing.
The optimism generated by the Asian and European sessions faded as the North American session winds down. US equities seesaw between gainers/losers as sentiment shifted mixed, on the back of money managers' portfolio reshuffling on quarter-month end, amidst a jump in global bond yields.
EUR/JPY Daily chart
In the meantime, the EUR/JPY daily chart illustrates a double top formation. Nevertheless, EUR/JPY sellers' failure to drag prices lower, courtesy of an ultra-dovish Bank of Japan, keeps prices elevated and threatening of breaking to new YTD highs.
Additionally, the Relative Strenght Index (RSI) at 60.91 aims higher. Besides that, it just crossed above the RSI 7-day SMA (line in red), indicating that buying pressure is accumulating.
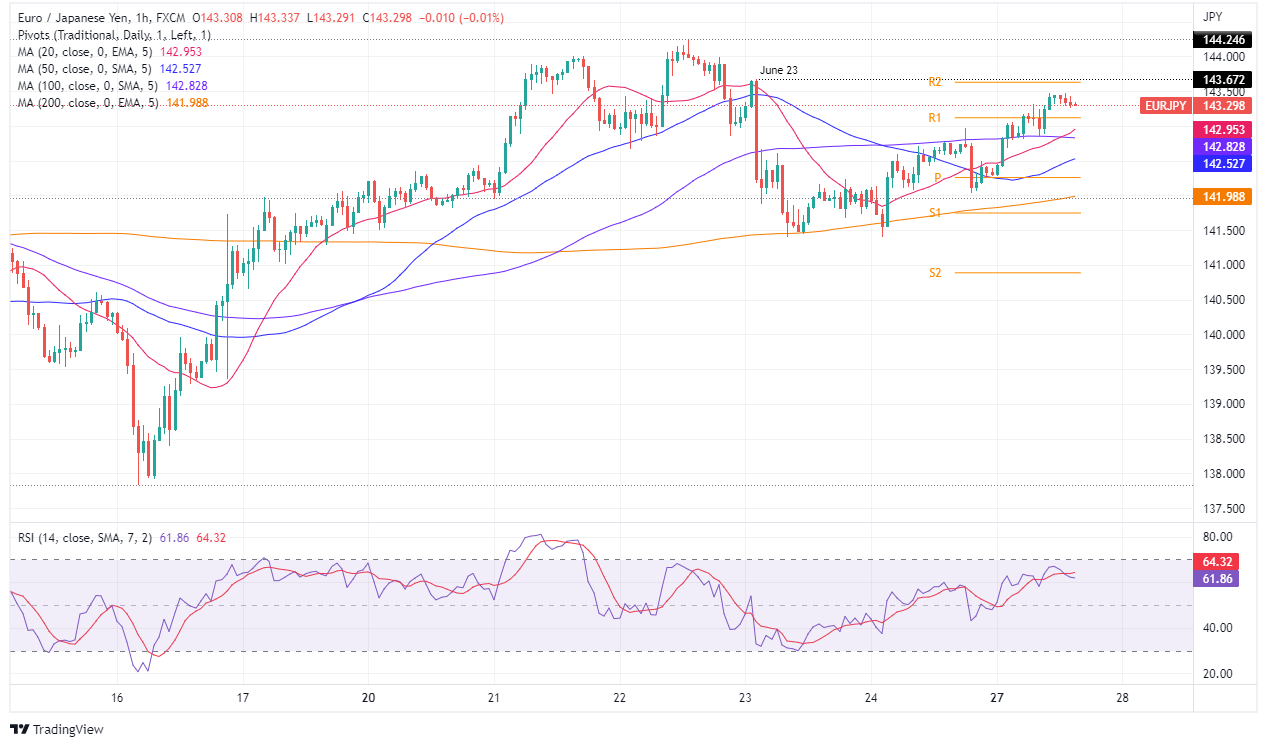
EUR/JPY 1-Hour chart
The EUR/JPY 1-hour chart depicts the cross-currency pair upwards but is about to face solid resistance around the R2 daily pivot point at 143.63. That, alongside June's 23 daily high at 143.67, would be solid ceiling areas to break. Nevertheless, once broken, the EUR/JPY's next resistance is June 22, high at 144.24.
On the flip side, the EUR/JPY first support would be the R1 pivot at 143.12. A break below would expose the confluence of the 20 and the 100-EMAs around the 142.83-97 area. Once cleared, the next support would be the 50-EMA at 142.50.
EUR/JPY Key Technical Levels
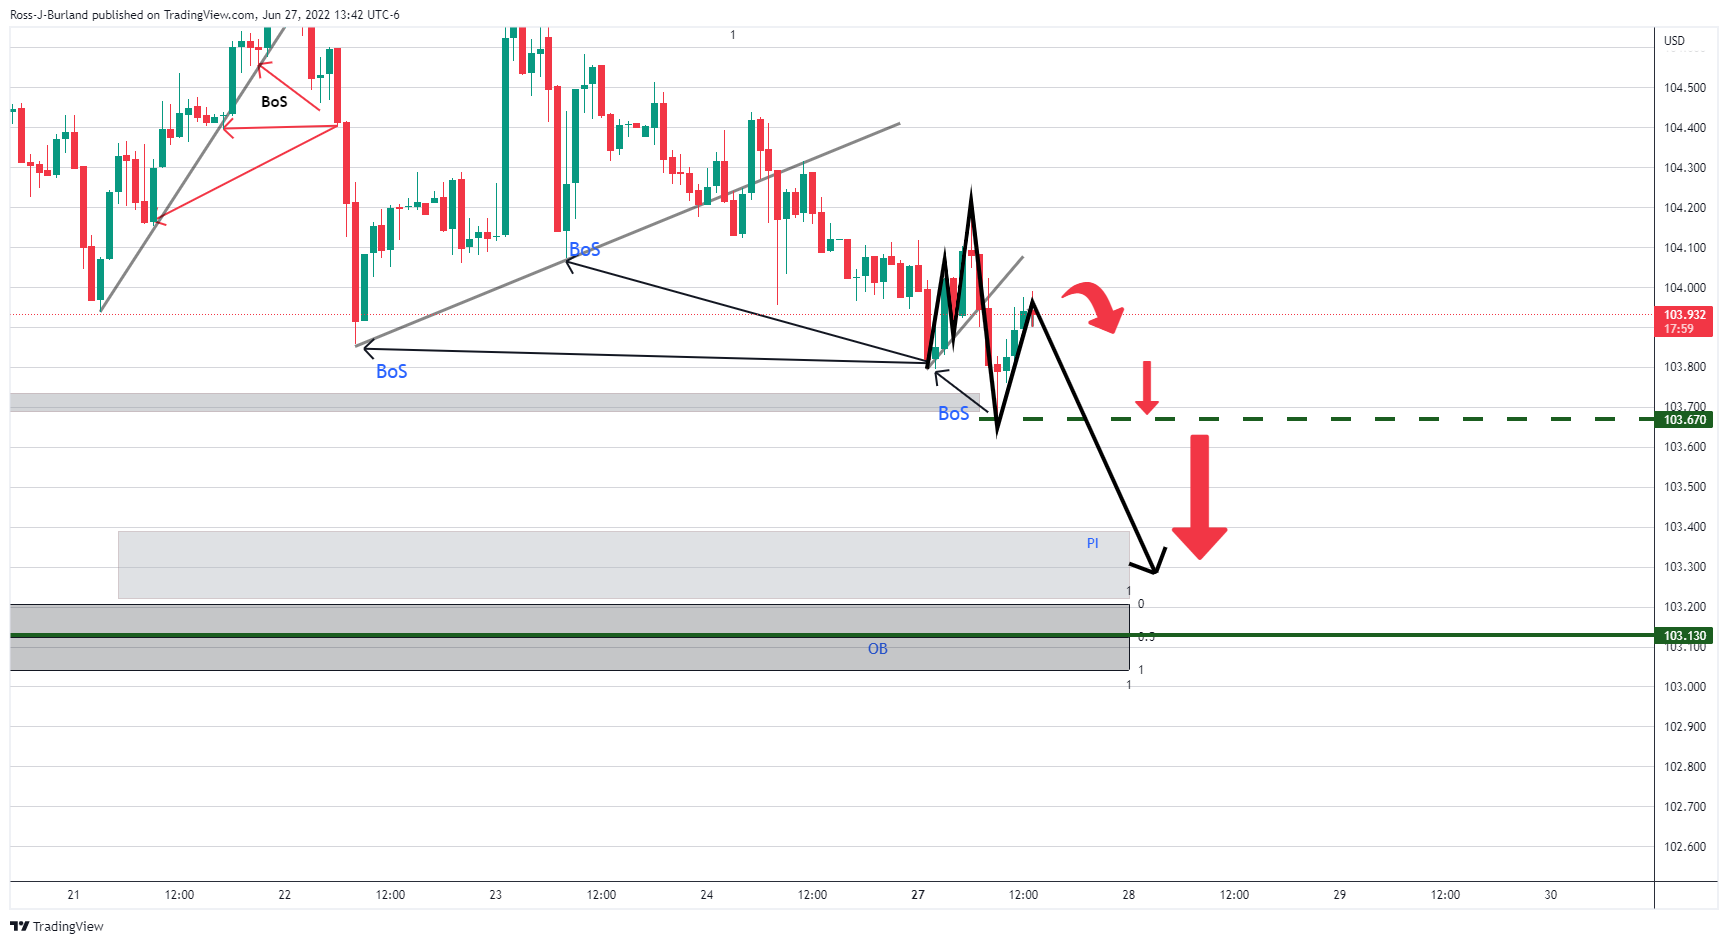
- USD/JPY bears moving in for the kill but the structure is key.
- The bears have their eyes on the lower bound support.
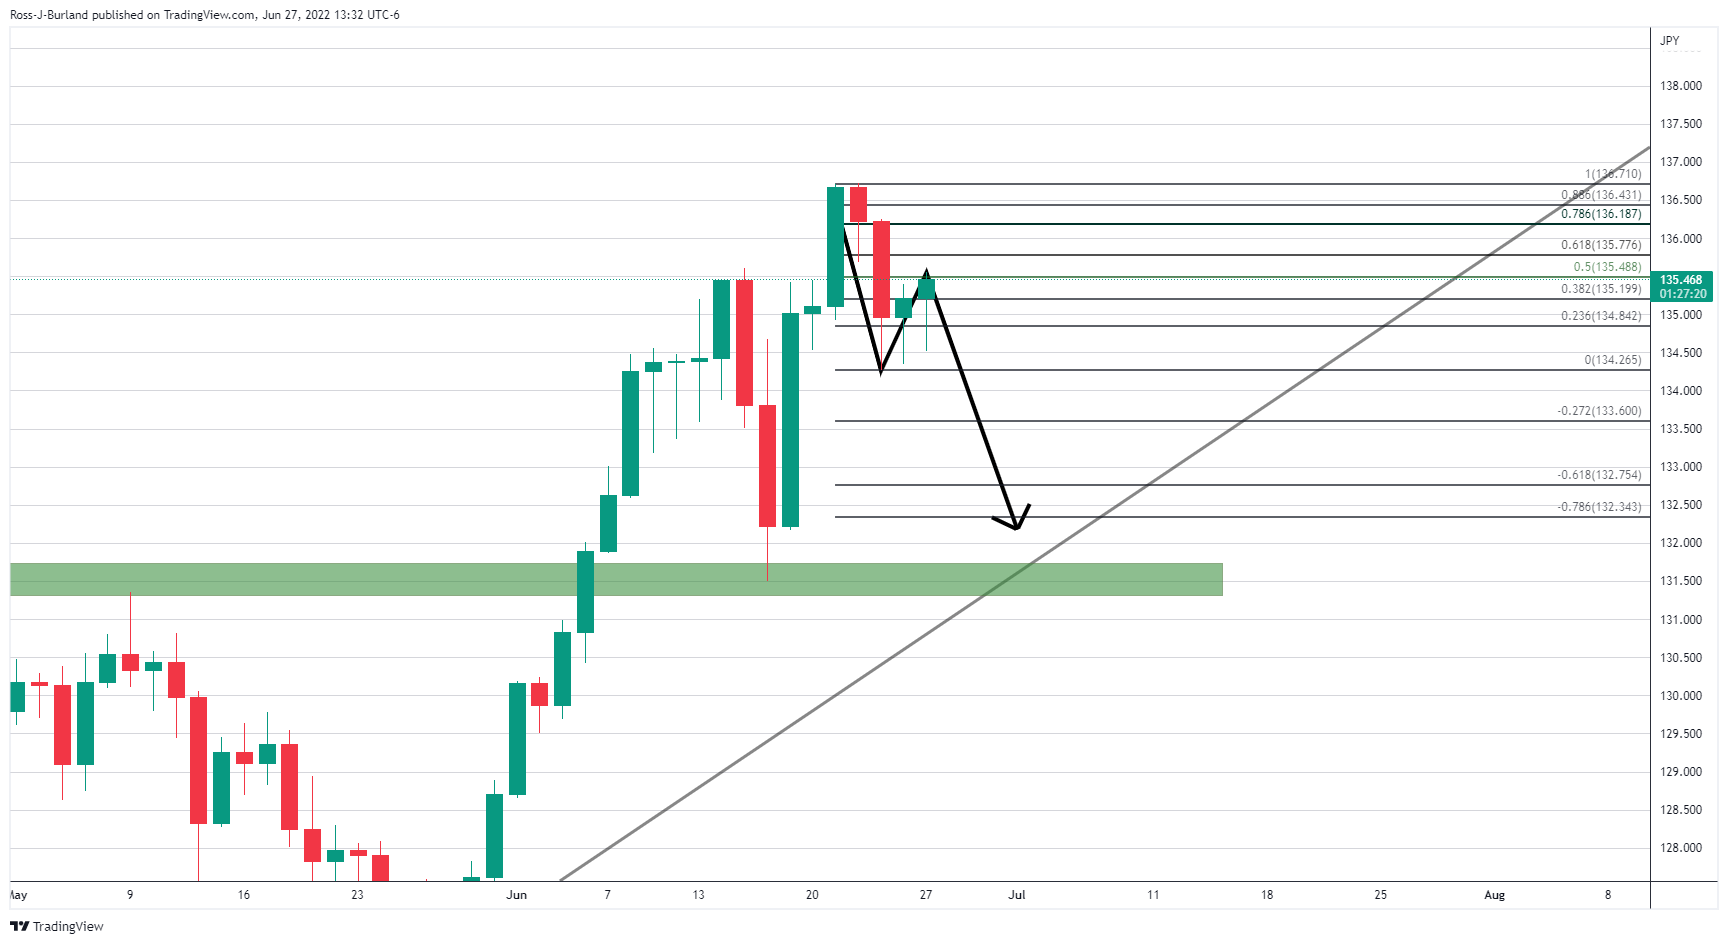
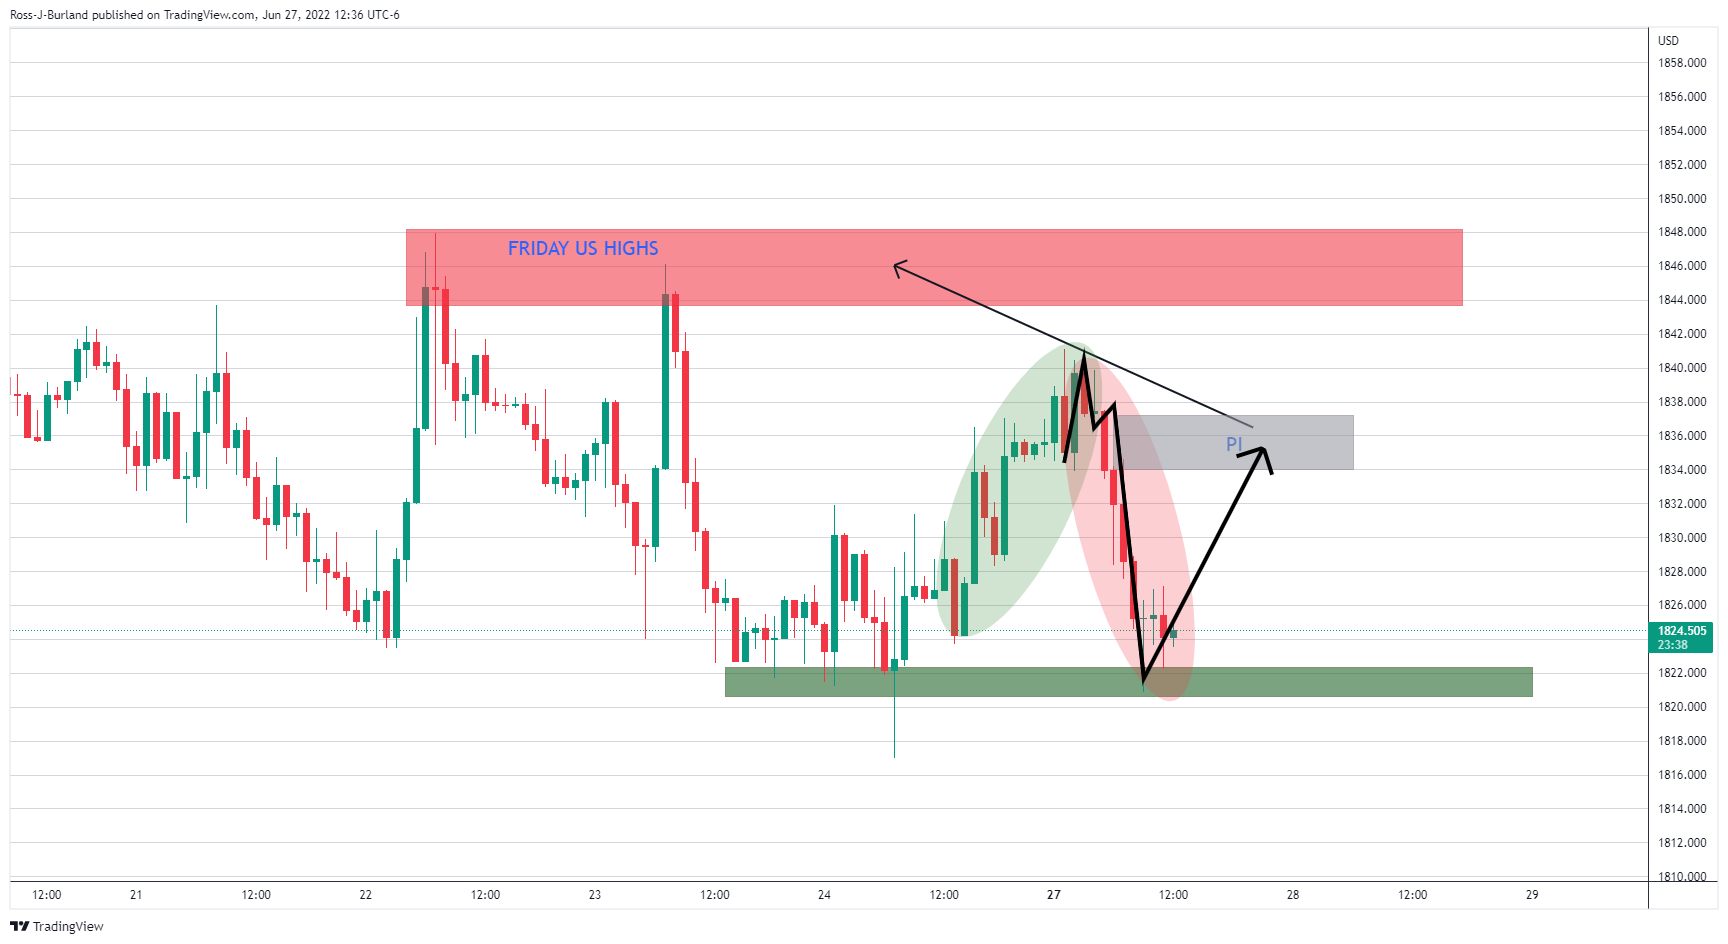
USD/JPY is under pressure and falling in a classic reversal topping pattern on the daily chart. The following illustrates the bearish bias from a weaker US dollar perspective. However, there are also prospects of a move higher from here and until the price breaks the lower bound support, the bullish daily structure remains in tact.
USD/JPY daily charts
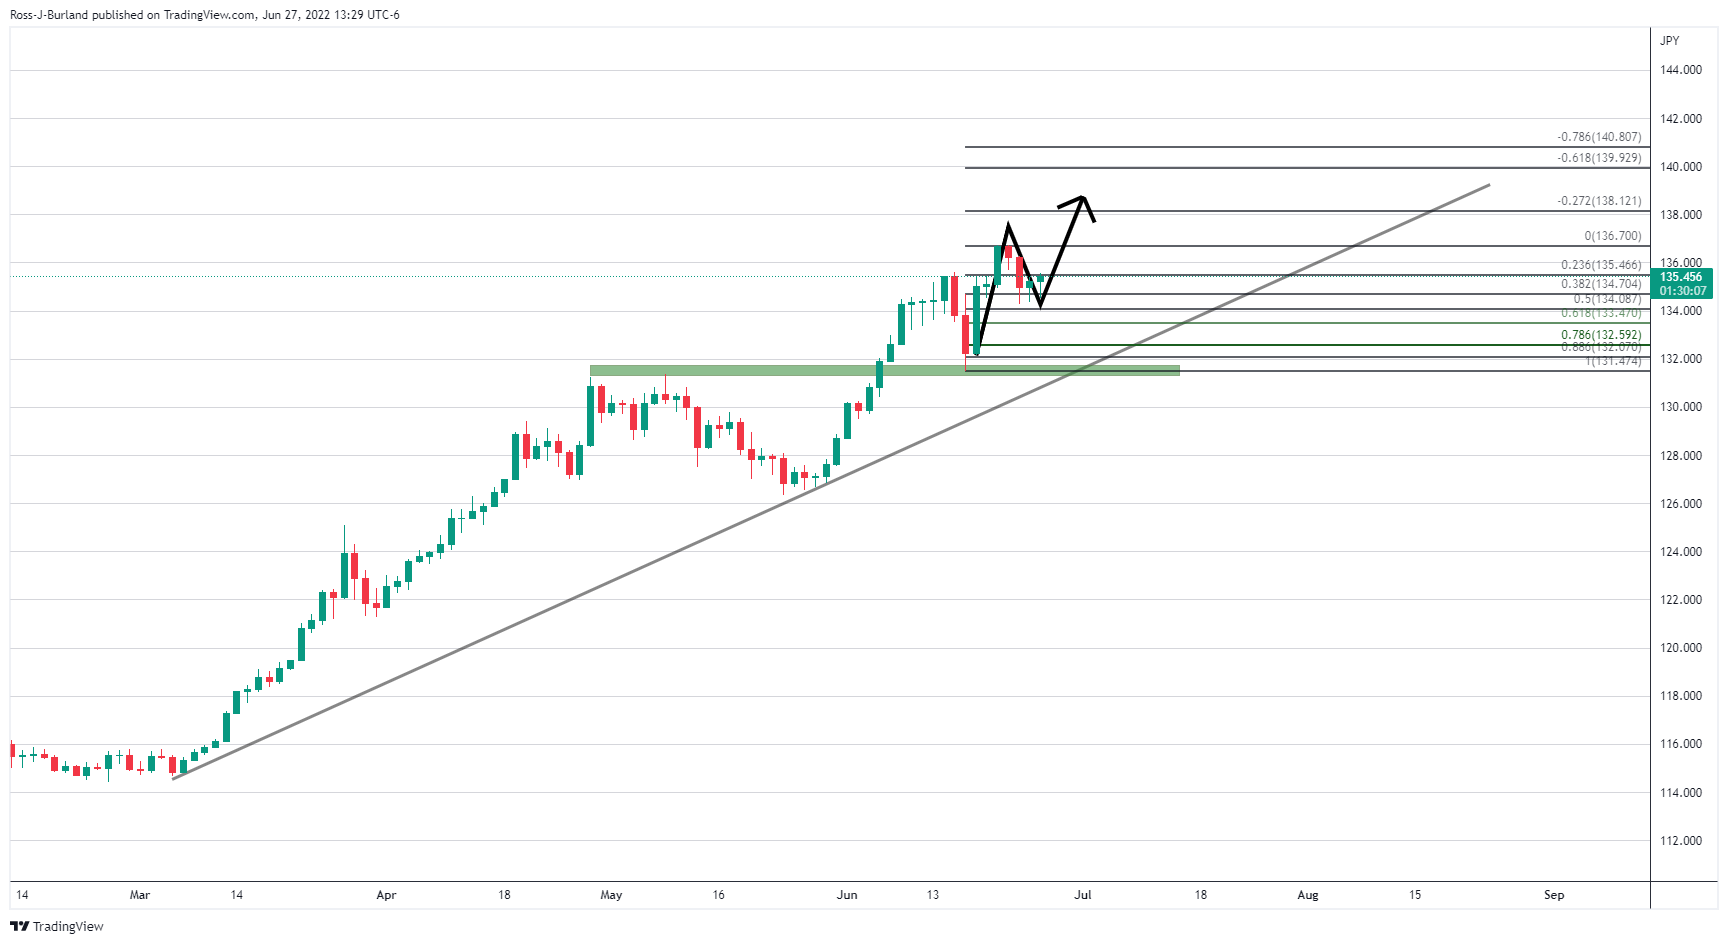
There are two scenarios. The above illustrates the potential for a move higher from current support while the lower bound support remains intact. The other scenario shows the price running into a 50% mean reversion of the last bearish impulse and prospects of a move towards the lower bound support area:
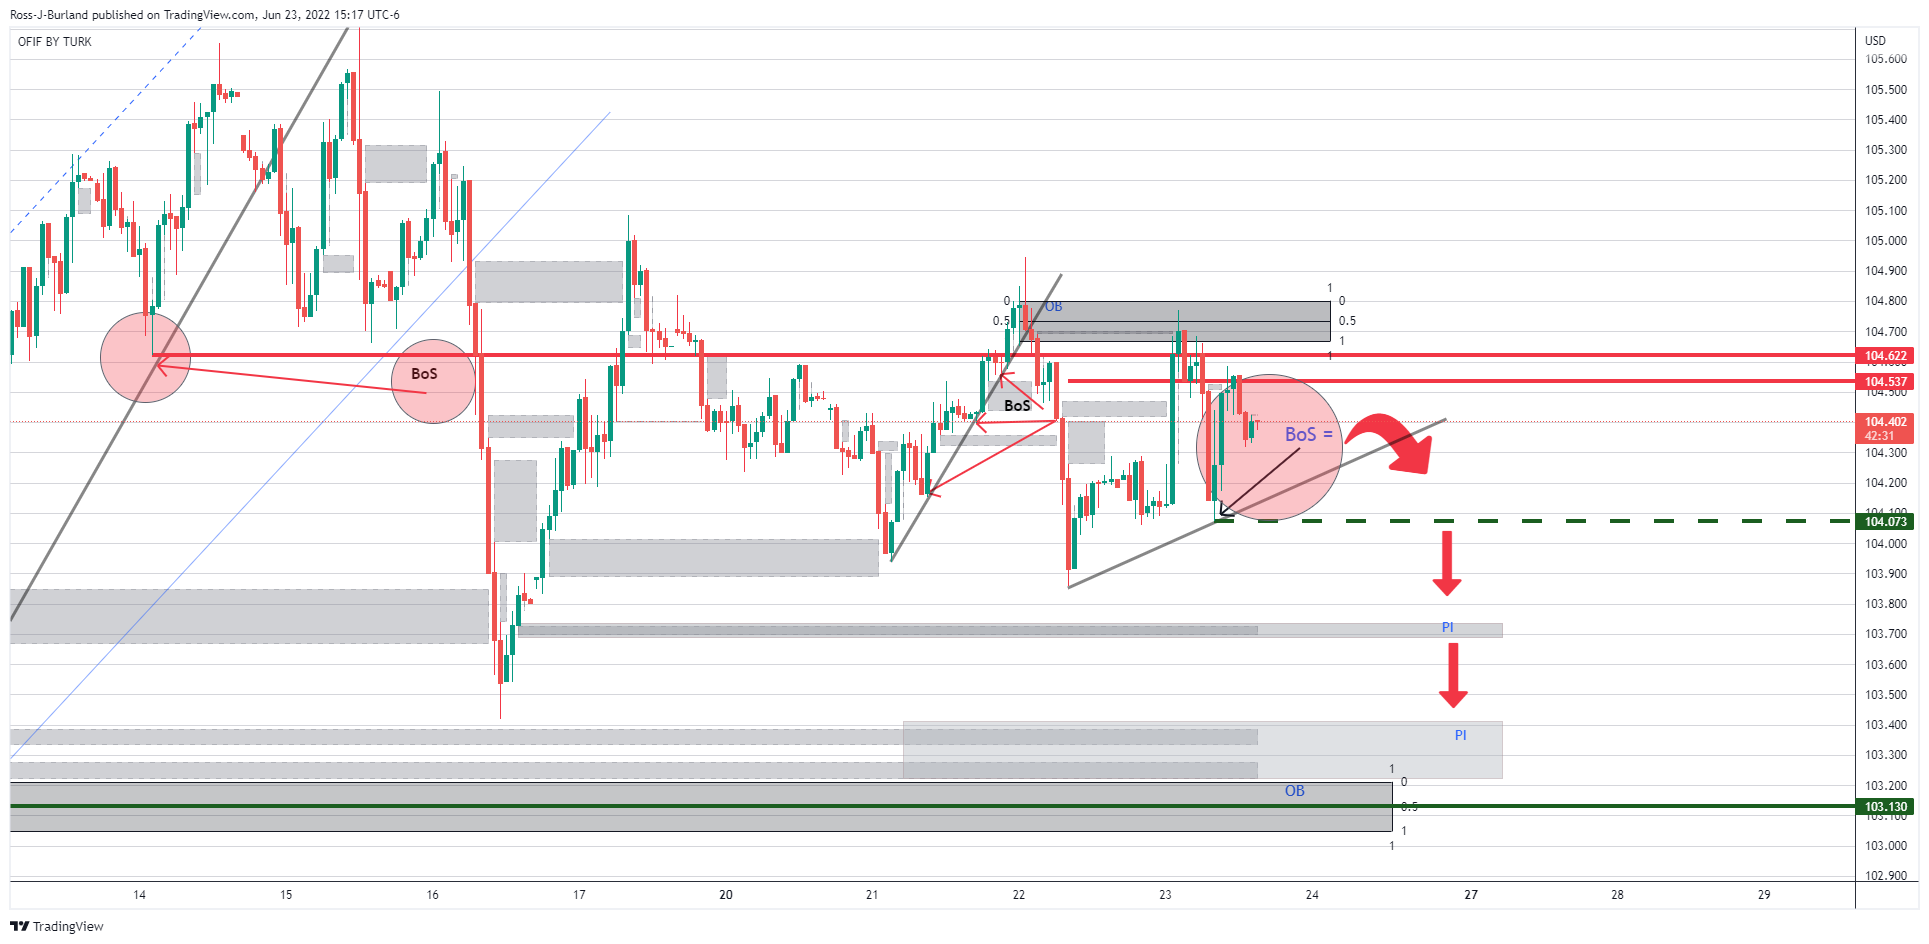
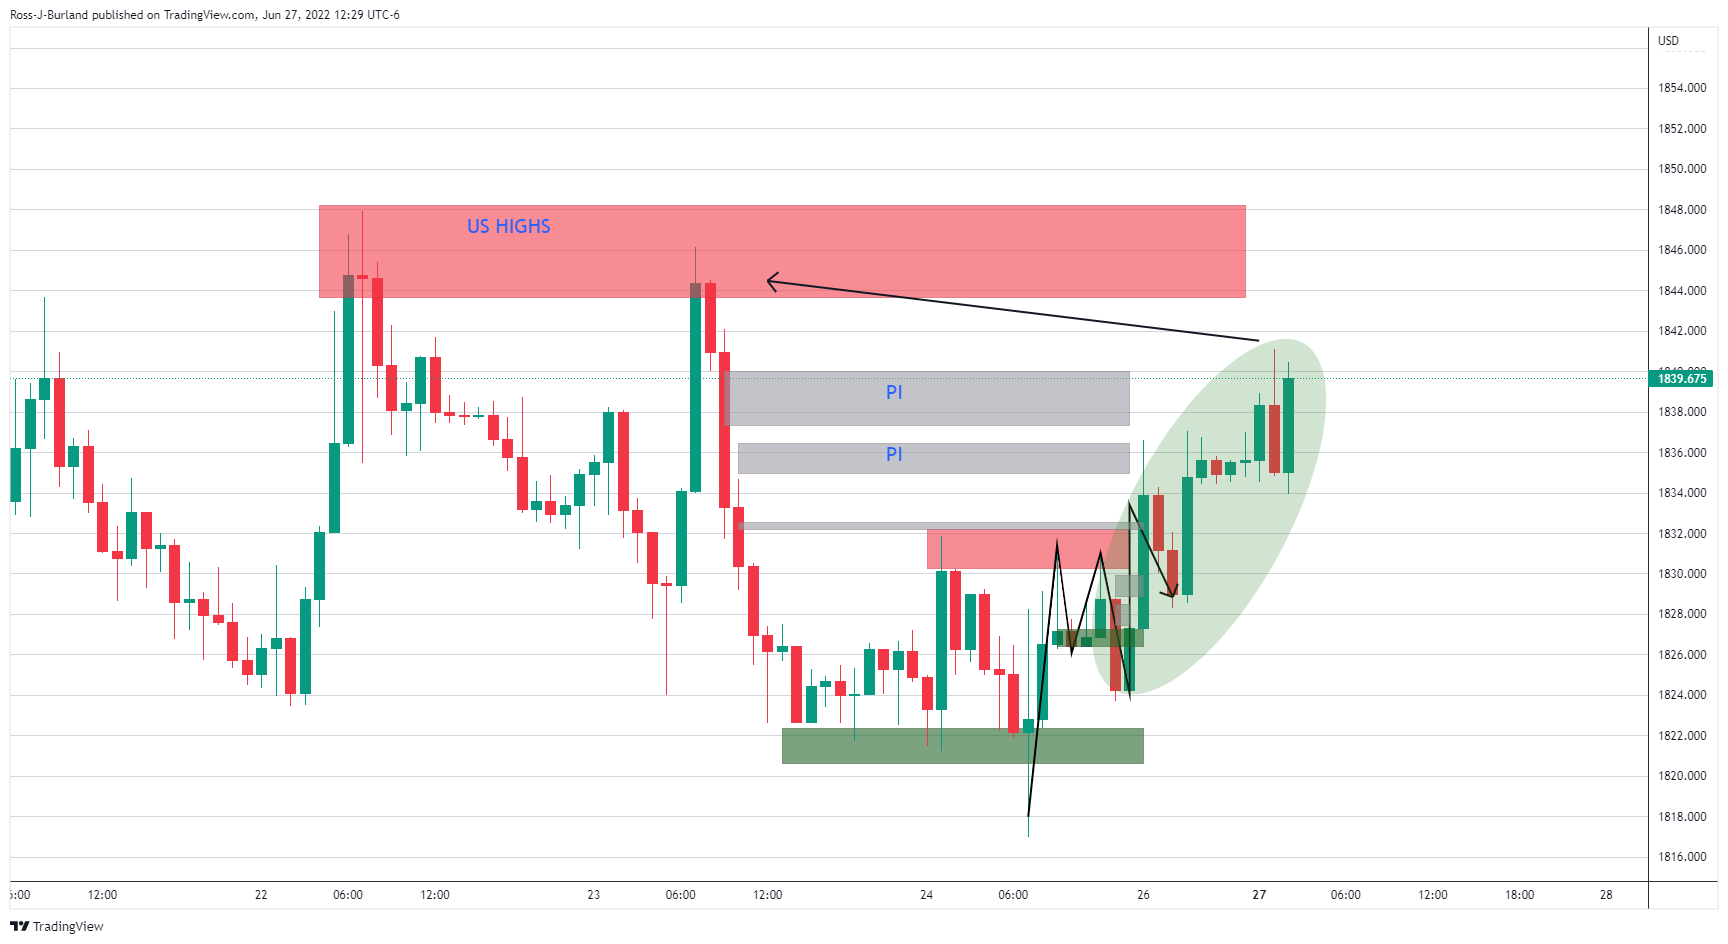
This thesis would marry up with the weakness in the US dollar, as displayed in the following DXY chart:
DXY H1 chart
The price of the US dollar has been pressured and continues to show signs of weakness given the breaks of structures of late as per the hourly analysis above.
- The lack of a fresh catalyst kept the pound within familiar ranges.
- A mixed market mood, spurred by higher global bond yields, put a lid on GBP/USD gains.
- GBP/USD Price Forecast: Remains tilted to the downside, but a test towards 1.2300 is on the cards.
The British pound remains to trade in a narrow range vs. the greenback, though it stays trading with minimal gains after probing the 1.2300 mark reaching daily highs at 1.2313, followed by a dip towards daily lows near 1.2238. At 1.2277, the GBP/USD is up 0.05% in the North American session.
The market mood is mixed, as US equities fluctuate between gainers and losers. The GBP/USD remains almost flat amidst the lack of a catalyst, leaving traders adrift on last week’s news and sentiment. Last Friday, the Bank of England’s chief economist Huw Pill said that interest rates would be the primary monetary policy tool as the bank prepares to begin its Quantitative Tightening.
Given the backdrop that UK’s inflation rose to a 40-year high at 9.1%, analysts expect that the central bank will hike rates by 25 bps in August. The BoE Monetary Policy Committee is due to consider the plan of selling bonds in the same meeting, after which it could decide to start the asset sales.
Meanwhile, global bond yields, which were lower in the session as recession fears faded, pushed to the upside, shifting the market sentiment to mixed. That said, the US 10-year Treasury yield is moving higher by six basis points, yielding 3.200%-
In the meantime, the US Dollar Index, a measure of the buck’s value vs. its peers, give in some territory on Monday, down 0.18%, back under the 104.000 mark.
Calendar-wise, the UK docket would feature BoE speakers with Jon Cunliffe, crossing the wires on Tuesday. Across the pond, the US docket will feature CB Consumer Confidence for June, estimated at 100.4, less than May’s 106.4. that alongside Wholesale inventories, Trade Balance, Regional Fed Indices reports, and Fed speakers.
GBP/USD Price Forecast: Technical outlook
Consolidation is what the GBP/USD daily chart shows, within the 1.2150-1.2300 area, though it is skewed to the downside. Confirmation of the previously mentioned is the exponential moving averages (EMAs), above the exchange rate, while the Relative Strength Index (RSI) at 44.97, remains in bearish territory.
If GBP/USD buyers need to regain control, they must reclaim 1.2500. Nevertheless, on its way north, they would face resistance at the 1.2300 mark. Once cleared, the 50-EMA at 1.2353 would be the next ñeveñ to challenge, followed by June’s 16 high at 1.2405, and then the 100-EMAR at 1.2463.
On the major’s path of least resistance, the first support would be 1.2200. Breach below would expose June 22 daily low at 1.2160, followed by the figure at 1.2000.
- Gold bears move in despite weakness in the US dollar.
- Bulls lurking in familiar support, eyes towards $1.840s.
Gold is under pressure despite the weakness in the US dollar. At $1,823, the price is down by some 0.23% while the US dollar is also underwater, currently down by 0.18%. The greenback has struggled versus its major rivals at the start of the week due to the prospects of softening inflation which has given cause for a reassessment of the projected path of the Federal Reserve.
As a consequence, the greenback has been tipped over to the edge of the abyss as per the technicals illustrated in the prior analysis as follows:
In the above analysis, the greenback was forecasted to break the structure and head lower to the area of imbalance of price towards 103.00.
The price has followed the trajectory and is currently mitigating some of the imbalance following a fresh break of structure and this could be significant in the schematic of the gold price on the charts below.
Key US and ECB events
Meanwhile, the week ahead is going to be focused on Core PCE prices that have likely advanced firmly in May. Wjwta will be important is whether or not they will still be at a somewhat slower pace than the core Consumer Price Index (0.5% vs 0.6%). Additionally, US manufacturing surveys that have already been released point to a notable deceleration in activity in June. The Dallas survey today was very poor, -17.7 vs -3.1. Tomorrow we will have the Richmond report that is expected to show a move to -5 vs. -9 in May. Overall, the outcome of these data points this week will serve to move the needle with respect to the Federal Reserve's tightening expectations.
Currently, the WIRP suggests a 75 bp hike at the next meeting July 27 is 85% priced in, about the same as the start of last week, while 50 bp hikes at the subsequent meetings on September 21 and November 2 are almost fully priced in, analysts at Brown Brothers Harriman noted. ''Looking ahead, the swaps market is pricing in 200 bp of tightening over the next 12 months that would see the policy rate peak between 3.50-3.75%, down from nearly 4.0% at the start of last week.''
Meanwhile, there will be a focus on the European Central Bank and the euro. Hawkkishness there could see the dollar weaker and support gold higher. The ECB forum begins tonight in Sintra, Portugal. which is the ECB’s version of the Fed’s Jackson Hole Symposium. Euro-area inflation will be coming out this week as well and this likely rose further in June due to broadening price pressures and investors will look to this to cement sentiment of a likelihood of a 50bps hike from the ECB in September and set the tone for more to come at later meetings.
Analysts at TD Securities argued that ''gold prices are also being pulled higher as rising recession risks drive inflows into the yellow metal. In turn, while gold bears are looking for catalysts to shake out the massive amount of potentially complacent speculative length from proprietary traders, recession fears have started to spark a bid for safe-havens, given this historically has led a pivot in Fed policy.''
Gold technical analysis
As for the prior pre-open analysis this week, the bullish case for gold, it was stated that ''a bullish case for gold comes above the current consolidation rage above 1,832 towards the prior highs in the prior two US sessions and then $1,850 as follows:
We have seen two way price action since:
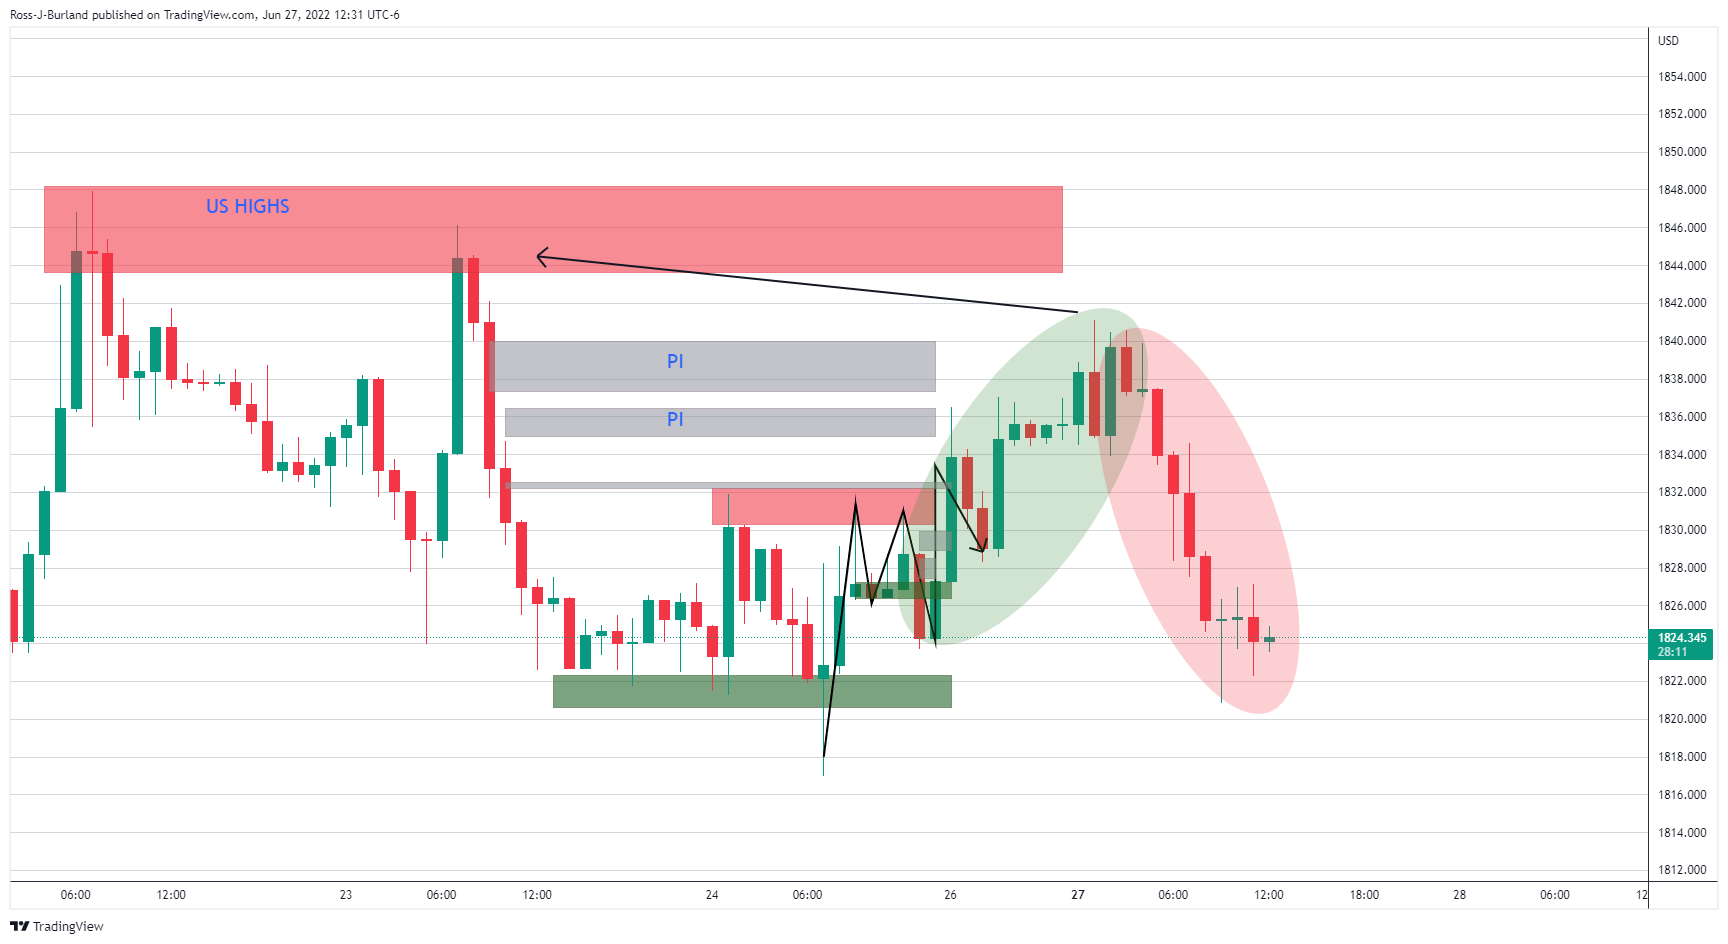
The move lower has coincided with a bid on US yields yet there is a probability that the bulls will be enticed by weakness in the greenback. The price imbalance on the hourly time frame below is located near the neckline of the M-formation at 1,839.
- Euro gains as European yields move higher.
- US dollar weakens as markets avoid a correction after last week’s rally.
- EUR/USD rises back above the 20-day SMA.
The EUR/USD rose further during the American session and climbed to 1.0614, reaching the highest level in two weeks. The euro was unable to consolidate above 1.0600 and pulled back underneath the psychological level, still holding onto holding daily gains.
The improvement in risk sentiment weakened the greenback. The DXY is falling 0.25% on Monday, trading at 103.85. US bond yields are modestly higher, but European yields rose even further. The German 10-year yield jumped 7% to 1.54%. The divergence helped EUR/USD to move higher.
US economic data came in above expectations, with Durable Goods Orders and Pending Home Sales rising more than market consensus. The dollar did not benefit from the numbers. On Thursday, the Core PCE is due.
In Portugal, the European Central Bank started its annual conference. The highlight will be on Wednesday with a panel including ECB President Lagarde, Bank of England’s Governor Bailey and Fed’s Chair Powell.
Bullish short-term outlook
The EUR/USD is trading above 1.0580 but is showing difficulties running above 1.0600. The euro is back above the 20-day Simple Moving Average (1.0588). A daily close above 1.0600 should strengthen the recovery. The 55-day SMA awaits at 1.0620.
A decline under 1.0580 would alleviate the bullish pressure. The next support might be located at 1.0530, followed by 1.0490.
Technical levels
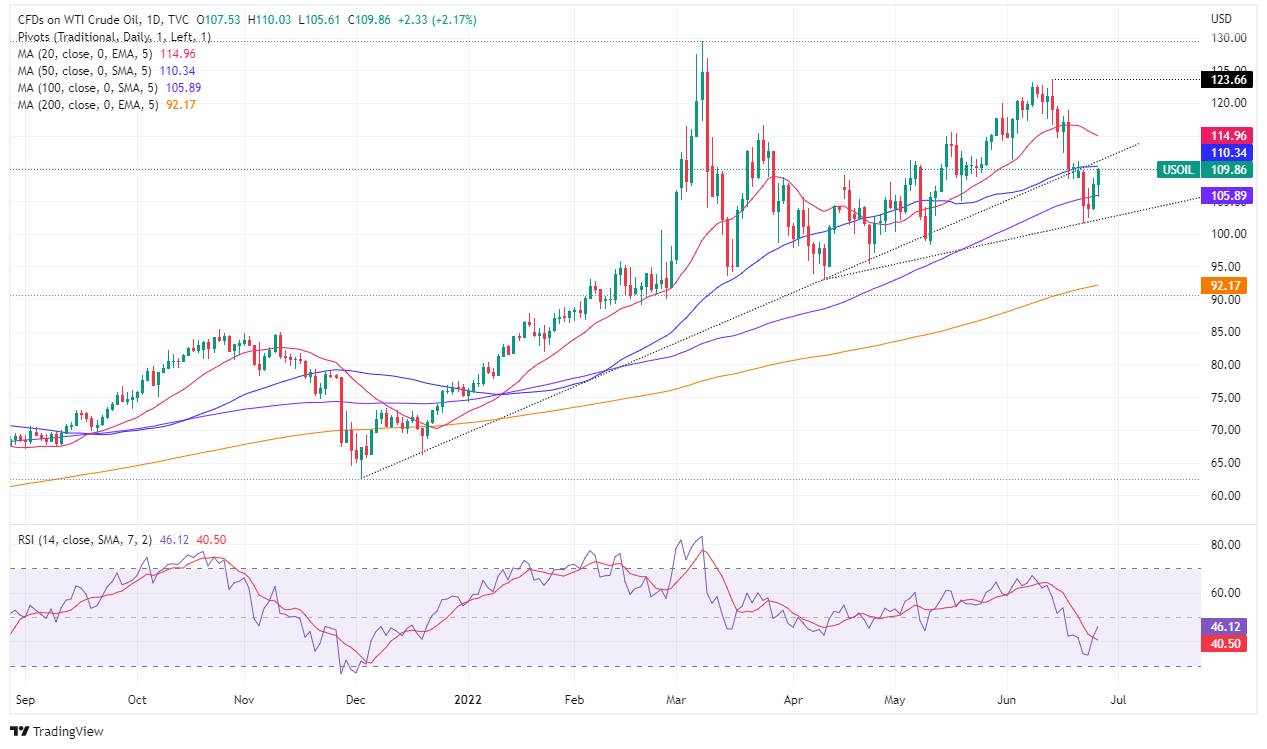
- US crude oil extends its gains to two consecutive days, though it faces solid resistance at the 50-EMA, around $110.33.
- OPEC+ reduced its 2022 market surplus to 1 million BPD, while Libya’s political turmoil cut production by 600K BPD.
- WTI Price Analysis: Despite breaking an upslope trendline, oil's price has recovered those losses, and now targets $110.00.
Western Texas Intermediate, aka WTI, records a solid bounce after testing the 100-EMA on the downside near $105.88 a barrel near the daily low and got bolstered late, as OPEC+ cuts 2022 market surplus from 1.4 million BPD to 1 million BPD according to sources cited by Reuters. At the time of writing, WTI exchanges hand at $109.86 per barrel.
Oil is rising to several factors striking the global economy. Over the weekend, the G7 is weighing on putting a lid on Russian oil prices and looking for other ways to supplant Russian oil and gas, as long as Russia keeps battling Ukraine. Meanwhile, Libya’s state oil company reported that it might suspend exports from the Gulf of Sirte amidst a worsening political crisis. Libya’s inability to resolve its political turmoil will shrink the oil market by 600,000 BPD.
In the meantime, talks between the US and Iran will restart in the coming days, according to EU chief diplomat Josep Borrell. If there is progress in Iran’s nuclear deal, crude from the country will begin to flow into the markets as a sign of relief due to the petrol shortage and high energy prices.
At the time of writing, it crossed wires that France President Macron told US President Biden that UAE is producing oil at near-maximum capacity after a conversation with UAE’s crown prince. At the same time, the Department of Energy (DOE) reported that strategic petroleum reserve oil stock dropped to 497.9 million barrels, the lowest level since April 1986.
In the meantime, the US Energy Information Administration said the timeline of publication of its Petroleum Status report that was scheduled to come out last week is still unclear but will not be published Monday, according to Bloomberg.
WTI Price Analysis: Technical outlook
The US crude oil benchmark price is trapped within the 50 and 100-EMA’s in the daily chart, each at $110.33 and $105.88, respectively. Nevertheless, WTI is upward biased, as sellers could not drag prices below the psychological $100 level.
WTI traders should be aware that despite WTI’s falling below a six-month-old upslope trendline last Tuesday, it does not mean that WTI’s trend shifted; it is just slowing, and oil is already trading near last Tuesday’s prices as WTI consolidates.
Upwards, WTI’s first resistance would be the 50-EMA at $110.00. Break above would expose the 20-EMA at $114.94, followed by the last swing high on June 14, at $123.66 per barrel.
Data released on Monday showed Durable Goods Orders rose more than expected in May. Analysts at Wells Fargo point out the report presented gains despite softening demand for goods and signs of slowing activity in regional Fed manufacturing surveys. According to them, a broad-based gain in core capital goods shipments should lift estimates for second-quarter equipment spending.
Key Quotes:
“If you are looking for signs of slowing in the manufacturing sector, you won't find many in the May durable goods report. A stout 0.7% monthly increase handily exceeded consensus expectations for a scant 0.1% gain. The strength was broadly based, with most categories in the black for the month.”
“Nondefense capital goods shipments (including aircraft), which are a good proxy for equipment spending in GDP accounts, rose 1.6% in May. This marked the seventh consecutive gain in core shipments and signals equipment spending should hold up during the quarter.”
“With every category of durables, besides computers and related equipment, seeing stronger shipments last month, this report suggests broad-based improvement across industries.”
British Foreign Minister Liz Truss said on Monday that they don't rule out using Article 16 further down the line, as reported by Reuters.
"Triggering Article 16 would not resolve fundamental issues in the Northern Ireland Protocol," Truss added.
Regarding the upcoming vote on proposed legislation to override parts of the post-Brexit agreement, "It is our expectation that the passage of this bill will result in the institutions being established," Truss told parliament earlier in the day.
Market reaction
These comments don't seem to be hurting the pound. As of writing, the GBP/USD pair was up 0.4% on the day at 1.2308.
- Stocks in Wall Street rebound back to positive.
- US Dollar Index drops to weekly lows during the American session.
- USD/CHF heads for the lowest daily close in two months.
The USD/CHF dropped to 0.9541 in American hours, hitting a fresh daily low. Earlier the pair peaked at 0.9620 before turning to the downside amid a weaker US dollar.
The greenback failed to hold onto gains as Wall Street rebounded back to positive territory. The improvement in market sentiment weighed on the dollar. The US Dollar Index has fallen 0.37% and trades at 103.75, the lowest level in a week. The US 10-year yield stands at 3.19% and the 30-year at 3.31%.
Economic data from the US came in above expectations on Monday. Durable Goods Order rose by 0.7% in May. Above the 0.1% expected. Pending Home Sales climbed unexpectedly by 0.7%. The numbers did not help the greenback. The key data of the week will be the Core PCE on Thursday. In Portugal, the annual European Central Bank forum starts on Monday; on Wednesday a discussion panel will include Lagarde (ECB), Powell (Fed) and Bailey (BoE).
Bearish bias
The USD/CHF continues to move with a bearish bias. The failure to hold above 0.9600 confirms the momentum. As of writing, the pair is testing levels under 0.9550. If it consolidates clearly below, more losses seem likely. The next target might be located at the 100-day Simple Moving Average at 0.9505.
A recovery above 0.9620 should face resistance at 0.9680, followed by 0.9715 (20-day SMA).
Technical levels
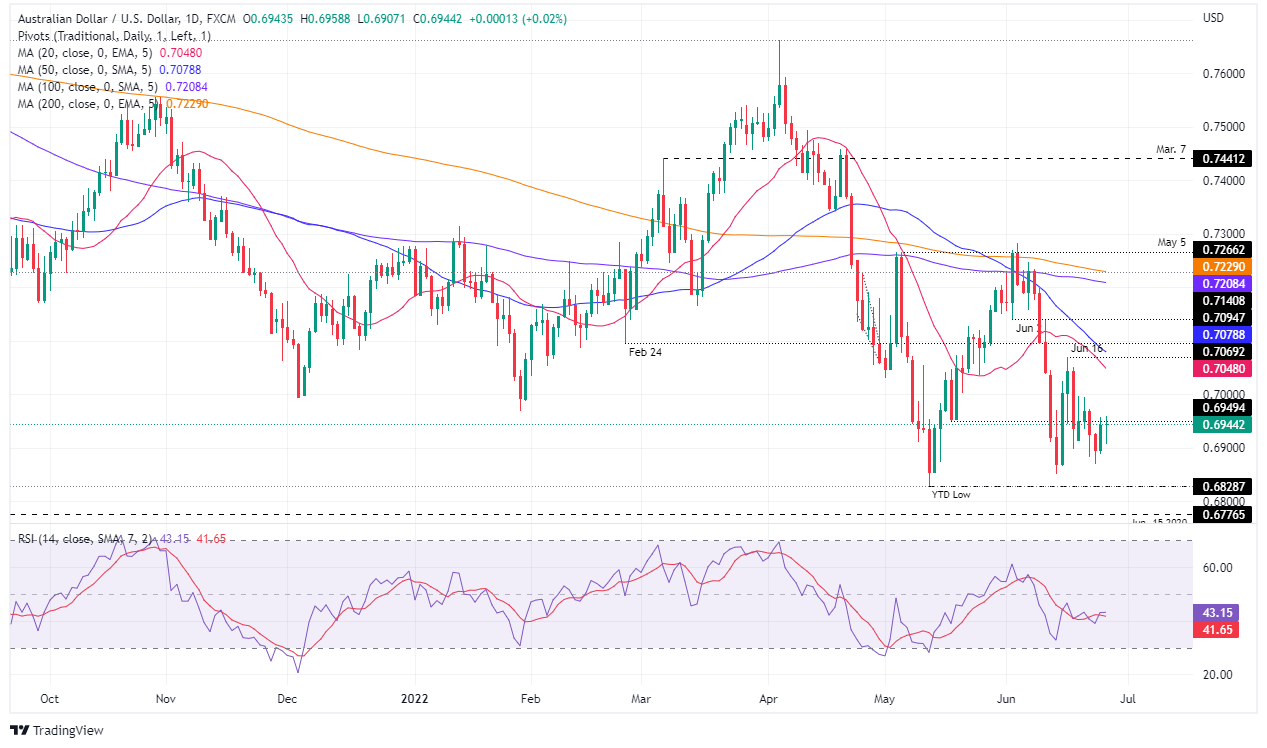
- The AUD/USD reports minimal gains of 0.03% on Monday.
- Higher global bond yields shifted Wall Street sentiment mixed, a headwind for the AUD.
- AUD/USD Price Forecast: Range-bound but skewed to the downside.
The AUD/USD seesaws from daily highs around 0.6958 printed during the Asian session and dipped towards daily lows near 0.6910, in a narrow trading range that witnessed the Aussie dollar losing some ground vs. the greenback. At 0.6944, the AUD/USD trades above the middle of the aforementioned 0.6910-0.6960 region during the North American session.
The AUD/USD dropped due to falling Iron Ore prices, from $131.45 to $129.71. Additionally, global bond yields, which ticked lower on news that global recession fears faded, pushed to the upside after one hour of the Wall Street open, which has shifted the sentiment to mixed, with US equities fluctuating between gains and losses.
In the meantime, the US Dollar Index, a gauge of the greenback’s value against a basket of its rivals, give in some territory on Monday, down 0.32%, back under the 104.000 mark. Contrarily, the US 10-year Treasury yield grinds higher close to four basis points and sits at 3.162%.
Analysts at Westpac expect that the AUD/USD could remain afloat at 0.6830
“The Aussie and Kiwi are softest in the G10 over the past week. Fragile risk sentiment and a startling slide in commodity prices are taking a toll. A relatively quiet global calendar suggests that equity sentiment could be pivotal in determining whether AUD/USD can remain clear of May’s lows around 0.6830,” analysts wrote.
In the week ahead, the Australian economic docket will feature Retail Sales for May on its preliminary reading, expected at 0.4%, less than the previous reading. On the US front, on Tuesday, CB Consumer Confidence for June is estimated at 100.4, less than May’s 106.4. that alongside Wholesale inventories, Trade Balance, Regional Fed Indices reports, and Fed speakers.
AUD/USD Price Forecast: Technical outlook
In the daily chart, the Aussie dollar is still headed to the downside as the week begins. If AUD/USD buyers would like to regain control, they need to reclaim 0.7000 to ease the ongoing selling pressure on the pair. If that is achieved, AUD buyers’ next target would be the 20-EMA at 0.7047, immediately followed by the 50-EMA at 0.7078.
On the flip side, and the AUD/USD path of least resistance, the first support would be 0.6900. A breach below would expose June 23 low at 0.6869, followed by the June 14 swing low at 0.6850.
According to the Federal Reserve Bank of Atlanta's GDPNow model, the US economy is expected to expand by 0.3% in the second quarter, up from the June 16 forecast of 0%.
"After recent releases from the Federal Reserve Board of Governors, the National Association of Realtors, and the US Census Bureau, the nowcast of second-quarter real gross private domestic investment growth increased from -9.0% to -8.1%," Atlanta Fed's publication read.
Market reaction
The US Dollar Index continues to push lower after this report and was last seen losing 0.4% on the day at 103.70.
Citing an internal report prepared for the upcoming Joint Technical Committee meeting, Reuters reported on Monday that OPEC+ trimmed its oil market surplus forecast for 2022 to 1 million barrels per day (bpd) from 1.4 million bpd previously.
Market reaction
Crude oil prices gained traction after this report. As of writing, the barrel of West Texas Intermediate (WTI) was trading at $109.47, where it was up 1.75% on a daily basis. Similarly, the barrel of Brent was up 2% at $114.65.
- Dallas Fed Manufacturing Index fell sharply in June.
- US Dollar Index continues to fluctuate near 104.00 after the data.
The headline General Business Activity Index of the Federal Reserve Bank of Dallas' Texas Manufacturing Survey plunged to -17.7 in June from -7.3 in May. This print missed the market expectation of -3.1 by a wide margin.
The New Orders sub-index dropped to 3.3 from 19.8, the Prices Paid for Raw Materials component fell to 57.5 from 61.8 and the Employment sub-index declined to 15.2 from 20.9.
Market reaction
There was no immediate market reaction to this report and the US Dollar Index was last seen posting small daily losses at 103.98.
- Pending Home Sales in the US rose modestly in May.
- US Dollar Index stays in negative territory below 104.00.
The monthly data published by the National Association of Realtors showed on Monday that Pending Home Sales rose by 0.7% on a monthly basis in May following April's decline of 4%. This print came in better than the market expectation for a contraction of 3.7%.
Despite this monthly increase, Pending Home Sales were down 13.6% on a yearly basis.
Market reaction
These figures don't seem to be having a noticeable impact on the dollar's performance against its rivals. As of writing, the US Dollar Index was down 0.2% on the day at 103.90. Meanwhile, The Dow Jones Industrial Average and the S&P 500 indexes were both flat on the day.
AUD/NZD has been following a regular bullish trend since the end of last year. Economists at Société Générale expect the pair to reach new highs above the 1.12 top seen in 2018.
AUD/NZD to benefit from a rates differential switch
“As the RBNZ started to hike earlier than the RBA, the latter is now proving more aggressive in the catch-up, so that the rates differential is likely to switch soon in the favour of Australian rates.”
“AUD/NZD could break the 1.12 top seen in 2018 and reach new highs.”
G7 members are set to ban imports of Russian gold to tighten the sanctions squeeze on Moscow. Nonetheless, the yellow metal is expected to shrug off these headlines, economists at TD Securities report.
Fed pivot less associated with recession odds than in prior episodes
“G-7 ban on new Russian gold imports isn't expected to impact gold trading considering the LBMA's ban has already cut off new Russian output from major markets within the G-7. In turn, price action is reversing to reflect the minor impact on gold. However, gold prices are also being pulled higher as rising recession risks drive inflows into the yellow metal.”
“Gold bugs sniffing out a potential stagflationary outcome associated with lower growth but lingering inflation should also consider that central banks, facing a credibility crisis, could also continue to raise rates for longer than they otherwise would. In this scenario, pricing for a Fed pivot would be less associated with recession odds than in prior episodes.”
“In the near-term, continued whipsaws from CTA trend followers reflect the range-bound price action in the yellow metal as macro pressures build.”
See – Gold Price Forecast: XAUUSD to shrug off a G7 ban on imports from Russia – Commerzbank
- USD/JPY gained some positive traction on Monday, though lacked any strong follow-through buying.
- The risk-on mood undermined the safe-haven JPY and extended support amid rising US bond yields.
- Upbeat US Durable Goods Orders failed to impress the USD bulls or provide any impetus to the pair.
The USD/JPY pair attracted some dip-buying on the first day of a new week and rallied over 100 pips from the daily swing low, around mid-134.00s. Spot prices shot to a two-day high during the early North American session, though seemed struggling to capitalize on the move amid modest US dollar weakness.
The greenback did attract some buying following the release of upbeat US Durable Goods Orders, which unexpectedly rose by 0.7% in May. Adding to this, orders excluding transportation items also surpassed estimates and recorded a growth of 0.7% during the reported month. That said, reducing odds for more aggressive Fed rate hikes kept the USD bulls on the defensive and acted as a headwind for the USD/JPY pair, at least for the time being.
The fundamental backdrop, however, supports prospects for the resumption of the recent strong bullish run to a 24-year peak touched. The recent sharp decline in commodity prices eased fears about a further rise in inflationary pressures and boosted investors' confidence. This was evident from a generally positive tone around the equity markets, which might continue to undermine the safe-haven Japanese yen and act as a tailwind for the USD/JPY pair.
The risk-on impulse pushed the US Treasury bond yields and resulted in the widening of the US-Japan yield differential. Apart from this, a big divergence in the policy stance adopted by the Bank of Japan (dovish) and the Federal Reserve (hawkish) favours bullish traders. Hence, any meaningful pullback could be seen as a buying opportunity and is more likely to remain limited ahead of Fed Chair Jerome Powell's appearance on Thursday.
Technical levels to watch
USD/JPY has established itself above the May peak of 131.30. Economists at Société Générale expect the pair to reach next projections at 138 and 141.
Watch out for support at 131.30
“Monthly MACD is firmly anchored within positive territory, which denotes upside momentum is still prevalent.”
“USD/JPY is fast heading towards the upper limit of a multi-month channel at 138 and projections of 141. If these objectives are achieved, it could result in a consolidation, although signals of reversal are still not visible.”
“The next significant resistance could be at projections of 148/150 which is also the high formed in 1998.”
“Only a break below May peak of 131.30 would denote a phase of pullback.”
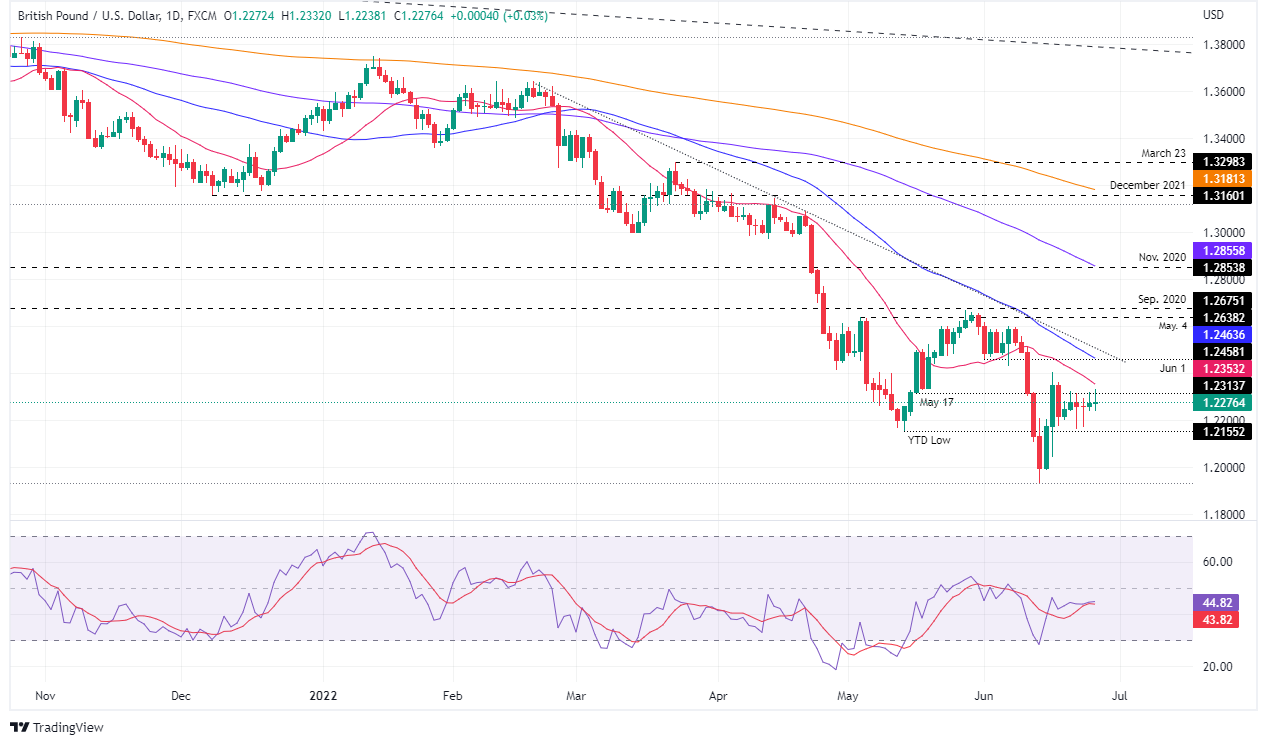
GBP/USD is gradually approaching potential support at 1.1840/1.1740. A break below this region would clear the way towards the low carved out in 2020 near 1.1410, strategists at Société Générale report.
Recent pivot high of 1.2670 must be overcome to affirm an extended rebound
“The pair is drifting gradually towards potential support of 1.1840/1.1740, representing the lows of 2016 and projections. Defending this zone could result in a short-term bounce.”
“The recent pivot high of 1.2670 is an important resistance. This must be overcome to affirm an extended rebound towards 1.2810, the 38.2% retracement from June 2021 and December low of 1.3100/1.3160.”
“In the event that the ongoing decline persists below 1.1740, the pair could revisit the low carved out in 2020 near 1.1410.”
EUR/USD has extended its downtrend after breaking below the trend line drawn since 2000. This violation has led the pair towards the lows of 2016/2017 near 1.0340. A break under here would open up additional losses towards 1.0070/1.0000, analysts at Société Générale report.
Break above 1.0790/1.0810 essential to affirm a phase of rebound
“The neckline at 1.0790/1.0810, which is also the low of March, is an important resistance. So long as crossover beyond this doesn’t materialize, the downtrend is expected to persist.”
“Failure to defend 1.0340 would affirm a continuation in decline. The next potential objectives could be at 1.0070/1.0000, the 76.4% retracement of the whole uptrend during 2000 and 2008.”
The CAD edged fractionally higher to the 1.2865/70 area before ceding gains and trading back to near flat on the session. This movement indicates that the loonie lacks positive momentum, in the view of analysts at Scotiabank
Break under 1.2865 to tip funds back to the low/mid 1.27s
“Spot’s soft-ish close on the week through last Friday puts a tentative top on the USD rally after spot’s rejection of the upper 1.30s in the prior week. But the fact that support around 1.2865 continues to hold the market up suggests very limited, positive momentum behind the CAD at this point.”
“A break under 1.2865 should tip funds back to the low/mid 1.27s.”
“Intraday, we spot resistance at 1.2935/45.”
See – USD/CAD: Break below 1.2864/58 to prompt further weakness – Credit Suisse
The US Dollar Index stays relatively quiet near 104.00. In the view of economists at Société Générale the steady uptrend is in force, therefore, DXY is set to clib as high as 111.
Only a break under 101 would signal a risk of a deeper downtrend
“We expect the index to head higher gradually towards next projections at 109 and the upper band of the multiyear channel near 111/112.”
“Shorter-term, we cannot rule out a phase of consolidation roughly within limits of 101.30/101 and 106. Eventually, a move beyond 106 would lead to the next leg of uptrend.”
“Only if the recent pivot low near 101 is violated would there be a risk of a deeper downtrend. If this break materializes, the next potential support levels would be at 99.40 and the 200-DMA near 97.50.”
EUR/USD strengthens into high-1.05s. A break above the 1.06 level would open up further gains towards the next big figure, economists at Scotiabank report.
EUR/USD holds in a minor upward trend since mid-month
“The EUR is heading into a test of its 50-day MA at exactly the 1.06 figure, as it holds in a minor upward trend since mid-month.”
“The EUR is now aiming for a test of the big figure that quickly triggered selling pressure earlier this month and is a key zone to beat to preserve the EUR’s ascent.”
“Beyond the figure, the 1.0640/50 zone is resistance followed by the next big figure.”
“Support is the daily low of 1.0550 followed by 1.0520 and the 1.05 figure area.”
- Gold once again faced rejection near 200-DMA and has now filled the weekly bullish gap.
- The risk-on impulse and rising US bond yields acted as a headwind for the commodity.
- The emergence of some USD dip-buying further contributed to the intraday selling bias.
Gold continued with its struggle to make it through the very important 200-day SMA and witnessed some intraday selling near the $1,840 area on Monday. The intraday downtick dragged spot price to the lower end of the daily trading range, around the $1,828 region during the early North American session and was sponsored by a combination of factors.
Investors turned optimistic amid hopes that inflation is nearing its peak, bolstered by the recent sharp decline in commodity prices. This was evident from a generally positive tone around the equity markets, which acted as a headwind for the safe-haven gold. The risk-on flow pushed the US Treasury bond yields and further contribute to capping gains for the non-yielding yellow metal.
A goodish pickup in the US bond yields allowed the US dollar to reverse its modest intraday losses to over a one-week low. The greenback drew additional support from upbeat US Durable Goods Orders, which unexpectedly increased by 0.7% in May. Orders excluding transportation items also surpassed estimates and rose 0.7%. A stronger USD exerted additional pressure on the dollar-denominated gold.
The downside, however, seems cushioned, at least for the time being, amid growing recession fears and expectations that some G7 countries plan to ban bullion imports from Russia. This might tighten supplies and continue lending support to gold prices. This makes it prudent to wait for strong follow-through selling before positioning for any further near-term depreciating move.
Nevertheless, gold has now filled a weekly bullish gap and repeated failures near a technically significant moving average suggest an eventual breakdown to the downside. Hence, any attempted recovery might still be seen as a selling opportunity and runs the risk of fizzling out rather quickly near the $1,848-$1,850 region, which should act as a pivotal point for gold prices.
Technical levels to watch
EUR/USD has been stuck in the 1.04-1.08 range since April. Economists at Société Générale expect the pair to remain below the 1.10 throughout the rest of the year.
Fundamentals suggest a higher EUR/USD
“Over the past four years, EUR/USD has tracked the spread of economic surprises between Europe and the US. This correlation recently broke, but the cross used to be around 1.15 when the spread was flat like it is now. Fundamentals thus suggest a higher EUR/USD, which, however, has been stuck in the 1.04-1.08 range since April.”
“The war in Ukraine remains a serious tail risk that should continue to anchor the euro in the second semester, likely postponing the take-off above 1.10 to next year.”
NZD/USD recovered on Friday. Nonetheless, analysts at Credit Suisse stay bearish and look for an eventual break below 0.6230/6194.
NZD/USD remains capped at 0.6329
“We remain tactically bearish on the back of the 55-day and 200-day moving averages continuing to fall and look for a move below 0.6194. A break here would support further medium-term weakness and open up an eventual move to the next significant support at 0.5919/5841.”
“A close above 0.6329 would prompt near-term upward pressure and see potential to reach a notable near-term resistance at the recent price high and the minor breakdown point at 0.6395/6435.”
“A close above the 0.6435 level would likely trigger a stronger move to the May/June highs at 0.6568/76, though we would look for a ceiling here to maintain the core downtrend.”
- EUR/USD shot to a three-day high on Monday, albeit struggled to make it through the 1.0600 mark.
- Repeated failures near the 50-day SMA warrants caution before positioning for any meaningful gains.
- Break below a two-week-old ascending trend-line would shift the bias in favour of bearish traders.
The EUR/USD pair gained traction for the second successive day on Monday and climbed to a three-day peak, though struggled to capitalize on the move.
A goodish pickup in the US Treasury bond yields assisted the US dollar to reverse an intraday dip to over a one-week low. Apart from this, upbeat US Durable Goods Orders offered additional support to the greenback and capped the EUR/USD pair just ahead of the 1.0600 round-figure mark.
From a technical perspective, the aforementioned handle now coincides with the 50-day SMA and should now act as a pivotal point. Sustained strength beyond would be seen as a fresh trigger for bullish traders and pave the way for an extension of a nearly two-week-old upward trajectory.
The EUR/USD pair might then accelerate the momentum towards the 1.0650 horizontal support breakpoint, now turned resistance, before aiming to reclaim the 1.0700 mark. The next relevant hurdle is pegged near the 1.0745-1.0750 area ahead of the May high, around the 1.0780-1.0785 zone.
Meanwhile, the recent bounce from the vicinity of mid-1.0300s, or the YTD low has been along an upward-sloping trend-line. The said support, currently around the 1.0535-1.0530 region, should continue to protect the immediate downside, which if broken might prompt some technical selling.
The subsequent fall has the potential to drag spot prices towards the 1.0500 psychological mark, which is closely followed by support near the 1.0480 region. Some follow-through selling would shift the bias back in favour of bearish traders and make the EUR/USD pair vulnerable.
EUR/USD 4-hour chart
-637919312947961808.png)
Key levels to watch
- Durable Goods Orders in the US rose unexpectedly in May.
- US Dollar Index holds above 104.00 after the data.
Durable Goods Orders in the US increased by 0.7%, or by $1.9 billion, on a monthly basis in May to $267.2 billion, the monthly data published by the US Census Bureau revealed on Monday. Investors were expecting the data to remain unchanged.
"Excluding transportation, new orders increased 0.7%. Excluding defense, new orders increased 0.6%," the publication further read. "Transportation equipment, up two consecutive months, led the increase, $0.7 billion or 0.8% to $87.6 billion."
Market reaction
The US Dollar Index edged slightly higher after this data and was last seen posting small daily losses at 104.08.
- USD/CAD reversed an early dip to over a one-week low amid the emergence of some USD buying.
- Bullish crude oil prices could underpin the loonie and keep a lid on any further gains for the major.
- The markets reacted little following the release of upbeat US Durable Goods Orders data for May.
The USD/CAD pair attracted some dip-buying near the 1.2865-1.2860 congestion zone and bounced nearly 40 pips from a one-and-half-week low touched earlier this Monday. The pair was last seen trading with modest intraday gains, around the 1.2900 round-figure mark heading into the North American session.
The US dollar reversed an intraday dip to over a one-week low amid a goodish pickup in the US Treasury bond yields, bolstered by the risk-on impulse in the markets. The emergence of some USD buying at lower levels turned out to be a key factor that offered some support to the USD/CAD pair. That said, an uptick in crude oil prices underpinned the commodity-linked loonie and might keep a lid on any meaningful upside for spot prices, at least for the time being.
Moves against Russian oil and gas exports that might come out of a meeting of leaders of the Group of Seven (G7) nations in Germany acted as a tailwind for the black liquid. That said, the prospects for a revival of the Iran nuclear deal, which might lead to more Iranian oil exports, could cap gains for the commodity. Traders might also be reluctant to place aggressive bets and prefer to move on the sidelines ahead of the OPEC+ meeting later this week.
Apart from this, investors will take cues from Fed Chair Jerome Powell's remarks in a panel discussion on Thursday that might help determine the near-term trajectory for the USD/CAD pair. In the meantime, the markets reacted little to the US macro data, which showed that Durable Goods Orders unexpectedly increased by 0.7% in May. Orders excluding transportation items also surpassed estimates and rose 0.7%, though failed to provide any impetus to the USD/CAD pair.
Nevertheless, spot prices, for now, seem to have stalled the recent pullback from the YTD peak, around the 1.3075-1.3080 region touched earlier this month and recovered a part of Friday's losses. Some follow-through buying has the potential to lift the USD/CAD pair towards the 1.2945 resistance zone, above which bulls might aim back to reclaim the 1.3000 psychological mark.
Technical levels to watch
In the view of strategists at Credit Suisse, the S&P 500 is expected to see a deeper recovery to 3974, potentially the top of the early June price gap and 38.2% retracement of the fall from March at 4017/19.
Initial support seen at 3872
“The recovery is set to extend further yet with resistance seen next at 3943, then the price gap from earlier in June, starting at 3974 and stretching up to 4017/19, also the 38.2% retracement of the March/June fall. With the top of the trend channel from April seen not far above at 4039, we would look for a cap here for an eventual resumption of the broader downtrend.”
“Support is seen at 3872 initially, then 3848/38, with the price gap from Friday ideally holding to keep the immediate risk higher, seen starting at 3822 and stretching down to 3796.”
USD/CAD fell sharply on Friday and has tested significant near-term support at 1.2864/58 on Monday. A break below here would signal a swing lower within the channel, analysts at Credit Suisse report.
Immediate resistance moves to 1.2933/34
“A sustained close below the recent price low at 1.2864/58 would signal a failure to break above 1.3077/3100 and prompt another swing back lower within the gently upward sloping mean-reverting channel, with next support seen at 1.2680/71.”
“Should weakness extend directly below 1.2680/71 as well, this would promote further downside towards a major support zone at the bottom of the channel at 1.2515/2400, which we would certainly expect to hold.”
“Immediate resistance moves to 1.2933/34 and next to the recent price high and retracement resistance at 1.3017/38. A move above here would open the door to the top of the channel at 1.3077/3104, which has to hold to maintain the mean-reverting regime and prevent a major medium-term breakout to the upside. Should this take place though, we would look for a quick move to the next resistance at 1.3334.”
EUR/USD consolidation stays seen as temporary ahead of an eventual sustained break below the 2017 and YTD lows at 1.0350/41, in the view of economists at Credit Suisse.
Further consolidation looks likely
“EUR/USD extends its consolidation but remains capped below its recent high at 1.0601. With more important price resistance and the falling 55-day average seen not far above at 1.0621/27 our bias remains for a cap here and for a fresh turn lower and an eventual resumption of the broader downtrend.”
“Support moves to 1.0512 initially, then 1.0469, below which should see the risk turn lower again for a retest of key price support from the YTD and 2017 lows at 1.0350/41. We continue to look for eventual break below here, which should act as the catalyst for a resumption of the core downtrend, with support seen next at 1.0217/09 and eventually parity/0.99.”
US durable goods orders overview
Monday's US economic docket highlights the release of Durable Goods Orders data for May. The US Census Bureau will publish the monthly report at 12:30 GMT and is expected to show that headline orders remained flat during the reported month as compared to the 0.5% rise in April. Orders excluding transportation items, which tend to have a broader impact, are anticipated to have increased by 0.3% in May, down slightly from a 0.4% in the previous month.
How could it affect EUR/USD?
A weaker-than-expected report would further fuel concerns that the growth momentum in the US is starting to cool and force investors to scale back their expectations for more aggressive Fed rate hike moves. This would be enough to exert some downward pressure on the US dollar and allow the EUR/USD pair to make it through the 50-day SMA resistance.
Conversely, upbeat figures are more likely to be overshadowed by a goodish recovery in the global risk sentiment, which should continue undermining the safe-haven greenback. The fundamental backdrop suggests that the path of least resistance for the USD is to the downside and up for the EUR/USD pair, which has been trending higher over the past two weeks or so.
Eren Sengezer, Editor at FXStreet, outlined important technical levels to trade the EUR/USD pair: “As of writing, EUR/USD was trading slightly above the 200-period SMA on the four-hour chart, which is currently located at 1.0580. In case the pair starts using that level as support, 1.0600 (Fibonacci 61.8% retracement of the latest downtrend, psychological level) aligns as interim resistance ahead of 1.0640 (static level) and 1.0660 (static level, former support).”
“On the downside, key support seems to have formed at 1.0560 (Fibonacci 50% retracement, 100-period SMA). A four-hour close below that level could attract bears and cause the pair to retreat toward 1.0520 (Fibonacci 38.2% retracement, 50-period SMA) and 1.0500 (psychological level),” Eren added further.
Key Notes
• EUR/USD Forecast: Euro could push higher as long as 1.0560 support holds
• EUR/USD closes in on 1.0600 amid risk flows-led USD slide
• EUR/USD bulls approach 1.0600 hurdle, US Durable Goods Orders, ECB’s Lagarde eyed
About US durable goods orders
The Durable Goods Orders, released by the US Census Bureau, measures the cost of orders received by manufacturers for durable goods, which means goods planned to last for three years or more, such as motor vehicles and appliances. As those durable products often involve large investments they are sensitive to the US economic situation. The final figure shows the state of US production activity. Generally speaking, a high reading is bullish for the USD.
- GBP/USD climbed to over a one-week high on Monday amid modest USD weakness.
- Dovish BoE expectations, Brexit woes acted as a headwind and capped the upside.
- Investors now look forward to the US economic data for short-term opportunities.
The GBP/USD pair gained some positive traction on Monday and shot to over a one-week high during the early part of the European session. Spot prices, however, struggled to capitalize on the move or find acceptance above the 1.2300 mark and have now surrendered a major part of the intraday gains.
The recent slump in commodity prices seems to have eased worries about the persistent rise in inflation and forced investors to scale back expectations for a more aggressive policy tightening by the Fed. Apart from this, a goodish recovery in the global risk sentiment - as depicted by a generally positive tone around the equity markets - undermined the safe-haven US dollar. This, in turn, was seen as a key factor that offered some support to the GBP/USD pair, though the uptick lacked bullish conviction.
The incoming softer UK macro data has raised concerns over the British economic growth and been fueling recession fears. This, along with expectations that the Bank of England would opt for a more gradual approach towards raising interest rates, held back traders from placing aggressive bullish bets around the British pound. Apart from this, the UK-EU impasse over the Northern Ireland Protocol of the Brexit agreement further contributed to capping the gains for the GBP/USD pair, at least for the time being.
Hence, it will be prudent to wait for strong follow-through buying beyond last week's swing high, around the 1.2325 region, before positioning for any further appreciating move. Market participants now look forward to the US economic docket, featuring the release of Durable Goods Orders and Pending Home Sales data. This, along with the US bond yields and the broader market risk sentiment, might influence the USD price dynamics and produce short-term trading opportunities around the GBP/USD pair.
Technical levels to watch
- AUD/USD kicked off the new week on a weaker note, though lacked follow-through selling.
- The recent slide in commodities, Chinese economic woes acted as a headwind for the aussie.
- The risk-on impulse undermined the safe-haven USD and helped limit losses for the major.
The AUD/USD pair struggled to capitalize on Friday's goodish rebound from sub-0.6900 levels and met with a fresh supply on the first day of a new week. The pair maintained its offered tone through the first half of the European session and was last seen trading around the 0.6920 area, just a few pips above the daily low.
The recent slump in commodity prices turned out to be a key factor that continued acting as a headwind for the resources-linked Australian dollar. Adding to this, the fact that the Chinese economy is facing headwinds amid the resurgence of COVID-19 cases exerted additional downward pressure on the China-proxy aussie. That said, a combination of factors held back traders from placing aggressive bearish bets around the AUD/USD pair and helped limit deeper losses.
Investors turned optimistic amid hopes that inflation is nearing its peak and now seem to have scaled back their expectations for more aggressive rate hikes by the Fed. This was reinforced by a sharp corrective pullback in the US Treasury bond yields, which kept the US dollar bulls on the defensive. Apart from this, a generally positive risk tone around the equity markets further undermined the safe-haven greenback and offered some support to the risk-sensitive aussie.
From a technical perspective, the emergence of fresh selling at higher levels suggests that the recent downward trajectory witnessed since the beginning of this month is still far from being over. Hence, a subsequent fall back towards the monthly low, around the 0.6850 region, now looks like a distinct possibility. The AUD/USD pair could extend the fall further and eventually drop to challenge the YTD low, around the 0.6830-0.6825 region touched in May.
Market participants now look forward to the US economic docket, featuring the release of the Durable Goods Orders and Pending Home Sales data later during the early North American session. This, along with the US bond yields, will influence the USD price dynamics and provide some impetus to the AUD/USD pair. Traders will further take cues from the broader risk sentiment to grab short-term opportunities around the major.
Technical levels to watch
Russia does not accept that it has defaulted on its external debt, the Kremlin said in a statement on Monday.
Additional takeaways
Russian gold and forex reserves are blocked unlawfully.
Russia made payment on euro bond coupons in May.
Euroclear not accepting Russia’s euro bond transaction 'is not our problem'.
Early Monday, Bloomberg reported that Russia has ''defaulted on its foreign-currency sovereign debt for the first time since 1918.
Market reaction
USD/RUB was last seen trading at 53.26, down 0.25% on the day.
GBP/USD has gained traction early Monday. As FXStreet’s Eren Sengezer notes, the pair faces next hurdle at 1.2360.
1.2280 aligns as first support
“GBP/USD is facing next resistance at 1.2360, where the Fibonacci 61.8% retracement of the latest downtrend is located. In case the pair manages to clear that hurdle, it could target 1.2400 (200-period SMA on the four-hour chart) and 1.2460 (static level, former support).”
“On the flip side, 1.2280 (Fibonacci 50% retracement) aligns as first support before 1.2250 (50-period SMA) and 1.2200 (Fibonacci 38.2% retracement).”
See: GBP/USD could edge up to the recent highs at 1.24 – ING
Gold has climbed to $1,840. Nonetheless, G7 planning import ban on gold from Russia is set to have a limited market impact, in the view of strategists at Commerzbank.
Inflation pressure to remain high in the short term
“The seven leading industrialised countries are planning at their summit to ban imports of gold from Russia. This may indeed explain the immediate market reaction. However, the actual impact on the gold market is likely to be too small to have any lasting influence on the price trend.”
“The development of inflation and interest rates will continue to have a greater bearing on the gold price. The inflation pressure is likely to remain high in the short term. This is positive for gold per se in its role as an inflation hedge. However, it also keeps up the pressure on central banks to raise interest rates more steeply, which is negative for gold per se as a non-interest-bearing investment. Much therefore points to a continuation of volatile sideways trending depending on which of the two influential factors happens to have the upper hand.”
- EUR/USD is extending gains to test 1.0600 in the European session
- The US dollar loses further ground amid a risk-on mood at full steam.
- Markets re-price central banks’ tightening plans ahead of US data, Lagarde.
EUR/USD is nearing 1.06000, building onto the Asian rebound in the European session on Monday, as positive global momentum continues and weighs heavily on the safe-haven US dollar.
European stocks climb over 1%, taking the upbeat cues from their Asian and US peers, as investors rethink whether the central banks’ will continue with their aggressive rate-hike track, in the face of slowing economic growth.
Futures pricing shows traders now anticipating the US Fed’s benchmark funds rate stabilizing around 3.5% from March next year, a revision lower from peviously pricing in rates zooming to around 4% in 2023.
Risks of economic contractions in the US and Europe have risen sharply after Russia’s invasion of Ukraine caused consumer prices to surge worldwide, which was well reflected in June business PMI reports released on both sides of the Atlantic last week.
Despite the bullish momentum, buyers seem to be struggling over the last hour, as the rally in the US Treasury yields could be hindering EUR/USD’s journey towards 1.0600.
Attention now turns towards the first-tier US Durable Goods Orders data due on the cards later in the NA session, followed by the Pending Home Sales for a fresh take on the American economic health. Additionally, ECB President Christine Lagarde’s opening remarks at the central bank’s three-day Forum in Sintra this week will be closely eyed.
The main event risk, however, this week will be the policy debate between the chiefs of the Fed, BOE and ECB at the Sintra Forum on Wednesday.
EUR/USD technical levels to consider
- A combination of supporting factors pushed gold prices higher on the first day of a new week.
- G7 nations plan to ban bullion imports from Russia and acted as a tailwind amid a weaker USD.
- The risk-on impulse held back bulls from placing aggressive bets and capped any further gains.
Gold attracted some dip-buying after filling the weekly bullish gap and climbed to a fresh daily high during the early part of the European session. The XAUUSD was last seen trading around the $1,840 region, with bulls still awaiting sustained strength beyond the very important 200-day SMA.
The recent sharp decline in commodity and energy prices now seems to have eased fears about the risk of a further rise in inflationary pressures. Furthermore, some high-frequency data indicate that the growth momentum in the US is starting to cool. This forced investors to reassess the prospects of more aggressive rate hikes by the Federal Reserve, which dragged the US dollar to over a one-week low on Monday and benefitted the dollar-denominated gold.
Some countries, including the US, UK, Japan, and Canada, plan to announce a ban on new gold imports from Russia during the G7 summit ban bullion imports from Russia during the G7 summit this week. This was seen as another factor that acted as a tailwind for the XAUUSD. The upside, however, remains capped, at least for the time being amid a generally positive tone around the equity markets, which tends to drive flows away from the traditional safe-haven XAUUSD.
Meanwhile, the risk-on impulse pushed the US Treasury bond yields higher and was seen as another factor that kept a lid on any meaningful upside for the non-yielding yellow metal. This, in turn, warrants some caution before placing aggressive bullish bets around gold. Market participants now look forward to the US economic docket - featuring the release of Durable Goods Orders and Pending Home Sales later during the early North American session.
This, along with the US bond yields and the USD price dynamics, should provide some impetus to gold. Traders will further take cues from the broader market risk sentiment to grab short-term opportunities around the commodity.
Technical levels to watch
With the G7 Summit underway, a US official said on Monday that the G7 is close to setting a global price cap for Russian oil.
Additional comments
“To issue coordinated steps tomorrow to raise pressure on Russia.”
“Targeting services for transporting Russian oil is a 'promising avenue'.”
“US will impose higher tariffs on Russian goods worth about $2.3 billion.”
Meanwhile, Javier Blas, Energy and commodities columnist at Bloomberg, tweeted out, “from what I hear from officials on the ground, the G7 is **not** going to agree on an oil price cap at this meeting, but it will agree **this a direction it wants to push forward**, and will seek further talks to non-G7 nations to see if it can be put into practice.”
Market reaction
WTI is defending minor gains around $106.50, having hit daily highs at $107.24 earlier in the day.
Hiking by the Swiss National Bank (SNB) should reduce the US dollar's momentum. Subsequently, economists at UBS have lowered their USD/CHF forecasts.
SNB’s unexpected hike to lead to a stronger franc against the dollar
“The SNB surprised markets with a 50 bps rate hike and announced its intention to take further action to keep inflation expectations well anchored. While the SNB is still well behind the US, we expect this unexpected hike to lead to a stronger franc against the dollar.”
“We recently lowered our USD/CHF forecasts to 0.94 for end-September, 0.93 for end-December, 0.91 for end-March 2023, and 0.88 for end-June 2023 (from 0.98, 0.96, 0.94, and 0.92, respectively).”
EUR/USD has started the new week on a firm footing. The pair could push higher as long as 1.0560 support holds, FXStreet’s Eren Sengezer reports.
Technical outlook points to a bullish tilt
“In case EUR/USD starts using the 200-period SMA on the four-hour chart located at 1.0580 as support, 1.06 (Fibonacci 61.8% retracement of the latest downtrend, psychological level) aligns as interim resistance ahead of 1.0640 (static level) and 1.0660 (static level, former support).”
“Key support seems to have formed at 1.0560 (Fibonacci 50% retracement, 100-period SMA). A four-hour close below that level could attract bears and cause the pair to retreat toward 1.0520 (Fibonacci 38.2% retracement, 50-period SMA) and 1.05 (psychological level).”
“The Relative Strength Index (RSI) indicator holds above 50, confirming the bullish shift in the short-term outlook.”
- GBP/JPY gained traction for the second straight day on Monday, though lacked follow-through.
- A generally positive risk tone undermined the safe-haven JPY amid the BoJ’s dovish outlook.
- Recession fears, bets for more gradual BoE rate hikes capped the upside amid Brexit woes.
The GBP/JPY cross attracted some dip-buying near the 165.15-165.10 region on Monday and turned positive for the second successive day. The cross maintained its bid tone through the early European session and was last seen trading around the 166.30 area, just a few pips below the daily high touched in the last hour.
The recent slump in commodity prices now seems to have eased fears about the persistent rise in inflationary pressures and boosted investors' confidence. This was evident from a generally positive tone around the equity markets, which, along with a more dovish stance adopted by the Bank of Japan, undermined the safe-haven Japanese yen. On the other hand, the British pound drew some support from the prevalent US dollar selling bias. The combination of supporting factors assisted the GBP/JPY cross to gain some positive traction on the first day of a new week, though the upside is likely to remain capped.
The incoming softer UK economic data have been fueling fears about a possible recession. This, along with the social and political unrest, points to further instability in the UK and could force the Bank of England to opt for a more gradual approach toward raising interest rates. Apart from this, the UK-EU impasse over the Northern Ireland Protocol of the Brexit agreement could act as a headwind for the British pound. This, in turn, should hold back bulls traders from placing aggressive bets and keep a lid on any meaningful gains for the GBP/JPY cross, at least for the time being.
There isn't any major market-moving economic data due for release on Monday, leaving spot prices at the mercy of the broader market risk sentiment. Traders will further take cues from the USD price dynamics, which will influence the GBP and contribute to producing short-term opportunities around the GBP/JPY cross.
Technical levels to watch
- Silver gained strong traction for the second straight day and recovered further from the monthly low.
- Move beyond the 200-period SMA on the 4-hour chart should allow bulls to conquer the $22.00 mark.
- Sustained weakness below the $21.00 round figure would shift the bias in favour of bearish traders.
Silver built on Friday's solid recovery move from the $20.60 area, or the lowest level since May 13 and gained follow-through traction on the first day of a new week. This marked the second successive day of a positive move and pushed spot prices back closer to mid-$21.00 during the early European session.
From a technical perspective, any subsequent move up is more likely to confront stiff resistance near the 200-period SMA on the 4-hour chart, currently around the $21.65-$21.70 region. Some follow-through buying should allow the XAG/USD to build on the momentum and aim back to conquer the $22.00 mark.
Sustained strength beyond the latter would negate any near-term negative outlook and be seen as a fresh trigger for bullish traders. The XAG/USD might then accelerate the move towards an intermediate resistance near the $22.30 area en-route the $22.50-$22.60 hurdle and the $23.00 round-figure mark.
On the flip side, the daily low, around the $21.10 region, now seems to protect the immediate downside. A convincing break below, leading to a subsequent break through the $21.00-$20.90 support, would suggest that attempted recovery has run out of steam and shift the bias back in favour of bearish traders.
The next relevant support is pegged near the monthly low, around the $20.60 area touched on Friday, ahead of the YTD low, around the $20.45 region. The downward trajectory could get extended and drag the XAG/USD towards challenging the $20.00 psychological mark for the first time since July 2020.
Silver 4-hour chart
-637919121597849421.png)
Key levels to watch
In the view of economists at Rabobank, the risk of USD/JPY pushing to 140 in the short-term is highly dependent on US yields. Therefore, upticks in US treasury yields will be watched closely.
BoJ’s YCC policy unlikely to be altered in the near-term
“On the assumption that the BoJ’s YCC policy will not be altered in the near-term, the outlook for USD/JPY is likely to be a function of the outlook for US yields. If US yields move higher, USD/JPY could see 140.”
“By the end of the year, the BoJ is likely hoping that signs of domestic wage inflation will allow it more flexibility to consider a policy change without being pushed into it by speculators. In this scenario, USD/JPY is likely to edge lower.”
NZD/USD has found dcent support at 0.62. Economists at Westpac expect the pair to range between the latter and the 0.66 mark multi-week.
Kiwi to hit 0.69 by year-end
“NZD/USD has established decent support around 0.62 over the past month, and a period of ranging between there and 0.66 is expected over the next few weeks.”
“By year-end, we expect to see NZD/USD above 0.69.”
USD/JPY is moving sideways near 135 at the start of the new week. Economists at Westpac expect the pair to reach the 137 level in the near-term.
JPY’s depreciation path is set to continue
“The latest post 1998 spot highs are not backed by the 10 year Treasury – JGB spread. But we can’t justify calling a top of the cycle near term.”
“We continue to look for a run at 137.”
Despite recent IDR weakness, Bank Indonesia (BI) opted to keep its policy rate on hold at 3.50%. Until clear signs of a hawkish shift emerge, the IDR is likely to be relatively more vulnerable to shifts in global sentiment, in the view of economists at ANZ Bank.
Bank Indonesia bucks the hawkish trend
“While there were some signs suggesting that the central bankis turning more vigilant on inflation risks, the overall policy messaging remained dovish.”
“We have been of the view that pandemic-era stimulus is no longer needed in Indonesia and that the scope for BI to swim against the global tide of rate hikes is narrowing. But until clear signs of a hawkish shift by the central bank emerge, the IDR is likely to be more vulnerable to swings in global risk sentiment.”
What will EUR/USD do in case of a US recession? Economists at Commerzbank still expect the pair to reach the 1.16 level but it will take much longer than expected.
US dollar to ease significantly in 2023
“The continued risks of a recession are likely to put continued pressure on the euro for longer than previously assumed in this new central scenario. As a result, we have postponed the recovery of EUR.”
“If the Fed lowers its key rate again in 2023, but not the ECB, the US dollar’s real interest rate advantage will disappear and thus the main reason for the USD strength which we have been seeing for more than a year now. We therefore expect (now for 2023 and no longer for 2022) the US dollar to ease significantly.”
“We still left our target for EUR/USD at 1.16, but expect that it will take much longer until EUR/USD will reach this target.”
Gold trades in the upper half of its consolidation channel above $1,830. Nevertheless, economists at Commerzbank expect the yellow metal to struggle to post further gains in the near-term.
Optimistic gold’s prospects in the medium to long-term
“In his testimony before the Financial Committee of the US House of Representatives, US Fed Chair Powell stressed the ‘unconditional’ willingness of the Fed to curb inflation. This is likely to translate into sizeable rate hikes in the coming months.”
“Our economists expect the Fed to raise interest rates to 4% by the end of the year. However, the Fed rate hikes will choke the economy – we believe the US economy will slide into recession in the coming year – so the Fed will probably not increase interest rates any further than that, and in our opinion is even likely to lower them again towards the middle of next year. We, therefore, remain optimistic about gold’s prospects in the medium to long-term.”
“Gold is likely to have problems regaining any ground in the short-term.”
Turkish authorities have found a new way to boost the lira, restricting lending to companies. The measures triggered a 5% rally in the lira. However, economists at ING expect USD/TRY to struggle to hold below the 16.00/30 area.
New measures provide temporary support for the lira
“On Friday, regulators announced that firms with excess holdings of foreign exchange would see access to commercial lira loans curtailed. The measures seem to be addressing one of the areas of lira leakage where credit growth was finding its way into FX.”
“Most expect that the lira will struggle to defy 70% inflation without recourse to more conventional monetary policy, thus it is not clear how long the lira can sustain these gains close to the 16.00/16.30 area.”
- A combination of factors assisted USD/JPY to reverse modest intraday losses on Monday.
- A positive risk tone undermined the safe-haven JPY amid the Fed-BoJ policy divergence.
- Weaker USD failed to inspire bullish traders or provide any additional boost to the major.
The USD/JPY pair attracted some dip-buying on the first day of a new week and has now recovered nearly 60 pips from the daily low, around mid-134.00s. The pair moved back above the 135.00 psychological mark during the early European session and was last seen trading near the top end of its intraday range.
The recent sharp decline in commodity prices helped ease fears about a further rise in inflationary pressures and led to a goodish rebound in the global risk sentiment. This was evident from signs of stability in the financial markets, which undermined the safe-haven Japanese yen and acted as a tailwind for the USD/JPY pair.
The lacklustre demand for safe-haven assets pushed the US Treasury bond yields higher, resulting in the widening of the gap between the US-Japanese bond yields. This, along with a big divergence in the policy stance adopted by the Bank of Japan and the Fed, weighed on the JPY and further extended support to the USD/JPY pair.
That said, modest US dollar weakness held back traders from placing aggressive bullish bets and capped the upside for the USD/JPY pair, at least for the time being. Hopes that inflation is nearing its peak forced investors to reduce bets for more aggressive rate hikes by the Fed, which, in turn, kept the USD bulls on the defensive.
The mixed fundamental backdrop warrants caution before positioning for any firm near-term direction, though the bias still seems tilted in favour of bullish traders. Market participants now look forward to the US economic docket - featuring the release of Durable Goods Orders and Pending Home Sales later during the early North American session.
Apart from this, the US bond yields will influence the USD price dynamics and provide a fresh impetus to the USD/JPY pair. Traders will further take cues from the broader market risk sentiment to grab short-term opportunities around the major.
Technical levels to watch
Here is what you need to know on Monday, June 27:
The US Dollar Index stays relatively quiet near 104.00 early Monday after having closed the previous week modestly lower. US stock index futures trade flat on the day as focus shifts to May Durable Goods Orders data. Pending Home Sales and the Dallas Fed Manufacturing Survey data for June will be featured in the US economic docket as well. The European Central Bank (ECB) Forum on Central Banking will start later in the day with ECB President Christine Lagarde delivering the opening remarks at 1830 GMT.
San Francisco Fed President Mary Daly said she is prepared to support another 75 basis points rate increase in July. Ahead of the weekend, St. Louis Federal Reserve Bank President James Bullard reiterated that they need to continue to frontload rate hikes to get inflation under control. Supported by the recent hawkish commentary, the 10-year US Treasury bond yield is up nearly 1% on the day at 3.15%.
Meanwhile, the International Monetary Fund (IMF) said in its annual assessment that the US economic growth expectation got revised lower to 2.9% for 2022 from 3.7% in April's forecast. "Based on the median projection for the policy rate published at the June FOMC meeting, we expect the US economy will slow in 2022-23 but narrowly avoid a recession," the IMF noted in its publication.
EUR/USD clings to small daily gains and fluctuates above 1.0550 early Monday. The pair gained nearly 100 pips last week.
GBP/USD continues to move up and down in a narrow channel below 1.2300 for the fourth straight trading day. Later in the day, members of parliament will vote on proposed legislation to give ministers the power to scrap parts of the post-Brexit agreement. The European Union warned that it would be a breach of international law if the UK were to take unilateral action on the post-Brexit deal.
USD/JPY is moving sideways near 135.00 at the start of the new week. The Bank of Japan's (BOJ) June meeting Summary of Opinions showed that the bank will maintain its loose policy while keeping a close eye out on markets.
Gold trades in the upper half of its consolidation channel above $1,830. Over the weekend, four G7 members decided to ban imports of Russian gold to tighten the sanctions squeeze on Moscow.
Bitcoin trades above $21,000 in the European morning. Ethereum is up nearly 2% on a daily basis near $1,200.
Global equity markets are putting in a little run of gains. Quarter-end and half-year-end rebalancing may help equities and soften the dollar this week, economists at ING report.
Some respite in equities may help commodity FX in particular
“There is much focus this week that quarter-end and half-year-end rebalancing by buyside fund managers will give equities a lift into Thursday.”
“Barring fresh shocks and since it is not a big week for US data, it seems not unreasonable to think equities could post some marginal further gains this week.”
“A benign week for equities could see the likes of the Canadian dollar and Norwegian krone play catch-up with their hawkish local central banks. This all looks like a slightly negative environment for the dollar. Yet we doubt the dollar will slump.”
“It is far too early for central bankers to be signalling the all-clear with inflation. And signs later in the summer that central banks will still be tightening even as growth slows may trigger another wave of equity selling.”
- EUR/GBP grinds higher towards intraday top, extends Friday’s recovery moves.
- Downward sloping resistance line from mid-June appears critical for further upside.
- Key HMAs restrict immediate downside, RSI favors buyers.
EUR/GBP remains on the front foot for the second consecutive day, up 0.10% intraday around 0.8605 ahead of Monday’s trading bell in Brussels.
In doing so, the cross-currency pair justifies the upside break of the 50-HMA and 200-HMA. Also keeping buyers hopeful is the firmer RSI (14) line, not overbought.
It should be noted, however, that a descending trend line from June 15, around 0.8615 by the press time, restricts short-term upside moves of the EUR/GBP pair.
Following that, the 61.8% Fibonacci retracement of the June 15-16 downturn, near 0.8640, could gain the pair buyer’s attention.
Should the recent bullish bias gain acceptance past 0.8640, the odds of the pair’s run-up towards the 0.8700 round figure and then to a monthly high of 0.8721 can’t be ruled out.
Meanwhile, pullback moves remain elusive until the quote stays above the HMA confluence surrounding 0.8590.
Even if the quote drop below 0.8590, the latest swing low of 0.8561 can probe the EUR/GBP bears before giving them control.
In that case, the 0.8500 round figure and the monthly low of 0.8485 will be in focus.
EUR/GBP: Hourly chart
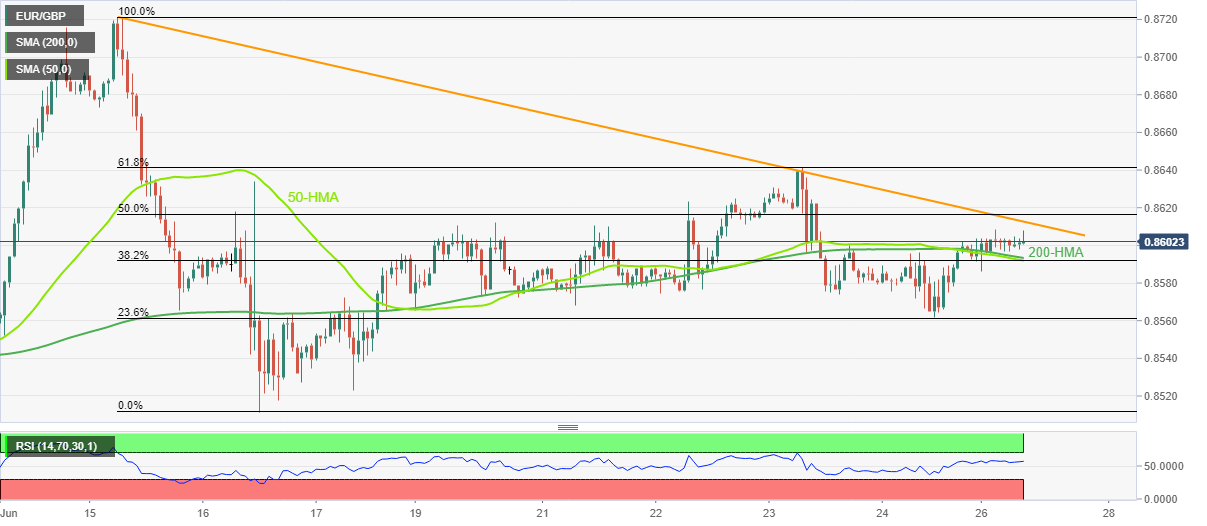
Trend: Further upside expected
Sterling continues to defy some of the more bearish forecasts. Economists at ING expect the GBP/USD pair to edge higher towards 1.24 amid some respite in equities.
Equity rally could help sterling
“Headlines could be grabbed this afternoon by news that Conservatives in the lower house have backed a bill suspending parts of the Northern Ireland protocol and risking a trade war with the EU. We suspect that news is priced in, even though it will not be welcome for sterling.”
“Helping sterling should be the better equity environment where sterling has recently taken on the characteristics of a growth currency with a decent correlation with equities.”
“In quiet markets, GBP/USD could edge up to the recent highs at 1.2400, while EUR/GBP could edge back down to the 0.8550 area.”
Gold posted losses for the second straight week. Bearish bias stays intact as XAU/USD fails to reclaim 200-day moving average (DMA), FXStreet’s Eren Sengezer reports.
Significant resistance for XAU/USD seems to have formed at $1,850
“The Fibonacci 23.6% retracement level of the latest downtrend and the 200-day SMA form strong resistance at $1,850. Unless XAU/USD makes a daily close above that level, sellers should be able to retain control. Above $1,850, $1,860 (50-day SMA) and $1,870 (Fibonacci 38.2% retracement) aligns as the next hurdles.”
“$1,810 (the end-point of the downtrend) could be seen as the next bearish target. If that support fails, further losses toward $1,800 (psychological level) and $1,787 (May 16 low) could be witnessed.”
French Finance Minister Bruno Le Maire is out on the wires now, via Reuters, making some comments on the inflation outlook, which is the key area of concern for euro area policymakers.
Key quotes
Inflation in 2022 should be around 5%.
We are amid an inflation peak at the moment.
Inflation will continue to rise in the next weeks.
Inflation will ease over 2023.
Confirms 3.5% rise of social welfare payments due to inflation.
I welcome EDF, Engie and TotalEnergies jointly calling for reducing energy consumption in current context.
We are already discussing potential energy cuts to businesses, but we have not yet reached that point.
Market reaction
The shared currency is unfazed by these comments, with EUR/USD keeping mild gains near 1.0560 amid the ongoing US dollar weakness.
Strategists at Goldman Sachs Group Inc provide their outlook on the high-yielding emerging-Asia currencies, citing that they are likely to remain under pressure, courtesy of worsening external finances and Fed tightening-led adverse market sentiment.
Key quotes
“Along with the broader emerging market currency complex, high-yielding currencies like the Philippine peso, Indian rupee and Indonesian rupiah have been under pressure in June,”
“In coming weeks, we expect this pressure to continue versus the dollar, in some cases potentially posing upside risks to our dollar-cross forecasts.”
“The dollar-rupiah pair could continue to see upside pressure until Bank Indonesia follows the Fed in hiking interest rates.”
“The rupee, which tested a series of record lows in recent weeks, may continue to remain under pressure against the dollar amid expectations of a $40 billion balance of payments deficit this year, compared with a surplus of $55 billion in 2021.”
Related reads
- USD/INR Price News: Indian rupee dribbles near record high of 78.46 despite RBI intervention
- USD/RUB Price Analysis: Establishes below the critical support of 55.00
- USD/TRY drops the most in 2022 as Turkish government takes step to curb lira selling.
- Policymakers restricted lending to companies with more than $1 million in foreign currency cash.
- US dollar pullback adds strength to the pair’s bearish performance.
- Comments from Turkish President Erdogan, US data eyed for fresh impulse.
USD/TRY slumps more than 3.0% as bears attack 16.00 heading into Monday’s European session. The Turkish lira (TRY) pair’s latest weakness could be linked to Friday’s Turkish moves to defend the struggling currency, as well as the US dollar’s recent weakness.
“The Turkish lira rallied as much as 6% against the dollar on Monday after Turkiye moved to restrict lira lending to many companies with more than $1 million in foreign currency cash in the latest step to reverse a slide in the currency,” said Reuters.
The news also adds, “After most local markets had closed for the week on Friday, the BDDK banking watchdog said if companies had more than 15 million lira ($908,000) of forex cash assets, and they exceed 10% of total assets or annual revenues, they will not be allowed to receive new lira loans.”
It’s worth noting that the high inflation and the Turkish central bank’s refrain from interest rate increases propelled the USD/TRY so far in 2022.
On the other hand, the US Dollar Index (DXY) remains pressured around the intraday low of 103.95 as markets struggle for clear directions. Market sentiment remains sluggish amid the fears of faster rate hikes and US economic slowdown, not to forget geopolitical concerns surrounding China and Russia. It should, however, be noted that the hopes of overcoming the tough time, as well as cautious optimism ahead of this week’s key debate among the policymakers of the European Central Bank (ECB), Fed and the Bank of England (BOE), seem to favor the mood.
Against this backdrop, the S&P 500 Futures remain firmer around 3,920, up 0.20% intraday by the press time, whereas the US 10-year Treasury yields rise three basis points (bps) to around 3.16% after posting the first weekly loss in four.
Moving on, Turkish President Recep Tayyip Erdoğan is up for meeting the policymakers during the day and will hold a press conference, making it the key event of the day for the USD/TRY traders to watch. Following that, US Durable Goods Orders for May, expected at 0.1% versus 0.5% prior, will be important to watch for fresh clues.
Technical analysis
USD/TRY’s downside break of a seven-week-old ascending support line, now resistance around 16.87, directs the bears towards the 50-DMA support near 16.00.
- GBP/USD is struggling to overstep 1.2300 as investors await the US Durable Goods Orders.
- Investors should brace for a vulnerable performance from the US economic data.
- The BOE may dictate a jumbo rate hike in July considering its inflation rate is above 9%.
The GBP/USD pair is juggling in a narrow range of 1.2259-1.2297 in the early European session as investors are awaiting the release of the US Durable Goods Orders. The US economic data is expected to release at 0.1% against the prior print of 0.5%.
An underperformance is expected from the economic data, thanks to soaring price pressures, which have forced the Federal Reserve (Fed) to elevate its interest rates vigorously and eventually squeeze liquidity from the market. It is worth noting that the PMI figures reported by the IHS Markit last week were extremely lower than the forecasts and the prior prints. Now, lower estimates for the Durable Goods Orders are indicating that the economy is facing a slump in the overall demand structure.
This week, the US agencies will also report the Gross Domestic Product (GDP) numbers, which are due on Wednesday. The GDP numbers are expected to remain steady at -1.5% on a quarterly basis. While the GDP Price Index may slip to 7.2% from the prior print of 8.1%.
On the pound front, bulls are holding themselves despite a minor advancement in the Consumer Price index (CPI) at 9.1% on an annual basis. This has raised the odds of a 50 basis point (bps) rate hike by the Bank of England (BOE) in July. Earlier, the BOE elevated its interest rates by 25 bps only as the growth prospects were not lucrative to support a healthy rate hike announcement.
- Gold grinds higher around intraday top, consolidates two-week losses.
- Market sentiment dwindles, the US dollar remains pressured on rate hikes, recession woes.
- G7 leaders brace for banning imports of Russian gold, and crude oil.
- US Durable Goods Orders to decorate daily calendar, ECB Forum is important for the week.
Gold Price (XAU/USD) extends Friday’s recovery to $1,836 ahead of Monday’s European session. The precious metal’s upside moves could be linked to the softer US dollar, as well as chatters surrounding a ban on gold imports from Russia.
US Dollar Index (DXY) remains pressured around the intraday low of 103.95 as markets struggle for clear directions.
Market sentiment remains sluggish amid the fears of faster rate hikes and US economic slowdown, not to forget geopolitical concerns surrounding China and Russia. It should, however, be noted that the hopes of overcoming the tough time, as well as cautious optimism ahead of this week’s key debate among the policymakers of the European Central Bank (ECB), Fed and the Bank of England (BOE), seem to favor the gold buyers.
It’s worth noting that four of the Group of Seven (G7) rich nations moved to ban imports of Russian gold on Sunday to tighten the sanction squeeze on Moscow and cut off its means of financing the invasion of Ukraine, per Reuters.
Amid these plays, the S&P 500 Futures remain firmer around 3,920, up 0.20% intraday by the press time, whereas the US 10-year Treasury yields rise three basis points (bps) to around 3.16% after posting the first weekly loss in four.
Although mixed concerns and fears of the ban on Russian gold may underpin gold’s upside momentum, rate hike woes may recall the gold sellers. For that matter, today’s US Durable Goods Orders for May, expected 0.1% versus 0.5% prior, as well as Wednesday’s debate of the US and the UK and the European central bankers at the ECB Forum on Central Banking, will be important to watch.
Technical analysis
Gold buyers cheer a clear upside break of the 100-HMA and 20-HMA, as well as bullish MACD signals, as they approach a one-week-old resistance line near $1,840.
However, major attention is given to the 61.8% Fibonacci retracement level of the June 12-14 downturn, around $1,850, for further upside momentum. Also acting as resistance is the mid-June swing high near $1,858.
Meanwhile, pullback moves may initially aim for the stated HMAs, near $1,830, before revisiting the 23.6% Fibonacci retracement level surrounding $1,822.
In a case where XAU/USD drops below $1,822, the monthly low of $1,805 will appear as the last defense of buyers.
Gold: Hourly chart
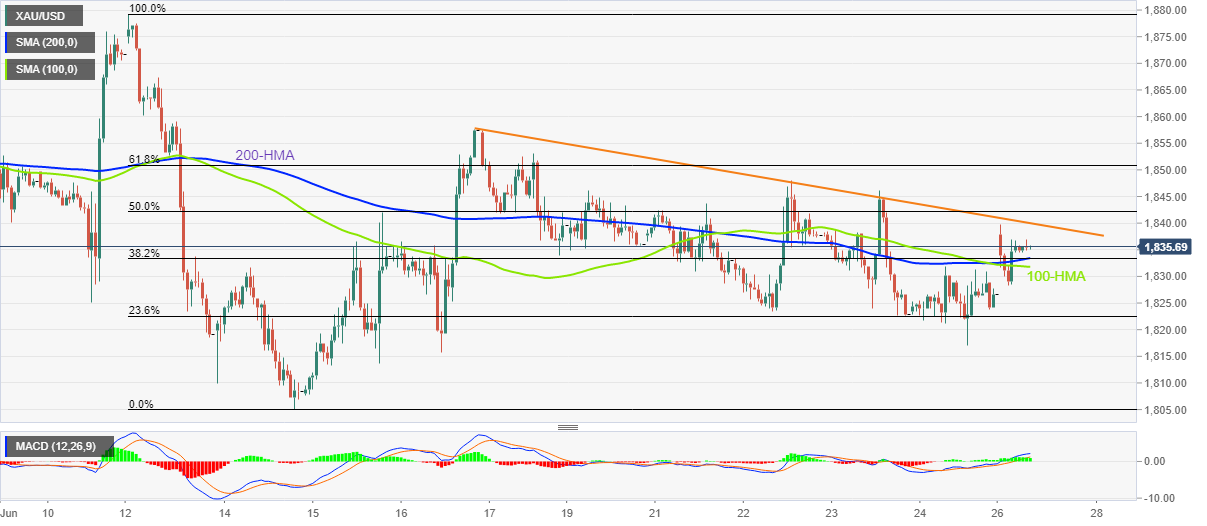
Trend: Further upside expected
Gold Price rebounds to test the critical barrier at $1,842 yet again. As FXStreet’s Dhwanie Mehta notes, XAUUSD faces a wall of resistance on road to recovery.
Bulls could face a hard time on the road to recovery
“Markets now look forward to the US Durable Goods Orders data with a downbeat print likely to underpin the buck’s corrective downside, which could render gold-positive.”
“A sustained move above the short-tern critical 21-Daily Moving Average (DMA) resistance at $1,842 and the horizontal 200 DMA, now at $1,845 will be needed to confirm any meaningful recovery. Further up, bulls will look to reclaim the $1,850 psychological level. Powerful hurdle then awaits at $1,858, which is the confluence of the May 16, 17 highs and bearish 50 DMA.”
“If sellers regain control, the daily low at $1,827 could offer initial support, below which Friday’s low of $1,1817 will be retested. The next downside target is envisioned at the June 15 low of $1,808, followed by the critical $1,800 threshold.”
German Chancellor Olaf Scholz said on Monday, discussions ongoing on Russia's gold import ban have to be discussed with the European Union (EU) countries.
Over the weekend, four of the Group of Seven (G7) rich nations moved to ban imports of Russian gold to tighten the sanctions squeeze on Moscow and cut off its means of financing the invasion of Ukraine. Britain, the US, Japan and Canada agreed the ban on new Russian gold imports.
But European Council President Charles Michel said that the issue would need to be handled carefully and discussed further.
developing story ...
FX option expiries for June 27 NY cut at 10:00 Eastern Time, via DTCC, can be found below.
- EUR/USD: EUR amounts
- 1.0445-55 983m
- USD/JPY: USD amounts
- 134.50 375m
- 135.00 363m
- 137.00 450m
- AUD/USD: AUD amounts
- 0.7050 284m
- USD/CAD: USD amounts
- 1.2820 200m
- 1.2870-75 200m
- An Ascending Triangle formation is bolstering the shared currency bulls.
- The 20- and 50-period EMAs have displayed a bulls cross that indicates an upside in the asset.
- A break of 60.00 by the RSI (14) firmly will add to the upside filters.
The EUR/USD pair has remained biased towards the shared currency bulls in the Asian session and is expected to extend its gains after violating an intraday high at 1.0575. From the past week, the asset is scaling gradually higher but is still inside the woods.
An ascending triangle formation in the four-hour scale is strengthening the shared currency bulls. The upward sloping trendline of the above-mentioned chart pattern is placed from June 17 low at 1.0444 while the horizontal resistance is plotted from June 16 high at 1.0602.
On the four-hour scale, a balanced profile area in a 1.0627-1.0787 range has been marked, which will act as a major resistance for the counter.
A bull cross, represented by the 20- and 50-period Exponential Moving Averages (EMAs) at 1.0531 adds to the upside filters.
Meanwhile, the Relative Strength Index (RSI) (14) is attempting to shift above 60.00, which will strengthen the eurozone bulls further.
A decisive move above June 1 low at 1.0627 will drive the asset towards June 7 low at 1.0671, followed by June 6 high at 1.0752.
On the flip side, the greenback bulls could dictate the asset if it drops below June 22 low at 1.0469. An occurrence of the same will drag the asset towards June 17 low at 1.0444. A slippage below June 17 low will expose the asset to more downside levels of the Jun 16 low at 1.0381.
EUR/USD four-hour chart
-637919052993185865.png)
- AUD/USD picks up bids to pare intraday losses, recovers from day’s low.
- Three-week-old resistance-turned-support direct buyers towards a fortnight-old hurdle.
- 200-SMA holds the key to bull’s return, sellers need validation from six-week-old ascending support line.
AUD/USD bears struggle to keep reins around 0.6930 even as it rebounds from the previous resistance line heading into Monday’s European session.
The Aussie pair’s recovery from the resistance-turned-support line from early June takes clues from the upbeat MACD signals. That said, buyers aim for the fortnight-long trend line resistance, at 0.6970 by the press time.
However, the quote’s upside past 0.6970 depends upon the ability to cross the 200-SMA level surrounding 0.7050. It should be noted that the 0.7000 psychological magnet appears to be the intermediate halt during the run-up beyond 0.6970.
On the flip side, a clear break below the previous resistance line, near 0.6910, will need validation from the 0.6900 round figure to convince AUD/USD bears.
Even so, an upward sloping trend line support from May 12, near 0.6870 by the press time, may challenge the AUD/USD bears before directing them to the yearly low near 0.6830.
Overall, AUD/USD remains on the bear’s radar even if short-term recovery remains on the table.
AUD/USD: Four-hour chart
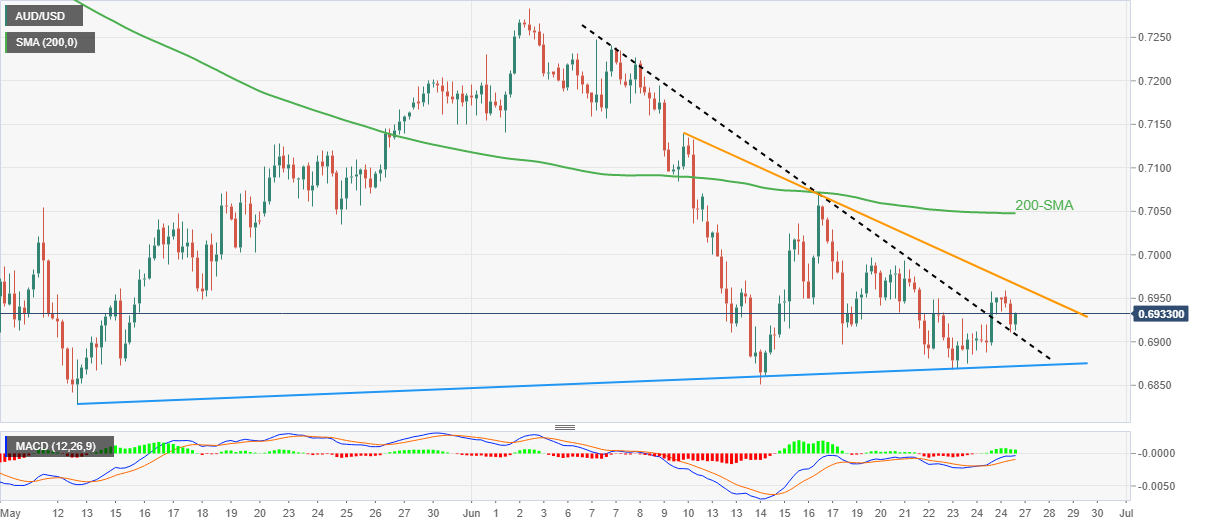
Trend: Corrective pullback expected
- The critical support of 54.35 has turned into a potential resistance for the greenback bulls.
- Short-term EMAs are declining which favors the downside further.
- A (20.00-40.00) bearish range shift by the RSI (14) adds to the downside filters.
The USD/RUB pair is displaying back and forth moves in a narrow range of 53.07-54.13 in the Asian session. The asset has remained in the grip of bears for a prolonged period and has extended its losses after violating the 29 October 2021 low at 69.22.
On the weekly scale, the Russian ruble bulls have dragged the asset firmly below the critical support of the 30 March 2018 low at 54.35. That critical support has turned into a potential resistance for the greenback bulls.
The 10- and 20-period Exponential Moving Averages (EMAs) at 63.16 and 70.00 respectively are declining, which adds to the downside filters.
Meanwhile, the Relative Strength Index (RSI) (14) has shifted into a bearish range of 20.00-40.00 comfortably, which signals a continuation of a downside move. It is worth noting that the asset has not displayed any sign of exhaustion yet.
A pullback near the critical support-turned-potential resistance at 54.35 will activate the Russian ruble bulls for a bargain sell. This will drag the asset towards the 6 May 2015 low at 52.36, followed by the 10 April 2015 low at 50.28.
On the flip side, the greenback bulls could regain strength for an upside move towards the psychological resistance at 60.00 and the 10-EMA at 63.16 after violating May 27 low at 55.91.
USD/RUB weekly chart
-637919031459085206.png)
- Steel Price pushes the previous week’s recovery moves forward amid a sluggish session.
- Fears of more production loss can favor intraday buyers.
- Off-season, recession woes and concerns surrounding China challenge recovery moves.
Steel Price begins the week on a firmer footing as short-term supply fears favor buyers during a sluggish Asian session on Monday. Industrial metal’s recent gains could also be linked to the US dollar’s mixed performance.
The most active steel rebar contract on Shanghai Futures Exchange (SFE) rise around 1.0% to 4,265 yuan per metric tonne (MT) by the press time. The metal slumped to the lowest in six months during the last week as risk-aversion joined pessimism surrounding China.
Recently, the White House said, per Reuters, “The US is confident that NATO's new strategy document will include "strong" language on China, a White House official said on Sunday, adding that negotiations on how to refer to Beijing were still underway.”
Also challenging the steel demand could be the statements from the Bank for International Settlements (BIS) that supported faster rate hikes. On the same line are comments from International Monetary Fund (IMF) Managing Director Kristalina Georgieva, who said per Reuters, “Further negative shocks would inevitably make US economic situation ‘more difficult’.”
“Rebar output dropped palpably due to frequent production cuts across steel mills. In terms of rebar, the production was muted due to serious losses suffered by steel mills, and the overall supply slumped amid frequent production cuts,” said Shanghai Metal Markets (SMM) per Reuters.
The SMM news also mentioned that the rebar supply is likely to extend the declines as steel mills are increasingly less interested in producing when rebar prices keep falling, and more mills will join the queue of suspending the production for maintenance. In terms of HRC, the output increased slightly last week mainly because fewer steel mills were under maintenance last week.
Apart from that, US Durable Goods Orders for May, expected 0.1% versus 0.5% prior, as well as the Pending Home Sales, expected -2.0% versus -3.9% prior, will be important for daily directions.
- USD/CAD takes offers to refresh more than a week’s low, extends Friday’s losses.
- Geopolitical concerns surrounding Russia underpin oil prices.
- US dollar struggles to find directions amid mixed clues surrounding Fed, risk appetite.
- US data may entertain traders ahead of key central bankers’ debate at the ECB Forum.
USD/CAD renews intraday low near 1.2870 heading into Monday’s European session. In doing so, the Loonie pair takes clues from the upbeat prices of crude oil, Canada’s key export item. However, mixed sentiment and the US dollar moves appear to challenge the bears ahead of important data/events.
That said, the WTI crude oil remains mildly bid at around $106.50, stretching the previous weekly gains, suggesting the Group of Seven (G7) leaders prepare to take moves against Russian gold and oil.
It’s worth noting, however, that the fears surrounding China probe the oil buyers and challenge the USD/CAD bears. The White House said, per Reuters, “The US is confident that NATO's new strategy document will include "strong" language on China, a White House official said on Sunday, adding that negotiations on how to refer to Beijing were still underway.”
Elsewhere, statements from the Bank for International Settlements (BIS) add to the risk-off mood and restrict the US dollar’s downside, which in turn tests the USD/CAD sellers. “Bank for International Settlements (BIS) calls for interest rates to be raised "quickly and decisively" to prevent the surge in inflation from turning into something even more problematic,” said Reuters.
However, fears surrounding the US recession, highlighted by International Monetary Fund (IMF) Managing Director Kristalina Georgieva, keep the USD/CAD sellers hopeful.
While portraying the mood, the S&P 500 Futures remain firmer around 3,920, up 0.20% intraday by the press time, whereas the US 10-year Treasury yields rise three basis points (bps) to around 3.15% after posting the first weekly loss in four.
Given the upbeat oil prices and the US dollar’s indecision, the USD/CAD is likely to remain pressured. However, today’s US Durable Goods Orders and Pending Home Sales for May will be important for intraday directions. Forecasts suggest that the US Durable Goods Orders for May, expected 0.1% versus 0.5% prior, as well as the Pending Home Sales, expected -2.0% versus -3.9% prior. Above all, Wednesday’s debate of the US and the UK and the European central bankers at the ECB Forum on Central Banking will be an important event to watch.
Technical analysis
USD/CAD justifies the previous day’s downside break of the 10-DMA, around 1.2945 by the press time, as sellers approach multiple supports surrounding 1.2860-50.
- Asian indices have extended their recovery as the DXY weakens on lower estimates for US economic data.
- As per the market consensus, the US Durable Goods Orders are seen at 0.1% vs. 0.5% reported earlier.
- Oil prices have rebounded as investors have started underpinning the supply constraints.
Markets in the Asian domain have extended their rebound as the US dollar index (DXY) has displayed a weak performance in the Asian session. The DXY started declining right from the first tick on Monday and slipped to near the round-level support of 104.00. The weakness in the DXY is backed by lower forecasts for the US Durable Goods Orders.
At the press time, Japan’s Nikkei and China A50 jumped 1.40%, Hang Seng surged 3.20% and Nifty50 gained 1.30%.
A preliminary estimate for the US Durable Goods Orders is 0.1% against the former release of 0.5%. It is worth noting that the Manufacturing and Services PMI that were released last week, were significantly lower than the estimates and their prior releases.
A spell of weak economic data is indicating a slump in the overall demand structure. This might be the outcome of the price pressures and its associated interest rate hike decisions. In case of a weak economic data release, the DXY could display some more losses.
On the oil front, oil prices have witnessed a rebound after finding significant bids around the psychological support of $100.00. The black gold is expected to extend its recovery as supply constraints will cover the demand worries. The supply constraints are a prolonged phenomenon now as the prohibition of Russian oil will stay longer and it won’t be easy for the OPEC cartel to fix the supply imbalance.
- WTI retreats from intraday high, battles short-term key resistance.
- RSI rebound, recovery moves from 100-day EMA and 61.8% Fibonacci retracement favor buyers.
- 50-day EMA adds to the upside filters before convincing buyers.
WTI crude oil prices extend the previous week’s recovery from the monthly low, despite easing from intraday high to $106.50 amid early Monday morning in Europe. The black gold’s latest pullback could be linked to the commodity’s inability to cross the $107.00 hurdle, as well as the market’s indecision amid mixed sentiment.
That said, the previous support line from April 11 joins a two-week-old descending trend line to highlight the $107.00 level as the short-term key hurdle.
Following that, the 50-day EMA near $109.00 could test the WTI bulls before directing them to mid-May’s high near $113.20.
Should the quote remains firmer past $113.20, the odds of witnessing a run-up towards the monthly high near $121.35 can’t be ruled out.
Alternatively, pullback moves may fail to attract the market’s attention until the quote remains above $103.50, comprising the 100-day EMA and 61.8% Fibonacci retracement level of April-June upside.
In a case where oil bears manage to conquer the $103.50 support confluence, the monthly low near $101.15 and the $100.00 psychological magnet could flash on their radars.
WTI: Daily chart
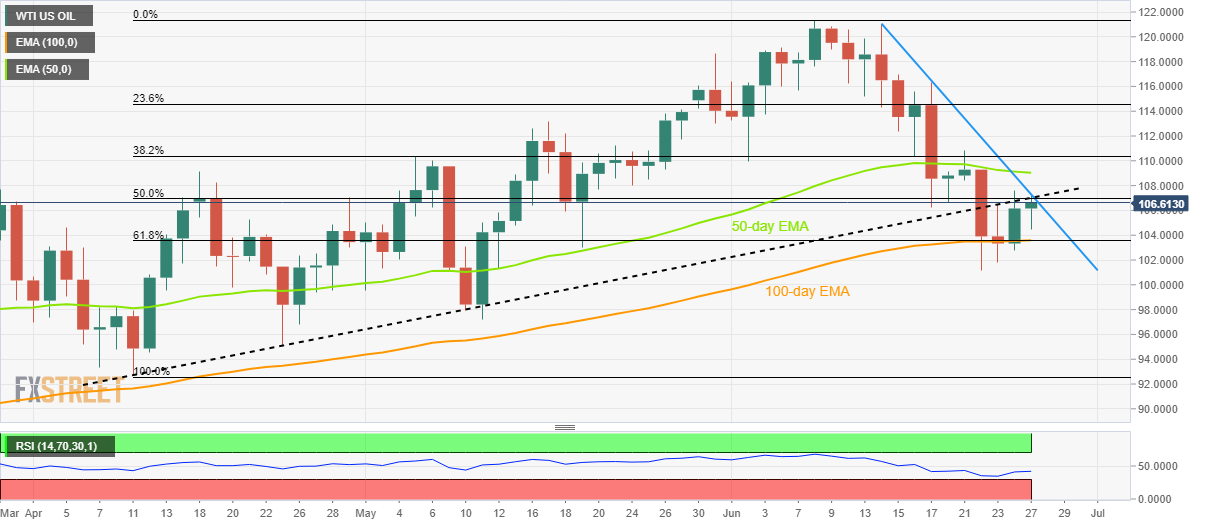
Trend: Further upside expected
- USD/INR picks up bids towards all-time high marked earlier in the day.
- RBI intervention fails to underpin INR rebound amid firmer oil prices, hawkish hopes from Fed.
- Indian equities managed to cheer cautious optimism on downbeat US inflation expectations, softer US data.
USD/INR adds strength to overcome the 78.50 hurdle after witnessing the second retreat from 78.46 during Monday’s Asian session, picking up bids to 78.31 by the press time. In doing so, the Indian rupee (INR) pair justifies the US dollar strength while raising doubts about the Reserve Bank of India’s (RBI) intervention.
The US Dollar Index (DXY) posted the first weekly loss in four by the end of Friday’s trading, before the latest rebound to 104.06. The greenback gauge’s recent gains could be linked to the recovery in the US inflation expectations and fears of faster rate hikes, not to forget geopolitical headlines surrounding Russia and China.
On the other hand, the RBI intervention fails to underpin the INR rebound as traders remain unconvinced of the Indian central bank’s ability to tame the inflation woes at home, not to forget the record budget deficit, amid firmer oil prices and risk-off mood.
On Friday, the Business Standard raised concerns over the RBI’s decision to take advance delivery of outstanding long-forward dollar positions to hint at the passive efforts to defend the US dollar.
It’s worth mentioning that Friday’s US data and the latest rebound in the US inflation expectations raised concerns over the previous risk-on mood and propelled the USD/INR prices too. That said, the US New Home Sales for May, by 10.7% versus April’s revised figures of -12.0%, joined the record low print of the final reading of the University of Michigan's Consumer Sentiment Index for June, to 50.0 from 50.2 initial estimates, also drowned the US dollar.
US inflation expectations, as per the 10-year breakeven inflation rate per the St. Louis Federal Reserve (FRED) data, recovered from the four-month low by the end of Friday’s North American session. The inflation gauge’s latest print is 2.56%, following the previous three-day downtrend that poked the lowest levels since February at around 2.50%.
Elsewhere, market sentiment dwindles as the Group of Seven (G7) leaders brace for taking moves against Russia's oil and gold, due to the invasion of Ukraine. Additionally, comments from the White House also challenge the risk appetite and propel the USD/INR prices. saying, “The US is confident that NATO's new strategy document will include "strong" language on China, a White House official said on Sunday, adding that negotiations on how to refer to Beijing were still underway,” per the news from Reuters.
Looking forward, US Durable Goods Orders for May, expected 0.1% versus 0.5% prior, as well as the Pending Home Sales, expected -2.0% versus -3.9% prior, will be important for daily directions. However, Wednesday’s debate of the US and the UK and the European central bankers at the ECB Forum on Central Banking will be an important event to watch for clear market directions.
Technical analysis
A five-week-old rising wedge bearish chart pattern restricts short-term USD/INR moves between 78.10 and 78.60. It’s worth noting that the 10-DMA adds strength to the 78.10 support, a break of which could direct the pair towards March’s high near 77.17.
- A break of the Darvas Box invites volatility expansion in the asset.
- The short-term EMAs are overlapping to the cable prices, which signals a consolidation ahead.
- A (40.00-60.00) range oscillation by the RSI (14) is advocating a rangebound phase going forward.
The GBP/USD pair is displaying a lackluster performance in the Asian session. The asset has auctioned in a narrow range of 1.2257-1.2279 and is constantly hovering around Friday’s closing price at 1.2272. On a broader note, the cable is displaying back and forth moves from the past week after a responsive buying action below the psychological support of 1.2000.
On an hourly scale, the asset is forming a Darvas Box in a range of Jun 17 low 1.2173 to June 21 high at 1.2324. The formation of the above-mentioned chart pattern indicates a slippage in the standard deviation, which is followed by a breakout in the same.
The 20- and 50- period Exponential Moving Averages (EMAs) on similar level around 1.2270 are overlapping the cable prices, which strengthen a consolidation ahead.
Also, a (40.00-60.00) range oscillation by the Relative Strength Index (RSI) (14) is advocating a range-bound phase. Although the momentum oscillator is backing a rangebound move, a volatility expansion cannot be ruled out going forward.
An upside break of the Darvas Box at 1.2324, which is the June 21 high will strengthen the cable bulls and will drive the asset towards June 16 high at 1.2407, followed by June 10 high at 1.2518.
On the flip side, the pound bulls could lose their strength if the asset drops below the previous week’s low at 1.2161, which will send the asset towards June 16 low at 1.2041. A breach of the latter will drag the asset towards the psychological support at 1.2000.
GBP/USD hourly chart
-637918981864840808.png)
- EUR/USD holds lower ground near intraday bottom after the first weekly gain in four.
- Firmer yields, fears of higher rate hike underpin US dollar rebound.
- Concerning surrounding Russia, China adds strength to the greenback’s safe-haven demand.
- US Durable Goods Orders, speech from ECB’s Lagarde eyed for fresh impulse.
EUR/USD remains pressured around daily lows near 1.0550, after snapping the three-week uptrend, as traders reassess the previous recovery ahead of the key data/events. That said, the chatters surrounding Russia, China and the central banks’ aggression also seem to weigh on the quote during early Monday morning in Europe.
Market sentiment dwindles even as the S&P 500 Futures print mild gains, which in turn directs traders towards the US dollar due to its safe-haven demand. The reason could be linked to the market’s reassessment of the previous week’s cautious optimism, as well as fresh fears surrounding Moscow and Beijing.
It’s worth noting that the comments from a German Official suggesting the Group of Seven (G7) leaders’ preparedness for taking moves again Russia's oil and gold seem to recently weigh on the risk appetite. On the same line were comments from the White House saying, “The US is confident that NATO's new strategy document will include "strong" language on China, a White House official said on Sunday, adding that negotiations on how to refer to Beijing were still underway,” per the news from Reuters.
Amid these plays, the S&P 500 Futures remain firmer around 3,920, up 0.20% intraday by the press time, whereas the US 10-year Treasury yields rise three basis points (bps) to around 3.15% after posting the first weekly loss in four.
Also contributing to the EUR/USD pair’s weakness could be the fresh chatters surrounding economic weakness in China and the US, not to forget Australia.
Additionally, the market’s cautious sentiment ahead of the US Durable Goods Orders and Pending Home Sales for May, as well as a speech from European Central Bank (ECB) President Christine Lagarde exerts additional downside pressure on the quote. Forecasts suggest that the US Durable Goods Orders for May, expected 0.1% versus 0.5% prior, as well as the Pending Home Sales, expected -2.0% versus -3.9% prior.
Technical analysis
EUR/USD sellers need validation from the convergence of the 10-DMA and a one-week-old support line, around 1.0520. Alternatively, 21-DMA and the 50-DMA, around 1.0600 by the press time, restrict the short-term recovery of the pair ahead of a downward sloping resistance line from February 10, near 1.0635.
China's economy is expected to grow 4.7% this year, Wang Yiming, an adviser to the monetary policy committee of the People's Bank of China (PBOC) said in a statement on Monday.
Wang said, China’s economy could see a strong rebound in the second half, “but difficulties remain for the 5.5% target”.
On Saturday, the central bank advisor said that the country could consider trying to boost the economy by introducing special national bonds that don’t count as financial deficits.
Market reaction
USD/CNY was last seen trading down 0.04% on the day at 0.6860. The pair remains unfazed by the above comments.
China’s economy showed some fresh signs of life in June as the country gradually emerged from the covid-induced lockdowns but the recovery remains muted, Bloomberg Economics’ aggregate index of eight early indicators showed on Monday.
Key takeaways
The overall gauge returned to the neutral level after deteriorating for two straight months.
Economic activity picked up in June after financial hub Shanghai lifted its lockdown, allowing businesses to restart and most residents to leave their homes.
That can be seen in a rebound in small business confidence, which started growing again after contracting for two months.
Market reaction
Markets remain cautious amid a slump in the Chinese Industrial Profits and ongoing recession fears. USD/CNY, however, remains slightly offered near 6.6880 so far this Monday.
- Gold price has given an upside break of $1821.25-1,831.87 as G7 bans Russian gold exports.
- Gold exports are the second largest revenue generation source for Russia.
- Lower expectations from the US economic data have weakened the DXY.
Gold price (XAU/USD) has climbed above $1,836.00 after overstepping Friday’s high at $1,831.87. The announcement of a prohibition on gold imports from Russia has infused fresh blood into the gold bulls. Earlier, the precious metal remained in a narrow range of $1821.25-1,831.87. Now, an upside break in the counter has brought a volatility expansion.
The prohibition of gold imports from Russia as it invaded Ukraine is going to hurt its financials for a prolonged period. After the ban on imports, Russia’s second most income-generating source has been targeted by the G7 countries, the business that fetches tens of billions of dollars for Russia. A prohibition on gold imports from Russia will squeeze the supply of gold in the global market.
Apart from that, a mild correction in the US dollar index (DXY) has also supported the gold prices. The DXY is underperforming as investors are bracing for underperformance from the US economic data. As per the market consensus, the US Durable Goods Orders are expected to land at 0.1% from the former release of 0.5%.
Gold technical analysis
A symmetrical triangle formation on the hourly is indicating a volatility contraction on a broader note. The upward sloping trendline is placed from June 14 low at $1,805.11 while the downward sloping trendline is plotted from June 16 high at $1,857.88. A firmer move above the 50-period Exponential Moving Average (EMA) at $1,829.30 has underpinned the gold bulls for supportive action. The Relative Strength Index (RSI) (14) has shifted into a 40.00-60.00, which bolsters a rangebound move ahead.
Gold hourly chart
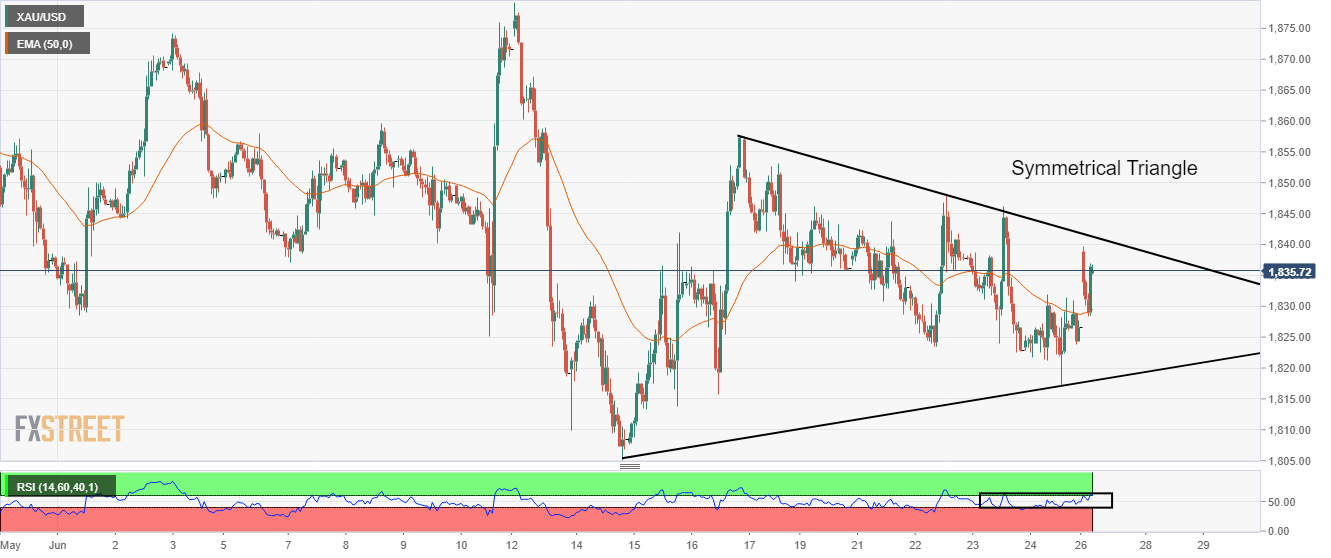
Australian Finance Minister Katy Gallagher voiced her concerns over the economic challenges being faced by her country after the Bank for International Settlements (BIS) reported risks for a global stagflationary scenario.
Key quotes
“The case for stagflation was a worst-case scenario, but where was no doubt the Australian economy faced challenges.”
“We have got cost of living going through the roof, we have got rising interest rates, we have got wages still stagnant and that is presenting some real challenges to people,”
“The job for government is to look at how we can make our policies, our sensible investments drive the productive capacity of the economy.”
“They are things that will help the economy in the long term without adding to inflation in the short term.”
Also read: BIS urges decisive wave of global rate hikes to stem inflation
Market reaction
Amid increasing risks of a recession, AUD/USD remains under pressure on the 0.6900 level. Although the rebound in the S&P 500 futures is helping the aussie stage a modest bounce from 0.6907 lows. The pair is now trading at 0.6933, still down 0.24% on the day.
The US Gross Domestic Product (GDP) is now expected to grow 2.9% in 2022, lower than its recent forecast of 3.7% in April, IMF Managing Director Kristalina Georgieva said in an annual assessment of US economic policies over the weekend.
Additional takeaways
US economy will grow at 1.7% in 2023 and 0.8% in 2024. After contracting by -3.4% in 2020, the US economy grew by 5.7 percent in 2021.
"Based on the median projection for the policy rate published at the June FOMC (Federal Open Market Committee) meeting, we expect the US economy will slow in 2022-23 but narrowly avoid a recession."
"The expected slowing of US demand, combined with the needed tightening of global financial conditions, has significant potential to negatively impact individuals, firms, and countries that are leveraged in US dollars and/or that face sizable near-term funding needs."
"To decisively bring inflation back to the Federal Reserve’s 2% goal by late 2023/early 2024, will require both raising the policy rate above neutral, in ex-ante real terms, and keeping it there for some time. Given the scope of the current inflation problem."
Related reads
- US inflation expectations rebound from multi-day low to 2.56%
- US Dollar Index skids to near 104.00 on lower forecasts of the US Durable Goods Orders
US inflation expectations, as per the 10-year breakeven inflation rate per the St. Louis Federal Reserve (FRED) data, recovered from the four-month low by the end of Friday’s North American session.
That said, the inflation gauge’s latest print is 2.56%, following the previous three-day downtrend that poked the lowest levels since February at around 2.50%.
The corrective pullback in inflation expectations probes the market sentiment, which previously portrayed cautious optimism, amid fears of higher interest rates. The fears of central bankers’ aggression also took clues from Reuters’ news suggesting that the Bank for International Settlements (BIS) calls for interest rates to be raised "quickly and decisively" to prevent the surge in inflation from turning into something even more problematic.
The same joins geopolitical tension surrounding China and Russia to weigh on the risk appetite even if the US dollar fails to benefit from its safe-haven allure.
Also read: S&P 500 Futures, US Treasury bond yields portray anxiety ahead of central bankers’ debate
| Raw materials | Closed | Change, % |
|---|---|---|
| Brent | 112.42 | 1.65 |
| Silver | 21.151 | 0.71 |
| Gold | 1827.29 | 0.17 |
| Palladium | 1851.66 | 0.59 |
- Recession fears join chatters surrounding higher rates to reverse Friday’s cautious optimism.
- S&P 500 Futures fade rebound from yearly low, US 10-year Treasury yields remain mildly bid after snapping three-week uptrend.
- US Durable Goods Orders, housing data may entertain intraday traders, ECB Forum is crucial.
Global markets fail to extend Friday’s cautious optimism as fears of higher rates weighing on the economic transition probe traders during Monday’s Asian session. The risk appetite also weakens amid a cautious mood ahead of Wednesday’s debate of the US, the UK and the European central bankers at the ECB Forum on Central Banking.
That said, the S&P 500 Futures drop 0.15% intraday to 3,910 while consolidating a bounce off the yearly low. Further, the US 10-year Treasury yields rose 1.5 basis points (bps) to around 3.13% after posting the first weekly loss in four.
During the weekend, Reuters came out with the news suggesting that the Bank for International Settlements (BIS) calls for interest rates to be raised "quickly and decisively" to prevent the surge in inflation from turning into something even more problematic.
The fears of higher rates and economic recession were also supported by the International Monetary Fund (IMF) Managing Director Kristalina Georgieva’s comments stating, per Reuters, “Further negative shocks would inevitably make US economic situation ‘more difficult’.”
It’s worth noting that the comments from a German Official suggesting the Group of Seven (G7) leaders’ preparedness for taking moves again Russia's oil and gold seem to recently weigh on the risk appetite. On the same line were comments from the White House saying, “The US is confident that NATO's new strategy document will include "strong" language on China, a White House official said on Sunday, adding that negotiations on how to refer to Beijing were still underway,” per the news from Reuters.
On Friday, the US New Home Sales for May, by 10.7% versus April’s revised figures of -12.0%, joined the record low print of the final reading of the University of Michigan's Consumer Sentiment Index for June, to 50.0 from 50.2 initial estimates, also drowned the US dollar.
It’s worth noting that the downbeat US inflation expectations also underpinned the US dollar’s pullback the previous day. That said, the US Dollar Index (DXY) posted the first weekly loss in four by the end of Friday’s trading, down 0.10% around 104.00 by the press time.
Having witnessed a sluggish start to the week, US Durable Goods Orders for May, expected 0.1% versus 0.5% prior, as well as the Pending Home Sales, expected -2.0% versus -3.9% prior, will be important for daily directions. However, Wednesday’s debate of the US and the UK and the European central bankers at the ECB Forum on Central Banking will be an important event to watch for clear market directions.
Ecuador's Energy Minister Xavier Vera-Grunauer warned Sunday that oil production had reached a "critical" level and could be halted entirely within 48 hours if protests and roadblocks continue.
Key quotes
"Oil production is at a critical level.”
"If this situation continues, the country's oil production will be suspended in less than 48 hours as vandalism, the seizure of oil wells and road closures have prevented the transport of equipment and diesel needed to keep operations going."
"Today the figures show a decrease of more than 50 percent" in production which, before the protests, was at roughly 520,000 barrels per day.”
Market reaction
WTI is back in the green zone following the above news, having erased early losses triggered by the G7 discussion on Russian oil exports and the Iran nuclear deal. The US oil is now trading at $106.32, up 0.19% on the day.
- USD/JPY holds lower ground after rising for four consecutive weeks.
- Two-day-old ascending trend channel, monthly support line challenge bears.
- Bulls need a clear break of 100-HMA to retake control.
USD/JPY takes offers to refresh intraday low around 134.50 following a four-week uptrend. In doing so, the yen pair extends its pullback from a short-term bullish channel’s resistance line, as well as a downside break of the 100-HMA.
Also adding to the bearish bias are the downbeat MACD signals and a weekly falling trend line.
That said, the bottom line of the aforementioned channel from Thursday, near 134.40, restricts the immediate downside of the yen pair before directing it towards an upward sloping support line from May 27, near 133.90 by the press time.
In a case where the quote drops below 133.90, it becomes vulnerable to fall towards the mid-month low near 131.50.
On the contrary, the weekly resistance line near 135.25 and the stated channel’s upper line, close to 135.40 by the press time, limit the short-term recovery of the USD/JPY pair.
Following that, the 100-HMA level of 135.55 challenges the bulls before directing them to the monthly peak near 136.70.
Overall, USD/JPY is likely to witness limited downside as bulls take a breather.
USD/JPY: Hourly chart
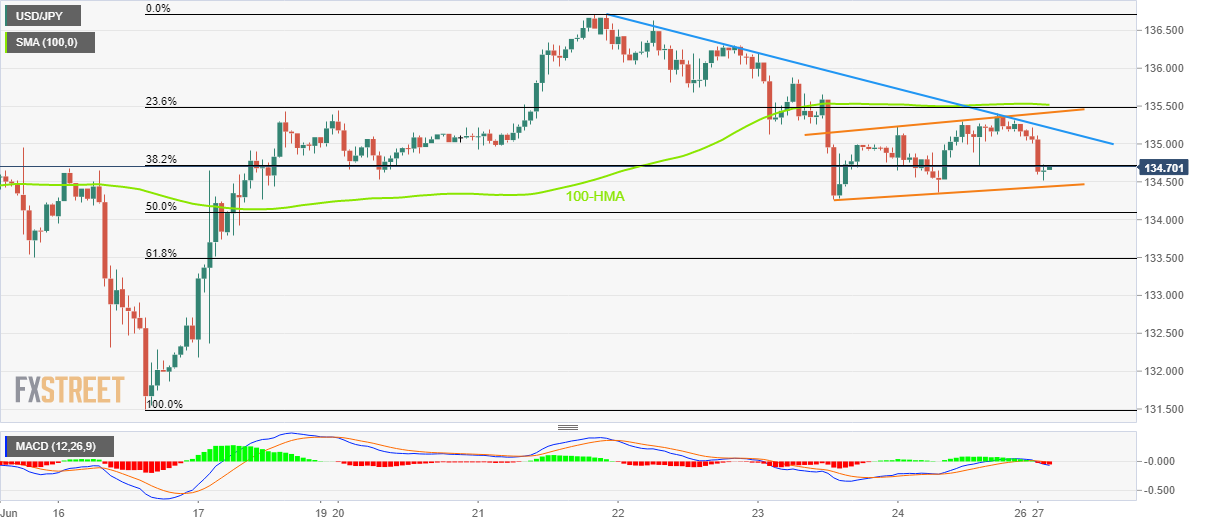
Trend: Further weakness expected
- Copper relieved as US dollar is pressured at key breakout area.
- DXY tests the 104 figure that could give way to a sell-off.
The price of copper recorded its steepest weekly loss in a year and is trying to recover from there at the start of this week. CFDs are bid by around 1.5% to $3.7850 at the time of writing.
The US dollar is giving in at the knees which is going to be helpful for the commodities bloc but as analysts at ANZ Bank explained, ''the market became increasingly concerned about slowing economic activity and its impact on demand.''
''Copper, which is seen as an economic bellwether, ended the week down more than 6% as central banks geared up to raise rates further. Uncertainty around Chinese demand amid ongoing lockdowns have also created headwinds,'' the analysts said. ''However, the red metal managed to pare some of these losses on Friday after better-than-expected US home sales.''
DXY breaking 104 the figure
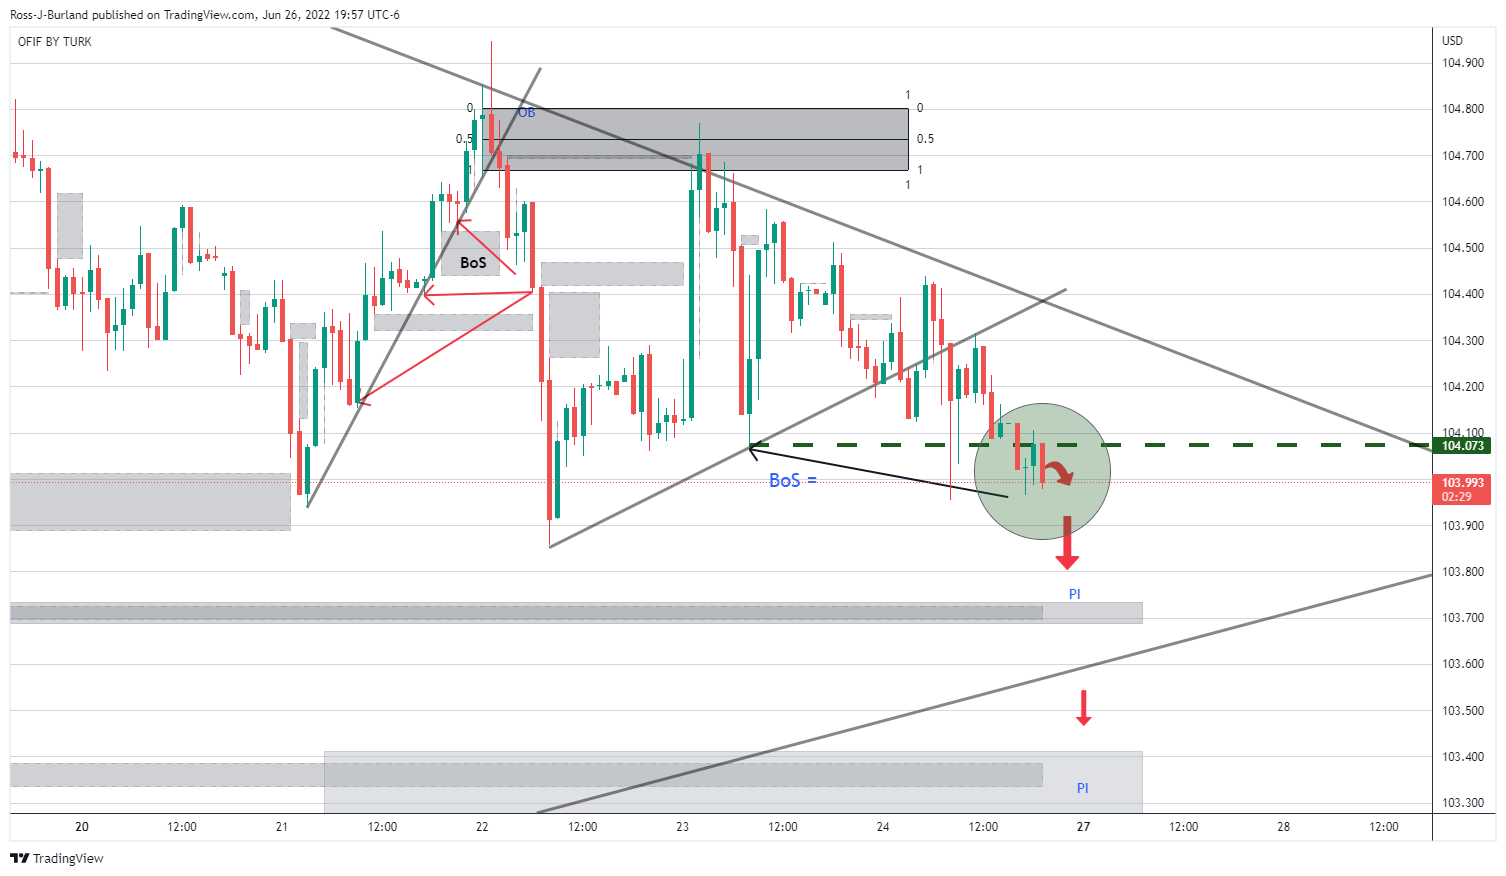
The bears have been piling it on over the last two weeks and there is a risk of a move to 103 and lower which would help stabilise the rout in the metals markets as risk appetite returns:
Copper daily chart
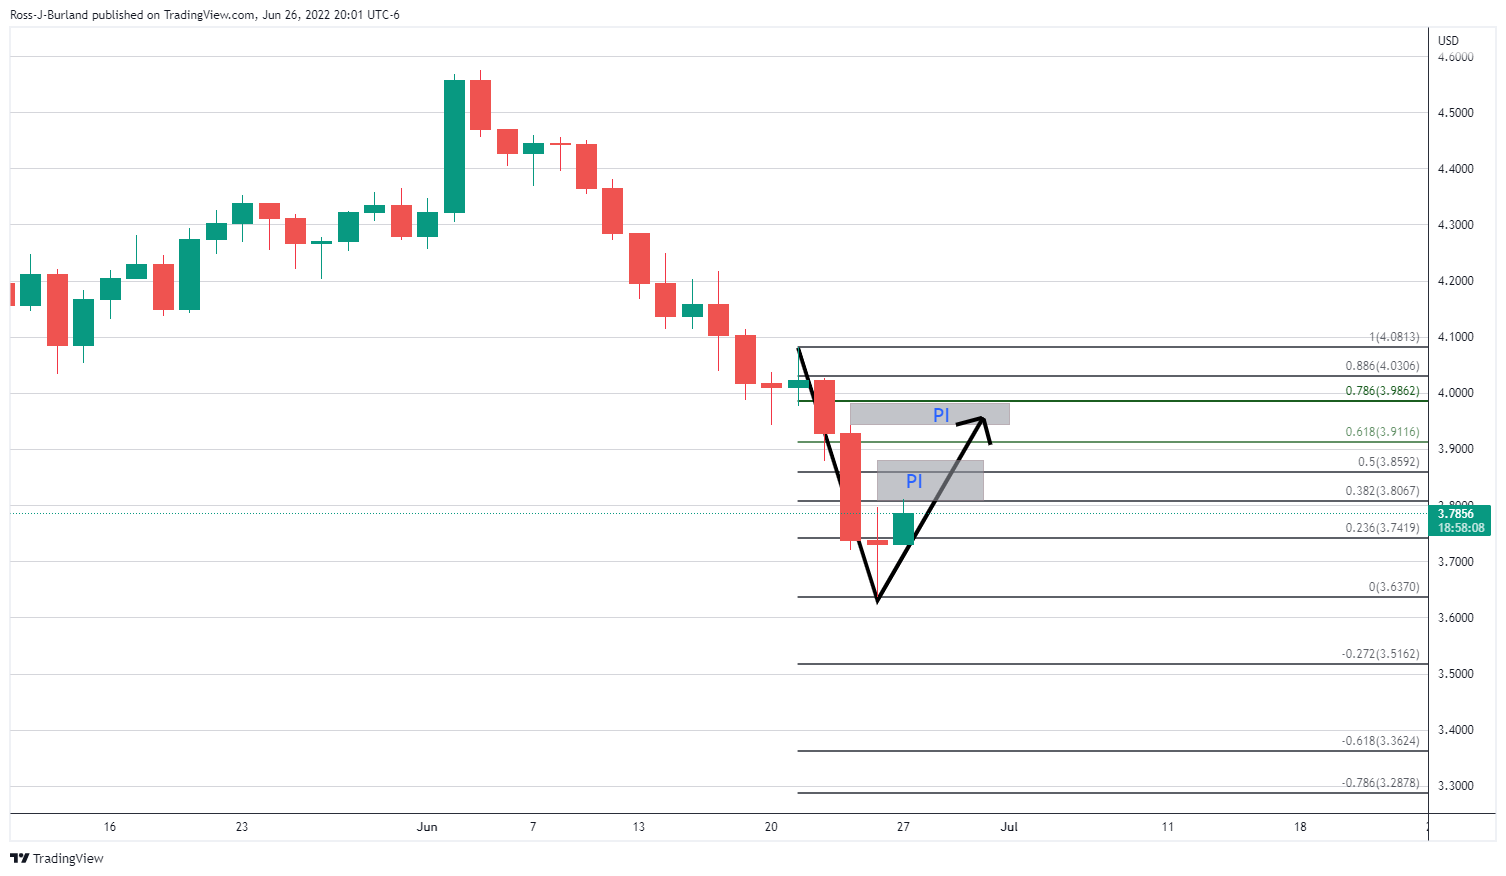
The price imbalances above make for a compelling bullish thesis on the daily chart for the week ahead if the greenback sinks.
- AUD/USD consolidates the first weekly gain in three.
- Australia FinMin Katy Gallagher signals economic challenges for the Pacific major.
- Market sentiment sours amid recession fears, US dollar fails to improve.
- US data, central bankers’ speeches will be crucial for near-term directions.
AUD/USD can’t cheer the US dollar weakness for long as it drops back to 0.6910, after snapping a two-week downtrend on Friday. That said, the Aussie pair portrays the economic fears surrounding Australia, as well as the global economy, while reversing the previous day’s run-up during Monday’s Asian session.
Australian Finance Minister (FinMin) Katy Gallagher crossed wires during the weekend, via AAP Australian General News, as she concedes Australia is facing economic challenges. The policy’s comments follow warnings the global economy risks a toxic mix of low growth and high inflation, also known as stagflation, per the news shared via Reuters.
Elsewhere, Australia's Treasurer Jim Chalmers also mentioned fears of higher inflation during the weekend while expecting a 7.0% figure and agreeing with a forecast by the central bank.
On Friday, Reserve Bank of Australia Governor Philip Lowe said that he does not expect a recession in Australia but acknowledged that there is a narrow path back to low inflation, as reported by Reuters.
It’s worth noting that Reuters came out with the news suggesting that the Bank for International Settlements (BIS) calls for interest rates to be raised "quickly and decisively" to prevent the surge in inflation from turning into something even more problematic.
During the weekend, International Monetary Fund (IMF) Managing Director Kristalina Georgieva crossed wires while saying, “Further negative shocks would inevitably make US economic situation ‘more difficult’.” It’s worth noting that the IMF revised down US 2022 GDP forecasts to 2.9% versus the 3.7% predicted earlier.
The US New Home Sales for May, by 10.7% versus April’s revised figures of -12.0%, joined the record low print of the final reading of the University of Michigan's Consumer Sentiment Index for June, to 50.0 from 50.2 initial estimates, also drowned the US dollar.
While portraying the mood, S&P 500 Futures fail to track Wall Street’s gains, down 0.30% intraday at the latest, whereas the US 10-year Treasury yields rise 1.5 basis points (bps) to around 3.13% after posting the first weekly loss in four.
Moving on, US Durable Goods Orders for May, expected 0.1% versus 0.5% prior, as well as the Pending Home Sales, expected -2.0% versus -3.9% prior, will be important for daily directions. However, Wednesday’s debate of the US and the UK and the European central bankers at the ECB Forum on Central Banking will be an important event to watch for clear market directions.
Technical analysis
Although an upward sloping trend line from May 12 restricts the short-term downside around 0.6885, the AUD/USD pair’s pullback from the 10-DMA level of 0.6945 keeps the bears hopeful.
- NZD/USD bulls moving back in from support.
- Eyes turn to weakness in the greenback at the start of the week.
As per the prior series of analyses found here, NZD/USD Price Analysis: Bulls in control and eye 0.6330/40s, the kiwi moved in on the projected area, not quite as far as the potential so far, and is mitigated some of the price imbalance left behind at the start of the week.
NZD/USD prior analysis
It was stated that the sights were ''left on the upside price imbalance with offers left unmatched between 0.6318 and 0.6327.''
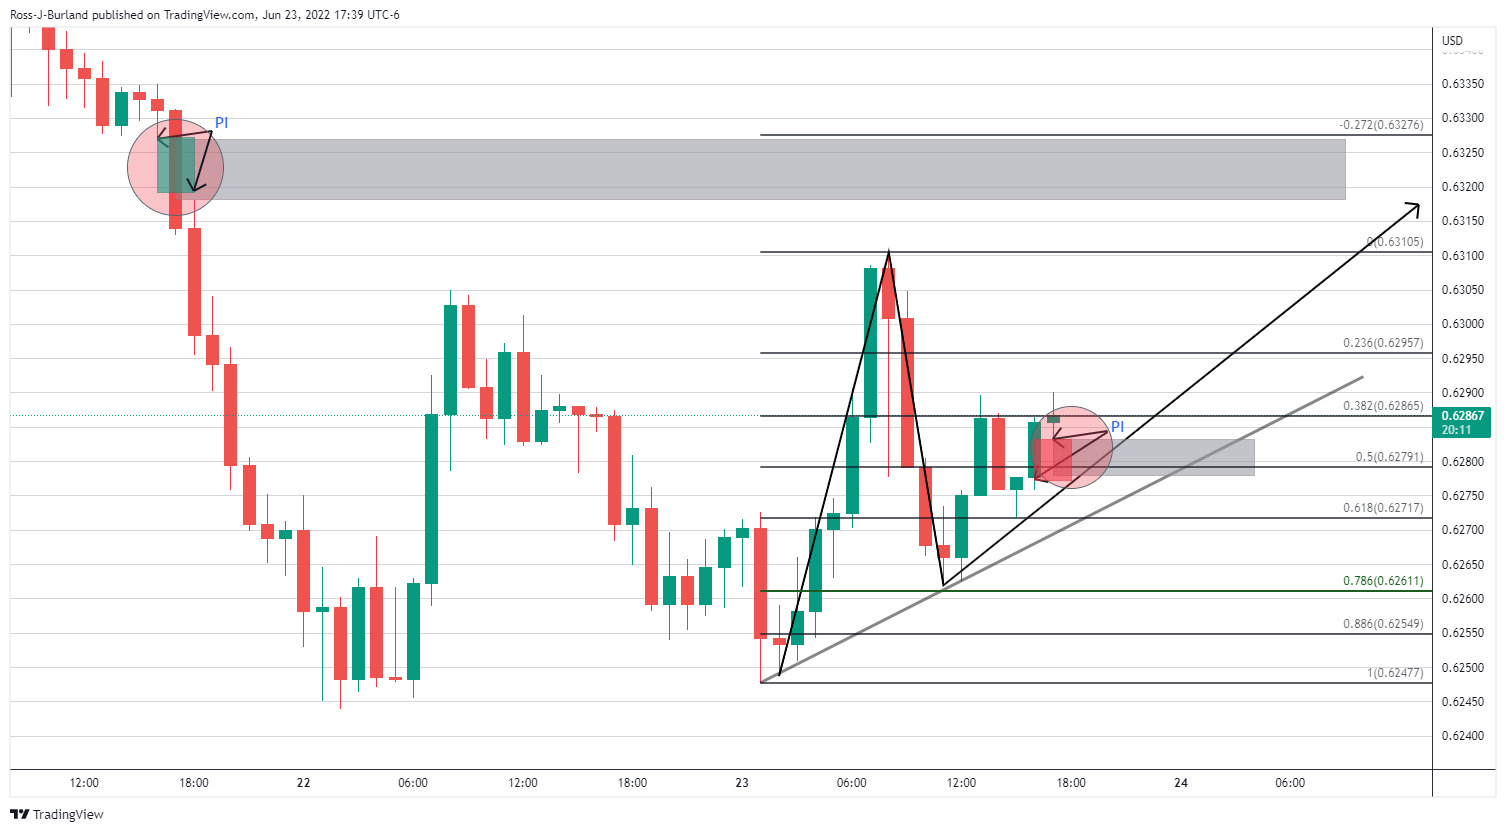
The targetted area was reached and the market has since moved in on the W-formation's neckline:
NZD/USD live market
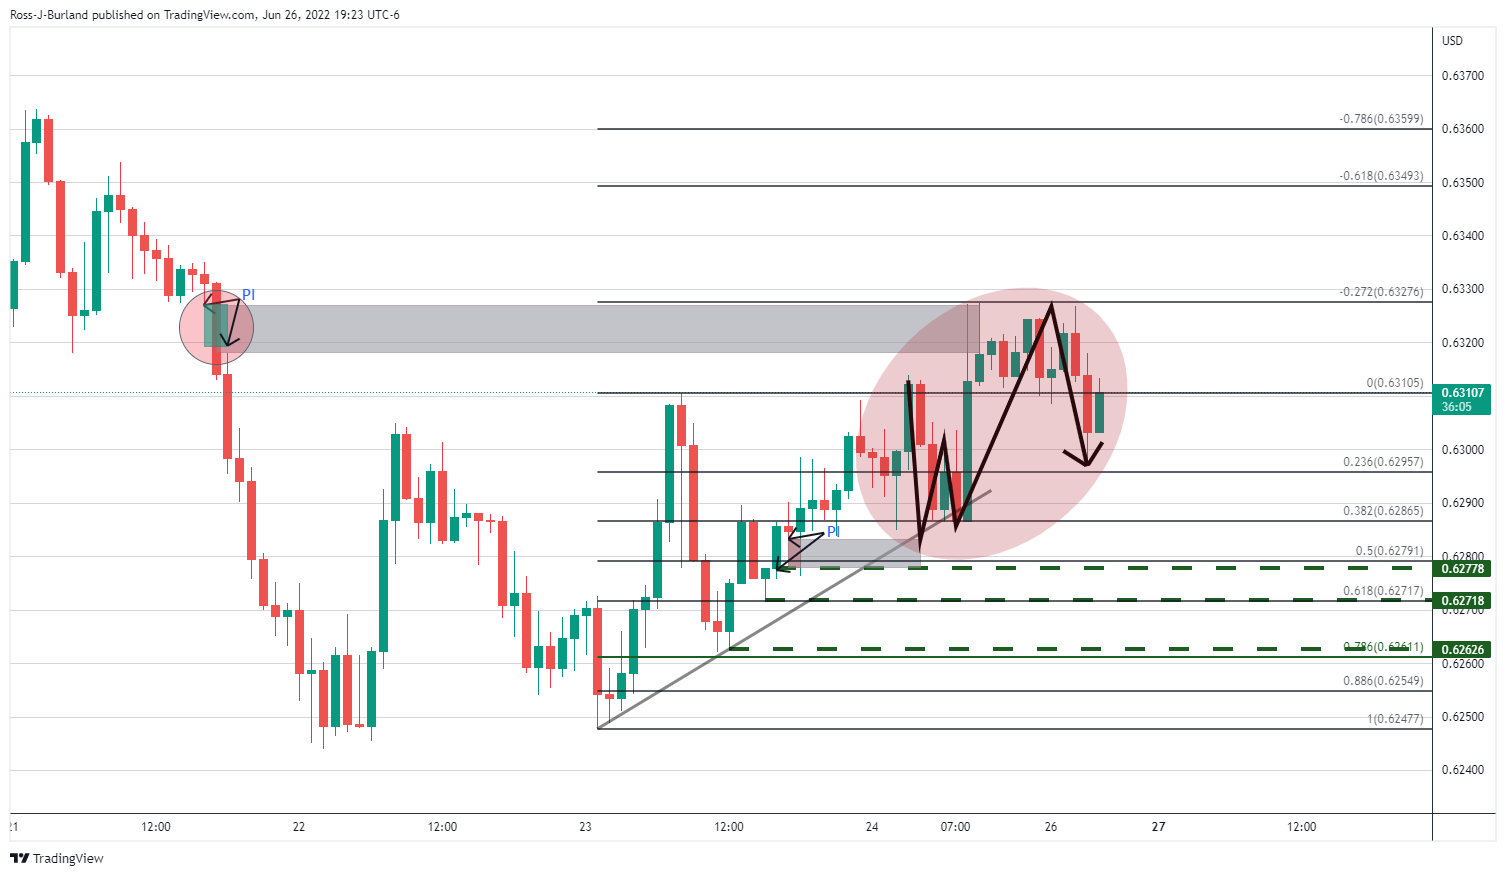
The neckline of the formation could offer some support, especially given the prospects of the downside in the DXY which is trying to break away from the prior lows as it takes out structure:
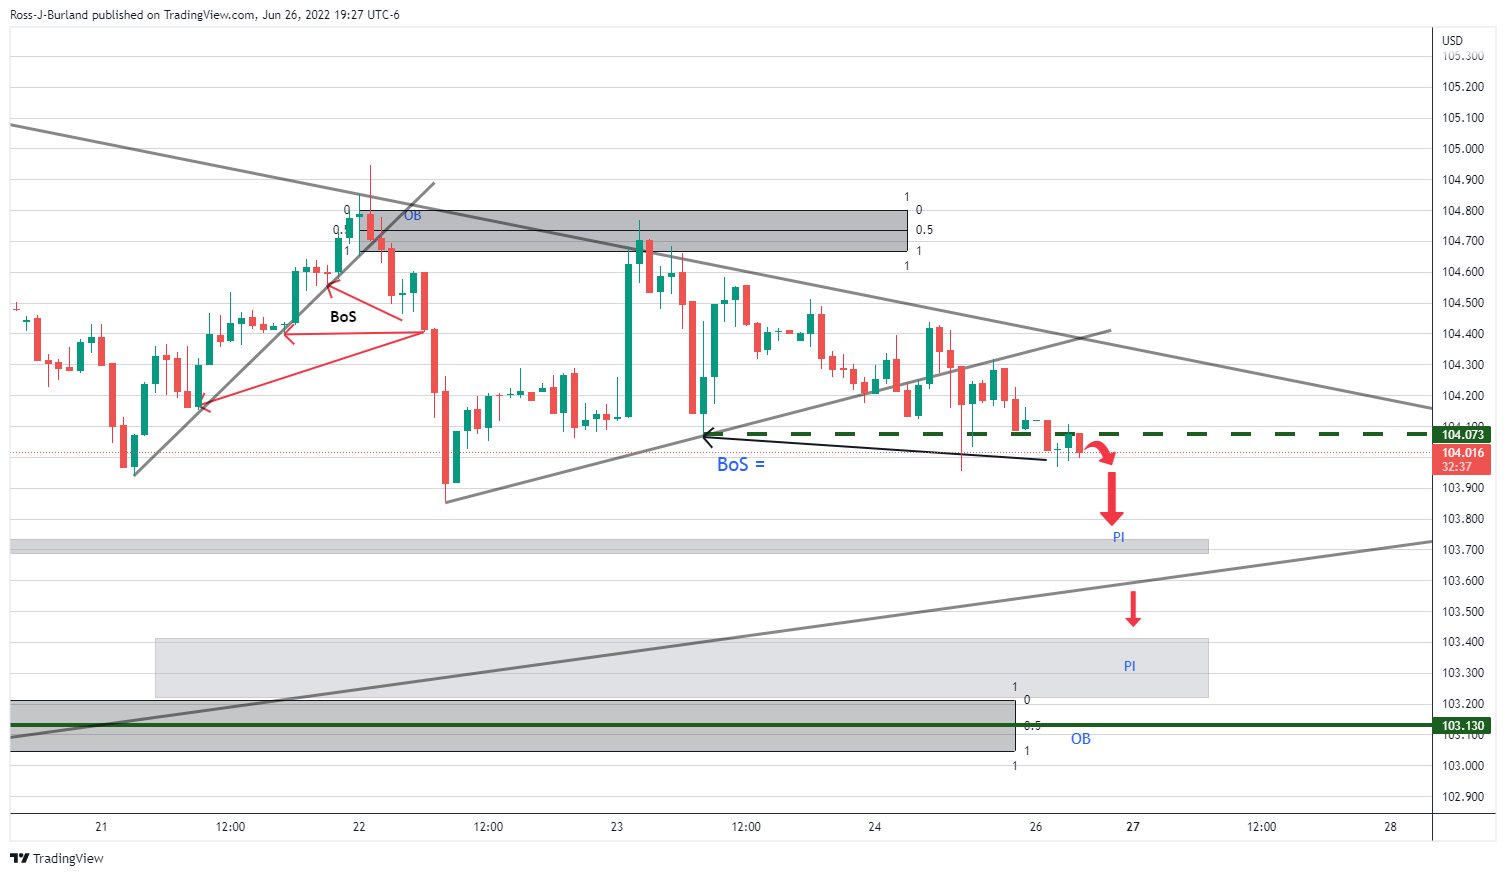
In doing so, this will put the kiwi bulls back in charge and the prior targets, 0.6340s, on the map again.
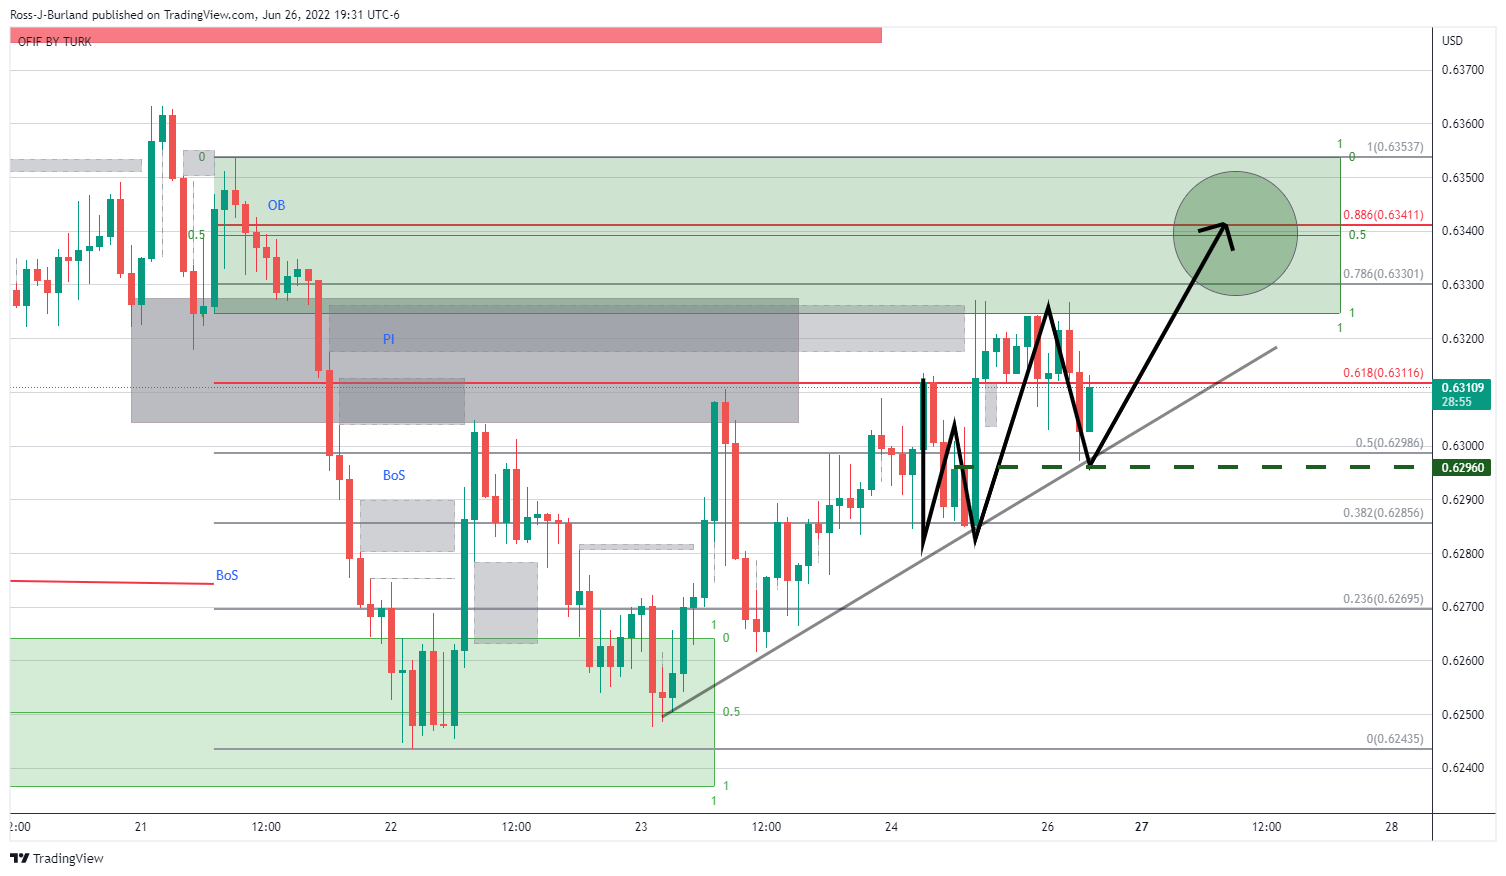
In recent trade today, the People’s Bank of China (PBOC) set the yuan (CNY) at 6.6850 vs.the last close of 6.6898.
About the fix
China maintains strict control of the yuan’s rate on the mainland.
The onshore yuan (CNY) differs from the offshore one (CNH) in trading restrictions, this last one is not as tightly controlled.
Each morning, the People’s Bank of China (PBOC) sets a so-called daily midpoint fix, based on the yuan’s previous day's closing level and quotations taken from the inter-bank dealer.
- EUR/JPY has slipped to near 142.20 as focus shifts to the eurozone HICP.
- The eurozone HICP is seen at 8.3% vs. 8.1% reported earlier.
- BOJ’s ultra-loose monetary policy will keep the yen bulls on the tenterhooks.
The EUR/JPY pair is declining sharply lower after failing to overstep the critical hurdle of 143.00. The cross has displayed the signs of a bearish open rejection-reverse trading session. The asset moved marginally higher after opening flat, found barricades around the crucial hurdle of 143.00, slipped lower and extended losses after slipping from the opening price at 142.62.
The yen bulls are performing well despite the continuation of the ultra-loose monetary policy from the Bank of Japan (BOJ). BOJ’s monetary policy minutes dictated that most of the policymakers were favoring a prudent monetary policy.
Despite the achievement of the targeted inflation rate above 2%, the BOJ is inclined to flush more liquidity into the economy. The aggregate demand levels in the Japanese economy have not reached their pre-pandemic levels yet. Also, the inflation rate in the Japanese economy is contaminated by soaring oil prices and costly food items.
Meanwhile, the shared currency bulls are expecting a rate hike announcement in July. It is worth noting that the economy has not elevated its interest rates yet despite soaring price pressures. The other Western leaders have already paddled their interest rates to fix the inflation mess and now the European Central Bank (ECB) should be bold enough to dictate a rate hike.
This week, investors' focus will remain on the eurozone Harmonized Index of Consumer Prices (HICP) data. A preliminary estimate for the annual Inflation rate is 8.3% against the prior print of 8.1%. A continuation of the higher inflation rate is advocating a mega rate hike announcement by the ECB.
- GBP/JPY takes offers to refresh intraday low, extending pullback from 100-HMA.
- Impending bear cross on MACD adds strength to the downside bias targeting 200-HMA.
- Overall trend remains bullish until the quote drops below 160.00.
GBP/JPY breaks one-week-old support as it refreshes an intraday low around 165.25 during Monday’s Asian session.
In doing so, the cross-currency pair extends pullback from the 100-HMA amid a looming bearish signal from the MACD.
With this, the quote aims to retest the 200-HMA surrounding 165.00 before challenging the 164.50 horizontal support area.
Following that, the 61.8% Fibonacci retracement level of June 16-21, near 163.00, will precede the 161.00 round figure before directing GBP/JPY bears towards the monthly bottom surrounding 160.00.
On the contrary, a clear upside break of the 100-HMA, at 166.20 by the press time, could recall short-term buyers.
However, multiple hurdles near 167.50 appear to test the bulls ahead of offering them the monthly high of 168.73.
Overall, a clear downside break of the short-term support suggests that the GBP/JPY prices are likely to decline further. However, the bears have limited room to cheer and may remain cautious unless witnessing a daily closing below 160.00.
GBP/JPY: Hourly chart
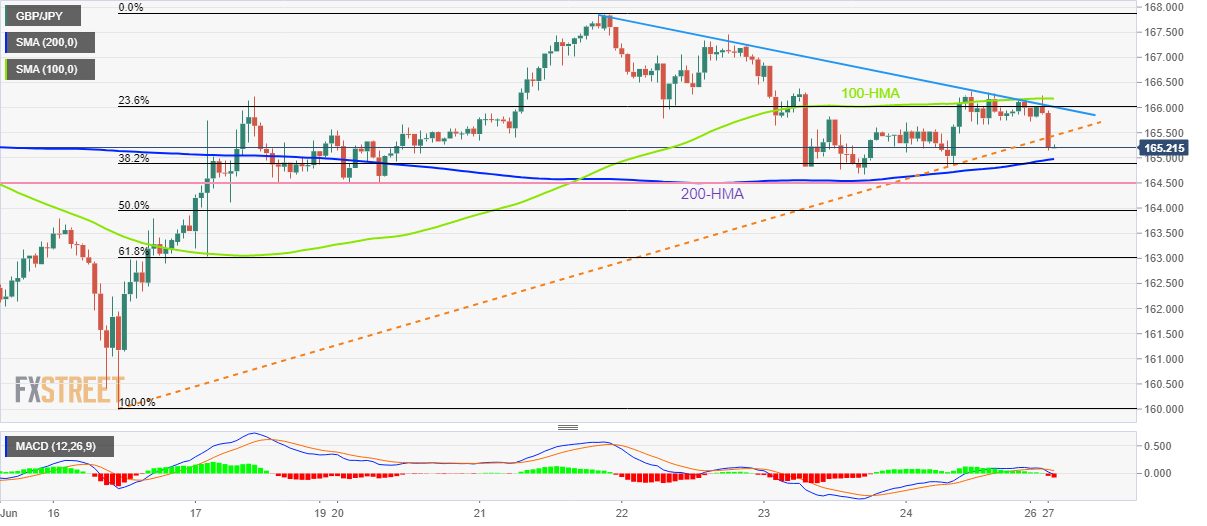
Trend: Limited downside expected
- EUR/USD grinds higher towards the four-month-old resistance line, keeping the first weekly gain in four.
- US dollar remains pressured amid market’s indecision, downbeat US data.
- Geopolitical and recession woes challenge the upside momentum ahead of the key data, central bankers’ speeches.
EUR/USD extends the weekly recovery towards 1.0600, picking up bids to 1.0570 during Monday’s initial Asian session. In doing so, the major currency pair cheers US dollar pullback, as well as sluggish market sentiment, ahead of the key data/events.
US Dollar Index (DXY) posted the first weekly loss in four by the end of Friday’s trading, down 0.10% around 104.00 by the press time. The greenback gauge’s latest weakness could be linked to the downbeat inflation expectations and softer US data, as well as fears of the US GDP weakness.
That said, International Monetary Fund (IMF) Managing Director Kristalina Georgieva crossed wires during the weekend while saying, “Further negative shocks would inevitably make US economic situation ‘more difficult’.” It’s worth noting that the IMF revised down US 2022 GDP forecasts to 2.9% versus the 3.7% predicted earlier.
On Friday, the US New Home Sales for May, by 10.7% versus April’s revised figures of -12.0%, joined the record low print of the final reading of the University of Michigan's Consumer Sentiment Index for June, to 50.0 from 50.2 initial estimates, also drowned the US dollar. Elsewhere, a sharp drop in the German IFO Business Climate Index, to 92.3 in June versus last month's 93.0 and the consensus estimates of 92.9, join comments from the European Central Bank (ECB) official to weigh on the EUR/USD prices. ECB Vice President Luis de Guindos said on Friday that it was possible to see negative growth in the euro area in 2023, as reported by Reuters.
Reuters came out with the news suggesting that the Bank for International Settlements (BIS) calls for interest rates to be raised "quickly and decisively" to prevent the surge in inflation from turning into something even more problematic. The news also challenges the EUR/USD buyers of late.
Against this backdrop, S&P 500 Futures fail to track Wall Street’s gains, down 0.40% intraday at the latest, whereas the US 10-year Treasury yields dribble around 3.13% after posting the first weekly loss in four.
Moving on, the Eurozone calendar appears to be light ahead of ECB President Christine Lagarde’s speech. However, the US Durable Goods Orders for May, expected 0.1% versus 0.5% prior, as well as the Pending Home Sales, expected -2.0% versus -3.9% prior, will be important for daily directions. Above all, Wednesday’s debate of the US and the UK and the European central bankers at the ECB Forum on Central Banking will be important to watch.
Technical analysis
A convergence of the 21-DMA and the 50-DMA, around 1.0600 by the press time, restricts the short-term recovery of the EUR/USD pair ahead of a downward sloping resistance line from February 10, near 1.0635.
Meanwhile, the 10-DMA and a one-week-old support line limit the bear’s entry around 1.0520.
- The DXY has started the week on a weak note ahead of the downbeat US economic data.
- Weak US economic data may restrict the fed to sound hawkish extremely.
- Fed policymaker Mary Daly has supported on more 75 bps rate hike for July.
The US dollar index (DXY) is declining firmly in the Asian session as investors are dumping the asset on expectations of a poor performance from the US economic data. The DXY has slipped to near 104.00 after a sheer downside move right from the initial tick of the trading session and is expected to drop further after an establishment below the same.
Lower estimates for the US Durable Goods Orders
Last week’s underperformance from the US Purchase Managers Index (PMI) is expected to be carry-forwarded to the US Durable Goods Orders data. A preliminary estimate for the economic data is 0.1% vs. the former figure of 0.5%. It won’t be wrong to state that mounting price pressures and Federal Reserve (Fed)’s inability to bring even a minute impact on the former have started affecting the overall demand structure. This will leave less room for the Fed to tighten its policy rates further.
Fed’s Daly support one more 75 bps rate hike
San Francisco Fed President Mary Daly is supporting one more 75 basis points (bps) rate hike by the Fed in its July monetary policy meeting. Considering the soaring price pressures, the Fed needs to display some quick responses and follow a consecutive bumper rate hike announcement. The inflation rate has reached to a four-decade high of 8.6% on an annual basis.
Key data this week: Durable Goods Orders, Pending Home Sales, Consumer Confidence, Gross Domestic Product (GDP), Core Personal Consumer Expenditure (PCE), ISM Manufacturing PMI.
Major events this week: European Central Bank (ECB) Lagarde speech, Fed chair Jerome Powell’s speech, OPEC meeting.
| Index | Change, points | Closed | Change, % |
|---|---|---|---|
| NIKKEI 225 | 320.72 | 26491.97 | 1.23 |
| Hang Seng | 445.19 | 21719.06 | 2.09 |
| KOSPI | 52.28 | 2366.6 | 2.26 |
| ASX 200 | 50.3 | 6578.7 | 0.77 |
| FTSE 100 | 188.3 | 7208.8 | 2.68 |
| DAX | 205.54 | 13118.13 | 1.59 |
| CAC 40 | 190.02 | 6073.35 | 3.23 |
| Dow Jones | 823.32 | 31500.68 | 2.68 |
| S&P 500 | 116.01 | 3911.74 | 3.06 |
| NASDAQ Composite | 375.43 | 11607.62 | 3.34 |
- Gold fades bounce off one-week low, reverses from 2.5-month-old resistance line.
- Sour sentiment can renew US dollar demand amid calls for faster rate hikes.
- Concerns surrounding China, Russia adds strength to the risk-off mood.
- Key central bankers’ debate at ECB Forum will be crucial for fresh impulse.
Gold Price (XAU/USD) retreats to $1,830 while reversing the corrective pullback from a one-week low during Monday’s Asian session. The metal’s recent weakness could be linked to the market’s fears of recession, as well as the higher rates. However, the latest softness in the US dollar seems to limit the bullion’s downside.
Market sentiment sours amid recession fears, as well as downbeat data and chatters surrounding more hardships for Russia and China.
Recently, Reuters came out with the news suggesting that the Bank for International Settlements (BIS) calls for interest rates to be raised "quickly and decisively" to prevent the surge in inflation from turning into something even more problematic. On the same line, International Monetary Fund (IMF) Managing Director Kristalina Georgieva crossed wires during the weekend while saying, “Further negative shocks would inevitably make US economic situation ‘more difficult’.” It’s worth noting that the IMF revised down US 2022 GDP forecasts to 2.9% versus 3.7% predicted earlier.
Elsewhere, the US anticipates strong comments on China from the North Atlantic Treaty Organization (NATO), which in turn adds bearish bias to the oil prices due to Beijing’s position among the world’s top oil consumers. “The US is confident that NATO's new strategy document will include "strong" language on China, a White House official said on Sunday, adding that negotiations on how to refer to Beijing were still underway,” per the news from Reuters.
Furthermore, the comments from a German Official suggesting the Group of Seven (G7) leaders’ preparedness for taking moves again Russia's oil and gold seem to recently weigh on the WTI. “Leaders of the Group of Seven rich democracies are having "very constructive" discussions on a possible cap on Russian oil imports, a German government official said on Saturday shortly before the start of the annual three-day G7 summit,” said Reuters.
Amid these plays, S&P 500 Futures fail to track Wall Street’s gains, down 0.30% intraday at the latest, whereas the US 10-year Treasury yields dribble around 3.13% after posting the first weekly loss in four.
Looking forward, the US Durable Goods Orders for May, expected 0.1% versus 0.5% prior, as well as the Pending Home Sales, expected -2.0% versus -3.9% prior, will be important for daily directions. However, Wednesday’s debate of the US and the UK and the European central bankers at the ECB Forum on Central Banking will be a crucial event for the week to note.
Also read: Gold Weekly Forecast: Bearish bias stays intact as XAU/USD fails to reclaim 200 DMA
Technical analysis
Gold maintains its downward trajectory by recently reversing from a 10-week-old resistance line, at $1,840 by the press time.
The metal’s multiple rejections from the 200-DMA hurdle of $1,845, as well as the sustained trading below the 50-DMA, around $1,856 by the press time, also keeps XAU/USD sellers hopeful.
Given the steady RSI line and sluggish MACD, the gold bears are likely to aim for a five-week-long horizontal support area near $1,807 ahead of targeting the yearly low surrounding $1,786.
On the contrary, the aforementioned trend line and the DMAs can restrict XAU/USD upside below $1,856. Also acting as an upside filter is the monthly peak surrounding $1,880.
Gold: Daily chart
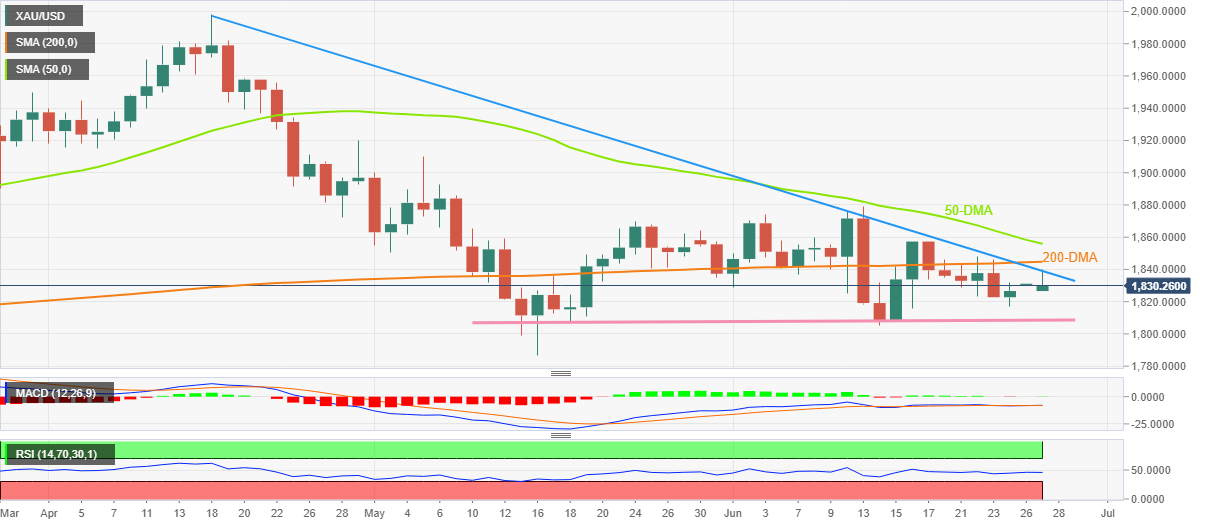
Trend: Further weakness expected
| Pare | Closed | Change, % |
|---|---|---|
| AUDUSD | 0.69421 | 0.65 |
| EURJPY | 142.677 | 0.48 |
| EURUSD | 1.0554 | 0.3 |
| GBPJPY | 165.906 | 0.3 |
| GBPUSD | 1.22722 | 0.11 |
| NZDUSD | 0.6313 | 0.54 |
| USDCAD | 1.28942 | -0.79 |
| USDCHF | 0.95859 | -0.27 |
| USDJPY | 135.195 | 0.19 |
The Bank of Japan's June meeting Summary of Opinions has been released and the following are some of the key points.
- BoJ must maintain easy policy, keep close eye out on market, fx impact on economy, prices.
- Number of goods seeing prices rise is increasing due to rising raw material costs and weak yen, but appropriate to keep easy monetary policy as inflation not driven by positive economic cycle.
- Maintaining ultra-easy policy is effective in achieving sustained rise in wages.
- Must heighten households' purchasing power, inflation expectations to achieve boj's price goal in steady manner.
- Sharp yen fall would hurt economy, heighten uncertainty.
- Exports, output under stronger downward pressure than seen in april due to supply constraints caused by china's lockdowns.
- Will likely take time for shanghai's economic activity to normalise, worried about risk of China's slowdown, prolonged global supply constraints.
This report includes the BOJ's projection for inflation and economic growth. It is scheduled 8 times per year, about 10 days after the Monetary Policy Statement is released.
-
USD/JPY eyes downside below 135.00 as DXY weakens, US Durable Goods Orders eyed
- Bulls eye a run towards 1.2500 for the sessions ahead.
- US dollar is under pressure as it breaks structure.
where there is a price imbalance, PI, on a 4-hour perspective on the way there that guards an order block, OB, above it.
At 1.2292, GBP/USD is up 0.16% as the US dollar falls away below a key structure on the DXY chart.
The US dollar is extending the downside after it slipped on Friday and posted its first weekly decline this month. A fall in oil and commodity prices has dented the greenback's safe-haven appeal. We have seen the price action in DXY play out as follows:
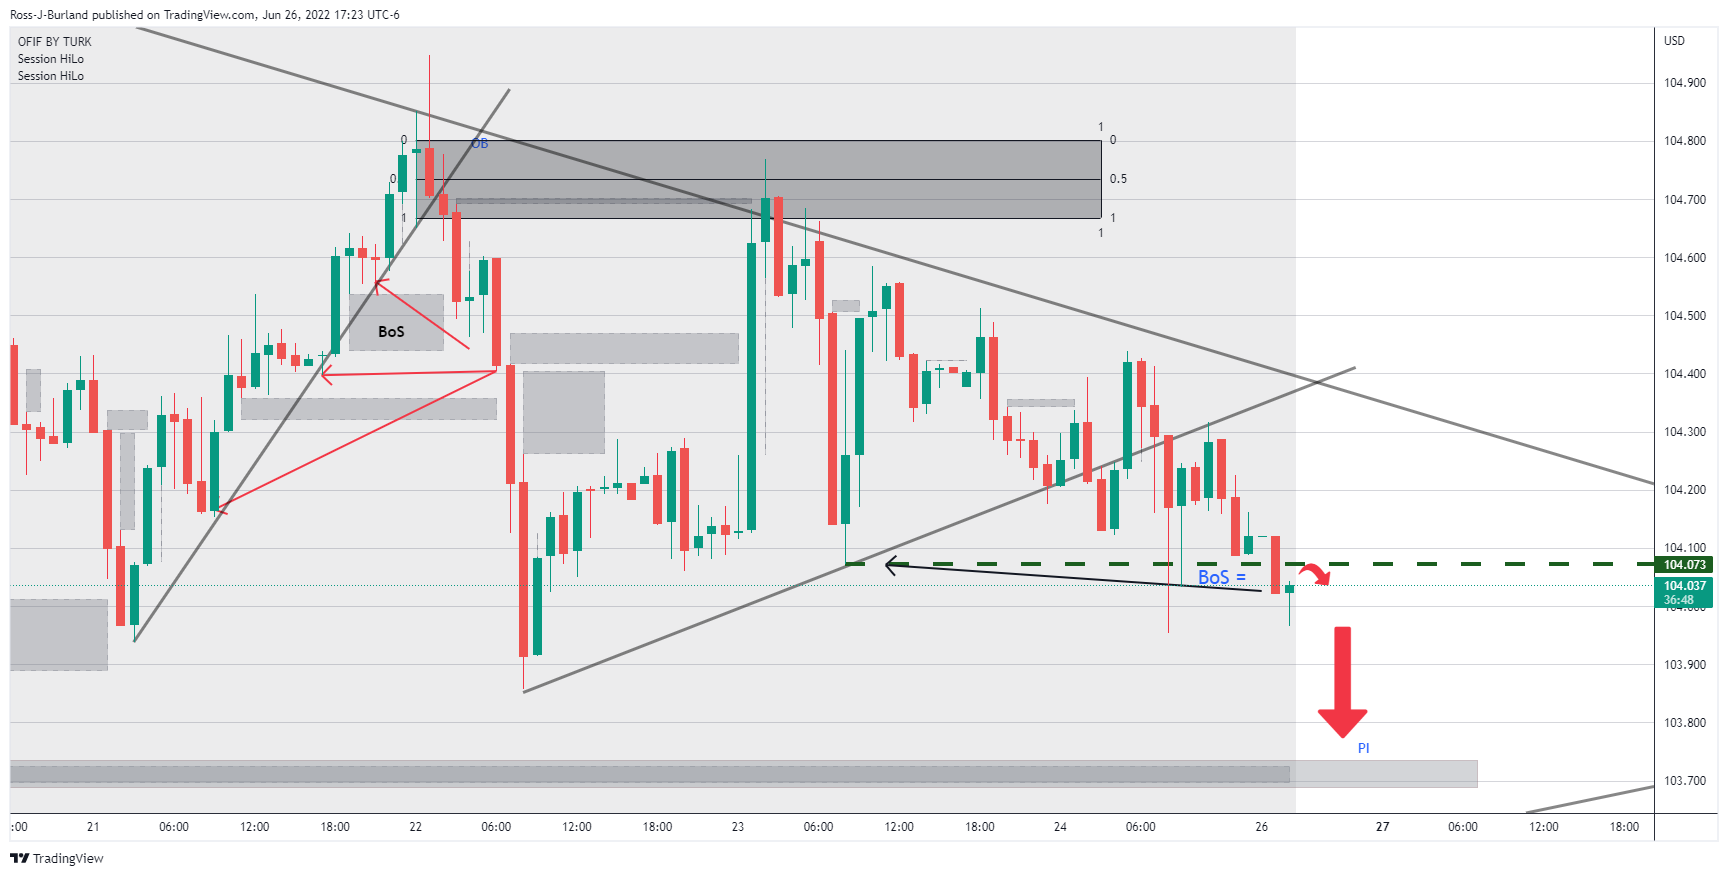
Meanwhile, while this is a positive development for GBP, domestically, the focus is on the forthcoming Bank of England while observers note that the UK is in danger of being the slowest-growing major advanced economy next year.
The Uk could have with the highest inflation rate and the biggest current account deficit, analysts at Societe Generale said.
''That's quite a collection, and it represents a clear threat to the pound. The sentiment is already poor and there are plenty of speculative shorts out there too, but further weakness is likely. Whether it falls more as the US dollar continues to rise, or under-performs a recovering euro, it will struggle. Longer-term, we will see sterling make new trade-weighted lows.''
The downside risks to growth resulting from higher interest rates have resulted in a complicated relationship between GBP and the BoE's gloomy predictions about the risks to growth have been a weight for sterling.
The Bank is not scheduled to update its forecasts again until August, but investors may take little comfort from another rate hike when they next meet. Growth fears have been reinforced by April's growth data but the recent strong labour data has given the pound a softer landing as seen in the following technical analysis:
GBP/USD technical analysis
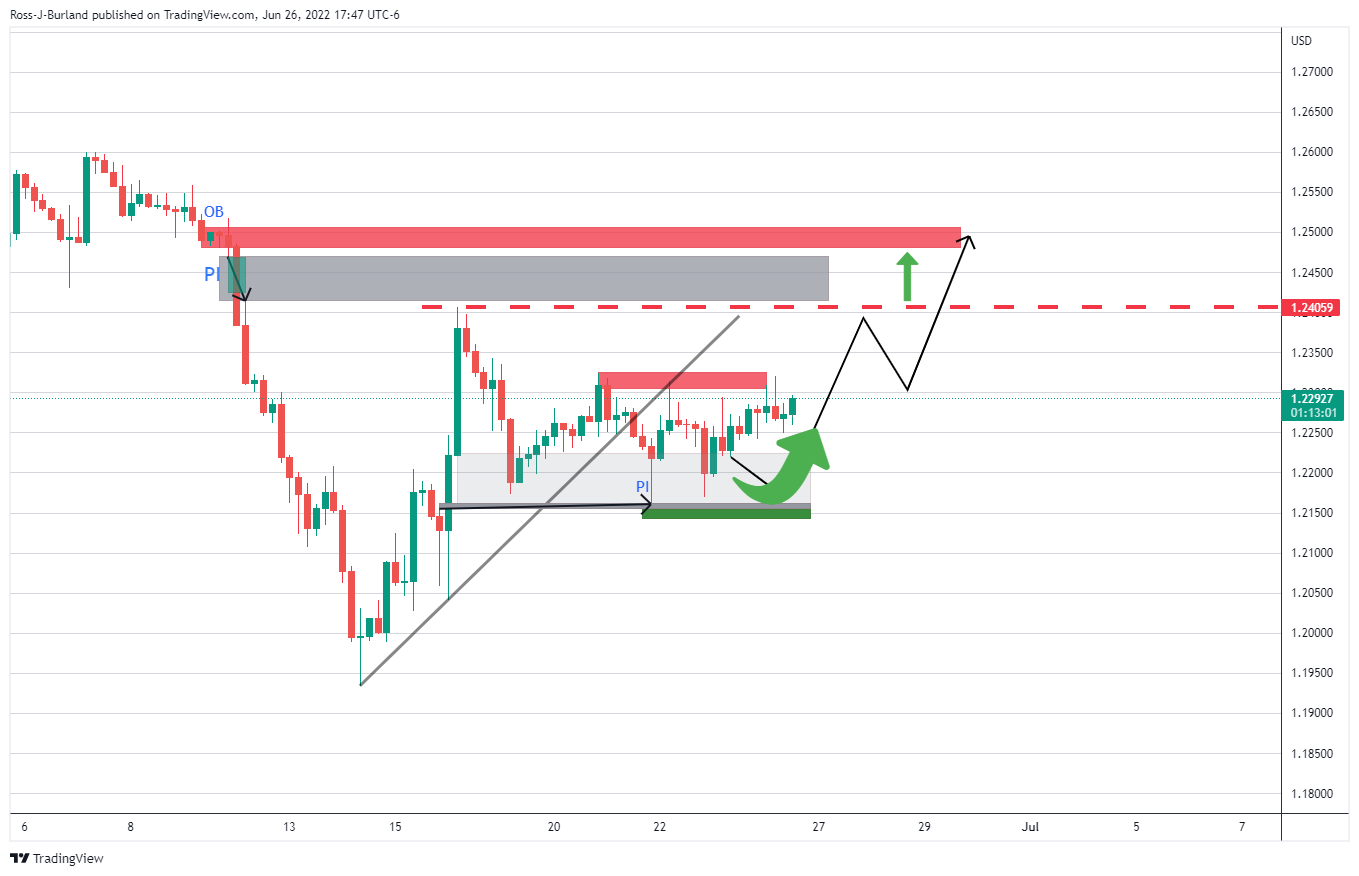
The price is moving in on near-term resistance and a break of which opens risk towards 1.2500 where there is a price imbalance, PI, on a 4-hour perspective on the way there that guards an order block, OB, above it.


© 2000-2026. Bản quyền Teletrade.
Trang web này được quản lý bởi Teletrade D.J. LLC 2351 LLC 2022 (Euro House, Richmond Hill Road, Kingstown, VC0100, St. Vincent and the Grenadines).
Thông tin trên trang web không phải là cơ sở để đưa ra quyết định đầu tư và chỉ được cung cấp cho mục đích làm quen.
Giao dịch trên thị trường tài chính (đặc biệt là giao dịch sử dụng các công cụ biên) mở ra những cơ hội lớn và tạo điều kiện cho các nhà đầu tư sẵn sàng mạo hiểm để thu lợi nhuận, tuy nhiên nó mang trong mình nguy cơ rủi ro khá cao. Chính vì vậy trước khi tiến hành giao dịch cần phải xem xét mọi mặt vấn đề chấp nhận tiến hành giao dịch cụ thể xét theo quan điểm của nguồn lực tài chính sẵn có và mức độ am hiểu thị trường tài chính.
Sử dụng thông tin: sử dụng toàn bộ hay riêng biệt các dữ liệu trên trang web của công ty TeleTrade như một nguồn cung cấp thông tin nhất định. Việc sử dụng tư liệu từ trang web cần kèm theo liên kết đến trang teletrade.vn. Việc tự động thu thập số liệu cũng như thông tin từ trang web TeleTrade đều không được phép.
Xin vui lòng liên hệ với pr@teletrade.global nếu có câu hỏi.
ngân hàng