- Phân tích
- Tin tức và các công cụ
- Tin tức thị trường
Tin tức thì trường
- The NZD/USD erased early week losses and finished the week flat.
- On Friday, recession fears abated, but growing risks remain skewed to the downside.
- St. Louis Fed’s Bullard commented that the US economy is fine and that recession worries are exaggerated.
The New Zealand dollar recorded solid gains vs. the greenback, snapping two days of consecutive losses, recovering from daily lows near 0.6266, piercing through the 0.6300 figure, and ending near the daily highs at around 0.6327. At 0.6312, the NZD/USD reflects Friday’s upbeat market mood, which underpinned risk-sensitive currencies in the FX space.
Upbeat sentiment and a weaker greenback, a tailwind for the NZD/USD
Risk appetite increased in the session as witnessed by Wall Street finishing with robust gains after plunging to bear market levels, meaning losses of 20% or more from all-time-highs. US recession fears abated on US economic data, showing that consumer inflation expectations lowered from a 14-year high. Nevertheless, Thursday’s US S&P Global PMIs printed that the economy is slowing down, coupled with inflation expectations taming, which denotes the Fed could keep hiking but not at a faster pace.
During the North American session, the St. Louis Fed President James Bullard said US recession worries are overblown and commented that the US would be fine. He added that tightening policy will slow down the economy to a trend pace of growth and expects the need to move the FFR near 3.50%.
Late in the day, San Francisco Fed President Mary Daly said the Fed doesn’t need to think about the endpoint of the balance sheet yet, and added that the central bank would communicate regarding that. Daly’s said that she does not see a recession.
NZD/USD traders should be aware of New Zealand’s holiday, suggesting that no economic data is available. Meanwhile, the US economic docket featured the UoM Consumer Sentiment on its final reading for June, which plunged to 50. US New Home Sales rose 10.7% in May to 0.696 million and beat expectations of 0.588 million
In the week ahead, the New Zealand economic docket will feature ANZ Business Confidence, ANZ Consumer Confidence, and Building Permits. On the US front, the calendar will unveil Durable Goods Orders, CB Consumer Confidence, Gross Domestic Product, and the Fed’s favorite gauge of inflation, the Personal Consumption Expenditure (PCE) for May.
NZD/USD Key Technical Levels
- The shared currency finished the week with decent gains of 0.21%.
- Sentiment remains optimistic, despite recession fears threatening.
- EUR/GBP Price Analysis: Remains upwards but struggling at 0.8600 might open the door for selling pressure.
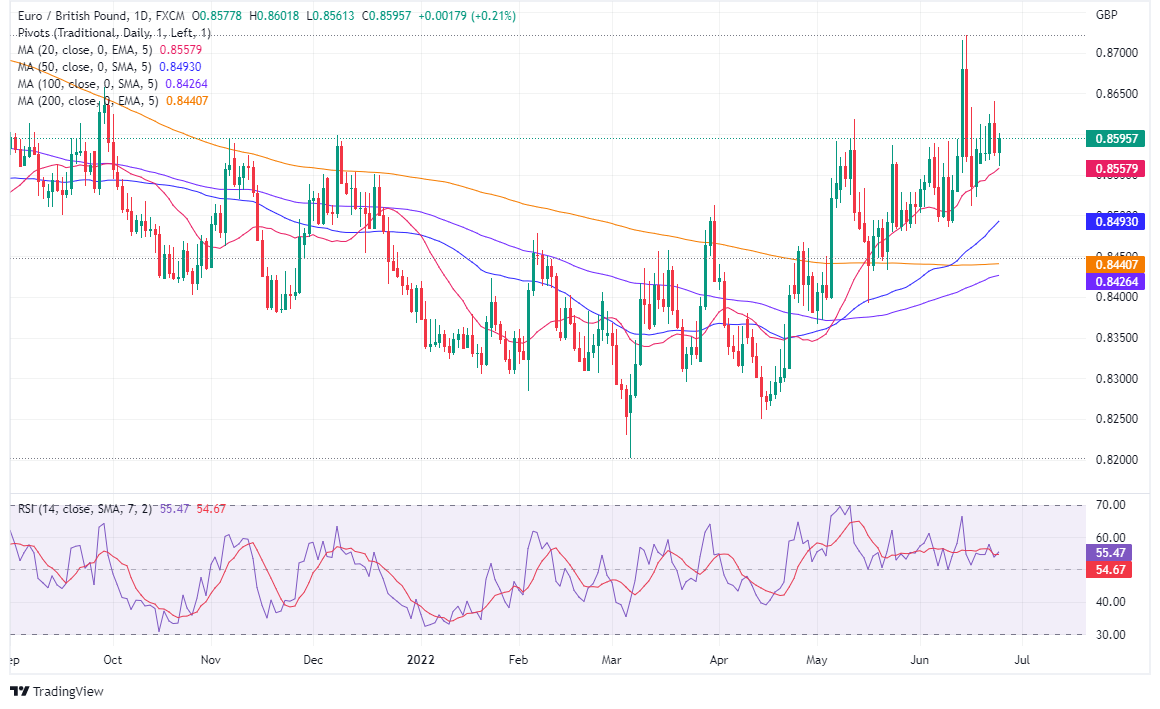
The EUR/GBP accelerates for the fourth day out of five in the week, set to finish with decent gains of 0.21%. On Friday, the cross-currency pair slumped towards its daily low at 0.8561, then snapped back and rose towards 0.8600. At 0.8595, the EUR/GBP retained the control and extended its weekly rally to two consecutive weeks.
Wall Street is set to finish the week on an upbeat tone, registering gains in the range of 2.34% and 2.73%. US economic slowdown, alongside lower inflation expectations, revealed at the University of Michigan June’s Consumer sentiment report tempered expectations for the Federal Reserve hike plan.
Reflection of the abovementioned are money market futures STIRs, showing that traders expect the Federal funds rate (FFR) to end around 3.50%, aligned with the St. Louis Fed President James Bullard’s forecast.
Friday’s EUR/GBP price action shows that the cross opened near 0.8580s and dipped towards 0.8561 before bouncing off those lows, settling around 0.8590. nevertheless, the lack of a EUR/GBP bullish impulse kept the pair below the 0.8600 threshold.
EUR/GBP Price Analysis: Technical outlook
Daily chart
EUR/GBP price action depicts the pair as upward biased. However, buyers unable to break above the 0.8650 kept the cross-currency range-bound in the 0.8550-0.8650 area, meaning consolidation lies ahead. Further confirmation of that is the Relative Strength Index (RSI) At 55.36, in positive territory but with an almost horizontal slope.
Therefore, the EUR/GBP top of the range is 0.8650. A breach of the latter would expose the 0.8700 figure. Once cleared, the next ceiling level would be the YTD high at 0.8720, followed by 0.8800.
On the flip side, the EUR/GBP first support is the 20-EMA at 0.5857. Break below would expose June’s 16 low at 0.8511, followed by the 50-EMA at 0.8493.
EUR/GBP Key Technical Levels
- The USD/CHF remains negative in the week, losing 1.16%.
- A positive market mood deterred USD/CHF sellers from confirming the double top chart pattern.
- USD/CHF Price Analysis: Double top remains in play, but USD/CHF require to hold spot prices below 0.9600.
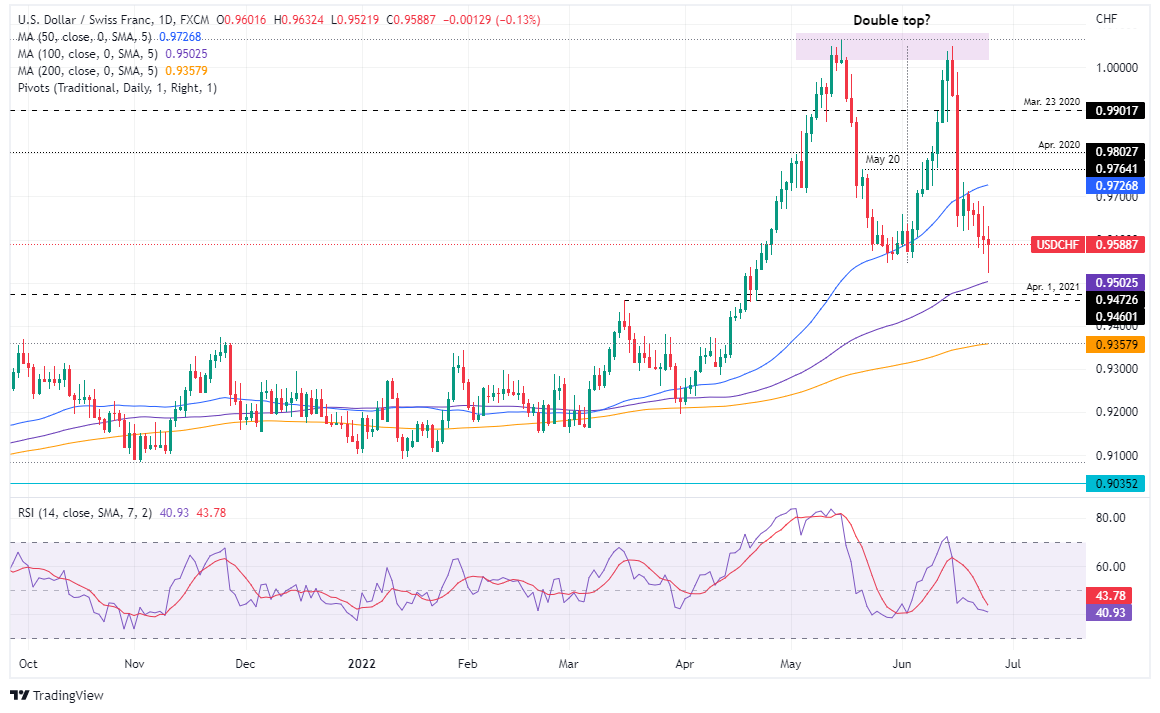
The USD/CHF slumps for the fifth consecutive day, though bounced off weekly lows reached during the day near 0.9521, towards the 0.9580s region, shy of reclaiming the 0.9600 figure. At 0.9589, the USD/CHF lost 0.13% on Friday, extending its weekly losses to 1.16%.
The market mood remains upbeat as US equities post gains between 2.13% and 2.47%. That is courtesy of the University of Michigan’s inflation expectations easing from a 14-year high, meaning that the Fed needs to tighten but not as previously expected by market players, which now foresee the Federal funds rate (FFR) near 3.50%. Furthermore, US recession fears abated as St. Louis Fed President James Bullard said that worries are overblown.
In the meantime, the USD/CHF opened above 0.9600 and edged higher towards Friday’s daily high, retreating afterward to daily lows near 0.9521, though of late settled around the 0.9580 area.
USD/CHF Price Analysis: Technical outlook
Daily chart
The USD/CHF is still in an uptrend but remains trapped between the 50 and 100-day moving averages (DMAs). It’s worth noting that the major formed a double top in the daily time frame but still requires a daily close below May’s 27 swing low at 0.9544 to validate the pattern.
Therefore, a USD/CHF daily close below 0.9544 would open the door for the 100-DMA at 0.9502. Break below would expose the 0.9400 mark, followed by the 200-DMA at 0.9357.
However, if the ongoing uptrend resumes, the USD/CHF’s first resistance would be 0.9600. A breach of the latter would expose the 0.9700 figure, followed by the 50-DMA at 0.9772, and then a test of June’s 16 daily high at 0.9989.
USD/CHF Key Technical Levels
- Gold is headed for the second consecutive week with losses, down 0.64% despite climbing on Friday.
- Lower US 10-year TIPS yields and a softer US dollar are a tailwind for Gold prices.
- Gold Price Forecast (XAUUSD): Gold is neutral-downward biased.
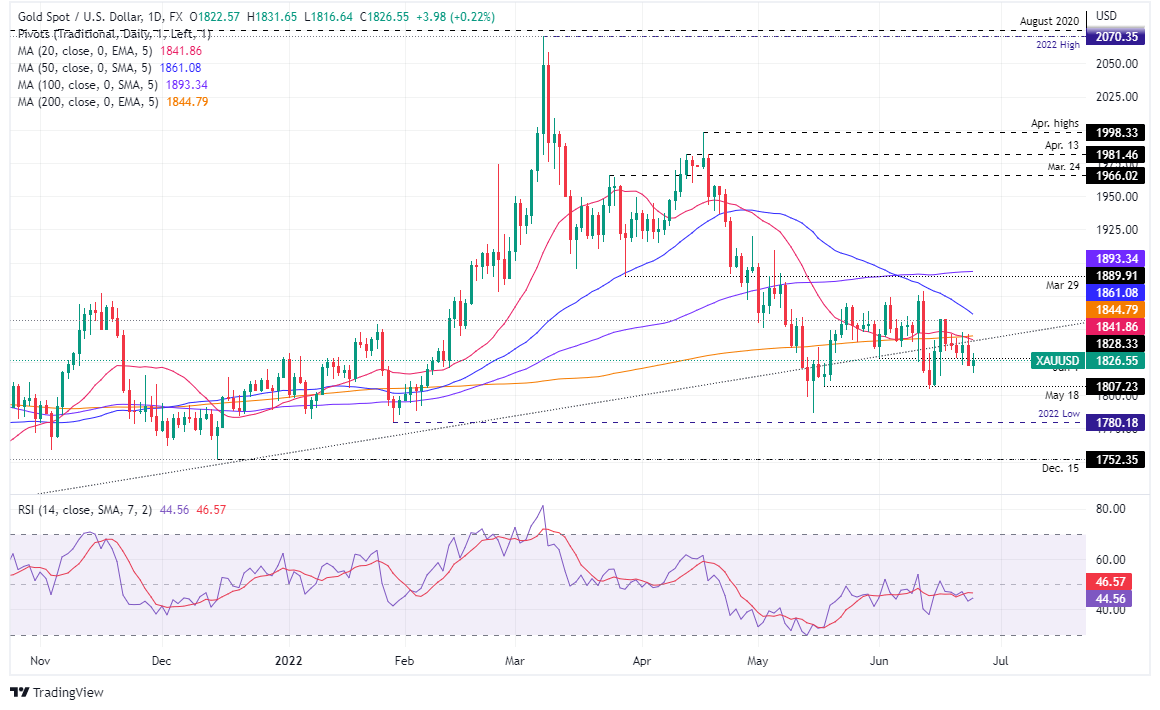
Gold spot (XAUUSD) bounces off weekly lows near $1816, recovering some ground in the week, reclaiming above the $1825 mark courtesy of a soft US Dollar amidst a trading day with upbeat market sentiment and elevated US Treasury yields. At the time of writing, XAUUSD is trading at $1826.56, up 0.23%.
Sentiment improved despite Thursday’s dismal US S&P Global PMI, which showed the US economy is slowing. US recession fears increased after Friday’s University of Michigan Consumer Sentiment on its June final reading plunged to 50. However, inflation expectations, unveiled in the same report, were lowered, which began to be priced in by market players, who backpedaled an aggressive Fed, now expecting the Federal funds rate (FFR) to top around 3.50%.
Before Wall Street opened, the St. Louis Fed President James Bullard spoke at a panel alongside the RBA’s Governor Philip Lowe. He said that fears of a US recession are overblown and commented that the US would be fine. He added that tightening policy will slow down the economy to a trend pace of growth and expects the need to move the FFR near 3.50%.
At the time of writing, the San Francisco Fed President Mary Daly is crossing wires. She said the Fed doesn’t need to think about the endpoint of the balance sheet yet, and added that the central bank would communicate regarding that. Daly’s said that she does not see a recession.
In the meantime, the US Dollar Index, a measure of the buck’s value vs. a basket of currencies, dives 0.16% to 104.238, contrarily to the US 10-year Treasury yield, which is rising two basis points, yielding 3.117%.
Elsewhere US 10-year TIPS (Treasury Inflation-Protected Securities), a proxy for US Real yields, slumps two bps at 0.556%, a tailwind for the yellow metal that usually benefits from lower Real yields augmenting appetite for precious metals.
Meanwhile, the US 10s-2s yield spread remains positive at 0.071%, though it remains to push towards 0%. A reading below 0% would imply that traders forecast a recession in the US.
Friday US economic calendar featured June’s UoM Consumer sentiment on its final reading alongside further Fed speaking.
Gold Price Forecast (XAUUSD): Technical outlook
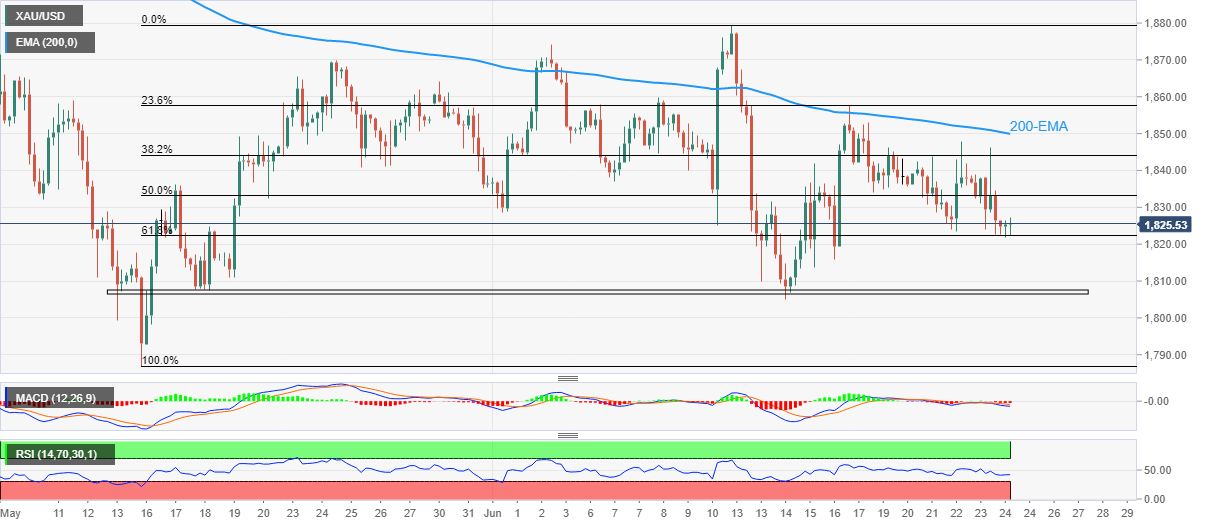
XAUUSD is in consolidation, though it remains below the 200-day moving average (DMA) around $1844.79, suggesting that gold bias is neutral-downwards. Also, the Relative Strength Index (RSI) is at bearish territory at 44.87, signaling that selling pressure remains on the non-yielding metal, but the lack of a catalyst that moves the price above/below the range kept it trapped in the $1825-50 area.
Upwards, Gold price resistance levels would be the 200-DMA at $1844.79, followed by $1850 and the 50-EMA at $1861.07. On the downside, XAU/USD’s support levels would be $1800, followed by the May 16 low at $1786.50 and the YTD low at $1780.18.
The current environment with economic growth slowing down is favorable to the US dollar according to analysts from Danske Bank. They forecast the EUR/USD pair at 1.04 in a one-month perspective, at 1.03 in three months and at 1.00 in a year.
Key Quotes:
“Fundamentally, the US should continue to be a high(er) interest rate market and equities continue to appeal to foreign investors. This means the US is likely to attract capital, which helps the USD.”
“The large negative terms-of-trade shock to Europe vs US, a further cyclical weakening among trading partners, the coordinated tightening of global financial conditions, broadening USD strength and downside risk to the euro area make us keep our focus on EUR/USD moving still lower (targeting 1.00) – a view not shared by consensus.”
“The key risk to shift EUR/USD towards 1.15 is seeing global inflation pressures fade and industrial production increase. The upside risk also include a renewed focus on easing Chinese credit policy and a global capex uptick but neither appear to be materialising, at present.”
- US dollar drops on Friday as stocks soar.
- Commodity prices also recover, US yields remain low.
- AUD/USD is modestly higher for the week, holds above recent lows.
The AUD/USD broke above 0.6920 and jumped to 0.6957 on Friday, reaching the highest level in two days. Stocks are rising sharply in Wall Street helping the aussie.
Risk appetite at the end of a positive week
Despite recession fears, investors went for stocks. US stocks indexes are up by more than 2%, extending weekly gains. Negative economic data did not weigh on sentiment and kept US yields far from the recent peak, weakening the dollar.
The AUD/USD recovered from weekly lows under 0.6900, erasing weekly losses. The short-term outlook for the aussie improved. Above 0.6950 the next resistance stands at 0.6990, the last defense to 0.7000. A decline back under 0.6925 would expose the weekly low around 0.6870.
Week ahead
In the US attention will likely continue to be on how the Federal Reserve evaluates the current outlook between high inflation and recession fears. Regarding data, the PCE report (with the Core PCE) on Thursday will be the most important followed by the ISM Manufacturing on Friday.
The economic calendar for Australia show May’s retail sales numbers due on Wednesday. “While consumer sentiment has slumped give rising inflation and a lower confidence around the economic outlook, household balance sheets are in good shape. Further, a strong labour market should keep household spending elevated. A strong retail beat will boost the case for another aggressive move by the RBA in July after their outsized 50bps hike”, said analysts at TD Securities.
Technical levels
- The S&p 500, the Nasdaq, and the Dow Jones extend gains between 4 and 5 percent in the week.
- UoM Consumer Sentiment plunged, and inflation expectations got lower, seen as a relief by traders.
- Fed’s Bullard commented that fears of a recession are overblown.
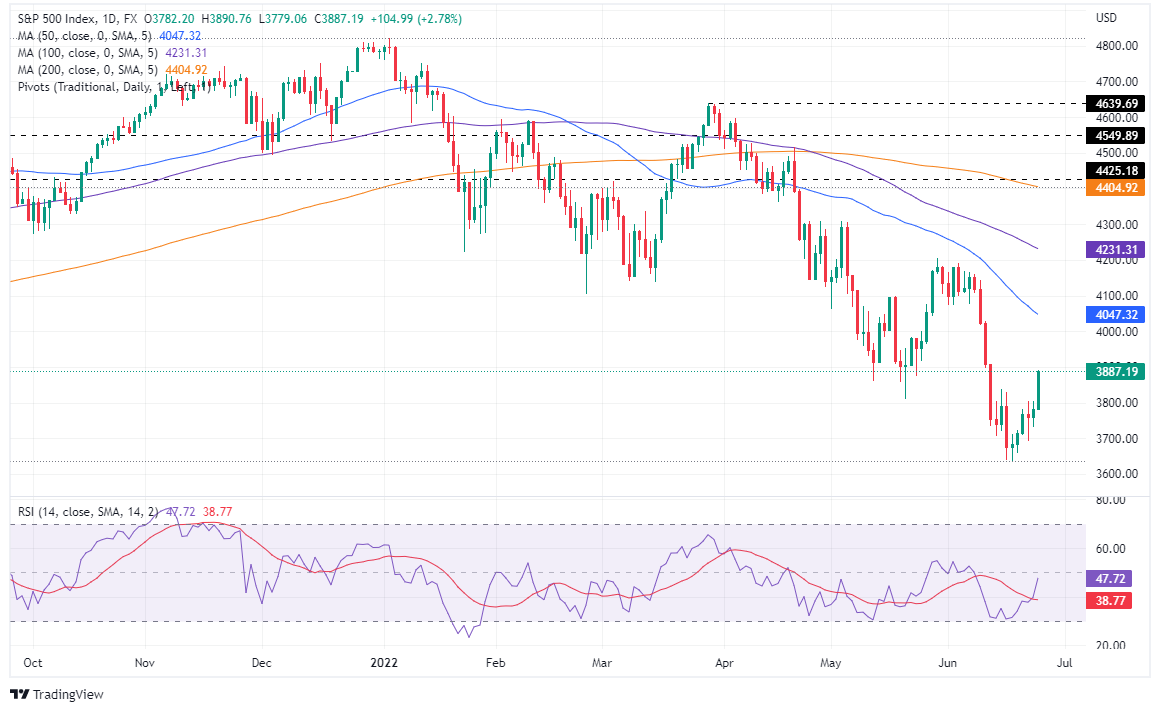
US equities are rising for the second consecutive day, and despite being in the mid-North American session, the major indices prepare to post solid gains in the week, within the 4% to 6% range.
The S&P 500 reclaimed the 3,800 mark around 3,887.19 and is up 2.74% in the day, while the heavy-tech index, the Nasdaq Composite, followed suit, gaining 2.36%, up at 11,498.82, followed by the Dow Jones Industrial (DJIA), climbing 2.15%, advancing to 31,330.63.
Sector-wise, the leading sectors are Financials, up by 3.43 %, followed by Communication Services and Materials, each recording gains of 3.16 % and 3.11%, respectively. The laggards but also up due to the increased risk appetite are Health, Consumer Staples, and Utilities, recording decent gains of 1.46%, 1.27%, and 0.92% each.
Equities jumped courtesy of investors repricing the Federal Reserve rate hike expectations. Fears of a US and global recessions loom due to Thursday’s EU, UK, and US S&P Global PMIs, all expanding but showing signs of slowing their pace. Given the previously mentioned, traders begin to price in “possible” rate cuts, which appears too early to be predicted, as the global economy settles on higher interest rates.
Later in the day, the University of Michigan Consumer Sentiment, on its June final reading, plunged towards 50, dismal reading but inflation expectations easied a relief for investors, which piled in on equities as we head into the weekend.
Further Fed speaking continued in the turn of the St. Louis Fed President James Bullard. He said that fears of a recession in the US are overblown and stated that the US will be fine and that tightening policy will slow down the economy to a trend pace of growth. He reiterated that the Federal funds rate (FFR) would need to move to 3.5% this year.
The US Dollar Index (DXY), a measurement of the greenback’s value against some currencies, lurks some 0.20% at 104.196, while the 10-year US Treasury yield recovers some ground climbing five basis points, yielding 3.123%.
In the commodities complex, the US crude oil benchmark, WTI, rises 2.22 %, exchanging hands at $106.81 BPD. Meanwhile, precious metals like gold (XAU/USD) drop 0.04%, trading at $1829.05 a troy ounce.
SP 500 Chart
Key Technical Levels
Brexit Tensions are increasing and may weigh on the British pound in coming months, warn analysts at Danske Bank. They also point out that relative interest rates have weighed on EUR/GBP for quite some time but not anymore.
Key Quotes:
“It is still worth keeping an eye on the EU-UK negotiations on the implementation of the Northern Ireland protocol. Tensions are increasing, which may weigh on GBP in coming months.”
“EUR/GBP has been trending higher lately. Looking forward, on one hand, the positive USD environment is usually benefitting GBP relative to EUR. On the other hand, relative rates now seem supportive for EUR relative to GBP. Overall, we keep our 12M EUR/GBP target unchanged at 0.84 despite we are likely to see some support to the cross near-term.”
“A hit to global risk sentiment usually weakens GBP but if the war turns worse and/or the West imposes tougher sanctions on Russia, we are likely to see EUR/GBP moving somewhat lower again. EUR/GBP will move higher if ECB turns more hawkish. EU-UK tensions remain a risk.”
The EUR/USD is about to end the week hovering around 1.0550, with a modest gain. Analysts at Rabobank continue to see the risk of a dip back to the year’s low at the 1.0350 region on a one to three-month view. They revised lower their 12-month forecast to 1.08 from 1.10.
Key Quotes:
“The move lower in US treasury yields this week suggests that the market focus is in the process of shifting to growth risks and away from inflation. This could take some time to play out and the tug of war between the two drivers could characterise market developments in the months ahead.”
“Insofar as a recession in the world’s largest economy is hardly an endorsement of risk appetite, we expect the USD to hold up relatively well into next year. In consideration of the USD’s safe haven characteristics, in addition to the considerable energy related risks that are faced by the Eurozone this winter, we have revised lower our 12 month forecast for EUR/USD in spite of the rise in rhetoric regarding US recessionary fears.”
- Loonie gains momentum on higher crude oil and as stocks rally.
- USD/CAD moves away from the 1.3000 area.
- Consolidation below 1.2900 to confirm bearish bias.
The USD/CAD broke to the downside during the American session as US stocks soar and as crude oil prices jump. The pair dropped to 1.2899, hitting the lowest level in a week.
There is no bad data for stocks
The decline in US Consumer Sentiment to the lowest on record did not weaken the rally Wall Street. The Dow Jones is rising by 2.12% and the Nasdaq by 2.14%. The improvement in market sentiment is also driving crude oil prices to the upside. The WTI barrel is at multi-day up almost 4%.
The combination of risk appetite, higher crude oil prices and a weaker dollar are pushing USD/CAD to the downside on Friday. On a wider perspective, analysts at MUFG Bank warn the loonie could be hurt more than other currencies by intensifying global growth fears and from negative spill-over risks from higher rates.
Testing 1.2900
On Thursday, USD/CAD was testing the critical resistance around 1.3000. It failed to break higher and pulled back. Currently, is it trading under the 1.2900, a relevant support. A consolidation below should open the doors for an extension of the move lower targeting initially 1.2860.
The bias points to the downside in the short-term and it would be reinforced with a break under 1.2580. The dollar needs to break above 1.3000 to strengthen.
Technical levels
- The USD/CAD snaps two straight weeks of gains and slumps 0.85% weekly.
- Higher oil prices and an upbeat sentiment coupled with a weaker USD propel the CAD up.
- Fed’s Bullard commented that fears of a US recession are overblown; expect the FFR to end at 3.5%.
The USD/CAD slides from daily highs around 1.3000, set to finish the week with losses, amidst an upbeat market mood as traders scaled back aggressive tightening by the US Federal Reserve. At the time of writing, the USD/CAD is trading at 1.2914.
A positive mood and higher oil prices underpin the CAD
Global equities are rising, depicting an upbeat mood on Friday. Recession fears surround the markets, though, despite the aforementioned, investors begin to assess “possible” first-rate cuts in 2023, appearing to be too soon to predict what will happen to the economy.
In the meantime, the USD/CAD is falling as investors reprice Fed’s interest rate hikes. Consequently, US Treasury yields dropped, so demand for the greenback descended. Besides that, higher US crude oil prices, with Western Texas Intermediate (WTI) snapping two days of losses, up by 3.68% at $108.14 BPD, boost the Loonie, a headwind for the USD/CAD.
The US Dollar Index (DXY), a measurement of the greenback’s value against some currencies, lurks some 0.24% at 104.149. Taking a glance at the DXY daily chart, the index is consolidating and forming an ascending triangle, threatening to lift the DXY higher.
In the meantime, Fed speaking continued, now taking the stand the St. Louis Fed President James Bullard. He said that fears of a recession in the US are overblown. Bullard stated that the US will be fine and that tightening policy will slow down the economy to a trend pace of growth. He reiterated that the Federal funds rate (FFR) would need to move to 3.5% this year.
On Wednesday, the Bank of Canada Senior Deputy Governor Carolyn Rogers said that May inflation data was an unwelcome number but not unexpected. When asked about 75 bps rate hikes, she commented that the decision would be made until July.
Data-wise, the Canadian calendar unveiled Average Weekly Earnings for April, which expanded by 4%, lower than the previous reading. On the US front, the economic docket featured the UoM Consumer Sentiment on its final reading for June, which plunged to 50.
USD/CAD Key Technical Levels
- UOM Consumer Sentiment Index dropped to a record low in June.
- The US Dollar Index stays on the back foot after this data.
The University of Michigan's Consumer Sentiment Index declined to 50 in June's final reading from 50.2 in the flash estimate. This marked the lowest print on record.
Further details of the survey revealed that the Current Conditions Index dropped to 53.8 in June from 63.3 in May and the Consumer Expectations Index fell to 47.5 from 55.2.
The five-year inflation expectations got revised lower to 3.1% from the preliminary estimate of 3.3%.
Market reaction
The greenback stays under pressure after this data and the US Dollar Index was last seen losing 0.3% on the day at 104.08.
- New Home Sales in the US rebounded sharply in May.
- Wall Street's main indexes continue to push higher after the data.
The data published by the US Census Bureau showed on Friday that New Home Sales in the US rose by 10.7% in May to 696,000 following April's contraction of 12% (revised from -16.6%).
"The median sales price of new houses sold in May 2022 was $449,000," the press release further read. "The average sales price was $511,400."
Market reaction
Risk flows continue to dominate the markets after this report. As of writing the Dow Jones Industrial Average and the S&P 500 indexes were up 1.9% and 2.2%, respectively.
- Silver dropped to a six-week low on Friday, confirming a bearish break below the $21.00 mark.
- Any meaningful recovery attempt could be seen as a selling opportunity and remain capped.
- The XAG/USD now seems vulnerable to weaken further below the $20.00 psychological mark.
Silver reversed a knee-jerk slide to a six-week low and was last seen trading with only modest intraday losses, around the $20.90-$20.85 region during the early North American session. That said, any meaningful recovery still seems elusive and attempted recovery runs the risk of fizzling out rather quickly.
Sustained break and acceptance below the $21.00 round-figure mark could be seen as a fresh trigger for bearish traders. Moreover, technical indicators on daily/4-hourly charts are holding deep in the negative territory and are still far from being in the oversold zone. This, in turn, supports prospects for further losses.
Hence, a subsequent slide back towards challenging the YTD low, around the $20.45 region set in May, looks like a distinct possibility. Some follow-through selling should pave the way for an extension of the downward trajectory and pave the way for a fall to the $20.00 psychological mark en-route the $19.35-$19.30 support.
On the flip side, momentum beyond the $21.00 mark is likely to confront resistance near the daily high, around the $21.15 region. Any further recovery might still be seen as a selling opportunity near the $21.50-$21.55 supply. This, in turn, should cap the XAG/USD near the $21.70 area, or the 200-period SMA on the 4-hour chart.
Silver 4-hour chart
-637916749278811313.png)
Key levels to watch
"Elevated level of UK inflation stems largely from the impact of external shocks, rather than excess money growth," Bank of England Chief Economist Huw Pill said on Friday, as reported by Reuters.
"Threat exists that higher headline inflation leads to second-round effects in prices, wages and costs," Pill added. "Current challenge for UK monetary policy is to contain those second-round effects and return inflation to the target."
Market reaction
These comments don't seem to be having a significant impact on the GBP/USD pair, which was last seen gaining 0.13% on the day at 1.2276.
- USD/TRY trades close to 2022 highs near 17.40.
- Türkiye Capacity Utilization dropped to 77.6%.
- Türkiye Manufacturing Confidence deteriorate in June.
The Turkish currency extends its march south for yet another session and keeps USD/TRY bid near the area of YTD peaks above 17.30 on Friday.
USD/TRY now focuses on inflation
USD/TRY navigates the third consecutive session with gains and trades in levels just shy of Thursday’s 2022 peak.
The lira continues to lose momentum despite the appetite for the riskier assets dominate the global sentiment at the end of the week and the greenback trades on the defensive across the board.
However, the unabated geopolitical concerns from the war in Ukraine and the rampant inflation continue to hurt the prospects around the currency ahead of the publication of the June inflation figures on July 4.
What to look for around TRY
USD/TRY keeps the underlying upside bias well and sound and now surpasses the 17.00 mark, an area last traded back in December 2021.
So far, price action in the Turkish currency is expected to gyrate around the performance of energy prices, the broad risk appetite trends, the Fed’s rate path and the developments from the war in Ukraine.
Extra risks facing TRY also come from the domestic backyard, as inflation gives no signs of abating, real interest rates remain entrenched in negative figures and the political pressure to keep the CBRT biased towards low interest rates remain omnipresent.
Key events in Türkiye this week: Consumer Confidence (Wednesday) - CBRT interest rate decision (Thursday) – Capacity Utilization, Manufacturing Confidence (Friday).
Eminent issues on the back boiler: FX intervention by the CBRT. Progress (or lack of it) of the government’s new scheme oriented to support the lira via protected time deposits. Constant government pressure on the CBRT vs. bank’s credibility/independence. Bouts of geopolitical concerns. Structural reforms. Upcoming Presidential/Parliamentary elections.
USD/TRY key levels
So far, the pair is gaining 0.21% at 17.3717 and faces the next up barrier at 17.3759 (2022 high June 23) seconded by 18.2582 (all-time high December 20) and then 19.00 (round level). On the flip side, a breach of 16.3136 (monthly low June 3) would aim to 16.1431 (low May 27) and finally 15.6684 (low May 23).
- GBP/USD gained some positive traction on Friday amid modest USD weakness.
- Dovish BoE expectations, Brexit woes acted as a headwind for the British pound.
- Aggressive Fed rate hike bets should help limit the USD losses and cap the upside.
The GBP/USD pair built on the previous day's bounce from the vicinity of the weekly low, around the 1.2170-1.2160 area and gained some positive traction on Friday. The pair maintained its bid tone through the early North American session, though seemed to struggle to capitalize on the move or find acceptance above the 1.2300 round-figure mark.
Some cross-driven strength stemming from the ongoing retracement slide in the EUR/GBP cross, from over a one-week high touched on Thursday, acted as a tailwind for the British pound. On the other hand, the risk-on impulse undermined the safe-haven US dollar, which, to a larger extent, helped offset dismal UK data and offered some support to the GBP/USD pair.
The UK Office for National Statistics reported this Friday that the headlines Retail Sales contracted by 0.5% MoM in May as against the 1.4% growth recorded in the previous month. The core retail sales, stripping the auto motor fuel also decelerated sharply and fell 0.7% MoM from the 1.4% in April, raising concerns over the British economic growth.
The incoming softer UK economic data further fueled recession fears and reaffirmed market bets that the Bank of England would opt for a more gradual approach toward raising interest rates. In contrast, the Federal Reserve is expected to stick to its aggressive policy tightening path and deliver another 75 bps rate hike at its next policy meeting in July.
Fed Chair Jerome Powell, during his second day of Congressional testimony on Thursday, reinforced bets and stressed an unconditional commitment to taming inflation, even amid risks to growth. This might limit the USD losses, which, along with the UK-EU impasse over the Northern Ireland Protocol of the Brexit agreement should cap gains for the GBP/USD pair.
Hence, it will be prudent to wait for strong follow-through buying beyond the weekly high, around the 1.2325 region, before positioning for any further appreciating move. Market participants now look forward to the US economic docket, featuring the release of the revised Michigan Consumer Sentiment Index and New Home Sales data, which might provide some impetus to the GBP/USD pair.
Technical levels to watch
- Gold struggled to capitalize on its attempted intraday bounce from over a one-week low.
- The risk-on impulse, rising US bond yields, hawkish Fed expectations acted as a headwind.
- Modest USD weakness could lend support to the metal and help limit any further losses.
Gold staged modest recovery from the $1,821 area, or over a one-week low touched this Friday, albeit struggled to capitalize on the move. The XAUUSD has now surrendered a major part of its intraday gains and was seen hovering near the lower end of the daily range during the early North American session.
A significant decline in commodity prices this week seems to have eased fears about the persistent rise in inflationary pressures and boosted investors' sentiment. This, in turn, triggered a strong rally in the equity markets, which was seen as a key factor that capped the upside for the safe-haven gold.
The risk-on impulse allowed the US Treasury bond yields to rebound from a nearly two-week low touched on Thursday. This, along with expectations that the Fed would retain its policy tightening path to curb soaring inflation, contribute to keeping a lid on any meaningful gains for the non-yielding gold.
Even from a technical perspective, repeated failures near the very important 200-day SMA favours the XAUUSD bears and supports prospects for further losses. That said, modest US dollar weakness could lend some support to the dollar-denominated commodity and hold back traders from placing bearish bets.
Market participants now look forward to the US economic docket, featuring the release of the revised Michigan Consumer Sentiment Index and New Home Sales data. This, along with the US bond yields, the USD price dynamics and the broader risk sentiment might provide a fresh trading impetus to gold prices.
Technical levels to watch
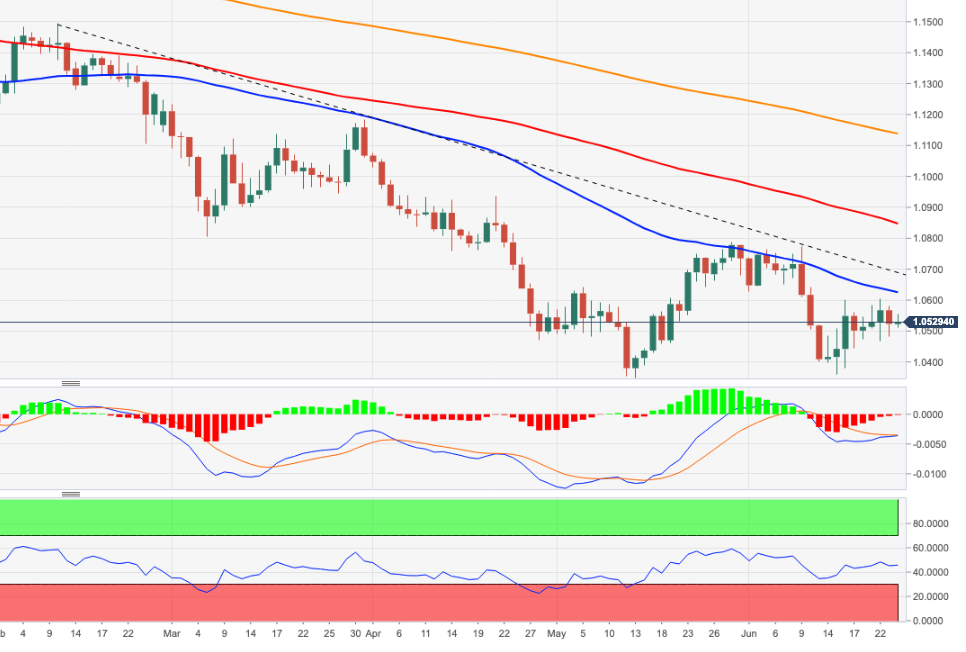
- EUR/USD keeps the erratic activity well in place this week.
- The 1.0670/80 band continues to cap the upside so far.
EUR/USD resumes the upside bias past the 1.0500 mark following Thursday’s decent pullback.
So far, and as long as the 4-month line in the 1.0670/80 band limits the upside, extra pullbacks in the pair should remain on the cards in the near term. The surpass of this area, however, could spark a bull run to the June top at 1.0773 and the May peak at 1.0786.
In the longer run, the pair’s bearish view is expected to prevail as long as it trades below the 200-day SMA at 1.1136.
EUR/USD daily chart
"We need to frontload rate hikes, get inflation under control in short order," St. Louis Federal Reserve Bank President James Bullard said on Friday, as reported by Reuters.
Bullard further argued that the market is fully pricing in the idea that the Fed will get rates to 3.5% by the end of the year and added that it is hard for them to interpret the inflation expectations surveys.
Market reaction
These comments don't seem to be having an impact on the greenback's performance against its rivals. As of writing, the US Dollar Index was little changed on the day at 104.35.
- USD/CHF turned lower for the fifth straight day and dropped back closer to the monthly low.
- The SNB’s surprise hawkish shift continued underpinning the CHF and exerted some pressure.
- A softer tone surrounding the USD was seen as another factor that added to the selling bias.
The USD/CHF pair struggled to capitalize on its modest intraday uptick and met with a fresh supply near the 0.9630-0.9635 region on the last day of the week. The downtick - marking the fifth successive day of a negative move - dragged spot prices to the 0.9565-0.9560 area, back closer to the monthly low during the mid-European session.
The Swiss National Bank (SNB) surprised markets with a 50 bps rate hike at the end of the June policy meeting last week and left the door open for further rate hikes to counter rising inflation. This, in turn, continued underpinning the Swiss franc, which, along with a softer tone surrounding the US dollar exerted some downward pressure on the USD/CHF pair.
The worsening global economic outlook forced market participants to bring forward the likely timing of rate cuts to counter a possible recession. It is worth recalling that the Fed has forecasted the rate to decline to 3.4% in 2024 and 2.5% over the long run from the 3.8% in 2023. The repricing in the market was seen as a key factor that undermined the USD.
Investors, however, seem convinced that the Fed would stick to its aggressive policy tightening path in the near term to curb soaring inflation. This, along with an uptick in the US bond yields, should act as a tailwind for the USD. Apart from this, the risk-on impulse might undermine the safe-haven CHF and further contribute to limiting the downside for the USD/CHF pair.
Hence, it will be prudent to wait for a convincing break below the 0.9550 horizontal support before traders start positioning for an extension of the recent sharp pullback from the vicinity of the YTD peak. Next on tap is the US economic docket, featuring the release of the revised Michigan Consumer Sentiment Index and New Home Sales data.
This, along with the US bond yields, will influence the USD price dynamics and provide some impetus to the USD/CHF pair. Traders will further take cues from the broader risk sentiment to grab some short-term opportunities on the last day of the week.
Technical levels to watch
European Central Bank (ECB) Vice President Luis de Guindos said on Friday that it was possible to see negative growth in the euro area in 2023, as reported by Reuters.
Regarding the inflation outlook, de Guindos noted that inflation could continue to rise in the coming months before starting to fall in the fourth quarter of the year.
Market reaction
EUR/USD pair edged lower after these comments and was last seen trading at 1.0515, where it was down 0.08% on a daily basis.
St. Louis Federal Reserve Bank President James Bullard said on Friday that he expects the Fed's rate hikes to slow the economy to the trend pace of growth, as reported by Reuters.
Additional takeaways
"Current models probably not a good indicator of recession risk."
"Households in a great position to spend going forward."
"No sign from households that we are in imminent stages of them pulling back meaningfully."
"Some components of GDP behaving strangely."
"Inventory adjustments have been very unusual."
"I am bullish on business investment."
"Unless we get hit by a big shock, unusual to go back into recession at this stage."
"Too early to have a debate about recession probability."
"Rates are still far from neutral."
"Frontloading rate hikes is a good idea in this situation."
"Means we can nip inflation in the bud before it becomes entrenched."
"I want to move up rates to 3.5% this year."
Market reaction
The US Dollar Index showed no immediate reaction to these comments and was last seen unchanged on the day at 104.38.
Reserve Bank of Australia Governor Philip Lowe said on Friday that he does not expect a recession in Australia but acknowledged that there is a narrow path back to low inflation, as reported by Reuters.
Earlier in the week, Lowe noted that they will discuss raising the policy rate by either 25 or 50 basis points at the next policy meeting.
Market reaction
The AUD/USD pair showed no immediate reaction to Lowe's comment and was last seen trading at 0.6905, where it was up 0.25% on a daily basis.
- A combination of factors assisted USD/JPY to attract some buying near the 134.35 area on Friday.
- The risk-on impulse, widening of the US-Japan yield differential weighed on the safe-haven JPY.
- The Fed-BoJ policy divergence suggests that the pullback from a 24-year high has run its course.
The USD/JPY pair attracted some buying near the 134.35 region on Friday and recovered over 85 pips from the daily low. Spot price climbed back above the 135.00 psychological mark during the mid-European session, though lacked any follow-through buying.
A significant decline in commodity prices this week seems to have eased fears about the persistent rise in inflationary pressures and boosted investors' sentiment. This, in turn, triggered a risk-on rally, which was evident from the strong rally across the global equity markets and dented demand for traditional safe-haven assets, including the Japanese yen.
A goodish recovery in the global risk sentiment allowed the US Treasury bond yields to rebound from nearly a two-week low touched on Thursday. This resulted in the widening of the gap between the US-Japanese bond yields, which, along with a big divergence in the monetary policy stance adopted by the Bank of Japan and the Fed further undermined the JPY.
It is worth recalling that the BoJ last week decided to maintain the massive stimulus programme and vowed to defend the 0.25% cap for the 10-year JGB yield to support a still-fragile economy. In contrast, the Fed remains on track to retain its policy tightening path and is expected to hike interest rates again by 75 bps in July to curb soaring inflation.
Fed Chair Jerome Powell, during his second day of Congressional testimony on Thursday, reaffirmed market bets and stressed an unconditional commitment to taming inflation, even amid risks to growth. This, in turn, favours the USD bulls, though speculations that any further depreciation of the JPY might force some form of practical intervention might cap the USD/JPY pair.
Market participants now look forward to a scheduled speech by St. Louis Fed President James Bullard. Traders will further take cues from the US economic data - the revised Michigan Consumer Sentiment Index and New Home Sales. This, along with the US bond yields, the USD price dynamics and the broader risk sentiment should provide some impetus to the USD/JPY pair.
Technical levels to watch
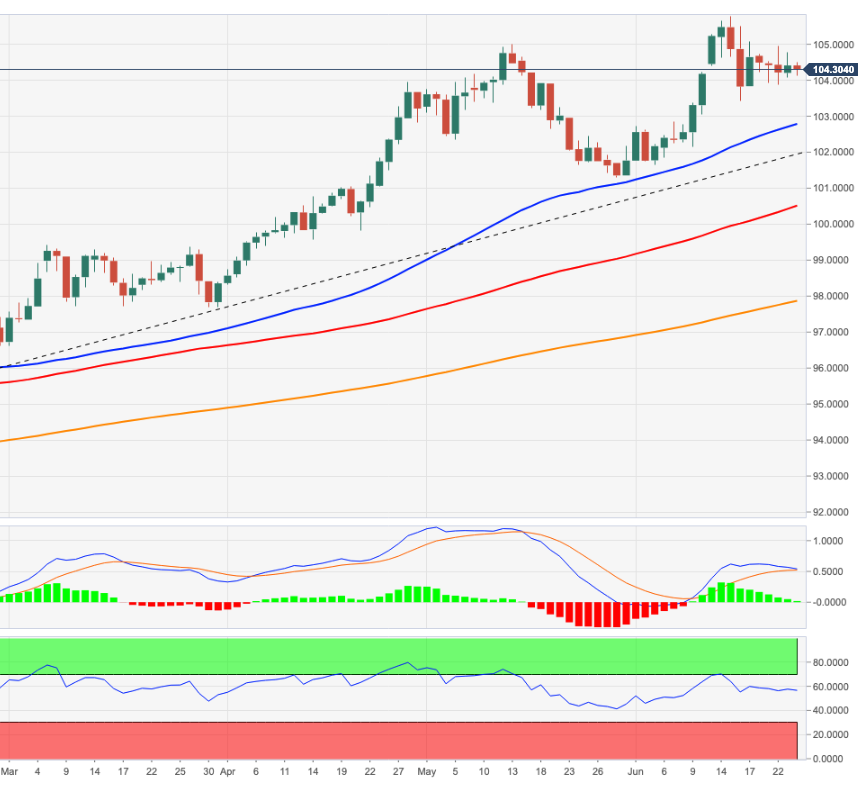
- DXY extends the consolidative phase above the 104.00 mark.
- The breakdown of this theme exposes 103.40.
DXY fades Thursday’s advance and trades with modest losses at the end of the week, always within the broad side-lined theme above 104.00.
Ideally, the index should surpass the weekly high near 105.00 (June 22) in the near term to allow for the recovery to gather momentum and attempt a visit to the nearly 20-year peak in the 105.80 zone (June 15). On the flip side, a breach of the lower bound of the range carries the potential to force the index to challenge the weekly low at 103.42 (June 16).
As long as the 4-month line above 102.00 holds the downside, the near-term outlook for the index should remain constructive.
Looking at the longer run, the outlook for the dollar is seen bullish while above the 200-day SMA at 97.85.
DXY daily chart
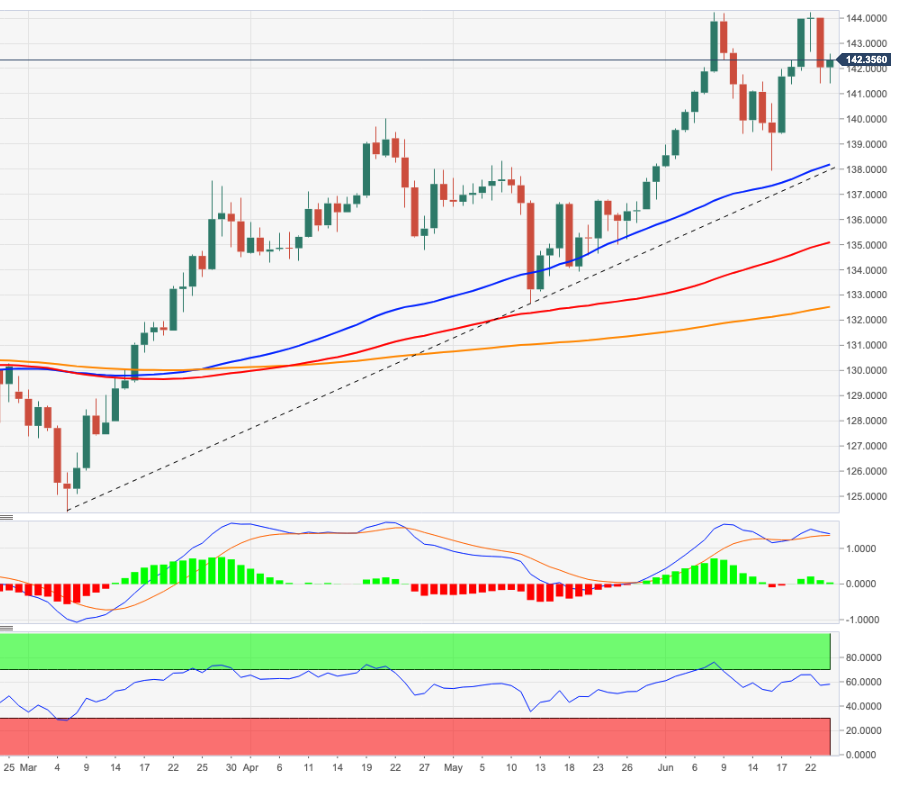
- EUR/JPY rebounds after two consecutive daily retracements.
- Next on the upside comes the 2022 peak past 144.00.
EUR/JPY regains the 142.00 mark and beyond and at the same time leaves behind two straight sessions with losses on Friday.
The bullish bias in the cross remains well and sound and the continuation of the recovery could revisit the 2022 high at 144.25 (June 8) sooner rather than later.
The surpass of the latter could pave the way for a move to the 2015 high at 145.32 (January 2) prior to the 2014 high at 149.78 (December 8).
In the meantime, while above the 3-month support line around 138.15, the short-term outlook for the cross should stay bullish. This area appears reinforced by the proximity of the 55-day SMA.
EUR/JPY daily chart
- AUD/USD regained positive traction on Friday and climbed back above the 0.6900 mark.
- The risk-on impulse prompted some USD selling and benefitted the risk-sensitive aussie.
- Fed rate hike bets, growing recession fears could limit the USD losses and cap the major.
The AUD/USD pair attracted some buying on the last day of the week and moved further away from over a one-week-low touched on Thursday. The pair maintained its bid tone through the mid-European session and was last seen hovering near the top end of its daily range, around the 0.6915 region.
A significant decline in commodity prices this week seems to have eased fears about the persistent rise in inflationary pressures and boosted investors' sentiment. This was evident from the risk-on impulse across the global equity markets, which, in turn, prompted some selling around the safe-haven US dollar and benefitted the risk-sensitive aussie.
That said, the worsening global economic outlook could keep a lid on any optimistic move in the markets. Investors remained sceptical that major central banks would be able to hike interest rates to curb soaring inflation without affecting the growth. The fears were further fueled by Thursday's disappointing release of the Eurozone PMI prints for June.
Apart from this, expectations that the Fed would retain its policy tightening path and deliver another 75 bps rate hike in July should act as a tailwind for the USD. Fed Chair Jerome Powell, in his second day of Congressional testimony on Thursday, reaffirmed market bets and stressed an unconditional commitment to taming inflation, even amid risks to growth.
The fundamental backdrop makes it prudent to wait for strong follow-through buying before confirming that the AUD/USD pair has formed a near-term bottom and positioning for any further gains. Market participants now look forward to a scheduled speech by St. Louis Fed President James Bullard, which along with second-tier US macro data, might influence the USD.
Friday's US economic docket features the release of the revised Michigan Consumer Sentiment Index and New Home Sales data. Traders will further take cues from the broader market risk sentiment to grab short-term opportunities around the AUD/USD pair.
Technical levels to watch
European Central Bank (ECB) Governing Council member Mario Centeno said on Friday that the ECB's new instrument will show their determination to battle against fragmentation, as reported by Reuters.
Centeno further explained that they don't have a goal regarding specific yield spread values in the anti-fragmentation tool.
Market reaction
These comments don't seem to be having a significant impact on the shared currency's performance against its major rivals. As of writing, the EUR/USD pair was trading at 1.0544, where it was up 0.2% on a daily basis.
Senior Economist at UOB Group Alvin Liew reviews the latest inflation figures in Singapore.
Key Takeaways
“Singapore’s headline CPI rose slightly faster than expected, at 1.0% m/m, 5.6% y/y in May (from 0.1% m/m, 5.4% y/y in Apr). Core inflation (which excludes accommodation and private road transport) also rose at a faster clip, up by 3.6% y/y in May (from 3.3% y/y in Apr).”
“The sources of price pressures for core inflation in May were broad-based, ranging from food, to services, to retail & other goods, including clothing & footwear, personal effects and personal care products, to electricity & gas. As for the headline CPI inflation, other than upside to the core CPI, both the accommodation costs and private transport costs were the key drivers of overall price increases.”
“External inflation pressures continue to be driven by the on-going Russia-Ukraine conflict which in turn, impacts commodity prices, especially energy and food. Supply-demand mismatches, as well as disruptions to global transportation and regional supply chains, add further upside to prices. Domestically, the tight labour market situation resulting in upside wage pressures also bears watching as it feeds into higher services cost.”
“We now expect headline inflation to average 5.0% (up from previous forecast of 4.5%) and core inflation at 4.0% (up from previous forecast of 3.5%) in 2022. This is in line with the official outlook for headline CPI (4.5 – 5.5%) but exceeds the official core inflation forecast range (2.5% - 3.5%), and the risks are tilted to the upside. Even as Singapore’s central bank, MAS, kept its core inflation forecast range unchanged, it highlighted in the report that improving demand and a greater passthrough of accumulating business costs to consumer prices will keep ‘core inflation significantly above its historical average through the year.’”
“We expect MAS to further steepen the S$NEER gradient at the Oct 2022 monetary policy meeting to 2% (from the currently estimated 1.5%), while leaving the width of the band and the level at which it is centred unchanged. But the risk of another double-tightening or a steeper slope or perhaps, most importantly, another off-cycle tightening (ahead of Oct) cannot be ruled out especially if core inflation accelerates well above 4% in the next few months.”
- GBP/USD bulls are fighting the bearish odds, re-attempting the upside.
- UK political jitters, mixed Retail Sales data could remain a drag on cable.
- Cable bulls struggle to yield a break above the key 1.2275 hurdle.
GBP/USD is moving back and forth in a 40-pips narrow range so far this Friday, now attempting another bounce towards 1.2300.
The renewed upside in the major is fuelled by a bout of weakness seen in the US dollar across its main peers, as risk sentiment receives a fresh boost. Easing rate hike expectations from the ECB and BOE amid increasing recession risks is helping calm the market nerves.
Bulls, however, could face a hard time extending the latest uptick, as the UK political jitters remain in play. A senior Tory party member resigned after the ruling Conservative Party lost two crucial seats in the parliamentary by-elections on Friday. The latest news put PM Johnson’s leadership in jeopardy, which could undermine the sterling’s upswing.
Further, the UK Retail Sales for May came in mixed, earlier on, with the previous figures revised downwards. The discouraging fundamentals point to the BOE’s dilemma of fighting inflation while balancing the economic growth. UK Retail Sales drop 0.5% MoM in May vs. -0.7% expected
Attention now turns towards the two-tier data from the US for fresh trading impetus, as risk sentiment is likely to lead the way into the weekly close.
Looking at cable’s four-hour chart, the latest uptick in the price has taken out the falling trendline resistance at 1.2275. Should bulls manage to hold above the latter on a four-hourly candlestick closing basis, a test of the bearish 100-Simple Moving Average (SMA) at 1.2336 will be inevitable.
Ahead of that, the 1.2300 round figure will offer stiff resistance to GBP buyers. The Relative Strength Index (RSI) is pointing higher above the midline, allowing room for more upside.
GBP/USD: Four-hour chart
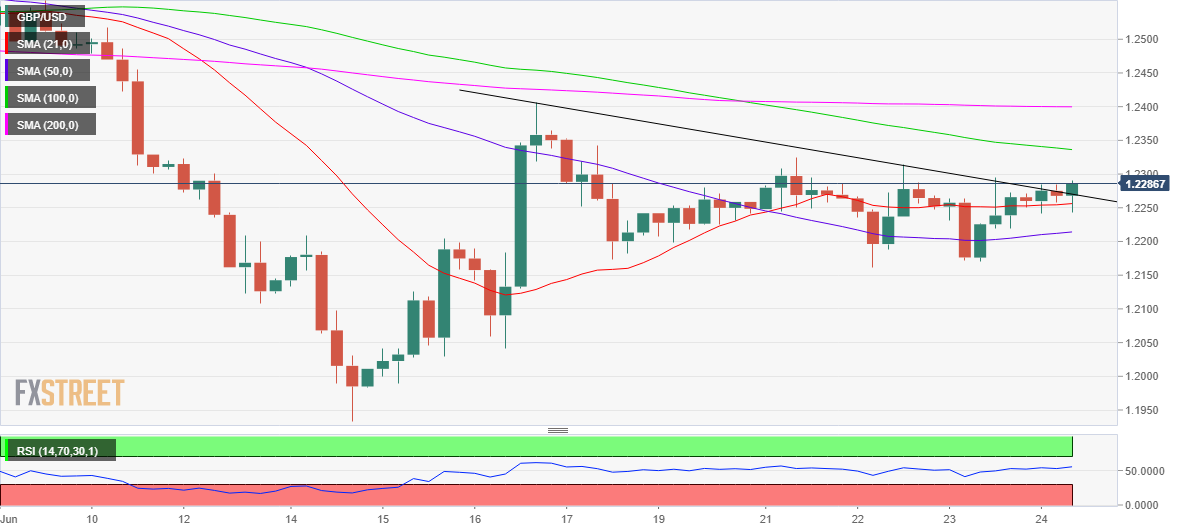
On the flip side, the immediate support is now seen at the 21 SMA at 1.2256, below which a sharp drop towards the mildly bullish 50 SMA at 1.2214 will be in the offing.
The next stop for sellers will be seen at the 1.2200 demand area on increased downside pressure.
GBP/USD: Additional technical levels
- EUR/USD extends the rebound to the 1.0550 region.
- The German Business Climate eased a tad in June.
- ECB’s Fernandez-Bollo, de Guindos next on tap.
The single currency regains the smile and lifts EUR/USD to the area of daily highs near 1.0550 on Friday.
EUR/USD up on dollar weakness, risk-on mood
EUR/USD quickly forgot about Thursday’s pullback and resumed the upside at the end of the week on the back of the renewed offered stance in the greenback and the tepid recovery attempt in yields in both the US and German money markets.
In the meantime, investors seem to have left behind Powell’s testimonies and continue to closely follow news surrounding the start of the hiking cycle by the ECB as well as any details regarding the bank’s plans to fight fragmentation.
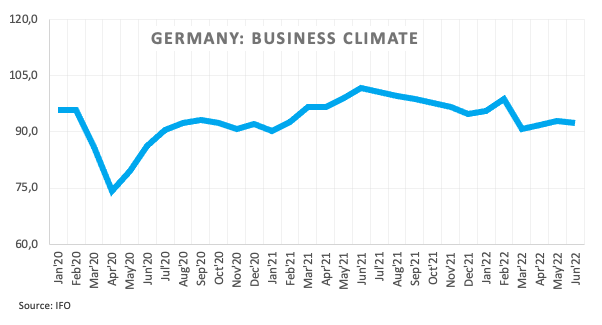
In the domestic calendar, the German Business Climate tracked by the IFO institute missed estimates and deteriorated a tad to 92.3 in June (from 93.0) in what was the sole release in the euro area on Friday. Later in the session, ECB Board members P.Fernandez-Bollo and L. de Guindos are also due to speak.
In the US, the final Consumer Sentiment for the current month will grab all the attention seconded by May’s New Home Sales.
What to look for around EUR
EUR/USD regains composure and advances further north of the 1.0500 mark amidst the mild improvement in the risk appetite trend in a week marked by broad-based choppy trading.
In the meantime, the single currency continues to closely follow any developments surrounding the ECB and its plans to design a de-fragmentation tool in light of the upcoming start of the hiking cycle.
However, EUR/USD is still far away from exiting the woods and it is expected to remain at the mercy of dollar dynamics, geopolitical concerns and the Fed-ECB divergence, while higher German yields, persistent elevated inflation in the euro area and a decent pace of the economic recovery in the region are also supportive of an improvement in the mood around the euro.
Key events in the euro area this week: Germany IFO Business Climate (Friday).
Eminent issues on the back boiler: Fragmentation risks. Kickstart of the ECB hiking cycle in July? Asymmetric economic recovery post-pandemic in the euro bloc. Impact of the war in Ukraine on the region’s growth prospects.
EUR/USD levels to watch
So far, spot is gaining 0.25% at 1.0543 and a breakout of 1.0605 (weekly high June 22) would target 1.0623 (55-day SMA) en route to 1.0786 (monthly high May 30). On the other hand, the next support emerges at 1.0358 (monthly low June 15) followed by 1.0348 (2022 low May 13) and finally 1.0300 (psychological level).
- Gold Price rebounds from six-day lows but buyers remain wary.
- Upbeat mood keeps USD bears in control despite a pause in the yields sell-off.
- Central banks' rate hike bets cool off amid looming recession risks.
The R-word is back on the radars, prompting markets to scale back aggressive rate hike expectations from major central banks worldwide. Cooling hawkish expectations is helping calm investors’ nerves, weighing negatively on the safe-haven US dollar at the expense of gold price. However, stabilizing US Treasury yields, following the recent retreat, are keeping the further upside elusive in the bright metal. The market’s perception of risk sentiment, in the facing of lingering inflation and recession worries will continue to drive the US dollar price action, in turn, influencing XAUUSD. Attention now turns towards next Monday’s US Durable Goods data and the ECB Forum in Sintra, where the central banks’ heads are likely to participate in a panel discussion on the monetary policy.
Also read: Gold Price Forecast: XAUUSD looks set to test $1,800 after symmetrical triangle breakdown
Gold Price: Key levels to watch
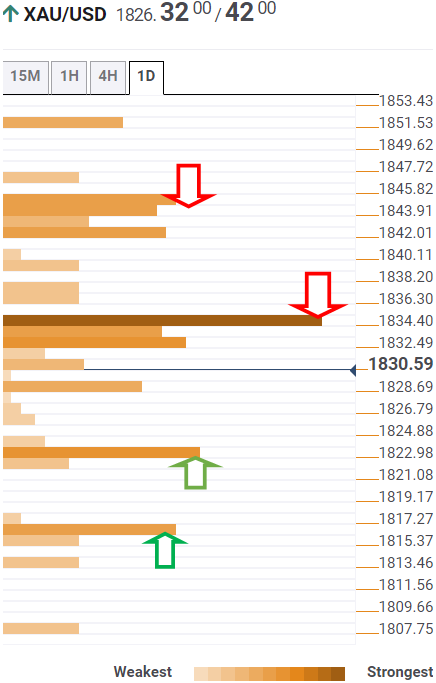
The Technical Confluence Detector shows that Gold Price is retreating after running into strong offers at $1,831, which is the intersection of the Fibonacci 38.2% one-day, SMA200 one-hour and the previous high four-hour.
The yellow metal is retracing further towards the previous day’s low of $1,823, where the Fibonacci 23.6% one-week coincides.
A breach of the latter will trigger a sharp drop for a test of the confluence of the Fibonacci 23.6% one-month and pivot point one-day S1 at $1,816.
The Bollinger Band one-day Lower at $1,812 will be the line in the sand for gold optimists.
On the flip side, acceptance above the aforesaid resistance at $1,831 will challenge the powerful barrier at $1,835. At that level, the SMA5 one-day, Fibonacci 38.2% one-week, one-month and one-day converge.
The Fibonacci 61.8% one-day at $1,838 will test the bearish commitments on the additional upside. A dense cluster of strong resistance levels around $1,843 will be the level to beat for XAU bulls. That level comprises the SMA200 one-day, SMA100 four-hour and the Bollinger Band one-day Middle.
Here is how it looks on the tool
About Technical Confluences Detector
The TCD (Technical Confluences Detector) is a tool to locate and point out those price levels where there is a congestion of indicators, moving averages, Fibonacci levels, Pivot Points, etc. If you are a short-term trader, you will find entry points for counter-trend strategies and hunt a few points at a time. If you are a medium-to-long-term trader, this tool will allow you to know in advance the price levels where a medium-to-long-term trend may stop and rest, where to unwind positions, or where to increase your position size.
FX Strategists at UOB Group Lee Sue Ann and Quek Ser Leang still favour the continuation of the consolidative mood in USD/CNH in the next weeks.
Key Quotes
24-hour view: “Yesterday, we highlighted that ‘the pullback amidst overbought conditions suggest that USD is unlikely to advance further’ and we expected USD to ‘trade between 6.6900 and 6.7300’. USD subsequently traded within a narrower range than expected (6.6949/6.7134). The underlying tone has softened and the bias for today is tilted to the downside. That said, any weakness is likely limited to a test of 6.6800. The major support at 6.6600 is not expected to come under threat. Resistance is at 6.7090 followed by 6.7190.”
Next 1-3 weeks: “On Monday (20 Jun, spot at 6.7080) we highlighted that USD is likely to trade between 6.6600 and 6.7400. There is no change in our view for now.”
Following the release of the German IFO Business Survey, the institute’s Economist Klaus Wohlrabe said that “the worry lines in the German economy are getting bigger.”
Additional quotes
Index has fallen significantly in industry and retail.
Expectations are more pessimistic.
Despite increased uncertainty, there are no signs of a recession at the moment.
Threat of gas shortages has increased companies' uncertainty.
Bottlenecks in industry have improved slightly, also in retail.
Price expectations have fallen slightly, but every second company plans hikes in next three months.
Export expectations have fallen slightly.
Mood at service providers, especially hospitality, has improved significantly.
- German IFO Business Climate Index came in at 92.3 in June.
- IFO Current Economic Assessment eased to 99.3 this month.
- June German IFO Expectations Index arrived at 85.8
The headline German IFO Business Climate Index dropped sharply to 92.3 in June versus last month's 93.0 and the consensus estimates of 92.9.
Meanwhile, the Current Economic Assessment eased to 99.3 points in the reported month as compared to May's 99.5 and 99.1 anticipated.
The IFO Expectations Index – indicating firms’ projections for the next six months, unexpectedly fell to 85.8 in June from the previous month’s 86.9 reading and the market forecast of 87.4.
Market reaction
EUR/USD remains little affected by the mixed German IFO survey. At the time of writing, the pair is trading at 1.0530, modestly flat on the day.
About German IFO
The headline IFO business climate index was rebased and recalibrated in April after the IFO research Institute changed series from the base year of 2000 to the base year of 2005 as of May 2011 and then changed series to include services as of April 2018. The survey now includes 9,000 monthly survey responses from firms in the manufacturing, service sector, trade and construction.
Here is what you need to know on Friday, June 24:
Major currency pairs fluctuated in relatively tight ranges throughout the week as investors tried to figure out how central banks will continue to battle inflation in face of heightened recession risks. The European economic docket will feature the IFO business sentiment data for Germany on Friday. In the second half of the day, the University of Michigan will release the final revision to the June Consumer Sentiment Index and the US Census Bureau will publish the May New Home Sales data. Investors will keep a close eye on comments from central bank speakers ahead of the weekend.
The US Dollar Index moves sideways above 104.00 and the 10-year US Treasury bond yield holds above 3% after having declined in the previous two days. US stock index futures are up between 0.4% and 0.7%, pointing to a slightly upbeat market mood.
While testifying before the House Financial Services Committee, FOMC Chairman Jerome Powell reiterated that they have an "unconditional commitment" to fighting inflation. "We are trying to moderate demand so inflation can come down," Powell added but further noted he was still expecting growth this year to be fairly strong. Meanwhile, Federal Reserve Governor Michelle Bowman said on Thursday another 75 basis points (bps) rate increase in July and at least 50 bps of hikes at the next few meetings would be appropriate.
EUR/USD erased Wednesday's gains on Thursday but didn't have a difficult time holding above 1.0500. "If monetary policy falls behind the curve, even stronger hikes in interest rates could become necessary to get inflation under control," European Central Bank (ECB) Governing Council member Joachim Nagel said on Wednesday.
GBP/USD closed the second straight day virtually unchanged on Thursday and extended its sideways grind below 1.2300 early Friday. The UK’s ruling Conservative Party lost by-elections, with the loss of two Tory seats after ballots were cast in Wakefield, Tiverton and Honiton. In the meantime, the UK's Office for National Statistics revealed that Retail Sales declined by 0.5% on a monthly basis in May, compared to the market expectation for a contraction of 0.7%.
USD/JPY continued to push lower after having closed below 135.00 on Thursday. The data from Japan showed that the National Consumer Price Index stayed unchanged at 2.5% on a yearly basis in May, falling short of analysts' estimate of 2.9%. Commenting on the data, “we should pay sufficient attention to possible impact from inflations on consumer sentiment and corporate activities," Japan’s Deputy Chief Cabinet Secretary Seiji Kihara said.
Gold closed deep in negative territory on Thursday and seems to have gone into a consolidation phase above $1,820 in the European morning.
Bitcoin managed to post recovery gains on Thursday but failed to gather further bullish momentum. BTC/USD was last seen losing more than 1% on the day at $20,780. Ethereum trades in a narrow range near $1,100 early Friday.
- A combination of factors prompted fresh selling around USD/CAD on Friday.
- The risk-on impulse weighed the safe-haven USD and exerted some pressure.
- An uptick in oil prices underpinned the loonie and added to the selling bias.
The USD/CAD pair extended the overnight late pullback from the 1.3015 region and witnessed some follow-through selling on Friday. The pair remained on the defensive through the early European session and was last seen trading near the daily low, around the 1.2980-1.2975 area.
A turnaround in the global risk sentiment - as depicted by a generally positive tone around the equity markets - prompted some selling around the safe-haven US dollar. Apart from this, a modest uptick in crude oil prices underpinned the commodity-linked loonie and exerted downward pressure on the USD/CAD pair.
The Canadian dollar drew additional support from stronger domestic consumer inflation figures released on Wednesday, which lifted bets for a 75 bps rate hike move by the Bank of Canada in July. That said, hawkish Fed expectations should continue to lend support to the greenback and limit losses for the USD/CAD pair.
The markets seem convinced that the Fed would stick to its aggressive policy tightening path and hike interest rates by 75 bps in July to curb soaring inflation. This, in turn, warrants some caution for aggressive bearish traders before traders start positioning for any further depreciating move for the USD/CAD pair.
Market participants now look forward to a scheduled speech by St. Louis Fed President James Bullard, which along with the release of the revised Michigan Consumer Sentiment Index and New Home Sales data might influence the USD. Apart from this, oil price dynamics might provide some impetus to the USD/CAD pair.
Technical levels to watch
- GBP/JPY traders remain bearish for the third consecutive day.
- UK Retail Sales marked disappointment for May even as MoM numbers dropped less than expected.
- Fortnight-old horizontal hurdle restricts immediate upside, 50-SMA lures bears.
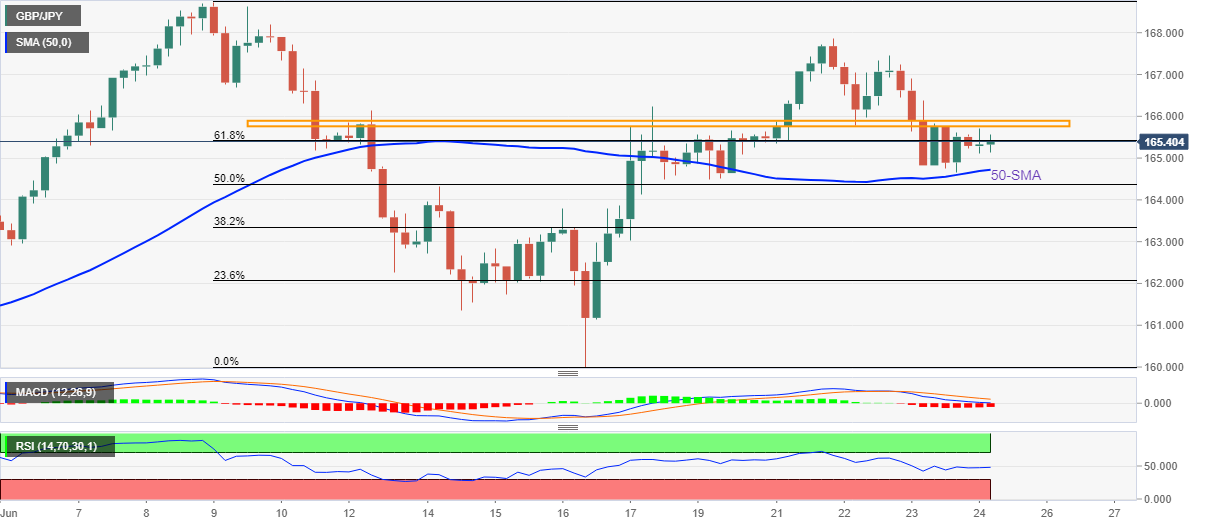
GBP/JPY seesaws around 165.40 during the initial hour of Friday’s London open. In doing so, the cross-currency pair stays on the bear’s radar for the third consecutive day as the UK Retail Sales failed to impress GBP buyers. However, firmer yields seem to probe the pair sellers of late.
That said, UK Retail Sales improved from -0.7% expectations to -0.5% MoM, versus downwardly revised 0.4% prior. However, the slump in the yearly figures, to -4.7% from -5.7% previous readings and -4.5% forecast, seems to favor the GBP/JPY sellers of late.
Technically, the quote’s sustained trading below a two-week-long horizontal resistance joins bearish MACD signals to hint at the further downside.
Though, the 50-SMA level surrounding 164.70 puts a floor under the GBP/JPY prices.
Also challenging the pair sellers is the mid-June swing high near 163.80 and the 23.6% Fibonacci retracement of June 09-16 downside, around 162.00.
On the contrary, recovery moves beyond the aforementioned horizontal resistance, surrounding 165.75-90, needs validation from 167.40 and 167.85 before challenging the monthly peak of 168.73.
It’s worth observing that the GBP/JPY pair’s successful trading above 168.73 won’t hesitate to conquer the 170.00 round figures.
GBP/JPY: Four-hour chart
Trend: Further weakness expected
Bank of Japan (BOJ) will stick with monetary easing to support the economy, the central bank Deputy Governor Masayoshi Amamiya said on Friday.
Additional comments
Japan's economy picking up as a trend.
Uncertainty regarding Japan’s economy extremely high.
BOJ must closely watch impact of financial, forex market moves on Japan’s economy, prices.
BOJ will achieve price target in sustained, stable manner accompanied by wage rises.
Japan's financial system remains stable as a whole.
Japan's short-term funding stable as a whole.
Recent rises in raw material, energy prices could affect financial institutions' credit costs via corporate funding.
Market reaction
USD/JPY is off the lows, currently trading at 134.67, down 0.17% on the day.
- DXY gives away part of Thursday’s gains around 104.20.
- US yields attempts a lacklustre rebound early on Friday.
- The final U-Mich Index, New Home Sales are due later.
The US Dollar Index (DXY), which tracks the greenback vs. a bundle of its main competitors, returns to the negative ground in the 104.20 region at the end of the week.
US Dollar Index looks weak on risk appetite, focuses on data
The index extends the choppy performance so far this week and moves in a consolidative theme, with losses somewhat contained by the 104.00 region for the time being.
The better tone in the risk appetite trends weighs on the buck so far in the European morning, while the US cash markets show some respite in the recent downtrend in US yields.
Market participants, in the meantime, seem to have digested both testimonies by Chair Powell before the Senate and the House of Representatives on Wednesday and Thursday, respectively. Powell’s message somehow reiterated the FOMC’s statement of the June meeting, placing the pledge to bring down inflation in the centre of the debate and not ruling out even a 100 bps rate hike in future meetings.
Powell’s colleague at the FOMC, M.Bowman, favoured on Thursday another 75 bps rate hike in July and 50 bps hikes at the subsequent meetings for the remainder of the year.
Speaking about rate hikes, the probability of a 75 bps raise at the July meeting is now at more than 93% according to CME Group’s FedWatch Tool, and around 60% when it comes to a 50 bps hike at the September 21 event.
Later in the NA session, the final Consumer Sentiment gauge is due along with New Home Sales for the month of May.
What to look for around USD
The index seems to have embarked on a consolidation theme with the upper end limited around 105.00 for the time being.
The dollar, in the meantime, remains well supported by the Fed’s divergence vs. most of its G10 peers (especially the ECB) in combination with bouts of geopolitical effervescence, higher US yields and a potential “hard landing” of the US economy, all factors supportive of a stronger dollar in the next months.
Key events in the US this week: Final June Consumer Sentiment, New Home Sales (Friday).
Eminent issues on the back boiler: Hard, soft, softish landing of the US economy. Escalating geopolitical effervescence vs. Russia and China. Fed’s more aggressive rate path this year and 2023. US-China trade conflict. Future of Biden’s Build Back Better plan.
US Dollar Index relevant levels
Now, the index is losing 0.14% at 104.25 and faces the next contention at 103.41 (weekly low June 16) seconded by 102.78 (55-day SMA) and finally 101.29 (monthly low May 30). On the other hand, a break above 104.94 (weekly high June 22) would expose 105.78 (2022 high June 15) and then 107.31 (monthly high December 2002).
FX option expiries for June 24 NY cut at 10:00 Eastern Time, via DTCC, can be found below.
- EUR/USD: EUR amounts
- 1.0400 670m
- 1.0420-30 674m
- 1.0450 574m
- 1.0495-00 1.15b
- 1.0520-30 365m
- 1.0575 275m
- 1.0600 483m
- 10660 560m
- USD/CHF: USD amounts
- 0.9600 240m
- 0.9700 540m
- AUD/USD: AUD amounts
- 0.6900 923m
- 0.6980 229m
- 0.7000 290m
- USD/CAD: USD amounts
- 1.2850 390m
- 1.2900 230m
- 1.2950 400m
Further corrective downside could drag USD/JPY to the 133.50 region in the short-term horizon, commented FX Strategists at UOB Group Lee Sue Ann and Quek Ser Leang.
Key Quotes
24-hour view: “The sharp sell-off that sent USD plunging to a low of 134.25 came as a surprise (we were expecting sideway-trading). While the rapid drop appears to be running ahead of itself, the downside risk is still intact. That said, any weakness is unlikely to break 134.00. On the upside, a breach of 135.65 (minor resistance is at 135.30) would indicate that the current downward pressure has eased.”
Next 1-3 weeks: “The USD strength that started earlier this week ended quickly as the sharp pullback yesterday took out our ‘strong support’ level at 135.00 (low has been 134.25). The rapid pullback has scope to extend to 133.50. Overall, only a break of the ‘strong resistance’ level, currently at 136.00 would indicate that the pullback is not ready to extend lower.”
- GBP/USD takes offers to justify downbeat UK Retail Sales data for May.
- UK Retail Sales shrank more-than-expected on YoY but improved on MoM.
- Conservatives Chairman Oliver Dowden resigns after a humiliating defeat in UK by-elections.
- USD pullback tests bears but recession woes, BOE-linked disappointment keep bears hopeful.
GBP/USD slips 20-pips to refresh intraday low around 1.2259, near 1.2270 by the press time, as the UK Retail Sales continued raising concerns over the British economic growth. In addition to the British data, the Conservative Party’s defeat in the UK by-elections also weighs on the Cable pair.
UK Retail Sales improved from -0.7% expectations to -0.5% MoM, versus downwardly revised 0.4% prior. However, the slump in the yearly figures, to -4.7% from -5.7% previous readings and -4.5% forecast, seems to weigh on the GBP/USD prices of late.
On the previous day, the UK S&P Global PMIs also raised concerns over the British economic growth, as well as pushed the Bank of England (BOE) towards aggressive rate hikes. That said, UK’s S&P Global/CIPS Manufacturing Purchasing Managers’ Index (PMI) dropped to 53.4 in June, versus 53.7 expected and May’s final reading of 54.6. The Services PMI reprints the previous month’s final reading of 53.4 while staying below 53.0 forecasts.
It should be noted that UK PM Boris Johnson’s defeat in previously safe seats for the Conservatives Party during the by-elections also exerts downside pressure on the GBP/USD pair. Liberal Democrats Party won the Tiverton and Honiton seats while Labour Party won in Wakefield. Following the results, the Conservative Party Chairman Oliver Dowden resigned.
Elsewhere, the US dollar fails to cheer the corrective pullback in the Treasury yields amid broad fears of economic slowdown and faster rate hikes, not to forget more supply-chain woes. The US Dollar Index (DXY) drops 0.15% intraday to 104.25 at the latest. Further, US 10-year Treasury yields rebound from a two-week low, flashed the previous day, as traders await more clues to confirm the economic slowdown. Even so, the bond coupons brace for the first weekly loss in four while reversing from the highest levels since 2011, at 3.09% by the press time.
Having witnessed a downbeat reaction to the UK data, GBP/USD traders should pay attention to the risk catalysts for fresh impulse. As a result, BOE Chief Economist and Executive Director Huw Pill’s comments will be closely watched for clear directions.
Technical analysis
Despite the latest rebound, the 100-SMA could test the bulls around 1.2345. However, a six-week-old horizontal support area, around 1.2170-60, appears crucial support to restrict the Cable pair’s short-term downside.
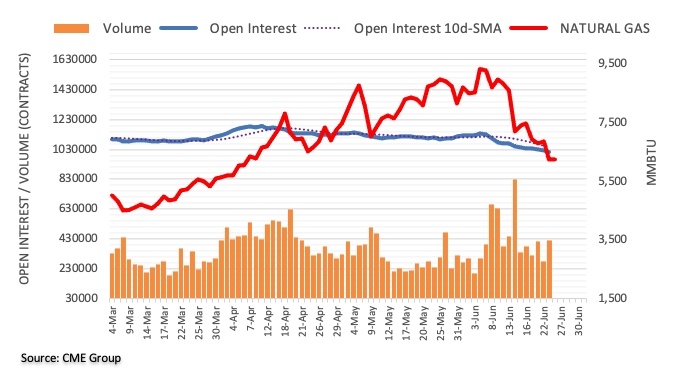
Considering preliminary readings from CME Group for natural gas futures markets, open interest extended the downtrend on Thursday, this time by around 11.3K contracts. Volume, on the other hand, remained erratic and increased by around 145.3K contracts.
Natural Gas seems ready for a bounce
Prices of natural gas lost further ground on Thursday and dropped to 2-month lows in the vicinity of $6.20 mar per MMBtu. The commodity thus remains well on track to close its second consecutive week with losses. The downtick was amidst shrinking open interest and hinted at the idea that further decline looks out of favour for the time being. Reinforcing this, natural gas currently flirts with the oversold territory, as per the daily RSI.
- A decent performance from US Banks on their fundamental aspect has strengthened the global equities.
- Stability in Japan’s inflation has supported the respective indices.
- The DXY is expected to remain sideways amid a light economic calendar
Markets in the Asian domain have extended their recovery on Friday as sound financials of the US banks have brought a sense of optimism to the global economy. The US banks have aced their stress test considering their solid Capital Adequacy Ratio (CAR) and lower non-performing assets (NPA) ratios. A rock-solid condition of the lenders in the US economy is sufficient to bolster the sentiment of the market participants.
At the press time, Japan’s Nikkei225 jumped 1.24%, China A50 added 0.68%, Hang Seng surged almost 2%, and Nifty50 gained 0.85%.
Stability in Japan’s inflation figures has supported the respective indices. Investors were worried due to the preliminary estimates of the Consumer Price Index (CPI) figures as the consensus was displaying a divergence in the overall annual CPI and core CPI. Although the figures have remained in line with their prior releases. Sustainability in the CPI figures indicates that costly oil and food prices have not elevated their impact on the overall inflation. It is worth noting that the overall CPI is landed at 2.5% and the core CPI that excludes oil and food prices have released at 0.8%. One could deduce that price rises in the Japanese economy are majorly guided by the oil and food price rise.
Meanwhile, the US dollar index (DXY) has witnessed a minor rebound after a corrective move to 104.20. The DXY is expected to remain lackluster amid the unavailability of any potential trigger for a decisive move.
Further downside in AUD/USD is seen meeting decent contention in the mid-0.6800s in the near term, suggested FX Strategists at UOB Group Lee Sue Ann and Quek Ser Leang.
Key Quotes
24-hour view: “Yesterday, we held the view that ‘the risk is still on the downside but AUD is unlikely able to maintain a foothold below 0.6880’. Our view was not wrong as AUD dropped to 0.6870 before rebounding. The rebound amidst waning downward momentum suggests that AUD is unlikely to weaken further. For today, AUD is more likely to trade sideways between 0.6875 and 0.6935.”
Next 1-3 weeks: “There is not much to add to our update from yesterday (23 Jun, spot at 0.6905). As highlighted AUD could drift lower but any weakness is expected to encounter solid support at 0.6850. Overall, only a break of 0.6965 (‘strong resistance’ level was at 0.6980 yesterday) would indicate that the current mild downward pressure has eased.”
- The UK Retail Sales came in at -0.5% MoM in May, beat estimates
- Core Retail Sales for the UK dropped by 0.7% MoM in May.
- The cable defends gains below 1.2300 on the mixed UK data.
The UK retail sales arrived at -0.5% over the month in May vs. -0.7% expected and 1.4% previous. The core retail sales, stripping the auto motor fuel sales, stood at -0.7% MoM vs. -1.0% expected and 1.4% previous.
On an annualized basis, the UK retail sales plunged 4.7% in May versus -4.5% expected and -5.7% prior while the core retail sales tumbled by 5.7% in the reported month versus -5.1% expectations and -6.9% previous.
Main points (via ONS)
The fall in sales volumes over the month was because of food stores, which fell by 1.6%; reduced spending in food stores seems to be linked to the impact of rising food prices and the cost of living.
Automotive fuel sales volumes rose by 1.1% in May 2022, which may in part be linked to increased hybrid working and a fall in those working exclusively from home.
Non-food stores sales volumes were unchanged (0.0%) over the month; an increase in clothing sales (2.2%) was offset by a fall in household goods (negative 2.3%), such as furniture stores, and department stores (negative 1.1%).
FX implications
GBP/USD edges a few pips lower to near 1.2260 on the mixed UK Retail Sales data. The spot was last seen trading at 1.2270, up 0.09% on the day.
- Gold stays on the way to a second weekly loss even buyers cheer metal’s consolidation of late.
- Technical analysis joins recession fears to favor bears.
- US dollar retreats amid lack of major data/events, risk catalysts eyed.
Gold Price (XAU/USD) benefits from the US dollar weakness, as well as sluggish markets, as buyers poke $1,825 while consolidating the biggest daily loss in a week. That said, the quote prints 0.18% intraday gains heading into Friday’s European session.
The US Dollar Index (DXY) drops 0.15% intraday to 104.25 at the latest, which in turn allows commodities and Antipodeans to lick their wounds. It’s worth noting that the greenback gauge remains on the way to the first weekly loss in four amid downbeat yields. However, fears of economic slowdown the Fed Chair Jerome Powell’s readiness for rate hikes keep the USD buyers hopeful.
The US 10-year Treasury yields rebound from a two-week low, flashed the previous day, as traders await more clues to confirm the economic slowdown. Even so, the bond coupons brace for the first weekly loss in four while reversing from the highest levels since 2011, at 3.09% by the press time.
Global central bankers’ rush towards higher rates, especially amid fragile economic conditions, probes market sentiment of late. Recently, global rating agency Fitch raised concerns over China’s economic growth. “Fitch expects economic growth in China to fall to just 3.7% in 2022 (2021: 8.1%), partly reflecting the impact of the lockdowns,” said the official update.
Even so, softer US Treasury yields and a light calendar appear to have triggered a corrective pullback in the Western stock futures.
Considering the light calendar for the rest of the day, updates concerning central bank moves and recession will be important to watch for clear directions of gold prices.
Technical analysis
Gold defends the early Asian bounce off a 61.8% Fibonacci retracement level of its run-up from May 16 to June 12. That said, steady RSI seems to favor the corrective pullback.
However, the 200-EMA level surrounding $1,850 holds the key to the precious metal’s recovery towards the monthly high, near $1,880.
Meanwhile, a downside break of the aforementioned key Fibo. level, surrounding $1,822, could drag the bullion prices to a six-week-old horizontal support zone, near $1,807 at the latest.
Gold: Four-hour chart
Trend: Further weakness expected
CME Group’s flash data for crude oil futures markets noted traders added around 5.1K contracts to their open interest positions on Thursday. Volume, instead, shrank by around 164.5K contracts and reversed the previous daily build.
WTI: Immediately to the downside comes $100.00
The sell-off in prices of the WTI remained unabated on Thursday. The downtick was amidst rising open interest, which is supportive of the continuation of this trend in the very near term. That said, the next key support emerges at the psychological $100.00 mark per barrel.
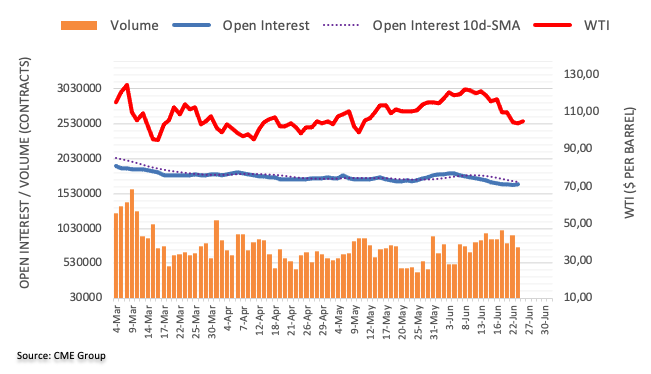
In the opinion of FX Strategists at UOB Group Lee Sue Ann and Quek Ser Leang, the outlook for GBP/USD remains mixed for the time being.
Key Quotes
24-hour view: “We highlighted yesterday that ‘the sharp swings have resulted in a mixed outlook and further choppy price actions are not ruled out’ and we expected GBP to ‘trade within a range of 1.2200/1.2310’. Our view for choppy trading was not wrong as GBP plunged to 1.2171, snapped up to 1.2294 before dropping back down to end the day little changed at 1.2262 (-0.03%). The outlook remains mixed and GBP could continue to trade in a choppy manner. Expected range for today, 1.2190/1.2305.”
Next 1-3 weeks: “We have held the same view since Monday (20 Jun, spot 1.2225) where the outlook is mixed and GBP could continue to trade in a choppy manner, likely between 1.2040 and 1.2400. Our view was not wrong as GBP traded in a choppy manner the last few days. The price actions offer no fresh clues and the outlook remains mixed. Only a break out of the expected range of 1.2130/1.2380 (narrowed from 1.2040/1.2400) would suggest a directional move is likely.”
Open interest in gold futures markets rose by around 2.5K contracts on Thursday, reversing the previous pullback according to advanced prints from CME Group. In the same line, volume extended the choppy mood and went up by around 16.4K contracts.
Gold now looks to $1,800
Thursday’s decent pullback in gold prices was on the back of increasing open interest and volume, opening the door to extra losses in the very near term. Against that, the precious metal could attempt a move to the key $1,800 mark per ounce troy.
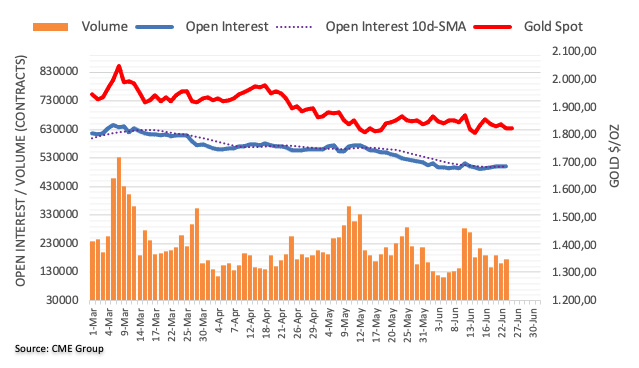
- Copper prices dribble around the lowest level since early 2021.
- Fitch cites recession woes, central bank action and China to expect further losses.
- Resolution of labor issues in Chile adds strength to the bearish bias.
- Light calendar, quiet session triggers corrective pullback but bears keep reins.
Copper Price remains on the back foot, pointing to the worst week in a year, even as the red metal recovers from of 18-month low heading into Friday’s European session.
That said, the copper futures on COMEX print around 1.30% daily gains as corrective pullback jostles with $3.72 by the press time. Elsewhere, the three-month copper contract on the London Metal Exchange (LME) seesaws around the lowest since February 2021, close to $8,400, while prices of the most active contract on the Shanghai Futures Exchange (SFE) remain pressured at around 63,830 yuan per metric tonne.
While portraying the challenges for the red metal, the global rating agency Fitch said, “We expect base metals to extend losses following their recent fall caused principally by the Fed's tightening and China's economic slowdown on the back of the country's zero-COVID policy.”
“A stronger U.S. dollar and weaker global economic growth will cause a significant drop in demand across base metals. Risks are broadly skewed to the downside,” the note also mentioned.
It’s worth noting that, Fed Chair Jerome Powell’s concern for recession joined downbeat US PMI data to weigh on the commodities the previous day. However, the mentioning of inflation and recession woes as the challenges to ensure a smooth landing, despite expecting firmer growth this year, weigh on the US Dollar Index (DXY) afterward and triggered the metal’s corrective pullback.
Looking forward, updates concerning central bank moves and recession will be important to watch for clear directions.
Technical analysis
Copper prices are likely to witness further declines as bears managed to conquer the late 2021 swing low surrounding $3.97. The same directs the commodity sellers towards the 50% Fibonacci retracement of March 2020 to 2022 upside, around $3.56. It’s worth noting that the recovery moves past $3.97 and will need validation from the $4.00 before eying further upside.
Further consolidation remains on the cards for EUR/USD in the next weeks, this time between 1.0430 and 1.0630, according to FX Strategists at UOB Group Lee Sue Ann and Quek Ser Leang.
Key Quotes
24-hour view: “Our expectations for EUR to ‘retest the 1.0605 level’ yesterday was incorrect as it dropped sharply to 1.0481 before rebounding. We view the movement as part of a consolidation phase and we expect EUR to trade between 1.0470 and 1.0560 for today.”
Next 1-3 weeks: “We have expected EUR to consolidate since late last week. EUR traded in a relatively choppy manner the last few days but has stayed within a range. There is still clear direction for now and we continue to expect EUR to consolidate albeit within a narrower range of 1.0430/1.0630 (vs 1.0390/1.0650 previously). Overall, EUR has to break out of the expected range before a sustained directional move is likely.”
"Certain industries would have to be shut down if there is not enough gas and that pretty much is a prelude to potential gas rationing in the country, which is now one step away," said German Economy Minister Robert Habeck on Friday.
Also read: Germany’s Habeck: Gas is from now on in short supply in the country
FX implications
The news fails to move a needle when it comes to EUR/USD as the major currency pair grinds higher around 1.0540 heading into European session. However, chatters over the global recession gains momentum due to the German policymakers' comments, which in turn should weigh on the market sentiment and underpin the US dollar's safe-haven demand.
Read: EUR/USD advances towards 1.0550 despite escalating hawkish Fed bets
- Advancing 50- and 200-EMAs are hinting at more upside.
- A Bullish Pennant formation is strengthening the greenback bulls.
- The RSI (14) is displaying some signs of exhaustion as it has slipped below 60.00.
The USD/TRY pair is displaying topsy-turvy moves in a range of 17.22-17.37 for the past three trading sessions. Earlier, the greenback bulls have displayed a juggernaut rally from June 5 low at 15.96 to June 9 high at 17.50.
On a four-hour scale, the asset is forming a Bullish Pennant that signals a volatility contraction phase after a vertical upside move. The consolidation phase denotes inventory purchase by the initiative buyers, which prefer to enter an auction after the establishment of a bullish bias.
Advancing 50- and 200-period Exponential Moving Averages (EMAs) at 17.29 and 16.59 respectively add to the upside filters.
However, the Relative Strength Index (RSI) (14) has slipped below 60.00 after sensing exhaustion in the upside momentum. Although this doesn’t indicate a bearish reversal, for a resumption of an uptrend the RSI (14) needs to surpass 60.00 again.
An upside break of the above-mentioned chart pattern at 17.50, which is the June 9 high will activate the greenback bulls and will drive the asset towards the psychological resistance at 18.00, followed by the 21 December 2021 high at 18.26.
On the flip side, the Turkiye lira bulls will regain strength if the asset drops below June 9 low at 16.75, which will drag the asset towards May 26 high at 16.47. A breach of the latter will unleash the Turkiye lira bulls to more downside towards the psychological support at 16.00.
USD/TRY four-hour chart
-637916445379300416.png)
- WTI dribbles inside a bearish chart pattern around six-week low.
- Steady RSI and sustained trading below 100-HMA favor bears.
- Eight-day-old resistance line adds to the upside filters.
WTI crude oil traders lick their wounds near $103.50, up 0.15% intraday, heading into Friday’s European session. In doing so, the black gold remains inside a two-day-old bearish pennant formation while taking rounds to the lowest levels in six weeks.
It’s worth noting that the quote’s failure to rise past 100-HMA and steady RSI, together with the aforementioned pennant, gives rise to hopes of witnessing the further downside.
However, a clear break of the $103.00 becomes necessary for the WTI bears to retake control.
Following that, the theory suggests a $20.00 slump in commodity prices. However, the recent low near $101.00 and the $100.00 psychological magnet may act as additional validation points for the commodity’s further downside.
Meanwhile, recovery moves should cross the pennant’s resistance line, at $105.20 by the press time, to recall the buyers.
Even so, the 100-HMA level of $106.40 and a downward sloping resistance line from June 14, close to $108.50 at the latest, could challenge the WTI crude oil’s further upside.
In a case where the black gold rises past $108.50, the $110.00 appears to be the last defense for the bears.
WTI: Hourly chart
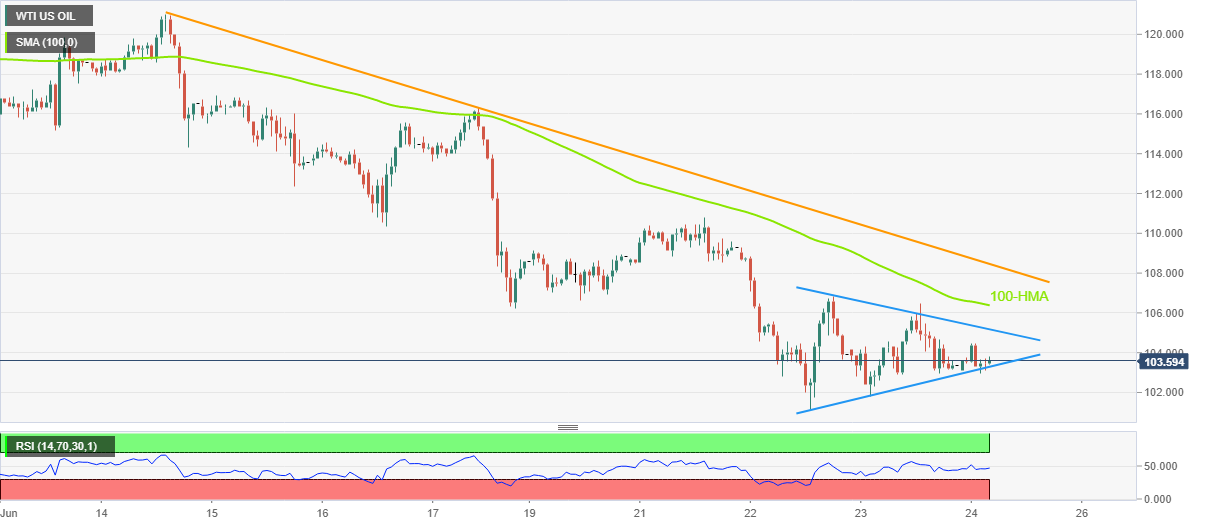
Trend: Further weakness expected
- EUR/USD is marching towards 1.0550 as the DXY is performing lackluster.
- Fed Powell’s testimony has failed to bring a notable impact on the DXY prices.
- For further guidance, investors will focus on the US Durable Goods Orders.
The EUR/USD pair is advancing gradually towards the critical hurdle of 1.0550 as an underperformance is expected from the US dollar index (DXY) amid the unavailability of any potential trigger in Friday’s session. The asset has remained sideways in the Asian session and an upside break from the consolidation is expected after overstepping the intraday high at 1.0538.
It looks like the downbeat US Purchase Managers Index (PMI) is fetching exhaustion in the DXY. The Manufacturing PMI landed at 52.4 much lower than forecasts and the prior print of 56 and 57 respectively. Also, the Services PMI slipped sharply to 51.6 from the consensus of 53.5 and the prior print of 53.4.
The hawkish commentary from Federal Reserve (Fed) chair Jerome Powell in his testimony has failed to bring a notable impact on the DXY prices. It won’t be wrong to state that the market participants have discounted the fact that policy tightening will continue for a prolonged period.
Going forward, the release of the US Durable Goods Orders is expected to bring a decisive move in the asset, which is due on Monday. A preliminary estimate for the economic data is 0.6%, higher than the former release of 0.5%. The preliminary estimate is hinting that the demand prospects in the US economy are much intact.
On the eurozone front, investors are keeping an eye on the Germany IFO Business Climate figures. The economic data indicates the current conditions and business expectations in Germany. A marginal fall is expected in the economic indicator to 92.9 from the prior print of 93.
- AUD/USD consolidates weekly losses amid quiet session, light calendar.
- Treasury yields rebound, USD retreats even as recession fears probe optimists.
- Aussie yields brace for the biggest fall in a decade as hawkish RBA lures bond buyers.
- RBA’s Lowe should repeat readiness for higher rates to defend Aussie bulls.
AUD/USD dribbles around 0.6900, marking the first daily performance in three, as risk-aversion ebbs during early Friday morning in Europe. A light calendar and a lack of major negatives from macro seem to have underpinned the Aussie pair’s latest corrective pullback ahead of the scheduled speech from Reserve Bank of Australia (RBA) Governor Philip Lowe.
US 10-year Treasury yields rebound from a two-week low, flashed the previous day, as traders await more clues to confirm the economic slowdown. Even so, the bond coupons brace for the first weekly loss in four while reversing from the highest levels since 2011, at 3.09% by the press time.
At home, Australia’s 10-year Treasury bond yields extend pullback from the highest levels since 2014 despite the 1.0% daily gains around 3.71%. More importantly, the 3-year counterpart eyes the biggest weekly loss since 2011 with over 11% fall to 3.31% by the press time.
It’s worth noting that 0.50% intraday gains of the S&P 500 Futures also portray the market’s cautious optimism, or at least consolidation of the latest pessimism, during early Friday.
Amid these plays, the US Dollar Index (DXY) drops 0.15% intraday to 104.25 at the latest, which in turn allows commodities and Antipodeans to lick their wounds.
While a pause in the risk-off mood and softer USD triggered the Aussie pair’s rebound, headlines suggesting improved traffic in China add strength to the recovery moves. Even so, a cautious mood ahead of a speech from RBA’s Lowe tests the bulls.
That said, softer US PMIs and Fed Chair Jerome Powell’s readiness for more rate hikes, as well as fears over economic growth, seemed to have weighed on the AUD/USD prices the previous day. In doing so, the Aussie bears ignored upbeat S&P Global PMIs for Australia.
Moving on, AUD/USD prices are likely to remain firmer as RBA’s Lowe might not want to spoil his reputation by stepping back from the latest comments suggesting further rate hikes. Also important for the pair traders to watch is the US New Home Sales for May. Above all, updates concerning central bank moves and recession will be important to watch for clear directions.
Technical analysis
AUD/USD recovery needs validation from a downward sloping resistance line from June 07, at 0.6930 by the press time. However, sellers are likely to remain away until witnessing a downside break of the six-week-old support line, around 0.6855-60 at the latest.
- USD/INR is aiming to recapture its all-time highs at 78.50.
- Fed Powell’s hawkish commentary has underpinned the greenback bulls against the Indian rupee.
- Oil prices are expected to remain on the tenterhooks amid escalating recession fears.
The USD/INR pair has rebounded strongly at the open after a corrective move towards 78.13. The hawkish commentary from Federal Reserve (Fed) Jerome Powell in his testimony has infused an adrenaline rush into the greenback bulls.
Fed Powell in his testimony has cleared that the US central bank is ‘unintentionally committed’ to achieving price stability. The ongoing inflation rate is 8.6% more than four times the desired inflation rate. In order to combat the inflation monster, the Fed needs to feature one more 75 basis points (bps) in its July monetary policy.
The Fed has already elevated its interest rates to 1.50-1.75% and still no notable impact has been witnessed on the price rise. Therefore, investors should not brace for a pause after a bumper rate hike in July. More rate hike announcements could come in the following interest rate decisions.
Meanwhile, the US dollar index (DXY) is displaying a lackluster performance in the Asian session due to the unavailability of any potential trigger on Friday. At the press time, the asset is oscillating in a 104.26-104.33 range. Going forward, investors’ focus will remain on the US Durable Goods Orders. An improvement is seen in the economic data to 0.6% from the prior print of 0.5%. A higher-than-expected print by the economic data will signify a resilient demand in the US economy.
On the oil front, oil prices have turned sideways after remaining in a negative trajectory for the past two weeks. Escalating recession fears are expected to keep the oil prices on the tenterhooks going forward.
- Steel Price licks wounds at six-month low after falling nearly 500 yuan per metric tonne during the week.
- Lack of major data/events, softer USD allowed bears to take a breather.
- Fears of recession, doubts about production cuts and China’s covid conditions provide a trifecta attack on prices.
Steel Price consolidates weekly losses amid Friday’s sluggish Asian session as risk-off sentiment recedes amid a light calendar and lack of major events. However, the industrial metal bears remain hopeful as pessimism surrounding the demand outlook, as well as fears of further supplies, remains intact.
That said, the most active rebar contract on the Shanghai Futures Exchange (SFE) rises to 4,230 yuan per metric tonne (mt), up 1.30% on a day by the press time. It’s worth noting that the stated October 2022 expiry bearing contract slumped nearly 500 yuan/mt during the week while dropping to the lowest levels since December 2021 the previous day.
While a pullback in the US dollar and an absence of major data/events could be linked to the latest corrective bounce in the Steel Price, the overall fundamentals remain against the bullish bias and keep the metal sellers hopeful.
Among them, the recession fears are the key as steel has more to do with industries and could witness more demand during growth years than otherwise. Further, China’s “zero covid” policy weighs on the demand from the world’s biggest industrial player and drowns the metal prices. Additionally, fears of more production, especially from Asia, also exert downside pressure on the Steel Price.
It should be noted that the global central bankers’ rush towards higher rates intensifies recession fears and challenge steel traders especially amid fragile economic conditions.
Looking forward, the steel prices could witness further downside as a lack of growth optimism joins an unattractive demand-supply matrix.
- GBP/USD pulls back from intraday high during the first positive day in three.
- Conservatives lost two Parliamentary seats in the UK by-elections, challenges to PM Johnson mounts.
- Downbeat UK data and disappointment from BOE keep cable bears hopeful.
- British Retail Sales for May will be important considering its lion share in GDP.
GBP/USD justifies UK’s political pessimism to take a U-turn from the intraday high, near 1.2270 during early Friday morning in Europe. Even so, a softer US dollar and anxiety ahead of the UK’s Retail Sales for May, up for publishing at 06:30 GMT, challenge the Cable pair sellers.
UK PM Boris Johnson witnesses defeat in previously safe seats for the Conservatives during the by-elections. Among them, Liberal Democrats Party won the Tiverton and Honiton seats while Labour Party won in Wakefield. It’s worth noting that UK PM Johnson lost confidence after the partygate scandal and hence raised worries about the further GBP/USD weakness.
Elsewhere, downbeat prints of the UK PMIs for June and early signals for Retail Sales weighed on the GBP/USD pair the previous day. UK’s S&P Global/CIPS Manufacturing Purchasing Managers’ Index (PMI) dropped to 53.4 in June, versus 53.7 expected and May’s final reading of 54.6. The Services PMI reprints the previous month’s final reading of 53.4 while staying below 53.0 forecasts.
Further, the Confederation of British Industry's (CBI) latest Distributive Trades Survey showed on Thursday that the UK’s Retail Sales Balance dropped to -5 in June versus -1 prior. Additionally, the three-month average dropped to the lowest level in a year with -14 versus -9 previous readings.
On the other hand, the US Dollar Index (DXY) snapped the three-day downtrend the previous day, down 0.11% intraday near 104.30 by the press time, as Fed Chair Jerome Powell’s concern for recession joined downbeat US PMI data to favor the greenback buyers the previous day. However, the mentioning of inflation and recession woes as the challenges to ensure a smooth landing, despite expecting firmer growth this year, weigh on the DXY.
Amid these plays, the Wall Street benchmarks closed positively due to the downbeat Treasury yields. However, the S&P 500 Futures rise 0.30% while the US 10-year Treasury yields remain firmer around 3.09%, after dropping to a fortnight low the previous day.
Moving on, UK Retail Sales contribute nearly 60% to the British GDP and hence become important for the GBP/USD pair traders. The key data is expected to improve on YoY but may disappoint on MoM. It should be observed that the Bank of England’s (BOE) refrain from announcing faster rate hikes than already planned could weigh on the quote even if the data manage to offer a positive surprise.
Technical analysis
GBP/USD fades bounce off a six-week-old horizontal support area, around 1.2170-60. On the contrary, buyers need validation from 1.2285 to trigger the upside momentum. Even so, the 100-SMA could test the bulls around 1.2345.
- Bearish negative divergence on the RSI (14) is indicating exhaustion in the upside move.
- The greenback bulls have defended the 10-EMA at 134.69.
- The 20-EMA is still scaling higher untouched and is favoring a bullish bias.
The USD/JPY pair is displaying wild moves after the release of Japan’s Inflation. The asset is facing barricades around the round-level resistance of 135.00. On a broader note, the major has witnessed a steep fall after failing to sustain above the critical hurdle of 136.00.
The formation of bearish negative divergence on a daily scale is hinting for exhaustion after a juggernaut rally. In a comparison of the asset price and the momentum oscillator, Relative Strength Index (RSI) (14), a loss of momentum is clearly visible. The asset made a higher high on Wednesday at while the RSI (14) recorded a lower high. It is worth noting that a negative divergence signal is not sufficient to claim a bearish reversal. The concept needs more confirmation from other filters.
The greenback bulls are still defending the 10-period Exponential Moving Average (EMA) at 134.69. The 20-period EMA at 133.40 has not attacked yet and is advancing higher, which favors a bullish bias.
A demand zone in a 131.33-131.58 range will remain a major hurdle for the yen bulls.
For a downside move, the yen bulls need to violate Thursday’s low at 134.27. The occurrence of the same will drag the asset towards June 9 low at 133.29, followed by the above-mentioned demand zone.
On the contrary, the greenback bulls will resume the upside move after overstepping Thursday’s high at 136.30. This will expose the asset to register fresh two-decade highs at 136.89, recorded in October 1998, followed by September 1998 highs at 139.91.
USD/JPY daily chart
-637916379169017989.png)
UK: Conservative Party loses by-elections to Labour and Lib Dems
more to come ....
Japan’s Deputy Chief Cabinet Secretary Seiji Kihara said in a statement on Thursday, “we should pay sufficient attention to possible impact from inflations on consumer sentiment and corporate activities.”
Kihara welcomed the EU starting process for Ukraine to join as a member.
Related reads
- Japan's May consumer inflation tops BOJ target for 2nd straight month — RTRS
- Global factory activity drops, treasury yields tumble, stocks dip
- Gold price is expected to rebound as a retest of Wednesday’s low shows a loss of downside momentum.
- The hawkish commentary from Fed Powell has put the gold prices on tenterhooks for a prolonged period.
- The DXY is performing lackluster on the downbeat US PMI.
Gold price (XAU/USD) is hoping for a rebound as the gold bears are indicating a loss of momentum after testing Wednesday’s low around $1,820.00. The precious metal is oscillating in a narrow range of $1,822.67-1,825.47 from the late New York session and is now showing some signs of an upside break of the rangebound move.
The commentary from Federal Reserve (Fed) chair Jerome Powell’s testimony that the central bank is ‘unintentionally committed’ to bringing price stability in the US economy has kept the gold prices on the tenterhooks. To achieve the targeted inflation rate, the Fed is needed to elevate interest rates quickly. Comparing the current inflation rate with the targeted one, the former is at least four times of the latter.
Meanwhile, the US dollar index (DXY) is expecting a downside move on displaying underperformance on the Purchase Managers Index (PMI) front. The Manufacturing PMI landed at 52.4 much lower than forecasts and the prior print of 56 and 57 respectively. Also, the Services PMI slipped sharply to 51.6 from the consensus of 53.5 and the prior print of 53.4.
Gold technical analysis
On a broader note, the gold prices are displaying topsy-turvy moves in a range of $1,821.72-1,847.95. The 20- and 50-period Exponential Moving Averages (EMAs) at $1,828.30 and $1,831.58 respectively are scaling lower, which strengthens a downside bias. Meanwhile, the Relative Strength Index (RSI) (14) is displaying signs of momentum loss on the downside. The momentum oscillator is gauging support around 40.00 levels.
Gold hourly chart
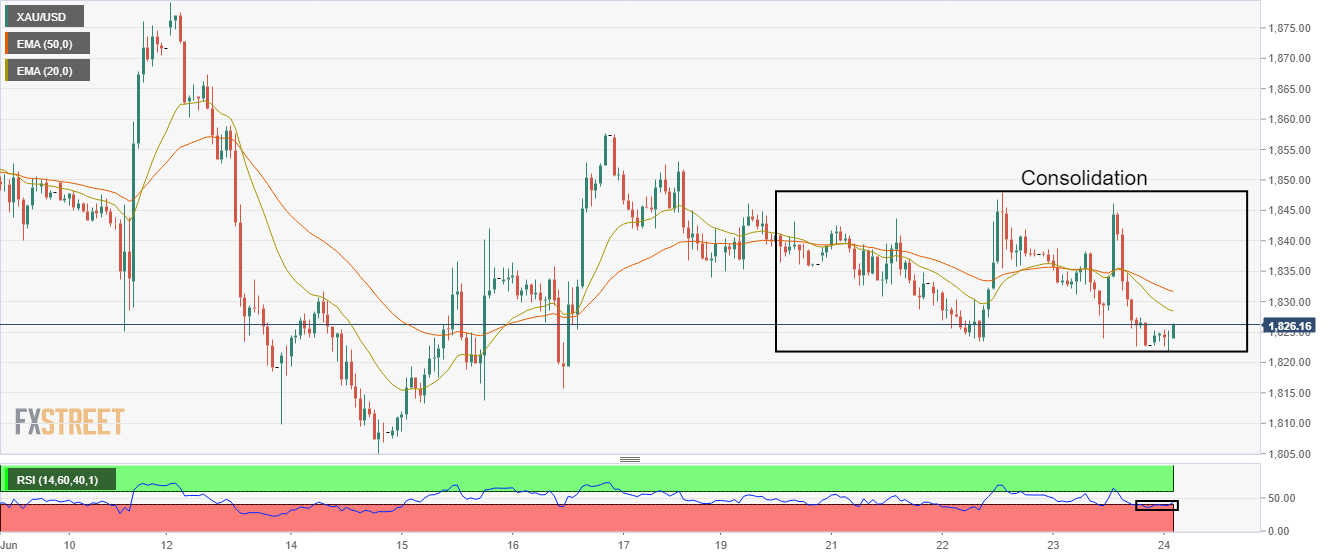
| Raw materials | Closed | Change, % |
|---|---|---|
| Brent | 110.05 | 0.05 |
| Silver | 20.951 | -2.24 |
| Gold | 1823.22 | -0.78 |
| Palladium | 1841.34 | -0.92 |
- EUR/USD adds to the first weekly gains in four amid quiet session.
- Recession fears keep markets dicey, US dollar fails to track firmer yields.
- Hawkish ECBSpeak, repetitive comments from Fed’s Powell favor buyers.
- German IFO sentiment figures for June, and second-tier US data may entertain traders.
EUR/USD renews intraday high near 1.0530 as it eyes to snap three-week downtrend during Friday’s Asian session. The major currency pair’s latest gains could be linked to the US dollar’s weakness as traders rush towards Treasury bonds amid recession fears.
That said, the US Dollar Index (DXY) seesaws around 104.40, after snapping the three-day downtrend the previous day. Even so, the greenback gauge remains on the way to posting the first weekly loss in four.
Fed Chair Jerome Powell’s concern for recession joined downbeat US PMI data to favor the greenback buyers the previous day. However, the mentioning of inflation and recession woes as the challenges to ensure a smooth landing, despite expecting firmer growth this year, weigh on the DXY.
It’s worth noting that downbeat US PMIs also added to the risk-aversion and fuelled the US dollar’s safe-haven demand. S&P Global Services PMI for the US slumped to 51.6 in June from 53.4 prior, not to forget missing the 53.5 forecasts. Further, the Manufacturing PMI not only missed the market expectation of 56 by a wide margin in June, to 52.4 versus 57.00 prior, but also slumped to a nearly two-year low.
On the other hand, German Economy Minister Robert Habeck rang the alarm of gas shortages by announcing a move to stage two of its three-stage gas plan amid reduced Russian flows. Additionally, the European Central Bank (ECB) published Economic Bulletin on Thursday, underscoring challenges to the economy from higher inflation. The ECB Bulletin also mentioned, “The Governing Council will make sure that inflation returns to its 2% target over the medium term.”
It’s worth noting that Governing Council member and German central bank head Joachim Nagel mentioned on Thursday that "The risk of inflation expectations becoming de-anchored has risen over the past months." The policymaker also said, "If monetary policy falls behind the curve, even stronger hikes in interest rates could become necessary to get inflation under control.”
Despite the market’s pessimism, the Wall Street benchmarks closed positively due to the downbeat Treasury yields. However, the S&P 500 Futures rise 0.30% while the US 10-year Treasury yields remain firmer around 3.09%, after dropping to a fortnight low the previous day.
Looking forward, Germany’s IFO numbers for June will be crucial after the bloc’s powerhouse signaled fears of an energy crisis. That said, the IFO – Business Climate is expected to ease to 92.9 from 93.0 while the Current Assessment is also likely to weaken to 99.0 from 99.5. However, the IFO – Expectations are likely to improve to 87.4 from 86.9, which in turn can help the EUR/USD buyers.
In addition to the German IFO numbers, US New Home Sales for May and comments from ECB Vice President Luis de Guindos also appear important for short-term EUR/USD directions.
Technical analysis
Given the sluggish MACD signals and steady RSI, coupled with the quote’s ability to recover from important supports, the EUR/USD pair is likely to run towards the 200-SMA hurdle surrounding 1.0585.
Among the key supports, the 50-SMA and horizontal area comprising multiple levels marked since mid-May., respectively near 1.0495 and 1.0470-60, gain major attention.
“China's monetary policy should be alert to the lagging effect and subprime mortgage risks while focusing on stabilizing prices and the property market,” the 21st Century Business Herald said in its editorial story, citing a study by Bank for International Settlements (BIS).
Additional takeaways
“A 1% drop in nominal short-term interest rates would lead to a 5% increase in housing prices, taking three years to materialize.”
“But the Chinese property market is not, for now, seeing such price growth, the newspaper noted. Developed countries in rate hike cycles to tame high inflation, face a growing concern of housing bubbles bursting, as both the home price-to-rent and home price-to-income ratios in 19 OECD countries are higher than those before the 2008 financial crisis.”
Market reaction
Despite a word of caution from the BIS, USD/CNY is trading 0.05% lower on the day at 6.6943, as of writing.
- USD/CAD snaps two-day uptrend, stays pressured towards immediate support line.
- Bullish chart pattern, steady RSI keeps buyers hopeful, 1.3080 is the key hurdle.
- Downside break of mid-month low could convince bears.
USD/CAD extends pullback from 1.3017 towards dropping back inside a weekly ascending trend channel formation. That said, the Loonie pair stays depressed at around 1.2980 by the press time of Friday’s Asian session.
A two-day-old support line joins the 50% Fibonacci retracement of June 16-17 upside to highlight 1.2970 as the short-term key support.
Following that, the aforementioned channel’s lower line, at 1.2935 by the press time, will be crucial for the USD/CAD bears to watch.
Should the quote remains bearish past 1.2935, the odds of witnessing a south-run towards the mid-June trough surrounding 1.2860 can’t be ruled out.
Alternatively, the upper line of the stated channel, around 1.3015, restricts short-term advances of the USD/CAD pair.
Following that, the double tops around 1.3080 will be important to track as a clear upside break of the 1.3080 hurdle could theoretically propel the prices towards 1.3650. However, the late 2020 peak near 1.3420 may offer intermediate halts during the run-up.
To sum up, USD/CAD braces for short-term declines but the overall trend remains bullish.
USD/CAD: Hourly chart
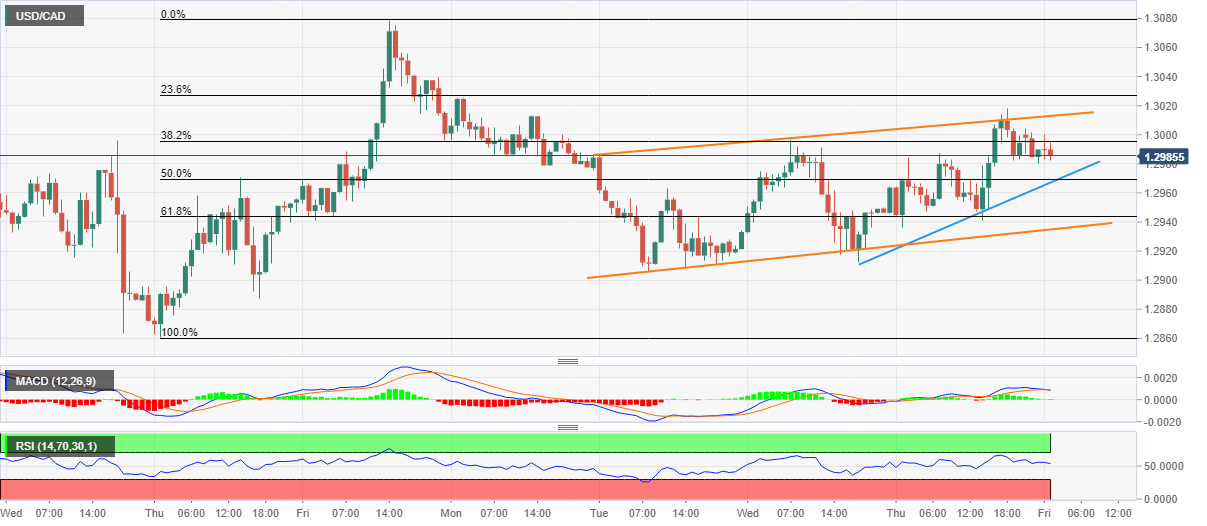
Trend: Bullish
Analysts at Goldman Sachs believe that the Fed could be forced to tighten aggressively, in the wake of upside risks to inflation expectations. An upcoming barrage of political advertisements point to high inflation.
Key quotes
“Potential further increases in food and gas prices are the main upside risk to consumer inflation expectations.”
“But another key upside risk is the coming barrage of political advertisements highlighting high inflation ahead of the midterm elections in the next few months.”
“Inflation expectations have historically been quite sensitive to political outcomes, and voters report that inflation will be one of the main issues this fall.”
“There is limited evidence available on the link between political ads and consumer inflation expectations because inflation has been tame and therefore not a significant campaign issue in recent decades. However, recent academic research suggests that a large share of the dispersion in inflation expectations is attributable to differences in available information, and that inflation expectations shift when new information is provided.”
“Fed officials might feel compelled to respond forcefully to even moderate further increases in long-run inflation expectations. As a result, we see the upcoming onslaught of inflation-focused political advertisements as adding to the risk that the Fed could continue to tighten aggressively even if economic activity decelerates sharply.”
- Aussie bond buyers keep reins as traders await RBA’s Lowe.
- 10-year coupons retreat from the highest in eight years to snap four-week uptrend.
- 3-year Treasury yield reverse from late 2011 highs, on the way to posting biggest weekly loss in 11 years.
- Aussie data, hawkish RBA fail to underpin bond-buying amid recession fears.
Australian bond markets track global cues to tease bulls as fears of economic slowdown escalate. Also keeping the Aussie bond buyers hopeful is the likely hawkish comments from Reserve Bank of Australia (RBA) Governor Philip Lowe, up for release at 11:30 GMT on Friday.
That said, Australia’s 10-year Treasury bond yields extend pullback from the highest levels since 2014 despite the 1.0% daily gains around 3.71%.
More importantly, the 3-year counterpart eyes the biggest weekly loss since 2011 with over 11% fall to 3.31% by the press time.
“Australia’s bonds have whipsawed this month after the RBA raised rates more than economists forecast and Governor Philip Lowe said policymakers would do what’s necessary to bring inflation down,” said Bloomberg in justification of the bond market moves.
It’s worth noting, however, that the fears of the global recession are stronger enough to weigh on the market sentiment and the Treasury yields of late.
The risk-aversion in Australia ignores upbeat PMIs at home, as well as the softer US activity numbers, not to forget China’s recently upbeat traffic data. That said, the preliminary readings of Australia’s S&P Global PMIs for June came in mixed as the Manufacturing and Services PMIs rose past market forecasts and priors but the Composite PMI eased below the previous readouts. The Manufacturing PMI rose to 55.8 versus 54.7 expected and 55.7 prior whereas the S&P Global Services PMI rose past 49.1 market consensus to 52.6, versus 53.2 previous readings. It should be noted that the Composite PMI eased below 52.9 to 52.6 in June.
It’s worth noting that RBA’s Lowe is likely to reiterate his hawkish bias, especially after the recently upbeat Aussie PMIs, which in turn could favor the Aussie bond buyers and weigh on the yields. Though, comments over economic slowdown may be detrimental to the moves.
Also read: AUD/USD regains 0.6900 amid corrective pullback ahead of RBA’s Lowe
In recent trade today, the People’s Bank of China (PBOC) set the yuan (CNY) at 6.7000 vs the estimated 6.6964 and the previous 6.7079.
About the fix
China maintains strict control of the yuan’s rate on the mainland.
The onshore yuan (CNY) differs from the offshore one (CNH) in trading restrictions, this last one is not as tightly controlled.
Each morning, the People’s Bank of China (PBOC) sets a so-called daily midpoint fix, based on the yuan’s previous day's closing level and quotations taken from the inter-bank dealer.
- A Descending Triangle formation has squeezed volatility from the asset.
- The RSI (14) is oscillating in a 40.00-60.00 range which indicates a consolidation ahead.
- A downside move below 0.6868 will activate the descending triangle breakout towards the south.
The AUD/USD pair is auctioning back and forth in a narrow range of 0.6890-0.6908 in early Tokyo. The asset has remained flat-to-negative this week after slipping below the critical hurdle of 0.7000. The lack of potential triggers this week has brought a volatility contraction in the asset.
A Descending Triangle formation on the hourly scale has squeezed volatility from the asset. The downward sloping trendline of the descending triangle is plotted from June 16 high at 0.7070 while the horizontal support is placed at 0.6880. The break of the chart pattern is followed by a vertical move. The prolonged downside bias in the asset is bolstering the odds of a southwards break of the chart formation.
The 20- and 50-period Exponential Moving Averages (EMAs) at 0.6900 and 0.6913 are scaling lower, which adds to the downside filters.
While, the Relative Strength Index (RSI) (14) is oscillating in a 40.00-60.00 range, which signals a rangebound move ahead.
A decisive move below Thursday’s low at 0.6868 will activate the downside break of the above-mentioned chart pattern, which will drag the asset towards the May 12 low and the round-level support at 0.6829 and 0.6800 respectively.
Alternatively, the aussie bulls could dictate the asset price if the major overstep Wednesday’s high at 0.6962. This will drive the asset towards the psychological resistance at 0.7000, followed by June 13 high at 0.7035.
AUD/USD hourly chart
-637916295334512556.png)
- GBP/USD bears capping the bull's advances in a familiar sideways channel.
- The focus is on the BoE for the foreseeable future.
At 1.2247, GBP/USD is trying to make headway within a critical hourly range, but the bears are capping the advances at the high of 1.2270. The price recently dropped to a low of 1.2240 as the US dollar jumps back to life.
There has been little in the way of a catalyst in what is otherwise a slow start to the end of the week in Asia. The yen was pushed lower and that is having an effect across the DXY index, pressuring the US dollar's rivals. At the time of writing, DXY is trading at 104.46, near the highs of the day at 104.51 while USD/JPY jumped back above 135 the figure to print 135.22 the high for the day so far.
In the data, the PMI's preliminary composite index held at 53.1 in June, above the median forecast of 52.6 in a Reuters poll of economists and unchanged from May. But the PMI's measure of new orders effectively stagnated as it fell to 50.8, the lowest in over a year. Factory orders dipped below the 50.0 growth threshold to 49.6.
''The UK is in danger of being the slowest-growing major advanced economy next year, with the highest inflation rate and the biggest current account deficit,'' Kit Juckes at Societe Generale said.
BoE in focus
Meanwhile, with a focus on domestics, the UK's inflation print coupled with that more recent UK PMI outcome has underpinned sentiment that the Bank of England, BoE, is on track to hike by a 50bps rate hike in the next meeting. The UK's central bank is watching for signs that the recent jump in inflation, which hit a 40-year high of 9.1% in May, might turn into a permanent problem for the British economy.
The BoE said last week it was ready to act "forcefully" if it saw signs of persistent inflation pressures, suggesting it might raise interest rates by more than its standard quarter-point increase despite fears of a recession. Overnight index swaps are continuing to price in 50bp moves by the BoE at the next 3 meetings. This lays out a path that would leave Bank Rate above 3% by year-end.
- EUR/GBP pares recent losses while bouncing off key Fibonacci retracement level.
- 200-HMA, previous support challenge buyers, bears eye fresh weekly low.
- Downbeat RSI, sustained break of short-term triangle keep sellers hopeful.
EUR/GBP picks up bids to 0.8590 while consolidating the biggest daily loss in a week during Friday’s Asian session. In doing so, the cross-currency pair rebounds from the 61.8% Fibonacci retracement of June 09-15 upside.
However, the quote’s clear downside break of a one-week-old ascending triangle, as well as the sustained trading below the 200-HMA, hint at the further downside.
That said, the 200-HMA level of 0.8597 guards the EUR/GBP pair’s immediate upside ahead of the aforementioned triangle’s support line, at 0.8605 by the press time.
Following that, the stated triangle’s resistance line and mid-June swing low could challenge EUR/GBP bulls around 0.8645 and 0.8675 respectively.
Meanwhile, a downside break of the 61.8% Fibonacci retracement level of 0.8575 appears to be the trigger for the pair’s fall towards the June 16 trough, close to 0.8510.
In a case where EUR/GBP bears dominate past 0.8510, the 0.8500 threshold and the monthly low of 0.8485 might gain the market’s attention.
Overall, EUR/GBP prices are likely to witness further downside pressure despite the latest rebound.
EUR/GBP: Hourly chart
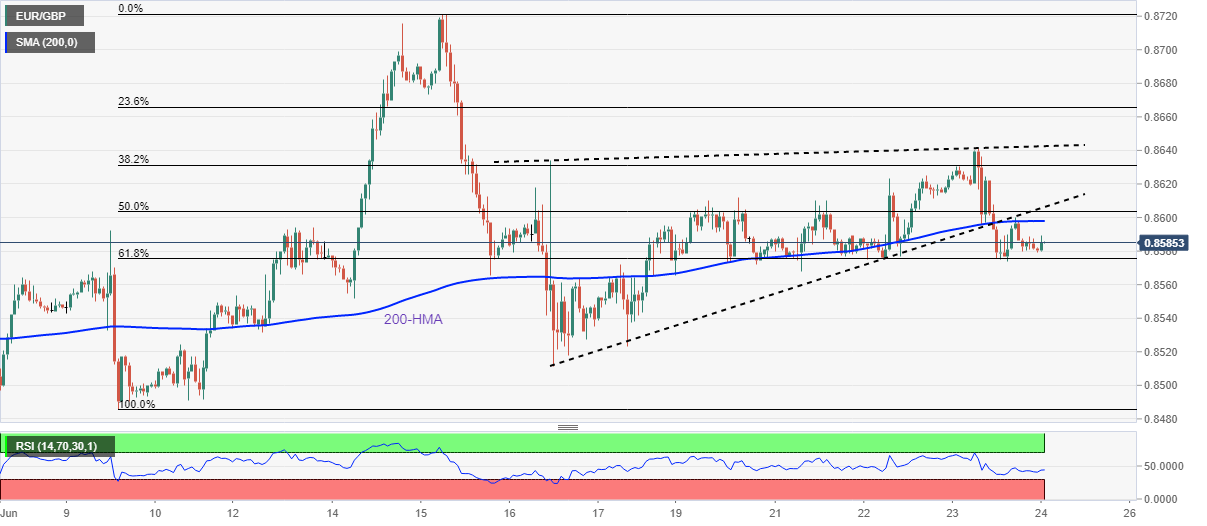
Trend: Further weakness expected
- Gold consolidates the biggest daily loss in a week, retreats from intraday high of late.
- US dollar pullback, quiet session underpin corrective pullback.
- Fears of economic slowdown, inflation weigh on the yellow metal.
- Sustained trading below 21-DMA, 200-DMA directs bears to six-week-old support.
Gold Price (XAU/USD) struggles to extend the daily gains around $1,825 as risk-aversion weighs on the metal during Friday’s Asian session. The metal pared the biggest daily loss in one-week earlier in the day before reversing from $1,825.37.
Escalating fears of global economic slowdowns and higher inflation drown the market’s sentiment and underpin the US dollar recovery, which in turn weighs on the gold prices.
That said, the US Dollar Index (DXY) seesaws around 104.40, after snapping the three-day downtrend the previous day.
The sour sentiment recently took clues from Fed Chair Jerome Powell’s testimony before the House Financial Services Committee on Monetary Policy. During the second round of justifying the biggest rate hike since 1994, the Fed Boss cited inflation and recession woes as the challenges to ensure a smooth landing, despite expecting firmer growth this year, during his second round of testimony. The central banker’s concern for recession joined downbeat US data to favor the risk-off mood.
It’s worth noting that downbeat US PMIs also added to the risk-aversion and fuelled the US dollar’s safe-haven demand. S&P Global Services PMI for the US slumped to 51.6 in June from 53.4 prior, not to forget missing the 53.5 forecasts. Further, the Manufacturing PMI not only missed the market expectation of 56 by a wide margin in June, to 52.4 versus 57.00 prior, but also slumped to a nearly two-year low.
Elsewhere, chatters surrounding improvement in China’s road traffic and a light calendar appeared to have favored the quote’s early-day corrective pullback.
Given the light calendar, XAU/USD traders may evaluate qualitative catalysts to keep the bears hopeful.
Technical analysis
Gold pares recent losses around the weekly low, the second one in the line, amid steady RSI. However, the metal’s clear pullback from the confluence of the 21-DMA and 200-DMA, near $1,843-45 at the latest, keeps sellers hopeful.
Also favoring the XAU/USD bears is the fortnight-old resistance line, around $1,834 by the press time.
On the downside, an upward sloping support line from May, near $1,811-12 lures the gold sellers before directing them to the yearly low near $1,786.
It’s worth noting that the upside break of the $1,845 DMA hurdle needs validation from a downward sloping resistance line from March, near $1,853.
Gold: Daily chart
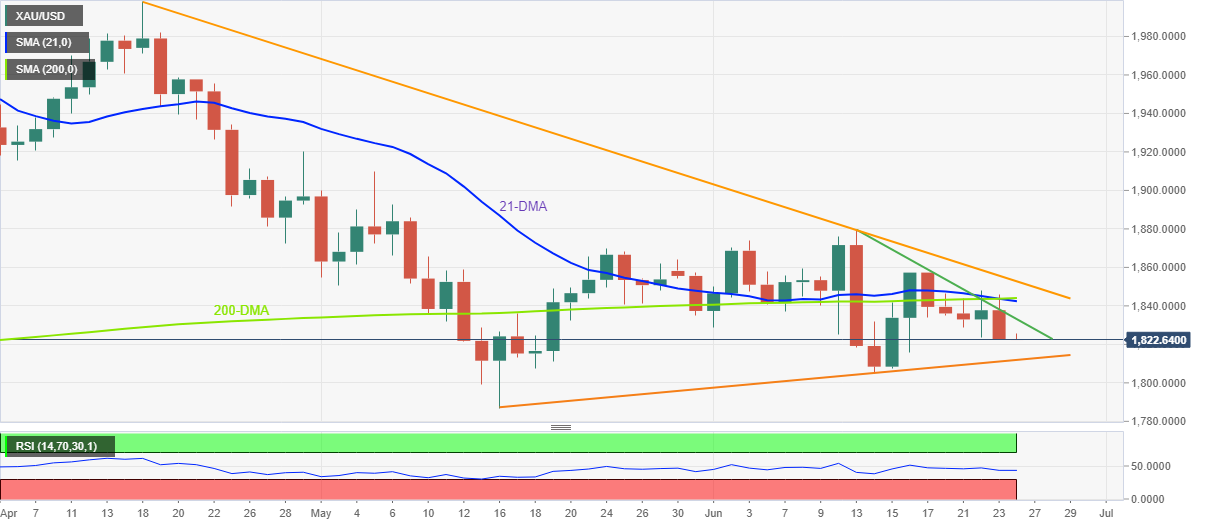
Trend: Further weakness expected
| Index | Change, points | Closed | Change, % |
|---|---|---|---|
| NIKKEI 225 | 21.7 | 26171.25 | 0.08 |
| Hang Seng | 265.53 | 21273.87 | 1.26 |
| KOSPI | -28.49 | 2314.32 | -1.22 |
| ASX 200 | 19.9 | 6528.4 | 0.31 |
| FTSE 100 | -68.75 | 7020.45 | -0.97 |
| DAX | -231.69 | 12912.59 | -1.76 |
| CAC 40 | -33.3 | 5883.33 | -0.56 |
| Dow Jones | 194.23 | 30677.36 | 0.64 |
| S&P 500 | 35.84 | 3795.73 | 0.95 |
| NASDAQ Composite | 179.11 | 11232.19 | 1.62 |
- USD/JPY has refreshed its day’s high at 135.14 on unchanged Japan’s Inflation.
- The overall inflation and core CPI have landed at 2.5% and 0.8% respectively.
- The DXY is performing lackluster as investors have shifted their focus to the US Durable Goods Orders.
The USD/JPY pair has rebounded strongly and has crossed the round-level resistance of 135.00 as the release of the Japanese inflation has brought some support to the counter. The major has faced offers marginally around 135.00 on unchanged Japan’s Inflation figures. The annual Consumer Price Index (CPI) has remained flat at 2.5%. Also, the core CPI displayed no deviation and landed at 0.8%.
In comparison with the estimates, the released data looks more promising for the Japanese economy. The core CPI remained steady at 0.8%, which indicates that the price rise in goods other than food and oil is sustaining. The Japanese economy is facing the headwinds of the inability to sustain the overall demand. Now, sustainability in the core CPI figures will support the Bank of Japan (BOJ) to achieve its inflation target.
Also, a stable plain vanilla CPI at 2.5% indicates that there has been no impact of costly fossil fuels and food prices in May. So, the unavailability of the cost-push inflation effect in May will be music to the ears for BOJ Haruhiko Kuroda and its co.
No doubt, the ultra-loose monetary policy by the BOJ will remain intact till they manage to bring a significant jump in demand-pull inflation.
On the dollar front, the US dollar index (DXY) is facing some offers while attempting to kiss the critical hurdle of 104.50. Going forward, investors’ focus will remain on the US Durable Goods Orders, which are expected to improve to 0.6% from the prior print of 0.5%.
Reuters reported that Japan’s annual core consumer inflation topped the central bank’s target for a second straight month in May, data showed on Friday, highlighting the intensifying pressure on the country’s fragile economy from soaring global raw material costs.
- Headline CPI 2.5% YoY, expected 2.9%, prior was 2.5%. (This remains the Bank of Japan’s 2% target for a second straight month, following a 2.1% rise in April).
- CPI excluding Fresh Food 2.1% YoY, expected 2.1%, prior was 2.1%.
- CPI excluding Food, Energy 0.8% YoY, expected 0.4%, prior was 0.8%.
Key notes
''The data challenges the Bank of Japan’s view that the recent rise in prices is temporary, and doesn’t warrant a withdrawal of monetary stimulus.''''The nationwide core consumer price index
''Rising fuel and food prices, blamed on Russia’s invasion of Ukraine and a weak yen that inflates the cost of imports, are expected to keep Japan’s core consumer inflation above the BOJ’s 2% target for most of this year, analysts say.''
''But there is little to cheer for the BOJ, which views such cost-push inflation as temporary and a risk to consumption, with households facing rising living costs and slow wage growth.''
''BOJ Governor Haruhiko Kuroda has repeatedly said the central bank will keep monetary policy ultra-loose until robust domestic demand and strong wage growth become key drivers of inflation.''
| Pare | Closed | Change, % |
|---|---|---|
| AUDUSD | 0.68959 | -0.43 |
| EURJPY | 141.987 | -1.31 |
| EURUSD | 1.05216 | -0.45 |
| GBPJPY | 165.396 | -0.94 |
| GBPUSD | 1.22575 | -0.06 |
| NZDUSD | 0.62752 | -0.16 |
| USDCAD | 1.29977 | 0.38 |
| USDCHF | 0.96126 | 0 |
| USDJPY | 134.946 | -0.88 |
- DXY struggles to extend the first daily gains in four amid market’s inactions.
- Fears of economic slowdown tighten the grip over risk appetite.
- Fed’s Powell, downbeat US PMIs add to the sour sentiment but Wall Street closed positive on softer yields.
- Yields rebound, stock futures print mild losses as traders await more clues.
US Dollar Index (DXY) seesaws around 104.40, after snapping the three-day downtrend, on Friday’s Asian session. The greenback gauge cheered the market’s risk-off mood the previous day while ignoring downbeat US data and mildly hawkish comments from the Fed Chair Jerome Powell.
In his testimony before the House Financial Services Committee on Monetary Policy, Fed’s Powell cited inflation and recession woes as the challenges to ensure a smooth landing, despite expecting firmer growth this year, during his second round of Testimony. The central banker’s concern for recession joined downbeat US data to favor the risk-off mood.
It’s worth noting that downbeat US PMIs also added to the risk-aversion and fuelled the US dollar’s safe-haven demand. S&P Global Services PMI for the US slumped to 51.6 in June from 53.4 prior, not to forget missing the 53.5 forecasts. Further, the Manufacturing PMI not only missed the market expectation of 56 by a wide margin in June, to 52.4 versus 57.00 prior, but also slumped to a nearly two-year low.
Despite the market’s pessimism, the Wall Street benchmarks closed positively due to the downbeat Treasury yields. However, the S&P 500 Futures drop 0.30% while the US 10-year Treasury yields remain unchanged at around 3.09% after dropping to a fortnight low the previous day.
Looking forward, a light calendar may test the US dollar bulls but risk catalysts and the second-tier US data for housing and activities may offer intermediate moves.
Technical anlaysis
DXY portrays a bullish pennant chart pattern, with the latest range between 104.10 and 104.60. That said, the bullish MACD signals and RSI conditions also keep buyers hopeful.
- NZD/USD's market structure is bullish for the day ahead.
- Bulls need to commit above the key the 0.6260 level.
As per the series of prior analyses, NZD/USD Price Analysis: The bird swoops in towards 0.6250s & demand area, and NZD/USD Price Analysis: Bulls lurking near 0.6250, rallies to 0.6340 eyed, the bulls are now back in control again following a critical structure break to the upside.
The following illustrates the market structure across the hourly and lower time frames only. For longer-term analysis, the original article outlines a full multi-timeframe thesis.
NZD/USD hourly chart, prior analysis
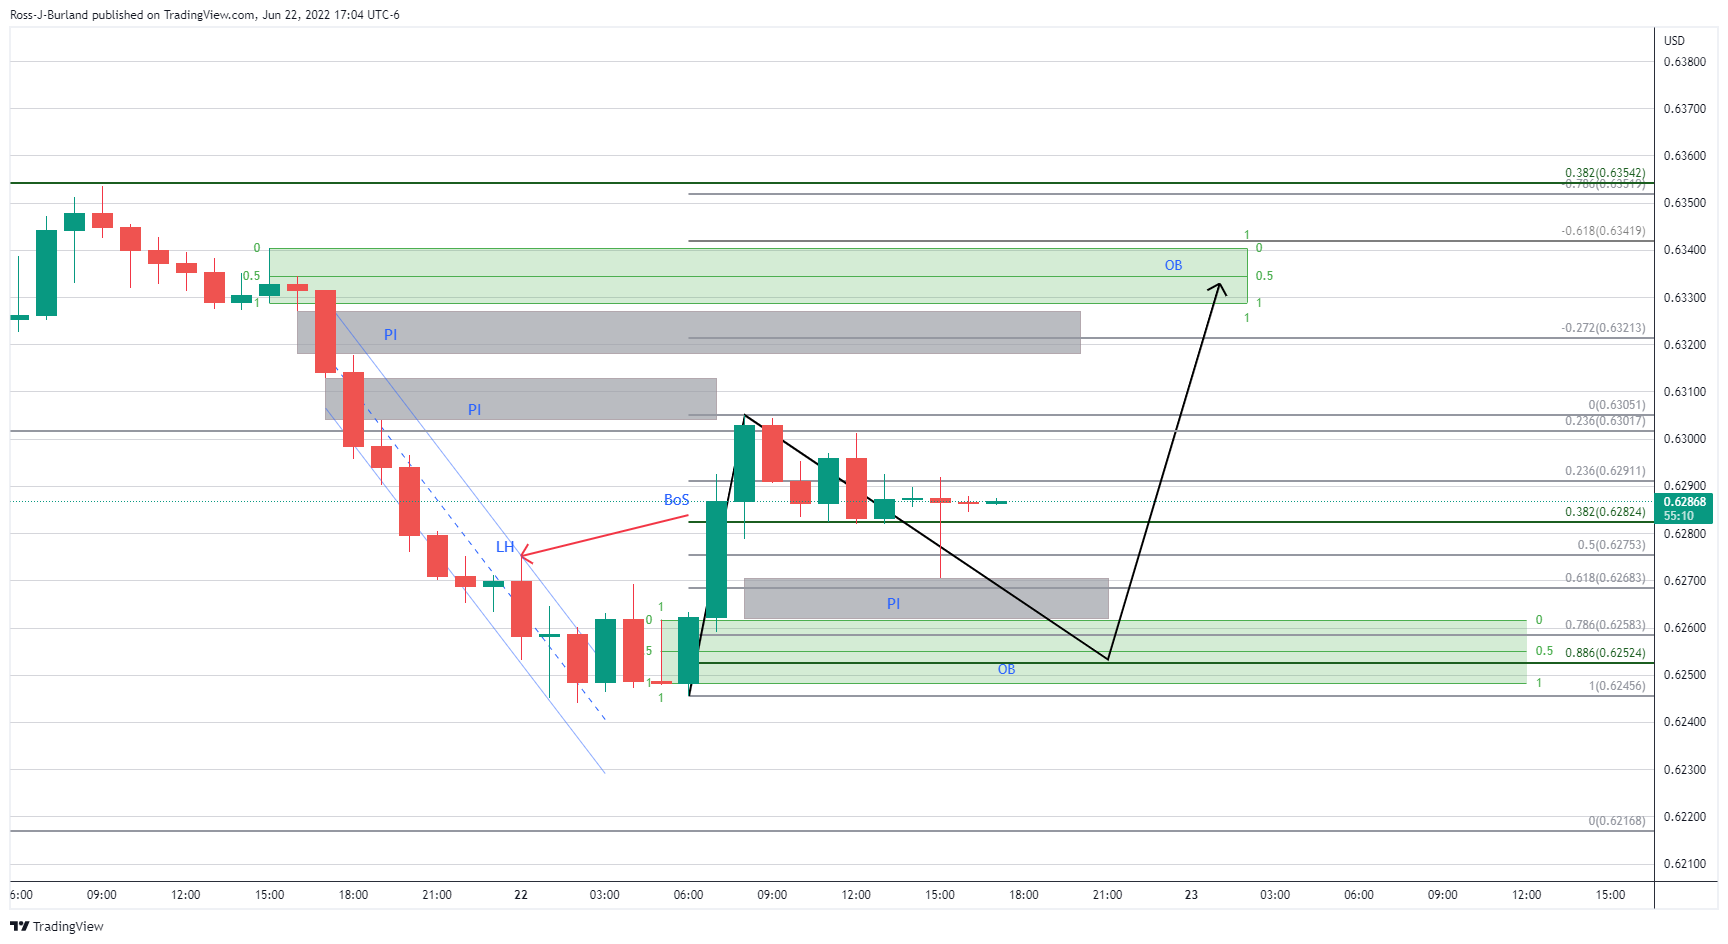

As illustrated, the bird has respected the projected flight trajectory until this point.
NZD/USD live market analysis
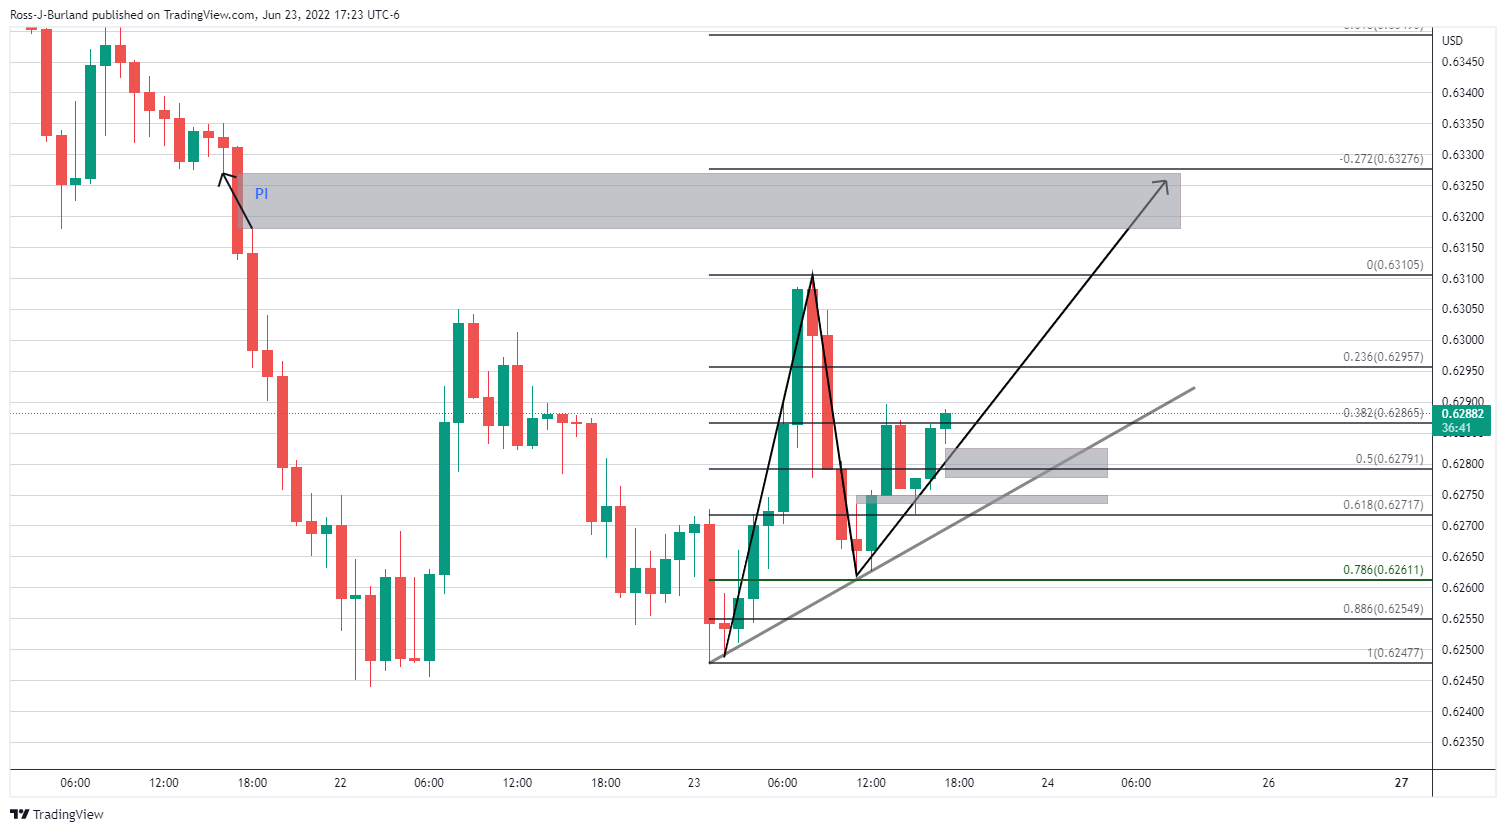
The above chart it is the same hourly chart, albeit stripped down to the current state of play.
The price corrected to a deeper Fibonacci, the 78.6% from where the bulls moved into guard positions established from the demand area below. There is an hourly inefficiency in bids between 0.62778 and 0.62832 which will be mitigated at some stage by offers which could potentially hamstring the bulls for the time being.
Meanwhile, sights are left on the upside price imbalance with offers left unmatched between 0.6318 and 0.6327.
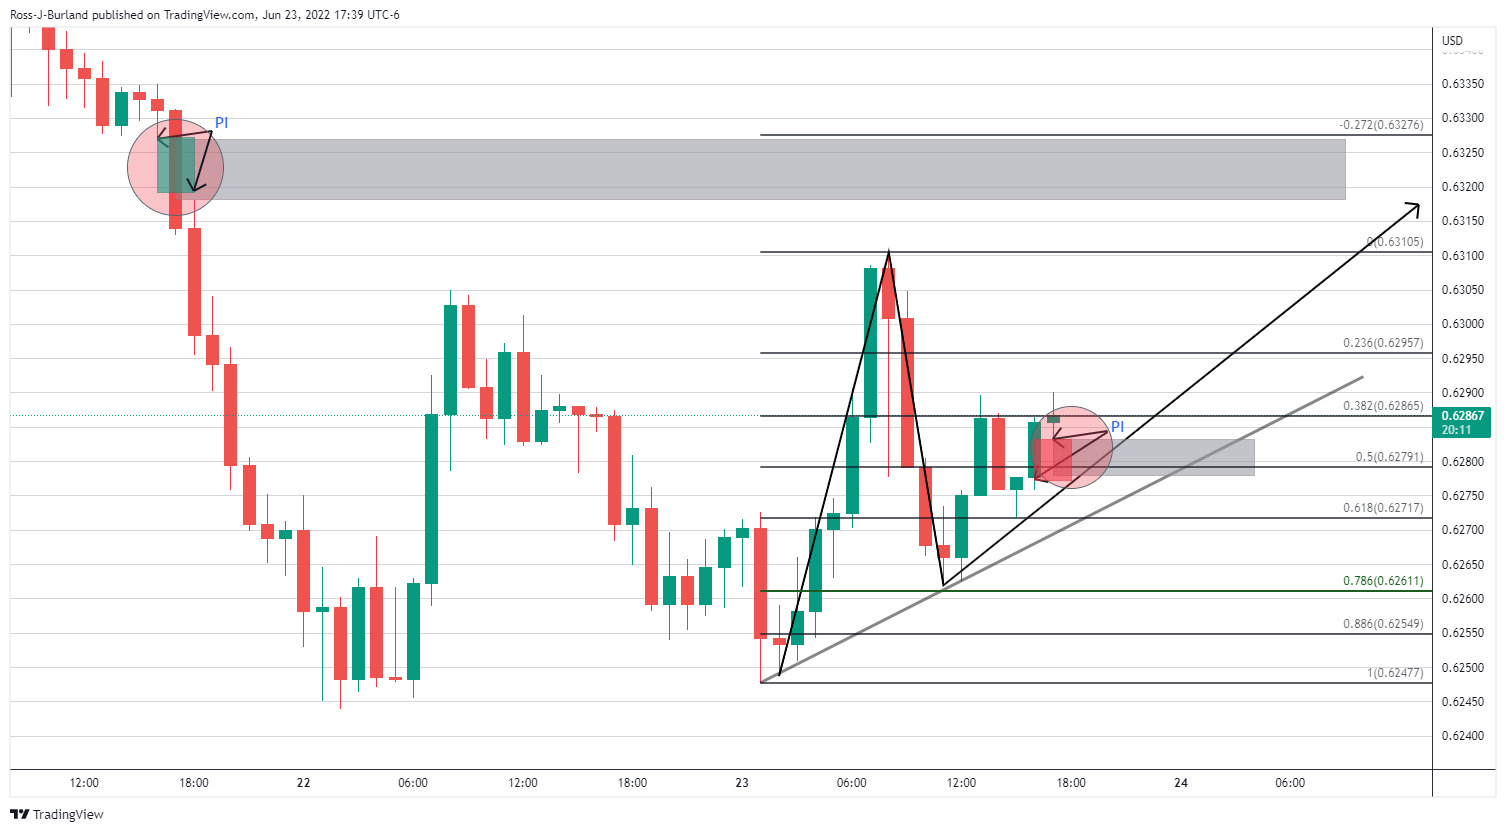
Above 0.6327, which is the 'confirmed' bias given the recent break of hourly structure...
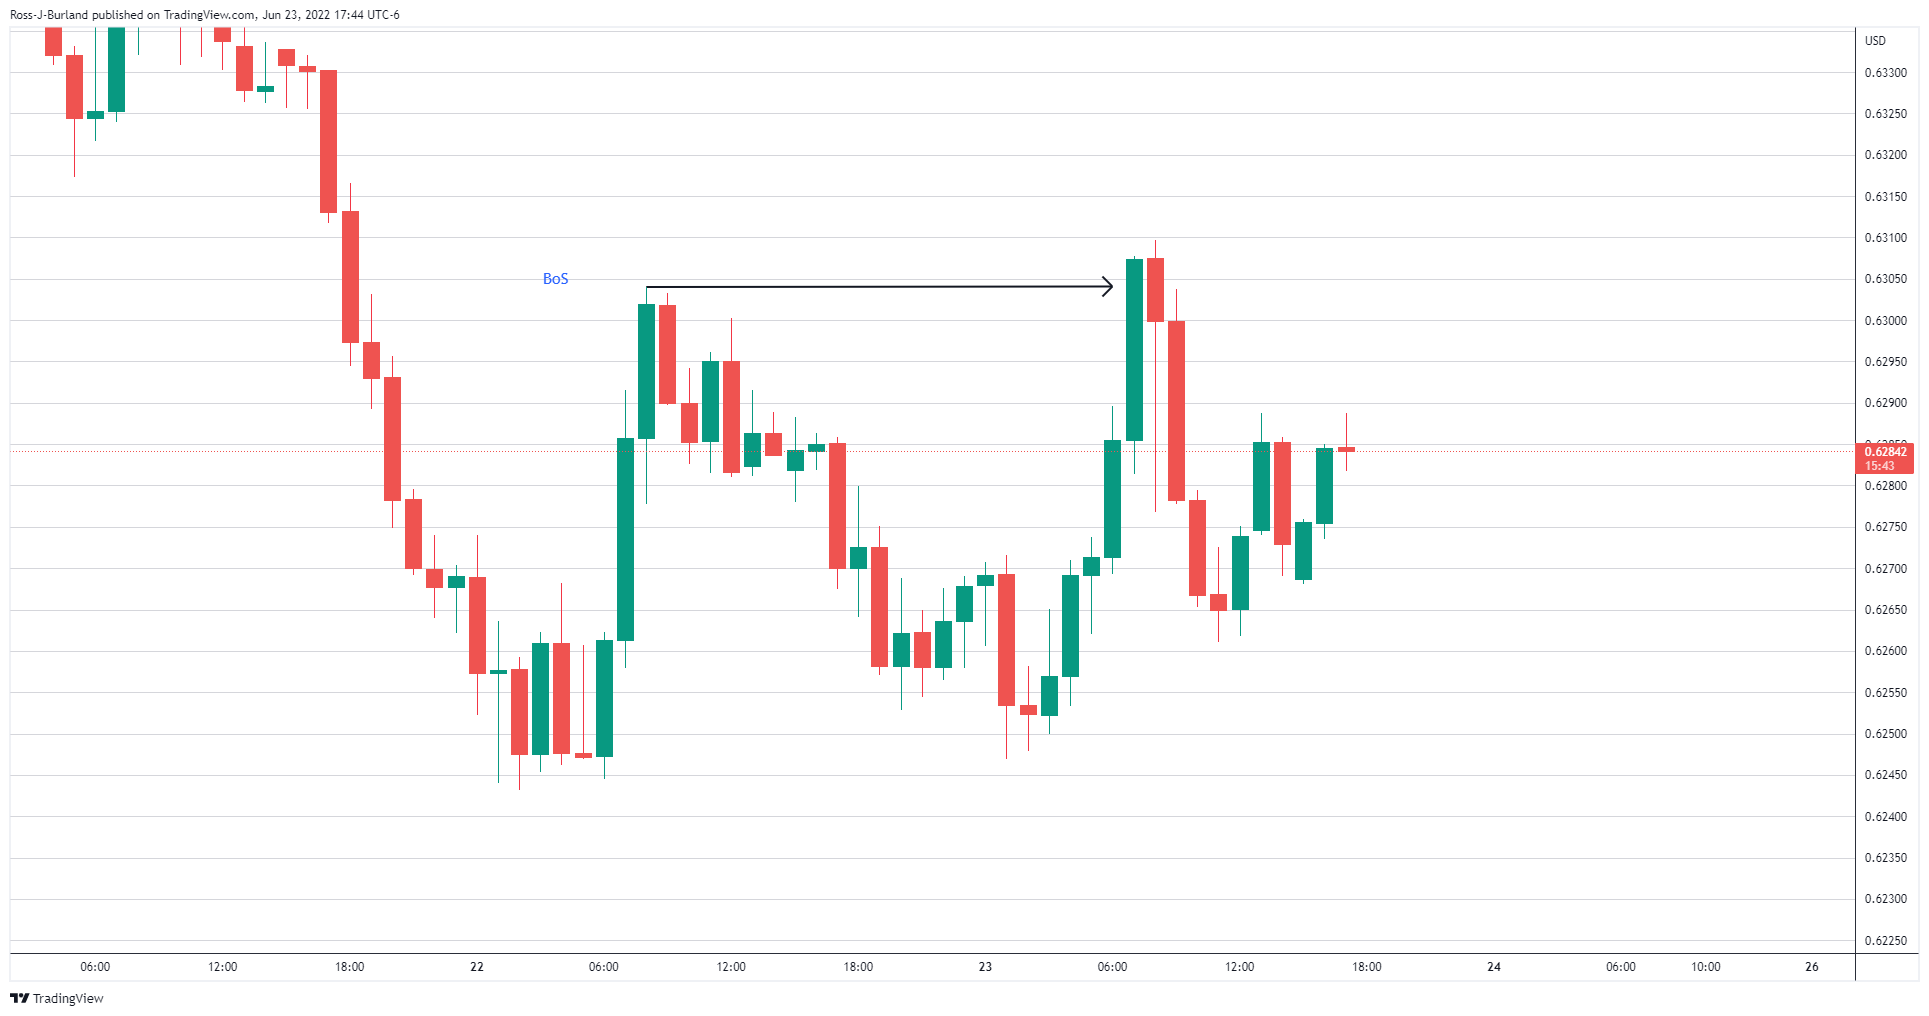
... the bulls can stay focussed on the original target area on the order block:
Switching broker, from chart to chart, the point of control of the prior highs and the order block is located, depending on the broker and price feed, at around 0.6335 while the midpoint of the order block is located at around 0.6330. These can both be used as reference points of interest.
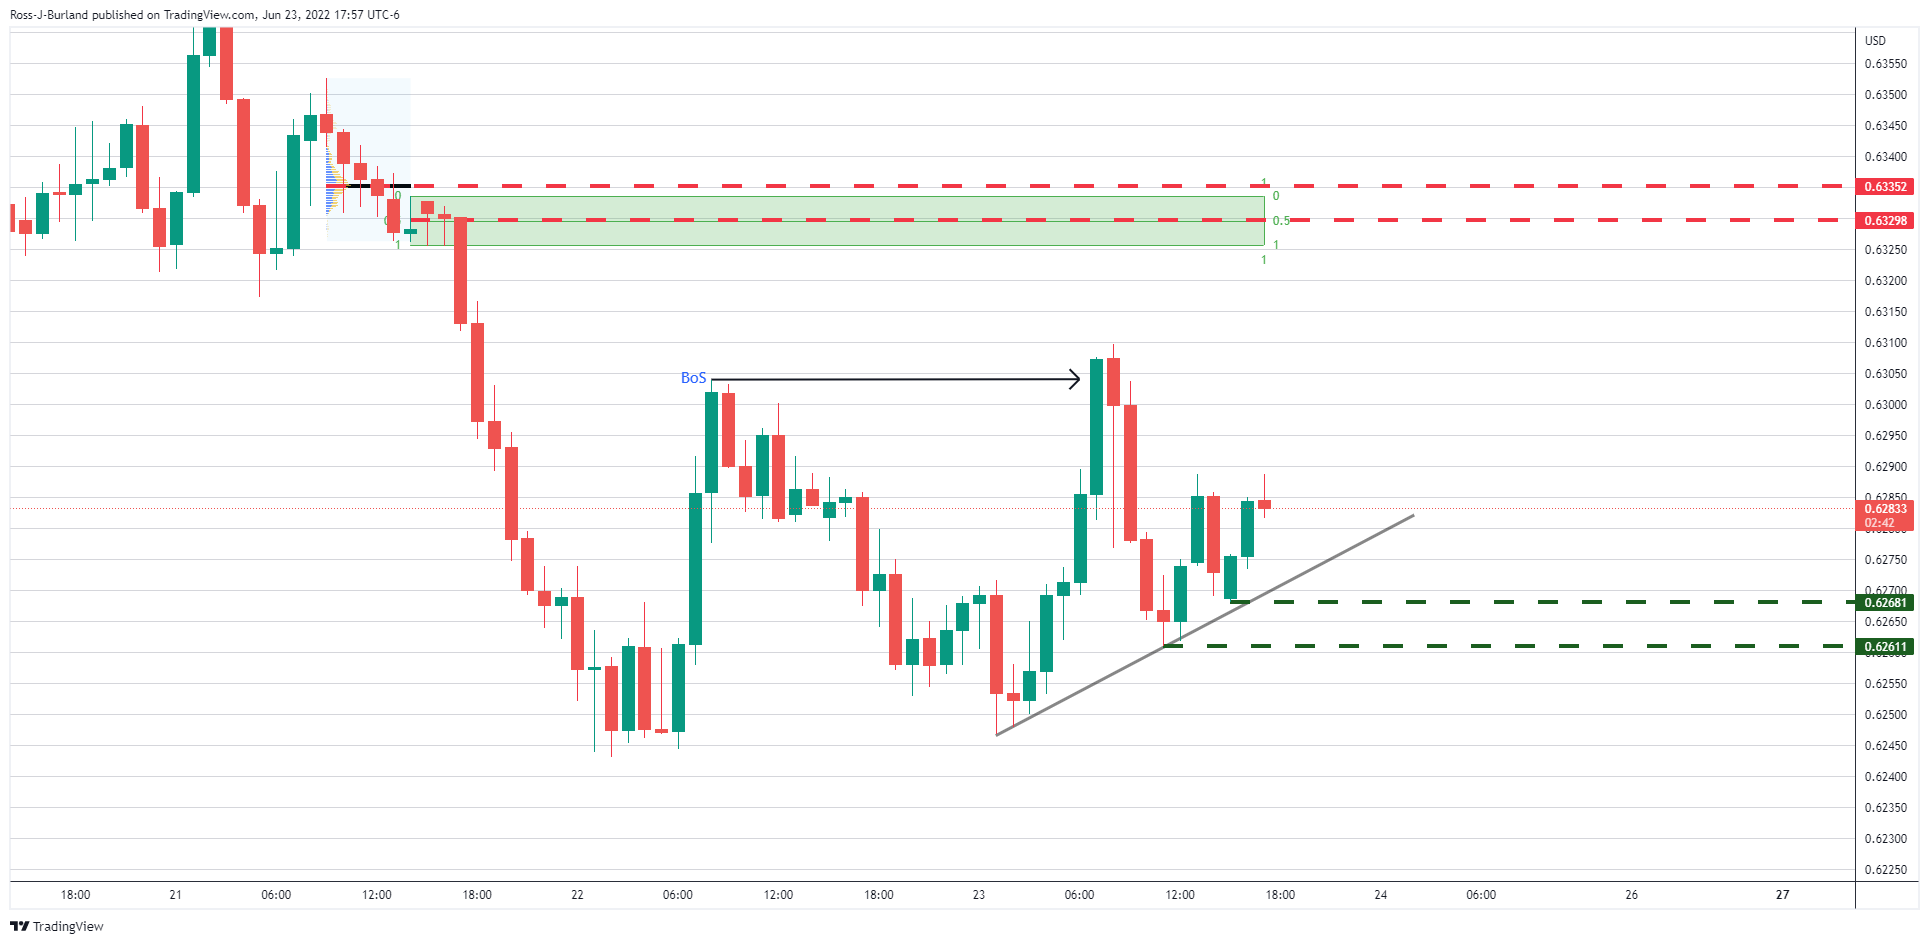
On the downside, the bulls need to stay in control above the market structures and swing lows around 0.6270 and 0.6260.
From a short-term perspective, on the 1-min chart, there are a couple of imbalances that will likely be mitigated in the meantime in the 0.6290s and the 0.6275s:
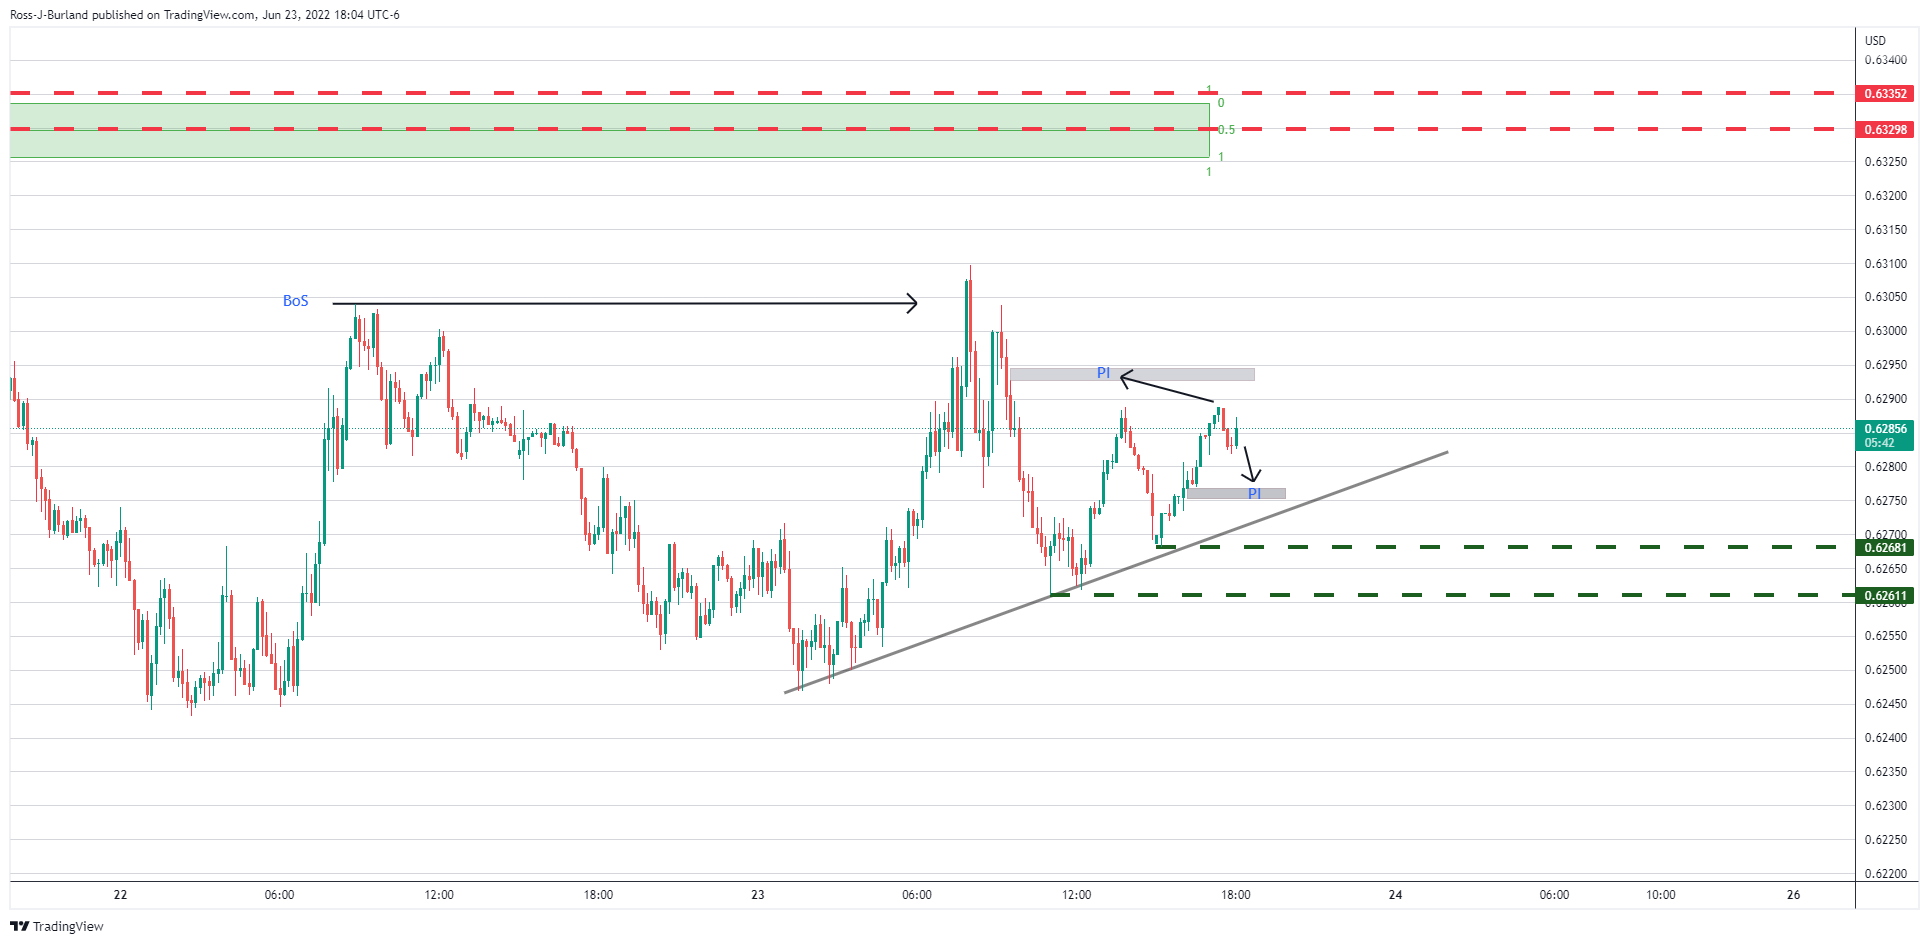


© 2000-2026. Bản quyền Teletrade.
Trang web này được quản lý bởi Teletrade D.J. LLC 2351 LLC 2022 (Euro House, Richmond Hill Road, Kingstown, VC0100, St. Vincent and the Grenadines).
Thông tin trên trang web không phải là cơ sở để đưa ra quyết định đầu tư và chỉ được cung cấp cho mục đích làm quen.
Giao dịch trên thị trường tài chính (đặc biệt là giao dịch sử dụng các công cụ biên) mở ra những cơ hội lớn và tạo điều kiện cho các nhà đầu tư sẵn sàng mạo hiểm để thu lợi nhuận, tuy nhiên nó mang trong mình nguy cơ rủi ro khá cao. Chính vì vậy trước khi tiến hành giao dịch cần phải xem xét mọi mặt vấn đề chấp nhận tiến hành giao dịch cụ thể xét theo quan điểm của nguồn lực tài chính sẵn có và mức độ am hiểu thị trường tài chính.
Sử dụng thông tin: sử dụng toàn bộ hay riêng biệt các dữ liệu trên trang web của công ty TeleTrade như một nguồn cung cấp thông tin nhất định. Việc sử dụng tư liệu từ trang web cần kèm theo liên kết đến trang teletrade.vn. Việc tự động thu thập số liệu cũng như thông tin từ trang web TeleTrade đều không được phép.
Xin vui lòng liên hệ với pr@teletrade.global nếu có câu hỏi.
ngân hàng