- Phân tích
- Tin tức và các công cụ
- Tin tức thị trường
Tin tức thì trường
- Gold prices consolidate recent losses as key SMA confluence test bears.
- US Treasury yields grind higher after refreshing two-year top on Fed rate hike bets.
- Virus woes escalate and so do geopolitical tensions concerning Russia-Ukraine, suggesting safe-havens to stay firmer.
- Second-tier US housing data to decorate calendar, Fed chatters are crucial ahead of next week’s FOMC.
Gold (XAU/USD) prices keep the bounce off weekly low at around $1,815, up 0.05% intraday during Wednesday’s Asian session.
The yellow metal dropped to the lowest since December 11 the previous day as Fed Fund Futures propelled US Treasury yields and the US Dollar Index (DXY). However, geopolitical fears and downbeat sentiment concerning the South African covid variant, known as Omicron, joined US data to pare the losses.
Read: Gold Price Forecast: Poised to resume its decline amid inflation concerns
That said, the DXY dropped the most in 12 days on Tuesday after the Fed Fund Futures cited heavy chances of witnessing the above 1.0% Fed rate during early 2023. With that, the US Treasury bond yields for the 10-year and 2-year tenures rose to the highest levels since early 2020, which in turn weighed on the equities, commodities and Antipodeans. It should be noted that the stated US bond coupons recently dwindle around the highest levels since January 2020 with the benchmark 10-year yields around 1.87% by the press time.
Even so, downbeat New York Fed manufacturing gauge joined escalating fears of a war between Russia and Ukraine to keep the gold buyers hopeful. The NY Empire State Manufacturing Index slumped to negative for the first time in two years in December, -0.7 versus 25.7 expected and 31.9 prior, whereas US NAHB Housing Market Index eased to 83 versus 84 market forecasts and previous readouts.
Also acting as a risk-negative catalyst is the record high covid cases in Australia’s most populous state New South Wales (NSW) as well as worsening virus conditions in Japan and China.
To sum up, escalating chatters over the Fed rate hikes may underpin US dollar strength and can weigh on gold prices. However, other challenges to the risk appetite mentioned above might defend the gold buyers amid a light calendar in the US and Fedspeak blackout.
Read: Fed preview: End of money printing brrrrr – Four 25bp rate hikes this year and QT in September
Technical analysis
As gold buyers lurk around a five-week-old ascending trend line, near $1,805 at the latest, the yellow metal’s recent rebound once again target the 61.8% Fibonacci retracement of November-December downside, near $1,830.
Given the easing bearish bias of the MACD and RSI recovery, not to forget the bull cross of the 50-SMA to 100-SMA, the gold prices are likely to overcome the $1,830 hurdle this time.
However, tops marked in July and September close to $1,834 acts as an extra hurdle to the north before fueling the bullion towards the $1,850 intermediate resistance and November’s peak of $1,877.
Alternatively, a confluence of the stated SMA around $1,811 acts as immediate support before directing gold sellers toward the stated support line near $1,805.
In a case where gold prices decline past $1,805, the $1,800 threshold and 23.6% Fibo. level close to $1,782 should be watched carefully for the precious metal’s further downside.
To sum up, gold buyers regain upside momentum and are likely to overcome short-term hurdle this time.
Gold: Four-hour chart
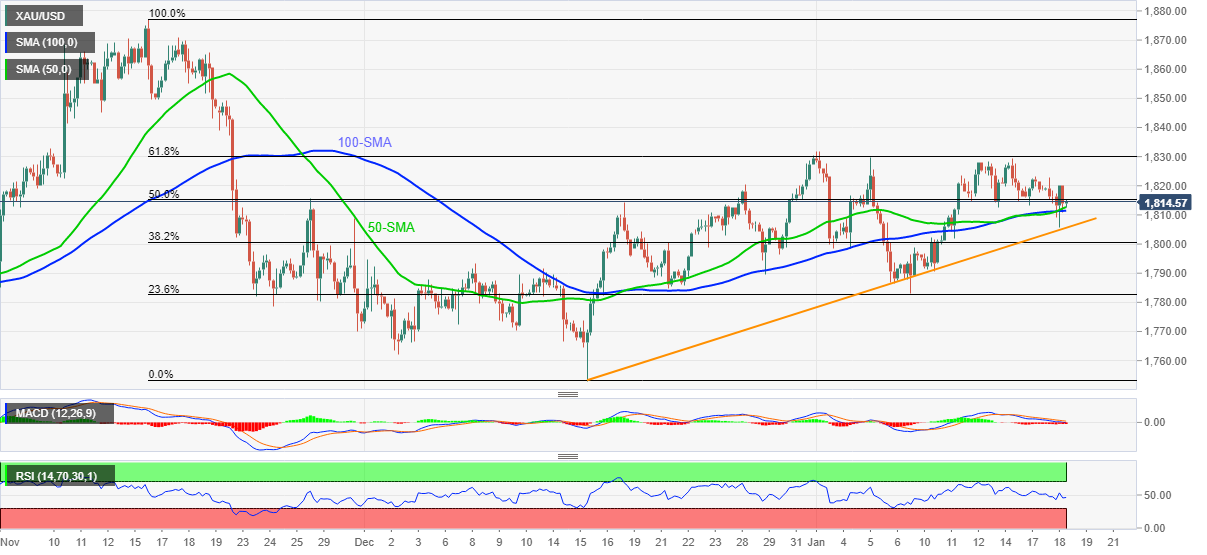
Trend: Recovery expected
Australia has reported a record high of COVID-19 deaths, and its second-largest state declared an emergency in hospitals to cope with surging patient admissions and a staffing shortage due to the coronavirus. Australian Prime Minister Scott Morrison has said in recent trade that he has not received advice to shorten the isolation rules.
The 74 deaths occurred in its three most populous states. New South Wales reported 36, Victoria reported 22 and Queensland 16. The previous daily record was 59 coronavirus-related deaths on Sept. 4, 2020.
More than 2,700 people have died with COVID-19 in Australia, which has a population of 26 million.
Meanwhile, this week, Morrison's approval ratings slid after his handling of the Omicron-driven coronavirus outbreak fuelled a backlash, a widely watched poll showed on Tuesday, putting opposition Labor into a leading position months away from a federal election.
“Boris Johnson is set to announce the lifting of ‘Plan B’ Covid restrictions on Wednesday as a plot to oust him by Tory MPs first elected in 2019 emerged,” said the UK Telegraph during late Tuesday.
The news also mentioned UK PM Boris Johnson to have appeared forlorn in a television interview while apologizing for ‘misjudgments that I have made … whether in Downing Street or throughout the pandemic’.
Key quotes (via Telegraph)
The Cabinet is expected to sign off scrapping work from home guidance and Covid passports at a meeting on Wednesday morning, although some face mask rules could remain.
The Prime Minister gave his first public comments in six days on Tuesday, issuing a "categorical" denial that he was warned that a Downing Street garden drinks event on May 20, 2020, was "against the rules".
Yet as he laid out his defense, a group of 20 recently elected Tory MPs, many representing former Labour heartland "Red Wall" seats, met to discuss his fate in a gathering described as the "pork pie plot".
Those present told The Telegraph the group discussed submitting letters of no confidence together – a move that would markedly increase the political danger for Mr. Johnson. If 54 Tory MPs submit letters to the 1922 Committee, an automatic leadership vote is triggered.
Tory whips believe the number submitted is in the 20s, but one 2019 rebel claimed the 54 threshold could be triggered as early as Wednesday.
FX reaction
Given the mixed news, mostly negative for the GBP/USD prices, coupled with the broad US dollar strength, the cable prices stay pressured around 1.3600 by the press time of early Wednesday morning in Asia. It’s worth noting that the cable prices dropped the most in 12 days the previous day despite firmer UK jobs report on broad US dollar gains.
Read: GBP/USD drops into daily support structure in session lows
“We still have tools at our disposal to deal with rising oil prices and will engage OPEC as needed,” said White House (WH) Spokesperson, per Reuters.
The US diplomat crossed wires as the energy benchmark rallied to the highest since October 2014 while poking $86.50 at the latest.
On a different page, Turkish state-owned media Botas reported an oil pipeline explosion and fire that carries around 450kb/d of crude oil from Iraq to Turkey.
Market implications
WTI crude oil bulls take a breather around the multi-year high of $86.50 following a stellar rally amid fears of US intervention, as well as fresh chatters concerning Omicron weighing on the global energy demand.
Read: WTI eases back to $85.00 level after hitting fresh multi-year highs near $86.00
- USD/CAD holds lower ground after two-day downtrend, bears eye monthly low.
- DXY jumped the most in 12 days on rising bets over faster Fed rate hikes.
- Eight-year high oil price, hopes of BOC rate increase defend bears.
- US housing data will join BOC CPI and risk catalysts to direct short-term moves.
USD/CAD struggles to defend the 1.2500 threshold after it became an exception to the G10 currency pairs that slumped versus the US dollar rally the previous day. That said, the quote seesaws near 1.2515 during the initial hours of Wednesday’s Asian session.
In doing so, the quote justifies strong prices of Canada’s main export item WTI crude oil as well as the rising bets on the Bank of Canada (BOC) rate lift ahead of the BOC Consumer Price Index (CPI) data.
That said, WTI crude oil prices rose to the highest since October 2014 while closing around $85.84 at the end of Tuesday’s North American trading session. The oil benchmark not only cheered hopes of economic recovery but also benefited from geopolitical tensions between Russia and Ukraine.
Elsewhere, interest rate futures hint at 70% probabilities favoring the BOC to announce a rate hike during the next week’s monetary policy meeting. However, that makes today’s inflation data all the more important. Forecasts suggest that the key BOC CPI Core ease to 3.5% versus 3.6% prior while the headlines Consumer Price Index for December may rise to 4.8% from 4.7% previous readouts.
It should be noted that the US Dollar Index (DXY) jumped the most since January 03 the previous day as the Treasury bond yields jumped to early 2020 days amid escalating hopes of faster rate hikes by the Federal Reserve. Adding to the bullish bias are worsening virus conditions and Russia-Ukraine tussles.
Talking about data, NY Empire State Manufacturing Index slumped to negative for the first time in two years, -0.7 versus 25.7 expected and 31.9 prior. Further, US NAHB Housing Market Index eased to 83 versus 84 market forecasts and previous readouts. At home, Canada Housing Starts declined below 270K expected to 236.1K, versus upwardly revised 303.8K prior.
Moving on, the USD/CAD pair may remain range-bound as both, namely the USD and the CAD, are the biggest winners of the G10 currencies and oil prices have fewer hurdles to the north on crossing the $85.00 hurdle. In addition to the Canadian data, US housing market numbers and virus updates will also be important to watch for clear direction.
Technical analysis
Although the 100-DMA and a monthly resistance line restrict the short-term upside of the USD/CAD prices respectively around 1.2620 and 1.2635, the bears need to conquer the 200-DMA and an upward sloping support line from June, close to 1.2500 and 1.2460 in that order to excel.
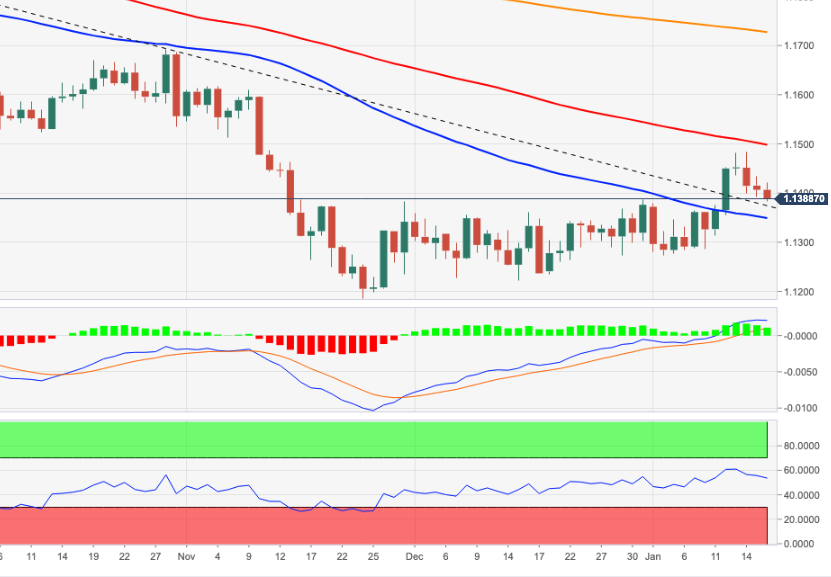
- EUR/USD holds lower grounds at weekly bottom after the biggest daily loss in two weeks.
- 50-DMA, two-month-old rising support line confine further declines.
- Clear break of horizontal area from November, MACD conditions keeps sellers hopeful.
- Buyers remain away until the quote stays below 100-DMA.
EUR/USD seesaws around 1.1320-25 during early Wednesday morning in Asia, having dropped the most in 12 days the previous day.
The major currency pair’s slump on Tuesday dragged MACD towards teasing the bears while breaking a two-month-long resistance-turned-support area of around 1.1380-85.
However, the 50-DMA level surrounding 1.1325 restricts the EUR/USD pair’s immediate declines ahead of an upward sloping support line from late November, close to 1.1300 at the latest.
Given the MACD conditions and a clear break of the key supports, EUR/USD prices are likely to conquer the 1.1300 support line, which in turn could drag the quote towards the 2021 bottom surrounding 1.1185.
During the fall, the 1.1230 and the 1.1200 threshold may offer an intermediate halt.
On the contrary, corrective pullback remains elusive below the horizontal area from November 16, near 1.1380-85.
Following that, the 50% Fibonacci retracement (Fibo.) level of October-November 2021 downside, near 1.1440, will test the EUR/USD buyers.
Even if the pair prices rise beyond 1.1440, 100-DMA and 61.8% Fibo. level, respectively around 1.1490 and 1.1500, will be tough resistances to break for the bulls.
EUR/USD: Daily chart
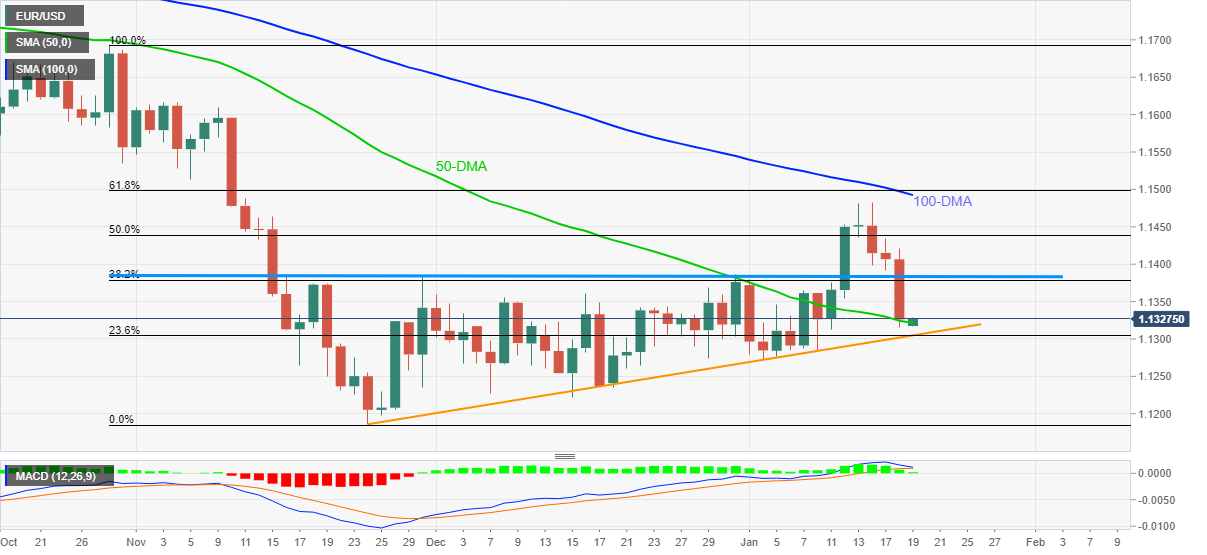
Trend: Further weakness expected
It has been another day of volatility and risk-off as US yields surged. The US 10-year yield hit a two-year peak of 1.866% overnight. In line with Treasury yields, the US dollar strengthened against a basket of currencies, hitting a one-week high of 95.83 DXY.
Conflict is a concern as Russia’s aggression toward Ukraine has prompted a reaction from the likes of the UK. Officials at the UK Foreign Office have been told to be ready to move into “crisis mode” at very short notice.
“This is critical work in shaping and securing our European neighbourhood,” staff were told in a communication.
However, “crisis mode” is not an indication the UK government thinks an invasion is imminent or definitely happening, but part of putting precautionary plans in place that would shuffle staff to higher priority areas and allow the FCDO to move quickly if the status is triggered, Bloomberg reported.
Nevertheless, there are reports that the UK is sending light, anti-armour, defensive weapon systems to Ukraine to help Ukraine increase its defensive capabilities.
Meanwhile, the White House said Tuesday that the current tensions presented an "extremely dangerous situation."
"We're now at a stage where Russia could at any point launch an attack in Ukraine," White House press secretary Jen Psaki told a press conference.
Meanwhile, it's expected that if Russia were to invade Ukraine, NATO would be likely to raise its alert level This would entail sending reinforcements of its troops in the Baltics and Poland and even in southeastern Europe.
This in turn would be a challenge for the EU. If Russia does invade, the EU would be likely to impose sanctions on Russia and risk a cut in supplies of gas to Europe (energy prices are already sky-high and inflation is a burden on the economy).
All in all, the US dollar, yen and Swiss franc are ones to watch, so too is gold; all of which are the typical safe havens.
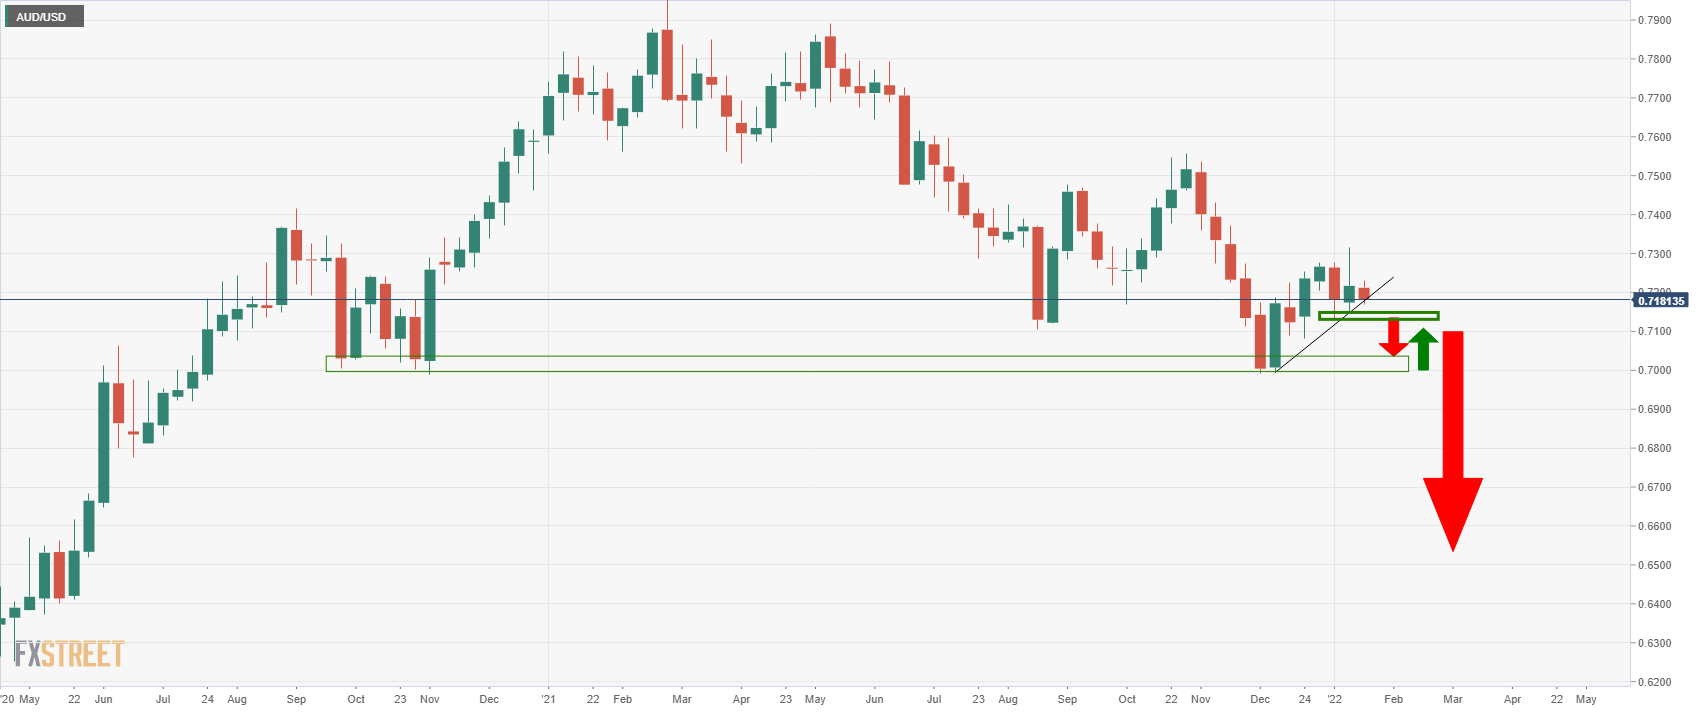
- AUD/USD is breaking into key support and the focus is on 0.7150.
- Bears will be looking for a significant breakout below trendline support.
As per the prior analysis, AUD/USD Price Analysis: Consolidation in play, 0.7150 eyed while below 0.7230, daily support is key, the bears took over and now the bullish outlook based on the inverse head & shoulders is invalidated.
AUD/USD prior analysis
AUD/USD Price Analysis: Inverse H&S in the making from 0.7200 support
The above was an article that had identified the prospects of a bullish inverse head & shoulders taking shape on the daily chart.
AUD/USD was on the verge of either a break to the upside of a run below critical daily support, as follows:

However, due to the surge in US yields and the greenback following suit, the bears have taken over and broken a critical daily support structure.
AUD/USD inverse H&S invalidated
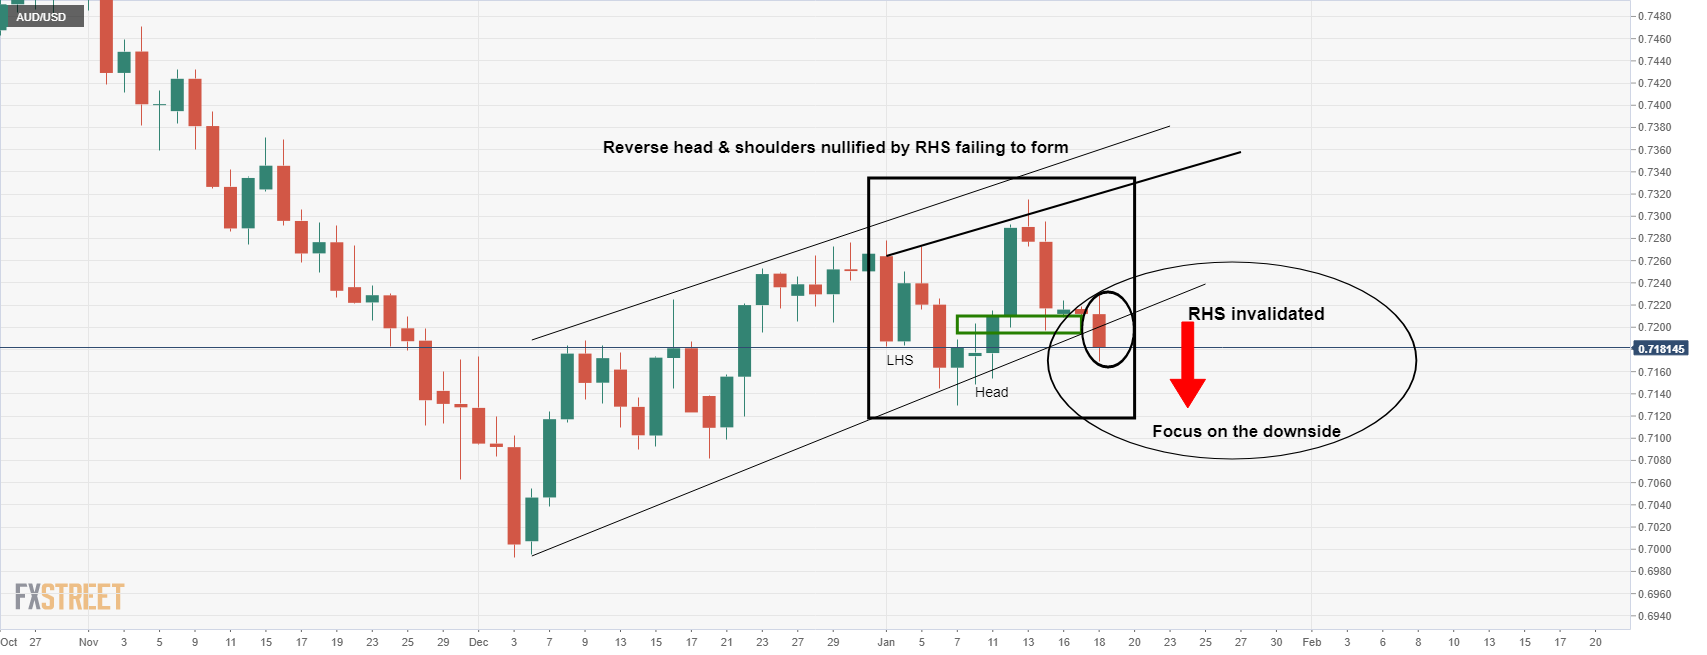
In turn, this has invalidated the bullish inverse head & shoulders pattern leaves 0.7150 exposed for the session ahead. 0.7150 could be the last stop before a significant sell-off below daily trendline support:
- US equities were broadly lower on Tuesday, as Fed tightening fears hit tech and weak Goldman Sachs earnings hit financials.
- The S&P 500 dropped 1.8%, the Nasdaq 100 dropped over 2.5% and the Dow dropped 1.5%.
- The S&P 500 dropped back under 4600 to hit fresh annual lows.
US equity markets experienced broad selling pressure on Tuesday, with the S&P 500 dropping 1.8% to slide back below 4600 and hit fresh annual lows, the Dow dropping 1.5% to slip under 35.5K and the Nasdaq 100 losing over 2.5%. Market commentators generally referred to “Fed tigthening fears” as the major driver of the downside. Michael O’Rourke, chief market strategist at JonesTrading commented that “we're having a repricing going on as the market prepares for interest rate hikes and we still have a bit of a ways to go to prepare for three rate hikes or four rate hikes”.
Despite a sharp rise in US government bond yields that hit tech/growth names hard (hence Nasdaq 100 underperformance), financial stocks were unable to benefit, with the S&P 500 GICS financials sector losing over 2.0% on downbeat Goldman Sachs earnings. Shares of the bank lost over 7.0% and hit their weakest levels since last May after earnings missed bottom-line expectations amid weak trading activity. The only sector in the green was energy, with the S&P 500 GICS sector up 0.2% amid a surge in oil prices to multi-year highs (with WTI near $86.00 per barrel).
In terms of the other major GICS sectors, the big tech-heavy Information Technology and Communication Services sectors lost 2.4% and 1.9% respectively while the Consumer Discretionary sector lost 2.0%. Consumer Staples, Industrials, Health Care, Materials and Utilities all lost between 1.1% to 1.6%. The broad selling pressure on Tuesday market a change in conditions compared to recent sessions which had been characterised more by rotation between “value” (incoming generating, low multiple) names to “growth” (low incoming generating, high multiple) names. As Fed rate hike expectations have amped up in sessions, investors have dumped growth stocks in favour of value.
The S&P 500 value index is down just 0.4% over the past five-session versus 2.7% losses in the S&P 500 growth index. Recent investment bank surveys allude to the souring of sentiment towards tech/growth names. BoA fund manager survey on Tuesday showed managers had aggressively cut their overweight tech positions to the lowest levels since 2008. Meanwhile, a survey conducted by Deutsche Bank found that most respondents see the US technology sector as in a bubble.
- USD/CAD has pulled back from over-1.2550 highs to trade back just above its 200DMA at 1.2500 again.
- Crude oil upside and hawkish BoC bets has largely insulated CAD from the US dollar’s advances on Tuesday.
USD/CAD has had a subdued session on Tuesday, with the pair having dropped back to trading just above its 200-day moving average at the 1.2500 level after briefly surpassing the 1.2550 mark midway through US trade. Surging crude oil prices that saw front-month WTI futures hit multi-year highs near the $86.00 per barrel level continued to provide the loonie with tailwinds, as has so often been the case in recent weeks (WTI is up nearly $20 from its December 20 lows). But this wasn’t enough to push USD/CAD below support in the 1.2500 area, with the pair supported by a broad recovery in the US dollar as US government bond yields advanced to reflect new hawkish Fed tightening bets ahead of next week’s meeting.
The net result is that USD/CAD looks set to end the session broadly flat, with both CAD and USD amongst the best G10 performers on the day, with the latter having shrugged off a disappointing NY Fed manufacturing survey for January. The loonie also shrugged off downbeat data in the form of underwhelming Housing Starts figures for December (which came in at 236.1K versus 270K forecasts). That’s likely because CAD continues to derive support from Monday’s bullish (though admittedly out-of-date given its compilation was pre-Omicron) BoC Business Outlook Survey (BOS), the headline index of which hit a new record high.
In wake of the BOS, CAD short-term interest rate markets are now pricing in a 70% chance that the BoC hikes rates at next week’s meeting. Given the BoC hasn’t even yet signalled a willingness to hike rates in Q1 2022, let alone the first month of 2022, that might be a bit of a stretch. At the very least, if the central bank doesn’t hike next week, it will likely signal a willingness to do so in the March meeting to keep pace with the Fed. Wednesday’s Canadian Consumer Price Inflation data (for December) will be viewed in the context of how it affects money market pricing for a rate hike in January and is the next key event to watch for USD/CAD traders.
An upside surprise could push USD/CAD below the big 1.2500 figure and on towards a test of recent lows in the 1.2450 area. A surprise January rate hike coupled with further crude oil markets gains (many commodity strategists see Brent hitting $100 later in the year amid a tighter than forecast market) could combine to send the pair back towards a test of last Q4 2021 lows in the 1.2300 area.
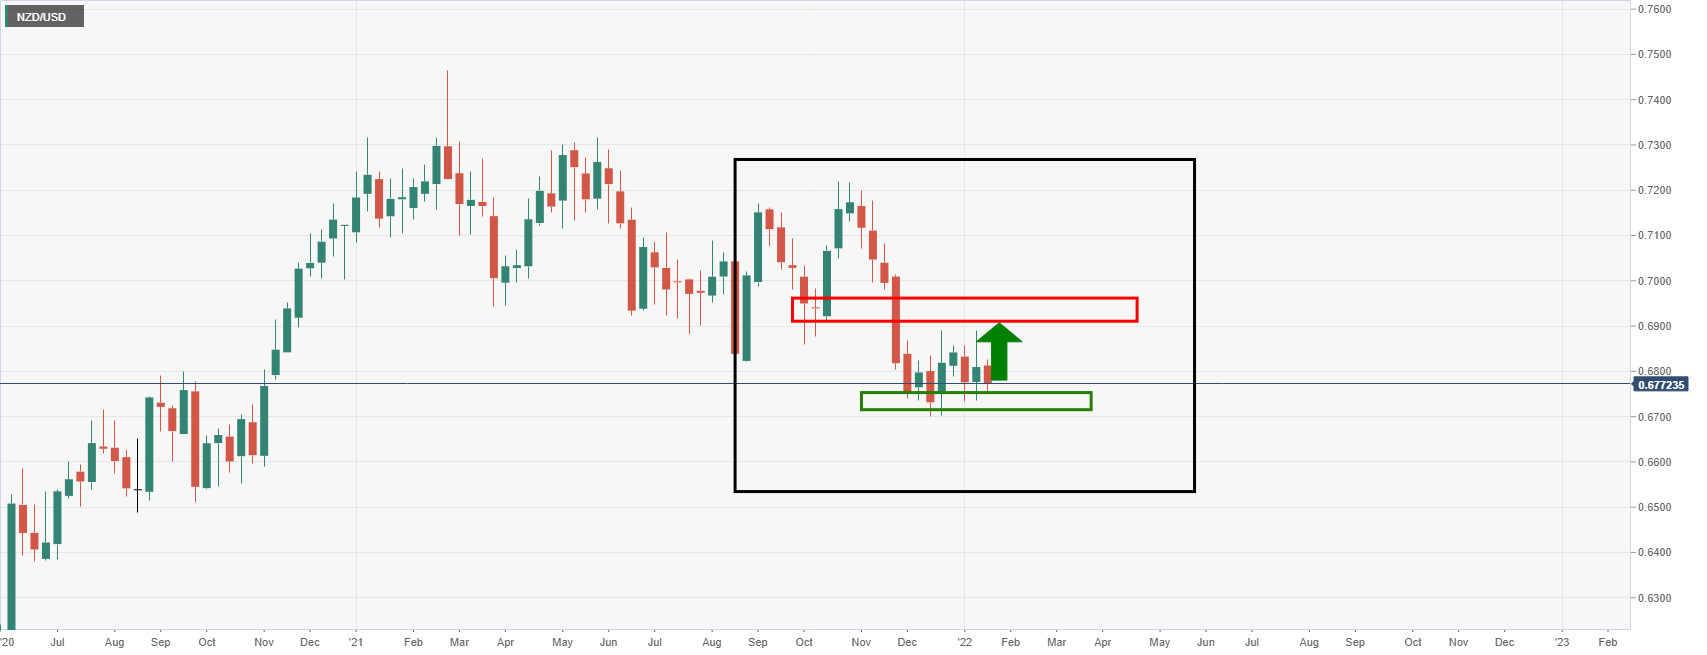
- NZD/USD bulls are stepping back in and eye the weekly M-formation's neckline near 0.6930.
- The US dollar and US yields are the driving forces mid-week.
NZD/USD was under pressure on Tuesday but is making an advance into the closing hours of the New York session, trading at 0.6773 after climbing from a low of 0.6752. The pair had been as high as 0.6808 at the start of the day before an almightly surge in the greenback.
benchmark US Treasury yields jumped to two-year highs and major equity market indexes dropped more than 1% on Tuesday as traders braced for the Federal Reserve to be more aggressive in tightening monetary policy to tackle inflation.
The US dollar struck a six-day high following the jump in Treasury yields. The US 10-year yield also hit a two-year peak of 1.866% overnight. In line with Treasury yields, the dollar strengthened against a basket of currencies, hitting a one-week high of 95.83 DXY.
As for risk appetite, the Dow Jones Industrial Average sank by over 1.9% to 35,262 and the S&P 500 dropped 1.9% to 4,569.82. The Nasdaq Composite slumped 2.31% to 15,238. All sectors were in the red as volatility remains in play at the start of the year, weighing on the high beat currencies and dollar bloc.
''While AUD and NZD have been the two worst-performing G10 currencies since the start of the year, they fared better than the EUR and CAD overnight. All in all, it’s a picture of volatility, and while not extreme, that theme is likely to carry through the year as global central banks look to tighten and rein in cash liquidity,'' analysts at ANZ bank argued.
''Yesterday’s NZIER QSBO data added fuel to the debate around how much more tightening might be delivered here. The survey pointed to a stretched labour market and to ongoing inflation pressures, but in a world where everyone else is also tightening, that may not help the NZD.''
NZD/USD techncial analysis
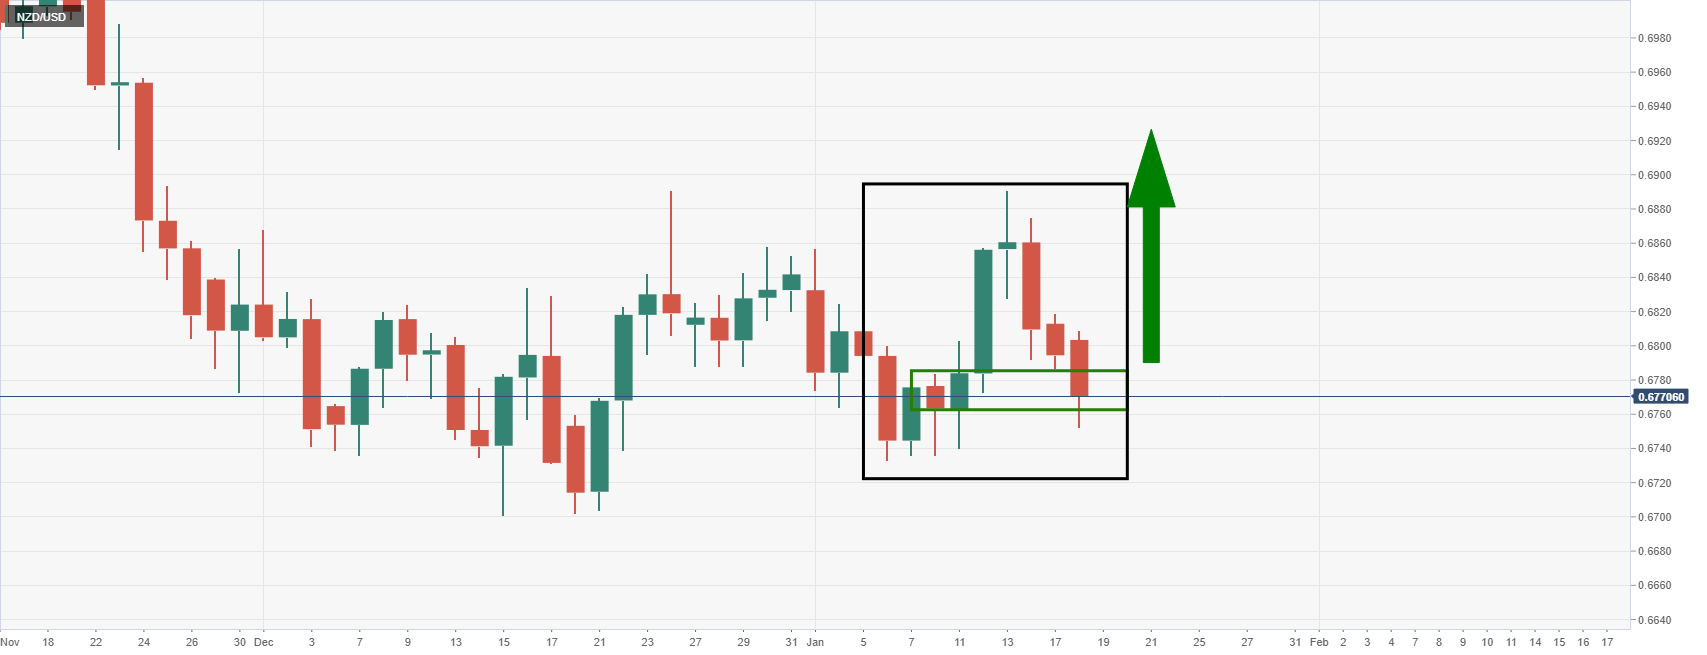
The bird is going through what could be a period of accumulation per the weekly chart's M-formation and neckline at 0.6930 as the target:
What you need to know on Wednesday, January 19:
The American dollar is the overall winner, up against all of its major rivals. US Treasury yields soared to levels last seen in February 2022, with the yield on the 10-year note reaching 1.856% and that on the 2-year note surpassing 1%. Stocks edged lower, with global indexes ending the day in the red.
The EUR/USD pair is currently trading at around 1.1420, despite an encouraging German ZEW survey, showing a sharp bounce in Economic Sentiment.
The GBP/USD pair broke below 1.3600, ignoring UK employment figures. The unemployment rate eased to 4.1% in the three months to November, while the unemployment claimant fell by 43.3K in December. Meanwhile, the scandal about the Downing Street parties in the worst of the UK lockdowns puts PM Boris Johnson leadership at risk.
At the beginning of the day, the Bank of Japan announced its decision on monetary policy. As widely anticipated, the central bank remained on hold, although policymakers revised to the downside their growth forecasts for this fiscal year. The USD/JPY pair peaked at 115.05, but trimmed gains ahead of the close and ended the day unchanged at around 114.50.
AUD/USD fell to 0.7170, bouncing modestly ahead of the close. Weaker gold prices put additional pressure on the pair, as the bright metal settled around $1,814 a troy ounce.
The USD/CAD pair posted a modest intraday advance, as higher oil prices limited CAD’s weakness. WTI trades at $84.50 a barrel after reaching its highest since October 2014.
Top 3 Price Prediction Bitcoin, Ethereum, XRP: Crypto market seems ready to rally
Like this article? Help us with some feedback by answering this survey:
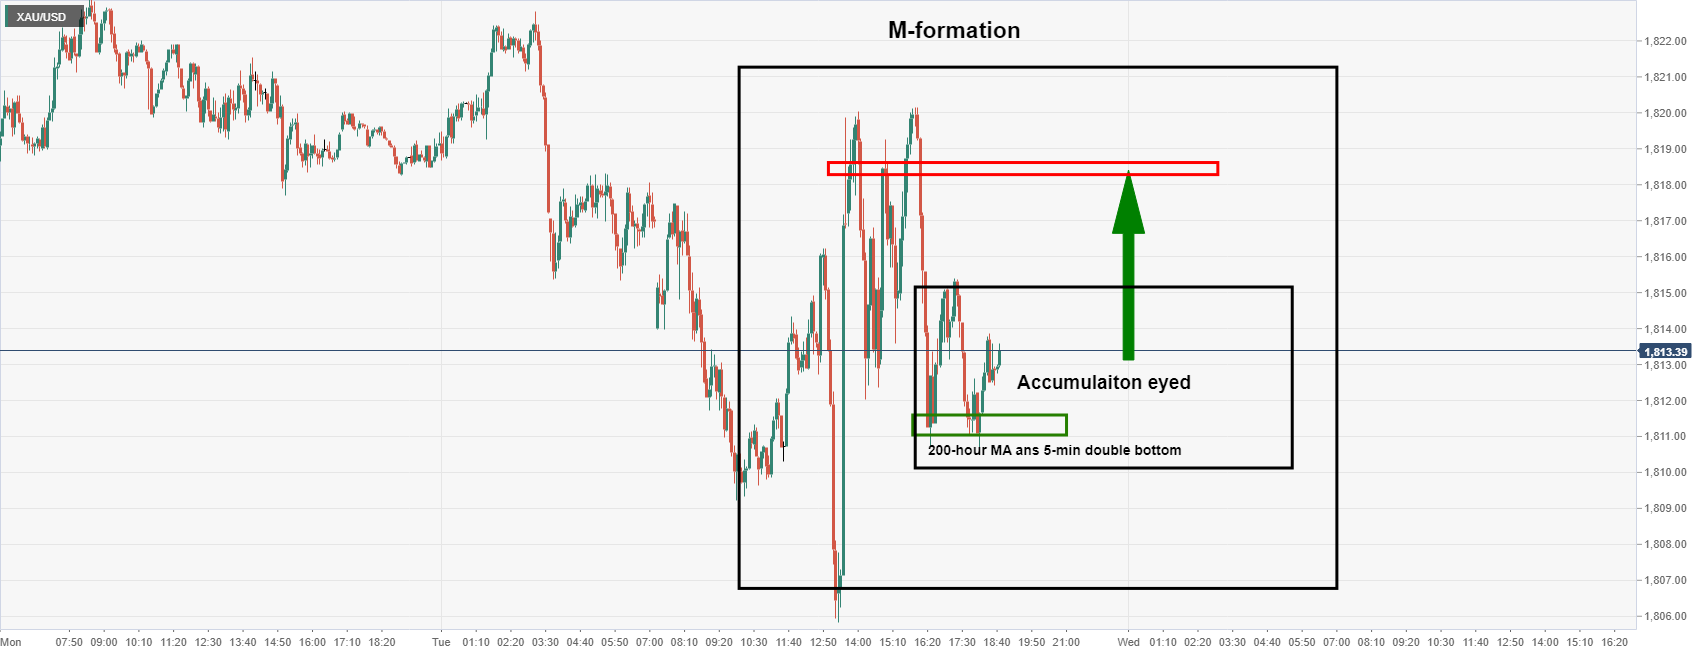
- Gold bulls are stepping in and accumulation following the hourly bearish impulse is in play.
- US dollar remains firm but US 2-year yields are topping out. A correction to $1,818 is eyed for the sessions ahead.
At $1,813.56, gold, XAU/USD, is attempting to correct the New York session's sell-off from $1,820 and has eyes to $1,1818 within an otherwise bullish trend as determined by the 200 moving average. The US dollar strength has, until now, undermined the performance of the bulls but despite the fresh highs in the greenback, gold is robust.
The 2-year US Treasury yield is slowing up which could be helping to support gold prices but overnight, the benchmark US Treasury yields jumped to two-year highs and major equity market indexes dropped more than 1% on Tuesday. Traders have braced for the Federal Reserve to be more aggressive in tightening monetary policy to combat inflationary pressures.
Consequently, the US dollar hit a six-day high following the jump in Treasury yields. The US 10-year yield also hit a two-year peak of 1.866% overnight. In line with Treasury yields, the US dollar strengthened against a basket of currencies, hitting a one-week high of 95.83 DXY.
For the remaining five business days, there are no Fed speakers until Chair Powell’s post-FOMC decision press conference on January 26. ''Given this way US yields are moving, it’s clear that the Fed’s full-court press last week made a significant impression on the bond market,'' analysts at Brown Brothers Harriman explained.
''We fully expect a hawkish hold next week that sets up liftoff at the March 15-16 meeting. WIRP suggests a hike then is now fully priced in, followed by hikes in June, September, and December. The expected terminal Fed Funds rates are also starting to move towards 2.0%, which is a key part of the market repricing,'' the analysts added and noted that the equity markets are finally getting the message.
The Dow Jones Industrial Average sank by over 1.9% to 35,262 and the S&P 500 dropped 1.9% to 4,569.82. The Nasdaq Composite slumped 2.31% to 145,238. All sectors were in the red.
Meanwhile, gold trend-follower positioning is also topping out, leaving fewer marginal buyers in precious metals to offset the aggressive rise in rates, analysts at TD Securities explained.
''As the market continues to pencil in additional Fed rate hikes, with a full 4 hikes priced for 2022 and a near-certain March rate hike priced, precious metals appear vulnerable to a consolidation.''
Gold technical analysis
An interesting development is taking place on the lower time frames in gold for which could equate to a short term opportunity:
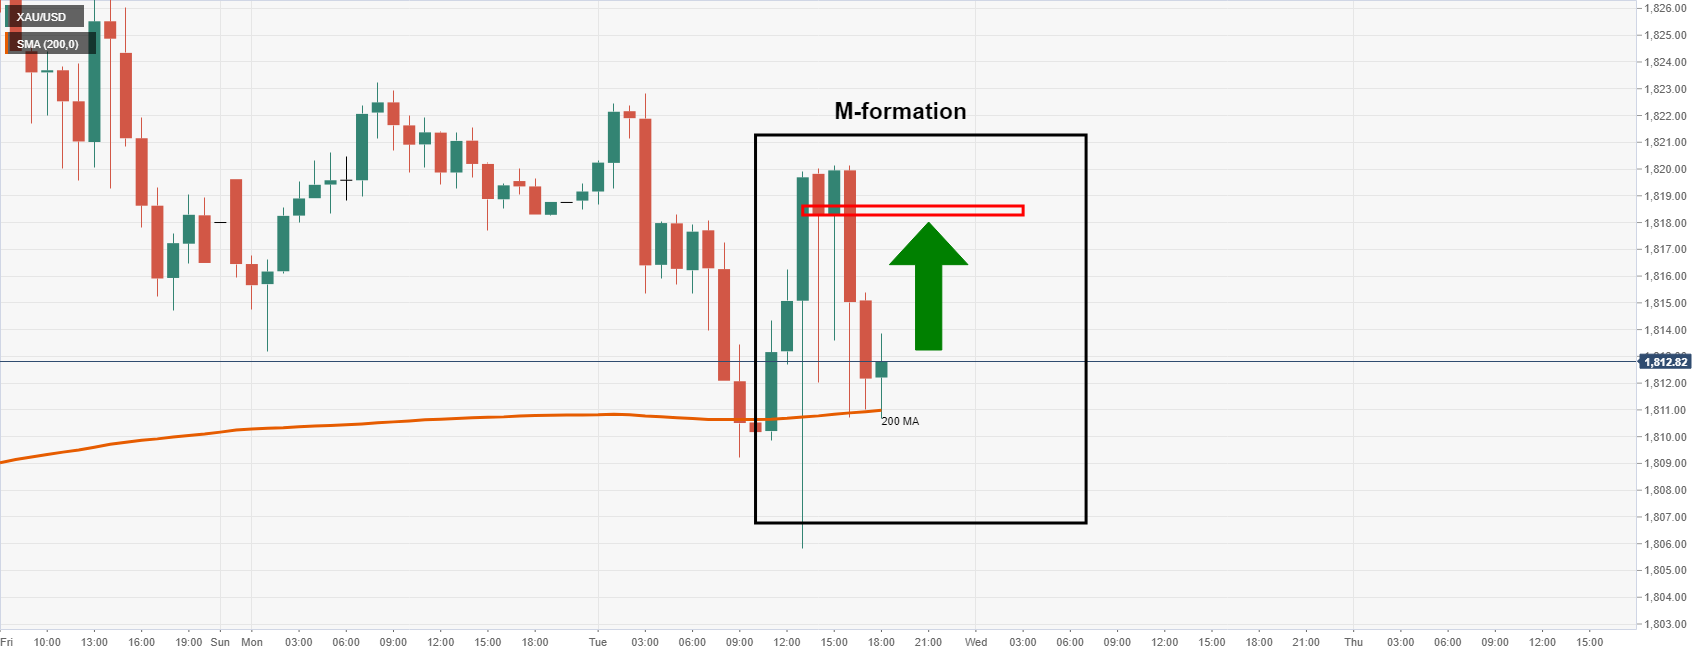
The price is already holding in bullish territory as per the 200-hour moving average. The M-formation is a reversion pattern that has a high completion rate. The price is often drawn in by the neckline of the formation, in this case, this comes in at $1,818.
Traders can take advantage of the lower time frames, such as the five-min chart, and monitor for accumulation and an optimal area to buy into what could turn out to be a correction of the hourly bearish impulse:
- GBP/USD sinks into critical demand territory as the dollar finds demand on a spike in US yields.
- A break below 1.3530 opens risk to the January 3 low a cent lower near 1.3430.
At 1.3574, GBP/USD has fallen some 0.51% on Tuesday from a high of 1.3661 to a fresh low of 1.3573. The surge in US Treasury yields has lifted the US dollar out of the doldrums while UK politics weighs on the tainted British currency as well.
Firstly, benchmark US Treasury yields jumped to two-year highs and major equity market indexes dropped more than 1% on Tuesday as traders braced for the Federal Reserve to be more aggressive in tightening monetary policy to tackle inflation.
The US dollar struck a six-day high following the jump in Treasury yields. The US 10-year yield also hit a two-year peak of 1.866% overnight. In line with Treasury yields, the dollar strengthened against a basket of currencies, hitting a one-week high of 95.83 DXY.
UK politics in focus
The UK's prime minister Boris Johnson is caught up in the ''Partygate'' scandal for which he has denied any wrongdoing and has lied to parliament about a lockdown party. His premiership is under threat. The uncertainty is a negative factor for the pound which is already pressured over European politics in the Brexit saga.
However, in the coming few months ahead, Johnson's popularity and sterling's robustness will be scrutinised once again when local elections are held across England, Scotland and Wales on May 5. A civil investigation in Partygate is underway but it is broadly accepted across the party that removing Johnson before this date would be extremely dangerous, as no one could be certain what the consequence would actually be. This could bring some solace to the pound.
Meanwhile, Brexit is a potentially bigger risk for the pound. despite Truss’ first meeting with EU officials seeming to indicate somewhat of a less confrontational approach, the discussions over the Northern Ireland protocol are still set to prove challenging.
As for UK economic data, British employers added a record number of staff in December failed to prop up sterling, despite the Unemployment Rate that fell slightly to 4.1% (vs. expectations: 4.2%). Both headline and ex-bonus wage growth continued to fall as more base effects disappear from the data, with headline wage growth falling slightly.
''Employment data for the three months ending in November continued to confirm the MPC's view that the transition from the furlough scheme went relatively smoothly,'' analysts at TD Securities explained.
''Moreover, vacancies rose to a record high, further highlighting the tightness of the labour market, and flash December PAYE data shows further signs of strength as it registered +184k despite effects from Omicron.''
''The Bank of England will now turn to tomorrow's inflation release, but as it stands, this labour report should pave the way for another rate hike in February—in line with our expectations—especially as Omicron appears to have had a relatively benign impact on the economy compared to previous waves.''
Casting minds back, in December, the BoE became the first major central bank to raise interest rates since the pandemic took hold in 2020. In response, the cable managed to rally over 4% from its December lows, but has lost ground in the last three sessions.
"Expectations have already run quite far," wrote Commerzbank analyst You-Na Park-Heger.
BoE eyed
She explained that there will be attention paid to what the BoE governor Andrew Bailey has to say on Wednesday when speaking to the Treasury Select Committee when inflation data is also due.
Traders will have noted that Gross Domestic Product data on Friday showed that the UK economy was better off than before the first COVID-19 lockdown which can help to underpin the pound as traders wait to see what will come of the BoE's monetary policy decisions in the coming months.
However, the latest positioning data shows that GBP net short positions have dropped back sharply from their recent highs following the 15 bps December rate hike from the BoE.
''The money market is still positioned for a fair amount of tightening next year though the fact that speculators are still net short of GBP still suggests that some types of investors remain sceptical of its outlook,'' analysts at Rabobank explained.
On the other hand, as analysts at Brown Brothers Harriman point out in a note today, ''WIRP suggests over 90% odds of another hike February 3, followed by hikes at very other meeting that would take the policy rate to 1.25% by year-end.'
The analysts at BBH said that they ''think this pricing overstates the BOE’s need to tighten, as headwinds abound from Brexit, higher energy costs, and fiscal tightening. ''
''Along the way, Quantitative Tightening will also kick in as the policy rate moves higher. The hawkish BOE outlook that had helped sterling outperform is getting crowded out a bit lately by the more hawkish Fed outlook. ''
GBP/USD technical analysis
Cable is down three straight days:
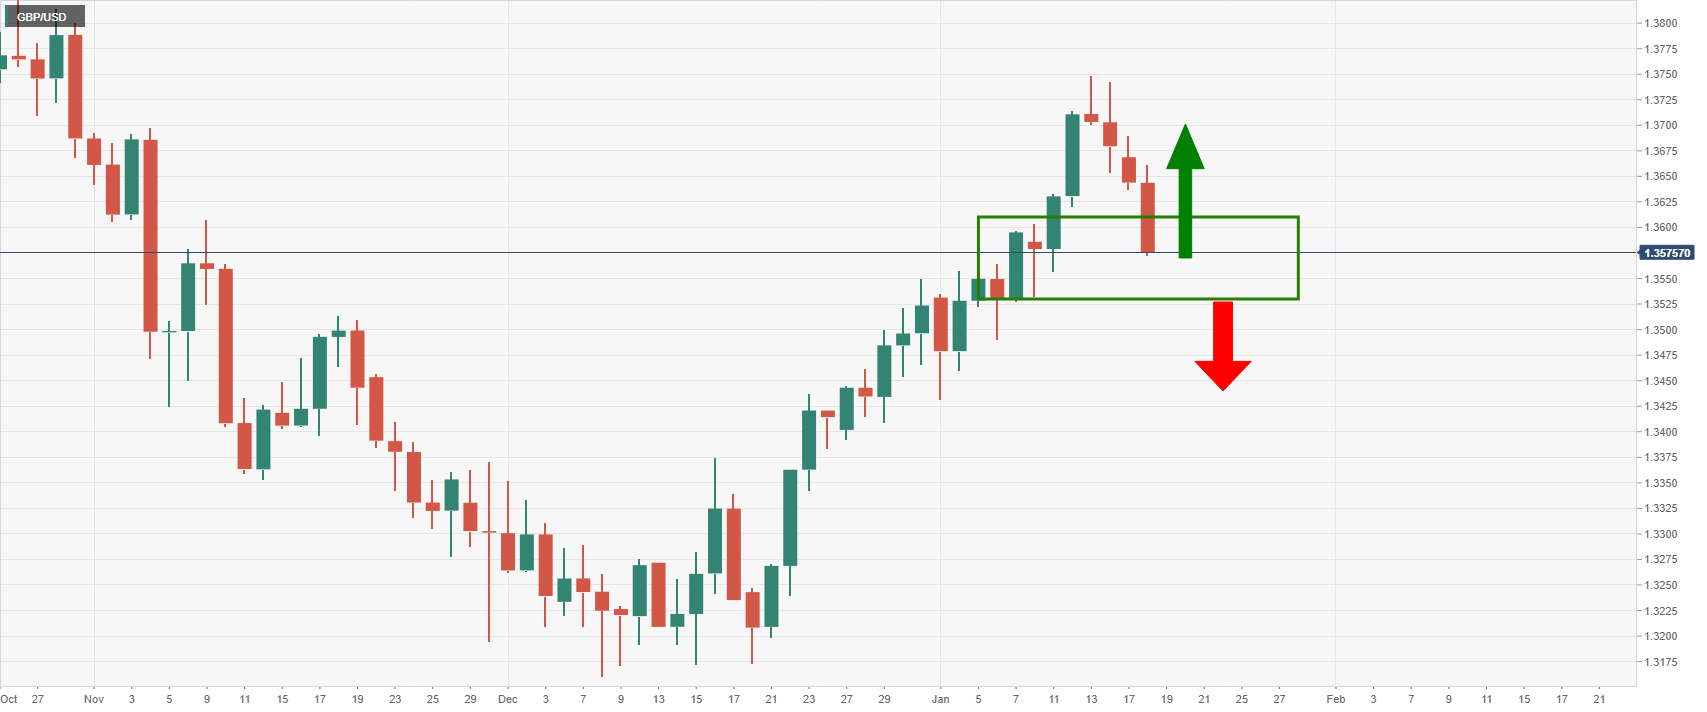
A break below 1.3530 opens risk to the January 3 low a cent lower near 1.3430.
France central bank head and ECB governing council member François Villeroy de Galhau reiterated on Tuesday that French inflation is likely to fall back under 2.0% by the end of 2022. However, should inflationary pressures prove more persistent, he added, he has no doubt that the ECB would adapt its monetary policy faster.
Market Reaction
EUR/USD selling continues and the pair has now dipped below its 50 and 21-day moving average to trade in the 1.1320s, down about 0.7% on the day. Recent losses do not appear to have anything to do with Villeroy's latest remarks which did not contain any new information/angles on ECB policy.
- AUD/NZD stuck close to its 21DMA on Tuesday just above 1.0600.
- Weak weekly Australia Consumer Confidence data was negated by a pessimistic NZ business survey.
- NZIER’s survey was also very inflationary, however, supporting the case for RBNZ rate hikes this year.
As has been the case for most of the last four sessions, AUD/NZD spent most of Tuesday’s session trading close to its 21-day moving average, which currently resides close to 1.0610. That means the pair continues to trade well within the 1.0580-1.0650ish ranges that have prevailed so far in 2022. Weekly Australia ANZ Consumer Confidence data release on Tuesday showed another sharp deterioration in confidence as Omicron continues to rage across Australia.
The Australian bank’s measure of consumer sentiment slid dropped 7.6% last week to its lowest since October 2020, below its levels during the surge in Delta infections during 2021 that saw certain areas of the country enter prolonged lockdowns. But the week data did not send AUD/NZD below 1.0600 as it was negated by equally downbeat data out of New Zealand. According to the think tank NZIER’s quarterly survey of business opinion (QSBO), a net 28.0% of surveyed companies expect general business conditions to deteriorate in Q4 compared to 11% in the previous quarter.
Perhaps this reflected anticipation that the wave of Omicron being seen in Australia would soon arrive on New Zealand’s shores. However, NZIER’s QSBO also showed a fresh build-up of inflationary pressures, which will likely encourage the RBNZ to press on with interest rate hikes in the coming months. A net 61% of surveyed firms reported increased costs in Q4, the most since June 2008, while 52% of survey respondents said they had raised prices, the highest such proportion since 1987. The report also spoke of acute labour shortages.
“Inflationary pressures were evident and appear to be accelerating,” said analysts at Kiwibank. “A closed border means it's becoming increasingly difficult to find skilled staff, and an exceptionally tight labour market is driving up wages” the bank added, saying that the reinforced the case for more monetary tightening from the RBNZ. For now though, AUD/NZD traders have been reticent to add bearish bets on RBNZ rate hike expectations in the run up to Australian December labour market data. If sufficiently strong, the data (released on Thursday) may be enough to spur further hawkish RBA rate bets. Despite the central bank saying it will not hike before 2023, markets currently expect the bank to lift rates before the end of H1 2022.
Analysts at MUFG Bank expect the EUR/USD pair to trade in the 1.100-1.1650 range during the next weeks. They see the pair moving to the downside, before staging a gradual rebound after the first quarter.
Key Quotes:
“The pair has found more support closer to the 1.1000-level similar to between 2015 and early 2017, and more recently between late 2019 and early 2020. The price action fits with our view that the EUR has become more deeply undervalued against the US dollar which is helping to dampen further downside risks in the near-term.”
“Our long-term PPP model estimates that EUR/USD is currently trading around one standard deviation below fair value which comes in at around 1.1250. It was only back in the early 2000’s that EUR/USD traded at even more extreme levels of undervaluation for a more sustained period of time.”
“There is still room to price in more Fed hikes further out the curve and price in a higher terminal rate. Additionally, the Fed could announce plans to begin shrinking their balance sheet sooner and more quickly than in the last tightening cycle. As a result, we still expect EUR/USD to trade closer to the 1.1000- level in Q1 before drifting gradually higher later this year.”
“One potential trigger for a weaker EUR in the month ahead is posed by rising geopolitical tensions between Russia and the West.”
Recent testimony, speeches and interviews have made it clear that the Federal Reserve “is gung ho and ready to start hiking in March”, explained analysts at Rabobank. They see the FOMC raising rates each quarter during 2022 unless there is a setback in the real economy.
Key Quotes:
“The next meeting of the FOMC takes place on January 25-26. There will be no update of economic projections, only a formal statement and a press conference by Powell. Since tapering continues until March, there will also be no rate hike in January. Powell will likely repeat his hawkish remarks of recent weeks and try to convince the markets, the public, and the politicians, that the Fed is now serious about inflation fighting.”
“At the post-meeting press conference on January 26, Powell may shed some light on the balance sheet normalization discussion. The minutes – to be released on February 16 – may give us more details on this debate.”
“Last summer, we expressed our fear that the Fed would be blindsided by inflation. However, we had no idea how long it would take for the FOMC to see the light. Keep in mind that at the time we wrote our special the FOMC still expected to keep rates unchanged until 2024! Then, at the December meeting, the Fed created the option to start hiking in March, by accelerating the pace of tapering. What we have heard in recent weeks from Powell and his fellow FOMC participants has convinced us that they have become serious about inflation fighting. In fact, they seem eager to show it through action. Therefore, we have put 4 Fed rate hikes of 25 bps each in our outlook for 2022.”
- USD/JPY has settled in the 114.50 area, roughly flat on the day despite a dovish BoJ and higher US yields.
- Safe-haven demand has underpinned the yen on a day where Fed tightening fears have driven US equities lower.
USD/JPY has eased back to near the 114.50 mark in recent trade after briefly spiking as high as the 115.00 handle during Asia Pacific trade on post-BoJ rate decision yen weakness. The more dovish than expected BoJ aside, some FX traders will be surprised at USD/JPY’s inability to track the latest advances in US bond yields that saw the US 10-year on Tuesday hit its highest level since January 2020 above 1.85%. By contrast, at current levels just above 114.50, USD/JPY is still trading some 1.5% below the 116.35 multi-year highs it hit in the first week of 2022.
USD/JPY’s failure on Tuesday to hold to the north of the 115.00 level, or indeed above the 21-day moving average at 114.91, post-BoJ/US bond yield spike likely has a lot to do with the market’s risk-off tone. US equities have tumbled on Tuesday as a result of Fed tightening fears and FX markets have unsurprisingly adopted a fairly defensive posture, which has seen safe-haven currencies JPY and USD outperform in unison. A much weaker than expected NY Fed manufacturing survey did not shift the dial for FX markets.
Recapping Tuesday’s BoJ meeting; as expected, the bank didn’t announce any new policy changes, but did modestly upgrade its inflation and growth forecasts, as sources had recently hinted was likely. The inflation forecast for the fiscal years 2022/23 and 2023/24 were both lifted to 1.1% from previously 0.9% and 1.0%, while the language on the risks to prices was adjusted to “generally balanced” from “skewed to the downside.
Governor Haruhiko Kuroda acknowledged that price pressures had risen, but was eager to push back against any chatter about rate hikes. “We are not debating an interest rate hike” he said in the post-meeting press conference, adding that “the median forecast of board members is for inflation to move around 1%... Under such conditions, we are absolutely not thinking about raising rates or modifying our easy monetary policy”. “We continue to expect the BoJ to stick to their current policy framework until at least Governor Kuroda’s term ends next April,” said an analyst at MUFG, adding that “the widening divergence between BoJ and Fed policy expectations should continue to place upward pressure on USD/JPY”.
- US dollar prints fresh highs versus main European currencies.
- EUR/USD having worst day in months, drops below the 20-day SMA.
The EUR/USD has been falling constantly since the European session, and on American hours reached a fresh weekly low at 1.1325. It is hovering near 1.1330/35, with the negative tone intact.
The euro is falling more than seventy pips versus the US dollar, having the worst day in months as US yields keep rising and amid a big drop in equity prices. Weaker-than-expected economic data from the US did not stop the greenback. The Empire manufacturing index dropped unexpectedly to contraction territory in January.
In Wall Street, the Dow Jones is falling by 1.39% and the Nasdaq drops 1.97%. The US 10-year yield stands at 1.84%, and the 30-year at 2.17%. The combination of higher yields and risk aversion is boosting the greenback on Tuesday, particularly against main European currencies.
From a technical perspective, if the EUR/USD fails to recover 1.1370 it could remain under pressure, looking at the 1.1300 zone and then the 1.1260 support area. The slide pushed the pair back below the 20-day simple moving average and into the previous trading range that prevails all December.
Technical levels
- Spot silver spiked to more than two-month highs above $23.50 in recent trade following a week NY Fed manufacturing survey.
- The move cuts against higher US yields and a stronger US dollar, suggesting the gains may prove short-lived.
Spot silver (XAG/USD) prices spiked nearly 60 cents from under $22.90 to near $23.50 (more than two-month highs) in recent trade in wake of a much weaker than expected January New York Fed Manufacturing survey. The headline index slumped into negative territory for the first time since October 2020 versus expectations for a decline from 31.9 to 25.7, a reflection of Omicron’s short-term hit to business conditions. At current levels just below the $23.50 mark, XAG/USD is now trading higher by nearly 2.0% on the day, having at one point traded closer to 1.0% lower.
Silver’s recent rally, which has seen the precious metal rebound from its 21-day moving average at $22.80 and scorch above its 50-day moving average just under $23.20, cuts against the moves being seen in bond and FX markets. Bond market participants, unfazed by the weak NY Fed survey, have continued to push US yields higher with focus instead on increasingly hawkish Fed expectations. The 2-year yield has pushed above 1.0% for the first time since February 2020 and is up about 6bps on the day, whilst the 10-year is up about 8bps and trading around 1.85%, its highest level since January 2020. This move is being driven by upside in real yields (rather than inflation expectations), which would typically weigh on precious metals.
Amid the rise in US yields that has outmatched the moves in yields in other developed markets, the US dollar has been catching a bid and the DXY, overcoming initial post-NY Fed data weakness, has pushed back to weekly highs above 95.50. That makes dollar-denominated precious metals more expensive for the holders of international currency, weighing on demand, and would thus typically send silver prices lower. Higher real yields and a stronger dollar suggest the most recent push higher in spot silver may be short-lived. If intra-day/swing traders do take the opportunity to add short positions at elevated levels above $23.50, they will likely be targetting a rest of Tuesday’s and last Friday’s lows in the $22.80 area.
- After hitting multi-year highs near the $86.00 per barrel level, WTI has since backed off to trade around $85.00.
- Market commentators have attributed rising geopolitical tensions in the Middle East as behind the latest push higher.
- Goldman Sachs is calling for oil (Brent) to hit $100 per barrel in H2 2022.
After hitting multi-year highs early on during the European trading session near the $86.00 per barrel level, front-month WTI futures have since backed off to trade around $85.00, though still hold onto gains of about 60 cents on the session. Market commentators have attributed geopolitical tensions as driving the latest upside in crude oil prices, after an attack by Yemen’s shia Houthi militia on the UAE earlier in the week ratched up tensions in the region. Following the drone and missile strikes that killed three people and triggered explosions in fuel trucks, the Houthis have been threatening to target further UAE facilities.
The latest increase in Middle Eastern tensions comes at a time when global crude oil markets are already looking a lot tighter than analysts had been expecting at the start of the year. A lower-than-expected hit to global demand from Omicron combined with the difficulties some smaller OPEC+ members have been having in lifting output led Goldman Sachs to announce a for oil (Brent) to hit $100 per barrel in H2 2022. The bank explained that the above factors had “kept the global oil market in a larger deficit than even our above consensus forecast”, a factor that has likely been driving growing premiums in various physical crude oil grades over future prices in recent weeks.
“If current geopolitical tensions continue and OPEC+ members can’t deliver on their 400,000 barrel per day increase, macros coupled with the strong technical outlook could see prices push toward the $100 mark” analysts at CMC Markets concluded. Indeed, the technicals for oil have been looking relentlessly bullish in recent weeks. Since the December 20 low at $66.11, WTI has rallied nearly $20.00 or close to 30%, after consistently printing higher highs followed by higher lows. Though WTI did print multi-year highs on Tuesday, it hasn’t yet been able to convincingly break above the 2021 highs. Was this to be the case and was WTI to surge above $86.00, the next level of resistance to target would be the January 2014 lows in the $91.50 area.
- Stronger US dollar sends cable to weekly lows.
- Pound fails to benefit from BoE rate hike expectations.
- GBP/USD falling for the third consecutive day, extends retreat.
The GBP/USD pair failed to recover 1.3600 and dropped further falling to 1.3572, hitting a fresh weekly low. It remains near the lows, under pressure amid a stronger US dollar and as equity prices tumble in Wall Street.
Weaker than expected US economic data (unexpected decline in the Empire Manufacturing Index) weakened the dollar only for a few minutes. The combination of higher US yields and risk aversion, are boosting the dollar. The DXY is up by 0.7%, at 95.60.
The Dow Jones is falling more than 500 points or 1.50%, while the Nasdaq slides 1.38%. European markets are also in red, falling on average 0.85%.
Earlier on Wednesday, data showed positive numbers of the UK labor market. The unemployment rate dropped to 4.1%, the lowest since June 2020. The numbers help keep at elevated levels expectations about another rate hike from the Bank of England at the next meeting.
“The hawkish BOE outlook that had helped sterling outperform is getting crowded out a bit lately by the more hawkish Fed outlook”, explained analysts at Brown Brothers Harriman. They see the next target at 1.3550 and warn that a break lower “would set up a test of the January 3 low near 1.3430.”
Technical levels
Jane Foley, Head of FX Strategy at Rabobank, expects EUR/USD to plummet towards the 1.10 level by mid-2022. After that, the world’s most popular currency pair is set to push higher by the end of the year.
Policy normalization in the eurozone to lift EUR/USD by year-end
“We see scope for EUR/USD to head towards 1.10 in the middle of the year.”
“By the end of 2022, we expect EUR/USD to be pushing higher as policy normalization in the eurozone becomes more topical.”
Gold has established above the $1,800 level. However, strategists at UBS expect the yellow metal to move downward and hit the $1,650 mark by the end of the year.
Silver to gradually drop towards $19/oz by end-2022
“We expect gold prices to fall to $1,650/oz by end-2022.”
“Silver is likely to gradually decline this year and reach $19/oz by end-2022.”
- USD/TRY fades the recent weakness and advances to 13.60.
- The pair keeps the consolidation theme well and sound so far.
- All the attention is now on the CBRT event on Thursday.
The Turkish lira resumes its depreciation on Thursday and pushes USD/TRY to the 13.60 region on Tuesday.
USD/TRY remains capped by 14.00
USD/TRY regains some upside traction in line with the bullish sentiment surrounding the greenback and manages to reverse two consecutive daily pullbacks.
Indeed, the US dollar extends the recovery following last week’s new lows vs. its main peers, always on the back of firm expectations of a Fed’s move on rates as soon as in March and the persistent move higher in US yields.
In the meantime, cautiousness among investors have been rising in past weeks, as the Turkish central bank will meet on Thursday, with consensus among market participants pretty divided on what could be the next move by the central bank.
What to look for around TRY
The pair seems to have moved into a consolidative phase within a 13.00-14.00 range since the beginning of the new year. Higher-than-expected inflation figures released earlier in the year put the lira under extra pressure in combination with some cracks in the confidence among Turks regarding the government’s recently announced plan to promote the de-dollarization of the economy. In the meantime, the reluctance of the CBRT to change the (collision?) course and the omnipresent political pressure to favour lower interest rates in the current context of rampant inflation and (very) negative real interest rates are forecast to keep the domestic currency under intense pressure for the time being.
Key events in Turkey this week: CBRT Meeting (Thursday) – Consumer Confidence (Friday).
Eminent issues on the back boiler: Progress (or lack of it) of the government’s new scheme oriented to support the lira via protected time deposits. Constant government pressure on the CBRT vs. bank’s credibility/independence. Bouts of geopolitical concerns. Much-needed structural reforms. Growth outlook vs. progress of the coronavirus pandemic. Potential assistance from the IMF in case another currency crisis re-emerges. Earlier Presidential/Parliamentary elections?
USD/TRY key levels
So far, the pair is gaining 1.33% at 13.6001 and a drop below 12.7523 (2022 low Jan.3) would pave the way for a test of 12.4787 (55-day SMA) and finally 10.2027 (monthly low Dec.23). On the other hand, the next up barrier lines up at 13.9319 (2022 high Jan.10) followed by 18.2582 (all-time high Dec.20) and then 19.0000 (round level).
Although the S&P 500 Index has had a tough start of the year and edging closer to the 4,600 mark, economists at UBS target the 5,000 and 5,100 levels by June and December, respectively.
Cyclicals to outperform
“We forecast 2022 revenue growth of 8%, translating into earnings per share growth of 12%.”
“Our S&P 500 price targets are 5,000 and 5,100 for June and December, respectively.”
“We retain a bias for cyclical parts of the market, including energy and financials, balanced by exposure to the attractively valued but more defensive healthcare sector.”
GBP/USD slips below the 1.36 level but firm jobs data leans into Bank of England (BoE) tightening risk. Strategists at Scotiabank expect the cable to lurch higher towards 1.40 but a correction lower is probable by late-2022.
Strong payrolls data marginally boosted BoE rate hike expectations
“UK firms added 184K employees to their ranks in December with no noticeable impact from the Omicron wave. For 2021, total payrolls increased by roughly 1.35M employees and as of last month totaled about 1.5% over their pre-pandemic peak in February 2020.”
“A faster pace of hiking amid a strong jobs market and elevated inflation would continue to lift the GBP toward 1.40 but it does leave it at risk of correcting in late-2022.”
“As the BoE reaches its neutral rate (likely 1.25%) by the end of this year or early-2023, flows will likely shift more toward dollar-denominated fixed-income assets as the Fed’s hiking cycle continues in 2023.”
USD/CAD is holding a little above 1.25. Economists at Sctoiabank believe the pair is likely to push lower on a break below the 1.2480 mark.
Minor resistance seen at 1.2530
“Short-term price action is generally flat in a tight range around the 1.25 point, however, with spot not weak enough yet to signal a renewed attack on 1.2450 support or strong enough to suggest a return to 1.2550+.”
“We spot minor resistance at 1.2530 and support at 1.2480 intraday, with the pair likely to trade with a little more momentum on a break either side of that range; we favour a push lower.”
- AUD/USD slipped under 0.7200 on Tuesday as key short-term trend support was broken and amid downside in global equities.
- Aussie traders were also fretting about further domestic data that showed weakening consumer confidence and Omicron infections surge.
AUD/USD broke below key short-term trendline support earlier during Tuesday’s session and has subsequently fallen underneath the 0.7200 level. At current levels in the 0.7180s, AUD/USD trades lower on the day by about 0.3%, a reflection of weakness in global equity markets which were rocked on Tuesday by sharp upside in US government bond yields and a stronger USD. A much weaker than expected NY Fed manufacturing survey did not have a lasting impact on FX markets, perhaps given Aussie traders are also fretting about another sharp downturn in weekly ANZ Consumer Confidence data, as new data revealed during Tuesday’s Asia Pacific session.
The Australian bank’s measure of consumer sentiment slid dropped 7.6% last week to its lowest since October 2020, below its levels during the surge in Delta infections during 2021 that saw certain areas of the country enter prolonged lockdowns. David Plank, ANZ's head of Australian economics, commented that “we don't think the economy is as weak as these data might suggest, with the shock of the Omicron surge and strains on testing capability the key drivers of the fall rather than underlying economic conditions”. However, the bank warns that the “result highlights that concerns about COVID have the potential to significantly impact the economy if they linger”.
Evidence of the economic impact of the Omicron surge complicates the RBA’s upcoming monetary policy decision, particularly regarding whether or not to end QE buying in February or to taper the purchase rate and continue until May. Recent economic data and the hawkish shift at the Fed and other major central banks (like the BoE) supports the case for an immediate end to QE next month. Traders now look ahead to December labour market data due on Thursday that will provide further inputs to the pre-Omicron recovery story. Further buck strength and risk-off flows risk sending AUD/USD back towards 2022 lows just below 0.7150 in the absence of another massive positive Australian labour market surprise.
Italy's parliament will vote for a new president on Monday, January 24. Economists at ING look at FX implications of different scenarios. The EUR/CHF pair is expected to suffer downside pressure.
Mostly downside risks for EUR/CHF
“Our base case of Draghi moving from prime minister to president of the Republic should prove to be a rather benign one for markets as investors should welcome the fact that he will still overlook the reform process even after next year’s elections. There is, however, not much political risk currently embedded into EUR/CHF, and we, therefore, see some rather contained positive implications from the best-case scenario for markets.”
“We think that if Berlusconi becomes the new president and tensions within the ruling alliance flare-up, we can definitely see some fresh pressure on EUR/CHF.”
“Despite evidence that the SNB has scaled up FX interventions at the start of the year, we doubt there is a clear line in the sand around the current 1.04 level, and a significant rise in Italian political risk can cause EUR/CHF to explore the 1.02/1.03 range. However, this is not our base case.”
- USD/CHF regained positive traction on Tuesday amid sustained USD buying interest.
- The ongoing sharp move up in the US bond yields acted as a tailwind for the greenback.
- Dismal US data capped gains amid risk-off, which tends to benefit the safe-haven CHF.
The USD/CHF pair held on to its intraday gains through the early North American session, albeit has retreated a few pips from the daily high and was last seen trading just above mid-0.9100s.
The pair caught some fresh bids on Tuesday and is now looking to build on last week's recovery move from sub-0.9100 levels, or the lowest level since early November. The momentum was sponsored by sustained buying interest around the US dollar, which continued drawing support from elevated US Treasury bond yields.
Investors seem convinced that the Fed would begin raising interest rates in March 2022 to combat stubbornly high inflation. The expectations were reinforced by last week's data, which showed that the headline US CPI surged to the highest level since June 1982 and core CPI registered the biggest advance since 1991.
This, in turn, pushed the yield on the benchmark 10-year US government bond to the highest level since January 2020 and underpinned the greenback. That said, an extended sell-off in the US bond markets took its toll on the global risk sentiment, which benefitted the safe-haven Swiss franc and acted as a headwind for the USD/CHF pair.
Apart from this, a slump in the US Empire State Manufacturing Index to -0.70 in January from the previous month's reading of 31.9 held back bulls from placing aggressive bets around the USD/CHF pair. Even from a technical perspective, spot prices, so far, have struggled to move back above the very important 200-day SMA.
Investors also seemed reluctant and prefered to wait on the sidelines ahead of the upcoming FOMC monetary policy meeting on January 25-26. This further makes it prudent to wait for a strong follow-through buying before confirming that last week's fall from the 0.9275-0.9280 region, or a near one-month high has run its course.
Technical levels to watch
- Headline NY Fed Manufacturing Index fell to -0.70 in January, well below expectations for 25.70.
- The DXY saw some mild weakness in an immediate reaction.
The headline General Business Conditions Index of the NY Fed's Empire State Manufacturing Survey slid to -0.70 in January, from December's 31.90 reading. That was much larger than the expected drop to 25.70 and marked the first time the reading had fallen into negative territory since June 2020.
Subindices:
- The New Orders subindex fell to -5.0 in January from 27.1 in December.
- The Prices Paid subindex fell to 76.7 from 80.2.
- The Employment subindex fell to 16.1 from 21.4.
- The Six-month Business Conditions subindex remained elevated at 35.1 versus 36.4 the month prior.
Market Reaction
The DXY has seen some modestly negative ticks in recent trade following the large miss on expectations in terms of the latest NY Fed survey, with the DXY recently falling back under 95.50.
- Spot gold has recently dropped under its 21 and 50DMAs in the $1810 area.
- Recent downside reflects the upside in US yields, which hurts the appeal of non-yielding precious metals.
Spot gold (XAU/USD) prices fell to their lowest level since this time last week on Tuesday, breaking below support in the form of the 21 and 50-day moving averages at $1810. Gold weakness, which has seen spot prices drop about 0.6% to current levels around $1807, reflects recent upside in US bond yields as traders further ramp up Fed tightening bets ahead of next week’s Fed meeting. Notably, the 2-year yield surpassed 1.0% for the first time since February 2020, whilst the 10-year rose briefly above 1.85% to hit fresh near-two-year highs before slipping back to just above the 1.80% level.
Real yields, with which precious metals like gold have the strongest negative correlation, were also up, with the 10-year TIPS trading in a -0.65% to -0.70% range and at its highest levels since early Q2 2021. Remember that higher real yields raise the opportunity cost of holding non-yielding assets like gold. In the absence of any Fed speak or tier one US data releases to drive Fed tightening expectations in the week ahead, movements in bond and currency markets, which will by virtue impact precious metals, are likely to be driven instead by animal spirits. With the market seemingly expecting four rate hikes in 2022 and a further four in 2023, risks for both the US dollar and yields (real and nominal) seem tilted to the upside.
That doesn’t bode well for spot gold prices, which may be looking at further losses, including a drop back under $1800, though such a move would require prices to fall under the 200DMA at $1803. Looking at the last few weeks, the 200DMA has had a mixed ability to offer support/resistance. A drop below $1800 would then see bearish short-term speculators turn their focus to a test of this year’s lows in the $1780s.
According to the Credit Suisse analyst team, the S&P 500 is expected to see a close below its 63-day average for a lengthier corrective phase and a fall back to 4596/83, with scope for the 4495 December low.
Lengthier corrective/consolidation phase to emerge
“A weekly close below 4658 should further reinforce our base case for a lengthier corrective phase with support seen next at 4615, then the recent low, gap support and now also trend support from December at 4594/82.”
“A close below 4582 would now raise the prospect we are indeed seeing a top complete to further increase the downside risk with supports seen next at 4568 ahead of the December reaction lows at 4531 and 4495.”
“Resistance is seen moving to 4685 initially, then the 13-day exponential average at 4602/07, with the immediate risk now seen staying lower whilst below here. Above 4758 remains needed to ease fears of a deeper setback.”
With a global growth slowdown looming and central bank divergence, economists at Danske Bank remain bearish on the Swedish krona; forecasting EUR/SEK at 10.50 in 12 months.
Riksbank pricing is too aggressive
“As for 2022, we still see a case for broad SEK to weaken as global monetary policy has started to diverge.”
“The biggest downside is probably against currencies where the central bank is front-loading policy normalization. The risk is more limited vs EUR, as the RB and the ECB are equally likely to sit out this year at least. That said we still see a strategic case for a weaker SEK against the EUR, as RB pricing is too aggressive (one full hike by end 2022 and three hikes by end 2023).”
“As long as inflation remains elevated, which we think it will do in H1, there should probably be a non-negligible premium for hikes in the money-market curve. Thus limiting the upside in EUR/SEK and maybe even helping to pull EUR/SEK lower from here in the near-term.”
“We raise the 1M estimate to 10.20 (10.10) and otherwise leave the forecast profile unchanged at 10.20 in 3M, 10.30 in 6M and 10.50 in 12M.”
- A combination of diverging forces failed to provide any meaningful impetus to USD/CAD.
- Bullish crude oil prices underpinned the loonie and acted as a headwind for the major.
- Surging US bond yields, the risk-off impulse benefitted the USD and extended support.
The USD/CAD pair extended its sideways consolidative price move heading into the early North American session and remained confined in a range around the 1.2500 psychological mark.
Rising geopolitical tensions in the Middle East pushed crude oil prices to a more than seven-year high, which underpinned the commodity-linked loonie and acted as a headwind for the USD/CAD pair. The downside, however, remains cushioned amid a broad-based US dollar strength, bolstered by a continual surge in the US Treasury bond yields.
In fact, the yield on the benchmark 10-year US government bond shot to the highest level since January 2020 amid growing acceptance for an eventual Fed lift-off in March. Moreover, the US 2-year notes, which are highly sensitive to rate hike expectations, surged past the 1.0% mark for the first time since February 2020 and benefitted the buck.
Meanwhile, an extended sell-off in the US bond markets tempered investors' appetite for perceived riskier assets and triggered a steep decline in the equity markets. This was seen as another factor that boosted the greenback's relative safe-haven status and helped limit any meaningful slide for the USD/CAD pair, at least for the time being.
Market participants now look forward to the release of the US Empire State Manufacturing Index, which, along with the US bond yields and the broader market risk sentiment will drive the USD demand. Apart from this, traders will further take cues from oil price dynamics to grab some short-term opportunities around the USD/CAD pair.
From a technical perspective, the pair's inability to gain any meaningful traction suggests that the recent sharp pullback from the 2021 high might still be far from being over. That said, repeated failures to find acceptance below the 1.2500 mark warrants some caution before positioning for any further near-term depreciating move.
Technical levels to watch
- EUR/GBP rose to two-week highs on Tuesday in the 0.8375 area, despite strong US jobs data.
- Analysts interpreted the latest UK jobs release as bolstering the likelihood of another BoE rate hike in February.
A strong UK labour market report has failed to lift sentiment towards pound sterling on Tuesday, with GBP amongst the worst performing G10 currencies on the session, sending EUR/GBP to two-week highs in the 0.8375 area. Technical buying appeared to boost the pair, which now trades higher by about 0.2% on the day, as it broke above last week’s highs in the 0.8360 area. The currency pair is now probing resistance in the form of the November 2021 lows in the 0.8380 regions ahead of a test of the 21-day moving average at 0.8394.
Traders should be aware that, since mid-December, selling EUR/GBP rallies has been a profitable short-term trading strategy and, as UK economic data exceeds expectations and bolsters expectations for BoE rate hikes, this may well remain the case. To quickly recap the highlights of Tuesday’s UK jobs report; the ONS revealed that employers added 184K (a record number) to their staff payrolls in December. That saw the unemployment rate drop to 4.1%, its lowest since June 2020, whilst job openings hit a record high of 1.247M in the three months to December, double their levels in the same time period last year. “Alongside rising headline inflation rates and growing evidence that Omicron's impact has been modest, a February rate rise from the Bank of England looks increasingly likely” concluded analysts at ING.
Whether increased confidence in the likelihood that the BoE will follow up December’s 15bps rate hike with another next month translates into EUR/GBP reverting back towards last week’s sub-0.8350 lows remains to be seen. Downside in US and European equities on Tuesday amid a sharp rise in US government bond yields on Fed rate hike bets is currently weighing on sterling, just as lower equities are also weighing on other risk-sensitive currencies.
Stuart Cole, head macroeconomist at Equiti Capital, told Reuters that “with the FOMC and BoE already in tightening mode, it is difficult not to see the ECB similarly changing tack and moving policy towards fighting inflation also, particularly given the impact of soaring energy prices and the expectation that these are expected to continue their steady rise higher”. “We had a good start to the year, but that early euphoria has waned, and equities might have a difficult couple of weeks in the run-up to the Federal Reserve meeting” he continued. Choppier waters for overall risk appetite suggest EUR/GBP downside may be limited for now.
- A combination of factors dragged NZD/USD away from a multi-week high touched last Thursday.
- Surging US bond yields continued acting as a tailwind for the USD and exerted some pressure.
- The risk-off impulse further contributed to driving flows away from the perceived riskier kiwi.
The NZD/USD pair maintained its offered tone through the mid-European session and was last seen trading near a one-week low, around the 0.6770 area.
The pair witnessed fresh selling on Tuesday and extended last week's retracement slide from the vicinity of the 0.6900 mark, or the highest level since November 24. A combination of factors assisted the US dollar to recover further from an over two-month low touched in reaction to the devastating US retail sales report on Friday. This, in turn, was seen as a key factor exerting pressure on the NZD/USD pair.
Expectations for an eventual Fed lift-off in March – amid concerns over stubbornly high inflation – pushed the yield on the benchmark 10-year US government bond to the highest level since January 2020. Moreover, the US 2-year notes, which are highly sensitive to rate hike expectations, surged past the 1.0% mark for the first time since February 2020 and continued underpinning the greenback.
Meanwhile, an extended sell-off in the US bond markets took its toll on the global risk sentiment and triggered a steep decline in the equity markets. This was seen as another factor that benefitted the greenback's relative safe-haven status and drove flows away from the perceived riskier kiwi. The downtick could also be attributed to some technical selling on a sustained break below the 0.6800 mark.
Market participants now look forward to the US economic docket, featuring the release of the Empire State Manufacturing Index for some impetus during the early North American session. This, along with the US bond yields and the broader market risk sentiment, will influence the USD price dynamics and produce some meaningful trading opportunities around the NZD/USD pair.
Technical levels to watch
UOB Group’s Economist Ho Woei Chen, CFA, assesses the latest batch of Chinese data releases.
Key Takeaways
“China’s 4Q21 GDP growth slowed to 4.0% (1.6% q/q SA) from 4.9% in 3Q21 but beat consensus and our forecasts (Bloomberg est: 3.3% y/y, 1.2% q/q SA; UOB est: 3.5% y/y, 1.4% q/q). Overall, the economy grew by 8.1% in 2021 while the growth in 2020 was revised lower to 2.2% from 2.3%. On average, China’s economy expanded by an annual pace of 5.1% in the last two years.”
“The industrial sector provided much needed support to the economy as private consumption recovery continued to lag. Fixed asset investment moderated but was largely in line with consensus forecast, reflecting the slowdown in property investment. Meanwhile, labour market condition remained stable as the large city surveyed jobless rate stayed at 5.1% for the third consecutive month while the nationwide jobless rate inched marginally higher to 5.1% from 5.0% in Nov.”
“The 10 bps cut to the 1Y medium-term lending facility (MLF) rate this morning reaffirms that the People’s Bank of China’s (PBOC) is stepping up near-term support for growth. It likely viewed that the 5 bps reduction in the 1Y Loan Prime Rate (LPR) in Dec was too small to have any material impact on China’s growth. The 7-day reverse repo rate was also cut by 10 bps to 2.1% from 2.2%. As such, the LPR setting on 20 Jan is expected to see the 1Y LPR reduced by at least another 5 bps to 3.75%.”
“The challenging economic environment in early 2022 including the continuation of the property downturn and ongoing COVID-19 uncertainties will hamper the growth recovery in 1H22. As such, we expect a more moderate GDP growth at 4.7% y/y in 1Q22, 5.0% y/y in 2Q22 before recovering to 5.6% y/y in 2H22 as support measures filter through and households increase spending. Our revised 2022 GDP growth forecast is lowered to 5.2% (previously 5.7%).”
- EUR/USD sheds ground for the third session in a row on Tuesday.
- Key contention emerges at the 4-month line near 1.1370.
EUR/USD extends the bearish move sparked soon after hitting new 2022 highs in the 1.1480/85 band earlier in the month.
The bias appears tilted to the downside for the time being. That said, a deeper decline remains on the cards if spot breaches the 4-month support line, today around 1.1370. On such event, the next support should emerge at the temporary 55-day SMA at 1.1347.
The longer term negative outlook for EUR/USD is seen unchanged while below the key 200-day SMA at 1.1725.
EUR/USD daily chart
If USD/CNH breaks above the 6.3710 level, the downside pressure is forecast to alleviate, noted FX Strategists at UOB Group.
Key Quotes
24-hour view: “We highlighted yesterday that ‘there is room for the rebound in USD to extend but any advance is unlikely to break the strong resistance at 6.3710’. USD subsequently rose to 6.3650 before dropping sharply. Upward pressure has eased and USD is likely to trade sideways for today, expected to be within a range of 6.3430/6.3600.”
Next 1-3 weeks: “There is not much to add to our update from yesterday (17 Jan, spot at 6.3610). As highlighted, downward momentum has waned quickly and the odds for further USD weakness are not high. However, only a breach of 6.3710 (no change in ‘strong resistance’ level) would indicate that the downside risk has dissipated. Looking ahead, any decline in USD is expected to encounter solid support at 6.3390 and
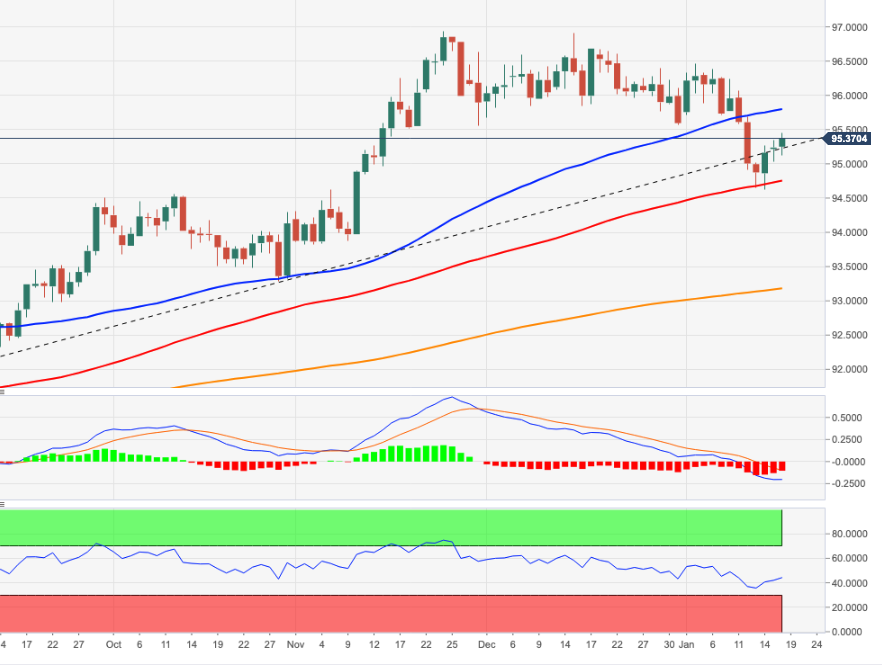
- DXY extends the recovery further north of the 95.00 mark.
- The next hurdle is seen at the 55-day SMA near 95.80.
The continuation of the rebound in the greenback remains well and sound and propels DXY well past the 95.00 barrier on Tuesday.
If the index manages to surpass the 4-month line around 95.20 on a sustainable fashion, then the upside momentum carries the potential to revisit the 55-day SMA, today at 95.76 ahead of the 20-day SMA at 95.81.
Looking at the broader picture, the longer-term positive stance remains unchanged above the 200-day SMA at 93.15.
DXY daily chart
The breakout of 114.75 would indicate that the downside pressure in USD/JPY has alleviated.
Key Quotes
24-hour view: “Yesterday, we held the view that ‘the rebound in USD has scope to extend but a break of the strong resistance at 114.75 is unlikely’. Our view was not wrong as USD rose to a high of 114.64 before easing off. Upward momentum is beginning to wane and USD is unlikely to strengthen much further. For today, USD is more likely to consolidate and trade between 114.20 and 114.65.”
Next 1-3 weeks: “We continue to hold the same view as yesterday (17 Jan, spot at 114.30). As highlighted, while the prospect for further USD weakness is not high, only a break of 114.75 (no change in ‘strong resistance’ level) would indicate that the downside risk that started late last week (see annotations in the chart below) has dissipated.”
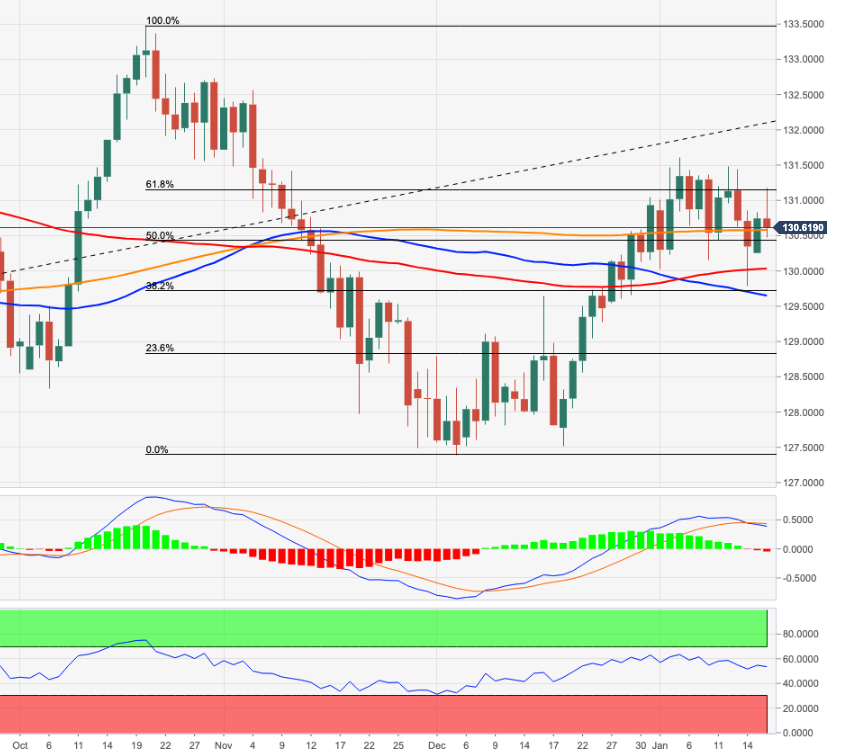
- EUR/JPY resumes the downside and retests 130.50.
- Upside remains limited by the 131.50/60 band so far.
EUR/JPY fades the initial move further north of the 131.00 mark and sparked a moderate pullback to the mid-130.00s soon afterwards on Tuesday.
Price action remains unconclusive around the cross for the time being, with gains capped by the so far YTD top at 131.60 (January 5) and the 130.00 neighbourhood offering some decent contention.
The inability of EUR/JPY to surpass the 131.50/60 band on a convincing fashion, ideally in the near term, should shift the bias towards the downside.
EUR/JPY daily chart
- GBP/USD witnessed some selling for the third successive day amid sustained USD buying.
- Break below the 23.6% Fibo. level should pave the way for a slide towards 100-day SMA.
The GBP/USD pair edged lower for the third successive day and extended last week's rejection slide from the very important 200-day SMA or the highest level since October 29. The pair maintained its offered tone through the first half of the European session and was last seen trading near a one-week low, around the 1.3620 region.
Firming expectations that the Fed would start raising interest rates in March 2022 amid concerns over stubbornly high inflation continued pushing the US Treasury bond yields higher. This, along with the risk-off impulse in the equity markets, benefitted the safe-haven US dollar and exerted some downward pressure on the GBP/USD pair.
From a technical perspective, the corrective pullback has now dragged spot prices closer to support marked by the 23.6% Fibonacci retracement level of 1.3161-1.3749 strong move up. Some follow-through selling below, leading to a subsequent breakthrough the 1.3600 mark would expose the 100-day SMA support near mid-1.3500s.
This is followed by the 38.2% Fibo. level, around the 1.3525 region, which if broken decisively will suggest that the GBP/USD pair has topped out in the near term. The subsequent technical selling should pave the way for a slide below the key 1.3500 psychological mark, towards testing the 50% Fibo. level, around the 1.3455 region.
On the flip side, the daily swing high, around the 1.3660 area now seems to act as an immediate resistance ahead of the 1.3700 mark. Any further positive move might continue to meet with a fresh supply near the 1.3745-1.3750 region (200-DMA), which should act as a pivotal point and help determine the near-term trajectory for the GBP/USD pair.
GBP/USD daily chart
-637780986098440914.png)
Levels to watch
Japanese Prime Minister Fumio Kishida said on Tuesday that they want to impose quasi-emergency on some regions from January 21 to February 13, as reported by Reuters.
Earlier in the day, the Kydowo news agency report that Japan's Osaka prefecture was expected to report about 6,000 new coronavirus cases on Tuesday.
Market reaction
The risk-averse market environment is helping the JPY stay resilient against the greenback. As of writing, the USD/JPY pair, which rose to 115.00 earlier in the day, was virtually unchanged on a daily basis at 114.60.
Cable is offered for third day. Economists at Société Générale spots significant support for GBP/USD at the 1.3500/1.3460 region.
October high of 1.3840 is next potential hurdle
“Daily Ichimoku cloud at 1.3500/1.3460 should be an important support near-term.”
“Next potential hurdle is at October high of 1.3840.”
According to FX Strategists at UOB Group, NZD/USD is still expected to navigate within 0.6740 and 0.6870 in the near term.
Key Quotes
24-hour view: “We highlighted yesterday that ‘the decline in NZD has room to extend but oversold conditions suggest that the chance of a break of 0.6775 is not high’. Our expectations did not quite materialize as NZD traded sideways between 0.6788 and 0.6818. The underlying tone still appears to be a tad soft and we continue to see chance for NZD to drift lower. That said, a break of 0.6775 is unlikely. Resistance is at 0.6810 followed by 0.6820.”
Next 1-3 weeks: “There is no change in our view from yesterday (17 Jan, spot at 0.6810). As highlighted, the recent sharp and rapid loss in momentum has resulted in a mixed outlook and NZD is likely to trade between 0.6740 and 0.6870 for now.”
- German ZEW Economic Sentiment arrived at 51.7 in January, up from 29.9 previous.
- The ZEW Current Situation for Germany came in at -10.2 January vs -7.4 in December.
- EUR/USD remains in the red below 1.1400 on mixed ZEW data.
The German ZEW headline numbers for January showed that the Economic Sentiment Index unexpectedly jumped again, recording 51.7 from 29.9 previous while beating estimates of 32.7.
Meanwhile, the Current Conditions sub-index slumped to -10.2 in January as against -7.4 recorded in the previous month and -7.5 expectations.
The Eurozone ZEW Economic Sentiment rose to 49.4 for the current month as compared to the 26.8 previous.
Key takeaways
“The majority of financial market experts assume that economic growth will pick up in the coming six months.”
“It is likely that the phase of economic weakness from the fourth quarter of 2021 will soon be overcome.”
“The main reason for this is the assumption that the incidence of covid-19 cases will fall significantly by early summer.”
“The more positive economic expectations include the consumer-related and export-oriented sectors and thus a large part of the German economy.”
FX market reaction
The euro remains pressured against the US dollar on the mixed ZEW Surveys. EUR/USD drops 0.07% on the day to trade at 1.1396, as of writing.
The benchmark 10-year US Treasury bond yield has reached 1.85% for the first time since January 2020. Economists at Société Générale expect 10-year US T- bond yield to extend its upwards momentum towards 1.97%.
Key levels at 1.88% and 1.97%
“10Y UST is expected to head gradually higher towards next projections at 1.88% and perhaps even towards November 2019 levels of 1.97%.”
“Gap at 1.79% and recent low at 1.69% are immediate support levels.”
GBP/USD extends its downward correction and continues to edge lower toward 1.3600. Risk-averse market environment and rising US T-bond yields favour the bears, FXStreet’s Eren Sengezer reports.
Pound looks vulnerable amid risk aversion
“The sharp upsurge seen in the US Treasury bond yields ahead of next week's FOMC policy meeting helps the greenback find demand early Tuesday.”
“In case safe-haven flows continue to dominate the financial markets in the second half of the day, the risk-sensitive GBP could find it hard to stay resilient against the greenback.”
“The Fibonacci 23.6% retracement level of the one-month uptrend forms strong support at 1.3600. In case a four-hour candle closes below that level, the pair could extend its slide to 1.3560 (100-period SMA) and 1.3530 (Fibonacci 38.2% retracement).”
“On the upside, the lower limit of the ascending channel and the 20-period SMA align as key resistance at 1.3680. If the pair manages to return within that channel, it could target 1.3700 (psychological level) and 1.3725 (middle line of the ascending channel).”
Brent Oil rises around 1% this morning. Strategists at Société Générale expect prices to continue trending higher towards $92.50 and then $95.00/96.30.
$83.50 and $79.00/78.50 are short-term supports
“Brent is breaking above the peaks of 2018 and October affirming persistence of upward momentum. This is also highlighted by weekly MACD establishing itself within positive territory and attempting a cross above its trigger.”
“Next projections are located at $92.50 and $95.00/96.30 which is also the upper limit of an ascending channel.”
“Daily Kijun line near $83.50 and $79.00/78.50, the 38.2% retracement from December will be short-term supports.”
- USD/JPY struggled to preserve its intraday gains or find acceptance above the 115.00 mark.
- A steep fall in the equity markets benefitted the safe-haven JPY and exerted some pressure.
- Surging US bond yields continued underpinning the USD and helped limit any deeper losses.
The USD/JPY pair surrendered intraday gains to a multi-day high and has now retreated to the lower end of its daily trading range, around mid-114.00s.
The pair gained positive traction during the first half of the trading on Tuesday, albeit struggled to find acceptance or build on the momentum beyond the key 115.00 psychological mark. The widening of the US-Japanese government bond yield differential was seen as a key factor that acted as a tailwind for the USD/JPY pair.
In fact, the yield on the benchmark 10-year US government bond shot to the highest level since January 2022 amid growing acceptance that the Fed would start hiking interest rates in March 2022. Conversely, the yield on the 10-year Japanese government bond remained near zero in the wake of the Bank of Japan's yield curve control policy.
Moreover, the BoJ reiterated that it will maintain ultra-loose monetary policy at the end of its latest monetary policy meeting on Tuesday. In the post-meeting press conference, the BoJ Governor Haruhiko Kuroda reiterated that the Japanese central bank remains ready to ease policy further without hesitation as needed.
Despite the supporting factors, the risk-off impulse forced investors to take refuge in traditional safe-haven currencies, including the Japanese yen and acted as a headwind for the USD/JPY pair. An extended sell-off in the US bond markets tempered investors' appetite for riskier assets and triggered a steep fall in the equity markets.
This, in turn, was seen as the only factor that attracted fresh selling at higher levels and led to the USD/JPY pair's intraday slide of nearly 50 pips. Market participants now look forward to the release of the Empire State Manufacturing Index for a fresh trading impetus later during the early North American session.
Apart from this, the US bond yields will influence the USD price dynamics. Traders will further take cues from the broader market risk sentiment to grab some short-term opportunities around the USD/JPY pair.
Technical levels to watch
- Gold bears fight back control as US 10-year Treasury yields hit two-year highs.
- Russia-Ukraine crisis, aggressive Fed rate hike bets triggered the yields spike.
- Gold 2022 Outlook: Correlation with US T-bond yields to drive yellow metal.
The Fed policymakers have entered a blackout period ahead of next week’s FOMC decision. What is moving the US Treasury yields, dollar and gold then? With the return of full markets on Tuesday, investors brace for heightened tensions between Russia and Ukraine, causing the risk premium to explode and driving the benchmark US 10-year yields to a new two-year high of $1.85%. The US rates also jumped, sending the dollar higher, on speculation of aggressive Fed rate hike in March to the tune of 50bps.
Looking ahead, in absence of relevant US economic data due for release on Tuesday, the Fed sentiment and geopolitical tensions will continue to influence gold price. Higher yields tend to weigh on the non-interest-bearing gold price.
Read: Gold Price Forecast: XAU/USD weighed down by surging US bond yields, stronger USD
Gold Price: Key levels to watch
The Technical Confluences Detector shows that the gold price is testing the bullish commitments at $1,811, which is a powerful resistance of the SMA10 one-day and SMA100 four-hour.
The next support awaits at the 50-DMA of $1,808, below which a dense cluster of healthy cushions align at $1,804. At that point, the SMA200 one-day coincides with the Fibonacci 61.8% one-week and pivot point one-day S3.
The last line of defense for gold bulls is seen at $1,800, the Fibonacci 38.2% one-month.
On the flip side, the previous day’s low at $1,813 offers immediate resistance, followed by the intersection of the SMA5 and 10 four-hour.
Fibonacci 23.6% one-week at $1,820 will emerge as the next significant upside barrier.
Bulls will then challenge the previous day’s high at $1,823.
Here is how it looks on the tool
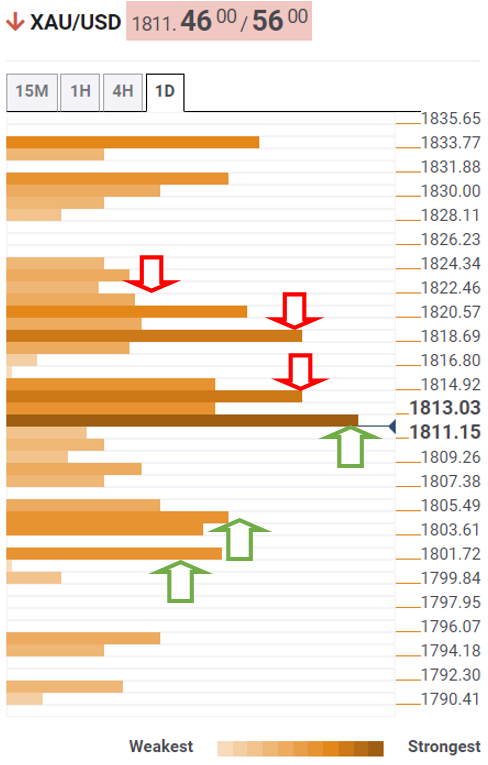
About Technical Confluences Detector
The TCD (Technical Confluences Detector) is a tool to locate and point out those price levels where there is a congestion of indicators, moving averages, Fibonacci levels, Pivot Points, etc. If you are a short-term trader, you will find entry points for counter-trend strategies and hunt a few points at a time. If you are a medium-to-long-term trader, this tool will allow you to know in advance the price levels where a medium-to-long-term trend may stop and rest, where to unwind positions, or where to increase your position size.
FX Strategists at UOB Group noted GBP/USD is expected to trade within the 1.3560-1.3725 range in the next weeks.
Key Quotes
24-hour view: “We expected GBP to ‘trade sideways between 1.3650 and 1.3715’ yesterday. However, GBP drifted to a low of 1.3639 before settling on a soft note at 1.3644 (-0.30%). Despite the decline, downward momentum has barely improved and GBP is unlikely to weaken much further. For today, GBP is more likely to trade sideways within a range of 1.3630/1.3690.”
Next 1-3 weeks: “While GBP only dipped one pip below our ‘strong support’ level at 1.3640 yesterday (low of 1.3639), upward momentum has more or less dissipated. In other words, the GBP strength that started more than a week ago (see annotations in the chart below) has run its course. The current movement is viewed as part of a consolidation phase and GBP is likely to trade between 1.3560 and 1.3725 for now.”
People’s Bank of China (PBOC) Deputy Governor Liu Guoqiang said in a statement on Tuesday, the central bank “will keep yuan exchange rate basically stable.”
Additional quotes
“Will maintain various policy tools to keep liquidity reasonably ample.”
“Will step up cross-cyclical policy adjustments in 2022.”
“Yuan exchange rate may deviate from equilibrium in near-term, but will correct over long-term.”
Another PBOC official was reported as saying that “property sales and financing steadily returning to normal.”
Market reaction
USD/CNY was last seen trading at 6.3509, up 0.06% on the day.
- A combination of factors dragged AUD/USD to a one-week low on Tuesday.
- Surging US bond yields acted as a tailwind for the USD and exerted pressure.
- The risk-off impulse also drove flows away from the perceived riskier aussie.
The AUD/USD pair maintained its offered tone through the first half of the European session and was last seen hovering near a one-week low, just below the 0.7200 mark.
Following the previous day's directionless price move, the AUD/USD pair met with a fresh supply on Tuesday and extended last week's retracement slide from a near two-month high, around the 0.7315 area. The downfall was sponsored by a broad-based US dollar strength, underpinned by a continual surge in the US Treasury bond yields.
In fact, the yield on the benchmark 10-year US government bond shot to the highest level since January 2022 amid growing acceptance that the Fed would start raising interest rates in March 2022. Moreover, the US 2-year notes, which are highly sensitive to rate hike expectations, surged past the 1.0% mark for the first time since February 2020.
Meanwhile, an extended sell-off in the US money markets tempered investors' appetite for riskier assets, which was evident from a turnaround in the equity markets. This further benefitted the safe-haven greenback and drove flows away from the perceived riskier aussie amid worries about a record high of COVID-19 deaths in Australia.
Investors, however, seem reluctant to place aggressive bearish bets and prefer to wait on the sidelines ahead of the upcoming FOMC policy meeting on January 25-26. The outcome will be looked upon for clearer signals about the likely timing when the Fed will be commencing its rate hike cycle and provide a fresh directional impetus to the AUD/USD pair.
In the meantime, traders on Tuesday will take cues from the release of the Empire State Manufacturing Index for some short-term opportunities later during the early North American session. This, along with the US bond yields and the broader market risk sentiment, will influence the USD and produce some trading opportunities around the AUD/USD pair.
Technical levels to watch
USD/IDR is now forecast to remain consolidative between 14,260 and 14,360, according to Quek Ser Leang at UOB Group’s Global Economics & Markets Research.
Key Quotes
“USD/IDR traded between 14,275 and 14,325 last week, narrower than our expected consolidation range of 14,240/14,380. The relatively quiet price actions suggest that USD/IDDR could continue to consolidate, expected to be within a range of 14,260 and 14,360.”
- EUR/USD drops to new lows in the 1.1390/85 band.
- The pair remains under pressure following recent tops near 1.1490.
- German ZEW survey next of relevance in the domestic calendar.
The European currency remains under pressure so far in the second half of the week and drags EUR/USD to multi-day lows in the 1.1390/85 band on turnaround Tuesday.
EUR/USD looks to USD, yields
EUR/USD extends the downside momentum to the sub-1.1400 region on the back of the persevering recovery in the greenback, which encouraged the US Dollar Index (DXY) to bounce off recent 2-month lows.
Higher US yields and rising speculation that the Fed could raise the Fed Funds Target Range as soon as at the March meeting have been underpinning the sentiment in the dollar and keeping the mood depressed in the risk complex.
On another front, market participants do not expect the EcoFin meeting to have any impact on the FX space, where the European recovery fund is predicted to be in the centre of the debate.
In the domestic calendar, investors will focus on the release of the Economic Sentiment in both Germany and the broader Euroland for the month of January tracked by the ZEW survey. Earlier in the session, the German Car Registration expanded 14.8% in December vs. the previous month.
Across the pond, the NY Empire State Index, the NAHB Index and TIC Flows are all due later in the NA session.
What to look for around EUR
EUR/USD came under pressure after hitting new tops in the 1.1480 region earlier in the month. In the meantime, the Fed-ECB policy divergence and the performance of yields are expected to keep driving the price action around the pair for the time being. ECB officials have been quite vocal lately and now acknowledge that high inflation could last longer in the euro area, sparking at the same time fresh speculation regarding a move on rates by the central bank by end of 2022. On another front, the unabated advance of the coronavirus pandemic remains as the exclusive factor to look at when it comes to economic growth prospects and investors’ morale in the region.
Key events in the euro area this week: Ecofin Meeting, Germany/EMU ZEW Survey (Tuesday) – Germany Final December CPI (Wednesday) – EMU Final December CPI, ECB Accounts (Thursday) - ECB Lagarde, EC’s Flash Consumer Confidence (Friday).
Eminent issues on the back boiler: Asymmetric economic recovery post-pandemic in the euro area. ECB stance/potential reaction to the persistent elevated inflation in the region. ECB tapering speculation/rate path. Italy elects President of the Republic in late January. Presidential elections in France in April.
EUR/USD levels to watch
So far, spot is losing 0.04% at 1.1398 and faces the next up barrier at 1.1482 (2022 high Jan.14) followed by 1.1496 (100-day SMA) and finally 1.1511 (200-week SMA). On the other hand, a break below 1.1398 (low Jan.14) would target 1.1348 (55-day SMA) en route to 1.1272 (2022 low Jan.4).
The yen has weakened overnight following the BoJ’s latest policy meeting resulting in the USD/JPY briefly moving back above the 115.00-level. But economists at MUFG Bank believe that the recent failure at 117.00 is a sign of the beginning of the end of the trend higher in USD/JPY.
USD/JPY overvaluation has become more stretched
“The BoJ left their monetary policy settings unchanged but now judges that risks to inflation are ‘balanced’ instead of ‘tilted to the downside’. The BoJ noted that as wage increases give households more purchasing power, a broader range of firms will raise prices. That, in turn, will push up inflation and heathen public perceptions that prices will rise further.”
“The widening divergence between BoJ and Fed policy expectations should continue to place upward pressure on USD/JPY. However, USD/JPY’s recent clear failure to test the 117.00-level has provided a bearish technical signal for the pair in the near-term. That failure and the fact that the market was short JPY means the prospect of a quick rebound for USD/JPY is diminishing.
“We have long argued the case for a correction and it seems that has unfolded a little sooner than expected. Assuming though that US dollar sentiment improves broadly, some USD/JPY recovery is feasible but this correction could be a sign of the beginning of the end of the trend higher in USD/JPY that began at the start of last year.”
The euro has depreciated 6.9% in the past twelve months. Overall, economists at the National Bank of Canada expect the common currency to remain relatively tepid in the coming year.
New year, old ways
“Christine Lagarde treads a fine line as the Fed and other major central banks start normalizing policy. Inaction could lead to weakness in the currency which could translate into higher imported inflation.”
“We expect the euro to remain relatively tepid in 2022. The common area will have to contend with supply chain issues and inflationary pressures while the ECB is unlikely to signal a significant change in policy until later this year.”
The Norwegian krone has seen renewed support on notably the short-term theme of unwinding COVID-19 fears and the equity flows supporting materials, energy and value. But economists at Danske Bank expect the move lower to be temporary and continue to forecast EUR/NOK to move higher going into 2022.
NOK rates pricing looks elevated
“While we strategically maintain a negative view on the NOK we lower the short-end of our forecast profile.”
“We still expect EUR/NOK to move higher later in the year and highlight how weaker growth and inflation alongside tighter global liquidity conditions is set to become a considerable headwind for NOK. Also, NOK rates pricing looks elevated.”
“We forecast EUR/NOK at 9.90 in 1M (from 10.20), 10.20 in 3M (from 10.30), 10.40 in 6M (unchanged) and 10.40 in 12M (unchanged).”
In opinion of FX Strategists at UOB Group, the prospects for further gains in EUR/USD now appear somewhat diminished.
Key Quotes
24-hour view: “We expected EUR to ‘trade sideways between 1.1390 and1.1445’ yesterday. Our view for sideway-trading was not wrong even though EUR traded within a narrower range than expected (1.1390/1.1434). The quiet price actions offer no fresh clues and EUR could continue to trade sideways for today, likely between 1.1395 and 1.1440.”
Next 1-3 weeks: “Our view from yesterday (17 Jan, spot at 1.1410) still stands. As highlighted, upward momentum is beginning to wane and a break of 1.1390 (no change in ‘strong support’ level) would indicate that the positive phase in EUR that started in the middle of last week is unlikely to extend to 1.1515. Note that the ‘strong support’ level was tested during NY session but was not clearly breached (low of 1.1390). Looking ahead, a clear break of 1.1390 would indicate that EUR could consolidate and trade sideways.”
- Bullish oil prices underpinned the loonie and kept USD/CAD on the defensive on Tuesday.
- Surging US bond yields acted as a tailwind for the USD and extended support to the major.
- The mixed fundamental backdrop warrants some caution before placing directional bets.
The USD/CAD pair remained on the defensive through the early European session and was last seen trading around the key 1.2500 psychological mark.
The pair added to the overnight modest losses and edged lower for the second successive day on Tuesday amid bullish crude oil prices, which tend to underpin the commodity-linked loonie. In fact, the black gold rallied to a more than seven-year high in the wake of rising geopolitical tensions in the Middle East.
In fact, Yemen's Houthi group claimed to have launched a drone strike on the United Arab Emirates’ capital city of Abu Dhabi, killing three people. This fueled worries about possible supply disruptions from the third-biggest OPEC producer and added to the bullish sentiment amid shrinking global oil inventories.
The downside, however, remains cushioned, at least for now, on the back of a broad-based US dollar strength, bolstered by surging US Treasury bond yields. The yield on the benchmark 10-year US government bond shot to the highest level since January 2022 amid bets that the Fed would start raising rates in March 2022.
The mixed fundamental backdrop warrants some caution before positioning for any firm near-term direction ahead of the upcoming FOMC policy meeting on January 25-26. In the meantime, traders on Tuesday will take cues from the release of the Empire State Manufacturing Index and oil price dynamics for some short-term opportunities.
Technical levels to watch
The Canadian dollar has been battered in recent weeks. But economists at the National Bank of Canada still expect the loonie to appreciate further in the coming months.
Interest rate spread to stay positive
“Rising commodity prices, a current account surplus, a strong labour market and positive interest rate differentials argue for an appreciation of the Canadian dollar.”
“Despite the uncertainty created by the latest COVID variant, we remain comfortable with our current forecast of a C$1.20 rate for the US dollar in 2022.”
EUR/USD is testing 1.1400 after closing the first day of the week slightly lower. As FXStreet’s Eren Sengezer notes, the euro could weaken further if bulls fail to defend 1.1380.
1.1400 has become a pivot point in the near-term
“The pair is currently trading near 1.1400 – Fibonacci 23.6% retracement of the uptrend that started on January 6 and lasted for a week. In case this level turns into resistance, the next support aligns at 1.1380 (50-period SMA on the four-hour chart, Fibonacci 50% retracement). With a decisive drop below that level, additional losses toward 1.1350 (100-period SMA, Fibonacci 61.8% retracement could be witnessed).”
“On the upside, buyers could show interest in the common currency if 1.1400 proves to be stronger support than it appears. 1.1430 (20-period SMA, Fibonacci 23.6% retracement) could be seen as the hurdle on the upside.”
The yen came under pressure, with USD/JPY extending yesterday’s gains to push the 115.00 level as the Bank of Japan meeting was largely disappointed. No change in policy is on the horizon, and this is set to add pressure on the yen, according to economists at ING.
BoJ disappoints hawkish expectations
“The Bank’s inflation estimates are now 1.1% for both FY2022 and FY2023, compared to the previous 0.9% and 1.0%, respectively, figures that hardly suggest an imminent change in the BoJ’s ultra-dovish stance. Incidentally, Governor Haruiko Kuroda poured cold water on any speculation that a potential rate hike in 2024 was being discussed.”
“We think there is further room for the pair to rise on the back of rising US treasury yields in the near-term, and we expect a convergence to the early-January 116 levels.”
“For today, new signs of fragility in the equities as US markets re-open after a long weekend may help the yen find some stabilisation.”
In a trading day starting with general USD strength across the board, the pound is holding up well, helped by some good jobs data released this morning. As economists at ING note, good UK jobs data is also supporting hawkish Bank of England (BoE) bets.
Data doing little to challenge hawkish BoE bets
“After showing resilience to the end of the furlough scheme, the UK labour market continued to tighten in November, with the unemployment rate moving a notch lower, to 4.1%. Wage growth decelerated, but not more than consensus and remained above 4.2%.”
“We think that the BoE’s rate expectations (four hikes by the end of 2022) are overdone, but this morning’s jobs data as well as tomorrow’s CPI data are set to do little to challenge the current hawkish bets. Ultimately, this means that the pound’s good momentum, which has remained immune to the UK’s political noise – should remain broadly intact into the 3 February BoE meeting.”
“EUR/GBP remains on track for a move below 0.8300.”
Oil prices have rallied along with the rest of the energy space and in the bigger picture the broad commodity space. According to strategists at Danske Bank, hawkish central banks are set to weigh on oil prices. Consequently, they still forecast Brent to average $75 throughout the year.
More supply from OPEC+ and rebound in USD to pull prices down again
“Demand may be nearing a peak since central banks are likely to contemplate tightening monetary policy next year.”
“Prices are above our forecast for this year, but we think it will be temporary. More supply from OPEC+ and a rebound in USD should pull prices down again.”
“We keep our forecasts unchanged. Medium-term past years’ of lower investment will keep prices elevated. We expect Brent to average $75bbl in 2022 and $80/bbl in 2023.”
In response to rampaging US inflation, economists at Nordea now expect the Federal Reserve to hike rates four times this year followed by another four in 2023. They see more upside for long yields and expect EUR/USD to bottom by the end of the year.
The Fed is turning more hawkish by the day
“The Fed to hike rates four times both this year and next and also decide to start contracting the balance sheet during the summer.”
“The ECB to stop net bond purchases in the first half of 2023 and raise rates towards the end of next year.”
“EUR/USD to bottom at 1.08 at the end of this year and already rebound sharply in 2023.”
“US 10-year yield to rise to 3% by the end of next year, but the bulk of the increase is likely to be seen already this year.”
EUR/GBP has been volatile but GBP has seen support. In the opinion of economists at Danske Bank, the scope of sterling strength has likely come to an end – and they see risks skewed to GBP weakness.
A hit to global risk sentiment could hit GBP
“We are having a hard time seeing a much stronger GBP with fragile risk sentiment and the aggressive BoE pricing and possibly increasing Brexit risks in 2022.
“We keep our 12M target for EUR/GBP unchanged at 0.84.”
- GBP/USD attracted some dip-buying on Tuesday and reversed the early downtick to a one-week low.
- An unexpected fall in the UK unemployment rate, BoE rate hike bets acted as a tailwind for sterling.
- Surging US bond yields underpinned the USD and capped gains amid the recent UK political drama.
The GBP/USD pair reversed an intraday dip to a one-week low and held steady in the neutral territory, just below mid-1.3600s following the release of the UK employment details.
The pair extended last week's rejection slide from the very important 200-day SMA and edged lower during the early part of the trading on Tuesday amid sustained US dollar buying interest. A continual surge in the US Treasury bond yields – bolstered by the prospects for a faster policy tightening by the Fed – turned out to be a key factor that continued underpinning the greenback.
In fact, the yield on the benchmark 10-year US government bond shot to the highest level since January 2022 amid growing acceptance that the Fed would start raising interest rates in March 2022. Apart from this, a generally weaker tone around the equity markets further benefitted the greenback's safe-haven status and dragged the GBP/USD pair to a one-week low, around the 1.3620 area.
That said, hopes that the Omicron outbreak won't derail the UK economy, along with rising bets for additional rate hikes by the Bank of England acted as a tailwind for the British pound. Apart from this, an unexpected dip in the UK unemployment rate, to 4.1% during the three months to November assisted the GBP/USD pair to attract some dip-buying at lower levels.
The attempted recovery, however, lacked follow-through amid the latest political development in the United Kingdom. The calls for UK Prime Minister Boris Johnson to resign are rising from within the Conservative party after an admission that he attended a lockdown-breaching party in May 2020. This, in turn, should hold back traders from placing bullish bets around the GBP/USD pair.
Traders now look forward to the release of the US economic docket, featuring the release of the Empire State Manufacturing Index for some impetus later during the early North American session. The focus, however, will remain on the upcoming FOMC policy meeting on January 25-26, which will help determine the next leg of a directional move for the GBP/USD pair.
Technical levels to watch
Here is what you need to know on Tuesday, January 18:
The greenback managed to post modest gains against its major rivals and looks to preserve its bullish momentum early Tuesday with the US Dollar Index rising above 95.30. The benchmark 10-year US Treasury bond yield is at its highest level in two years near 1.85%, up more than 1% on a daily basis. ZEW Survey from Germany will be featured in the European economic docket ahead of NY Empire State Manufacturing Index data from the US on Tuesday.
Meanwhile, S&P Futures and Nasdaq Futures were down 0.4% and 0.9%, respectively, at the time of press, suggesting that safe-haven flows could dominate the markets in the second half of the day. Heightened geopolitical tensions due to the Russia-Ukraine conflict, the rising number of coronavirus cases in China seem to be weighing on risk sentiment.
EUR/USD is testing 1.1400 after closing the first day of the week slightly lower. The pair remains at the mercy of the dollar's market valuation.
GBP/USD extended its downward correction early Tuesday and continues to edge lower toward 1.3600. Political jitters in the UK and the sour market mood could cause the pair to stay on the back foot. The data published by the ONS showed earlier in the session that the Unemployment Rate edged lower to 4.1% from 4.2% as expected. Average Earnings Including Bonus rose by 4.2% in November, compared to 4.9% in October.
USD/JPY rose sharply toward 115.00 on the back of surging US Treasury bond yields after closing in the positive territory on Monday. The Bank of Japan (BOJ) left its monetary policy settings unchanged as expected. BOJ Governor Haruhiko Kuroda said that they are not considering hiking the key rate or tweaking the current monetary easing. Additionally, the BOJ reiterated in its quarterly report that the economic pick-up is becoming clearer.
Gold fluctuated in a tight range and closed the day virtually unchanged near $1,820 on Monday. Rising US Treasury bond yields seem to have started to weigh on the yellow metal in the early Europen session.
USD/CAD edged lower despite renewed dollar strength on Monday and tests 1.2500 early Tuesday. Rising crude oil prices help the commodity-related loonie find demand. The Bank of Canada's (BOC) Business Outlook Survey (BOS) revealed on Monday that the business sentiment continued to improve at an impressive pace in the fourth quarter with the BOS Indicator rising to a record high of 5.99 from 4.73 in the third quarter.
Bitcoin has failed to gather recovery momentum and returned to the $42,000 area on Monday, where it seems to have gone into a consolidation phase early Tuesday. Ethereum lost more than 4% on Monday and came in within a touching distance of $3,000, giving back a large portion of last week's gains.
Gold is extending its sideways consolidative price move for the second successive day. As FXStreet’s Haresh Menghani notes, the yellow metal has continued trading comfortably above the 200-day moving average around the $1,800 neighborhood and faces stubborn resistance at the $1,830/32 area.
Convincing break below $1,790 to pave the way for deeper losses
“XAU/USD has managed to hold above the very important 200-day SMA around the $1,800 mark. This is followed by an upward sloping trend-line extending from August 2021 swing low, currently around the $1,790 region, which should now act as a pivotal point. A convincing break below will be seen as a fresh trigger for bearish traders and pave the way for deeper losses. Gold might then accelerate the slide towards the $1,768-67 intermediate support en-route December swing low, around the $1,753 region.”
“The $1,830-32 supply zone should continue to act as immediate strong resistance. Some follow-through buying has the potential to lift gold to the next relevant hurdle near the $1,848-50 region. The upward trajectory could further get extended towards the $1,869-70 area en-route the $1,877 zone.”
- UK claimant count change arrived at -43.3K in December.
- The unemployment rate in the UK dropped to 4.1% in November.
- The UK wages excluding bonuses fell to 3.8% YoY 3.8% expected.
The Office for National Statistics (ONS) showed on Tuesday, the UK’s official jobless rate surprised markets to the upside, by arriving at 4.1% in November vs. the previous 4.2% and 4.2% expected while the claimant count change showed a smaller than previous drop last month from the previous.
The number of people claiming jobless benefits fell to 43.3K in December when compared to -49.8K booked previously. The claimant count rate came in at 4.7% vs. 4.8% last.
The UK’s average weekly earnings, excluding bonuses, arrived at 3.8% 3Mo/YoY in November versus +4.3% last and +3.8% expected while the gauge including bonuses came in at 4.2% 3Mo/YoY in November versus +4.9% previous and +4.2% expected.
Key points (via ONS)
‘There were 184,000 more people in payrolled employment in December 2021 when compared with November 2021.”
‘The UK vacancies rose to a new record of 1,247,000 in three months to Dec.”
GBP/USD reaction
GBP/USD keeps the rebound intact at around 1.3650 on the upbeat UK jobs report.
The spot was last seen trading at 1.3646, modestly flat on the day.
About UK jobs
The UK Average Earnings released by the Office for National Statistics (ONS) is a key short-term indicator of how levels of pay are changing within the UK economy. Generally speaking, the positive earnings growth anticipates positive (or bullish) for the GBP, whereas a low reading is seen as negative (or bearish).
- Gold prices snap two-day uptrend as Euro tracks firmer Bund yields.
- Increasing hopes of faster monetary policy normalization in Europe, the US propel yields.
- Virus woes, stimulus hopes fail to provide decisive signals.
Gold (XAU/EUR) declines to €1,593, down 0.06% intraday as bears sneak in after a two-day absence during early Tuesday in Europe.
In doing so, the gold prices take clues from the firmer German Bund yields, as well as virus woes, while snapping a two-day uptrend.
That said, German 10-year Bund yields rose 1.6 basis points (bps) to -0.008%, the fresh high since May 2019 at the latest. In doing so, the German bund coupons track their US counterparts.
It’s worth noting that the US 10-year and 5-year Treasury yields refresh two-year highs while the 2-year bond coupon jumps to the February 2020 levels amid escalating future market bets on the US Federal Reserve’s (Fed) faster rate hikes in 2022. “Fed fund futures extend slide as December 2022 implies rates of 1.05%, July 2023 near 1.50%,” said Reuters.
Elsewhere, Australia reports the biggest daily death toll due to the covid, China braces for tighter activity controls in Tianjin. Further, Japan’s Tokyo also braces for quasi-emergency together with the other nine prefectures.
Amid these plays, stock futures in the US and Europe print losses while crude oil prices improve.
Moving on, ZEW sentiment numbers for Germany and Eurozone for January will be crucial to watch for immediate directions.
Technical analysis
Gold prices step back from a two-week-old symmetrical triangle’s resistance line, as well as the 100-SMA, amid steady RSI line.
Given the repeated failures to cross the triangle and the key SMA, the metal prices are likely declining towards the 200-SMA level of €1,588. Though, a convergence of the 50% Fibonacci retracement of December-January upside and support line of the stated triangle, near €1,584, will challenge the metal’s further weakness.
On the contrary, an upside clearance of €1,595 will propel the XAU/EUR towards the €1,600 threshold. Following that, the monthly peak near €1,614 will be in focus.
Overall, gold prices in Euro are likely to witness a pullback inside a short-term neutral chart pattern.
Gold: Four-hour chart
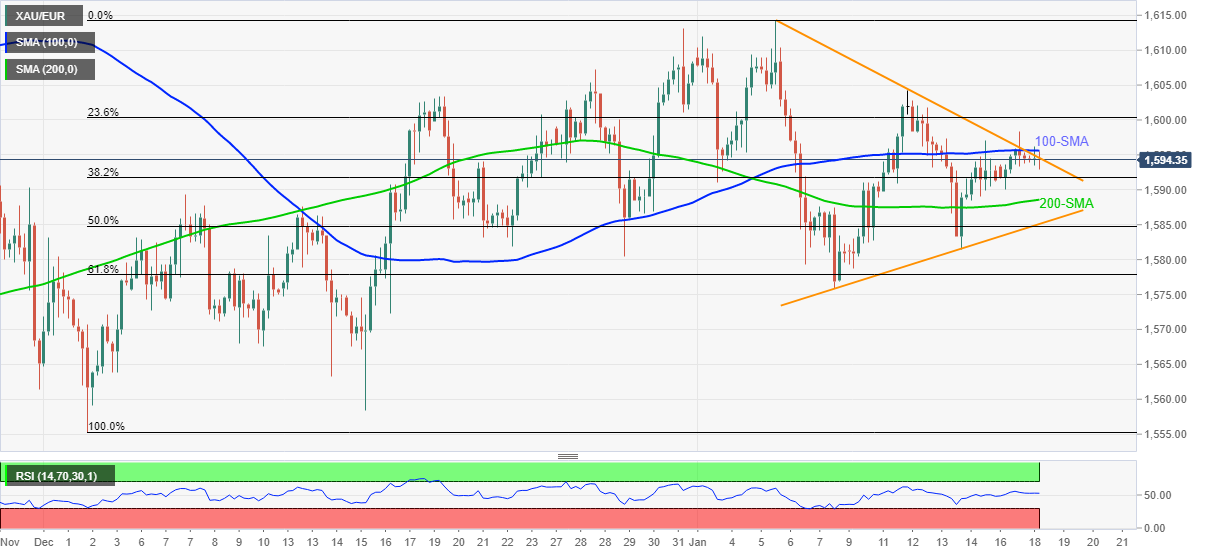
Trend: Further weakness expected
- USD/JPY edged higher on Tuesday, albeit struggled to find acceptance above the 115.00 mark.
- The widening of the US-Japanese yield differential continued acting as a tailwind for the major.
- A softer risk tone benefitted the safe-haven JPY and kept a lid on any further gains for the pair.
The USD/JPY pair maintained its bid tone heading into the European session, albeit has retreated a few pips from the daily high and was last seen trading just below the 115.00 mark.
The pair built on its recovery from a multi-week low, around mid-113.00s touched in reaction to dismal US retail sales report on Friday and gained traction for the second straight day on Tuesday. A further widening of the US-Japanese government bond yield differential was seen as a key factor that acted as a tailwind for the USD/JPY pair.
In fact, the yield on the benchmark 10-year US government bond shot to the highest level since January 2022 amid growing acceptance that the Fed would start raising interest rates in March 2022. Conversely, the yield on the 10-year Japanese government bond remained near zero due to the Bank of Japan's yield curve control policy.
Meanwhile, a continual surge in the US bond yields underpinned the US dollar, which provided an additional lift to the USD/JPY pair. That said, an extended sell-off in the US money markets tempered investors' appetite for riskier assets. This, in turn, benefitted the safe-haven Japanese yen and capped the upside for the major.
The intraday movement seemed rather unaffected by the Bank of Japan's (BoJ) decision to leave interest rates steady at -0.10% at the end of its policy meeting on Tuesday. In the post-meeting press conference, the BoJ Governor Haruhiko Kuroda reiterated that the central bank will ease policy further without hesitation as needed.
The fundamental backdrop favours bullish traders and supports prospects for additional gains. Bulls, however, are likely to wait for a sustained strength beyond the key 115.00 psychological mark before positioning for a further near-term appreciating move. Traders now look forward to the Empire State Manufacturing Index for a fresh impetus.
Technical levels to watch
Commenting on the prospects of an interest rate hike, the Bank of Japan (BOJ) Governor Haruhiko Kuroda said that they are “not debating rate hikes.”
Additional quotes
Not considering at all rate hikes or tweaking current monetary easing.
Not in situation of prices steadily rising towards 2% target.
It's true prices are rising for temporary factors.
- The index pushes further north of the 95.00 yardstick on Tuesday.
- US markets return to normality following the MLK Jr. holiday.
- NY Empire State Index, NAHB Index, TIC Flows next on tap.
The greenback, when tracked by the US Dollar Index (DXY), keeps the buying bias unchanged and approaches the 95.50 region on turnaround Tuesday.
US Dollar Index up on yields, looks to data
The index advances for the third consecutive session on Tuesday amidst the renewed sentiment towards the buck and the relentless move higher in US yields across the curve.
Indeed, yields of the 2y note trade well past the 1.0% yardstick for the first time in nearly two years, while the 10y reference approaches 1.85% and the long end trade in multi-month peaks above 2.16%. The closely watched 2y-10y yield spread now hovers around the 80 pts.
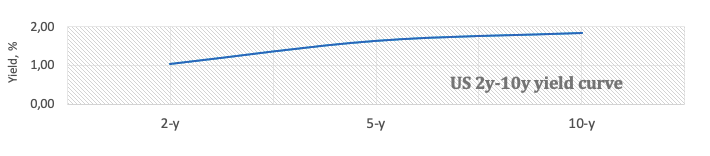
Meanwhile, investors continue to adjust to the increasing prospects of a Fed’s lift-off sooner than expected, with the March meeting a likely candidate to start the tightening cycle. Recent Fedspeak, Powell’s testimony last week and persistent elevated inflation underpins this potential scenario.
In the US data space, the NY Empire State Index is due in the first turn seconded by the NAHB Index, while November TIC Flows will close the calendar.
What to look for around USD
The index regained composure and reclaimed the 95.00 mark and above in past sessions, partially reversing the intense selloff witnessed during most of last week. Higher US yields propped up by firmer speculation of a sooner Fed’s lift-off and supportive Fedspeak helped the buck to regain part of the shine lost in past sessions, all against the backdrop of persistent elevated inflation and the solid performance of the US economy.
Key events in the US this week: NAHB Index, TIC Flows (Tuesday) – Building Permits, Housing Starts (Wednesday) – Initial Claims, Philly Fed Index, Existing Home Sales (Thursday).
Eminent issues on the back boiler: Start of the Fed’s tightening cycle. US-China trade conflict under the Biden’s administration. Debt ceiling issue. Potential geopolitical effervescence vs. Russia and China.
US Dollar Index relevant levels
Now, the index is gaining 0.07% at 95.31 and a break above 95.76 (55-day SMA) would open the door to 96.46 (2022 high Jan.4) and finally 96.93 (2021 high Nov.24). On the flip side, the next down barrier emerges at 94.62 (2022 low Jan.14) seconded by 93.27 (monthly low Oct.28 2021) and then 93.15 (200-day SMA).
The Bank of Japan’s (BOJ) Haruhiko Kuroda said that the central bank “will ease policy further without hesitation as needed” yet another time, as he speaks at the post-monetary policy meeting press conference scheduled on Tuesday.
Additional quotes
No need to change current monetary easing.
Will patiently continue current powerful monetary easing.
In many cases commodity-driven inflation has been short-lived in Japan.
Wages are rising moderately reflecting tight labor market.
Necessary to pay attention to whether higher prices are not negatively impacting households.
Market reaction
USD/JPY is keeping its range below 115.00 on these above comments. The spot is, however, up 0.22% on the day, currently trading at 114.85.
- Asian-Pacific shares remain mostly on the back foot as US Treasury bond yields rally to multi-day high.
- Virus woes escalate in Japan, BOJ keeps monetary policy unchanged while raising price outlook.
- China’s PBOC braces for rate cut after MLF reduction, financial market risks loom.
- Australia reports record virus-led death toll, New Zealand Business Confidence eased.
Markets in the Asia-Pacific region remain sluggish, mostly pressured, during early Tuesday in Europe as the firmer US Treasury yields joined upbeat oil prices. On the same line are concerns relating to the South African covid variant, namely Omicron, as well as the Fed rate hike.
That said, the US 10-year and 5-year Treasury yields refresh two-year highs while the 2-year bond coupon jumps to the February 2020 levels at the latest. Also portraying the risk-off mood is the S&P 500 Futures drop 0.45% by the press time.
Behind the moves could be the slide in the Fed Fund Futures rate. “Fed fund futures extend slide as December 2022 implies rates of 1.05%, July 2023 near 1.50%,” said Reuters. Escalating bets on the faster rate hikes propel the US bond yields.
Elsewhere, Australia reports the biggest daily death toll due to the covid, China braces for tighter activity controls in Tianjin. Further, Japan’s Tokyo also braces for quasi-emergency together with the other nine prefectures.
Talking about data, the Bank of Japan (BOJ) revised up inflation outlook while keeping the monetary policy unchanged. Further, New Zealand’s NZIER Business Confidence for the fourth quarter (Q4) dropped to -28% versus -11% prior.
Amid these plays, MSCI’s index of Asia-Pacific shares outside Japan drops 0.50% whereas Japan’s Nikkei 225 declines 0.25% by the press time.
Australia’s ASX 200 and Hong Kong’s Hang Seng print mild losses at the latest while China manages to print mild gains amid hopes of further easy money policies to defend the domestic financial market on fresh risks from the key developers.
Elsewhere, New Zealand’s NZX 50 and India’s BSE Sensex struggle for clear direction whereas South Korea’s KOSPI and Indonesia’s ISX Composite print around 0.80% losses each at the latest.
On a broader front, the US 10-year and 5-year Treasury yields refresh two-year highs while the 2-year bond coupon jumps to the February 2020 levels at the latest. Also portraying the risk-off mood is the S&P 500 Futures drop 0.45% by the press time.
Looking forward, US NY Empire State Manufacturing Index for January and NAHB Housing Market Index will decorate the calendar whereas bond yields and virus updates will be important too.
- Silver prices struggle to overcome intraday low, reverses Monday’s gains.
- Bearish MACD signals keep sellers hopeful inside short-term symmetrical triangle.
- 200-SMA, 50% Fibonacci retracement act as additional trading filters.
Silver (XAG/USD) fades bounce off intraday low, down 0.40% on a day while recently easing to $22.92 ahead of Tuesday’s European session.
In doing so, the bright metal drops back to the 100-SMA while staying inside a two-month-old symmetrical triangle.
Given the bearish MACD signals and repeated failures to stay firmer above the 100-SMA, XAG/USD is likely to break the $22.85 immediate support.
Following that, the 200-SMA level of $22.60 may offer an intermediate halt during the metal’s likely fall towards the stated triangle’s support line near $22.20.
On the contrary, a clear upside break of the triangle’s resistance line, close to $23.30, becomes necessary for the commodity prices to aim for a 50% Fibonacci retracement level of November-December downside, near $23.40.
In a case where silver rises past $23.40, the late November swing high near $23.75 may test the bulls before directing them to the $24.00 threshold.
Overall, silver prices are likely to remain pressured inside a neutral chart pattern.
Silver: Four-hour chart
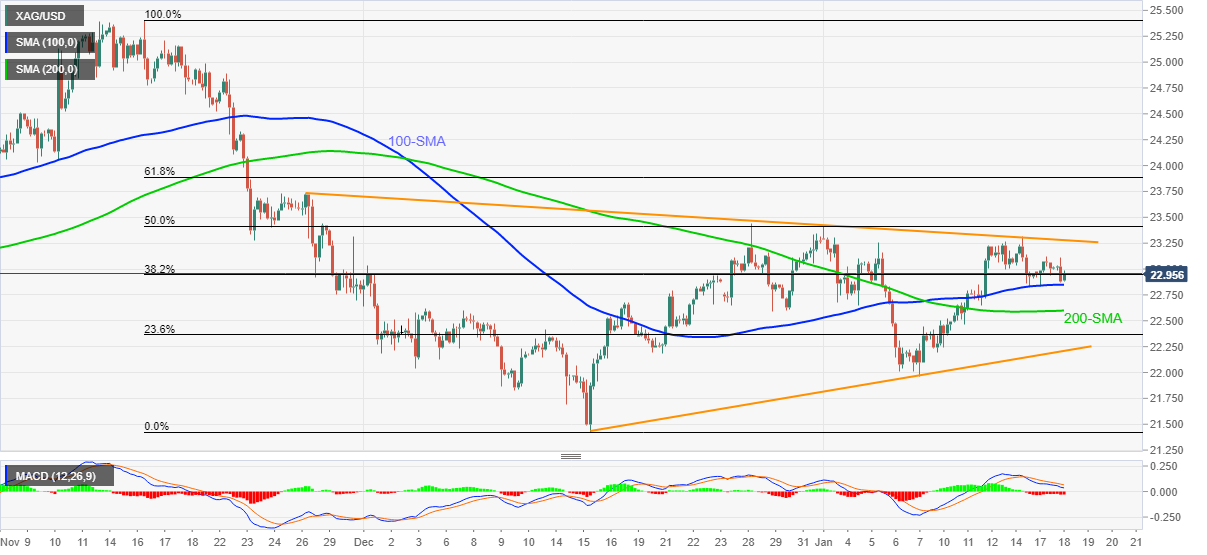
Trend: Further weakness expected
Quek Ser Leang at UOB Group’s Global Economics & Markets Research suggests USD/MYR could navigate within the 4.1680-4.2060 range.
Key Quotes
“The sharp drop in USD/MYR to a low of 4.1680 last week came a surprise (we were expecting USD/MYR to test the resistance at 4.2200). The rapid decline appears to be running ahead of itself and USD is unlikely to weaken further.”
“For this week, USD/MYR is more likely to consolidate between 4.1680 and 4.2060. Looking ahead, a break of 4.1680 is not ruled but any decline is expected to encounter solid support at 4.1620 followed by 4.1560.”
The Turkish central bank (CBRT) is reportedly said to hold an extraordinary general assembly on February 3, Reuters reports, citing a newspaper advertisement on Tuesday.
USD/TRY is seen breaking higher from the Asian consolidative mode, now closing in on the 13.50 hurdle on the above headlines.
more to come ....
- USD/INR takes the bids to refresh weekly top, up for the fourth consecutive day.
- India daily covid infections rise, WTI crude oil pokes 2021 top.
- US Treasury yields refresh multi-day peak, India bond coupons follow the suit.
USD/INR leaps to 74.41, up 0.20% intraday during the fourth consecutive day of an upside momentum amid early Tuesday.
The Indian rupee (INR) pair tracks the US Treasury yields and firmer oil prices to extend the north-run towards the monthly peak.
That said, the US 10-year and 5-year Treasury yields refresh two-year highs while the 2-year bond coupon jumps to the February 2020 levels at the latest. Also portraying the risk-off mood is the S&P 500 Futures drop 0.45% by the press time.
“The yield on the benchmark 6.10% bond maturing in 2031 is likely to trade in the 6.62%-6.66% band today, a trader with a private bank said. The note ended at 96.27 rupees, yielding 6.64%, the highest since Jan. 20, 2020, yesterday. The Indian rupee was at 74.24 per dollar yesterday,” said Reuters.
It’s worth noting that the WTI crude oil prices rise around 1.0% around $85.00 while poking the year 2021 peak, posted in October.
Elsewhere, escalating virus woes in Asia-Pacific also weigh on the INR. While Australia reports the biggest daily death toll due to the covid, China braces for tighter activity controls in Tianjin. Further, Japan’s Tokyo also braces for quasi-emergency together with the other nine prefectures. At home, India reports 682 fresh cases of Omicron versus 466 posted yesterday.
That said, the risk-off mood propels USD/INR prices and the same is likely to keep the pair buyers hopeful ahead of the next week’s Federal Open Market Committee (FOMC) meeting. For today, US NY Empire State Manufacturing Index for January and NAHB Housing Market Index will decorate the calendar.
Technical analysis
A clear upside break of the 200-DMA level of 74.27 directs USD/INR bulls towards the 100-DMA level of 74.56 and then to the monthly peak of 74.68. Alternatively, pullback moves remain elusive until staying beyond 74.27.
“China’s economy to grow by 4.8% in 2022,” forecasts the global rating giant Fitch during early Tuesday morning in Asia, per Reuters.
Additional quotes
China's growth should improve during the second half of 2022, as policy support in mainland China takes effect.
Growth across greater China will slow in 2022 following its strong economic recovery in 2021.
Expect macro-policy easing to advance in early 2022 in mainland China, after a 50bp reduction to banks’ reserve requirement ratios in December 2021.
USD/CNY refreshes 32-month low
USD/CNY pays a little heed to mixed growth forecasts from Fitch while printing a three-day downtrend to poke the fresh low since May 2018, down 0.06% daily around $6.34 by the press time.
Also read: China opens door to more monetary easing actions ahead
- GBP/JPY extends pullback from daily top after flashing bearish candlestick on the hourly chart.
- Failures to cross 200-HMA, weekly resistance line add to the bearish bias.
- 50-HMA offers immediate support ahead of 23.6% Fibonacci retracement.
GBP/JPY remains on the back foot around 156.60, paring intraday gains with the latest U-turn from 156.91 during early Tuesday morning in London.
The pair justifies technical signals to return to the seller’s desk, despite printing mild intraday gains by the press time.
Among them, a bearish Doji candlestick below the 200-HMA and a descending resistance line from January 12, not to forget the steady Momentum line, play their roles.
That said, the GBP/JPY prices currently drop towards 50-HMA level near 156.30 while 23.6% Fibonacci retracement (Fibo.) of January 12-14 declines, near 156.00, will challenge the pair bears afterward.
In a case where the pair remains bearish past 156.00, the monthly low near 155.45 will be on the cards.
Alternatively, a clear upside break of the 200-HMA level of 156.77 will direct GBP/JPY prices towards the 157.00 threshold.
Following that, 154.45 and the monthly peak of 157.76 should lure the GBP/JPY buyers before directing them to the 2021 high near 158.22.
GBP/JPY: Hourly chart
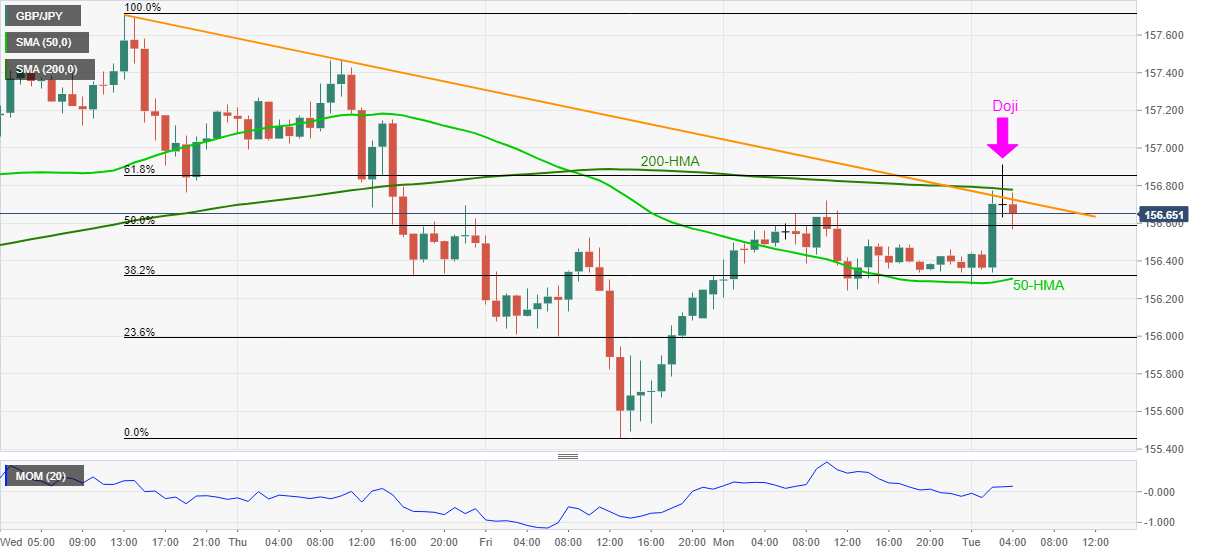
Trend: Further declines expected
- EUR/USD takes offers to refresh intraday and one-week low during three-day declines.
- US Treasury yields refresh multi-day high, fuels DXY for third consecutive day.
- Mixed concerns over Omicron, ECB v/s Fed battle keep pair sellers hopeful.
- German/Eurozone ZEW data, US second-tier activity, housing numbers will decorate calendar.
EUR/USD buyers face rejection during early Tuesday morning in Asia as the quote tracks firmer US Treasury yields to test 1.1385 level, currently down 0.08% around 1.1400.
In doing so, the major currency pair refreshes daily/weekly low while portraying a three-day downtrend as the US Dollar Index (DXY) rises for the third consecutive day.
That said, the DXY prints 0.14% daily gains around 95.36 as US bond yields refresh multi-day tops. It’s worth noting that the US 10-year and 5-year Treasury yields refresh two-year highs while the 2-year bond coupon jumps to the February 2020 levels at the latest. Also portraying the risk-off mood is the S&P 500 Futures drop 0.45% by the press time.
While tracing the strong US Treasury yields, the market’s indecision over the US Federal Reserve’s (Fed) next moves, as well as uncertainty over Omicron, could be held responsible. Friday’s hawkish comments from Federal Reserve Bank of San Francisco President Mary Daly and New York Fed President John Williams are the major drivers for the firmer US bond yields.
Also fueling the yields are record high virus-led deaths in Australia and Japan’s readiness to declare quasi-emergency in Tokyo and 10 other prefectures due to recent jump in the covid cases. Furthermore, risk-negative headlines from Russia, signaling intensifying conditions with Ukraine, also propel the US Treasury yields.
It should be noted, however, that hawkish European money market bets for the 20 basis points (bps) of ECB hike battle recently softer US consumer-centric data to test the EUR/USD bears. However, ECB’s Lagarde sounds less hawkish than her Fed counterpart in the latest speech, which in turn keeps the pair sellers hopeful ahead of next week’s Federal Open Market Committee (FOMC) meeting.
In addition to the next week’s FOMC, US NY Empire State Manufacturing Index for January and NAHB Housing Market Index will be on the US calendar. Before that, ZEW sentiment numbers for Germany and Eurozone for January will be crucial to watch for immediate directions.
Technical analysis
Although failures to cross the 100-day EMA surrounding 1.1480 restricts the short-term upside of the EUR/USD prices, the 50-day EMA level of 1.1380 limits the pair’s immediate downside.
It’s worth noting that the EUR/USD weakness past 1.1380 will direct the quote towards a two-month-old support line near 1.1300, which holds the key to further south-run to 2021 bottom near 1.1185.
- AUD/USD declines for the fourth consecutive day, refreshes daily/weekly lows.
- US Treasury yields extend Friday’s run-up to renew multi-day tops after Monday’s holiday.
- Mixed concerns over virus, Fed’s next move keeps traders on the edge.
- Second-tier US data may entertain traders, Thursday’s Aussie jobs report, next week’s FOMC in focus.
AUD/USD takes offers near 0.7185, down 0.33% intraday as markets turn risk-off during early Tuesday. In doing so, the risk barometer pair refreshes daily and weekly lows while declining for the fourth day in a row.
The latest fall in the AUD/USD prices could be linked to the steady increase in the US Treasury yields as bond traders begin the week’s trading after Monday’s holiday.
That said, the US 10-year and 5-year Treasury yields refresh the highest level in two years while the 2-year coupon jumps to the February 2020 levels during the week-start move. It’s worth noting that S&P 500 Futures drop 0.37% by the press time.
It’s worth noting that the record high covid-led deaths in Australia, the latest is 76 per ABC News, also weigh on the AUD/USD prices. On the same line are geopolitical risks emanating from Russia, which recently signaled nearness to a war with Ukraine.
Further, Friday’s hawkish comments from Federal Reserve Bank of San Francisco President Mary Daly and New York Fed President John Williams added strength to the odds of faster Fed rate hikes in 2022 and offer additional burden on the AUD/USD prices, by way of firmer yields.
Looking forward, US NY Empire State Manufacturing Index for January and NAHB Housing Market Index will decorate the calendar for the day. Though, major attention will be given to Thursday’s Aussie jobs report for December and the next week’s Federal Open Market Committee (FOMC) meeting.
Technical analysis
A clear downside break of an ascending support line from January 07, near 0.7200, directs AUD/USD prices to the 200-SMA level on 4H near 0.7180.
Meanwhile, the 100-SMA on the four-hour chart near 0.7220 restricts the pair’s short-term upside ahead of the 100-DMA level surrounding 0.7285.
Markets have soured in recent trade without a known catalyst, so far. Covid spreading and the combination in recent news that Russia has begun emptying out its embassy in Kyiv, the Ukrainian capital. While not breaking news topics, they are fundamentally worthy of note:
An EU diplomat has stated that "Europe is now closer to war than it has been since the break up of former Yugoslavia," according to Katya Adler at the BBC.
''Stark words of warning from the senior EU diplomat I've just been speaking to off the record about current tensions with Moscow, over its huge military build-up on the border with Ukraine.''
She reports that the mood in Brussels is ''jumpy''.
''There's a real fear that Europe could be spiralling towards its worst security crisis in decades.
But angst isn't wholly focused on the prospect of a long, drawn-out ground war with Russia over Ukraine.
Few here believe Moscow has the military might, never mind the money, or popular support back home for that.''
Concerningly, Ukrainian and US officials say the evacuation could be the preparation for a conflict.
''How to interpret the evacuation has become part of the mystery of divining the next play by President Vladimir V. Putin of Russia,'' the New York Times wrote.
''In Washington, US officials say they still assess that Mr. Putin has not yet made a decision to invade. They describe him as more a tactician than a grand strategist, and they believe that he is constantly weighing a host of different factors.''
The article explains that ''the US officials say Mr. Putin may also have concluded that with the United States and other countries arming Ukraine, his military advantage is at risk of slipping away.''
While U.S. officials still believe Mr. Putin is undecided about his next move, officials in Kyiv are assessing what an attack may look like, if it happens. It could come in the form of a full-on invasion, the Ukrainian security official said.
However, for markets, there is a far greater threat than just troops and armour rolling in over Ukraine's border. Nuclear armament and the echoes of the 1962 Cuban Missile Crisis are the most extreme real risks that are being reported on in the media.
''The Russian leader telegraphed that approach himself by warning repeatedly in the past year that if the West crossed the ever-shifting “red line” that, in Mr. Putin’s mind, threatens Russia’s security, he would order an unexpected response,'' the NYT wrote.
“Russia’s response will be asymmetrical, fast and tough,” Mr. Putin said last April, referring to the kinds of unconventional military action that Russia could take if adversaries threatened “our fundamental security interests.”
With all that being said, five of the world's largest nuclear powers, the US, UK, France, and Russia, recently pledged to work together toward "a world without nuclear weapons" in a rare statement of unity amid rising East-West tensions.
However, as the BBC states, ''what Vladimir Putin plans to do next is unclear. But the West believes the Kremlin has invested too much in its very public manoeuvres over Ukraine to back down now, without something to show for it.''
Markets in action
In Asia, equities are off sharply in recent trade as risk appetite sours and the US dollar rallies sending USD/JPY towards the 115 target:
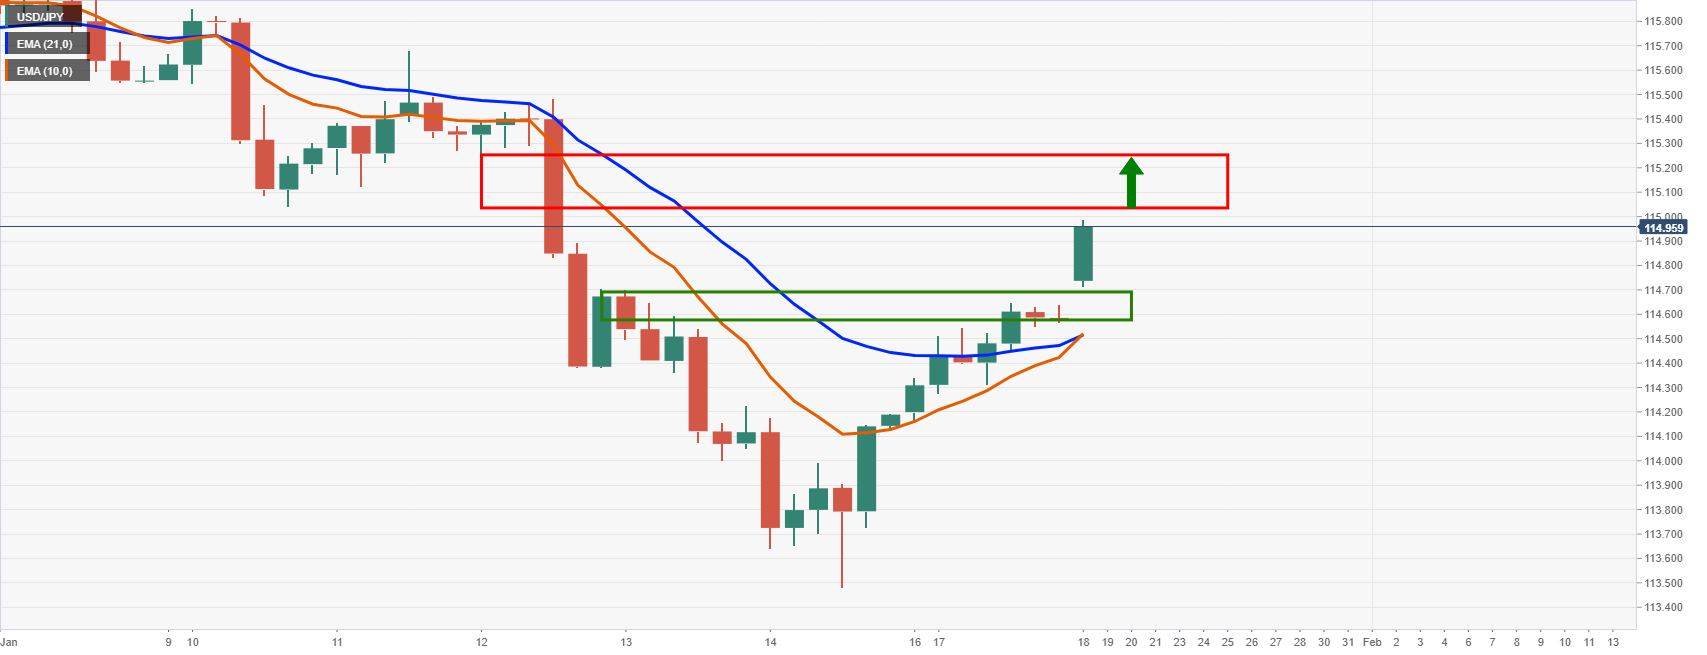
The S&P 500 is down some 0.4%, the US dollar, DXY, is up 0.16% and AUD/JPY has reversed course sharply to being flat on the day. US yields in the 10-years move to fresh two-year highs also.
- USD/JPY bulls take the lead and run towards 115 the figure.
- The bulls have broken critical resistance, clearing the way for further upside.
USD/JPY is catching a fresh wave of demand as bulls continue to drive the price towards a 115 objective for the forthcoming sessions. The Bank of Japan has left rates unchanged and updated its forecasts as follows. Meanwhile, USD/JPY trades around 114.70 and has climbed from a low of 114.44 to reach a 114.73 high so far.
BoJ key takeaways
The BoJ has left the 10-year yield target unchanged at 0.00% and leaves the policy balance rate unchanged at -0.10%.
The BoJ cut the 2021 median Gross Domestic Product forecast to 2.8% from 3.4% but raised the 2022 median GDP forecast to 3.8% from 2.9%.
The central bank's 2023 median GDP forecast has moved to 1.1% from 1.3%.
It has left the 2021 core Consumer Price Index median forecast unchanged at 0.00% but has raised the 2022 core CPI median forecast to 1.1% from 0.9% and the 2023 core CPI median forecast to 1.1% from 1.0%.
The BoJ says the positive economic cycle will strengthen as rising income push up expenditure, including that for households.
The central bank says the developments in overseas economies seen as risks to the economic outlook while wage earners' income is likely to gradually rise reflecting higher wages for sectors facing labour shortages.
USD/JPY technical analysis
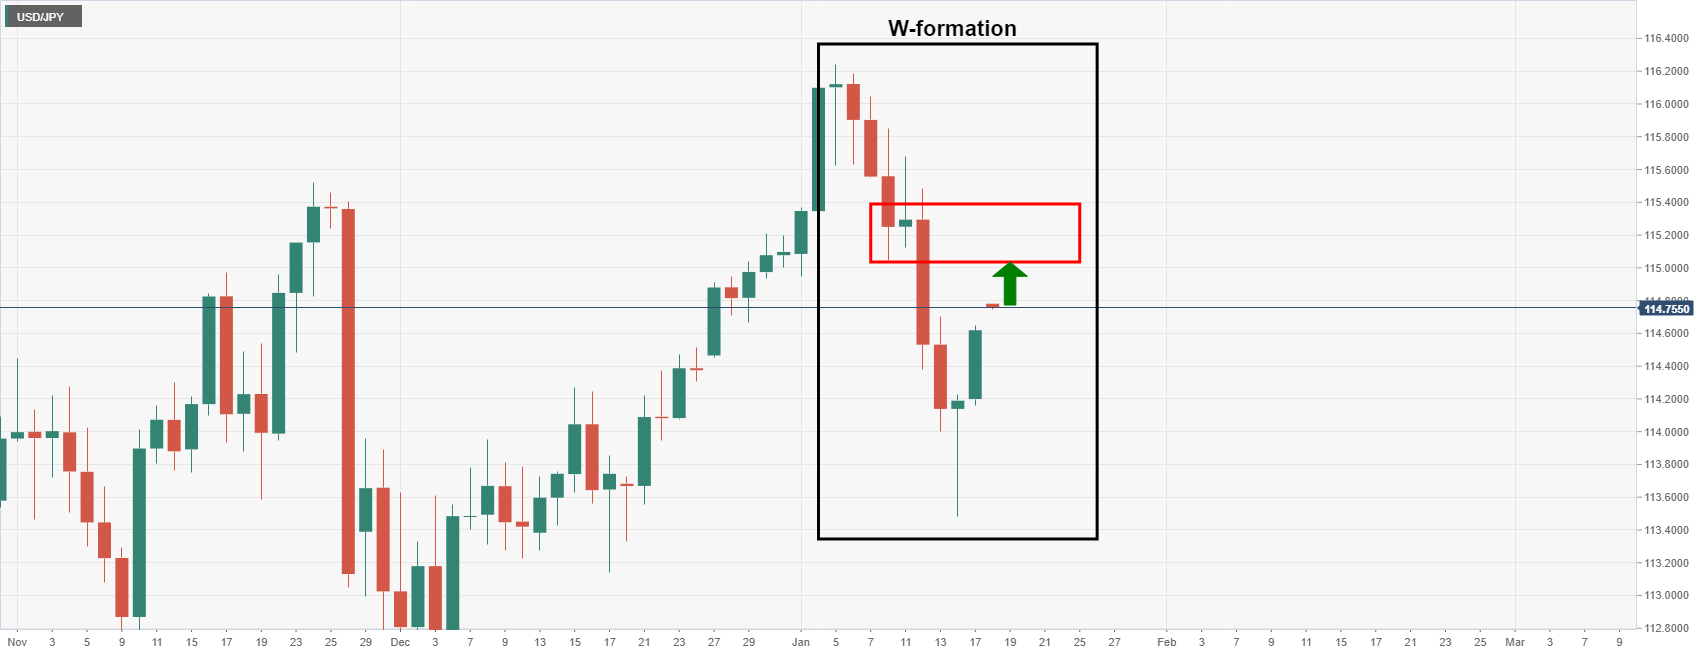
Following a shallow correction in late New York trade, The price is on target for a test of the neckline of the M-formation near 115 the figure. A break there could mitigate a further portion of the bearish impulse's range towards 115.50 as per the hourly chart below.
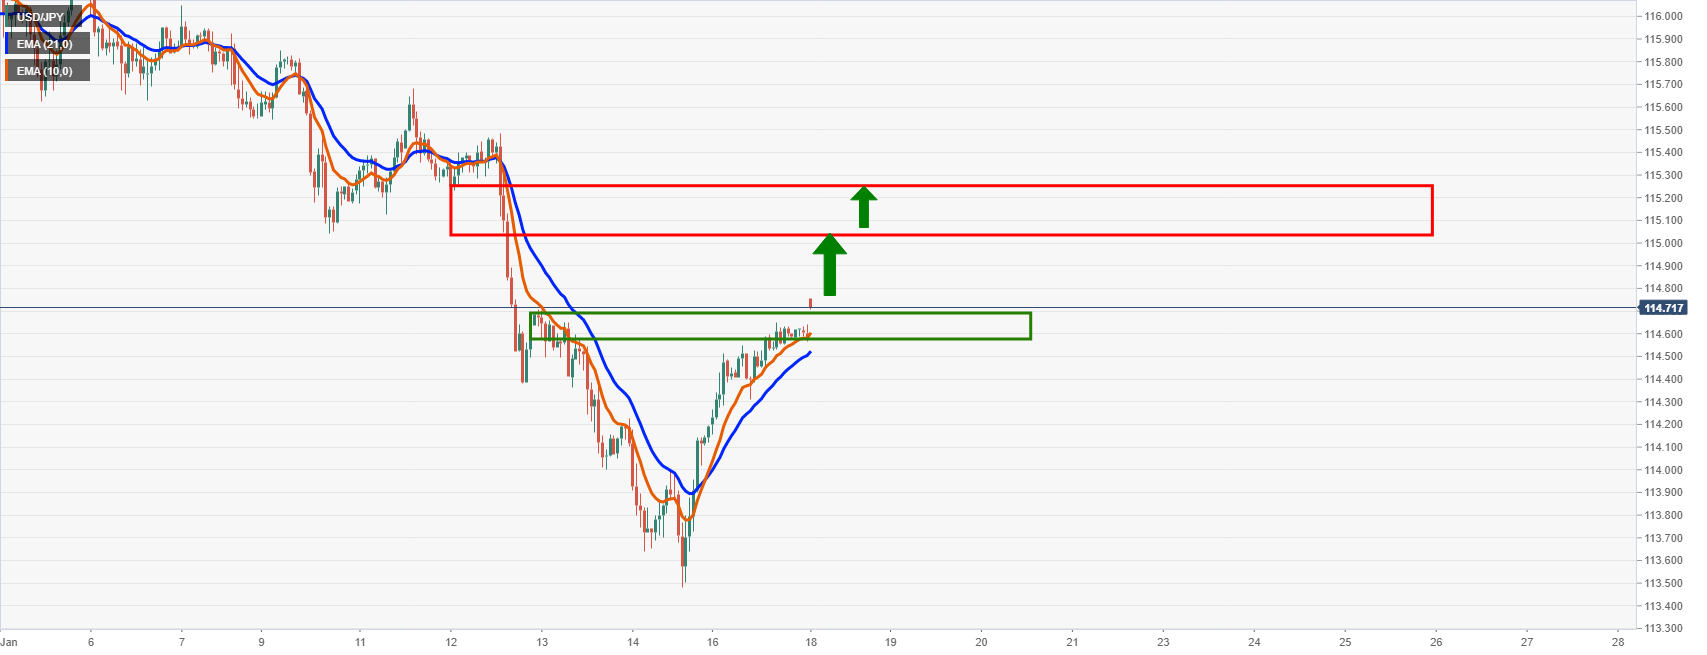
“The risks to Japan’s price outlook are roughly balanced,” the Bank of Japan (BOJ) stated in its quarterly outlook report that accompanied the monetary policy statement on Monday.
Key additional takeaways
Japan's economic pick-up becoming clearer.
Inflation expectations heightening moderately.
Consumer inflation hovering at slightly positive territory.
Japan's economy likely to recover.
Japan's consumer inflation likely to accelerate ahead.
Japan's consumer inflation to continue to move around 1% through end of BOJ report's projection period.
households to become more accepting of price hikes as wage gains accelerate.
Japan likely to see pass-through of costs, price hikes to broaden.
Underlying rise in inflation likely to heighten households' and firms' inflation expectations, push up prices further.
At its first monetary policy meeting of 2022, the Bank of Japan (BOJ) left its policy settings unchanged, although offered an optimistic outlook on inflation.
Key takeaways
BOJ made a decision on yield curve control by 8-1 vote.
BOJ board member Kataoka dissented to the decision on YCC.
developing story ...
- WTI remains on the front foot to refresh multi-day high.
- Bullish MACD keeps buyers hopeful to cross 2021 peak.
- Overbought RSI conditions test buyers from targeting June 2014 lows.
WTI pierces $84.00 to refresh a three-month high during early Tuesday. In doing so, the black gold rises 0.40% intraday.
Given the firmer MACD signals and sustained trading beyond the key SMAs, WTI crude oil prices seem capable to cross the immediate hurdle, namely the year 2021 top surrounding $85.00.
The following run-up will aim for the $90.00 psychological magnet before hitting the June 2014 trough close to $91.30.
It’s worth observing that the overbought RSI conditions will challenge WTI crude oil buyers beyond $85.00.
Alternatively, pullback moves may initially aim for the 100-DMA level of $75.85 and then to the 50-DMA near $75.10.
Following that, a six-week-old support line of around $72.50 will be crucial for oil sellers to watch.
WTI: Daily chart
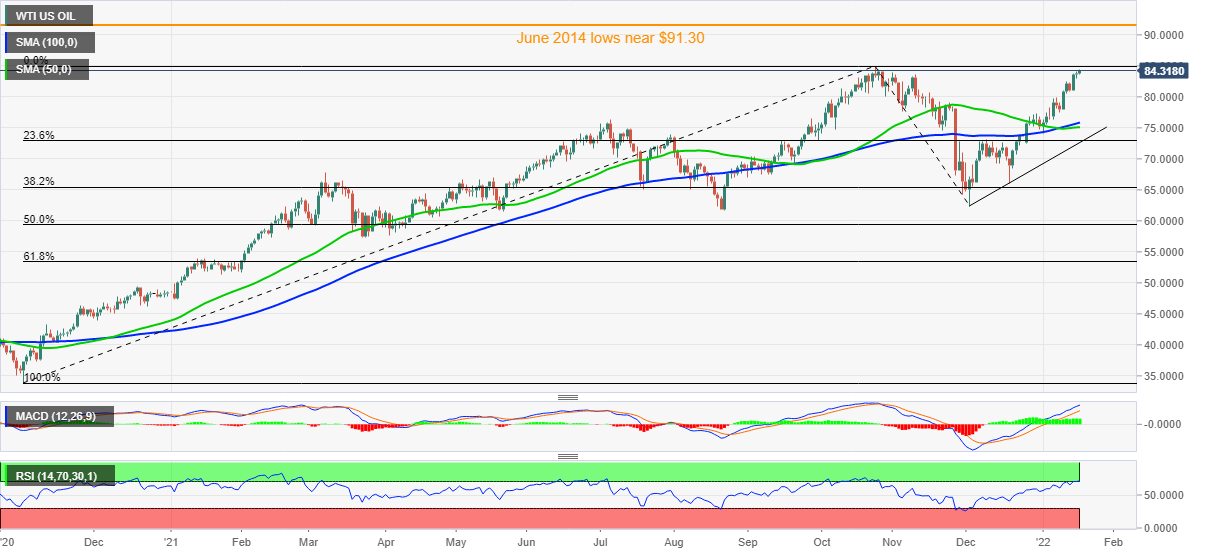
Trend: Further upside expected
- NZD/USD bears are being beaten back by bulls near the daily support.
- A pick up in price activity is underway as traders return to markets for Tuesday.
At 0.6804, NZD/USD is higher on Tuesday by 0.17% following a rally from a low of 0.6783 to a high of 0.6808. It is a relief for traders following a very quiet end to Monday's trade with the US on holiday for Martin Luther King Jr Day and no headline data releases in Europe.
''With 2022 well underway, the main sense we get is that it could be a bumpy ride as global central banks transition from easing to tightening, and as markets look for slower growth (or a decline in) liquidity as QT supplants QE,'' analysts at ANZ Bank said.
''Locally, Omicron remains a proximate threat (to activity and inflation), but going the other way, it’s not difficult to envisage inflation and jobs data surprising to the upside over coming quarters, and that could provide a leg of support. Plenty to think about.''
Meanwhile, traders continue to hold on to US dollars as per the latest positing data but there is a major segment of the market that expect that the Federal Reserve tightening plans are largely priced in. This is weighing on the greenback, while the euro eased from Friday’s two-month high. The US dollar index (DXY), which declined sharply last week until Friday's leap, is dripping pips by some 11% ton the day so far.
NZD/USD technical analysis
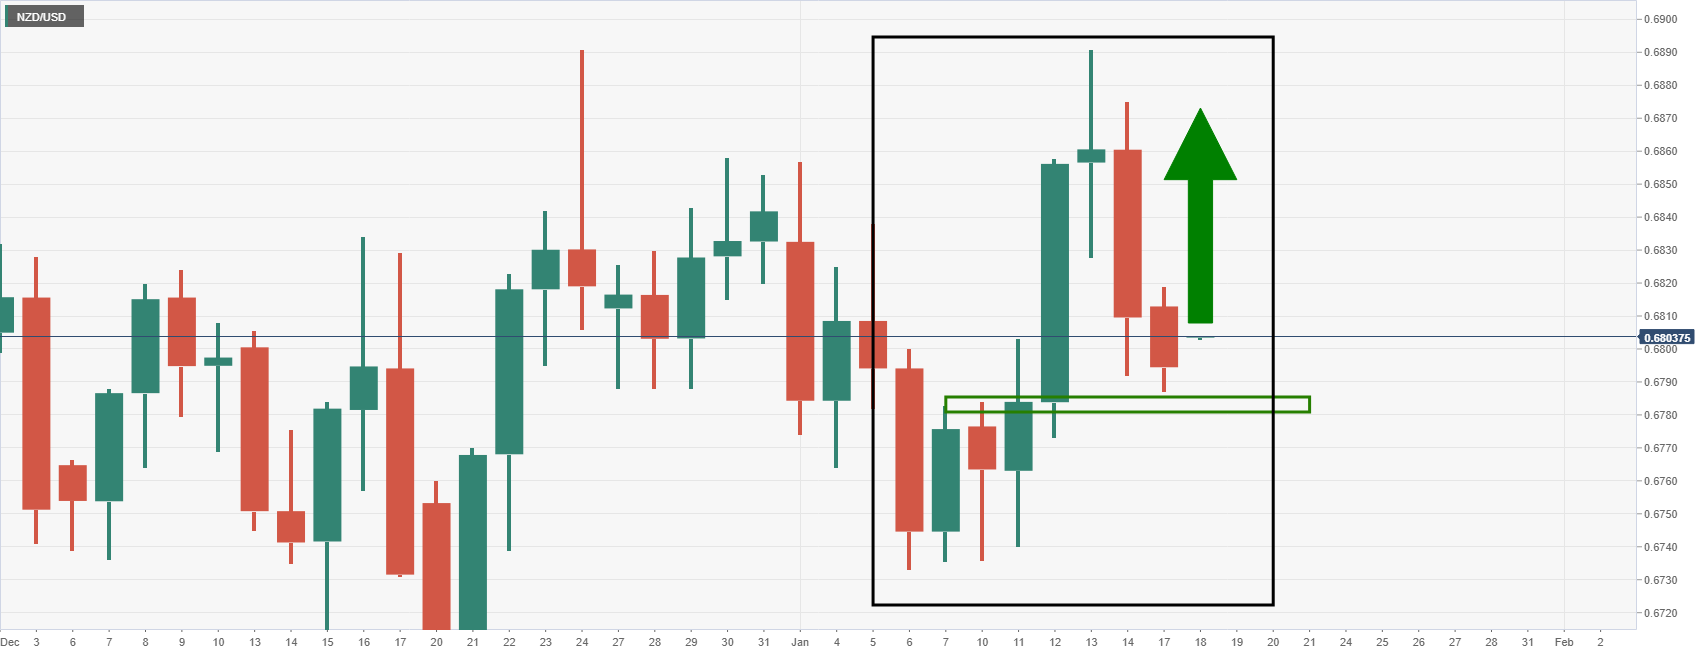
The bulls are moving in around daily support following a test at the neckline support of the W-formation. If this were to hold, the bulls will be looking to run the show back towards 0.6900. A break of support below 0.6780 will otherwise open prospects of a test to the daily lows near 0.6735.
| Raw materials | Closed | Change, % |
|---|---|---|
| Brent | 86.59 | 0.25 |
| Silver | 23.012 | 0.28 |
| Gold | 1818.632 | 0.12 |
| Palladium | 1867 | -0.02 |
Early on Tuesday, around 03:00 AM GMT, the Bank of Japan (BOJ) will provide the decision of its routine monetary policy meeting. Following the rate decision, BOJ Governor Haruhiko Kuroda will attend the press conference, around 06:00 AM GMT, to convey the logic behind the latest policy moves.
The Japanese central bank is widely expected to keep the short-term interest rate target at -0.1% while directing 10-year Japanese Government Bond (JGB) yields toward zero.
Although the BOJ isn’t expected to offer any change in its monetary policy, the quarterly economic forecasts will be important to watch following the fresh talks of the virus-led threats to inflation, as signaled in the latest Summary of the BOJ Monetary policy meeting.
Ahead of the event, Westpac said,
Basic policy settings are expected to be unchanged, notably the ‘around zero percent’ yield target for the 10-year bond. But quarterly forecasts will be noted, with suggestions that inflation forecasts will be nudged a little closer to the 2% target and the longstanding bias of downside risks to inflation removed.
Additionally, FXStreet’s Dhwani Mehta said,
Despite the upbeat economic outlook for the next fiscal year, the BOJ could refrain from deciding on continuing the current easing measures, as the Omicron covid wave is brewing trouble once again in Japan.
How could it affect the USD/JPY?
USD/JPY remains pressured around 114.45, down 0.12% intraday, ahead of the BOJ event. The yen pair reacts to the soft USD despite firmer yields amid mixed concerns over Fed’s rate hike and Omicron.
While portraying the market moves, the US 10-year and 5-year Treasury yields rose to the highest in two years while 2-year coupon jump to the February 2020 levels during the week-start move. On the other hand, S&P 500 Futures rise 0.12% intraday by the press time.
Given the wide division between the policymakers of the US Federal Reserve (Fed) and the BOJ, the carry trade opportunities may escalate should the BOJ choose to keep the easy money flowing by citing the virus-led economic hardships. However, the covid-linked challenges to inflation may weigh on the carry trade and weigh on the USD/JPY prices.
Technically, failures to cross October 2021 peak and previous support line from late September, surrounding 114.70, join the bearish MACD signals to direct USD/JPY prices towards the latest swing low near 113.50.
Key Notes
USD/JPY snaps two-day uptrend around 114.50 despite firmer yields, BOJ eyed
BOJ Preview: Raising its view on inflation, finally!
About BoJ Rate Decision
BoJ Interest Rate Decision is announced by the Bank of Japan. Generally, if the BoJ is hawkish about the inflationary outlook of the economy and rises the interest rates it is positive, or bullish, for the JPY. Likewise, if the BoJ has a dovish view on the Japanese economy and keeps the ongoing interest rate, or cuts the interest rate it is negative, or bearish.
- DXY snaps two-day rebound from 10-week low, seesaws near intraday low.
- US 2-year Treasury yields refresh 23-month high, 10-year, 5-year counterparts refresh two-year tops.
- Market sentiment dwindles amid mixed concerns over Omicron, Fed’s next move.
- US traders return after an extended weekend, next week’s FOMC is the key.
US Dollar Index (DXY) begins the week’s trading on a softer footing, down 0.09% intraday near 95.15 during Tuesday’s Asian session.
In doing so, the greenback gauge drops for the first time in three days while ignoring firmer US Treasury yields and tracking technical signals, by way of Monday’s Doji formation, to hint at the further weakness.
It’s worth observing that the US equities and bond markets were off on Monday due to Martin Luther King’s Birthday. However, China’s firmer GDP and the People’s Bank of China’s (PBOC) Medium-Term Lending Facility (MLF) rate cut joined receding fears of the South African covid variant, namely Omicron, to favor the latest DXY weakness.
On the same line could be the softer prints of the US Retail Sales for December and Michigan Consumer Sentiment Index for January.
Even so, US Treasury yields seem to react to the latest hawkish comment from Federal Reserve Bank of San Francisco President Mary Daly and New York Fed President John Williams, published on Friday, ahead of next week’s Federal Open Market Committee (FOMC) meeting, which in turn tests the DXY sellers.
Amid these plays, the US 10-year and 5-year Treasury yields rose to the highest in two years while 2-year coupon jump to the February 2020 levels during the week-start move. On the other hand, S&P 500 Futures rise 0.12% intraday by the press time.
Looking forward, the US traders’ return from holiday will weigh on the Omicron fears and second-tier activity, as well as housing market, data to portray near-term moves.
Technical analysis
US Dollar Index justifies Tuesday’s Doji candlestick to retreat towards the 100-DMA level of 94.75. Alternatively, upside moves need validation from previous horizontal support from mid-November, now resistance near 95.55.
- USD/TRY seesaws after two-day downtrend inside bearish chart pattern
- Sustained trading below 200-SMA, steady RSI favor pair sellers.
- 38.2% Fibonacci retracement level, triangle’s support line limit short-term downside.
USD/TRY licks its wounds near $13.45, up 0.06% intraday after two consecutive days of downside to Tuesday’s Asian session.
Even so, the Turkish lira (TRY) pair remains below the 200-SMA, as well as inside a two-week-long ascending triangle bearish chart pattern.
Given the steady RSI line, the gradual easing of the USD/TRY prices seems to be on the table.
However, a clear downside break of the $13.35 becomes necessary as the level comprises the lower of the stated triangle and 38.2% Fibonacci retracement of the December 20-23 downside.
Following that, a downside towards 23.6% Fibo. level surrounding $12.16 and then to the $12.00 threshold can’t be ruled out.
Meanwhile, recovery moves remain dismal below the 200-SMA level of $13.55, a break of which will propel the quote towards the triangle’s upper line of the bearish chart pattern near $13.95.
It’s worth observing that the $14.00 threshold will act as a validation point for the fresh rally targeting the 61.8% Fibonacci retracement level near $15.25.
USD/TRY: Four-hour chart
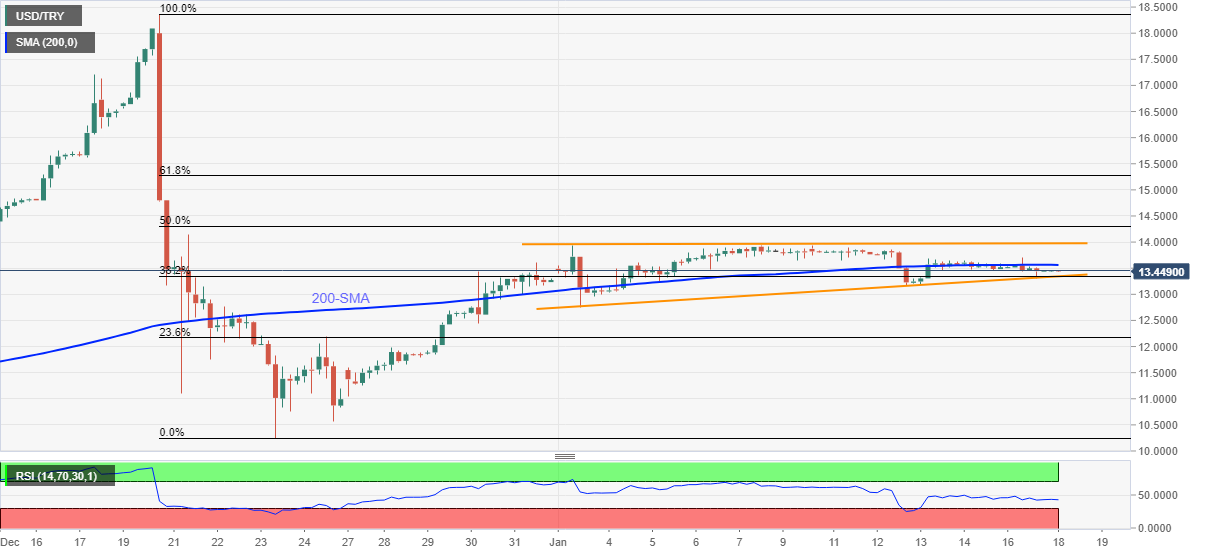
Trend: Further downside expected
- AUD/USD bears are looking for a break of the daily support.
- Bulls needs a bounce from here and a break of inverse H&S neckline.
As per the prior analysis, AUD/USD Price Analysis: Inverse H&S in the making from 0.7200 support, AUD/USD is on the verge of either a break to the upside of a run below critical daily support, as follows:
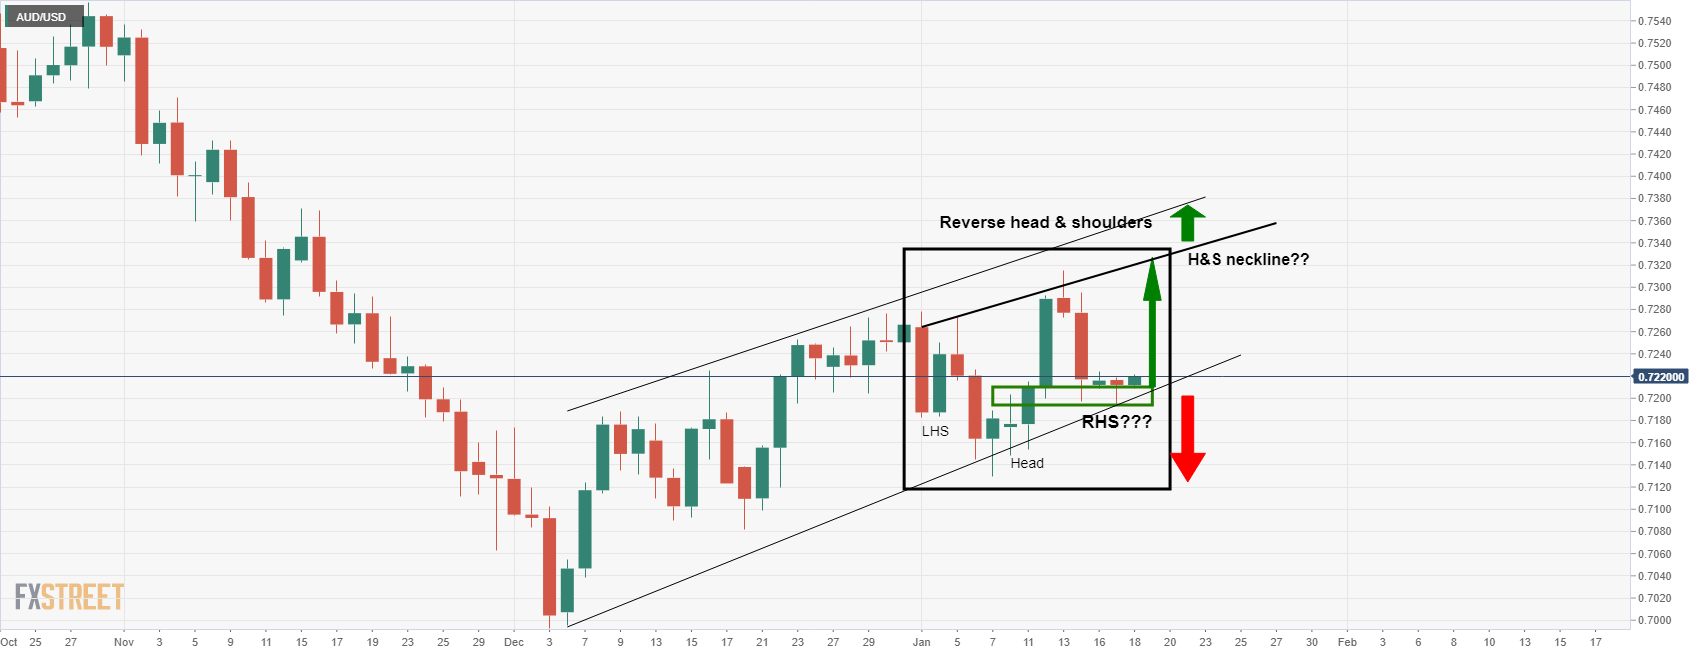
From an hourly perspective, the market is stuck between near term support and resistance as follows:
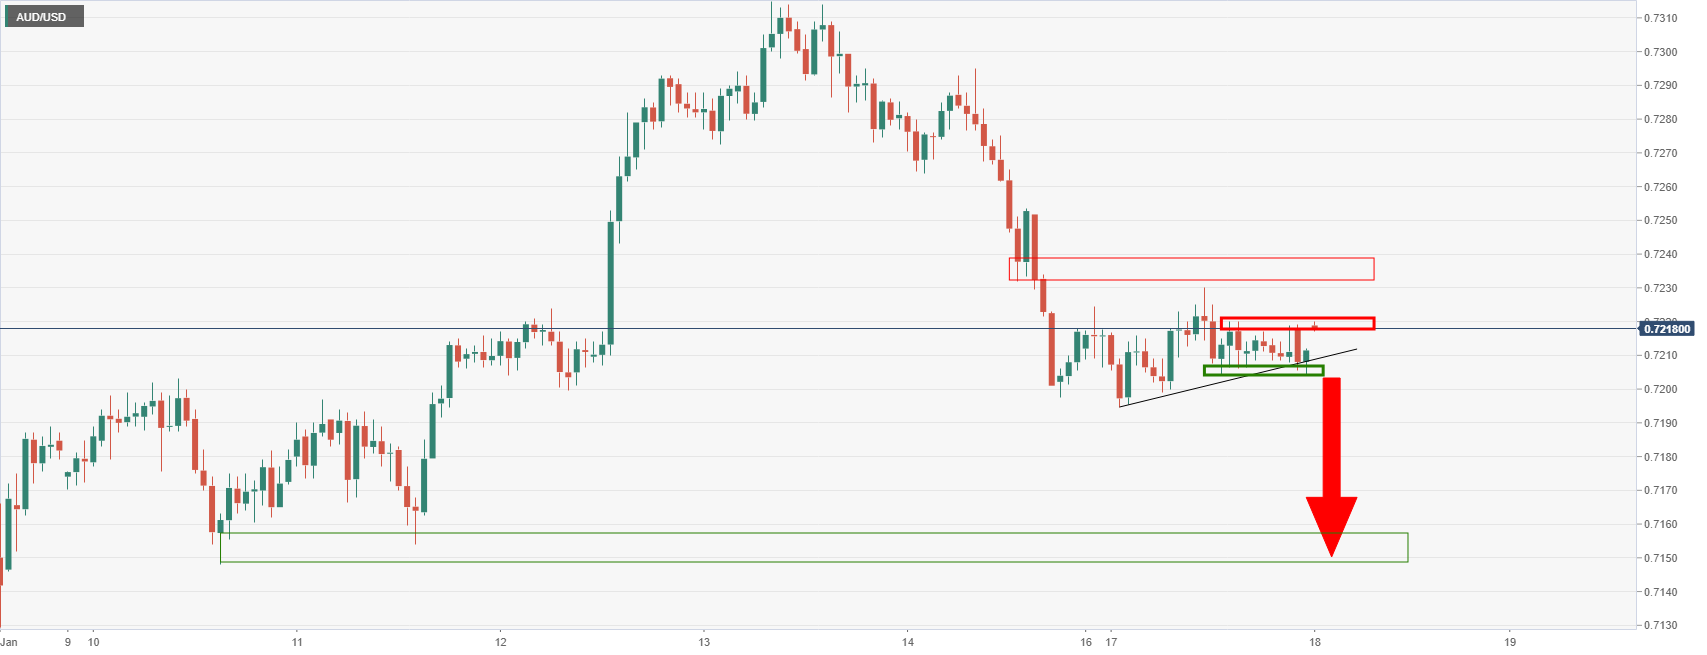
While below 0.7230, a break of the support line would coincide with the horizontal support as well, so this could be a significant development if it unfolds over the course of the week. In doing so, the 0.7150s will be eyed as the last stop before a hefty sell-off below daily trendline support:
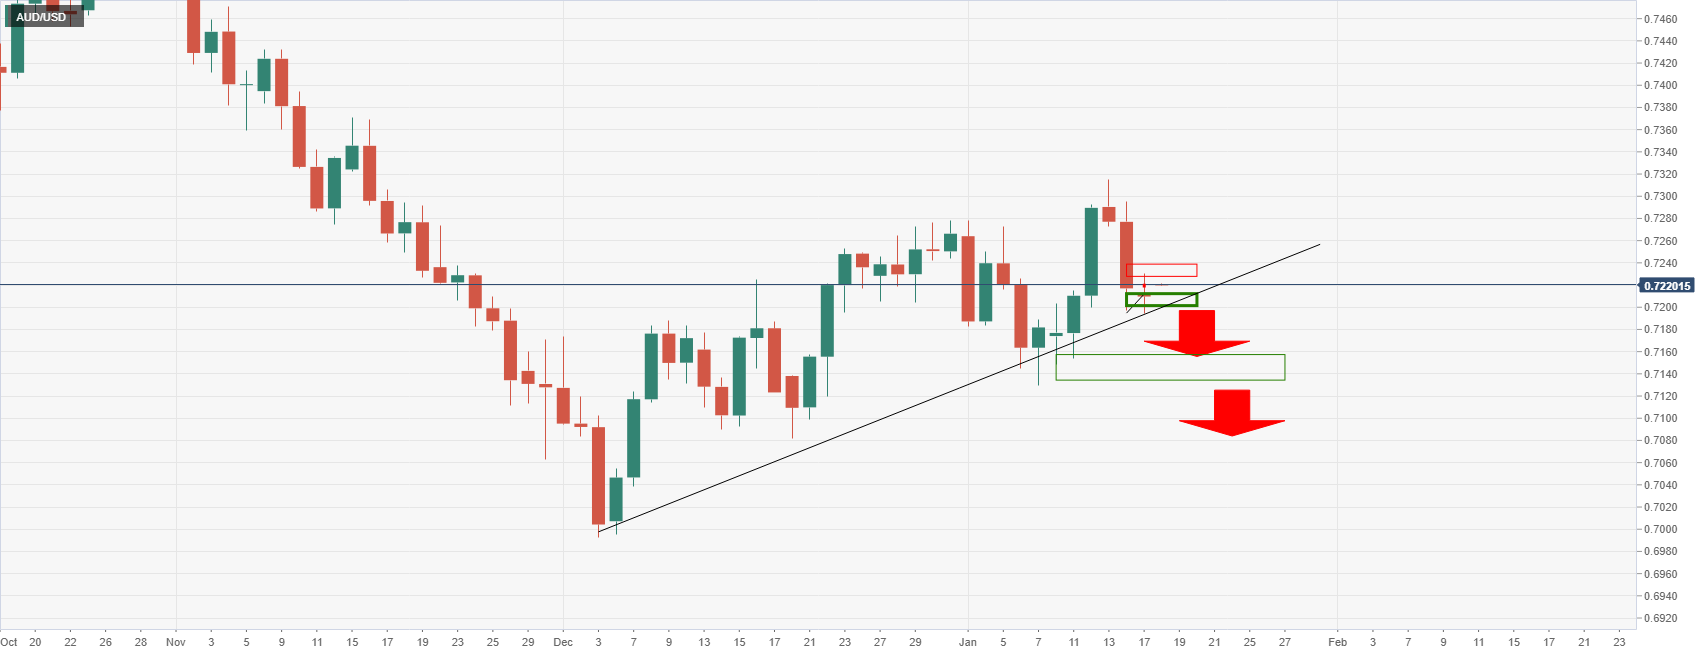
In recent trade today, the People’s Bank of China (PBOC) set the yuan (CNY) at 6.3521 vs the estimated 6.3522 and the previous 6.3599.
About the fix
China maintains strict control of the yuan’s rate on the mainland.
The onshore yuan (CNY) differs from the offshore one (CNH) in trading restrictions, this last one is not as tightly controlled.
Each morning, the People’s Bank of China (PBOC) sets a so-called daily midpoint fix, based on the yuan’s previous day closing level and quotations taken from the inter-bank dealer.
- Gold remains firmer around intraday high after a bullish candlestick formation.
- US Treasury yields refresh multi-day top as bond/equities’ trading resume following MLK Day off.
- DXY struggles to extend two-day uptrend amid mixed concerns over Fed’s next moves, Omicron.
- Gold Price Forecast: Hovering around $1,820 in a quiet start to the week
Gold (XAU/USD) prices stay on the front foot near intraday high of $1,820.31 during Tuesday’s Asian session.
The yellow metal portrayed a sluggish start to the week while marking a Doji candlestick on Monday following the two-day downside. The trend reversal suggests candlestick joins mixed concerns over the Fed’s next move and the South African covid variant, namely Omicron, to underpin the latest upside of the gold prices.
In doing so, the riskier asset ignores firmer US Treasury yields while tracking mildly bid S&P 500 Futures.
That said, the US 10-year and 5-year Treasury yields rose to the highest in two years while 2-year coupon jump to the February 2020 levels during the week-start move. On the other hand, S&P 500 Futures rise 0.12% intraday by the press time.
US Treasury yields seem to react to the latest hawkish comment from Federal Reserve Bank of San Francisco President Mary Daly and New York Fed President John Williams, published on Friday, ahead of next week’s Federal Open Market Committee (FOMC) meeting. In doing so, the bond coupons pay a little heed to the softer prints of the US Retail Sales for December and Michigan Consumer Sentiment Index for January.
It should be noted that Omicron concerns flash mixed signals with rising cases in China and Japan signaling more virus-led activity restrictions while softer numbers in the West placate market players. It should be noted that Tokyo and the other 10 Japanese prefectures are at the risk of witnessing quasi-emergency while China’s Tianjin threatens a stop all foreign mails due to covid.
Elsewhere, North Korea’s missile testing and the Sino-American tussles also challenge the market sentiment but fails of late.
Looking forward, Bank of Japan (BOJ) monetary policy and the UK jobs report will join updates concerning Omicron and the chatters suggesting China’s likely rate cut, not to forget talks of Fed’s next moves, to direct short-term market moves.
Technical analysis
Monday’s Doji candlestick joins firmer RSI and bullish MACD signals to keep gold buyers hopeful during Tuesday’s Asian session.
However, a clear upside break of the 61.8% Fibonacci retracement (Fibo.) of November-December 2021 downside, around $1,830, becomes necessary for the gold buyers to retake control. It’s worth noting that tops marked during July and September, around $1,834, act as a validation point for the commodity’s further rally.
Following that, the run-up could aim for the multiple lows marked during mid-November around $1,850 ahead of the challenging latest 2021 peak surrounding $1,877.
Alternatively, pullback moves may aim for the 50% and 38.2% Fibo. levels, respectively near $1,815 and $1,800 threshold.
Though, a convergence of the 100-DMA and an ascending support line from December 15, around $1,793, becomes a strong support for the gold sellers to watch afterward.
Overall, gold buyers brace for the short-term key hurdle to the north, backed by firmer oscillators and candlestick formation.
Gold: Daily chart
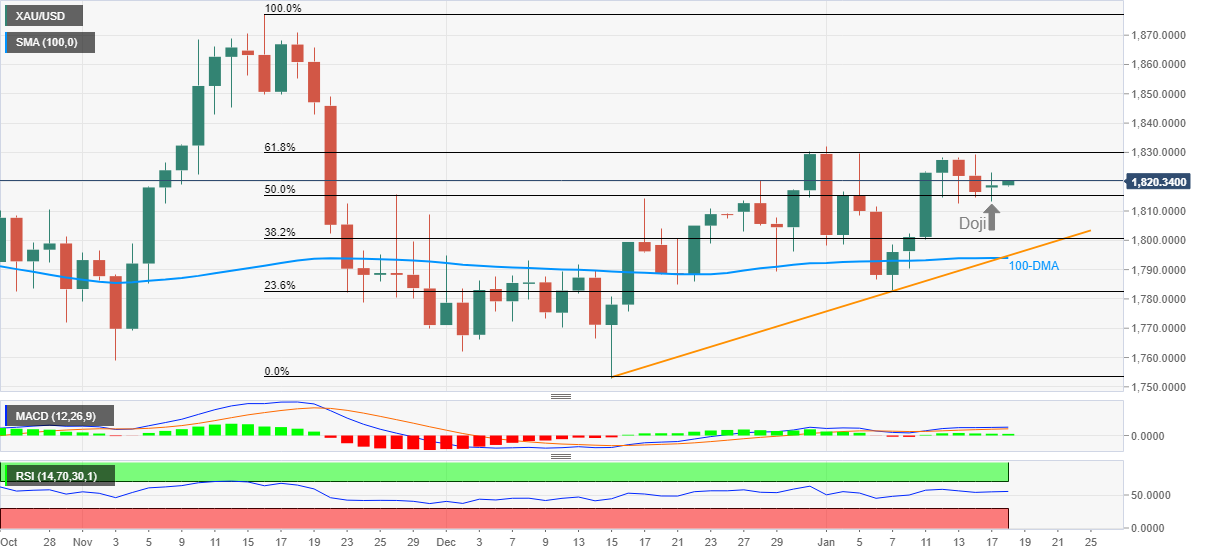
Trend: Further upside expected
- USD/JPY takes offers to refresh intraday low, consolidate the biggest daily jump in two weeks.
- US Treasury yields refresh multi-day top as bond trading resumes after MLK Day off.
- Japan weighs covid-linked quasi emergency over Tokyo and 10 other prefectures.
- BOJ is likely to keep monetary policy intact, quarterly report on price and growth outlook will be important.
USD/JPY stands on the slippery ground near 113.45, down 0.14% intraday, as Tokyo opens for Tuesday’s trading.
The yen pair rose the most in two weeks the previous day as a bank holiday in the US restricted bond and equities’ moves. However, the resumption of the Treasury bond trading portrayed a strong start to the week and weighed on the quote.
The US 10-year and 5-year Treasury yields rose to the highest in two years while 2-year coupon jump to the February 2020 levels during the week-start move. "Hawkish Fed speak ahead of the blackout has reinforced odds of a March hike, with the market now pricing in 95% odds of a March rate hike and nearly four full hikes in 2022," analysts at TD Securities wrote.
Among the latest Fed hawks were Federal Reserve Bank of San Francisco President Mary Daly and New York Fed President John Williams on Friday. While portraying the hawkish Fed scenario ahead of next week’s Federal Open Market Committee (FOMC) meeting, the yields pay a little heed to the softer prints of the US Retail Sales for December and Michigan Consumer Sentiment Index for January.
It’s worth noting that the mixed concerns over the South African covid variant, namely Omicron, also increase the market’s fear and weigh on the USD/JPY prices. Japan witnesses a jump in the daily infections and braces for tougher covid-linked restrictions. “Japan is considering placing Tokyo and 10 prefectures under a COVID-19 quasi-state of emergency to curb rapidly spreading coronavirus cases, government sources said Monday,” per Kyodo news. Elsewhere, covid cases in the US and the UK recede.
Moving on, USD/JPY traders will pay attention to the Bank of Japan (BOJ) monetary policy meeting even as the policymakers are likely to keep the benchmark policy rate steady at -10bps while maintaining its pledge to buy J-REITS at an annual pace of up to JPY180 bln. The important part is the chatters over the quarterly prices and growth outlook amid virus-led reflation fears.
Ahead of the BOJ, FXStreet’s Dhwani Mehta said, “The reaction to the BOJ decision is likely to remain brief, as the prevalent risk tone combined with the yields and the dollar valuations will likely remain the main drivers for the currency pair.”
Read: BOJ Preview: Raising its view on inflation, finally!
Technical analysis
Failures to cross October 2021 peak and previous support line from late September, surrounding 114.70, join the bearish MACD signals to direct USD/JPY prices towards the latest swing low near 113.50.
- EUR/USD could be in line for a significant breakout which would be expected to drag GBP along for the ride.
- GBP/USD needs to clear 1.3690 for bluer skies.
As per the prior analysis, GBP/USD Price Analysis: Bears press 1.3700 critical daily support, the price of cable is firming at the projected support area and there is now a focus on the upside.
GBP/USD prior analysis
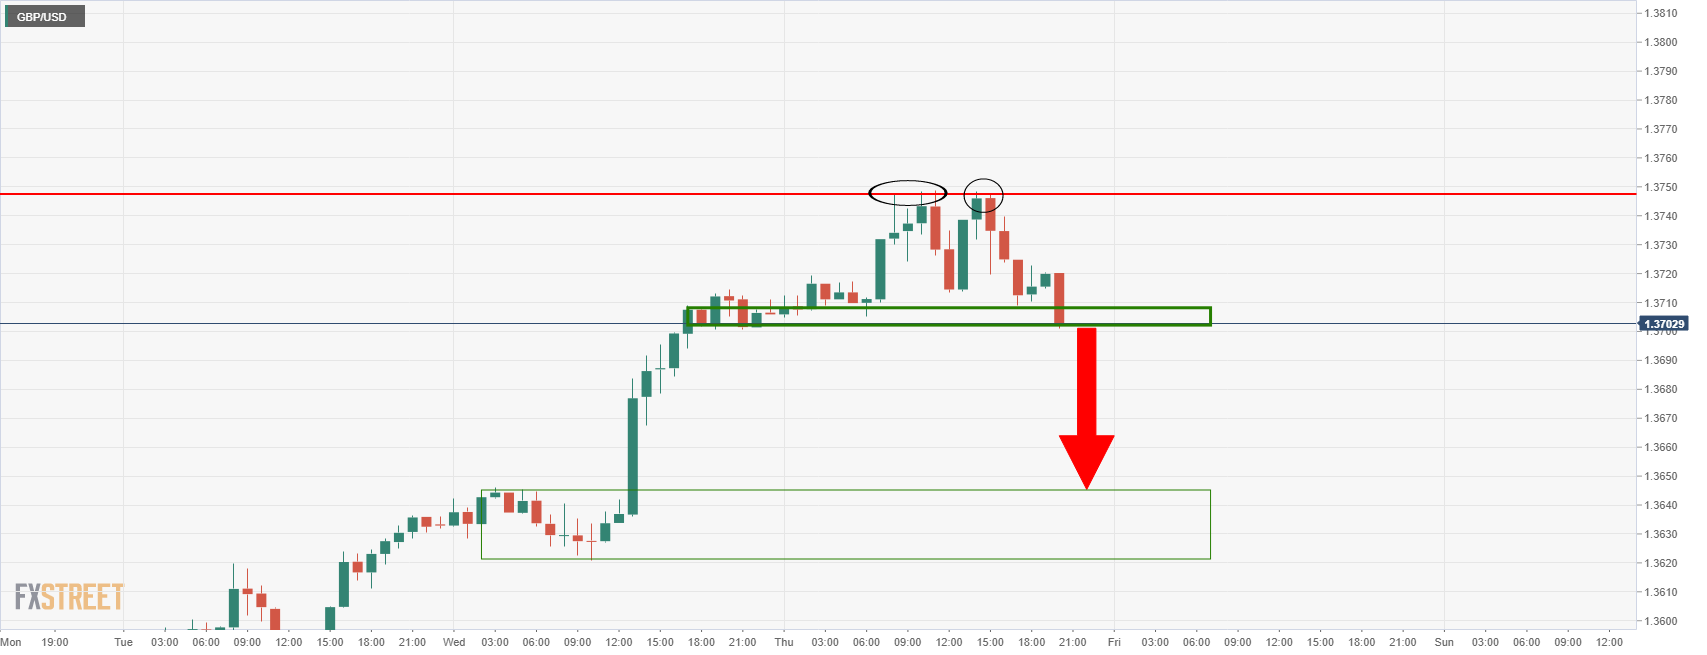
As illustrated last Thursday, GBP/USD's hourly chart was pressuring support below a double top which added conviction to the downside prospects. The targeted area was shown to be between 1.3620 and the 1.3640s.
Meanwhile, the bears are pulling out around this structure as per the following 4-hour chart's illustration:
GBP/USD 4-hour chart
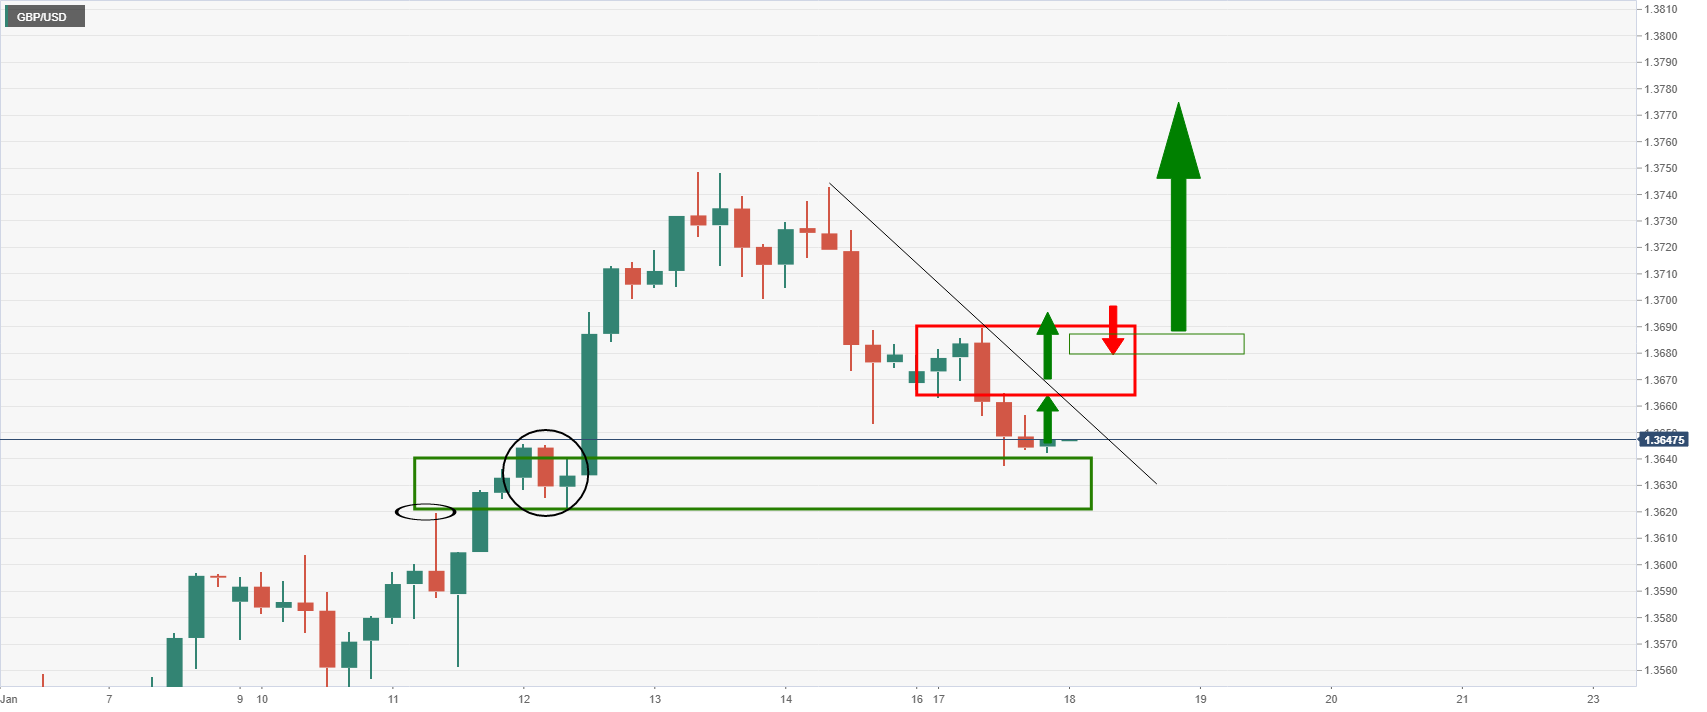
The price could be expected to now move higher to test what could prove to be a tricky layer of resistance. If the bulls do commit, then a break of the 4-hour highs would be required before prospects of a bullish continuation might unfold on the daily chart as follows:
GBP/USD daily chart
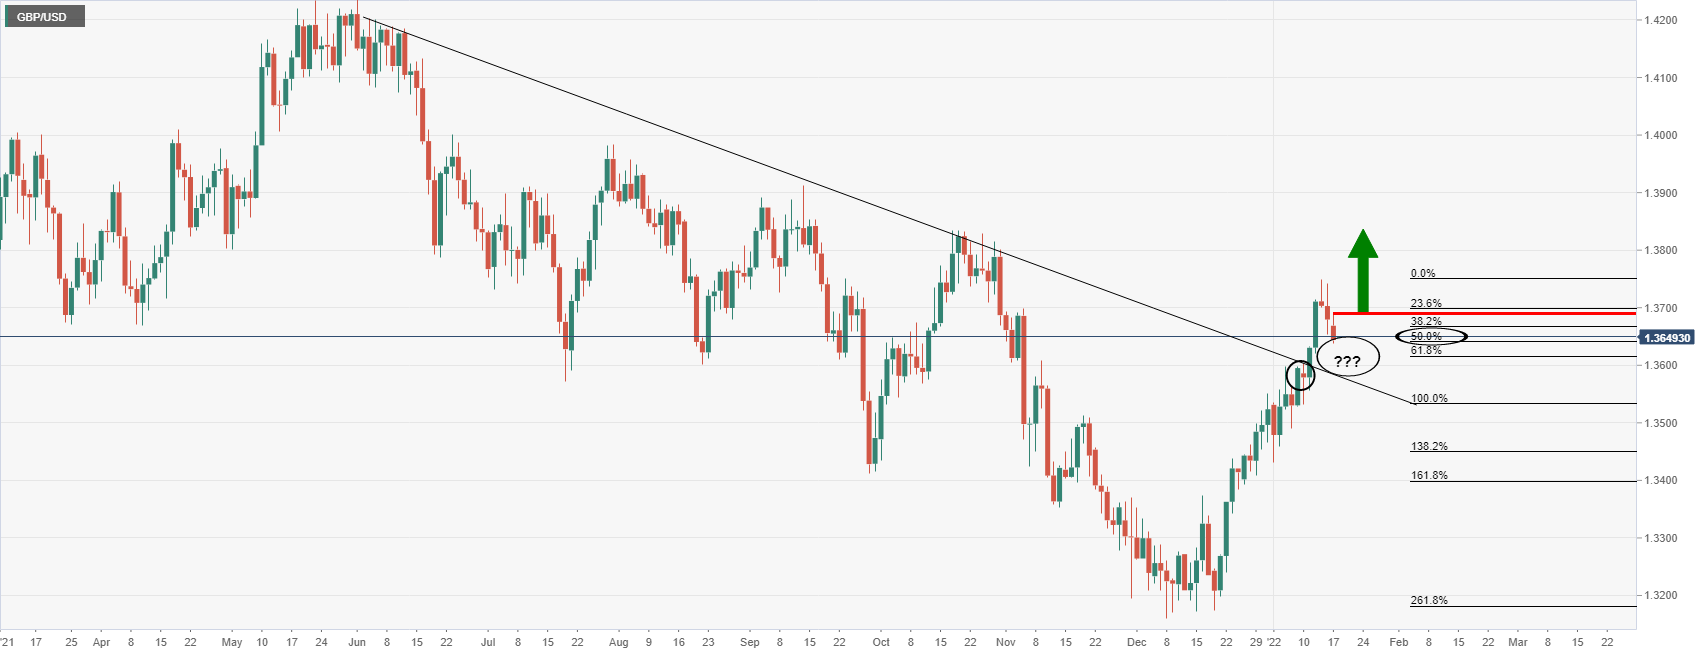
As drawn, the price has already made a 50% mean reversion of the prior bullish impulse. However, bulls need to break 1.3690 and in doing so, they would be on course for a continuation to the upside. However, given that there is still room to go until the counter trendline is tested, there is the risk that the price continues to fall in the coming sessions in order to mitigate the inefficiency of the price between 1.3604 and 1.3637:
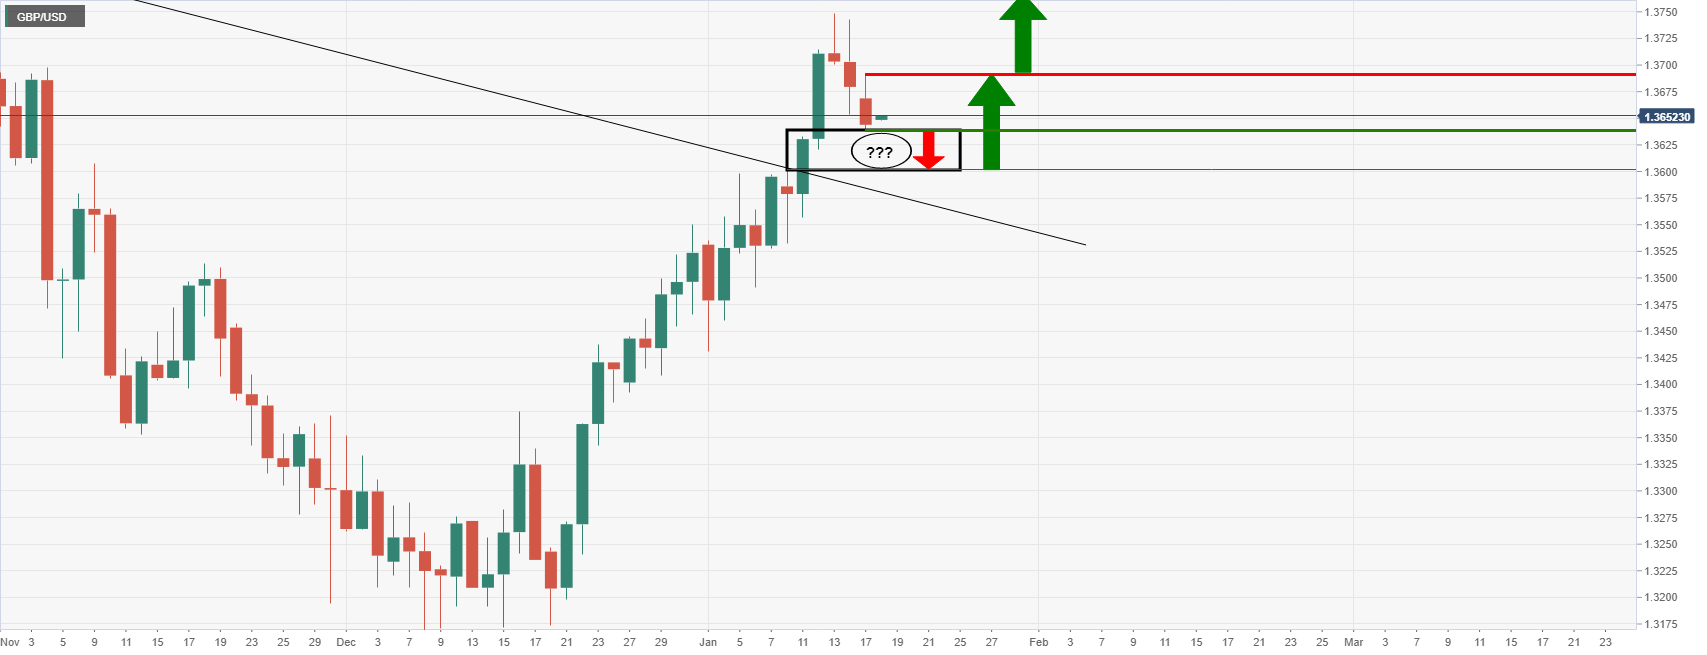
On the other hand, if the US dollar continues to bleed out, the pound may well follow in the euro's footsteps and keep up with the bid:
-
EUR/USD Price Analysis: Reaccumilaiton playing out from 1.1380, eyes to 1.1500
- US T-bond coupons begin the trading week on a firmer footing.
- 10-year, 5-year yields rise to the highest in two years, 2-year coupon jump to the February 2020 levels.
- Market sentiment dwindles amid a lack of major data/events, Fed rate-hike concerns.
Yields of the US government bonds print a strong start to the week after an extended weekend due to Martin Luther King’s Birthday.
That said, the benchmark 10-year Treasury yields rose 4.2 basis points (bps) to 1.814% while the 5-year counterpart also jumped over four bps to 1.5993%. In doing so, both these key bond coupons refresh the highest levels in two years.
Elsewhere, the 2-year US Treasury yields rose above 1.0% for the first time since February 2020, up 3.9 bps to 1.006% whereas the 20-year T-bond yields rise 3.3 bps to 2.208%, the highest since June 2021.
The jump in the bond yields could be linked to the escalating hopes of the faster Fed rate hikes in 2022, backed by Federal Reserve Bank of San Francisco President Mary Daly and New York Fed President John Williams on Friday. While portraying the hawkish Fed scenario ahead of next week’s Federal Open Market Committee (FOMC) meeting, the yields pay a little heed to the softer prints of the US Retail Sales for December and Michigan Consumer Sentiment Index for January.
It’s worth observing that S&P 500 Futures remain lackluster around 4,660 while commodities and Antipodeans copy the moves as market turns cautious ahead of the US traders’ return, as well as ahead of the key Bank of Japan (BOJ) monetary policy and the UK jobs report.
In addition to the BOJ and UK employment data, mixed updates concerning Omicron and the chatters suggesting China’s likely rate cut, coupled with talks of Fed’s next moves, will be crucial for the market’s near-term direction.
That said, the US Dollar Index (DXY) stretched the previous day’s rebound from a 10-week low before ending Monday with minor gains around 95.23.
Read: The point is to talk between what the market perceives as needed and what the Fed determines is right
| Pare | Closed | Change, % |
|---|---|---|
| AUDUSD | 0.72094 | -0.1 |
| EURJPY | 130.705 | 0.35 |
| EURUSD | 1.14048 | -0.08 |
| GBPJPY | 156.352 | 0.19 |
| GBPUSD | 1.36426 | -0.24 |
| NZDUSD | 0.67949 | -0.15 |
| USDCAD | 1.25163 | -0.15 |
| USDCHF | 0.91423 | 0.22 |
| USDJPY | 114.606 | 0.4 |


© 2000-2026. Bản quyền Teletrade.
Trang web này được quản lý bởi Teletrade D.J. LLC 2351 LLC 2022 (Euro House, Richmond Hill Road, Kingstown, VC0100, St. Vincent and the Grenadines).
Thông tin trên trang web không phải là cơ sở để đưa ra quyết định đầu tư và chỉ được cung cấp cho mục đích làm quen.
Giao dịch trên thị trường tài chính (đặc biệt là giao dịch sử dụng các công cụ biên) mở ra những cơ hội lớn và tạo điều kiện cho các nhà đầu tư sẵn sàng mạo hiểm để thu lợi nhuận, tuy nhiên nó mang trong mình nguy cơ rủi ro khá cao. Chính vì vậy trước khi tiến hành giao dịch cần phải xem xét mọi mặt vấn đề chấp nhận tiến hành giao dịch cụ thể xét theo quan điểm của nguồn lực tài chính sẵn có và mức độ am hiểu thị trường tài chính.
Sử dụng thông tin: sử dụng toàn bộ hay riêng biệt các dữ liệu trên trang web của công ty TeleTrade như một nguồn cung cấp thông tin nhất định. Việc sử dụng tư liệu từ trang web cần kèm theo liên kết đến trang teletrade.vn. Việc tự động thu thập số liệu cũng như thông tin từ trang web TeleTrade đều không được phép.
Xin vui lòng liên hệ với pr@teletrade.global nếu có câu hỏi.
ngân hàng