- Phân tích
- Tin tức và các công cụ
- Tin tức thị trường
Tin tức thì trường
- AUD/USD fades corrective bounce after snapping four-day uptrend, reversing from the highest level in a month.
- RBA’s Lowe defends hawkish surprise by citing inflation woes, Australia Q1 GDP growth rate eases.
- Recently softer China data join fears of global economic slowdown to exert downside pressure on Aussie pair.
- Australia trade numbers, risk catalysts eyed for clear directions.
AUD/USD stays depressed around 0.6650 after reversing from a one-month high. In doing so, the quote struggles to find traction as hawkish concerns about the Reserve Bank of Australia (RBA) join growth fears to challenge the Aussie bulls. With this, the risk-barometer pair stays clueless amid the early hours of Thursday’s Asian session, after snapping a four-day uptrend the previous day.
The recent challenges to the major economies, as perceived from the latest downbeat statistics from the United States, China, Australia, Europe and the UK, renew recession fears and weigh on the AUD/USD price. Adding strength to the economic pessimism are the concerns surrounding higher interest rates from the top-tier central banks, especially after the latest hawkish surprises from the Reserve Bank of Australia and the Bank of Canada (BoC).
That said, China’s headline Trade Balance deteriorates to $65.81 billion versus the $92.0 billion expected and $90.21 billion previous readings. That said, the Exports and Imports came in mixed with the former falling past -0.4% expected and 8.5% previous readings to -7.5% YoY whereas the latter improves to 2.3% from -0.8% market forecasts and 4.2% prior. On the other hand, Aussie Q1 GDP rose 0.2% QoQ compared to 0.5% previous readings and 0.3% market forecasts. On the same line, the yearly GDP came in as 2.3% versus the analysts’ estimation of 2.4% YoY and 2.7% previous readings.
Even so, RBA Governor Philip Lowe signaled further rate hikes from the Aussie central bank and propelled the five-day uptrend of the Aussie pair. That said, the policymaker said, “Some further tightening of monetary policy may be required, depending on how economy and inflation evolve.” It should be known that the RBA surprised markets for the second time in a row by announcing a 25 basis points (bps) rate hike on Tuesday.
It should be noted that the latest Organisation for Economic Co-operation and Development (OECD) report, published Wednesday, mentioned, “The global economy is set for a weak recovery over the coming years as persistent core inflation and tighter monetary policy weigh on demand.”
While portraying the mood, Wall Street closed in the red whereas commodities and Antipodeans closed in the red. Further, the benchmark US 10-year Treasury bond yields rose the most in five weeks to 3.79% while the two-year counterpart marched to 4.52% at the latest.
Looking forward, Australia Trade Balance for April and the US weekly Initial Jobless Claims will be eyed for clear directions. However, major attention should be given to the risk catalysts and the yields as the latest shift in the market’s sentiment weighs on the risk-barometer pair.
Technical analysis
AUD/USD portrays reversal from two downward-sloping resistance lines from February 02 and 14 respectively, currently around 0.6715 by the press time. The pullback moves join downbeat oscillators to direct Aussie bears toward the 21-DMA support of around 0.6610.
As per the latest survey from the UK’s Recruitment and Employment Confederation (REC), funded by the global quant giant KPMG, published early Thursday, “Britain's labour market cooled further in May as starting salaries for permanent staff rose at the weakest pace in over two years.”
It should be noted that the recruiters included in the survey are the ones being closely watched by the Bank of England (BoE) and hence the results appear more important for the GBP/USD pair traders.
Also read: GBP/USD Price Analysis: Bulls are in the market but 1.2450s resistance could be tough
Key findings
REC said the number of permanent staff placements dropped last month at the sharpest rate since January 2021, as its gauge of demand for staff fell to a five-month low.
The survey chimed with other gauges of the labour market that show it is now clearly loosening.
REC's gauge of growth in starting salaries for permanent staff fell to its lowest level since April 2021, although it said this still represented ‘a historically sharp pace overall’.
Elsewhere, another poll of the Royal Institution of Chartered Surveyors' (RICS) hints that measure of new buyer enquiries rose to a net balance of -18, the least negative figure since -14 in May 2022, and up from -34 in April, per Reuters.
- NZD/USD stays pressured at the lowest levels in a week.
- NZ Q1 Manufacturing Sales improved from prior but slide beneath upbeat forecasts.
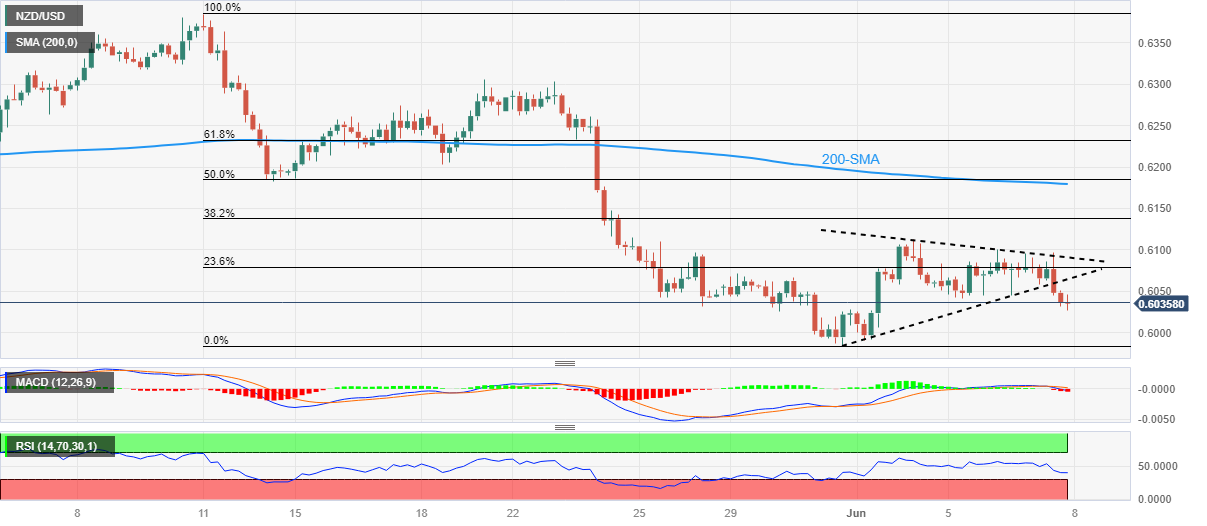
- Clear downside break of one-week-old symmetrical triangle, bearish MACD signals suggest further fall in Kiwi price.
- RSI conditions suggest bottom-picking around yearly low marked in the last week.
NZD/USD bears occupy the driver’s seat as the Kiwi pair remains depressed at the weekly low surrounding 0.6030 amid the early Asian session on Thursday, after falling the most in a fortnight the previous day.
In doing so, the Kiwi pair ignores the recently firmer New Zealand (NZ) data while paying more attention to the previous day’s downside break of a one-weeklong symmetrical triangle. That said, NZ Manufacturing Sales improves to -2.1% in the first quarter (Q1) of 2023 versus 3.9% expected and -4.7% prior.
It should be noted that the heaviest bearish MACD signals in nearly two weeks join the aforementioned triangle breakdown to keep the NZD/USD bears hopeful.
With this, the quote appears all set to prod the 0.6000 psychological magnet. However, the RSI (14) is below the 50.0 level and hence the yearly low marked in the last week around 0.5985 may offer an opportunity for the counter-trend traders to take the risk.
Should the quote fails to recover from 0.5985, the odds of witnessing a slump toward the early October 2022 top near 0.5815 can’t be ruled out.
On the contrary, NZD/USD recovery appears elusive unless the quote stays below the previously stated triangle formation’s bottom line, close to 0.6065 at the latest. Even so, the top of the triangle, near 0.6100, can act as an extra check for the bulls before giving them control.
Following that, a convergence of the 200-SMA and 50% Fibonacci retracement level of the pair’s May 10-31 downturn, around 0.6180, will be key to watch for the NZD/USD bulls.
NZD/USD: Four-hour chart
Trend: Limited downside expected
- AUD/JPY forms a doji at YTD highs, signaling a possible pause in the rally.
- Potential retracement could test the 91.89 support zone, an intersection of the 50% Fibonacci and Tenkan-Sen line.
- On the upside, surpassing the YTD high could push the pair towards 94.00, with a potential target at 95.00.
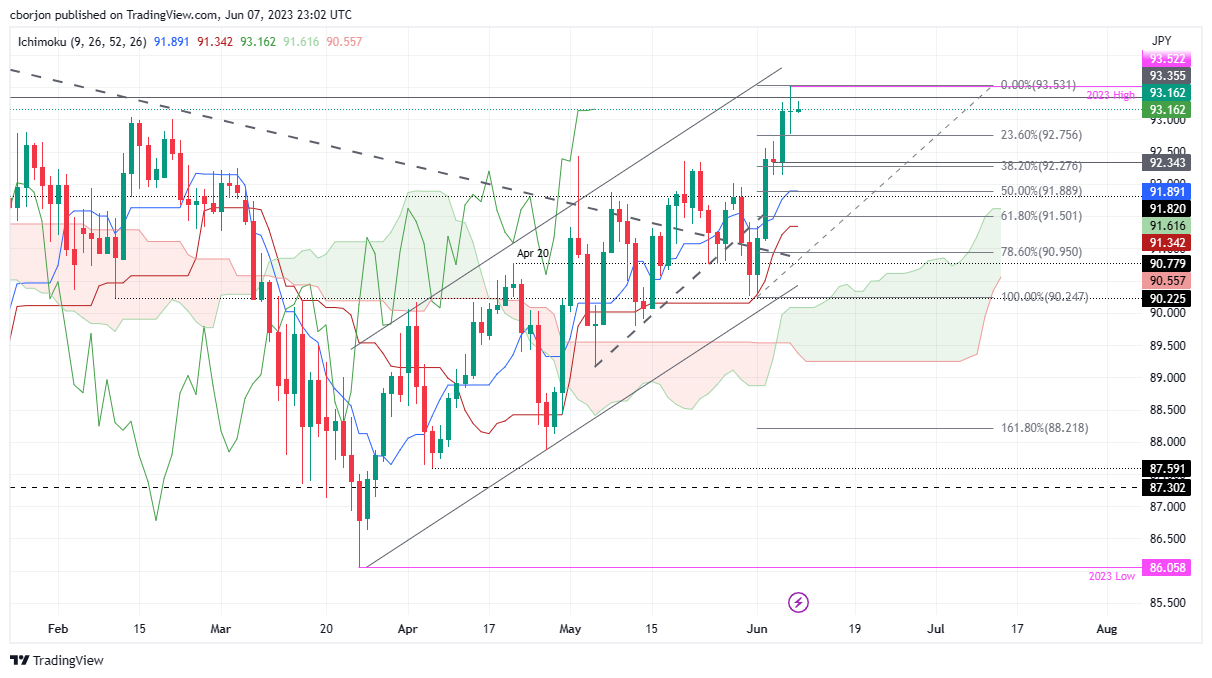
AUD/JPY hovers at around the 93.20 area as the Asian session begins, following Wednesday’s session, which formed a doji after reaching new year-to-date (YTD) highs. However, a daily close below the June 6 high of 93.26 suggests buyers are losing control ahead of Thursday’s session.
AUD/JPY Price Analysis: Technical outlook
AUD/JPY seems to pause its rally, as a doji emerged on Wednesday after hitting a new YTD high. However, in the medium term, the AUD/JPY is still upward biased but might pull back toward the confluence of the 50% Fibonacci retracement and the Tenkan-Sen line at around 91.89. Further downside is expected, towards the next confluence, of the Kijun-Sen line and the 61.8% Fibo retracement at around 91.34/50, before resuming its uptrend.
Conversely, a bullish continuation will witness the AUD/JPY exploding past the YTD high and testing the psychological level at 94.00. A breach of the latter will expose the November 16 daily high at 94.65, ahead of gaining traction and challenging the 95.00 figure.
AUD/JPY Price Action – Daily chart
US inflation expectations, as per the 10-year and 5-year breakeven inflation rates from the St. Louis Federal Reserve (FRED) data, rise to the highest levels in a week and justify the recently hawkish Federal Reserve (Fed) expectations, which in turn propel the yields. The same should have underpinned the US Dollar rebound but an absence of the Fed policymakers’ comments, due to the pre-FOMC blackout, joins a light calendar to restrict immediate USD moves.
That said, interest rate futures suggest an increase in the market’s bets on the Federal Reserve’s (Fed) 25 basis points (bps) of rate hike in July, even as June rate hike concerns are minimal.
It should be noted that the 5-year inflation expectations per the aforementioned calculations rise to the highest level in a week to around 2.15% by the press time whereas the 10-year counterpart rose for the third consecutive day to refresh weekly top near 2.21% at the latest.
Given the US inflation expectations and upbeat US Treasury bond yields, the US Dollar is likely to pick up bids. That said, the greenback’s gauge versus the six major currencies, namely the US Dollar Index (DXY), remained sluggish on Wednesday, mildly offered around 104.10 at the latest.
Also read: Forex Today: Another hawkish surprise shows inflation remains central bank’s main concern
- EUR/USD remains sidelined within trend continuation chart pattern.
- Sustained trading beyond five-month-old ascending support line lures Euro buyers.
- Looming bull cross on MACD, nearly oversold RSI signal EUR/USD’s further upside.
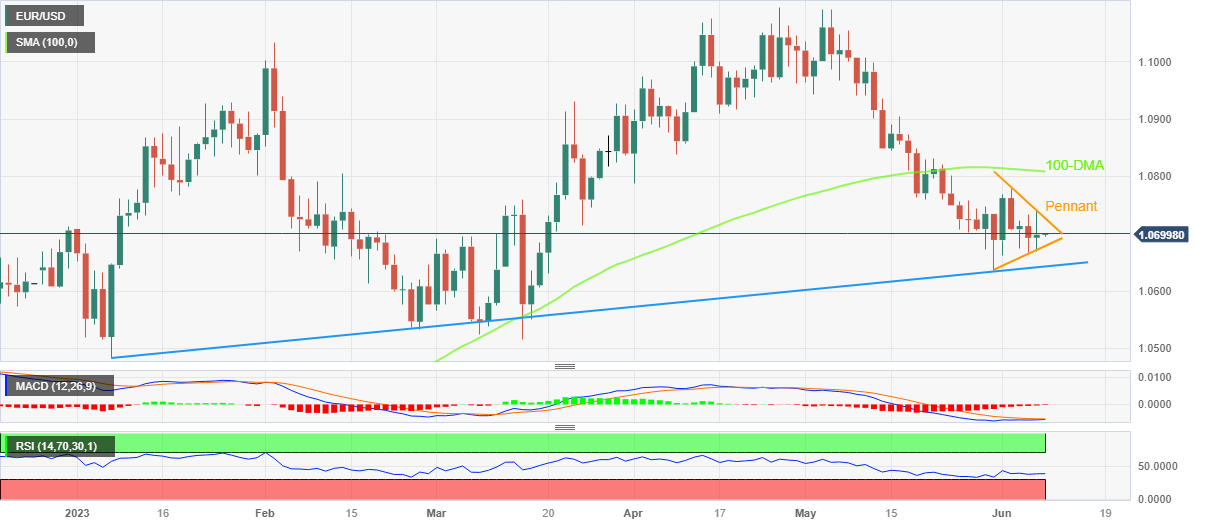
- Pennant’s top line, 100-DMA challenge Euro bulls before giving control.
EUR/USD steadies within a one-week-old Pennant formation, near 1.0700 by the press time of early Thursday in Asia, as bulls and bears jostle amid fears of economic slowdown, higher rates and softer Eurozone data.
Also read: Gold Price Forecast: XAU/USD bears ignore sluggish USD on mixed growth concerns, hawkish central banks
That said, the Euro pair’s rebound from a five-month-old ascending support line joins the recently downbeat RSI (14) line, as well as an impending bull cross on the MACD, to keep the EUR/USD buyers hopeful.
However, a clear upside break of the stated Pennant’s top line, currently around 1.0730, becomes necessary for the EUR/USD pair buyers to retake control.
Even so, the 100-DMA hurdle of around 1.0810 can check the upside momentum ahead of directing the Euro price towards the mid-May swing high of near 1.0910.
On a different page, the stated Pennant’s bottom line, close to 1.0670 by the press time, restricts the short-term downside of the EUR/USD, a break of which will drag the Euro pair to an upward-sloping support line from early January, near 1.0640.
It’s worth noting that the previous monthly low of around 1.0635 acts as an extra check for the EUR/USD bears, past 1.0640, before directing them to the lows marked in March and January, respectively near 1.0515 and 1.0480 in that order.
EUR/USD: Daily chart
Trend: Recovery expected
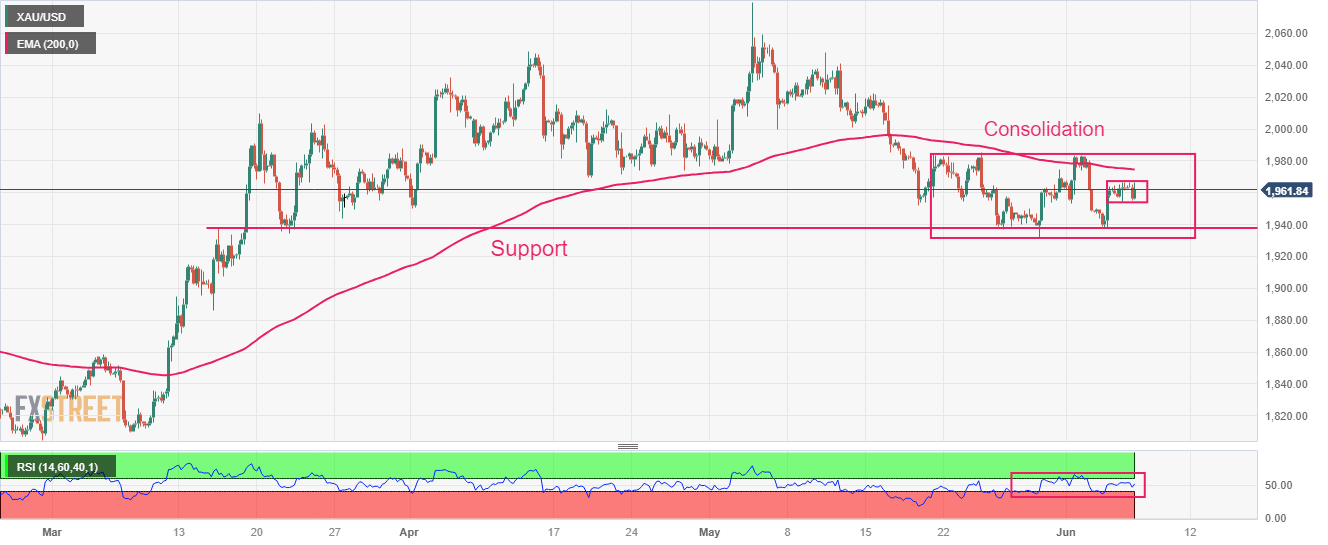
- Gold Price braces for the weekly loss despite sluggish US Dollar, taking offers to poke weekly low of late.
- XAU/USD retreats as hawkish central bank actions, fears of higher rates join downbeat statistics from major economies.
- Growth figures from Japan, Eurozone and United States employment clues eyed for clear directions of the Gold Price.
Gold Price (XAU/USD) remains bearish around the weekly low after snapping a two-day winning streak with a heavy loss to around $1,939 by the press time of early Thursday morning in Asia. In doing so, the precious metal bears the burden of the market’s fears of slowing economic growth and higher rates, as well as the firmer United States Treasury bond yields, even if the US Dollar remains sluggish.
Gold Price suffers from fears of economic slowdown, higher rates
Gold Price bears the burden of the recent challenges to the major economies, as perceived from the latest downbeat statistics from the United States, China, Europe and the UK. Adding strength to the economic pessimism are the fears of the higher interest rates from the top-tier central banks, especially after the latest hawkish surprises from the Reserve Bank of Australia and the Bank of Canada (BoC).
“The global economy is set for a weak recovery over the coming years as persistent core inflation and tighter monetary policy weigh on demand,” per the latest Organisation for Economic Co-operation and Development (OECD) report published Wednesday. The same raises doubts on the XAU/USD demand as China trade numbers trace the last week’s downbeat activity data while the German Industrial Production followed the previous day’s Factory Orders after marking the easy growth figure earlier. That said, the US activity numbers have been downeat and the Goods And Services Trade Balance also disappointed the previous day.
Not only the growth fears but the concerns surrounding the higher rates amid sluggish economic transition also weigh on the Gold Price.
On Wednesday, the Bank of Canada (BoC) surprised markets by announcing 25 basis points (bps) of increase to increase benchmark interest rate, to 4.75%, versus market expectations supporting no change in the previous rate of 4.50%. Earlier in the week, the RBA surprised markets for the second time in a row by announcing a 25 basis points (bps) rate hike.
Elsewhere, market’s bets of the Fedearl Reserve’s 25 bps rate hike in July increased, even as the June Federal Open Market Committee (FOMC) is likely to keep the rates unchanged. Even so, the OECD said, “(It) sees US Fed funds rate peaking at 5.25%-5.5% from Q2 2023, followed by two ‘modest’ cuts in H2 2024.”
Rising yields weigh on the XAU/USD
With the growth fears and hawkish central bank actions, as well as signals, the US Treasury bond yields rallied and weighed on the Gold Price the previous day. That said, the benchmark US 10-year Treasury bond yields rose the most in five weeks to 3.79% while the two-year counterpart marched to 4.52% at the latest.
It should be noted that the looming fears of a $1.0 bond issuance by the United States Treasury Department, due to the debt-ceiling deal, also prods the markets sentiment and weigh on the bond price, as well as bolster the yields. The same exerts downside pressure on the Gold Price.
While portraying the mood, Wall Street closed in the red whereas commodities and Antipodeans closed in the red.
Looking forward, growth numbers from Japan and Europe will join the weekly US Jobless Claims to entertain the Gold traders but risk catalysts and the bond market moves will be crucial to watch for clear directions.
Gold Price Technical Analysis
Gold Price breaks a one-week-old ascending support line while reversing the previous weekly gains.
That said, the steady conditions of the Relative Strength Index (RSI) line, placed at 14, join a looming bear cross on the Moving Average Convergence and Divergence (MACD) indicator to suggest further grinding of the XAU/USD towards the south.
With a clear downside break of the aforementioned support line, now resistance near $1,943, the Gold Price confirms a fall toward the monthly, as well as the yearly low, marked in the last week around $1,932.
In a case where the XAU/USD remains bearish past $1,932, the odds of witnessing a fall towards the 61.8% Fibonacci Expansion (FE) of May 10 to June 02 moves, near $1,910, can’t be ruled out.
On the contrary, the Gold Price recovery remains elusive unless the quote crosses the three-week-old horizontal resistance area surrounding $1,985, quickly followed by the 200-SMA level of around $1,987. That said, the support-turned-resistance line restricts immediate upside near $1,943.
Even if the XAU/USD crosses the $1,987 hurdle, the $2,000 psychological magnet will be crucial for the Gold buyers to surpass to tighten the grip.
Gold Price: Four-hour chart

Trend: Further downside expected
- GBP/JPY sees a bullish continuation, testing the year-to-date high amid a weaker JPY and BoE tightening expectations.
- A move past the YTD high could propel the pair toward the 175.00 supply zone and possibly a seven-year high.
- Potential correction below the Tenkan-Sen line could hit support at 172.66 and drop towards the Kijun-Sen line at 171.26.
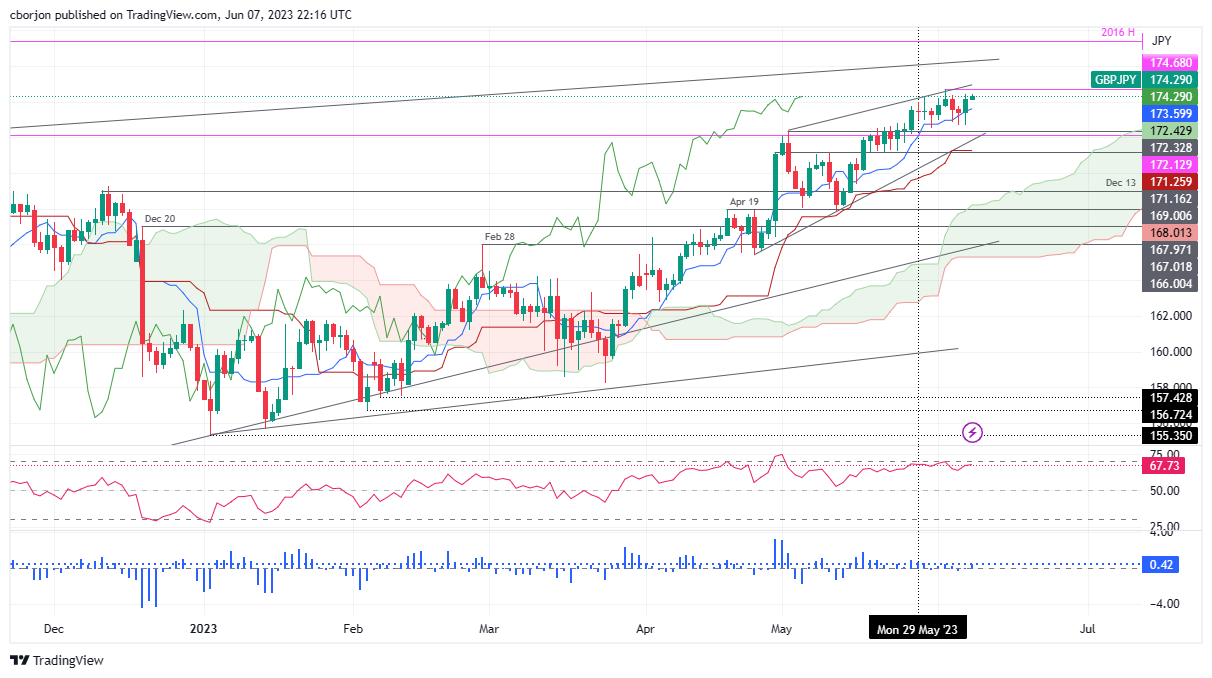
GBP/JPY prints minuscule gains, with buyers eyeing a test of the year-to-date (YTD) high at 174.68 as the Asian session begins. On Wednesday, the GBP/JPY pair finished with gains of 0.42%, bolstered by a weaker Japanese Yen (JPY). Meanwhile, expectations for further tightening by the Bank of England (BoE) underpinned the Pound Sterling (GBP). Hence, the GBP/JPY exchanges hand at 174.28.
GBP/JPY Price Analysis: Technical outlook
GBP/JPY is set for a bullish continuation, as shown by the daily time frame. As the pair closes into the YTD high, price action turns choppy, which could open the door for a reversal, as the Tenkan-Sen line, at 173.59, is the closest to the current price action.
If GBP/JPY extends its gains past the YTD high, the next supply zone would be 175.00. A rally above that level could pave the way for the GBP/JPY to hit seven-year new highs and test the 2016 yearly high at 177.37.
Conversely, a fall below the Tenkan-Sen line and the GBP/JPY might correct lower. First, support would be found at the weekly low of 172.66. A breach of the latter will expose 2022 yearly high shifted support at 172.13, ahead of falling toward the 172.00 figure. Downside risks lie beneath that level, with the Kijun-Sen line at 171.26.
GBP/JPY Price Action – Daily chart
- WTI bulls looking to engage in anticipation of a bullish continuation.
- Daily inverse H&S is a compelling feature on the charts.
West Texas Intermediate, WTI, crude oil ended higher on Wednesday as a report showed an unexpected drop in US inventories while China's imports rose last month. Nevertheless, the bulls remain in good stead as per the following technical analysis:
WTI daily chart
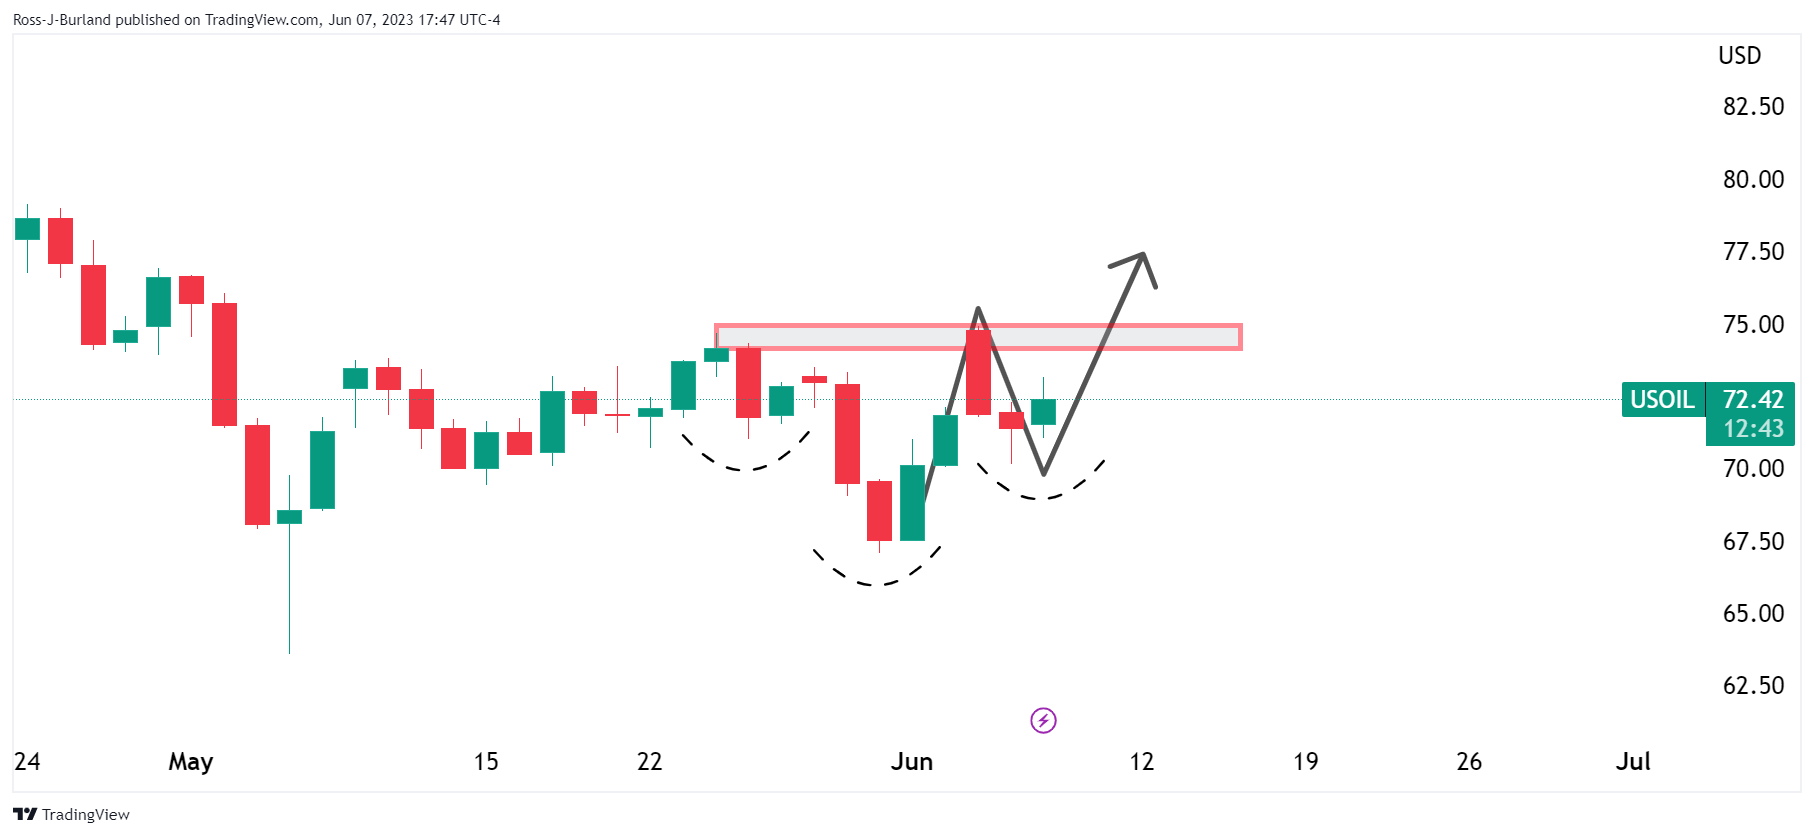
We have an inverse head and shoulders which is bullish.
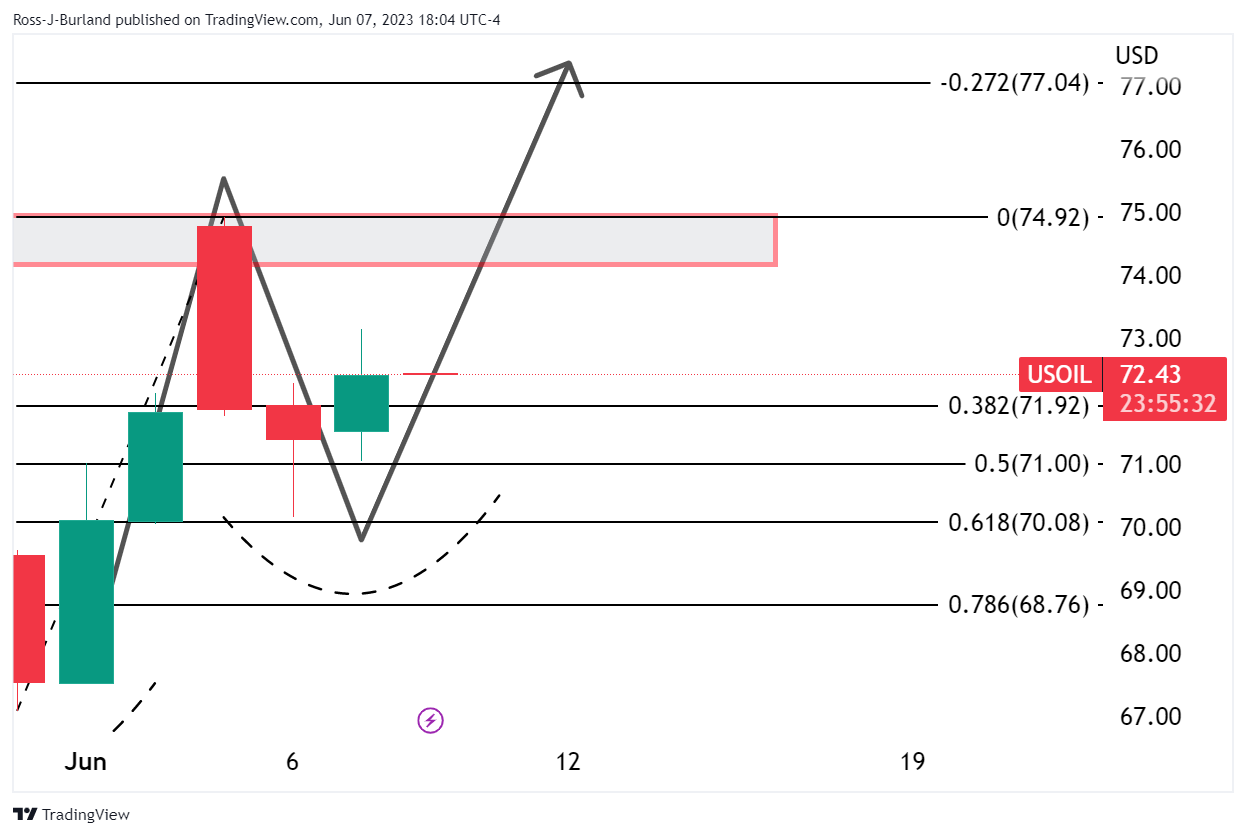
Pulling the chart across to see the impulse correction and what could now be another bullish impulse in the making, we can see that the market is supported at a 61.8% Fibonacci retracement level. This too is bullish.
WTI H4 chart
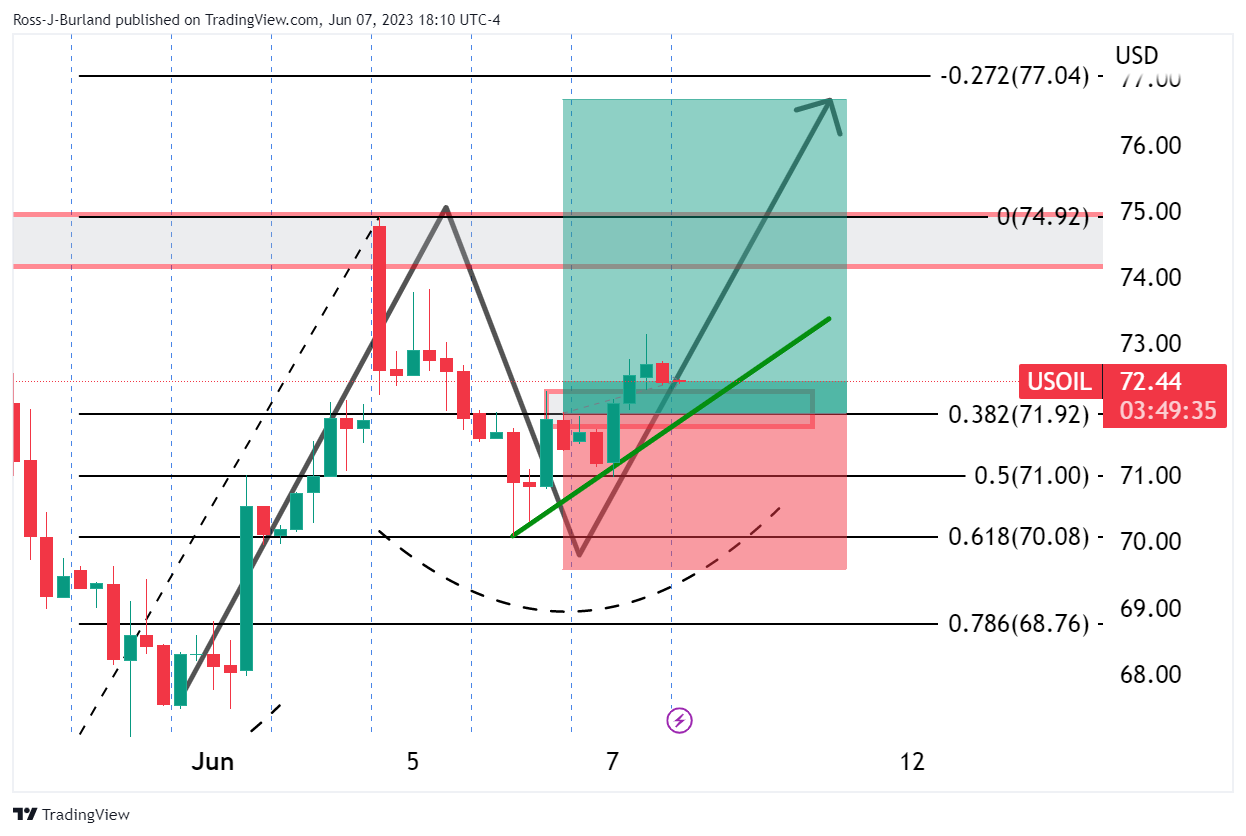
The 4-hour chart shows the price has breached prior resistance that could now well act as a support on the pullback. Bulls could be encouraged to enter the market in anticipation of a bullish continuation.
- USD/CHF shows bullish momentum, targeting the 0.9100 mark with 0.27% gains.
- RSI and three-day RoC indicators suggest bullish dominance despite sideways movement.
- Overcoming the 0.9120 hurdles could steer the USD/CHF toward the 0.9147 and 0.9200 landmarks.
USD/CHF bounces off the 50-day Exponential Moving Average (EMA) and threatens to claim the 0.9100 figure late after Wall Street closed. The US Dollar (USD), propelled by risk aversion, helped the USD/CHF to Regusters solid gains of 0.27%. At the time of writing, the USD/CHF is trading at 0.9090 after hitting a low of 0.9043.
USD/CHF Price Analysis: Technical outlook
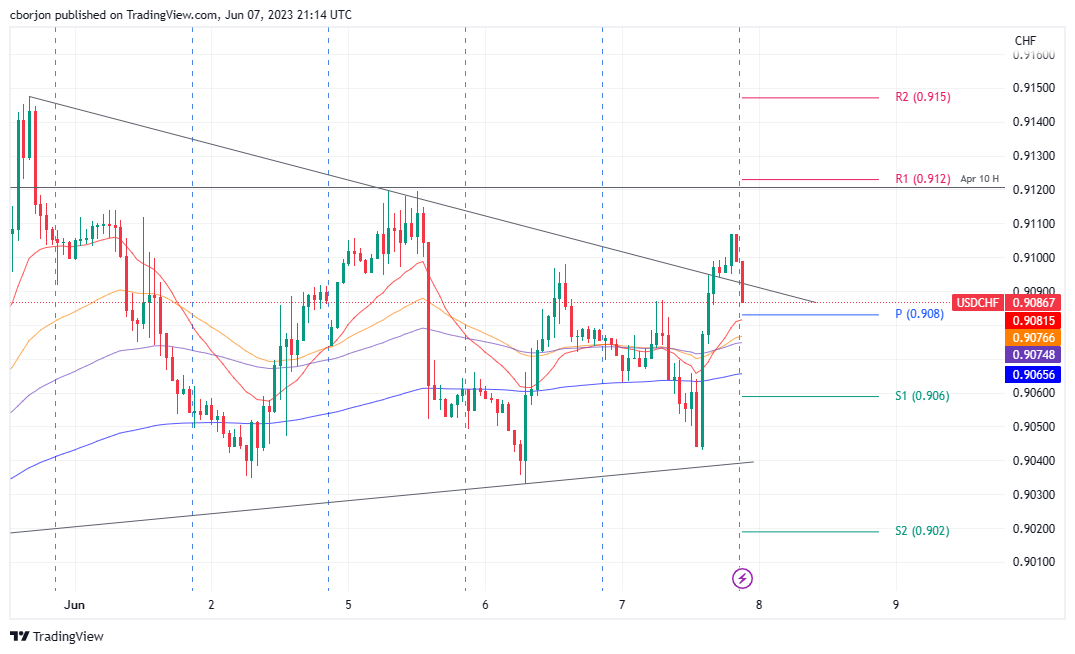
From the USD/CHF daily chart perspective, the pair is neutrally biased, consolidated within the limits of solid support found around the 20- and 50-day EMAs, each at 0.9036 and 0.9040) and resistance at the 100-day EMA at 0.9123. Although price action remains sideways, the Relative Strength Index (RSI) shows bulls are in charge, further cemented by the three-day Rate of Change (RoC). Hence, the USD/CHF path of least resistance is upwards. Of note, the Average True Range (ATR) suggests that volatility in the pair could lean up to 60 pips.
Dialing into the USD/CHF hourly chart, price action remains sideways, though it broke above a resistance trendline late in the New York session, exacerbating a rally above 0.9100. However, buyers must reclaim the weekly high of 0.9120, so they can pose a threat toward the last week’s high of 0.9128. The breach of those levels will pave the way towards the R1 daily pivot at 0.9147, ahead of challenging the 0.9200 figure. Conversely, a fall below the daily pivot at 0.9083 could open the door towards the EMAs at around 0.9074/76, followed by the 200-EMA at 0.9065.
USD/CHF Price Action – Hourly chart
The Bank of Canada surprised markets with a rate hike on Wednesday, following the Reserve Bank of Australia's rate increase on Tuesday. These developments come ahead of a crucial week with meetings from the Federal Reserve and the European Central Bank. In terms of data for Thursday's Asian session, the highlights will be Japan's Q1 GDP. New Zealand will report Q1 Manufacturing Sales and Australia, trade data. Later in the day, the Eurozone's GDP and employment figures will be released, along with the weekly US Jobless Claims report.
Here is what you need to know on Thursday, June 8:
The Canadian Dollar outperformed on Wednesday following the Bank of Canada's surprise rate hike. Against expectations, the central bank raised its key rate by 25 basis points to 4.75%, citing persistent excess demand and increasing concerns that inflation could "get stuck" materially above the target. This decision follows the Reserve Bank of Australia's hike on Tuesday, which also exceeded economic consensus. In the upcoming week, the Federal Reserve, the European Central Bank, and the Bank of Japan will have their own monetary policy meetings.
The Fed remains in its blackout period, preventing markets from hearing any official comments. Recent data shows a weakening in the manufacturing sector, though there are no imminent signs of a recession. All eyes are now on the upcoming Consumer Price Index (CPI) report next Tuesday, which is expected to be a key determinant for the Fed’s decision.
Analysts at Wells Fargo commented on the US economic outlook:
We still expect the delayed effects of monetary tightening and tighter credit availability to dampen economic growth. However, the enduring strength of the labor market prompted upward adjustments to our forecast for employment, real disposable income and consumption, shifting the expected start of the downturn closer to the end of this year.
During Wednesday's American session, US Treasury yields surged as market participants pared back their bets for rate cuts by the Fed by the end of the year. However, the most likely scenario for next week's Fed meeting is that rates will remain unchanged. The 10-year Treasury yield settled at 3.79%, the highest since May 29. Global government bond yields rose in response to another surprise rate hike, while equity prices on Wall Street posted mixed results. The VIX dropped to 13.90, the lowest level since February 2020, despite ongoing caution due to a gloomy global outlook and higher interest rates.
With the debt ceiling drama now resolved, the Wall Street Journal is warning of a potential flood of over $1 trillion in Treasury bills that could trigger volatility across financial markets in the weeks ahead. Investors will be closely watching for any signs of disruption as this massive amount of new issuance hits the market.
China reported weak trade data on Wednesday, with exports dropping 7.5% YoY in May against expectations of a 1.8% decline. This marks the first contraction in three months. Meanwhile, imports dropped 4.5% YoY, less than the 8.0% decline expected by the market consensus. These disappointing numbers add pressure on Chinese officials to provide more policy support, including rate cuts. The USD/CNH climbed to 7.15, the strongest level since November.
EUR/USD continues to trade around 1.0700, moving sideways and stuck ahead of next week's central bank meetings. On Thursday, the Eurozone will release a new reading on Q1 GDP and Employment.
GBP/USD approached the 1.2500 level before falling back to the 20-day Simple Moving Average (SMA) around the 1.2430 area, as the US dollar gained strength. A consolidation below 1.2400 would indicate potential for further losses in the pair.
Rabobank’s GBP outlook:
The risk for GBP is that further progressive rate hikes from the Bank significantly undermines the recently improved growth outlook. The line-up of UK fundamentals has already been poor for some time. The backdrop has been been characterised by high inflation, weak growth in addition to low investment and productivity. The UK’s current deficit last year likely enhanced the vulnerability of the pound. This has shrunk recently, which could afford GBP a little protection. However, on the view that the ‘higher for longer’ interest rate story is set to support the USD into Q3, we see scope for cable to edge lower to GBP/USD1.22 on a 3 mth view.
The Japanese Yen was hit by rising government bond yields. USD/JPY jumped from 139.00, surpassing 140.00. Japan will report Bank Lending, Trade data, and a new estimate of Q1 GDP. Also due is the Eco Watches Survey.
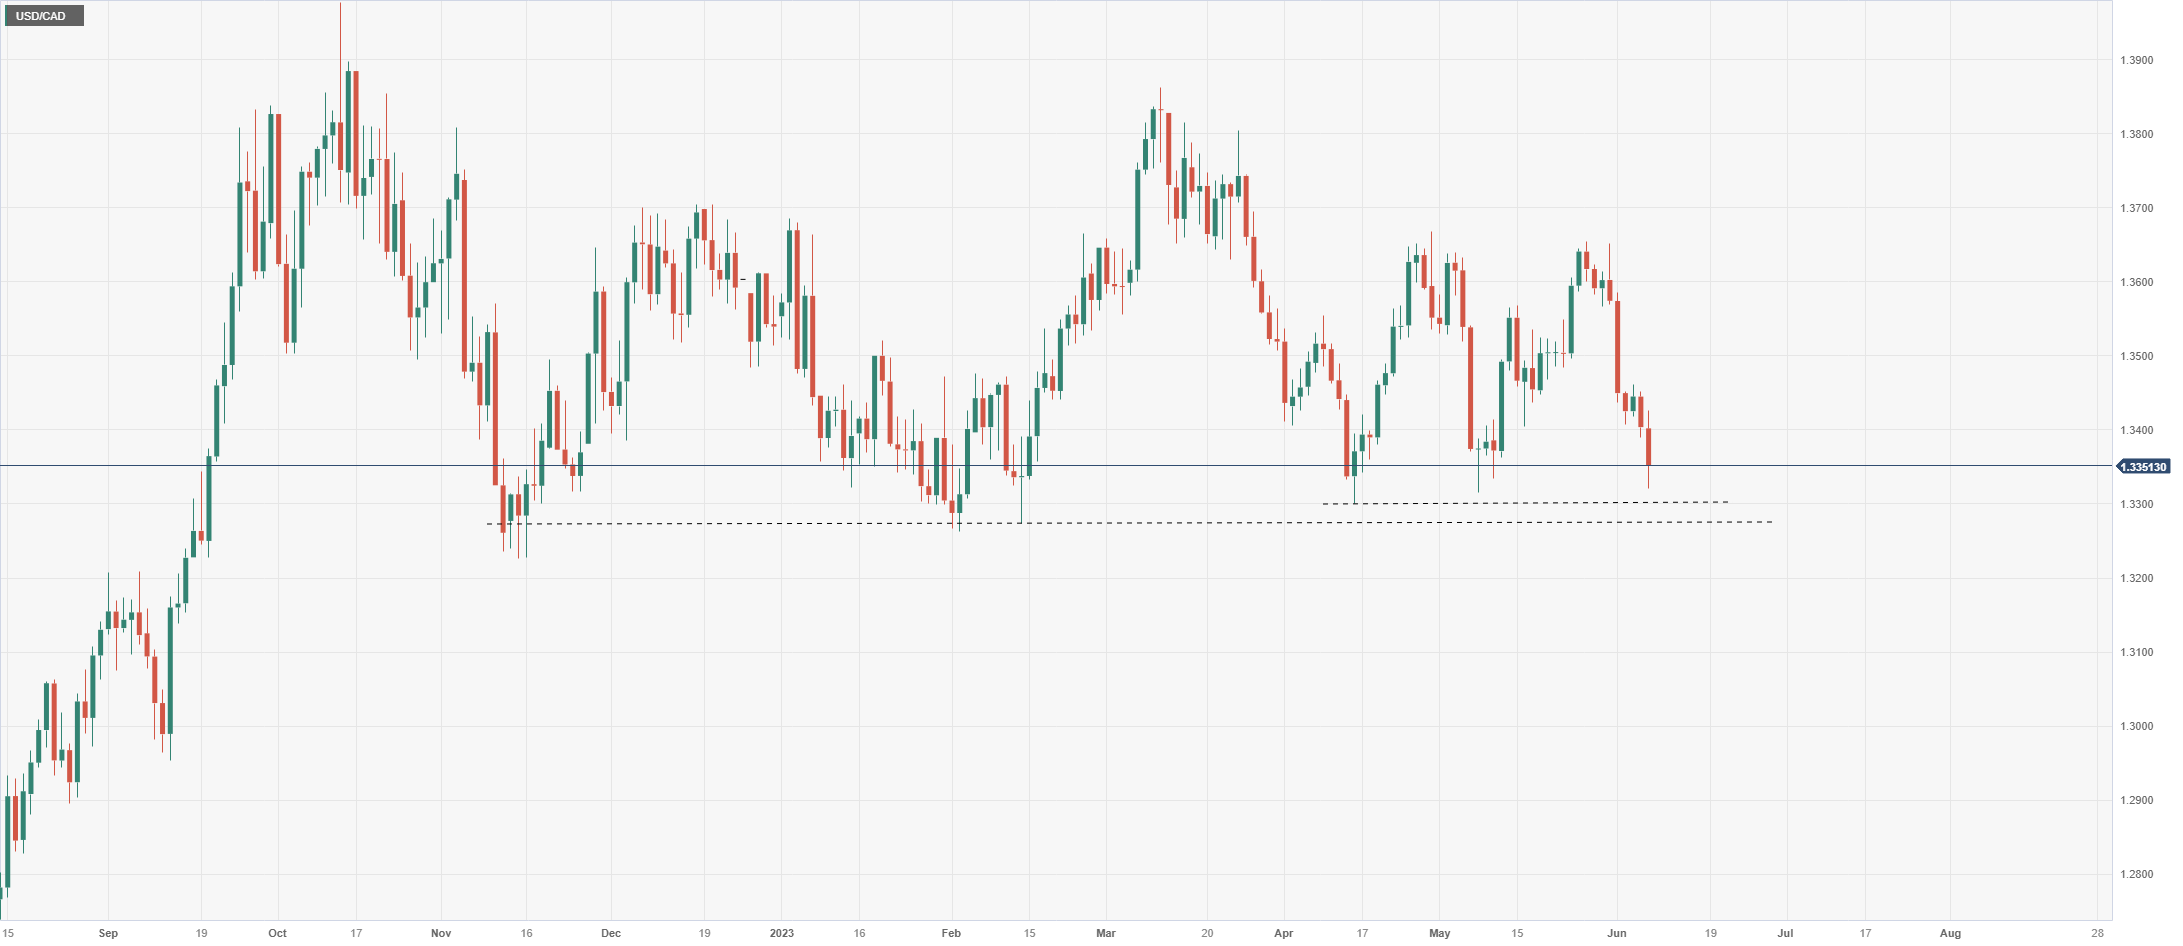
USD/CAD tumbled to 1.3319 after the unexpected rate hike by the BoC. It then rebounded, trimming losses to stabilize at 1.3370/80. The crucial support area above 1.3300 remains firm.
AUD/USD dropped after a four-day positive streak. The pair failed to hold above 0.6700. A relevant short-term support is located at 0.6640. The momentum that emerged from the hawkish RBA hike and Governor Lowe's comments faded amid cautious markets and a slide in commodity prices. Australia will report exports and imports on Thursday.
NZD/USD dropped below 0.6050, posting the lowest daily close in a week. The 0.6000 psychological area is back on the radar.
Despite new government appointments with more market-friendly names, the Turkish Lira remains under pressure. USD/TRY gained more than 7%, reaching fresh record highs above 23.00. Meanwhile, the Mexican peso hit its highest level since 2016, with USD/MXN falling to 17.30.
Gold tumbled to $1,940 and is looking at May lows, affected by higher Treasury yields. Silver reversed after approaching $24.00, falling below $23.50. Crude oil prices rose more than 1% on the back of inventory data, despite rate hikes and trade data from China. The WTI barrel settled around $72.50.
Cryptocurrencies weakened, with BTC/USD losing 2.25% to $26,360. Volatility still prevails after the Securities and Exchange Commission sued Coinbase on Tuesday and asked for a temporary restraining order to freeze assets tied to Binance on Monday.
Like this article? Help us with some feedback by answering this survey:
- NZD/USD bears moved in despite soft US Dollar.
- Attention turns to US CPI and Fed next week and local GDP.
NZD/USD traded down some 0.65% on the day by the last 45 minutes of the US session on Wednesday. The US Dollar, however, was little changed on the day as per DXY as investors awaited US inflation data for May and the Federal Reserve’s interest rate decision next week.
´´The Kiwi is lower this morning, and this time it’s not because of USD strength (with the USD DXY little changed after a whippy night), but instead, the decline was an Antipodean AUD and NZD move,´´ analysts at ANZ Bank said:
´´Exactly what the driver was isn’t clear but both currencies have corrected against EUR and GBP, so call it a wash-up. One thing we do think bears saying is that the USD itself isn’t really budging despite having put things like the debt ceiling and bank wobbles behind it, and as markets eye an end to the tightening cycle.´´
´´Instead, it is holding up against most forecasters’ expectations. And last night’s rise in US bond yields may sustain it for a bit longer. New Zealand's first quarter manufacturing data today will be key for Gross Domestic Product next week, but we are also a little nervous about New Zealand's first quarter current account data next week.´´
Meanwhile, what might play into the hands of risk currencies such as the antipodeans is the sentiment around the central bank divergences. The prospects for the Fed to pause raising interest rates next week while the likes of the Bank of Canada, Australia, and the European Central Bank align a chorus of hawkish counterparts should underpin the risk on currencies. With that being said, there is the risk of a hawkish surprise at the Fed.
´´The headwinds on the US Dollar (banking sector weakness, debt ceiling battle) have been resolved even as the tailwinds (strong economy and robust labor market) pick up,´´ analysts at Brown Brothers Harriman have argued, ´´We look for this post-Nonfarm Payrolls rally to continue.´´
´´Fed tightening expectations remain steady,´´ the analysts said.
´´WIRP suggests odds of a hike this month around 30% and those odds rise to around 80% in July. More importantly, WIRP suggests around 50% odds of a rate cut by year-end. There has been quite a bit of Fed repricing in recent weeks but more needs to be done. ´´
´´ It’s going to be a close call for the Fed and the final determinant for its decision will be May CPI data next Tuesday.´´
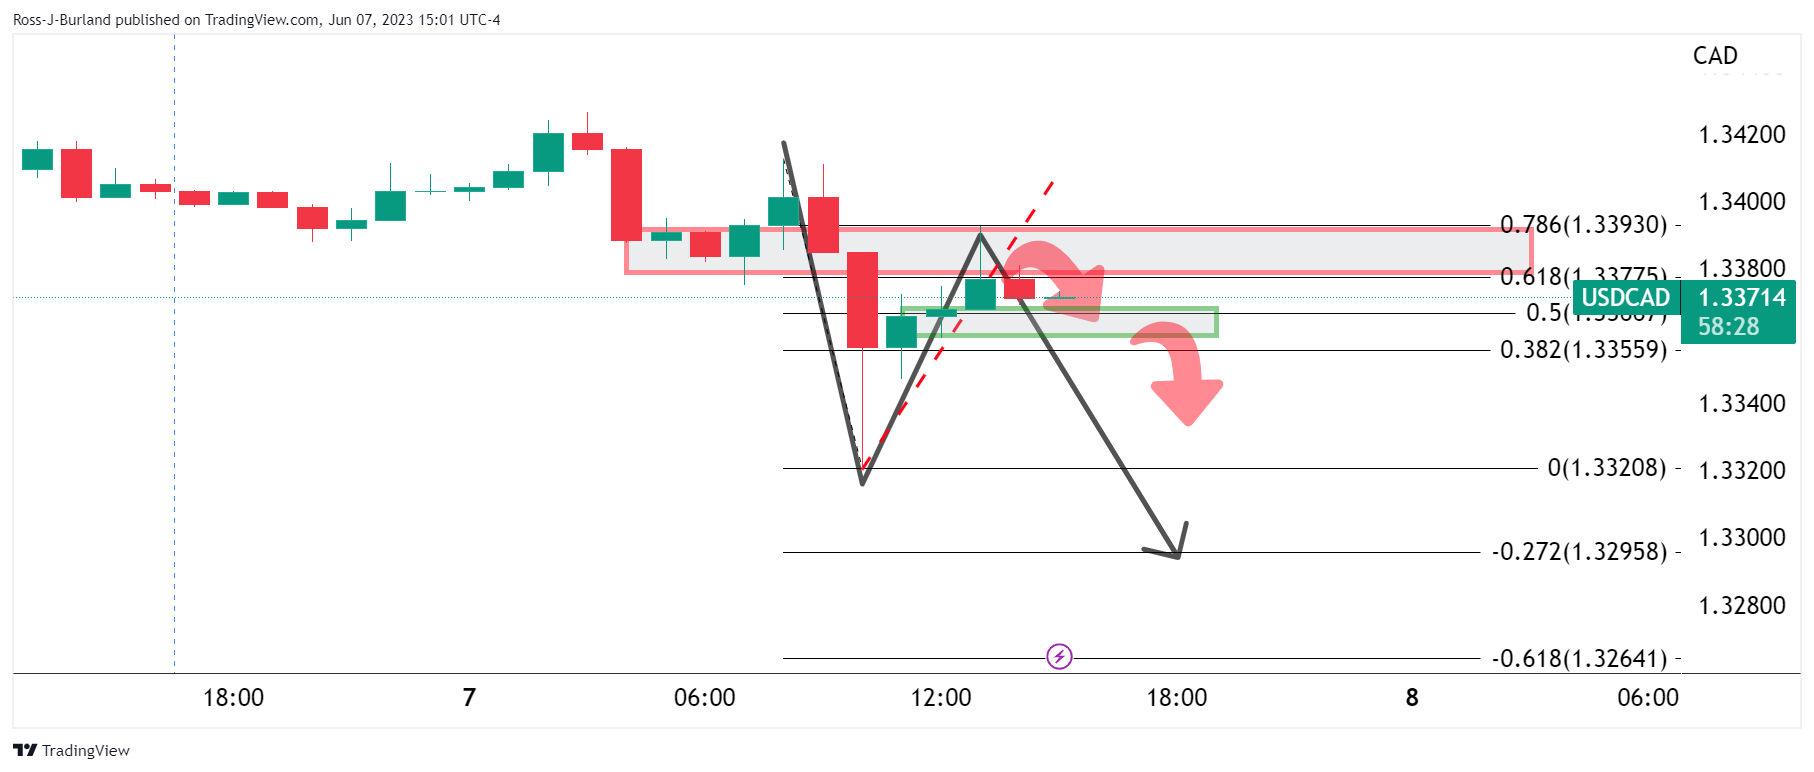
- USD/CAD bulls come up to meet resistance on the correction of the BoC induced sell-off.
- USD/CAD bears eye a downside extension on a break of 15-minute support area between 1.3370 and 1.3360.
The Canadian Dollar popped to a four-week high vs. the Greenback on Wednesday after the Bank of Canada said it would continue to raise interest rates next month after it tightened for the first time since January. The BoC showed its hand to the market as it warned that inflation could get stuck significantly above its 2% target amid persistently strong economic growth.
This has flipped the script technically ahead of US Consumer Price Index and the Federal Reserve events next week, putting the bears in control again as the following technical analysis will illustrate:
USD/CAD daily chart

The bears are targeting the lows and we could see further selling coming in following this meanwhile correction. However, traders would be aware of the CPI and Fed events at the start of next week and thus we could see some derisking into the events that would likely see a deceleration of the bearish impulse as drawn above.
USD/CAD H1 and M15 charts
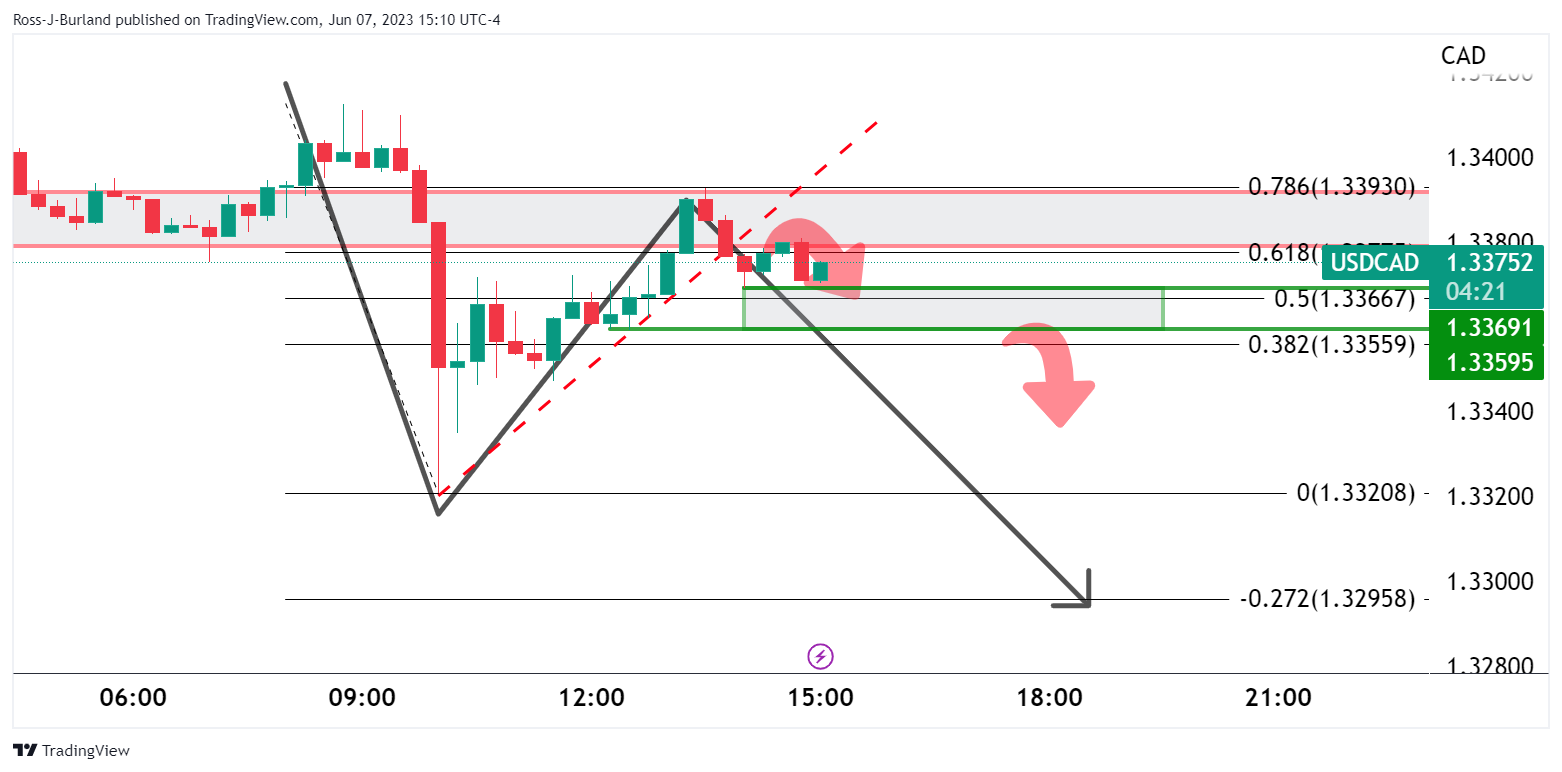
For the time being, however, it appears that the correction is decelerating at resistance and this could lead to further selling pressure in the sessions and days ahead before the week is out. A downside extension could be on the cards if the 15-minute support area between 1.3370 and 1.3360 gives way with sellers potentially encouraged to add below 1.3350.
- USD/MXN sinks to a seven-year low, influenced by the MXN’s favorable interest rate and Fed’s dovish stance.
- Despite USD/MXN decline, higher US Treasury bond yields hint at a potential Fed rate hike in July.
- A widened US trade deficit for April, driven by falling exports and rising imports, contributes to USD’s depreciation against the MXN.
USD/MXN collapsed to new seven-year lows on Wednesday, as the interest rate differential favors the Mexican Peso (MXN), while the US Dollar (USD) weakened on last week’s Fed dovish commentary ahead of the next week’s monetary policy meeting. Even though a risk-off impulse is present in the markets, the USD/MXN is trading at around 17.3600s after hitting a daily high of 17.3915.
Interest rate differential Favors the Mexican Peso; therefore, further USD/MXN downside expected
Sentiment remains deteriorated, as shown by US equities. Higher US Treasury bond yields cushion the USD/MXN from falling further, as investors bet the US Federal Reserve would hike rates in July after skipping the June meeting. The CME FedWatch Tool portrays odds for a 25-bps increase at 50.8%, at around the same level as yesterday.
Nevertheless, G10 central banks tightening monetary policy after skipping some rate-setting decisions keeps investors nervous about the Fed’s next move. During the last week, policymakers stressed that a pause is necessary to assess the impact of the cumulative tightening in the economy.
Data-wise, the US economic agenda featured the US Trade Balance, showing the deficit broadened in April, compared with March’s data. Numbers came at $-74.6B in April of 2023, vs. March’s $-60.B. A notable dip in exports contributed to this shift, while imports rose sharply
The greenback shifted positively; printing gains as shown by the US Dollar Index (DXY). The DXY, which tracks the USD performance against a basket of six currencies, pares its earlier losses, up 0.04%, at 104.078.
USD/MXN Price Analysis: Technical outlook
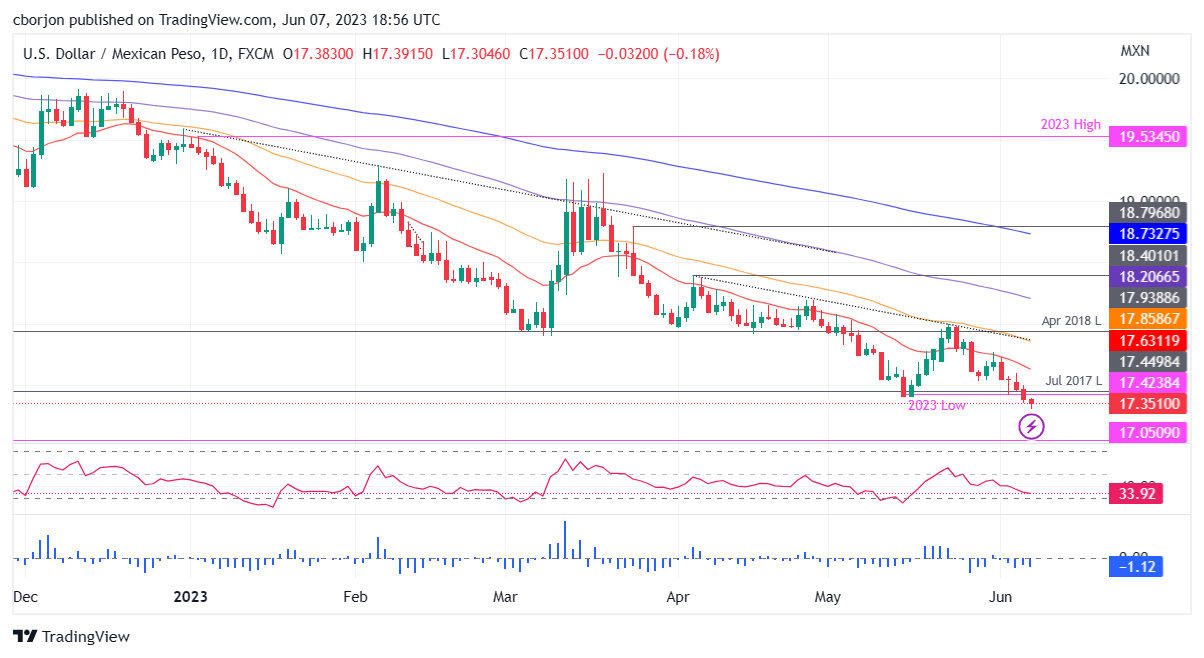
After testing the 17.99 on May 26, the USD/MXN plunged 3.50%, sponsored by overall MXN strength. Swing In market sentiment tempered the pair’s fall, but even comments that the Bank of Mexico would keep rates unchanged for two meetings was no excuse for the MXN to appreciate. Technical indicators like the Relative Strength Index (RSI) and the three-day Rate of Change (RoC) suggest that sellers remain in charge. That said, the USD/MXN next support would be the year-to-date (YTD) low of 17.3046. A breach of the latter will expose the 2016 low of 17.0500 before diving to 17.0000. Conversely, the USD/MXN first resistance would be the 20-day EMA at 17.6314, followed by the 50-day EMA at 17.8587.
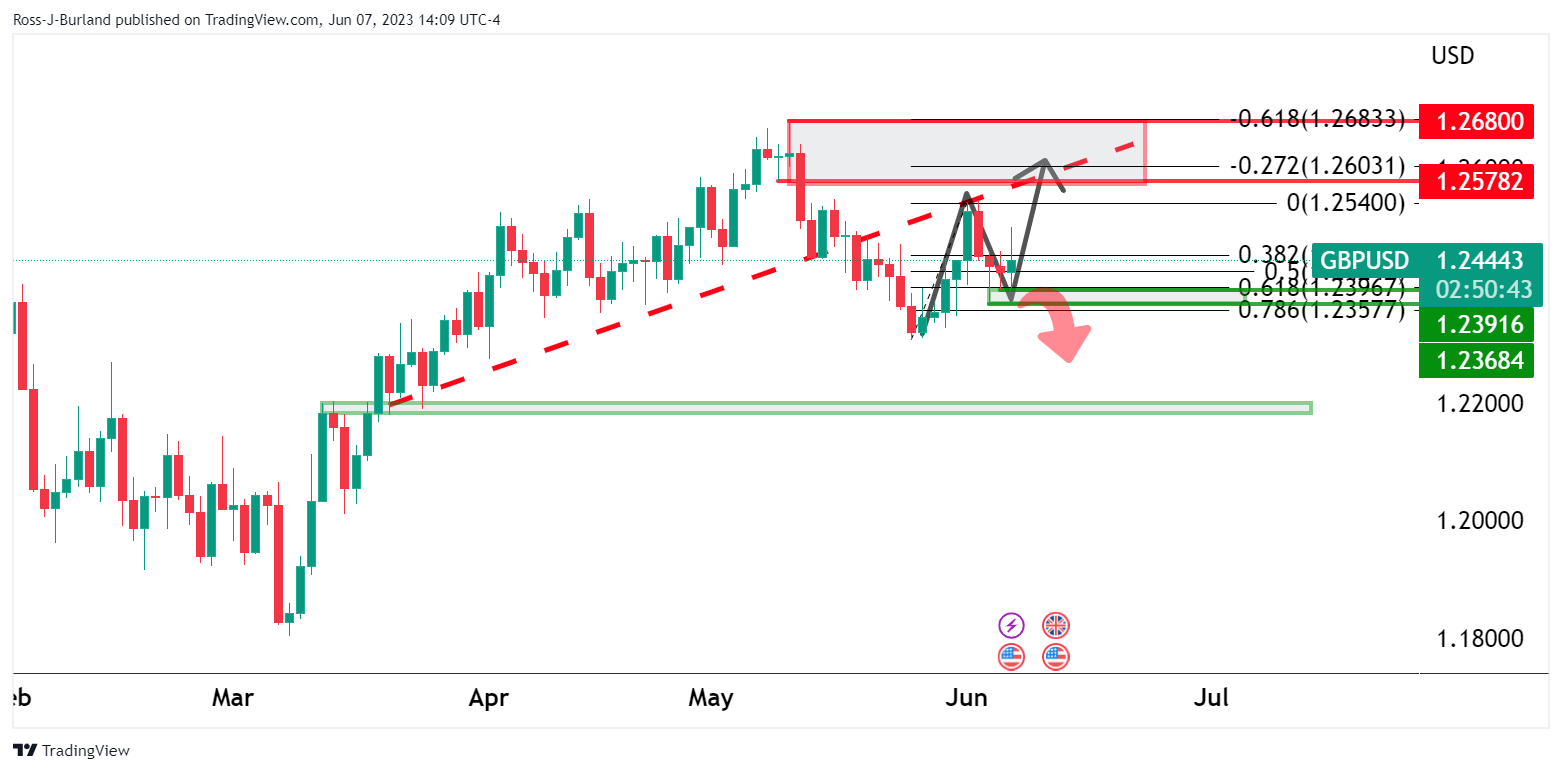
- GBP/USD bulls are moving in and eye a 38.2% Fibo retracement.
- Longer-term bulls eye a bullish extension from trendline support.
GBP/USD has traveled between a low of 1.2395 and a high of 1.2499 so far while it attempts to correct higher late in the New York day. At the time of writing, the pair is trading at 1.2444 and is 0.16% higher. Markets are looking ahead to the central bank meetings with the Federal Reserve scheduled for June 14 and the next Bank of England meeting is scheduled for June 22.
Meanwhile, the technical outlook is meanwhile bullish into a resistance area as follows:
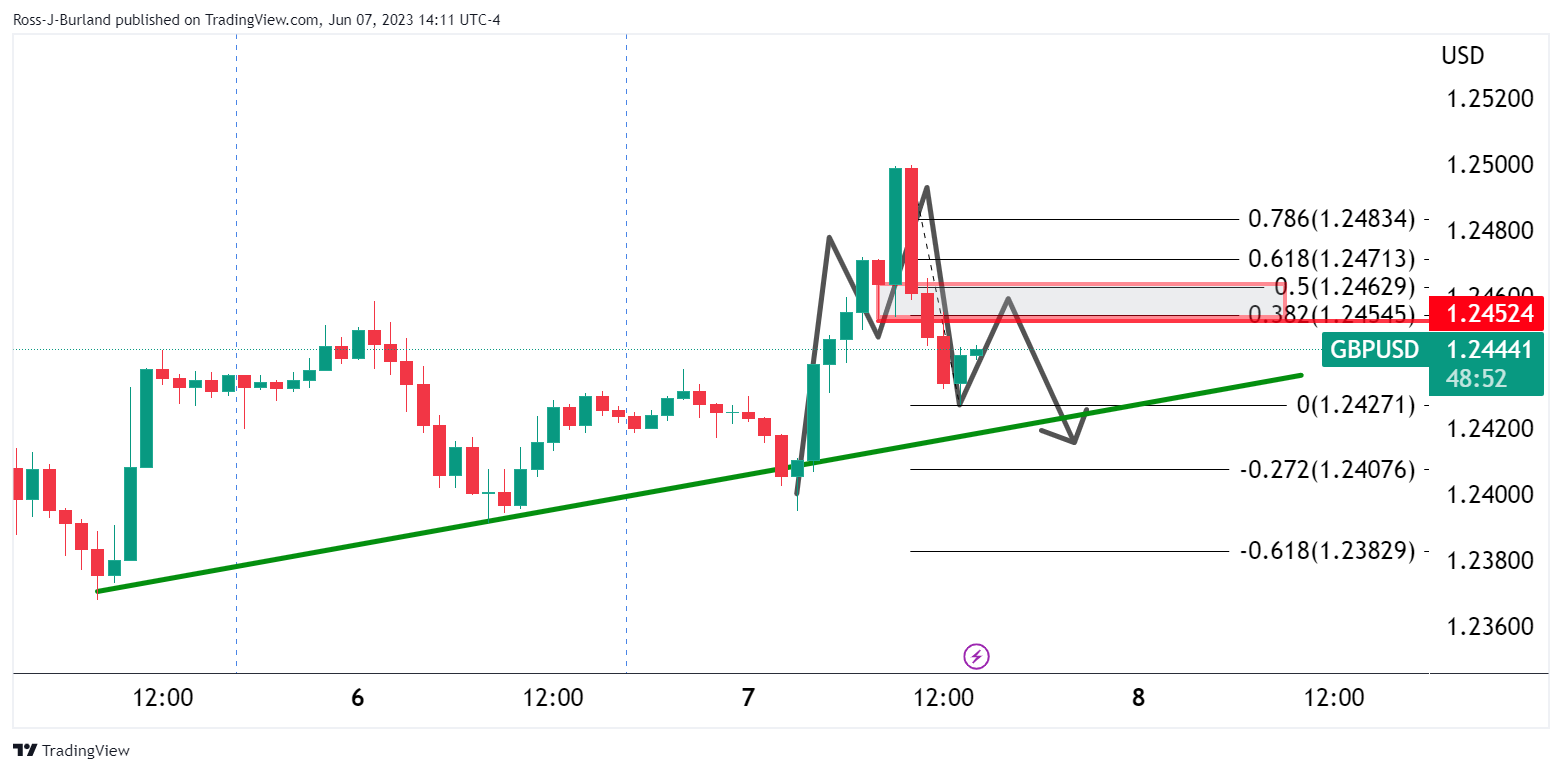
The hourly chart shows an M-formation´s neckline as vulnerable to a restest as the price turns on a dime and moves in towards a 38.2% Fibonacci retracement level. However, bears could move in and target the trendline support.
Longer-term, we could have a scenario whereby the support holds and the bulls commit to target the 1.2580s-1.2680s as illustrated below:
- AUD bulls failed to hold above the 200-SMA after the RBA rate hike momentum.
- The cautious market mood following weak Chinese data favours USD.
- Rising US bond yields gave a boost to the greenback.
The AUD/USD trades with losses on Wednesday below 0.6650 area after hitting a daily high at 0.6717. A stronger US Dollar during the American session pushed the pair to the dowside. A surprising 25 basis point (bps) hike by the Bank of Canada (BoC) slightly strengthened the case for a hike by the Federal Reserve (Fed) in the upcoming June 13-14 meeting, sending US yields higher, favoring the US Dollar.
US bond yields rise ahead of Fed decision
The BoC announced on Wednesday a rate hike by 25 bps while markets expected them to maintain them steady at 4.5%. In that sense, adding to the Reserve Bank of Australia’s (RBA) decision on Tuesday, the expectations of a 25 bps hike next Wednesday by the Federal Reserve (Fed) slightly increased. However, the CME FedWatch tool suggests that investors are placing higher probabilities on the Fed refraining from hiking rates and instead, keeping the target rate steady at 5.25% but the odds of a 25 bps hike jumped to 30%.
As a reaction, the US bond yields are seeing gains across the curve. The 10-year bond yield rose to 3.79% seeing a 2.35 % surge on the day, while the 2-year yield stands at 4.60% with a 2.02 % advance and the 5-year yielding 3.95% with a 2.37 % increase respectively giving additional traction to the US Dollar.
Earlier on Wednesday, the AUD/USD peaked at 0.6717, the highest level since May 11, despite weak Chinese data. The Australian Dollar was boosted by a hawkish tone from RBA Governor Lowe. However, Australian Q1 GDP data fell below expectations, with a quarterly expansion of 0.2% compared to the market consensus of 0.3%.
Levels to watch
Technically speaking, the AUD/USD holds a neutral to bullish outlook for the short term as the bulls are struggling to maintain their dominance, but technical indicators are still favourable, suggesting that the market may still have some upside potential.
In case the Aussie recovers momentum, the following resistance line up at the 200-day Simple Moving Average (SMA) at 0.6690, followed then by the daily high at 0.6715/20 and the 100-day SMA at 0.6743. On the downside, the next support levels to watch are 0.6640, followed by 0.6605/10 and 0.6575 (weekly low).
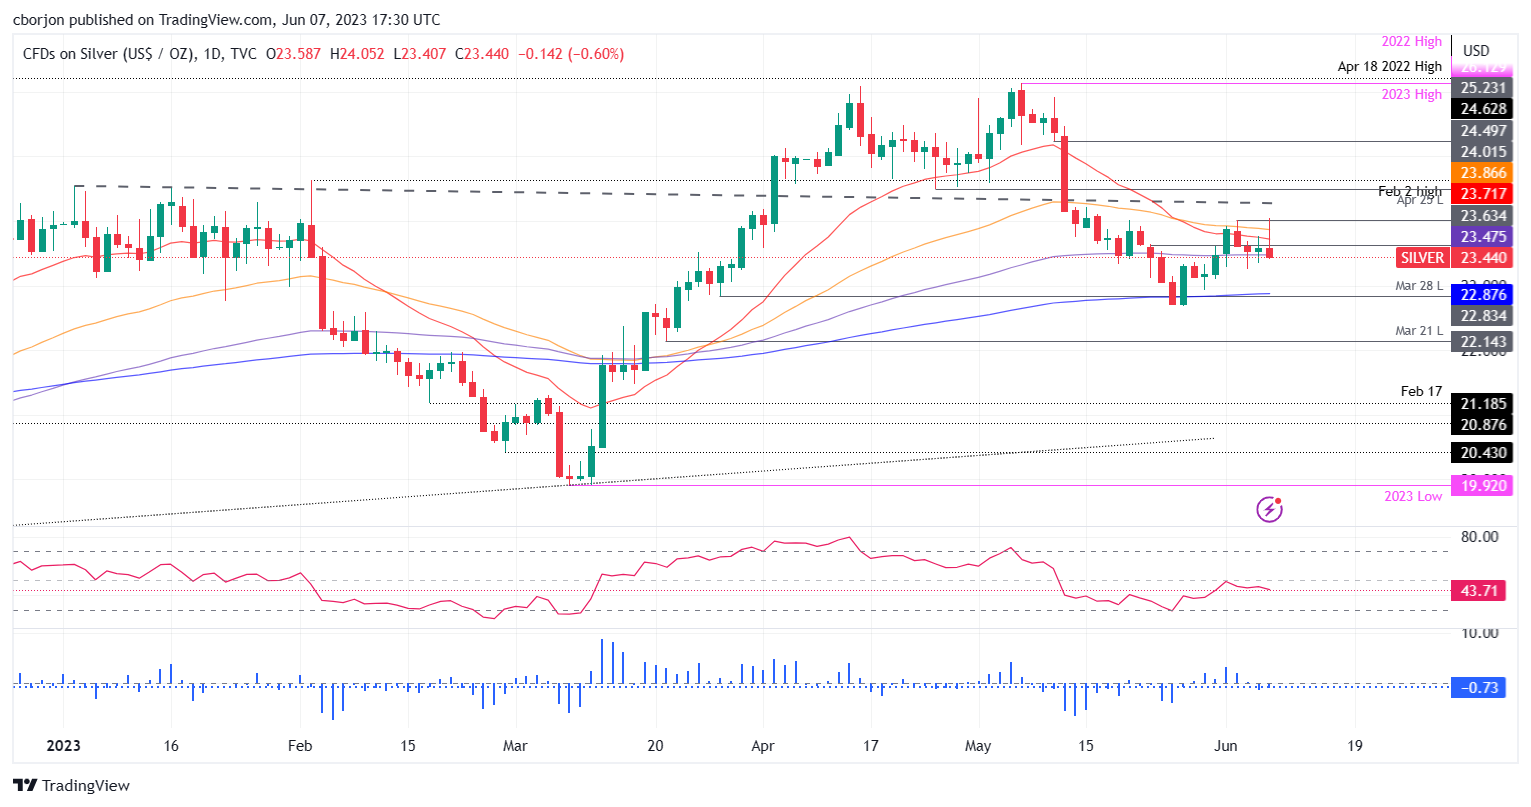
- Silver prices dropped after testing weekly highs of $24.00, impacted by rising US bond yields.
- Bullish momentum was curbed by the strong US Dollar and significant resistance at the $24.00 area, according to technical indicators.
- Downward bias confirmed by bearish Relative Strength Index (RSI) and three-day Rate of Change (RoC).
Silver price dropped after testing weekly highs of $24.00, and retraces weighed due to elevated US bond yields, strong US Dollar (USD), and technical indicators. The XAG/USD exchanges hands at around $23.40s after hitting a weekly high of $24.05.
XAG/USD Price Analysis: Technical outlook
XAG/USD remains neutral-to-downward biased, unable to break decisively above the $24.00 mark area. Technical indicators, like the 50- and 20-day Exponential Moving Averages (EMAs) confluence at $23.71-$23.87, dragged Silver’s spot price lower.
Furthermore, the Relative Strength Index (RSI) indicator and the three-day Rate of Change (RoC) portray that sellers are in charge, both at bearish territory warrant downward action.
Therefore, the XAG/USD first support would be the current week’s low at $23.25, which, once cleared, the white metal could extend its losses toward the $23.00 figure. If XAG/USD slides further will challenge the 200-day EMA at $22.87.
Otherwise, the XAG/USD resistance area would be the abovementioned confluence of the 20/50-day EMAs, at around $23.71-$23.87, which, once breached, could spark a test of $24.00. if XAG/USD clears that area, the next supply zone would be the $25.00 mark.
XAG/USD Price Action – Daily chart
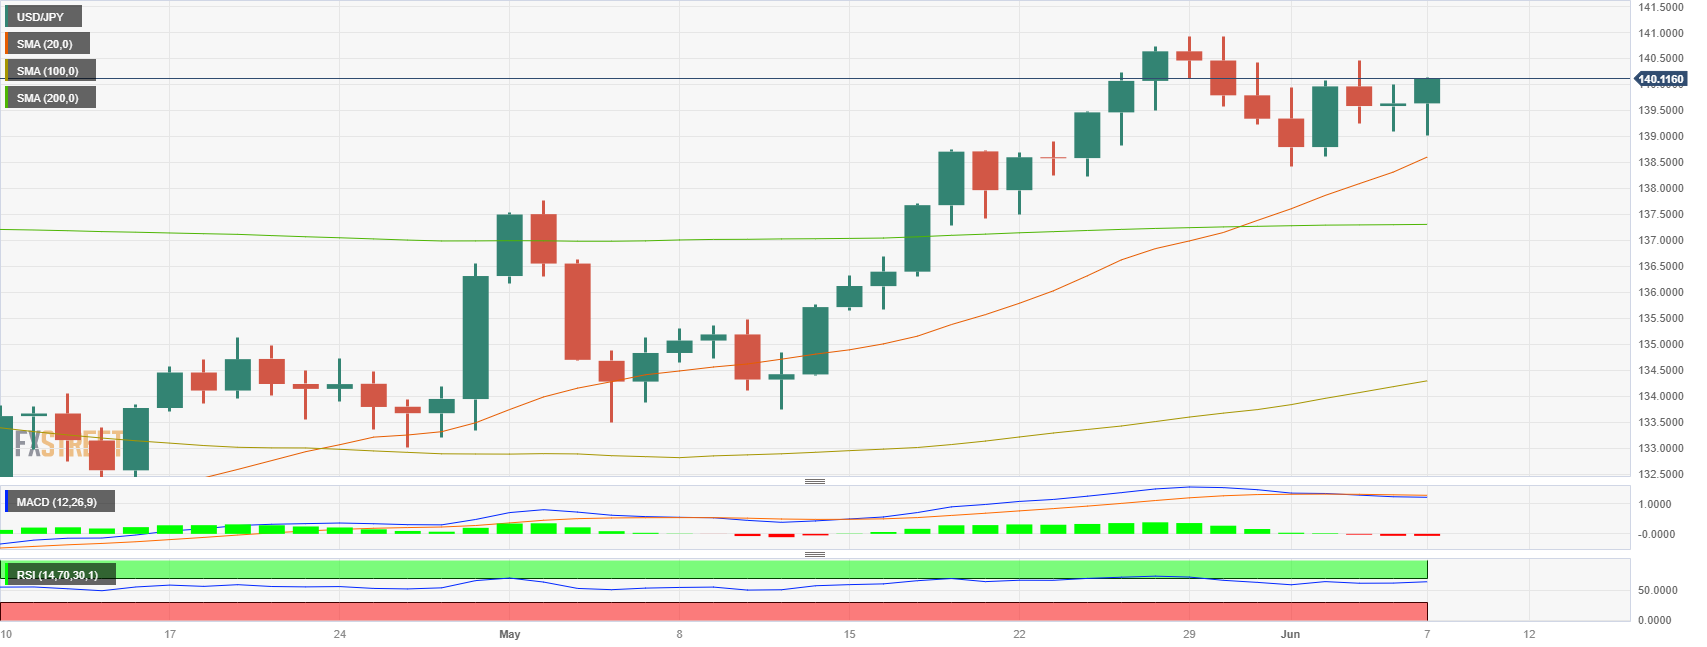
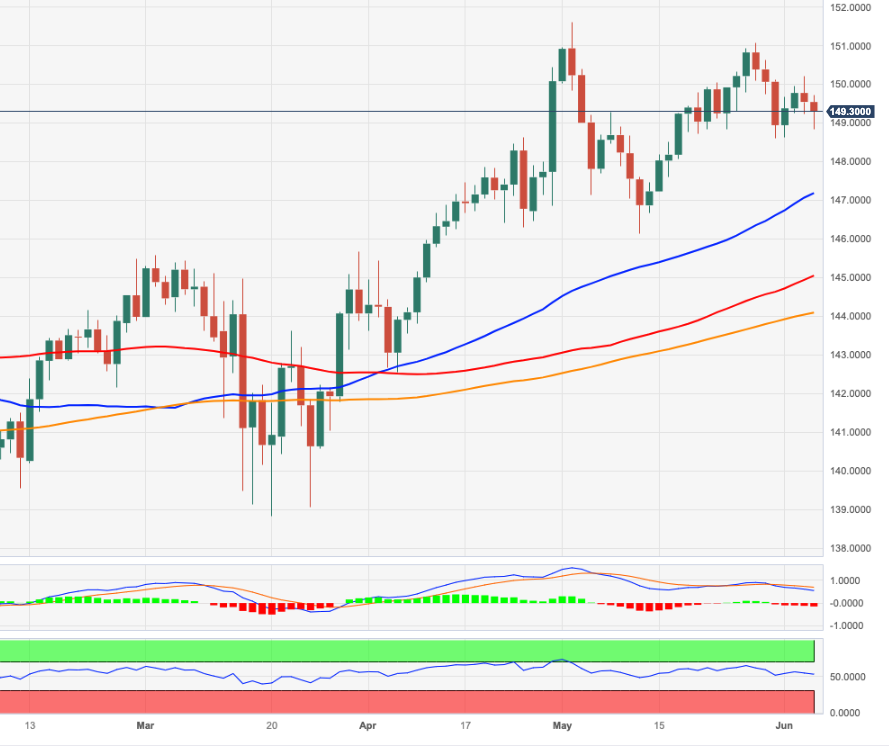
- USD/JPY rose past the 140.00 zone during the New York session.
- The US Dollar cleared daily losses amid rising US bond yields and a cautious market mood.
- Investors await Q1 Gross Domestic Product data from Japan.
The USD/JPY pair rose for a second consecutive day on Wednesday to currently trade around 140.00. On the other hand, as per the DXY index, the USD weakened against most of its rivals earlier but cleared daily losses finding support at 103.66 and recovering above 104.00 on the back of significant increases in the US bond yields. Another surprising rate hike, this time by the Bank of Canada (BoC), increased slightly the hawkish bets on the Fed.
BoC surprise decision fueled hawkish bets on the Fed
Market expectations for the upcoming June 13-14 Federal Reserve (Fed) still favour a no-hike despite the BoC surprise hike on Wednesday boosted prospects of another Fed hike. According to the CME FedWatch Tool, investors are betting on higher odds (64.7%) of the Fed not raising interest rates with expectations of maintaining the target rate at 5.25% but the probabilities of a 25 bps hike jumped to 30%
Against this backdrop, the US bond yields are seeing increases across the curve. The 10-year bond yield rose to 3.78%, while the 2-year yield stands at 4.59% and the 5-year yielding 3.94%, all up on the day, lifting the US Dollar.
On the other hand, the Yen's decline might be limited by speculations of Japanese authorities intervening in the markets to support the domestic currency. For Wednesday’s session, a cautious market mood amid weak Chinese economic data reported during the Asia session weighed on the JPY as it fueled a risk-off market mood.
USD/JPY levels to watch
According to the daily chart, the USD/JPY holds a neutral to bullish outlook for the short term. The Relative Strength Index (RSI) holds resilient above its midline while the Moving Average Convergence Divergence (MACD) fell slightly to the negative zone, but the pair trading above the 20-,100- and 200-day Simple Moving Averages (SMAs) suggests that the overall technical outlook is positive for the pair.
If USD/JPY manages to move higher, the next resistance to watch is at the 140.00 level, followed by the 140.50 zone and the psychological mark at 141.00. On the other hand, the 139.50 zone level is key for USD/JPY to maintain its upside bias. If breached, the pair could see a steeper decline towards the 139.00 psychological level and weekly low and then at the 20-day Simple Moving Average (SMA) at 138.60.
USD/JPY daily chart
- Gold prices decline, hindered by rising US bond yields and the greenback’s resilience; XAU/USD is down 0.50%.
- Gloomy global economic outlook impacts sentiment, with disappointing export data from China and broadened US trade deficit.
- The US dollar gains momentum as the US Dollar Index (DXY) pares earlier losses, adding pressure on gold prices.
Gold price retraces after facing solid resistance at the confluence of technical indicators, as well as weighed by rising US Treasury bond yields and a gloomy global economic outlook, with China’s export falling more than estimates. The XAU/USD is trading at $1952.36, down 0.50%, after hitting a daily high of $1970.15.
Resilient USD and risk aversion adds to XAU’s downward pressure; the US trade deficit widens
XAU/USD is on the defensive, weighed by high US bond yields, with the 10-year benchmark note climbing more than ten bps, at 3.774%. US real yields are heading towards the 1.60% region, a headwind for the yellow metal. China’s data revealed that Exports declined 7.5% YoY in US Dollar terms, below estimates for a 1.8% drop; meanwhile, Imports fell a less-than-forecasts at 4.5% YoY in May, vs. an 8.1% plunge.
The greenback shifted positively, printing gains as shown by the US Dollar Index (DXY). The DXY, which tracks the USD performance against a basket of six currencies, pares its earlier losses, up 0.04%, at 104.078.
Risk aversion is another factor impacting Gold prices as Wall Street tumbles. The trade deficit in the United States broadened, as reported by the Bureau of Economic Analysis (BEA), mainly attributed to A notable dip in exports contributed to this shift, while imports rose sharply. The Balance of Trade came at $-74.6B in April of 2023, vs. March’s $-60.B. Exports declined compared to April, came at $249B vs. $258.2B, while imports rose by $323B above March’s $318.8B.
Gold Price Analysis: XAU/USD Technical Outlook
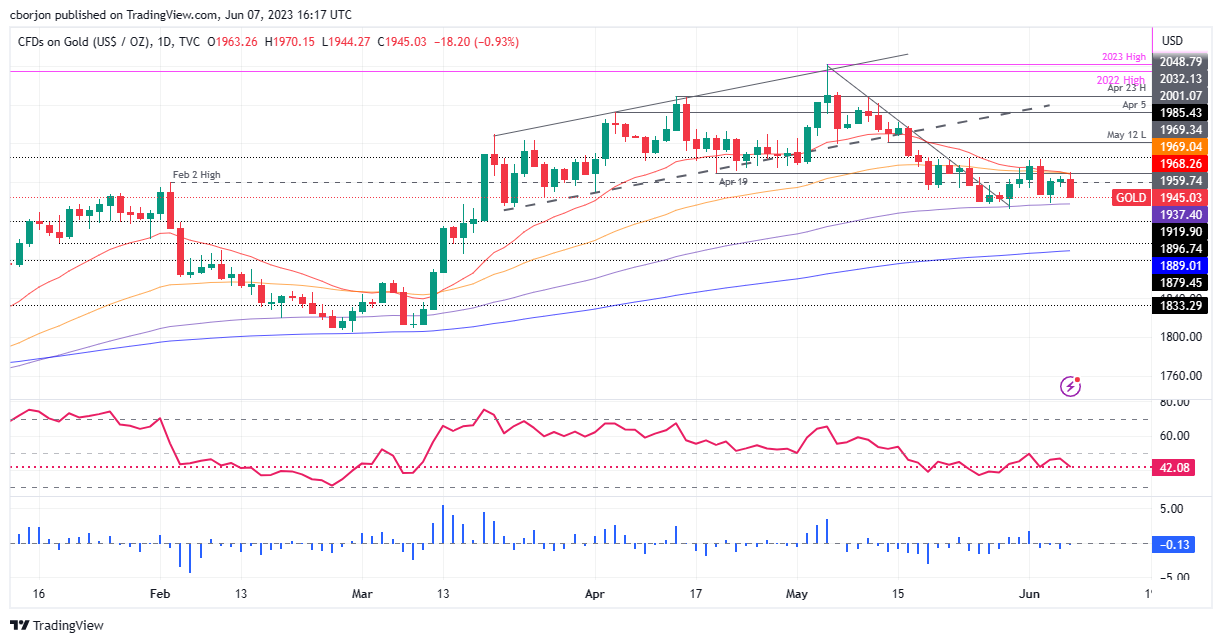
XAU/USD remains consolidated, capped within the boundaries delineated by the 20 and 100-day Exponential Moving Averages (EMAs), each at $1968.35 and $1937.43. The Relative Strength Index (RSI) indicator remains in bearish territory, while the 3-day Rate of Change (RoC) confirms a bearish bias in the near term. Therefore, the XAU/USD first support would be the 100-day EMA, followed by the $1900 figure. A breach of the latter will expose the 200-day EMA at $1889.01. Conversely, if XAU/USD buyers reclaim the confluence of the 20 and 50-day EMA at around $1968-$1970, that would open the door for a rally toward the $2000 mark.
- EUR/USD buoyed by hawkish ECB commentary bounces off 200-day EMA as Fed June rate hike expectations fade.
- The US trade deficit widens significantly to $-74.6B, driven by a decline in exports and a rise in imports.
- Rate hikes by BoC and RBA influence US Treasury bond yields, signaling global central bank response to persistent inflation.
EUR/USD bounces off the 200-day Exponential Moving Average (EMA) and climbs above the 1.0700 handle due to European Central Bank (ECB) official hawkish commentaries boosting the Euro (EUR). Meanwhile, the US Dollar (USD) dives as expectations for Fed’s June rate hike fade. The EUR/USD is trading at around 1.070, a gain of 0.12%.
Euro strengthens against falling USD as G10 central banks scramble amid sticky inflation
Sentiment deteriorated after a brief jump in equities. A sudden slump of the CBOE Volatility Index (VIX), known as the fear index, to 2020 lows shifted investors’ mood, which appeared to book profits, though it remained away from the US Dollar. Before Wall Street opened, the US Bureau of Economic Analysis (BEA) revealed the US deficit widened, as shown by the Balance of Trade to $-74.6B in April of 2023, vs. March $-60.B. Exports declined compared to April, came at $249B vs., $258.2B, while imports rose by $323B above March’s $318.8B.
Lately, US Treasury bond yields, notably the 10-year benchmark note rate, climbed more than ten bps, up to 3.766%, after the Bank of Canada (BoC) lifted rates, following subsequent meetings holding rates unchanged. Therefore, the BoC added its name to the list, led by the Reserve Bank of Australia (RBA), of G10 central banks pausing rates, though had to scramble and increase them, as inflation probes to be stickier than estimated.
In the meantime, hawkish comments by ECB Klas Knot underpin the EUR/USD back above the 1.0700 figure. He noted that the ECB must lift rates in June and July and would become data-dependent. Knot added that peak interest rates “must be maintained for a long time to keep inflation in check.”
Earlier, Governing Council member Isabel Schnabel commented aggressive tightening takes longer than usual to impact the economy, said in an interview published by the ECB.
Datawise, Industrial Production in Germany improved compared to March’s plunge of -3.4%, coming at 0.3% MoM, below estimates of 0.6%. At the same time, France achieved a wider deficit than estimates of €-7.7B, coming at €-9.7B, greater than March €-8.39B, while Italy revealed an improvement in Retail Sales.
EUR/USD Technical Levels
Economists at ANZ Bank analyze Gold (XAU/USD) outlook.
Price dip presents a buying opportunity to build fresh long positions
Strong labour data suggests the Fed needs to tightening monetary policy more to bring inflation into its target range. While this remains a short-term headwind for Gold, other factors are supportive.
The recent price dip presents a buying opportunity to build fresh long positions.
We target $2,100 by the end of 2023.
See – Gold Price Forecast: Prospect of rising rates to weigh on XAU/USD until FOMC meeting – Commerzbank
Economists at MUFG Bank discuss the US Dollar outlook.
Consolidation at these stronger US Dollar levels seems likely
The mixed global growth backdrop remains supportive for the US Dollar at this stage.
Consolidation at these stronger US Dollar levels seems most likely given the probable declining appetite for position-taking ahead of a key week next week with the US Consumer Price Index (CPI) data and the FOMC and European Central Bank (ECB) meetings.
See: Slower growth everywhere ought to help the Yen – SocGen
- Bank of Canada raises policy rate by 25 basis points to 4.75%.
- Loonie jumps across the board following the decision.
- USD/CAD approaching April and May lows.
The USD/CAD plummet toward 1.3300 following the decision of the Bank of Canada (BoC) to raise its key interest rate taking markets off guard. The Loonie is outperforming on the back of the BoC decision.
The BoC raised interest rates by 25 basis points to 4.75%, against market consensus. In its statement, the central bank mentioned increasing concerns about the Consumer Price Index inflation getting “stuck materially above the 2% target”.
The BoC's decision follows an unexpected rate hike from the Reserve Bank of Australia (RBA) on Tuesday and comes ahead of next week’s decisions from the Federal Reserve, the European Central Bank, and the Bank of Japan.
Before the announcement, the USD/CAD was trading around 1.3390, but it quickly dropped to 1.3319, reaching the lowest level since May 8. The bias for the pair is clearly to the downside, moving towards critical medium-term support levels. It is approaching the April and May-June lows at 1.3299 and 1.3314, respectively. The next support area is the January lows around 1.3360.
USD/CAD daily chart
Kit Juckes, Chief Global FX Strategist at Société Générale, analyzes the latest growth data and its implications for the FX market.
The most resilient major economy may be Japan
Monday’s US Services ISM data seem to have flown under the radar. They were very soft but haven’t had a discernible impact on rate pricing or on the Dollar.
I can understand why soft US data currently has less impact on EUR/USD (and indeed many other pairs) than usual – the US may be slowing but the European data are at least as bad and indeed the downturn is pretty general.
The most resilient major economy may be Japan, and that should provide some support for the yen as the market waits for next week’s BoJ meeting.
Economists at Commerzbank analyze the EUR outlook ahead of the decisions of the major central banks next week.
How long the EUR-positive effects will dominate and at which points the EUR-negative arguments will become more important?
We expect the Fed to cut interest rates quite soon (the first ones expect this for around the end of the year), but not so from the ECB. Medium-term the ECB’s monetary policy should therefore be more attractive from the FX market’s point of view.
At the same time, we expect that the ECB’s monetary policy course will be such that (a) a fall in core inflation to levels close to the 2% target cannot be expected longer term and that (b) inflation risks in the Eurozone will not principally disappear, which justifies an inflation and inflation risk premium which could put sustainable pressure on the Euro.
We admit openly: our current projections, which assume that the EUR-positive factors will dominate until the end of the year, is more the result of gut instinct than rational calculation. Please read our EUR projections (1.14 at the end of 2023, 1.08 at the end of 2024) with some caution in this respect!
- GBP/USD gains strong positive traction on Wednesday and snaps a three-day losing streak.
- Bets for an imminent Fed rate-hike pause continue to weigh on the USD and lend support.
- The prospects for further tightening by the BoE boost the GBP and contribute to the move.
The GBP/USD pair catches aggressive bids following an early dip to sub-1.2400 levels and builds on its intraday positive move through the early North American session on Wednesday. Spot prices jump to 1.2470 region, or a fresh weekly high in the last hour, snapping a three-day losing streak and stalling the recent pullback from a nearly three-week high touched last Friday.
The US Dollar (USD) comes under some renewed selling pressure as traders remain uncertain over the Federal Reserve's (Fed) rate-hike path and turns out to be a key factor acting as a tailwind for the GBP/USD pair. Last week's dovish rhetoric by several Fed officials lifted bets for an imminent pause in the US central bank's policy tightening cycle. That said, the recent inflation and labor market data from the US kept alive hopes for a 25 bps lift-off at the June FOMC meeting. This, in turn, leads to a modest recovery in the US Treasury bond yields, albeit fails to impress the USD bulls.
The British Pound, on the other hand, continues to be underpinned by expectations that the Bank of England (BoE) will be far more aggressive in policy tightening to contain stubbornly high inflation. Investors now expect the BoE to raise interest rates again from 4.5% to 4.75% on June 22 and see a roughly 60% chance that rate will peak at 5.5% later this year. The bets were lifted by the official data, which showed that the headline UK CPI fell less than expected in April and a closely watched measure of core price surged to a 31-year high. This is seen as another factor boosting the GBP/USD pair.
Meanwhile, investors now seem to have digested Wednesday's disappointing release of Chinese macro data, which showed that the trade surplus sank to a 13-month low in May and fueled worries about a deeper global economic downturn. This is evident from signs of stability in the equity markets, which could dent the Greenback's safe-haven status and supports prospects for a further intraday appreciating move for the GBP/USD pair. The positive outlook is reinforced by bullish technical indicators on the daily chart, which are still far from being in the overbought territory.
Technical levels to watch
- NZD/USD has turned sideways broadly amid an absence of a potential trigger.
- The US Dollar Index has resumed its downside journey after a less-confident pullback move to near 104.00.
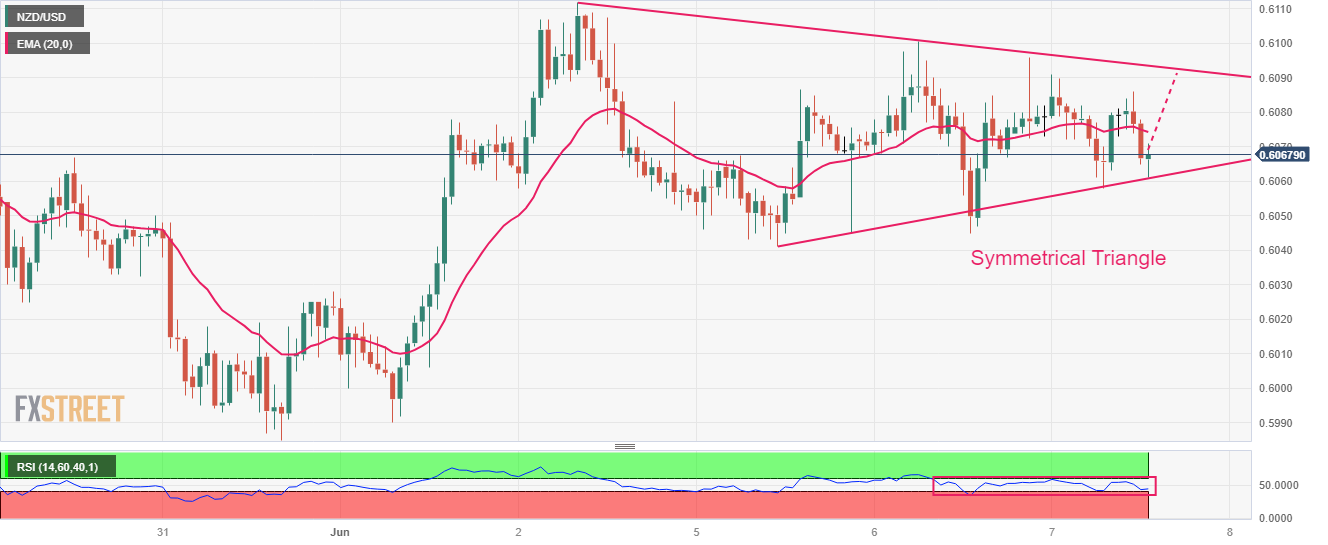
- NZD/USD is auctioning in a Symmetrical Triangle that indicates a contraction in volatility.
The NZD/USD pair is demonstrating topsy-turvy moves in the early New York session. The Kiwi asset is auctioning in a tight range as investors are divided about the Federal Reserve (Fed)’s interest rate policy for June.
While the United States' solid labor market conditions are propelling the continuation of the rate-hiking spell by the Fed, deteriorating economic activities are telling a different story. The US Dollar Index (DXY) has resumed its downside journey after a less-confident pullback move to near 104.00.
The risk-on market mood has improved the appeal of the risk-perceived assets.
NZD/USD is auctioning in a Symmetrical Triangle chart pattern that indicates a contraction in volatility, which is followed by wider ticks and heavy volume after an explosion. The upward-sloping trendline of the aforementioned chart pattern is plotted from June 05 low at 0.6041 while the downward-sloping trendline is placed from June 02 high at 0.6112.
The 20-period Exponential Moving Average (EMA) at 0.6075 seems sticky to the asset, indicating a sideways performance.
Also, the Relative Strength Index (RSI) (14) has been confined into the 40.00-60.00 range, which signals that investors are awaiting a fresh trigger for a decisive move.
A confident break above May 25 high at 0.6110 will drive the Kiwi asset toward May 01 low at 0.6160 followed by the round-level resistance at 0.6200.
Alternatively, a downside move below the intraday low at 0.6015 will expose the asset for a fresh six-month low toward 11 November 2022 low at 0.5984. A slippage below the latter would expose the asset toward 02 November 2022 high at 0.5941.
NZD/USD hourly chart
- USD/TRY clinches fresh all-time highs past 23.00.
- Türkiye lenders appear to have halted their support for the lira.
- Investors home and abroad remain skeptical of the move so far.
The Turkish currency remains in free-fall, which motivates USD/TRY to advance to new record highs north of the 23.0000 hurdle on Wednesday.
USD/TRY looks at the government for clues
USD/TRY maintains the upside bias well in place on Wednesday as investors continue to assess the recent win by President Erdogan at the May 28 elections and the subsequent appointment of market-friendly finance minister M. Simsek.
In the meantime, Wednesday’s collapse of the lira seems to be attributed to state lenders discontinuing their sale of dollars to support the currency, indicating a shift in the new economic administration's approach. This change suggests a departure from expensive interventions and a move towards adopting more conventional economic policies.
So far, the Turkish currency has already depreciated around 24% since the start of the new year, while the drop has reached nearly 170% since the Turkish central bank (CBRT) embarked on its easing cycle in August 2021.
What to look for around TRY
USD/TRY maintains its upside bias well in place, always underpinned by the relentless meltdown of the Turkish currency.
In the meantime, investors are expected to closely monitor upcoming decisions on monetary policy, particularly after President R. T. Erdogan named former economy chief M. Simsek as the new finance minister following the cabinet reshuffle in the wake of the May 28 second round of general elections.
The appointment of Simsek has been welcomed with optimism by market members in spite of the fact that it is not yet clear whether his orthodox stance on monetary policy can survive within Erdogan’s inclination to battle inflation via lower interest rates.
In a more macro scenario, price action around the Turkish lira is supposed to continue to spin around the performance of energy and commodity prices - which are directly correlated to developments from the war in Ukraine, broad risk appetite trends, and dollar dynamics.
Key events in Türkiye this week: Industrial Production (Friday).
Eminent issues on the back boiler: Persistent skepticism over the CBRT credibility/independence. Absence of structural reforms. Bouts of geopolitical concerns.
USD/TRY key levels
So far, the pair is gaining 7.49% at 23.0676 and faces the next hurdle at 23.1582 (all-time high June 7) followed by 24.00 (round level). On the downside, a break below 19.6547 (55-day SMA) would expose 19.2926 (100-day SMA) and finally 18.9152 (200-day SMA).
Economists at Société Générale analyze USD/CAD technical outlook.
Short-term bounce is expected
USD/CAD has evolved within a range-bound consolidation since last October; a clear trend has been lacking as highlighted by crisscross moves around the 50-DMA.
The pair is now approaching the lower limit of its range near 1.3300/1.3220 which is a crucial support. Defence of this zone is essential to avert a deeper down move.
A short-term bounce is expected; April/May high of 1.3670 is likely to be an important hurdle.
- The oil price is marching towards $73.00 as hawkish Fed bets have slimmed vigorously.
- Weak China’s Trade Balance data failed to restrict the upside in the oil price.
- The discussions between US Blinken and Saudi Arabia’s Price, and US EIA inventory data will remain in focus.
West Texas Intermediate (WTI), futures on NYMEX, are looking to extend their recovery towards the crucial resistance of $73.00 in the early American session. The oil price showed a solid recovery amid a sell-off in the US Dollar Index (DXY) and deepening hopes of a steady interest rate policy announcement by the Federal Reserve (Fed).
In the Asian session, oil bears were heated after the release of weak China’s Trade Balance (May) data. In US Dollar terms, Trade Balance data dropped sharply to $65.81B vs. the estimates of $92B and the former release of $90.21B. Exports were sharply contracted by 7.5% while the street was estimated a marginal contraction of 0.4%.
The likes for Chinese products are getting wane and buyers are shifting to other countries for outsourced manufacturing. It is worth noting that China is the largest importer of oil in the world and weak economic prospects in China mean a filthy demand for oil.
The US Dollar Index (DXY) has sensed selling pressure after a minor pullback move to near 104.00. Rising bets for a neutral interest rate policy by the Fed are weighing significant pressure on the USD Index. Meanwhile, the US Goods and Trade Balance deficit has grown to $74.6B, lower than the estimates of $75.2B.
Going forward, oil inventory data for the week ending June 02, reported by the United States Energy Information Administration (EIA) will be keenly watched. Apart from that, investors will keep focusing on the discussions between US Secretary of State Antony Blinken and Saudi Arabia’s Price Mohammed bin Salman Al Saud.
- USD/JPY attracts some dip-buying and recovers a major part of its modest intraday losses.
- Rebounding US bond yields acts as a tailwind for the USD and lends support to the major.
- Economic woes, intervention fears could benefit the JPY and cap any meaningful upside.
The USD/JPY pair edges lower on Wednesday, albeit lacks any follow-through selling and remains confined in the previous day's broader trading range. Spot prices manage to recover a major part of the intraday losses back closer to the weekly low set on Tuesday and hover just above mid-139.00s, nearly unchanged for the day during the early North American session.
A combination of factors provides a modest lift to the Japanese Yen (JPY), which, in turn, prompts some intraday selling around the USD/JPY pair. Disappointing Chinese data, showing that trade surplus sank to a 13-month low in May led by a surprise slump in exports on the back of weaker overseas demand for Chinese goods, weighs on investors' sentiment. This is evident from the cautious mood around the equity markets and benefits traditional safe-haven assets, including the JPY.
Apart from this, speculations for more sizeable interventions by the Bank of Japan (BoJ) to support the domestic currency further underpin the JPY. This, along with the emergence of fresh US Dollar (USD) selling, contributes to the offered tone surrounding the USD/JPY pair. That said, the downside for the USD remains limited amid the uncertainty over the Federal Reserve's (Fed) rate-hike path, which is holding back traders from placing aggressive near-term directional bets.
Last week's dovish rhetoric by several Fed officials lifted bets for an imminent pause in the US central bank's policy tightening cycle.
That said, the recent inflation and labor market data from the US kept alive hopes for a 25 bps lift-off at the June
FOMC meeting. This, in turn, acts as a tailwind for the US Treasury bond yields, which seems to offer some support to the Greenback and assist the USD/JPY pair to attract some dip-buying ahead of the 139.00 round-figure mark.
There isn't any relevant market-moving economic data due for release from the US on Wednesday, leaving the USD at the mercy of the USD price dynamics. Apart from this, the broader risk sentiment will drive demand for the safe-haven JPY and provide some impetus to the USD/JPY pair. The range-bound price action witnessed since the beginning of the current week, meanwhile, warrants some caution before positioning for the next leg of a directional move.
Technical levels to watch
- AUD/USD is facing barricades in extending its rally above 0.6700, however, the upside bias is still solid.
- Offers for the USD Index soared dramatically as investors are anticipating a pause in the policy-tightening spell by the Fed.
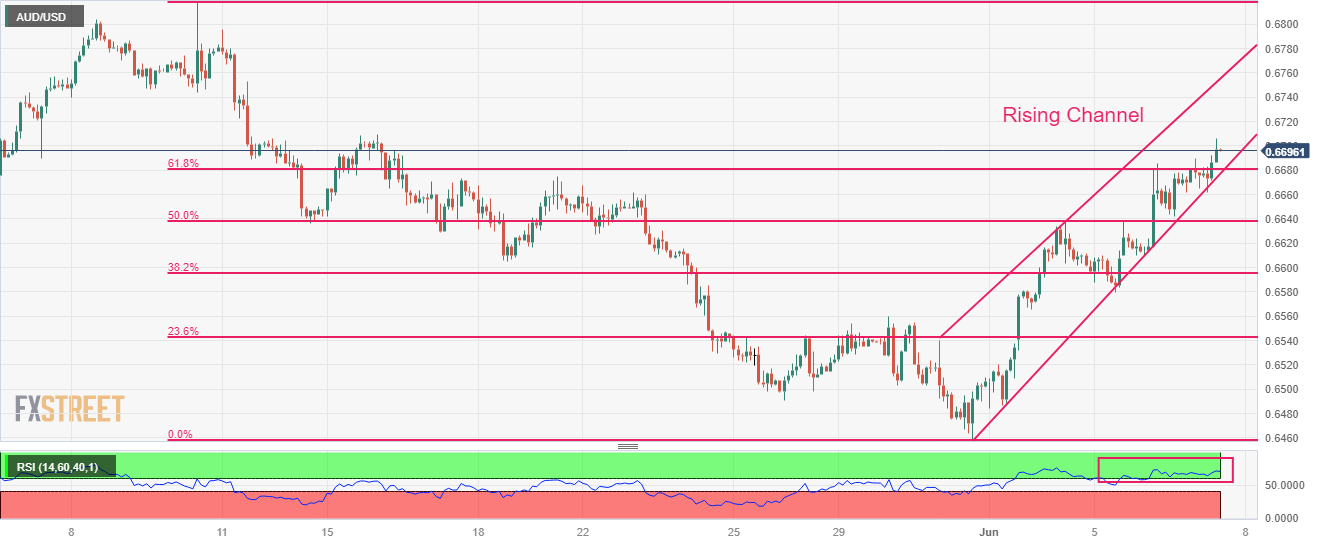
- AUD/USD is auctioning in a Rising Channel in which each corrective move is considered a buying opportunity.
The AUD/USD pair is struggling in stretching its rally above the round-level resistance of 0.6700 in the early New York session. The Aussie asset is expected to climb above the aforementioned resistance confidently as the Reserve Bank of Australia (RBA) has opened room for further interest rate hikes to arrest stubborn Australian inflation.
S&P500 futures have added decent gains ahead of United States opening, portraying an upbeat market mood. The US Dollar Index (DXY) displayed a perpendicular fall after failing to recapture the previous day’s high at 104.30. Offers for the USD Index soared dramatically as investors are anticipating a pause in the policy-tightening spell by the Federal Reserve (Fed).
As per the CME Fedwatch tool, the chances of a neutral interest rate policy have jumped above 77%.
AUD/USD is auctioning in a Rising Channel on a two-hour scale in which each corrective move is considered as a buying opportunity by the market participants. The Aussie asset has comfortably shifted above the 61.8% Fibonacci retracement (plotted from May 10 high at 0.6818 to May 31 low at 0.6458) at 0.6682.
The Relative Strength Index (RSI) is oscillating in the bullish range of 60.00-80.00, indicating more upside ahead.
Should the Aussie asset confidently breaks above the round-level resistance of 0.6700, the Australian Dollar bulls will drive the asset toward April 18 high at 0.6748 followed by May 10 high at 0.6818.
On the flip side, if the Aussie asset breaks below June 01 low at 0.6484, US Dollar bulls would drag the asset to 01 November 2022 high around 0.6464 followed by the round-level support at 0.6400.
AUD/USD two-hour chart
- US Goods and Services Trade Balance came in at -$74.6 billion in April.
- US Dollar Index stays in the daily range below 104.00.
The United States international trade deficit in goods and services rose by $14 billion to $74.6 billion in April, the data published jointly by the US Census Bureau and the US Bureau of Economic Analysis revealed on Wednesday. This reading came in slightly below than the market expectation for a deficit of $75.2 billion.
Key takeaways from the report:
April exports were $249.0 billion, $9.2 billion less than March exports. April imports were $323.6 billion, $4.8 billion more than March imports.
The April increase in the goods and services deficit reflected an increase in the goods deficit of $14.5 billion to $96.1 billion and an increase in the services surplus of $0.6 billion to $21.6 billion.
Year-to-date, the goods and services deficit decreased $86.5 billion, or 23.9 percent, from the same period in 2022. Exports increased $55.9 billion or 5.8 percent. Imports decreased $30.6 billion or 2.3 percent.
Exports of goods decreased $9.4 billion to $167.1 billion in April.
Exports of services increased $0.2 billion to $81.9 billion in April.
Imports of goods increased $5.2 billion to $263.2 billion in April.
Considering figures for the first quarter, the biggest surpluses in trade were with South and Central America ($19.6), Netherlands ($13.5) and Australia ($8.2). The biggest deficits were recorded with China ($65.3), Mexico ($38.7), European Union ($35.0), Vietnam ($23.7), Germany ($22.5) and Japan ($16.6).
Market reaction:
The data was ignored by market participants. The US Dollar is trading in negative territory on Wednesday as the attention is set on next week’s inflation data and FOMC meeting. The DXY is falling 0.15% on the day, trading slightly below 104.00.
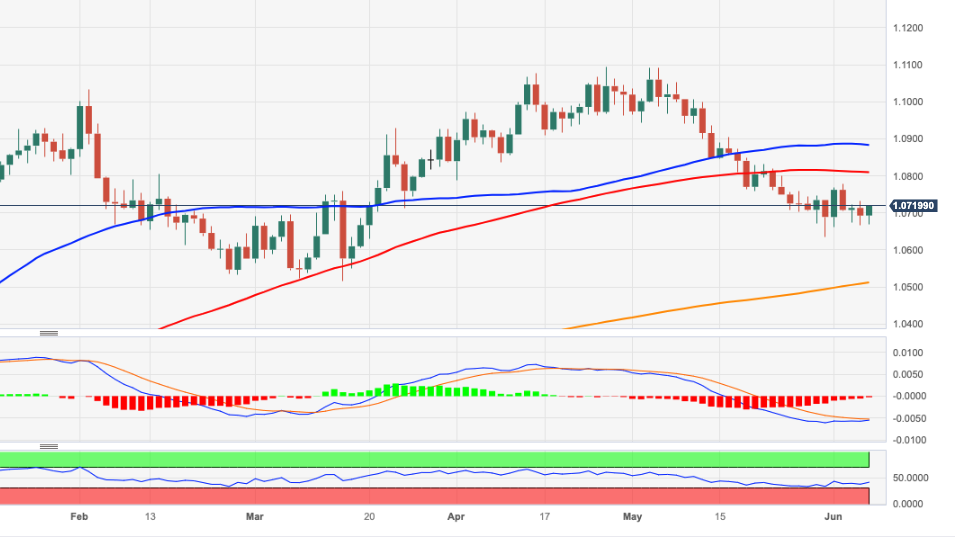
- EUR/USD leaves behind Tuesday’s pullback and retakes 1.0700
- The selling bias still dominates the sentiment around the pair.
EUR/USD regains upside traction and moves beyond the key barrier at 1.0700 the figure on Wednesday.
The pair remains well under pressure despite the bullish move and the continuation of the selling bias should prompt a probable test of the May low at 1.0635 (May 31) to emerge on the horizon in the short term. If spot clears the 1.0600 support it could then open the door to a deeper decline to the March low at 1.0516 (March 15).
A deeper pullback to the 2023 low at 1.0481 (January 6) would likely need a sharp deterioration of the outlook, which appears not favoured for the time being.
Looking at the longer run, the constructive view remains unchanged while above the 200-day SMA, today at 1.0510.
EUR/USD daily chart
CAD is firmer ahead of the Bank of Canada (BoC) Interest Rate Decision. Economists at Scotiabank expect a hike to propel the Loonie.
Narrower spreads suggest CAD upside risk
We expect a 25 bps hike in the Overnight Target rate from the current 4.50%.
A somewhat hawkish hike (the policy statement is unlikely to shut the door definitively on more tightening) should put the CAD on course for the mid/low 1.33s at least.
Narrower, short-term US/Canada cash bond spreads already suggest some unrealized downside potential in USD/CAD which tighter BoC policy today may help achieve.
See – BoC Preview: Forecasts from six major banks, rates unchanged but hawkish bias
European Central Bank (ECB) governing council member Gabriel Makhlouf said on Wednesday that key rates are likely to stay there once they reach the "top of the ladder of increasing interest rates," per Reuters.
"Again I'm not going to say how long that will be, but I know some people in markets are pricing in cuts in rates at the end of the year and I'd be interested in how they are coming to those judgements," Makhlouf further added. Regarding the rate outlook, he explained that it would be a "question of judgement" whether they will need to continue with rate hikes after summer.
Market reaction
EUR/USD clings to modest daily gains above 1.0700 following these comments.
EUR/USD is firmer as steady support in upper 1.06s develops. Economists at Scotiabank analyze the pair’s outlook.
Gains through 1.07 have triggered a minor double-bottom signal
ECB policy hawks continue to stress the ‘more ground to cover’ on interest rate messaging (Knot, Schnabel), keeping market expectations high for hikes next week and Jul.
The EUR has found solid support on weakness to the 1.0670 zone over the past few days.
Solid intraday price gains through 1.07 have triggered a minor double-bottom signal which should see gains extend to the 1.0730 area, with a push through here signaling scope for an additional 60 pips or so of strength.
- Gold price has recovered from a minor fall to near $1,956.00 but has turned choppy again.
- The Fed is more likely to leave rates unchanged, rather than cut them any time soon.
- Gold price is showing signs of sheer volatility contraction as the US economic calendar has nothing much to offer.
Gold price (XAU/USD) has returned inside the woods after an attempt at a downside break in the late European session. The precious metal recovered after dropping to near $1,956.00 but has turned choppy again amid an absence of potential triggers.
The recovery move in the Gold price was supported by the vertical sell-off in the US Dollar Index (DXY). The USD Index has slipped below 103.90 as expectations for a raise in interest rates by the Federal Reserve (Fed) have receded. While monetary policies of other central banks belonging to the G7 cartel are far from any sort of a pause amid persistence in inflation in their respective countries.
Analysts at Rabobank cited that given the Fed is more likely to leave rates unchanged, rather than cut them any time soon, the U.S. dollar is likely to boast a natural edge over other currencies for now.
Meanwhile, S&P500 futures have recovered their losses and have turned positive amid rising hopes that Fed chair Jerome Powell will keep interest rates steady. Also, Fed Powell cited last that more interest rate hikes are less appropriate as tight credit conditions are doing the job effectively. The risk appetite of the market participants has improved, which has increased the appeal for risk-perceived assets.
Gold technical analysis
Gold price is showing signs of sheer volatility contraction as the US economic calendar has nothing much to offer. Investors should note that a squeeze in volatility is followed by an expansion in the same, which results in wider ticks and heavy volume.
On a broader note, Gold price is consolidating in a range of $1,932-1,985 for the past three weeks on a four-hour. Horizontal support is plotted from March 15 high at $1,937.39. The magical 200-period Exponential Moving Average (EMA) at $1,975.47 is acting as a strong barrier for the Gold bulls.
An oscillation in the 40.00-60.00 territory by the Relative Strength Index (RSI) (14) indicates a non-directional performance.
Gold four-hour chart
Economists at TD Securities discuss the Bank of Canada (BoC) Interest Rate Decision and its implications for the USD/CAD pair.
Dovish (40%)
Rates unchanged. Bank holds overnight rate at 4.50% as it seeks more evidence that outlook has shifted materially. Statement acknowledges Q1 GDP and labour market strength but also points to weaker survey data, still-anchored inflation expectations, and states that growth is expected to slow to justify pause. Bank maintains forward guidance, leaving hikes on the table if outlook continues to strengthen. USD/CAD +0.40%.
Base-Case (60%)
25 bps hike. Bank steps off the sidelines with hike to 4.75% after accumulation of upside data surprises. Statement has a hawkish tone, cites resilient economic conditions, sticky core inflation pressures, and subsiding US banking risks. Economy remains in excess demand and further tightening still on the table if required. USD/CAD -0.60%.
GBP/USD tracks other majors higher. Economists at Scotiabank analyze the pair’s technical outlook.
Good demand on GBP dips has developed so far this week
Good demand on GBP dips has developed so far this week, putting some positive work in on the daily chart – implying a short-term low may be in at least at Monday’s low.
Cable gains through 1.2470 (40-Day Moving Average) will add to the positive tone in the short run at least and put a return to the mid-1.25s on the radar.
Economists at Commerzbank assess BRL outlook ahead of Brazilian inflation figures.
Political factors pose greater risk to BRL than inflation for now
The June meeting of the National Monetary Council, which will review the inflation target and set a new one for 2026, is more important for the Real exchange rate than today's inflation figures.
Possible attempts by the government to influence the hawkish monetary policy in a more dovish direction via the inflation target or the appointment of new BCB directors, also due in June, remain the biggest risks for the BRL. However, we will only know whether and to what extent such concerns are justified at the first interest rate decision after the National Monetary Council meeting and with the participation of the new directors, probably in August.
See – USD/BRL: Decline to extend on failure to defend 4.89 – SocGen
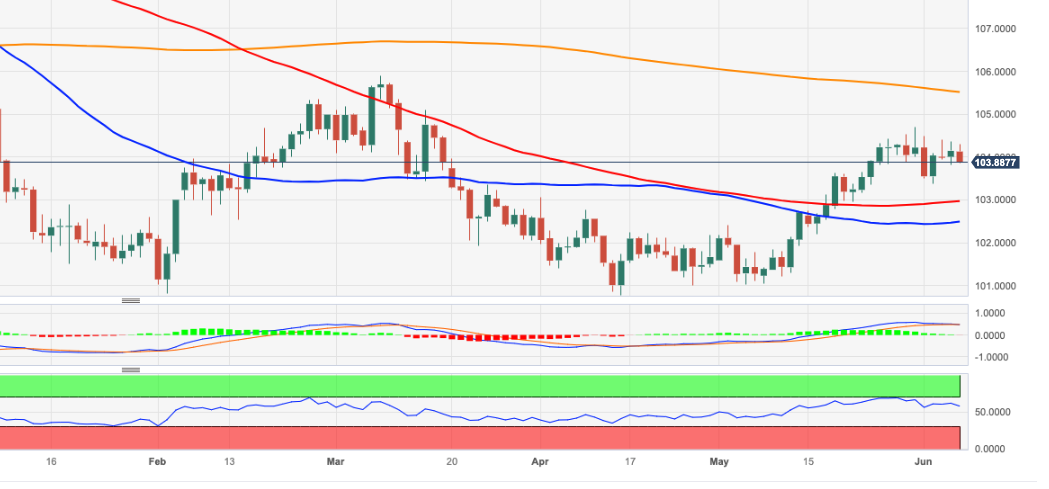
- DXY fades Tuesday’s uptick and returns to the sub-104.00 region
- Further choppiness seems probable in the near term .
DXY leaves behind Tuesday’s decent gains and resumes the downside below the key 104.00 support on Wednesday.
Considering the ongoing price action, the index could now move into a consolidative phase in light of the current lack of strong catalysts. On the downside, the June low of 103.38 (June 2) emerges as the immediate contention, while the next up-barrier is seen at the May peak of 104.79 (May 31).
Looking at the broader picture, while below the 200-day SMA at 105.51 the outlook for the index is expected to remain negative.
DXY daily chart
- EUR/JPY trades in an inconclusive fashion above 149.00
- Further consolidation appears likely for the time being.
EUR/JPY keeps the trade below the 150.00 region so far on Wednesday.
In case bulls regain the initiative, there is an immediate hurdle at the so far monthly high at 150.19 (June 5). The convincing surpass of this level could put the weekly top at 151.07 (May 29) back on the radar prior to the 2023 peak at 151.61 (May 2).
So far, further upside looks favoured while the cross trades above the 200-day SMA, today at 144.10.
EUR/JPY daily chart
- USD/CAD turns lower for the second straight day and drops to a nearly four-week low.
- A goodish intraday pickup in Oil prices underpins the Loonie and exerts some pressure.
- The emergence of fresh USD selling contributes to the slide ahead of the BoC decision.
The USD/CAD pair attracts fresh sellers following an intraday uptick to the 1.3425 area and turns lower for the second straight day on Wednesday. The downward trajectory extends through the first half of the European session and drags spot prices to a nearly four-week low, around the 1.3380 region in the last hour.
A goodish pickup in Crude Oil prices underpins the commodity-linked Loonie, which, along with the emergence of fresh selling around the US Dollar (USD), exerts downward pressure on the USD/CAD pair. the recent inflation and labour market data from the US kept alive hopes for a 25 bps lift-off at the June FOMC meeting. That said, last week's dovish rhetoric by several Fed officials lifted bets for an imminent pause in the US central bank's policy tightening cycle. This leads to a further decline in the US Treasury bond yields and keeps the USD bulls on the defensive.
The upside for Oil prices, meanwhile, seems limited in the wake of worries that a global economic slowdown will dent fuel demand. The concerns resurfaced following the release of weaker Chinese data, which showed that the trade surplus sank to a 13-month low in May on the back of a surprise slump in exports. This, in turn, suggests that overseas demand for Chinese goods remained weak and poses additional headwinds for the world's second-largest economy. This overshadows additional supply cuts by Saudi Arabia/OPEC and could cap the black liquid.
Traders might also refrain from placing aggressive bets and prefer to wait on the sidelines ahead of the Bank of Canada (BoC) policy decision, due to be announced later during the North American session. The stronger-than-expected employment details and a slight pick-up in price pressures might have raised the possibility of another unanticipated hike by the BoC. Nevertheless, the latest monetary policy update, along with Oil price dynamics, should influence the Canadian Dollar (CAD) and produce short-term trading opportunities around the USD/CAD pair.
Technical levels to watch
EUR is losing more steam. Economists at Credit Suisse analyze the shared currency outlook.
Only 70 bps of rate cuts are priced for the ECB from Sep ’23 to Sep ’24
Softer inflation data are causing EUR to lose upward momentum.
The fact that only 70 bps of rate cuts are priced for the ECB from Sep ’23 to Sep ’24 stands in sharp contrast with the more aggressive rate cut pace priced into the US curve.
EUR is left as a relative G10 low yielder that is now losing the upward rate momentum that was so instrumental to its strength over the past 8 months, but without the cushion of dramatic 2024 cuts having already been priced in. This in our view leaves open the door for EUR/USD to test 1.0500 near term.
The Canadian Dollar has been the best G10-performing currency in the past month. Economists at ING analyze CAD outlook ahead of the Bank of Canada meeting.
A hawkish hold from the BoC
We favour a hawkish hold, signalling that if there isn’t clearer evidence of softening in price pressures it could raise rates again in July.
A hawkish tone by the Bank of Canada at the June meeting is clearly an important element to keep the bullish narrative for CAD alive.
As long as the BoC does not push back against the pricing for a hike in the summer, we expect CAD to remain supported.
Some lingering USD strength in June can put a floor around 1.33/1.34 in USD/CAD, but we expect a decisive move to 1.30 in the third quarter and below then level before the end of the year.
See – BoC Preview: Forecasts from six major banks, rates unchanged but hawkish bias
- US Dollar holds steady against its major rivals this-week.
- US Dollar Index fluctuates in a narrow channel near 104.00 for the third straight day.
- US inflation report and Fed's policy meeting next week could ramp up US Dollar's volatility.
The US Dollar (USD) stays relatively stable on Wednesday as investors refrain from committing to large positions ahead of next week's highly-anticipated data releases and central bank policy announcements. The US Dollar Index, which gauges the USD's valuation against a basket of six major currencies, fluctuate in a tight channel near 104.00 for the third straight day.
May Consumer Price Index (CPI) data from the United States (US) will be watched closely by market participants on Tuesday before the Federal Reserve (Fed) announces the interest rate decision on Wednesday. The Fed will also publish the revised Summary of Projections, the so-called dot plot.
Daily digest market movers: US Dollar struggles to find direction
- In its latest outlook published on Wednesday, the OECD said that it sees the Fed funds rate peaking at 5.25%-5.5% from Q2 2023, followed by two "modest" cuts in the second half of 2024.
- The US Census Bureau will publish April Goods Trade Balance later in the day. The US economic docket will also feature Consumer Credit Change.
- The monthly data published by the ISM showed on Monday that the business activity in the US service sector continued to expand in May, albeit at a softer pace than it did in April. The ISM Services PMI declined to 50.3 in May from 51.9 in April and missed the market expectation of 51.5.
- Further details of the ISM PMI report revealed that the Prices Paid Index edged lower to 56.2 from 59.6 and the Employment Index dropped to 49.2 from 50.8.
- US stock index futures trade flat in the European session. On Tuesday, Wall Street's main indexes closed virtually unchanged, reflecting the cautious market mood.
- Commenting on the data, "there has been a pullback in the rate of growth for the services sector," noted Anthony Nieves, Chair of the Institute for Supply Management (ISM) Services Business Survey Committee. "This is due mostly to the decrease in employment and continued improvements in delivery times (resulting in a decrease in the Supplier Deliveries Index) and capacity, which are in many ways a product of sluggish demand."
- The US Census Bureau announced on Monday that Factory Orders rose 0.4% in April following the 0.9% increase recorded in March.
- According to the CME Group FedWatch Tool, markets are pricing in a more than 70% probability of the Fed leaving its policy rate unchanged at the upcoming meeting.
- The monthly data published by the US Bureau of Labor Statistics (BLS) showed on Friday that Nonfarm Payrolls rose 339,000 in May. This reading surpassed the market expectation of 190,000 by a wide margin. April's reading of 253,000 also got revised higher to 294,000.
- Underlying details of the labor market report revealed that the Unemployment Rate climbed to 3.7% from 3.4% in the same period. The Labor Force Participation rate remained unchanged at 62.6%, while annual wage inflation, as measured by the change in Average Hourly Earnings, edged lower to 4.3% from 4.4%.
- "There's likely enough pockets of softness in this report for the FOMC to pass on raising rates at the next meeting, though another strong payrolls gain in June, coupled with another disappointing inflation report, could set the stage for a rate increase in July," economists at the Bank of Montreal said regarding the potential impact of the labor data on the Fed's policy outlook.
Technical analysis: US Dollar Index trades near key technical level
The US Dollar Index (DXY) trades at around 104.00, where the Fibonacci 23.6% retracement of the November-February downtrend is located. In the meantime, the Relative Strength Index (RSI) indicator on the daily chart stays comfortably above 50, suggesting that buyers look to remain in the driver's seat.
104.50 (static level) aligns as first resistance for DXY ahead of 105.00 (psychological level). A daily close above the latter could bring in additional buyers and open the door for an extended rebound toward 105.60 (Fibonacci 38.2% retracement, 200-day Simple Moving Average (SMA)).
On the downside, bearish pressure could increase if DXY closes the day below 104.00. In that scenario, 103.50 (static level) could be seen as initial support before 103.00 (100-day SMA).
How does Fed’s policy impact US Dollar?
The US Federal Reserve (Fed) has two mandates: maximum employment and price stability. The Fed uses interest rates as the primary tool to reach its goals but has to find the right balance. If the Fed is concerned about inflation, it tightens its policy by raising the interest rate to increase the cost of borrowing and encourage saving. In that scenario, the US Dollar (USD) is likely to gain value due to decreasing money supply. On the other hand, the Fed could decide to loosen its policy via rate cuts if it’s concerned about a rising unemployment rate due to a slowdown in economic activity. Lower interest rates are likely to lead to a growth in investment and allow companies to hire more people. In that case, the USD is expected to lose value.
The Fed also uses quantitative tightening (QT) or quantitative easing (QE) to adjust the size of its balance sheet and steer the economy in the desired direction. QE refers to the Fed buying assets, such as government bonds, in the open market to spur growth and QT is exactly the opposite. QE is widely seen as a USD-negative central bank policy action and vice versa.
Economists at Société Générale analyze USD/BRL technical outlook.
Downward momentum is still prevalent
USD/BRL downtrend has tentatively paused after forming interim low near the 4.89 mark, however, it has struggled to reclaim the 200-Day Moving Average (DMA) near 5.17/5.20. This denotes the downward momentum is still prevalent.
In case the pair fails to defend the 4.89 point, the phase of decline is expected to extend.
Next potential objectives are located at projections of 4.80/4.75 which is also the 76.4% retracement from April 2022.
- EUR/USD has demonstrated a V-shape recovery post a sell-off in the USD Index.
- Eurozone’s economic turmoil is attracting downgrades from credit rating agencies.
- ECB Schnabel cited the impact of our tighter monetary policy on inflation is expected to peak in 2024.
The EUR/USD pair has shown a V-shape recovery move after finding a cushion at 1.0670 in the European session. The major currency pair has rebounded above 1.0700 amid a sheer sell-off in the US Dollar Index (DXY). The upside in the USD Index seems capped as investors are not confident about one more interest rate hike announcement from the Federal Reserve (Fed).
S&P500 futures are holding nominal losses in London. US equities witnessed decent buying interest on Tuesday. It seems that investors are turning cautious, however, the overall market mood is cheerful.
Considering the strength in the downside move shown by the US Dollar Index (DXY), the 104.00 support could be broken. As per the CME Fedwatch tool, more than 73% chances are in favor of a pause announcement by the Fed for June policy.
The reason behind the higher odds for an unchanged interest rate policy is the poor economic prospects of the United States economy. US factory activity has registered seven straight monthly contractions and the service sector is managing to defend the contraction phase with lots of difficulties. Therefore, expectations of a bleak economic outlook could be dried by pausing the policy-tightening spell for a while.
In the Eurozone, economic turmoil is attracting downgrades from credit rating agencies. The largest economy of Eurozone- Germany is going through a recession amid contracting Gross Domestic Product (GDP) figures for the last two quarterly amid poor factory activity. A situation of weak activities in times of high inflation is painting a rosy picture for the shared continent.
About inflation guidance, European Central Bank (ECB) Governing Council member Isabelle Schnabel said, “The impact of our tighter monetary policy on inflation is expected to peak in 2024.” In the meantime, more interest rate hikes are expected from ECB President Christine Lagarde.
- GBP/JPY reverses an intraday dip on Wednesday and seems poised to appreciate further.
- A softer risk tone, intervention fears underpin the JPY and prompt some intraday selling.
- Bets for more BoE rate hikes continue to benefit the GBP and lend support to the cross.
The GBP/JPY cross drops to a one-and-half-week low during the early European session on Wednesday, albeit attracts fresh buying near the 172.65 area for the second successive day. Spot prices recover a major part of the intraday losses and currently trade just below mid-173.00s, nearly unchanged for the day.
A combination of factors provides a modest lift to the Japanese Yen (JPY), which, in turn, prompts some intraday selling around the GBP/JPY cross. The prospect of Japanese authorities intervening in the markets continues to underpin the JPY, which draws additional support from a generally weaker tone around the equity markets. The global risk sentiment takes a hit in reaction to weaker Chinese data, showing that the trade surplus sank to a 13-month low in May in the wake of a surprise slump in exports and suggesting that overseas demand for Chinese goods remained weak. This poses additional headwinds for the world's second-largest economy and tempers investors’ appetite for perceived riskier assets.
The downside for the GBP/JPY cross, however, remains cushioned on the back of firming expectations that the Bank of England (BoE) will be far more aggressive in policy tightening to contain stubbornly high inflation. In fact, investors expect the UK central bank to raise interest rates again from 4.5% to 4.75% on June 22 and see a roughly 60% chance that rate will peak at 5.5% later this year. The bets were lifted by the official data, which showed that the headline UK CPI fell less than expected in April and a closely watched measure of core price surged to a 31-year high. This, in turn, favours bullish traders and supports prospects for an extension of the GBP/JPY pair's multi-week-old upward trajectory.
Technical levels to watch
USD/CAD is tracking short rates, which suggests we will get a reaction to the Bank of Canada (BoC) meeting today, Kit Juckes, Chief Global FX Strategist at Société Générale, reports.
BoC can afford a pause
USD/CAD used to track long-term rate differentials more closely than short-term ones, but like several other currency pairs, the degree of global uncertainty has shorted the market’s perspective.
With lower inflation than the US, and helpful labour supply growth, the BoC can afford a pause, but a clear indication that peak rates haven’t been reached is surely needed to get USD/CAD any lower than this.
See – BoC Preview: Forecasts from six major banks, rates unchanged but hawkish bias
Economists at Credit Suisse analyze USD/INR outlook ahead of the Reserve Bank of India (RBI) meeting.
RBI will intervene to enforce an 81.00-83.00 USD/INR trading range
We still think RBI intervention is the main driver for the USD/INR exchange rate. The RBI has intervened at 81.00 and 83.00 since October 2022. The decision to hike or hold on 8 Jun is unlikely to shift these RBI intervention levels. We, therefore, reiterate our USD/INR forecast range of 81.00- 83.00.
We prefer to fade USD/INR rallies near 82.70, and think the pair will trade back towards the mid-point of the trading range.
Economists at ING analyze the implications of a Bank of Canada (BoC) hike for the broader market and the Dollar.
Hawkish hold by the BoC
We think markets will watch the BoC decision with great interest today. Following the Reserve Bank of Australia rate hike yesterday, another hawkish surprise from a developed central bank in the run-up to the FOMC meeting could cause the revamp of some hawkish speculation, especially considering Canada’s economic affinity with the US.
Given the lack of other market-moving events today, a BoC hike could end up supporting the USD too. But we expect a hawkish hold – in which case the spill-over into the Dollar may not be very material given that should be insufficient to prompt markets to price out the implied chances of a Fed June hike currently embedded in the USD curve.
See – BoC Preview: Forecasts from six major banks, rates unchanged but hawkish bias
- EUR/JPY trades with a negative bias for the third successive day, though lacks follow-through.
- Fresh worries about a global economic downturn benefit the JPY and exert some pressure.
- Bets for more ECB rate hikes in the coming months underpin the Euro and help limit losses.
The EUR/JPY cross drifts lower for the third successive day and drops to a multi-day low during the first half of trading action on Wednesday. Spot prices, however, recover a few pips during the early European session and bounce back to the 149.00 mark in the last hour.
Worries about a global economic downturn continue to weigh on investors' sentiment, which benefits the safe-haven Japanese Yen (JPY) and exerts some downward pressure on the EUR/JPY cross. The concerns were fueled by weaker Chinese macro data, showing that the trade surplus sank to a 13-month low in May in the wake of a surprise slump in exports. This, in turn, suggested that overseas demand for Chinese goods remained weak and posed additional headwinds for the world's second-largest economy.
Apart from this, the prospect of Japanese authorities intervening in the markets might further underpin the JPY and contribute to offered tone surrounding the EUR/JPY cross. The shared currency, on the other hand, is pressured by discouraging German Industrial Production figures, French Trade Balance and French Trade Balance. That said, a big divergence in the monetary policy stance adopted by the Bank of Japan (BoJ) and the European Central Bank (ECB) holds back bears from placing fresh bets around the EUR/JPY cross.
Against the backdrop of the recent hawkish comments by several ECB officials, President Christine Lagarde said earlier this week that there is no clear evidence that underlying inflation has peaked. This, in turn, reaffirms expectations that the ECB is not done raising rates despite the recent fall in consumer inflation. It is worth recalling that the headline Eurozone CPI decelerated more than anticipated, to the 6.1% YoY rate in May from the 7.0% previous and the Core CPI slowed from the 5.6% YoY rate in April to 5.3% last month.
The aforementioned fundamental backdrop seems tilted in favour of the Euro bulls and supports prospects for the emergence of fresh buying around the EUR/GBP cross. Hence, any meaningful downside is more likely to remain limited, at least for the time being.
Technical levels to watch
- EUR/CAD has dropped sharply to near 1.4300 due to anxiety ahead of BoC policy.
- An unchanged interest rate decision with a hawkish commentary is expected from the BoC.
- ECB policymakers are still supporting more interest rate hikes despite bleak economic prospects.
The EUR/CAD has delivered a breakdown of the consolidation formed in a narrow range of 1.4320-1.4340 in the London session. The asset has dropped to near the round-level support of 1.4300. More action is anticipated from the pair ahead of the interest rate decision by the Bank of Canada (BoC).
BoC Governor Tiff Macklem has been keeping interest rates steady at 4.5% in their last two monetary policy meetings, reiterating that the current policy is restrictive enough to give a tough fight to Canada’s inflation. Also, Canada’s inflation has sharply slowed to 4.4% in April from post Covid high of 8.1% recorded in June 2022.
Analysts at ING expect the BoC to leave the policy rate at 4.5%, but after stronger-than-expected consumer price inflation and GDP and with the labor data remaining robust, we cannot rule out a surprise interest rate increase. A hawkish hold should be enough to keep the Canadian Dollar supported.
Later this week, Canada’s Employment data (May) will be of utmost importance. As per the preliminary report, the economy added fresh 23.2K jobs in May lower than April’s addition of 41.4K. The Unemployment Rate is seen rising to 5.1% from the former release of 5.0%.
Meanwhile, the Euro has come under pressure after German Factory Orders contracted sharply and Eurozone Retail Sales remained stagnant. However, European Central Bank (ECB) policymakers are still supporting more interest rate hikes amid persistence in core inflation. ECB President Christine Lagarde conveyed in the last monetary policy meeting that more than one interest rate hike is appropriate.
European Central Bank (ECB) policymaker, Klaas Knot, said on Wednesday, “prolonged monetary tightening might still lead to stress in financial markets.”
“Inflation expectations in markets seem optimistic,” he added.
Market reaction
EUR/USD is recovering ground, although remains stuck near the 1.0700 barrier so far this Wednesday. The pair is modestly flat on the day.
Considering advanced prints from CME Group for natural gas futures markets, open interest increased for the second session in a row on Tuesday, now by nearly 2K contracts. Volume, in the same direction, added to the previous daily build and went up by almost 3K contracts.
Natural Gas faces initial hurdle around $2.43
Prices of natural gas extended the march north on Tuesday amdidst rising open interest and volume, leaving the door open to the continuation of the ongoing bounce in the very near term. That said, there is an interim resistance area at the 100-day SMA around the $2.43 level per MMBtu for the time being.
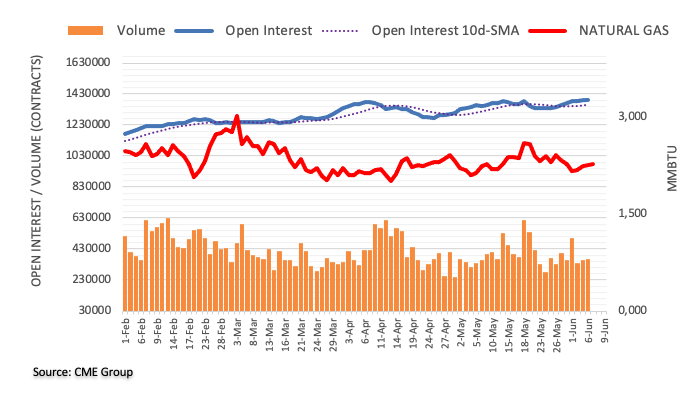
Economists at Société Générale analyze EUR/CHF technical outlook.
0.9670 is key support before 0.9600
A rebound is taking shape; retest of the 50-Day Moving Average near 0.9810 is not ruled out. It would be interesting to see if the pair can overcome the trend line drawn since 2021 near the 0.9900 level; this is an important hurdle.
If the EUR/CHF pair is unable to defend 0.9670, there would be risk of an extended downtrend. Next potential supports could be at projections of 0.9600/0.9575.
- GBP/USD has shown a recovery move from 1.2400 as the USD index has fallen into a volatility contraction phase.
- Market mood has turned cautious amid an absence of potential triggers this week.
- UK economy is facing the issue of labor shortages after the Brexit event and early retirement taken by several individuals.
The GBP/USD pair has found a decent buying interest near the round-level support of 1.2400 in the London session. The Cable has shown recovery due to a decline in the US Dollar Index (DXY). The USD Index has faced selling pressure while attempting to reclaim Tuesday’s high around 104.40.
S&P500 futures have extended losses in Europe amid anxiety among investors about the interest rate decision by the Federal Reserve (Fed) in its June policy meeting. Market mood has turned cautious amid an absence of potential triggers this week.
On a broader note, the USD index is showing signs of volatility contraction as the economic calendar has nothing much to offer this week. Therefore, second-tier events could produce some decisive moves ahead.
On Wednesday, United States Goods and Services Trade balance data (April) will remain in focus. The economic data is expected to show a wider deficit of $75.2B vs. the prior deficit of $64.2B. This could impact the US Dollar ahead.
On the Pound Sterling front, stubborn United Kingdom inflation is consistently forcing the need for more interest rate hikes. The Bank of England (BoE) has already hiked interest rates consecutively 12 times to 4.50%. Inflation in the UK region is significantly higher than in the United States and Eurozone due to the tight labor market and higher food inflation.
The UK economy is facing the issue of labor shortages after the Brexit event and early retirement taken by several individuals due to Covid-19.
In June’s monetary policy, BoE Governor Andrew Bailey is expected to raise interest rates further to augment UK PM Rishi Sunak’s promise of halving inflation by year-end.
- USD/CHF trades with a mild positive bias on Wednesday, albeit lacks follow-through.
- A modest USD uptick turns out to be a key factor lending some support to the major.
- Fed rate-hike uncertainty and a softer risk tone hold back bulls from placing fresh bets.
The USD/CHF pair edges higher for the second successive day on Wednesday, albeit lacks follow-through and remains well within over a one-week-old trading band. Spot prices hover around the 0.9075-0.9080 region during the early part of the European session, below a technically significant 100-day Simple Moving Average (SMA) and a nearly two-month high touched last week.
As investors seek clarity on the Federal Reserve's (Fed) next policy move, the US Dollar (USD) trades with a mild positive bias and is seen as a key factor lending as a tailwind for the USD/CHF pair. It is worth recalling that the recent inflation and labour market data from the US kept alive hopes for a 25 bps lift-off at the June FOMC meeting. However, dovish rhetoric by several Fed officials last week lifted market bets for an imminent pause in the US central bank's policy tightening cycle.
In fact, current market pricing indicates a greater chance that the Fed will leave interest rates unchanged next week. This leads to a further decline in the US Treasury bond yields, which continues to act as a headwind for the Greenback. Apart from this, the prevalent cautious mood benefits the safe-haven Swiss Franc (CHF) and contributes to capping the upside for the USD/CHF pair, warranting some caution for aggressive bullish traders and positioning for any meaningful appreciating move.
Weaker-than-expected Chinese trade balance data, showing that surplus sank to a 13-month low in May in the wake of a surprise 7.5% slump in exports, add to worries about a global economic slowdown. This, in turn, weighs on investors' sentiment and is evident from a generally weaker tone around the equity markets. Hence, a strong follow-through buying is needed to support prospects for an extension of a one-month-old recovery move from a 15-month low touched in May.
There isn't any relevant market-moving economic data due for release from the US on Wednesday, leaving the USD at the mercy of the US bond yields. Apart from this, the broader risk sentiment will drive demand for the safe-haven CHF and contribute to producing short-term trading opportunities around the USD/CHF pair.
Technical levels to watch
Economists at Commerzbank analyze how the Bank of Canada (BoC) Interest Rate Decision could impact the Loonie (CAD).
A surprise rate hike is likely to boost the CAD further
A vote for an unchanged 4.5% rate today, accompanied by a hawkish statement, should provide only limited support for the Loonie. It is true that the market should feel vindicated in its assessment that the BoC will continue its rate hike cycle in July. However, this seems to be already priced into the market. In addition, the market is likely to keep an eye on the upcoming central bank decisions by the Fed and the ECB next week and position itself rather cautiously.
On the other hand, a surprise rate hike as early as today is likely to boost the CAD further.
See – BoC Preview: Forecasts from six major banks, rates unchanged but hawkish bias
- Natural Gas is showing a sideways auction around $2.30 ahead of US EIA inventory data.
- Strength came for the Natural Gas price amid a sell-off in oil despite production cuts by Saudi Arabia.
- Natural Gas price has shifted into a bullish trajectory after a breakout of the Falling Channel chart pattern.
Natural Gas (XNG/USD) price is demonstrating a back-and-forth action around $2.30 in the London session. The energy instrument is struggling to find any direction as investors are awaiting the release of the stockpiles for the week ending June 02 by the United States Energy Information Administration (EIA) on Thursday.
Strength came for the Natural Gas price amid a sell-off in oil despite the announcement of production cuts by Saudi Arabia to provide some cushion.
On a broader note, pressure on Natural Gas prices could be created as global central banks are preparing for a fresh interest rate hike to tame stubborn inflation.
Natural Gas price has shifted into a bullish trajectory after a breakout of the Falling Channel chart pattern formed on an hourly scale. The energy instrument is struggling to surpass the immediate resistance plotted around $2.35.
The 200-period Exponential Moving Average (EMA) at $2.34 is consistently capping the upside in the Natural Gas price.
The Relative Strength Index (RSI) (14) is oscillating in the 40.00-60.00 range, indicating a non-directional performance.
Should the asset break above June 05 high at $2.37, the Natural Gas price will move toward May 31 high at $2.44 followed by May 23 low around $2.50.
In an alternate scenario, a decisive drop below June 06 low at $2.24 will drag the asset toward June 01 low at $2.18. A break below the latter will expose the asset to May 05 low around $2.10.
Natural Gas hourly chart
-638217221282616738.png)
CME Group’s flash data for crude oil futures markets noted traders added nearly 15K contracts to their open interest positions on Tuesday, extending the prevailing uptrend. Volume, on the other hand, shrank by around 131.3K contracts.
WTI: Downside could retest $67.00
Tuesday’s corrective decline in prices of the barrel of WTI was on the back of increasing open interest, which suggests that further losses could lie ahead for the commodity in the very near term. That said, there is scope for the commodity to revisit the late May low near the $67.00 mark per barrel.
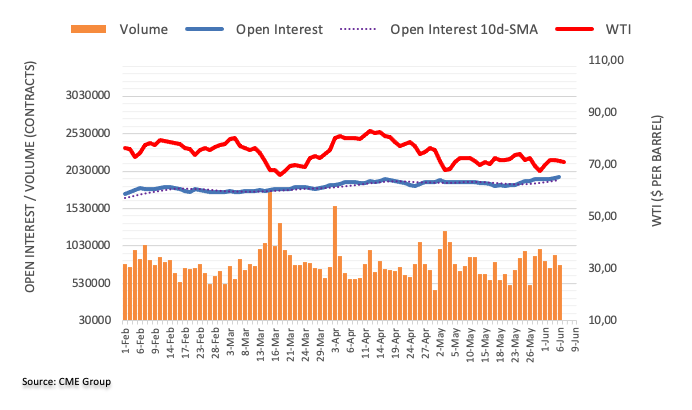
- Bank of Canada is likely to maintain key interest rates at 4.5% on June 7.
- BoC was the first major central bank to hit pause on interest rates in March.
- Canadian Dollar is set for intense volatility on the BoC’s rate outlook.
The Bank of Canada (BoC) is set to keep interest rates unchanged at 4.5% for the third meeting in a row on Wednesday, having become the first major central bank to hit the pause button on interest rates hikes in March. USD/CAD has been struggling in two-week lows just above 1.3400 ahead of the BoC policy announcements, as the Canadian Dollar continues to draw support from surging Oil prices.
Strong economic performance in Canada has been also underpinning the Canadian Dollar at the expense of the USD/CAD pair. Canadian Gross Domestic Product (GDP) expanded 0.8% QoQ after showing no change in the previous quarter, recording the fastest pace since the second quarter of 2022. Canada's real GDP grew at an annual rate of 3.1% in the first quarter, following the 0.1% contraction in Q4 2022 and beating the market expectation for an expansion of 2.5%.
Meanwhile, Canada's inflation unexpectedly rose in April, picking up for the first time in 10 months. The country’s annual Consumer Price Index (CPI) rose 4.4% in April, compared with a 4.3% increase in March. On a monthly basis, the CPI was up 0.7% in April, following a 0.5% gain in March.
Bank of Canada interest rate expectations: Steady monetary policy for a while
The acceleration in Canada’s headline consumer inflation combined with a resilient Canadian economy exerts pressure on the central bank to bring rate hikes back on the table. However, the Bank of Canada is widely expected to hold rates steady at 4.5% at its June 7 monetary policy meeting, with markets pricing about a 60% probability of such a move.
Some industry experts and banks are revising their calls, now expecting the BoC to deliver 50 bps rate hikes by September while some are predicting the central bank to resume its tightening cycle not until September. Markets are looking forward to Friday’s May employment report from Canada to reprice rate hike expectations in the second half of this year. Canada added higher-than-expected 41,000 jobs in April while the Unemployment Rate remained steady at 5%, near the record low of 4.9% observed in June and July 2022.
Analysts at TD Securities (TDS) offered a more hawkish outlook on the BoC policy decision due this Wednesday, citing that “we look for the BoC to hike by 25bp in June, and 25bp in July. Ongoing economic resilience will lengthen the path back to 2.0% inflation and as such, we believe the BoC needs to tighten further.”
“We were in the red zone for risks to further hikes, and this has pushed us to call for an additional 50bps of hikes (June, July) from here to bring us to 5% on the overnight rate. While market pricing is around 40% chance of a June hike, the reasons we are calling for a hike coupled with the market building towards a hike possibility are exactly why we continue to feel flatteners are the right way to skew,” TDS Analysts added.
When will the BoC release its monetary policy decision and how could it affect USD/CAD?
The Bank of Canada will announce its policy decision on Wednesday, June 7, at 14:00 GMT. The policy announcements will not be accompanied by the central bank’s updated forecasts. There is no press conference to be held by Governor Tiff Macklem following the rates decision.
Should the BoC maintain rates at 4.5% but hint at a 25 basis points (bps) July rate increase, the Canadian Dollar is expected to catch a fresh bid wave, smashing the USD/CAD pair. The major could also come under intense selling pressure if the central bank surprises with a 25 bps rate lift-off to 4.75%. The 1.3300 round figure could be then on USD/CAD sellers’ radars.
The Canadian Dollar could witness ‘sell the fact’ trades in case the BoC holds the rates while remaining ambiguous about the future policy path. USD/CAD buyers are likely to recapture 1.3500 and beyond on a dovish hike.
Meanwhile, Dhwani Mehta, Asian Session Lead Analyst at FXStreet, offers a brief technical outlook for the USD/CAD pair and writes: “The pair confirmed a Death Cross on the four-hour timeframe in Wednesday’s Asian trading after the bearish 50-Simple Moving Average (SMA) cut the flattish 200 SMA from above. This suggests that risks remain skewed to the downside for the USD/CAD pair, especially with the Relative Strength Index (RSI) also sitting way below the 50 level.”
Dhwani also outlines important technical levels to trade the major: “Sellers are likely to challenge the 1.3350 psychological level if USD/CAD sees a fresh leg lower in its ongoing downtrend. The next key support is seen at the May 10 low of 1.3335. Alternatively, immediate resistance awaits at the 21 SMA, pegged at 1.3424. Acceptance above the latter is critical to initiate a meaningful recovery toward the 1.3500 round figure.”
About the BoC Interest Rate Decision
BoC Interest Rate Decision is announced by the Bank of Canada. If the BoC is hawkish about the inflationary outlook of the economy and raises the interest rates it is positive, or bullish, for the CAD. Likewise, if the BoC has a dovish view on the Canadian economy and keeps the ongoing interest rate, or cuts the interest rate it is seen as negative, or bearish.
In its latest outlook published on Wednesday, the OECD said that it sees US Fed funds rate peaking at 5.25%-5.5% from Q2 2023, followed by two "modest" cuts in H2 2024.
Additional takeaways
OECD sees US growth of 1.6% in 2023 and 1.0% in 2024 (previously 1.5% in 2023 and 0.9% in 2024).
Sees global GDP growth of 2.7% in 2023 and 2.9% in 2024 (previously 2.6% in 2023 and 2.9% in 2024).
Sees Chinese growth of 5.4% in 2023 and 5.1% in 2024 (previously 5.3% in 2023 and 4.9% in 2024).
Sees Japanese growth of 1.3% in 2023 and 1.1% in 2024 (previously 1.8% in 2023 and 0.9% in 2024).
Sees Euro area growth of 0.9% in 2023 and 1.5% in 2024 (previously 0.8% in 2023 and 1.4% in 2024).
Sees ECB rates peaking in q3 2023 and remaining unchanged at 4.25% to end 2024.
UK growth of 0.3% in 2023 and 1.0% in 2024 (previously -0.2% in 2023 and 0.9% in 2024).
No rate hike in Japan until end of 2024.
No further rate hikes expected in Canada and South Korea, rate peaks expected in Australia and the UK from Q2 2023.
The Euro continues to suffer from a softening inflation story in the Eurozone. Economists at ING analyze EUR/USD outlook.
ECB communication has not seen drastic changes
While easing inflation should build a case for the doves, ECB communication has not seen drastic changes as we head into next week’s policy announcement.
Yesterday, President Christine Lagarde reiterated her call for more tightening, and her hawkish tone is probably a key factor keeping markets attached to the 40-45 bps pricing for the July meeting.
We have other speakers to keep an eye on today. Barring major dovish remarks, and unless a BoC hike has a positive spill-over on the Dollar, we feel EUR/USD can remain anchored to 1.0700 for now.
- Silver meets with some supply on Wednesday and challenges the 200-hour SMA.
- The technical setup gradually seems to be shifting in favour of bearish traders.
- A sustained strength beyond $24.00 is needed to negate the negative outlook.
Silver comes under some selling pressure on Wednesday and sticks to its modest intraday losses through the early part of the European session. The white metal is currently placed just below the mid-$23.00s, with bears now awaiting a break below the 200-hour Simple Moving Average (SMA) before placing fresh bets and positioning for any further losses.
Against the backdrop of last week's rejection slide from the $24.00 mark, some follow-through selling will suggest that the recent bounce from a two-month low has run its course and turn the XAG/USD vulnerable amid bearish oscillators on the daily chart. The subsequent downfall has the potential to drag the commodity towards the $23.00 round figure en route to the next relevant support near the $22.70-$22.65 region, or over a two-month low touched in May.
The XAG/USD could eventually drop to the $22.00 mark, which represents a technically significant 200-day SMA, which should act as a strong base and help limit any further losses. That said, a sustained break below will be seen as a fresh trigger for bearish traders and set the stage for the resumption of the recent pullback from over a one-year high, around the $26.15 region, touched in May.
On the flip side, the weekly top, around the $23.75 area set on Tuesday, now seems to act as an immediate barrier ahead of the $24.00 mark. This is closely followed by the $24.15-$24.20 horizontal resistance, which if cleared decisively could trigger a near-term short-covering rally. The XAG/USD might then surpass the $24.45-$24.50 intermediate hurdle and climb to the $24.80 zone before aiming toe reclaim the $25.00 psychological mark.
Silver 1-hour chart
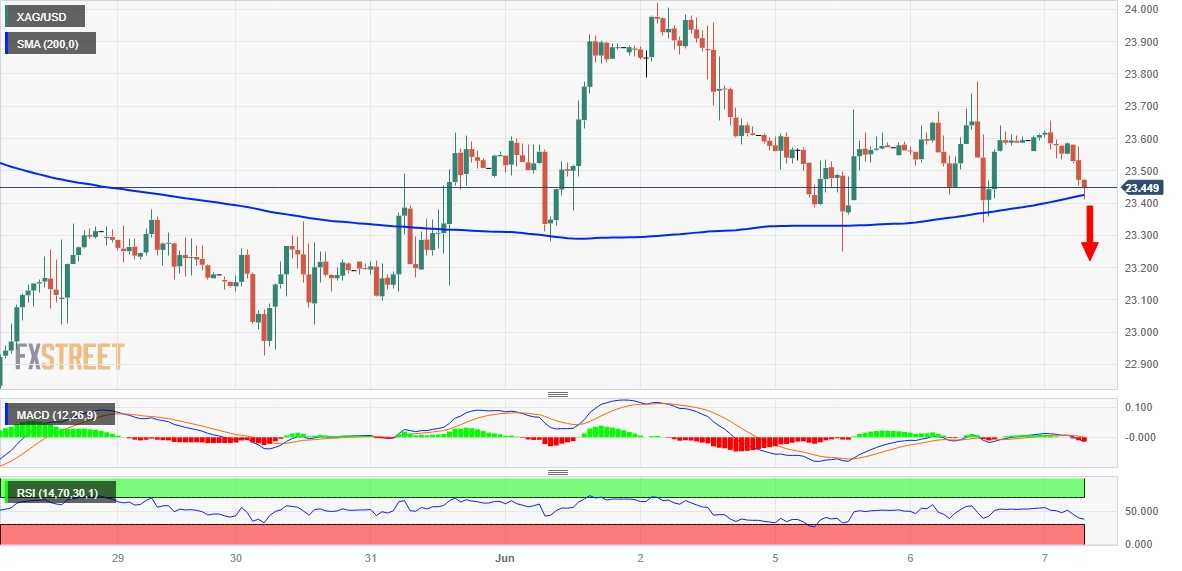
Key levels to watch
- EUR/USD adds to Tuesday’s losses and retests 1.0670.
- Industrial Production in Germany expanded 0.3% MoM in April.
- ECB speakers due next in the domestic docket.
EUR/USD remains on the defensive and keeps navigating in the sub-1.0700 zone on Wednesday.
EUR/USD focused on ECB-speak, Chinese data
EUR/USD corrects further south on Wednesday amidst the broad-based sour mood in the risk-linked galaxy, particularly after Chinese trade balance figures reignited concerns over the recovery in the country’s economy.
Against that, the greenback extends the buying interest and keeps the USD Index (DXY) well bid above the 104.00 barrier, exposing at the same time a probable deeper pullback in the pair to, initially, the May low near 1.0630 (May 31).
Back at the ECB, Board member I. Schnabel argued that the impact of the current ECB tightening cycle is expected to peak at some point in 2024, reiterating that underlying inflation remains elevated and that the central bank has still further ground to cover.
In the docket, Industrial Production in Germany expanded less than expected 0.3% MoM in April.
In the US, MBA Mortgage Applications are due followed by trade balance figures and Consumer Credit Change.
What to look for around EUR
EUR/USD flirts with weekly lows near 1.0670 amidst the gradual recovery in the greenback so far this week.
In the meantime, the pair’s price action is expected to closely mirror the behaviour of the US Dollar and will likely be impacted by any differences in approach between the Fed and the ECB with regards to their plans for adjusting interest rates.
Moving forward, hawkish ECB speak continues to favour further rate hikes, although this view appears to be in contrast to some loss of momentum in economic fundamentals in the region.
Key events in the euro area this week: Germany Industrial Production (Wednesday) - EMU Flash GDP Growth Rate (Thursday).
Eminent issues on the back boiler: Continuation of the ECB hiking cycle in June and July (and September?). Impact of the Russia-Ukraine war on the growth prospects and inflation outlook in the region. Risks of inflation becoming entrenched.
EUR/USD levels to watch
So far, the pair is losing 0.09% at 1.0683 and faces initial support at 1.0635 (monthly low May 31) seconded by 1.0516 (low March 15) and finally 1.0481 (2023 low January 6). On the upside, the surpass of 1.0779 (weekly high June 2) would target 1.0808 (100-day SMA) en route to 1.0881 (55-day SMA).
Brent is inching towards first resistance at $81. Economists at Société Générale analyze the technical outlook.
Recent peak at $86/87 remains a key resistance zone
Daily MACD has started posting positive divergence however signals of trend reversal are not yet visible. Recent peak at $86/87 remains a key resistance zone.
Shorter-term, Brent has experienced a steady bounce since last week and is now challenging the 50-DMA. It is approaching a multi-month descending trend line at $81. If ongoing rebound falters near this level, the downward momentum could regain.
Break below $70 would confirm one more leg of downtrend; next potential objectives are located at December 2021 low of $65/63 and $57.
- AUD/USD has sensed stiff resistance around 0.6680 despite the RBA being open for further interest rate hikes.
- Australian Q1GDP missed estimates as higher interest rates are impacting the overall growth.
- US Goods and Trade Balance are expected to show a wider deficit of $75.2B vs. the prior deficit of $64.2B.
The AUD/USD pair is consistently failing to climb above the immediate resistance of 0.6680 in the European session. The Aussie asset is not getting the required strength despite a hawkish commentary came from the Reserve Bank of Australia.
On Tuesday, RBA Governor Philip Lower raised its Official Cash Rate (OCR) surprisingly by 25 basis points (bps) to 4.10%. RBA’s Lowe cited that despite Australian inflation having peaked now but is extremely far from the desired rate. Therefore, RBA’s Lowe announced that more interest rate hikes are appropriate to keep pressure on inflation.
Investors should note that the monthly Australian Consumer Price Index (CPI) rebounded to 6.8% in April from the 6.4% figure recorded for March.
In the Asian session, the Australian Bureau of Statistics reported weaker-than-anticipated Q1 Gross Domestic Product (GDP) data. Quarterly GDP was expanded by 0.2% while the street was anticipating an expansion of 0.3%, which was revised lower from the prior print of 0.6%. On an annual basis, Q1 GDP dropped to 2.3% vs. the estimates of 2.4% and the former release of 2.6%.
Post the release of Australia’s Q1 GDP data, Australian Treasurer Jim Chalmers said that “rising interest rates are clearly impacting the economic growth,” He further added, “Growth momentum is waning,”
Meanwhile, S&P500 futures have surrendered gains generated in Asia, portraying a decline in the risk appetite of the market participants. The USD Index has extended its recovery to near 104.26 despite the street being mixed about Federal Reserve’s (Fed) policy stance for June monetary policy.
Going forward, United States Goods and Services Trade Balance (April) will remain in focus. The economic data is expected to show a wider deficit of $75.2B vs. the prior deficit of $64.2B.
- NZD/USD meets with a fresh supply on Wednesday and is pressured by a modest USD uptick.
- Weaker Chinese macro data weigh on investors’ sentiment and benefit the safe-haven buck.
- Bets for an imminent Fed rate-hike pause might cap the USD and help limit losses for the pair.
The NZD/USD pair struggles to capitalize on its modest gains registered over the past two days and comes under some selling pressure on Wednesday. The pair maintains its offered tone through the early European session and is currently placed near the daily low, around the 0.6060 area, down
Weaker-than-expected Chinese macro data released earlier this Wednesday adds to worries about a global economic slowdown and weighs on investors' sentiment. This is evident from a generally weaker tone around the equity markets, which lends some support to the safe-haven US Dollar (USD) and exerts some downward pressure on the NZD/USD pair. In fact, China's trade surplus sank to a 13-month low in May, led by a surprise 7.5% slump in exports. The data suggests that overseas demand for Chinese goods remained weak in the wake of worsening economic conditions globally. This, in turn, poses additional headwinds for the world's second-largest economy and undermines demand for antipodean currencies, including the Kiwi.
The New Zealand Dollar (NZD) is further undermined by the Reserve Bank of New Zealand's (RBNZ) explicit signal that it was done with its most aggressive hiking cycle since 1999. That said, the uncertainty over the Federal Reserve's (Fed) next policy move might hold back the USD bulls from placing aggressive bets and help limit losses for the NZD/USD pair. In fact, the recent inflation and labour market data kept alive hopes for a 25 bps lift-off at the June FOMC meeting. However, dovish rhetoric by several Fed officials last week lifted market bets for an imminent pause in the US central bank's policy tightening cycle. The current market pricing indicates a greater chance that the Fed will leave interest rates unchanged next week.
The expectations lead to a further decline in the US Treasury bond yields, which should continue to act as a headwind for the Greenback and lend some support to the NZD/USD pair. Meanwhile, the recent repeated failures near the 0.6100 round-figure mark favour bearish traders. The aforementioned fundamental backdrop, however, makes it prudent to wait for strong follow-through selling before positioning for any further intraday depreciating move amid absent relevant market-moving economic releases from the US.
Technical levels to watch
Pressure on swedish Krona has resumed. Economists at ING analyze EUR/SEK outlook.
Hard to pick a top for the EUR/SEK pair in the near term
The lack of any support from the Riksbank is making it hard to pick a top for the EUR/SEK pair in the near term.
The financially-distressed Swedish landlord SBB is reportedly denying rumours about discounted sales of its business units, but a default warning from creditors has emerged and the centrality of the firm in the Swedish real estate space means more risk premium (related to a property market collapse) could be priced into SEK now.
A recovery for the Krona seems unlikely in the near term.
- WTI remains depressed around intraday low, down for the second consecutive day.
- Sluggish markets, fears of banking crisis underpin US Dollar rebound even as Fed bets weigh on greenback.
- China trade numbers flash mixed signals for May, risk appetite
- API Crude Oil inventories marked surprise draw, EIA stockpiles eyed for clear directions.
WTI crude oil rebounds from the intraday low of $71.25 heading into Wednesday’s European session. In doing so, the black gold remains bearish for the second consecutive day amid economic fears, as well as the recent recovery in the US Dollar.
Softer statistics from the US, China and Eurozone recently renewed fears of economic slowdown. Additionally, fears of higher rates from the Bank of Japan (BoJ) and hawkish performances of the Reserve Bank of Australia (RBA) and Reserve Bank of New Zealand (RBNZ) also prod the previous economic optimism.
Previously, Saudi Arabia and OPEC+ pledge to deepen oil production cuts joined a surprise draw in the weekly inventories to allow the black gold in grinding higher. That said, the American Petroleum Institute (API) Weekly Crude Oil Stock dropped by 1.71 million barrels in the week ended on June 02 versus the previous addition of 5.20 million barrels.
Furthermore, comments from the US Energy Information Administration (EIA), suggesting that the US crude oil production this year would rise faster and demand increases would cool compared to prior expectations, per Reuters, also weigh on Oil price.
Elsewhere, an absence of the Federal Reserve (Fed) talks and a lack of major data on the calendar joined a recent pick-up in the odds favoring the Fed’s July rate hike to underpin the US Dollar Index (DXY) rebound.
Looking ahead, weekly Oil inventory data from the US Energy Information Administration (EIA) is likely to entertain energy traders. That said, the US Crude Oil Stocks Change is expected to mark a reduction in the inventory build with a 1.5M figure for the week ended on June 02, versus 4.488M previous readings.
Apart from the stockpile data, risk catalysts and economic growth signals will be closely observed for clear directions of the WTI crude oil.
Technical analysis
WTI crude oil’s failure to cross the 50-day Exponential Moving Average (EMA), around $73.40, directs the energy bears toward the one-month-old ascending support line, close to $67.85 at the latest.
Economists at Credit Suisse analyze USD/CAD ahead of the Bank of Canada (BoC) Interest Rate Decision.
Hawkish hold or cautious hike?
We see a ‘hawkish hold’ as the most likely outcome from the BoC today, but don’t rule out a 25 bps hike with cautious guidance.
The message of policy continuity that our view implies should be consistent with FX stability, in line with our 1.3450 end-Q2 target.
We expect knee-jerk moves higher in USD/CAD related to an unchanged outcome to be short-lived and would look to fade rallies to the 200-DMA (~1.3510).
In the event of a hike, a quick drop to the Apr lows around 1.3300-1.3315 is a possibility: Loonie strength beyond that point should nevertheless remain elusive.
See – BoC Preview: Forecasts from six major banks, rates unchanged but hawkish bias
Here is what you need to know on Wednesday, June 7:
Major currency pairs continue to trade in familiar ranges mid-week as investors remain in search of the next significant catalyst. Later in the day, the Bank of Canada (BoC) will announce its interest rate decision and release the policy statement. The US economic docket will feature Goods Trade Balance and Consumer Credit Change data for April.
During the Asian trading hours, the data from China revealed that the trade surplus contracted to $65.81 billion in May from $90.21 billion in April. This reading came in much lower than the market expectation of $92 billion. On a yearly basis, Exports and Imports declined 7.5% and 0.8% respectively. Meanwhile, Australian Bureau of Statistics reported that the real Gross Domestic Product (GDP) grew at an annualized rate of 2.3% in the first quarter, compared to analysts' estimate of 2.4%. Following Tuesday's rally that was fuelled by the Reserve Bank of Australia's (RBA) unexpected to decision to raise its policy rate by 25 basis points, AUD/USD lost its traction early Wednesday and was last seen trading in negative territory slightly above 0.6650.
The US Dollar Index clings to small daily gains above 104.00 and US stock index futures trade flat early. Meanwhile, the benchmark 10-year US Treasury bond yield continues to fluctuate at around 3.7%.
The BoC is widely forecast to leave its policy rate unchanged at 4.5%. USD/CAD trades in a tight channel above 1.3400 early Wednesday. Previewing the BoC event, "we expect the BoC to leave the policy rate at 4.5%, but after stronger-than-expected consumer price inflation and GDP and with the labour data remaining robust, we cannot rule out a surprise interest rate increase," said economists at ING.
BoC Preview: Forecasts from six major banks, rates unchanged but hawkish bias.
EUR/USD closed in negative territory on Tuesday and continues to trade on the back foot below 1.0700 in the European morning.
GBP/USD struggled to find direction on Tuesday and closed the day little changed near 1.2400 for the second day in a row. Early Wednesday, the pair edges lower but manages to hold slightly above 1.2400.
USD/JPY edges lower toward 139.00 on Wednesday. The data from Japan showed earlier in the day that the Coincident Index improved slightly to 99.4 in April's flash estimate from 98.8 in March.
Gold price continues to move up and down in a narrow channel above $1,950 as the lack of volatility in the US yields makes it difficult for XAU/USD to gather directional momentum.
Bitcoin gained traction and erased all of its weekly losses by rising nearly 6% on Tuesday. BTC/USD, however, has lost its recovery momentum and retreated below $27,000 early Wednesday. Ethereum rose 4% on Tuesday and came within a touching distance of $1,900 before going into a consolidation phase.
- Gold price has attempted a downside break of the consolidation formed above $1,960.00 amid a recovery in the USD Index.
- The expectations of a temporary pause in the policy-tightening spell by the Fed have soared due to weak US Services PMI.
- Gold price is consolidating in a range of $1,932-1,985 for the past three weeks.
Gold price (XAU/USD) has displayed a sharp drop to near $1,960.00 in the European session. The precious metal is trying to come out of the woods. A minor sell-off in the Gold price has been propelled by a recovery extension in the US Dollar Index (DXY).
S&P500 futures have carry-forwarded nominal gains added in Asia to the London session. The market mood is quite cheerful as investors are anticipating that the Federal Reserve (Fed) is going to consider a neutral interest rate policy stance thoroughly for June’s monetary policy.
The expectations of a temporary pause in the policy-tightening spell by the Fed have soared after the United States Services PMI, reported by the ISM agency, hardly managed to dodge contraction. The economic data was marginally above the 50.0 threshold. Subdued service sector and contracting factory activities are pushing the United States economy aggressively toward a recession.
The US Dollar Index has rebounded to near 104.25 despite the street is anticipating that divergence in Fed’s interest rate policy with other global central banks will drop as the former is likely to keep rates steady while others are preparing for a fresh interest rate hike. The yields offered on 10-year US government bonds have also rebounded marginally above 3.66%.
Gold technical analysis
Gold price is consolidating in a range of $1,932-1,985 for the past three weeks on a four-hour. The precious metal is struggling in delivering a decisive move amid an absence of a potential trigger. Broadly, horizontal support is plotted from March 15 high at $1,937.39. The magical 200-period Exponential Moving Average (EMA) at $1,975.47 is acting as a strong barrier for the Gold bulls.
An oscillation in the 40.00-60.00 territory by the Relative Strength Index (RSI) (14) indicates a non-directional performance.
Gold four-hour chart
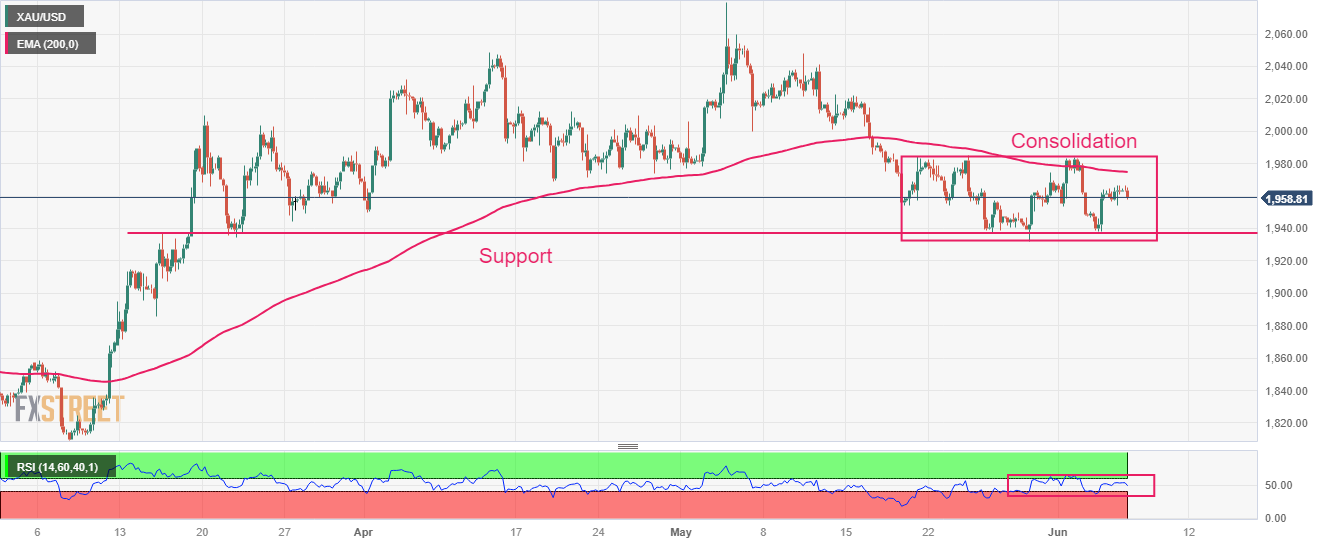
- EUR/GBP renews intraday low amid sluggish session, stays pressured for the second consecutive day.
- German Industrial Production (IP) growth improves on MoM, eases on YoY for April.
- Fears of British economic woes, political jitters surrounding UK prod pair sellers.
EUR/GBP remains pressured around the intraday low near 0.8600 during the second daily fall amid the early hours of Wednesday’s London open. In doing so, the cross-currency pair takes clues from the downbeat German data while ignoring hawkish comments from the European Central Bank (ECB) officials and pessimism in the UK.
Germany’s Industrial Production (IP) improved to 0.3% MoM versus 0.6% market forecasts and -2.1% prior (revised) whereas the yearly growth figures ease to 1.6% from 2.3% (revised) previous readouts and 1.2% expected.
Also read: German Industrial Production rises 0.3% MoM in April vs. 0.6% expected
On the other hand, ECB Governing Council member Isabelle Schnabel pushes back the recent dovish concerns by stating that the impact of our tighter monetary policy on inflation is expected to peak in 2024.
Also read: ECB’s Schnabel: Impact of our tighter policy on inflation expected to peak in 2024
Previously, the downbeat prints of the German Factory Orders and Eurozone Retail Sales joined easing inflation expectations in the bloc to weigh on the Euro. Further, the cautious mood ahead of the UK Prime Minister Rishi Sunak’s US visit and fears that the British economy will have to bear the burden of too high inflation and less productivity increase weighs on the EUR/GBP prices.
Looking ahead, a light calendar will direct EUR/GBP traders to pay attention to UK PM Sunak’s US visit, as well as local politics, for clear directions. “British Prime Minister Rishi Sunak will advocate for a deepening of economic ties between the United Kingdom and the United States when he speaks to the country's lawmakers and business representatives during his trip to Washington D.C. this week,” Reuters quotes a British Government press release.
To sum up, EUR/GBP bears are likely to keep the reins as the recent Eurozone statistics prod ECB hawks while the higher British inflation keeps suggesting the BoE rate hikes.
Technical analysis
Failure to cross the previous support line stretched from the mid-March, around 0.8635 by the press time, directs EUR/GBP bears towards the yearly low marked in the last week near 0.8565.
Economists at Société Générale analyze USD/INR technical outlook.
Failure to reclaim 82.95/83.30 could trigger snap back towards 81.80/81.60
USD/INR uptrend stalled last year in October and since then it has evolved within a narrowing consolidation.
The pair has recently failed to overcome the upper end of its range at 82.95/83.30; this zone has capped multiple rebounds and is a crucial hurdle. A break above this resistance is essential to affirm next leg of uptrend.
A short-term pullback is taking shape; a retest of 200-DMA near 81.80/81.60 is not ruled out. This is a key support zone.
- USD/JPY seems vulnerable above 139.00 as the USD Index is losing its charm.
- BoJ Ueda said the central bank will discuss specifics of an exit policy when achievement of the price target is foreseen.
- USD/JPY is expected to display a sheer downside after a breakdown of the Descending Triangle pattern.
The USD/JPY pair is juggling in a narrow range above the crucial support of 139.00 in the Asian session. The asset seems vulnerable above the aforementioned support as the US Dollar Index is losing its charm. Where major central banks are gearing up for a fresh interest rate hike, investors are anticipating that the Federal Reserve (Fed) could pause its policy-tightening spell as the impact of interest rate hikes yet made has not passed.
The US Dollar Index (DXY) has witnessed some support after correcting to near 104.00. A squeeze in volatility for the USD Index is anticipated amid an absence of potential economic events this week.
Meanwhile, the Japanese yen has got some strength as Bank of Japan (BoJ) Governor Kazuo Ueda said on Wednesday, “When achievement of price target is foreseen, we will discuss specifics of an exit policy and disclose information as needed.”
USD/JPY is on the verge of delivering a breakdown of the Descending Triangle chart pattern formed on an hourly scale. A breakdown of the aforementioned pattern results in wider ticks and heavy volume.
Declining 20-period Exponential Moving Average (EMA) at 139.43 adds to the downside filters.
The Relative Strength Index (RSI) (14) has shifted into the bearish range of 20.00-40.00, which indicates that downside momentum has been triggered.
A confident break below June 06 low at 139.09 will drag the asset toward March 08 high at 137.92 followed by March 02 high at 137.10
On the flip side, a break above May 31 high at 140.42 will drive the asset toward May 30 high at 140.93. A break above the latter will expose the asset to a fresh six-month high of around 141.61, which is 23 November 2022 high.
USD/JPY hourly chart
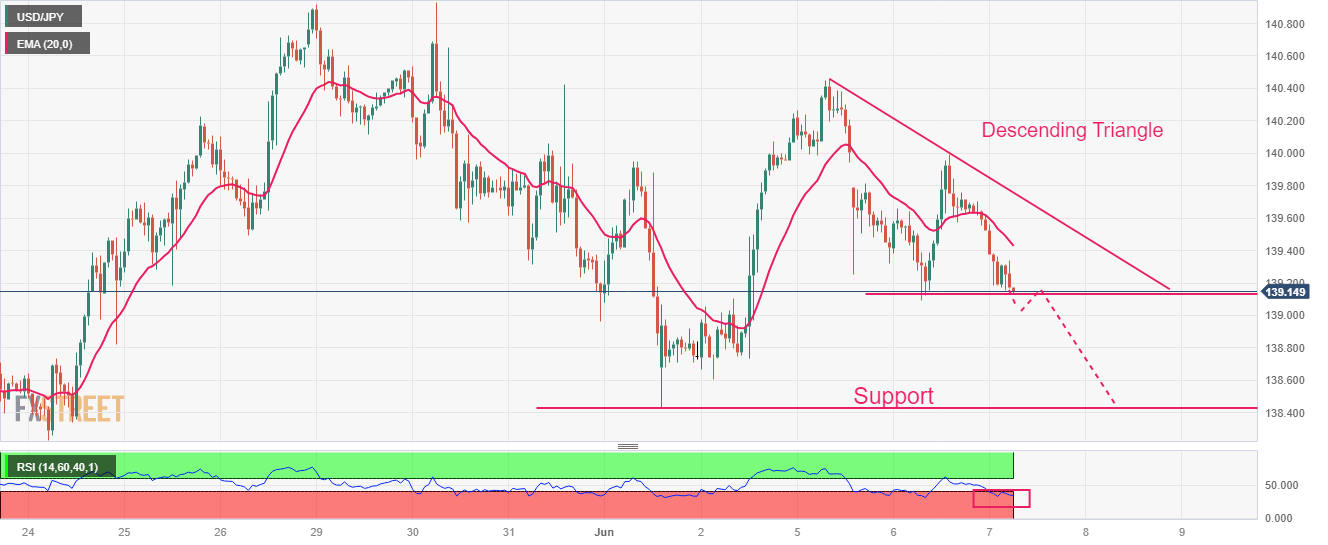
In an interview with De Tijd on Wednesday, European Central Bank (ECB) Governing Council member Isabelle Schnabel said, “the impact of our tighter monetary policy on inflation is expected to peak in 2024.”
“However, there is great uncertainty over the strength and the speed of this process,” she was quick to add.
Market reaction
EUR/USD was last seen trading at 1.0677, losing 0.17% on the day.
Industrial Production in Germany rebounded in April, the official data showed on Wednesday, suggesting that the manufacturing sector could be on the road to recovery.
Eurozone’s economic powerhouse’s Industrial Output rose 0.3% MoM, the federal statistics authority Destatis said in figures adjusted for seasonal and calendar effects, vs. 0.6% expected and -2.1% prior.
The annual German Industrial Production arrived at 1.6% in April versus a 1.2% figure recorded in March and 2.3% market expectations.
FX implications
The shared currency is trading on the back foot below 1.0700 against the US Dollar following the mixed German industrial figures. The pair is losing 0.08% on the day, as of writing.
- USD/CAD licks its wounds at monthly low within one-week-old descending trend channel.
- BoC is expected to keep the interest rates unchanged, policy signals will be the key to follow for Loonie traders.
- Steady RSI suggests slower grind towards the south, convergence of 100-HMA, channel’s top line prods bulls.
- Three-week-long horizontal area and dovish BoC outlook holds the key for USD/CAD bull’s conviction.
USD/CAD aptly portrays the Loonie trader’s cautious mood ahead of the Bank of Canada (BoC) Interest Rate Decision as it pares recent losses around a multi-day low heading into Wednesday’s European session. That said, the quote stays defensive near the lowest level in a month despite recently picking up bids to 1.3405.
Also read: USD/CAD braces for BoC near 1.3400 as Oil grinds higher, US Dollar struggles
Apart from the pre-BoC consolidation, the existence of a one-week-long bearish channel also keeps the USD/CAD bears hopeful.
That said, the steady RSI (14) line allows the USD/CAD pair to grind higher within a one-week-old bearish trend channel, currently between 1.3380 and 1.3445-50.
It’s worth noting that the 100-bar Hourly Moving Average (HMA) adds strength to the 1.3445-50 upside hurdle for the pair, a break of which could direct the pair buyers towards a convergence of the 200-HMA and 38.2% Fibonacci retracement level of the pair’s May 08-25 upside, near 1.3530.
Should the Loonie pair manages to remain firmer past 1.3530, backed by the dovish BoC outcome, a horizontal area comprising multiple levels marked since mid-April, near 1.3570, acts as the last defense of the USD/CAD bears.
On the contrary, a downside break of the stated channel’s bottom line, close to 1.3380 at the latest, won’t hesitate to challenge the previous monthly high of near 1.3315, a break of which could drag the Loonie pair price towards the yearly low marked in February around 1.3265.
USD/CAD: Hourly chart
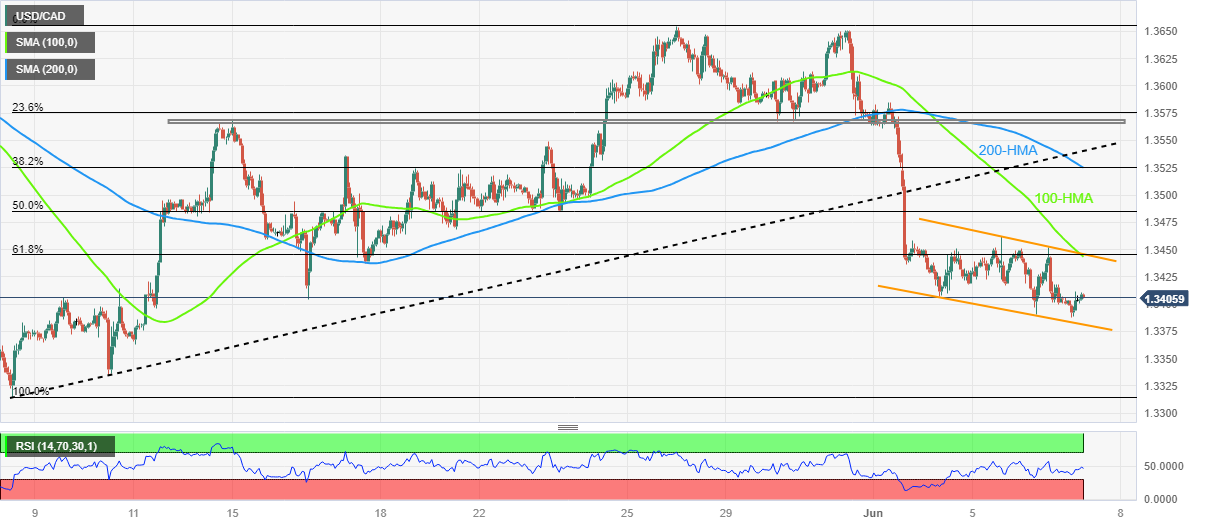
Trend: Bearish
The Bank of Canada (BoC) is set to announce its Interest Rate Decision on Wednesday, May 7 at 14:00 GMT and as we get closer to the release time, here are the expectations as forecast by the economists and researchers of six major banks, regarding the upcoming announcement.
BoC is expected to keep interest rates steady at 4.5% but may show readiness for further rate hikes if needed. Updated macro forecasts will not be released until the July meeting.
TDS
We look for the BoC to step off the sidelines with another 25 bps hike to 4.75% in June. Economic data has remained resilient, and the Bank's conditional pause is looking less tenable without clear evidence of a material slowdown in the first half of 2023. We look for a relatively hawkish statement, with the Bank leaving the door open to further tightening in the coming months.
ING
We expect the BoC to leave the policy rate at 4.5%, but after stronger-than-expected consumer price inflation and GDP and with the labour data remaining robust, we cannot rule out a surprise interest rate increase. A hawkish hold should be enough to keep the Canadian Dollar supported.
RBC Economics
The economy’s resilient start to 2023 likely has the Bank of Canada actively considering raising interest rates. But we think it will ultimately maintain the pause in hikes that began in January, keeping the overnight rate steady at 4.5% for now.
NBF
We’re looking for the BoC to maintain the overnight target at 4.5%. Recent headline data has hardly been reassuring but we still believe a modicum of patience is needed/warranted to get a better assessment of the apparent rebound in inflation, housing and GDP will be sustained. It’s also worth highlighting that a new MPR will not be unveiled alongside the decision. That by no means precludes a rate hike but means there wouldn’t be a Macklem-Rogers press conference or fresh economic/inflation projections to support a potential rate increase. While there will be a BoC speech and press conference the day after the decision, it’ll be Deputy Governor Paul Beaudry at the podium. Again, one would assume that a resumption of tightening would warrant having the BoC’s top dog(s) deliver the news, smoothing over any interpretational issues, should they arise. Nonetheless, the Bank hasn’t shied away from unpredictability over the past year and while we lean towards no change, this is not a high conviction forecast. Investors beware, this is very much a ‘live’ meeting.
Citi
With consistently stronger than expected activity and stably too strong inflation, the 4.50% level of policy rates is unlikely restrictive enough to slow activity and bring inflation back to 2%. As a result, the BoC is expected to raise rates again by 25 bps. Guidance in the policy statement will be important, although we do not anticipate many changes here. Guidance should continue to be that the Governing Council ‘remains prepared to raise the policy rate further if needed to return inflation to the 2% target’. Leaving guidance unchanged could be interpreted as somewhat hawkish.
Wells Fargo
The BoC will opt to keep rates on hold at 4.50% for the third meeting in a row. If inflation trends remain elevated and activity remains resilient, there certainly remains a risk the BoC will raise its policy rate further beyond 4.50%. However, in our view, the more relevant debate is how quickly the BoC turns to monetary easing in the quarters ahead. With our expectation for the Fed to begin monetary easing in 2024, and with inflation in Canada slowing down steadily but gradually, we also now expect BoC rate cuts to be delayed until the first quarter of next year, compared to our previous forecast for rate cuts to begin in Q4-2023.
FX option expiries for June 7 NY cut at 10:00 Eastern Time, via DTCC, can be found below.
- EUR/USD: EUR amounts
- 1.0600 313m
- 1.0620 1.1b
- 1.0650 310m
- 1.0690 543m
- 1.0730 1.2b
- 1.0750 330m
- 1.0800 311m
- USD/JPY: USD amounts
- 138.00 861m
- 139.00 1.3b
- 140.00 1.1b
- 140.25 320m
- 141.00 681m
- 142.00 2.9b
- USD/CHF: USD amounts
- 0.9025 901m
- 0.9100 683m
- AUD/USD: AUD amounts
- 0.6600 395m
- 0.6620 900m
- 0.6650 441m
- 0.6700 1.3b
- 0.6750 461m
- NZD/USD: NZD amounts
- 0.6200 715m
- The index adds to Tuesday’s advance above the 104.00 mark.
- Investors continue to favour a Fed’s pause in June.
- Weekly Mortgage Applications, trade balance next on tap.
The USD Index (DXY), which gauges the greenback vs. a bundle of its main competitors, extends Tuesday’s gains and maintains the trade above the 104.00 yardstick on Wednesday.
USD Index looks at Fed, data
The index advances for the second session in a row and so far manages well to keep business above the 104.00 hurdle on Wednesday.
The uptick in the index comes amidst steady expectations of a pause in the Fed’s normalization of its monetary conditions in June, while investors continue to pencil in a 25 bps rate hike in July.
In the meantime, US yields lack direction and trade around Tuesday’s closing levels across the curve so far.
In the US data space, weekly Mortgage Applications tracked by MBA are seconded by the Balance of Trade and Consumer Credit Change.
What to look for around USD
The index looks to consolidate the trade above the 104.00 mark amidst the absence of strong catalysts so far this week.
In the meantime, bets of another 25 bps at the Fed’s next gathering in June reversed course in spite of the steady resilience of key US fundamentals (employment and prices, mainly), denting the recent rally in the dollar and favouring a further decline in US yields.
Bolstering a pause by the Fed instead appears to be the extra tightening of credit conditions in response to uncertainty surrounding the US banking sector.
Key events in the US this week: MBA Mortgage Applications, Balance of Trade, Consumer Credit Change (Wednesday) – Initial Jobless Claims, Wholesale Inventories (Thursday).
Eminent issues on the back boiler: Persistent debate over a soft/hard landing of the US economy. Terminal Interest rate near the peak vs. speculation of rate cuts in late 2023/early 2024. Fed’s pivot. Geopolitical effervescence vs. Russia and China. US-China trade conflict.
USD Index relevant levels
Now, the index is gaining 0.02% at 104.14 and the breakout of 104.69 (monthly high May 31) would open the door to 105.51 (200-day SMA) and then 105.88 (2023 high March 8). On the other hand, the next support aligns at 103.38 (monthly low June 2) seconded by 102.96 (100-day SMA) and finally 102.48 (55-day SMA).
- GBP/USD remains pressured for the fourth consecutive day, fades bounces off intraday low.
- Fears of British economic woes, sluggish markets allow Cable bears to keep the reins.
- US Dollar battles with bears even as bulls are hard to recall amid light calendar, pre-Fed blackout.
- Political news, Fed vs. BoE chatters will direct Pound Sterling traders.
GBP/USD refreshes intraday low as the US Dollar picks up bids to pare the early Asian session losses heading into Wednesday’s London open. In doing so, the Cable pair prints a four-day losing streak around 1.2415 by the press time.
US Dollar Index (DXY) stretches the previous day’s corrective bounce while rising towards 104.20 at the latest, despite being indecisive on the day. In doing so, the greenback’s gauge versus six major currencies suffers from downbeat market bets on the Fed’s next move amid the pre-FOMC blackout for the policymakers. Additionally, recent chatters that the US government’s bond spree, due to the debt-ceiling deal, will trigger the banking crisis, as signaled by the Financial Times (FT), seem to prod the previous risk-on mood and underpin the US Dollar’s rebound.
Furthermore, interest rate futures show a nearly 20% probability of a June rate hike but the odds of witnessing 25 basis points (bps) worth rate hike in July increased of late, which in turn seems to favor the Pound Sterling sellers. The reason could be linked to downbeat United States activity data released on Monday, as well as the previously dovish comments from the Federal Reserve (Fed) Officials ahead of the pre-Fed blackout.
On the other hand, the cautious mood ahead of the UK Prime Minister Rishi Sunak’s US visit and fears that the British economy will have to bear the burden of too high inflation and less productivity increase weigh on the GBP/USD prices.
“British Prime Minister Rishi Sunak will advocate for a deepening of economic ties between the United Kingdom and the United States when he speaks to the country's lawmakers and business representatives during his trip to Washington D.C. this week,” Reuters quotes a British Government press release.
While portraying the market’s mood, the 10-year coupons remain sluggish at around 3.67%, despite a recent corrective bounce, whereas the two-year counterpart rose a bit to 4.50% at the latest. While portraying the mood, S&P500 Futures print mild gains by tracking Wall Street’s performance.
Moving forward, the UK-US political headlines may entertain GBP/USD traders, in addition to the chatters about the Bank of England (BoE) and the Federal Reserve’s (Fed) next moves.
Technical analysis
A two-week-old ascending support line joins the steady RSI (14) line and the receding bearish bias of the MACD signals to challenge the GBP/USD bears around the 1.2400 round figure.
Also read: GBP/USD Price Analysis: Cable prods three-day downtrend above 1.2400, further rise appears difficult
- EUR/USD has retreated after facing barricades around 1.0700 amid a recovery in the USD Index.
- The German economy is going through a rough phase due to higher interest rates by the ECB.
- ECB Lagarde is expected to raise interest rates further considering persistence in core inflation.
The EUR/USD pair has witnessed some selling interest after facing stiff barricades around 1.0700 in the early European session. The major currency pair is consistently defending the crucial support of 1.0670, therefore, a breakdown of the same would result in wider bearish ticks. The Euro has come under pressure as investors are anticipating a bleak economic outlook in Eurozone.
S&P500 futures generated mild gains in the Asian session. US equities registered a positive settlement on Tuesday as more dovish catalysts are adding to Federal Reserve’s (Fed) interest rate policy filters. The US Dollar Index (DXY) has rebounded to near 104.18. On a broader note, the USD Index is inside the woods amid a lack of economic events this week.
The demand for US government bonds has improved amid a mild decline in hawkish Fed bets. As per the CME FedWatch tool, more than 80% of the chances are in favor of a steady interest rate policy. This has led to a decline in the 10-year US Treasury yields to near 3.66%.
On the Eurozone front, the German economy is going through a rough phase due to higher interest rates by the European Central Bank (ECB). The German economy has already shown a recession after a consecutive contraction in quarterly Gross Domestic Product (GDP). Adding to that, German Factory orders are consistently declining, indicating weak demand.
Apart from that, Eurozone Retail Sales data released on Tuesday also failed to stand expectations. Monthly Retail Sales remained stagnant while the street was anticipating an expansion by 0.2%. Annual Retail Sales contracted by 2.6% vs. the expectations of -1.8%. In spite of the poor economic outlook, ECB President Christine Lagarde is highly likely to raise interest rates further considering persistence in core inflation.
Open interest in gold futures markets rose by more than 2K contracts on Tuesday, reversing at the same time a downtrend in place since May 16, according to preliminary readings from CME Group. Volume, instead, shrank for the second consecutive session, now by nearly 47K contracts.
Gold faces some range bound near term
Tuesday’s inconclusive price action in gold was on the back of increasing open interest and declining volume, which exposes some near-term consolidation around current levels. In the meantime, the yellow metal remains well supported by the $1930 region per ounce troy for the time being.
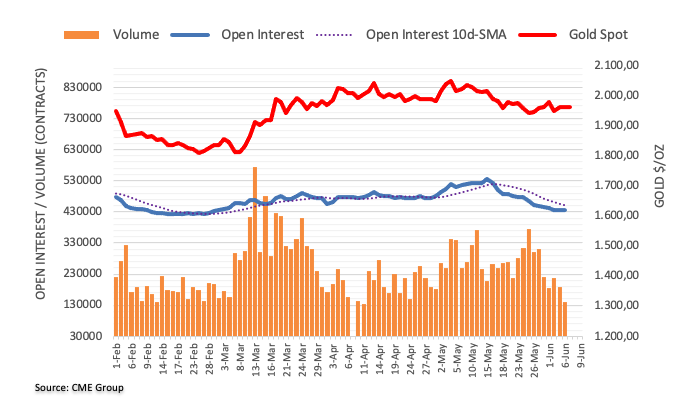
- USD/TRY has witnessed a temporary pause in a rally to near 22.08.
- A mild decline in hawkish Fed bets after the release of weak US Services PMI has trimmed the appeal of the US Dollar.
- USD/TRY has already posted 10 consecutive positive settlements on a weekly basis.
The USD/TRY pair has witnessed a loss in the upside momentum after printing an all-time high of 22.08 in the late Asian session. The asset is expected to resume its upside journey as the sentiment about Turkish Lira has been soured after President Erdogan got another term. President Erdogan is working on reshuffling the cabinet and taking the economic policy in a new direction.
The US Dollar Index (DXY) has turned sideways after defending the crucial support of 104.00. The USD Index showed a corrective action after failing to surpass Monday’s high at 104.40. A mild decline in hawkish Federal Reserve (Fed) bets after the release of weak United States Services PMI has trimmed the appeal of the US Dollar.
USD/TRY has already posted 10 consecutive positive settlements on a weekly basis. The Fibonacci expansion tool plotted on the third week of December 2021 indicates that the asset has climbed above the 138.2% ratio placed at 21.58.
The Relative Strength Index (RSI) (14) is oscillating in the bullish range of 60.00-80.00, showing no signs of divergence but is in an overbought situation.
The USD/TRY pair is already in unchartered territory and a break above the intraday high at 22.34 will drive the asset toward round-level resistance at 23.00 and 23.50 respectively.
Alternatively, a decisive break below June 06 low at 21.20 will drag the asset toward June 02 low at 20.83 followed by May 31 low at 20.53.
USD/TRY weekly chart
-638217110822243858.png)
The Bank of Japan (BoJ) Governor Kazuo Ueda said on Wednesday, “when achievement of price target is foreseen, we will discuss specifics of an exit policy and disclose information as needed.”
Additional quotes
How exit from easy policy could affect BoJ’s finances will depend on economic, price, financial developments at the time.
BoJ must ensure its finances are sound to avoid un-intended market attention to its finances from disrupting monetary policy decisions.
Too early to debate specific strategy on how BoJ could sell ETFs in the future.
Meanwhile, Japanese Finance Minister Shunichi Suzuki said that “the government must look into whether govt can buy BoJ’s ETF holdings at book value as efforts to secure source of revenue.”
Market reaction
At the press time, USD/JPY is trading close to 139.30, down 0.24% on the day.
- Gold Price retreats from intraday high but stays mildly bid for the second consecutive week.
- Sluggish US Dollar, unimpressive market and mixed China data prod XAU/USD traders.
- Multiple hurdles challenge Gold buyers near $1,970 as yields dribble.
Gold Price (XAU/USD) lacks clear directions even as bulls have an upper hand for the second consecutive week. In doing so, the precious metal depicts the sluggish markets amid an absence of the Federal Reserve (Fed) talks and a lack of major data on the calendar. It’s worth noting that upbeat China PMI jostles with mixed foreign trade numbers while the recent pick-up in the July Fed rate hike also challenges the Gold buyers.
Meanwhile, an increase in the US Treasury’s bond issuance and cautious optimism surrounding China joins no rate hike expectations from June FOMC to keep the Gold bulls on the table.
With this in mind, second-tier US data/events may entertain the Gold traders ahead of Friday’s China inflation numbers.
Also read: Gold Price Forecast: XAU/USD appears ‘sell the bounce’ trade below 21 DMA barrier
Gold Price: Key levels to watch
As per our Technical Confluence Indicator, the Gold Price prods a jungle of resistances surrounding the $1,970 level.
Among them, a convergence of the Fibonacci 38.2% in one-week and multiple short-term moving averages join the middle band of the Bollinger on 15-minute chart to highlight $1,966 as the immediate upside hurdle.
Following that, Pivot Point one-day R1, upper band of the Bollinger on hourly play and the Fibonacci 23.6% in one-month together highlight $1,968 as another important resistance for the Gold Price.
Should the quote manage to remain firmer past $1,968, the $1,970 round figure may act as an extra filter towards the north before directing the XAU/USD towards a convergence of the previous weekly high and upper band of the Bollinger on four-hour chart, near $1,985.
Meanwhile, 200-HMA, 10-DMA and Pivot Point one-day S1 together highlight $1,955 as immediate support to watch for the Gold bears to conquer.
Even so, Fibonacci 61.8% in one week can act as an extra filter towards the north near $1,952 before welcoming the Gold sellers.
Here is how it looks on the tool
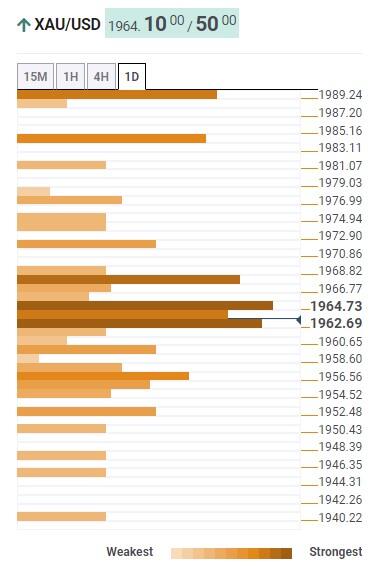
About Technical Confluences Detector
The TCD (Technical Confluences Detector) is a tool to locate and point out those price levels where there is a congestion of indicators, moving averages, Fibonacci levels, Pivot Points, etc. If you are a short-term trader, you will find entry points for counter-trend strategies and hunt a few points at a time. If you are a medium-to-long-term trader, this tool will allow you to know in advance the price levels where a medium-to-long-term trend may stop and rest, where to unwind positions, or where to increase your position size
In its latest client note, analysts at Goldman Sachs raised its terminal rate hike expectation for the Reserve Bank of Australia (RBA) after the central bank surprised markets with two consecutive rate hikes.
Key points
The bank now expects a 4.85% peak in September from 4.35% previous forecast.
They saw a hawkish shift in the RBA's reaction function during Lowe's speech earlier today.
They also noted that the Q1 GDP report showed a surprise acceleration in unit labor costs.
The bank now expects hikes in July, August and September. Previously it had expected a 25bp hike in July.
Related reads
- Aussie Gross Domestic Product (Q1): Miss by 0.1% QoQ and YoY, AUD/USD in 15 pip rangesteady
- RBA’s Lowe: Too early to declare victory in the battle against inflation
- USD/INR picks up bids to brace for the first weekly gain in three.
- Firmer Oil price, dovish hopes from RBI underpin bearish bias surrounding Indian Rupee.
- US Dollar struggles to find traction amid light calendar, pre-Fed blackout.
- Increase in July Fed rate hike bets put a floor under USD/INR price during dicey markets.
USD/INR clings to mild gains around 82.55 as it defies the previous day’s Doji candlestick amid early Wednesday. In doing so, the Indian Rupee (INR) pair seems to justify the market’s dovish hopes from the Reserve Bank of India (RBI) ahead of Thursday’s monetary policy decision.
In this matter, Reuters said that the RBI decision is due on Thursday when it is expected to leave the repo rate unchanged at 6.50% after having surprised markets by holding rates in April. It should be noted that the news also quotes an anonymous trader who said, “RBI rate decision could ‘lend some volatility,’ but "there was no way" it will change the current status quo on USD/INR.”
Apart from the RBI’s likely status quo, recent improvements in the prices of WTI crude oil, India’s major import item, also weigh on the Indian Rupee and propel the USD/INR price. That said, WTI crude oil remains mildly bid near $71.70 as it justifies a downbeat US Dollar and a surprise draw in the weekly Oil inventory data from the American Petroleum Institute (API). It should be noted that the global oil producers’ readiness for further output cuts joins improvement in China data to underpin the upbeat bias surrounding the black gold which is also a major export earner for Canada.
Elsewhere, US Dollar Index (DXY) struggles to defend the previous day’s corrective bounce while making rounds to 104.10, mostly indecisive on a day by the press time. In doing so, the greenback’s gauge versus six major currencies suffers from downbeat market bets on the Fed’s next move amid the pre-FOMC blackout for the policymakers. That said, the interest rate futures show a nearly 15% probability of a June rate hike. The reason could be linked to downbeat United States activity data released on Monday, as well as the previously dovish comments from the Federal Reserve (Fed) Officials ahead of the pre-Fed blackout.
It should be noted that the recent weakness in China's trade numbers and previously positive PMIs raise concern about the market’s future and hence weigh on the INR amid the indecision.
Looking ahead, a light calendar and absence of Fed talks can restrict the USD/INR moves while the pre-RBI anxiety adds strength to the trading restrictions. Even so, a surprise rate hike from the RBI, which is least expected due to the recent easing in Indian inflation, can trigger the Indian Rupee’s rebound from the technical level mentioned below.
Technical analysis
USD/INR pair’s recovery from the 50-day Exponential Moving Average (EMA), around 82.30 by the press time, needs validation from a two-week-old resistance line, near 82.60 at the latest, to convince the buyers.
- AUD/USD fades upside momentum at the highest levels in three weeks, prods intraday low of late.
- China trade surplus eases, imports increase but exports drop in May.
- 61.8% Fibonacci retracement prods Aussie buyers amid overbought RSI conditions.
- Sellers need validation from convergence of 200-SMA, 50% Fibonacci retracement level.
AUD/USD bulls struggle to keep the reins as China trade numbers join downbeat Australia’s first quarter (Q1) Gross Domestic Product (GDP) to prod the upside momentum at the highest levels in three weeks. That said, the Aussie pair retreats towards the intraday low surrounding 0.6670 heading into Wednesday’s European session.
China’s headline Trade Balance deteriorates to $65.81 billion versus the $92.0 billion expected and $90.21 billion previous readings. That said, the Exports and Imports came in mixed with the former falling past -0.4% expected and 8.5% previous readings to -7.5% YoY whereas the latter improves to 2.3% from -0.8% market forecasts and 4.2% prior.
On the other hand, Aussie Q1 GDP rose 0.2% QoQ compared to 0.5% previous readings and 0.3% market forecasts. On the same line, the yearly GDP came in as 2.3% versus the analysts’ estimation of 2.4% YoY and 2.7% previous readings.
Technically, the Aussie pair portrays a rising wedge bearish chart pattern on the four-hour play while recently reversing from the 61.8% Fibonacci retracement of its May 10-31 downturn, also known as the golden Fibonacci ratio.
That said, the risk-barometer pair’s reversal from the key Fibonacci ratio also justifies the overbought RSI (14) line to tease the sellers.
However, a clear downside break of the stated wedge’s bottom line, close to 0.6650 at the latest, becomes necessary for the AUD/USD bears to retake control.
Even so, a convergence of the 200-SMA and 50% Fibonacci retracement level of around 0.6640-35, appears a tough nut to crack for the AUD/USD sellers.
On the flip side, a successful break of the 61.8% Fibonacci retracement level of 0.6680 needs validation from the stated wedge’s top line, close to the 0.6700 round figure by the press time, to recall the AUD/USD buyers.
Also acting as an upside filter is the mid-May swing high around 0.6710.
AUD/USD: Four-hour chart
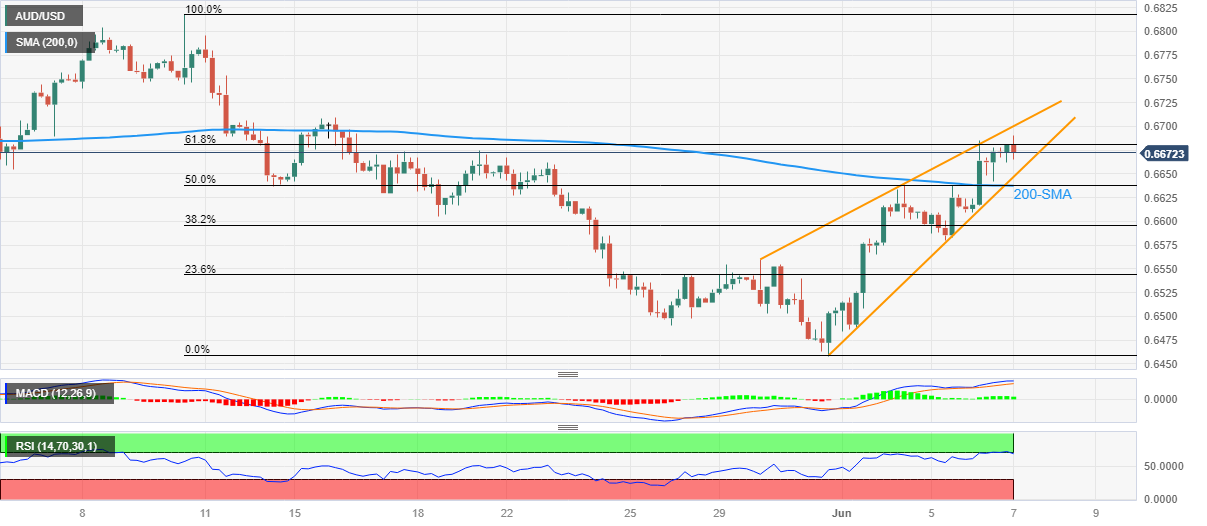
Trend: Further downside expected
- USD/CNH picks up bids to are intraday losses, braces for three-day uptrend.
- China trade surplus ease, Exports grow, Imports ease in May.
- Sluggish markets, US Dollar’s failure to gain traction amid pre-Fed blackout limit Yuan’s moves.
USD/CNH looks set to reclaim 7.1300 as it rebounds from the intraday low amid mixed China trade numbers published early Wednesday. In doing so, the offshore China Yuan (CNH) fails to justify recently sluggish, mostly downbeat, US Dollar moves.
China’s headline Trade Balance deteriorates to $65.81 billion versus the $92.0 billion expected and $90.21 billion previous readings. That said, the Exports and Imports came in mixed with the former falling past -0.4% expected and 8.5% previous readings to -7.5% YoY whereas the latter improves to 2.3% from -0.8% market forecasts and 4.2% prior.
Also read: China’s May Trade Balance: Surplus shrinks as exports tumble
On the other hand, US Dollar Index (DXY) struggles to defend the previous day’s corrective bounce while making rounds to 104.10, mostly indecisive on a day by the press time. In doing so, the greenback’s gauge versus six major currencies suffers from downbeat market bets on the Fed’s next move amid the pre-FOMC blackout for the policymakers. That said, the interest rate futures show a nearly 15% probability of a June rate hike. The reason could be linked to downbeat United States activity data released on Monday, as well as the previously dovish comments from the Federal Reserve (Fed) Officials ahead of the pre-Fed blackout.
Elsewhere, the recently positive concerns about the US-China ties and the People’s Bank of China’s (PBoC) qualitative measures to ease credit improves the sentiment. Furthermore, the US policymakers’ ability to avoid the ‘catastrophic’ default and softer US Data allow market players to remain optimistic.
Against this backdrop, the 10-year coupons remain sluggish at around 3.67%, despite a recent corrective bounce, whereas the two-year counterpart rose a bit to 4.50% at the latest. While portraying the mood, S&P500 Futures print mild gains by tracking Wall Street’s performance.
Looking ahead, a light calendar and the pre-Fed silence can restrict the USD/CNH moves ahead of Friday’s China inflation numbers.
Technical analysis
A one-week-old ascending support line, near 7.1160 at the latest, restricts immediate downside of the USD/CNH pair even as the RSI conditions suggest a pullback from the multi-month high.
China's Trade Balance for May, in Chinese Yuan terms, came in at CNY452.33 billion versus CNY643.25 billion expected and CNY618.44 billion last.
Exports fell 0.8% in the reported period vs. 9.9% expected and 16.8% previous.
The country’s imports rose 2.3% vs. 4.2% expected and -0.8% prior.
In US Dollar terms, China reported a sharp decrease in the trade surplus as exports show a bigger-than-expected drop.
Trade Balance came in at +65.81B versus +92B expected and +90.21B previous.
Exports (YoY): -7.5% vs. -0.4% exp. and 8.5% prior.
Imports (YoY): -4.5% vs. -8.0% exp. and -7.9% last.
FX implications
AUD/USD is feeling the pull of gravity on mostly downbeat Chinese trade figures. The spot is down 0.04% on the day, trading at 0.6667, as of writing.
Following the release of the Australian first quarter Gross Domestic Product (GDP) data on Wednesday, the country’s Treasurer Jim Chalmers said that “rising interest rates are clearing impacting the economic growth,”
“Growth momentum is waning,” he added.
At a press conference on Tuesday, Chalmers said that it is “not our expectation the economy will head into recession.”
- USD/CHF retreats towards intraday low, eyes first weekly loss in five.
- Lower high prices join downbeat RSI (14) line, bearish MACD signals to keep sellers hopeful.
- One-month-old rising trend line, 100-SMA prod Swiss Franc (CHF) buyers.
USD/CHF clings to mild losses near 0.9070 as it fades bounce off the intraday low early Wednesday. In doing so, the Swiss Franc (CHF) pair struggles for clear directions while staying between the key support line stretched from March and a one-week-long descending resistance line. It should be noted that the quote fades bounce off the 100-SMA, poked the previous day.
Bearish MACD signals join the lower high formation on the RSI (14) line and the USD/CHF price to suggest the pair’s further downside.
However, a clear break of the aforementioned support line, near 0.9055 by the press time, becomes necessary for the USD/CHF bear’s entry. Even so, the 100-SMA support of 0.9037 can act as an additional check for the pair sellers.
Following that, a downward trajectory towards the 0.9000 psychological magnet and then to the 200-SMA level of around 0.8975 can be expected.
On the flip side, USD/CHF buyers need to cross a downward-sloping resistance line from the previous Wednesday, near 0.9105 as we write, to retake control.
In that case, the Swiss Franc (CHF) pair may challenge the previous monthly high of around 0.9150 before eyeing the yearly peak marked in March around 0.9440.
USD/CHF: Four-hour chart
-07062023-638217032890691625.png)
Trend: Further downside expected
- USD/CAD licks its wounds at the lowest levels in a month as Loonie traders brace for BoC.
- Oil price consolidates previous day’s losses amid mostly downbeat US Dollar, surprise draw in API inventories and market’s cautious optimism.
- US Dollar lacks momentum amid light calendar, pre-Fed blackout.
- BoC is likely to keep the benchmark rates unchanged but hawkish bias can propel the Loonie price.
USD/CAD picks up bids to rebound from the lowest levels in one month as it defends the 1.3400 threshold early Wednesday. In doing so, the Loonie pair prepares for the Bank of Canada (BoC) Interest Rate Decision, up for moving markets late in the day.
The Loonie pair’s latest corrective bounce could be linked to the WTI crude oil’s retreat from the intraday high, as well as the US Dollar’s pause at the daily low, amid sluggish markets.
That said, WTI crude oil remains mildly bid near $71.70 as it justifies a downbeat US Dollar and a surprise draw in the weekly Oil inventory data from the American Petroleum Institute (API). It should be noted that the global oil producers’ readiness for further output cuts joins improvement in China data to underpin the upbeat bias surrounding the black gold which is also a major export earner for Canada.
Elsewhere, US Dollar Index (DXY) reverses the previous day’s corrective bounce while taking offers around 104.00, down 0.10% on a day by the press time. In doing so, the greenback’s gauge versus six major currencies suffers from downbeat market bets on the Fed’s next move. That said, the interest rate futures show a nearly 15% probability of a June rate hike. The reason could be linked to downbeat United States activity data released on Monday, as well as the previously dovish comments from the Federal Reserve (Fed) Officials ahead of the pre-Fed blackout.
On Tuesday, Canada’s Ivey Purchasing Managers Index for May improved to 60.1 but the seasonally adjusted figures came in softer and prod the USD/CAD bears.
It should be noted that the 10-year coupons remain sluggish at around 3.67%, despite a recent corrective bounce, whereas the two-year counterpart rose a bit to 4.50% at the latest. While portraying the mood, S&P500 Futures print mild gains by tracking Wall Street’s performance.
Looking forward, Canadian statistics have been upbeat of late and hence the BoC may show readiness for further rate hikes if needed, which in turn can weigh on the USD/CAD price even if the Canadian central bank is expected to keep the rates unchanged at 4.5%.
Technical analysis
USD/CAD sellers remain hopeful unless witnessing a clear run-up beyond the previous support line stretched from mid-April, around 1.3445 by the press time
| Raw materials | Closed | Change, % |
|---|---|---|
| Silver | 23.586 | 0.11 |
| Gold | 1963.02 | 0.09 |
| Palladium | 1406.76 | -0.07 |
- USD/JPY bounces off intraday low as bears take a breather amid two-week downtrend.
- US Treasury yields halt latest downside as debt-ceiling deal pushed for more bond issuance.
- BoJ officials keep defending easy-money policies but Japan’s upbeat inflation clues lure policy hawks.
- Receding hawkish Fed bets, absence of major US data and Fed blackout also favor Yen pair sellers.
USD/JPY prints mild losses around 139.35 despite bouncing off an intraday low early Wednesday morning. In doing so, the Yen pair struggles to justify the market’s cautious optimism due to the recent hawkish bias about the Bank of Japan (BoJ), as well as a broad US Dollar weakness.
BoJ Governor Kazuo Ueda signaled on Tuesday that the Japanese central bank will continue QQE until the achievement of the inflation target. Even so, the Yen pair sellers remain hopeful as higher inflation numbers from Japan join easing hawkish Fed bets and mostly downbeat US data.
Earlier in the day, Japan’s Foreign Reserve eased to $1,254.5 billion in May versus $1,265.4 billion.
That said, US Dollar Index (DXY) reverses the previous day’s corrective bounce while taking offers around 104.00, down 0.10% on a day by the press time. In doing so, the greenback’s gauge versus six major currencies suffers from downbeat market bets on the Fed’s next move. That said, the interest rate futures show a nearly 15% probability of a June rate hike. The reason could be linked to downbeat United States activity data released on Monday, as well as the previously dovish comments from the Federal Reserve (Fed) Officials ahead of the pre-Fed blackout.
It’s worth noting that the 10-year coupons remain sluggish at around 3.67%, despite a recent corrective bounce, whereas the two-year counterpart rose a bit to 4.50% at the latest. While portraying the mood, S&P500 Futures print mild gains by tracking Wall Street’s performance.
Looking forward, preliminary readings of April month sentiment data from Japan can entertain the USD/JPY pair traders ahead of Thursday’s Japan first quarter (Q1) Gross Domestic Product (GDP).
Technical analysis
A downside break of a one-month-old ascending support line, now immediate resistance near 139.70, directs USD/JPY bears toward the 40-35 support confluence including the previous weekly low and the 21-DMA.
- AUD/USD retreats from three-week high on downbeat Aussie economic growth figures.
- Australia Q1 GDP rose 0.2% QoQ versus 0.3% expected, 0.5% prior.
- RBA’s hawkish surprise, Governor Lowe’s hints of further rate hikes keep Aussie pair buyers hopeful.
- China trade numbers, risk catalysts eyed for clear directions.
AUD/USD reverses from the highest levels in three weeks after Australia’s first quarter (Q1) Gross Domestic Product (GDP) print a downbeat outcome early Wednesday. In doing so, the Aussie pair trims the Reserve Bank of Australia’s (RBA) led gains to 0.6675 by staying mildly bid, despite the latest fall, amid a sluggish session.
That said, Aussie Q1 GDP rose 0.2% QoQ compared to 0.5% previous readings and 0.3% market forecasts. On the same line, the yearly GDP came in as 2.3% versus the analysts’ estimation of 2.4% YoY and 2.7% previous readings.
Also read: Aussie Gross Domestic Product (Q1): Miss by 0.1% QoQ and YoY, AUD/USD in 15 pip rangesteady
RBA Governor Philip Lowe signaled further rate hikes from the Aussie central bank and propelled the five-day uptrend of the Aussie pair. That said, the policymaker said, “Some further tightening of monetary policy may be required, depending on how economy and inflation evolve.” It should be known that the RBA surprised markets for the second time in a row by announcing a 25 basis points (bps) rate hike on Tuesday.
Also read: RBA’s Lowe: Too early to declare victory in the battle against inflation
While the Aussie GDP fails to tame the RBA-inspired optimism for the AUD/USD buyers, the softer US Dollar adds strength to the pair’s upside momentum.
US Dollar Index (DXY) reverses the previous day’s corrective bounce while taking offers around 104.00, down 0.10% on a day by the press time. In doing so, the greenback’s gauge versus six major currencies suffers from downbeat market bets on the Fed’s next move. That said, the interest rate futures show a nearly 15% probability of a June rate hike. The reason could be linked to downbeat United States activity data released on Monday, as well as the previously dovish comments from the Federal Reserve (Fed) Officials ahead of the pre-Fed blackout.
Additionally favoring the AUD/USD bulls could be the cautious optimism in the markets, as portrayed by the mildly bid US stock futures and sluggish Treasury bond yields.
Having witnessed the initial market reaction to the Aussie Q1 GDP, AUD/USD pair traders should wait for China trade numbers for April for clear directions. However, the bulls are likely to keep the reins amid the latest RBA versus Fed divergence.
Technical analysis
Although, an upside break of the previous support line stretched from early March, around 0.6620 by the press time, joins successful trading beyond the 50-DMA level surrounding 0.6665 to favor the AUD/USD bulls, the 200-DMA hurdle of near the 0.6700 threshold caps the Aussie pair’s run-up.
The Australian Bureau of Statistics (ABS) has released the Gross Domestic Product (GDP):
- Australia Gross Domestic Product (YoY) came in at 2.3%, below expectations (2.4%) in 1Q.
- Australia Gross Domestic Product (QoQ) came in at 0.2% below forecasts (0.3%) in 1Q.
AUD/USD update
AUD/USD is in a 15-pip range on the data.
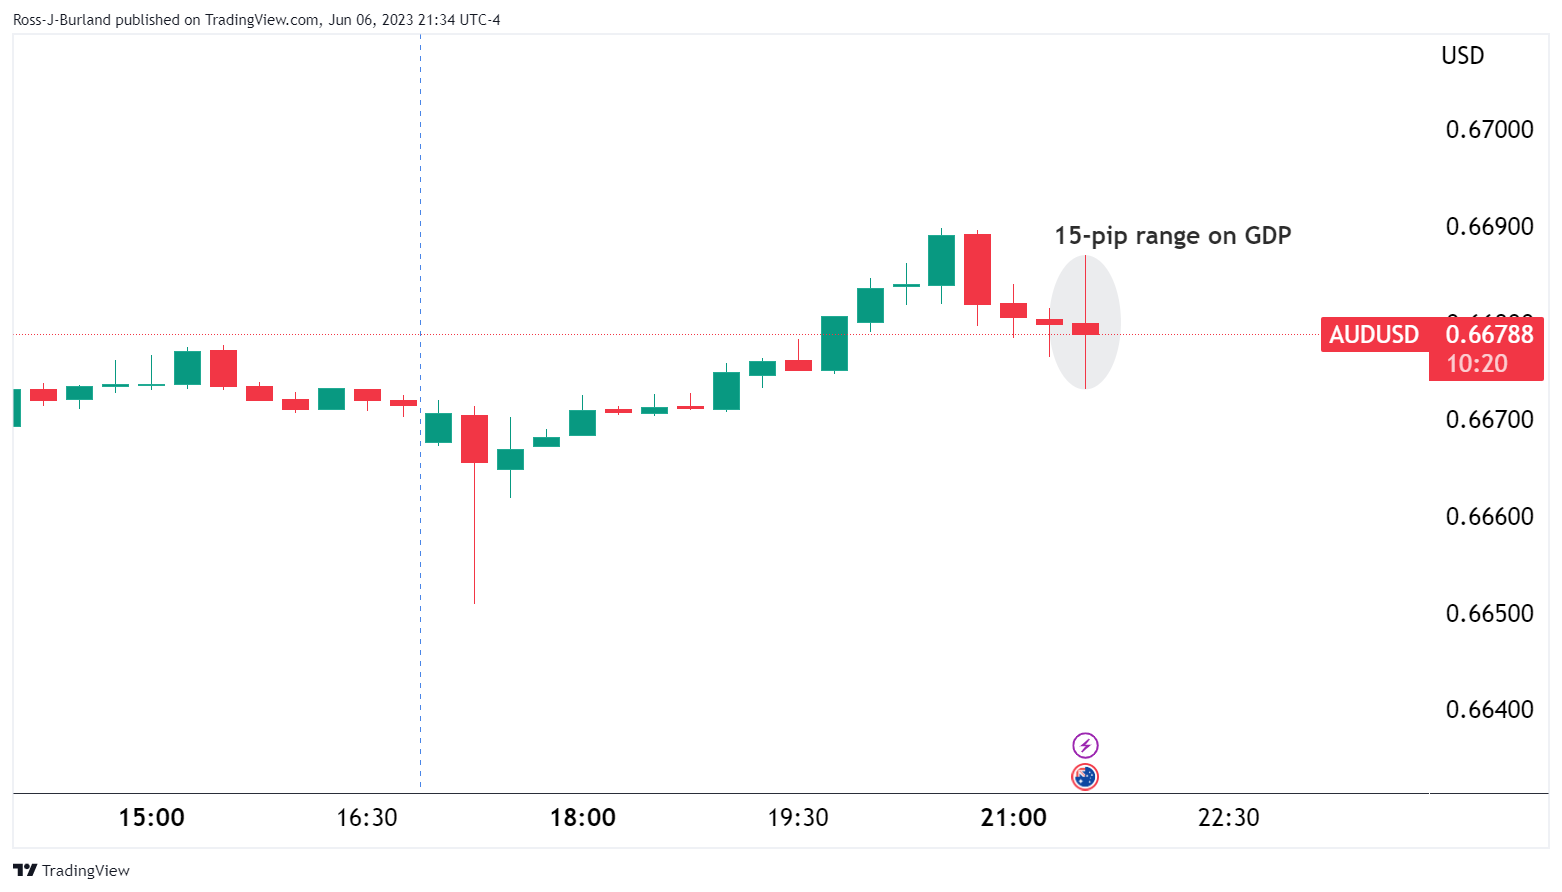
-
AUD/USD Price Analysis: Bulls eye 0.6700 but bears are lurking ahead of the Fed
As illustrated in the article above, the daily chart shows the price in a W-formation also, but this could be about to complete with a pullback to restest the commitment of the bulls.
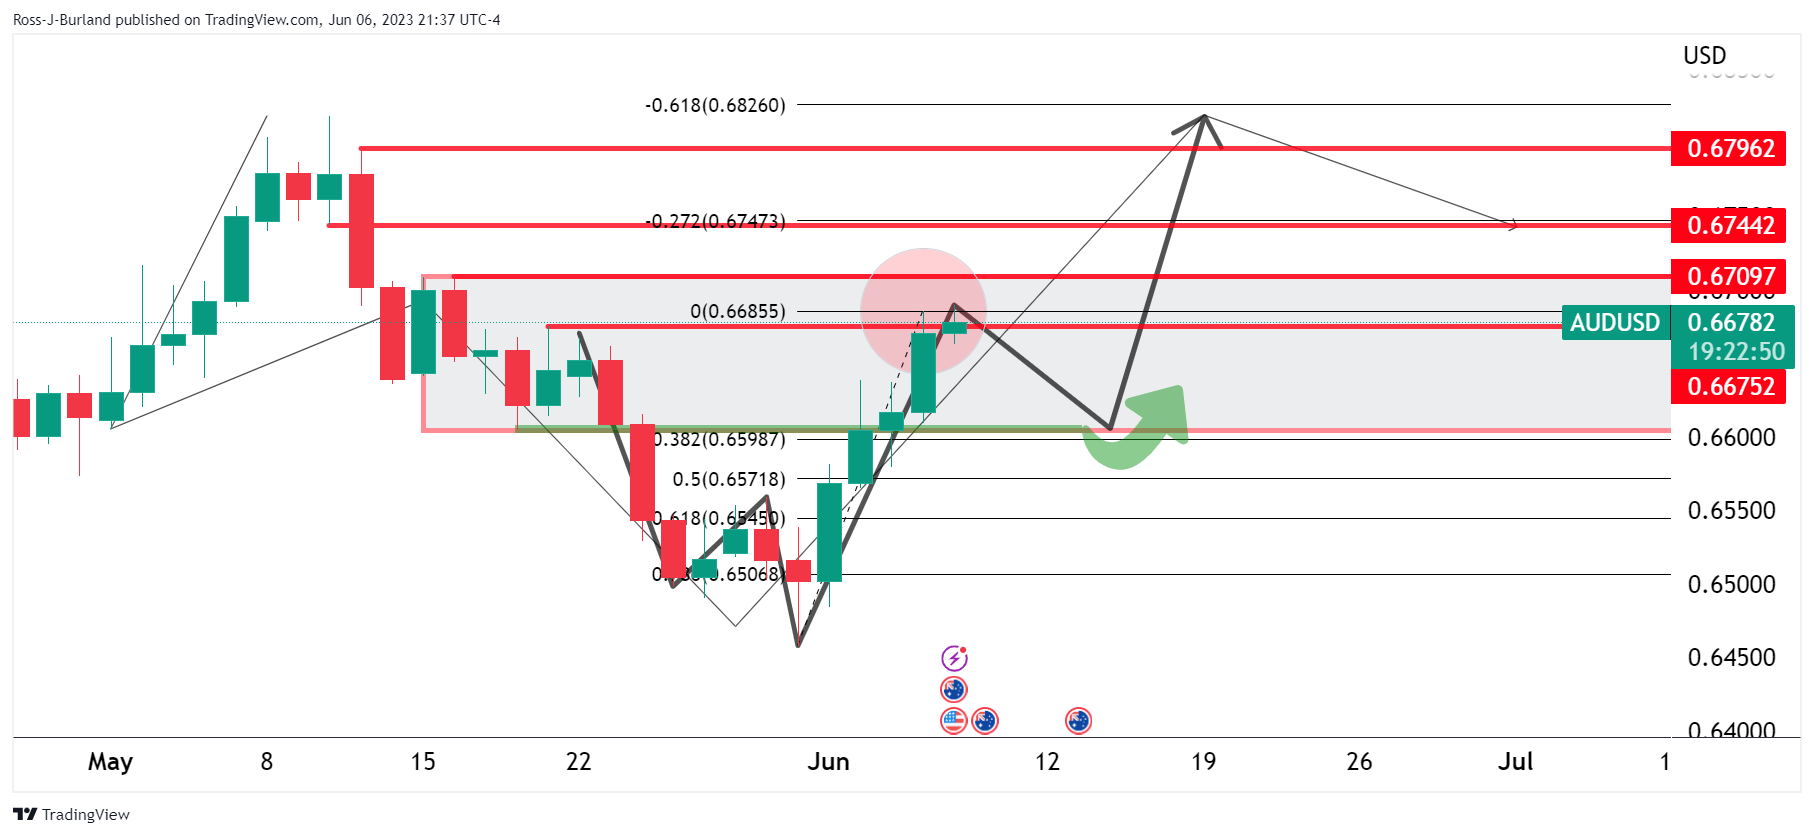
A declaration of the momentum with a creeping correction into the Federal Reserve meeting, June 14, could be on the cards.
On the other hand, there is a series of days that have been running in the green which could come under pressure mid-week as follows:
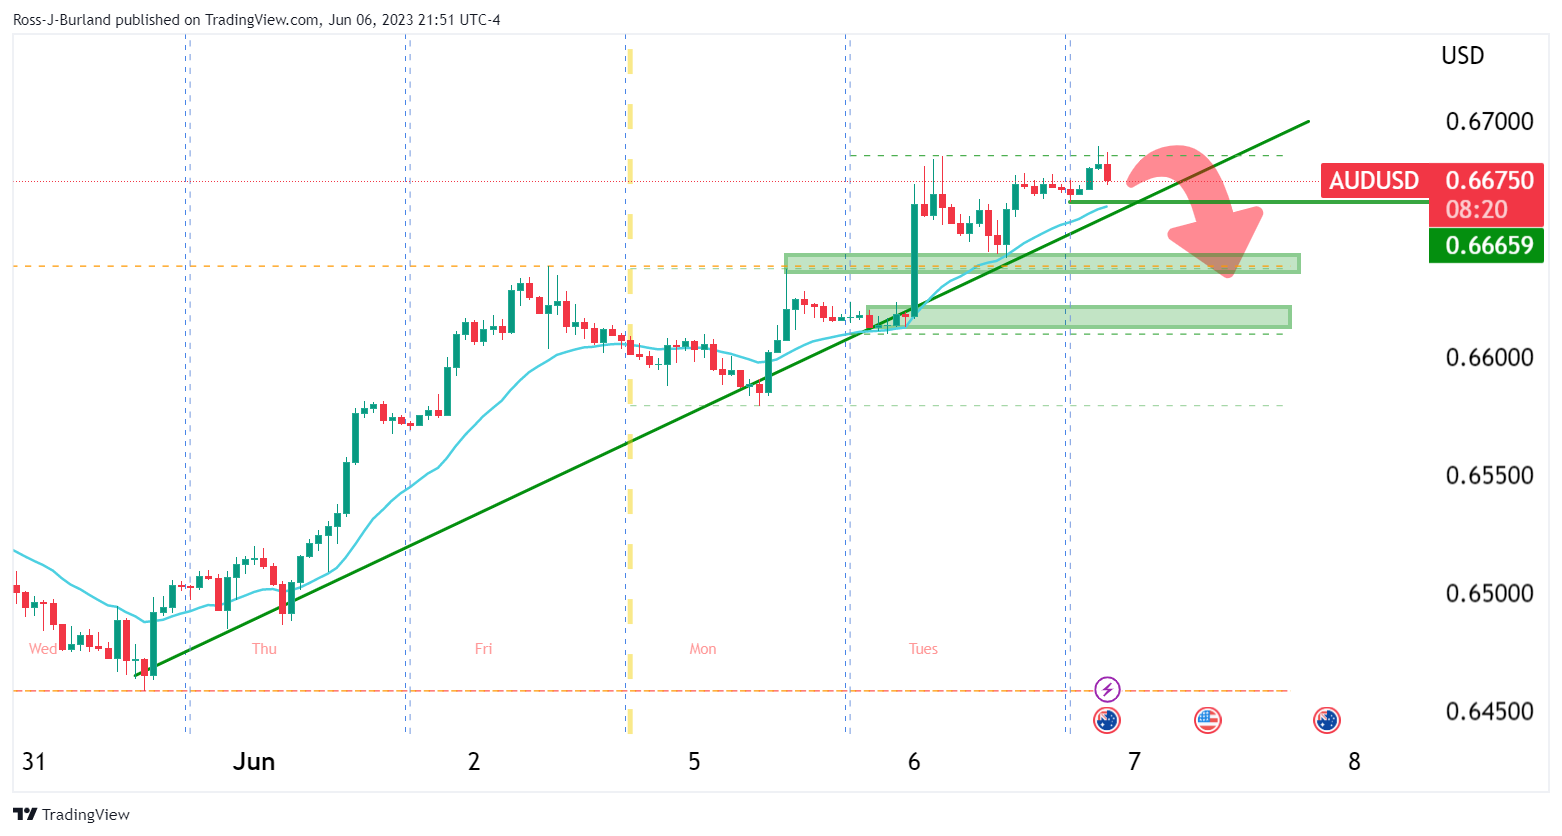
A break of the trendline, 20 EMA and 0.6665 would open risk to test 0.6640 and 0.6612 structures and possible support areas.
About the Gross Domestic Product (GDP)
The Australian Bureau of Statistics (ABS) releases the Gross Domestic Product (GDP) on a quarterly basis. It is published about 65 days after the quarter ends. The indicator is closely watched, as it paints an important picture for the economy. A strong labor market, rising wages and rising private capital expenditure data are critical for the country’s improved economic performance, which in turn impacts the Reserve Bank of Australia’s (RBA) monetary policy decision and the Australian dollar. Actual figures beating estimates is considered AUD bullish, as it could prompt the RBA to tighten its monetary policy.
In recent trade today, the People’s Bank of China (PBOC) set the yuan at 7.1196 vs. the last close of 7.1180.
About the fix
China maintains strict control of the yuan’s rate on the mainland.
The onshore yuan (CNY) differs from the offshore one (CNH) in trading restrictions, this last one is not as tightly controlled.
Each morning, the People’s Bank of China (PBOC) sets a so-called daily midpoint fix, based on the yuan’s previous day's closing level and quotations taken from the inter-bank dealer.
- Gold Price picks up bids to refresh intraday high, prints three-day uptrend despite mild weekly gains.
- Bullish chart formation, downbeat US Dollar allow XAU/USD bulls to keep the reins during sluggish session.
- US Dollar moves, risk catalysts and mid-tier China data eyed for immediate directions.
Gold Price (XAU/USD) prints a three-day winning streak near $1,965 as the US Dollar remains depressed during early Wednesday. In doing so, the precious metal also cheers hopes of China’s more stimulus and the cautious optimism in the markets amid an absence of Federal Reserve (Fed) policymakers’ speeches due to the pre-FOMC blackout, as well as due to a light calendar.
That said, the US Dollar Index (DXY) reverses the previous day’s corrective bounce while taking offers around 104.00, down 0.10% on a day by the press time. In doing so, the greenback’s gauge versus six major currencies suffers from downbeat market bets on the Fed’s next move.
“Fed funds futures traders see the Fed as likely to then resume rate increases, with a 65% chance of an at least 25 basis-point increase in July, according to the CME Group's FedWatch Tool," said Reuters late on Tuesday. It’s worth mentioning that the interest rate futures show a nearly 15% probability of a June rate hike. The reason could be linked to downbeat United States activity data released on Monday, as well as the previously dovish comments from the Federal Reserve (Fed) Officials ahead of the pre-Fed blackout.
Elsewhere, recently firmer China PMIs and measures to ease credit conditions at home allow the Gold Price to grind higher, as Beijing is one of the world’s biggest Gold consumers.
It should be noted, however, that a light calendar and no major noises in the markets restrict the Gold Price moves. While portraying the mood, the 10-year coupons remain sluggish at around 3.69% whereas the two-year counterparts rose a bit to 4.50%. On the same line, the technology stocks remained firmer but the manufacturing ones weighed on the sentiment and pared Wall Street’s gains. Additionally, the S&P500 Futures print mild gains by the press time and allow the XAU/USD to remain firmer.
Looking ahead, China’s monthly trade numbers will join the risk catalysts and momentum in the bond market to direct the Gold Price.
Gold Price Technical Analysis
Gold Price portrays an inverse head-and-shoulders (H&S) chart formation on the hourly play.
In addition to the bullish chart pattern, the XAU/USD’s sustained trading beyond the 200-Hour Moving Average (HMA), currently around $1,956, also keeps the buyers hopeful.
Furthermore, the upbeat prints of the RSI (14) line, not overbought, also underpins the bullish bias surrounding the Gold price.
With this, the XAU/USD is well-set to prod the aforementioned inverse H&S’s neckline, around $1,983 at the latest. However, further upside hinges on how well the Gold Price remains firmer past the $2,000 threshold, following its sustained break of the $1,983 hurdle.
On the contrary, a clear break of the 200-HMA support of near $1,956 could quickly drag the Gold Price towards the previous monthly low of near $1,932 marked in the last week. That said, the XAU/USD’s downside past $1,932 won’t hesitate to prod the $1,900 round figure.
Overall, the Gold Price is likely to remain firmer but the upside room seems limited.
Gold Price: Hourly chart
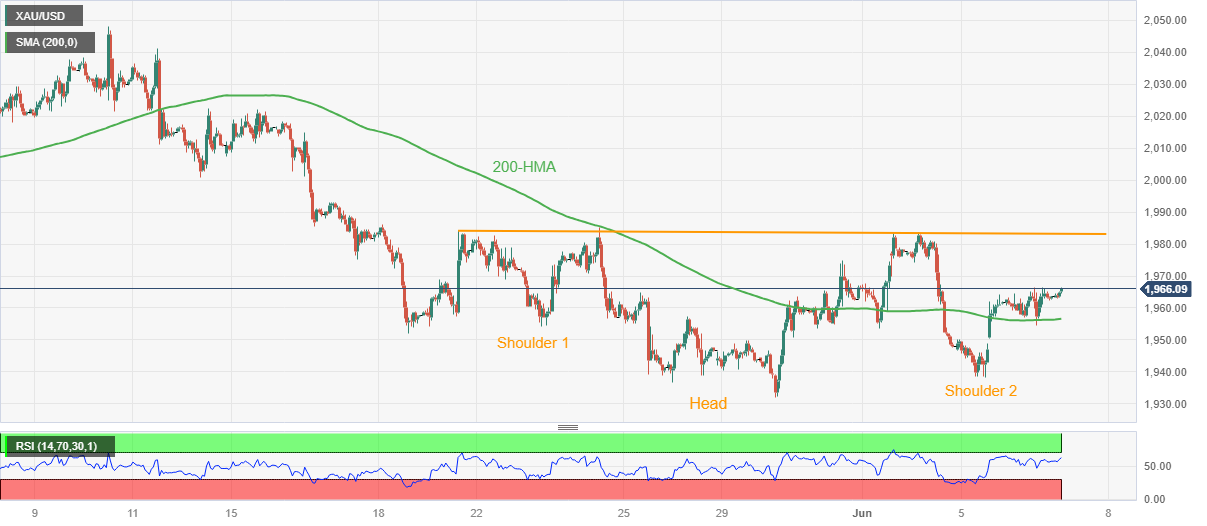
Trend: Further upside expected
- NZD/USD bulls in the market and eye a move to test resistances.
- The weekly M-formation is a compelling feature in this regard.
New Zealand Dollars rebounded from earlier dips on Monday, helped by China's data showing an accelerated recovery in the services sector. Additionally, the surprise hawkish decision from the Reserve Bank of Australia (RBA) has tugged the Bird along as well. At the time of writing, NZD/USD has rallied from the week´s peak low area finding support around the 0.6050s.
The following will illustrate the bias for an upside move on Wednesday:
NZD/USD weekly chart
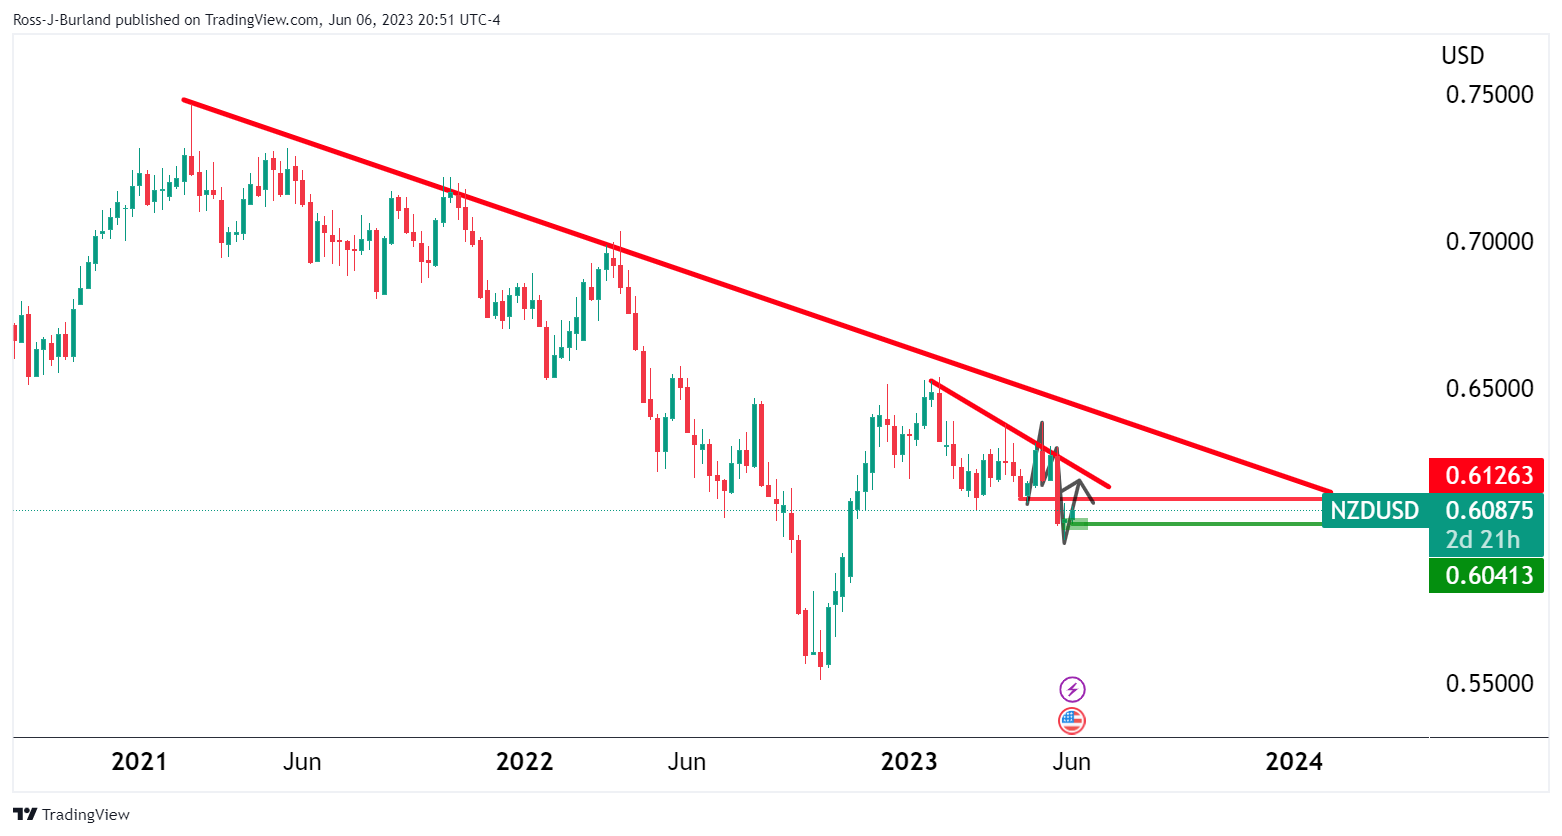
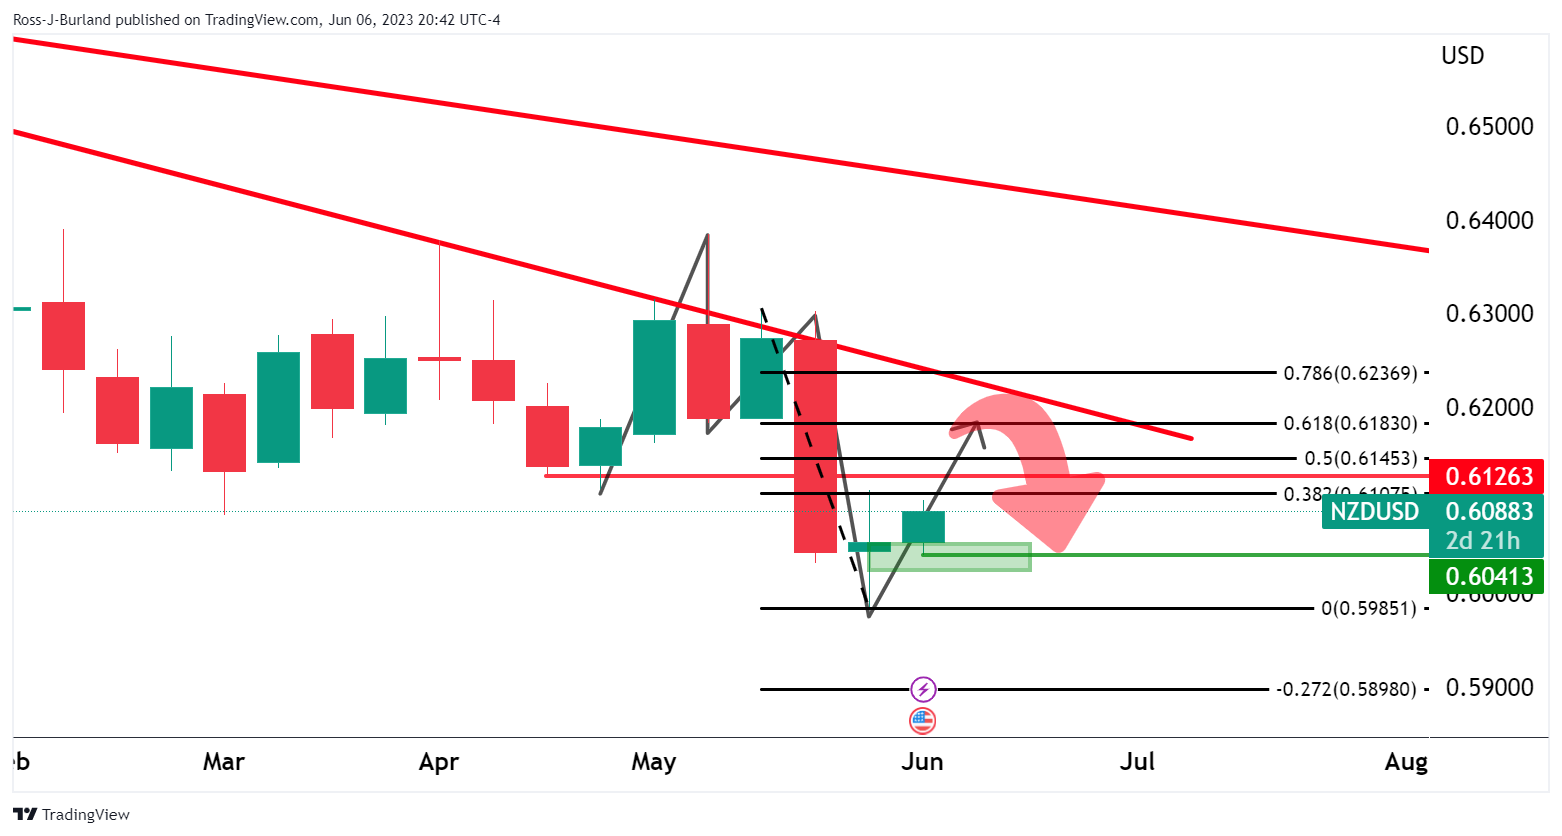
The weeklñy M-formation is compelling. This is a reversion pattern and the bulls are moving in for a target toward the neckline and a 61.8% Fibonacci. This meets the trenmdlñine resistance as well.
NZD/USD daily chart
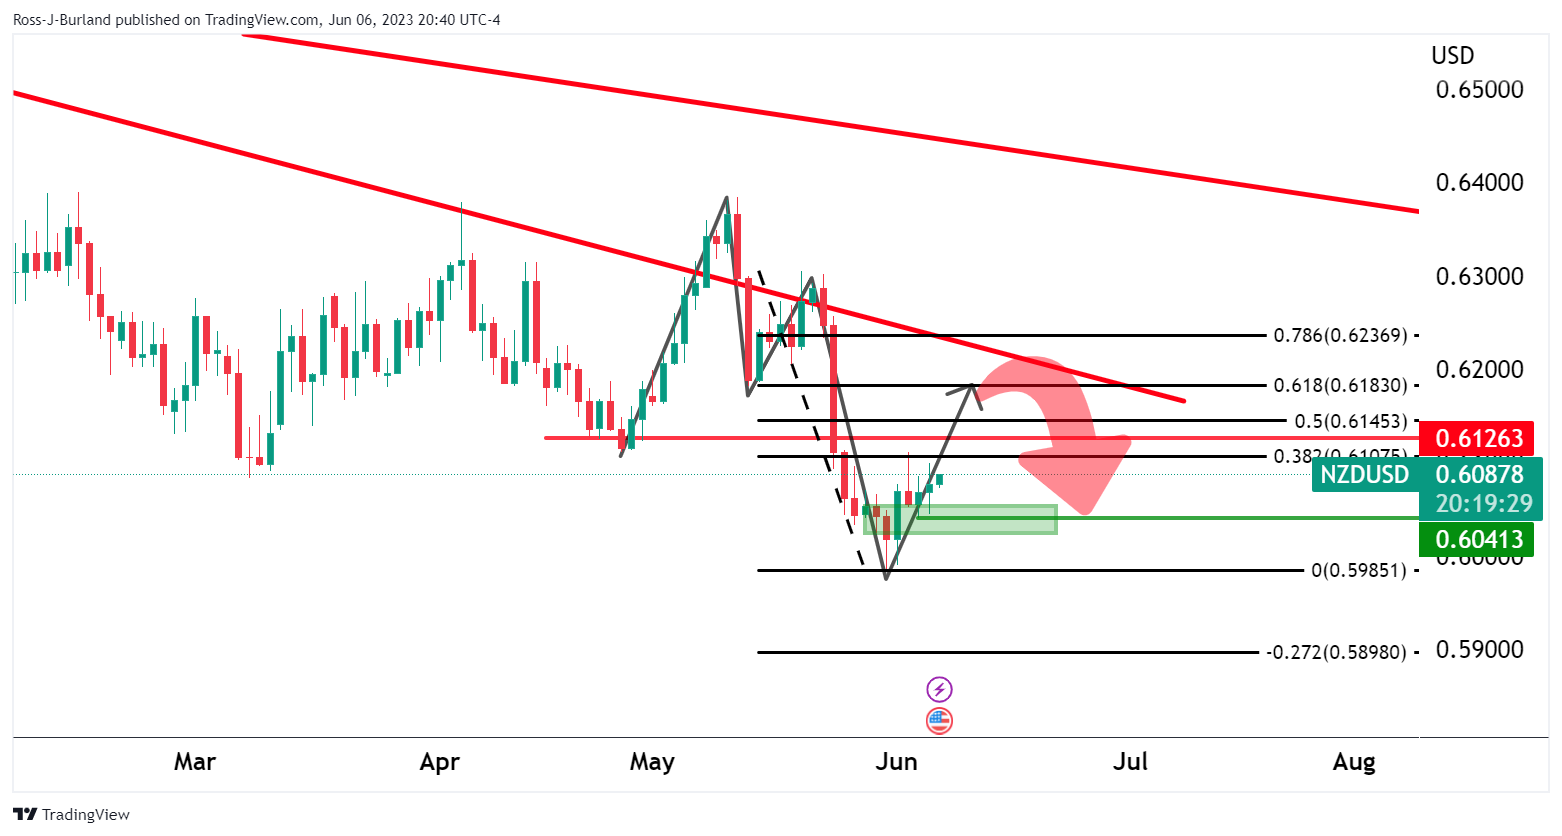
The daily chart aligns with the bullish bias as for the support area that is holding so far:
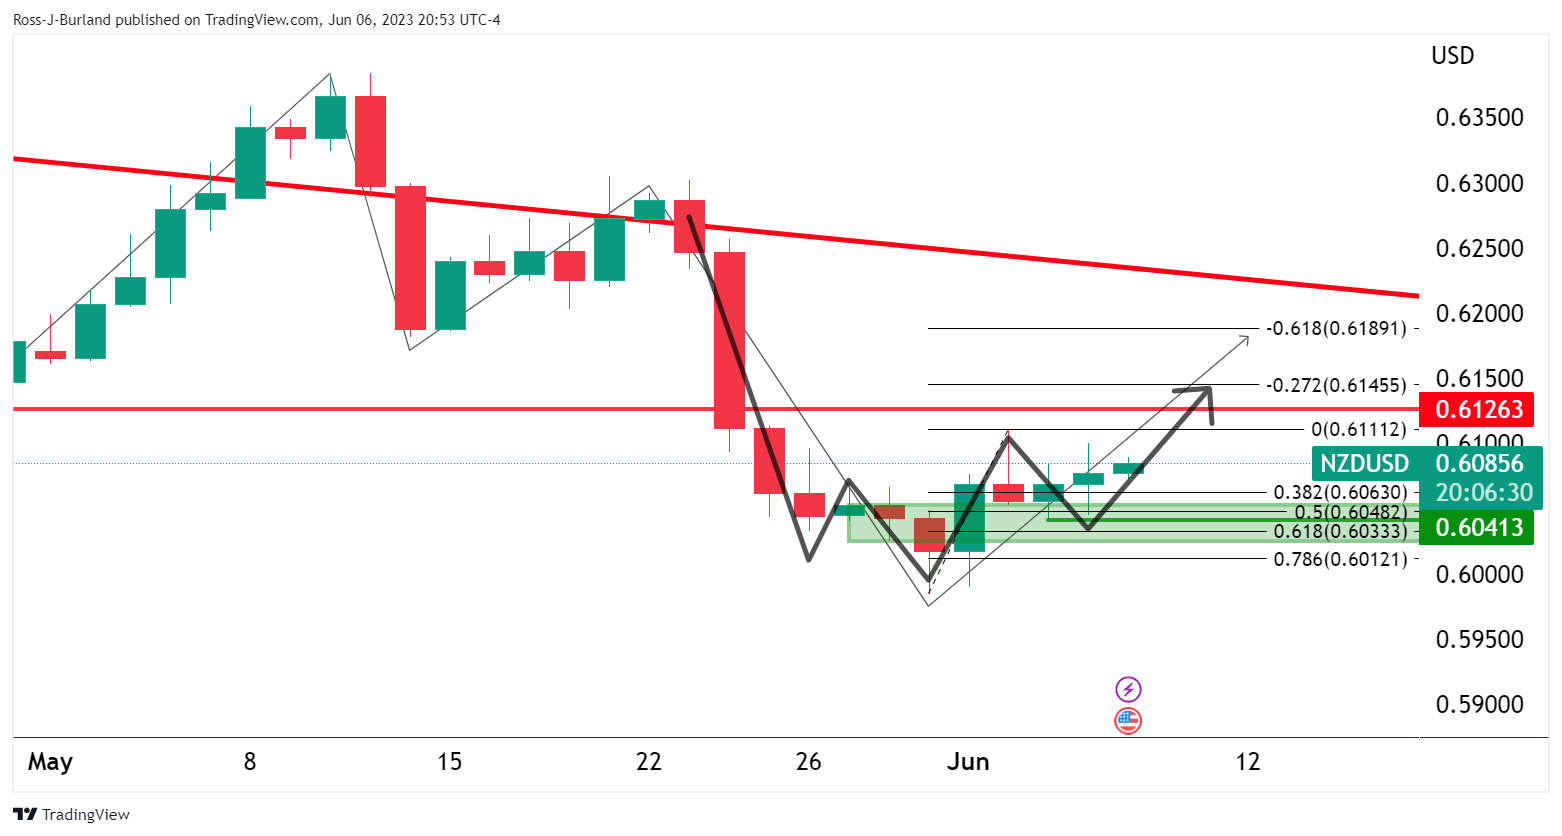
The correction was a 50% mean reversion that has held the test of time and bulls stay in control.
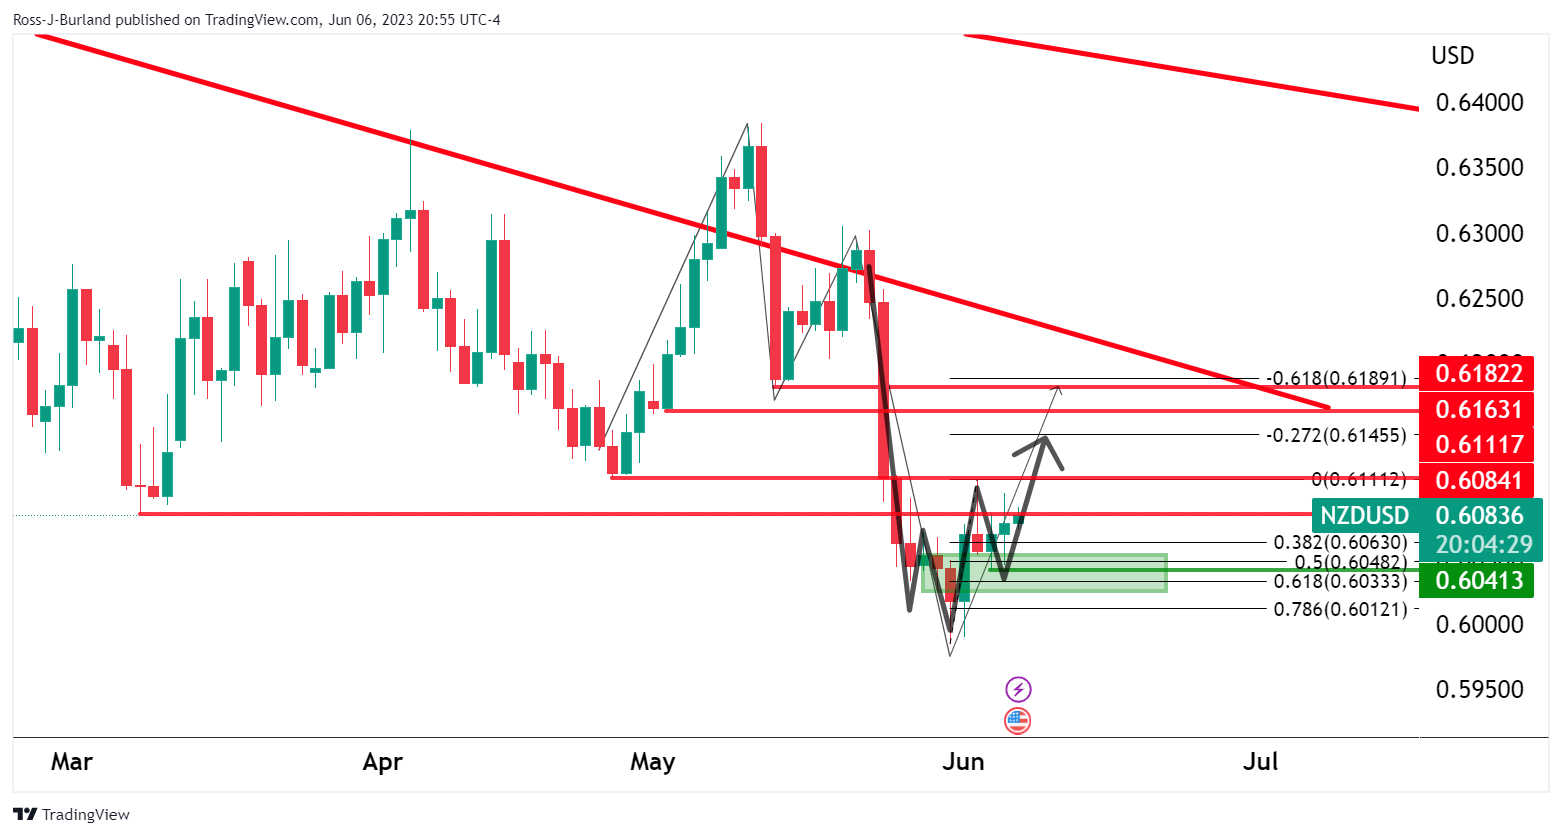
The levels to watch on the upside are highlighted above.
- EUR/USD picks up bids to refresh intraday high, bounces off weekly low.
- Upbeat RSI, MACD signals joins sustained rebound from weekly triangle’s support to favor Euro bulls.
- Convergence of 200-HMA, 100-HMA and triangle’s top line checks EUR/USD bulls before giving them control.
EUR/USD bulls attack the 1.0700 threshold while refreshing the intraday high early Wednesday. In doing so, the Euro pair reverses the previous day’s losses within a one-week-old symmetrical triangle.
It’s worth noting that the bullish MACD signals and upbeat RSI (14) line, not overbought, back the Euro pair’s rebound from the stated triangle’s support line, suggesting further advances in the price.
Furthermore, the latest divergence between the interest rate bets on the European Central Bank (ECB) and the Federal Reserve (Fed) also lure the EUR/USD buyers.
Also read: EUR/USD replicates sluggish markets around 1.0700 amid challenges for ECB hawks, Fed blackout
However, the 200-Hour Moving Average (HMA), 100-HMA and the aforementioned triangle’s top line together highlight the 1.0720 level as a tough nut to crack for the EUR/USD bulls.
Should the major currency pair manages to remain firmer past 1.0720, the odds of witnessing a quick jump toward Friday’s high of around 1.0780 can’t be ruled out.
Following that, the 1.0800 may act as a buffer during the EUR/USD pair’s likely run-up towards the mid-May peak surrounding 1.0910.
Alternatively, EUR/USD pullback remains elusive unless the quote stays beyond the bottom of the short-term triangle, close to 1.0665 by the press time.
In a case where the Euro pair remains bearish past 1.0665, May’s low of 1.0635 can act as the last defense of the buyers before highlighting the troughs of March and January, 1.0515 and 1.0480, as the key supports.
EUR/USD: Hourly chart
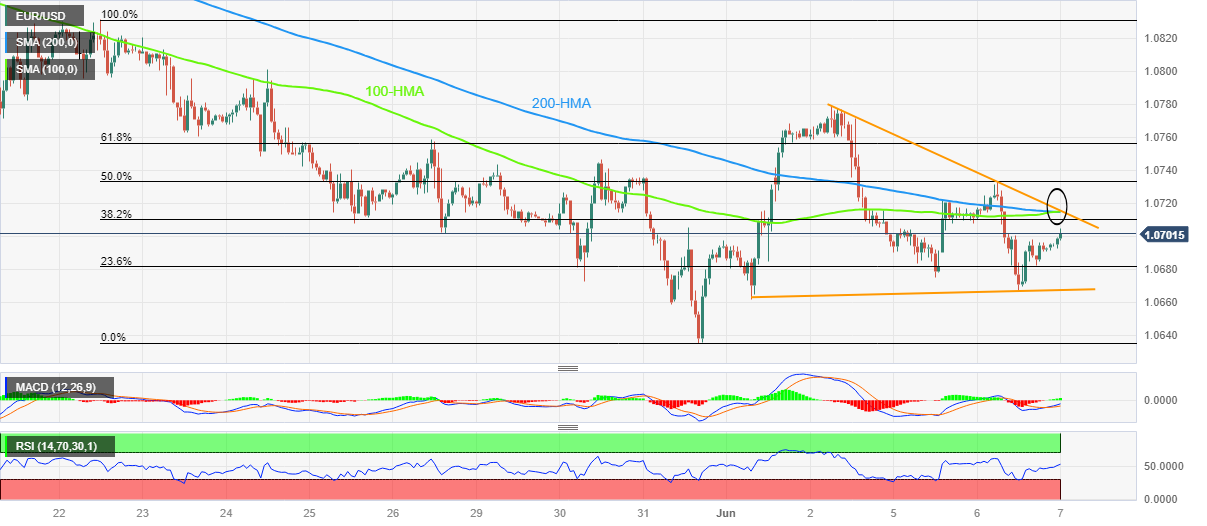
Trend: Further upside expected
Australian GDP overview
Reserve Bank of Australia’s (RBA) surprise increase in interest rates and expectations of solid economic recovery highlights Australia’s first-quarter (Q1) Gross Domestic Product (GDP) figures, up for publishing at 01:30 GMT on Wednesday, for the AUD/USD pair traders.
The recent data from Australia portray a mixed picture as downbeat housing market data, inflation numbers and mixed employment report contrasts with upbeat Retail Sales. Even with these statistics in mind, the Aussie Q1 GDP is likely to print slightly softer figures and could prod the AUD/USD bulls.
That said, forecasts suggest the annualized pace of economic growth to come in at 2.4%, softer than the previous period's 2.7%, while the quarter-on-quarter (QoQ) numbers could ease with 0.3% growth figures versus 0.5% prior.
Ahead of the outcome, Analysts at ANZ said,
Market is expecting a 0.3% q/q rise in GDP. We are a touch above at +0.4%.
How could it affect the AUD/USD?
AUD/USD stays on the front foot for the consecutive fifth day as bulls prod the highest level in three weeks, marked the previous day, after witnessing hawkish comments from Reserve Bank of Australia (RBA) Governor Philip Lowe, as well as the RBA’s surprise rate lift. Adding strength the Aussie pair’s run-up could be the cautious optimism in the market, as well as hopes of economic recovery in China.
It’s worth noting, however, that the upside limit to the RBA rates appears too close to hit and Governor Lowe also said, “Ambition is to navigate narrow path where inflation returns to target and economy grows.” With this, challenges for the Aussie bulls are high in a case where the Australian Q1 GDP disappoints the markets. Even so, China’s trade figures for May and concerns about RBA can keep the AUD/USD bulls on the lookout for more clues.
Hence, AUD/USD is likely to remain firmer despite an anticipated weakness in the Aussie growth figures. Even if the figures mark extreme disappointment, the downside might turn out as ephemeral amid the hawkish RBA concerns and also due to the Fed blackout period.
Technically, an upside break of the previous support line stretched from early March, around 0.6620 by the press time, joins successful trading beyond the 50-DMA of around 0.6665 to enable the AUD/USD bulls to aim for the 200-DMA hurdle of near the 0.6700 threshold.
Key notes
AUD/USD bulls approach 0.6700 as RBA’s Lowe sounds hawkish, Australia GDP eyed
AUD/USD Forecast: Aussie likely to test 0.6700 after hawkish RBA meeting
About the Aussie GDP release
The Gross Domestic Product released by the Australian Bureau of Statistics is a measure of the total value of all goods and services produced by Australia. The GDP is considered a broad measure of economic activity and health. A rising trend has a positive effect on the AUD, while a falling trend is seen as negative (or bearish) for the AUD.
| Index | Change, points | Closed | Change, % |
|---|---|---|---|
| NIKKEI 225 | 289.35 | 32506.78 | 0.9 |
| Hang Seng | -9.22 | 19099.28 | -0.05 |
| ASX 200 | -86.7 | 7129.6 | -1.2 |
| DAX | 28.55 | 15992.44 | 0.18 |
| CAC 40 | 8.09 | 7209 | 0.11 |
| Dow Jones | 10.42 | 33573.28 | 0.03 |
| S&P 500 | 10.06 | 4283.85 | 0.24 |
| NASDAQ Composite | 46.99 | 13276.42 | 0.36 |
- Silver Price struggles for clear directions after snapping two-day downtrend the previous day.
- Sustained trading beyond a convergence of 200-HMA, one-week-old rising trend line keeps XAG/USD buyers hopeful.
- Steady RSI (14) adds strength to expectations of further grinding towards the north.
- Double tops around $24.00 appear tough nuts to crack for the Silver buyers.
Silver Price (XAG/USD) picks up bids to defend the previous day’s corrective bounce off the short-term key support, mildly bid near $23.60 during early Wednesday in Asia.
In doing so, the bright metal rebounds from a convergence of the 200-Hour Moving Average (HMA) and an upward-sloping support line from May 30, close to $23.60-65.
Apart from the clear bounce off important support, the steady RSI (14) line also keeps the XAG/USD buyers hopeful.
However, a three-week-old double top formation of around $24.00 challenges the Silver buyers before giving them control.
In a case where the XAG/USD remains firmer past $24.00, the 61.8% Fibonacci retracement of the metal’s May 10-26 May, around $24.70, will act as the last defense of the Silver buyers.
Following that, the $26.00 round figure and the previous monthly high of around $26.15 will be in the spotlight.
On the contrary, a clear downside break of $23.40 won’t hesitate to portray an immediate fall toward the $23.00 round figure, a break of which could direct the XAG/USD sellers toward the previous monthly low of near $22.70.
Silver Price: Hourly chart
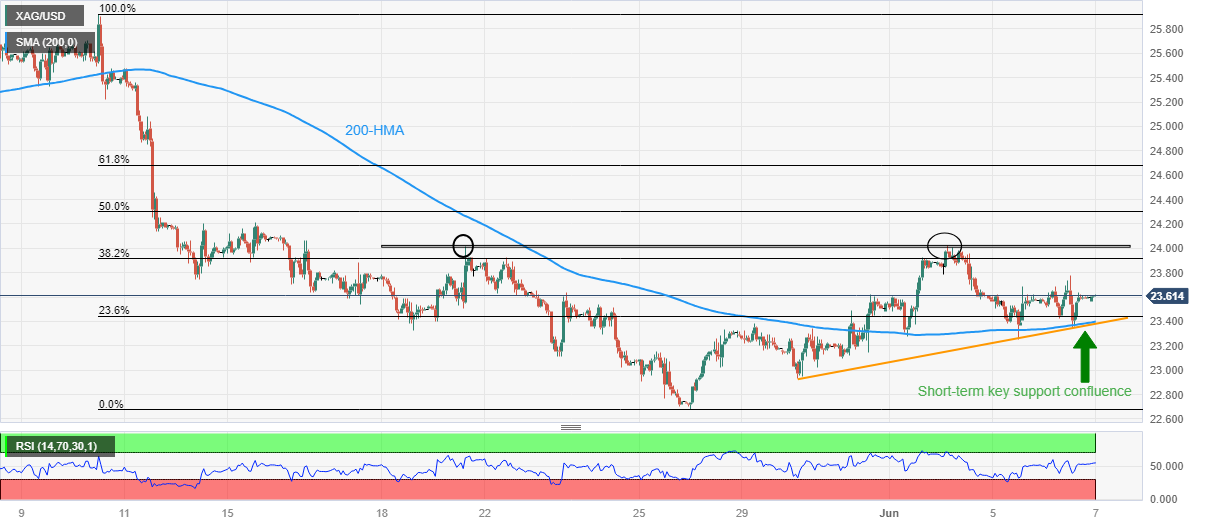
Trend: Limited upside expected
| Pare | Closed | Change, % |
|---|---|---|
| AUDUSD | 0.66685 | 0.76 |
| EURJPY | 149.313 | -0.12 |
| EURUSD | 1.06939 | -0.19 |
| GBPJPY | 173.423 | -0.05 |
| GBPUSD | 1.24198 | -0.12 |
| NZDUSD | 0.60752 | 0.05 |
| USDCAD | 1.34006 | -0.3 |
| USDCHF | 0.90753 | 0.17 |
| USDJPY | 139.636 | 0.07 |
- US Dollar strengthened against the Swiss Franc on Tuesday’s session at the 0.9075 area.
- Focus shifts to the next US CPI reading, the Fed’s interest decision next week.
- US bond yields limited the greenback’s gains.
The USD/CHF closed Tuesday’s session at the 0.9075 area, recording a 0.16% gain. The US dollar benefited from a cautious market mood despite US bond yields retreating ahead of next week's CPI and interest decision from the Fed. In addition, fears of a global economic downturn amid a fresh cycle of rate hikes by the main central banks may continue to cushion the US Dollar.
Markets anticipate a pause by the Fed on June 13-14
According to the CME FedWatch Tool, investors are currently predicting a 73.6% chance that the Federal Reserve (Fed) will not raise interest rates at their upcoming meeting in June, instead keeping the target rate at 5.25%. However, this decision will largely depend on the forthcoming May Consumer Price Index (CPI) data. It is anticipated that the headline inflation will slow down to 4.2% (year-on-year) from the previous 4.9%, while the Core rate is expected to increase to 5.6% (year-on-year) from the previous reading of 5.5%. Consequently, the market's expectations regarding the Fed's decision could potentially impact the strength of the US Dollar.
Regarding the market sentiment, in Wednesday’s session, China will release key economic data which may have an impact on the prospects of a global economic downturn and hence, a weak reading may further support the greenback.
Levels to watch
According to the daily chart, the technical outlook slightly favours the USD but indicators turned somewhat flat in positive territory. Meanwhile, the 20- and 100-day Simple Moving Averages (SMA) seem to be converging towards the 0.9100 area, hinting at a possible bullish cross by the 20-day SMA to confirm the shorter-term positive outlook.
On the upside, the mentioned level of the SMAs convergence stands as the first resistance for the bulls. Then, the following levels to watch stand at 0.9150 and 0.9180. On the downside, the 20-day SMA at 0.9030 stands as immediate support followed by the 0.9000 psychological mark and the 0.8980 area.
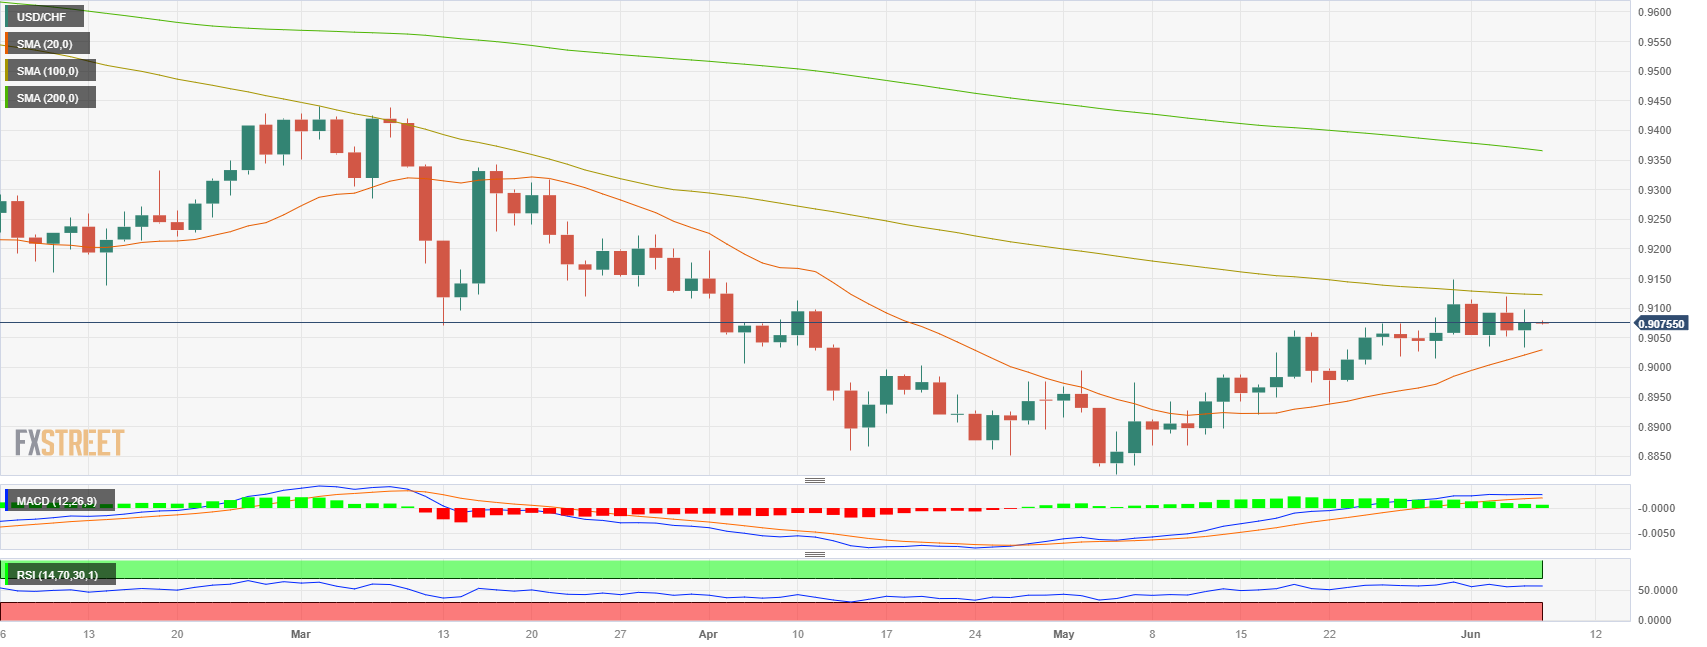


© 2000-2026. Bản quyền Teletrade.
Trang web này được quản lý bởi Teletrade D.J. LLC 2351 LLC 2022 (Euro House, Richmond Hill Road, Kingstown, VC0100, St. Vincent and the Grenadines).
Thông tin trên trang web không phải là cơ sở để đưa ra quyết định đầu tư và chỉ được cung cấp cho mục đích làm quen.
Giao dịch trên thị trường tài chính (đặc biệt là giao dịch sử dụng các công cụ biên) mở ra những cơ hội lớn và tạo điều kiện cho các nhà đầu tư sẵn sàng mạo hiểm để thu lợi nhuận, tuy nhiên nó mang trong mình nguy cơ rủi ro khá cao. Chính vì vậy trước khi tiến hành giao dịch cần phải xem xét mọi mặt vấn đề chấp nhận tiến hành giao dịch cụ thể xét theo quan điểm của nguồn lực tài chính sẵn có và mức độ am hiểu thị trường tài chính.
Sử dụng thông tin: sử dụng toàn bộ hay riêng biệt các dữ liệu trên trang web của công ty TeleTrade như một nguồn cung cấp thông tin nhất định. Việc sử dụng tư liệu từ trang web cần kèm theo liên kết đến trang teletrade.vn. Việc tự động thu thập số liệu cũng như thông tin từ trang web TeleTrade đều không được phép.
Xin vui lòng liên hệ với pr@teletrade.global nếu có câu hỏi.
ngân hàng