- Phân tích
- Tin tức và các công cụ
- Tin tức thị trường
Tin tức thì trường
- US Dollar Index edges lower as weak US data weigh on hawkish Fed bets.
- Pre-FOMC blackout, light calendar elsewhere also prod DXY bulls.
- Absence of US default fears jostles with fresh banking woes to challenge risk appetite.
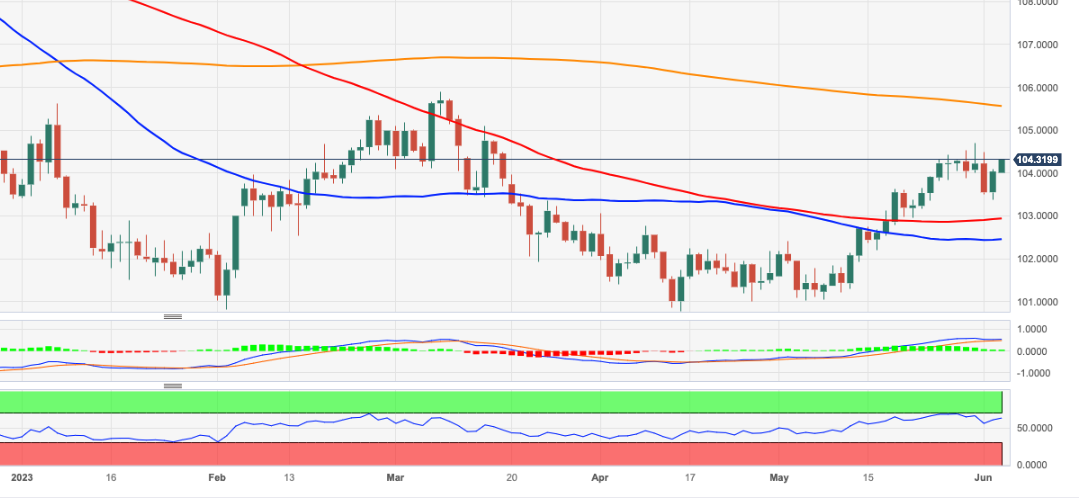
US Dollar Index (DXY) stays defensive near 104.00 amid early Tuesday, after a volatile week-start that initially portrayed a run-up to 104.40 before marking a no-change day in the end.
The greenback’s gauge versus six major currencies dropped the previous day amid downbeat US data and Treasury bond yields. In doing so, the DXY also bears the burden of an absence of the Federal Reserve (Fed) talks amid the pre-FOMC blackout ahead of next week’s monetary policy meeting.
Talking about the data, US ISM Services PMI declined to 50.3 for May versus 51.5 expected and 51.9 prior whereas growth of the Factory Orders also deteriorated during the stated month to 0.4% versus 0.5% market forecasts and 0.9% previous readings. It should be noted that the final readings of S&P Global Composite PMI and Services PMI also marked softer figures for May.
With the softer US statistics, the market’s bets on the Fed’s June rate hike dropped from around 80% in the middle of the last week to nearly 25%. The same could have joined an absence of the Fed talks to weigh on the US Treasury bond yields and the US Dollar.
It should be noted, however, that International Monetary Fund (IMF) Managing Director Kristalina Georgieva suggested during the weekend that the Fed needs to do more to tame inflation, which in turn probed the Gold buyers.
Elsewhere, concerns about the need for the US large banks to hold more capital to battle the landing crisis contrasted with the policymakers’ ability to avoid the debt-ceiling expiration and confused the market players, as well as the DXY traders.
Moving on, a light calendar and the Fed blackout may keep troubling the momentum traders. That said, the US Consumer Price Index for May, due on June 13, is the next major US economic release before the Federal Open Market Committee (FOMC) monetary policy meeting on June 13-14.
Technical analysis
Monday’s “Gravestone Doji” bearish candlestick on the DXY’s daily chart drags it to the 100-day Exponential Moving Average (EMA) support of around 103.35.
- The Euro gained against the GBP on Monday for a second consecutive session.
- UK reported upbeat PMI revisions and while the EU reported weaker figures.
- The Euro held its foot on the back of hawkish comments from ECB’s Lagarde.
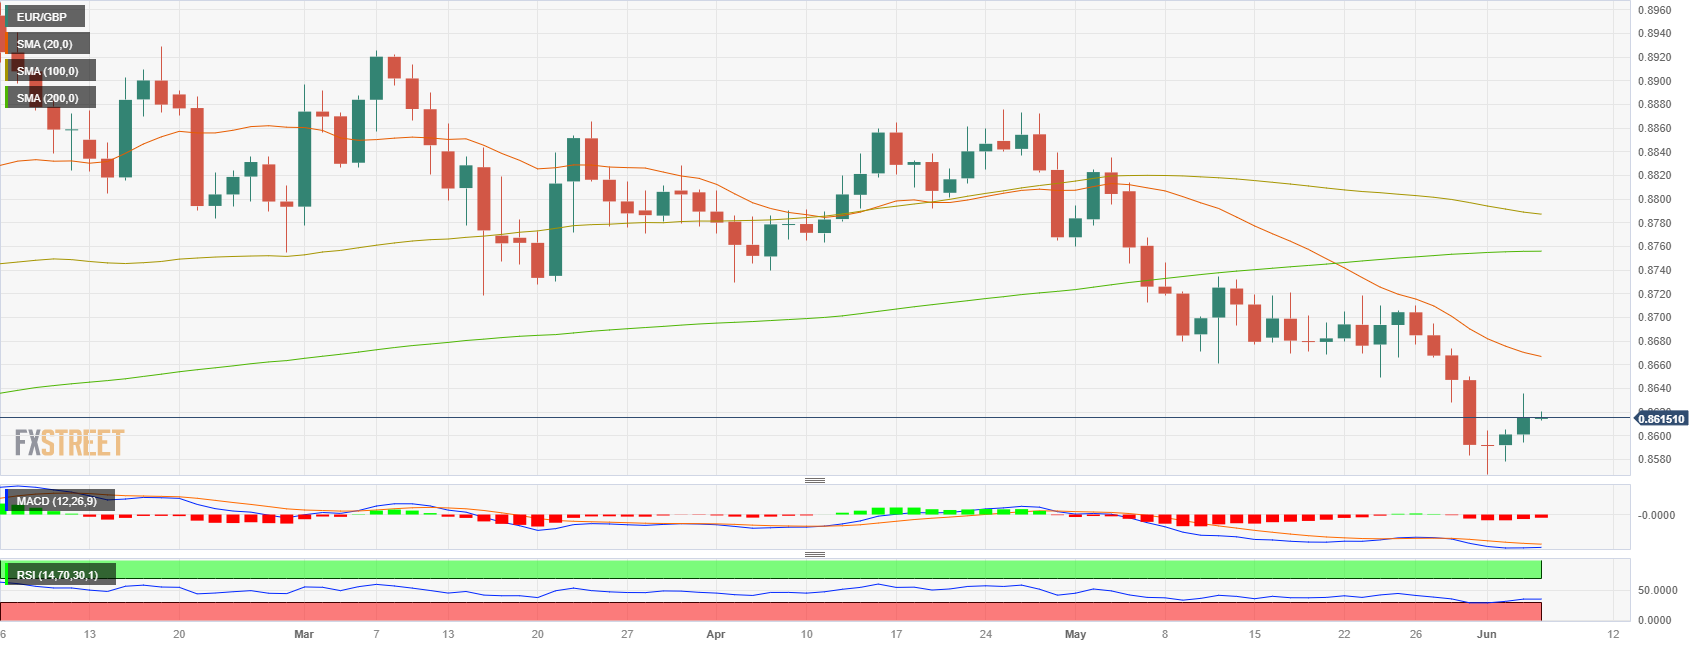
At the beginning of the week, the EUR/GBP gained traction, closing near 0.8615 as the Euro gained traction on the back of hawkish comments from European Central Bank (ECB) president Christine Lagarde. On the other hand, the Sterling, traded weak against most of its rivals, despite strong PMI revisions.
Hawkish comments from Lagarde gave the Euro impulse
According to S&P Global and Hamburg Commercial Bank (HCOB), the Composite PMI from the European Union (EU) decreased to 52.8 in May, which was lower than both the consensus estimate of 53.3 and the initial reading of 53.3. Similarly, the Services PMI was revised downward to 55.1 from 55.9.
However, the Euro managed to hold its ground on the back of Christine Lagarde's comments at the beginning of the American session, showing concern with persistent inflationary pressures. Rising German yields, with 10-year and 2-year bonds, were up by over 3%, signalling market anticipation of the ECB's proactive measures to tackle inflation concerns.
On the British side, the May final estimates of the S&P Global/CPIS, the Composite Purchasing Managers' Index (PMI), saw an upward revision, reaching 54 from the initial reading of 53.9. Similarly, the Services PMI was revised upwards to 55.2 from the previous figure of 55.1.
Levels to watch
Technically speaking, the EUR/GBP maintains a bearish outlook for the short term, as per indicators on the daily chart. The Relative Strength Index (RSI) and Moving Average Convergence Divergence (MACD) are both showing weakness, standing deep in negative territory. The pair trades below its main moving averages, indicating that the sellers have the upper hand.
In case the pair sees more downside, support levels line up at the 0.8600 zone and below around the 0.8580 area and the multi-month low at the 0.8565 level. Furthermore, a move above 0.8620 would pave the way towards the 0.8650 area and the 20-day Simple Moving Average at 0.8665.
- AUD/USD grinds near the highest level in a fortnight after three-day uptrend.
- Convergence of 50-DMA, 50% Fibonacci retracement guards immediate upside.
- Upbeat oscillators, recovery from falling wedge’s bottom line keeps Aussie buyers hopeful.
- RBA is expected to keep current monetary policy unchanged amid market’s indecision.
AUD/USD bulls take a breather around 0.6620, making rounds to a two-week high amid Tuesday’s sluggish session as Aussie pair traders await the Reserve Bank of Australia’s (RBA) Interest Rate Decision. In doing so, the quote remains sidelined after rising in the last three consecutive days, following a bounce off the yearly falling wedge’s bottom line.
Also read: Reserve Bank of Australia Preview: AUD/USD ready for another hike?
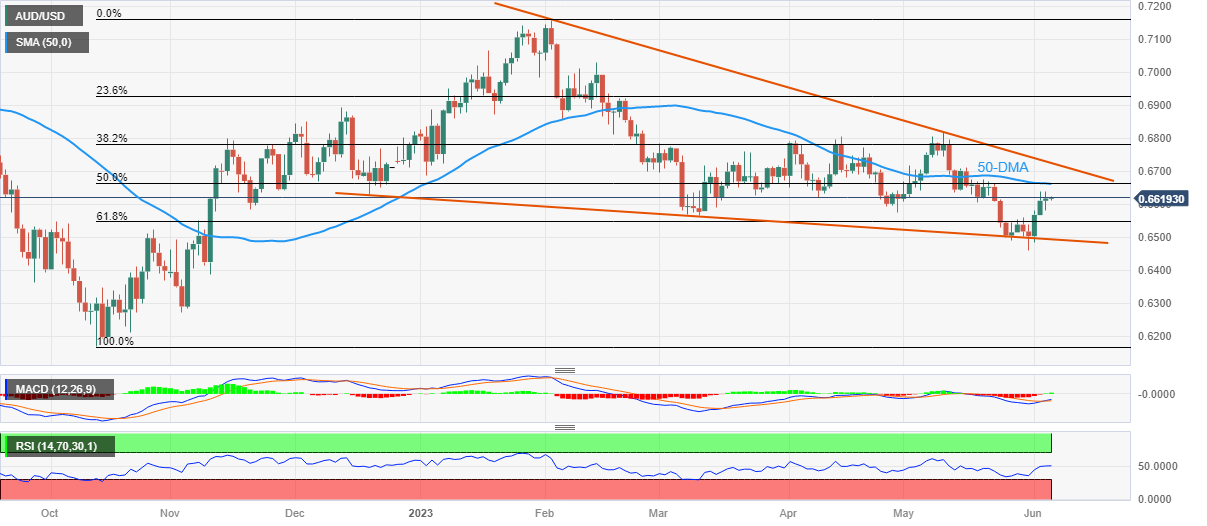
The Aussie pair’s rebound from the support line of a falling wedge established since late December 2022 crossed 61.8% Fibonacci retracement of October 2022 to February 2023 upside and teased the buyers in the last few days. Adding strength to the upside momentum are the recently bullish MACD signals and upbeat RSI (14) line to keep buyers hopeful.
With this, the AUD/USD pair is all set to confront a convergence of the 50% Fibonacci retracement level and the 50-DMA, around 0.6660. However, any further upside beyond the same hinges on the RBA’s capacity to lure the bulls.
Following that, the aforementioned falling wedge bullish chart pattern’s top line, close to 0.6730 at the latest, becomes crucial to watch for clear directions.
Should the quote rises past 0.6730, the odds of witnessing a run-up towards crossing the previous monthly high of around 0.6720 can’t be ruled out.
On the contrary, pullback moves may initially aim for the 61.8% Fibonacci retracement level, also known as the golden Fibonacci ratio, close to 0.6545 at the latest.
However, the AUDUSD bears need validation from the wedge’s bottom line, surrounding 0.6495 by the press time.
AUD/USD: Daily chart
Trend: Further upside expected
- AUD/JPY experiences a risk-off impulse amid decelerating US business activity and RBA’s monetary policy.
- Despite a lingering upward bias, market sentiment may shift due to the pair’s sensitivity to risk changes, potentially leading to violent swings.
- A balance of technical indicators suggests that AUD/JPY could target a lower range, with resistance remaining at the four-month and year-to-date highs.
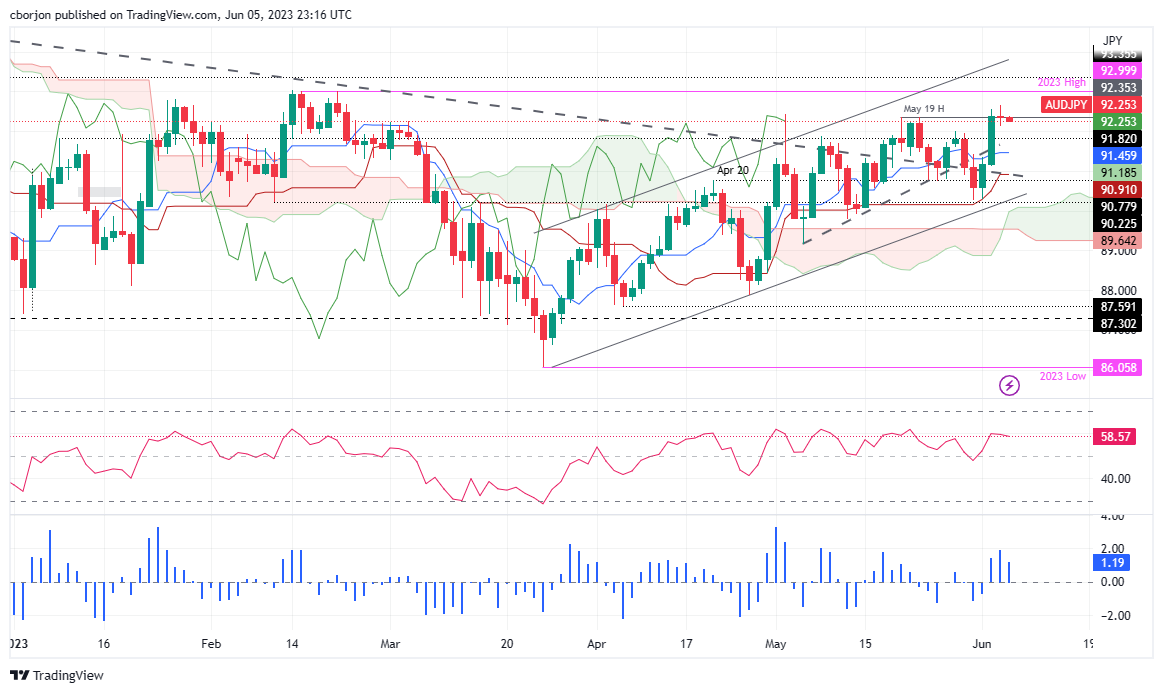
AUD/JPY forms a doji, as shown by the daily chart, after hitting a fresh four-month high at 92.66, hovering nearby the 92.30s area, after trading within the 9213/66 range on Monday. A risk-off impulse was the main reason behind price action, with US business activity decelerating, while expectations for the Reserve Bank of Australia (RBA) to keep unchanged its interest rates at the upcoming monetary policy on Tuesday pressures the Aussie (AUD).
AUD/JPY Price Analysis: Technical outlook
From a daily chart perspective, the AUD/JPY is still upward biased, but given the nature of being used as a currency pair that reflects market sentiment, a risk-off impulse could shift the bias of the AUD/JPY. As long as the AUD/JPY remains above the Ichimoku cloud, the pair is upwards, but the Chikou Span, piercing May 2 candlestick chart at around 92.25, could trigger a sell signal, which could lower the price.
The Relative Strength Index (RSI) indicator is still bullish, but the three days Rate of Change (RoC) portrays that buying pressure is easing. Therefore, the AUD/JPY could aim toward the Tenkan-Sen Line at 91.46, as an initial target, in the near term, followed by the confluence of a support trendline and the Kijun Sen at 90.91.
Conversely, the AUD/JPY first resistance would be the four-month high at 92.66 before testing the YTD high at 92.99. A breach of the latter will expose the last year’s YTD high of 98.59.
AUD/JPY Price Action – Daily chart
- GBP/USD stays defensive after pushing back Cable bears the previous day.
- Softer US data fails to impress Pound Sterling bulls amid mixed concerns about BoE.
- UK’s higher inflation clues jostle with British growth fears to prod GBP/USD bulls.
- Absence of Fed talks, major UK data adds strength to cable pair’s sluggish move.
GBP/USD struggles for clear directions around 1.2435-40 amid early Tuesday in Asia, despite bouncing off a short-term key support line the previous day. In doing so, the Cable pair portrays the market’s indecision while also fails to cheer the downbeat US data amid mixed concerns about the Bank of England’s (BoE) next step.
On Monday, market players witnessed downbeat US statistics, as well as improved prints of the UK S&P Global/CIPS PMIs. However, the same initially underpinned the GBP/USD to rebound from a three-month-old rising support line before the recession woes and indecision at the BoE weighed on the Pound Sterling.
That said, US ISM Services PMI declined to 50.3 for May versus 51.5 expected and 51.9 prior whereas growth of the Factory Orders also deteriorated during the stated month to 0.4% versus 0.5% market forecasts and 0.9% previous readings. It should be noted that the final readings of S&P Global Composite PMI and Services PMI also marked softer figures for May.
On the other hand, final readings of the UK S&P Global/CIPS Services PMI and Composite PMI for May improved to 54.0 and 55.2 versus 53.9 and 55.1 initial expectations. Recently, UK BRC Like-for-Like Retail Sales growth slide to 3.7% YoY for May versus 5.2% prior. Furthermore, the latest survey from Barclays mention that the UK May Consumer Spending rose 3.6% YoY as higher food prices limit discretionary spending.
Following the data, Reuters said, “Recent data indicates previous BoE hikes are beginning to slow the UK economy, which could reignite UK recession fears and thus pressure more MPC members to vote for steady rates to help jumpstart the economy, removing the primary stimulus sterling strength.”
Elsewhere, US receding hawkish bets on the Federal Reserve (Fed) and concerns about the need for the US large banks to hold more capital to battle the landing crisis contrast with the policymakers’ ability to avoid the debt-ceiling expiration.
It should be noted that the latest political jitters in the UK, especially after the late May local elections, also prod the GBP/USD buyers.
Amid these plays, the US benchmark yields dropped on Monday while Wall Street closed in the red, with mild losses. That said, the US Dollar Index (DXY) dropped and reversed the early-day gains to end in the red with minor losses around 104.10.
To sum up, the inflation woes appear to lack the strength to keep the GBP/USD pair firmer as the market fears the UK recession and further challenges for the BoE hawks.
Moving on, a light calendar and the absence of the Fed talks keep the GBP/USD pair at the mercy of the risk catalysts.
Technical analysis
GBP/USD fades bounce off a three-month-old ascending support line, around 1.2375 by the press time, amid failure to cross a horizontal resistance zone comprising multiple levels marked since mid-April, close to 1.2545-50 at the latest.
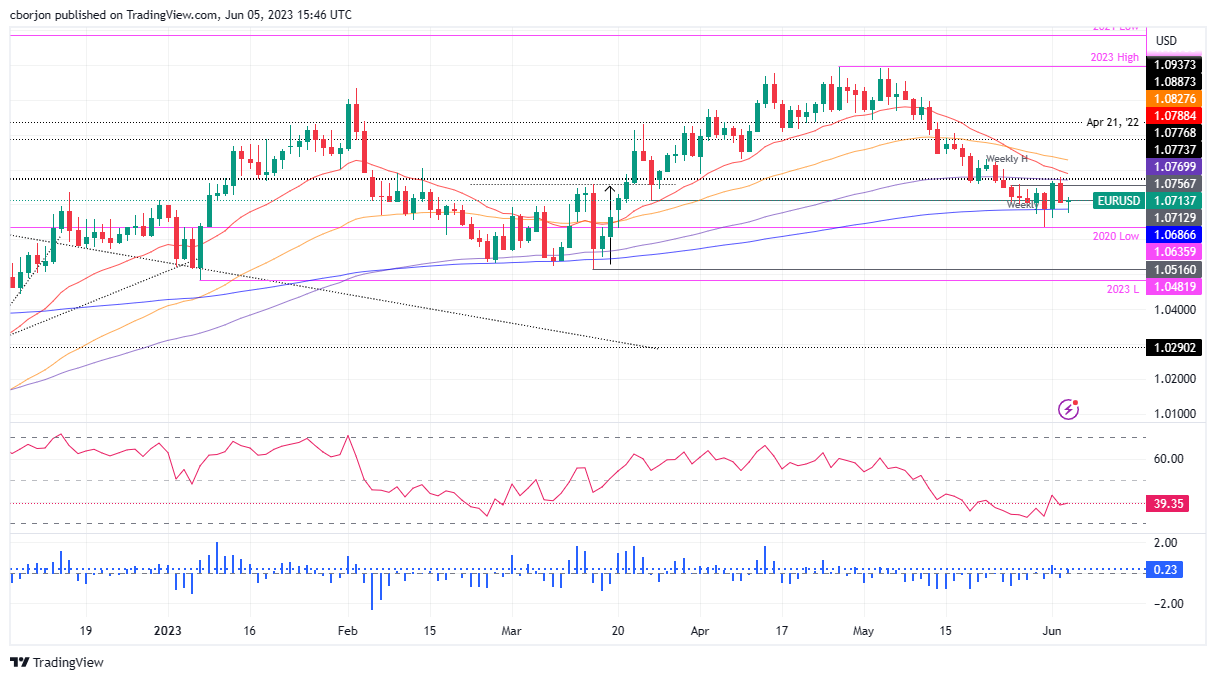
- EUR/USD fades the week-start rebound amid sluggish oscillators.
- Failure to cross the key upside hurdles during previous week’s recovery lures Euro sellers.
- One-week-old ascending support line, 78.6% Fibonacci retracement limit short-term downside.
EUR/USD retreats towards 1.0700 amid the early hours of Tuesday’s Asian session after a volatile day. That said, the Euro pair initially cheered the downbeat US data before paring the gains and closing the day around the week-start levels.
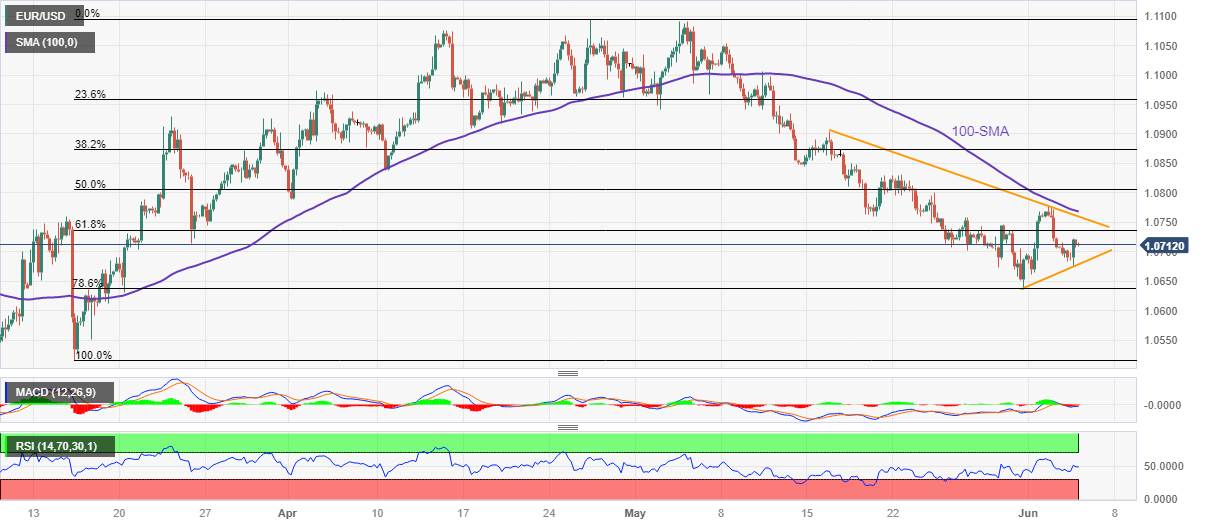
That said, the major currency pair’s latest pullback could be linked to the sluggish RSI (14) line surrounding the 50.0 levels suggesting the continuation of a lower grind. On the same line could be the MACD signals which are bearish but losing the momentum strength of late.
As a result, the EUR/USD pair’s slow grind toward the south can’t be ruled out, which in turn highlights a one-week-old rising support line, close to 1.0675 at the latest, as immediate support to watch for the Euro sellers.
Following that, the 78.6% Fibonacci retracement level of the pair’s March-April rise, near 1.0635, will gain the EUR/USD bear’s attention.
Although the likely oversold RSI around 1.0635 will prod the Euro sellers around then, any further downside could make the pair traders vulnerable to refreshing the yearly low of around 1.0480.
Alternatively, a fortnight-long descending resistance line precedes the 100-SMA level, respectively near 1.0760 and 1.0770, limiting the short-term downside of the EUR/USD pair.
In a case where the Euro buyers remain in the driver’s seat past 1.0770, the 50% Fibonacci retracement level of the quote’s aforementioned upside, near 1.0805, will be in the spotlight.
EUR/USD: Four-hour chart
Trend: Further downside expected
- GBP/JPY fell to a daily low of 172.85 as it seems to be correcting overbought conditions.
- UK reported strong PMIs revisions.
- British yields to limit Sterling’s losses.
During Monday’s session, the Sterling Pound weakened across the board, trading in the 174.36 - 172.85 range and failing to capitalize on rising British bond yields following strong UK PMI revisions. On the other hand, the Japanese Yen traded mixed against its rivals and continues to gain traction on rumours of authorities from Japan intervening in the markets.
The UK reported strong PMI revisions, with eyes on the next BoE decision
According to the latest May reports by S&P Global/CPIS, the Composite Purchasing Managers' Index (PMI) was upwardly revised to 54 from the preliminary reading of 53.9. Likewise, the Services PMI was revised to 55.2 from 55.1.
As a reaction, the British bond yields saw gains across the curve while the British Financial Times Stock Exchange 100 Index (FTSE), indicating that markets seem to be waiting for more action from the Bank of England (BoE). In that sense, the 10-year bond yield increased to 4.26%, reflecting a gain of 1.13% on the day. Similarly, the 2-year yield stands at 4.49%, indicating an increase of 1.18%. The 5-year yield also saw an upward movement, reaching 4.21%, with a gain of 1.13% respectively.
On the other hand, as more interest rate hikes and stocks tend to be negatively correlated, the FTSE lost more than 0.1% following the release of the data. However, inflation and labour market data that will be released throughout June will continue to model the expectations for the following BoE interest rate decision and hence direct the movements of the GBP price dynamics.
Levels to watch
According to the daily chart, the GBP/JPY holds a neutral to bullish outlook for the short term. The bulls have lost some steam as buyers seem to be taking profits. In addition, the Relative Strength Index (RSI) despite getting rejected at the overbought threshold, stays flat in positive territory while the Moving Average Convergence Divergence (MACD) fell slightly to negative territory.
In case the buyers regain momentum, a move above the 173.50 zone would suggest a continuation of the bullish trend for the GBP/JPY, with the next resistances at the 173.95 zone and 174.00 level. On the other hand, immediate support is seen at the 172.40 level, followed by the psychological mark at 172.00 and the 171.80 area.
-638216011358063981.png)
- Gold Price defends the week-start bounce off short-term key support confluence, seesaws of late.
- XAU/USD benefits from softer United States PMI data, Factory Orders amid downbeat US Dollar and Treasury bond yields.
- Risk catalysts eyed amid an unimpressive economic data line for the Gold traders.
Gold Price (XAU/USD) stays on the front foot around $1,961, after an upbeat start of the week, as the bullion traders seek more clues to extend the latest rebound during early Tuesday in Asia. That said the precious metal cheered downbeat United States statistics and dicey markets to regain upside momentum the previous day. Adding strength to the XAU/USD rebound was its inability to crack the short-term key support confluence surrounding $1, 940 (stated in the technical analysis).
Gold Price rises on downbeat US data, easing hawkish Federal Reserve bets
Gold Price began the week on a front foot, after snapping a three-week downtrend, as weak United States data weigh on the Federal Reserve (Fed) bets and the US Dollar on Monday. That said, On Monday, US ISM Services PMI declined to 50.3 for May versus 51.5 expected and 51.9 prior whereas growth of the Factory Orders also deteriorated during the stated month to 0.4% versus 0.5% market forecasts and 0.9% previous readings. It should be noted that the final readings of S&P Global Composite PMI and Services PMI also marked softer figures for May.
Following the data, the market’s bets on the Fed’s June rate hike dropped from around 80% in the middle of the last week to nearly 25%. The same could have joined an absence of the Fed talks to weigh on the US Treasury bond yields and the US Dollar. That said, the US Dollar Index (DXY) dropped and reversed the early-day gains to end in the red with minor losses around 104.10.
It should be noted, however, that International Monetary Fund (IMF) Managing Director Kristalina Georgieva suggested during the weekend that the Fed needs to do more to tame inflation, which in turn probed the Gold buyers.
China data, United States banking concerns also favor XAU/USD bulls
Apart from the softer US data and yields, upbeat statistics from China, one of the world’s biggest Gold consumers, also allowed the XAU/USD to remain firmer. On the same line were concerns about the US banks.
That said, China’s Caixin Services PMI matches 57.1 market forecasts for May versus 56.4 previous readings.
Elsewhere, chatters were making rounds that the large banks in the United States need to hold more capital to avoid the risk of default seemed to have dented the market sentiment. While portraying the same, Wall Street benchmarks closed in the red, which in turn joined downbeat US data and allowed the Gold price to remain firmer.
Looking forward, a lack of major data/events on Tuesday may help the Gold buyers to take a breather. However, growing pessimism among the Fed hawks can keep the XAU/USD bulls hopeful.
Gold Price technical analysis
Gold Price (XAU/USD) repeatedly bounces off a convergence of the 100-DMA and an upward-loping support line from early November 2022, around $1,940 by the press time.
Adding strength to the XAU/USD recovery expectations is the near-50.0 level of the Relative Strength Index (RSI) line, placed at 14, as well as an impending bearish signal on the Moving Average Convergence and Divergence (MACD) indicator.
Even so, the 50-DMA hurdle of around $1,990 and the $2,000 round figure challenge the Gold buyers before giving them control.
On the contrary, the Gold Price daily closing below $1,940 support confluence can quickly fetch the metal towards the $1,900 round figure.
In a case where the Gold Price remains bearish past $1,900, the early March swing high of around $1,860 and the yearly low marked in February near $1,804 will be in the spotlight.
Overall, the Gold price is likely to remain firmer unless breaking the $1,940 level.
Gold price: Daily chart
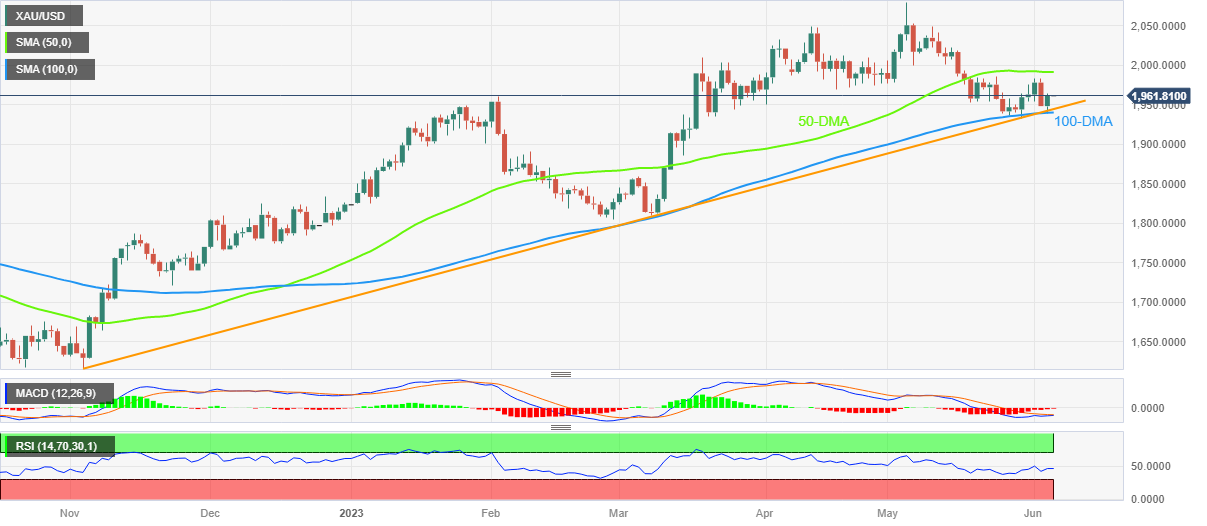
Trend: Further upside expected
- NZD/USD is firming into the 0.6070s in early Asia ahead of the RBA.
- US Dollar fell on Monday on a poor data outcome.
NZD/USD is trading away from the lows of Monday after a parabolic rally that occurred in the New York session. NZD/USD is starting the day in the 0.6070s as traders await the Reserve Bank of Australia´s meeting.
NZD/USD rallied on the back of a drop in the US Dollar after the weaker ISM services print. ´´The May ISM Services index fell 1.6pts to 50.3, below consensus of a lift to 52.4. That is the survey’s lowest reading since the initial onset of the pandemic, except for December last year which was affected by severe weather conditions,´´ analysts at ANZ Bank explained. ´´The print will undoubtedly fan expectations that the largest sector of economic activity may finally be responding to Fed tightening.´´
As for the US Dollar, the index cut early gains to trade little changed around 104 on Monday. The data dented the US Dollar that had otherwise enjoyed the Nonfarm Payrolls and a remarkable 339K jobs in May. However, the Unemployment Rate rose by 0.3 percentage points to 3.7% and hourly wage growth slowed. Around 80% of market participants expect the Fed to leave rates steady when it meets next week.
Additionally, the analysts at ANZ Bank also explained that a rate hike from the RBA today is a risk, and they think´´ the RBNZ will deliver two more hikes by August, so expect volatility given the market is hedging its bets 50/50 each way.´´
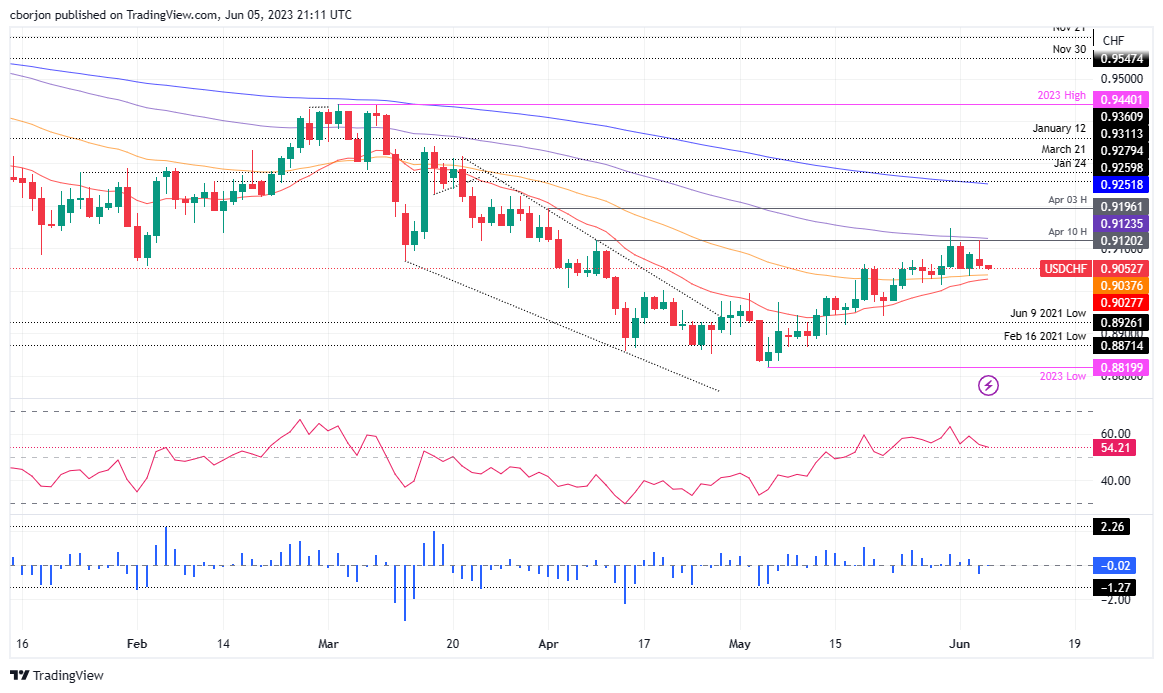
- USD/CHF takes a hit as weaker-than-expected US economic data spur recession fears, driving the Swiss Franc up.
- From a technical perspective, the USD/CHF pair is neutrally biased, awaiting a fresh catalyst for definitive market direction.
- Amid mixed signals from market oscillators, expectations of a hawkish Swiss National Bank may provide a catalyst for further USD/CHF downside.
USD/CHF slips after clashing with the 100-day Exponential Moving Average (EMA) at 0.9125, dropping below the 0.9100 mark, sponsored by a soft US Dollar (USD). Weaker-than-expected US economic data stirred recession fears amongst investors. Therefore, the Swiss Franch (CHF) rises, as shown by the USD/CHF pair trading at 0.9063, down 0.27%.
USD/CHF Price Analysis: Technical outlook
From a daily chart perspective, the USD/CHF is neutrally biased, waiting for a fresh catalyst that could give direction to the USD/CHF pair. Meanwhile, the USD/CHF is trapped on the upside by the 100-day Exponential Moving Average (EMA) at 0.9123; on the flip side, the 50-day EMA is at 0.9037.
In bullish territory, the Relative Strength Index (RSI) indicator aims downwards, while the 3-day Rate of Change (RoC), even though in bearish territory, climbs toward the neutral area. Mixed signals between oscillators might prevent traders from opening new long/short positions. But, expectations for a hawkish Swiss National Bank (SNB) could open the door for further downside.
The USD/CHF first support would be the 50-day EMA. A breach of the latter will expose the 20-day EMA at 0.9027, followed by the 0.9000 psychological support, before diving toward February 16, 2021, Low of 0.8926.
USD/CHF Price Action – Daily chart
The most significant event during the Asian session will be the Reserve Bank of Australia's meeting, where there may be an announcement of another interest rate hike. Ahead of the meeting, Japan will report on House Spending, ANZ will release the Commodity Price Index, and Australia will release Q1 Current Account Balance data.
Here is what you need to know on Tuesday, June 6:
On Monday, economic data from the US weighed on the US dollar, trimming Friday's gains. Last week's upbeat employment data had boosted the Greenback, but on Monday, the numbers came in the opposite direction and weighed on the currency. The Dow Jones lost 0.59%, and the Nasdaq declined 0.09%.
Data released on Monday showed that the US service sector continued to expand, albeit at a more moderate pace than in April, with the ISM Services PMI declining to 50.3 in May from 51.9 in April. This reading came in below the market expectation of 51.5. The Employment index dropped below 50, and the Prices Paid index fell from 59.6 to 56.2. The report presents evidence of easing inflation and softer activity, offering arguments for those Federal Reserve (Fed) officials who favor a pause at the June meeting. US yields dropped after the report and then trimmed losses. The DXY finished around 104.00, far from the 104.40 (June 5 high).
The Japanese yen was the best performer among majors, boosted by a decline in government bond yields and by a drop in equity prices in Wall Street. USD/JPY pulled back from near 140.50 to 139.20. Japan will release Overall Household Spending on Tuesday.
Economic data from the Eurozone came in below expectations (EZ PPI, Sentix Investor Confidence, and HCOB PMI). After the figures, European Central Bank President Christine Lagarde said that there is no clear evidence that underlying inflation has peaked. EUR/USD rebounded from 1.0680, boosted by a weaker US dollar, to 1.0720. On Tuesday, German April Retail Sales are due.
USD/CHF dropped, closing slightly above 0.9050. The Consumer Price Index rose 0.3% in May in Switzerland, and the annual rate dropped from 2.6% to 2.2%.
AUD/USD rose for the third consecutive day but again faced resistance at 0.6640. The Reserve Bank of Australia (RBA) will announce its decision on Tuesday. Market consensus points to the central bank remaining on hold with the cash rate at 3.85%, but it seems like a close call as analysts warn that a 25 basis points rate hike is possible.
Analysts at Rabobank wrote:
It is our house view that the RBA will keep policy steady on June 6. This would allow policy makers to absorb the Q1 GDP report which is due for release on June 7 and give them more time to assess the impact of the policy tightening to date. That said, we do expect more policy tightening later in the year and there are good reasons to suspect that this week’s policy decision will be a close call
NZD/USD rose modestly but maintained its position well above 0.6000. The ANZ Commodity Price Index is due on Tuesday, and the RBA's decision is important for the Kiwi.
USD/CAD moved sideways around 1.3440, looking steady ahead of Wednesday's Bank of Canada meeting. The Loonie had rallied earlier on Monday amid a rise in crude oil prices but then pulled back.
Oil prices finished flat after experiencing significant gains following Saudi Arabia's announcement of an extra cut in production in July. The WTI barrel finished under $72.00. Gold bounced from the $1,940 area to $1,965, boosted by the weaker US dollar and lower yields.
Bitcoin tumbled and dragged other cryptocurrencies down after the Securities and Exchange Commission sued Binance, alleging that the company operated an illegal exchange. BTC/USD lost 6% and dropped to $25,600.
Like this article? Help us with some feedback by answering this survey:
- AUD/USD is moving into the necklines of the W-formations.
- AUD/USD traders await the RBA key event.
AUD/USD is higher by some 0.18% on the day and met support on Monday that attracted buyers to test the prior day´s high of 0.6638. This has occurred as the market gets set for the Reserve Bank of Australia meeting today.
´´Following this week's data we now expect the RBA's target cash rate to peak at 4.35% with a 25bps hike with another in August,´´ analysts at TD Securities explained.
´´Given the monthly April inflation print showed the Bank departing further from its Q2'23 trimmed mean f/c and the higher than expected Fair Wage Commission decision, there is now a strong case for the Bank to move sooner rather than later.´´
Meanwhile, analysts at Rabobank argued that while the market has already assessed that the risks of a RBA rate hike have risen, a policy move would likely result in upside pressure on AUD/USD.
´´Although the AUD may edge a little lower on a steady policy announcement, we would expect that the downside would be limited given our house view that the RBA will be leaving the door open to another rate hike later in the year,´´ the analysts explained.
That said, their expectation that the USD is likely to remain well supported in the coming months suggests that AUD/USD may struggle to break above the 0.66-0.67 area.
As for the US Dollar, the index cut early gains to trade little changed around 104 on Monday on the back of Factory Orders that rose 0.4% in April, well below what had been expected. Additionally, ISM Services PMI fell sharply to the lowest in five months in May.
The data dented the US Dollar that had otherwise enjoyed the Nonfarm Payrolls and a remarkable 339K jobs in May. However, the Unemployment Rate rose by 0.3 percentage points to 3.7% and hourly wage growth slowed. Around 80% of market participants expect the Fed to leave rates steady when it meets next week.
AUD/USD technical analysis
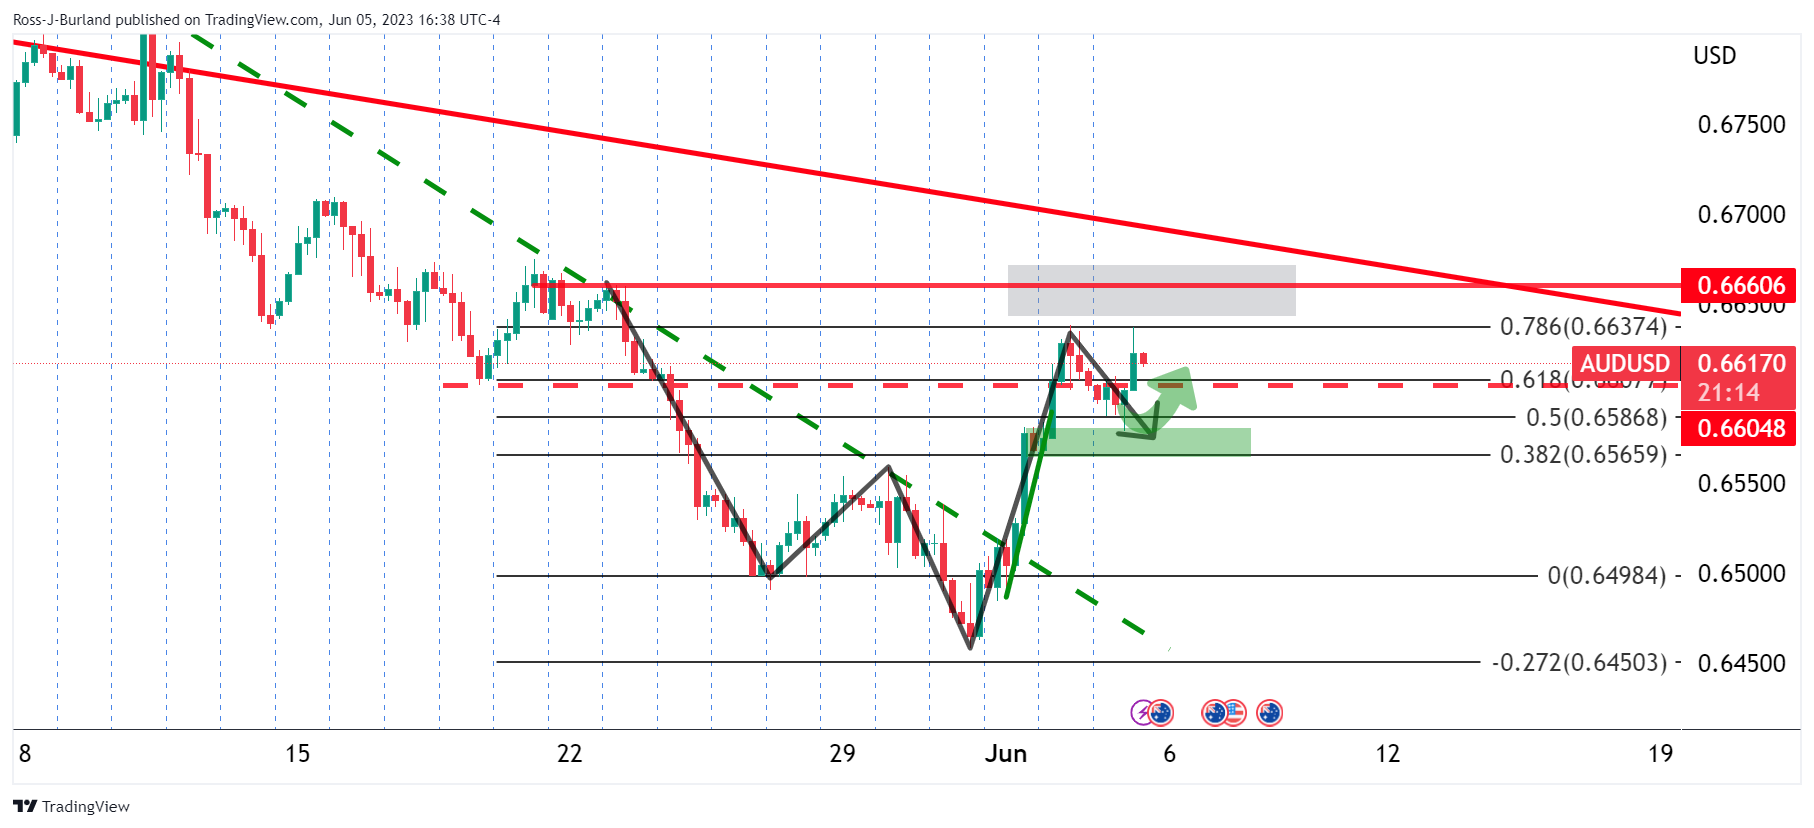
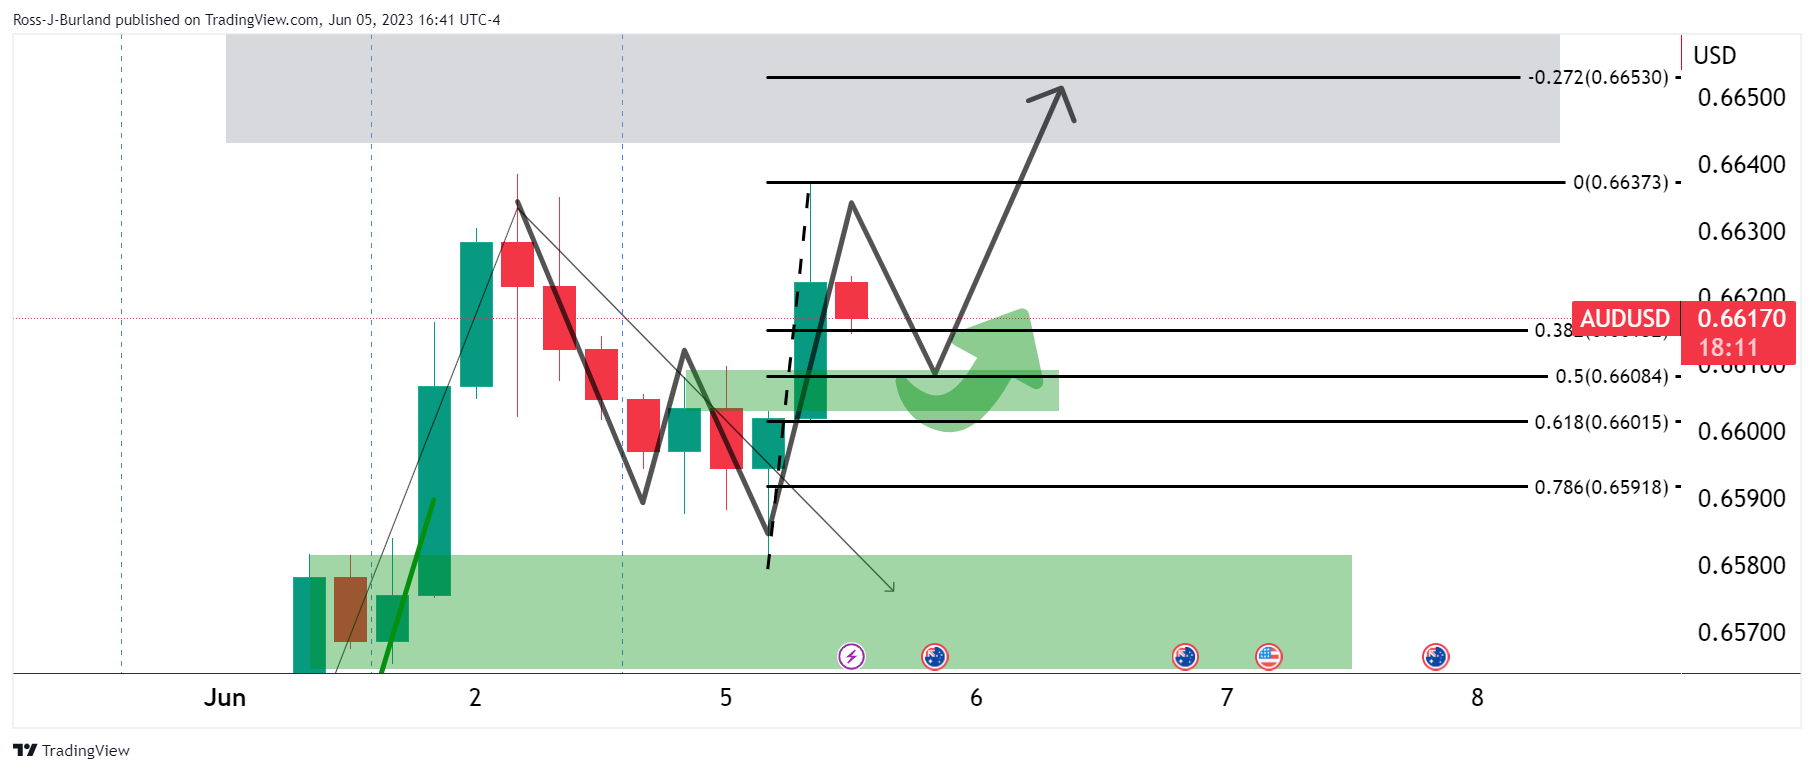
The W-formations are pulling the price into the necklines. There are targets set higher with the 0.6670s eyed.
- EUR/JPY lost ground on Monday’s session, but managed to remain above 149.00.
- Eurozone May PMIs were revised lower.
- The Euro finds support on ECB Lagarde’s hawkish comments.
The EUR/JPY retreated to the 149.70 regions at the start of the week while the Euro traded mixed against its major rivals following disappointing PMIs from the EU (European Union). On the other hand, the Japanese Yen, held strong against most of its rivals as the prospects of Japanese authorities intervening in the markets helps limit deeper losses for the JPY.
EU reported weak PMIs but Lagarde’s comments limit the Euro’s losses
The S&P Global and Hamburg Commercial Bank (HCOB) showed that de Composite PMI dropped to 52.8 vs the consensus of 53.3 and the preliminary reading of 53.3. In addition, the Services PMI was also revised downwards to 55.1 from 55.9. Other data showed that the Sentix Investor confidence for June, slid to -17 (MoM) falling short of the -9.2 expected. April’s Producer Price Index (PPI) was confirmed at -3.2% (MoM) matching the consensus.
On the other hand, the European Central Bank (ECB) president, Christine Lagarde's hawkish comments stating that underlying inflationary pressures remain high and there is no clear evidence of inflation peaking, limits the European currency losses. In addition, the euro is supported by rising German yields, indicating market expectations of proactive measures from the ECB to address inflation concerns. In that sense, the 10-year and 2-year bond yields saw more than 3% increases standing at 2.39% and 2.94% respectively.
Levels to watch
Technically speaking, the EUR/JPY holds a neutral to bullish outlook for the short term as the bulls are struggling to maintain their dominance, but technical indicators are still favourable, suggesting that the market may still have some upside potential. The Relative Strength Index (RSI) remains above its midline while the Moving Average Convergence Divergence (MACD) turned somewhat flat.
In case the EUR/JPY exchange rate continues to gain traction, the following resistance line up at the 149.80 zone followed then by the 150.00 psychological area and the 150.50 level. On the other hand, the 20-day Simple Moving Average (SMA) at 149.05 level remains the key support level for the pair. If broken, the 148.50 area and 148.00 zone could come into play.
-638215918766829049.png)
- USD/MXN falls close to 0.50% amid declining US bond yields, on US recession fears.
- Despite an unchanged interest rate from the Mexican central bank, the Mexican Peso teeters towards year-to-date lows.
- USD/MXN is downward biased, potentially testing the current YTD low and the 2016 yearly low, suggesting bearish market sentiment.
USD/MXN drops close to 0.50% as the week begins, undermined by falling US bond yields, courtesy of mixed data, even though last week’s job report in the United States (US) cemented the case for one more rate hike by the US Federal Reserve (Fed). The Mexican Peso (MXN) threatens to fall toward new year-to-date (YTD) lows, albeit the central bank of Mexico held rates unchanged at its last meeting. The USD/MXN is trading at 17.4629 after hitting a high of 17.5971.
USD/MX pair weakens as US bond yields fall, concerns over potential US recession mount as further rate hikes by the Fed hinted
Wall Street is trading with losses as market sentiment deteriorated, as data from the Institute for Supply Management (ISM) revealed that service business activity remains in expansionary territory but slowing down. That, alongside a contractionary figure in manufacturing, sparked fears of an upcoming recession in the United States. Another piece of the puzzle added to recessionary anxiety is that Factory Orders released by the US Census Bureau weakened from 0.6% in April to 0.4% in the last month, excluding transportation, improved from a -0.7% drop to -0.2% in March.
Consequently, the greenback remains under pressure, as shown by the US Dollar Index (DXY). The DXY, a basket of six currencies that measures the performance of the USD, drops 0.04%, down at 103.995, weighed by falling US bond yields.
Hence, the USD/MXN has fallen from around the 17.59s area, even though that consumer confidence in Mexico was 44.4 in May. Contrarily, gross fixed income climbed 0.5% in March from February, as revealed by the Instituto National de Estadistica, Geografia e Informatica (INEGI) on Monday.
USD/MXN Price Analysis: Technical outlook
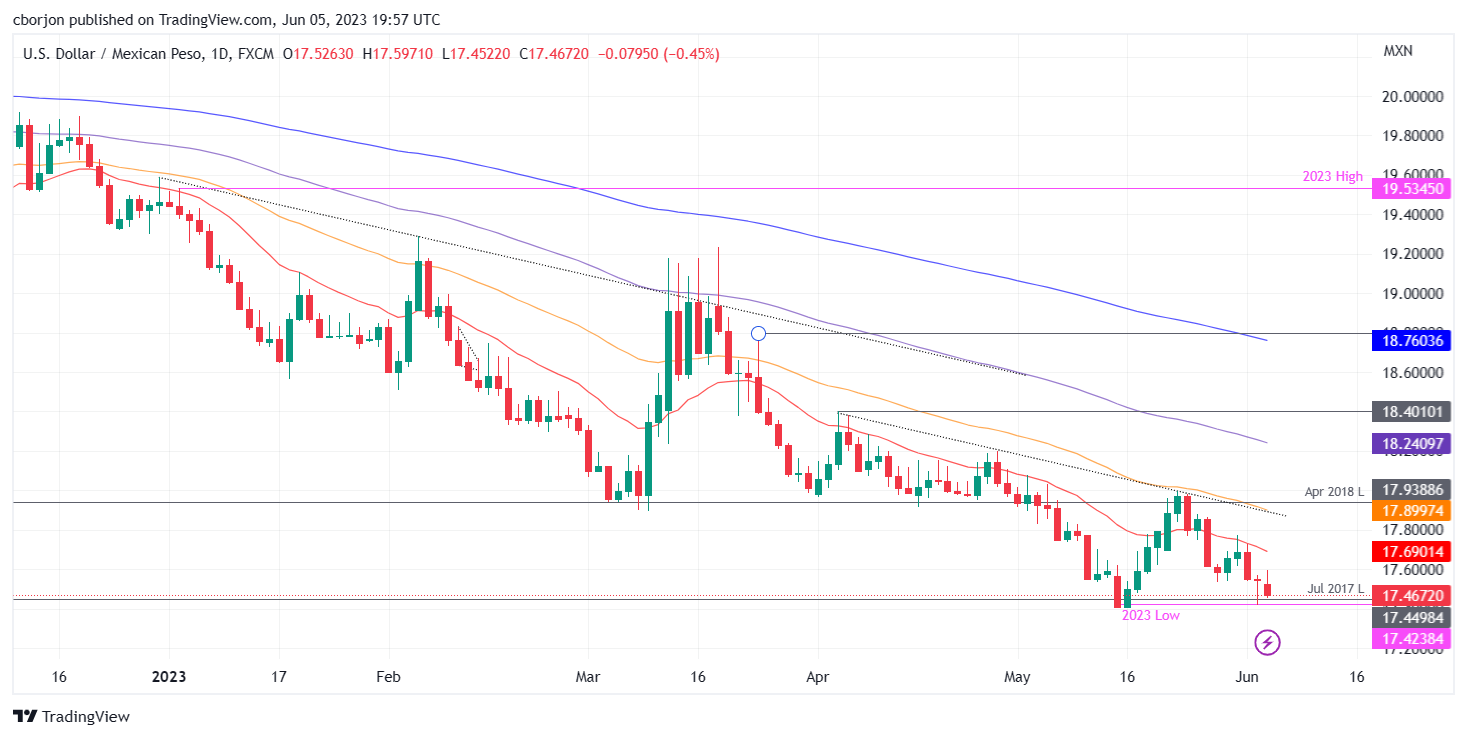
USD/MXN remains downward biased, though consolidated at around the 17.60/17.40 figure, during the last six trading days, unable to reclaim the 20-day Exponential Moving Average (EMA) at 17.6896, which could exacerbate a rally toward the 50-day EMA at 17.8995, ahead of re-testing the 18.00 handle. USD/MXN path of least resistance is downward and might test the current YTD low of 17.4238. A breach of the latter will expose the 2016 yearly low of 17.0509 before diving to 17.0000.
- USD/CAD bulls 38.2% ratio as first stop.
- Beyond daily resistance, bulls eye the1.3560s.
USD/CAD is been in the hands of the bulls at the start of the week while the yield on benchmark government debt climbed and despite a surprise in the US economic data front. Nevertheless, the technical outlook remains bullish as for the following analysis:
USD/CAD daily chart
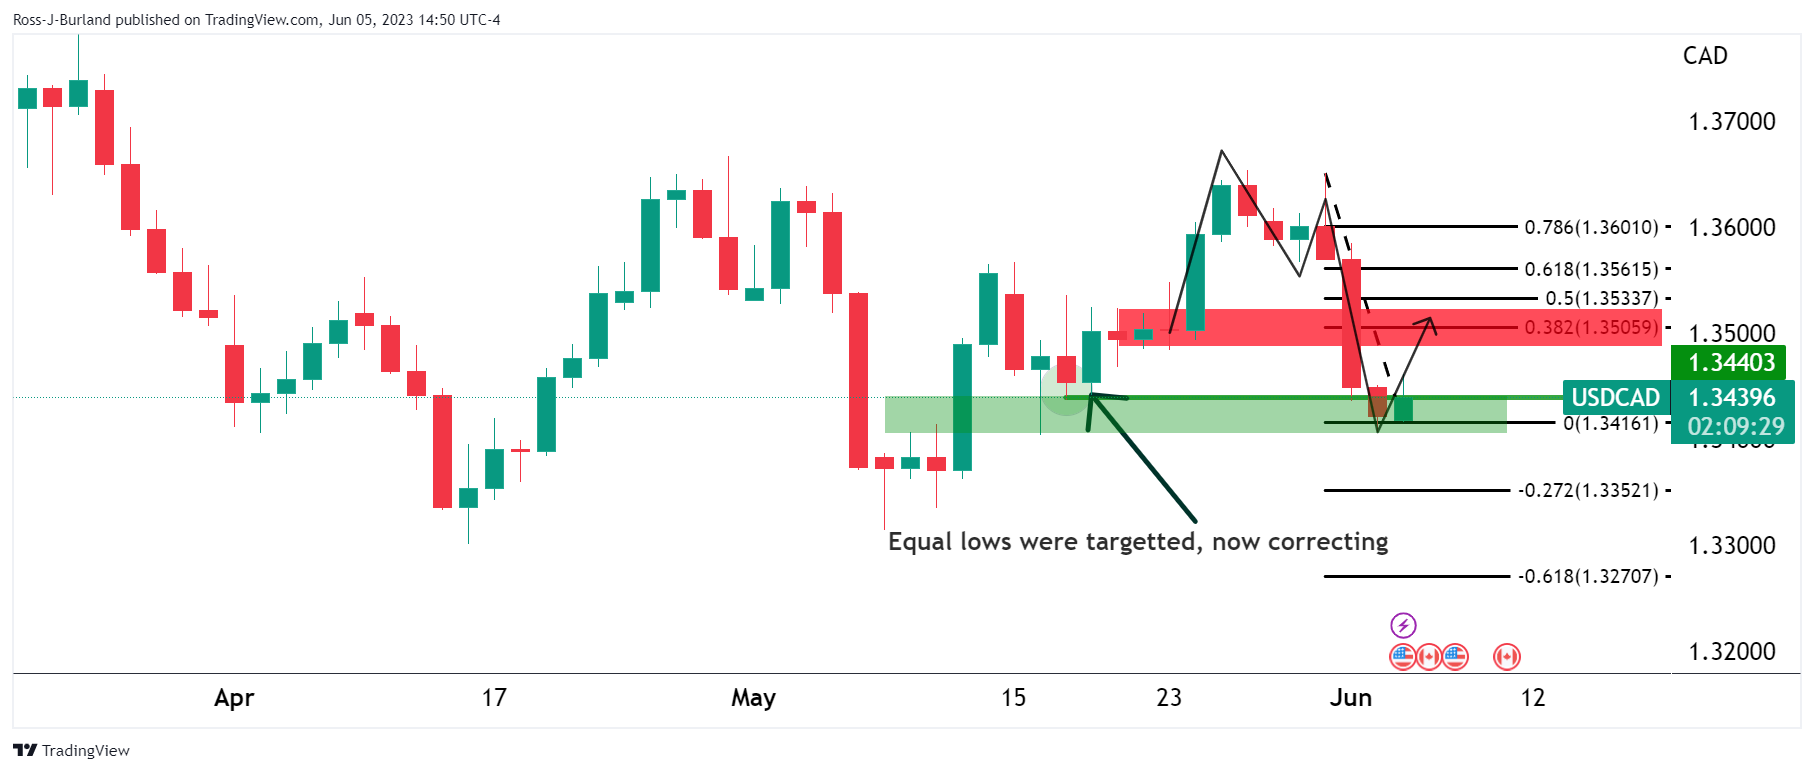
The market swept the equal lows and subsequently, bulls moved in at a discount at the end of the three-day drop. This has occurred while an M-formation has been left on the charts. The bulls look to the Fibonacci scale whereby the 38.2% ratio meets with the prior structure and offers a compelling target for the bulls.
USD/CAD H1 chart
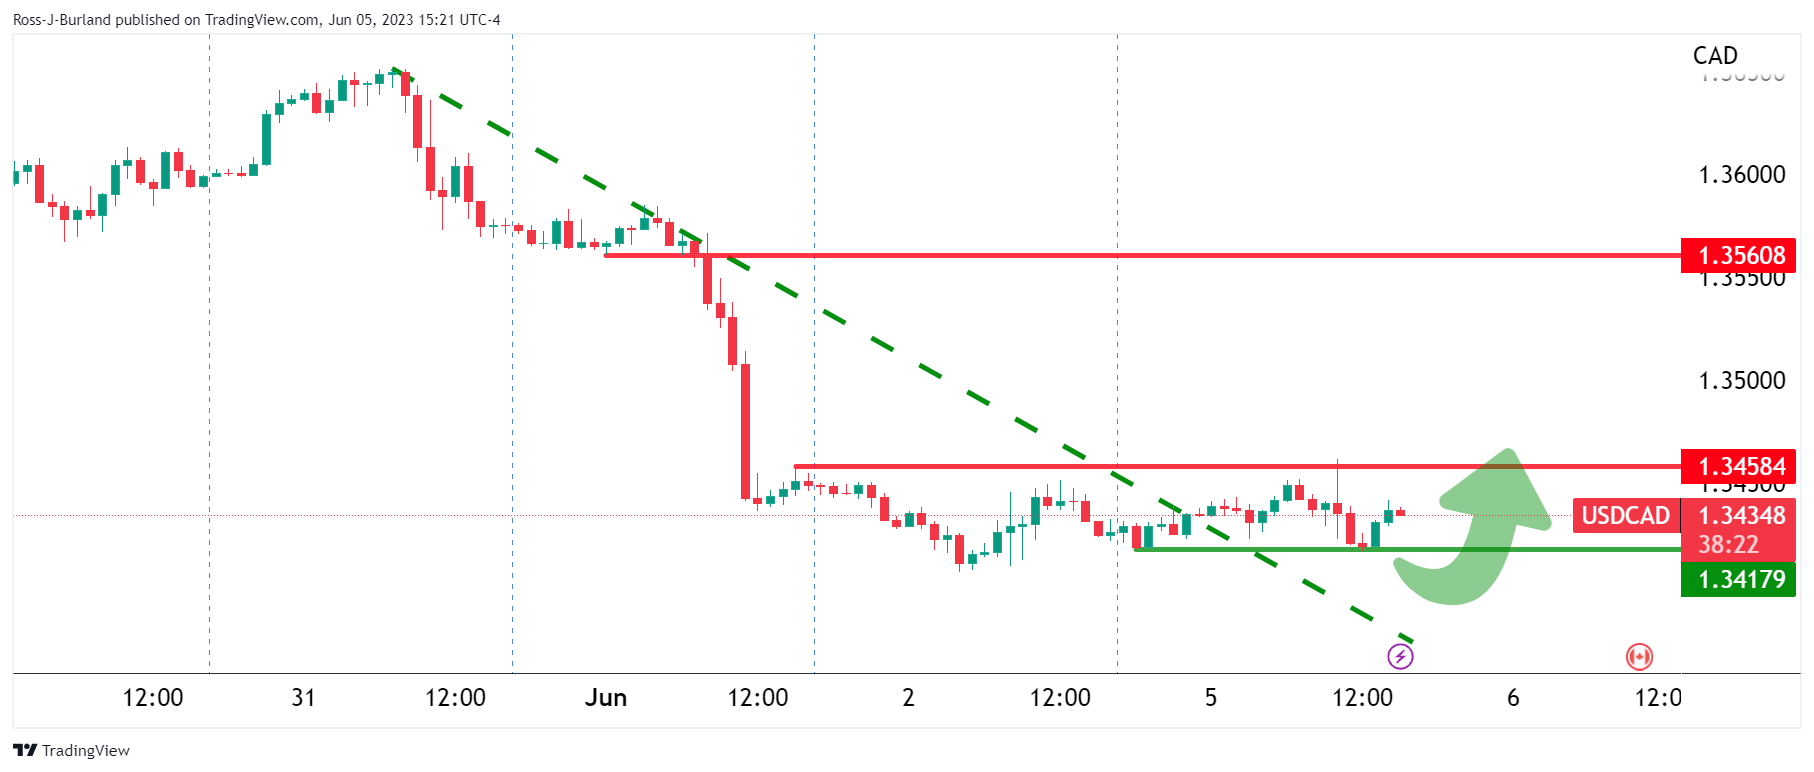
On the hourly chart, The price is sideways and bulls need to get above 1.3460 to break the resistance structure. In doing so, there are prospects of a move all the way through the 38.2% ratio into the 1.3560s.
- Gold bears got rejected at the 100-day SMA at $1,940.
- US Service PMIs from ISM and S&P Global came in weak in May.
- US bond yields decline across the board following the disappointing data.
During Monday’s session, Gold price gained bullish momentum and reached the $1,960 level after bottoming at the 100-day Simple Moving Average at the $1,940 zone. This increase was triggered by the release of disappointing ISM Services PMI data for May, which fueled a US Dollar sell-off on the back of failing US bond yields.
US yields decline across the board after disappointing US data
The US Institute for Supply Management (ISM) reported a Service PMI of 50.3 in May, falling short of the expected 51.5 and down from 51.9 the previous month. Furthermore, the S&P Global Composite final estimate for the same month declined to 54.3, lower than the anticipated 54.5, following the previous reading of 55.1. Meanwhile, the final revision of the service sector PMI came in at 54.9, slightly lower than the preliminary reading of 55.1.
Following the release, investors are perceiving a stronger case of a no-hike by the Federal Reserve (Fed) in the June 13-14 meeting. In that sense, the CME FedWatch Tool indicates there is a higher likelihood (77%) of the Fed not raising interest rates in their upcoming June, with expectations of maintaining the target rate at 5.25%.
Those dovish bets on the Fed were reflected in the drop of the US bond yields. The 10-year bond yield is trading at 3.67%, while the 2-year yield stands at 4.50% and the 5-year yield sits at 3.85%. As the US bond rates could be seen as the opportunity cost of holding the non-yielding gold, the yellow metal gained traction.
Levels to watch
According to the daily chart, the XAU/USD holds a neutral short-term outlook as the Relative Strength Index (RSI) and Moving Average Convergence Divergence (MACD) suggest that the sellers are struggling to maintain their dominance while the bulls are starting to gain momentum. Both indicators remain in negative territory but hint at bearish impulse exhaustion.
If the XAU/USD continues to move higher, the next resistances to watch are at the $1,960 zone, followed by the 20-day Simple Moving Average (SMA) at $1,977 and the $1,990 area. On the other hand, supports are seen at the 100-day SMA at $1,940, and then the $1,930 and $1,920 zones.
-638215885220520442.png)
- The oil price is on the backside of the trend and this leaves the outlook meanwhile bullish.
- WTI bulls are lurking within the Fibonacci scale.
Crude prices jumped today after Saudi Arabia said it would cut its crude production by -1.0 million bpd starting in July. However, weaker-than-expected global economic news raised concerns about energy demand, and crude prices fell back from their best levels. WTI is trading back to $74.50 and within the day´s range of between $74.92 and $72.07 the low. The following illustrates the technical outlook at this juncture:
WTI daily chart
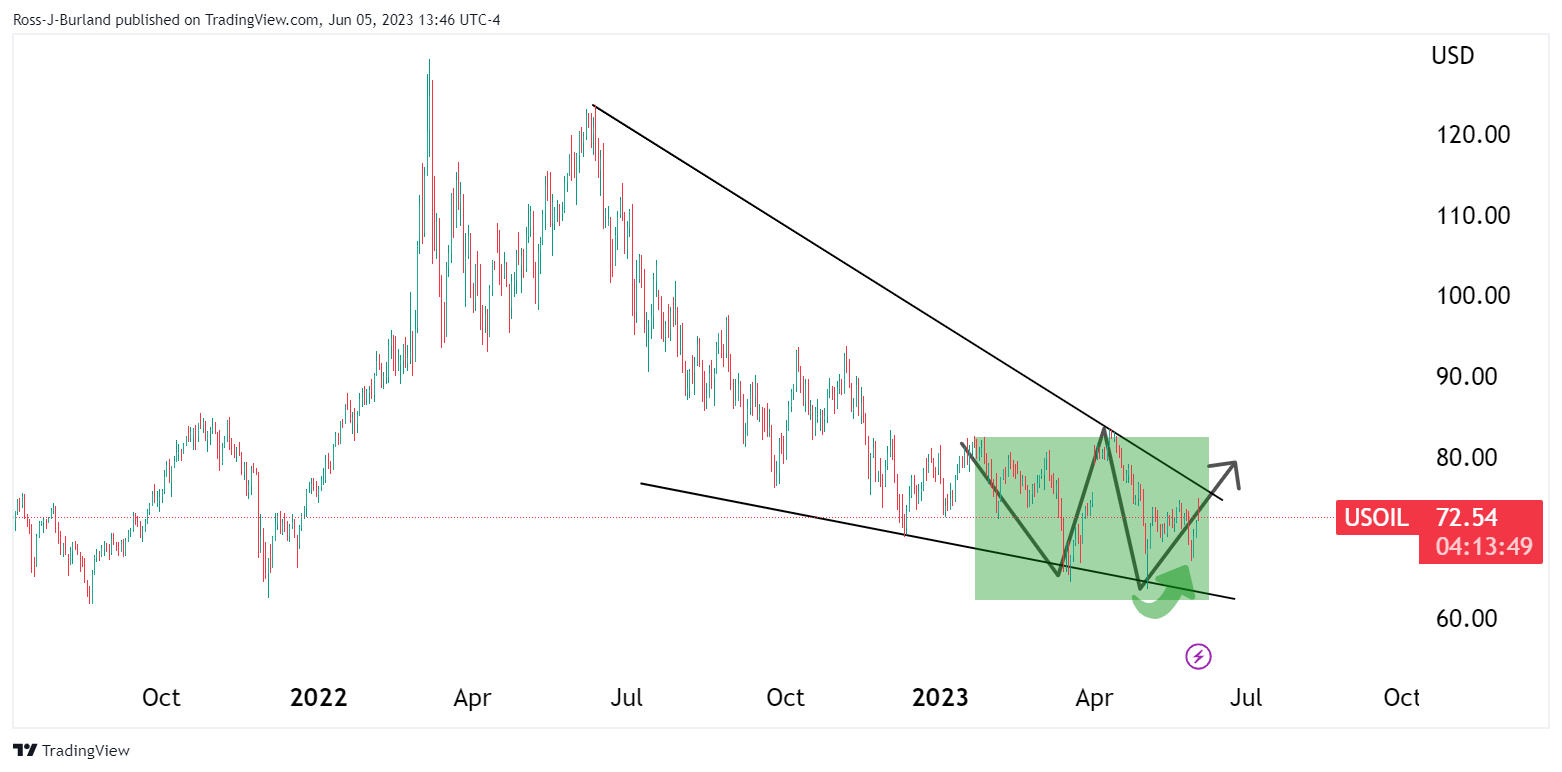
The double bottom is a bullish feature on the longer-term charts with the price coiled within a falling bullish wedge formation.
WTI H1 chart
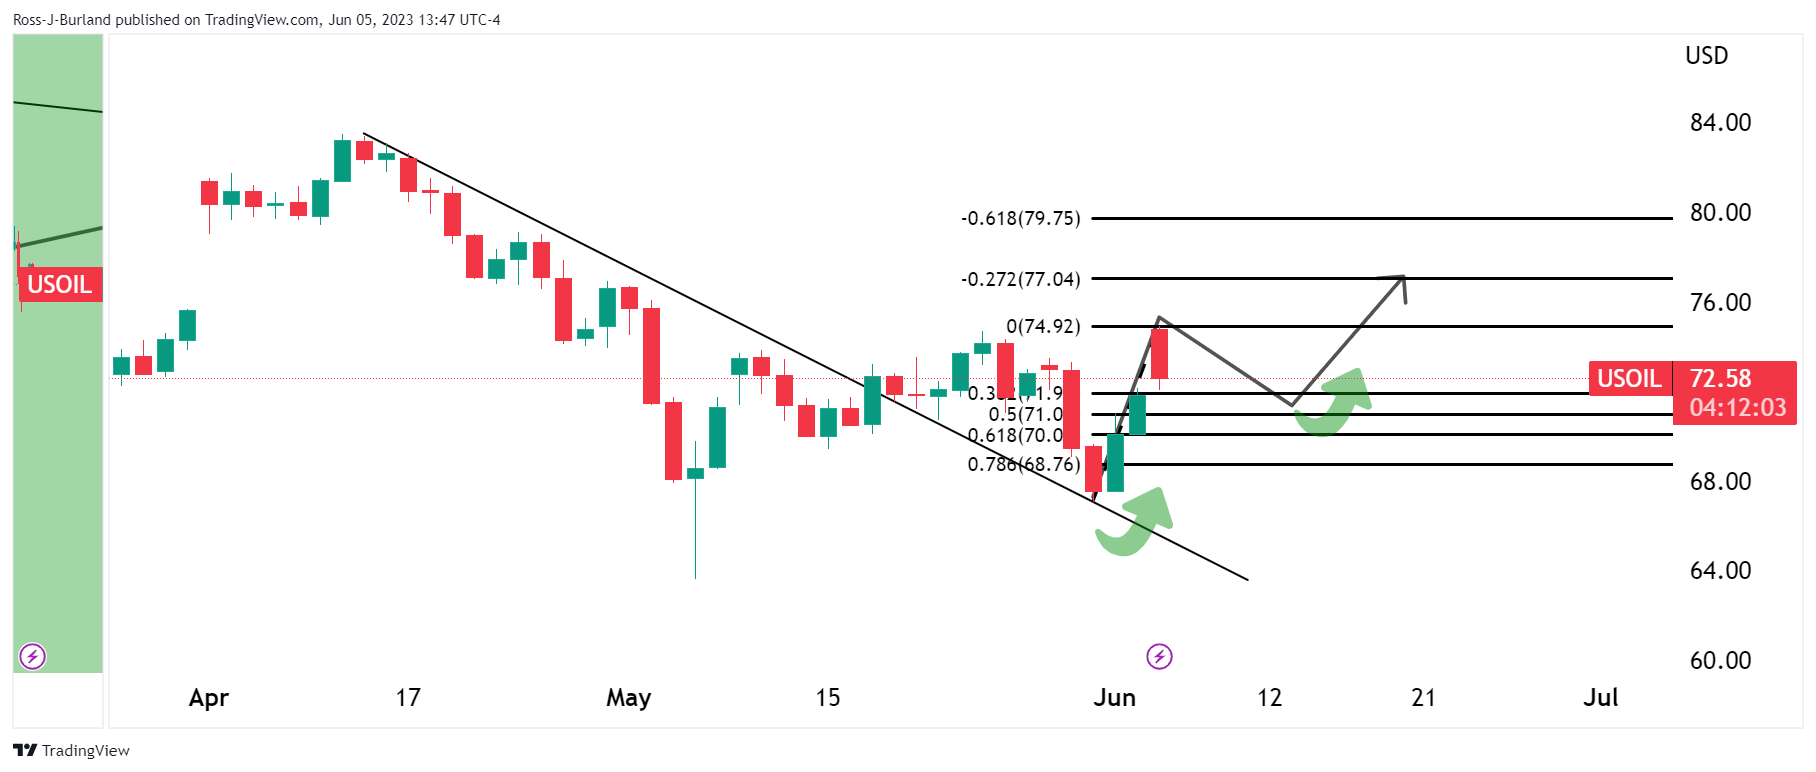
The price has pulled back into the gap but remains on the backside of the prior bearish trendline. This leaves scope for a move up from within the Fibonacci scale in due course.
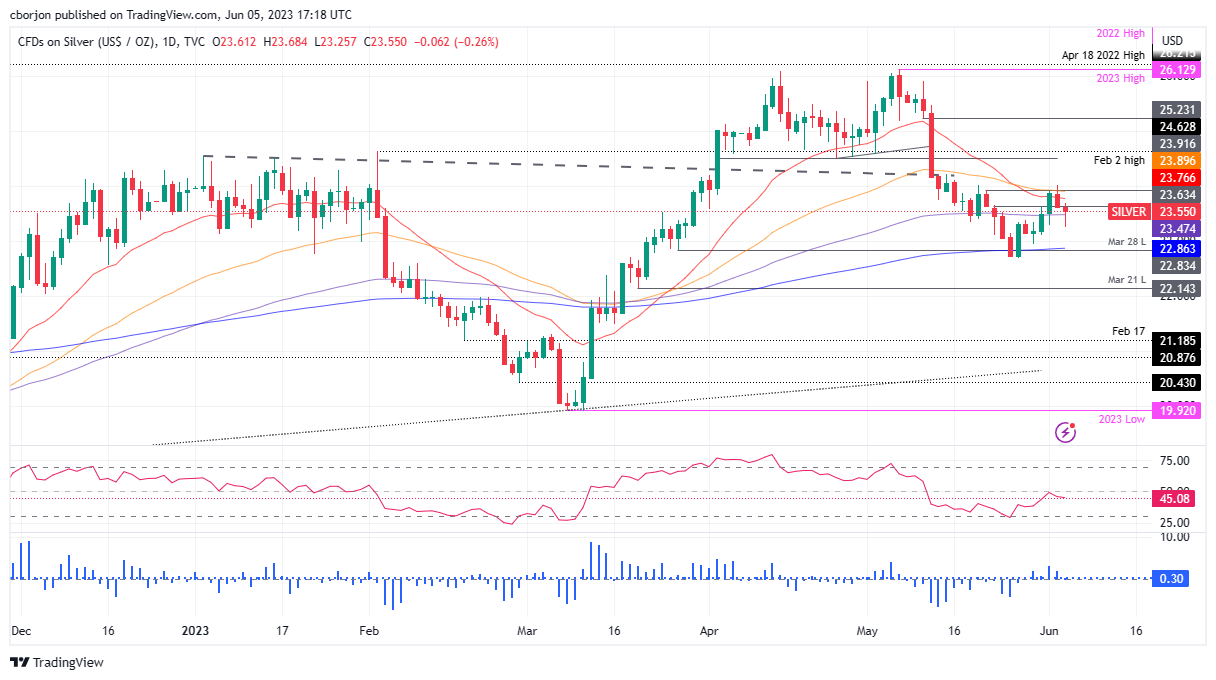
- XAG/USD reclaims the 100-day EMA at $23.47 after dipping to a daily low, showcasing a subtle comeback.
- Despite the recovery, the market remains neutral to downward biased as XAG/USD fails to reconquer the April 25 daily low.
- Technical indicators suggest a battle between sellers and incoming buyers, hinting at volatility in the XAG/USD market.
XAG/USD stages a comeback though it remains slightly below its opening price, reclaimed the 100-day Exponential Moving Average (EMA) at $23.47 after hitting a daily low of $23.25. At the time of writing, XAG/USD exchanges hands at $23.55, down 0.14%
XAG/USD Price Analysis: Technical outlook
From a daily chart perspective, the XAG/USD is neutral to downward biased, as price action has failed to reconquer the April 25 daily low of $24.49, which could pave the way for further upside. In addition, the Relative Strength Index (RSI) indicator at bearish territory suggests that sellers are in charge, while the 3-day Rate of Change (RoC) indicates that buyers are moving in, cushioning the XAG/USD’s fall.
For a bearish resumption, XAG/USD must fall below the 100-day EMA at $23.47 to force a downward move to the $23.00 figure. A breach of the latter will expose the 200-day Exponential Moving Average (EMA) at $22.86.
Conversely, if XAG/USD buyers reclaim the 20-day EMA at $23.76, a rally toward the $24.00 is on the cards. But on its way north lies the 50-day EMA at $23.89.
XAG/USD Price Action – Daily chart
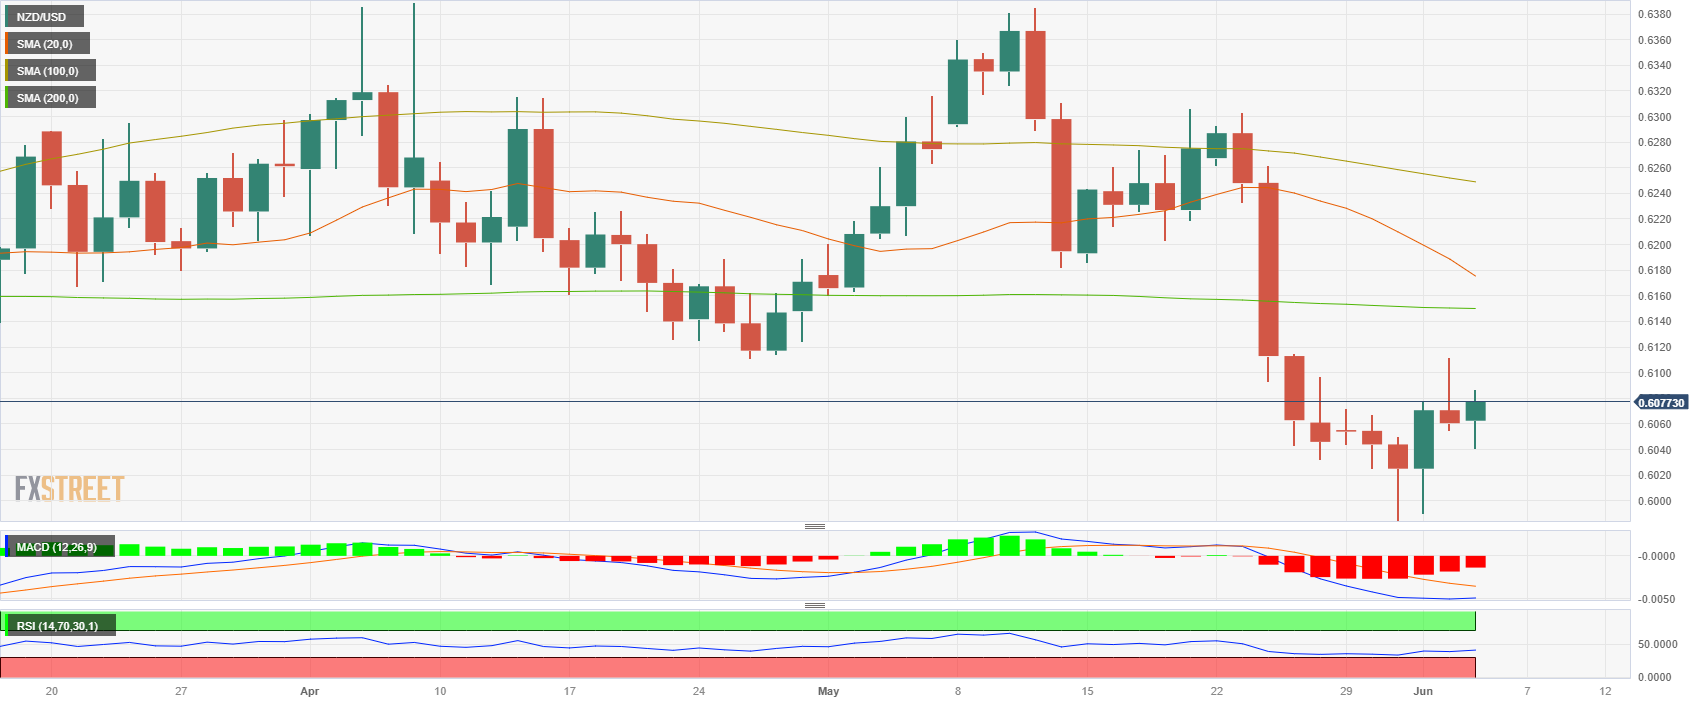
- NZD/USD jumped to its highest level since May 26 around 0.6085 after bottoming at November lows last week
- US ISM Services PMI fell to 50.3 in May.
- S&P Global Composite PMI retreated to 54.3.
The NZD/USD traded with gains at the beginning of the week near 0.6070, fueled by poor economic data from the US, which sparked a US Dollar sell-off. In reaction to the data, markets are perceiving a stronger case for the Federal Reserve (Fed) not hiking rates in the upcoming meeting on June 13-14 making the US bond yields decline.
US bond yields decline following weak economic data
The US Institute for Supply Management (ISM) Service PMI came in at 50.3 in May vs the 51.5 expected and decelerated from its previous figure of 51.9. In addition, the S&P Global Composite final estimate for the same month slid to 54.3 vs the 54.5 expected from the last reading of 55.1. Meanwhile, the service sector PMI final revision printed at 54.9 vs the preliminary reading of 55.1.
Following the disappointing data, US bond yields have declined throughout the yield curve. The 10-year bond yield has fallen to 3.69%. Similarly, the 2-year yield stands at 4.48%, while the 5-year yield sits at 3.83%, which weighs on the US Dollar.
According to the CME FedWatch Tool, investors are currently assigning a 77.10% probability to the Federal Reserve maintaining the target rate at 5.25% and not implementing an interest rate hike in the upcoming June 13-14 meeting. However, it is worth highlighting that the Fed's primary objective of achieving full employment and price stability remains steadfast. As a result, the release of the May Consumer Price Index (CPI) on June 13 will play a crucial role in shaping the FOMC's (Federal Open Market Committee) expectations and considerations for future interest rate decisions and hence impacting the US Dollar price dynamics.
Levels to watch
Technically speaking, the NZD/USD maintains a neutral to a bearish outlook for the short term, as per indicators on the daily chart. The Relative Strength Index (RSI) and Moving Average Convergence Divergence (MACD), despite standing in negative territory, show a loss of momentum, suggesting that sellers seem to have run out of steam.
On the upside, upcoming resistance for NZD/USD is seen at the daily high of 0.6085, followed by the psychological mark at 0.6100 and June 2 high around 0.6115. On the other hand, if the Kiwi retakes the downside, immediate support levels are seen at the daily low at 0.6040, followed by the psychological mark at the 0.6000 level and the cycle low at 0.5985.
- GBP/USD rate hovers above the 1.2400 mark after the last week’s USD boost from stronger-than-expected jobs data.
- US economic indicators reveal a mixed story, with weakening factory orders and a fall in Non-Manufacturing PMI.
- UK outpaces expectations with S&P Global Services and Composite PMIs, adding pressure on the Bank of England to address inflation concerns.
GBP/USD trims some of its losses but remains trading below its opening price; after the latest week, robust jobs reports boosted the American Dollar (USD), but Monday’s agenda capped the USD gains. Therefore, the GBP/USD is exchanging hands at 1.2440, 0.04% below its opening price but higher than the day’s low of 1.2368.
GBP/USD slashes early losses on weakening US factory orders and falling Treasury bond yields, limiting US Dollar gains as the UK PMI beats estimates
Last week, the US Bureau of Labor Statistics (BLS) revealed May’s data, showing the creation of more than 300K jobs, thought flashed the Unemployment Rate at 3.7%, sought by the US Federal Reserve (Fed), as a sign the economy is cooling and unexpectedly boosted the US Dollar (USD), as the GBP/USD retreated last Thursday¿s gains.
But on Monday, the story is different as Factory Orders in the US weakened, from 0.6% to 0.4% in May, less than estimations. Core Orders, excluding transportation, plummeted 0.2% but improved compared with March’s 0.7% drop. At the same time, the Institute for Supply Management (ISM) revealed that the Non-Manufacturing PMI fell to 50.9 from April’s 51.9, portraying that the economy is weakening.
After the data was released, the greenback weakened, as shown by the US Dollar Index (DXY), which tracks the buck’s value vs. a basket of peers. The DXY d down 0.09%, at 103.947, failing to crack the 104.000 mark, weighed by falling US Treasury bond yields. The US 10-year Treasury bond yield drops two basis points, at 3.677%.
On the UK front, the S&P Global Services and Composite PMIs beat estimates, with the Services Index registering a 55.2, exceeding forecasts of 55.1, though less than April’s 55.9. However, price input pressures rose the most in three months, with wages being the main reason. That would keep the Bank of England (BoE) pressured to deliver further tightening as inflation proves to be stickier than expected.
GBP/USD Price Analysis: Technical outlook
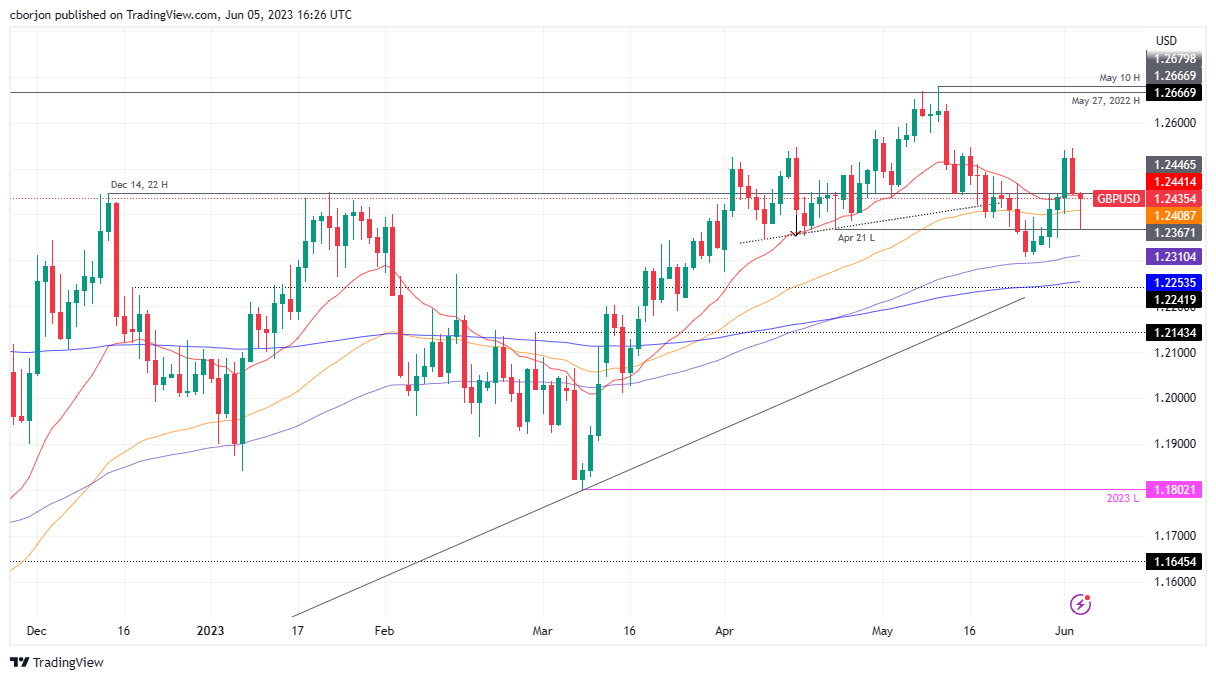
Given the fundamental backdrop, the GBP/USD is neutral to upward biased. In fact, today’s price action forming a gravestone doji or a hammer would put the 1.2500 figure into play. Still, traders must reclaim the 20-day Exponential Moving Average (EMA) resistance at 1.2442, followed by 1.2450. Once cleared, that could pave the way towards 1.2500. Conversely, the GBP/USD first support would be the 1.2400 figure, followed by the current week’ slow of 1.2368.
- Euro rises on weakening US factory orders and a mixed ISM reading, with EUR/USD trading above the opening price.
- Wall Street displays mixed sentiment as fears of recession loom following 7th straight month of contracting Manufacturing PMI.
- Hawkish comments from ECB officials, boost the Euro against the backdrop of a sluggish US economy.
EUR/USD erases some of its previous losses, sponsored by weaker orders in factories in the United States (US), alongside mixed ISM readings. European Central Bank President Christine Lagarde and other policymakers’ hawkish comments also lifted the Euro (EUR). The EUR/USD is trading at 1.0710, above its opening price by 0.01%.
Factory orders in the US falter while European Central Bank hints at continued interest rate hikes, sending the EUR/USD higher
Market sentiment is fragile, as shown by Wall Street trading mixed. Factory Orders in the United States slowed down in April, from 0.6% in the prior month, to 0.4%, beneath expectations for a solid 0.8% figure. Excluding transportation, plunged -0.2%, a slight improvement from March -0.7% fall. That, alongside further economic data from the US, underpinned the EUR/USD, which gained 27 pips in the latest 50 minutes of trading, claiming the 1.0700 mark.
The Institute for Supply Management (ISM) revealed that the Non-Manufacturing PMI, also known as the Services PMI, dropped to 50.3 in May from April 51.9, clung to expansionary territory amidst a slowdown in orders. Given that the PMI decelerated, increased fears for a possible recession after the last week’s Manufacturing PMI contracted for the seventh straight month.
Meanwhile, the US Dollar Index (DXY), a measure of the buck’s value vs. a basket of currencies, pairs earlier losses at 104.060, positive by 0.02%, capping the EUR/USD’s rally amidst falling US Treasury bond yields. The US 10-year benchmark note rate sits at 3.693%, almost flat.
On the European front, business activity in May, particularly the S&& Global Services PMI, decelerated but offset the plunge in manufacturing activity. Meanwhile, ECB speakers crossed newswires, led by its President Lagarde, who said that the central bank would stop all reinvestments in APP. Lagarde added that although there are signs of moderation, “there is no clear evidence that underlying inflation has peaked,” told European lawmakers.
At the same time, her colleague Joachim Nagler added the ECB needs to keep raining rates beyond the summer. Money market futures have priced in a 25 bps rate hike by the ECB, contrarily to the US Federal Reserve (Fed), which is seen pausing in June, but if data proves them wrong, another interest rate increase is expected in July.
EUR/USD Price Analysis: Technical outlook
From a technical perspective, the EUR/USD is neutral to downward biased, though testes briefly the 200-day Exponential Moving Average (EMA) at 1.0687, though bounced for the third time. Nevertheless, the Relative Strength Index (RSI) and the 3-day Rate of Change (RoC) are bearish, suggesting sellers remain in charge.
Downside risks lie at the 1.0700 figure. Break below will expose the 200-day EMA, followed by the May 31 low of 1.0635. on the flip side, the EUR/USD first resistance would be the 100-day EMA at 1.0769, the 20-day EMA at 1.0788, and the 1.0800 figure.
- US Dollar weakens across the board following lower-than-expected ISM Service PMI.
- US yields decline sharply after data, benefiting the Yen.
- USD/JPY extends reversal from six-day highs.
The USD/JPY experienced a sharp drop below 140.00 after the release of US economic data that weighed on the US Dollar. Within a few minutes, the pair lost more than 50 pips, reaching a fresh daily low at 139.25. It remains near the lows, under pressure.
Data triggers more losses in USD/JPY
The May S&P Global Services PMI was revised down from 55.1 to 54.9. More importantly, the ISM Services PMI for May came in at 50.3, the lowest level since May 2020, falling short of expectations of 51.5 and below April's figure of 51.9. The Prices Paid Index also fell from 59.6 to 56.2, and the Employment Index dropped to 49.2, indicating contraction.
In addition, a separate report showed that Factory Orders rose by 0.4% in April, below the market consensus of 0.5%.
These figures triggered weakness in the US Dollar across the board. The US Dollar Index dropped from 104.30, hitting daily lows below 104.00. US Treasury yields also turned negative, with the 10-year sliding from 3.75% to 3.66% and the 2-year from 4.55% to 4.43%.
The rally in Treasuries boosted the Japanese Yen, which is also benefiting from the slide in equity prices on Wall Street. As a result, the yen is one of the top performers so far on Monday.
USD/JPY fails to hold above 140.00
The USD/JPY reached a high of 140.45 on Monday, which was the highest level it had seen since May 30th. However, it began to pull back and accelerated its descent after the release of US data. The pair was unable to maintain a level above 140.00.
On the 4-hour chart, the USD/JPY has fallen below its 20-period Simple Moving Average (SMA). Immediate support is at 139.20, followed by the 138.95/139.00 zone. If the pair continues to decline, attention will turn to last week's low at 138.40. A recovery above 139.60 could alleviate the bearish pressure.
Technical levels
- US ISM Services PMI edged lower in May.
- US Dollar Index retreated below 104.00 with the initial reaction.
The business activity in the US service sector continued to expand, albeit at a more moderate pace than in April, with the ISM Services PMI declining to 50.3 in May from 51.9 in April. This reading came in below the market expectation of 51.5.
Further details of the publication revealed that the Prices Paid Index edged lower to 56.2 from 59.6 and the Employment Index dropped to 49.2 from 50.8.
Commenting on the data, "there has been a pullback in the rate of growth for the services sector. This is due mostly to the decrease in employment and continued improvements in delivery times (resulting in a decrease in the Supplier Deliveries Index) and capacity, which are in many ways a product of sluggish demand," said Anthony Nieves, Chair of the Institute for Supply Management (ISM) Services Business Survey Committee."
"The majority of respondents indicate that business conditions are currently stable; however, there are concerns relative to the slowing economy," Nieves added.
Market reaction
The US Dollar lost its strength after this report and the US Dollar Index turned negative on the day slightly below 104.00 with the initial reaction.
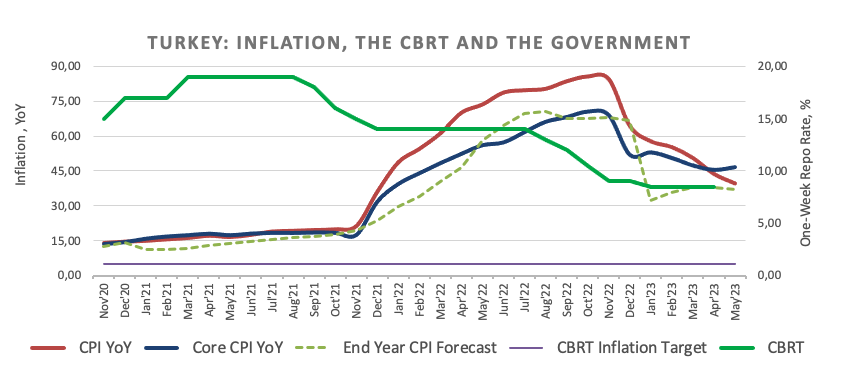
- USD/TRY advances to the 21.30 region on Monday.
- Investors appears skeptics after the appointment of M. Simsek.
- Türkiye headline CPI rose below 40% YoY in May.
There seems to be no respite for the weakness of the Turkish lira. That said, USD/TRY clocked a new record high well north of the 21.0000 mark on Monday.
USD/TRY: Further upside looks likely
USD/TRY maintains its firm bullish bias for yet another session and this time breaks above the 21.0000 mark with marked conviction, as investors remain highly apathetic following the announcement of new members of Erdogan’s cabinet.
Recently appointed Treasury and Finance Minister M. Simsek said over the weekend that returning to "rational ground" is necessary to ensure predictability in the economy and emphasized that the new government's primary objective will be to enhance social welfare.
It is worth noting that the lira has already lost more than 14% since January.
In the docket, inflation figures in Turkey tracked by the headline CPI rose at an annualized 39.59% in May and 0.04% vs. the previous month. It was the first reading below 40% since December 2021. In addition, the Core CPI (CPI excluding energy, food, non-alcoholic beverages, alcoholic beverages, tobacco, and gold) rose 46.62% YoY.
What to look for around TRY
USD/TRY maintains its upside bias well in place, always underpinned by the relentless meltdown of the Turkish currency.
In the meantime, investors are expected to closely monitor upcoming decisions on monetary policy, particularly after President R. T. Erdogan named former economy chief M. Simsek as the new finance minister following the cabinet reshuffle in the wake of the May 28 second round of general elections.
The appointment of Simsek has been welcomed with optimism by market members in spite of the fact that it is not yet clear whether his orthodox stance on monetary policy can survive within Erdogan’s inclination to battle inflation via lower interest rates.
In a more macro scenario, price action around the Turkish lira is supposed to continue to spin around the performance of energy and commodity prices - which are directly correlated to developments from the war in Ukraine, broad risk appetite trends, and dollar dynamics.
Key events in Türkiye this week: CPI, Producer Prices (Monday) – Industrial Production (Friday).
Eminent issues on the back boiler: Persistent skepticism over the CBRT credibility/independence. Absence of structural reforms. Bouts of geopolitical concerns.
USD/TRY key levels
So far, the pair is gaining 1.70% at 21.2381 and faces the next hurdle at 21.3119 (all-time high June 5) followed by 22.00 (round level). On the downside, a break below 19.5366 (55-day SMA) would expose 19.2216 (100-day SMA) and finally 18.8743 (200-day SMA).
- EUR/GBP scales higher for the second straight day and recovers further from the YTD low.
- Hawkish remarks by ECB officials underpin the shared currency and remain supportive.
- The setup supports prospects for additional gains towards the 0.8670 support breakpoint.
The EUR/GBP cross gains positive traction for the second successive day on Monday and recovers further from a fresh YTD low, around the 0.8565 region touched last week. The cross maintains its strong bid tone through the mid-European session and is currently placed near a three-day high, around the 0.8625-0.8630 region.
The shared currency's relative outperformance comes amid the recent hawkish remarks by several European Central Bank (ECB) officials, backing the case for additional rate hikes in the coming months. In fact, ECB policymaker Boštjan Vasle said on Friday that more rate hikes are needed to get inflation to the 2% target as core inflation remains high and persistent. Separately, ECB Governing Council member, Gabriel Makhlouf noted that the central bank has not reached the moment where it can say let's now stop.
Adding to this, ECB President Christine Lagarde, speaking at the Hearing before the Committee on Economic and Monetary Affairs (ECON) of the European Parliament, reiterated that price pressure remains strong in the Euro area. Lagarde added that there is no clear evidence that underlying inflation has peaked and that wage pressures have strengthened further. This overshadows last week's softer Eurozone CPI figures and continues to underpin the Euro, which, in turn, acts as a tailwind for the EUR/GBP cross.
The British Pound, on the other hand, struggles to attract any buyers as the market already seems to have priced in the prospects for another interest rate hike by the Bank of England (BoE). This, in turn, favours bullish traders and backs the case for a further near-term appreciating move for the EUR/GBP cross. Hence, some follow-through strength back towards testing a strong horizontal support breakpoint, around the 0.8670 region, looks like a distinct possibility. The said area should act as a pivotal point for short-term traders.
Technical levels to watch
- Gold price is making efforts for recovery from $1,940.00 as the focus shifts to US Services PMI.
- After the release of downbeat Manufacturing PMI, weak service sector performance could propel volatility in the USD Index.
- The yields offered on 10-year US government bonds are holding gains above 3.74%.
Gold price (XAU/USD) has defended its downside after a fresh four-day low around $1,940.00 in the New York session. The precious metal is expected to deliver a power-pack action as the United States ISM agency is going to release Services PMI numbers for May.
After the release of the downbeat Manufacturing PMI last week, a downbeat performance from the service sector could propel volatility in the US Dollar Index (DXY). US factory activity reported a seventh straight contraction as firms are failing to cater to their fixed and working capital requirements amid higher interest rates by the Federal Reserve (Fed) and tight credit conditions by US regional banks.
According to the preliminary report, US Services PMI is seen declining to 51.5 vs. the prior release of 51.9. New Orders Index that conveys forward demand is seen advancing to 56.5 against the former release of 56.1.
At the press time, the USD Index has faced marginal pressure while attempting to cross the immediate resistance of 104.40. After the release of upbeat US Nonfarm Payrolls data, it is critical to discuss about interest rate policy from Fed. The investing community will get more clarity after getting inflation figures for May ahead.
Meanwhile, S&P500 are expected to open on a mildly bullish note. US equities are expected to continue Friday’s optimism amid consistent macros. The yields offered on 10-year US government bonds are holding gains above 3.74%.
Gold technical analysis
Gold price witnessed an intense sell-off after a mean-reversion move to near the 200-period Exponential Moving Average (EMA) at $1,977.32 on a four-hour scale. The precious metal is declining toward the key support plotted from March 22 low at $1,934.34.
The Relative Strength Index (RSI) (14) is hovering near the 40.00 threshold. Bearish momentum will get triggered on a breakdown into the 20.00-40.00 range.
Gold four-hour chart

- AUD/USD reverses an intraday dip on Monday, though lacks any follow-through buying.
- Bets for another 25 bps Fed rate hike in June underpin the USD and cap gains for the pair.
- Traders look to the US ISM Services PMI for some impetus ahead of the RBA on Tuesday.
The AUD/USD pair attracts some dip-buying near the 0.6580 area and climbs to the top end of its intraday trading range during the early North American session on Monday. The pair currently trades just above the 0.6600 mark and remains well within the striking distance of a nearly two-week high touched on Friday.
A private-sector survey showed on Monday that China's services activity picked up in May and raises hopes of a recovery in the world's second-largest economy. Adding to this, speculations that the Reserve Bank of Australia (RBA) could tighten its policy further lend some support to the China-proxy Aussie. The upside for the AUD/USD pair, however, seems limited, at least for the time being, as traders seem reluctant to place aggressive bets ahead of the RBA meeting on Tuesday. Apart from this, a strong follow-through US Dollar (USD) buying further contributes to capping the major.
In fact, the USD Index (DXY), which tracks the Greenback against a basket of currencies, builds on Friday's post-NFP goodish rebound from over a one-week low and continues gaining traction for the second successive day amid expectations for additional rate hikes by the Federal Reserve. In fact, the current market pricing indicates a 30% chance of another 25 bps lift-off at the end of a two-day FOMC monetary policy meeting on June 14. This remains supportive of a further rise in the US Treasury bond yields, which underpins the buck and holds back the AUD/USD bulls from placing fresh bets.
Heading into the key central bank event risk, the aforementioned mixed fundamental backdrop warrants some caution before positioning for an extension of the AUD/USD pair's recent recovery from the multi-month low touched last week. In the meantime, traders on Monday will take cues from the release of the US ISM Services PMI. This, along with the US bond yields, will influence the USD price dynamics and produce short-term trading opportunities around the major.
Technical levels to watch
While speaking at the Hearing before the Committee on Economic and Monetary Affairs (ECON) of the European Parliament in Brussels, European Central Bank (ECB) President Christine Lagarde reiterated that price pressure remain strong in the Euro area.
Additional takeaways
"Underlying inflationary pressures remain high."
"No clear evidence that underlying inflation has peaked."
"Wage pressures have strengthened further."
"Decisions will continue to be based on our assessment of the inflation outlook in the light of the incoming economic and financial data, the dynamics of underlying inflation and the strength of monetary policy transmission."
"Our rate hikes are being transmitted forcefully to financing conditions."
"Full effects of our monetary policy measures are starting to materialise."
"Effects of monetary policy tightening on real activity and inflation can be expected to strengthen in the coming years."
Market reaction
EUR/USD showed no immediate reaction to these comments and was last seen losing 0.3% on the day at 1.0680.
- USD/CAD is oscillating in a narrow range around 1.3450 as the BoC policy comes under the picture.
- The upside in the Lonnie asset is restricted by upbeat oil prices while the downside is being supported by a solid US Dollar.
- The BoC is expected to keep interest rates steady at 4.5% as Canada’s inflation has been steadily declining.
The USD/CAD pair is consistently showing back-and-forth action around 1.3430 in the early New York session. The Loonie asset is struggling to deliver a decisive move as investors are shifting their focus toward the interest rate decision by the Bank of Canada (BoC), which will be announced on Wednesday.
S&P500 futures are showing nominal gains before the opening of the American session. The overall market mood is quite upbeat as the Federal government has successfully eradicated the case of a default by the United States economy.
The US Dollar Index (DXY) has registered a fresh day's high at 104.40. Investors are gung-ho for the USD Index as consistent higher additions of fresh payrolls in the US labor market is supporting hopes of the continuation of the policy-tightening spell by the Federal Reserve (Fed).
It is worth noting that the Loonie asset is inside the woods despite sheer strength in the USD Index, which indicates that the Canadian Dollar is also strong.
The trigger that has been supporting the Canadian Dollar is the upbeat oil prices after the announcement of fresh oil production cuts seldom by Saudi Arabia. Saudi Arabia’s Energy Minister, Prince Abdulaziz bin Salman, said on Sunday, “Saudi Arabia to make extra 1 million b/d output cut from July.” He further added the Kingdom will extend its 500k barrels per day (b/d) voluntary cut until the end of 2024.
Investors should note that Canada is the leading exporter of oil to the United States and higher oil prices are supporting the Canadian Dollar.
This week, the interest rate policy by the BoC will be keenly watched. BoC Governor Tiff Macklem is expected to keep interest rates steady at 4.5% as Canada’s inflation has been steadily declining. In April, Canada’s inflation was recorded at 4.4%.
US ISM Services PMI Overview
The Institute of Supply Management (ISM) will release the Non-Manufacturing Purchasing Managers' Index (PMI) - also known as the ISM Services PMI – at 14:00 GMT this Monday. The gauge is expected to come in at 51.5 for May, down a little from 51.9 in the previous month. Given that the Fed looks more at inflation than growth, investors will keep a close eye on the Prices Paid sub-component, which is anticipated to fall from 59.6 in April to 57.8 during the reported month.
How Could It Affect EUR/USD?
Ahead of the key release, the prospects for another 25 bps rate hike by the Federal Reserve (Fed) in June push the US Dollar (USD) higher for the second successive day and drag the EUR/USD pair back blow the 1.0700 mark. A stronger US ISM Services PMI, along with higher-than-expected Prices Paid Index, will reaffirm market expectations, which should provide an additional boost to the Greenback and pave the way for a further depreciating move for the major.
In contrast, any immediate market reaction to the disappointing headline print is more likely to remain limited amid a further rise in the US Treasury bond yields. This, in turn, favours the USD bulls and suggests that the path of least resistance for the EUR/USD pair is to the downside. That said, a generally positive risk tone could act as a headwind for the safe-haven buck and help limit deeper losses for the major, at least for the time being.
Eren Sengezer, Editor at FXStreet, offers a brief technical outlook and writes: “EUR/USD broke below the 20 and the 50-period Simple Moving Averages (SMA) on the four-hour chart and the Relative Strength Index (RSI) indicator on the same chart dropped below 50, reflecting the bearish bias in the short term.
Eren also outlines important technical levels to trade the EUR/USD pair: “The upper-limit of the descending regression channel aligns as immediate support at 1.0680. In case EUR/USD returns within that channel by confirming that level as resistance, 1.0650 (mid-point of the channel, end-point of the latest downtrend) aligns as strong support before bears could target 1.0600 (psychological level, lower-limit of the descending channel).”
“On the upside, a four-hour close above 1.0720 (50-period SMA) could discourage sellers. In that scenario, 1.0750 (Fibonacci 23.6% retracement level of the latest downtrend) and 1.0780 (100-period SMA) align as next hurdles,” Eren adds further.
Key Notes
• EUR/USD Forecast: Euro could stretch lower in case 1.0680 support fails
• EUR/USD remains offered and below 1.0700 ahead of data, Lagarde
• EUR/USD: Dollar attention to the Fed?
About the US ISM manufacturing PMI
The Institute for Supply Management (ISM) Manufacturing Index shows business conditions in the US manufacturing sector. It is a significant indicator of the overall economic condition in the US. A result above 50 is seen as positive (or bullish) for the USD, whereas a result below 50 is seen as negative (or bearish).
- GBP/JPY has extended its downside to near 173.58 amid solid hopes of a BoJ’s stealth intervention.
- BoJ Ueda is consistently pumping liquidity into the economy to keep inflation steadily above 2%.
- Higher food inflation and labor shortages have remained major catalysts behind sticky UK inflation.
The GBP/JPY pair has picked significant offers and has extended its reversal move to near 173.58 in the late European session. A fresh seven-year high made by the cross has been followed by profit-booking as the Bank of Japan (BoJ) is expected to make a stealth intervention in the currency market to provide some cushion to the Japanese Yen, which is facing the heat of expansionary monetary policy.
According to the latest Reuters report, bets against the Japanese Yen have risen to $8.6 billion equivalent, which was a similar level when Japan’s authorities intervened last year.
To keep Japan’s inflation steadily above 2%, BoJ Governor Kazuo Ueda is consistently pumping liquidity into the economy so that the overall demand can be improved. Japan’s inflation has been imported cost-push driven, which lacks the traits of remaining steady. Steady inflation should be fueled by solid overall demand and higher wages and for which BoJ Ueda has been maintaining an ultra-dovish policy.
Later this week, Japan’s Q1 Gross Domestic Product (GDP) will remain in the spotlight. As per the preliminary report, Thursday’s GDP data is expected to expand by 0.5% vs. prior expansion of 0.4% on a quarterly basis. Annualized Q1 GDP is seen steady at 1.6%.
The Pound Sterling has shown a clear exhaustion in the upside momentum despite the Bank of England (BoE) being bound to raise interest rates further to keep pressure on United Kingdom’s stubborn inflation. Higher food inflation and labor shortages have remained major catalysts behind sticky UK inflation for more than the past year.
Investors should note that BoE Governor Andrew Bailey has already raised interest rates consecutively 12 times and more interest rate hikes cannot be ruled out to bring down price pressures.
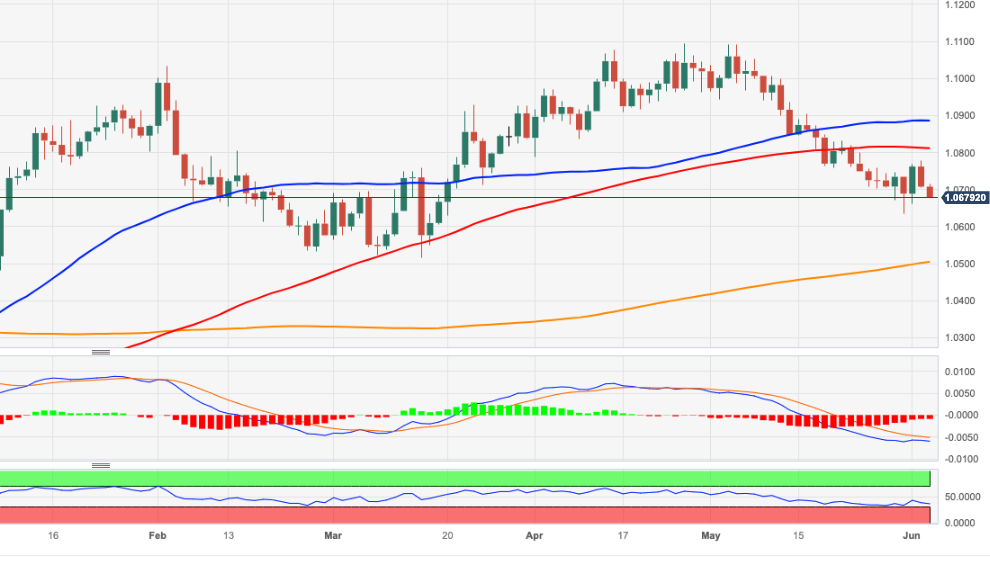
- EUR/USD resumes the downside following Friday’s tops.
- A deeper correction could revisit the 1.0630 zone.
EUR/USD adds to Friday’s marked pullback and drops to the 1.0680 area on Monday.
The pair remains well under pressure and the continuation of the selling bias should put a potential test of the May low at 1.0635 (May 31) back on the radar in the short-term horizon. If spot clears the 1.0600 support it could then open the door to a deeper decline to the March low at 1.0516 (March 15).
A deeper pullback to the 2023 low at 1.0496 (January 6) would likely need a sharp deterioration of the outlook, which appears not favoured for the time being.
Looking at the longer run, the constructive view remains unchanged while above the 200-day SMA, today at 1.0503.
EUR/USD daily chart
- USD/CHF scales higher for the second straight day and draws support from a stronger USD.
- Bets for another 25 bps Fed rate hike lift the US bond yields higher and underpin the buck.
- A positive risk tone dents demand for the safe-haven CHF and also lends support to the pair.
The USD/CHF pair gains positive traction for the second successive day on Monday and maintains its bid tone heading into the North American session. The pair is currently placed just above the 0.9100 mark, with bulls awaiting a sustained move beyond the 100-day Simple Moving Average (SMA) before placing fresh bets.
The post-NFP US Dollar (USD) rebound from over a one-week low remains uninterrupted on the first day of a new week amid expectations that the Federal Reserve (Fed) could hike interest rates again to contain stubbornly high inflation. In fact, the current market pricing indicates around a 30% chance of another 25 bps lift-off at the next policy meeting on June 13-14 and the bets were reaffirmed by robust US monthly employment details released on Friday. This, in turn, remains supportive of a further rise in the US Treasury bond yields, which continues to underpin the Greenback and acts as a tailwind for the USD/CHF pair.
The Swiss Franc (CHF), on the other hand, is pressured by a generally positive tone around the equity markets, which tends to drive flows away from traditional safe-haven currencies. The market sentiment remains well supported by the latest optimism over the passage of legislation to lift the government's $31.4 trillion debt ceiling and avert an unprecedented American default. Adding to this, a private-sector survey showed on Monday that China's services activity picked up in May and further boosts investors' confidence, which, in turn, dents the CHF's safe-haven demand and lends additional support to the USD/CHF pair.
The markets, meanwhile, have pushed back their expectations for an imminent pause in the Fed's rate-hiking campaign to July and eased off on bets for rate cuts later in the year. This, in turn, favours the USD bulls and supports prospects for a further near-term appreciating move for the USD/CHF pair. A sustained move and acceptance above the 100-day SMA will reaffirm the positive outlook, setting the stage for an extension of the recent upward trajectory witnessed over the past month or so. Traders now look to the release of the US ISM Services PMI for some impetus and grab short-term opportunities on Monday.
Technical levels to watch
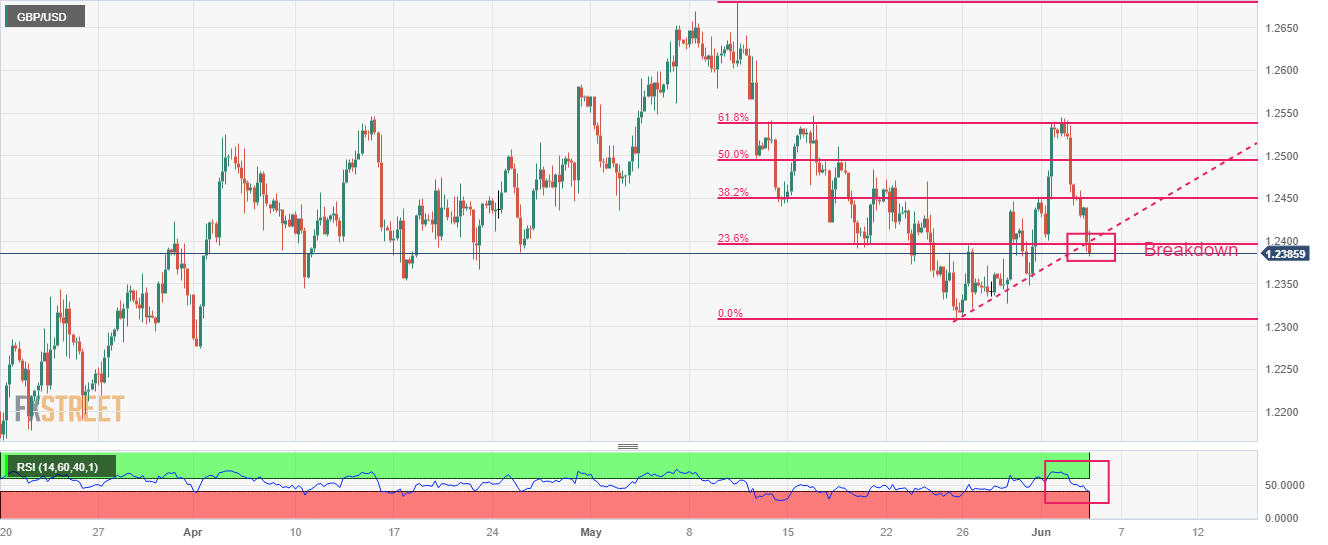
- GBP/USD has delivered a breakdown below 1.2400 as investors get hopeful for a hawkish Fed policy post robust US NFP.
- Considering the persistence of UK inflation, the BoE might fail to halve inflation by year-end as promised by UK PM Rishi Sunak.
- GBP/USD witnessed intense selling pressure after failing to surpass the 61.8% Fibo retracement at 1.2583.
The GBP/USD pair has slipped sharply below the round-level support of 1.2400 in the European session. The Cable is facing immense selling pressure as the US Dollar has been strengthened after robust payroll additions in the United States in May fetched interest rate hike bets into the picture.
Additions of fresh Employment in May were extremely solid despite the Federal Reserve (Fed) consistently raising interest rates and US regional banks have inculcated more filters into their credit disbursement mechanism to maintain their asset quality amid a turbulent environment.
The Pound Sterling is failing in holding its feet despite the Bank of England (BoE) being expected to raise interest rates further amid a tight labor market and persistent food inflation. Considering the persistence in United Kingdom inflation, BoE Governor Andrew Bailey might fail to halve inflation by year-end as promised by UK Prime Minister Rishi Sunak.
GBP/USD witnessed intense selling pressure after failing to surpass the 61.8% Fibonacci retracement (plotted from May 10 high at 1.2680 to May 25 low at 1.2308) at 1.2583. At the press time, the Cable dropped below the 23.6% Fibo retracement at around 1.2400. The asset has also surrendered the support from the upward-sloping trendline placed from May 25 low at 1.2308.
The Relative Strength Index (RSI) (14) is hovering near 40.00. A breakdown below the same would activate the bearish momentum.
Should the asset break below May 31 low at 1.2348, US Dollar bulls would drag the asset toward May 25 low at 1.2308. Slippage below the latter would expose the asset to April 03 low at 1.2275.
On the flip side, a confident break above May 16 high at 1.2547 will drive the Cable towards May 10 low at 1.2603 followed by May 10 high at 1.2680.
GBP/USD four-hour chart
- DXY adds to Friday’s gains well north of the 104.00 barrier.
- Further upside is seen revisiting the May top around 104.80.
DXY’s rebound picks up pace and tests 2-day highs past the 104.00 hurdle on Monday.
Considering the current price action, further advances could initially see the May top of 104.79 (May 31) revisited in the relatively near term. From here, the index could target the minor hurdle at the round level of 105.00 ahead of the crucial 200-day SMA, today at 105.56.
Looking at the broader picture, while below the 200-day SMA, the outlook for the index is expected to remain negative.
DXY daily chart
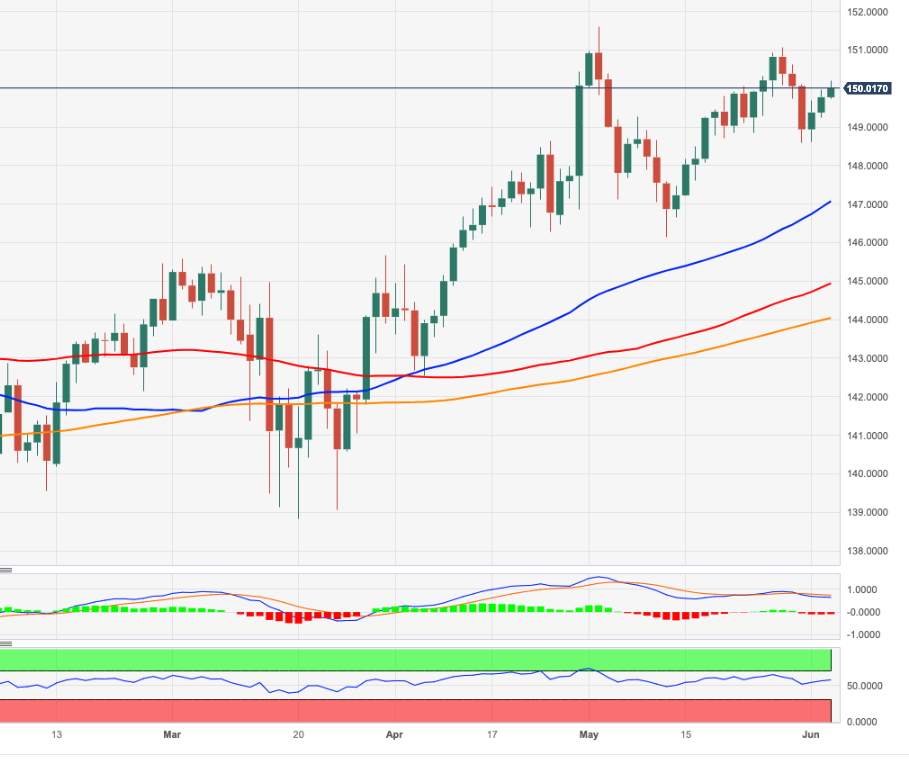
- EUR/JPY extends the rebound and revisits the 150.00 region.
- Further up emerges the late month tops just above 151.00.
EUR/JPY climbs further and reclaims the area beyond the key 150.00 barrier at the beginning of the week.
Further recovery appears a plausible near-term scenario. That said, a convincing move north of 150.00 should retest the weekly high at 151.07 (May 29) ahead of the 2023 top at 151.61 (May 2).
So far, further upside looks favoured while the cross trades above the 200-day SMA, today at 144.01.
EUR/JPY daily chart
- US Dollar preserves its strength at the beginning of the week.
- US Dollar Index stays in positive territory above 104.00.
- ISM Services PMI report for May could influence US Dollar's performance on Monday.
The US Dollar (USD) holds its ground to start the new week. The US Dollar Index (DXY), which tracks the USD's valuation against a basket of six major currencies, stays in positive territory above 104.00 after having gained more than 0.5% on the back of the upbeat May jobs report from the US on Friday.
In the second half of the day, the USD's valuation could be effected by the ISM's Services PMI report for May. Markets expect the data to reveal an ongoing expansion in the service sector's business activity, while forecasting another month of strong input inflation. It's also worth noting that the US Census Bureau will release the Factory Orders data for April.
Daily digest market movers: US Dollar builds on Friday's gains
- The monthly data published by the US Bureau of Labor Statistics (BLS) showed on Friday that Nonfarm Payrolls rose 339,000 in May. This reading surpassed the market expectation of 190,000 by a wide margin. April's reading of 253,000 also got revised higher to 294,000.
- Underlying details of the labor market report revealed that the Unemployment Rate climbed to 3.7% from 3.4% in the same period. The Labor Force Participation rate remained unchanged at 62.6%, while annual wage inflation, as measured by the change in Average Hourly Earnings, edged lower to 4.3% from 4.4%.
- Commenting on the US jobs report, "is the US economy experiencing a soft landing? According to the latest Nonfarm Payrolls, the job market is slowing down to a "Goldilocks level" – not too hot nor too cold," said FXStreet Analyst Yohay Elam. "For markets, it means ongoing growth but with lower inflation and interest rates. For the US Dollar, it means the path of least resistance is down."
- The benchmark 10-year US Treasury bond yield snapped a five-day losing streak after US jobs report and rose nearly 3% on Friday. The 10-year yield continues to stretch higher and stays in positive territory above 3.7% on Monday, providing a support to the USD.
- Despite rising US yields, the CME Group FedWatch Tool shows that markets are still pricing a more than 70% probability of the Federal Reserve (Fed) leaving its policy rate unchanged at the upcoming meeting.
- "There's likely enough pockets of softness in this report for the FOMC to pass on raising rates at the next meeting, though another strong payrolls gain in June, coupled with another disappointing inflation report, could set the stage for a rate increase in July," economists at the Bank of Montreal said regarding the potential impact of the labor data on the Fed's policy outlook.
- US stock index futures trade mixed in the European session. On Friday, the S&P 500 Index gained more than 1% as markets cheered strong jobs figures.
Technical analysis: US Dollar Index turns bullish after recent upsurge
The US Dollar Index (DXY) broke above 104.00 on Thursday, where the Fibonacci 23.6% retracement of the November-February downtrend is located. Confirming the bullish tilt in the near-term technical outlook, The Relative Strength Index (RSI) indicator on the daily chart climbed above 60.
104.50 (static level) aligns as first resistance for DXY ahead of 105.00 (psychological level). A daily close above the latter could bring in additional buyers and open the door for an extended rebound toward 105.60 (Fibonacci 38.2% retracement, 200-day Simple Moving Average (SMA)).
On the downside, bearish pressure could increase if DXY drops back below 104.00. In that scenario, 103.50 (static level) could be seen as initial support before 103.00 (100-day SMA).
How does Fed’s policy impact US Dollar?
The US Federal Reserve (Fed) has two mandates: maximum employment and price stability. The Fed uses interest rates as the primary tool to reach its goals but has to find the right balance. If the Fed is concerned about inflation, it tightens its policy by raising the interest rate to increase the cost of borrowing and encourage saving. In that scenario, the US Dollar (USD) is likely to gain value due to decreasing money supply. On the other hand, the Fed could decide to loosen its policy via rate cuts if it’s concerned about a rising unemployment rate due to a slowdown in economic activity. Lower interest rates are likely to lead to a growth in investment and allow companies to hire more people. In that case, the USD is expected to lose value.
The Fed also uses quantitative tightening (QT) or quantitative easing (QE) to adjust the size of its balance sheet and steer the economy in the desired direction. QE refers to the Fed buying assets, such as government bonds, in the open market to spur growth and QT is exactly the opposite. QE is widely seen as a USD-negative central bank policy action and vice versa.
- Gold price edges lower for the second successive day amid some follow-through US Dollar buying.
- Bets for another 25 bps Fed rate-hike in June push the US bond yields higher and underpin the USD.
- The prevalent risk-on mood contributes to driving flows away from the non-yielding yellow metal.
Gold price edges lower for the second successive day on Monday and remains depressed through the first half of the European session. The XAU/USD is currently placed just above the $1,940 level, with bears awaiting a sustained break through the 100-day Simple Moving Average (SMA) before positioning for an extension of the recent pullback from an all-time peak.
Stronger US Dollar weighs on Gold price
The US Dollar (USD) builds on Friday's rebound from over a one-week low, touched in the aftermath of the mixed employment details from the United States (US), and turns out to be a key factor weighing on the Gold price. It is worth recalling that the headline Nonfarm-Payrolls showed that the US economy added 339K jobs in May, higher than the 294K reported in the previous month and smashing estimates for a reading of 190K. This could allow the Federal Reserve (Fed) to stick to its hawkish stance to bring down stubbornly higher inflation, which continues to push the US Treasury bond yields higher and underpin the USD.
Fed rate hike uncertainty lends some support to XAU/USD
Additional details of the closely-watched US jobs data, however, revealed that the Unemployment Rate rose to 3.7% as compared to an expected uptick to 3.5% from 3.4% in April. Furthermore, Average Hourly Earnings edged lower to 4.3% from 4.4% and pointed to signs of moderating wage growth. This, along with less hawkish remarks by a slew of Fed officials last week, fueled speculations about an imminent pause in the US central bank's rate-hiking campaign. This, in turn, is holding back traders from placing aggressive bearish bets around the non-yielding Gold price and helping limit further losses, at least for the time being.
Risk-on mood should cap any attempted recovery in Gold price
The upside, meanwhile, remains capped amid the prevalent risk-on environment, which tends to undermine traditional safe-haven assets, including the XAU/USD. Investors continue to cheer the optimism over the passage of legislation to lift the government's $31.4 trillion debt ceiling to avert an unprecedented American default. Adding to this, a private-sector survey showed on Monday that China's services activity picked up in May and remains supportive of a generally positive tone around the equity markets. This, in turn, could act as a headwind for the Gold price and warrants some caution for aggressive bullish traders.
Traders now look to US ISM Services PMI for some impetus
Market participants now look forward to the release of the US ISM Services PMI, due later during the early North American session. This, along with the US bond yields, will influence the USD price dynamics and provide some impetus to Gold price. Apart from this, the broader risk sentiment might further contribute to producing short-term trading opportunities around the XAU/USD.
Gold price technical outlook
From a technical perspective, some follow-through selling below last week's swing low, around the $1,932 area, will be seen as a fresh trigger for bearish traders and pave the way for deeper losses. The Gold price might then accelerate the downfall towards the $1.919-$1.918 intermediate support before eventually dropping to the $1.900 round-figure mark.
On the flip side, recovery back above the $1,947-$1,949 region is likely to face resistance near the $1.957-$1,958 zone ahead of the $1.983-$1,985 supply zone. The latter should act as a pivotal point, above which a fresh bout of a short-covering could allow the Gold price to reclaim the $2.000 psychological mark and climb to the next relevant hurdle near the $2,010-$2,012 region.
Key levels to watch
- EUR/JPY is looking delicate around 150.00 as the focus shifts to ECB Lagarde’s speech.
- ECB policymakers are supporting more interest rate hikes as Eurozone core inflation is still persistent.
- The BoJ is expected to intervene in the currency markets to provide some cushion to the Japanese Yen.
The EUR/JPY pair is struggling in defending the auction above the psychological support of 150.00 in the European session. The cross is expected to remain on the tenterhooks as investors are awaiting the speech from European Central Bank (ECB) President Christine Lagarde before the European Parliament.
ECB Lagarde is expected to provide guidance about the likely monetary policy action in June’s monetary policy meeting. The street is convinced that the ECB will hike interest rates further despite the sheer softening of Eurozone inflation.
An in-depth investigation of the Eurozone’s May inflation report showed that headline price pressures slowed dramatically amid declining energy prices and food inflation while core inflation is still stubborn. Sticky core inflation makes the case stronger for more interest rate hikes by the ECB. Also, ECB policymaker, Boštjan Vasle, said on Friday, “More rate hikes needed to get inflation to the 2% target.” He further added, “Core inflation remains high and persistent.”
In addition to ECB Vasle, ECB Governing Council member, Gabriel Makhlouf, said that they are “likely to see another rate increase at the next meeting.“ He further added a fall in Eurozone inflation is welcomed but is not definitive with underlying pressures quite strong. It is likely that we will see another rate increase at the next meeting as the ECB has not reached the moment where it can say let's now stop.
Meanwhile, the Japanese Yen is making efforts to get an upper hand as the Bank of Japan (BoJ) is expected to intervene to provide some cushion to the domestic currency. According to the latest Reuters report, bets against the Japanese Yen have risen to $8.6 billion equivalent, which was a similar level when Japan’s authorities intervened last year.
Going forward, Japan’s Q1 Gross Domestic Product (GDP) will remain in the spotlight. Thursday’s GDP data is expected to expand by 0.5% vs. prior expansion of 0.4% on a quarterly basis. Annualized Q1 GDP is seen steady at 1.6%.
- AUD/USD has printed a fresh day’s low at 0.6587 as USD Index prepares for a fresh upside.
- The street is holding mixed views on the interest rate decision by the Fed for June’s monetary policy meeting.
- The RBA is expected to raise the OCR further as Australian inflation has turned stubborn again.
The AUD/USD has refreshed its day’s low at 0.6587 in the London session. The Aussie asset has witnessed immense selling pressure despite the street holding mixed views on the interest rate decision by the Federal Reserve (Fed) for June’s monetary policy meeting.
S&P500 futures are holding nominal gains in the European session, indicating that the risk appetite theme is being underpinned by the market participants. The overall upbeat market mood seems biased toward the US equities and not supporting the risk-sensitive currencies. The US Dollar Index (DXY) has turned sideways after printing a fresh day’s high at 104.32. The USD Index is expected to extend its upside journey amid the absence of signals of exhaustion in the upside momentum.
Meanwhile, the street is divided about Fed’s interest rate policy stance. A scrutiny of the Friday’s Nonfarm Payrolls (NFP) report showed that the Unemployment Rate jumped to its seven-month high at 3.7%. Contrary to that, additions of fresh payrolls in the United States labor market in May were at 339K, significantly higher than the estimates of 190K. The situation is a little surprising on whether to consider consistent solid payroll additions and support more rate hikes or pause the same due to a sudden rise in the jobless rate.
On the Australian Dollar front, the interest rate decision by the Reserve Bank of Australia (RBA) will remain in focus. Considering the fact that Australian inflation has turned stubborn again as the monthly Consumer Price Index (CPI) indicator rose to 6.8% in April from March’s 6.3% figure, one more interest rate hike of 25 basis points (bps) which will push the Official Cash Rate (OCR) to 4.10%, cannot be ruled out.
- USD/JPY gains traction for the second straight day on Monday amid broad-based USD strength.
- Bets for a 25 bps Fed rate hike in June push the US bond yields higher and underpin the buck.
- Fears of an intervention lend some support to the JPY and could cap further gains for the pair.
The USD/JPY pair builds on Friday's strong intraday positive move and gains some follow-through traction for the second successive day on Monday. The pair maintains its bid tone through the first half of the European session and currently trades around the 140.25-140.35 region, just a few pips below a four-day high touched in the last hour.
The post-NFP US Dollar (USD) recovery from over a one-week low remains uninterrupted on the first day of a new week and is seen as a key factor acting as a tailwind for the USD/JPY pair. Despite the mixed US jobs data released on Friday, the markets are still pricing in the possibility of another 25 bps rate hike by the Federal Reserve (Fed) at its policy meeting later this month. This, in turn, remains supportive of a further rise in the US Treasury bond yields and continues to underpin the Greenback.
The Japanese Yen (JPY), on the other hand, is weighed down by a more dovish stance adopted by the Bank of Japan (BoJ). Apart from this, the prevalent risk-on mood - as depicted by a generally positive tone around the equity markets - further dents the JPY's relative safe-haven status and lends additional support to the USD/JPY pair. That said, the prospect of Japanese authorities intervening in the markets helps limit deeper losses for the JPY and caps any further gains for the major, at least for now.
This, in turn, warrants some caution for aggressive bullish traders and before positioning for any further intraday appreciating move. The fundamental backdrop, however, suggests that the path of least resistance for the USD/JPY pair is to the upside. Trades now look to the US ISM Services PMI, due later during the early North American session. Apart from this, the US bond yields will drive the USD, which, along with the broader risk sentiment, should provide fresh impetus to the major.
Technical levels to watch
In a CNBC interview on Monday, International Monetary Fund (IMF) Managing Director Kristalina Georgieva said that "we don't yet see a significant slowdown in lending.”
“There is some, but not on the scale that would lead to the Fed stepping back,” the IMF chief added.
Related reads
- Forex Today: Cautious start to the week ahead of key US data
- USD Index extends the upside above 104.00 ahead of key data
The Eurozone Sentix Investor Confidence index keeps falling, arriving at -17.1 in June from -13.1 booked in May vs. -9.2 expected.
The Index on the Current Situation fell steeply to -15.8 from -7.0 in May, raising worries over a recession in the Eurozone already underway.
The Sentix index for Germany in June fell to the lowest since November last year, at minus 21.1, from minus 14.5 the previous month.
Key takeaways
"A look at the Sentix data of the largest economy then clearly shows that the cause of the misery in Euroland is probably linked to the weakness of the German economy.”
"The biggest problem child in the Eurozone remains Germany."
EUR/USD reaction
The shared currency is keeping its downside momentum intact after the downbeat Eurozone Sentix data. EUR/USD is trading at 1.0694, down 0.14% on the day.
- USD/CAD gains some positive traction on Monday amid some follow-through USD buying.
- Bets for another 25 bps Fed rate hike in June push the US bond yields higher and the USD.
- Bullish Crude Oil prices underpin the Loonie and might cap any further gains for the pair.
The USD/CAD pair attracts some buying near the 200-day Exponential Moving Average (EMA) on Monday and sticks to its modest intraday gains through the early part of the European session. The pair currently trades around the 1.3430-1.3435 region, up nearly 0.10% for the day, and for now, seems to have snapped a three-day losing streak to the 1.3400 mark, or a nearly three-week low touched on Friday.
The US Dollar (USD) gains some follow-through traction for the second successive day and turns out to be a key factor acting as a tailwind for the USD/CAD pair. Despite the mixed US monthly employment details, the markets area still pricing in another 25 bps lift-off by the Federal Reserve (Fed) later this month. This remains supportive of a further rise in the US Treasury bond yields and pushes the Greenback higher on the first day of a new week. That said, the prevalent risk-on mood might hold back traders from placing aggressive bullish bets around the safe-haven buck.
The markets continue to cheer the optimism over the passage of legislation to lift the government's $31.4 trillion debt ceiling to avert an unprecedented American default. Adding to this, a private-sector survey showed on Monday that China's services activity picked up in May and boosted investors' confidence, which is evident from a generally positive tone around the equity markets. This, along with an intraday rally in Crude Oil prices, which tends to underpin the commodity-linked Loonie, further contributes to capping any meaningful upside for the USD/CAD pair.
In fact, Oil prices opened with a bullish gap on Monday in reaction to an OPEC+ agreement over the weekend to extend at least 3.66 million bpd of cuts till end-2024 from end-2023. Adding to this, Saudi Arabia pledged to cut its production by about 1 million bpd in July to 9 million bpd and lends additional support to the black liquid. This, in turn, makes it prudent to wait for a strong follow-through buying around the USD/CAD pair before positioning for any further appreciating move ahead of the release of the US ISM Services PMI later during the early North American session.
Technical levels to watch
According to the latest Reuters report, bets against the Japanese Yen have risen to $8.6 billion equivalent. That was a similar level when Japan’s authorities intervened last year.
“Japan's authorities may think currency speculation is excessive,” the report said, adding, “the problem for Japan policymakers is their own policy.”
Market reaction
USD/JPY is off the intraday highs of 140.45, trading at 140.24, at the press time. The pair is adding 0.18% on the day.
- EUR/USD starts the week on the defensive below 1.0700.
- Germany, EMU Services final Services PMIs came in mixed.
- ECB President C. Lagarde speaks later in the European session.
The single currency extends the corrective decline vs. the greenback and forces EUR/USD to break below the key support at 1.0700 the figure at the beginning of the week.
EUR/USD focused on data, ECB
EUR/USD slips back below the 1.0700 level and prints new 2-day lows near 1.0680 on Monday on the back of the continuation of the bid bias in the greenback and further weakness in the risk complex, all despite positive results from the Chinese PMIs gauged by Caixin earlier in the session.
Indeed, spot appears to resume the downtrend seen in past weeks and fades further last Thursday’s strong advance, returning to the sub-1.0700 region in response to the resumption of the buying interest in the greenback amidst rising yields on both sides of the ocean and investors’ repricing of a Fed’s pause at its meeting later in the month.
In the domestic calendar, final Services PMI in Germany and the euro area came in at 57.2 and 55.1, respectively, for the month of May. In addition, Germany’s trade surplus rose to €18.4B in April. Still in the region, ECB President C. Lagarde is expected to speak before the European Parliament later in the afternoon.
Across the pond, the ISM Services PMI will take centre stage along with Factory Orders and the final Services PMI tracked by S&P Global.
What to look for around EUR
EUR/USD retreats to the area south of the 1.0700 support following the resumption of the bid bias in the greenback on Monday.
In the meantime, the pair’s price action is expected to closely mirror the behaviour of the US Dollar and will likely be impacted by any differences in approach between the Fed and the ECB with regards to their plans for adjusting interest rates.
Moving forward, hawkish ECB speak continues to favour further rate hikes, although this view appears to be in contrast to some loss of momentum in economic fundamentals in the region.
Key events in the euro area this week: Germany Final Services PMI/Balance of Trade, EMU Final Services PMI/Sentix Index/Producer Prices (Monday) – Germany Construction PMI/Factory Orders, EMU Retail Sales (Tuesday) – Germany Industrial Production (Wednesday) - EMU Flash GDP Growth Rate (Thursday).
Eminent issues on the back boiler: Continuation of the ECB hiking cycle in June and July (and September?). Impact of the Russia-Ukraine war on the growth prospects and inflation outlook in the region. Risks of inflation becoming entrenched.
EUR/USD levels to watch
So far, the pair is losing 0.13% at 1.0692 and faces initial support at 1.0635 (monthly low May 31) seconded by 1.0516 (low March 15) and finally 1.0481 (2023 low January 6). On the upside, the surpass of 1.0779 (weekly high June 2) would target 1.0810 (100-day SMA) en route to 1.0885 (55-day SMA).
- The oil price has extended its recovery above $73.20 as fresh supply cuts would impact the demand-supply parity.
- Higher odds of a stable Fed policy and a recovery in Chinese factory activity are supporting the oil price.
- The investing community is divided between a higher United States Unemployment Rate and higher payroll additions.
West Texas Intermediate (WTI), futures on NYMEX, rebounded firmly after defending the downside near $72.22 in Asia. The oil price has extended its recovery above $73.20 in Europe as the announcement of fresh cuts in oil production solely by Saudi Arabia is going to tweak the current supply-demand mechanism.
On the weekend, Saudi Arabia’s Energy Minister, Prince Abdulaziz bin Salman, said on Sunday, “Saudi Arabia to make extra 1 million b/d output cut from July.” He further added the Kingdom will extend its 500k barrels per day (b/d) voluntary cut until the end of 2024.
The continuous decline in oil prices by the oil cartel in a way to provide cushion to energy prices indicates that the oil demand outlook is extremely bleak and back-to-back supply cuts are the only method for supporting prices.
In China, recovery in factory activity communicated by IHS Markit through Caixin Manufacturing PMI has fueled some optimism among investors. The economic data managed to defend the 50.0 threshold and landed at 50.9, higher than the consensus and the prior release of 49.5. Investors should note that China is the largest importer of oil in the world and higher manufacturing activity in China strengthens the oil demand outlook.
Meanwhile, the US Dollar Index (DXY) is hovering near its intraday high around 104.32 as hawkish Federal Reserve (Fed) bets are consistently providing the required support. The investing community is divided between a higher United States Unemployment Rate and higher payroll additions. According to the CME Fedwatch tool, more than 86% of the chances are in favor of a stable interest rate decision.
- Silver remains under some selling pressure for the second successive day on Monday.
- The intraday break below the $23.55 confluence supports prospects for further losses.
- A sustained strength beyond the $24.00 mark is needed to offset the negative outlook.
Silver extends Friday's rejection slide from the $24.00 mark, or the 38.2% Fibonacci retracement level of the downfall witnessed in May and drifts lower for the second successive day. The white metal maintains its offered tone, just below the $23.50 level through the early European session on Monday and seems vulnerable to weaken further.
From a technical perspective, the intraday slide drags the XAG/USD below the $23.55 confluence support, comprising the 23.6% Fibo. level and the 100-period Simple Moving Average (SMA) on the 4-hour chart. Moreover, bearish oscillators on daily/4-hour charts add credence to the negative outlook and support prospects for a further intraday depreciating move.
Hence, a subsequent slide, towards testing the $23.00 round figure, looks like a distinct possibility. Some follow-through selling will expose the $22.70-$22.65 region, or over a two-month low touched in May, below which the XAG/USD could eventually drop to the $22.00 mark. The latter represents the very important 200-day SMA and should act as a pivotal point.
On the flip side, sustained strength beyond the $23.55 confluence support breakpoint could allow the XAG/USD to make a fresh attempt towards conquering the $24.00 mark. This is closely followed by the $24.15-$24.20 horizontal resistance, above which the momentum could push the commodity further towards the 50% Fibo. level, around the $24.45-$24.50 region.
The XAG/USD might eventually climb to the $24.80 zone, or the 61.8% Fibo. level, and aim to reclaim the $25.00 psychological mark for the first time since May 11. The upward trajectory could get extended further towards the $25.30-$25.35 supply zone en route to the $26.00 round figure and over a one-year high, around the $26.10-$26.15 area touched in May.
Silver 4-hour chart
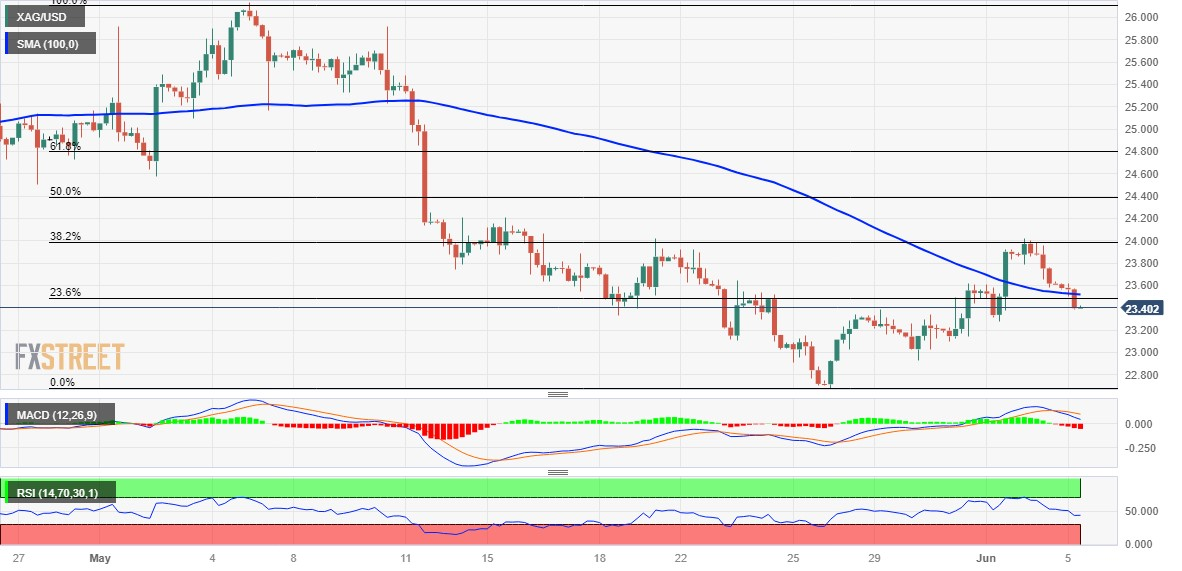
Key levels to watch
- USD/CHF has recorded a fresh day’s high at 0.9120 amid strength in the USD Index.
- The USD Index might post more gains as more rates by the Fed will widen the interest rate divergence with other central banks.
- Swiss inflation remained mixed as monthly CPI dipped to 0.3% while annual inflation accelerated marginally to 2.2%.
The USD/CHF pair has refreshed its intraday high at 0.9120 in the European session. The Swiss Franc asset has been infused with an adrenaline rush amid sheer strength in the US Dollar. The major has been underpinned as the Federal Reserve (Fed) is expected to raise interest rates. The odds for a fresh interest rate hike by the Fed are skyrocketing amid tight labor market conditions.
S&P500 futures have recovered their entire losses posted in Asia and have turned positive, indicating a solid recovery in the risk appetite of the market participants. Investors should note that US equities were significantly bought on Friday and now mild correction is being capitalized as a buying opportunity, portraying that the overall market mood is extremely cheerful.
The US Dollar Index (DXY) has printed a fresh day’s high at 104.32. Investors are hopeful that the USD Index will post more gains as more interest rate hikes by the Fed will widen the interest rate divergence with other central banks. The strength in the USD Index has also pushed US Treasury yields significantly higher. The 10-year US Treasury yields have accelerated sharply to near 3.75%.
A power-pack action cannot be ruled out on Monday as the US ISM agency will report Services PMI data. The economic data will be closely watched as the Manufacturing activity contracted straight for the seventh time. A decline in Services PMI could recede hopes of further policy-tightening by the Fed.
Meanwhile, the Swiss Franc has faced pressure after the release of mixed inflation (May) data. The monthly Consumer Price Index (CPI) accelerated at a slower pace of 0.3% while the street was anticipating a pace of 0.4%. Contrary to that, the annual CPI figure jumped to 2.2% vs. the consensus of 2.1% but decelerated sharply from the prior release of 2.6%.
The Swiss National Bank (SNB) could raise interest rates further as SNB Chairman Thomas J. Jordan cited that risks associated with a high-inflated economy are higher than a low-inflation environment.
Here is what you need to know on Monday, June 5:
The US Dollar holds its ground against its major rivals at the beginning of the new week with the US Dollar Index (DXY) building on Friday's gains. Nevertheless, US stock index futures trade mixed, reflecting a cautious stance. April Producer Price Index (PPI) and June Sentix Investors Confidence Index data will be featured in the European economic docket ahead of April Factory Orders and May ISM Services PMI releases from the US.
On Friday, the US Bureau of Labor Statistics reported that Nonfarm Payrolls (NFP) in the US rose 339,000 in May, surpassing the market expectation of 190,000 by a wide margin. Further details of the publication revealed that the Unemployment Rate edged higher to 3.7% from 3.4% in April. The DXY regained its traction on the strong NFP reading and retraced a portion of its weekly decline. Early Monday, the index continues to stretch higher and stays in positive territory above 104.00. In the meantime, the benchmark 10-year US Treasury bond yield is already up more than 1% on the day above 3.7%. Nevertheless, the CME Group FedWatch Tool shows that markets are still pricing in a more than 70% possibility that the Fed will leave its policy rate unchanged at the upcoming meeting.
Over the weekend, Saudi Arabia’s Energy Minister, Prince Abdulaziz bin Salman said that Saudi Arabia will make an extra output cut of 1 million barrels per day from July. Moreover, OPEC and its allies (OPEC+) announced in a statement that they have reached a deal to target total output of 40.46 million barrels per day from 2024. Following this development, crude oil prices rise on Monday and the barrel of West Texas Intermediate was last seen rising nearly 2% on the day at $73.20. The commodity sensitive Canadian Dollar stays resilient early Monday and USD/CAD trades flat on the day slightly below 1.3450.
During the Asian trading hours, the data from Japan revealed that the Jibun Bank Services PMI declined to 55.9 in May from 56.3 in April. USD/JPY largely ignored this report and started the new week on a bullish note. At the time of press, the pair was trading in positive territory at around 140.50.
EUR/USD registered big losses on Friday and extended its decline early Monday. The pair was last seen trading below 1.0700.
Despite Friday's pullback, GBP/USD ended up posting small gains last week. The pair stays on the back foot in the European morning and tests 1.2400.
In the early trading hours of the Asian session on Tuesday, the Reserve Bank of Australia (RBA) will announce its monetary policy decisions. The RBA is expected to leave its key interest rate unchanged at 3.85%. Ahead of this important event, AUD/USD stays in the red at around 0.6600.
Reserve Bank of Australia Preview: AUD/USD ready for another hike?
Gold price fell sharply on Friday and erased all of its weekly gains. XAU/USD stays under modest bearish pressure amid rising US yields and trades below $1,950.
Following an indecisive weekend, Bitcoin continues to move up and down in a tight channel slightly below $27,000. Ethereum failed to make a daily close above $1,900 despite having advanced above that level over the weekend. ETH/USD edges lower early Monday and was last seen losing nearly 1% on the day at $1,870.
- GBP/USD drifts lower for the second straight day amid some follow-through USD buying.
- Bets for a 25 bps Fed lift-off in June push the US bond yields higher and underpin the USD.
- The risk-on mood could cap gains for the safe-haven buck and lend support to the major.
The GBP/USD pair kicks off the new week on a weaker note and retreats further from its highest level since May 16, around the 1.2540-1.2545 region touched on Friday. Spot prices extend the steady intraday descent through the early European session and drop to the 1.2400 neighbourhood, or a fresh daily low in the last hour.
The post-NFP US Dollar (USD) bounce from over a one-week high remains uninterrupted amid the uncertainty over the Federal Reserve's (Fed) rate-hike path and drags the GBP/USD pair lower for the second successive day. It is worth recalling that a slew of influential Fed officials last week backed the case for skipping an interest rate hike, though the markets are still pricing in the possibility of another 25 bps lift-off in June.
Moreover, investors scaled back their expectations for an imminent pause in the Fed's rate hiking cycle to July and eased off on bets for rate cuts later in the year following the release of the mixed US monthly employment details on Friday. This remains supportive of a further rise in the US Treasury bond yields and continues to underpin the Greenback, which, in turn, is seen exerting downward pressure on the GBP/USD pair.
That said, the prevalent risk-on environment might hold back traders from placing aggressive bullish bets around the safe-haven buck and lend support to the GBP/USD pair. The passage of legislation to lift the government's $31.4 trillion debt ceiling to avert an unprecedented American default, along with hopes of a recovery in China, boost investors' confidence and is evident from a generally positive tone around the equity markets.
Apart from this, firming expectations for additional interest rate hikes by the Bank of England (BoE), bolstered by stronger-than-expected UK consumer inflation figures for May, might contribute to limiting losses for the GBP/USD pair. Market participants now look forward to the release of the final UK Services PMI for a fresh impetus ahead of the US ISM Services PMI, due later during the early North American session.
Technical levels to watch
- NZD/USD has witnessed a downside move after the rebound move inspired by the steady Chinese Services PMI faded brutally.
- The US Dollar Index (DXY) has come out of the woods and has climbed above the immediate resistance of 104.20.
- US NFP data showed that it would be early for Fed to pause the policy-tightening spell.
The NZD/USD pair has delivered a decent recovery move after sensing buying interest near 0.6050 in the early European session. The recovery move in the Kiwi asset could be concluded as the US Dollar Index (DXY) has refreshed its intraday high at 104.22.
S&P500 futures have covered significant losses added in Asia, portraying recovery in the risk-taking ability of the market participants. The US Dollar Index (DXY) has come out of the woods and has climbed above the immediate resistance of 104.20. Investors seem gung-ho for the US Dollar as the Federal Reserve (Fed) is expected to raise interest rates further to discount the impact of consistently rising additions of fresh talent into the labor market.
On Friday, United States Employment data showed that it would be early for Fed chair Jerome Powell to pause the policy-tightening spell as higher interest rates and tight credit conditions by the US regional banks are failing to force firms to slow down the hiring process.
In May, the US labor market was filled with fresh addition of 339k, significantly higher than expectations. Contrary to that, the Unemployment Rate rose to 3.7%. Monthly Average Hourly Earnings matched expectations at 0.3% while the annual figure decelerated marginally to 4.3%.
Analysts at TD Securities pointed out that payroll strength keeps the door open for another rate hike from the Fed. “The May jobs report should leave the hike option fully on the table for the Fed. If Fed officials were looking for clear signs of labor-market slowing, we do not think this report clearly offers that perspective despite the rise in the UE rate. We continue to look for the Fed to lift rates by a final 25bp to 5.25%-5.50% range in June, but also acknowledge that the FOMC's decision will be a very close call.”
On the Kiwi front, Caixin Services PMI (May) matched expectations and provided some support to the New Zealand Dollar. The economic data justified expectations at 57.1. A collaborative impact of upbeat factory activity and decent Services PMI indicates that the Chinese economy is right on track after dismantling Covid protocols.
It is worth noting that New Zealand is one of the leading trading partners of China and economic activities in China with better scale support the New Zealand Dollar.
- EUR/GBP extends previous week’s rebound from yearly low amid oversold RSI.
- Support-turned-resistance line, bearish MACD signals challenge pair buyers.
- 11-month-old horizontal support area appears a tough nut to crack for bears.
EUR/GBP picks up bids to stretch the previous week’s recovery from the lowest levels in 2023 heading into Monday’s European session. In doing so, the cross-currency pair justifies the oversold RSI (14) line to print the two-day rebound.
However, the previous support line from March 15, around 0.8640 by the press time, as well as the bearish MACD signals, challenge the EUR/GBP pair buyers.
Even if the quote crosses the 0.8640 hurdle, the 61.8% Fibonacci retracement of its August-September 2022 upside, near 0.8690, quickly followed by the 0.8700 round figure, can challenge the EUR/GBP bulls.
It’s worth noting that the 200-DMA level surrounding 0.8755 acts as the last defense of the EUR/GBP bears, a break of which could convince pair buyers to aim for the previous monthly high of 0.8834.
On the flip side, EUR/GBP sellers need validation from the 0.8600 round to return to the table.
Even so, a horizontal area comprising multiple levels marked since July 2022, close to 0.8550-40 by the press time, appears a tough nut to crack for the pair bears before approaching the late 2022 trough of around 0.8340.
Overall, EUR/GBP is likely to pare the latest monthly loss but the room towards the north appears limited.
EUR/GBP: Daily chart
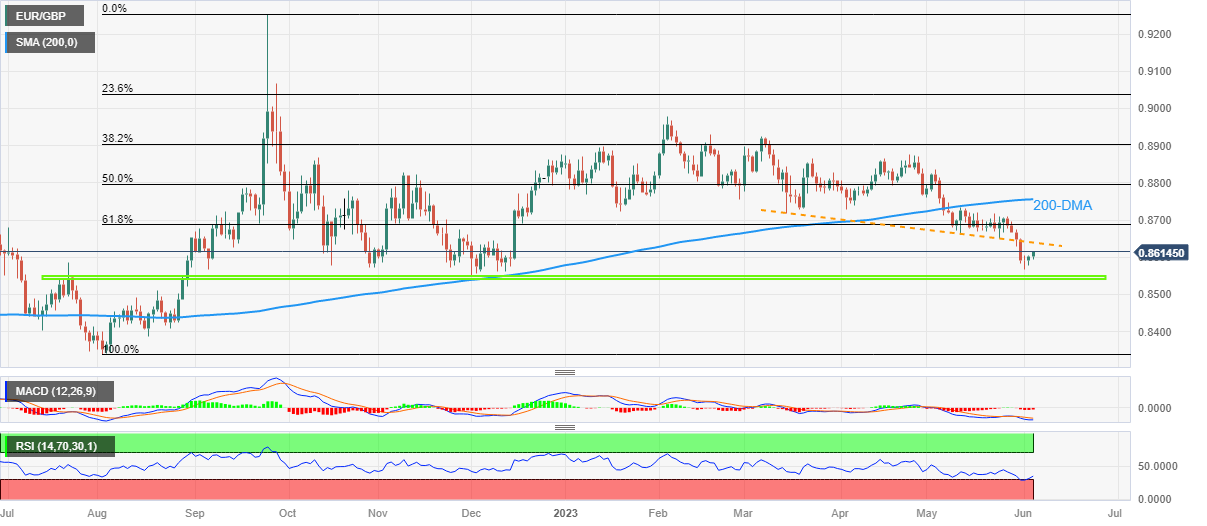
Trend: Limited recovery expected
- Natural Gas price extends the previous day’s rebound from one-month low.
- Upbeat China data underpins hopes of recovery in demand from world’s biggest energy consumer.
- US DoE anticipates XNG/USD oversupply, Chinese consumption snapped 11-year uptrend on zero-covid policy.
- US avoidance of debt-ceiling expiration, doubts over central banks’ ability to further fuel rates propel Natural Gas Price.
Natural Gas Price (XNG/USD) picks up bids to refresh intraday high, extending the previous day’s rebound as the market’s hopes of economic recovery gain momentum during early Monday. However, fears of lesser energy demand and hawkish Fed concerns, as well as a firmer US Dollar, prod the XNG/USD bulls.
US President Joe Biden signed the debt-ceiling bill and avoided the ‘catastrophic’ default, which in turn triggered economic optimism the last Friday.
On the same line is the latest improvement in China data. Earlier in the day, China’s Caixin Services PMI matches 57.1 market forecasts for May versus 56.4 previous readings.
Elsewhere, geopolitical fears surrounding the US, China, Russia and Ukraine also underpin the XNG/USD rebound amid challenges to energy supply.
It should be noted, however, that the US Department of Energy (DoE) predicts the Natural Gas demand increasing by 1.0% but the supplies are likely to grow by 2.0% and hence suggest a 1.0% more supplies over the demand. However, Analysts at Forbes raise doubts about such forecasts.
On a different page, S&P Global Commodity Insights mentioned the first yearly decline in Chinese demand for Natural Gas since 1990 during 2022. However, the drawdown in the XNG/USD was mainly because of the nation’s zero-covid policy and hence the economy’s recent re-opening raise expectations of further Natural Gas demand.
Amid these plays, the energy instrument consolidates the previous monthly losses ahead of the key US ISM Services PMI and Factory Orders for May. Should the scheduled data defy downbeat expectations and print strong outcomes, the XNG/USD bears will have an additional reason to return to the desk.
Natural Gas Price technical analysis
A daily closing beyond a two-week-old descending resistance line, around $2.28 becomes necessary for the Natural Gas buyers to aim for the $2.30 round figure.
- The index adds to Friday’s gains beyond the 104.00 barrier.
- Markets continue to lean towards a Fed’s pause in June.
- US ISM Services PMI, Factory Orders next on tap in the docket.
The greenback, in terms of the USD Index (DXY), starts the new trading week in a positive fashion beyond the 104.00 hurdle on Monday.
USD Index looks at data, Fed bets
The index so far advances for the second session in a row and reclaims the area above the 104.00 level on the back of further selling pressure in the risk-linked galaxy despite positive prints from the Chinese calendar earlier in the Asian session.
In the meantime, expectations of an impasse at the Fed’s tightening cycle at the June 14 event continue to run high and the probability of this scenario hovers around 70% according to CME Group’s FedWatch Tool.
Moving forward, traders are expected to follow the release of the ISM Services PMI due later in the NA session along with the final S&P Global Services PMI for the month of May as well as April’s Factory Orders.
What to look for around USD
The index picks up further pace and looks to regain the bullish outlook above 104.00 at the beginning of the week.
In the meantime, bets of another 25 bps at the Fed’s next gathering in June suddenly reversed course in spite of the steady resilience of key US fundamentals (employment and prices, mainly), denting the recent rally in the dollar and favouring a further decline in US yields.
Bolstering a pause by the Fed instead appears to be the extra tightening of credit conditions in response to uncertainty surrounding the US banking sector.
Key events in the US this week: Final Services PMI, ISM Services PMI, Factory Orders (Monday) – IBD/TIPP Economic Optimism index (Tuesday) – MBA Mortgage Applications, Balance of Trade, Consumer Credit Change (Wednesday) – Initial Jobless Claims, Wholesale Inventories (Thursday).
Eminent issues on the back boiler: Persistent debate over a soft/hard landing of the US economy. Terminal Interest rate near the peak vs. speculation of rate cuts in late 2023/early 2024. Fed’s pivot. Geopolitical effervescence vs. Russia and China. US-China trade conflict.
USD Index relevant levels
Now, the index is gaining 0.15% at 104.19 and the breakout of 104.69 (monthly high May 31) would open the door to 105.56 (200-day SMA) and then 105.88 (2023 high March 8). On the other hand, the next support aligns at 103.38 (monthly low June 2) seconded by the 100-day SMA at 102.93 and finally 102.44 (55-day SMA).
- Gold price has found a short-term cushion near $1,943.00, however, more downside seems favored.
- The USD Index is expected to climb above 104.00 as the odds of one more interest rate hike by the Fed are extremely solid.
- Gold price witnessed an intense sell-off after a mean-reversion move to near the 200-period EMA at $1,977.32.
Gold price (XAU/USD) has found an intermediate support of around $1,943.00 in the early European session. The downside in the precious metal has intervened for the short-term, however, more losses are still in the pipeline as the Federal Reserve (Fed) is expected to raise interest rates further to keep pressure on stubborn United States inflation.
S&P500 futures have trimmed some losses generated in Asia, indicating a recovery in the risk appetite of the market participants. US equities remained in the bullish trajectory on Friday despite the release of the better-than-anticipated Nonfarm Payrolls (NFP) data.
The US Dollar Index (DXY) is continuously trading sideways around 104.00 after a stellar rally. It seems that the USD Index is gathering strength for further upside. Higher odds of one more interest rate hike from the Federal Reserve (Fed) have also fueled fresh blood into US Treasury yields. The yields offered on 10-year US Treasury bonds have climbed strongly above 3.74%.
After the seventh straight contraction in US factory activity, investors are shifting their focus towards the release of the US ISM Services PMI data. US Manufacturing PMI has been failing in reclaiming the 50.0 threshold for the past seven months, however, the Services PMI is performing critically better than the manufacturing sector. As per the preliminary report, US Services PMI is seen declining to 51.5 vs. the prior release of 51.9. New Orders Index that displays forward demand is seen advancing to 56.5 against the former release of 56.1.
Gold technical analysis
Gold price witnessed an intense sell-off after a mean-reversion move to near the 200-period Exponential Moving Average (EMA) at $1,977.32 on a four-hour scale. The precious metal is declining toward the key support plotted from March 22 low at $1,934.34.
The Relative Strength Index (RSI) (14) is hovering near the 40.00 edge. A breakdown in the same will be followed by the activation of the bearish momentum.
Gold four-hour chart
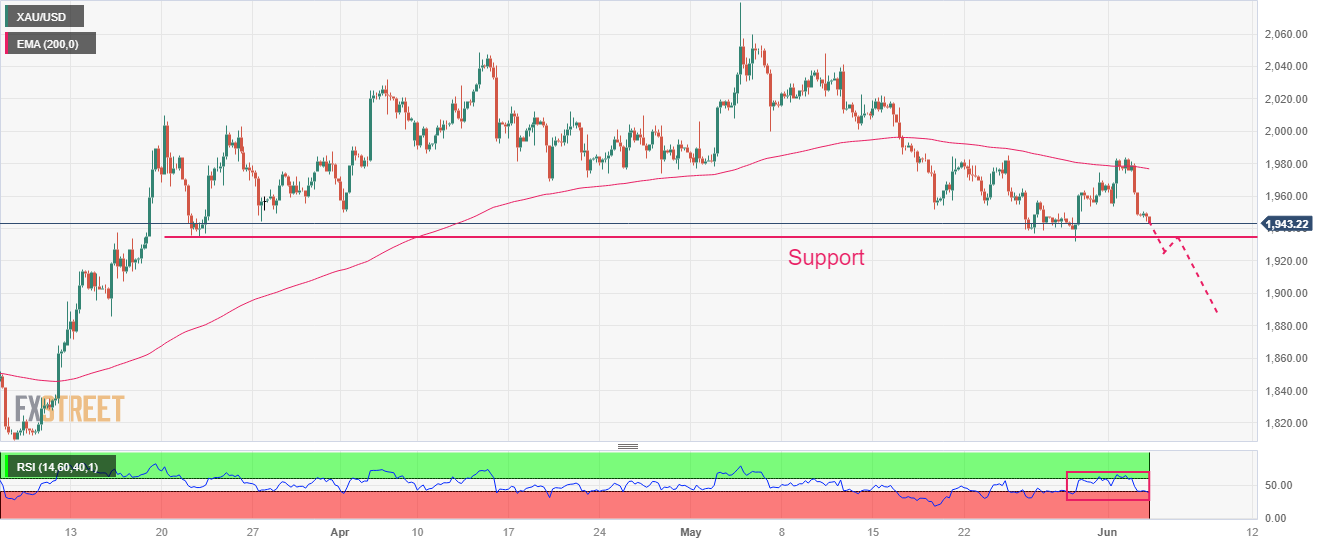
- AUD/USD extends recovery from intraday low within bullish chart formation.
- China Caixin PMI, Australia TD Securities Inflation came in firmer for May.
- Sustained trading beyond key moving averages, upbeat RSI hints at confirmation of bullish pattern.
- Bull flag signals theoretical target of 0.6750, sellers need validation from 200-SMA.
AUD/USD picks up bids to pare intraday losses around 0.6700 as it struggles to cheer upbeat catalysts at home amid early Monday in Europe. In doing so, the Aussie pair portrays the traders’ anxiety ahead of the key Reserve Bank of Australia (RBA) data.
That said, strong US Nonfarm Payrolls (NFP) teased Aussie pair sellers during the week-start trading before the firmer Australia-China data recall the buyers. Earlier in the day, China’s Caixin Services PMI matches 57.1 market forecasts for May versus 56.4 previous readings. Before that, Australia’s TD Securities Inflation rose 0.9% MoM in May versus 0.2%. However, the downbeat prints of the TD Securities Inflation on a YoY basis join a reduction in the nation’s Company Gross Operating Profits for the first quarter (Q1) to prod the bulls.
Apart from that, the top line of the short-term bull flag, around 0.67000 round figure by the press time, challenges the AUD/USD pair buyers.
However, the Aussie pair’s successful trading above the 200 and 100 SMAs, as well as a three-day-old rising support line, keeps the pair buyers hopeful of crossing the immediate 0.6700 hurdle, which in turn highlights a theoretical run-up towards the 0.6750 mark.
During the likely rise, highs marked on May 16 and 19, respectively near 0.6710 and 0.6675, can act as intermediate halts.
Meanwhile, 100-SMA joins the stated flag’s bottom line to highlight the 0.6580 level as the short-term key support.
Following that, the ascending support line from the last Wednesday, near 0.6570, followed by the 200-SMA level of near 0.6545, can act as the last defense of the AUD/USD bulls.
AUD/USD: 30-Minutes chart
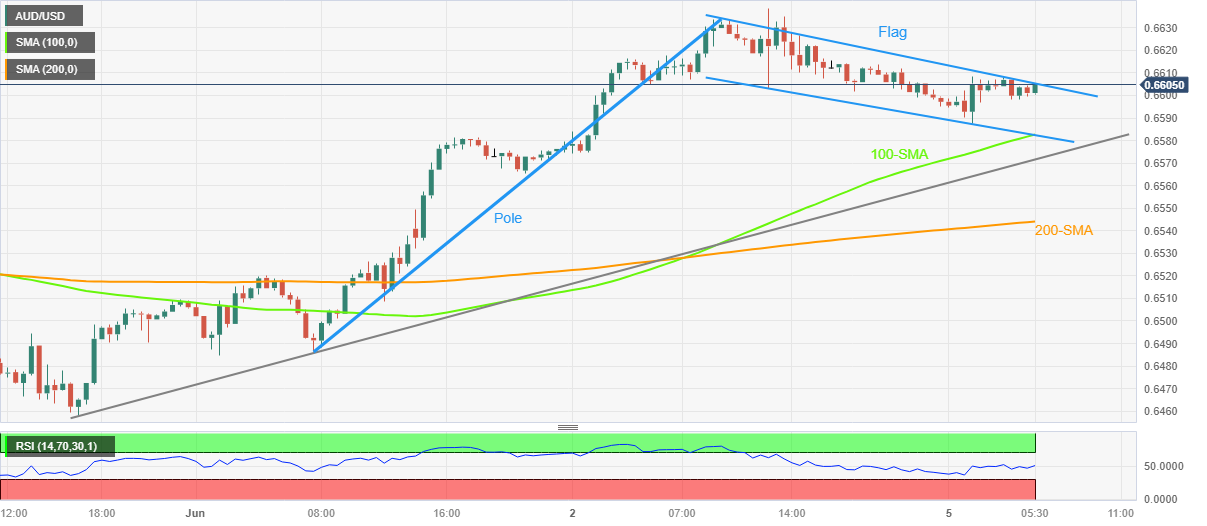
Trend: Further upside expected
CME Group’s flash data for natural gas futures markets noted traders scaled back their open interest positions by around 2.6K contracts on Friday, reversing at the same time four consecutive daily builds. In the same direction, volume kept the choppiness well and sound and shrank by around 161.8K contracts following the previous daily advance.
Natural Gas remains supported around $2.00
Prices of natural gas charted an inconclusive session on Friday amidst shrinking open interest and volume. That said, price action around the commodity remains unclear and supportive of further range bound for the time being. Support, in the meantime, appears around the $2.00 mark per MMBtu.
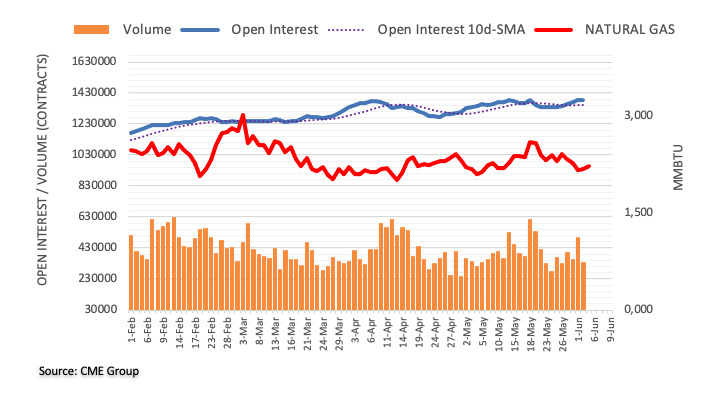
Considering advanced prints from CME Group for crude oil futures markets, open interest rose for the fourth session in a row on Friday, this time by around 5.3K contracts. On the other hand, volume dropped by around 90.4K contracts, adding to the previous daily decline.
WTI: Next on the upside comes $80.00
Prices of the WTI extended the optimism seen in the second half of last week amidst rising open interest on Friday. Against that, the continuation of the uptrend appears likely for the time being with the immediate target at the key $80.00 mark per barrel, which appears underpinned by the 200-day SMA around $79.30.

- USD/IDR has slipped below 14.87 after a wild move to near 14.90 after softening of Indonesian inflation.
- Indonesian headline and core CPI softened to 4.0% and 2.66% respectively.
- Upbeat US Employment data has made the battle against stubborn inflation extremely complicated.
The USD/IDR pair traded volatile after softening of Indonesian inflation in the Asian session. The asset displayed a wild gyration in an attempt to capture the critical resistance of 15.00 but dropped back to the square near 14.87.
Statistics Indonesia reported headline inflation at 4.0% vs. the estimates of 4.23% and the former release of 4.33%. The monthly headline Consumer Price Index (CPI) figure accelerated by 0.009% at a slower pace in comparison to the street’s estimates of 0.3% and the prior release of 0.33%. Core inflation that strips off the impact of oil and food prices decelerated to 2.66% against the consensus of 2.8% and the former release of 2.83%.
S&P500 futures are carrying nominal losses in the early European session, indicating a minor caution in the overall upbeat market mood. US equities are expected to capture annual highs amid optimism fueled by the clearance of the US debt-ceiling bill in Congress, which has faded fears of a default by the US economy.
Meanwhile, the US Dollar Index (DXY) is displaying a back-and-forth action below 140.20. More upside in the USD Index seems favored as the Federal Reserve (Fed) is expected to raise interest rates further to scale down fears of a rebound in the United States inflation. US Employment data released on Friday has made the battle against stubborn inflation extremely complicated as firms have continued their recruitment process despite higher interest rates by the Fed and tight credit conditions by US regional banks. However, the Unemployment Rate rose to 3.7%.
On Monday, US ISM Services PMI (May) will be keenly watched. The economic data is seen declining to 51.5 vs. the prior release of 51.9. New Orders Index that displays forward demand is seen advancing to 56.5 against the former release of 56.1.
FX option expiries for June 5 NY cut at 10:00 Eastern Time, via DTCC, can be found below.
- EUR/USD: EUR amounts
- 1.0675 951m
- 1.0690 649m
- 1.0700 359m
- 1.0820 959m
- GBP/USD: GBP amounts
- 1.2375 300m
- 1.2500 303m
- 1.2585 319m
- USD/JPY: USD amounts
- 138.20 1.6b
- 139.00 552m
- 139.60 501m
- 141.00 476m
- AUD/USD: AUD amounts
- 0.6625 547m
- USD/CAD: USD amounts
- 1.3430 995m
- 1.3700 578m
Open interest in gold futures markets extended the decline in place since May 16 and shrank by around 7.2K contracts on Friday according to preliminary readings from CME Group. Volume, instead, reversed two consecutive daily pullbacks and went up by more than 33K contracts.
Gold: Decent support emerges around $1930
Friday’s marked decline in gold prices was on the back of shrinking open interest, leaving the door open to some near-term rebound. In the meantime, the yellow metal is expected to meet firm contention around the $1930 level per ounce troy.
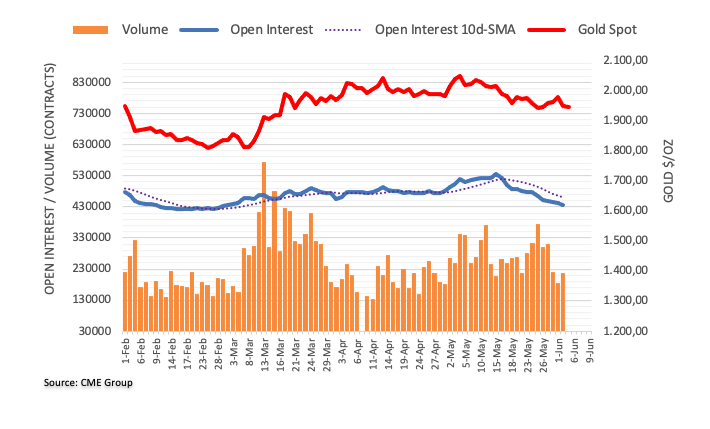
- EUR/USD fades bounce off intraday low amid two-day losing streak.
- US NFP, IMF’s Georgieva underpin hawkish concerns for Fed.
- EU statistics fail to back hawkish claims of ECB policymakers.
- US ISM Services PMI, Factory Orders may entertain Euro bears amid Fed blackout.
EUR/USD retreats to 1.0695 as it drops for the second consecutive day heading into Monday’s European session, sticking to minor losses of late. In doing so, the Euro pair takes clues from the market’s hawkish bias surrounding the Federal Reserve (Fed), especially after Friday’s strong US Nonfarm Payrolls (NFP).
During the weekend, International Monetary Fund (IMF) Managing Director Kristalina Georgieva suggested that the Fed needs to do more to tame inflation. “We don’t yet see a significant slowdown in lending. There is some, but not on the scale that would lead to the Fed stepping back,” the IMF’s Managing Director Kristalina Georgieva told CNBC’s Karen Tso Saturday in Dubrovnik, Croatia.
It’s worth noting that the US NFP rose to the four-month high on Friday while bolstering the hawkish Fed bets, which in turn propels the US Dollar Index (DXY) of late.
Also adding strength to the DXY is the avoidance of the debt-ceiling expiration as the US policymakers managed to extend the limit until 2024. Furthermore, fears of the fresh US-China tension over Taiwan and the Russia-Ukraine rhetoric also weigh on the sentiment and allow the EUR/USD bears to remain hopeful.
Elsewhere, the growth and inflation numbers from Eurozone have been downbeat at the latest, which in turn favors the Fed hawks and exerts downside pressure on the EUR/USD price.
Looking forward, EUR/USD price remains pressured towards the previous monthly low marked on Thursday around 1.635 as traders await the US ISM Services PMI and Factory Orders for May. Should the scheduled data defy downbeat expectations and print strong outcomes, the Euro bears will have an additional reason to cheer.
Technical analysis
A convergence of the 200-day EMA and an upward-sloping trend line from late November 2022, around 1.0690-85, challenges the EUR/USD bears.
Lee Sue Ann, Economist at UOB Group, comments on the upcoming interest rate decision by the RBA.
Key Quotes
Latest wages and employment data reinforce our view of the RBA holding its cash rate at 3.85% in Jun.
There, is however, some risk to our view, and that the RBA may raise the cash rate one more time this year, given that inflation remains well above target in the near term; and that the economy is still moderately resilient.
- USD/CAD picks up bids to refresh intraday high, prints the first daily gains in four.
- Bearish MACD signals, “double top” formation keeps Loonie pair sellers hopeful.
- Multiple hurdles to challenge buyers, 1.3800 is the key upside hurdle.
USD/CAD recovers from the key Exponential Moving Average (EMA) while snapping a three-day downtrend near 1.3440 heading into Monday’s European session. In doing so, the Loonie pair renews its intraday high while bouncing off the lowest levels in three weeks.
It’s worth noting that the quote’s recovery fails to justify bearish MACD signals and hence suggests limited upside room.
Even so, the USD/CAD pair’s rebound from the 200-EMA, around 1.3420 by the press time, allows the Loonie bears to aim for the 1.3500 threshold.
Following that, the 50% Fibonacci retracement level of the pair’s October-November 2022 downside, near 1.3600, can’t be ruled out.
However, a “double top” bearish chart pattern, with highs surrounding 1.3650-65, appears a tough nut to crack for the USD/CAD bulls.
Even if the Loonie pair defies the bearish formation by crossing the 1.3665 hurdle, a downward-sloping resistance line from late October 2022, close to 1.3800 by the press time, can challenge the pair buyers before giving them control.
Alternatively, a daily closing below the 200-EMA level of around 1.3420 could quickly drag the USD/CAD price towards a four-month-old upward-sloping support line, near 1.3330, a break of which will refresh the yearly low, currently around 1.3260.
USD/CAD: Daily chart
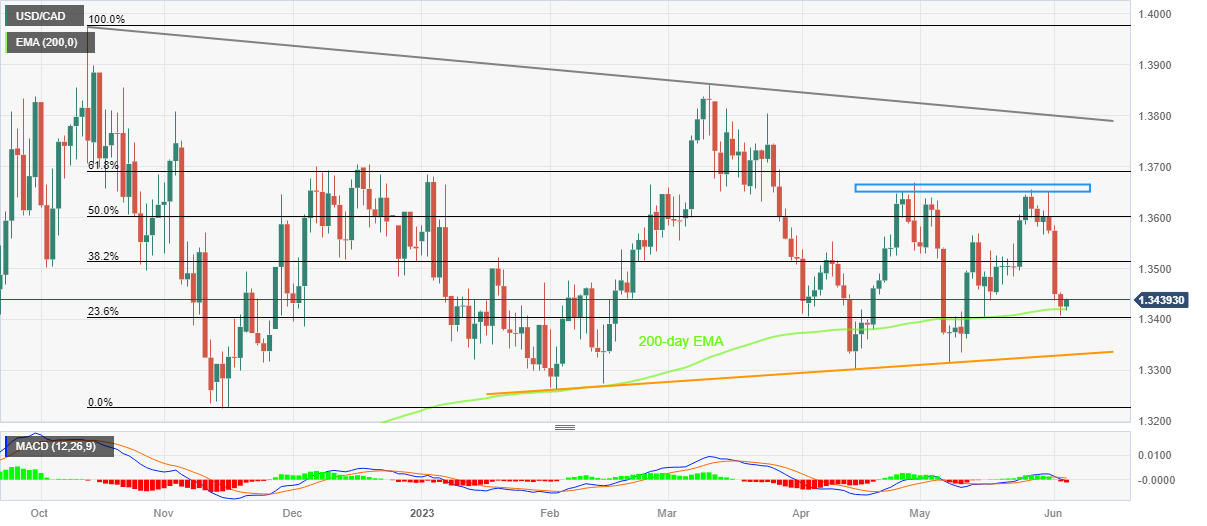
Trend: Limited recovery expected
- USD/JPY has comfortably established above 140.00 inspired by upbeat US Employment data.
- Friday’s upbeat US NFP data have accelerated the odds of more interest rate hikes by the Fed.
- USD/JPY has climbed back above the 50% Fibonacci retracement at 139.66.
The USD/JPY pair has shifted its auction comfortably above the crucial resistance of 140.00 in the Asian session. The major is expected to extend its gains firmly as Friday’s upbeat United States Nonfarm Payrolls (NFP) data have accelerated the odds of more interest rate hike announcements by the Federal Reserve (Fed).
S&P500 futures are showing some losses in the Asian session but settled the previous week on a solid note, portraying a minor caution in the overall risk-appetite mood. The US Dollar Index (DXY) is confidently balancing above 104.00 and is expected to extend its upside journey after scrolling above the immediate resistance of 104.20.
On the Japanese Yen front, investors are anticipating that the Bank of Japan (BoJ) could tweak its Yield Curve Control (YCC) to keep monetary policy expansionary.
USD/JPY has climbed back above the 50% Fibonacci retracement (plotted from 21 October 2022 high at 151.94 to 16 January 2023 low at 127.22) at 139.66. The asset has rebounded after finding support near the 20-period (High-Low) Exponential Moving Average (EMA) band.
The Relative Strength Index (RSI) (14) is oscillating in the bullish range of 60.00-80.00, indicating more upside ahead.
Going forward, a break above May 31 high at 140.42 will drive the asset toward May 30 high at 140.93. A break above the latter will expose the asset to a fresh six-month high of around 141.61, which is 23 November 2022 high.
On the flip side, a downside move below March 08 high at 137.92 will drag the asset toward March 02 high at 137.10 followed by a 38.2% Fibo retracement at 136.81.
USD/JPY daily chart
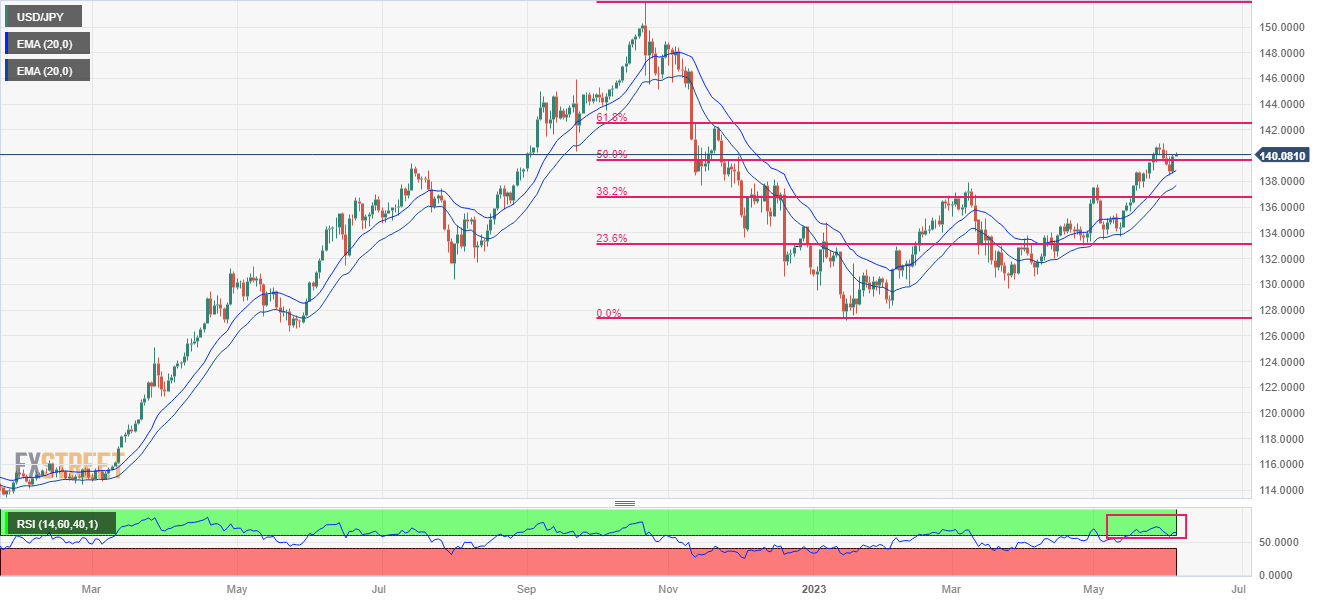
- USD/INR stays on the front foot after reversing from 13-day low on Friday.
- Strong US NFP renews hawkish Fed concerns while softer India data allows RBI to defend status quo.
- Risk-off mood, higher Oil price also weigh on Indian Rupee ahead of the key week.
- Second-tier US data, risk catalysts may entertain intraday traders.
USD/INR extends recovery from 50-day EMA to around 82.50 heading into Monday’s European session. In doing so, the Indian Rupee (INR) pair cheers the US Dollar strength, as well as downbeat sentiment and the firmer Crude Oil price to propel the pair of late.
Adding strength to the USD/INR recovery could be the consolidation ahead of this week’s Reserve Bank of India (RBI) Monetary Policy Meeting, up for Thursday.
Above all, a monetary policy divergence between the Fed and the RBI, mainly due to the latest streams of the US and India data, allow the USD/INR pair to remain firmer. Adding strength to the USD/INR pair could be the latest strength of the WTI Crude Oil and the risk-off mood, led by the fears of the US-China tussle and the Russia-Ukraine war.
That said, Friday’s US NFP bolstered calls for the Fed’s 0.25% rate hike in June, as well as slashed the odds favoring the Fed rate cut in 2023. The same allowed the US Dollar Index (DXY) to remain firmer and favor the corrective bounce in the US Treasury bond yields.
On the other hand, the market’s sour sentiment due to the geopolitical concerns about China, Russia, Ukraine and the US join the concerns about the RBI’s likely monetary policy inaction, mainly due to the Indian economics suggesting easy inflation and softer growth, to propel the USD/INR price.
Against this backdrop, the US 10-year and two-year Treasury bond yields recover after snapping a three-week uptrend by the end of the last Friday. That said, the S&P500 Futures also portray the risk-off mood by mild losses as it retreats from the highest levels since August 2022. The same underpins the US Dollar Index (DXY) strength ahead of the US Factory Orders and ISM Services PMI for May.
Moving on, US Factory Orders and ISM Services PMI for May will entertain intraday traders whereas Thursday’s RBI Interest Rate Decision becomes the key event for the USD/INR pair watchers.
Technical analysis
A clear rebound from the 50-day Exponential Moving Average (EMA), around 82.30 by the press time, allows USD/INR bulls to aim for a one-week-old descending resistance line of near 82.65.
- Silver price remains pressured for the second consecutive day within bearish triangle.
- Failure to cross 200-EMA, bearish MACD signals favor XAG/USD sellers.
- Bulls need validation from $24.25 to retake control.
Silver Price (XAG/USD) stays depressed around the intraday low of $23.50 heading into Monday’s European session. In doing so, the bright metal prods the bottom line of a two-week-old ascending triangle while extending the previous day’s pullback from the 200-bar Exponential Moving Average (EMA).
Apart from the failure to cross the key EMA and the existence of the bearish chart pattern, the downbeat MACD signals also lure the XAG/USD sellers.
However, a clear break of $23.50 becomes necessary to confirm the bearish chart formation suggesting a theoretical fall toward $22.20.
That said, the previous monthly low of around $22.70 may act as an extra filter towards the theoretical target whereas the 61.8% Fibonacci Expansion (FE) of its May 10 to June 02 moves, near $22.00, can prod the Silver bears afterward.
On the flip side, a recovery moves not only needs validation from the 200-EMA hurdle of around $23.95 but also needs to defy the triangle formation by crossing the stated pattern’s top line, close to $24.00 by the press time.
Even so, a one-month-old horizontal resistance area around $24.25 can challenge the XAG/USD bulls before giving them control.
Silver Price: Four-hour chart
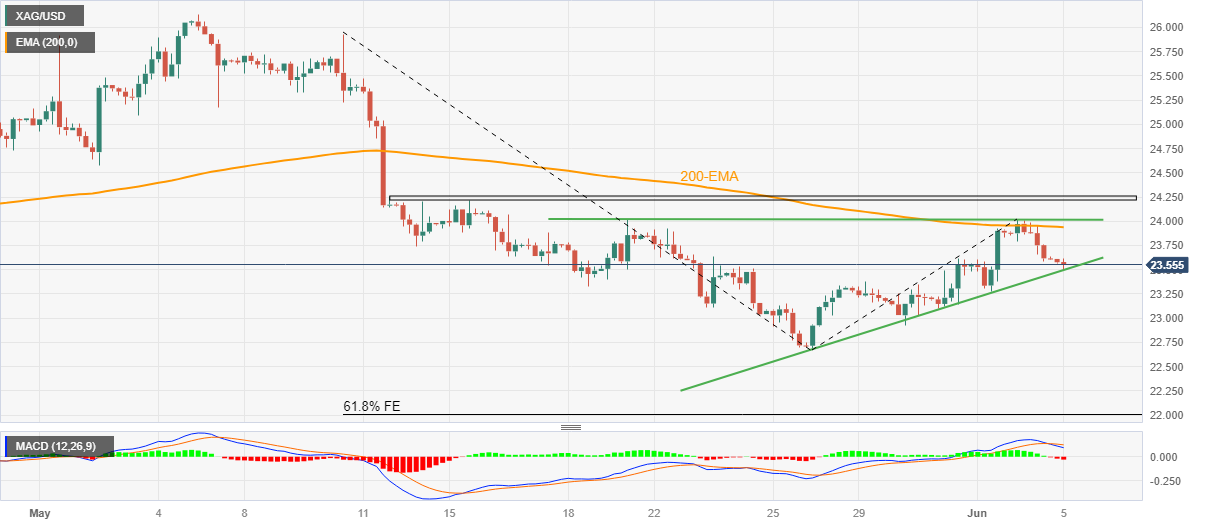
Trend: Further downside expected
- GBP/USD extends the previous day’s reversal from three-week high, holds lower ground near intraday bottom.
- BoE hawks retreat amid lack of UK data, US Dollar cheers escalating Fed rate hike concerns on upbeat US NFP.
- Light calendar in Asia, mixed sentiment fail to inspire Pound Sterling traders.
- Final readings of UK S&P Global PMIs, US ISM Services PMI for May eyed for intraday moves of Cable.
GBP/USD remains pressured toward 1.2400 while extending the previous day’s U-turn from a three-week high heading into Monday’s London open, mildly offered near intraday low of 1.2426 by the press time. In doing so, the Cable pair justifies the market’s dicey momentum amid a lack of major data/events, as well as Fed policymakers’ blackout period ahead of next week’s Federal Open Market Committee (FOMC).
That said, the Cable pair marked the first weekly gain in four despite retreating from a short-term key horizontal resistance area on Friday. In doing so, the Pound Sterling justifies hawkish concerns about the Bank of England (BoE) despite recently justifying an increase in the odds of the Federal Reserve (Fed) rate hike concerns, backed by the upbeat US employment data. It’s worth noting that the political jitters in the UK also prod the GBP/USD buyers, especially when the US diplomats have successfully avoided the debt payment default woes.
During the last week, upbeat signals from the UK inflation underpinned the hawkish BoE concerns ahead of Friday’s US NFP that bolstered calls for the Fed’s 0.25% rate hike in June, as well as slashed the odds favoring the Fed rate cut in 2023. That said, the US jobs report for May surprised markets with a jump in the headline Nonfarm Payrolls (NFP) by 339K versus 190K expected and 294K prior (revised). It’s worth noting, however, that the Unemployment Rate also rose to 3.7% from 3.4% prior, versus 3.5% market forecasts. It should be noted, that the Average Hourly Earnings eased whereas the Labor Force Participation Rate remain the same as previous.
Apart from that, May’s local elections in the UK have raised doubts on UK PM Rishi Sunak’s future as the Labor Party braces for a major victory and recently gained a strong economic supporter. Elsewhere, the market’s sour sentiment due to the the geopolitical concerns about China, Russia, Ukraine and the US seem to also propel the US Dollar and weigh on the GBP/USD prices.
Amid these plays, the US 10-year and two-year Treasury bond yields recover after snapping a three-week uptrend by the end of the last Friday. That said, the S&P500 Futures also portray the risk-off mood by mild losses as it retreats from the highest levels since August 2022. The same underpins the US Dollar Index (DXY) strength ahead of the US Factory Orders and ISM Services PMI for May.
Ahead of the US data, final readings of the UK’s S&P Global/CIPS Services and Composite PMIs for May will also entertain the GBP/USD pair traders.
Technical analysis
GBP/USD drops below the 50-DMA support while extending the previous day’s U-turn from a horizontal resistance area comprising multiple levels marked since mid-April.
- USD/CHF grinds higher after bouncing off 0.9040 support confluence, mildly bid of late.
- 50-EMA, one-month-old rising trend line prods bears amid upbeat oscillators.
- Bulls have a tough road to travel amid presence of multiple EMAs, horizontal resistance.
USD/CHF picks up bids to 0.9105 as it clings to mild gains around 0.9100 during early Monday morning in Europe. In doing so, the Swiss Franc (CHF) pair rises for the second consecutive day while defending the previous day’s rebound from the 0.9040 support confluence.
That said, a convergence of the 50-day Exponential Moving Average (EMA) and an upward-sloping trend line from early May, facilitates the USD/CHF pair’s recovery amid bullish MACD signals and a firmer RSI (14) line, not overbought.
With this, the USD/CHF is likely to conquer the 10-week-old horizontal resistance area, as well as the 100-EMA, respectively around 0.9120 and 0.9130.
However, the RSI line is near the overbought territory and may prod the upside limit in case of the Swiss Franc (CHF) pair’s further upside, which in turn can challenge the USD/CHF bulls afterward.
In a case where the USD/CHF buyers remain hopeful past 0.9130, the late March swing high of around 0.9225 and the 200-EMA level of 0.9260 will challenge the pair buyers.
On the flip side, a daily closing below the aforementioned support confluence near 0.9040 can quickly fetch the USD/CHF price towards the 0.9000 round figure.
It’s worth noting, however, that the USD/CHF pair’s weakness past 0.9000 will make it vulnerable to revisiting the yearly low marked in May around 0.88220.
USD/CHF: Daily chart
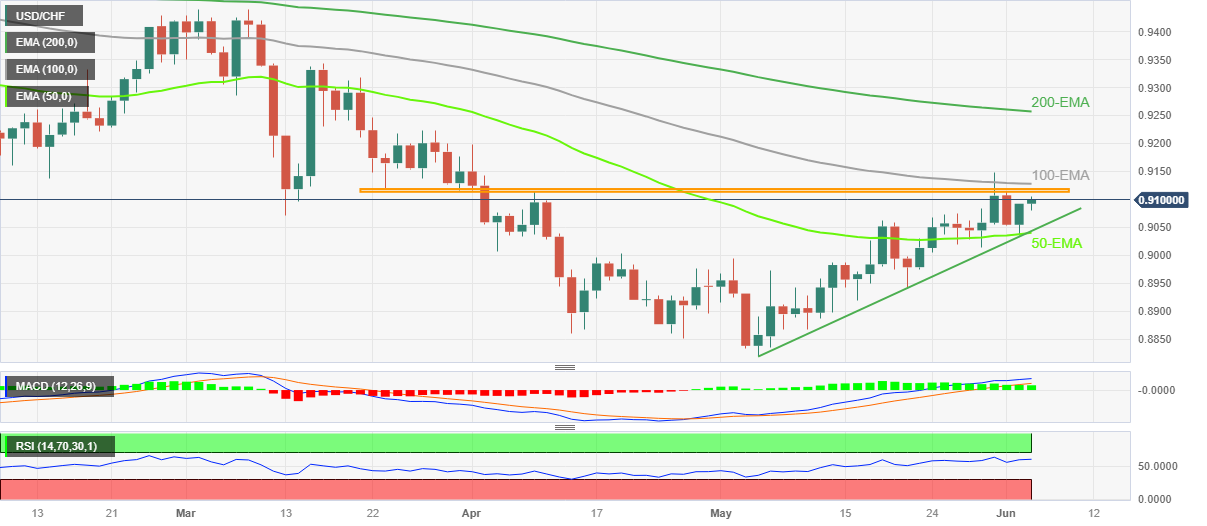
Trend: Limited upside expected
- USD/CAD stays defensive at the lowest levels in three weeks.
- Oil price pares intraday gains but stays firmer amid OPEC+ headlines, geopolitical woes.
- US Dollar cheers upbeat US NFP-led hawkish Fed concerns ahead of US data.
- BoC, Canada employment report will be the key for Loonie pair amid pre-FOMC blackout.
USD/CAD aptly portrays the Loonie traders’ anxiety above 1.3400, up 0.05% intraday near 1.3435 at the latest, as the key week comprising the Bank of Canada (BoC) Monetary Policy Decision and Canadian employment data begins with unimpressive moves. In addition to the pre-data/event caution, firmer prices of Canada’s main export item Crude Oil and the upbeat US Dollar also challenge the pair’s latest moves.
That said, WTI crude oil prints a three-day uptrend near $72.50 despite recently paring intraday gains while reversing from a one-week high amid the firmer US Dollar. That said, the black gold began the week’s trading with a gap-up amid headlines suggesting further reductions in Oil output from major producers.
Also read: WTI crude oil surpasses $73 amid OPEC+ and geopolitical events, despite firm USD
On the other hand, the US Dollar Index (DXY) extends the post-NFP run-up to 104.15 as it cheers the market’s sour sentiment and firmer US Treasury bond yields ahead of the key US ISM Services PMI and Factory Orders. It’s worth noting, however, that the Fed policymakers are stipulated for any public comments ahead of next week’s Federal Open Market Committee (FOMC), which in turn prod the DXY bulls.
That said, the US jobs report for May surprised markets with a jump in the headline Nonfarm Payrolls (NFP) by 339K versus 190K expected and 294K prior (revised). It’s worth noting, however, that the Unemployment Rate also rose to 3.7% from 3.4% prior, versus 3.5% market forecasts. It should be noted, that the Average Hourly Earnings eased whereas the Labor Force Participation Rate remain the same as previous.
Apart from that, the market’s sour sentiment due to the hawkish Fed bets and the geopolitical concerns about China, Russia, Ukraine and the US seem to also propel the USD/CAD prices while the US debt-ceiling extension and hopes of lesser rate hikes from the major banks weigh on the Loonie pair. Furthermore, the global rating agencies remain cautious about the US financial market credibility and prod the US Dollar despite the price-positive move on Friday. “Fitch Ratings said on Friday the United States' "AAA" credit rating would remain on negative watch, despite the agreement that will allow the government to meet its obligations,” said Reuters.
Looking ahead, US Factory Orders and ISM Services PMI for May will entertain intraday traders of the USD/CAD pair. However, major attention will be given to Wednesday’s BoC and Friday’s Canadian jobs report. While the Canadian central bank is up for no change in rates, any surprises won’t be taken lightly after the recent firmer Canada data.
Technical analysis
Repeated failures to stay beyond the 200-DMA, around 1.3510 by the press time, directs USD/CAD bears towards breaking an upward-sloping support line from November 2022, close to 1.3330 at the latest.
| Raw materials | Closed | Change, % |
|---|---|---|
| Silver | 23.618 | -1.05 |
| Gold | 1948.28 | -1.46 |
| Palladium | 1418.64 | 1.94 |
- AUD/USD picks up bids to recover from intraday low on upbeat China data.
- China Caixin Services PMI for May matches upbeat market forecasts, Aussie inflation clues also came in firmer.
- Sluggish sentiment, pre-RBA anxiety and hawkish Fed bets keep Aussie bears hopeful.
- US Factory Orders, ISM Services PMI may direct intraday moves, RBA is the key.
AUD/USD pares intraday losses around 0.6600 after China’s private activity gauge flashes upbeat signals during early Monday. Adding strength to the Aussie pair’s corrective bounce could be the initial Asian session release suggesting higher inflation in Australia.
That said, China’s Caixin Services PMI matches 57.1 market forecasts for May versus 56.4 previous readings. Earlier in the day, Australia’s TD Securities Inflation rose 0.9% MoM in May versus 0.2%. It should be noted, however, that the downbeat prints of the TD Securities Inflation on a YoY basis join a reduction in the nation’s Company Gross Operating Profits for the first quarter (Q1) to prod the AUD/USD bulls.
On the other hand, hawkish Fed bets join the geopolitical fears to weigh on the AUD/USD price, especially amid fears of the Reserve Bank of Australia’s (RBA) policy pivot.
Hopes of the Fed’s 0.25% rate hike in June rallied while the market’s bets of a Fed rate cut in 2023 dropped after Friday’s Nonfarm Payrolls (NFP) surprised markets. That said, the US Nonfarm Payrolls (NFP) rose by 339K in May versus 190K expected and 294K prior (revised). It’s worth noting, however, that the Unemployment Rate also rose to 3.7% from 3.4% prior, versus 3.5% market forecasts. It should be noted, that the Average Hourly Earnings eased whereas the Labor Force Participation Rate remain the same as previous.
Elsewhere, the Shangri-la Dialogue in Singapore renewed geopolitical fears surrounding the US and China amid no meeting of the policymakers of both nations, as well as an incident suggesting escalating war fears among the Sino-American navies in the Taiwan Strait. Furthermore, news from Russian Defense Ministry suggesting large-scale military operations by Ukraine also weigh on the sentiment and put a floor under the US Dollar.
Against this backdrop, the US 10-year and two-year Treasury bond yields recover after snapping a three-week uptrend by the end of the last Friday. That said, the S&P500 Futures also portray the risk-off mood by mild losses as it retreats from the highest levels since August 2022. The same underpins the US Dollar Index (DXY) strength ahead of the US Factory Orders and ISM Services PMI for May.
Above all, recently dovish concerns about the RBA, especially after previously downbeat Aussie inflation readings and the Reserve Bank of New Zealand’s (RBNZ) actions, keeps the AUD/USD bears hopeful.
Technical analysis
AUD/USD recovery remains elusive below the 200-EMA hurdle surrounding 0.6630.
Also read: AUD/USD Price Analysis: Extends pullback from 200-EMA towards 0.6560 support confluence
- Gold Price renews intraday low to extend post-NFP losses.
- US Dollar cheers hawkish Fed bets, sour sentiment amid sluggish session.
- US Factory Orders, ISM Services PMI eyed for intraday directions.
Gold Price (XAU/USD) stays on the bear’s radar for the second consecutive day as the precious metal renews intraday low near $1,945, extending the post-NFP losses amid to early Monday amid firmer US Dollar and the Treasury bond yields.
That said, the US Dollar Index (DXY) prints mild gains around 104.12 as it keeps the previous day’s recovery from a one-week low amid Monday’s sluggish Asian session. In doing so, the greenback’s gauge versus the six major currencies cheers the market’s fears of higher Federal Reserve (Fed) rates and the US-China tension, not to forget the fresh war headlines surrounding Russia and Ukraine.
Apart from that, an increase in the odds supporting June’s 0.25% Fed rate hike and a reduction in the market’s bets of a Fed rate cut in 2023 also seem to favor the US Dollar and yields, which in turn exerts downside pressure on the Gold price amid a sluggish start to the week. It’s worth noting that Friday’s Nonfarm Payrolls (NFP) surprised markets with a strong outcome and renewed hawkish concerns about the US central bank. That said, the US-China tension about Taiwan joins the headlines suggesting a heavy battle between Russia and Ukraine also weighs on the sentiment and allows the DXY to remain firmer, which in turn favors the Gold sellers.
Alternatively, recently firmer China PMIs and doubts about the Fed’s capacity to keep the rates higher for longer challenge the Gold bears.
Amid these plays, the US 10-year and two-year Treasury bond yields recover after snapping a three-week uptrend by the end of the last Friday. That said, the S&P500 Futures also portray the risk-off mood by mild losses as it retreats from the highest levels since August 2022.
To sum up, sour sentiment joins hawkish Fed bets to weigh on the Gold price but a lack of major data/events and upbeat catalysts from China put a floor under the quote ahead of the US Factory Orders and ISM Services PMI for May.
Gold Price Technical analysis
Gold price justifies the downside break of a short-term bullish channel, as well as the 200-SMA, as it approaches the yearly low marked in May at around $1,932. Adding strength to the downside bias are the bearish MACD signals.
It’s worth noting, however, that the RSI (14) line is in the oversold territory, which in turn suggests limited downside room for the XAU/USD past $1,932.
The same highlights the 61.8% Fibonacci Expansion (FE) of the Gold Price moves between May 10 to June 01, around $1910, as the key support to watch afterward.
Meanwhile, the Gold price recovery may initially aim for the 200-SMA hurdle of around $1,960 before challenging the bottom line of an ascending trend channel stretched from the last Tuesday, close to $1,970 at the latest.
Gold price: Hourly chart
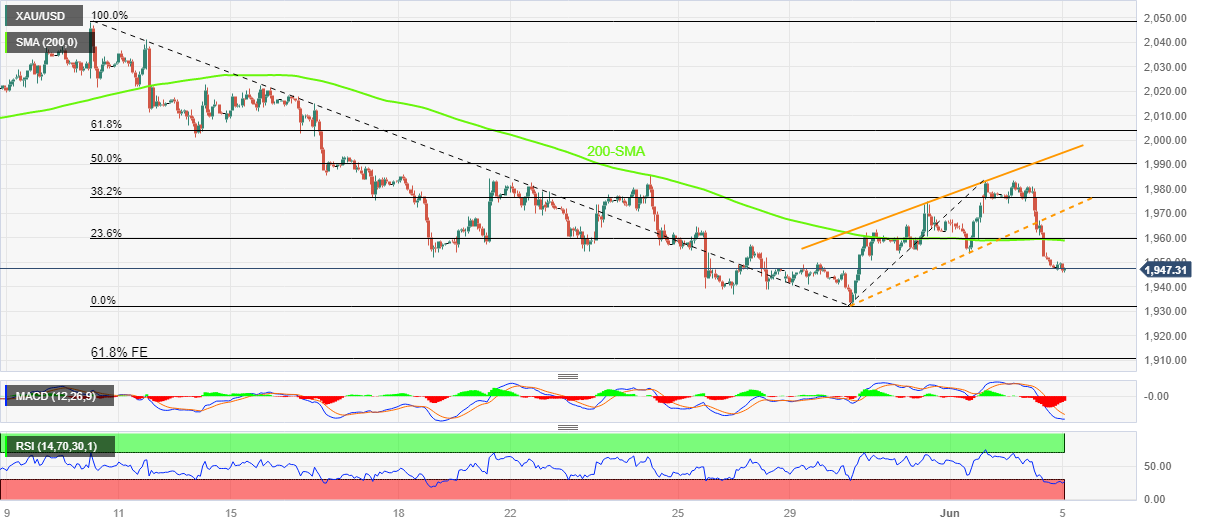
Trend: Limited downside expected
China's Services Purchasing Managers' Index (PMI) rose to 57.1 in May as against the 56.4 reading booked in April, the latest data published by Caixin showed on Monday. The market consensus for a reading of 57.1.
Key points
Business activity expands for fifth month running.
Robust and accelerated upturn in new orders.
Output charge inflation reaches 15-month high.
Commenting on the China General Services PMI ™ data, Dr. Wang Zhe, Senior Economist at Caixin Insight Group said: “Both services supply and demand expanded further in May. The gauges for business activity and total new orders both stood above 50 for the fifth consecutive month and logged their second-highest readings since November 2020.”
“External demand also maintained strong momentum, with the measure for new export orders staying in expansionary territory for five months in a row. Services activity continued to rebound after China scrapped its “zero-Covid” policy in December,” Wang added.
AUD/USD reaction
The in-line with expectations Chinese Services PMI bodes well for the Aussie Dollar, lifting AUD/USD back above 0.6600. The major is trading at 0.6604, at the time of writing, still down 0.21% on the day.
- EUR/USD stays defensive as sellers flirt with 200-EMA, seven-month-old support line.
- Looming bull cross on MACD, below-50.00 RSI conditions prod Euro bears.
- Euro buyers need validation from 100-EMA to retake control.
EUR/USD remains pressured around the intraday low, making rounds to 1.0700 of late, as a short-term key support confluence challenges the Euro sellers amid Monday’s sluggish Asian session.
It’s worth noting that the broad US Dollar and downbeat concerns about the Eurozone keep the EUR/USD bears hopeful as traders await the US ISM Services PMI and Factory Orders.
Also read: EUR/USD stays depressed near 1.0700 ahead of US Factory Orders, ISM Services PMI
That said, the quote’s clear U-turn from the 100-day Exponential Moving Average (EMA), currently around 1.0770, allows the EUR/USD bears to prod a convergence of the 200-day EMA and an upward-sloping trend line from late November 2022.
It’s worth noting, however, that the receding bearish bias of the MACD and the nearly oversold RSI line, placed at 14, challenge the EUR/USD bears as they jostle with the key support near 1.0690-85.
Even if the quote drops below the 1.0690-85 support confluence, the 50% Fibonacci retracement of its November-April upside and a five-month-old rising support line, respectively near 1.0660 and 1.0635, can challenge the EUR/USD pair’s further downside.
Meanwhile, EUR/USD recovery needs to provide a daily closing beyond the 100-day EMA, around 1.0770 by the press time, to convince the buyers.
Even so, the lows marked during early April and May around 1.0840-50 can act as the last defense of the EUR/USD bears.
EUR/USD: Daily chart
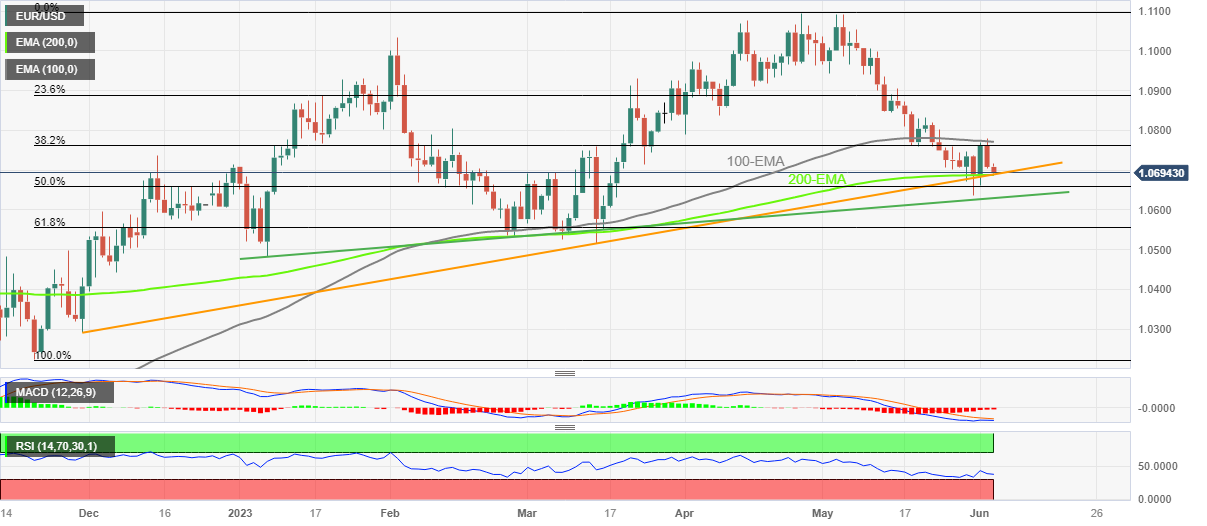
Trend: Limited downside expected
People’s Bank of China (PBOC) set the USD/CNY central rate at 7.0904 on Monday, versus previous fix of 7.0939 and market expectations of 7.0918. It's worth noting that the USD/CNY closed near 7.0960 the previous day.
"With 25 billion Yuan worth of reverse repos maturing on Monday, China central bank drains 23 billion Yuan on a net basis on the day," said Reuters following the PBOC Fix announcements.
About PBOC fix
China maintains strict control of the yuan’s rate on the mainland.
The onshore yuan (CNY) differs from the offshore one (CNH) in trading restrictions, this last one is not as tightly controlled.
Each morning, the People’s Bank of China (PBOC) sets a so-called daily midpoint fix, based on the yuan’s previous day's closing level and quotations taken from the inter-bank dealer.
- USD/JPY renews intraday high amid cautious mood, firmer yields.
- Downbeat Japan PMI versus strong US NFP adds strength to Yen pair’s run-up.
- US ISM Services PMI, Japan’s final Q1 GDP eyed for clear directions amid Fed blackout.
USD/JPY clings to mild gains around 140.20 as it cheers upbeat Treasury bond yields, as well as the firmer US Dollar to propel the USD/JPY prices. Adding strength to the Yen pair’s upside is the risk-aversion wave, as well as downbeat Japan data.
That said, Japan’s Jibun Bank Services PMI for May dropped to 55.9 versus 56.3. On the contrary, “The composite PMI, which combines the manufacturing and services activity figures, expanded at the fastest pace since October 2013. The index advanced to 54.3 in May from 52.9 in April, staying above the break-even 50 mark for the fifth straight month,” said Reuters.
On the other hand, hawkish Fed bets and receding fears of the US default underpin the US Treasury bond yields and the US Dollar. That said, Friday’s US employment numbers renew the odds of the Federal Reserve’s (Fed) rate hikes.
Talking about the data, the US Nonfarm Payrolls (NFP) renewed hawkish Fed concerns. That said, the US jobs report for May surprised markets with a jump in the headline Nonfarm Payrolls (NFP) by 339K versus 190K expected and 294K prior (revised). It’s worth noting, however, that the Unemployment Rate also rose to 3.7% from 3.4% prior, versus 3.5% market forecasts. It should be noted, that the Average Hourly Earnings eased whereas the Labor Force Participation Rate remain the same as previous.
Apart from that, the Shangri-la Dialogue in Singapore renewed geopolitical fears surrounding the US and China amid no meeting of the policymakers of both nations, as well as an incident suggesting escalating war fears among the Sino-American navies in the Taiwan Strait. Furthermore, news from Russian Defense Ministry suggesting large-scale military operations by Ukraine also weigh on the sentiment and put a floor under the US Dollar.
It’s worth noting, however, that the hawkish concerns about the Bank of Japan (BoJ) officials and optimism about the US debt ceiling deal, as well as US credit rating, prod the USD/JPY bulls. That said, US President Joe Biden signed the debt-ceiling bill and avoided the ‘catastrophic’ default. Also negative for the DXY were concerns suggesting slower rate hikes from the major central banks. Furthermore, the global rating agencies remain cautious about the US financial market credibility and prod the US Dollar despite the price-positive move on Friday. “Fitch Ratings said on Friday the United States' "AAA" credit rating would remain on negative watch, despite the agreement that will allow the government to meet its obligations,” said Reuters.
Against this backdrop, Wall Street closed higher and the US Treasury bond yields marked the first weekly loss in four, grinding higher of late. It’s worth observing that the S&P500 Futures print mild losses amid mixed sentiment.
Moving on, today’s US Services PMI and Factory Orders for May can entertain intraday traders ahead of Friday’s final readings of Japan’s first quarter (Q1) 2023 Gross Domestic Product (GDP). Above all, risk catalysts and the bond market moves are critical for the Yen pair traders.
Technical analysis
Although the USD/JPY bears remain off the table beyond the previous resistance line stretched from December 15, 2022, around 137.40 by the press time, an ascending trend line from late 2022, close to 141.20 by the press time, challenges the Yen pair’s short-term upside.
- AUD/USD holds lower grounds around intraday low while snapping two-day uptrend.
- RSI (14) line’s retreat from overbought territory joins U-turn from 200-EMA to lure Aussie sellers.
- Convergence of 50-EMA, one-week-old horizontal support zone challenges intraday sellers.
AUD/USD licks its wounds around the intraday low of 0.6595 while printing the first daily loss in three amid Monday’s mid-Asian session. In doing so, the Aussie pair keeps the previous day’s retreat from the 200-bar Exponential Moving Average (EMA).
Adding strength to the downside bias is the RSI (14) line’s U-turn from the overbought territory, as well as the receding bullish bias of the MACD indicator.
However, a convergence of the 50-EMA and multiple levels marked since May 24, around 0.6565-60, appears a tough nut to crack for the AUD/USD bears.
In a case where the Aussie pair drops below 0.6560, a quick drop towards another key horizontal support zone surrounding 0.6490, comprising levels marked in the last week, can’t be ruled out.
It’s worth observing though that the AUD/USD pair’s weakness past 0.6490 needs validation from the previous monthly low of around 0.6460 to keep the bears on board.
On the contrary, AUD/USD recovery remains elusive below the 200-EMA hurdle surrounding 0.6630.
Also acting as upside filters are 50% and 61.8% Fibonacci retracements of the pair’s May 10-31 downside, respectively near 0.6640 and 0.6680.
Overall, AUD/USD remains on the back foot but the downside room appears limited.
AUD/USD: Four-hour chart
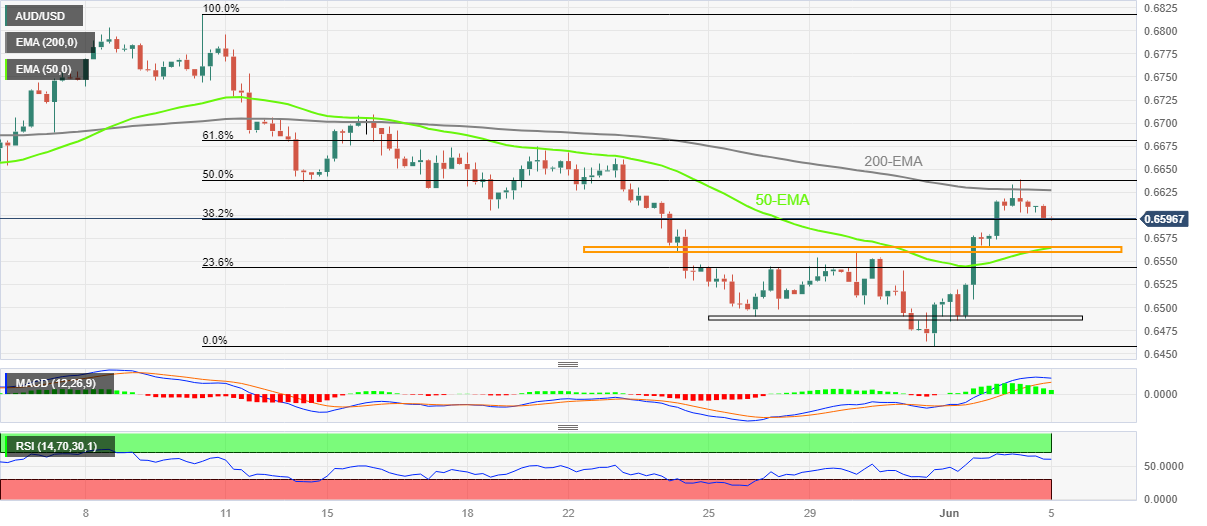
Trend: Limited downside expected
| Index | Change, points | Closed | Change, % |
|---|---|---|---|
| NIKKEI 225 | 376.21 | 31524.22 | 1.21 |
| Hang Seng | 733.03 | 18949.94 | 4.02 |
| KOSPI | 32.19 | 2601.36 | 1.25 |
| ASX 200 | 34.3 | 7145.1 | 0.48 |
| DAX | 197.57 | 16051.23 | 1.25 |
| CAC 40 | 133.26 | 7270.69 | 1.87 |
| Dow Jones | 701.19 | 33762.76 | 2.12 |
| S&P 500 | 61.35 | 4282.37 | 1.45 |
| NASDAQ Composite | 139.79 | 13240.77 | 1.07 |
- WTI crude oil grinds higher after week-start gap towards the north, prints three-day uptrend.
- OPEC+ extends production cut deal into 2024, Saudi Arabia pledges for more output reduction.
- US-China fears escalate amid no talks in Shangri-la Dialogue, Navy presence in Taiwan Strait.
- Firmer US Dollar, challenges to risk prods Oil buyers ahead of key US, China PMIs.
WTI crude oil pares intraday gains around $73.20, after the week started with a gap towards the north, as headlines suggesting challenges to the Oil output contrast with the US Dollar’s run-up. Also likely to weigh on the black gold could be the cautious mood ahead of the key China and US data, as well as the risk risk-off mood.
The Organization of the Petroleum Exporting Countries and allies led by Russia, collectively known as OPEC+, agreed on a new output target of 40.46 million barrels per day (mb/d) from 2024 during its June 4 Ministerial meeting.
Not only that, Saudi Arabia’s readiness for more output cuts also allowed the black gold to begin the week on a front foot. In this regard, Saudi Arabia’s Energy Minister, Prince Abdulaziz bin Salman, said on Sunday, “Saudi Arabia to make extra 1 mln b/d output cut from July,” reported Reuters.
On a different page, escalating geopolitical concerns emanating from the Shangri-la Dialogue held in Singapore and the Russia-Ukraine war also allow the WTI crude oil buyers to remain hopeful. The Shangri-la Dialogue in Singapore renewed geopolitical fears surrounding the US and China amid no meeting of the policymakers of both nations, as well as an incident suggesting escalating war fears among the Sino-American navies in the Taiwan Strait. Furthermore, news from Russian Defense Ministry suggesting large-scale military operations by Ukraine added to the Russia-Ukraine war fears and allow the Oil buyers to remain hopeful.
However, the risk-off mood joins the recently firmer US Nonfarm Payrolls (NFP) to underpin the US Dollar strength and prod the WTI bulls of late.
That said, the US Dollar Index (DXY) renews its intraday high around 104.20 while extending the previous day’s recovery from a one-week low. It should be noted that the corrective bounce in the US Treasury bond yields contrasts with the mildly offered S&P500 Futures to also challenge the Oil buyers.
Looking forward, the energy benchmark may witness further consolidation of the gains if today’s China Caixin Services PMI and US ISM Services PMI for May print downbeat figures and challenge the energy demand outlook, especially amid the firmer US Dollar.
Technical analysis
Unless providing a daily close beyond the 50-day Exponential Moving Average (EMA), around $73.60 at the latest, the WTI crude oil’s recovery remains doubtful.
| Pare | Closed | Change, % |
|---|---|---|
| AUDUSD | 0.66053 | 0.51 |
| EURJPY | 149.85 | 0.32 |
| EURUSD | 1.07062 | -0.51 |
| GBPJPY | 174.252 | 0.27 |
| GBPUSD | 1.24496 | -0.56 |
| NZDUSD | 0.60575 | -0.21 |
| USDCAD | 1.34296 | -0.13 |
| USDCHF | 0.90892 | 0.36 |
| USDJPY | 139.969 | 0.84 |


© 2000-2026. Bản quyền Teletrade.
Trang web này được quản lý bởi Teletrade D.J. LLC 2351 LLC 2022 (Euro House, Richmond Hill Road, Kingstown, VC0100, St. Vincent and the Grenadines).
Thông tin trên trang web không phải là cơ sở để đưa ra quyết định đầu tư và chỉ được cung cấp cho mục đích làm quen.
Giao dịch trên thị trường tài chính (đặc biệt là giao dịch sử dụng các công cụ biên) mở ra những cơ hội lớn và tạo điều kiện cho các nhà đầu tư sẵn sàng mạo hiểm để thu lợi nhuận, tuy nhiên nó mang trong mình nguy cơ rủi ro khá cao. Chính vì vậy trước khi tiến hành giao dịch cần phải xem xét mọi mặt vấn đề chấp nhận tiến hành giao dịch cụ thể xét theo quan điểm của nguồn lực tài chính sẵn có và mức độ am hiểu thị trường tài chính.
Sử dụng thông tin: sử dụng toàn bộ hay riêng biệt các dữ liệu trên trang web của công ty TeleTrade như một nguồn cung cấp thông tin nhất định. Việc sử dụng tư liệu từ trang web cần kèm theo liên kết đến trang teletrade.vn. Việc tự động thu thập số liệu cũng như thông tin từ trang web TeleTrade đều không được phép.
Xin vui lòng liên hệ với pr@teletrade.global nếu có câu hỏi.
ngân hàng