- Phân tích
- Tin tức và các công cụ
- Tin tức thị trường
Tin tức thì trường
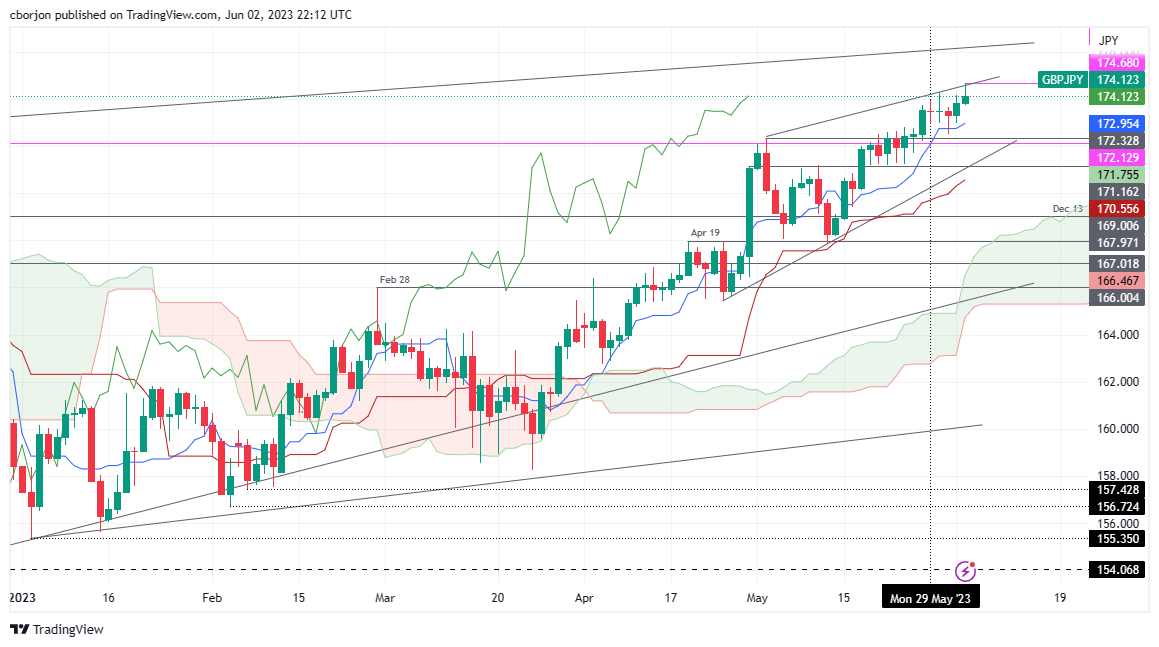
- GBP/JPY surges to year's high, up by 0.18%, amid positive market sentiment.
- Expectations of a dovish Fed and resolution of the US debt-ceiling imbue strength to high beta currencies.
- Despite the overall upward bias, the technical outlook suggests potential downside pressure on GBP/JPY.
GBP/JPY climbed to fresh year-to-date (YTD) highs at 174.68 before a pullback that dragged the exchange rate toward the 174.10s area. A risk-on impulse caused expectations for a dovish US Federal Reserve (Fed) amongst geopolitical issues like the US debt-ceiling resolution underpinned high beta currencies. Therefore, safe-haven peers persisted pressured, as the GBP/JPY traded at 174.12, up 0.18%.
GBP/JPY Price Analysis: Technical outlook
The GBP/JPY is still upward biased, confirmed by price action widening its distance from the Tenkan-Sen and Kijun-Sen lines below the exchange rate. In addition, price action is another bullish signal above the Ichimoku cloud.
Nevertheless, an upslope resistance trendline from the May 2 highs cushioned the GBP/JPY rally; while a support trendline, drawn from the April and May lows, indicates a rising wedge forming. That means further downside pressure is expected.
If GBP/JPY falls below the 174.00 figure, the next support would be the Tenkan-Sen at 172.95. A breach of the latter will expose the 2022 high turned support at 172.13 before testing April 28 daily high at 171.16. Conversely, the uptrend would continue above the YTD high at 174.68 once cleared, and the GBP/JPY could rally to the 175.00 mark, followed by the 2016 high at 177.37.
GBP/JPY Price Action – Daily chart
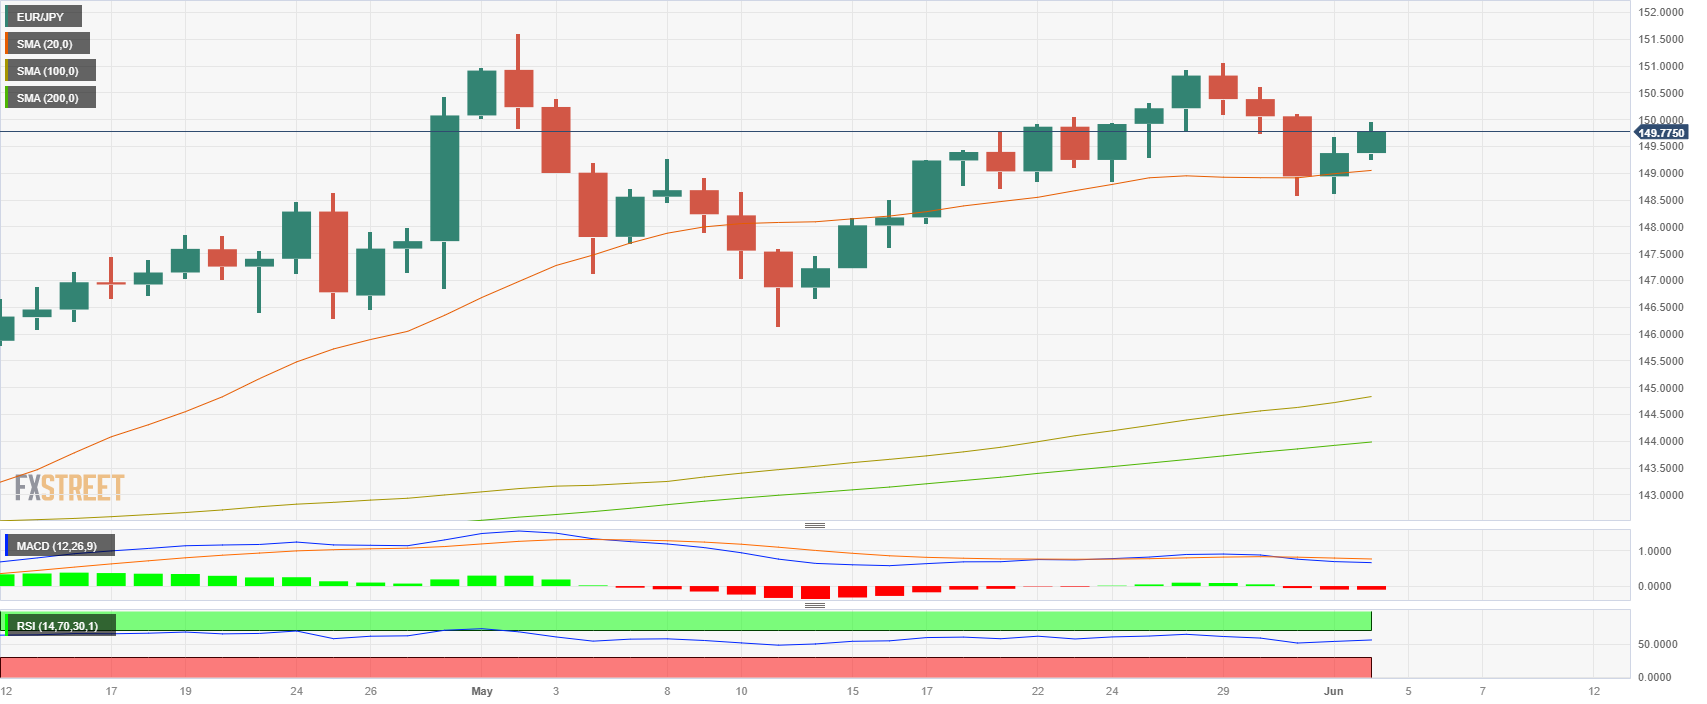
- The EUR/JPY trades for a second consecutive day with gains.
- Cross ends week with gains, but below 150.00.
- Yield divergence favours the Euro.
The EUR/JPY closes the week trading with gains above 149.80 as the Yen weakened across the board on Friday, against its major rivals, including the Sterling Pound, Swiss, the US and Australian Dollars. On the other hand, the Euro is getting traction on the back of rising German bond yields following ECB Lagarde's hawkish comments in Thursday's session.
Yield divergence between Japanese and German bonds traction the Euro
Following the Eurozone's inflation figures during Thursday's session, European Central Bank (ECB) President Christine Lagarde expressed her ongoing concerns about persistent high inflation and its prolonged duration. She emphasized that the interest rate hikes implemented by the ECB have already had a notable impact on bank lending conditions. Despite these efforts, Lagarde expressed dissatisfaction with the current inflation outlook and hinted at further rate hikes.
As a response, the German yields exhibit a mixed performance. The 10-year bond yield is trading at 2.32%, reflecting an increase of 3.65% for the day. In addition, the 2-year yield stands at 2.84%, experiencing a gain of 3.98%, while the 5-year yield sits at 2.35%, demonstrating a slight decline of 0.49%.An improvement in global market sentiment also weighed on bond demand.
On the other hand, the Japanese yields have witnessed a decline. The 10-year bond yield has retraced to 0.41%, indicating a decline of 1.56%. Similarly, the 2-year yield stands at -0.07%, reflecting a loss of 9.7%, and the 5-year yield is at 0.07%, showing a decline of 6.76% and applying further pressure on the Japanese Yen.
Levels to watch
On the weekly and daily charts, the technical outlook for the EUR/JPY appears to be bullish in the short term. The Relative Strength Index (RSI) and Moving Average Convergence Divergence (MACD) remain in both charts in positive territory. Only on the daily chart, the MACD remains weak and print decreasing red bars.
Moving above the 149.90 zone would suggest continuing the bullish trend for the EUR/JPY, with the next resistances at the 150 psychological mark area and the 150.50 level. On the other hand, the 20-day Simple Moving Average (SMA) at 149.00 level stands as the critical support level for EUR/JPY. If broken, the 148.50 area and 148.00 zone could come into play.
- Silver price pulls back as robust US jobs report strengthens Treasury bond yields.
- Expectations for a July rate hike by the Fed mount, pressuring precious metals.
- Resolution of US debt-ceiling drama provides potential respite for Silver.
Silver price makes a U-turn following the path of Gold, as precious metals weighed by high US Treasury bond yields edge lower. XAG/USD opened around the daily highs and printed a weekly high of $24.00 before retreating past the 50- and 20-day Exponential Moving Averages (EMAs) confluence at the time of writing. XAG/USD is trading at $23.61, down 0.01%.
XAG/USD retreats amid strong US jobs data and anticipation of Fed rate hike
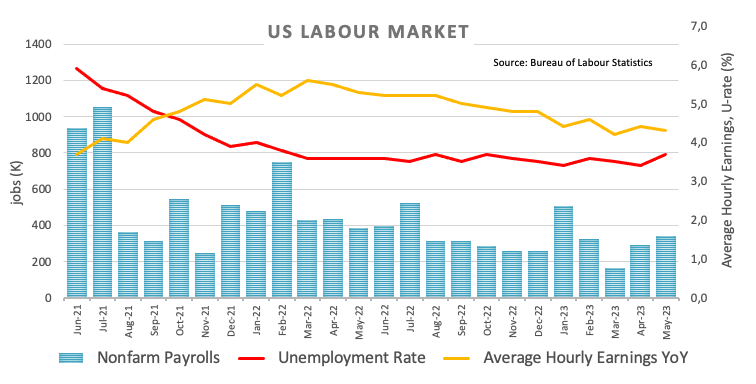
XAG/USD slid on a hotter-than-expected US Nonfarm Payrolls report in May, which revealed that 339K Americans entered the workforce, more than one and a half expected of 190K. The headline data suggests the Federal Reserve (Fed) still has some work. Still, the Unemployment Rate saw signs of upward pressure, from 3.4% to 3.7% YoY, while Average Hourly Earnings, seen as wages inflation, stood at 4.3% YoY, a tick lower than April’s.
Given the amount of data revealed, traders brace for a July rate hike by the Fed, aligning themselves with recent Fed officials’ commentary, led by the Chair Jerome Powell, saying the US central bank could skip a meeting to see the effects of 500 bps of tightening. Vice-Chair nominee Philip Jefferson and the Philadelphia Fed President Patrick Harker reinforced the message.
Therefore US Treasury bond yields exploded to the upside, a headwind for the precious metals segment. US Treasury bond yields climbed, with 2s up 16 bps to 4.501%, while 10s stand at 3.689%, gaining nine bps. The US Dollar Index (DXY), which tracks the greenback’s value against a basket of six currencies, rose 0.46%, up at 104.041, but set to finish the week on the wrong foot.
On the geopolitical sphere, the US debt-ceiling saga finished with a happy ending, with both chambers, the US House and the Senate passing the bill, easing fears of a possible US government default. The bill would be signed into law by US President Joe Biden over the weekend.
XAG/USD Price Analysis: Technical outlook
Given the fundamental backdrop, the XAG/USD shifted from neutral upward biased to neutral. The Relative Strength Index (RSI) indicator dodged the 50-midline and aimed downwards, suggesting that sellers are still in place. But the 3-day Rate of Change (RoC) indicates that selling pressure is beginning to fade. It means the white metal could remain sideways, awaiting the next catalyst.
Upwards, resistance levels lie at the 20-day EMA at $23.79, the 50-day EMA at $23.91, and the $24.00 figure. Conversely, XAG/USD support levels are the 100-day EMA at $23.47, the $23.00 psychological price level, and the 200-day EMA At $22.85.
- Gold price dips despite week’s strong showing; US job growth exceeds expectations.
- Rising US Treasury bond yields and a robust USD exert downward pressure on gold.
- US debt-ceiling resolution eases bond yields, potential respite for gold.
Gold price slumps after hitting a daily high of $1977.87, as the release of a solid US jobs data report underpinned US Treasury bond yields, a headwind for the yellow metal. That, alongside a strong US Dollar (USD), keeps XAU/USD downward pressured but still set to end the week with decent gains. At the time of writing, the XAU/USD is trading below the $1950 area.
XAU/USD falters amidst robust US data, Treasury yields surge and heightened Fed rate hike expectations
A risk on impulse keeps safe-haven assets under pressure, as Wall Street shrugged off a solid employment report from the United States (US). On Friday, the US Department of Labor revealed May’s Nonfarm Payrolls report, which crushed estimates of 190K, as the economy created 339K jobs. Regardings to the Unemployment Rate grew by 3.7% YoY from 3.4%.
US Treasury bond yields reacted to the upside, with 2s jumping 16 bps to 4.501%, while 10s stand at 3.689%, gaining nine bps. The greenback edged up 0.43% as shown by the US Dollar Index at 104.026, ready to post its first weekly loss, snapping three weeks of gains.
Bets that the US Federal Reserve will keep rates unchanged at the June meeting increased, although, in July, it is almost sure that the US central bank will raise rates by 25 bps.
Should be said that once the US House and Senate approved the US debt-ceiling bill, US bond yields dropped. The bill would be signed by US President Joe Biden during the weekend, ending the soap opera.
XAGU/USD Price Analysis: Technical outlook
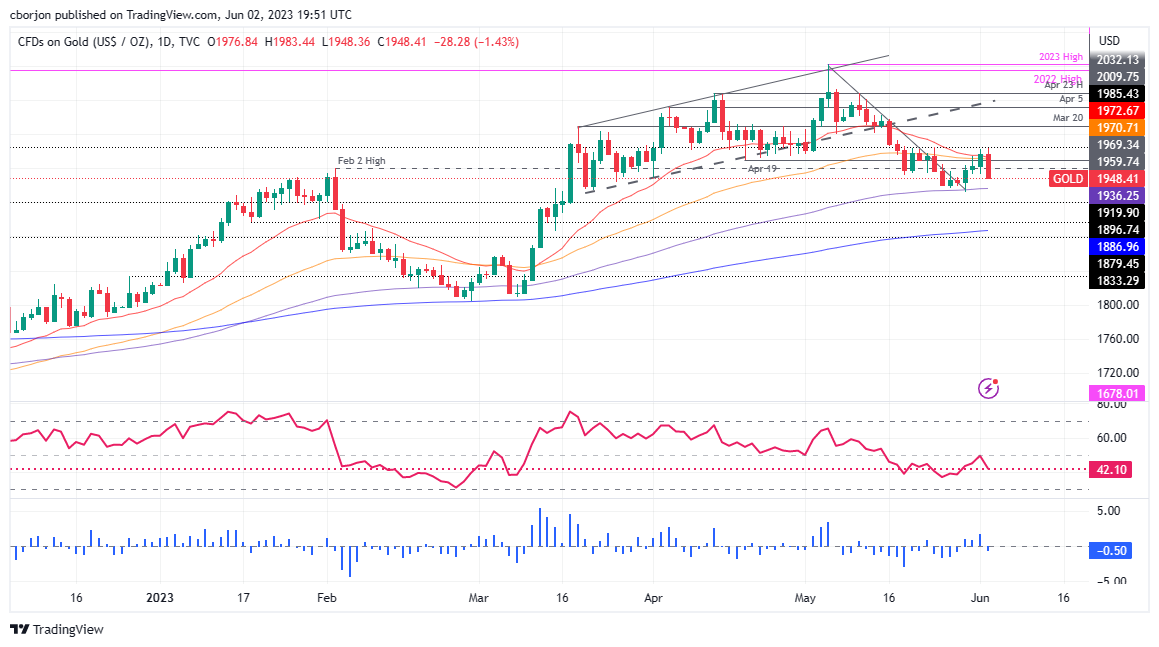
XAU/USD is neutral to downward biased, even though the Gold spot remains trading above the 200-day Exponential Moving Average (EMA) at $1886.98. As the yellow metal registered successive series of lower highs, despite pending confirmation for a second lower-low, it turned the bias slightly downwards.
Oscillators like the Relative Strength Index (RSI) and the 3-day Rate of Change (RoC) suggests sellers are in charge though a decisive break below $1950 would put them in the driver’s seat to challenge the 200-day EMA.
XAU/USD first support would be $1950, followed by the 100-day EMA at $1936.30. Once cleared, $1900 is up next. On the other hand, the XAU/USD first resistance would be the 50-day EMA at $1970.78, closely followed by the 20-day EMA at $1972.86. Upside risks lie at $2000.
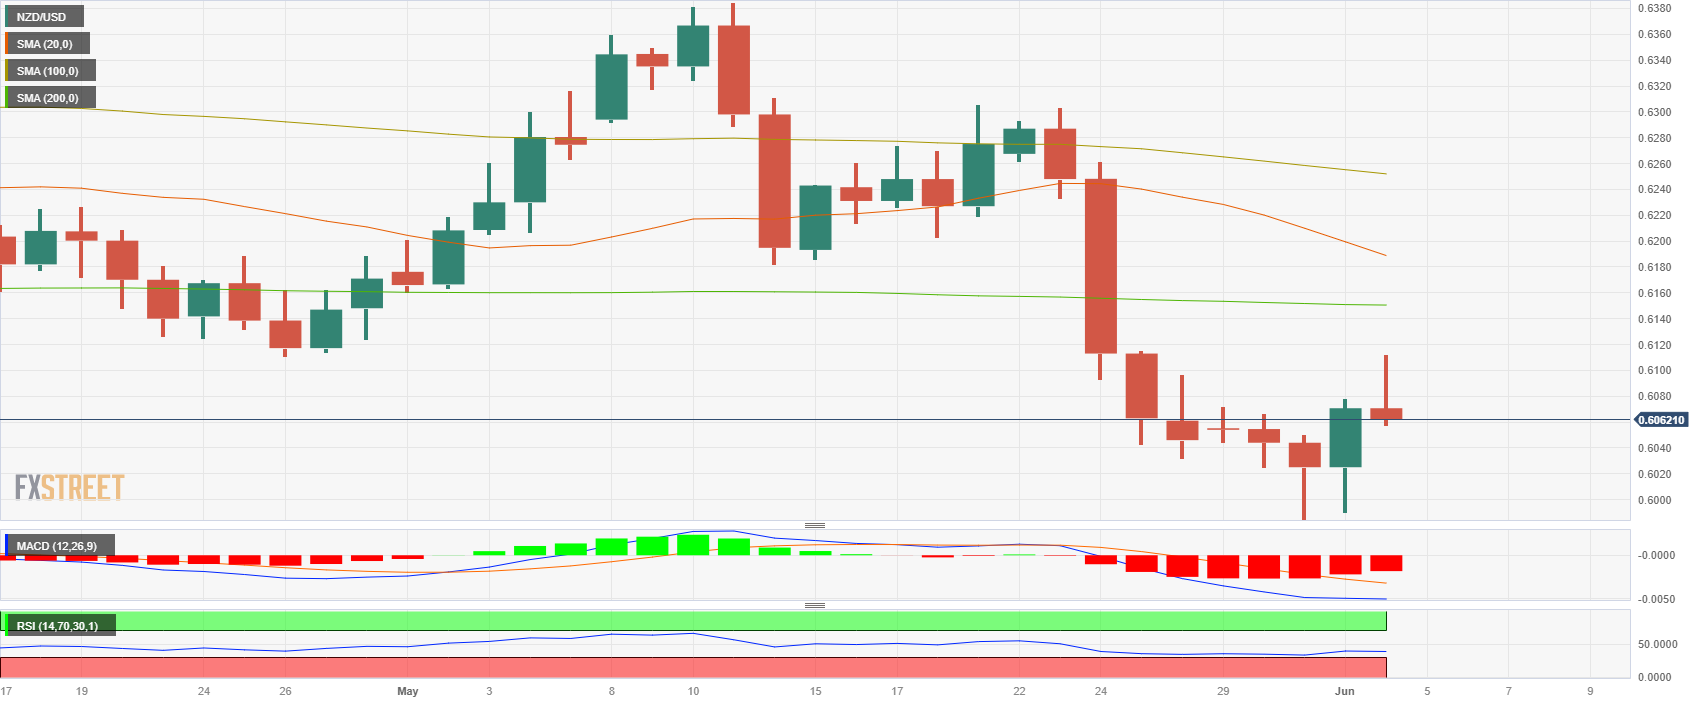
- The Kiwi peaked at a five-day high at 0.6111 and then fell to the 0.6065 area.
- Despite labor demand in the US showing a deceleration, the figures showed a robust employment growth.
- The Greenback gained interest on the back of increasing US yields.
The NZD/USD pair erased gains which saw the Kiwi surging to the 0.6111 area at the end of the week and fell towards the 0.6065 area, in response to strong labor market data from the US. The data suggested a potential reassessment of additional rate hikes by the Federal Reserve (Fed) which consequently favored the US Dollar amid rising US bond yields.
Greenback gains on rising US bond yields following NFP
According to the US Bureau of Labor Statistics, employment in the United States surpassed expectations by increasing by 339k in May, exceeding the consensus forecast of 190k. However, the Unemployment Rate rose slightly, reaching 3.7% instead of the expected 3.5%. Average Hourly Earnings, which serves as a gauge of wage inflation, stood at 4.3% YoY, slightly below the projected 4.4%.
The overall labor market outlook suggests that labor demand is showing some deceleration but the robust employment growth and the increasing inflationary pressures indicate that these developments make a case for the Fed to reconsider a 25 basis points (bps) hike in the upcoming June meeting. As a result, US bond yields are experiencing an upward trend. The 10-year bond yield has increased to 3.68%, reflecting a gain of 2.70% for the day. Similarly, the 2-year yield stands at 4.51% with an increase of 3.64%, and the 5-year yield is at 3.84% up by 3.81%.
As the Fed officials mention, their ultimate goal is to assure full-employment and price stability, so the May Consumer Price Index (CPI), to be release next week, will play a crucial role in influencing the expectations and considerations of the Federal Open Market Committee (FOMC) regarding the next interest rate decision. As for now, the CME FedWatch tool suggests markets are still discounting higher probabilities of no hike for the next June 13-14 meeting but the case of a 25 bps hike gained some relevance.
Levels to watch
According to the daily chart, the NZD/USD holds a bearish outlook for the short term as the Relative Strength Index (RSI) and Moving Average Convergence Divergence (MACD) suggest that the sellers are in control while the pair trades below its main moving averages.
In case of further downside, support levels line up at the 0.6050 area and below at the 0.6025 zone and the 0.60 psychological mark. On the upside, resistances line up at the daily high around 0.6111 followed by the 200 and 20-day Simple Moving Average (SMA) at 0.6150 and 0.6180 respectively.
Federal Reserve (Fed) Chair Jerome Powell will testify at the U.S. Senate Banking Committee on June 22, panel chief Sherrod Brown said on Friday, Reuters reported. The testimony will come a week after the June 13-14 FOMC meeting.
Data released on Friday, showed Nonfarm Payrolls rose by 339K in May surpassing expectations. Analysts at TD Securities point out payroll strength keeps the door open for another rate hike from the Federal Reserve.
Key quotes:
“The two-month net revisions also added a notable 93k jobs to the employment series, which resulted in the 3-month moving average moving significantly higher to 283k in May from 222k in April. Not really the direction the Fed's is hoping for. With that said, the unemployment rate unexpectedly rose by 0.3pp to 3.7%, though the details behind that move were more nuanced.
“The May jobs report should leave the hike option fully on the table for the Fed. If Fed officials were looking for clear signs of labor-market slowing, we do not think this reports clearly offers that perspective despite the rise in the UE rate. We continue to look for the Fed to lift rates by a final 25bp to 5.25%-5.50% range in June, but also acknowledge that the FOMC's decision will be a very close call.”
Next week, the Reserve Bank of Australia (RBA) is set to announce its decision on monetary policy. The market consensus is for the central bank to keep rates unchanged. However, analysts at Wells Fargo are expecting the RBA to deliver another 25 basis point rate hike.
Key quotes:
“On the inflation front, this week's monthly CPI data showed that inflation jumped to 6.8% year-over-year in April, up from 6.3% in March, boosted by the end of a government fuel subsidy put into place in April 2022, as well as price gains in housing, food and transportation.”
“Lowe mentioned he believes risks to inflation are tilted to the upside and that the central bank is “not going to declare victory until victory’s achieved.” Overall, given that inflation dynamics remain stubbornly high in Australia, we believe the RBA will deliver another 25 bps rate hike at its June meeting to 4.10%.”
- US jobs growth exceeds estimates, yet USD/MXN slips by 0.12%.
- US Treasury bond yields’ increase lends some support to USD/MXN.
- Bank of Mexico’s stand on record high-interest rates adds resilience to the Peso.
USD/MXN trims some of its losses but remains trading negatively, despite a solid US jobs report revealed before Wall Street opened, which did not stop the Mexican Peso from reaching new weekly lows. Traders’ mood improvement, seen as US equities post gains, cushioned the MXN from falling against its counterpart, the US Dollar (USD). At the time of writing, the USD/MXN is trading at 17.5308, down 0.10%.
MXN holds its ground amidst strong US jobs data and rising US Treasury bond yields
The USD/MXN dropped sharply from around 17.5000s toward the lows of the week of 17.4190 after the US Bureau of Labor Statistics (BLS) revealed Nonfarm Payrolls in May crushed analysts’ estimates of 190K, with the economy adding 339K jobs. Although the headline figure is impressive, digging a little deep, the Unemployment Rate jumped from 3.4% to 3.7%. Regarding wages, inflation, known as Average Hourly Earnings, rose 0.3% MoM but edged down from April 4.4% to 4.3%.
Later, the USD/MXN rallied, about to erase its earlier losses, as traders digested the US jobs report, underpinned by rising US Treasury bond yields. The 10-year benchmark note rate is 3.69%, ten basis points (bps) higher than Thursday’s close.
In the meantime, the US Dollar Index (DXY), a gauge of the buck’s value against a basket of six currencies, advances 0.47%, up above 104.000, set to finish the week with losses of 0.17%.
Across the border, Mexico’s Unemployment Rate for April was 2.8%, above estimates of 2.7%. Aside from this, the latest meeting minutes of the Bank of Mexico (Banxico) showed inflation and inflationary pressures cooling down after the bank held rates at 11.25%. On Wednesday, Banxico{s Governor Victoria Rodriguez Ceja said that the institution she commands would keep rates at record high for at least the two following meetings.
USD/MXN Price Analysis: Technical outlook
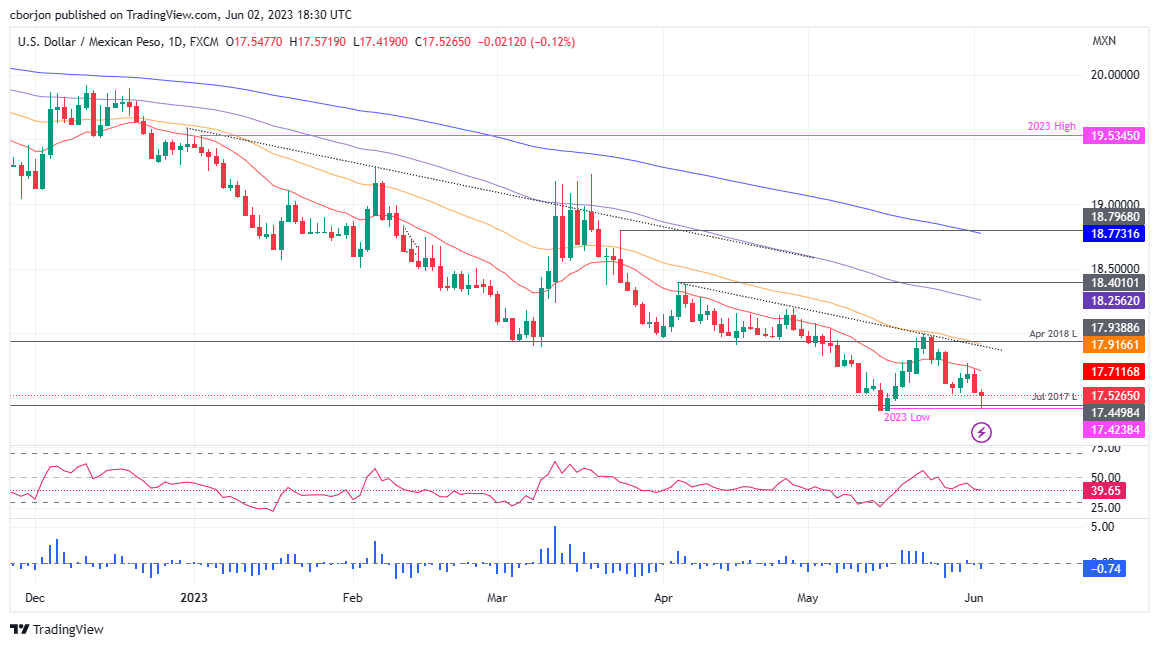
Given the fundamental backdrop, the USD/MXN remains downward biased, but recent price action could form a double bottom. Even though it’s just a double dip toward the 17.4000 area, it’s worth considering due to the latest downtrend, which started in November 2021, with the USD/MXN plunging 20%. If USD/MXN surpasses that support, the next stop would be the 17.0000 figure. Otherwise, if USD/MXN reclaims the 18.0000 figure, it will conform to the double bottom. Above this area, the USD/MXN’s next stop would be the 100-day EMA at 18.2563, followed by the April 5 daily high of 18.4010.
- Cable fell below the 20-day SMA toward the 1.2450 area.
- The US added 339k new jobs in May vs 190k expected.
- US bond yields increased as a reaction to the employment figures.
The GBP/USD fell more than 0.50% to a daily low of 1.2453 at the end of the week, following robust labor market data from the US, indicating a possible reconsideration of further rate hikes by the Federal Reserve (Fed). As a result, the US Dollar strengthened due to rising US bond yields, while the Sterling Pound continued to face selling pressure while the British economic calendar had nothing relevant to offer.
Robust labor market made markets reconsider a possible hike by the Fed
The US Bureau of Labor Statistics revealed that employment in the US increased by 339k, surpassing the consensus forecast of 190k. However, the Unemployment rate rose to 3.7% compared to the expected 3.5%. Wage inflation, measured by Average Hourly Earnings, stood at 4.3% YoY, slightly lower than the anticipated 4.4%.
Despite labor demand beginning to exhibit signs of deceleration, the robust employment growth and ongoing inflationary pressures are exerting force on the Fed to contemplate interest rate hikes. This has resulted in an upswing in US bond yields, reflecting heightened market expectations for a 25 basis points hike in the upcoming June meeting. In that sense, the US bond yields are experiencing increases across the curve. The 10-year bond yield increased by 2.33%, reaching 3.68%. Similarly, the 2-year yield stands at 4.50% with a gain of 4.69%, and the 5-year yield is at 3.83% up by 3.53%.
However, as per the CME FedWatch tool, markets are still discounting higher odds of no hike, although the case for a 25 bps gain has strengthened. Before the meeting, the Federal Open Market Committee will know the May inflation reading, which will finally model the expectations for their next interest rate decision.
Levels to watch
The GBP/USD holds a slightly bearish outlook for the short term, as per the daily chart. The Relative Strength Index (RSI) fell towards its midpoint while Moving Average Convergence Divergence (MACD) turned flat. However the pair still holds above the 100 and 200-day Simple Moving Averages (SMA) while bulls try to retake the 20-day rolling average at the 1.2460 zone.
If the Cable falls, immediate support levels are seen at the daily low area around 1.2350 and the 1.2400 level. Furthermore, to regain traction the bulls must consolidate the 20-day SMA at the 1.2461 area. Above, resistances stand at 1.2480 and 1.2500.
- US adds 339K jobs, beating estimates; EUR/USD slips by 0.43%.
- Federal Reserve’s hawkish outlook hints at a possible July FFR increase.
- Positive economic indicators from Europe, including Italy’s Industrial Production and Spain’s Unemployment Change.
EUR/USD slumps from weekly highs reached as a knee-jerk reaction to a solid US jobs report, driving the pair towards 1.0779 before sliding toward daily lows. The labor market in the United States (US) stayed strong but saw slight signs of weakness. At the time of writing, the EUR/USD is trading at 1.0715, printing losses of 0.43%.
EUR/USD pair exhibits a weak response to robust US jobs data; US Federal Reserve’s future rate decisions loom
In early trading, before Wall Street opened, the US Department of Labor revealed May employment figures, with the economy adding 339K jobs, above estimates of 190K. Even though the figure is positive for the economy, the Unemployment Rate ticked to 3.7%, from 53-year lows of 3.4%, sought by the Fed as a sign that can undermine consumer spending. Average Hourly earnings rose 0.3%, up 4.3% YoY, less than April’s figure of 4.4%.
Given the backdrop, traders pricing in a hawkish US Federal Reserve (Fed), despite skipping the June monetary policy meeting, expect another increase to the Federal Funds Rate (FFR) in July toward the 5.25%-5.50% area. But, the rising unemployment rate would make the Fed’s job easier as it scrambles to tame high inflation and double its target.
Since the data release, the EUR/USD pair lost 40 pips or 0.40% intraday, threatening to get toward the 1.0700 figure as the greenback limps its wounds. The US Dollar Index (DXY) climbs 0.44%, again above the 104.000 figure.
Events that took the headlines over the last couple of weeks, like the US debt-ceiling crisis, were solved late Thursday night, with the US Senate passing the bill, set to be signed by US President Joe Biden. The ceiling would be raised, though we would witness the same soap opera by January 1, 2025.
Across the pond, the latest European Central Bank (ECB) meeting minutes showed that hawks were striving for a 50 bps, but “consensus” voted for a 25 bps at the expense of further tightening ahead. Data-wise, the economic docket showed Industrial Production in Italy, at 0.8% MoM, above estimates of 0.3%, while the Unemployment Change in Spain hit -49.3K, above forecasts of -40.1 K.
EUR/USD Technical Levels
- Headline employment growth in the US rose by 339k in May.
- The US Unemployment rate rose to 3.7%.
- Wage inflation slightly decreased.
The USD/JPY gained more than 60 pips on Friday, spiking to the 139.70 zone following the labor market data from the US which suggested that the Federal Reserve (Fed) may reconsider a further hike. As a reaction, the US Dollar gained traction on the back of rising US bond yields while Japanese yields continue to decline.
Yield divergence post NFP favors the Greenback
The US Bureau of Labor Statistics released that employment in the US measured by the Nonfarm payrolls (NFP) increased by 339k, way above the consensus of 190k. The Bureau stated that job gains were seen across various sectors, with notable increases in professional and business services and government employment. Other figures show that the Unemployment rate picked up to 3.7% in the same period of time vs the 3.5% expected while wage inflation measured by the Average Hourly Earnings, came in at 4.3% YoY vs the 4.4% expected.
In that sense, while signs of slowing labor demand have emerged, the strong employment growth and persistent inflation are pressuring the Fed to consider further rate hikes which fueled an increase of the US bond yields. The US bond yields experienced an increase as a result of strong employment growth and persistent inflation, putting pressure on the Federal Reserve to consider raising interest rates. The 10-year bond yield in the US increased by 1%, reaching 3.67%. Additionally, the 2-year yield in the US rose by 1.98% to stand at 4.47%, while the 5-year yield increased by 1.29% to reach 3.79% and the increase of the US rates seem to be attracting foreign investors and hence supporting the US Dollar.
However, the CME FedWatch tool suggests that markets still discount higher odds of a no hike by the Fed in the June 13-14 meeting, while the probabilities of a 25 basis point (bps) hike increased slightly to 30%.
In contrast, Japanese bond yields declined. The 10-year yield decreased by 1.68% to 0.41%, while the 2-year yield fell by 9.7% to stand at -0.07%. Furthermore, the 5-year yield in Japan experienced an 8.78% decrease, reaching 0.07% and applied further pressure on the Yen..
Levels to watch
According to the daily chart, the USD/JPY holds a bullish outlook for the short term as the Relative Strength Index (RSI) and Moving Average Convergence Divergence (MACD) both suggest that the buyers are in control while the pair trades above its main moving averages. The 4-hour chart also suggests bulls dominance as the mentioned indicators jumped from negative territory to positive zone.
The 140.00 level is key for USD/JPY to gain further traction. If cleared, we could see a more pronounced move towards the 140.50 zone and the psychological mark at 141.00. On the other hand, immediate support for USD/JPY is seen at the 138.90 zone level, followed by the 138.50 level and the psychological mark at 138.00.
- US adds 339K jobs, beating estimates, but USD/CAD stays tepid.
- CAD gains momentum on a 1.70% surge in WTI Crude Oil prices.
- Uncertain Fed rate hike in July overshadows USD’s future trajectory.
USD/CAD registers modest losses after an outstanding jobs report in the United States (US) would likely keep the US Federal Reserve (Fed) hitting the economy’s brakes, despite recent dovish comments supporting a pause. Nevertheless, the US Dollar (USD) continued to weaken while the Loonie (CAD) strengthened. At the time of writing, the USD/CAD is trading at 1.3428, down 0.16%.
Strong job growth figures unable to buoy USD; WTI Crude Oil surge lifts CAD, sparking a USD/CAD shake-up
The USD/CAD stopped its fall at around the 200-day Exponential Moving Average (EMA) at 1.3417 on the release of May’s US Nonfarm Payrolls report, revealed by the US Department of Labor. The US economy created 339K jobs in the economy, crushing estimates of 190K, though the Unemployment Rate ticked higher to 3.7% from 3.4%, a 53-year low level.
Although the data supported a stronger US Dollar, the USD/CAD treads water after printing a daily low of 1.3406 ahead of the Nonfarm Payrolls release.
Given the backdrop, crude oil prices were another factor that boosted the CAD, with Western Texas Intermediate (WTI), the US crude oil benchmark, recovering ground gaining 1.70%, at $71.33 per barrel, along with a risk-on impulse, that keeps the greenback pressured through pairing some losses.
The US Dollar Index (DXY), a measure that tracks the buck’s value vs. six currencies, edges up 0.31%, at 103.888, underpinned by increased bets for a July rate hike by the Fed. According to the recent update from the CME FedWatch Tool, the Federal Reserve will likely maintain the current interest rates steady for the month. However, the forecast for July is considerably less definitive, with the likelihood of a rate change teetering at approximately 50.7%.
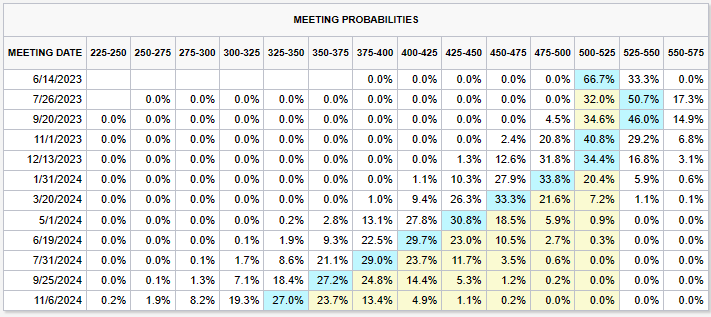
Source: CME Fed Watch Tool
An absent Canadian economic docket left USD/CAD traders leaning on the dynamics of the US Dollar. But recent data showing strong growth in the Canadian economy puts pressure on the Bank of Canada (BoC) to further tighten the economy, at the threat of elevated inflationary pressures.
USD/CAD Price Analysis: Technical outlook
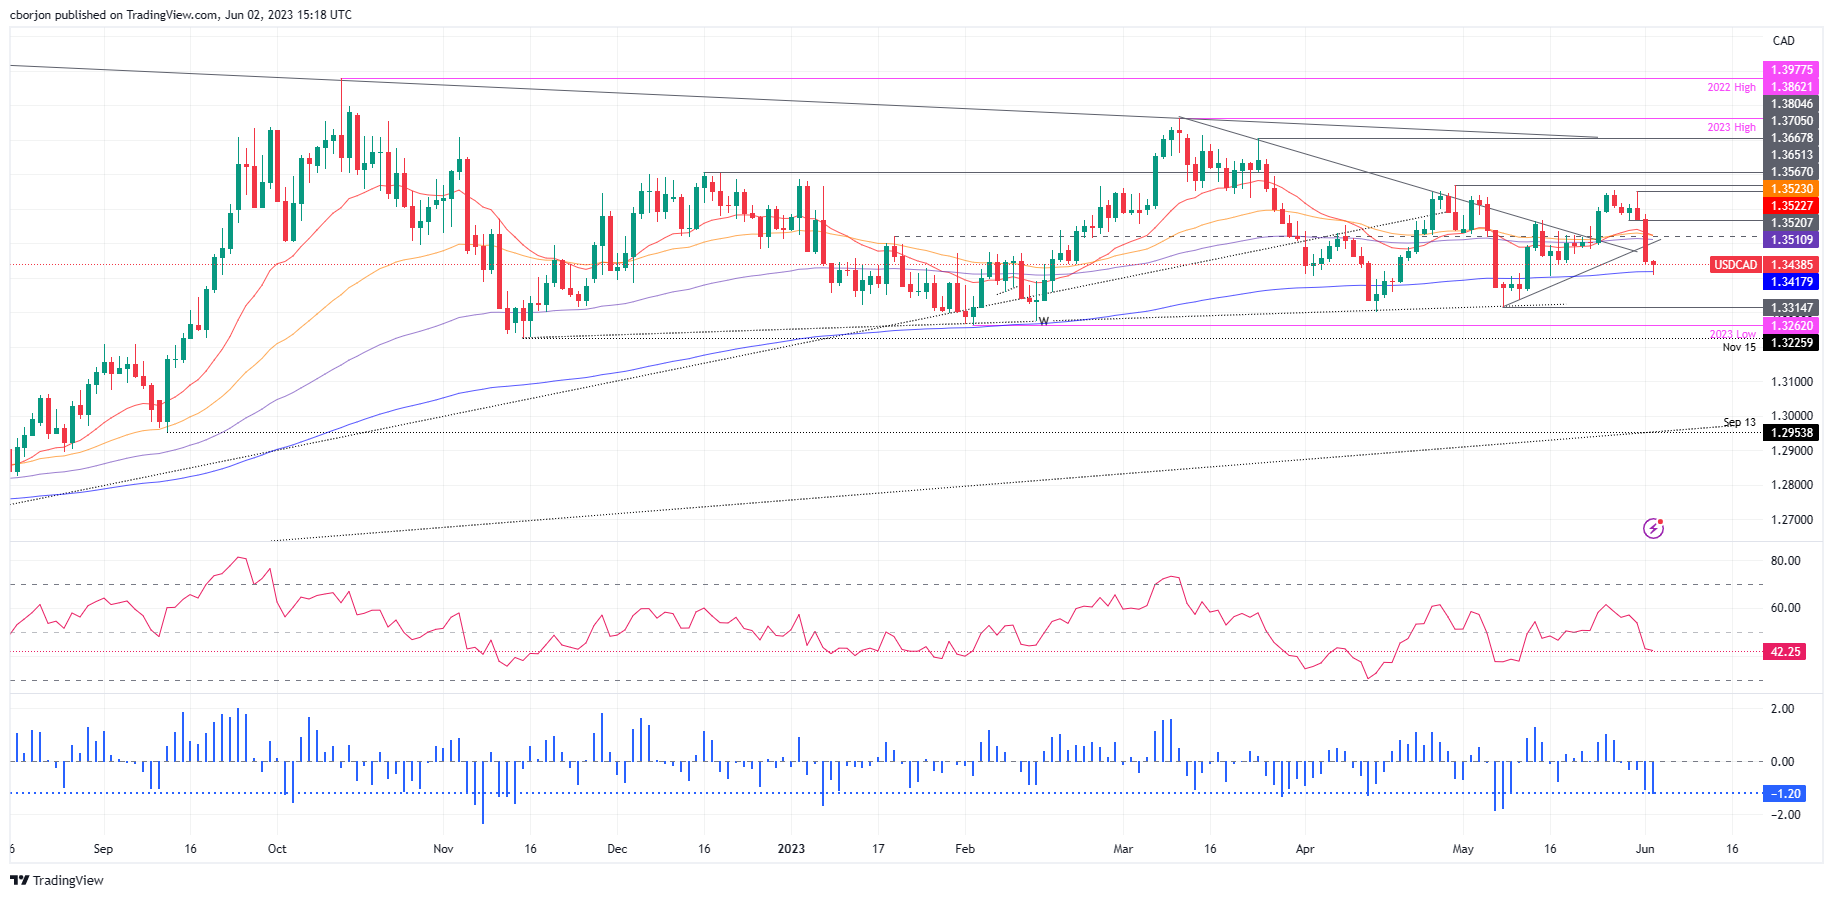
From a technical perspective, USD/CAD faced solid support at the 200-day EMA, with buyers piling in, driving the price 30 pips up. Nevertheless, the Relative Strength Index (RSI) indicator and the 3-day Rate of Change (RoC) in bearish territory suggest downside action in the near term. Therefore, the USD/CAD could be pressured, with support back at the 200-day EMA at 1.3417, before testing 1.3400. Break below will expose May’s low of 1.3314. Conversely, the USD/CAD first resistance would be the 1.3500 figure, followed by the 100-day EMA at 1.3510.
Economists at Commerzbank discuss Gold (XAU/USD) outlook.
Central banks planning further Gold purchases
Gold price dipped to a two-month low this week, but has recovered noticeably again in the meantime. Though it now seems likely that the Fed will take a break from its rate hike cycle in mid-June after all, a further rate increase is not off the table entirely. This should keep the gold price in check for the time being.
According to a survey conducted by the World Gold Council, central banks are planning to buy further Gold following their record purchases last year. Central bank purchases do not necessarily drive up the Fold price – but they could help prevent any fall in prices.
Economists at the Bank of Montreal discuss the Fed policy outlook following the US Nonfarm Payrolls report.
Fed will take further comfort from the gradual moderation in wage growth
The acceleration in payrolls, coupled with a recent upturn in job openings, suggests that American businesses are still aggressively hiring, likely to meet resilient consumer demand. However, the other areas of softness in this report suggest that the labour market is losing steam.
In light of a recent downward revision to unit labour costs data, the Fed will take further comfort from the gradual moderation in wage growth.
There's likely enough pockets of softness in this report for the FOMC to pass on raising rates at the next meeting, though another strong payrolls gain in June, coupled with another disappointing inflation report, could set the stage for a rate increase in July.
The BoE's stance seems too hesitant, which is likely to weigh on the Pound in the coming quarters, economists at Commerzbank report.
GBP weakness will probably continue next year as well
The door remains open for further rate hikes, but the BoE is likely to hope that the upcoming data releases will give it room to pause. The financial markets apparently do not share the BoE's optimistic view. The terminal rate is now seen at 5.5%. This seems excessive in view of the BoE's hesitant stance.
The market will probably have to scale back its interest rate expectations, which is why we are sticking to our forecast that the Pound will weaken against the EUR in the coming months. After all, in contrast to the BoE, the ECB appears much more determined in its statements, which should support the EUR.
GBP weakness will probably continue next year as well, as the BoE is likely to cut its key rate in view of the weak economy and somewhat lower inflation.

Source: Commerzbank Research
According to SG’s FX team, the USD/JPY could drop to 130 again.
Yen should appreciate when money returns to Japan
If the BoJ adjusts its Yield Curve Control (YCC) range at its June policy meeting as we expect, the USD/JPY could drop to around 130 again as the JGB yield rises.
Moreover, as a rule, the unwinding of foreign assets is bullish for the Yen. Net inflows into long-term bonds typically fuel Yen appreciation. We also think the USD/JPY could drop to 110 after 2025.
The Turkish Lira appears to be going exponential once again. Economists at Commerzbank have revised up their USD/TRY forecast path significantly.
Inflation-FX spiral may have restarted
We have revised up our USD/TRY forecast path significantly, with a target of 25.00 for end-2023 and 30.00 for end-2024.
Now that the exchange rate has started to depreciate once again, the FX pass-through to inflation will re-accelerate – the apparently falling inflation could begin to reverse.
The outlook for the real interest rate will deteriorate, which will further intensify exchange rate depreciation – this is the familiar inflation-FX spiral – the reason why we have significantly weakened our lira forecasts in the election aftermath.

Source: Commerzbank Research
- AUD/USD gains strong traction for the second straight day and climbs to a nearly two-week high.
- The uncertainty over the Fed’s rate-hike path weighs on the USD and lends support to the major.
- The mixed US NFP report does little to impress the USD bulls or provide any impetus to the pair.
The AUD/USD pair stands stall near a one-and-half-week high, around the 0.6625-0.6630 region through the early North American session on Friday and moves little in reaction to the mixed US monthly employment details.
The US Dollar (USD) did get a minor lift after the headline NFP print showed that the US economy added 339K new jobs in May, smashing consensus estimates by a big margin. Adding to this, the previous month's reading was also revised higher. That said, the uncertainty over the Federal Reserve's (Fed) next policy moves keeps a lid on any further gains for the Greenback and remains supportive of the strong bid tone surrounding the AUD/USD pair for the second successive day.
It is worth recalling that the markets have been pricing in the possibility of another 25 bps lift-off at the next FOMC meeting on June 13-14. A slew of influential Fed officials this week, however, backed the case for skipping an interest rate hike. Apart from this, the risk-on impulse - led by the optimism over the passage of legislation to lift the government's $31.4 trillion debt ceiling and avert an unprecedented American default - undermines the USD and benefits the risk-sensitive Aussie.
The Australian Dollar (AUD) further draws support from hopes of a recovery in the world's second-largest economy, bolstered by a private survey on Thursday that showed China’s manufacturing sector unexpectedly registered modest growth in May. This, along with speculations that the Reserve Bank of Australia (RBA) could tighten its monetary policy further, favours the AUD/USD bulls and suggests that the path of least resistance for spot prices is to the upside.
Technical levels to watch
The Mexican Peso is the only larger currency that was able to appreciate against the US Dollar in May. Economists at Commerzbank expect MXN to remain strong.
USD/MXN target remains at 17.50
The Peso was able to appreciate even in times of rising Fed rate hike expectations in May.
We assume that the Peso might be able to appreciate a little bit further as a result of Banxico’s hawkish approach, the promising growth environment and record high remittances.
Our target in USD/MXN remains 17.50.
- The index maintains the vacillating trade around 103.50.
- Further improvement in the risk space weighs on the buck.
- May Nonfarm Payrolls have hammered expectations at 339K.
The USD Index (DXY), which measures the greenback vs. a basket of its main competitors, alternates gains with losses in the mid-103.00s, as investors continue to assess the results from the US jobs report.
USD Index remains apathetic post-Payrolls
Following an ephemeral bout of strength soon after US Nonfarm Payrolls surprised to the upside in May, the index slowly returned to its current comfort zone around the 103.50 zone at the end of the week.
In fact, the greenback briefly revisited the 103.70/75 band, or daily highs, after the US economy created 339K jobs in May and the jobless rate rose to 3.7%. Further results saw Average Hourly Earnings rise 0.3% MoM and 4.3% from a year earlier, while the Participation Rate remained unchanged at 62.6%.
In the meantime, Thursday’s vote to pass the US debt ceiling bill in the US Senate continues to underpin the better tone in the risk complex and therefore keeps the dollar price action depressed, all in combination with the now-firm consensus around a Fed’s pause at the June gathering.
What to look for around USD
The index keeps the trade around the 103.50 zone amidst a vacillating price action on Friday.
In the meantime, bets of another 25 bps at the Fed’s next gathering in June suddenly reversed course in spite of the steady resilience of key US fundamentals (employment and prices, mainly), denting the recent rally in the dollar and favouring a further decline in US yields.
Bolstering a pause by the Fed instead appears to be the extra tightening of credit conditions in response to uncertainty surrounding the US banking sector.
Key events in the US this week: Nonfarm Payrolls, Unemployment Rate (Friday).
Eminent issues on the back boiler: Persistent debate over a soft/hard landing of the US economy. Terminal Interest rate near the peak vs. speculation of rate cuts in late 2023/early 2024. Fed’s pivot. Geopolitical effervescence vs. Russia and China. US-China trade conflict.
USD Index relevant levels
Now, the index is losing 0.04% at 103.52 and faces the next support at the 100-day SMA at 102.91 followed by the 55-day SMA at 102.41 and finally 101.01 (weekly low April 26). On the upside, the breakout of 104.69 (monthly high May 31) would open the door to 105.58 (200-day SMA) and then 105.88 (2023 high March 8).
Economists at Wells Fargo expect only modest gains in the Canadian Dollar against the US currency over time.
BoC could be among the first of the major central banks to begin easing monetary policy
We expect only modest gains in the CAD against the US currency over time. While growth was resilient in early 2023, an overall slowing inflation trend means we believe the Bank of Canada has already ended its tightening cycle.
Should growth and inflation slow further as we expect, Canada could also be among the first of the major central banks to begin easing monetary policy, by Q1-2024. That should act as a headwind for the Canadian dollar, while energy prices that are well below their peaks should also be a restraining factor for the currency.
Against this backdrop, we expect the Canadian Dollar to underperform relative to most of its G10 peers over the medium term.
- GBP/USD edges lower in reaction to the upbeat headline NFP print, albeit lacks follow-through.
- The mixed US jobs data adds to uncertainty over the next policy move by the Federal Reserve.
- The risk-on impulse to cap the US and lend support to the pair amid bets for more BoE rate hikes.
The GBP/USD pair pulls back from a two-and-half-week high, around the 1.2545 region, touched this Friday and extends its steady intraday descent through the early North American session. Spot prices slip below the 1.2500 psychological mark, hitting a fresh daily low in reaction to the mixed US employment details, albeit lacks follow-through and recovers a few pips in the last hour.
The US Dollar (USD) gains some positive traction in reaction to the upbeat headline NFP print and turns out to be a key factor exerting downward pressure on the GBP/USD pair. In fact, the US Bureau of Labor Statistics (BLS) reported that the economy added 339K new jobs in May as compared to the 170K estimated and the previous month's upwardly revised reading of 294K. Additional details, however, revealed that the Unemployment Rate, meanwhile, rose to 3.7% as compared to an expected uptick to 3.5% from 3.4% in April.
Furthermore, Average Hourly Earnings, edged lower to 4.3% from 4.4%, further raising uncertainty over the Federal Reserve's (Fed) next policy move. It is worth recalling that the markets have been pricing in the possibility of another 25 bps lift-off at the June FOMC policy meeting. That said, a slew of influential Fed officials this week backed the case for skipping an interest rate hike. This, along with the risk-on impulse, holds back traders from placing aggressive bullish bets around the safe-haven buck and lends support to the GBP/USD pair.
The British Pound, on the other hand, continues to draw support from rising bets for additional interest rate hikes by the Bank of England, bolstered by stronger-than-expected UK consumer inflation figures for May. This makes it prudent to wait for strong follow-through selling before confirming that the GBP/USD pair's recent bounce from the 1.2300 mark, or a two-and-half-month low touched last week has run its course. Nevertheless, spot prices remain on track to register strong weekly gains and snap a three-week losing streak.
Technical levels to watch
Economists at Commerzbank discuss Fed policy outlook after the latest Nonfarm Payrolls report.
A mixed picture
The US employment report for May shows a mixed picture. While payrolls surprised with a strong 339 thousand increase, other details point to a slowdown.
Apart from the robust job creation, the data indicate a cooling of the labor market. This allows the Fed to sit tight at the FOMC meeting on 13/14 June and at least pause on rate hikes.
The US central bank can then wait and see how things develop and, if necessary, tighten more at a later date.
- Oil price recovers for the second day after the debt-ceiling bill gets voted through by the US Senate.
- The possibility of OPEC+ announcing more production cuts at its June 4 meeting further supports Oil.
- The breakeven price for the Saudis is $80 a barrel despite Russia downplaying the need for cuts.
Oil price rallies for the second day on Friday as global markets breathe a sigh of relief after the US Senate votes through the debt-ceiling extension bill, vaulting the final hurdle prior to implementation. Increasing expectations that the US Federal Reserve (Fed) will pause on hiking rates at the next Fed meeting in mid-June caps the US Dollar’s progress, further helping Oil, which is priced in USD.
Oil news and market movers
- Oil recovers for the second consecutive day after the debt-ceiling extension deal gets passed by the US Senate and lands on the President’s desk for sign off.
- The bill means the US debt limit will be raised and averting a US default, which would have led to market mayhem, potentially causing a slowdown in the global economy.
- The possibility that the Federal Reserve (Fed) will pause hiking interest rates at their June 14 meeting is a headwind for the US Dollar and a backdraft for Oil price.
- On Wednesday Fed’s Philip Jefferson said he thought a pause before more hikes later might allow the economy time to digest current tightening and avoid bank stress.
- Jefferson’s view of ‘pausing’ in June was echoed by Philadelphia Fed President Patrick Harker.
- Cleveland Fed President, Loretta Mester, however, said she saw no “compelling” reason to pause, in an interview with the Financial Times on Wednesday.
- The CME FedWatch Tool, which provides an insight into the market view of the probability of future rate hikes, has flipped from previously showing odds favoring a 0.25% hike in June to an over 75% chance the Fed will leave rates unchanged.
- Two of OPEC+’s largest members, Russia and Saudi Arabia, appear to be clashing over policy ahead of the next OPEC meeting on June 4.
- According to sources in Riyadh, the Saudis are unhappy with the way Russia is allegedly flaunting quotas agreed at the October meeting, a report on Oilprice.com says.
- Although there is no official data available on Russian production, shipping data appears to corroborate the allegation they may have increased their Oil exports despite the OPEC+ limits agreed.
- Last week, representatives of the two countries gave conflicting messages about the likely trajectory of the up-and-coming OPEC+ meeting.
- The Saudis are likely to continue to apply pressure for OPEC+ to cut production given analysts estimate its breakeven level is $80 per barrel, which is still above the current low price levels.
Crude Oil Technical Analysis: Price recovers from 200-week SMA, still in downtrend
WTI Oil price is still broadly speaking in a longer-term downtrend that started in July 2022. Given the old saying that the trend is your friend, this favors short sellers over longs.
WTI Oil is trading below all the major daily and weekly Simple Moving Averages (SMAs) except the 200-week SMA at $66.90. On Wednesday it found support at this MA and began its recovery.
-638213066824046023.png)
WTI US Oil: Weekly Chart
A bullish hammer candlestick is in the process of forming on the weekly chart but until the week is over it is impossible to say if it will fix. Even if it does, it would have to be followed by a bullish green bar next week to confirm the reversal.
Given the downtrend remains intact more downside is still possible, however, it would require a break below the year-to-date lows at $64.31 to confirm more downside.
Such a break could lead to the next target at around $62.00, where trough lows from 2021 will come into play, followed by support at $57.50.
-638213067329248157.png)
WTI US Oil: Daily Chart
Oil price needs to climb back above the $74.70 May 24 highs to raise significant doubts about the dominance of the bear trend.
Such a break might lead to a potential target in the $79.70s, which roughly coincides with the 200-day SMA and the main trendline for the bear market, heightening its importance as a key resistance level.
The long hammer Japanese candlestick pattern that formed at the May 4 (and YTD) lows is a sign that Oil price may have formed a strategic bottom at that level and raises the suspicion the bear trend may be reaching a conclusion.
WTI Oil FAQs
What is WTI Oil?
WTI Oil is a type of Crude Oil sold on international markets. The WTI stands for West Texas Intermediate, one of three major types including Brent and Dubai Crude. WTI is also referred to as “light” and “sweet” because of its relatively low gravity and sulfur content respectively. It is considered a high quality Oil that is easily refined. It is sourced in the United States and distributed via the Cushing hub, which is considered “The Pipeline Crossroads of the World”. It is a benchmark for the Oil market and WTI price is frequently quoted in the media.
What factors drive the price of WTI Oil?
Like all assets, supply and demand are the key drivers of WTI Oil price. As such, global growth can be a driver of increased demand and vice versa for weak global growth. Political instability, wars, and sanctions can disrupt supply and impact prices. The decisions of OPEC, a group of major Oil-producing countries, is another key driver of price. The value of the US Dollar influences the price of WTI Crude Oil, since Oil is predominantly traded in US Dollars, thus a weaker US Dollar can make Oil more affordable and vice versa.
How does inventory data impact the price of WTI Oil
The weekly Oil inventory reports published by the American Petroleum Institute (API) and the Energy Information Agency (EIA) impact the price of WTI Oil. Changes in inventories reflect fluctuating supply and demand. If the data shows a drop in inventories it can indicate increased demand, pushing up Oil price. Higher inventories can reflect increased supply, pushing down prices. API’s report is published every Tuesday and EIA’s the day after. Their results are usually similar, falling within 1% of each other 75% of the time. The EIA data is considered more reliable, since it is a government agency.
How does OPEC influence the price of WTI Oil?
OPEC (Organization of the Petroleum Exporting Countries) is a group of 13 Oil-producing nations who collectively decide production quotas for member countries at twice-yearly meetings. Their decisions often impact WTI Oil prices. When OPEC decides to lower quotas, it can tighten supply, pushing up Oil prices. When OPEC increases production, it has the opposite effect. OPEC+ refers to an expanded group that includes ten extra non-OPEC members, the most notable of which is Russia.
- USD/JPY struggles to capitalize on its modest intraday gains and hands near a one-week low.
- The mixed NFP report reaffirms an imminent Fed rate hike pause and continues to cap the USD.
- The risk-on impulse undermines the safe-haven JPY and is seen lending some support to the pair.
The USD/JPY pair jumps to a fresh daily high, around the 139.45 region, during the early North American session, albeit meets with a fresh supply at higher levels. Spot prices quickly retreat to the lower end of the daily range and currently trade just above the 139.00 mark following the release of the mixed US monthly jobs data.
The US Dollar (USD) did get a minor boost in reaction to the upbeat headline NFP print, showing that the US economy added 339K new jobs in May. The reading consensus estimates pointing to an addition of 190K jobs and well above the previous month’s upwardly 294K, which, in turn, benefits the Greenback and provides a modest lift to the USD/JPY pair.
Further details of the report, however, revealed that the Unemployment Rate shot to 3.7%, missing expectations for a modest uptick to 3.5% from 3.4%. Moreover, Average Hourly Earnings also fall short of estimates, reaffirming market expectations that the Federal Reserve (Fed) will likely skip an interest rate hike in June. This, in turn, caps the buck and the USD/JPY pair.
The downside, meanwhile, remains cushioned, at least for the time being, amid a more dovish stance adopted by the Bank of Japan (BoJ). This, along with the risk-on impulse, as depicted by a generally positive tone around the equity markets, undermines the safe-haven Japanese Yen (JPY) and acts as a tailwind for the USD/JPY pair, warranting some caution for bearish traders.
Nevertheless, spot prices, for now, seem to have stalled this week's retracement slide from the 141.00 neighbourhood, or the YTD low, though remain on track to register losses for the first time in the previous four weeks.
Technical levels to watch
- US Nonfarm Payrolls rose by 339K in May, exceeding expectations of 190K.
- The Unemployment Rate increased more than expected from 3.4% to 3.7%.
- US Dollar gained momentum, US yields moved higher, and Gold printed fresh daily lows.
Gold prices dropped from the $1,980 area to $1,971 following the release of the US official employment report, which showed an increase in Nonfarm Payrolls above expectations.
The US economy created 339K jobs in May, exceeding the market consensus of 190K, marking the highest reading in four months. Additionally, April’s figures were revised higher from 253K to 294K. The unemployment rate rose from 3.4% to 3.7%, with the Labor Force Participation holding steady at 62.6%.
The US Dollar initially rose across the board, hitting fresh highs versus the EUR, GBP, and JPY, and trimmed losses against the CAD, NZD, and AUD. However, the Dollar's momentum started to fade.
US yields spiked but then pulled back as markets analyze whether the job numbers were strong enough to pressure the Federal Reserve for another rate hike. The increase in Treasury yields weighed on Gold, causing it to tumble to $1,971. Currently, the yellow metal trades at $1,975 in a volatile environment post-NFP.
On the upside, Gold faces strong resistance around the $1,980/85 area. A break higher could drive prices towards $2,000. Conversely, a slide under $1,970 would weaken the outlook, with the next support standing at $1,960.
Technical levels
- EUR/USD now reverses initial gains and revisits 1.0980.
- US Non-farm Payrolls surprised to the upside in May.
- The unemployment rate edged higher to 3.7%.
EUR/USD now returns to the negative territory on the back of the post-Payrolls bout of strength in the greenback on Friday.
EUR/USD: Daily upside capped near 1.0780
EUR/USD picks up extra selling pressure after the release of the Nonfarm Payrolls showed the US economy added 339K jobs during May, surpassing initial expectations for a gain of 190K jobs. In addition, the April reading was revised up to 294K (from 253K).
Further data saw the Unemployment Rate ticking higher to 3.7% and the key Average Hourly Earnings – a proxy for inflation via wages – rise 0.3% MoM and 4.3% from a year earlier. Additionally, the Participation Rate held steady at 62.6%.
What to look for around EUR
EUR/USD attempts to consolidate the recent breakout of the 1.0700 barrier following the resumption of the selling pressure in the greenback.
In the meantime, the pair’s price action is expected to closely mirror the behaviour of the US Dollar and will likely be impacted by any differences in approach between the Fed and the ECB with regards to their plans for adjusting interest rates.
Moving forward, hawkish ECB speak continues to favour further rate hikes, although this view appears to be in contrast to some loss of momentum in economic fundamentals in the region.
Eminent issues on the back boiler: Continuation of the ECB hiking cycle in June and July (and September?). Impact of the Russia-Ukraine war on the growth prospects and inflation outlook in the region. Risks of inflation becoming entrenched.
EUR/USD levels to watch
So far, the pair is losing 0.03% at 1.0758 and faces initial contention at 1.0635 (monthly low May 31) seconded by 1.0516 (low March 15) and finally 1.0481 (2023 low January 6). On the upside, the break above 1.0779 (weekly high June 2) would target 1.0812 (100-day SMA) en route to 1.0886 (55-day SMA).
Gold has stabilized above the 100-Day Moving Average, reasserting its outperformance trend. Strategists at Credit Suisse analyze the yellow metal technical picture.
A break below $1,938 would open up a move back to $1,893
Gold has stabilized over the past week after the hold above the 100-DMA at $1,938. Although this is not an average we typically track, it did floor the market during the February setback earlier this year.
We still expect pivotal resistance at the $2,063/75 record highs posted in 2020 and 2022 will prove a tough barrier given the tiring short-term momentum picture, with a triple bearish momentum divergence still in place. This suggests further rangebound price action is the most likely outcome for the now. Post this phase, we believe the market will eventually move to new record highs.
Above $2,075 on a weekly closing basis would be seen to mark a significant break higher, opening up a move to our next core upside objective at $2,330/2,360. In contrast, a break below $1,938 would open up a move back to $1,893.
Economists at Wells Fargo expect the Yen to be a key beneficiary from US Dollar weakness.
Japanese Yen strength later this year
Against a backdrop of aggressive global monetary tightening, the Yen has underperformed so far in 2023. However, our expectation for the Bank of Japan to adjust its policy settings in Q4-2023 to further normalize the government bond market leads us to believe the Japanese currency has scope to outperform later this year.
Yen strength should also be supported by the end of global central bank tightening cycles and a transition toward global easing, as well as a US recession in the second half of 2023.
We target a USD/JPY exchange rate 136.00 by end 2023, and 129.00 by late 2024.
- EUR/USD clings to the positive territory near 1.0770 on Friday.
- Extra upside impulse should challenge the 1.0800 barrier.
EUR/USD trades in a cautious note near 1.0760/70 ahead of the key release of US Nonfarm Payrolls.
Despite Thursday’s rebound, the pair remains under pressure. Against that, the breach of the May low at 1.0635 (May 31) could pave the way to a drop to 1.0600 prior to the March low at 1.0516 (March 15). On the upside, the breakout of 1.0800 the figure could rapidly see the 100-day SMA at 1.0811 revisited ahead of the 55-day SMA at 1.0886.
A deeper pullback to the 2023 low at 1.0496 (January 6) would likely need a sharp deterioration of the outlook, which appears not favoured for the time being.
Looking at the longer run, the constructive view remains unchanged while above the 200-day SMA, today at 1.0500.
EUR/USD daily chart
Economists at Commerzbank analyze the Brazilian Real outlook.
Strong growth supports the Brazilian Real
With a plus of 1.9% QoQ the Brazilian economy grew much more significantly at the start of the year than expected (consensus: +1.2%). This was mainly due to the strong agricultural sector.
We assume that the BCB is likely to remain cautious regarding rate cuts following yesterday’s data, and we therefore continue to expect that for the time being the Real will be able to defend current strong levels vs. the US Dollar.
Economists at Rabobank discuss AUD/USD outlook.
Scope for AUD/USD to reach 0.70 next year
While the expectation of further policy tightening should lend the AUD support, on the downside concerns over the sluggish recovery in China and the drop in iron ore prices from their March highs will dampen the outlook for the AUD.
Given our view that the USD will continue to garner support as the market prices out Fed rate hikes this year, we expect that AUD/USD will struggle to move beyond 0.67 on a three-month view.
We see scope for AUD/USD to reach 0.70 next year as the Fed prepares to reduce interest rates and risk appetite increases.
After dropping some nineteen percent from its mid-April high, Oil surged over three percent alongside the equity markets. Nonetheless, economists at TD Securities do not expect the rally to endure.
Rally hard to sustain
WTI jumped north of $70, with Brent nearing $75 after straddling the lows found back in mid-March.
The impressive rally is very likely the result of traders covering their short exposure and rebuilding their long bets, after recent aggressive moves to the short end of exposure. This suggests that the rally may be fragile and lose momentum.
- DXY keeps the bearish note unchanged in the 103.50/40 region.
- Further decline could extend to the 100-day SMA near 102.90.
DXY accelerates the decline south of the 104.00 barrier and records new multi-session lows near 103.40 on Friday.
Considering the current price action, extra pullbacks should not be ruled out. That said, the continuation of the decline could face the next support at the 100-day SMA at 103.91 ahead of another the interim 55-day SMA at 102.41.
A deeper drop to the May lows near 101.00 is not favoured for the time being.
Looking at the broader picture, while below the 200-day SMA at 105.57, the outlook for the index is expected to remain negative.
DXY daily chart
- EUR/JPY adds to recent gains and approaches 150.00.
- The continuation of the upside could revisit the 151.00 area.
EUR/JPY extends the recovery following Thursday’s advance and trades closer to the key 150.00 yardstick on Friday.
Further recovery appears a plausible near-term scenario, and a convincing breakout of the round level at 151.00 could encourage the cross to confront the 2023 top at 151.61 (May 2) in the not-so-distant future.
So far, further upside looks favoured while the cross trades above the 200-day SMA, today at 143.95.
EUR/JPY daily chart
- US Dollar struggles to stage a rebound following Thursday's selloff.
- US Dollar Index stays below 104.00 and looks to snap a three-week winning streak.
- US May jobs data could impact US Dollar's valuation ahead of the weekend.
The US Dollar (USD) is having a hard time staying resilient against its rivals on the last trading day of the week. The US Dollar Index, which tracks the USD's valuation against a basket of six major currencies, stays in negative territory below 104.00 after having lost more than 0.5% on Thursday.
May jobs report from the United States (US) will be watched closely by market participants due to its potential impact on the market pricing of the US Federal Reserve's (Fed) next policy decision.
Daily digest market movers: US Dollar continues to lose value against its peers
- Nonfarm Payrolls (NFP) in the US are expected to rise 190,000 in May. The Unemployment Rate is forecast to rise slightly to 3.5% from 3.4%.
- The economic activity in the US manufacturing sector continued to contract at an accelerating pace in May with the ISM Manufacturing PMI dropping to 46.9 from 47.1 in April. This reading came in worse than the market expectation of 47. More importantly, the inflation component of the PMI survey, Prices Paid Index, fell sharply to 44.2 from 53.2, compared to analysts' estimate of 52.
- The data published by Automatic Data Processing (ADP) showed on Thursday that private sector employment in the US rose by 278,000 in May. This reading surpassed the market expectation of 170,000 by a wide margin. Underlying details of the publication revealed that the annual wage inflation for 'job stayers' declined to 6.5% from 6.7% in April.
- The US Bureau of Labor Statistics revised the change in Unit Labor Costs for the first quarter lower to 4.2% from 6.3% in the advanced estimate.
- Other data from the US revealed that there were 232,000 initial claims for unemployment benefits in the week ending May 27, compared to 230,000 in the previous week.
- Philadelphia Fed President Patrick Harker noted on Wednesday and Thursday that he was leaning toward a pause in rate hikes in June but noted that incoming data may change his mind.
- Federal Reserve Governor Philip Jefferson said that pausing rate hikes at the next FOMC meeting would offer time to analyse more data before making a decision about the extent of additional tightening.
- According to the CME Group FedWatch Tool, the probability of one more 25 basis points (bps) Fed rate hike at the upcoming meeting declined below 30% from nearly 70% earlier in the week.
- The House of Representatives passed a bill to suspend the debt limit through January 1, 2025. US stock index futures trade modestly higher on Thursday.
- The US Bureau of Labor Statistics reported on Wednesday that the number of job openings on the last business day of April stood at 10.1 million, compared to 9.74 million in March. This reading came in higher than the market expectation of 9.37 million and provided a short-lasting boost to the USD.
- In an interview with the Financial Times, Cleveland Federal Reserve (Fed) Bank President Loretta Mester said that she doesn't necessarily see a compelling reason for pausing rate increases amid a "really embedded, stubborn inflationary pressure.”
- Consumer sentiment in the US weakened slightly in May with the Conference Board's (CB) Consumer Confidence Index edging lower to 102.3 from 103.7 in April (revised from 101.3). The Present Situation Index declined to 148.6 from 151.8 and the Consumer Expectations Index stayed virtually unchanged at 71.5. Finally, the one-year consumer inflation expectations ticked down to 6.1% in May from 6.2% in April.
Technical analysis: US Dollar Index stays below key technical level
The US Dollar Index (DXY) broke below 104.00 on Thursday, where the Fibonacci 23.6% retracement of the November-February downtrend is located. On the downside, 103.00 (100-day SMA) aligns as critical support. A weekly close below that level could bring in additional sellers and open the door for an extended decline toward 102.40 (50-day SMA) and 102.00 (psychological level). where the 100-day Simple Moving Average (SMA) and the 20-day SMA meet.
On the flip side, DXY could gather bullish momentum and rise toward 104.50 (static level) and 105.00 (psychological level) if it manages to rise above 104.00 and use that level as support.
How does Fed’s policy impact US Dollar?
The US Federal Reserve (Fed) has two mandates: maximum employment and price stability. The Fed uses interest rates as the primary tool to reach its goals but has to find the right balance. If the Fed is concerned about inflation, it tightens its policy by raising the interest rate to increase the cost of borrowing and encourage saving. In that scenario, the US Dollar (USD) is likely to gain value due to decreasing money supply. On the other hand, the Fed could decide to loosen its policy via rate cuts if it’s concerned about a rising unemployment rate due to a slowdown in economic activity. Lower interest rates are likely to lead to a growth in investment and allow companies to hire more people. In that case, the USD is expected to lose value.
The Fed also uses quantitative tightening (QT) or quantitative easing (QE) to adjust the size of its balance sheet and steer the economy in the desired direction. QE refers to the Fed buying assets, such as government bonds, in the open market to spur growth and QT is exactly the opposite. QE is widely seen as a USD-negative central bank policy action and vice versa.
- Gold price climbs to over a one-week high on Friday and is supported by a weaker US Dollar.
- Diminishing odds for another Federal Reserve rate hike in June continue to weigh on the buck.
- The upbeat market mood caps gains for the safe-haven XAU/USD ahead of the US NFP report.
Gold price builds on this week's goodish rebound from the $1,932 area, or its lowest level since March 17 and gains some follow-through traction for the fourth successive day. The XAU/USD sticks to its positive tone through the first half of the European session and currently trades around the $1,980 region, just below a one-and-half-week high touched earlier today.
Weaker US Dollar lends some support to Gold price
The US Dollar (USD) remains under some selling pressure on the last day of the week and retreats further from a two-and-half-month high touched on Wednesday amid hopes for a pause in the Federal Reserve’s (Fed) rate-hiking cycle. In fact, comments by a slew of influential Fed officials this week forced investors to scale back their expectations for another 25 basis points (bps) lift-off at the next Federal Open Market Committee (FOMC) on June 13-14. This has been a key factor behind the recent sharp decline in the United States (US) government bond yields, which continues to weigh on the Greenback and is seen benefitting the US Dollar-denominated Gold price.
A positive risk tone acts as a headwind for the XAU/USD
The upside for the XAU/USD, however, remains capped, at least for the time being, amid a generally positive tone around the equity markets, which tends to dent demand for traditional safe-haven assets. A slightly better-than-expected private survey on Thursday, showing that China's manufacturing sector unexpectedly registered modest growth in May, raised hopes for hopes of a recovery in the world's second-largest economy. The passage of bipartisan legislation to lift the government's $31.4 trillion debt ceiling and avert an unprecedented American default boosts investors' confidence. This, in turn, is acting as a headwind for the safe-haven Gold price.
Focus remains glued to US monthly jobs report (NFP)
Traders also seem reluctant to place aggressive bets and prefer to wait for the release of the US monthly employment details, due later during the early North American session. The popularly known Nonfarm-Payrolls (NFP) report will influence market expectations about the Fed's next policy move, which will drive the USD demand in the near term and provide some meaningful impetus to the non-yielding Gold price. Nevertheless, the XAU/USD remains on track to register its biggest weekly gain in nearly two months and snap a three-week losing streak.
Gold price technical outlook
From a technical perspective, some follow-through buying beyond the $1,985-$1,986 region should pave the way for additional gains and allow Gold price to reclaim the $2,000 psychological mark. The momentum could get extended towards the next relevant hurdle near the $2,008-$2,010 area, above which the XAU/USD could climb further towards the $2,035-$2,037 resistance zone.
On the flip side, the $1.970 static support could protect the immediate downside ahead of the $1,954-$1,952 region and the 100-day Simple Moving Average (SMA), currently pegged near the $1,940-$1,939 area. This is followed by the multi-month low, around the $1,932 zone, which if broken will be seen as a fresh trigger for bears and make the Gold price vulnerable to weaken further towards the $1,900 mark.
Key levels to watch
Analysts at Credit Suisse discuss US Dollar Index (DXY) technical outlook.
Looking for an eventual test of key resistance at 105.68/106.13
DXY continues to appreciate steadily following the completion of a near-term base above the 55-DMA and April high, itself on the back of the repeated successful defence of its 100.82 YTD January low. We are now also seeing a range of breaks of major levels across a range of USD crosses and with daily and weekly momentum positive we maintain our view the potential for a broad and large ‘double bottom’ continues to increase markedly.
We continue to look for strength back to the March highs, 200-DMA and 38.2% retracement of the 2022/2023 fall at 105.63/106.13. Above here though stays seen needed to see a ‘double bottom’ reversal confirmed to open the door to a more sustained and material phase of USD strength with next resistance seen at 107.78/99.
Support is seen at 103.88 initially, beneath which can see a pullback to the 13-day exponential average at 103.25. With price support seen not far below at 102.96 we would though look for a good floor here.
EUR/USD managed to rebound yesterday. Economists at MUFG Bank discuss the pair’s outlook.
ECB minutes point to two more hikes
The minutes (known as the accounts) from the ECB meeting on 4th May were released yesterday and again the take-away here also reinforces the prospect of at least two more rate hikes by the ECB.
ECB President Lagarde stated yesterday that there was ‘no clear evidence’ that underlying inflation had peaked. Expect that rhetoric to be repeated when President Lagarde speaks in the policy press conference on 14th June after a likely hike of 25 bps.
The ECB minutes, the comments from Lagarde and the fact that services inflation could well drift higher over the summer on tourism-related inflationary pressures, we see limited scope for lower yields at the front-end in the Eurozone which will provide EUR with support at these lower levels.
Economists at MUFG Bank discuss how the US Nonfarm Payrolls report could impact the greenback.
Fed will pause this month
We maintain our view that the Fed will pause this month and that the tightening cycle is likely over.
A consensus print today will likely remove the lingering pricing for a rate hike this month (OIS implies about 7bps) and propel the Dollar further weaker into the weekend. That could mean the 100-DMA for DXY (102.91) comes into play and is tested this afternoon.
See – Nonfarm Payrolls Preview: Banks expect labor market to lose momentum only slowly
- GBP/USD touches a nearly three-week high and draws support from sustained USD selling.
- Diminishing odds for another Fed rate hike in June and a positive risk tone weigh on the buck.
- Speculations for further tightening by the BoE remain support ahead of the US NFP report.
The GBP/USD pair enters a bullish consolidation phase near a two-and-half-week high touched on Friday and oscillates in a narrow band, around the 1.2530-1.2535 region through the first half of the European session.
The US Dollar (USD) extends the overnight sharp retracement slide from the vicinity of its highest level since mid-March set on Wednesday and remains depressed for the second successive day, which, in turn, acts as a tailwind for the GBP/USD pair. A slew of influential Federal Reserve (Fed) officials this week backed the case for skipping an interest rate hike and forced investors to scale back their expectations for another 25 bps lift-off in June. This, along with a positive risk tone, weighs on the safe-haven buck.
A slightly better-than-expected private survey on Thursday, showing that China's manufacturing sector unexpectedly registered modest growth in May, raised hopes for hopes of a recovery in the world's second-largest economy. Adding to this, the passage of bipartisan legislation to lift the government's $31.4 trillion debt ceiling and avert an unprecedented American default boosts investors' confidence. This, along with expectations that the Bank of England (BoE) could raise rates further, lends support to the GBP/USD pair.
Bullish traders, however, seem reluctant to place aggressive bets and prefer to wait for fresh cues from Friday's release of the closely-watched US monthly employment details. The popularly known NFP report is due for release later during the early North American session and will influence market expectations about the Fed's next policy move. This, in turn, will drive the USD demand and provide a fresh impetus to the GBP/USD pair. Nevertheless, spot prices remain on track to snap a three-week losing streak.
Technical levels to watch
European Central Bank (ECB) Governing Council member, Gabriel Makhlouf, said on Friday that they are “likely to see another rate increase at the next meeting.“
Additional comments
Fall in Eurozone inflation very welcome, not definitive with underlying pressures quite strong.
Likely to see another rate increase at next meeting.
Have not reached the moment where we can say let's now stop.
Picture a lot less clear beyond probably rate increases in June and July.
Related reads
- ECB’s Vasle: More rate hikes needed to get inflation to 2% target
- EUR/USD appears cautious near 1.0780 ahead of US NFP
Economists at Rabobank analyze USD/CAD outlook.
The 1.35 magnet
USD/CAD remains in a technical bull trend that began in the middle of 2022. Momentum has stalled since Q4, with the pair trading sideways in a 1.3280 to 1.3880 range, but without a close below 1.3260, that bull trend remains in place, and we do not expect to see USD/CAD trade through that level.
In the coming months, we expect USD/CAD to continue trading around 1.35 with the majority of price action taking place within the 1.34-1.36 range. We remain of the view that a break to the upside is likely by year-end, although we don’t expect an extension beyond the 1.3880 topside of the broader range.
- AUD/USD scales higher for the second straight day and jumps to a nearly two-week high.
- Reduced bets for another 25 bps Fed rate hike in June continue to weigh on the Greenback.
- A positive risk tone further benefits the risk-sensitive Aussie ahead of the key US NFP report.
The AUD/USD pair builds on this week's recovery from its lowest level since November 2022 and gains strong follow-through traction for the second successive day on Friday. The momentum remains uninterrupted through the first half of the European session and lifts spot prices to a nearly two-week high, around the 0.6625-0.6630 region in the last hour.
The US Dollar (USD) adds to the overnight heavy losses and remains depressed on the last day of the week, which, in turn, is seen as a key factor pushing the AUD/USD pair higher. The recent comments by a slew of influential Federal Reserve (Fed) officials forced investors to scale back their expectations for another 25 bps lift-off in June. This, along with a generally positive risk tone, drags the safe-haven buck to over a one-week low and benefits the risk-sensitive Aussie.
A private survey showed on Thursday that China’s manufacturing sector unexpectedly registered modest growth in May. Furthermore, the passage of bipartisan legislation to lift the government's $31.4 trillion debt ceiling and avert an unprecedented American default boosts investors' confidence. Apart from this, speculations that the Reserve Bank of Australia (RBA) could tighten its monetary policy support prospects for a further appreciating move for the AUD/USD pair.
That said, the Relative Strength Index (RSI) on the 1-hour chart is already flashing overbought conditions and acting as a headwind for spot prices. Traders might also refrain from placing aggressive bets and prefer to move to the sidelines ahead of the release of the US monthly employment details, due later during the early North American session. The popularly known NFP report will play a key role in driving the USD demand and provide some meaningful impetus to the AUD/USD pair.
Technical levels to watch
Economists at ING discuss USD outlook ahead of US NFP job data.
Dollar bias looks lower unless NFP comes in strong
We would say that an on-consensus +195K increase in jobs, a 3.5% unemployment rate and a 0.3% MoM increase in hourly earnings would not be enough to shift the needle from the view that the Fed pauses in June and the Dollar can stay gently offered.
High dollar deposit rates will stop the Dollar from selling off too quickly, but unless the May NFP surprises on the upside we would say today's DXY bias lies towards the 103.20 area.
See – Nonfarm Payrolls Preview: Banks expect labor market to lose momentum only slowly
European Central Bank (ECB) policymaker, Boštjan Vasle, said on Friday, “more rate hikes needed to get inflation to the 2% target.”
Vasle added, “core inflation remains high and persistent.”
Market reaction
At the time of writing, EUR/USD is keeping its upside intact at around 1.0775, up 0.11% on the day.
- EUR/USD looks to extend Thursday’s sharp uptick well past 1.0700.
- Improved sentiment in the risk complex bolsters the pair so far.
- The US economy is expected to have added nearly 200K jobs in May.
EUR/USD trims part of the earlier advance to multi-day highs near 1.0780 as a more cautious tone emerges ahead of the release of the US jobs report.
EUR/USD: Next on the upside comes the 100-day SMA
EUR/USD so far maintains the bid bias amidst a mildly offered tone in the greenback and a persistent appetite for the risk-associated universe at the end of the week.
In addition, the risk-on mood derives extra support after the US Senate passed the debt ceiling bill late on Thursday. The legislation is now on its way to the White House, where President Joe Biden will sign it into law. This action prevents the occurrence of an unprecedented default, as the Treasury Department had cautioned that it would be incapable of meeting all financial obligations on June 5 if Congress did not take action before that date.
Still contributing to the upside bias in spot is the persevering hawkish narrative from ECB President Lagarde and many of her colleagues at the Council, who insisted that inflation remains elevated and that further tightening remains well on the cards for the next couple of months. On this, investors continue to pencil in a quarter-point rate raise at both the June and July meetings, leaving the door open to a similar move in September.
Second-tier releases in the domestic docket saw Industrial Production in France expand more than estimated by 0.8% MoM in April.
Later in the NA session, the release of US Nonfarm Payrolls and the Unemployment Rate will grab all the attention.
What to look for around EUR
EUR/USD reclaims the area well north of the 1.0700 barrier, although the recent sharp rebound is expected to be put to the test in light of the release of crucial US data.
In the meantime, the pair’s price action is expected to closely mirror the behaviour of the US Dollar and will likely be impacted by any differences in approach between the Fed and the ECB with regards to their plans for adjusting interest rates.
Moving forward, hawkish ECB speak continues to favour further rate hikes, although this view appears to be in contrast to some loss of momentum in economic fundamentals in the region.
Key events in the euro area this week: Germany Retail Sales/Final Manufacturing PMI, EMU Final Manufacturing PMI, Flash Inflation Rate, ECB Lagarde, ECB Accounts (Thursday).
Eminent issues on the back boiler: Continuation of the ECB hiking cycle in June and July (and September?). Impact of the Russia-Ukraine war on the growth prospects and inflation outlook in the region. Risks of inflation becoming entrenched.
EUR/USD levels to watch
So far, the pair is gaining 0.09% at 1.0771 and a break above 1.0779 (weekly high June 2) would target 1.0812 (100-day SMA) en route to 1.0886 (55-day SMA). On the downside, initial contention comes at 1.0635 (monthly low May 31) seconded by 1.0516 (low March 15) and finally 1.0481 (2023 low January 6).
Economists at Société Générale analyze USD/JPY technical outlook.
High achieved earlier this week near 141 likely to be a short-term resistance
USD/JPY hit the upper limit of a multi month channel at 141 resulting in an initial pullback. Next potential support is located at the graphical levels of 138/137.20 which is also the 200-DMA.
It is worth noting that the 138/137.20 region had acted as a hurdle since December and is expected to be an intermittent support. Only a break below would denote possibility of a deeper decline. Test of this zone could result in a bounce; the high achieved earlier this week near 141 is likely to be a short-term resistance.
- USD/CAD continues losing ground for the third straight day and drops to a nearly three-week low.
- A further recovery in Oil prices underpins the Loonie and exerts pressure amid a weaker Greenback.
- Reduced bets for another 25 bps Fed rate hike in June weigh on the USD ahead of the NFP report.
The USD/CAD pair drifts lower for the third successive day on Friday - also marking the fifth day of a negative move in the previous six - and drops to a two-and-half-week low during the early part of the European session. The pair currently trades around the 1.3420-1.3415 region, down over 0.20% for the day, and is pressured by a combination of factors.
Crude Oil prices add to the overnight strong recovery gains and rally another 1% on the last day of the week, which, in turn, is seen underpinning the commodity-linked Loonie. The US Dollar (USD), on the other hand, remains depressed amid expectations that the Federal Reserve (Fed) will likely skip an interest rate hike at its meeting later this month and further contributes to the offered tone surrounding the USD/CAD pair.
In fact, Philadelphia Fed President Patrick Harker reiterated on Thursday that it’s time to at least hit the stop button for one meeting and see how it goes. This, along with the recent comments by several influential FOMC officials, forced investors to scale back their bets for another 25 bps lift-off in June. This led to a further decline in the US Treasury bond yields on Thursday and continues to weigh on the Greenback.
Furthermore, the passage of legislation to lift the US government's $31.4 trillion debt ceiling and avert an unprecedented American default boosts investors' confidence. The optimism remains supportive of a generally positive risk tone around the equity markets and turns out to be another factor weighing on the safe-haven Greenback. This, in turn, supports prospects for a further intraday downfall for the USD/CAD pair.
Traders, however, might refrain from placing aggressive bets and prefer to wait on the sidelines ahead of the release of the closely-watched US monthly employment details, due later during the early North American session. The popularly known NFP report will play a key role in driving the USD demand, which, along with Oil price dynamics, should allow traders to grab short-term opportunities around the USD/CAD pair.
Technical levels to watch
Copper maintains the break of its 200-Day Moving Average, which keeps analysts at Credit Suisse biased lower.
Resistance moves to the broken lows and 200-DMA at $8,370/8,44
Copper (LME) has stabilized this week but maintains its recent break below its 200-DMA and key range lows at $8,442/8368, with medium-term weekly MACD momentum also recently crossing into negative territory. Furthermore, the market also recently posted a clear weekly close below the key uptrend from 2020, which we viewed as a major breakdown.
We stay biased towards a trending phase to the downside despite the recent stabilization. With this in mind, we see the next support levels at $7,850, then $7,220 and finally the 2022 low and major retracement support at $6,955/6,844, which could prove a tough barrier.
Resistance moves to the broken lows and 200-DMA at $8,370/8,442, which we look to cap the market to keep the risks biased directly lower.
Economists at Commerzbank discuss ECB policy outlook and its implications for the EUR/USD pair.
The resistance towards further rate hikes will increase
A further rate hike at the upcoming June meeting is likely to be expected. However, comments by board member Francois Villeroy that the remaining interest rate hikes will be marginal confirm the view of our ECB watchers that in the period after the next hike the resistance towards further rate hikes will increase.
ECB monetary policy is not going to provide any further upside potential for the Euro.
A return to higher EUR/USD levels would have to be driven by a more cautious outlook for Fed interest rates.
See: ECB unlikely to raise interest rates further after the expected 25 bps hike in June – Commerzbank
USD/JPY has reversed from a high near 141. Economists at ING analyze the pair’s outlook.
Turnaround from 140?
We have noted that the current environment should continue to see interest in carry trade strategies – where the Japanese Yen scores poorly. However, USD/JPY looks overvalued relative to the terms of trade story – which is much better for the Yen than a year ago.
In addition, there is still the risk that the Bank of Japan surprises on 16 June by further normalising its Yield Curve Control policy. That would be a Yen positive. And thus it would not be a surprise to see speculator investors trying to re-position short USD/JPY above 140 – even if such a strategy has already proved painful this year.
- Silver climbs to a two-week high on Friday, albeit struggles to capitalize on the move.
- Bulls now await a sustained move beyond the $24.00 mark before placing fresh bets.
- Weakness below the 100-day SMA is needed to negate the near-term positive outlook.
Silver builds on its recent goodish rebound from sub-$23.00 levels and climbs to a two-week high on Friday, albeit struggles to capitalize on the modest intraday uptick. The white metal pulls back from the vicinity of the $24.00 mark, representing the 38.2% Fibonacci retracement level of the downfall in May, and trades with a mild positive bias during the early European session.
From a technical perspective, this week's sustained move beyond the 100-day Simple Moving Average (SMA) and the overnight break through the 23.6% Fibo. level favours bullish traders. Moreover, oscillators on the daily chart have recovered from the negative territory, though are yet to confirm a positive outlook. This makes it prudent to wait for some follow-through buying beyond the $24.00 mark before positioning for an extension of the recent bounce from over a two-month low touched last week.
The XAG/USD might then accelerate the momentum towards the next relevant hurdle near the $24.20-$24.25 region en route to the $24.40-$24.50 horizontal support breakpoint. The latter coincides with the 50% Fibo. level, above which a fresh bout of a short-covering should allow bullish traders to reclaim the $25.00 psychological mark. The upward trajectory could get extended towards the $25.30-$25.35 supply zone before the commodity eventually makes a fresh attempt to conquer the $26.00 mark.
On the flip side, any meaningful pullback now seems to attract fresh buyers near the mid-$23.00s, or the 23.6% Fibo. level. This should help limit the downside for the XAG/USD near the 100-day SMA, currently pegged around the $23..35 area. That said, a convincing break below will expose the $23.00 mark. This is followed by the May monthly swing low, around the $22.70-$22.65 region, which if broken decisively will negate any positive outlook and shift the bias back in favour of bearish traders.
Silver daily chart
Key levels to watch
Economists at TD Securities analyze how the all-important Nonfarm Payrolls could impact the US Dollar.
Upside surprise would likely play into recent USD strength, though with a few caveats
We look for payrolls to stay strong in May following the upside surprise to a robust 253K gain in April. We also expect the unemployment rate to remain steady at 3.4%, as we are assuming job creation in the household survey will be broadly consistent with NFP. Average hourly earnings likely advanced 0.3% MoM, though the y/y measure should have stayed unchanged at a still-elevated 4.4%.
An upside surprise would likely play into recent USD strength, though with a few caveats. The USD rally would also need follow through in subsequent data, like ISM services and inflation. What’s more, the USD has overshot recent Fed repricing, while the USD’s beta to data surprises show market is getting long USDs again. As a result, we see the risk of more downside on a miss than support on a beat.
See – Nonfarm Payrolls Preview: Banks expect labor market to lose momentum only slowly
Economist at UOB Group Lee Sue Ann comments on the upcoming RBA interest rate decision.
Key Quotes
Latest wages and employment data reinforce our view of the RBA holding its cash rate at 3.85% in Jun. There, is however, some risk to our view, and that the RBA may raise the cash rate one more time this year, given that inflation remains well above target in the near term; and that the economy is still moderately resilient.
- The index trades in the lower end of the range near 103.50.
- The US Congress passed the debt ceiling bill on Thursday.
- All the attention will be on the Nonfarm Payrolls later in the session.
The greenback, when gauged by the USD Index (DXY), trades slightly on the defensive around the 103.50 region at the end of the week.
USD Index focused on NFP
The index so far adds to Thursday’s strong pullback and navigates in the area of multi-session lows in the mid-103.00s against the backdrop of persistent appetite for the risk complex ahead of the release of the crucial US jobs report later on Friday.
Contributing to the improved optimism among market participants, the US Senate voted 63-36 in favour of legislation to suspend the US debt ceiling and set spending caps through the 2024 election, bringing an end to a drama that threatened a worldwide financial disaster. The bill now moves to President Biden, who promises to sign it only days before the United States defaults (June 5).
Back at the central banks’ front, the probability of a pause by the Fed at its June 14 gathering now climbs to the boundaries of 80%, according to the FedWatch Tool tracked by CME Group.
In the docket, investors will closely follow the release of the US jobs report for the month of May, when the economy is seen adding 190K jobs and the unemployment rate ticking higher to 3.5%.
What to look for around USD
The index corrects sharply lower and hovers around the 103.50 zone following Thursday’s intense retracement, always on the back of the recent U-turn in expectations of a Fed rate hike later in the month.
In the meantime, bets of another 25 bps at the Fed’s next gathering in June suddenly reversed course in spite of the steady resilience of key US fundamentals (employment and prices, mainly), denting the recent rally in the dollar and favouring a further decline in US yields.
Bolstering a pause by the Fed instead appears to be the extra tightening of credit conditions in response to uncertainty surrounding the US banking sector.
Key events in the US this week: Nonfarm Payrolls, Unemployment Rate (Friday).
Eminent issues on the back boiler: Persistent debate over a soft/hard landing of the US economy. Terminal Interest rate near the peak vs. speculation of rate cuts in late 2023/early 2024. Fed’s pivot. Geopolitical effervescence vs. Russia and China. US-China trade conflict.
USD Index relevant levels
Now, the index is losing 0.08% at 103.48 and faces the next support at the 100-day SMA at 102.91 followed by the 55-day SMA at 102.41 and finally 101.01 (weekly low April 26). On the upside, the breakout of 104.69 (monthly high May 31) would open the door to 105.58 (200-day SMA) and then 105.88 (2023 high March 8).
Economists at ING analyze EUR/USD outlook ahead of the US Nonfarm Payrolls report.
1.05-1.07 area to mark the base in the second quarter
Today's US data will have a big say in determining whether this week's EUR/USD low of 1.0635 was significant.
As we have been saying here over the last few weeks, we have expected the 1.05-1.07 area to mark the base in the second quarter, so let's see whether we get much of a rally from here.
EUR/USD could press the 1.0810/20 area if NFP does not come in too hot, with outside risk to 1.0865.
See – Nonfarm Payrolls Preview: Banks expect labor market to lose momentum only slowly
- NZD/USD climbs to over a one-week high on Friday amid some follow-through USD selling.
- Diminishing odds for another 25 bps Fed rate hike in June continue to weigh on the buck.
- A positive risk tone further benefits the risk-sensitive Kiwi ahead of the key US NFP report.
The NZD/USD pair builds on the previous day's solid recovery from the vicinity of its lowest level since November 2022 and gains strong follow-through traction for the second successive day on Friday. The pair maintains its bid tone through the early European session and currently trades near a one-week high, with bulls now awaiting a sustained move beyond the 0.6100 mark before placing fresh bets.
The US Dollar (USD) remains depressed amid firming expectations that the Federal Reserve (Fed) will skip an interest rate hike at its meeting later this month and turns out to be a key factor acting as a tailwind for the NZD/USD pair. In fact, Philadelphia Fed President Patrick Harker reiterated on Thursday that it’s time to at least hit the stop button for one meeting and see how it goes. This comes on the back of the recent comments by a slew of influential FOMC officials, which forced investors to scale back their expectations for another 25 bps lift-off in June. This led to a further decline in the US Treasury bond yields on Thursday and continues to weigh the Greenback.
Apart from this, Thursday's disappointing release of the US ISM Manufacturing PMI, which contracted for the seventh straight time in May, and a positive risk tone further undermines the safe-haven buck and benefits the risk-sensitive Kiwi. A private survey showed on Thursday that China’s manufacturing sector unexpectedly registered modest growth in May, raising hopes of a recovery in the world's second-largest economy. Furthermore, the passage of bipartisan legislation to lift the government's $31.4 trillion debt ceiling and avert an unprecedented American default boosts investors' confidence. Meanwhile, the USD bulls seem unimpressed by the upbeat US ADP report.
That said, the Reserve Bank of New Zealand's (RBNZ) explicit signal last week that it was done with its most aggressive hiking cycle since 1999 could act as a headwind for the domestic currency. Traders also seem reluctant to place aggressive bullish bets around the NZD/USD pair and prefer to wait on the sidelines ahead of the release of the closely-watched US monthly jobs data, due later during the early North American session. The popularly known NFP report will play a key role in influencing the USD price dynamics and provide a fresh directional impetus to the major.
Technical levels to watch
- USD/JPY clings to mild gains during the first positive day in five.
- Sustained downside break of previous key support, bearish trend channel keeps Yen pair sellers hopeful.
- 100-HMA acts as the last defense of Yen sellers, bumpy road awaits pair sellers on US NFP day.
USD/JPY struggles to defend the first daily gains in five as it seesaws around 139.00 heading into Friday’s European session, mildly bid near 138.85 by the press time.
The Yen pair’s latest corrective bounce could be linked to the RSI (14) line’s gradual rebound from the oversold territory, as well as the quote’s inability to break the lower line of a bearish channel stretched from Tuesday. The recovery moves also justify the bullish MACD signals.
However, a one-week-old previous support line, close to 139.15 at the latest, restricts the USD/JPY pair’s immediate upside within a short-term bearish channel, currently between 138.35 and 139.50.
Even if the Yen pair manages to deft the immediate bearish chart formation, the 100-Hour Moving Average (HMA) near 139.70, quickly followed by the 140.00 round figure, could challenge the bulls before giving them control.
On the flip side, a clear break of 138.35 will also reject the previously stated bearish channel but in favor of the USD/JPY sellers. Following that, the quote could drop to the May 19 swing low of around 137.40.
It’s worth noting that the 50% and 61.8% Fibonacci retracement level of the pair’s moves between May 11 and 30, around 137.30 and 136.50, could challenge the bears afterward.
Apart from the aforementioned technical details, the Yen pair’s risk-barometer status also justifies the pair’s latest inaction as the markets await the US employment report.
Also read: Forex Today: US Dollar struggles to find demand, all eyes on NFP
USD/JPY: Hourly chart
Trend: Bearish
CME Group’s flash data for natural gas futures markets noted traders increased their open interest positions for the fourth consecutive session on Thursday, this time by around 15.4K contracts. In the same line, volume went up by around 143.5K contracts, fading the previous daily drop.
Natural Gas: The $2.00 mark is just around the corner
Prices of natural gas retreated further on Thursday. The daily pullback was in tandem with increasing open interest and volume, exposing the likelihood of further losses in the very near term. Against that, there is a tough contention area around the $2.00 mark per MMBtu for the time being.
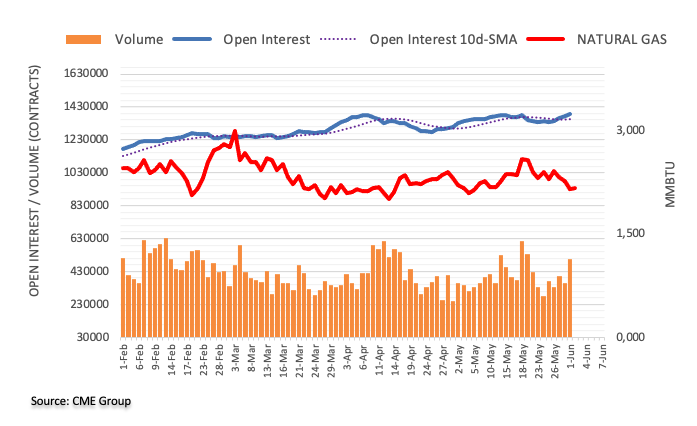
The focus of the FX market is today aimed at the May labor market report. Esther Reichelt, FX Analyst at Commerzbank, believes that the US Dollar could strengthen on strong employment figures.
US labor market as sustainable driver for inflation and the Dollar?
The Fed probably wants to see some easing of the labor market before considering a loosening of monetary policy. This may explain why the Fed is reluctant to commit to an extended pause in interest rates, and as a result, the Dollar may quickly recover yesterday's losses if we see a strong labor market today. On the other hand, this also means that the inflation outlook as well as the future course of the Fed and the US dollar are fraught with great uncertainty.
As a result, I remain skeptical about the USD rally continuing.
See – Nonfarm Payrolls Preview: Banks expect labor market to lose momentum only slowly
Considering advanced prints from CME Group for crude oil futures markets, open interest increased for the third straight session on Thursday, now by around 1.3K contracts. Volume, instead, reversed two consecutive daily gains and went down by around 169.2K contracts.
WTI: Next on the upside emerges $75.00
Thursday’s bounce in prices of WTI was on the back of a small build in open interest, suggesting that potential gains appear in the pipeline in the very near term. Against that, the next up-barrier of note comes at the recent tops near the $75.00 mark per barrel (May 24).
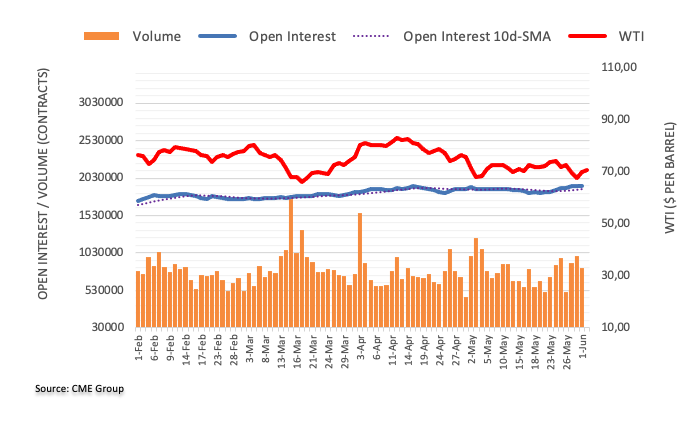
- GBP/JPY remains on the front foot near the highest levels since February 2016.
- BoE vs. BoJ divergence, recently upbeat UK data allow pair buyers to keep the reins.
- Yields recover amid market’s rush for bonds, Gold amid easy US Dollar, receding hawkish Fed bets.
- Risk catalysts are the key for fresh impulse.
GBP/JPY bulls keep the driver’s seat as the key flirt with the highest levels since February 2016, marked during the mid-week, as the quote rises for the second consecutive day heading into Friday’s London open. That said, the cross-currency pair prints mild gains near 174.20 by the press time.
While tracing the catalysts behind the pair’s latest run-up, the divergence between the monetary policy bias of the Bank of England (BoE) and the Bank of Japan (BoJ) gain major attention. The same factors become severe of late as the UK data arrives firmer while the Japanese officials defend easy-money policies.
On Thursday, the UK S&P Global/CIPS Manufacturing PMI improved to 47.1 for May versus 46.9 initial estimations. Further, the latest Bank of England (BoE) Monthly Decision Maker Panel (DMP) survey, released on Thursday, businesses in the UK see the year-ahead Consumer Price Index (CPI) at 5.9% in May vs 5.6% in April.
On the other hand, Bank of Japan Governor Kazuo Ueda said, “It will take some time to reach the 2% price goal,” while turning down the odds of a rate hike after the latest increase in the Japanese inflation data.
Elsewhere, the US 10-year Treasury bond yields that print the first daily gain in six as it bounces off a two-week low to 3.61% by the press time. On the same line, the two-year counterpart steadies near the weekly bottom surrounding 4.35% following a three-day downtrend.
Looking ahead, GBP/JPY traders should pay attention to the market’s risk appetite, as well as the US Treasury bond yields, for fresh impulse. Given the latest dynamics supporting the BoE hawks, the quote can stay on the way to refreshing the multi-month high.
Technical analysis
Although overbought RSI suggests a pullback in the GBP/JPY prices, the bulls can remain hopeful unless the quote stays beyond the previous resistance line stretched from October 2022, close to 172.30 by the press time.
Here is what you need to know on Friday, June 2:
The US Dollar (USD) stays on the back foot early Friday after having suffered heavy losses against its major rivals on Thursday with the US Dollar Index trading below 103.50 in the European morning. The market mood remains relatively upbeat as focus shifts to the US Bureau of Labor Statistics' (BLS) May jobs report, which will include Nonfarm Payrolls (NFP) and wage inflation figures.
US Nonfarm Payrolls Report: Analyzing May NFP release.
On Thursday, the USD came under heavy bearish pressure after the BLS reported that the change in Unit Labor Costs for the first quarter got revised significantly lower to 4.2% from the advanced estimate of 6.3%. Moreover, Automatic Data Processing's (ADP) monthly report revealed that private sector employment in the US rose by 278,000 in May. Although this reading surpassed the market forecast of 170,000 by a wide margin, the soft wage inflation component of the report didn't allow the USD to gather strength. According to the CME Group FedWatch Tool, markets are pricing in a left than 30% probability of one more Federal Reserve rate hike at the upcoming meeting.
Meanwhile, the US Senate voted to pass the bill to suspend the debt-limit. Commenting on this development, “this bipartisan agreement is a big win for our economy,” said US President Joe Biden and told reporters that he will sign this bill into law as soon as Friday. Reflecting the risk-positive market atmosphere, main equity indexes in the US closed decisively higher on Thursday. Early Friday, US stock index futures continue to trade in the green in the early European session.
EUR/USD registered impressive gains on Thursday and erased all of its weekly losses. The pair continues to stretch higher and holds above 1.0750 in the European morning.
GBP/USD took advantage of the persistent USD weakness and rose to its highest level in two weeks above 1.2500 on Thursday. The pair clings to small daily gains near 1.2550 early Friday.
USD/JPY extended its slide into a fourth straight day on Thursday and broke below 139.00. The pair edges slightly higher but stays below that level on the last trading day of the week.
Gold price continued to push higher on Thursday as the benchmark 10-year US Treasury bond yield fell below 3.6% for the first time in nearly three weeks. XAU/USD consolidates its weekly gains at around $1,980.
US May Nonfarm Payrolls Preview: Analyzing Gold price's reaction to NFP surprises.
Bitcoin has gained traction and recovered above $27,000 from the weekly low it set near $26,500 in the Asian trading hours on Friday. Following a two-day slide, Ethereum has staged a rebound and was last seen rising more than 1% on a daily basis at around $1,900.
Economists at Nordea expect EUR/NOK to trade around 12.30 during the summer, with more NOK weakening likely.
More pain for NOK ahead
We believe the NOK roller coaster ride will continue during the summer and see EUR/NOK trading around 12.30 during the summer. However, higher moves cannot be excluded.
We believe that NOK will be less weak towards year-end than during the summer. One reason for our view is that gas prices are likely to rise during the winter, implying higher NOK purchases from oil companies.
Markets Strategist at UOB Group Quek Ser Leang gives his views on the prospects for the yellow metal.
Key Quotes
After spot gold soared to a high of $2,072… we noted that ‘The advance to $2,072 lacks momentum as can be seen in the daily MACD which is barely positive’. However, we highlighted that spot gold ‘has the potential to rise further towards the top of the rising wedge near $2,100 before the risk of a reversal increases’. We added, ‘If spot gold falls below $2,020, it will most likely test $1,963’.
Spot gold not only broke below $2,020 in the middle of last month but also $1,963. On Tuesday (30 May 2023), it fell further to a low of $1,932. The low appears to have slightly breached both the 21-week exponential moving average and the rising trendline connecting the lows of October last year and March this year. The price actions, combined with the weekly MACD turning negative (as of last week) suggest an increasing risk of a bearish reversal.
However, spot gold has to break the support at the bottom of the daily Ichimoku, now at $1,920, before it could weaken towards $1,870 (the current level of the 55-week exponential moving average). The risk of spot gold breaking clearly below $1,920 will remain intact in the next month or so as long as it does not move above the top of the daily Ichimoku cloud, currently at $1,992.
FX option expiries for June 2 NY cut at 10:00 Eastern Time, via DTCC, can be found below.
- EUR/USD: EUR amounts
- 1.0575 510m
- 1.0700 1.7b
- 1.0725 462m
- 1.0750 793m
- GBP/USD: GBP amounts
- 1.2250 335m
- USD/JPY: USD amounts
- 138.25 640m
- 139.30 390m
- 140.00 642m
- 141.50 403m
- USD/CHF: USD amounts
- 0.9050 692m
- 0.9200 400m
- AUD/USD: AUD amounts
- 0.6500 420m
- 0.6600 419m
- USD/CAD: USD amounts
- 1.3405 770m
- 1.3500 396m
- 1.3580 644m
- 1.3600 859m
- 1.3615 736m
- NZD/USD: NZD amounts
- 0.5950 770m
- 0.6100 497m
- Gold price is making efforts for keeping auction confidently above $1,980.00 amid the delicate USD Index.
- Market sentiment is quite positive after the clearance of the US debt-ceiling bill in Congress.
- The only catalyst that can save the USD index from a further casualty is the US NFP data.
Gold price (XAU/USD) is looking to fit its auction above $1,980.00 in the early European session. The precious metal has been fueled with fresh blood as the USD Index is expected to remain in the bearish trajectory amid the absence of recovery signals.
S&P500 futures have posted decent gains in Asia as the market sentiment is quite positive after the clearance of the US debt-ceiling bill in Congress and a decline in expectations of one more interest rate hike from the Federal Reserve (Fed).
The US Dollar Index has refreshed its weekly low at 103.45 as Fed policymakers are favoring a pause in June’s monetary policy meeting considering the fact that US domestic factory activities are consistently contracting.
The only catalyst that can save the USD index from a further casualty is the United States Nonfarm Payrolls (NFP) data. Economists at Commerzbank expect if the US labor market report for May is strong and above expectations, the Dollar could rise. Further, they added that given the fairly stable downward trend in employment growth, they expect 200K new jobs to have been created in May after 253K in April. This would probably keep the unemployment rate at 3.4%. The noticeable weakening of the labor market desired by the US Federal Reserve, which could dampen inflation, would thus not yet be achieved.
Gold technical analysis
Gold price has delivered a breakout of the downward-sloping trendline plotted from an all-time high at $2,079.76 on a two-hour scale. The precious metal is gathering strength for breaking above the horizontal resistance plotted from May 19 high at $1,984.25.
Gold price has climbed above the 200-period Exponential Moving Average (EMA) at $1,973.58, which conveys that the long-term trend has turned bullish.
The Relative Strength Index (RSI) (14) has shifted into the bullish range of 60.00-80.00, which indicates that the upside momentum is active now.
Gold two-hour chart
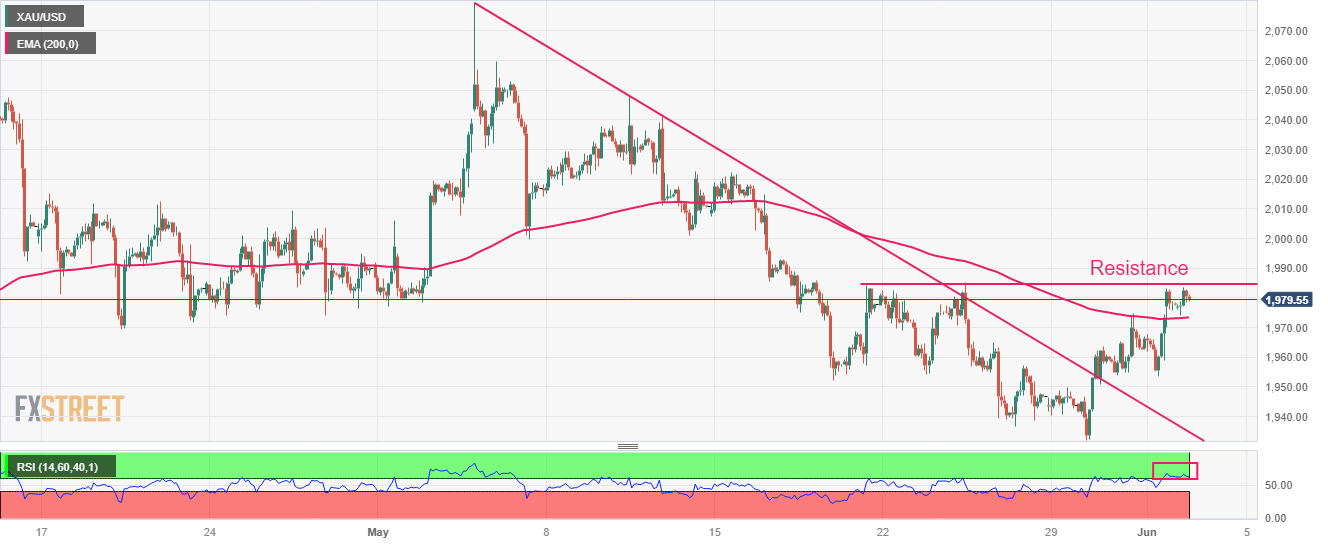
Open interest in gold futures markets dropped further on Thursday, this time by around 1.5K contracts according to preliminary readings from CME Group. Volume followed suit and shrank for the second session in a row, now by more than 36K contracts.
Gold: Another pullback to $1930 remains on the table
Gold prices extended the recovery and briefly trespassed the key $1980 region per ounce troy on Thursday. The uptick was accompanied by declining open interest and volume, removing strength for a potential continuation of the rebound.
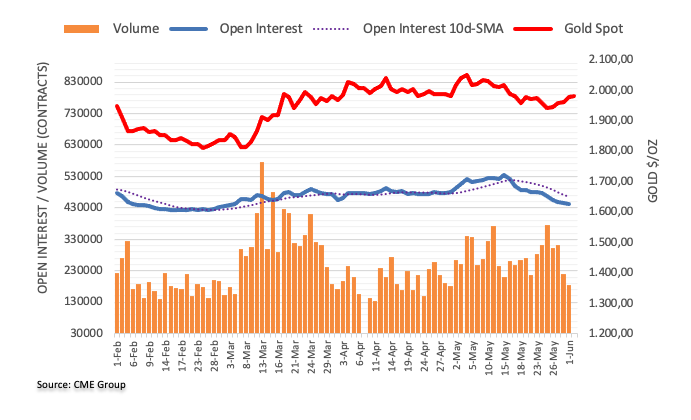
- GBP/USD clings to mild gains at the highest levels in two weeks.
- 2.5-month-old horizontal resistance, overbought RSI line challenges Cable byers.
- 200-SMA, bullish MACD signals put a floor under Pound Sterling price.
- US NFP becomes more important hawkish Fed bets run out of steam.
GBP/USD bulls seat idle on the driver’s seat as the all-important US NFP looms on Friday. That said, the Cable pair sticks on mild gains around 1.2535 during the six-day uptrend that recently prod the highest levels since May 16.
Also read: GBP/USD: Cable grinds above 1.2500 as BoE vs. Fed play intensifies, US jobs report eyed
It’s worth noting that the Pound Sterling pair’s successful upside break of the 200-SMA, at 1.2475 by the press time, keeps the buyers hopeful.
However, a horizontal area comprising multiple levels marked since April 14 constitutes the 1.2540-50 resistance zone, which in turn challenges the immediate GBP/USD upside amid the overbought RSI (14) line.
Hence, the Cable pair’s further upside hinges on its ability to cross the 1.2550 hurdle, backed by the downbeat US employment report for May.
The same will allow the GBP/USD bulls to pierce late April highs of around 1.2585 in search of refreshing the yearly high, currently around 1.2680.
On the flip side, a sustained break of the 200-SMA level of 1.2475 could recall the short-term Cable bears who can aim for the latest trough surrounding 1.2310 in a case where the US NFP offers a positive surprise.
In a case where the GBP/USD remains bearish past 1.2310, multiple hurdles around 1.2300 and 1.2270 can challenge the sellers.
GBP/USD: Four-hour chart
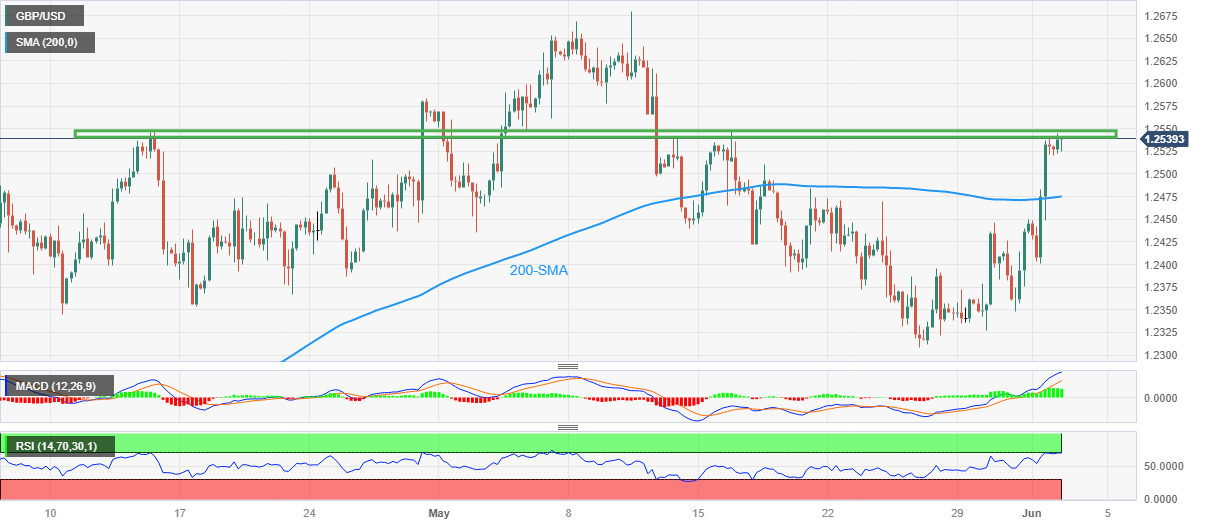
Trend: Limited upside expected
- US Nonfarm Payrolls is likely to show 190K jobs addition in May.
- The headline NFP and Average Hourly Earnings are likely to impact the Fed rates outlook.
- US Unemployment Rate is foreseen at 3.5% in May, up from April’s 3.4% print.
Progressing toward the United States Nonfarm Payrolls showdown, the US Dollar (USD) is on a corrective decline from two-month highs, undermined by increased bets of a US Federal Reserve (Fed) rate hike pause in June and the Congressional approval of the US debt ceiling suspension. May jobs report could hint at whether the Fed will bring an end to its tightening cycle, triggering fresh volatility around the Greenback.
Fed Chair Jerome Powell’s dovish remarks delivered last month, checked the US Dollar’s upward trajectory briefly. Speaking at the “Perspectives on Monetary Policy” panel at the Thomas Laubach Research Conference, Powell said the recent banking crisis, which led to tighter credit standards, has eased the pressure to hike interest rates. "Our policy rate may not need to rise as much as it would have otherwise," he added. Ever since, the US Dollar has been on a roll higher on the back of the hawkish rates outlook by several Fed policymakers, strong US economic data and the US debt deal optimism.
In a Financial Times (FT) interview earlier this week, Cleveland Federal Reserve Bank President, Loretta Mester, noted that there is no ‘compelling’ reason to wait for a fresh rate rise, adding that the “debt-ceiling deal removes a big piece of uncertainty over the US economy.”
However, Philadelphia Fed President, Patrick Harker, and Fed Governor, Philip Jefferson, said that they favor a rate hike pause in June, which prompted investors to assess the prospect of a pause in the tightening cycle by the Fed this month. In the face of the dovish Fedspeak, the probability of a 25 basis points (bps) Fed rate hike in June dropped from about 62% to 38%, where it now stands.
What to expect in the next Nonfarm Payrolls report?
This Friday, the all-important United States (US) monthly labor jobs report data for May will stand out. Markets are expecting the US economy to have created 190K jobs during the reported month, compared with the above estimates of 253K reported in April. The Unemployment Rate is foreseen at 3.5% in the fifth month of this year, up from the 3.4% growth seen in April.
The Average Hourly Earnings are likely to grab the eyeballs apart from the headline Nonfarm Payrolls print, as it could shed light on the country’s wage inflation, which could impact the Fed’s rates outlook. The Average Hourly Earnings is seen rising at the same pace in May as registered in April, at 4.4% on a yearly basis.
It’s also worth noting that the data published by Automatic Data Processing (ADP) showed on Thursday that private sector employment in the US rose by 278,000 in May. This reading followed the 291,000 increase recorded in April and surpassed the market expectation of 170,000 by a wide margin. Additionally, the Employment Index of the ISM’s Manufacturing PMI survey rose to 51.4 in May from 50.2, revealing an increase in employment in the manufacturing sector.
Analysts at TD Securities expect a slight slowdown in the payrolls growth in May: “US payrolls likely slowed modestly in May, advancing at a still strong 200k+ pace for a second consecutive month. We also look for the UE rate to stay unchanged at a historical low of 3.4%, and for wage growth to print 0.3% m/m (4.4% y/y).”
When will US May Nonfarm Payrolls report be released and how could it affect EUR/USD?
The Nonfarm Payrolls report is scheduled for release at 12:30 GMT, on June 2. EUR/USD has regained the 1.0700 level heading into the critical US jobs report. Therefore, it will be interesting to gauge whether the labor market data could help sustain the renewed upside in the main currency pair.
An above-forecast headline NFP print alongside a hotter wage inflation data would cement a case for another 25 basis points (bps) Fed rate hike on June 14, in turn, strengthening the ongoing upsurge in the US Dollar at the expense of the Euro.
Conversely, the US Dollar could come under intense selling pressure should the jobs data disappoint markets and pour cold water on expectations of any further rate increases by the Fed. EUR/USD could stage a solid upswing in reaction to the downbeat US employment data.
Meanwhile, Dhwani Mehta, Asian Session Lead Analyst at FXStreet, offers a brief technical outlook for the EUR/USD pair and writes: “With the 14-day Relative Strength Index (RSI) still lurking below the midline, the ongoing recovery in the EUR/USD pair appears at risk. Further, the 21-Daily Moving Average (DMA) is looking to pierce the flattish 100 DMA from above, warranting caution for EUR/USD buyers.”
Dhwani also outlines important technical levels to trade the EUR/USD pair: “On the upside, Euro buyers need acceptance above the confluence resistance near 1.0820, where the 21 and 50 DMA close in. Ahead of that, EUR/USD must recapture the 1.0800 psychological mark. Alternatively, immediate support awaits at the 1.0700 round figure, below which the previous day’s low at 1.0661. The line in the sand for Euro bulls is seen at the May low of 1.0635.”
About the Nonfarm Payrolls report
The Nonfarm Payrolls released by the US Department of Labor presents the number of new jobs created during the previous month, in all non-agricultural business.
The monthly changes in payrolls can be extremely volatile, due to its high relation with economic policy decisions made by the US Federal Reserve. The number is also subject to strong reviews in the upcoming months, and those reviews also tend to trigger volatility in the forex board.
Generally speaking, a high reading is seen as positive (or bullish) for the US Dollar, while a low reading is seen as negative (or bearish), although previous month's reviews and the Unemployment Rate are as relevant as the headline figure.
Economists at Nomura discuss ECB policy outlook.
The ECB will be watching core and service prices intently over the coming months
So far core inflation has fallen by just 0.4pp from its peak – so at 5.3% we are far from being able to conclude this is ‘job done’ on monetary tightening. The ECB will be watching core and service prices intently over the coming months – particularly the monthly momentum in those series – in order to judge whether pressures have eased sufficiently to end the hiking cycle.
We expect the ECB to raise rates twice more from here, i.e. 2x25 bps hikes in June and July for a terminal rate of 3.75%. Thereafter, assuming core price momentum has slowed sufficiently, we think the ECB may call it a day on the hiking cycle. Inevitably at that point, markets will be questioning when the first cut might be. We continue to see this as being far later than markets expect and not until the very end of 2024.
- EUR/USD is displaying a lackluster performance above 1.0760 as the focus has shifted to US NFP data.
- Federal Reserve policymakers are divided about June’s interest rate policy stance post US Manufacturing PMI and ADP Employment data.
- European Central Bank President Christine Lagarde is expected to raise interest rates despite sheer softening of Eurozone inflation.
- EUR/USD has delivered a breakout of the Falling Wedge chart pattern, which indicates a bullish reversal after a prolonged downside.
EUR/USD is consistently demonstrating a back-and-forth action above the critical support of 1.0760 in the early European session. The major currency pair is showing signs of a loss in the upside momentum amid a failure in extending its rally further. After a vertical sell-off, the US Dollar Index (DXY) has attempted to defend its downside post-refreshing weekly low at 103.44.
S&P500 futures are holding gains added in Asia amid an upbeat market mood. US equities carry-forwarded risk appetite theme showed on Thursday amid the clearance of the US debt-ceiling bill by Congress and easing odds of a further interest rate hike by the Federal Reserve (Fed) in its June meeting.
The US Dollar Index remained under pressure after a few Federal Reserve (Fed) policymakers favored a pause in the year-long policy-tightening spell. Philadelphia Federal Reserve Bank President Patrick Harker stated on Thursday that he believes it is time for the central bank to 'hit the stop button' for at least one meeting, reiterating his comments from Wednesday about a potential pause at the next meeting. Harker argued that such a move would be prudent at this time.
A recovery in the US Treasury yields has provided some support to the US Dollar. The 10-year US Treasury yields have rebounded above 3.62%.
Investors are bracing for a volatile action in global financial markets amid the release of the United States Nonfarm Payrolls (NFP) data (May), which will provide more clarity about interest rate policy to be dictated by the Federal Reserve.
US contracting factory activity vs. tight labor market conditions
Diverged United States economic indicators have created chaos among Federal Reserve policymakers. On Thursday, the US ISM agency reported the seventh straight contraction in Manufacturing PMI for May. A 50.0 threshold figure that separates expansion from contraction showed declining US domestic factory activities. The economic data landed at 46.9 from the downwardly revised figure of 47.0. Also, the New Orders Index that indicates forward demand dropped significantly to 42.6 vs. the estimates of 44.9. It seems that higher interest rates by the Federal Reserve and tight credit conditions have forced firms to operate with lower capacity. Also, individuals are struggling to avail credit for core goods.
On the contrary, US Automatic Data Processing (ADP) agency showed the Employment Change (May) at 278K jobs, significantly higher than the estimates of 170K. This has created a tug-of-war among Federal Reserve policymakers as tight labor market conditions advocate for more interest rate hikes while consistently contracting factory activities favor a pause this month.
Strong consensus for US NFP
After the release of upbeat US ADP Employment Change, the street is confident that US official Employment data would also remain extremely solid. Analysts at Wells Fargo expect NFP to increase by 200K. They believe it is important to keep a close eye on wage growth and the labor force participation numbers. The labor force has grown at a healthy pace over the past year, and a further deceleration in wages alongside expanding supply would be an encouraging sign in the Federal Reserve's fight to get inflation back to 2%.
Softening Eurozone Inflation fails to trim hawkish ECB bets
A compiled version of 20-Eurpoean nations showed that inflationary pressures for May have softened more than what the street was anticipating. Eurozone followed the trail of Germany, France, and Spain and reported lower-than-anticipated Harmonized Index of Consumer Prices (HICP) figures as individuals are surrendering luxuries due to higher cost of living. Monthly headline HICP remained flat vs. former expansion of 0.6% while annual HICP decelerated heavily to 6.1% from the estimates of 6.3% and the former release of 7.0%.
Investors started expecting that the European Central Bank (ECB) will consider the current deceleration in inflationary pressures and German’s recession and might consider a pause for June. However, European Central Bank President Christine Lagarde is expected to raise interest rates by 25 basis points (bps) as core inflation is still persistent as announced on Thursday.
EUR/USD technical outlook
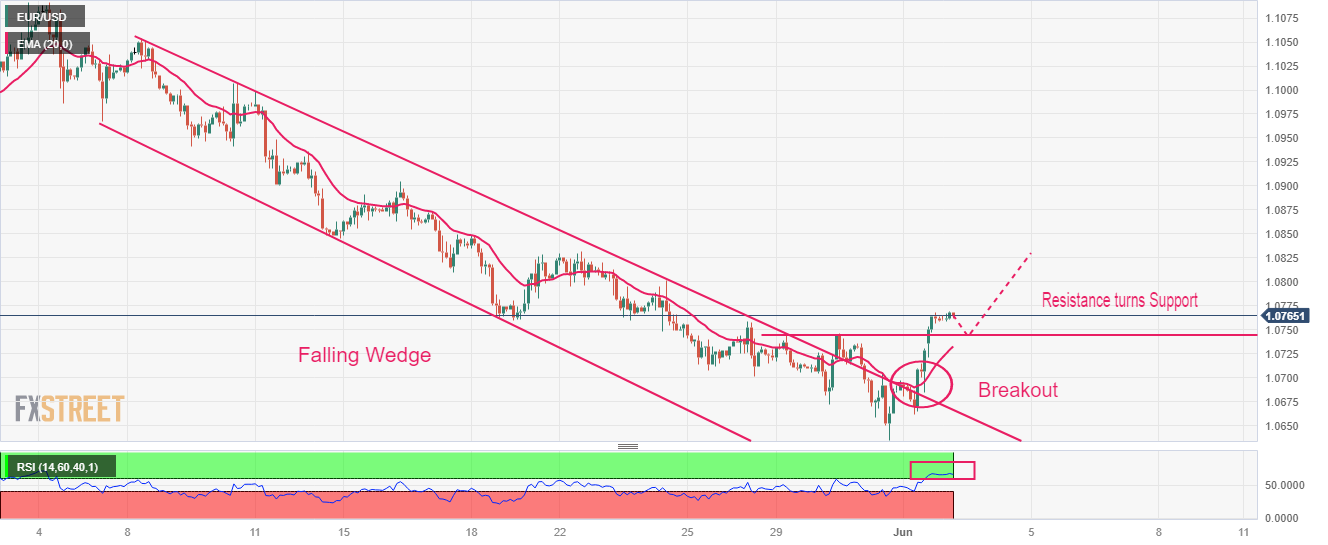
EUR/USD has delivered a breakout of the Falling Wedge chart pattern, which indicates a bullish reversal after a prolonged downside. The shared currency pair has shifted above the horizontal resistance plotted from May 29 high at 1.0744, which has turned into a support for the Euro bulls.
Upward-sloping 20-period Exponential Moving Average (EMA) at 1.0734 indicates that the short-term trend is bullish.
An oscillation in the bullish range by the Relative Strength Index (RSI) (14) indicates that the upside momentum is still active.
European Central Bank (ECB) executive board member, Fabio Panetta, said on Friday, “we have not reached the end of the rate hike cycle.”
He added, “but we are not far away from it.”
Market reaction
At the time of writing, EUR/USD is modestly flat on the day at 1.0765, awaiting the US Nonfarm Payrolls data.
- EUR/GBP licks its wounds after refreshing yearly low the previous day.
- Doji candlestick, Brexit woes and reassessment of BoE’s hawkish bias underpin corrective bounce.
- Hesitance among ECB hawks, softer Eurozone inflation keep bears hopeful.
EUR/GBP bears take a breather at the yearly low as markets reassess the latest dynamics on early Friday. With this, the cross-currency pair picks up bids to consolidate the recent losses near 0.8590 as it rebounds from the lowest levels since late 2022 amid mixed concerns.
Apart from the market’s consolidation ahead of the US Nonfarm Payrolls (NFP) and recent hawkish comments from European Central Bank (ECB) executive board member Fabio Panetta also allow the quote to lick its wounds. That said, the policymaker said, “We have not reached the end of the rate hike cycle.”
Additionally, the market’s fears that the higher rates in the UK will negatively affect the mergers and acquisitions at home, as well as the economic performance, seem to have prodded the British dealmakers of late. “Activity in mergers and acquisitions in Britain is at its lowest level in seven years as dealmakers remain cautious about the economic outlook,” said The Times.
On the same line are the headlines from the Financial Times (FT) stating that the UK should join a pan-European agreement on goods trade to limit the damage to its car industry from looming post-Brexit tariffs instead of seeking a delay to their introduction, according to senior officials in Brussels.
It should be noted that the upbeat UK data versus downbeat EU statistics joined mixed comments from the ECB and the Bank of England (BoE) officials to keep the EUR/GBP bears happy previously.
On Thursday, the UK S&P Global/CIPS Manufacturing PMI improved to 47.1 for May versus 46.9 initial estimations. Further, the latest Bank of England (BoE) Monthly Decision Maker Panel (DMP) survey, released on Thursday, businesses in the UK see the year-ahead Consumer Price Index (CPI) at 5.9% in May vs 5.6% in April. On the other hand, Eurozone Inflation, per the European Central Bank's (ECB) preferred gauge of inflation, namely the annual Harmonised Index of Consumer Prices (HICP), rose 6.1% YoY in May versus 6.3% expected and 7.0% prior. Further details suggest that the Core HICP also softened to 5.3% from 5.6% prior and 5.5% market forecasts.
Even so, the accounts of the European Central Bank's (ECB) May policy meeting revealed that a number of members initially expressed a preference for increasing the key interest rates by 50 basis points. Furthermore, President Christine Lagarde said, “We need to continue our hiking cycle until we are sufficiently confident that inflation is on track to return to our target in a timely manner.”
It’s worth quoting that the latest Bank of England (BoE) Monthly Decision Maker Panel (DMP) survey, released on Thursday, signaled that businesses in the UK see the year-ahead Consumer Price Index (CPI) at 5.9% in May vs 5.6% in April, which in turn suggests higher rates in the UK.
To sum up, comparatively more intense inflation pressure in the UK allows EUR/GBP bears to remain hopeful despite the latest rebound.
Technical analysis
Thursday’s Doji candlestick on the daily chart joins the oversold RSI (14) line to underpin the latest corrective bounce. The recovery moves, however, appear elusive unless crossing a five-week-old descending resistance line near 0.8671.
- Asian indices are having a ball as a clear passage of US debt-ceiling bill through Congress has uplifted market mood.
- BoJ Ueda said that the monetary policy will remain accommodative as the economy will take some time to reach the 2% price goal.
- A surprise expansion in China’s domestic factory activity supported Chinese equities.
Markets in the Asian domain posted significant gains on Friday. Rally in Asian indices is being supported by the clear passage of the US debt-ceiling bill and favor for a pause in the policy-tightening spell by a few Federal Reserve policymakers. Asian majors are following the footprints of the S&P500 as the latter settled with significant gains on Thursday.
The US Dollar Index (DXY) is struggling to show promising recovery signals after a perpendicular sell-off post dovish commentary from Fed policymakers. Fed Governor Philip Jefferson said in a speech on Wednesday that pausing rate hikes at the next FOMC meeting would offer time to analyze more data before making a decision about the extent of additional tightening. He added that a pause does not mean that rates peaked.
At the press time, Japan’s Nikkei225 jumped 0.94%, ChinaA50 soared 1.46%, Hang Seng gallops 3.45%, and Nifty50 remains subdued.
Japanese equities are skyrocketing as Bank of Japan (BoJ) Governor Kazuo Ueda said in front of Parliament that the monetary policy will remain accommodative as the economy will take some time to reach the 2% price goal. The continuation of the ultra-dovish monetary policy is a boon for stocks as sufficient injection of liquidity into the economy would allow firms to remain handy with funds for augmenting fixed and working capital requirements.
Chinese stocks have recovered sharply as investors are confident that the economy is effectively on the path of recovery after the release of the Caixin Manufacturing PMI data. Domestic factory activity remained upbeat in May as the economic data jumped to 50.9, higher than the consensus and the prior release of 49.5. A figure above the 50.0 threshold is considered an expansion in economic activities.
The Indian market is getting volatile as investors have shifted their focus toward the interest rate decision by the Reserve Bank of India (RBI), which will release next week. A survey from Bloomberg showed that the RBI will keep its repo rate steady at 6.5% throughout the year and will announce a rate cut by 25 basis points (bps) in the first quarter of the next financial year.
On the oil front, oil prices have shown recovery after defending the crucial support of $70.00 amid expectations that OPEC+ would announce production cuts in its meeting scheduled for June 04 to provide support to lower energy prices.
- WTI crude oil keeps previous day’s rebound from one-month low, grinds near intraday high of late.
- Short-term key EMA envelope restricts immediate Oil price moves ahead of the key US NFP.
- Seven-week-old descending resistance line, horizontal area established since early May gain major attention.
- Bullish MACD signals keep energy buyers hopeful of poking $74.70 hurdle.
WTI crude oil remains mildly bid around mid-$70.00s as it defends the previous day’s recovery from a one-month low heading into Friday’s European session.
In doing so, the black gold extends the mid-week rebound of a horizontal area comprising levels marked since early May. Adding strength to the upside bias are the bullish MACD signals and the energy benchmark’s sustained break of the 21-bar Exponential Moving Average (EMA).
It’s worth noting, however, that the 50-EMA level of around $71.00 guards the immediate recovery of the WTI crude oil.
Following that, a downward-sloping resistance line from April 14, close to $72.50 at the latest, will gain the Oil buyer’s attention.
It should be observed that the commodity’s run-up beyond $72.50 isn’t an open invitation to the WTI bulls as the late May swing high of around $74.70 acts as the last defense of the bears.
On the contrary, a clear break of the 21-EMA, near the $70.00 round figure as we write, could recall the Oil bears.
Even so, the aforementioned one-month-long horizontal support zone near $67.40-20, quickly followed by the $67.00 round figure, may prod the WTI bears before directing them to the multi-month low marked the previous month around $64.30.
WTI: Four-hour chart

Trend: Limited upside expected
- USD/JPY is expected to display a sheer downside below 138.50 amid an absence of recovery signals by the USD Index.
- The FX domain is expected to remain volatile amid the release of the US NFP.
- Gains are consistently advancing in the S&P500 futures as the market mood is quite cheerful.
The USD/JPY pair has found intermediate support near 138.50 in the Asian session. The asset is expected to deliver more downside as the US Dollar Index (DXY) has not shown any recovery signs after a healthy downside.
Gains are consistently advancing in the S&P500 futures as the market mood is quite cheerful amid soaring expectations that the Federal Reserve (Fed) could pause the policy-tightening spell. On a broader note, the risk-appetite theme underpinned by the market participants was weighing heavily on US Treasury yields. However, a minor recovery has been witnessed in the yields offered on 10-year US Treasury bonds to 3.62%.
The US Dollar Index (DXY) has slipped below the crucial support of 103.50 as the odds of a neutral interest rate policy by the Federal Reserve (Fed) are deepening. Philadelphia Federal Reserve Bank President Patrick Harker stated on Thursday that he believes it is time for the central bank to 'hit the stop button' for at least one meeting, reiterating his comments from Wednesday about a potential pause at the next meeting. Harker argued that such a move would be prudent at this time.
Investors should note that volatility in the FX domain is expected to remain higher amid the release of the United States Nonfarm Payrolls (NFP) data. Analysts at Commerzbank expect given the fairly stable downward trend in employment growth, they expect 200K new jobs to have been created in May after 253K in April. This would probably keep the unemployment rate at 3.4%. The noticeable weakening of the labor market desired by the US Federal Reserve, which could dampen inflation, would thus not yet be achieved.
On the Japanese Yen front, the commentary from Bank of Japan (BoJ) Governor Kazuo Ueda remained in focus. BoJ Ueda said that it will take some time to reach the 2% price goal. He added that he can't say when the 2% goal will be reached. He argues that trend inflation likely will heighten ahead but it will take time.
- USD/INR has sensed resistance around 82.40 amid weakness in the USD Index.
- The Indian Rupee will also remain on tenterhooks as the RBI is expected to keep its repo rate steady.
- USD/INR has witnessed a steep fall after a breakdown of the inventory distribution.
The USD/INR pair has sensed selling pressure around 82.40 in the Asian session amid a sheer sell-off in the US Dollar Index (DXY). The USD Index fell like a house of cards as a few Federal Reserve (Fed) policymakers delivered dovish commentary for June’s monetary policy. Going forward, the release of the United States Nonfarm Payrolls (NFP) data will remain in the spotlight.
It looks like the Indian Rupee will also remain on tenterhooks as the Reserve Bank of India (RBI) is expected to keep its repo rate steady in its monetary policy meeting scheduled for June 6-8.
A survey from Bloomberg showed that the RBI will keep its repo rate steady at 6.5% throughout the year and will announce a rate cut by 25 basis points (bps) in the first quarter of the next financial year.
USD/INR has witnessed a steep fall after a breakdown of the inventory distribution in which inventory is transferred from institutional investors to retail participants. The inventory adjustment formed in a range of 82.50-82.83 on an hourly scale. The 20-period Exponential Moving Average (EMA) at 82.36 is acting as a barricade for the US Dollar bulls.
The Relative Strength Index (RSI) (14) is oscillating in the bearish range of 20.00-40.00, indicating more weakness ahead.
Should the asset break below June 01 low at 82.23, Indian Rupee bulls would drag the asset toward the round-level support at 82.00 followed by May 04 high at 81.82.
In an alternate scenario, a decisive break above May 23 high at 82.97 will drive the asset toward 03 November 2022 high at 83.18 followed by all-time-high at 83.42.
USD/INR hourly chart
-638212744152980433.png)
“Debt ceiling legislation protects the full faith and credit of the United States and preserves our financial leadership,” US Treasury Secretary Janet Yellen said after the US senate clears the debt deal to avert default.
Additional quotes
“I continue to strongly believe that the full faith and credit of the United States must never be used as a bargaining chip.”
“Treasury will continue to effectively implement the Inflation Reduction Act, including the modernization of the IRS.”
Related reads
- US Pres. Biden looking forward to signing debt-ceiling bill after the Senate passage
- EUR/USD bulls flex muscles near 1.0780 hurdle amid mixed feelings of ECB, Fed hawks, focus on US NFP
- AUD/USD takes the bids to refresh weekly top during two-day uptrend.
- Upbeat Aussie Minimum Wage contrasts with market’s RBA bets to prod AUD/USD bulls.
- Downbeat concerns about Fed, mixed US data and cautious optimism weigh on US Dollar.
- Risk catalysts, US employment report eyed for clear directions.
AUD/USD bulls stay in the driver’s seat as it renews weekly top near 0.6615 heading into Friday’s European session. In doing so, the Aussie pair cheers broad US Dollar weakness, as well as upbeat wage announcements from home, while ignoring fears of the Reserve Bank of Australia’s (Fed) policy pivot. Adding strength to the risk-barometer pair’s latest run-up could be the passage of the US debt-ceiling deal through the Senate.
Recently, Reuters conveyed the news that the US Senate clears the debt deal to avert default and sends it to President Joe Biden’s Desk for signature into law. It’s worth noting that the reduction in the hawkish bias for the Federal Reserve (Fed) and mixed US data previously favored the risk appetite and weighed on the US Dollar, which in turn allowed AUD/USD bulls to retake control after a two-day downtrend.
Earlier in the day, Australia’s Fair Work Commission’s (FWC) Annual Wage Review unveiled a 5.75% compulsory hike in the minimum wage to around 180K Australian workers.
The same bolsters the call for the RBA’s 0.25% rate hike in June, versus the ongoing talks that the Fed won’t announce any rate lift in the next meeting. The same help the AUD/USD prices even as some of the prominent analysts expect a policy pivot at the Aussie central bank. Among them are the top four Aussie analyst banks, namely ANZ, CBA, NAB & Westpac.
Against this backdrop, S&P500 Futures print mild gains around 4,230 as it defends the previous day’s bullish move, the biggest in a week, amid a lackluster session. Also portraying the market’s anxiety is the US 10-year Treasury bond yield that prints the first daily gain in six as it bounces off a two-week low to 3.61% by the press time. On the same line, the two-year counterpart steadies near the weekly bottom surrounding 4.35% following a three-day downtrend.
To sum up, RBA chatters and risk catalysts may entertain AUD/USD traders ahead of the all-important US jobs report and the last round of the Fed talks ahead of the pre-Federal Open Market Committee (FOMC) blackout period for policymakers. Also important to watch is the US Senate’s passage of the debt-ceiling bill. Forecasts suggest, Nonfarm Payrolls (NFP) to ease to 190K from 253K prior while the Unemployment Rate is also expected to increase to 3.5% from 3.4%.
Technical analysis
AUD/USD bulls cheer a clear upside break of the three-week-old previous resistance line, now immediate support around 0.6525, to aim for the 21-DMA hurdle of around 0.6630.
- EUR/USD grinds at weekly top after posting the biggest daily gains in two months.
- Softer Eurozone inflation, mixed comments from ECB officials prod Euro buyers.
- Unimpressive US data, doubts about Fed’s June rate hike weigh on US Dollar.
- US employment numbers need to print strong outcomes to recall EUR/USD bears.
EUR/USD clings to mild gains around 1.0760-65 as it lacks follow through of the previous day’s heavy run-up amid the market’s cautious mood ahead of the key US employment data. Apart from the pre-data anxiety, the doubts about the European Central Bank’s (ECB) hawkish play also prod the Euro pair buyers, especially amid downbeat EU inflation figures and mixed ECB talks.
That said, Eurozone Inflation, per the European Central Bank's (ECB) preferred gauge of inflation, namely the annual Harmonised Index of Consumer Prices (HICP), rose 6.1% YoY in May versus 6.3% expected and 7.0% prior. Further details suggest that the Core HICP also softened to 5.3% from 5.6% prior and 5.5% market forecasts.
On a different page, the accounts of the European Central Bank's (ECB) May policy meeting revealed that a number of members initially expressed a preference for increasing the key interest rates by 50 basis points.
Also defending the ECB haws were comments from ECB Governing Council member Klaas Knot who said it’s not unlikely that 2024 interest rate-cut bets will have to be adjusted. On the same line, ECB Vice President Luis de Guindos said on Thursday, “Recent inflation data are positive but still far from the target.” Furthermore, ECB Governing Council member Olli Rehn also said, “Core inflation must slow before mulling easing.”
Above all, President Christine Lagarde said, “We need to continue our hiking cycle until we are sufficiently confident that inflation is on track to return to our target in a timely manner.”
In the case of the US Dollar, the market’s pricing of the Federal Reserve (Fed) rate hike, which dropped from 17 basis points (bps) in June on Wednesday to 7 bps on Thursday, weighed on the greenback and the Treasury bond yields. While tracing the downbeat Fed bets, mixed US data and Fed talks could be held responsible.
That said, the US ADP Employment Change eased to 278K in May from 291K prior (revised) but crossed the 170K market forecasts. On the same line, the weekly Initial Jobless Claims rose past 230K prior to 232K, versus 235K expected. Further, US ISM Manufacturing PMI eased to 46.9 in May compared to 47.0 anticipated and 47.1 previous readings whereas S&P Global Manufacturing PMI softened to 48.4 from 48.5 prior. Additionally, the US Employment Cost Index eased while the consumer sentiment gauge improved but the details were unimpressive.
Furthermore, Federal Reserve Bank of St. Louis President James Bullard recently published an analysis wherein the Fed hawk accepts that the prospects for continued disinflation are good but not guaranteed, and continued vigilance is required.
Looking ahead, ECB officials’ comments and risk catalysts may entertain EUR/USD traders ahead of the all-important US jobs report and the last round of the Fed talks ahead of the pre-Federal Open Market Committee (FOMC) blackout period for policymakers. Also important to watch is the US Senate’s passage of the debt-ceiling bill. Forecasts suggest, Nonfarm Payrolls (NFP) to ease to 190K from 253K prior while the Unemployment Rate is also expected to increase to 3.5% from 3.4%.
Technical analysis
EUR/USD’s successful break of a one-month-old descending trend line, close to 1.0690-85 at the latest, joins the receding bearish bias of the MACD indicator to keep the Euro bulls hopeful in crossing the immediate hurdle comprising the 100-day Exponential Moving Average (EMA) of near 1.0775.
Japanese Finance Minister Shunichi Suzuki said on Friday, FX rate moves are driven by the market and various factors.
Further comments
“A weak Yen has various impacts on Japan's economy such as exports, import prices.”
“Current account balance, Japan's stance on fiscal reform also affect long-term market trust on the Yen.”
Market reaction
USD/JPY was last seen trading at 138.65, down 0.10% on the day.
US President Joe Biden is crossing the wires after a majority of Senate voted to pass the debt-ceiling bill.
The bill will be now sent to President Biden's desk for signature into law.
Biden said, “I want to thank Leader Schumer and Leader McConnell for quickly passing the debt ceiling bill.”
Additional quotes
“This bipartisan agreement is a big win for our economy.”
“I look forward to signing this bill into law as soon as possible and addressing the American people directly on Friday.”
Market reaction
The headlines fail to move the needle around the US Dollar across its major counterparts. The US Dollar Index is trading 0.05% lower on the day at 103.51, at the press time.
- Gold Price remains around weekly top, grinds higher past key support confluence.
- Cautious optimism ahead of the US NFP, absence of major data/events prod XAU/USD bulls of late.
- Reconfiguration of Fed bets, optimism about US debt-ceiling deal keeps Gold buyers hopeful.
- Downbeat US employment figures, no US default can keep XAU/USD bulls in the driver’s seat.
Gold Price (XAU/USD) remains on the bull’s radar as it prints the first weekly gain in four heading into the key US employment report for May amid cautious optimism in the market. That said, the bullion’s latest run-up could be linked to the broad reduction in the market’s hawkish expectations from the Federal Reserve (Fed), as well as hopes of avoiding the ‘catastrophic’ US default. Adding strength to the Gold Price upside could be the latest run-up in the equities, backed by the technology shares and downbeat yields. It’s worth noting that the fresh optimism about China’s economic recovery adds strength to the XAU/USD upside as Beijing is one of the world’s biggest Gold consumers.
Moving on, today’s US employment report becomes more important and hence any surprise in the headline figures won’t be taken lightly. That said, Nonfarm Payrolls (NFP) to ease to 190K from 253K prior while the Unemployment Rate is also expected to increase to 3.5% from 3.4%. Apart from that, the US Senate’s passage of the debt-ceiling bill and the avoidance of the default woes, as well as the last round of the Fed talks ahead of the pre-Federal Open Market Committee (FOMC) blackout period for policymakers, should also be eyed closely for clear directions.
Also read: US May Nonfarm Payrolls Preview: Analyzing Gold price's reaction to NFP surprises
Gold Price: Key levels to watch
As per our Technical Confluence Indicator, the Gold Price grinds higher past $1,968 key confluence level comprising the 50-HMA, Fibonacci 61.8% in one-week and 23.6% on one-month.
Not only that, but the XAU/USD also trades beyond the Fibonacci 38.2% in one-day and the middle band of the Bollinger on the hourly chart, around $1,972 hurdle, to keep the buyers hopeful.
Also acting as an immediate support, previous resistance, is the convergence of the Pivot Point one-week R1 and Fibonacci 23.6% on one-day.
With this, the Gold Price appears capable of approaching the $1,992 upside hurdle including the 50-DMA and 200-HMA on four-hour chart.
Ahead of that, the $1,989-90 area may prod the XAU/USD bulls as it comprises the Pivot Point one-day R1 and Fibonacci 23.6% on one-month.
In a case where the Gold buyers manage to keep the reins beyond $1,992, the $2,000 round figure may act as the last defense of the Gold bears.
Here is how it looks on the tool
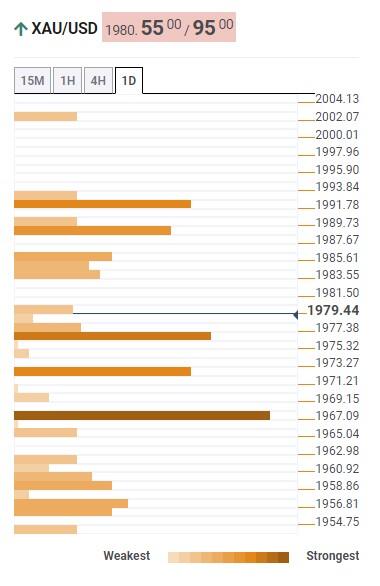
About Technical Confluences Detector
The TCD (Technical Confluences Detector) is a tool to locate and point out those price levels where there is a congestion of indicators, moving averages, Fibonacci levels, Pivot Points, etc. If you are a short-term trader, you will find entry points for counter-trend strategies and hunt a few points at a time. If you are a medium-to-long-term trader, this tool will allow you to know in advance the price levels where a medium-to-long-term trend may stop and rest, where to unwind positions, or where to increase your position size
- USD/MXN remains pressured at the lowest levels in two weeks after snapping two-day uptrend.
- Clear downside break of short-term support line, bearish MACD signals favor Mexican Peso buyers.
- 50-SMA, descending resistance line from late April adds to the upside filters.
- Oscillators keep sellers hopeful but the downside appears bumpy.
USD/MXN prods intraday low near 17.54 as it run the previous day’s bearish play despite a limited audience on early Friday. In doing so, the Mexican Peso (MXN) pair extends the mid-week reversal from the 50-SMA, as well as the downside break of a two-week-old rising trend line.
Not only a U-turn from the short-term key moving average and the support line break but the bearish MACD signals also favor the USD/MXN sellers. However, the RSI (14) line remains below 50.0 and hence suggests limited downside room.
As a result, the multi-month low marked in May around 17.42 gains the USD/MXN pair seller’s attention.
In a case where the USD/MXN pair remains bearish past 17.42, it will witness a bumpy road toward the 17.00 psychological magnet. That said, the year 2016 low of 17.05 may act as an intermediate halt.
Alternatively, recovery moves need to cross the immediate support-turned-resistance, around 17.58 by the press time, to recall the USD/MXN buyers.
Even so, the 50-SMA level of around 17.73 may challenge the pair buyers before giving them control.
It’s worth noting that a convergence of the downward-sloping resistance line from late April and 61.8% Fibonacci retracement of April-May fall, around 17.90, quickly followed by the 18.00 round figure, acts as the last defense of the bears.
USD/MXN Price: Four-hour chart
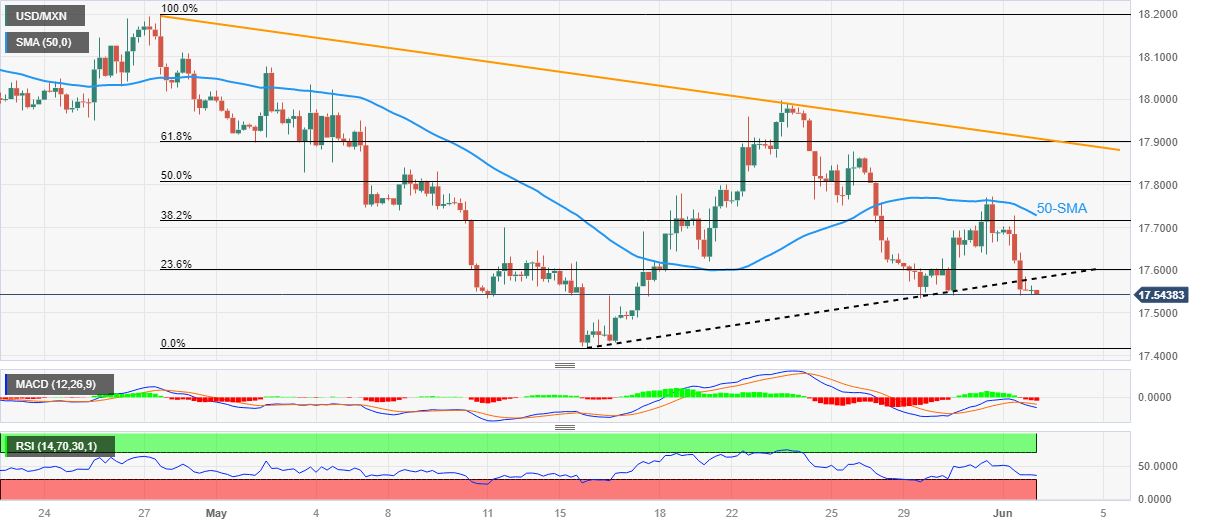
Trend: Limited downside expected
| Raw materials | Closed | Change, % |
|---|---|---|
| Silver | 23.878 | 1.58 |
| Gold | 1977.73 | 0.73 |
| Palladium | 1395.67 | 2.57 |
- Market sentiment dwindles as traders await the key US employment report for May.
- S&P500 Futures print mild gains after snapping three-day downtrend the previous day.
- US 10-year, two-year Treasury bond yields dribble around respective weekly bottoms.
- Receding hawkish Fed bias highlights today’s NFP, last rounds of Federal Reserve talks before blackout also important to observe.
Risk appetite remains sluggish amid typical pre-NFP inaction during early Friday. Even so, the markets remain cautiously optimistic as hawkish Fed bets drop and the US policymakers are all set to pass the debt-ceiling deal. However, today’s US jobs report and the last round of the Fed talks before the pre-FOMC blackout becomes crucial and hence prods the traders, especially amid a light calendar elsewhere.
That said, S&P500 Futures print mild gains around 4,230 as it struggles to defend the previous day’s bullish move, the biggest in a week, amid a cautious mood. Also portraying the market’s anxiety is the US 10-year Treasury bond yield that prints the first daily gain in six as it bounces off a two-week low to 3.61% by the press time. On the same line, the two-year counterpart steadies near the weekly bottom surrounding 4.35% following a three-day downtrend.
It’s worth noting that the easing Fed fears, optimism about the US debt-limit agreement’s passage and stellar performance of the technology shares allowed Wall Street to remain positive the previous day.
While tracing the catalysts that triggered the risk-on mood, the market’s pricing of the Federal Reserve (Fed) rate hike, which dropped from 17 basis points (bps) in June on Wednesday to 7 bps on Thursday, gain major attention. On the same line were mixed US data and Fed talks.
With this, the US ADP Employment Change eased to 278K in May from 291K prior (revised) but crossed the 170K market forecasts. On the same line, the weekly Initial Jobless Claims rose past 230K prior to 232K, versus 235K expected. Further, US ISM Manufacturing PMI eased to 46.9 in May compared to 47.0 anticipated and 47.1 previous readings whereas S&P Global Manufacturing PMI softened to 48.4 from 48.5 prior. Additionally, the US Employment Cost Index eased while the consumer sentiment gauge improved but the details were unimpressive.
On the other hand, Federal Reserve Bank of St. Louis President James Bullard recently published an analysis wherein the Fed hawk accepts that the prospects for continued disinflation are good but not guaranteed, and continued vigilance is required.
As a result, today’s US employment report becomes more important and hence any surprise in the headline figures won’t be taken lightly. That said, Nonfarm Payrolls (NFP) to ease to 190K from 253K prior while the Unemployment Rate is also expected to increase to 3.5% from 3.4%. It should be noted that the US Senate’s passage of the debt-ceiling bill and the avoidance of the default woes, as well as the last round of the Fed talks ahead of the pre-Federal Open Market Committee (FOMC) blackout period for policymakers should also be eyed closely for clear directions.
Also read: Forex Today: The rally is finally here, and the Dollar knows it
- NZD/USD is aiming to recapture 0.6080 as the USD Index is preparing for a fresh downside.
- US equities have managed to maintain Thursday’s bullish sentiment, portraying an upbeat market mood.
- Hopes of a recession and weak economic activities are supporting a pause in the Fed’s policy-tightening spell.
The NZD/USD pair has moved to near the crucial resistance of 0.6080 in the Asian session. The Kiwi asset has gained strength as the US Dollar Index (DXY) is preparing for a fresh downside. The USD Index is expected to refresh its weekly low below 103.50 as support for a pause in the Federal Reserve (Fed)’s rate-hiking spell by some Fed policymakers has trimmed its appeal.
S&P500 futures have added some gains in Asia. US equities have managed to maintain Thursday’s bullish sentiment, portraying an improvement in the risk-appetite theme. A cheerful market mood has improved the demand for US government bonds. This has led to a sheer decline in the 10-year US Treasury yields to 3.6%.
The USD Index is expected to extend its downside journey as Fed policymakers are divided about June’s monetary policy. Hopes of a recession and weak economic activities are supporting a pause in the policy-tightening spell while stubborn core inflation and upbeat labor market conditions are favoring one more interest rate hike.
Going forward, the release of the United States Nonfarm Payrolls (NFP) data will provide clear guidance. Analysts at TD Securities see US payrolls slowing modestly in May, advancing at a still strong 200K pace for a second consecutive month. They also look for the Unemployment Rate to stay unchanged at a historical low of 3.4%, and for wage growth to print 0.3% MoM (4.4% YoY).
On the Kiwi front, upbeat Caixin Manufacturing PMI (May) infused fresh blood into the New Zealand Dollar. The economic data has landed at 50.9, higher than the consensus and the prior release of 49.5. A figure above 50.0 bifurcates expansion and contraction phases and Chinese factory activities have landed in expansionary territory.
It is worth noting that New Zealand is one of the leading trading partners of China and upbeat Chinese factory activities support the New Zealand Dollar.
- USD/CHF remains depressed, poking the key support, ahead of the key US employment report for May.
- 200-HMA, oversold RSI restrict immediate downside of Swiss Franc pair.
- Multiple hurdles, Fed concerns prod buyers amid sluggish session.
USD/CHF holds lower ground near 0.9050 during early Friday, after positing the biggest daily loss in two weeks, as the key technical catalysts challenge sellers. Apart from that, the market’s positioning for the US Nonfarm Payrolls (NFP), especially amid the latest reduction in the hawkish Fed bets, also challenges the pair sellers.
That said, the 200-Hour Moving Average (HMA) level of around 0.9050 joins the oversold RSI (14) conditions to restrict the immediate downside of the USD/CHF pair.
Even if the Swiss Franc buyers manage to conquer the key HMA, an upward-sloping support line from May 22, close to 0.9045, will act as an extra filter towards the south.
In a case where the USD/CHF bears manage to smash the 0.9045 support, a downward trajectory towards the late May bottom of near 0.9020 and then to the 0.9000 round figure can’t be ruled out, ahead of highlighting the previous monthly low of 0.8820 for sellers.
On the contrary, USD/CHF recovery needs validation from the 100-HMA level of 0.9068, as well as the US NFP, to recall the buyers.
Even so, the previous resistance line stretched from May 18, close to 0.9080, as well as 0.9100 may prod the bulls before giving them control.
In that case, the monthly high of around 0.9150, marked on Wednesday, should gain the market’s attention.
USD/CHF: Hourly chart
-02062023-638212679022655450.png)
Trend: Corrective bounce expected
- Nat-gas bears remain in control on the front side of the bearish trend.
- Bulls coming up for air but will face resistance in the correction.
Nat-gas on Thursday fell sharply to a 1-month low as the following technical analysis will illustrate. The commodity is under pressure due to ample supplies and mild US temperatures.
A weekly EIA storage report was also bearish, as it showed a 110 billion cubic feet injection that topped both forecasts and averages, and kept an inventory surplus a beefy 17% above normal.
The recent move below 2.234 is leaving the door open for further downside as follows:
NatGas H4 charts
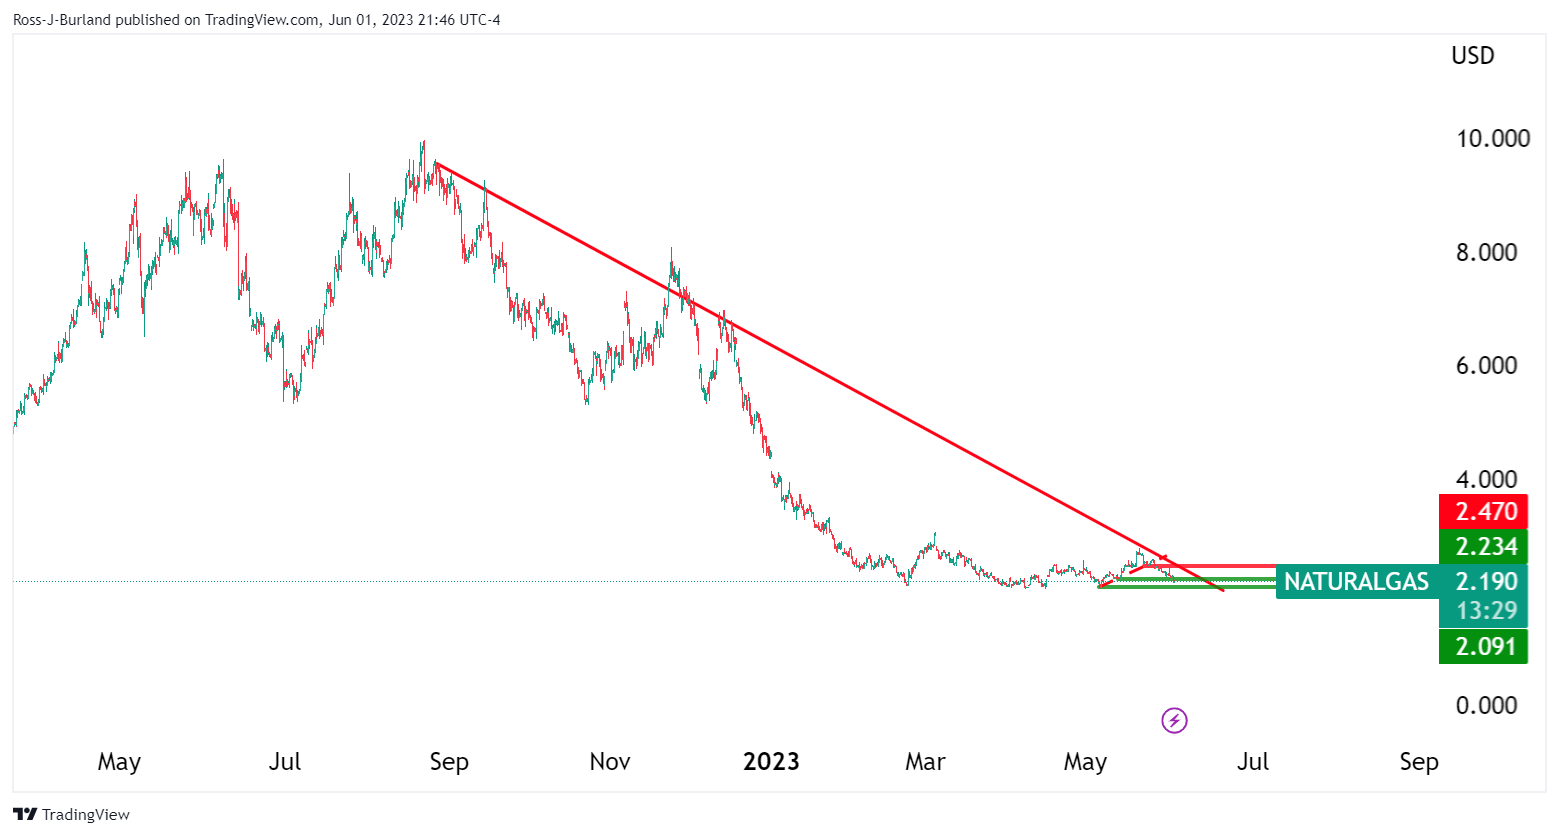
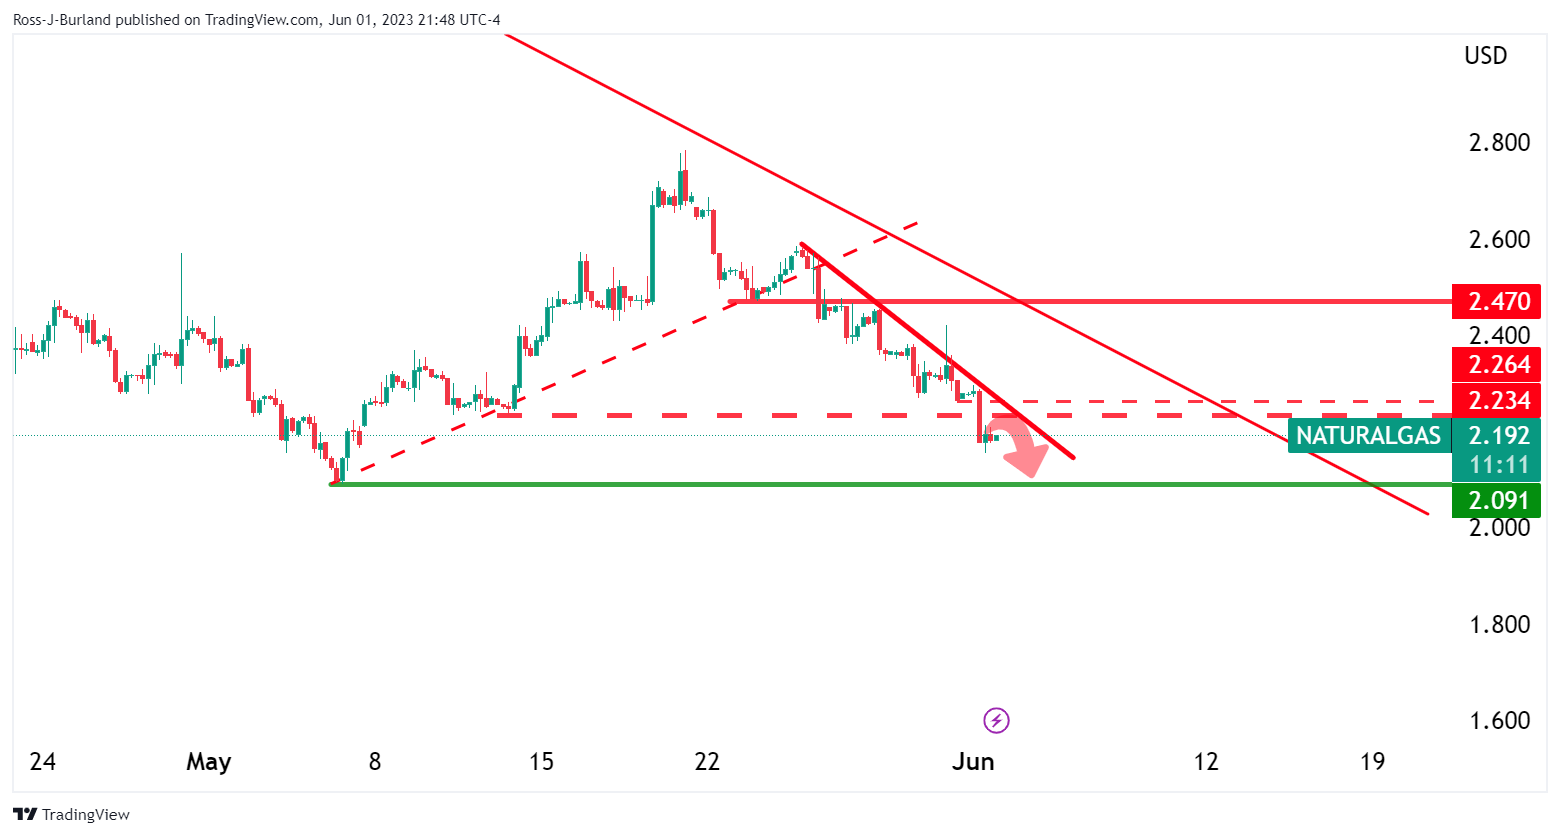
The market is still very much front side of the bearish trendlines and heading toward 2.091. However, a meanwhile correction could be on the cards:
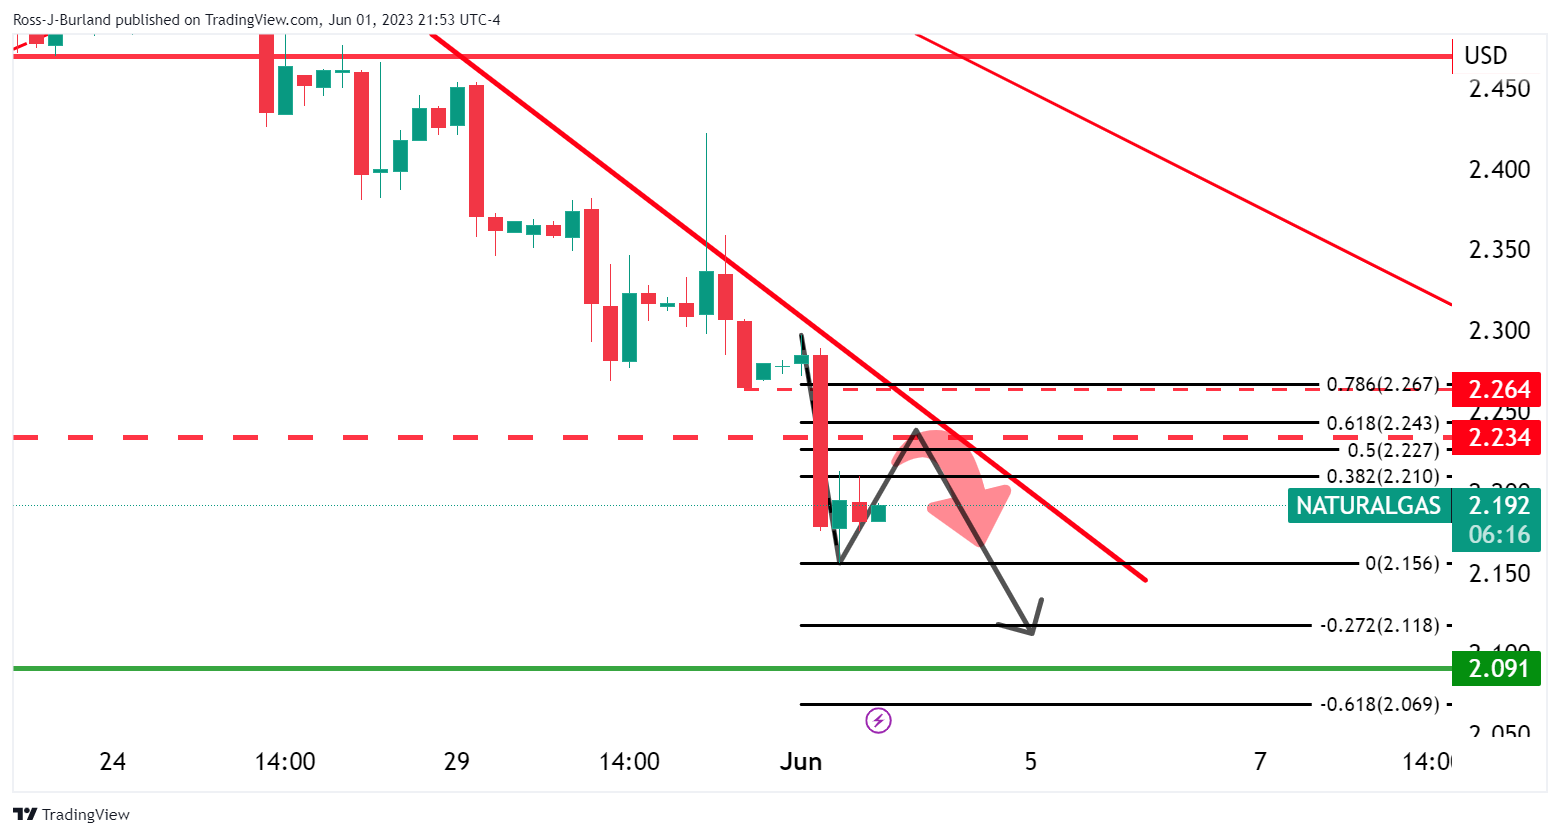
- GBP/USD struggles to extend five-day uptrend at the highest levels in two weeks.
- Hawkish BoE concerns contrast with hopes of Fed’s policy pivot to underpin Cable pair’s latest run-up.
- Cautious mood among British dealmakers, anxiety ahead of US NFP prod Pound Sterling buyers.
GBP/USD aptly portrays the pre-NFP anxiety in markets during early Friday as it seesaws around 1.2530 by the press time. In doing so, the Cable pair also justifies the latest challenges to the upside momentum flagged from London. It’s worth noting, however, that the increase in the odds favoring the monetary policy divergence between the Bank of England (BoE) and the US Federal Reserve (Fed) in the future seems to have underpinned the Pound Sterling’s latest run-up.
That said, the fears that the higher rates will negatively affect the mergers and acquisitions at home, as well as the economic performance, seemed to have prodded the British dealmakers of late. “Activity in mergers and acquisitions in Britain is at its lowest level in seven years as dealmakers remain cautious about the economic outlook,” said The Times.
On the other hand, a pause in the yields and indecisive stock futures also allowed the Cable pair buyers to take a breather.
Recently upbeat UK data and inflation clues, as well as hawkish comments from the Bank of England (BoE) officials, have favored the Pound Sterling across the board during this week. On Thursday, the UK S&P Global/CIPS Manufacturing PMI improved to 47.1 for May versus 46.9 initial estimations. Further, the latest Bank of England (BoE) Monthly Decision Maker Panel (DMP) survey, released on Thursday, businesses in the UK see the year-ahead Consumer Price Index (CPI) at 5.9% in May vs 5.6% in April.
From the US, the US ADP Employment Change eased to 278K in May from 291K prior (revised) but crossed the 170K market forecasts. On the same line, the weekly Initial Jobless Claims rose past 230K prior to 232K, versus 235K expected. Further, US ISM Manufacturing PMI eased to 46.9 in May compared to 47.0 anticipated and 47.1 previous readings whereas S&P Global Manufacturing PMI softened to 48.4 from 48.5 prior. Additionally, the US Employment Cost Index eased while the consumer sentiment gauge improved but the details were unimpressive.
It’s worth observing that Federal Reserve Bank of St. Louis President James Bullard recently published an analysis wherein the Fed hawk accepts that the prospects for continued disinflation are good but not guaranteed, and continued vigilance is required.
As a result, the market’s pricing of the Federal Reserve (Fed) rate hike dropped, from 17 basis points (bps) in June on Wednesday to 7 bps on Thursday, which in turn drowned the US Dollar Index (DXY).
To sum up, the GBP/USD pair is likely to remain firmer amid fresh expectations of the BoE’s stronger rate hikes versus the Fed’s policy pivot. However, it all depends upon today’s US employment data for May.
Technical analysis
A seven-week-old horizontal resistance area surrounding 1.2550 restricts further upside of the GBP/USD pair even if the oscillators are in favor of the bulls. The pullback moves, however, remain elusive beyond the immediate support comprising the 21-DMA level of near 1.2475.
- USD/CAD is continuously trading sideways below 1.3450 following the footprints of the USD Index.
- Seventh straight contraction in US ISM Manufacturing PMI and dovish Fed commentary weigh heavily on the USD Index.
- USD/CAD witnessed a bloodbath after failing to surpass the supply zone plotted in a range of 1.3652-1.3668.
The USD/CAD pair is demonstrating back-and-forth action below 1.3450 in the Tokyo session. The Loonie asset has muted after a perpendicular sell-off as investors are awaiting the release of the United States Nonfarm Payrolls (NFP) data for further guidance.
The US Dollar Index (DXY) is consolidating below 103.60 after a sheer fall inspired by dovish commentary from Federal Reserve (Fed) policymakers and a seventh straight contraction in the United States ISM Manufacturing PMI data.
Meanwhile, the Canadian Dollar showed some strength after a strong recovery in the oil price. At the press time, the oil price was trading sideways after a solid recovery inspired by easing hawkish Fed bets. It is worth noting that Canada is the leading exporter of oil to the United States and higher oil prices should support the Canadian Dollar.
USD/CAD witnessed a bloodbath after failing to surpass the supply zone plotted in a range of 1.3652-1.3668 on a four-hour scale. A formation of the Double Top chart pattern that supports a bearish reversal added to the downside filters.
The Relative Strength Index (RSI) (14) has shifted into the bearish range of 20.00-40.00, indicating more weakness ahead.
A further breakdown below June 01 low at 1.3436 will expose the Loonie asset to the horizontal resistances plotted around May 16 low at 1.3404 and May 08 low at 1.3315.
Ina n alternate scenario, a fresh buy would come above May 26 high at 1.3655, which would drive the asset toward the round-level resistance at 1.3700 followed by March 27 high at 1.3745.
USD/CAD four-hour chart
Bank of Japan Governor Haruhiko Kuroda said that it will take some time to reach the 2% price goal. He added that he can't say when the 2% goal will be reached. He argues that trend inflation likely will heighten ahead but it will take time.
More to come...
In recent trade today, the People’s Bank of China (PBOC) set the yuan at 7.0939 vs. the prior close of 7.0990.
About the fix
China maintains strict control of the yuan’s rate on the mainland.
The onshore yuan (CNY) differs from the offshore one (CNH) in trading restrictions, this last one is not as tightly controlled.
Each morning, the People’s Bank of China (PBOC) sets a so-called daily midpoint fix, based on the yuan’s previous day's closing level and quotations taken from the inter-bank dealer.
- EUR/JPY has moved above 149.50 after a sideways performance fueled by hawkish ECB bets.
- ECB Lagarde is expected to raise interest rates despite significant deceleration in Eurozone inflation.
- The BoJ is expected to tweak its YCC for keeping inflation steadily above 2%.
The EUR/JPY pair has climbed above the immediate resistance of 149.50 in the Asian session. The cross remained sideways but is looking to extend its upside as hawkish European Central Bank (ECB) bets are still solid despite softening of Eurozone inflation in May.
After a sheer deceleration in Germany, France, and Spain's inflation, Eurozone inflation carry-forwarded the trail and reported lower-than-anticipated Harmonized Index of Consumer Prices (HICP) figures as individuals are surrendering luxuries due to higher cost of living. Monthly headline HICP remained flat vs. former expansion of 0.6% while annual HICP decelerated heavily to 6.1% from the estimates of 6.3% and the former release of 7.0%.
In addition to that, monthly core inflation expanded by 0.2% at an extremely slower pace against estimates of 0.8%. Annual core HICP softened to 5.3% from the estimates of 5.5%. ECB policymakers are still worried about persistence in core inflation.
A sheer slowdown in Eurozone inflationary pressures and a recession situation in Germany divided investors that the ECB could consider a pause in its June monetary policy meeting. However, ECB President Christine Lagarde said in an appearance on Thursday, “We need to continue our hiking cycle until we are sufficiently confident that inflation is on track to return to our target in a timely manner.”
On the Japanese Yen front, a volatile action is expected as the Bank of Japan (BoJ) is expected to tweak its Yield Curve Control (YCC) for keeping inflation steadily above 2%. Also, BoJ Governor Kazu Ueda cited that bond-buying operations will continue ahead.
- Silver Price remains at weekly high, prods three-day uptrend.
- 50-EMA tests XAG/USD buyers amid steady RSI, looming bull cross on MACD.
- Silver sellers need validation from 200-EMA; five-month-old horizontal area appears a tough nut to crack for XAG/USD bulls.
Silver Price (XAG/USD) retreats from the weekly top of $23.92, mildly offered amid Friday’s Asian session, as the metal buyers jostle with the 50-day Exponential Moving Average (EMA) ahead of the key US jobs report for May.
Even so, the XAG/USD’s sustained break of the previous key resistance confluence around $23.50, comprising the 100-EMA and a two-week-old descending trend line, keeps the Silver buyers hopeful. Adding strength to the upside bias is the steady RSI (14) line near the 50.00 mark, as well as the impending bull cross on the MACD.
With this, the Silver Price is likely to cross the immediate 50-EMA hurdle of around $23.95 and can prod the $24.00 round figure. However, multiple levels marked since early January, around the $24.55-65 zone, will challenge the XAG/USD bulls afterward.
In a case where the XAG/USD price remains firmer past $24.65, the odds of witnessing the $25.00 round figure on the chart can’t be ruled out whereas the yearly high marked in May near $26.15 may lure the Silver buyers then after.
On the contrary, the stated resistance-turned-support confluence near $23.50, restricts the nearby downside of the bright metal.
Following that, the 200-EMA level of around $22.85 and the previous monthly low of $22.68 will be in the spotlight.
Silver Price: Daily chart
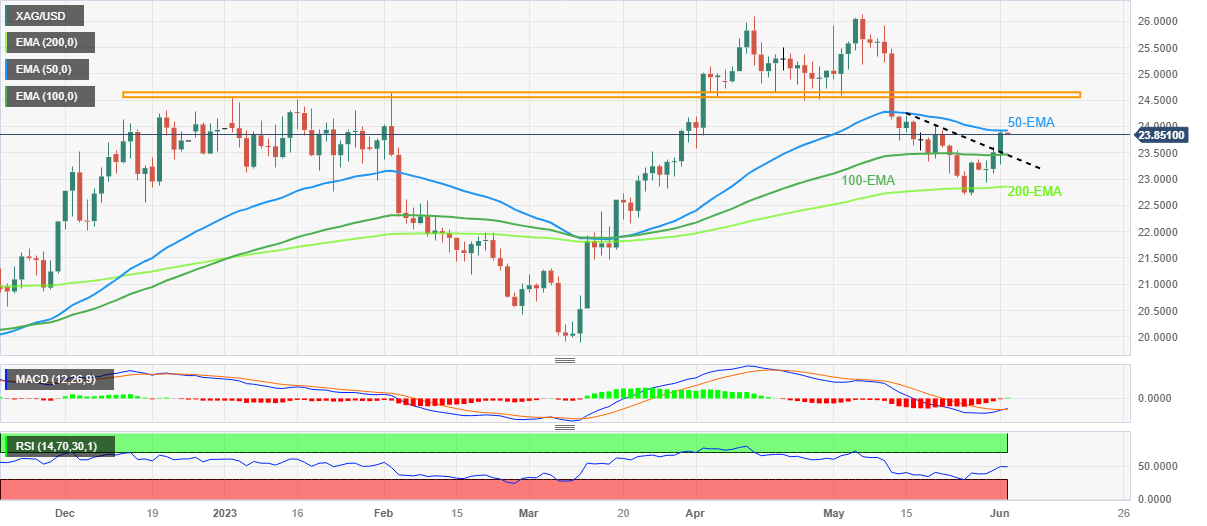
Trend: Further upside expected
- AUD/USD bulls eye a move higher to test a key resistance area.
- Bears note the W-formation´s neckline on the downside.
AUDUSD advanced mid-week and extended the gains on Thursday´s New York session as the US Dollar tumbled. AUD was helped by better China factory data and due to the hopes that the Federal Reserve will pause the rate hike. The currency has moved away from a 6-1/2 month low made on Wednesday and is recouping some of the 1.7% loss made last month. The following illustrates the technical structure and prospects of a continuation before the next leg lower.
AUD/USD daily chart
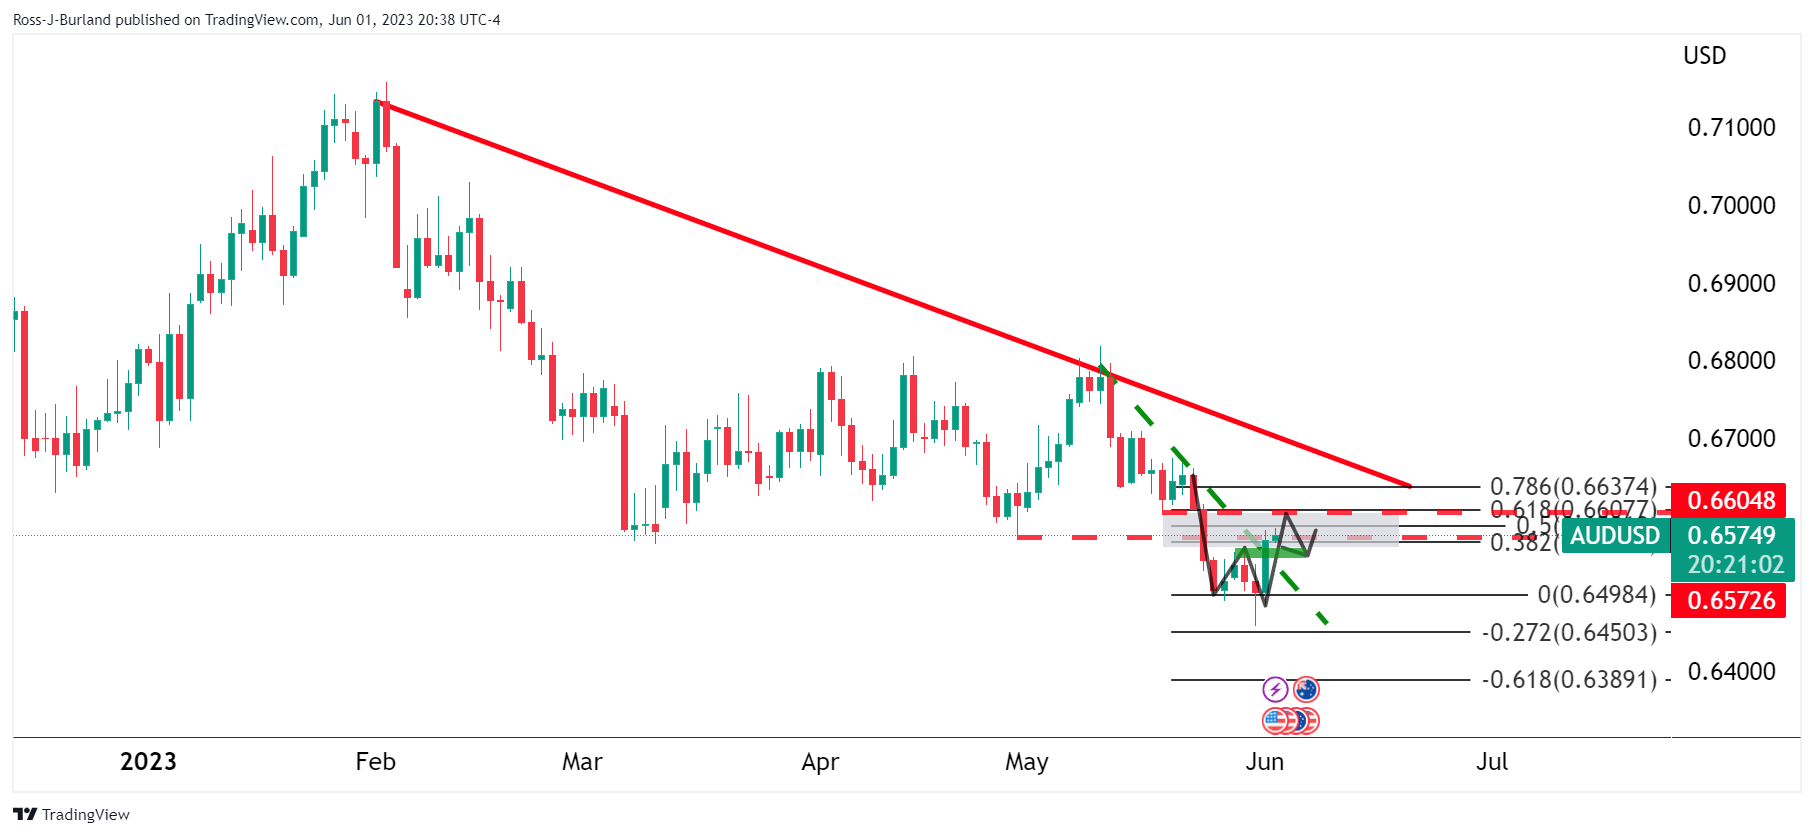
The price is still in a bearish territory while below the trendline resistance, submerged by the horizontal resistance as well. There are prospects of a move to the 50% mean reversion area and then the 61.8% Fibonacci level. This, in turn, will leave behind a W-formation, a reversion pattern:
AUD/USD H1 charts
The neckline will be eyed in the 0.6660s for a restest as support as follows:
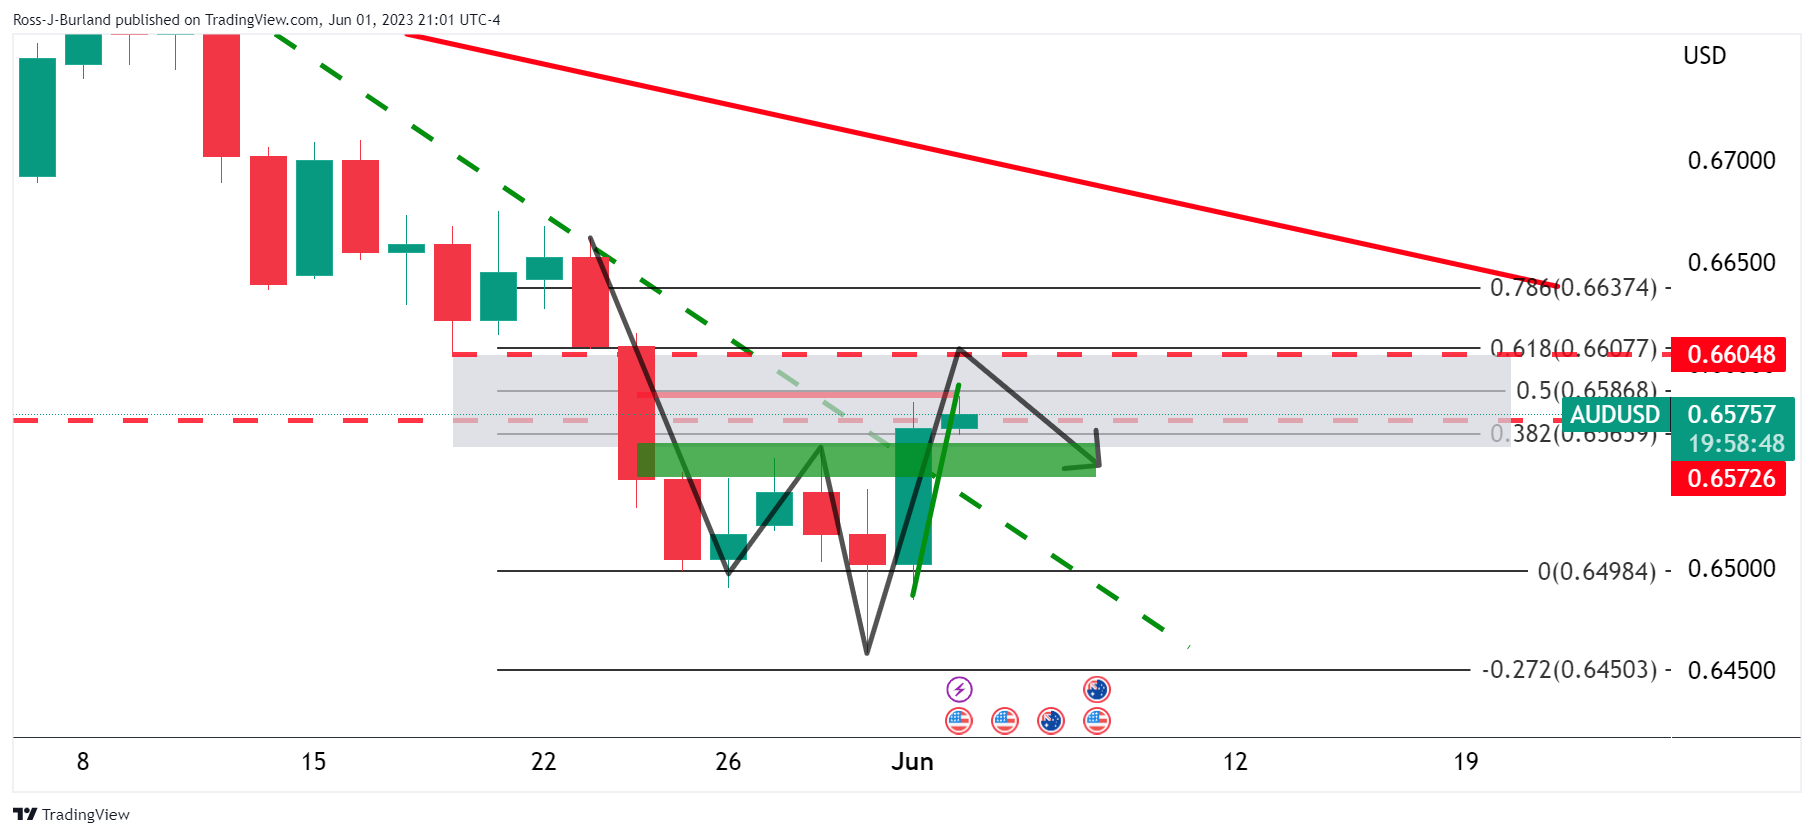
- USD/JPY snaps four-day downtrend with mild gains at weekly low.
- Market’s consolidation ahead of US NFP, lack of major data/events elsewhere allows Yen pair bears to take a breather.
- Receding hawkish Fed bets highlight today’s US jobs report, downbeat statistics can please Yen buyers.
USD/JPY pares weekly losses around 138.85-90 during early Friday’s boring session as traders await the US jobs report amid a light calendar in Japan. Adding strength to the market’s inaction could be the mixed feelings about the US Federal Reserve (Fed) and the Bank of Japan (BoJ) of late, as well as the inactive bond market by the press time.
That said, the US 10-year Treasury bond yields prints the first daily gain in six as it bounces off a two-week low to 3.61% by the press time whereas the two-year counterpart steadies near the weekly bottom surrounding 4.35% following a three-day downtrend. It should be noted that the S&P500 Futures remain mildly positive despite the upbeat performance of Wall Street.
On the other hand, the US Dollar weakness is the biggest catalyst to favor the Yen buyers. That said, US Dollar Index (DXY) seesaws around 103.56 by the press time, after falling the most in a month while reversing from the highest levels since mid-March the previous day.
If we trace the main culprits for the USD’s fall, the market’s pricing of the Fed rate hike and cautious optimism about China, as well as the US debt ceiling agreement seem to gain major attention. It should be noted that interest rate futures suggest the market’s pricing of the Federal Reserve (Fed) rate hike dropped, from 17 basis points (bps) in June on Wednesday to 7 bps on Thursday. Behind the reduction in the hawkish Fed bets are the recently mixed US data and an absence of strong Fed talks.
Talking about the data, US ADP Employment Change eased to 278K in May from 291K prior (revised) but crossed the 170K market forecasts. On the same line, the weekly Initial Jobless Claims rose past 230K prior to 232K, versus 235K expected. Further, US ISM Manufacturing PMI eased to 46.9 in May compared to 47.0 anticipated and 47.1 previous readings whereas S&P Global Manufacturing PMI softened to 48.4 from 48.5 prior. Additionally, the US Employment Cost Index eased while the consumer sentiment gauge improved but the details were unimpressive.
Elsewhere, Federal Reserve Bank of St. Louis President James Bullard recently published an analysis wherein the Fed hawk accepts that the prospects for continued disinflation are good but not guaranteed, and continued vigilance is required.
At home, higher inflation numbers and Retail Trade data, published earlier in the week, pushes the Bank of Japan (BoJ) towards higher rates even if the International Monetary Fund’s (IMF) Chief Economist Pierre-Olivier Gourinchas said on Thursday, it is “too early for the Bank of Japan (BoJ) to tighten monetary policy as re-anchoring inflation expectations to its 2% target will take time.
Moving on, monthly US employment clues and the last round of the Fed talks ahead of the pre-Federal Open Market Committee (FOMC) blackout period for policymakers will be eyed closely for clear directions. Forecasts suggest the headline Nonfarm Payrolls (NFP) to ease to 190K from 253K prior while the Unemployment Rate is also expected to increase to 3.5% from 3.4%. It should be noted that the US Senate’s passage of the debt-ceiling bill and the avoidance of the default woes should also be eyed for a clear guide.
Technical analysis
Despite the latest rebound, the USD/JPY pair remains below the 10-DMA immediate hurdle of around 139.50, which in turn joins the bearish MACD signals and steady RSI (14) line to keep the pair sellers hopeful.
| Index | Change, points | Closed | Change, % |
|---|---|---|---|
| NIKKEI 225 | 260.13 | 31148.01 | 0.84 |
| Hang Seng | -17.36 | 18216.91 | -0.1 |
| KOSPI | -7.95 | 2569.17 | -0.31 |
| ASX 200 | 19.5 | 7110.8 | 0.27 |
| DAX | 189.64 | 15853.66 | 1.21 |
| CAC 40 | 38.73 | 7137.43 | 0.55 |
| Dow Jones | 153.3 | 33061.57 | 0.47 |
| S&P 500 | 41.19 | 4221.02 | 0.99 |
| NASDAQ Composite | 165.69 | 13100.98 | 1.28 |
- Gold price is aiming for a sustained break above $1,980 as Fed policymakers are divided about June’s interest rate policy.
- Fed Harker and Jefferson advocated a pause in the policy-tightening spell while Fed Mester sees no reason for a pause.
- Gold price is gathering strength for breaking above the horizontal resistance at $1,984.25 after a downward-sloping trendline breakout.
Gold price (XAU/USD) has sensed marginal selling pressure after failing to sustain above the crucial resistance of $1,980.00 in the Asian session. The precious metal showed a solid upside on Thursday, capitalizing efficiently on a sell-off in the US Dollar Index (DXY).
S&P500 futures have added nominal gains in Asia. The risk-appetite theme is in action as US equities were heavily bought on Thursday after Federal Reserve (Fed) policymakers remained divided over their stance about interest rate guidance for June’s monetary policy meeting.
The US Dollar Index (DXY) was badly beaten after support for a pause in the rate-hiking spell from Fed policymakers. Philadelphia Federal Reserve Bank President Patrick Harker and Fed Governor Philip Jefferson favored a neutral interest rate policy and advised them to remain dependent on economic indicators. However, Cleveland Fed Bank President, Loretta Mester doesn’t see a compelling reason of pausing the policy-tightening regime.
It seems that confusion over interest rate action would ease sharply after the release of the United States Nonfarm Payrolls (NFP) data (May). Analysts at Wells Fargo expect NFP to increase by 200K. They believe it is important to keep a close eye on wage growth and the labor force participation numbers. The labor force has grown at a healthy pace over the past year, and a further deceleration in wages alongside expanding supply would be an encouraging sign in the Federal Reserve's fight to get inflation back to 2%.
Gold technical analysis
Gold price has delivered a breakout of the downward-sloping trendline plotted from an all-time high at $2,079.76 on a two-hour scale. The precious metal is gathering strength for breaking above the horizontal resistance plotted from May 19 high at $1,984.25.
A bull cross, represented by the 20-and 50-period Exponential Moving Averages (EMAs) at $1,954.70, advocates more upside ahead.
The Relative Strength Index (RSI) (14) has shifted into the bullish range of 60.00-80.00, which indicates that the upside momentum is active now.
Gold two-hour chart
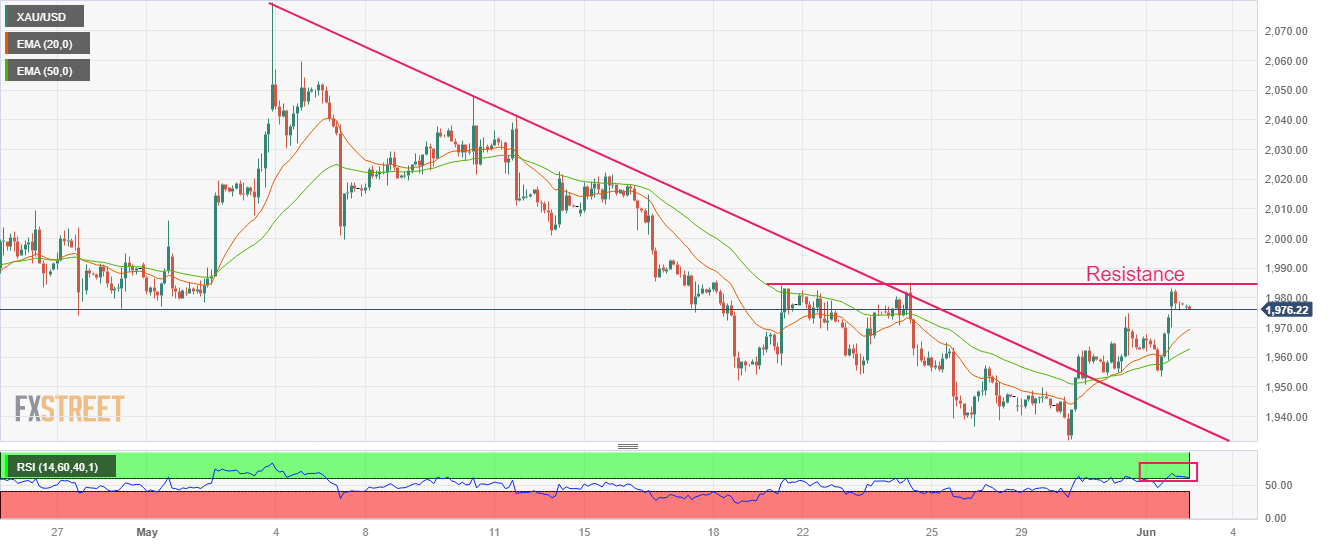
- EUR/USD bulls approach 100-day EMA hurdle after rising the most in seven weeks.
- Clear rebound from multi-day-old ascending support line, 200-day EMA favors buyers.
- 100-day EMA, downbeat RSI and US NFP may recall Euro bears in case of surprises.
EUR/USD seesaws around 1.0760 during Friday’s sluggish Asian session, after rising the most in nearly two months the previous day. In doing so, the Euro pair portrays the pre-NFP consolidation amid a cautious mood and a light calendar, as well as mixed technical catalysts.
Also read: Forex Today: The rally is finally here, and the Dollar knows it
That said, the Euro pair’s successful break of a one-month-old descending trend line joins the receding bearish bias of the MACD indicator to keep the EUR/USD bulls hopeful in crossing the immediate hurdle comprising the 100-day Exponential Moving Average (EMA) of near 1.0775.
However, the RSI (14) line remains below 50.0 and suggests a lack of upside momentum, which in turn may join a surprise improvement in the US jobs report, which is less likely, to recall the EUR/USD bears.
In a case where the EUR/USD crosses the 1.0775 hurdle, the 1.0800 round figure and the late May swing high near 1.0835 may prod the bulls.
On the flip side, a convergence of the previous resistance line and the 200-day EMA, around 1.0690-85, restrict immediate declines of the EUR/USD pair ahead of the previously mentioned rising support line from October 2022, close to 1.0635 at the latest.
It’s worth noting that the EUR/USD pair’s weakness past 1.0635 makes it vulnerable to drop toward the yearly low of around 1.0480 marked in January.
EUR/USD: Daily chart
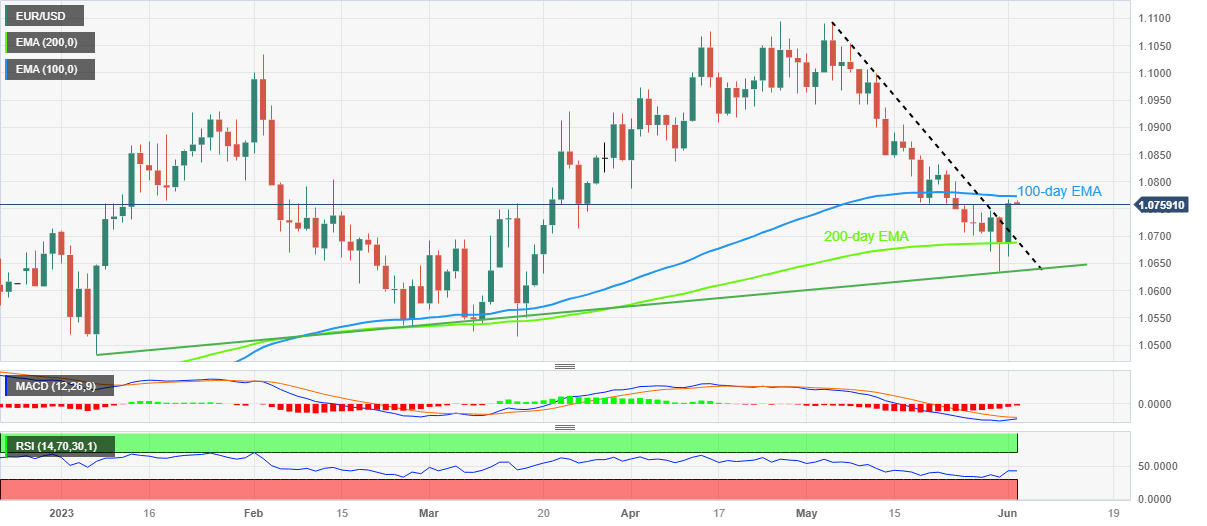
Trend: Limited upside expected
| Pare | Closed | Change, % |
|---|---|---|
| AUDUSD | 0.65716 | 1.06 |
| EURJPY | 149.355 | 0.31 |
| EURUSD | 1.07608 | 0.68 |
| GBPJPY | 173.839 | 0.33 |
| GBPUSD | 1.25224 | 0.68 |
| NZDUSD | 0.60674 | 0.85 |
| USDCAD | 1.34462 | -0.94 |
| USDCHF | 0.90544 | -0.56 |
| USDJPY | 138.803 | -0.36 |
Australia's central bank will keep key interest rate unchanged at 3.85% on Tuesday despite inflation staying well above the target range,” per the latest Reuters poll of nearly 30 economists.
Key findings
While expectations for future rate hikes were very much alive, a strong three-quarters majority of economists, or 22 of 30, forecast the RBA to hold its official cash rate at 3.85% on June 6.
The remaining eight in the poll taken between May 29 and June 1 poll expected a 25 basis point hike.
Interest rate futures were pricing in a roughly one-in-three chance of a rate hike then.
More than half of respondents, or 18 of 28, expected rates to reach 4.10% or higher by end-September, including four who saw rates at 4.35%. The remaining 10 expected rates to stay at 3.85%.
Also read: AUD/USD bulls await Aussie wage announcements, US NFP on the way to 0.6600


© 2000-2026. Bản quyền Teletrade.
Trang web này được quản lý bởi Teletrade D.J. LLC 2351 LLC 2022 (Euro House, Richmond Hill Road, Kingstown, VC0100, St. Vincent and the Grenadines).
Thông tin trên trang web không phải là cơ sở để đưa ra quyết định đầu tư và chỉ được cung cấp cho mục đích làm quen.
Giao dịch trên thị trường tài chính (đặc biệt là giao dịch sử dụng các công cụ biên) mở ra những cơ hội lớn và tạo điều kiện cho các nhà đầu tư sẵn sàng mạo hiểm để thu lợi nhuận, tuy nhiên nó mang trong mình nguy cơ rủi ro khá cao. Chính vì vậy trước khi tiến hành giao dịch cần phải xem xét mọi mặt vấn đề chấp nhận tiến hành giao dịch cụ thể xét theo quan điểm của nguồn lực tài chính sẵn có và mức độ am hiểu thị trường tài chính.
Sử dụng thông tin: sử dụng toàn bộ hay riêng biệt các dữ liệu trên trang web của công ty TeleTrade như một nguồn cung cấp thông tin nhất định. Việc sử dụng tư liệu từ trang web cần kèm theo liên kết đến trang teletrade.vn. Việc tự động thu thập số liệu cũng như thông tin từ trang web TeleTrade đều không được phép.
Xin vui lòng liên hệ với pr@teletrade.global nếu có câu hỏi.
ngân hàng