- Phân tích
- Tin tức và các công cụ
- Tin tức thị trường
Tin tức thì trường
- AUD/USD pares the previous day’s losses as RBA Governor Lowe sounds hawkish.
- RBA’s Lowe shows readiness to do “What is necessary” to tame inflation in next few years.
- Mixed sentiment, US Dollar’s retreat adds strength to the recovery moves ahead of the key Aussie data/events.
- Australia monthly inflation, China official PMIs, US employment clues and US Senate voting on debt ceiling deal eyed.
AUD/USD picks up bids to pare the previous day’s losses around 0.6520, after snapping a two-day uptrend, as Reserve Bank of Australia (RBA) Governor Philip Lowe sounds hawkish on early Wednesday in Asia.
That said, RBA Governor Lowe said, “(He) will do what is necessary to make sure inflation comes back to target range in next few years.”
Also read: RBA’s Lowe: Nominal wage growth has not been source of inflation
Apart from hawkish testimony from RBA’s Lowe, the market’s consolidation ahead of the top-tier data from Australia and China, as well as the US, joins the preparations for the US Senate’s voting on the debt ceiling agreement to favor the AUD/USD rebound.
It should be noted that the US Dollar’s struggle ahead of the key data/events also exerts downside pressure on the AUD/USD price despite the latest corrective bounce off the weekly low. That said, the greenback’s latest weakness could be linked to the market’s fears that the US policymakers will turn down the agreement to tame the US default in Congress despite looming system failure on June 05. Adding strength to the DXY’s retreat is the mixed US data and month-end positioning. With this, the US Dollar Index (DXY) rose to the highest levels since mid-March on Tuesday before snapping a five-day uptrend, as well as positing the biggest daily loss since April 19, while closing the North American trading session around 104.05.
It’s worth observing that the US Conference Board's (CB) Consumer Confidence Index edged lower to 102.30 for May from an upwardly revised 103.70 prior marked in April (from 101.30). Additional details of the survey report mentioned that the one-year consumer inflation expectations ticked down to 6.1% in May from 6.2% in April. Further, the Dallas Fed Manufacturing Business Index for May dropped to -29.1 from -23.4 and versus -19.6 market expectations.
Despite the mixed data, Richmond Fed President Thomas Barkin said that he is seeing evidence that interest rate hikes are curbing demand, which in turn prods the AUD/USD buyers ahead of an important day.
Elsewhere, US Republicans like Chip Roy and Ralph Norman showed readiness to turn down the US debt ceiling agreement but softer US data put a floor under the risk-off mood.
Against this backdrop, Wall Street closed mixed but the US Treasury bond yields remained pressured.
Looking ahead, Australia’s Monthly Consumer Price Index (CPI) for May and China's NBS Manufacturing PMI, as well as Non-Manufacturing PMI, will be the key to watching for clear AUD/USD directions. That said, a positive outcome of the Senate’s voting on the measures to avoid US default, which is very much likely, can keep the greenback buyers in the driver’s seat. Also, the US JOLTS Job Openings for April are likely to ease and hence a positive surprise from the same may strengthen the hawkish Fed bets and can recall US Dollar bulls. It’s worth noting, however, that any clear negatives from the US Congress won’t be taken lightly.
Technical analysis
AUD/USD rebound remains elusive unless crossing a three-week-old descending resistance line, around 0.6560 by the press time.
- EUR/GBP is expected to surpass the immediate resistance of 0.8650 confidently ahead of Eurozone inflation.
- ECB Šimkus expects a 25 basis points (bps) rate hike in June and July to tame sticky inflation.
- More interest rate hikes are anticipated from the BoE as UK’s inflation has yet not shown promising signs of deceleration.
The EUR/GBP pair is aiming to extend its recovery from 0.8630 above the immediate resistance of 0.8650 in the early Tokyo session. The cross is getting strength ahead of the release of the preliminary Eurozone Harmonized Index of Consumer Prices (HICP) data (May), which will release on Thursday.
As per the preliminary report, core monthly HICP is seen expanding by 0.8% at a slower pace than the 1% recorded for April. Annual core HICP is expected to soften marginally to 5.5% vs. the prior release of 5.6%. The headline HICP is seen decelerating sharply to 6.3% against the former release of 7.0%.
Eurozone’s inflation has remained extremely stubborn in the past few months one month of softening would be insufficient for pausing the European Central Bank (ECB) from further policy-tightening. ECB Governing Council Gediminas Šimkus said on Tuesday that he expects a 25 basis points (bps) rate hike in June and July. This indicates that ECB’s interest rate would at least peak around 4.25%.
Apart from Thursday’s Eurozone inflation data, the speech from ECB President Christine Lagarde will be keenly watched. ECB Lagarde is expected to provide interest rate guidance for June’s monetary policy meeting.
Meanwhile, inflationary pressures in the United Kingdom economy are showing no meaningful signs of easing. On Tuesday, British Retail Consortium (BRC) reported a historic jump in shop price inflation to 9.0% since the formation of the agency in 2005. The food price inflation slowed marginally to 19.1% from the prior figure of 19.2% led by lower energy and commodity cost.
UK’s inflation has yet not shown promising signs of deceleration, therefore, more interest rate hikes are anticipated from the Bank of England (BoE) ahead. BoE Governor Andrew Bailey is expected to announce two more quarter-to-a-point interest rate hikes in the next three meetings as forecasted by Nomura.
- US Dollar Index lacks clear direction after reversing from 11-week high.
- Mixed US data, positioning for key catalysts allowed DXY bulls to retreat.
- US Senate voting on debt ceiling deal, employment clues eyed for clear directions.
US Dollar Index (DXY) renews intraday low near 104.00 while keeping the previous day’s pullback from a multi-day top amid early Wednesday. In doing so, the greenback’s gauge versus six major currencies drop for the second consecutive day after reversing from the highest levels since mid-May, as well as snapping the five-day uptrend on Tuesday.
The greenback’s latest weakness could be linked to the market’s fears that the US policymakers will stop the US debt ceiling deal in the Congress despite looming default. Adding strength to the DXY’s retreat are the mixed US data and month-end positioning.
Talking about the data, the US Conference Board's (CB) Consumer Confidence Index edged lower to 102.30 for May from an upwardly revised 103.70 prior marked in April (from 101.30). Additional details of the survey report mentioned that the one-year consumer inflation expectations ticked down to 6.1% in May from 6.2% in April. Further, the Dallas Fed Manufacturing Business Index for May dropped further to -29.1 from -23.4 and versus -19.6 market expectations.
It should be noted, however, that Richmond Fed President Thomas Barkin said that he is seeing evidence that interest rate hikes are curbing demand.
Elsewhere, US Republicans like Chip Roy and Ralph Norman showed readiness to turn down the US debt ceiling agreement but softer US data put a floor under the risk-off mood.
Against this backdrop, Wall Street closed mixed but the US Treasury bond yields remained pressured.
Although the DXY is likely to remain pressured ahead of the key data/events, a positive outcome of the Senate’s voting on the measures to avoid US default, which is very much likely, can keep the greenback buyers in the driver’s seat. Also, the US JOLTS Job Openings for April is likely to ease and hence a positive surprise from the same may strengthen the hawkish Fed bets and can recall US Dollar bulls. It’s worth noting, however, that any clear negatives from the US Congress won’t be taken lightly.
Technical analysis
Although the overbought RSI and a downside break of a two-week-old ascending trend line’s break keeps the US Dollar Index bears hopeful, the 200-day Exponential Moving Average (EMA), currently around 103.85, limits the DXY’s immediate downside.
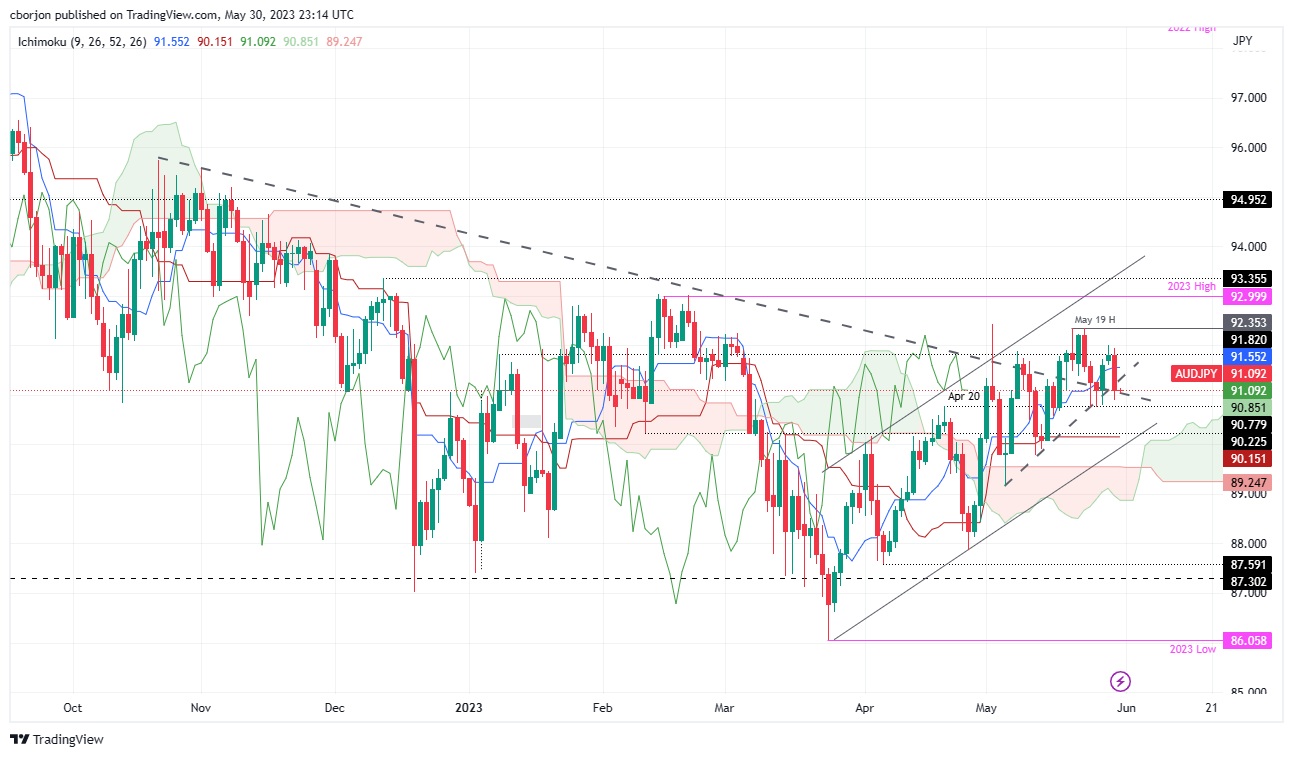
- AUD/JPY retreats from its weekly high of 92.01 and trades lower as the Asian session opens.
- The AUD/JPY break below the Ichimoku Tenkan-Sen at 91.55 cleared the path toward 91.00.
- For a bullish continuation, the AUD/JPY must claim 91.55; otherwise, a fall below 91.10/90.85 will expose 90.00.
AUD/JPY retraces from weekly highs of 92.01, drops for two straight days, on sentiment deterioration sponsored by US debt-ceiling woes, as traders brace for the release of the Australian Consumer Price Index (CPI). As the Asian session begins, the AUD/JPY is trading at 91.06, down 0.04%.
AUD/JPY Price Analysis: Technical outlook
From a daily chart perspective, the AUD/JPY is neutral to downward biased after falling below the Ichimoku Tenkan-Sen pierced at 91.55, exacerbating the fall toward the 91.00 figure. A one-month-old upslope support trendline was also broken, suggesting sellers are stepping in.
Even though the AUD/JPY is tilted downwards, a seven-month-old previous resistance trendline turned support, suggesting congestion around the 90.85/91.10 area. If AUD/JPY breaks below that area, the next support would be the Kijun-Sen line at 90.15, ahead of testing a support trendline has passed at around the 90.00 figure. Once cleared, the next support would be the top of the Ichimoku Cloud at 89.55.
Contrarily, the AUD/JPY must claim the Tenkan Sen line at 91.55 for a bullish continuation, triggering a rally toward the 92.00 figure. A breach of the latter will expose the year-to-date (YTD) high at 92.99.
AUD/JPY Price Action – Daily chart
“Nominal wage growth has not been source of inflation”, said Reserve Bank of Australia (RBA) Governor Philip Lowe while giving testimony before the Senate Economics Legislation Committee, in Canberra.
Key comments
We're in data dependent mode.
Not a single variable that drives our decisions.
Reasons for weak productivity growth complex.
Serious about inflation target, want to preserve gains in labor market.
Inflation expectations well anchored, cannot take for granted.
Entrenched inflation would lead to higher interest rates and unemployment.
Will do what is necessary to make sure inflation comes back to target range in next few years.
Market reaction
AUD/USD ticks up to 0.6520 in an immediate reaction to the statements from RBA’s Lowe. However, the Aussie pair stays defensive as it braces for a busy day ahead.
Also read: AUD/USD retreats amidst market uncertainty, US debt ceiling disputes ahead of Aussie CPI
- USD/CHF is looking to recapture the immediate resistance of 0.9080 despite the subdued USD Index.
- The Swiss Franc bulls witnessed immense selling pressure on Tuesday despite the release of upbeat Q1 GDP.
- USD/CHF is demonstrating a consolidation phase after delivering a breakout of the Wyckoff Accumulation pattern.
The USD/CHF pair has turned sideways around 0.9060 in the early Asian session after a V-shape recovery. The Swiss Franc asset is expected to recapture the crucial resistance of 0.9080 despite a subdued performance by the US Dollar Index (DXY).
Strength in the USD/CHF pair despite the sluggish USD index indicates that the Swiss Franc bulls are also weak. The Swiss Franc bulls witnessed immense selling pressure on Tuesday despite the release of upbeat Q1 Gross Domestic Product (GDP) data. Annual GDP matched expectations at 0.6% while quarterly GDP expanded by 0.3% while the street was anticipating an expansion of 0.1%.
Sheer volatility is anticipated from the US Dollar ahead of the release of the United States Automatic Data Processing (ADP) Employment data will be keenly watched. As per the consensus, the US economy added 170K jobs in May, lower than the prior addition of 296K. Later on Friday, US Nonfarm Payrolls (NFP) will release, which will provide comprehensive information about the US labor market.
USD/CHF is demonstrating a consolidation phase after delivering a breakout of the Wyckoff Accumulation pattern formed on a four-hour scale. Broadly, the Swiss franc asset is expected to display wider bullish ticks and heavy volume as bulls remain solid in the markup phase.
Currently, Relative Strength Index (RSI) (14) is oscillating in the 40.00-60.00 range, which indicates a lackluster performance. A confident break into the bullish range of 60.00-80.00 would strengthen US Dollar bulls.
Going forward, a decisive break above the immediate resistance plotted on May 30 high at 0.9084 will drive the asset toward March 28 low at 0.9137 followed by the round-level resistance of 0.9200.
In an alternate scenario, a downside move below May 16 low at 0.8929 will drag the asset toward April 14 low at 0.8867. A slippage below April 14 low will further drag the asset toward the Spring formation around May 04 low at 0.8820.
USD/CHF four-hour chart
-638210846382261541.png)
- WTI crude oil remains pressured at the lowest levels in three weeks after falling the most in a month.
- Downside break of bullish chart pattern, bearish MACD signals favor Oil sellers.
- Oversold RSI may prod WTI bears before directing them to monthly/yearly low.
- Buyers need validation from $76.85 to retake control.
WTI crude oil price holds lower grounds near $69.60 as bears take a breather during early Wednesday morning in Asia, after a heavy fall.
That said, the black gold dropped the most since May 02 on Tuesday to drag the quote towards the lowest levels in three weeks. With this, the energy benchmark broke an upward-sloping trend channel established since May 08, as well as extended the trading below the 200-SMA.
While the bullish channel rejection and sustained trading below the key SMA favor Oil price sellers, the MACD signals are also suggesting the commodity’s further downside. However, the RSI (14) is oversold and hence the quote needs to consolidate a bit before portraying the fresh fall.
With this, the $67.30-20 support area gains attention before the WTI bears can approach the monthly, as well as the yearly, low marked on May 03 around $64.30.
Meanwhile, the stated channel’s bottom line, close to $71.70 precedes the 200-SMA hurdle of around $73.93 to guard immediate recovery of the Oil price.
Following that, the aforementioned channel’s top line near $75.00 and the April 28 peak of around $76.85 may challenge the WTI bulls before giving them control.
WTI crude oil: Four-hour chart
-31052023-638210841469691070.png)
Trend: Further downside expected
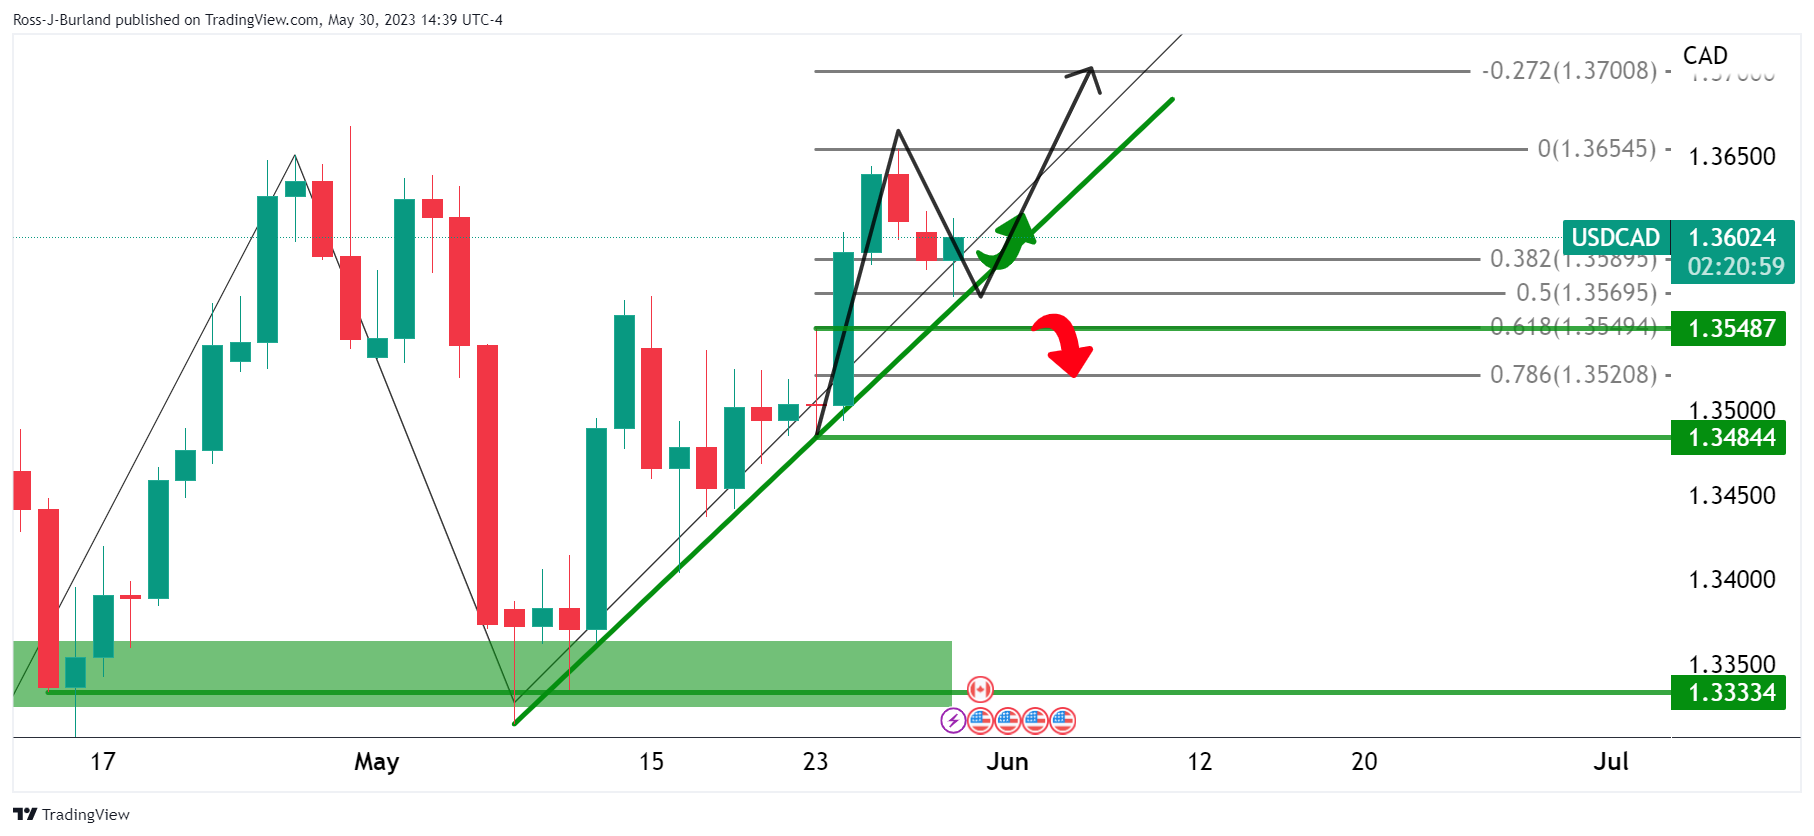
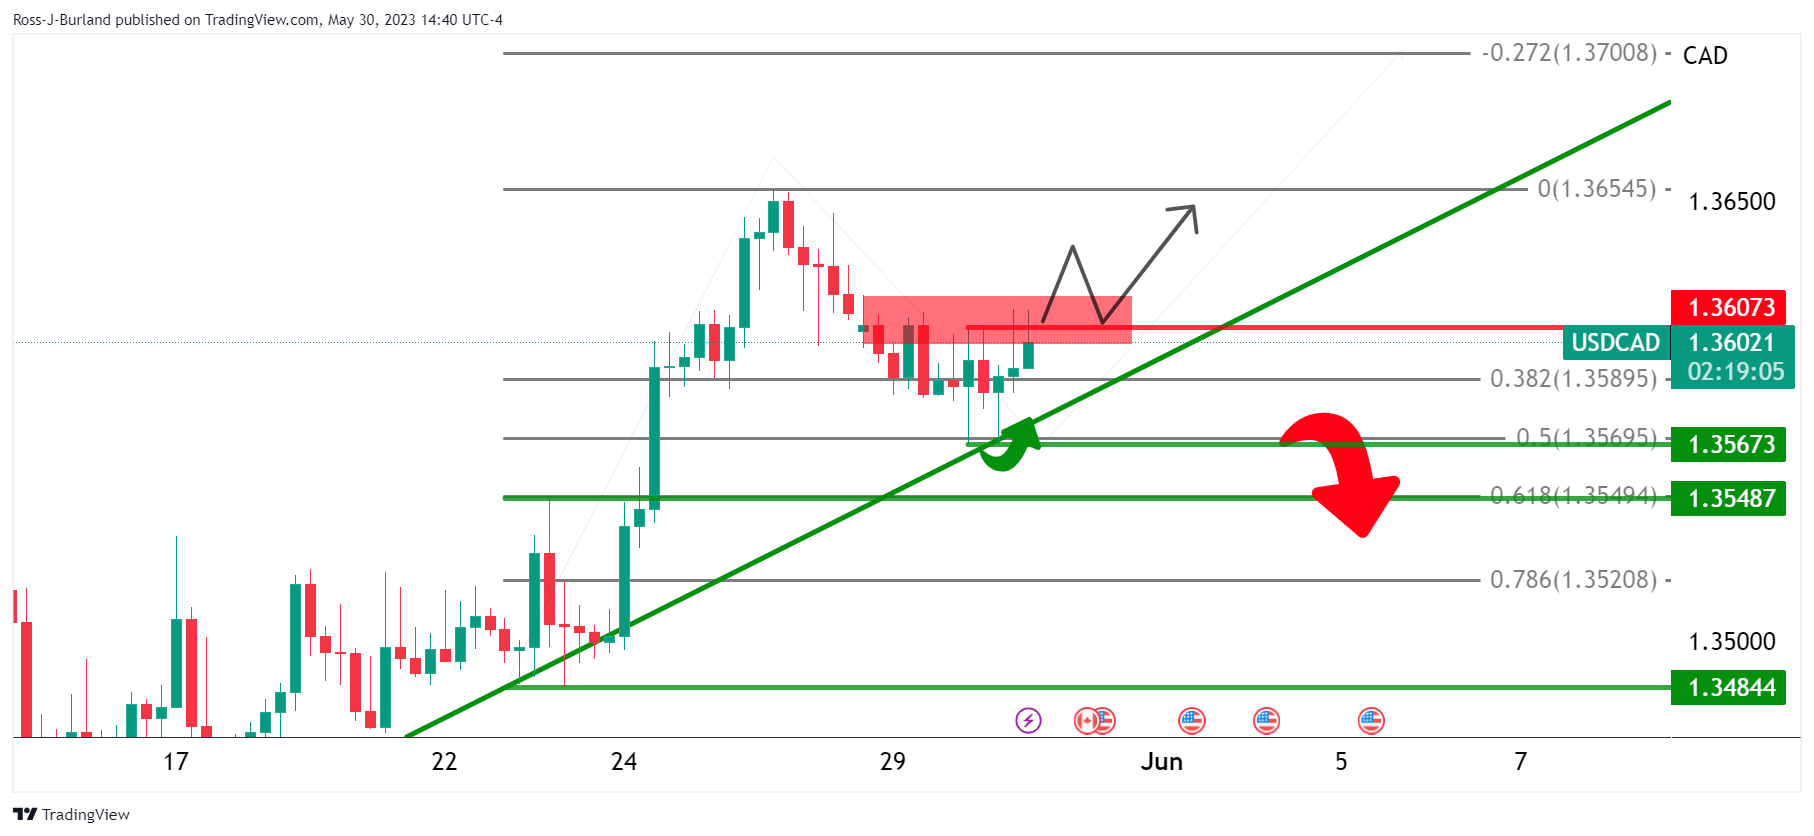
- USD/CAD fades bounce off one-week low after snapping two-day downtrend, sidelined of late.
- WTI crude oil dropped the most in four weeks amid mixed sentiment.
- Mixed US data, month-end consolidation and cautious mood before US Senate’s voting on debt ceiling deal prod US Dollar bulls.
- Canada Q1 GDP, US employment and activity clues should be eyed on calendar.
USD/CAD retreats to 1.3600 during early Wednesday’s Asian session, fading the previous day’s rebound from 1.3567 and easing from 1.3613, as it braces for the key growth numbers from Canada. Also challenging the Loonie pair could be the anxiety ahead of the US Senate voting on the debt ceiling deal. However, a slump in the WTI crude oil price weighs on the quote.
The month-end consolidation and cautious mood ahead of the top-tier data/events gain major attention. Also challenging the greenback could be the mixed US data. With this, US Dollar Index (DXY) rose to the highest levels since mid-March on Tuesday before snapping a five-day uptrend, as well as positing the biggest daily loss since April 19, while closing the North American trading session around 104.05.
On the other hand, WTI crude oil dropped to the lowest levels in four weeks, falling more than 4.0% to print the biggest daily loss since May 02 as it bears the burden of economic fears emanating from uncertainty about the US policymakers’ ability to avoid the looming default. Apart from that, hopes of more Oil output and the US push for using the Strategic Petroleum Reserve (SPR) also exert downside pressure on the black gold price.
On Tuesday, the US Conference Board's (CB) Consumer Confidence Index edged lower to 102.30 for May from an upwardly revised 103.70 prior marked in April (from 101.30). Additional details of the survey report mentioned that the one-year consumer inflation expectations ticked down to 6.1% in May from 6.2% in April. Further, US House Price Index rose 0.6% MoM versus 0.2% expected and 0.7% prior (revised from 0.5%) whereas the S&P/Case-Shiller Home Price Indices dropped to -1.1% YoY in March versus 0.4% prior and -1.6% anticipated. Additionally, the Dallas Fed Manufacturing Business Index for May dropped further to -29.1 from -23.4 and versus -19.6 market expectations.
It should be noted that an improvement in Canada’s Current Account deficit for the first quarter (Q1), to -6.17B versus -9.35B expected and -8.05B prior (revised) also exerts downside pressure on the Loonie pair.
While portraying the mood, Wall Street closed mixed but the US Treasury bond yields remained pressured as US Republicans like Chip Roy and Ralph Norman showed readiness to turn down the US debt ceiling agreement but softer US data put a floor under the risk-off mood. Elsewhere Richmond Fed President Thomas Barkin said that he is seeing evidence that interest rate hikes are curbing demand.
Looking ahead, the US JOLTS Job Openings for April and Canada's Gross Domestic Product (GDP) for Q1 will be crucial for the Loonie pair to watch for clear directions, apart from the risk catalysts mentioned above. Should the Canadian growth number surpasses the downbeat expectations, the Loonie pair may witness fresh downside pressure.
Technical analysis
USD/CAD grinds between a two-month-old descending resistance line and an upward-sloping support line from May 08, respectively near 1.3640 and 1.3570, as oscillators suggest that bulls run out of steam.
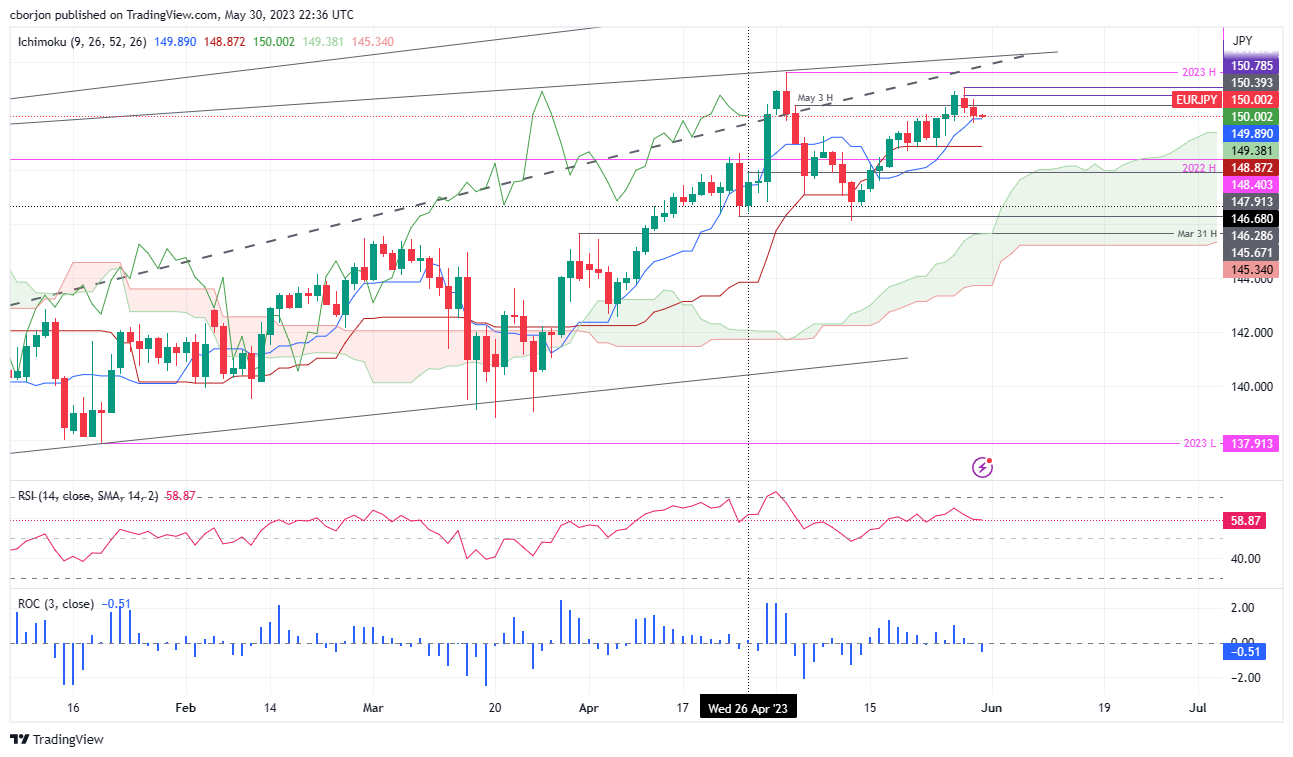
- Despite Japanese Authorities’ intervention in the FX markets, the EUR/JPY pair maintains the 150.00 mark.
- Although the EUR/JPY is upward biased, downside risks remain, with sellers eyeing the Kijun-Sen line at 148.87.
- The RSI and the Rate of Change are mixed, warranting caution, despite the EUR/JPY bullish bias.
EUR/JPY advances as the Wednesday Asian session begins after printing two consecutive days of losses, which witnessed the EUR/JPY pair falling from around the 151.00 figure toward the low 150.00s. Factors like a risk-off impulse, and Japanese Authorities’ vocal intervention in the Forex Markets, boosted the Japanese Yen (JPY). At the time of writing, the EUR/JPY exchanges hand at 150.04, almost flat.
EUR/JPY Price Analysis: Technical outlook
The cross-currency pair remains upward biased even though it dipped to the Ichimoku Tenkan-Sen at 149.89, but buyers staying around the area lifted the EUR/JPY to the 150.00 figure. Nevertheless, there’s some weakness on the pair, with two consecutive bearish sessions, suggesting that sellers are moving into the pair, trying to send the EUR/JPY towards the Kijun-Sen line at 148.87, which would exacerbate a drop towards the April 26 daily high of 147.91.
Conversely, the EUR/JPY first resistance would be the peak of the Chikou Span at 150.76, followed by the May 29 daily high at 151.07. A breach of the latter will expose the year-to-date (YTD) high at 151.61.
From an oscillator perspective, the Relative Strength Index (RSI) indicator is still bullish, while the 3-day Rate of Change (RoC) shifted bearishly.
Even though the EUR/JPY is bullishly biased, caution is warranted.
EUR/JPY Price Action – Daily chart
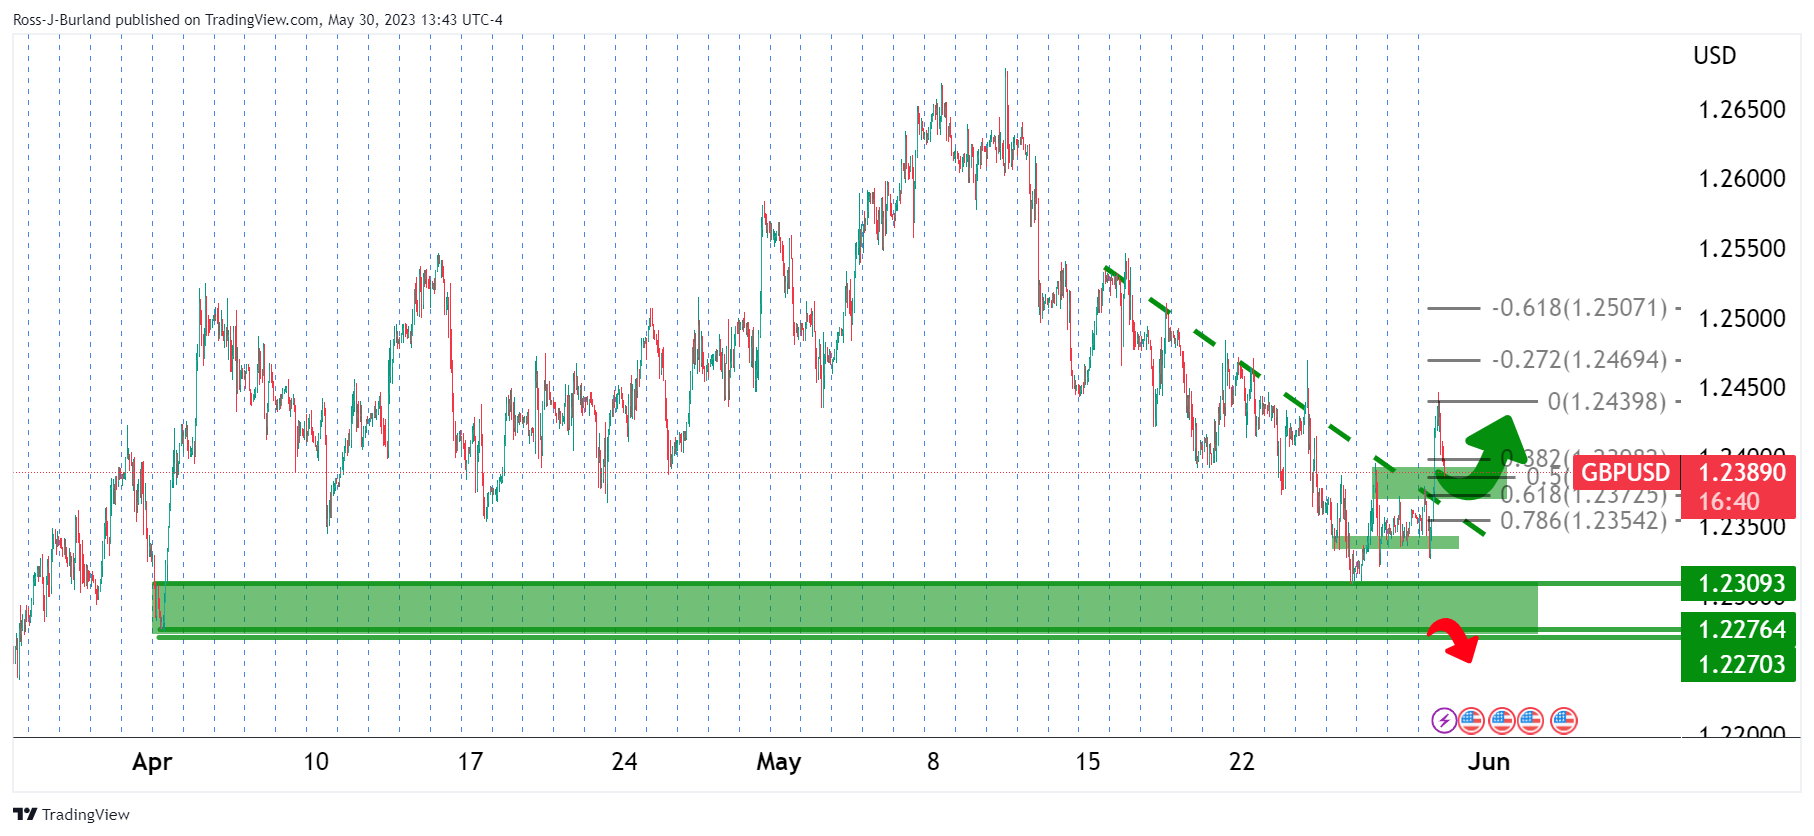
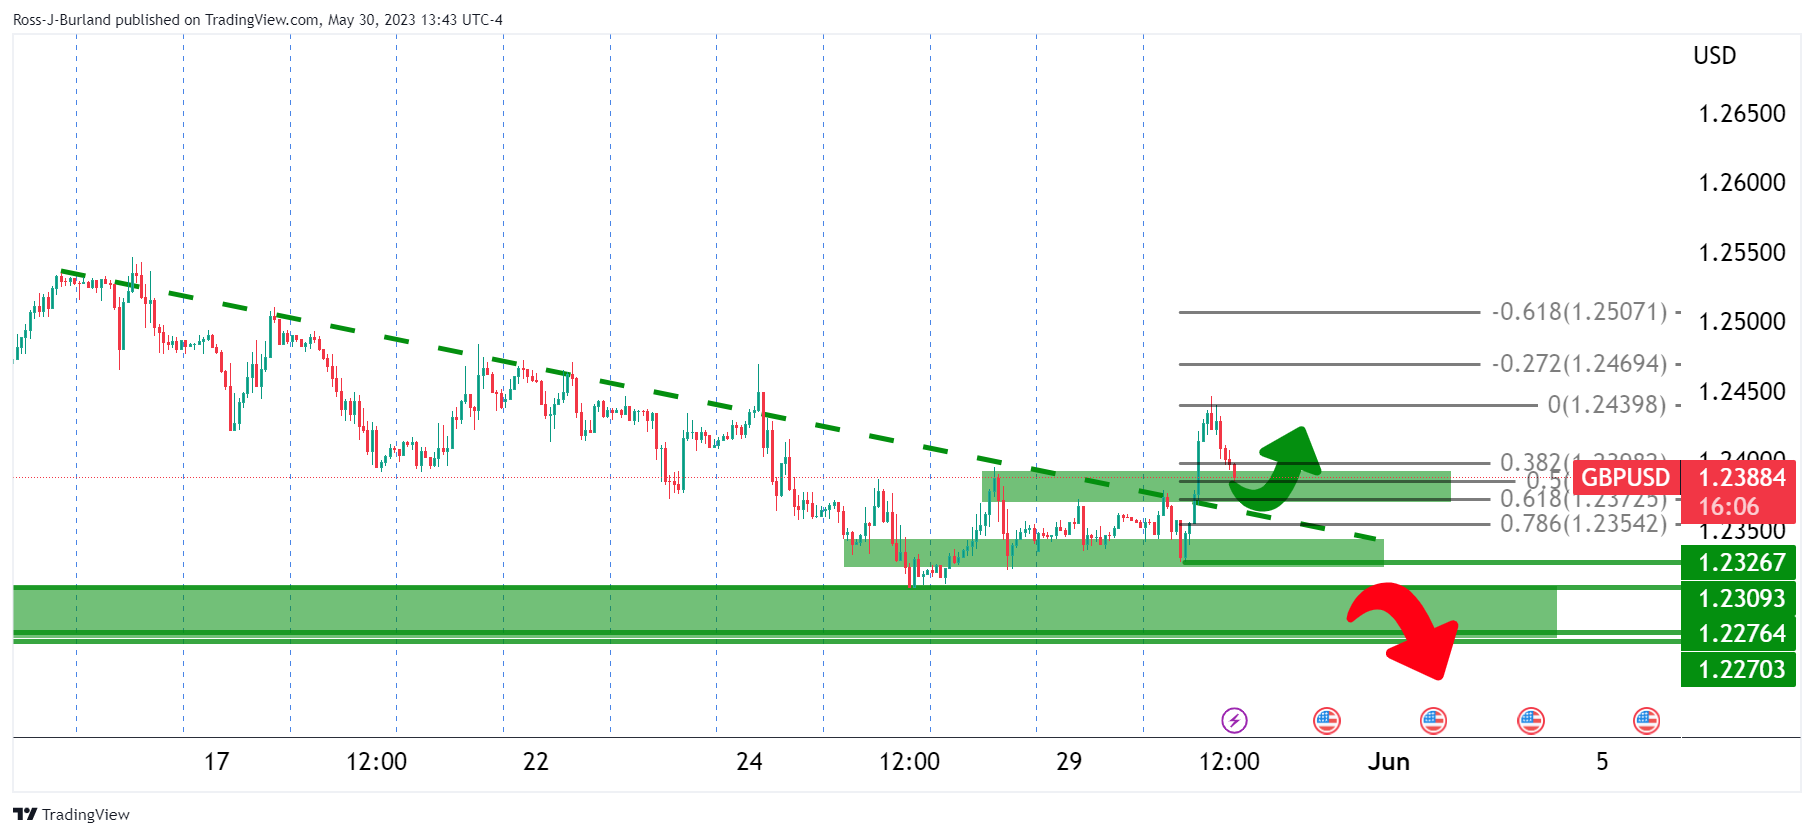
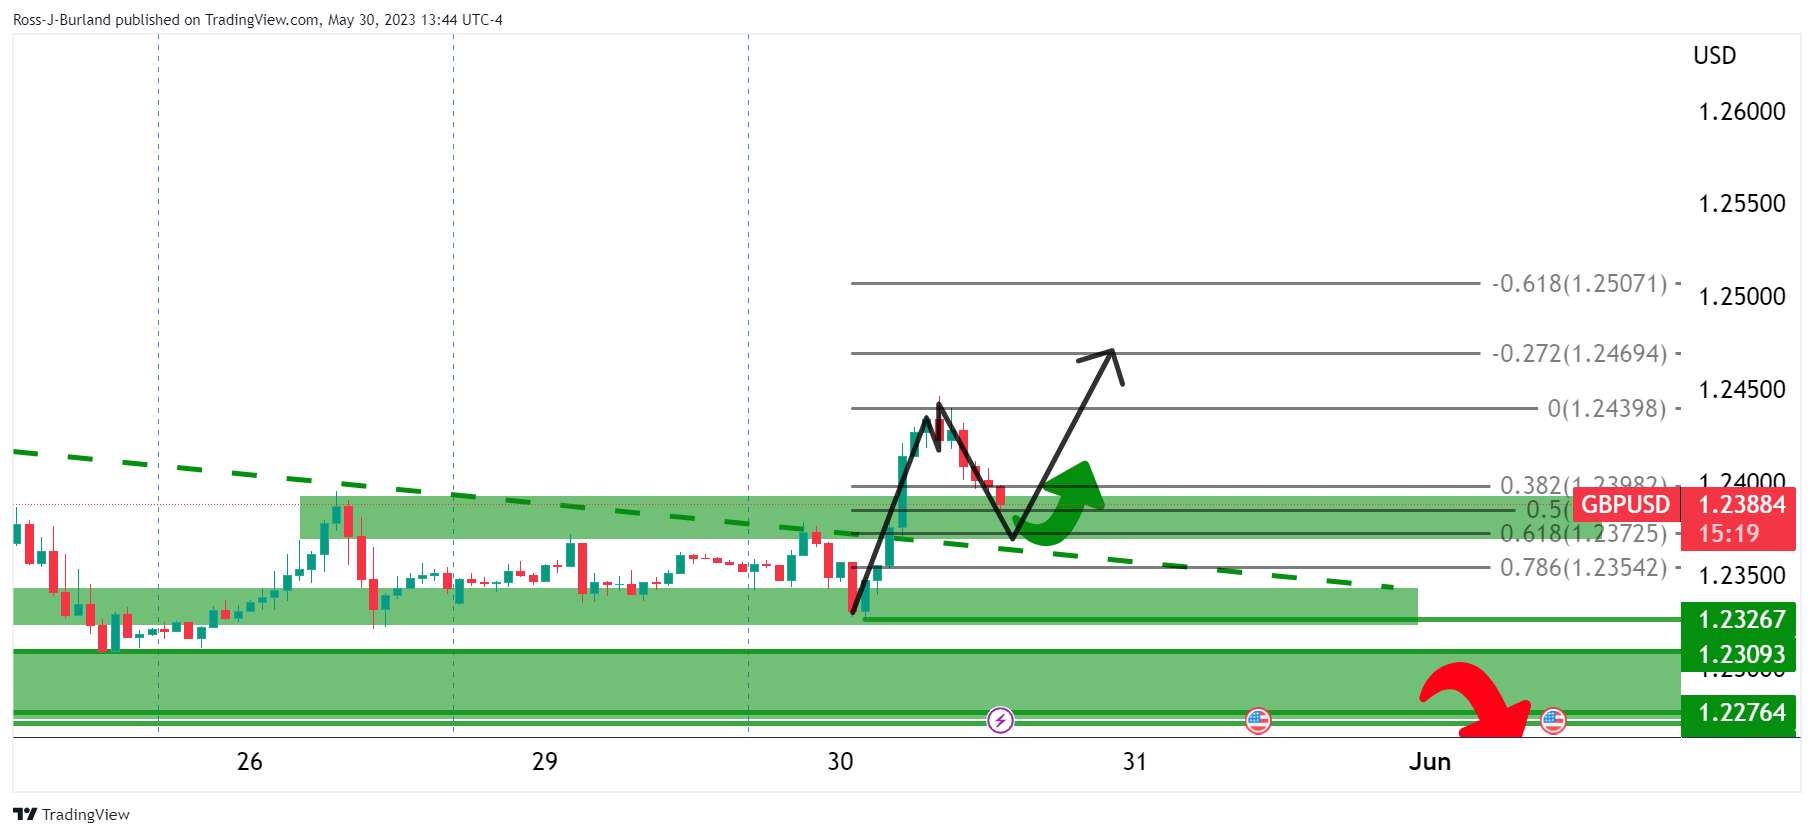
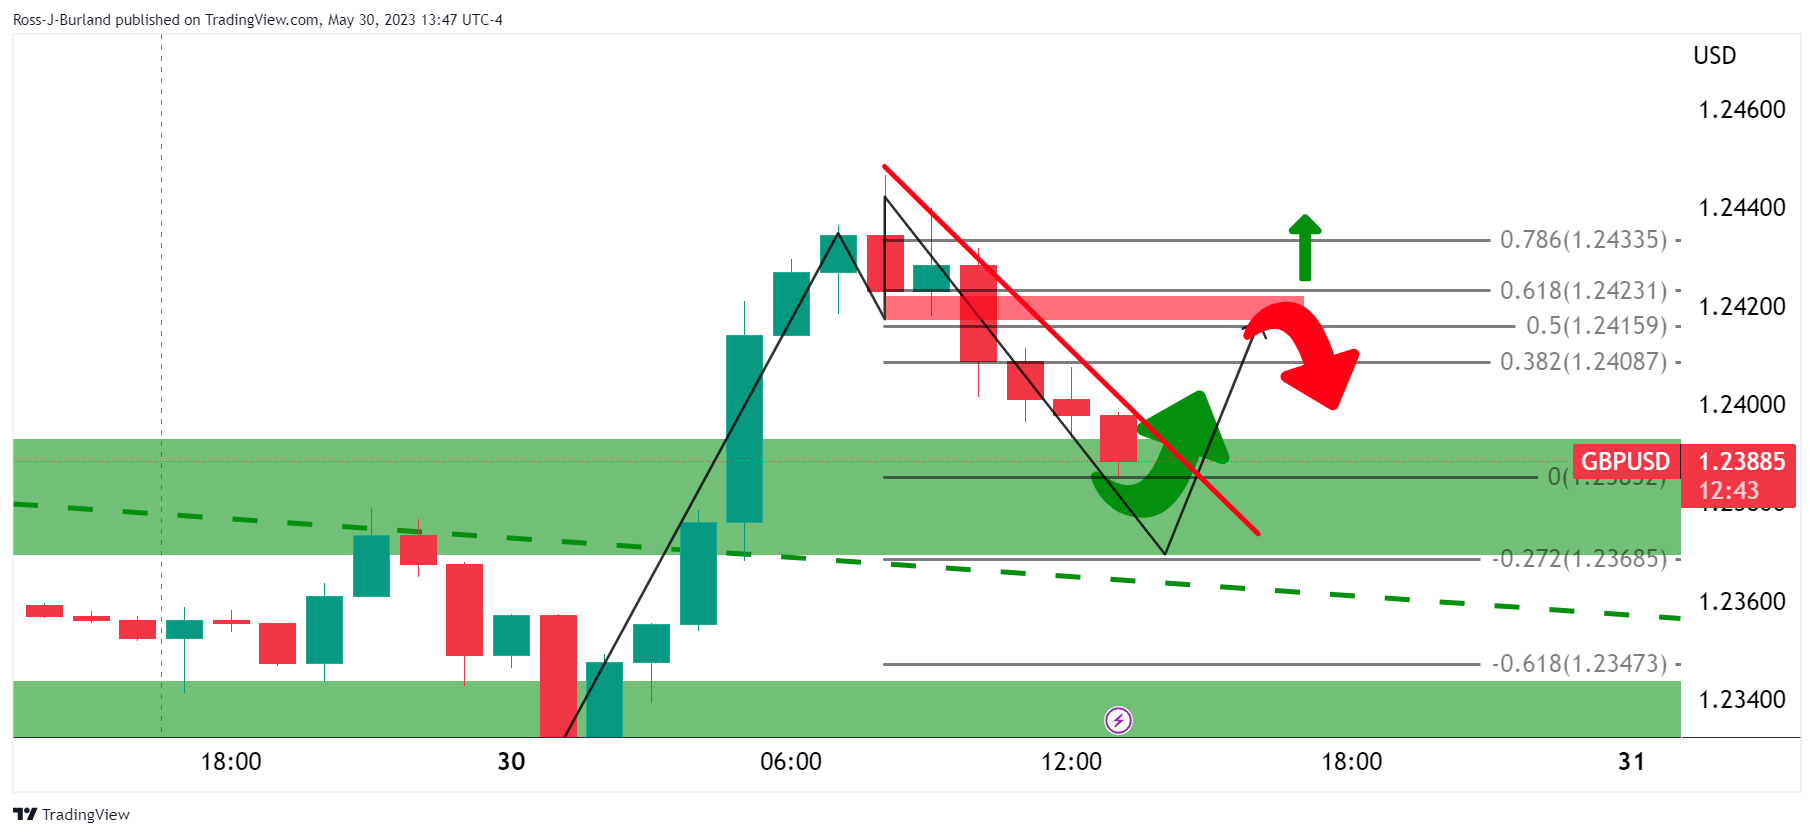
- GBP/USD has climbed back above 1.2400 as the USD Index has resumed its downside journey.
- Speaker McCarthy urged Republican members to support a bipartisan deal to lift the $31.4 trillion U.S. debt ceiling.
- Signs of persistence in the UK’s inflation are solidifying the need for more interest rate hikes from the BoE.
The GBP/USD pair has rebounded above the round-level resistance of 1.2400 after a steep correction in the early Tokyo session. The Cable has climbed back above 1.2400 as the US Dollar Index (DXY) has retreated from 104.20.
S&P500 futures are showing minor losses in early Asia after a choppy Tuesday, portraying a caution in the overall market mood. US equities remained flat on Tuesday despite opening after an extended weekend.
Fears of a default by the United States economy have not waned entirely as the US debt-ceiling raise deal is yet to pass in Congress. Late Tuesday, House of Representatives Kevin McCarthy urged Republican members to support a bipartisan deal to lift the $31.4 trillion U.S. debt ceiling, calling it the most conservative deal we ever had.
The USD Index is expected to remain sideways after retreating from 104.20 as investors are shifting their focus toward the United States Employment data. But before that, US JOLTS Job Openings data (April) will be keenly watched. According to the estimates, total job openings have dropped to 9.375M vs. the former release of 9.59M.
Apart from that, Federal Reserve’s (Fed) Beige Book will be in focus which will provide economy-wise inflation and growth numbers.
On the Pound Sterling front, signs of persistence in the United Kingdom’s inflation are solidifying the need for more interest rate hikes from the Bank of England. Official food inflation softened marginally to 19.1% from the prior figure of 19.2% led by lower energy and commodity cost but is insufficient to force BoE Governor Andrew Bailey to remain neutral ahead.
Economists at Nomura cited “Following the latest inflation print, we have changed our call and now see the BoE raising rates by 25 bps at each of the next three meetings.” They further added “We thus forecast peak rates at 5.25% for the BoE.
- EUR/USD grinds higher after bouncing off 10-week low.
- US Dollar traces yields to retreat from multi-day peak amid uncertainty for US debt ceiling deal in Congress.
- US data came in mixed, month-end positioning join anxiety ahead of key events to recall Euro buyers.
- Germany’s HICP, US JOLTS Job Openings and Fedspeak will decorate calendar, Senate will vote on measures to avoid US default.
EUR/USD struggles to extend the latest recovery from the lowest levels since March, grinding near 1.0735-30 amid early Wednesday morning in Asia, after snapping a five-day downtrend. That said, the Euro pair cheered the US Dollar’s pullback from the multi-day high the previous day but depicts the market’s cautious mood ahead of the top-tier data/events scheduled for publishing today.
US Dollar Index (DXY) rose to the highest levels since mid-March on Tuesday before snapping a five-day uptrend, as well as positing the biggest daily loss since April 19, while closing the North American trading session around 104.05.
While tracing the US Dollar’s latest retreat, the month-end consolidation and cautious mood ahead of the top-tier data/events gain major attention. Also challenging the greenback could be the mixed US data.
That said, the US Conference Board's (CB) Consumer Confidence Index edged lower to 102.30 for May from an upwardly revised 103.70 prior marked in April (from 101.30). Additional details of the survey report mentioned that the one-year consumer inflation expectations ticked down to 6.1% in May from 6.2% in April. Further, US House Price Index rose 0.6% MoM versus 0.2% expected and 0.7% prior (revised from 0.5%) whereas the S&P/Case-Shiller Home Price Indices dropped to -1.1% YoY in March versus 0.4% prior and -1.6% anticipated. Additionally, the Dallas Fed Manufacturing Business Index for May dropped further to -29.1 from -23.4 and versus -19.6 market expectations.
Following the data, Richmond Fed President Thomas Barkin said that he is seeing evidence that interest rate hikes are curbing demand.
Elsewhere, Republican representative Chip Roy said McCarthy should pull the debt ceiling bill, per Reuters, which in turn raises challenges for the US debt ceiling deal as it heads to the Republican-controlled Senate for voting.
On the other hand, Spain marked downbeat inflation numbers for May and hence raised expectations of softer prints of today’s German inflation figures, as well as highlighting a lesser need for the European Central Bank (ECB) to push for higher rates. Even so, ECB Governing Council Gediminas Šimkus said on Tuesday that he expects a 25 basis points (bps) rate hike in June and July.
Amid these plays, Wall Street closed mixed but the US Treasury bond yields remained pressured.
Looking ahead, Germany’s inflation gauge, namely the Harmonized Index of Consumer Prices for May, will precede the US JOLTS Job Openings for April and China Purchasing Managers Index for May to watch on the calendar for clear directions. However, major attention should be given to the voting on the US debt ceiling agreement in the Senate.
Technical analysis
A daily closing beyond the monthly descending resistance line, now immediate support near 1.0700, directs EUR/USD bulls toward the 100-DMA hurdle of around 1.0815.
- GBP/JPY bulls need to commit to trendline support.
- Bears will be in the market on a break of 173.00.
GBP/JPY is testing fresh bull cycle highs near 174.00 but this may be the highs. We are completing the initial balance for the week and there is length in the market that could attract the bears. The following will illustrate both sides of the story.
GBP/JPY daily charts
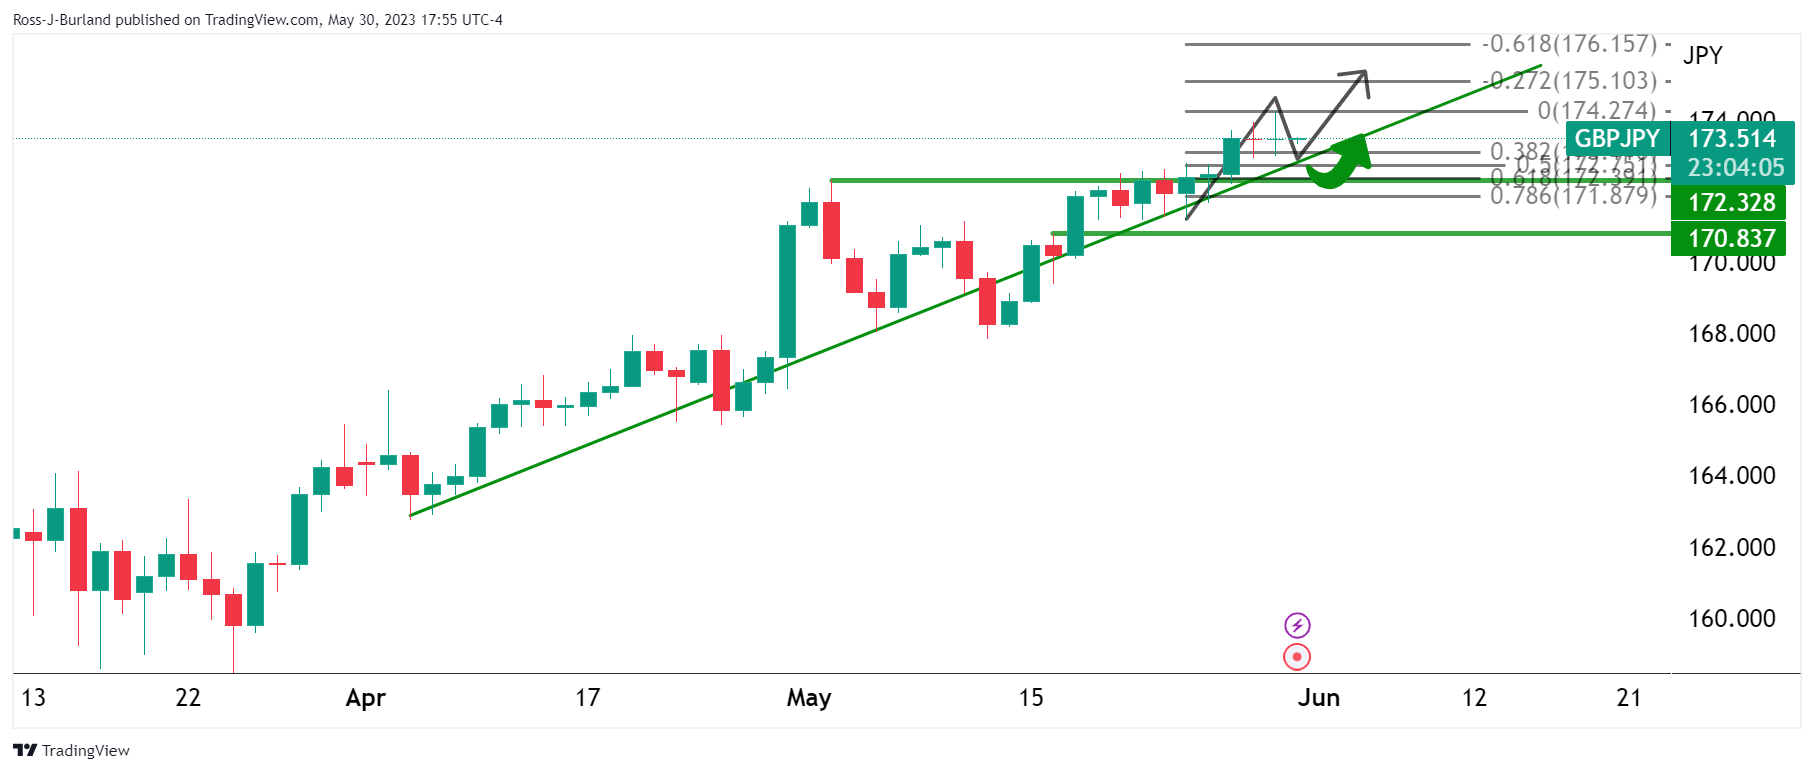
The price is bullish above trendline support and could move higher but could just as easily head lower on a break of the trendline support.
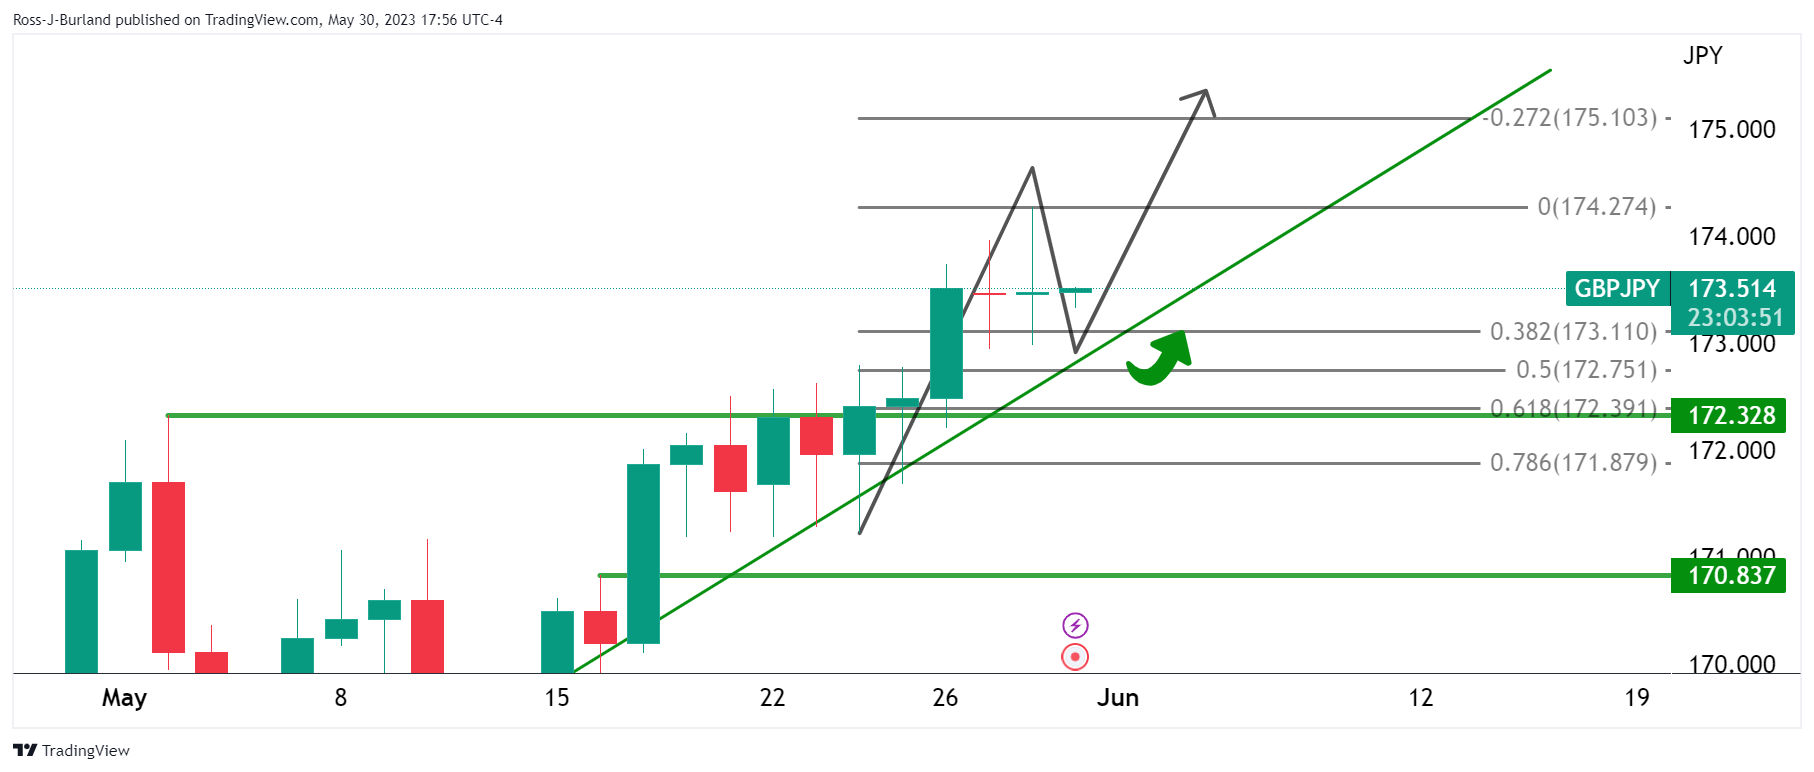
GBP/JPY H4 chart
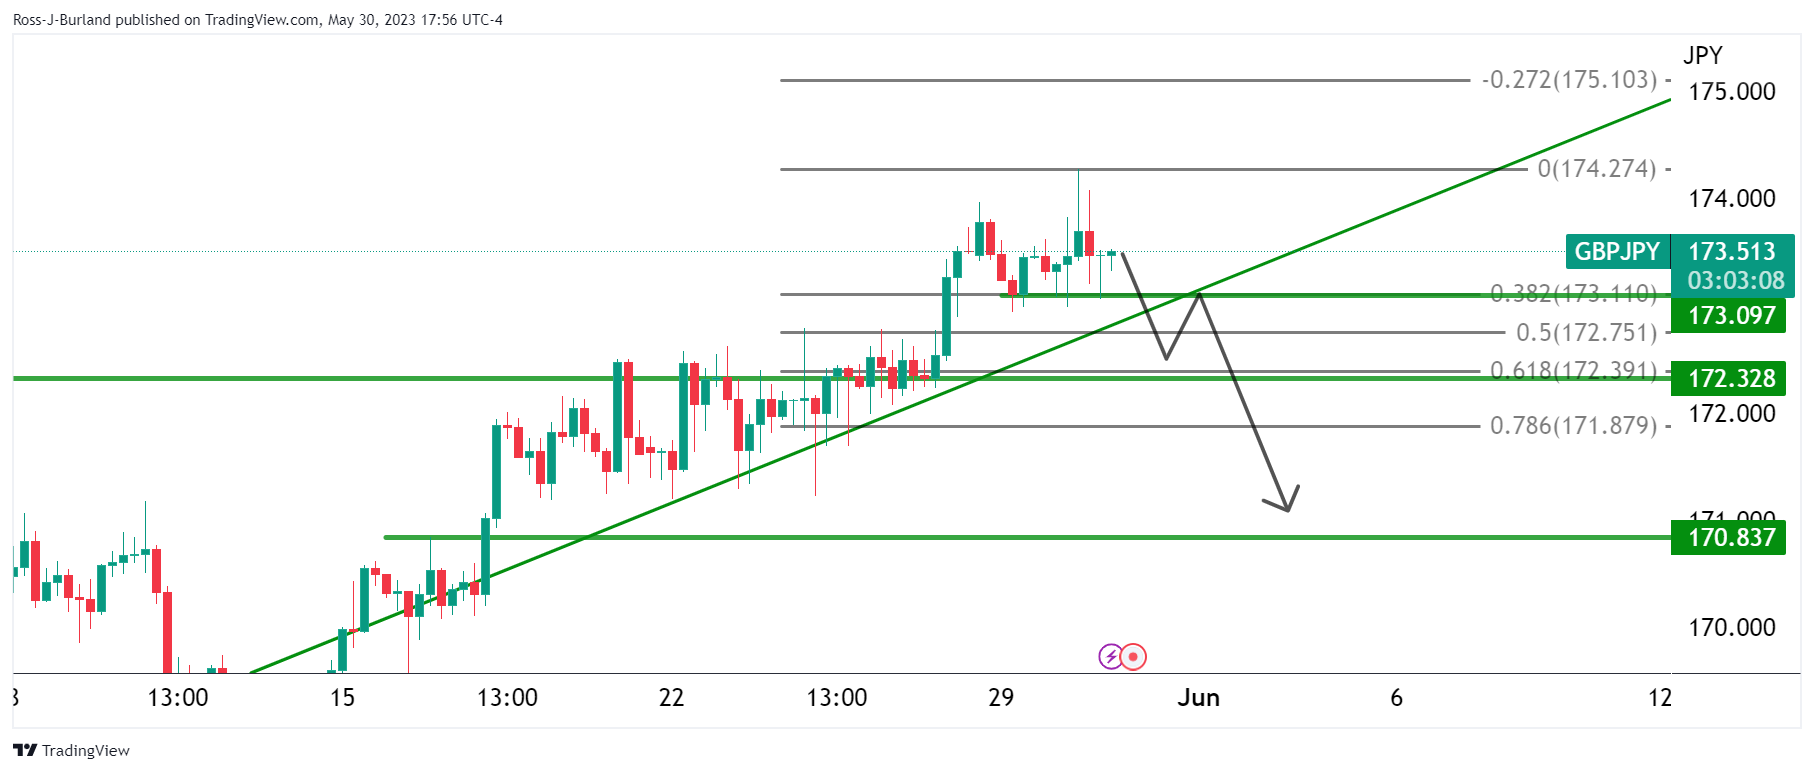
GBP/JPY is on the front side of the trend but the price could break the support structure and thus flip the focus on the backside.
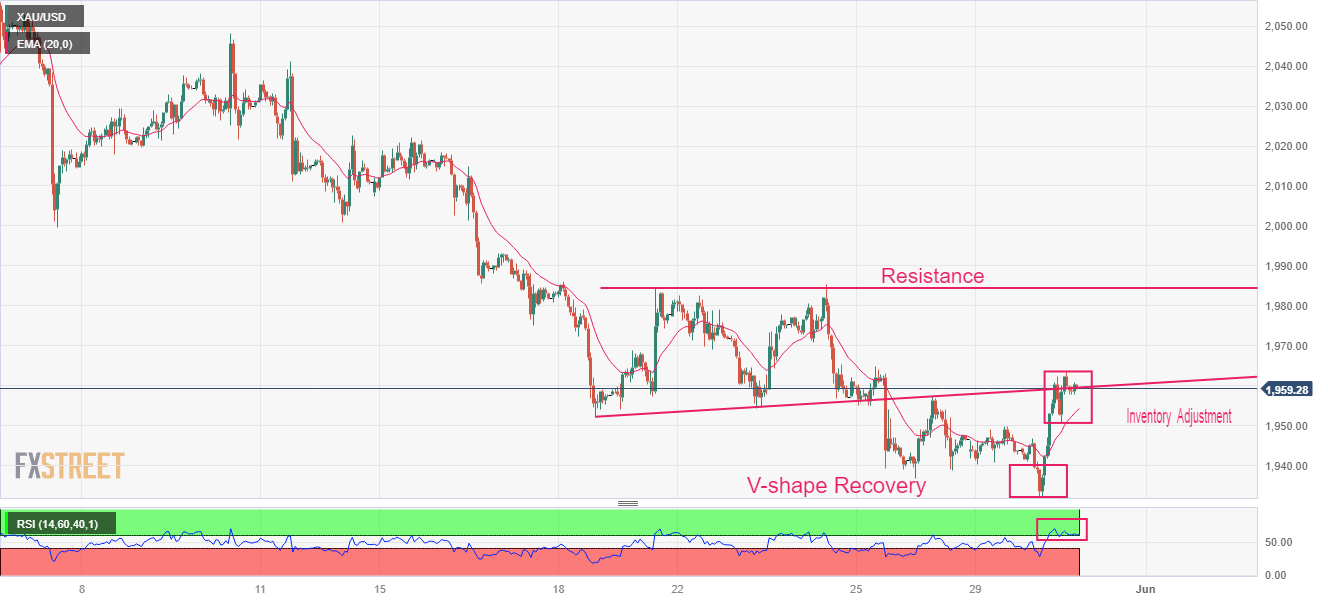
- Gold price is consolidating around $1,960.00 after a vertical rally ahead of US Employment.
- The USD Index witnessed intense selling pressure after printing a fresh 10-week high at 104.50.
- Gold price is gathering strength for a breakout above the trendline plotted from $1,952.00.
Gold price (XAU/USD) has turned sideways around $1,960.00 after failing to extend a rally above $1,963.70 in the early Asian session. A quick rally in the Gold price came after a vertical sell-off in the US Dollar Index (DXY). The USD Index witnessed intense selling pressure after printing a fresh 10-week high at 104.50.
S&P500 ended flat on Tuesday despite after an extended weekend, portraying a cautious market mood. Sheer volatility in the US equities cannot be ruled out ahead of the United States Employment data, which will build a base for June‘s monetary policy meeting by the Federal Reserve (Fed).
Despite a sell-off in the USD Index, investors are confident that the asset could be rerated ahead as one more interest rate hike by the Fed is yet to be discounted. Consumer spending has rebounded dramatically in April and now decent caliber in labor market conditions could force Fed chair Jerome Powell to look for raising interest rates further without any doubt.
On Thursday, US Automatic Data Processing (ADP) Employment data will be keenly watched. As per the consensus, the US economy added 170K jobs in May, lower than the prior addition of 296K. Later on Friday, US Nonfarm Payrolls (NFP) will release, which will provide comprehensive information about the US labor market.
Gold technical analysis
Gold price showed a V-shape recovery after dropping to near $1,932.12 on an hourly scale. The asset is gathering strength for a breakout above the trendline plotted from May 18 low around $1,952.00, which acted as a resistance for the Gold price earlier. Meanwhile, the horizontal resistance is plotted from May 19 high at $1,984.25.
Upward sloping 20-period Exponential Moving Average (EMA) at $1,954.50 indicates that the short-term trend has turned positive.
The Relative Strength Index (RSI) (14) has shifted into the bullish range of 60.00-80.00, which indicates that the upside momentum is active.
Gold hourly chart
- The AUD/USD ends with substantial losses, nearing YTD lows, weighed by disputes amongst Republicans.
- Political discussions surrounding the US debt ceiling and potential leadership change add a sour note to market sentiment.
- Investors are eyeing upcoming inflation data, Private Sector, and Housing Credit from Australia and the Chicago PMI and JOLTs report from the US for further market direction.
AUD/USD is set to finish Tuesday’s session with substantial losses, snapping two days of gains spurred by mixed market sentiment. Factors like Republicans opposing the US debt-ceiling agreement, alongside falling US Treasury bond yields, cushioned the AUD/USD’s fall. However, the AUD/USD is still hovering around the year-to-date (YTD) lows of 0.6510s.
AUD/USD heads towards 0.6510, despite higher-than-expected US Housing Prices despite
US equities finished the session mixed, as debt-ceiling discussions continued amongst Republicans looking to oust Kevin McCarthy as House Speaker. That, alongside falling US bond yields, turned market sentiment sour, weighing on Wall Street and US Treasury bond yields.
Talking about data, the US economic agenda revealed housing prices that advanced more than estimates but were ignored by market participants. Later, the US Conference Board (CB) showed that Consumer Confidence in May slowed to 102.3, above calculations but below April’s 103.7. “Consumer confidence declined in May as consumers’ view of current conditions became somewhat less upbeat while their expectations remained gloomy,” said Ataman Ozyildirim, Senior Director, Economics at The Conference Board.
In the meantime, the Dallas Fed reported that manufacturing activity in their area plunged to -29.1, beneath the prior’s month -23.4 drop, suggesting an ongoing deterioration in the Dallas Fed regional area.
On Wednesday, the Australian economic docket will feature inflation data, Private Sector, and Housing Credit, which could shed some light on the status of households. The Chicago PMI and the JOLTs report will update the economy’s position in the US.
AUD/USD Technical Levels
A busy calendar lies ahead, with a focus on Australia, with inflation data and RBA Governor Lowe's testimony. Japan will report industrial production and retail trade data. Chinese PMIs and the New Zealand ANZ May Activity Outlook are also due. Later in Europe, attention will turn to French and German inflation data. The debt ceiling drama remains unresolved, and Wednesday is supposed to be the day of the Congressional vote.
Here is what you need to know on Wednesday, May 31:
The debt ceiling deal struck between US President Biden and House Speaker Kevin McCarthy is facing hurdles and weighing on market sentiment. US stocks finished mixed, and Treasury yields dropped sharply.
The US dollar posted mixed results, affected by lower yields while at the same time, commodity and emerging market currencies were affected by risk aversion. Consumer confidence in the US dropped in May but less than expected. The focus on Wednesday will be on the debt ceiling, and then, if Congress delivers, attention will turn to employment data. Many Federal Reserve officials, including Harker and Bowman, are scheduled for public appearances on Wednesday, and the central bank will publish the Beige Book.
Analysts at Wells Fargo wrote:
Consumer confidence slipped slightly in May, and while the weakening may reflect short-term worries about the debt ceiling, the more interesting developments reveal how the sand is shifting under consumers' feet. Worries about the labor market are growing as buying plans dry up.
EUR/USD finished higher above 1.0700 after hitting a fresh monthly low at 1.0670. Spain released lower-than-expected inflation numbers. Germany and France will release inflation data on Wednesday. Another decline in annual rates could soften European Central Bank tightening expectations.
GBP/USD climbed from under 1.2350 to 1.2440 amid expectations of more tightening from the Bank of England (BoE). The EUR/GBP tumbled to 0.8628, the lowest level since mid-December.
The yen outperformed after the announcement of an emergency meeting between the Ministry of Finance, the Bank of Japan, and Financial Services Agency; also favored by the decline in government bond yields. USD/JPY dropped below 140.00 and holds a bearish bias.
USD/CHF hit two-month highs at 0.9082 and then pulled back modestly. Switzerland reported 0.6% Q1 growth, but the KOF Leading Indicators plummeted from 96.1 to 90.2 in May. Retail sales data is due on Wednesday.
AUD/USD failed to break above 0.6550 and pulled back towards 0.6500. The Aussie remains under pressure ahead of a busy Asian session, with Reserve Bank of Australia (RBA) Governor Lowe appearing before a Senate Committee and monthly inflation data. Next week is the monetary policy meeting.
USD/CAD moved sideways around 1.3600, despite the decline in crude oil prices. The WTI barrel lost more than 4%, falling below $70.00. Canada will report March growth numbers.
NZD/USD dropped marginally on Tuesday, posting the lowest daily close since November but remaining above 0.6000. The ANZ Activity Outlook and Business Confidence are due on Wednesday.
It was a positive day for Gold which finished higher after hitting fresh monthly lows. XAU/USD settled near $1,960, offering signs of stabilization. Silver retook $23.00. Cryptocurrencies rose, with BTC/USD gaining 0.45% to $27,800, and Ethereum gaining 0.60% to $1,905.
The Turkish Lira fell sharply again following the victory of Erdogan in the presidential runoff. USD/TRY climbed almost 2%, reaching a new record high at 20.40.
Like this article? Help us with some feedback by answering this survey:
- NZD/USD bears are lurking below the trendline resistance.
- Bulls eye a move into the Fibonacci scale.
NZD/USD stayed within a tight range of between 0.6025 and 0.6066 and was marginally lower ahead of the Asian open and roll over. There was a pick-up in volatility and the US Dollar was under pressure for the most part of the day.
There were concerns as to whether Congress will pass the Biden/McCarthy US debt ceiling deal. The gatekeeper House of Representatives Rules Committee is due to consider the 99-page bill beginning at 3 p.m. EDT (1900 GMT) on Tuesday, ahead of votes in the Republican-controlled House of Representatives and the Democratic-controlled Senate.
´´Although it is logical that resolving the deal will clear the way for the Federal Reserve to hike (which we think is needed, given recent US data), the fact that we have seen US bond yields fall suggests that markets are less ebullient,´´ analñysts at ANZ Bank explained.
´´Carry remains a focus for the Kiwi but carry “works” best when volatility is low and there isn’t much else going on, so it could be a patience game for carry traders. The NZ data is light until Gross Domestic Product in mid-June, and we may have to wait until then for NZ-specific factors to become drivers,´´ the analysts added.
NZD/USD technical analysis
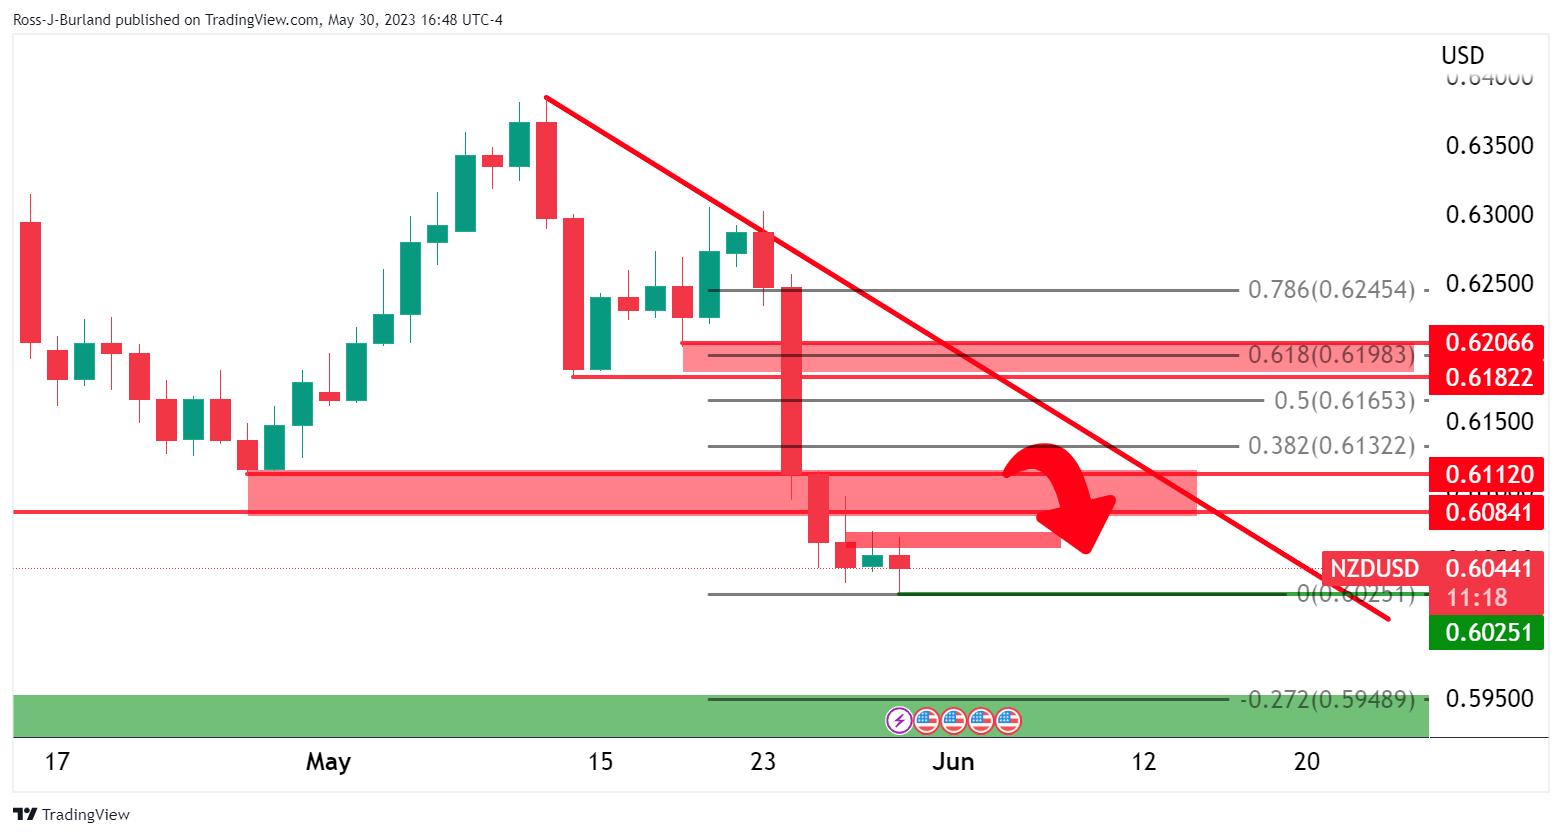
The bears are in the market and this leaves in-the-money shorts vulnerable to a pullback. A move to test resistances could open risk to the trendline resistance in a significant correction as measured by the Fibonacci scale.
- Silver is meeting key support on the daily chart.
- Beazrs need a break of structure while bulls need to get above trendline resistance.
The price of Silver has run into a key area of daily support that leaves the bias bullish for the near term. The following illustrates this along with the market structure and various scenarios for the foreseeable future.,
XAG/USD daily charts
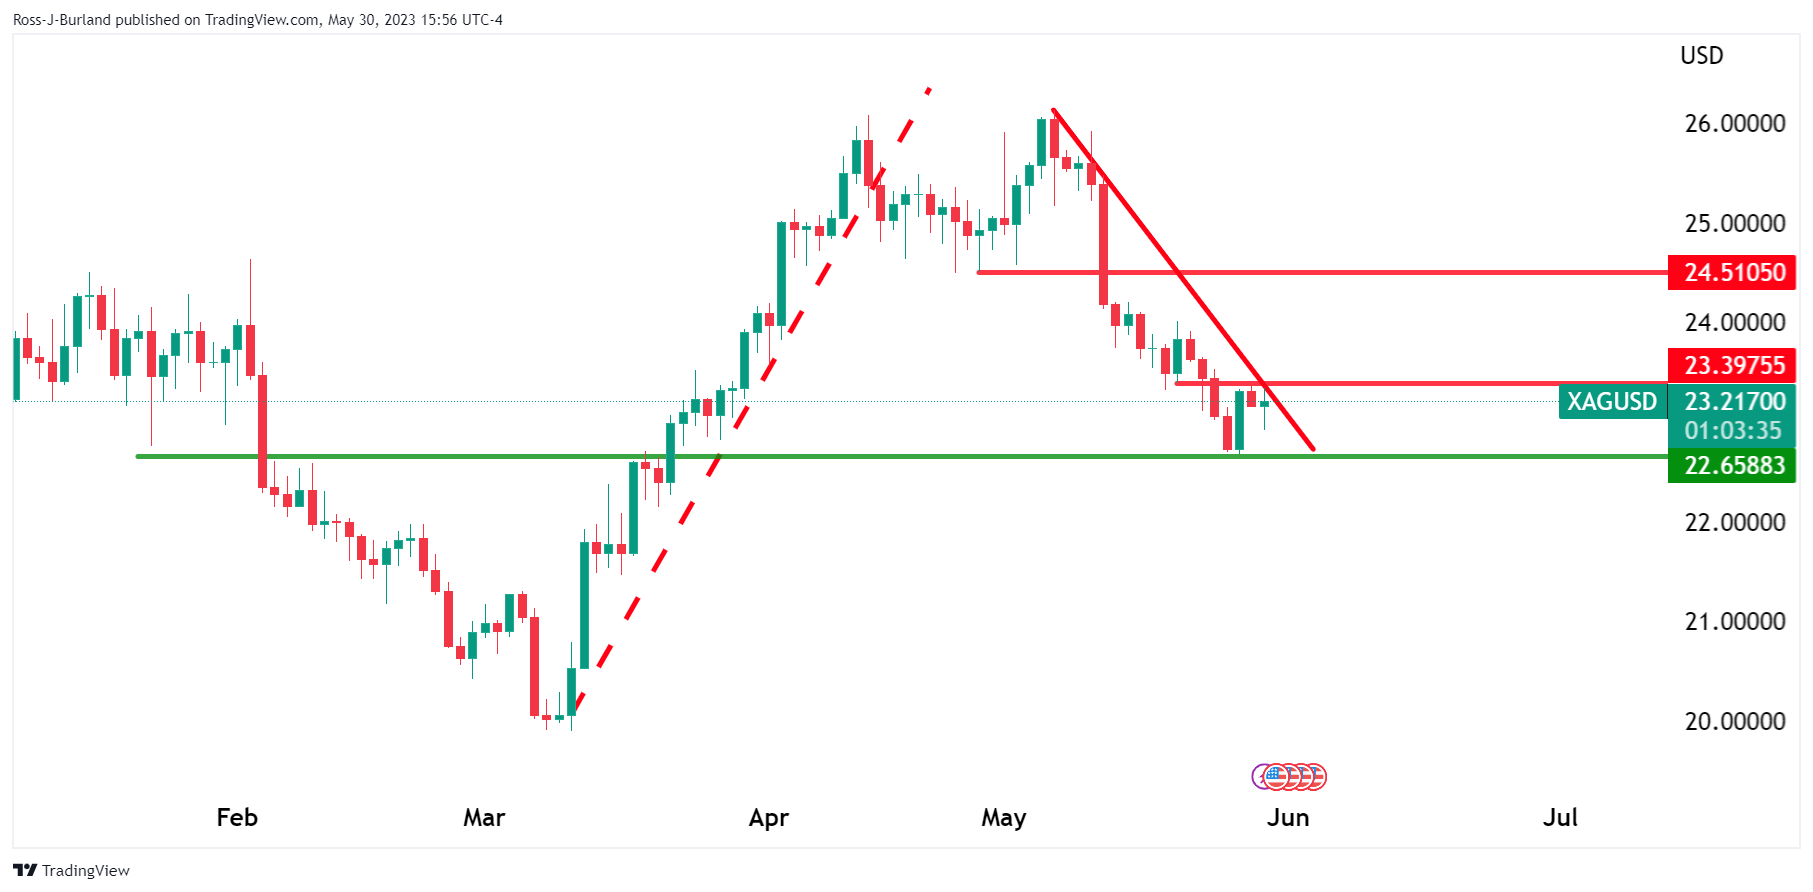
Silver is on the front side of the bearish trend but the price has run into a potential demand area that could see the bears throwing in the towel.
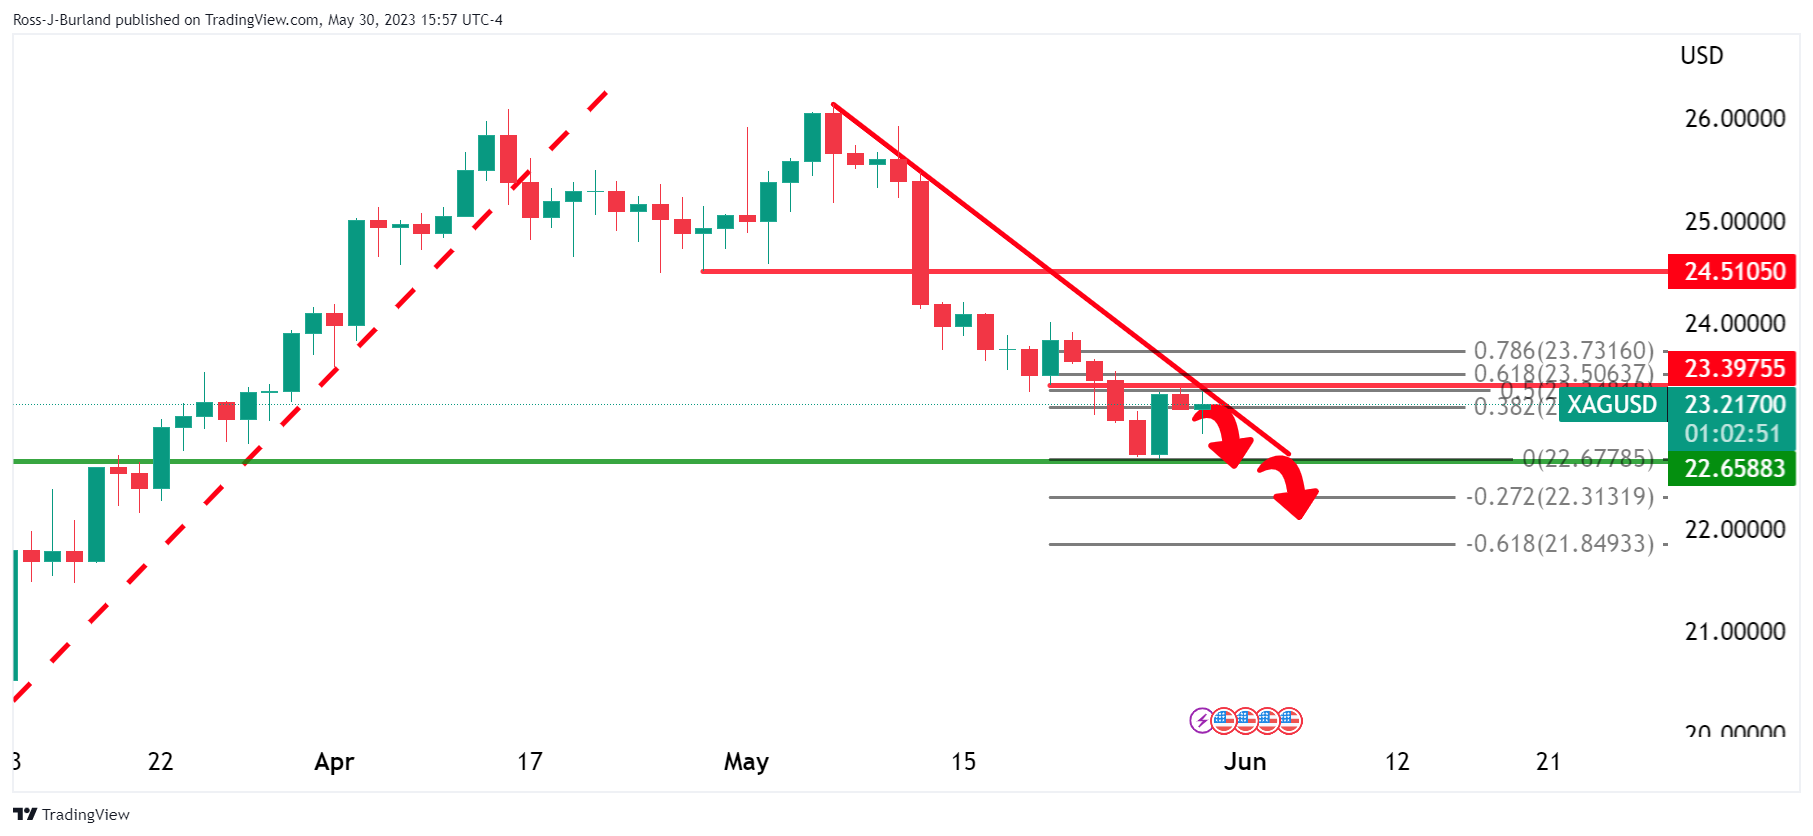
The above scenario, however, shows a bearish bias with the trendline resistance playing its role in the sell-off below the market structure.
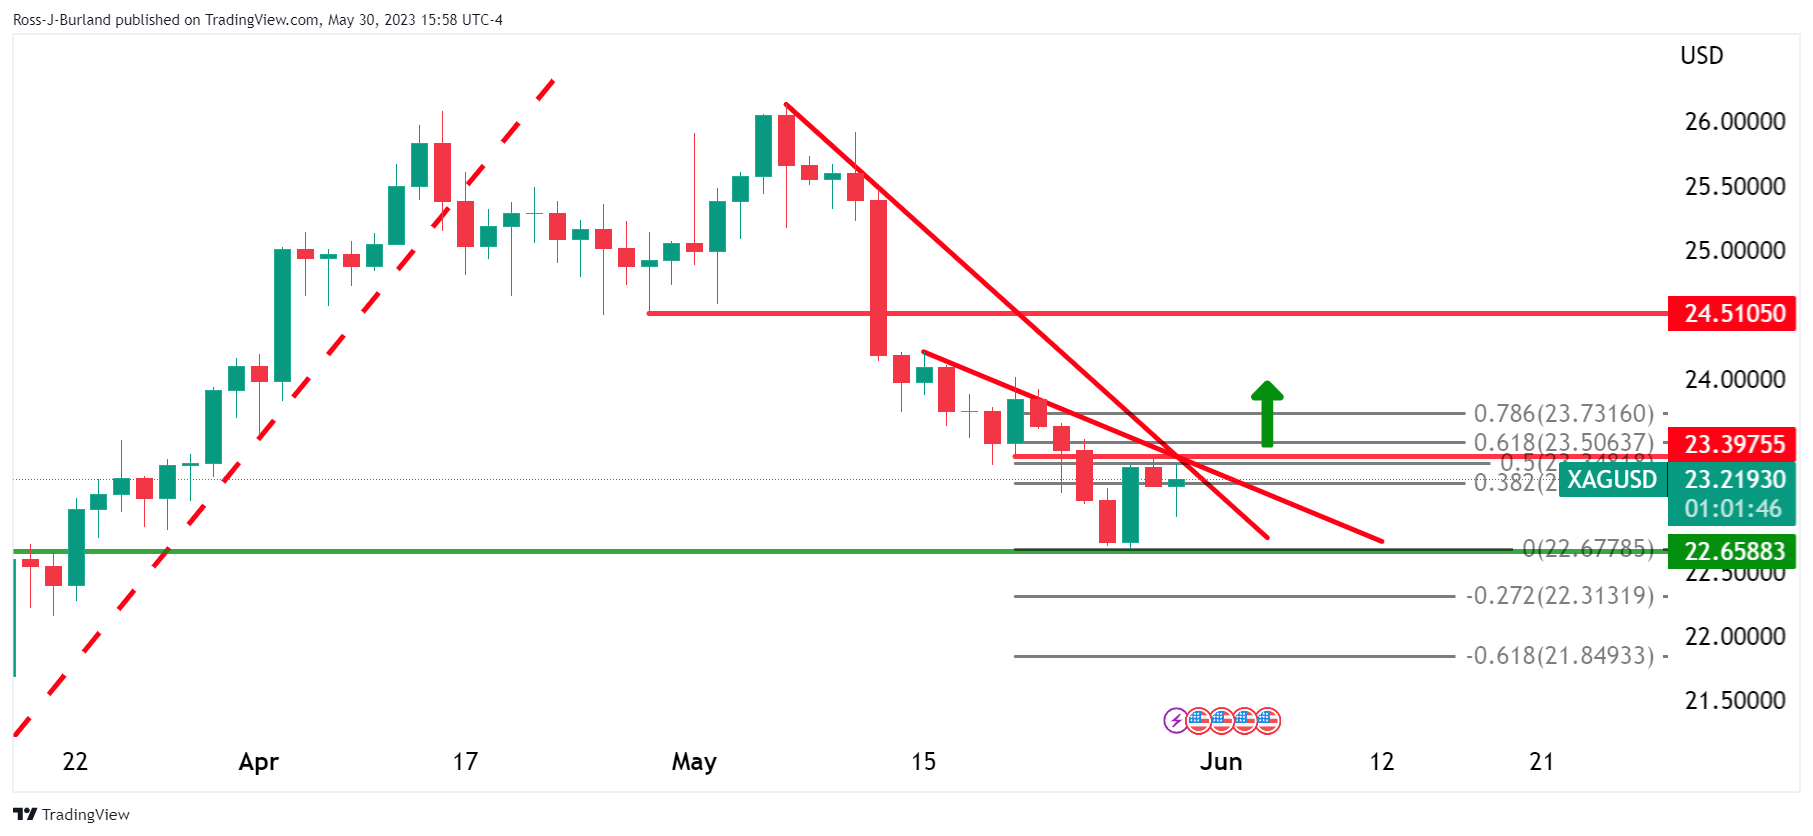
On the other hand, the market has rallied hard into the bearish impulse and is taking out the 50% mean reversion level. A break of the trendline resistance leaves the bullish bias intact. However, that is not to say that the bears will not attempt to sell at a premium which could see the price restest recent lows as its forms structure in a stage of accumulation.
- USD/MXN pair trades higher, fueled by risk-off sentiment and declining US bond yields.
- The Conference Board reports a decline in Consumer Confidence in May, reflecting a gloomy outlook among consumers, while housing prices rise above expectations.
- Richmond Fed President Barkin warns of stubborn inflation and mixed economic signals.
USD/MXN climbs amidst a risk-off impulse as some Republicans said they would oppose a bipartisan agreement to lift the US debt ceiling, even though the US government could fail to pay its obligations. That shifted sentiment while US bond yields plunged. At the time of writing, the USD/MXN is trading at 17.6757, a gain of 0.52%.
GOP opposition threatens bipartisan debt ceiling agreement, fuels economic uncertainty, USD/MXN climbs
US equities trade mixed; after a sudden shift in market sentiment, major indices pared their earlier gains. The US debt ceiling saga continues, with the GOP right-wing expected to oust Kevin McCarthy as House Speaker. On the data front, the US housing prices in March rose above estimates though they failed to trigger a reaction on the USD/MXN pair.
Later, the US Conference Board (CB) revealed that Consumer Confidence in May slowed to 102.3, above estimates but below April’s 103.7. “Consumer confidence declined in May as consumers’ view of current conditions became somewhat less upbeat while their expectations remained gloomy,” said Ataman Ozyildirim, Senior Director, Economics at The Conference Board. The report showed that Americans’ inflation expectations remain elevated but stable at a 6.1% average over the next 12 months.
The Dallas Fed Manufacturing Index for May plummeted by -29.1, below the previous month’s -23.4 contraction, signaling that business activity continued to deteriorate.
Aside from this, Richmond Fed President Thomas Barkin said that parts of the economy are giving mixed signals and that inflation is going to be more stubborn “than many people would think.”
The US Dollar Index (DXY), a gauge that measures the buck’s value against a basket of six currencies, is down 0.06%, at 104.116.
USD/MXN Price Analysis: Technical outlook
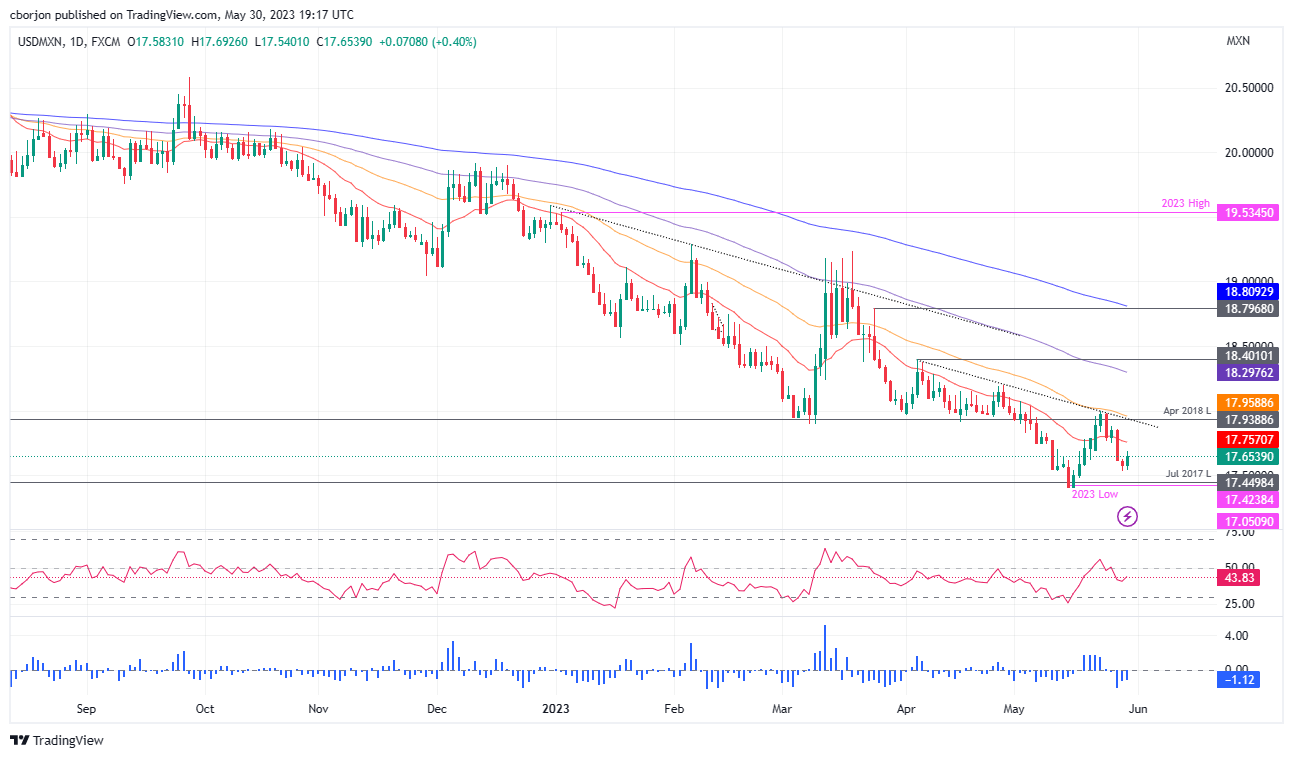
After two consecutive days of losses, the USD/MXN shifted upwards, though the rallies could be capped by solid resistance at the 20-day Exponential Moving Average (EMA) at 17.7600. Oscillators like the Relative Strength Index (RSI) indicator and the 3-day Rate of Change (RoC) are still in bearish territory, but the RSI is about to cross above the 50-midline.
For a bullish scenario, once USD/MXN buyers reclaim the 20-day EMA, that would open the door toward the confluence of a one-month-old falling resistance trendline and the 50-day EMA at 17.9593. Once cleared, the 18.00 figure is up for grabs. Conversely, the USD/MXN must reclaim the weekly low of 17.5341 before challenging the year-to-date (YTD) low of 17.4238.
- USD/CAD bulls are starting to graze on the bearish correction.
- Trendline support could well be respected leading to a bullish continuation.
The Canadian dollar edged higher against the US Dollar on Monday as a deal to temporarily suspend the US debt ceiling boosted investor sentiment. Technically, however, the correction could be grazed upon by hungry bulls as the following will illustrate.
USD/CAD daily charts
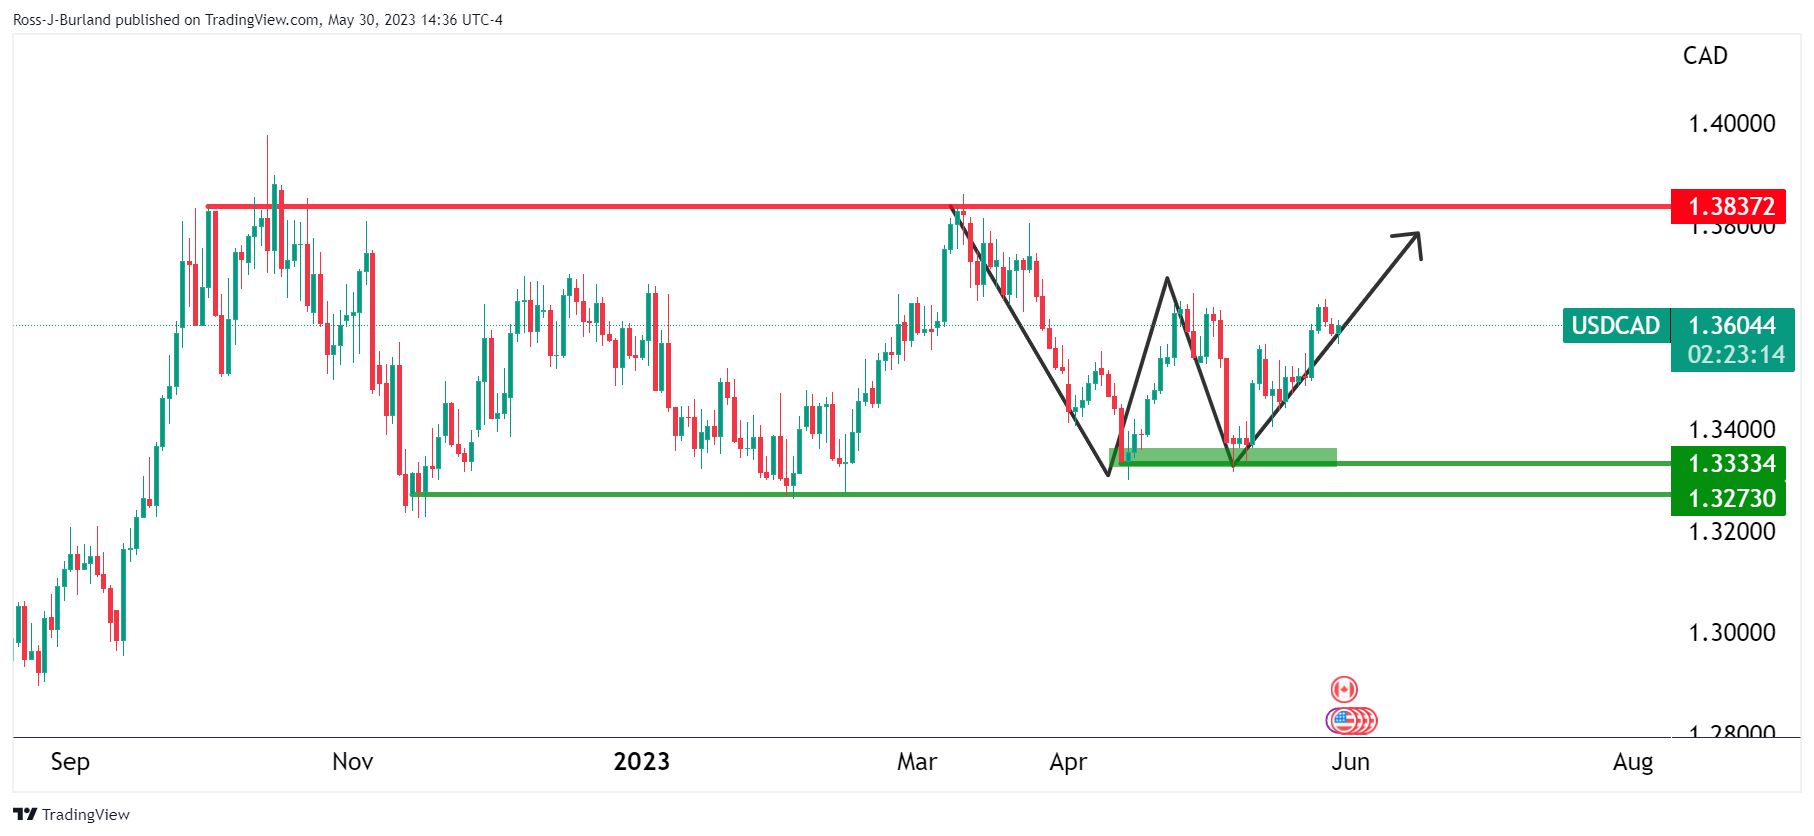
The market is carving out a W-formation and with prospects of an upside continuation.
Zooming in, we can see that the price has rallied to make new highs only to correct back into the rally ina 50% mean reversion. This could encourage the bulls to reengage at a discount with the price respecting the trendline support.
USD/CAD H4 charts
From a lower time frame perspective, the price will need to clear the recent highs. This will mark a new bullish structure for the bulls to lean against in positioning for higher highs to come. On the other hand, a break of 1.3570-50 would be a bearish development.
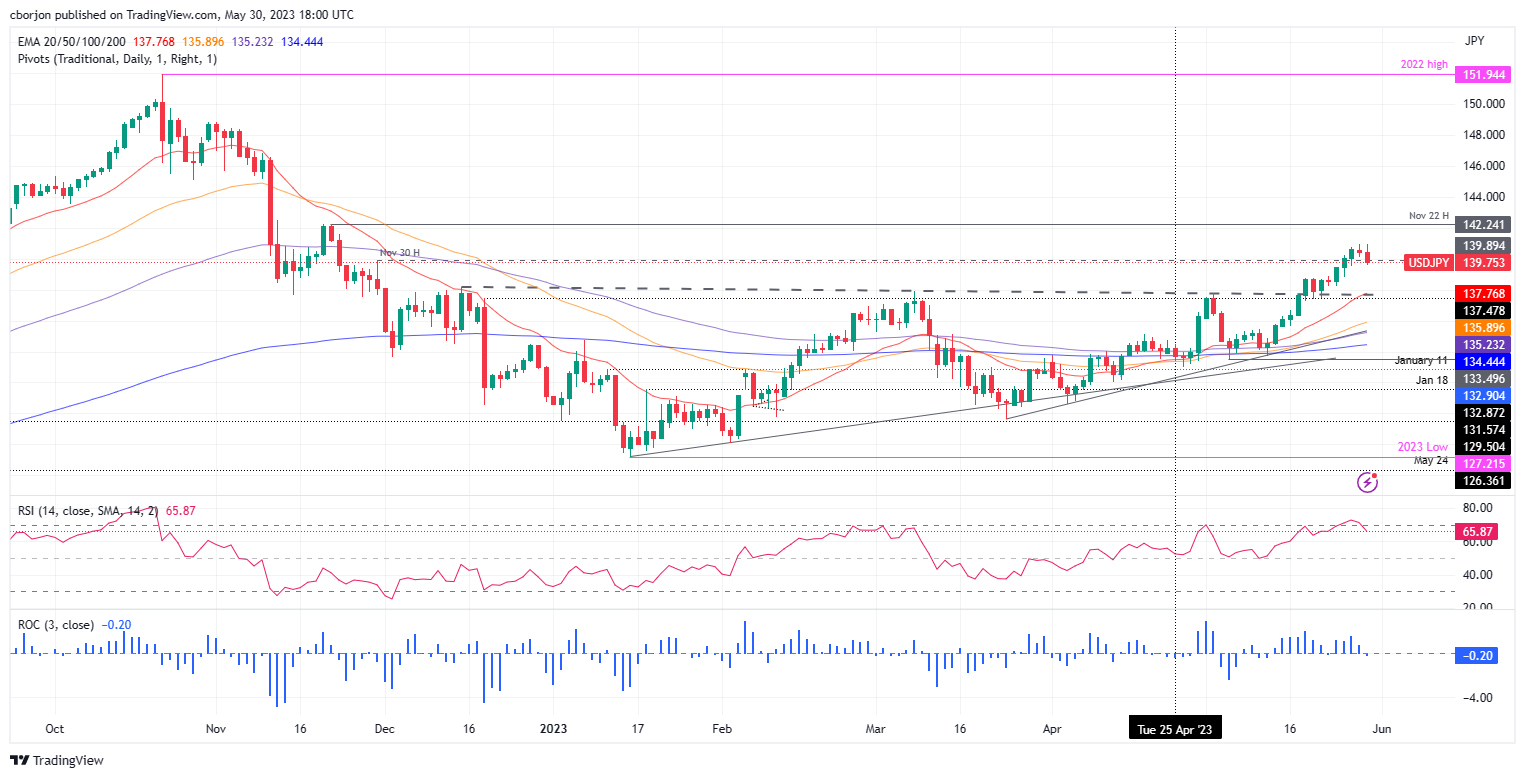
- USD/JPY declined for two consecutive days following remarks from Japanese authorities indicating increased scrutiny of currency market movements.
- Japanese Yen strengthens in response to the news, putting downward pressure on the USD/JPY pair.
- USD/JPY maintains an upward bias as long as it holds above the key level of 138.74, representing the May 18 daily high.
USD/JPY dropped for two consecutive days after Japanese authorities expressed that currency market moves would be watched, following a meeting between the Bank of Japan (BoJ) and Masato Kanda, vice finance minister for international affairs. After those remarks, the Japanese Yen (JPY) strengthened. At the time of writing, the USD/JPY is trading at 139.87, losing 0.40%.
USD/JPY Price Analysis: Technical outlook
USD/JPY remains upward biased as long as the pair remains above the May 18 daily high of 138.74, though the recent pullback could be attributed to market sentiment deterioration. Additionally, the Relative Strength Index (RSI) indicator, exiting from overbought conditions, could be one of the reasons, alongside plunging US Treasury bond yields.
That said, USD/JPY first support would be the 139.00 figure. A breach of the latter will expose the May 18 high, followed by the 138.00 figure. Next would be the confluence of a previous resistance trendline turned support and the 20-day EMA at 137.76.
Conversely, if buyers reclaim 140.00, that could open the door for further upside, like the year-to-date (YTD) high of 140.93, before challenging the 141.00 mark.
USD/JPY Price Action – Daily chart
- GBP/USD bulls are taking back control on a break of structure.
- The rally has taken out the bearish trendline resistance.
Sterling rose against a weaker dollar on Tuesday as British inflation remains in focus. This has forced the price higher and placed the bulls back in control as the following analysis will illustrate
GBP/USD H1 charts
The price has broken to the backside of the old bearish trendline resistance. This is a bullish development. The bulls could be encouraged to buy in again by the deep correction of the bullish impulse.
The price has made an M-formation and would be expected to run back toward the neckline of the pattern. A bullish continuation could occur on a break of the neckline.
The bulls will need to commit to the backside of the M-formation´s bearish impulse and trendline resistance while breaking the neckline and double top.
Thomas Barkin, President of the Federal Reserve Bank of Richmond, stated on Tuesday that he is seeing evidence that interest rate hikes are curbing demand. He is attending a webinar organized by the National Association for Business Economics.
According to Barkin, there is more willingness among businesses to increase prices, but that will continue until there is a decline in demand. He points out that some parts of the economy appear to be cooling, while others remain “vibrant.”
Market reaction
The US dollar is posting mixed results across the board on Tuesday, amid falling Treasury yields and risk aversion.
- WTI falls for the second consecutive day on concerns about the passage of the US debt-ceiling bill and conflicting statements from oil producers.
- Some Republicans express reluctance to pass the debt-ceiling pact, raising fears about the US government’s ability to meet its financial obligations.
- OPEC+ meeting on June 4 fuels market unease as speculations arise about potential oil production cuts.
Western Texas Intermediate (WTI), the US crude oil benchmark plummets for the second straight day by more than 4%, spurred by woes about whether the US Congress will pass the US debt-ceiling bill as some Republicans had expressed that they would not pass the pact. That, alongside mixed messages by crude oil producers, exerts downward pressure on WTI. WTI is trading at $69.58 after hitting a daily high of $73.33.
US Congress debates debt ceiling, OPEC+ meeting adds to market uncertainty
News emerged during the weekend that US President Joe Biden and US House Speaker Kevin McCarthy sealed an agreement to suspend the debt ceiling until January 1, 2025, but it{s pending approval by the US Congress. US Treasury Secretary Janet Yellen said that the US government could not pay its debt by June 5.
Aside from this, the Organization of Petroleum Export Countries and its allies (OPEC+) would meet on June 4, one day before the US debt-ceiling deadline. Investors are nervous about the outcome of oil production, as the Saudi Arabian Energy Minister Abdulaziz bin Salman warned short sellers, which are betting that prices will fall.
That increased speculations that crude oil output could be cut, while Russian Deputy Prime Minister Alexander Novak signaled that the world’s third largest producer would keep production unchanged.
On April 6, Saudi Arabia and other OPEC+ members announced 1.2 million barrels cut per day, triggering a jump of 6% in oil prices. Nevertheless, prices stabilized and erased those gains.
WTI traders should be aware of the release of China’s business activity report late this week, alongside Global PMIs, which could give us clues about the pace of growth of the global economy.
WTI Technical Levels
- EUR/USD snaps five-day losing streak, rises 0.30% in North American session following Eurozone data indicating easing inflation in some countries.
- US consumer confidence advances, supporting the gains but falls slightly below April’s figure, reflecting concerns about future business conditions.
- Inflation expectations are elevated but stable at an average of 6.1% over the next 12 months.
EUR/USD snaps five straight days of losses, rising some 0.30% in the North American session after a tranche of Eurozone (EU) economic data showed that inflation in some countries of the bloc appears to ease. Meanwhile, consumer confidence advances in the United States (US), capping the EUR/USD gains. At the time of writing, the EUR/USD is trading at 1.0727.
EUR/USD underpinned by upbeat sentiment, soft US Dollar
Wall Street trades mixed, though tech stocks climb on AI’s frenzy. The Conference Board (CB) revealed that Consumer Confidence in May rose to 102.3, below April’s 103.7, but exceeded estimates of 99. “Consumer confidence declined in May as consumers’ view of current conditions became somewhat less upbeat while their expectations remained gloomy,” said Ataman Ozyildirim, Senior Director, Economics at The Conference Board. The report showed that Americans are becoming pessimistic about future business conditions, though expectations for jobs and income remain steady.
Inflation expectations remain elevated but stable at a 6.1% average over the next 12 months.
Recently, the Dallas Fed Manufacturing Index for May plunged by -29.1, below the previous month's -23.4 contraction, signaling that business activity continued to deteriorate.
The US Dollar Index (DXY), a gauge that measures the buck’s value against a basket of six currencies, is down 0.06%, at 104.116.
Aside from this, the Eurozone economic agenda featured May inflation in Spain, with MoM figures at -0.1%, below estimates of 0.1% and well beneath the prior’s month reading of 0.6%. Annually based, inflation expanded by 3.2%, below forecasts of 3.5%.
Meanwhile, European Central Bank (ECB) speakers led by Lithuanian policymaker Gediminas Simkus commented that the ECB could raise ratees in June and July, echoing comments by many policymakers that June’s hike is not the last. Nevertheless, when speaking about September, he said, “it’s too early to say.”
EUR/USD Technical Levels
Economists at MUFG Bank expect a strong Nonfarm Payrolls report on Friday to provide further support to the greenback.
Focus to switch to health of US labour market from US debt ceiling
“Market attention in the coming days will now turn to the passage of the bill through Congress. While there is genuine unease about the deal amongst Democrats and Republicans which could make it a close call, we expect the deal to be passed to suspend the debt ceiling in time. By passing the deal ahead of the X date the US economy will avoid a bigger negative shock.”
“Assuming that US politicians don’t surprisingly reject the deal, market attention should switch back to the health of the US labour market in the week ahead including the release of the NFP report on Friday. The US rate market has been moving to price in a higher probability of another 25 bps hike from the Fed at next month’s FOMC meeting, which is now judged as more likely than not. Another strong employment report this week would further reinforce those expectations and encourage a stronger USD in the near-term.”
The USD is trading lower. Economists at Scotiabank analyze US Dollar Index (DXY) technical outlook.
DXY is breaking below rising trend support that has guided the market higher through much of May
“USD losses are broad across the G10 FX space and while losses for the DXY do not appear that significant at this point, the index is down for a third session in a row and short-term trading patterns show the index is breaking below rising trend support that has guided the market higher through much of May.”
“A soft close on the day would imply a (technical) peak in the DXY in the short run at least and greater downside risk for the USD after its uninterrupted 3.5% run higher over the month.”
- Gold rebounds sharply as government bond yields decline.
- XAU/USD climbs $30 from monthly lows to reach five-day highs.
Gold price is rising considerably on Tuesday, supported by a decline in government bond yields. XAU/USD hit a fresh daily high at $1,962 before pulling back towards $1,950.
Earlier in the day, XAU/USD hit a two-month low of $1,931 at the beginning of the European session before jumping more than $30 in a rally that started after Spain's inflation figures.
According to preliminary data, Spain's Consumer Price Index (CPI) dropped 0.1% in May, against expectations of a 0.1% increase, with the annual rate falling from 4.1% to 3.2%. These figures could be anticipating a larger decline in Eurozone inflation, due to be released on Thursday. Germany will report April's preliminary CPI data on Wednesday.
Meanwhile, US economic data will also take centre stage, with the focus on employment figures. ADP will release its report on Thursday, and Nonfarm Payrolls are due on Friday.
Bond yields are falling in Europe and the US, with the 10-year German bund yield standing at 2.37%, the lowest since May 18, and the 10-year Treasury yield at 3.73%, down 1% for the day.
Levels to watch
Despite the recent rebound in XAU/USD, the overall trend remains downwards. If the price manages to consolidate above $1,955, it could provide some support for the bulls and potentially lead to a more sustainable recovery. The next resistance levels are seen at $1,965 and $1,970.
On the flip side, if the price declines below $1,945, it could expose the next support level at $1,935, and then potentially test the recent bottom near $1,930.
Technical levels
- CB Consumer Confidence Index declined modestly in May.
- US Dollar Index stays in positive territory above 104.00.
Consumer sentiment in the US weakened slightly in May with the Conference Board's Consumer Confidence Index edging lower to 102.3 from 103.7 in April (revised from 101.3).
Further details of the publication revealed that the Present Situation Index declined to 148.6 from 151.8 and the Consumer Expectations Index stayed virtually unchanged at 71.5.
Finally, the one-year consumer inflation expectations ticked down to 6.1% in May from 6.2% in April.
Market reaction
The US Dollar Index clings to small daily gains slightly above 104.00 after this report.
Economists at Standard Chartered expect the US Dollar to weaken against the Euro and the Japanese Yen.
Pressure on BoJ to scrap policy unlikely to go away amid rising inflation in Japan
“EUR/USD to rise towards 1.09-1.10, USD/JPY to fall towards 133-134 over the next three months.”
“Unlike the Fed, we do not see the ECB altering its tightening bias for now, given the relatively stronger growth and greater inflation pressure.”
“USD/JPY also has room to reverse its initial disappointment from the BoJ ruling out any immediate change to its Yield Curve Control (YCC) policy. We believe that the pressure on BoJ to scrap policy is unlikely to go away amid rising inflation in Japan.”
- EUR/GBP accelerates losses to the 0.8830 region.
- The Sterling outperforms in a choppy trading session.
- EMU Consumer Confidence came in at -17.4 in May.
Further strength in the British pound dragged EUR/GBP to new YTD lows in the 0.8630/25 band on Tuesday.
EUR/GBP weaker on GBP-buying
EUR/GBP retreats for the third session in a row and seems to break below the consolidative theme in place since mid-May, just below 0.8700 the figure.
Renewed weakness in the cross came in response to the better tone in the quid, while the inconclusive price action in the dollar appears to have underpinned the sentiment in the risk-associated universe.
Some support for the euro also came after hawkish comments from the ECB’s Simkus, who advocated for further hikes in June and July.
In the euro docket, the final print of the Consumer Confidence matched the preliminary readings at -17.4 for the month of May, while Economic Sentiment and Industrial Sentiment in the broader Euroland weakened to 96.5 and -5.2 in the same period.
EUR/GBP key levels
The cross is retreating 0.44% at 0.8628 and the breakdown of 0.8547 (monthly low December 1 2022) would expose 0.8386 (weekly low August 17 2022) and finally 0.8249 (monthly low April 14 2022). On the other hand, the next resistance level aligns at 0.8750 (200-day SMA) followed by 0.8834 (monthly high May 3) and then 0.8875 (monthly high April 25).
- NZD/USD recovers early lost ground to a multi-month low, albeit lacks follow-through.
- Retreating US bond yields prompts USD profit-taking and lends some support to the pair.
- Bets for more Fed rate hikes, economic woes to act as a tailwind for the buck and cap gains.
The NZD/USD pair stages a goodish intraday bounce from the 0.6025 area, or its lowest level since November 2022 touched this Tuesday and touches a fresh daily high during the early North American session. Spot prices, however, struggle to capitalize on the move and currently trade around mid-0.6000s, nearly unchanged for the day.
A sharp intraday slide in the US Treasury bond yields trigger a modest US Dollar (USD) pullback from the highest level since mid-March touched this Tuesday, which, in turn, lends some support to the NZD/USD pair. This, along with a positive risk tone, undermines the safe-haven Greenback and further benefits the risk-sensitive Kiwi. The market sentiment gets a minor boost in reaction to a tentative agreement to suspend the US government's $31.4 trillion debt ceiling til January 2025 and avert an unprecedented American default.
That said, expectations that the Federal Reserve (Fed) will keep interest rates higher for longer could act as a tailwind for the US bond yields and favours the USD bulls. The recent hawkish remarks by a slew of influential Fed officials lifted market bets for another 25 bps lift-off in June. The speculations were reaffirmed by the stronger US Core PCE Price Index released on Friday, which pointed to sticky inflation. This, along with worries about slowing global economic growth and fresh US-China tensions, could cap antipodean currencies, including the Kiwi.
Apart from this, the Reserve Bank of New Zealand's (RBNZ) explicit signal last week that it was done with its most aggressive hiking cycle since 1999 might hold back traders from placing aggressive bullish bets around the NZD/USD pair. This, in turn, suggests that the path of least resistance for spot prices is to the upside and any subsequent move up might still be seen as a selling opportunity. Traders now look to the release of the Conference Board's US Consumer Confidence Index, which might influence the USD and provide some impetus to the major.
Technical levels to watch
Loonie makes marginal headway after the 1.3660 test. Economists at Scotiabank analyze USD/CAD technical picture.
Break below 1.3560 should see losses extend a bit further toward 1.3520/25
“Short-term trading patterns look a bit soft for USD/CAD as the market backs a bit further away from technical resistance at 1.3660. But there is not really much evidence of a reversal in intraday/daily chart patterns at this point.”
“Intraday trend support at 1.3560 is within reach, however, and a break below here should see USD losses extend a bit further towards moving average support clustered around 1.3520/25.”
- House prices in the US continued to rise in March.
- US Dollar Index holds steady at around 104.00.
House prices in the US rose by 0.6% on a monthly basis in March, the monthly data published by the US Federal Housing Finance Agency showed on Tuesday. This reading followed February's increase of 0.7% (revised from 0.5%) and came in better than the market expectation of +0.2%.
Meanwhile, the S&P/Case-Shiller Home Price Index arrived at -1.1% on a yearly basis in March, down from +0.4% recorded in February.
Market reaction
These data don't seem to be having an impact on the US Dollar's performance against its rivals. As of writing, the US Dollar Index was virtually unchanged on the day at 104.05.
Economists at Scotiabank analyze EUR/USD technical outlook.
Technicals look favourable
“Intraday trading patterns are positive for the EUR.”
“Spot’s snap higher form the session low has developed into a short-term bull ‘hammer’ signal and gains have extended through the May downtrend resistance at 1.0720 (now support).”
“Gains will have to develop a bit more and hold on a daily closing basis but corrective EUR gains could extend a bit more towards 1.0775/1.0825 from here.”
See: EUR/USD may be gently making its way to the March lows at 1.0515/0530 – ING
- USD/CAD struggles to capitalize on its modest intraday uptick amid a slight USD pullback.
- Rising bets for more rate hikes by the Fed act as a tailwind for the buck and the major.
- A fresh leg down in Oil prices further undermines the Loonie and lends support to the pair.
The USD/CAD pair attracts some intraday selling on Tuesday and drops to a four-day low during the early North American session. Spot prices, however, manage to rebound a few pips in the last hour and currently trade just below the 1.3600 mark, nearing unchanged for the day.
The US Dollar (USD) pulls back from its highest level since mid-March touched earlier this Tuesday amid a sharp intraday slide in the US Treasury bond yields and turns out to be a key factor acting as a headwind for the USD/CAD pair. That said, firming expectations that the Federal Reserve (Fed) will keep interest rates higher for longer might continue to lend support to the US bond yields and favours the USD bulls.
In fact, the current market pricing indicates a greater chance of another 25 bps lift-off at the June FOMC policy meeting and the bets were reaffirmed by the recent hawkish remarks by a slew of influential Fed officials. Adding to this, the stronger US Core PCE Price Index released on Friday pointed to sticky inflation, which should allow the US central bank to maintain its hawkish stance and continue raising interest rates.
Apart from this, the prevalent cautious market mood supports prospects for the emergence of some dip-buying around the USD. Investors remain concerned about slowing global economic growth, which, along with fresh US-China tensions, overshadows the latest optimism over a tentative deal to suspend the US government's $31.4 trillion debt ceiling until January 2025 and avert an unprecedented American default.
Furthermore, a fresh leg down in Crude Oil prices seems to undermine the commodity-linked Loonie and further contributes to limiting the downside for the USD/CAD pair. The aforementioned fundamental backdrop suggests that the path of least resistance for spot prices is to the upside. Hence, any subsequent slide is more likely to remain limited as traders now look to the Conference Board's US Consumer Confidence Index.
Technical levels to watch
-
Oil price has weakened as investors start to fear the deal to extend the debt ceiling may be derailed by Congress.
-
Mixed messages from OPEC+ members further confuse the market – next meeting is June 4.
-
Odds still favor a rate hike from the Fed at their next meeting, putting downward pressure on Oil.
Oil price slides lower on Tuesday as investors question whether the debt-ceiling deal will get voted into law. At least two rebel Republicans and one Democrat have voiced their disapproval and may vote against the deal. If the US defaults on its obligations, financial chaos is expected to follow, probably hitting the Oil price, though some analysts have said the US Dollar might also suffer, which would be positive for Oil since it is mostly priced in USD. Mixed messaging from OPEC+ adds to the opaque outlook.
At the time of writing, WTI Oil is trading in the upper $71s and Brent Crude Oil in the upper $75s.
Oil news and market movers
-
Oil price loses ground as investors worry about whether the debt-ceiling deal agreed by President Joe Biden and Republican House Speaker Kevin McCarthy will get enough votes in both Congress and the Senate to pass into law.
-
A vote in Congress could be as soon as Wednesday, but so far, at least two House Republicans have voiced their displeasure at the idea of increasing the country’s already gigantic debt pile. For different reasons, Democrat Riche Torres has criticized the cuts to disability benefits that form part of the agreement.
-
Both the debt deal as well as robust US macroeconomic data has increased market expectations that the Federal Reserve (Fed) will have to raise interest rates to combat rising inflation expectations – bullish for the US Dollar; bearish for Oil.
-
The CME FedWatch tool shows a 58% chance of the Fed raising interest rates by 0.25% at their meeting on June 14 (at time of writing).
-
Although this is down from the previous day’s 60% it still shows the odds favor a rate hike at the June meeting rather than no change as had been the prior expectation.
-
Oil traders further await the outcome of the next meeting of OPEC+ on June 4, when the possibility of production cuts has been mooted.
-
Investors remain a little confused as two of OPEC+’s largest members seem to be giving divergent messages over what might happen.
-
Last Tuesday, May 24, Saudi Oil Minister Prince Abdulaziz bin Salman seemed to imply OPEC+ might cut production quotas when he warned speculators (interpreted as short-sellers) to “watch out” and expressed support for OPEC’s October decision to cut supply.
-
Russia’s Energy Minister Alexander Novak, however, later played down the idea of production cuts. “I don't think that there will be any new steps, because just a month ago certain decisions were made regarding the voluntary reduction of oil production by some countries," he said.
Crude Oil Technical Analysis: Mixed technical outlook leads to waiting game
WTI Oil is in an established downtrend from a technical perspective, making successive lower lows, and so given the old adage that the trend is your friend, this overall favors short sellers over longs. WTI Oil is trading below all the major daily Simple Moving Averages (SMA) and all the weekly SMAs except the 200-week, which is at $66.90.
-638210468658146607.png)
WTI US Oil: Weekly Chart
That said, a possible bullish right-angled triangle may have just finished forming, as shown by the dotted lines on the chart below.
-638210469200364125.png)
WTI US Oil: Daily Chart
Price initially seemed to break out above the upper borderline of the triangle on May 24 but then failed to follow through higher and reversed, forming a spinning top Japanese candlestick reversal pattern in the process. It then rallied on Monday before capitulating again and is currently trading back below the lower border.
A decisive break below the May 22 lows of $70.65, or better still, the $69.40 May 15 lows, would provide confirmation that the triangle is actually breaking out lower. Such a break ought to be represented by a long red candlestick or three down-days in a row for solid confirmation.
A break below the year-to-date (YTD) lows of $64.31 would imply a new lower low was forming, reigniting the downtrend. The next target from there would be at around $62.00, where trough lows from 2021 will come into play, followed by support at $57.50.
A breakout higher is still possible, however. The three green up bars in a row that occurred prior to the bullish breakout on May 24 are a strong signal, suggesting there is still a chance price could recover.
Oil price needs to climb back above the $74.70 May 24 highs for confirmation.
Such a bullish breakout could see Oil price rise in a volatile rally to a potential target in the $79.70s, calculated by using the usual technical method, which is to take 61.8% of the height of the triangle and extrapolate it from the breakout point higher. Oil price could even go as far as a 100% extrapolation, however, the 61.8% level roughly coincides with the 200-day SMA and the main trendline for the bear market, heightening its importance as a key resistance level.
Assuming Oil price reaches its target, a bullish break would also signify that price had surpassed the key $76.85 lower high of April 28, thereby, bringing the dominant bear trend into doubt.
The long hammer Japanese candlestick pattern that formed at the May 4 (and year-to-date) lows is a further sign that Oil price may have formed a strategic bottom.
Further, the mild bullish convergence between price and the Relative Strength Index (RSI) at the March and May 2023 lows – with price making a lower low in May that is not matched by a lower low in RSI – is a sign that bearish pressure is easing.
WTI Oil FAQs
What is WTI Oil?
WTI Oil is a type of Crude Oil sold on international markets. The WTI stands for West Texas Intermediate, one of three major types including Brent and Dubai Crude. WTI is also referred to as “light” and “sweet” because of its relatively low gravity and sulfur content respectively. It is considered a high quality Oil that is easily refined. It is sourced in the United States and distributed via the Cushing hub, which is considered “The Pipeline Crossroads of the World”. It is a benchmark for the Oil market and WTI price is frequently quoted in the media.
What factors drive the price of WTI Oil?
Like all assets, supply and demand are the key drivers of WTI Oil price. As such, global growth can be a driver of increased demand and vice versa for weak global growth. Political instability, wars, and sanctions can disrupt supply and impact prices. The decisions of OPEC, a group of major Oil-producing countries, is another key driver of price. The value of the US Dollar influences the price of WTI Crude Oil, since Oil is predominantly traded in US Dollars, thus a weaker US Dollar can make Oil more affordable and vice versa.
How does inventory data impact the price of WTI Oil
The weekly Oil inventory reports published by the American Petroleum Institute (API) and the Energy Information Agency (EIA) impact the price of WTI Oil. Changes in inventories reflect fluctuating supply and demand. If the data shows a drop in inventories it can indicate increased demand, pushing up Oil price. Higher inventories can reflect increased supply, pushing down prices. API’s report is published every Tuesday and EIA’s the day after. Their results are usually similar, falling within 1% of each other 75% of the time. The EIA data is considered more reliable, since it is a government agency.
How does OPEC influence the price of WTI Oil?
OPEC (Organization of the Petroleum Exporting Countries) is a group of 13 Oil-producing nations who collectively decide production quotas for member countries at twice-yearly meetings. Their decisions often impact WTI Oil prices. When OPEC decides to lower quotas, it can tighten supply, pushing up Oil prices. When OPEC increases production, it has the opposite effect. OPEC+ refers to an expanded group that includes ten extra non-OPEC members, the most notable of which is Russia.
UOB Group’s Senior Economist Julia Goh and Economist Loke Siew Ting review the latest inflation figures in Malaysia.
Key Takeaways
“Headline inflation recorded a small blip, as it eased to 3.3% y/y in Apr (from +3.4% in Mar), marking an eighth straight month of deceleration and the lowest level since May 2022. The outturn matched our estimate and Bloomberg consensus. It was largely thanks to softer food and services (i.e. restaurants & hotels, education, healthcare, and packaged tours) price inflation amid diminishing base effects and the implementation of Festive Season Maximum Price Control Scheme (SHMMP) for Hari Raya Aidilfitri from 14-30 Apr.”
“Apr’s inflation reading further affirms our view that the disinflationary process will persist at a moderate pace throughout the remaining months of the year. In recent weeks, the government also hinted that the prospects of implementing a targeted subsidy mechanism remain intact but the timeline of execution (particularly for fuels) may be pushed to next year instead of in 2H23. With that, we maintain our 2023 full-year inflation forecast at 2.8% (BNM est: 2.8%-3.8%, 2022: 3.3%), while not factoring in any impact of government’s gradual subsidy rationalization.”
“Manageable inflation expectations and slowing economic growth momentum will continue to give central bank breathing room to maneuver its monetary policy stance as we enter 2H23. Core inflation extended its downtrend and eased at a faster pace than headline inflation in Apr, reflecting the lagged effects of past interest rate hikes and cautious consumer sentiment in light of heightened uncertainty surrounding the global and domestic economy. The existing price controls and fuel subsidies are also expected to further contain the extent of upward pressures to inflation in the near term. Recognizing these developments and peaking of global interest rates, we continue to expect no further adjustment in the Overnight Policy Rate (OPR, current: 3.00%) for the rest of the year.”
- The Turkish lira extended the selloff to the 20.40/45 band.
- The lira's exodus accelerated after Erdogan's win on Sunday.
- Erdogan reaffirmed the continuation of a low-rate policy.
The Turkish lira (TRY) magnifies its decline vs. the greenback and propels USD/TRY to a new record top north of 20.40 on turnaround Tuesday.
The Turkish lira is poised for further weakness
The march north in USD/TRY remained unabated on Tuesday amidst the unabated sell-off in the lira, which was particularly magnified after incumbent Recep Tayyip Erdogan secured his victory in the 2023 presidential election, extending his rule into a third decade in power.
The deep pullback in TRY comes pari passu with quite a pessimistic economic outlook for the country, which can even get worse after President Erdogan reaffirmed the continuation of the unorthodox (unreal? Non-sensical?) policy of tackling the elevated inflation with low interest rates.
Further concerns also emerge in a context where the country's FX reserves do everything but grow and the current account deficit flirts with its widest in series history.
It is worth noting that the pair has closed with gains in every single week since March 1.
Later on Tuesday, Trade Balance figures for the month of April will be the sole release in the domestic docket ahead of Q1 GDP results on Wednesday and the Manufacturing PMI on Thursday.
USD/TRY key levels
So far, the pair is gaining 1.37% at 20.3879 and faces the next hurdle at 20.4196 (all-time high May 30) followed by 21.00 (round level). On the downside, a break below 19.3967 (55-day SMA) would expose 19.1366 (100-day SMA) and finally 18.8192 (200-day SMA).
Sterling is the top-performer on the session as shop price data shows further gain. Economists at Scotiabank expect the GBP/USD pair to test the upper 1.24s.
UK shop prices continue to surge
“The BRC’s survey of shop prices reached 9% in May (a record) suggesting no relenting from the upward push in prices and reinforcing expectations that the BoE has more – perhaps quite a bit more – work to do.”
“Strong intraday bidding for the Pound leaves a positive impression on the short-term chart.”
“Congestion/retracement resistance stands at 1.2450/1.2495.”
Economists at Société Générale analyze EUR/SEK technical outlook.
Peak achieved in 2009 at 11.78 could be an important resistance
“EUR/SEK has recently overcome the upper part of its consolidation since February affirming resumption in uptrend. It is approaching next projections of 11.63/67 which is also a multi month channel band. An initial pullback is expected after achievement of this zone however upper limit of previous range at 11.42 should be an important support; only if this gets violated would there be risk of an extended correction.”
“The peak achieved in 2009 at 11.78 could be an important resistance near term.”
Senior Economist Alvin Liew at UOB Group assesses the latest results from Industrial Production in Singapore.
Key Takeaways
“Singapore’s industrial production (IP) contracted more than forecast in Apr, affirming the weak manufacturing outlook. IP contracted by -1.9% m/m, -6.9% y/y in Apr, worse than Bloomberg’s median forecast of +0.1% m/m, -4.5% y/y and our forecasts of -0.7% m/m SA, -3.9% y/y. Meanwhile, the March IP was revised higher to 9.7% m/m, -3.8% y/y (versus the prelim estimates of 9.3% m/m SA, -4.2% y/y in Mar. This was the seventh consecutive month of y/y decline and the worst streak since 2015 (11 months of y/y declines). Excluding the volatile biomedical manufacturing, IP actually rose by 2.2% m/m (from +5.4% m/m in Mar) which translated to a smaller contraction of -6.1% y/y in Apr (from -5.6% y/y in Mar).”
“IP Outlook – While we are heartened by the continued growth in the transport engineering components of aerospace and marine & offshore, the latest Apr IP print continues to affirm our downbeat manufacturing outlook due to the worsening electronics downcycle and weaker external demand. We maintain our forecast for Singapore 2023 manufacturing to contract by 5.4%.’
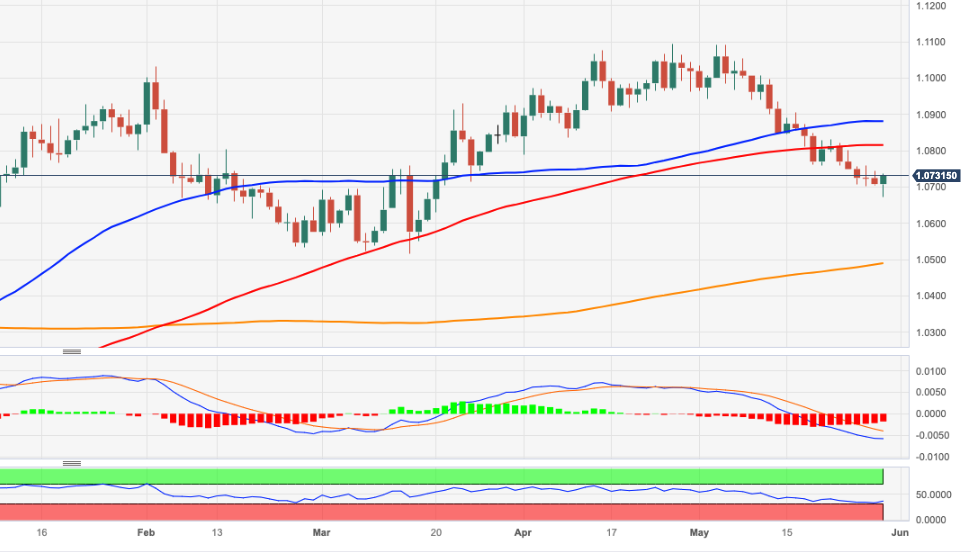
- EUR/USD rebounds from multi-week lows near 1.0670.
- The selling pressure could mitigate somewhat above 1.0830.
EUR/USD manages to regain some buying interest soon after bottoming out in new 10-week lows near 1.0670 on turnaround Tuesday.
The pair remains under heavy pressure despite the corrective bounce, although the selling mood could alleviate a tad on a convincing close above the weekly high of 1.0831 (May 22). Immediately to the upside, in the meantime, appears the transitory 100-day SMA at 1.0814.
Looking at the longer run, the constructive view remains unchanged while above the 200-day SMA, today at 1.0488.
EUR/USD daily chart
Senior Economist at UOB Group Alvin Liew comments on the latest release of the FOMC Minutes of the May gathering.
Key Takeaways
“According to the latest FOMC minutes (released on 25 May, 2am SGT), while the Federal Reserve (Fed) policymakers in its 2/3 May 2023 Federal Open Market Committee (FOMC) meeting, unanimously agreed to raise the Fed Funds Target Rate (FFTR) by 25-bps to 5.00%-5.25%, there was a lack of collective agreement on the next move.”
“Recall in the May policy decision, the Fed made a significant change in the forward guidance of its monetary policy statement (MPS), as it removed a key part of the FOMC statement, ‘some additional policy firming may be appropriate’ (from the Mar FOMC) and replaced it with ‘In determining the extent to which additional policy firming may be appropriate to return inflation to 2 percent over time, the Committee will take into account the cumulative tightening of monetary policy, the lags with which monetary policy affects economic activity and inflation, and economic and financial developments’.”
“FOMC Outlook – Done At 5.25% And Pause For Rest Of 2023. The change in language of the May FOMC statement and the lack of collective agreement among FOMC policymakers on the next policy move, implies our base case for a pause in the Jun FOMC remains valid. We still expect the 25-bps hike in the May FOMC to be the last one in the current Fed rate cycle and a pause thereafter. We continue to expect no rate cuts in 2023, with the FFTR terminal rate at 5.25% to last through this year.”
- DXY fades the earlier bullish move to new 2-month highs near 104.50.
- The resumption of the uptrend should retarget the 200-day SMA.
DXY comes under fresh downside pressure following earlier peaks past 104.50 on Tuesday.
In the near term, extra gains appear on the cards despite the ongoing knee-jerk. That said, the surpass of the May high at 104.53 (May 30) should put a potential visit to the key 200-day SMA, today at 105.65, back on the radar prior to the 2023 top of 105.88 (March 8).
Looking at the broader picture, while below the 200-day SMA the outlook for the index is expected to remain negative.
DXY daily chart
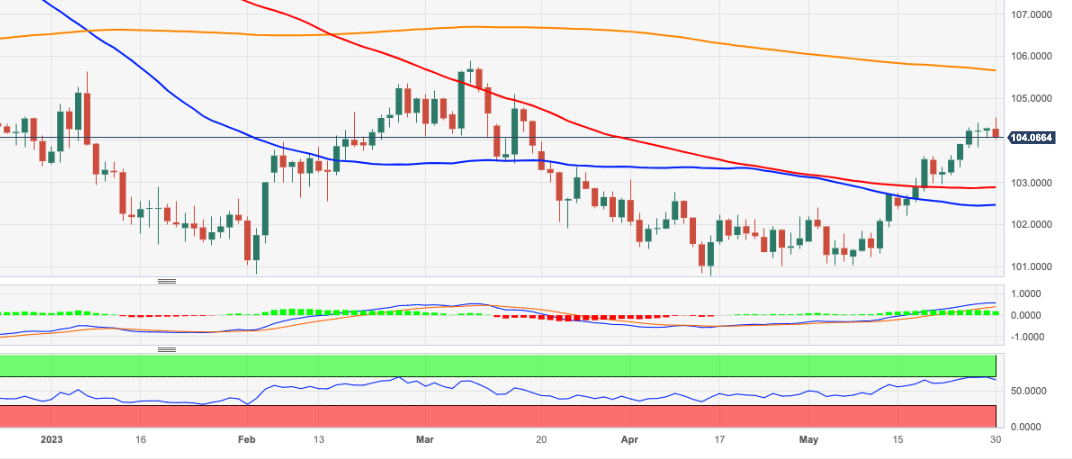
Economists at ING believe that some kind of recovery in China could lift the Euro.
Can China come to the Euro's rescue?
“We think EUR/USD is relatively cheap given the massive reversal in energy prices over the last year and that, in time, the 1.05/1.07 area will come to be seen as a summer base. Helping that proposition would be some kind of recovery in China.”
“Official May Chinese PMI figures are released later this week. A bounceback here, helping to reverse the recent run-up in USD/CNH, could provide the Euro with some support.”
- US Dollar struggles to build on last week's gains.
- US Dollar Index stays on the back foot as risk mood improves on debt-limit deal.
- Investors await May Consumer Confidence Index data from the US.
The US Dollar (USD) finds it difficult to preserve its bullish momentum on Tuesday as investors move toward risk-sensitive assets on hopes of the US debt-ceiling bill being finalized in the next couple of days. The US Dollar Index, which touched a fresh multi-month high above 104.50 earlier in the day, was last seen retreating toward 104.00. In the meantime, US stock index futures gain between 0.3% and 1.1%, reflecting the improving market mood.
The USD's valuation is likely to continue to be impacted by risk perception ahead of the highly-anticipated labor market data that will be published later in the week.
In the second half of the day, the Conference Board (CB) will release the Consumer Confidence Index data for May. More importantly, the House Rules Committee is scheduled to vote on the 99-page bill that US President Joe Biden and House Speaker Kevin McCarthy agreed on to suspend the debt-ceiling before sending it to the House floor for a final vote on Wednesday.
Daily digest market movers: US Dollar struggles to find demand
- Previewing the upcoming confidence data, "the CB Consumer Confidence Index fell in April to 101.3 from 104.0 in March and is expected to have shrunk further in May to 99.1," noted FXStreet Analyst Valeria Bednarik. "Since February 2022, the Expectations sub-component has remained below 80, a level usually associated with expectations of a recession within the next year. In fact, the sub-index fell to 68.1 in April from 74 in the previous month, indicating people do not see the situation improving and still fear worsening economic conditions."
- Following the three-day weekend, US Treasury bond yields opened lower on Tuesday. The benchmark 10-year yield was last seen losing more than 1% on the day near 3.7%. Nevertheless, the CME Group FedWatch Tool still shows that markets are pricing a less than 40% probability of the US Federal Reserve (Fed) leaving its policy rate unchanged in June.
- On Sunday, US President Joe Biden and Republican House Speaker Kevin McCarthy reached an agreement to temporarily suspend the debt-limit to avoid a US debt default. The House of Representatives and Senate still need to approve the deal, which will suspend the $31.4 trillion debt-ceiling until January 1, 2025, in coming days.
- The US Bureau of Economic Analysis (BEA) reported on Friday that inflation in the US, as measured by the change in Personal Consumption Expenditures (PCE) Price Index, rose to 4.4% on a yearly basis in April from 4.2% in March.
- The annual Core PCE Price Index, the Fed's preferred gauge of inflation, edged higher to 4.6%, compared to the market expectation of 4.6%.
- Further details of the BEA's publication showed that Personal Income increased 0.4% on a monthly basis while Personal Spending rose 0.8%.
- Cleveland Fed President Loretta Mester told CNBC on Friday that PCE Price Index data underscore the slow progress on inflation. "It's important for the Fed not to under tighten the monetary policy," Mester added.
- On Thursday, the ADP will release the private sector employment data ahead of the US Bureau of Labor Statistics' Nonfarm Payrolls (NFP) data for May on Friday.
Technical analysis: US Dollar Index stays bullish despite the latest pullback
The Relative Strength Index (RSI) indicator on the daily chart retreated toward 60 early Tuesday after touching 70 on Monday, suggesting that the US Dollar Index (DXY) is staging a technical correction rather than turning bearish. 104.00 (Fibonacci 23.6% retracement of the November-February downtrend), however, aligns as key support. A daily close below that level could attract USD sellers and open the door for an extended slide toward 103.00, where the 100-day Simple Moving Average (SMA) is located.
If DXY continues to use 104.00 as support, buyers are likely to remain interested. Additionally, the bullish cross seen in the 20-day and the 50-day SMAs confirms the bullish bias. On the upside, 104.50 (daily high) aligns as interim hurdle ahead of 105.00 (psychological level, static level) and 105.60 (200-day SMA, Fibonacci 38.2% retracement).
How does Fed’s policy impact US Dollar?
The US Federal Reserve (Fed) has two mandates: maximum employment and price stability. The Fed uses interest rates as the primary tool to reach its goals but has to find the right balance. If the Fed is concerned about inflation, it tightens its policy by raising the interest rate to increase the cost of borrowing and encourage saving. In that scenario, the US Dollar (USD) is likely to gain value due to decreasing money supply. On the other hand, the Fed could decide to loosen its policy via rate cuts if it’s concerned about a rising unemployment rate due to a slowdown in economic activity. Lower interest rates are likely to lead to a growth in investment and allow companies to hire more people. In that case, the USD is expected to lose value.
The Fed also uses quantitative tightening (QT) or quantitative easing (QE) to adjust the size of its balance sheet and steer the economy in the desired direction. QE refers to the Fed buying assets, such as government bonds, in the open market to spur growth and QT is exactly the opposite. QE is widely seen as a USD-negative central bank policy action and vice versa.
- AUD/USD reverses an intraday slide amid a modest USD pullback from over a two-month high.
- Retreating US bond yields and a positive risk tone prompts some profit-taking around the USD.
- Bets for more Fed rate hikes to act as a tailwind for the buck and cap any upside for the major.
The AUD/USD pair attracts some dip-buying near the 0.6500 psychological mark on Tuesday and builds on its steady intraday ascent through the first half of the European session. Spot prices, however, lack bullish conviction and currently trade around the 0.6540-0.6535 region, nearly unchanged for the day and below a multi-day high touched earlier today.
A combination of factors prompts traders to take some profits off their US Dollar (USD) bullish positions, especially after the recent runup to over a two-month high, which, in turn, is seen lending some support to the AUD/USD pair. A tentative deal to raise the $31.4 trillion debt ceiling and avert an unprecedented American default boosts investors' confidence, which is evident from a generally positive tone around the equity markets. This, along with a sharp intraday slide in the US Treasury bond yields, undermines the safe-haven buck.
That said, growing worries about slowing global economic growth, particularly in China, and fresh US-China tensions might cap any optimism in the markets. It is worth recalling that data from China recently showed that the world's second-largest economy underperformed in April. Furthermore, China declined a request for a meeting between US defence secretary Lloyd Austin and Chinese defence minister Li Shangfu at a forum in Singapore later this week, fueling fears of worsening ties between the world's two largest economies.
Moreover, the downside for the USD is likely to remain limited amid expectations that the Federal Reserve will keep interest rates higher for longer. In fact, the markets are now pricing in a greater chance of another 25 bps lift-off at the next FOMC policy meeting in June. This, along with speculations that the Reserve Bank of Australia (RBA) might refrain from hiking in June, bolstered by softer domestic data, should contribute to capping the AUD/USD pair and suggests that the path of least resistance for spot prices is to the downside.
Market participants now look to the release of the Conference Board's US Consumer Confidence Index, due later during the early North American session. This, along with the US bond yields and the broader risk sentiment, will influence the USD price dynamics and produce short-term trading opportunities around the AUD/USD pair. The focus will then shift to RBA Governor Philip Lowe's speech, the monthly Australian consumer inflation figures and the official Chinese PMI prints, due during the Asian session on Wednesday.
Technical levels to watch
The AUD/USD pair traded just above the 0.65 level but has managed to recover toward the mid-0.6500s. Economists at Société Générale analyze Aussie’s technical outlook, highlighting risks to the downside.
Steady down move
“AUD/USD has confirmed a Head and Shoulders denoting extension in down move. Next potential objectives are at 0.6450 and projections of 0.6280/0.6220.”
“Right shoulder level at the 0.6780/0.6850 area is crucial resistance zone.”
“Supports: 0.6450, 0.6410, 0.6355.”
“Rasistances: 0.6560, 0.6600, 0.6680.”
See – AUD/USD: Disappointing data threatens to weigh even more heavily on the Aussie – Commerzbank
Economist at UOB Group Enrico Tanuwidjaja comments on the latest decision on interest rates by the Bank Indonesia (BI).
Key Takeaways
“Bank Indonesia (BI) kept its benchmark policy rate (7-Day Reverse Repo) unchanged at 5.75% following its May MPC meeting, in line with consensus and our expectations.”
“BI remains of the view that inflation expectations are ‘well-anchored’ and it expects headline inflation to return to BI’s target range of 2-4% by 3Q23. Stronger rupiah has supported, keeping imported inflation pressures at bay.”
“Today’s MPC decision also signalled that BI is not too defensive about possibility of rate cuts. In our view, the key catalysts for the start of the rate cutting cycle would be a consistently declining inflation towards its target range, a more anchored and persistent stability of the rupiah, and an increasing need to support the growth momentum ahead. We keep our view for the rate cut cycle to start in 1Q24.”
- EUR/JPY comes under further downside pressure and breaches 150.00.
- A move above 151.00 should put the 2023 peak near 151.60 on the radar.
EUR/JPY adds to Monday’s fresh bearishness and breaks below the key support at 150.00 the figure on Tuesday.
Further upside appears a plausible near-term scenario, and a convincing breakout of the round level at 151.00 could encourage the cross to confront the 2023 top at 151.61 (May 2) in the not-so-distant future.
So far, further upside looks favoured while the cross trades above the 200-day SMA, today at 143.76.
EUR/JPY daily chart
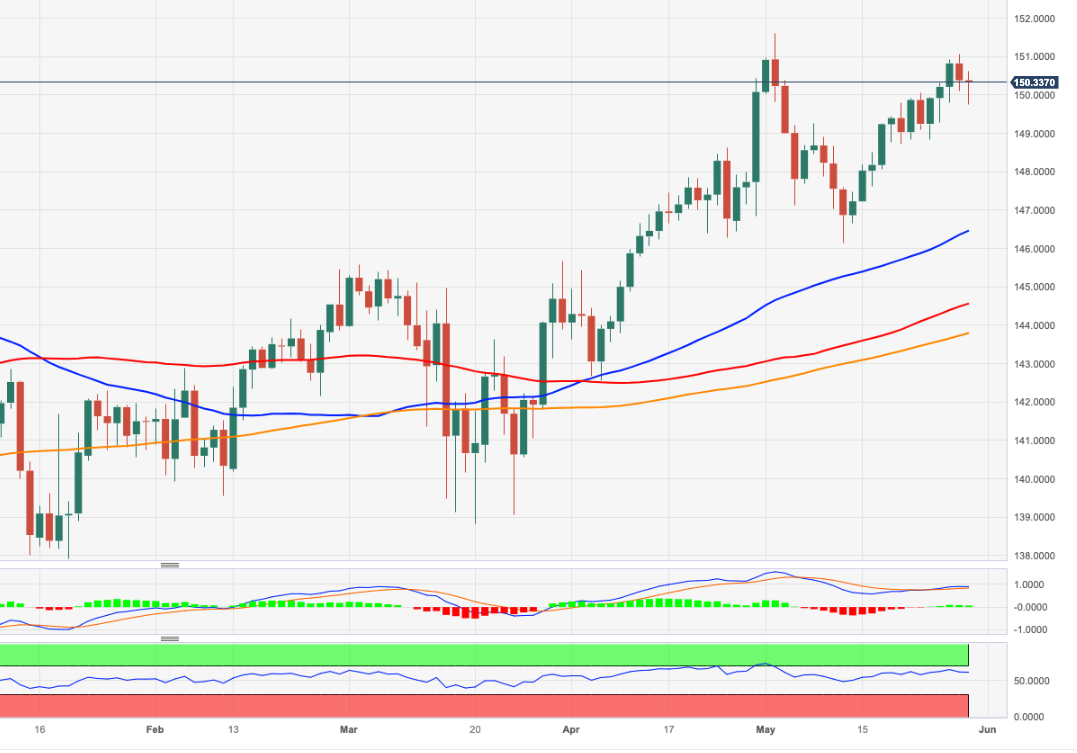
European Central Bank (ECB) Governing Council Gediminas Šimkus said on Tuesday that he expects a 25 basis points (bps) rate hike in June and July.
Markets are currently pricing an 87% probability of a 25 bps ECB rate hike next month.
Market reaction
EUR/USD is consolidating the latest upswing at around 1.0730, adding 0.11% on the day, at the time of writing.
- USD/JPY retreats from a fresh YTD peak touched this Tuesday amid a modest USD downtick.
- The Fed-BoJ policy divergence and the US debt ceiling optimism act as a tailwind for the pair.
- The fundamental backdrop still supports prospects for a further near-term appreciating move.
The USD/JPY pair pulls back from a six-month high touched earlier this Tuesday and turns lower for the second successive day. Spot prices slide below the mid-140.00s during the first half of the European session, though any meaningful corrective pullback still seems elusive.
The US Dollar (USD) bulls opt to take some profits off the table following the recent runup to over a two-month high amid retreating US Treasury bond yields. This, along with a slightly overbought Relative Strength Index (RSI) on the daily chart, prompts some long-unwinding trade around the USD/JPY pair. The USD downside, however, remains cushioned amid expectations that the Federal Reserve (Fed) will keep interest rates higher for longer.
In fact, the current market pricing indicates a greater chance of another 25 bps lift-off at the next FOMC monetary policy meeting in June. The bets were reaffirmed by the recent hawkish remarks by a slew of influential Fed officials and the US Core PCE Price Index released on Friday, which pointed to sticky inflation. This should act as a tailwind for the USD and supports prospects for the emergence of some dip-buying around the USD/JPY pair.
The Bank of Japan Governor Kazuo Ueda, meanwhile, had said that the central bank will continue easing with yield curve control. Adding to this, the Tokyo CPI released last Friday showed that inflation in Japan’s capital city eased more than expected in May. This validates the BoJ's view that inflation in Japan is likely to slow back below the 2% target in the middle of the current fiscal year and allow the central bank to stick to its dovish stance.
This, along with a positive risk tone, could undermine the safe-haven Japanese Yen (JPY) and contribute to limiting losses for the USD/JPY pair. US lawmakers signalled that they have reached a tentative agreement to suspend the US government's $31.4 trillion debt ceiling till January 25 and avert an unprecedented default by the world's largest economy. This, in turn, boosts investors' confidence, which is evident from the upbeat mood around the equity markets and is seen driving flows away from traditional safe-haven assets, including the JPY.
The aforementioned fundamental backdrop suggests that the path of least resistance for the USD/JPY pair is to the upside. Hence, any meaningful pullback might still be seen as a buying opportunity and is more likely to remain cushioned. Traders now look to the Conference Board's US Consumer Confidence Index for short-term opportunities later during the early North American session.
Technical levels to watch
Economists at Commerzbank discuss the USD outlook as market expectations regarding US key rates have moved upwards.
Market and FOMC largely agree in their projections of the future rate path
“For the first time market and FOMC largely agree in their projections of the future rate path. It was not the FOMC that moved but the market that shifted its rate expectations to the upside. All that is USD-positive.”
“We would consider the current USD strength to be sustainable if we agreed with the new view on the Fed. But we don’t. Our Fed watchers continue to expect no further rate hikes. And that is why we expect that the current USD strength is not sustainable.”
Economists at ING discuss EUR/GBP and GBP/USD outlooks.
EUR/GBP can probably press support at 0.8650
“UK data is doing the most of the talking and it will probably be the jobs/wages data (13 June) or the May CPI data (21 June) which will be the key determinant on whether the market reins in aggressive tightening expectations.”
“Until then, EUR/GBP can probably press support at 0.8650, below which 0.8600/8610 is the next target. GBP/USD can better resist the stronger Dollar. Support around the 1.2275/2300 area may hold temporarily.”
Following the emergency meeting between the Bank of Japan (BoJ), Ministry of Finance (MoF) and Financial Services Agency (FSA), Japan’s top currency diplomat Masato Kanda said on Tuesday that “officials are watching forex moves closely.”
Additional comments
Important for currencies to move stably reflecting economic fundamentals.
Not focusing on any forex levels specifically.
Closely watching forex moves, will respond appropriately if necessary.
Market reaction
At the time of writing, USD/JPY is bouncing back toward 140.50, reversing a dip to 104.13, still down 0.19% on the day.
- GBP/USD gains some positive traction for the third straight day, though lacks follow-through.
- Hawkish BoE expectations underpin the GBP and lend support amid subdued USD price action.
- Bets for more Fed rate hikes to limit the USD losses and cap any meaningful gains for the major.
The GBP/USD pair attracts some dip-buying near the 1.2325 region on Tuesday and turns positive for the third straight day, though remains confined well within a familiar trading band held over the past week or so. The pair currently placed near the top end of its daily range, around the 1.2375 region and is supported by a combination of factors.
Investors remain anxious over the possibility of further monetary policy tightening by the UK central bank, bolstered by stronger-than-expected consumer inflation figures released last week. This, in turn, is seen underpinning the British Pound (GBP) and acting as a tailwind for the GBP/USD pair amid subdued US Dollar (USD) price action. In fact, the USD Index (DXY), which tracks the Greenback against a basket of currencies, enters a bullish consolidation phase following an early uptick to its highest level since mid-March.
The latest optimism over raising the US debt ceiling boosts investors' confidence, which is evident from a generally positive tone around the equity markets and undermines the safe-haven buck. The downside for the USD, meanwhile, seems limited amid growing acceptance that the Federal Reserve (Fed) will keep interest rates higher for longer. In fact, the current market pricing indicates a greater chance of another 25 bps lift-off at the June FOMC meeting. The expectations were lifted by the recent hawkish remarks by several policymakers.
Adding to this, the Core PCE Price Index - the Fed's preferred inflation gauge - released on Friday indicated stick inflation and reaffirmed hawkish Fed expectations. This makes it prudent to wait for strong follow-through buying before confirming that the recent pullback from over a one-year high touched earlier this month has run its course and placing fresh bullish bets around the GBP/USD pair. Traders now look to the Conference Board's US Consumer Confidence Index for a fresh impetus later during the early North American session.
Technical levels to watch
USD/CNH could lose upside traction if it breaks below the 7.0500 level in the near term, comment UOB Group’s Economist Lee Sue Ann and Markets Strategist Quek Ser Leang.
Key Quotes
24-hour view: “After USD rose to 7.0976 last Friday and then sold off, we highlighted yesterday that ‘upward pressure has eased and conditions remain overbought’ and we expected USD to trade sideways in a range of 7.0600/7.0930. Our view for sideways trading was not wrong even though USD traded in a narrower range than expected (7.0719/7.0920). Momentum indicators are mostly neutral and we continue to expect USD to trade sideways, likely in a range of 7.0700/7.0930.”
Next 1-3 weeks: “There is not much to add to our update from yesterday (29 May, spot at 7.0800). As highlighted, last Friday’s outside reversal day suggests the chance of USD rising further to 7.1200 is low. However, only a breach of 7.0500 would indicate that the USD strength that started more than 2 weeks ago has run its course.”
Economists at Wells Fargo discuss EUR/USD outlook.
Moderate gains in the Euro
“We see potential for moderate gains in the Euro over the medium term. We see continued – albeit modest – Eurozone growth over time, and a much slower pace of rate cuts from the European Central Bank relative to the Fed in 2024.”
“Against this backdrop, we forecast the Euro to gain to 1.08 by the end of 2023 and strengthen to 1.14 by late 2024.”
See: The relative fundamental divergence ahead remains more EUR/USD supportive – MUFG
Here is what you need to know on Tuesday, May 30:
The US Dollar (USD) continues to gather strength against its rivals as trading conditions normalize following Monday's subdued action. The US Dollar Index sits at its highest level since mid-March near 104.50 ahead of the Conference Board's Consumer Confidence report for May and Housing Price Index data for March. The European economic docket will feature business and consumer sentiment surveys.
US Consumer Confidence Preview: Confidence remains down, but DXY aims up.
Following Sunday's agreement between US President Joe Biden and Republican House Speaker Kevin McCarthy to suspend the debt limit, the House Rules Committee and the House is expected to vote on the bill on Tuesday and Wednesday, respectively. Meanwhile, Biden will reportedly hold calls with Democratic members of the House ahead of the vote.
Reflecting the positive impact of this development on risk mood, US stock index futures are up between 0.2% and 0.6% in the European trading hours. The Euro Stoxx 50 Index, however, trades virtually unchanged on the day.
EUR/USD registered small losses on Monday and continued to stretch lower early Tuesday. The par was last seen trading at its weakest level in 10 weeks below 1.0700. Earlier in the session, the data from Spain showed that the annual Harmonized Index of Consumer Prices declined 0.2% on a monthly basis in May, dragging the annual increase lower to 2.9% from 3.8% in April.
Despite the persistent USD strength, GBP/USD manages to keep its footing on Tuesday and extends its sideways grind near 1.2350.
After rising toward 141.00 during the Asian trading hours on Tuesday, USD/JPY reversed its direction and fell sharply. At the time of press, the pair was trading in negative territory below 140.50. Earlier in the day, “the Bank of Japan (BoJ) will patiently maintain the easy monetary policy as there is still a distance to go to stable 2% inflation," said BoJ Governor Kazuo Ueda.
Gold price slumped to its lowest level since early March near $1,930 on Tuesday but reversed its direction in the European morning. With the benchmark 10-year US Treasury bond yield losing nearly 1% below 3.8%, XAU/USD erased its daily losses and turned flat above $1,940.
Bitcoin failed to build on Sunday's gains and posted marginal losses on Monday. BTC/USD holds steady above $27,500 early Tuesday. Similarly, Ethereum lost nearly 1% on Monday but managed to stabilize near $1,900.
- NZD/USD manages to recover a bid from a fresh YTD low touched earlier this Tuesday.
- A positive risk tone, retreating US bond yields cap the USD and lend support to the pair.
- The fundamental backdrop warrants caution before positioning for any meaningful rally.
The NZD/USD pair struggles to capitalize on the previous day's modest gains and meets with a fresh supply on Tuesday, hitting a fresh low since November 2022. Spot prices, however, manage to recover a few pips and trade just below mid-0.6000s during the early European session, still down nearly 0.20% for the day.
The New Zealand Dollar (NZD) continues to be undermined by the Reserve Bank of New Zealand's (RBNZ) explicit signal last week that it was done with its most aggressive hiking cycle since 1999. The US Dollar (USD), on the other hand, stands tall near a two-and-half-month high amid firming expectations that the Federal Reserve (Fed) will keep interest rates higher for longer and further contributes to the offered tone surrounding the NZD/USD pair.
In fact, the current market pricing indicates a greater chance of another 25 bps lift-off at the next FOMC policy meeting in June to combat stick inflation. The expectations were lifted by the recent hawkish remarks by several policymakers and the fact that the Fed's preferred inflation gauge, the Core PCE Price Index unexpectedly rose in April. This, in turn, continues to act as a tailwind for the Greenback and exerts some downward pressure on the NZD/USD pair.
That said, a modest pullback in the US Treasury bond yields, along with a positive risk tone, amid the optimism over raising the US debt ceiling, cap gains the safe-haven buck. This, in turn, assists the NZD/USD pair to find support near the 0.6025 area. Any meaningful recovery, however, seems elusive in the wake of worries about a global economic downturn and the worsening US-China ties, which tend to dent demand for antipodean currencies, including the Kiwi.
Market participants now look forward to the release of the Conference Board's US Consumer Confidence Index for a fresh impetus later during the early North American session. This, along with the US bond yields and the broader risk sentiment, will influence the USD and produce short-term trading opportunities around the NZD/USD pair. The fundamental backdrop, meanwhile, suggests that the path of least resistance for spot prices is to the downside.
Technical levels to watch
FX markets are returning to mull progress on a US debt ceiling deal. Progress on the deal will allow investors to focus on sticky US inflation – likely seeing the Dollar hold onto recent gains, economists at ING report.
Progress on debt deal allows markets to focus on another Fed hike
“Assuming there are no hiccups in the deal's passage, FX markets can return to the most pressing issue of sticky inflation and what central bankers plan to do about it.”
“One additional 25 bps Fed hike is now fully priced by the time of the 26 July meeting. Money markets price a 63% chance of that hike coming earlier at the 14 June meeting. The default view, therefore, seems to be that the Dollar can hold its recent gains at least into that June meeting.”
“This week sees US JOLTS job opening data (Wed), ADP (Thurs.), and the May NFP (Friday). Barring any major downside miss in these releases, it looks like the market will support another 25 bps hike from the Fed, continued inversion in the US yield curve, and a strong/stronger Dollar.”
“DXY looks comfortable above 104.00 and could extend recent gains to 104.65 or even 105.30 this week.”
In the second and decisive round of the elections, the Turkish electorate decided to vote for President Recep Tayyip Erdoğan. Economists at Commerzbank analyze the Lira outlook after this past weekend’s election result.
The Lira after the election
“The Turks are prepared to accept inflation and the weak currency. Is that a likely moment for Erdoğan to admit that his low interest rate policy of the past years was wrong and has caused damage?”
“We have known since 2018 that the low interest rate policy is based on a misjudgment that could be clarified with the advice from monetary policy experts within seconds. The fact that this has not happened in the years that have passed since then is certainly not due to any lack of experts in Turkey. It can only be due to the fact that the President is not amenable to such advice – despite high inflation levels and continued lira weakness. I doubt that this will change in the moment of his electoral victory. As a result, I have to conclude that the erosion of the TRY’s value will continue. Probably even at higher speed than in the recent past.”
Extra gains could see USD/JPY advancing past the 141.00 hurdle sooner rather than later, suggest UOB Group’s Economist Lee Sue Ann and Markets Strategist Quek Ser Leang.
Key Quotes
24-hour view: “Yesterday, we held the view that USD ‘could break above 141.00 but it is unlikely to threaten the next resistance at 141.55’. We indicated, ‘a breach of 140.00 suggests USD is not rising further’. However, USD did not break above 141.00 as it pulled back from 140.91 to 140.10 and then closed at 140.44 (-0.13%). Upward pressure has faded and the current movements are likely part of a consolidation range. Today, we expect USD to trade sideways between 139.70 and 140.70.”
Next 1-3 weeks: “There is not much to add to our update from yesterday (29 May, spot at 140.85). As highlighted, the recent increased in momentum suggests USD could break 141.00. However, the solid long-term resistance at 142.00 might not break. Overall, only a breach of 139.30 (no change in ‘strong support’ level) would indicate that the USD strength that started two weeks ago has run its course.”
- EUR/USD drops to 10-week lows near 1.0670 on Tuesday.
- The greenback appears well bid in new 2-month highs.
- Final EMU Consumer Confidence, US CB Consumer Confidence next on tap.
The European currency remains well on the defensive and dragged EUR/USD to new lows in the 1.0670 region on Tuesday.
EUR/USD weakens on USD-buying
EUR/USD loses ground for the sixth consecutive session on Tuesday and breaches the 1.0700 support for the first time since late March, always in response to the persevering march north in the dollar and a corrective move in the risk-associated space.
In the meantime, investors are expected to closely follow the US political scenario, where lawmakers will start discussing the recently announced bipartisan agreement on the US debt ceiling.
In addition, spot should remain under scrutiny in light of the upcoming US Nonfarm Payrolls (Friday) and the implications for the Fed’s interest rate decision on June 14.
Data-wise in the euro area, the final European Commission’s Consumer Confidence is due along with Economic Sentiment and Industrial Sentiment. In the US, the Consumer Confidence gauge measured by the Conference Board will be in the limelight, followed by the FHFA’s House Price Index.
What to look for around EUR
The sell-off in EUR/USD appears unabated after the pair broke below the key support at 1.0700 the figure on Tuesday.
In the meantime, the pair’s price action is expected to closely mirror the behaviour of the US Dollar and will likely be impacted by any differences in approach between the Fed and the ECB with regards to their plans for adjusting interest rates.
Moving forward, hawkish ECB speak continues to favour further rate hikes, although this view appears to be in contrast to some loss of momentum in economic fundamentals in the region.
Key events in the euro area this week: EMU Final Consumer Confidence, Economic Sentiment, Industrial Sentiment (Tuesday) – Germany Unemployment Change, Unemployment Rate, Flash Inflation Rate, ECB Lagarde (Wednesday) – Germany Retail Sales/Final Manufacturing PMI, EMU Final Manufacturing PMI, Flash Inflation Rate, ECB Lagarde, ECB Accounts (Thursday).
Eminent issues on the back boiler: Continuation of the ECB hiking cycle in June and July (and September?). Impact of the Russia-Ukraine war on the growth prospects and inflation outlook in the region. Risks of inflation becoming entrenched.
EUR/USD levels to watch
So far, the pair is losing 0.31% at 1.0673 and faces initial contention at 1.0672 (monthly low May 30) seconded by 1.0516 (low March 15) and finally 1.0481 (2023 low January 6). On the upside, a break above 1.0813 (100-day SMA) would target 1.0878 (55-day SMA) en route to 1.1000 (round level).
- Gold price drops to over a two-month low and is pressured by a combination of factors.
- The US debt ceiling optimism and a bullish US Dollar weigh on the safe-haven XAU/USD.
- Acceptance below the 100-day SMA will pave the way for a further depreciating move.
Gold price comes under some renewed selling pressure on Tuesday and drops to its lowest level since March 17 during the early part of the European session. The XAU/USD is currently placed just below the $1,940 level, down around 0.25% for the day, with bears now awaiting a sustained break and acceptance below the 100-day Simple Moving Average (SMA) before placing fresh bets.
US debt ceiling optimism weighs on Gold price
Lawmakers in the United States (US) signalled that they have reached a tentative agreement to raise the $31.4 trillion debt ceiling and avert an unprecedented default by the world's largest economy. This, in turn, improves investors' appetite for riskier assets, which is evident from a generally positive risk tone and exerts some pressure on the safe-haven Gold price. Apart from this, the recent US Dollar (USD) bullish run to over a two-month high further contributes to the offered tone surrounding the US Dollar-denominated commodity.
Stronger US Dollar also exert pressure on XAU/USD
The markets started pricing in a greater chance of another 25 bps lift-off in June following more hawkish remarks by several Federal Reserve (Fed) officials. Adding to this, data released last Friday showed that the Personal Consumption Expenditures (PCE) Price Index- the Fed’s preferred inflation gauge- unexpectedly rose in April and indicated that inflation remained sticky. This reaffirmed market expectations that the Fed will keep rates higher for longer, which underpins the buck and further weighs on the non-yielding Gold price.
Gold price seems vulnerable to sliding further
That said, a modest pullback in the US Treasury bond yields holds back the USD bulls from placing aggressive bets and could lend some support to the XAU/USD, at least for the time being. Nevertheless, the aforementioned fundamental backdrop suggests that the path of least resistance for Gold price is to the downside and any attempted bounce might still be seen as a selling opportunity. Traders now look to the release of the Conference Board's US Consumer Confidence Index for some impetus later during the early North American session.
Focus remains on US Nonfarm-Payrolls (NFP) on Friday
Apart from this, the US bond yields might influence the USD price dynamics and produce short-term trading opportunities. Market participants will further take cues from the broader risk sentiment, though the focus will remain glued to the closely-watched US monthly employment details, popularly known as the Nonfarm-Payrolls (NFP) report, scheduled for release on Friday.
Gold price technical outlook
From a technical perspective, some follow-through selling below the daily low, around the $1,932 area, will be seen as a fresh trigger for bearish traders. The Gold price might then accelerate the downfall towards the $1.919-$1.918 intermediate support before eventually dropping to the $1.900 round-figure mark.
On the flip side, the $1,947-$1,949 region is likely to act as an immediate hurdle ahead of the $1.957-$1,958 zone. Any further move up could attract fresh sellers and remain capped near the $1.980 region. The latter should act as a pivotal point, which if cleared could allow the Gold price to reclaim the $2.000 psychological mark.
Key levels to watch
Economists at ING discuss EUR/USD outlook for the day ahead.
Deteriorated Eurozone’s data to keep EUR/USD on the soft side
“EUR/USD has quietly slipped below support at 1.0700/1.0720 and may be gently making its way to the March lows at 1.0515/0530.”
“For today, the Eurozone focus will be on the release of industrial and consumer confidence figures for May. Consensus expects some further deterioration here and if so this should keep EUR/USD on the soft side.”
“We will also hear from a raft of ECB speakers today. Expect more hawkish rhetoric especially in advance of the May eurozone CPI data on Thursday. Consensus expects core eurozone CPI to edge lower to 5.5% YoY in May. Another upside surprise here – feeding the sticky inflation narrative – warns that investors could return to pricing a 4.00% ECB deposit rate.”
- USD/CAD grinds near intraday high as bulls cheer rebound from three-week-old support line.
- Convergence of previous resistance line, 50-day EMA acts as the key support.
- Bullish MACD signals, firmer but not overbought RSI (14) line favor Loonie pair buyers.
USD/CAD picks up bids to refresh intraday high near 1.3605 during the first positive day in three amid the early hours of Tuesday’s European session.
In doing so, the Loonie pair portrays a U-turn from an upward-sloping support line stretched from May 08. Adding strength to the quote’s recovery are the bullish MACD signals and the RSI (14) line’s upbeat conditions, not overbought.
It should be observed that the USD/CAD pair’s successful trading beyond an 11-week-old falling resistance, now support, also keeps the pair buyers hopeful.
Hence, the bulls are all set to challenge the monthly peak marked on Friday and April’s high, respectively around 1.3655 and 1.3670.
Should the USD/CAD bulls stay in the driver’s seat past 1.3670, the late March swing high around 1.3800 and the yearly top of 1.3861, marked in March, will be in the spotlight.
On the flip side, a break of the aforementioned three-week-old support line, close to 1.3565, isn’t an open invitation to the USD/CAD bears as a convergence of the 50-day Exponential Moving Average (EMA) and resistance-turned-support from March challenges the sellers around 1.3530.
Even if the Loonie pair drops below 1.3530, multiple supports around 1.3400 may test the downside momentum before directing the bears to the monthly bottom of near 1.3315.
USD/CAD: Daily chart
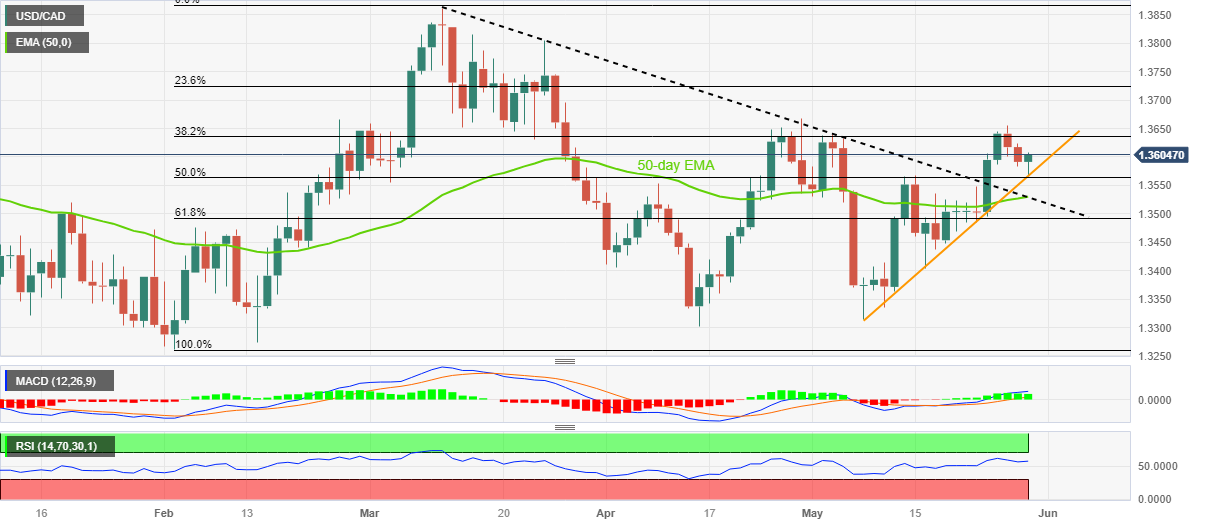
Trend: Further upside expected
Economists at TD Securities analyze CNH/INR outlook.
CNY more sensitive to USD strength than INR
“India has benefitted from a surge in foreign portfolio flows, while FDI inflows have remained firm. We expect inflows to continue to strengthen, providing support to the INR. Separately, India's trade deficit is narrowing, with the country registering its smallest deficit in April since Aug 2021. This all bodes well for the currency and while RBI FX intervention remains a risk to spot appreciation, carry and risk adjusted returns are attractive.”
“In contrast, the PBoC may favour some short term underperformance of CNY in the wake of softer China economic data and a firm USD, with the CNY more sensitive to USD strength than INR.”
“CNH/INR broke through its 200-DMA at 11.75 and negative MACD differential (12,26) favours a continued move lower.”
“The currency pair is trading around its 76.4% Fib support level at 11.65 and a push lower opens up the 61.8% Fib support at 11.30 (5-year daily window) and then 0% Fib support at 11.01.”
In the view of UOB Group’s Economist Lee Sue Ann and Markets Strategist Quek Ser Leang, NZD/USD could weaken to the sub-0.6000 region in the short-term horizon.
Key Quotes
24-hour view: “We highlighted yesterday that while NZD could dip below Friday’s low of 0.6034, a clear break of 0.6025 is unlikely. We added, any weakness is part of a lower range of 0.6025/0.6085”. Our expectation for NZD to dip below 0.6034 did not materialize as it traded in a range of 0.6046/0.6070. The underlying tone has softened and today, a break of 0.6034 will not be surprising. That said, any decline is highly unlikely to challenge the major support at 0.5995. Resistance is at 0.6065, followed by 0.6085.”
Next 1-3 weeks: “Our latest narrative from last Friday (26 May, spot at 0.6060) still stands. As highlighted, NZD could weaken further, albeit likely at a slower pace and the next level to watch is 0.5995. On the upside, a breach of 0.15 (‘strong resistance’ level was at 0.6130) indicates the weakness in NZD that started in the middle of last week has stabilized.”
- USD/TRY keeps rising post-Erdogan win on Sunday.
- The lira has already depreciated nearly 8% this year.
- President Erdogan vowed to keep low-rates policy.
The Turkish lira remains in free-fall vs. the greenback and lifted USD/TRY to a new all-time high near 20.25 on turnaround Tuesday.
USD/TRY: Further gains appear in store
USD/TRY advances for the third session in a row and flirts with the 20.25 region, as investors continue to assess Sunday’s win by President R. T. Erdogan in the second round of the general elections.
Extra weakness hitting the lira comes after President Erdogan promised to keep the current low-rate policy as the main tool to tackle the elevated inflation (against all economic theory), in a context where the country’s FX reserves do everything but grow and the current account deficit flirts with its widest in the series history.
It is worth noting that the pair has closed with gains in every single week since March 1.
Later on Tuesday, Trade Balance figures for the month of April will be the sole release in the domestic docket ahead of Q1 GDP results on Wednesday and the Manufacturing PMI on Thursday.
USD/TRY key levels
So far, the pair is gaining 1.18% at 20.2474 and faces the next hurdle at 20.2486 (all-time high May 30) followed by 21.00 (round level). On the downside, a break below 19.3941 (55-day SMA) would expose 19.1352 (100-day SMA) and finally 18.8185 (200-day SMA).
- WTI prints the first daily loss in three, eyes the biggest monthly loss in 2023.
- Risk profile turns dicey even as US policymakers agree on measures to avoid default.
- OPEC’s Al Ghais teases Iranian Oil’s return, prods energy bulls.
- US-China headlines, firmer US Dollar and hawkish Fed bets weigh on WTI price.
WTI crude oil bears return to the table, after a two-day absence, as the market’s rush towards the US Dollar joins fears of economic transition and higher energy supplies. With this, the black gold registers near 0.80% intraday losses around $72.40 ahead of Tuesday’s European session.
Late on Monday, the Organization of the Petroleum Exporting Countries (OPEC) Secretary-General Haitham Al Ghais praises Iran’s role in the global energy market as the Gulf nation is about to return to the oil supply frontier as the US-led sanctions expire soon. Even so, OPEC’s Al Ghais said, “We don’t target a certain price level.”
Apart from that, the US-China woes also weigh on the Oil price as the same downs the odds of free trade among the world’s top two economies, as well as one of the world’s biggest Oil consumers.
On the different, the US Dollar Index (DXY) rises to a fresh high in 10 weeks as it is printing the 104.50 mark at the latest. In doing so, the greenback not only cheers the market’s rush towards risk safety amid Sino-America tussles and uncertainty surrounding the US debt ceiling deal’s passage through Congress but also takes clues from the hawkish Fed bets, especially after the last week’s upbeat data.
Amid these plays, the S&P500 Futures print mild gains and the yields retreat after a long weekend in major markets.
Moving on, the weekly prints of the American Petroleum Institute’s (API) Crude Oil Stock data, prior -6.79M, as well as the US Conference Boards’ (CB) Consumer Confidence prints for May, will direct intraday moves of the WTI crude oil.
Technical analysis
Monday’s Doji candlestick keeps WTI crude oil bears hopeful of breaking a fortnight-old ascending support line, around $71.60 by the press time.
Economists at Nomura discuss ECB and BoE outlooks.
Both the BoE and ECB have become more data dependent
“Weaker data and recent less hawkish commentary led to the ECB pivoting in May, and we expect two more 25 bps hikes for a peak of 3.75% by July.”
“Following the latest inflation print, we have changed our call and now see the BoE raising rates by 25 bps at each of the next three meetings.”
“We thus forecast peak rates at 3.75% for the ECB and 5.25% for the BoE. We assume rate cuts from both central banks a little over a year after the last hike (settling at 2.75% for the ECB and 4% for the BoE).”
- AUD/USD is expected to find support around 0.6500 as the USD index has refreshed its 10-week high at 104.45.
- Rising US consumer spending could force the Federal Reserve (Fed) to remain hawkish ahead.
- Reserve Bank of Australia Lowe is expected to deliver interest rate guidance for the June policy meeting on Wednesday.
- AUD/USD has been critically dumped after testing the breakout region of the prolonged consolidation around 0.6560.
AUD/USD is declining towards the round-level support at 0.6500 in the early European session. The Aussie asset has witnessed immense selling pressure as the US Dollar Index (DXY) has printed a fresh 10-week high at 104.45 on expectations that the Federal Reserve (Fed) will not halt the policy0-tightening spell in June and will continue hiking interest rates further to keep weigh on stubborn United States inflation.
S&P500 futures have continuously eased gains in Asia posted on Monday as investors are worried that Tuesday’s trading session could be extremely volatile after an extended weekend. The overall market mood has turned cautious as investors are anticipating one more interest rate elevation from the Federal Reserve.
The US Dollar Index (DXY) has refreshed its 10-week high as investors have shifted their focus from the US debt-ceiling issues amid optimism that it will get passage from Congress to June’s monetary policy meeting by the Federal Reserve after observing resilience in consumer spending.
Meanwhile, a confirmation of a raise in the US borrowing cap by the White House has put sheer pressure on the US Treasury yields. The yields offered on 10-year US government bonds have slipped below 3.77%.
Resilience in US consumer spending accelerates hawkish Fed bets
Consumption expenditure data released on Friday showed that United States households are showing stubbornness in lowering their consumption despite higher interest rates by the Federal Reserve and higher cost of living. Federal Reserve’s preferred inflation tool Personal Consumption Expenditure (PCE) Price Index rebounded firmly. Monthly headline and core PCE Inflation (April) accelerated by 0.4%. Also, monthly Personal Spending data expanded by 0.8% vs. the estimates of 0.4% and the former expansion pace of 0.1%. While Personal Income matched expectations at 0.4%. This indicates that consumer spending is deepening significantly, which would force the Federal Reserve (Fed) to remain hawkish ahead.
US Employment to provide base for Federal Reserve’s policy stance
This week, the release of the United States Employment data will provide a base to Federal Reserve policymakers for designing June’s monetary policy stance. The Employment data will kick off with US JOLTS Job Openings data, which will release on Wednesday. The economic data is seen falling to 9.35M vs. the prior release of 9.59M. This indicates that firms have slowed down their hiring process due to a bleak economic outlook. Later on, US Automatic Data Processing (ADP) Employment Change (May) will be in focus. As per the consensus, the US economy added fresh 170K jobs in May, lower than the prior addition of 269K. The week will be ended with Nonfarm Payrolls (NFP) data, which will be extremely crucial.
An overall ease in labor market conditions could fade the impact of resilience in consumer spending and would allow the Federal Reserve to go neutral on interest rates.
Australian Inflation to remain in spotlight
A power-pack action is anticipated in the Australian Dollar amid the release of the Australian monthly Consumer Price Index (April), which is scheduled for Wednesday. The economic data is seen rebounding to 6.4% from the former release of 6.3%. Investors should note that Australian monthly CPI has quickly softened in the past four months from December’s height of 8.4% to March's 6.3% figure. Australian Retail Sales have remained stagnant earlier as the higher living cost is biting deep pockets of households.
Apart from that, Reserve Bank of Australia (RBA) Governor Philip Lowe’s speech will be keenly watched. Reserve Bank of Australia Lowe is expected to deliver interest rate guidance for the June policy meeting.
AUD/USD technical outlook
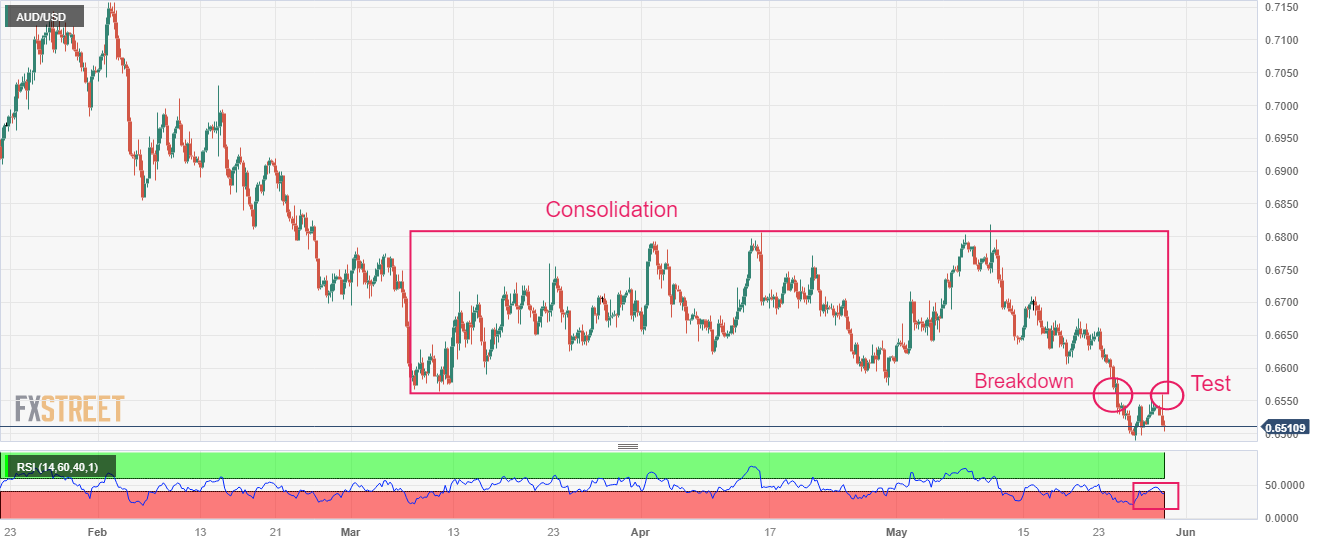
AUD/USD has been critically dumped by the market participants after testing the breakout region of the prolonged consolidation around 0.6560 on a four-hour scale. The consolidation formed in a wide range of 0.6562-0.6810 in which inventory adjustment took place.
The Relative Strength Index (RSI) (14) has slipped into the bearish range of 20.00-40.00, which indicates more downside ahead.
- USD/CNH extends week-start gains to approach the highest levels since November 2022.
- US Dollar regains upside momentum amid mixed concerns about US debt ceiling deal, hawkish Fed bets.
- US-China tension escalates as Beijing turns down Washington’s request for Defense Chief meeting.
- Risk catalysts, US CB Consumer Confidence eyed for clear directions.
USD/CNH bulls keep the reins for the second consecutive day as bulls prod the six-month high heading into Tuesday’s European session, up 0.30% intraday near 7.1050 by the press time.
In doing so, the offshore Chinese Yuan (CNH) pair takes clues from the broad US Dollar strength amid lackluster initial hours of a trading day when all the traders return to the table after a long weekend.
US Dollar Index (DXY) rises to a fresh high in 10 weeks as it prints the 104.50 mark at the latest.
With this, the greenback’s gauge versus six major currencies benefits from its safe-haven asset, as well as the recently hawkish Federal Reserve (Fed) bets.
Talking about the risks, the market’s mood remains unclear even as S&P500 Futures print mild gains and the yields retreat, which in turn pushes the traders towards the US Dollar, especially after the last week’s upbeat US data favoring the hawkish Fed concerns.
Among the key risk catalysts, the dissatisfaction of some of the US policymakers, mostly Republicans, are against the compromises made to their previous demands to reach the deal. The policymakers also show readiness to challenge the agreement in the House, as well as in the Senate, which in turn prods the market’s previous risk-on mood and keeps the US Dollar on the front foot. Additionally, the US-China woes also underpin the market’s rush toward the US Dollar and propel the USD/CNH price. Late on Monday, China turned down the US request for a meeting of the Defense Chiefs in Singapore, per the Wall Street Journal (WSJ).
On the other hand, the monetary policy divergence between the People’s Bank of China’s (PBOC) dovish outlook and the hawkish concerns about the Fed offer additional strength to the USD/CNH price.
Moving on, the US Conference Boards’ (CB) Consumer Confidence data for May will offer immediate directions to the USD/CNH pair traders ahead of Wednesday’s official PMIs from China and the US House voting on the debt-ceiling agreement. Following that, the US Senate’s approval of the US debt ceiling deal before June 05, as well as Friday’s US jobs report, become the key to watch for a clear guide.
Technical analysis
USD/CNH picks up bids to refresh multi-day high within a monthly bullish channel, currently between 7.1320 and 7.0460. That said, RSI (14) line suggests a gradual upside while bears stay off the table unless the quote stays below the October 2022 swing low of around 7.0120.
- USD/JPY recovers from intraday low within three-week-old bullish chart formation.
- Monday’s bearish candlestick formation, overbought RSI (14) line lure bears.
- Clear downside break of 140.00 needed to lure the Yen buyers.
- Bulls need 141.00 breakout to aim for late November peak.
USD/JPY makes rounds to 140.50 as bulls and bears jostle amid mixed technical signals heading into Tuesday’s European session.
That said, the Yen pair portrays a three-week-old bullish channel, currently between 140.20 and 141.85, to keep the buyers hopeful.
However, the oversold conditions of the RSI (14) line join Monday’s “Shooting Star” candlestick to suggest that the bulls are running out of steam.
As a result, the USD/JPY traders should remain cautious before taking any fresh positions, especially on the short side considering the US Dollar’s broad strength, unless the quote remains within the stated channel.
Even if the quote breaks the 140.20 support, the 140.00 psychological magnet will act as an extra filter toward the south before directing the bears toward the 200-SMA level of 137.25.
Following that, an upward-sloping support line from March 24, close to 135.80 at the latest, will be the key to defending the buyers.
On the flip side, the USD/JPY pair’s successful trading above the previous day’s peak of 140.92 defies the bearish candlestick. However, the buyers will need to cross the 141.00 round figure for conviction.
In that case, the late November 2022 peak of 142.25 may act as an intermediate halt ahead of directing the bulls to the stated channel’s top line of around 142.85.
USD/JPY: Daily chart
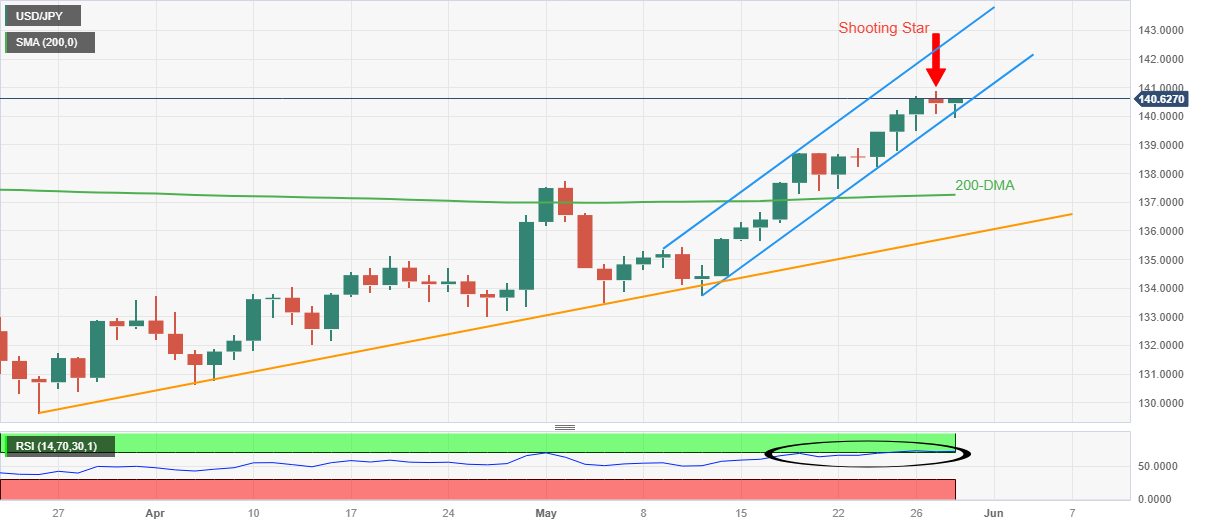
Trend: Further upside expected
Extra decline remains on the cards for GBP/USD in the next few weeks, according to UOB Group’s Economist Lee Sue Ann and Markets Strategist Quek Ser Leang.
Key Quotes
24-hour view: “We highlighted yesterday that ‘the price actions appear to be consolidative’ and we expected GBP to consolidate in a range of 1.2320/1.2390. In line with our expectations, GBP consolidated, albeit in a narrower range than expected (1.2337/1.2371), The quiet price actions offer no fresh clues and we continue to expect GBP to consolidate, likely between 1.2325 and 1.2385.”
Next 1-3 weeks: “Our update from last Friday (26 May, spot at 1.2320) still stands. As highlighted, the 2-week weakness in GBP is intact but it remains to be seen if 1.2175 will come into view this time around. On a shorter-term note, it is worth noting that both 1.2300 and 1.2250 are strong support levels. On the upside, a breach of 1.2415 (no change in ‘strong resistance’ level) would suggest the GBP weakness has stabilized.”
- The index regains the smile and hovers around the 104.30 region.
- US lawmakers will vote on the debt ceiling bill late on Tuesday.
- US Consumer Confidence takes centre stage across the pond.
The greenback, in terms of the USD Index (DXY), flirts with recent tops in the 104.40/50 band ahead of the opening bell in the old continent on turnaround Tuesday.
USD Index focuses on data and debt ceiling vote
The index regains balance following Monday’s Memorial Day holiday and advances to the area of recent multi-week highs near 104.50 as US traders return to their desks on Tuesday.
Back to the debt ceiling issue and following the bipartisan agreement to suspend it clinched over the weekend, US lawmakers in the House and Senate are expected to discuss the bill and vote on Wednesday.
In fact, the bill is anticipated to be voted on by the House Rules Committee on Tuesday afternoon. Three of the nine Republicans on the panel, which is split 9-4 between Republicans and Democrats, are conservative hardliners who are opposed of the arrangement, which means they may kill the package if no Democrats vote for it.
In the meantime, investors slowly refocus on the upcoming US jobs report (Friday) amidst rising speculation of further tightening at the Fed’s gathering on June 14. So far, CME Group’s FedWatch Tool sees the probability of a 25 bps rate hike at around 65%.
In the US data space, the Consumer Confidence gauge tracked by the Conference Board will take centre stage seconded by FHFA’s House Price Index for the month of March.
What to look for around USD
The index picks up fresh pace and trades close to recent highs in the 104.40/50 band on Tuesday.
In the meantime, rising bets of another 25 bps at the Fed’s next gathering in June appear underpinned by the steady resilience of key US fundamentals (employment and prices mainly) amidst the ongoing rally in US yields and the DXY.
Favouring a pause by the Fed, instead, appears the extra tightening of credit conditions in response to uncertainty surrounding the US banking sector.
Key events in the US this week: FHFA’s House Price Index, CB Consumer Confidence (Tuesday) – MBA Mortgage Applications, Fed’s Beige Book (Wednesday) – ADP Employment Change, Initial Jobless Claims, Final Manufacturing PMI, ISM Manufacturing PMI, Construction Spending (Thursday) – Nonfarm Payrolls, Unemployment Rate (Friday).
Eminent issues on the back boiler: Debt ceiling. Persistent debate over a soft/hard landing of the US economy. Terminal Interest rate near the peak vs. speculation of rate cuts in late 2023/early 2024. Fed’s pivot. Geopolitical effervescence vs. Russia and China. US-China trade conflict.
USD Index relevant levels
Now, the index is up 0.14% at 104.41 and the surpass of 104.45 (monthly high May 30) would open the door to 105.65 (200-day SMA) and then 105.88 (2023 high March 8). On the flip side, the next support emerges at the 100-day SMA at 102.87 seconded by the 55-day SMA at 102.45 and finally 101.01 (weekly low April 26).
FX option expiries for May 30 NY cut at 10:00 Eastern Time, via DTCC, can be found below.
- EUR/USD: EUR amounts
- 1.0620 378m
- 1.0670 615m
- 1.0700 1.1b
- 1.0770 1.1b
- 1.0785 643m
- GBP/USD: GBP amounts
- 1.2300 429m
- 1.2350 385m
- USD/JPY: USD amounts
- 139.50 500m
- AUD/USD: AUD amounts
- 0.6475 845m
- 0.6550 536m
USD/CAD: USD amounts
- 1.3610 301m
- NZD/USD: NZD amounts
- 0.6150 597m
- GBP/USD has shown some recovery from 1.2340 as the USD Index is struggling in refreshing the day’s high above 104.33.
- The BoE is expected to raise interest rates further considering the fact that United Kingdom inflation is not decelerating as expected.
- GBP/USD is showing a volatility contraction pattern after dropping to near the horizontal support at 1.2344.
The GBP/USD pair has rebounded after defending its downside near the crucial support around 1.2340 in the early European session. The Cable has shown recovery as the US Dollar index (DXY) has faced pressure while attempting to refresh its day’s high above 104.33. More upside in the USD Index seems possible as it has not shown signs of bearish reversal yet.
S&P500 futures are showing choppy moves after Asia as investors are anticipating wild movements on New York opening after an extended weekend. The overall market mood is cautious as investors are anticipating that the Federal Reserve (Fed) will not pause the policy-tightening spell in June.
The Pound Sterling has hogged the limelight as the Bank of England (BoE) is expected to raise interest rates further considering the fact that United Kingdom inflation is not decelerating as expected.
GBP/USD is showing a volatility contraction pattern after dropping to near the horizontal support plotted from March 23 high at 1.2344. The Cable is expected to deliver wider ticks and witness heavy volume after an explosion in the volatility contraction pattern.
It is highly likely that a mean-reversion move to near the 50-period Exponential Moving Average (EMA) at 1.2390 would trigger the downside bias.
For the time being, the Relative Strength Index (RSI) (14) has shifted into the 40.00-60.00 range from the bearish range of 20.00-40.00, which indicates a loss in the downside momentum. However, the downside bias is not ruled out yet.
Should the asset decline below May 25 low at 1.2308, US Dollar bulls will get strengthened further and will drag the Cable toward April 03 low at 1.2275, followed by March 14 high at 1.2204.
On the flip side, a recovery move above May 09 high at 1.2640 will drive the major toward the round-level resistance at 1.2700 and 26 April 2022 high at 1.2772.
GBP/USD four-hour chart
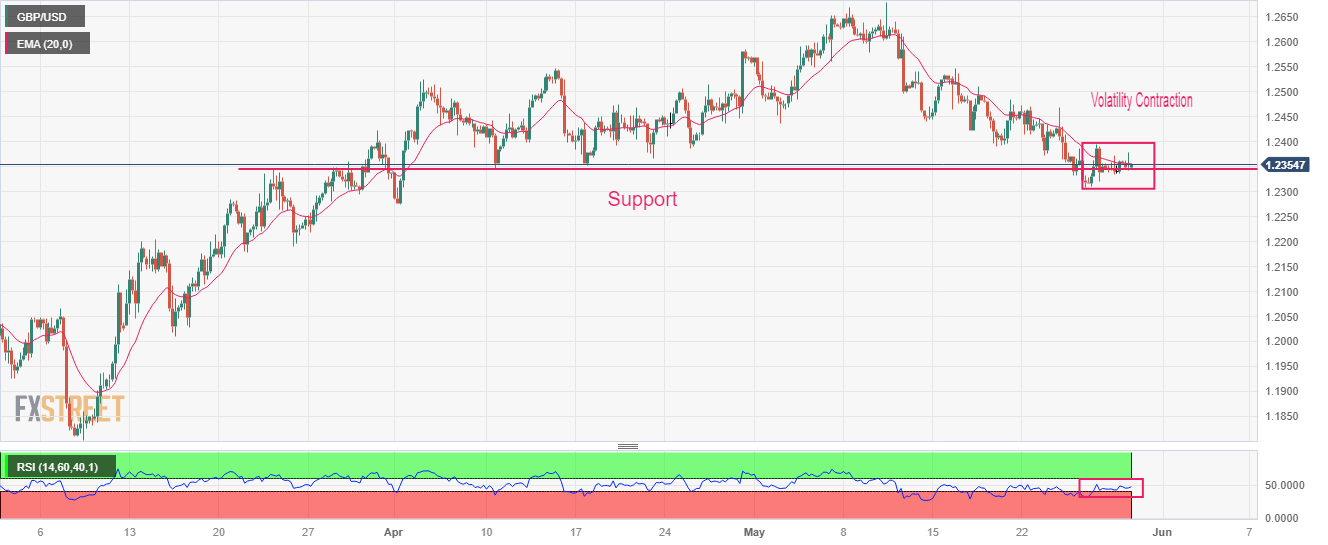
UOB Group’s Economist Lee Sue Ann and Markets Strategist Quek Ser Leang note there is still scope for EUR/USD to retreat further in the near term.
Key Quotes
24-hour view: “After EUR dropped to 1.0700 last Friday and rebounded, we noted yesterday that ‘downward pressure has eased and EUR is unlikely to weaken much further’. We expected EUR to trade sideways between 1.0700 and 1.0750. However, EUR traded in a narrower range than expected (1.0704/1.0743). The underlying tone has weakened somewhat and EUR could edge below 1.0700 today but it is highly unlikely to threaten the major support at 1.0650 (there is a minor support is at 1.0680). On the upside, a breach of 1.0745 (minor resistance is at 1.0725) would indicate the current mild downward pressure has faded.”
Next 1-3 weeks: “Our most recent narrative from last Friday (26 May, spot at 1.0725) still stands. As highlighted, the selloff in EUR that started about 2-1/2 weeks ago appears to be overextended, both in terms of time and price. While EUR could still drop below the major support at 1.0700, it remains to be seen if it has enough momentum to break clearly below the next support at 1.0650. All in all, only a breach of 1.0775 (no change in ‘strong resistance’ level) would suggest that the weakness in EUR has stabilized.”
- Natural Gas is showing a sideways auction around $2.38 after a vertical sell-off.
- The energy instrument has remained in the grip of bears as the market is oversupplied with natural gas.
- Natural Gas price is consolidating below the 61.8% Fibonacci retracement at $2.40.
Natural Gas price (XNG/USD) is demonstrating a back-and-forth action around $2.38 in the Asian session. The asset has turned sideways after a sheer sell-off, which is generally followed by a volatility contraction phase.
For the past two weeks, the energy instrument has remained in the grip of bears as the market is oversupplied with natural gas. The United States Energy Information Administration (EIA) has been reporting a build-up in gas storage for the past two weeks, indicating sluggish demand due to a bleak economic outlook.
Meanwhile, the US Dollar Index (DXY) has rebounded firmly and is hovering near the day’s high around 104.33 as investors are shifting their focus to June’s monetary policy meeting.
Natural Gas price is consolidating below the 61.8% Fibonacci retracement (plotted from May 05 low at $2.14 to May 19 high at $2.82) at $2.40 on a two-hour scale. The energy instrument is auctioning in a Falling Wedge chart pattern in which every pullback is seen as a selling opportunity by the market participants.
The Relative Strength Index (RSI) (14) has slipped into the bearish range of 20.00-40.00, indicating more weakness ahead.
For further move, a downside trip below May 29 low at $2.36 will drag the Natural Gas price further toward April 17 low at $2.31 followed by May 07 low at $2.25.
On the flip side, a solid recovery above 50% Fibo retracement at $2.48 will further drive the asset toward April 19 high at $2.54 and May 24 high at $2.61.
Natural Gas two-hour chart
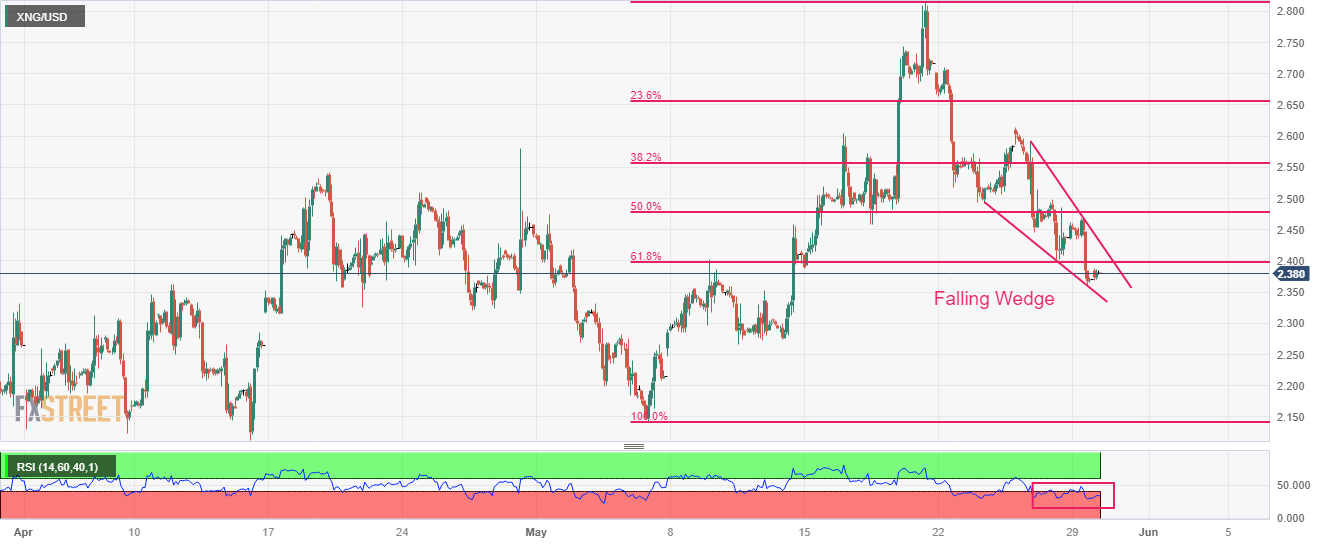
- USD/INR picks up bids to extend the previous day’s rebound inside bullish chart formation.
- 50-SMA adds strength to 82.75 hurdle for Indian Rupee bears.
- April’s peak, 200-SMA restrict short-term downside of USD/INR pair.
- US Dollar grinds higher amid default jitters, full markets’ reaction to US debt ceiling deal.
USD/INR remains on the front foot around 82.67 amid the initial hour of the Indian trading session on Tuesday. With this, the Indian Rupee (INR) pair portrays the market’s favor to the US Dollar amid anxiety ahead of the key US jobs report, as well as due to the mixed concerns about the US debt ceiling agreement and its capacity to become the law.
Amid these plays, the US stock futures print mild gains but the Treasury bond yields remain pressured and challenge the US Dollar Index (DXY) bulls as the greenback’s gauge versus the six major currencies seesaws around a nine-week high.
Technically, the USD/INR pair portrays a falling wedge bullish chart formation on the four-hour play, recently approaching the top line of the stated pattern.
It’s worth noting that the recently bullish MACD signals and upbeat RSI (14) line, not overbought, underpin the USD/INR pair’s latest run-up targeting the confirmation of the falling wedge by crossing the 82.75 resistance. Adding strength to the 82.75 hurdle is the 50-bar Simple Moving Average (SMA).
In a case where the USD/INR pair remains strong past 82.75, the monthly peak of around 83.00 may prod the buyers during the theoretical target of the wedge breakout, near 83.25.
Meanwhile, the USD/INR pair’s downside remains limited unless the quote stays beyond the aforementioned wedge’s bottom line, close to 82.50 at the latest.
Even if the USD/INR drops below 82.50, the 200-SMA level of around 82.15 can act as the last defense of the Indian Rupee sellers. It should be observed late April 20 peak of 82.41 also challenges the USD/INR bears.
USD/INR: Four-hour chart
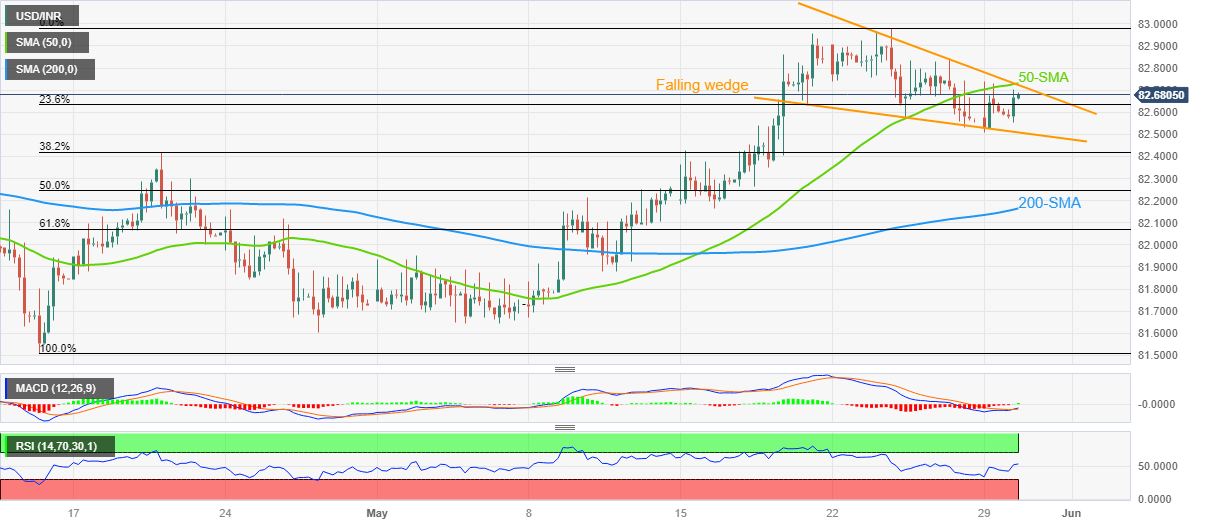
Trend: Further upside expected
- Gold price has extended its downside to near $1,940.00 amid a solid recovery in the USD Index.
- The overall market mood has turned cautious as investors are anticipating one more interest rate hike from the Fed.
- Gold price has delivered a breakdown of the volatility contraction pattern and is anticipated to deliver a vertical fall
Gold price (XAU/USD) witnessed extreme selling pressure after a short-lived pullback move to near $1,946.70 in the Asian session. The precious metal has extended its downside journey to near $1,940.00 as the US Dollar Index (DXY) has recovered its entire losses and is aiming to print afresh day high above 104.34.
S&P500 futures are continuously easing gains generated on Monday as investors are worried that Tuesday’s trading session could be extremely volatile after an extended weekend. The overall market mood has turned cautious as investors are anticipating one more interest rate elevation from the Federal Reserve (Fed).
Earlier, Fed chair Jerome Powell cited that tight credit conditions by US regional banks are doing the job for the central bank as liquidity disbursement in the economy has dropped. Firms are facing barriers in augmenting working capital requirements and are satisfied with operating at less capacity.
However, fresh incoming data showed that consumer spending is sky-rocketing in the US economy, and labor market conditions have not eased as expected, which is forcing the Fed to continue its policy-tightening spell.
This week, the release of the US Employment data will provide more clarity about interest rate guidance. As per the consensus, Thursday’s Automatic Data Processing (ADP) Employment Change is expected to land at 170K lower than the former release of 296K.
Gold technical analysis
Gold price has delivered a breakdown of the volatility contraction and is anticipated to deliver a vertical fall. Earlier, the precious metal displayed a downside move after a breakdown of the Symmetrical Triangle chart pattern on an hourly scale.
The 50-period Exponential Moving Average (EMA) at $1,948.00 has acted as a barricade for the Gold price.
Meanwhile, the Relative Strength Index (RSI) (14) has slipped below 40.00, which indicates that the downside momentum has been triggered.
Gold hourly chart
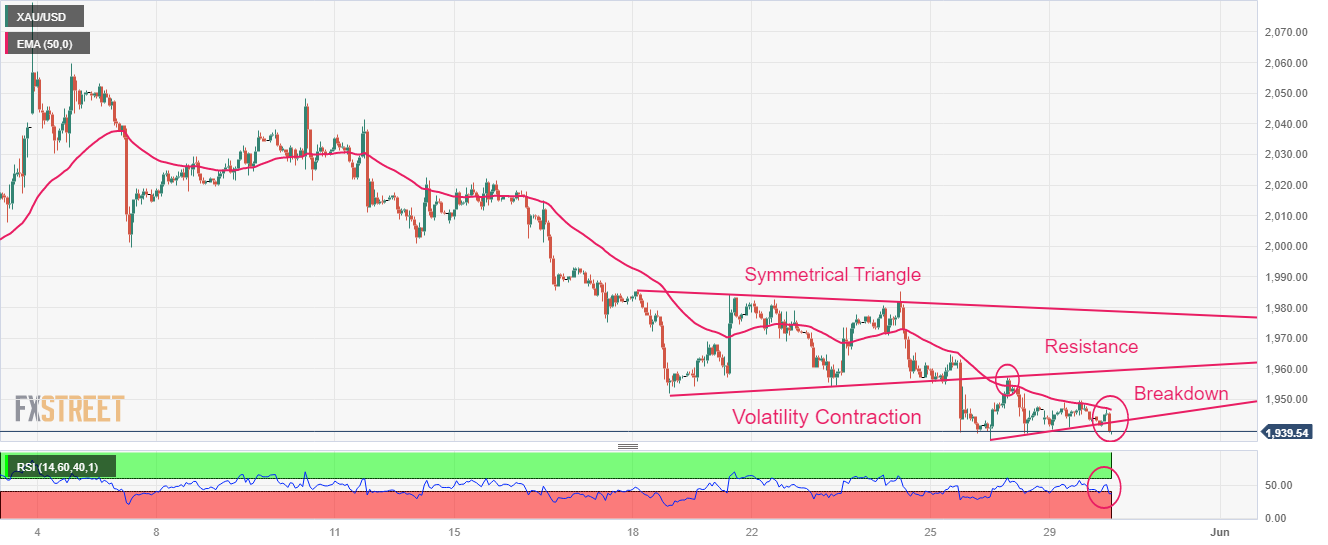
Haitham Al Ghais, the Secretary-General of the Organization of the Petroleum Exporting Countries (OPEC), said early Tuesday, “we believe that Iran is a responsible player amongst its family members, the countries in the OPEC group. I’m sure there will be good work together, in synchronization, to ensure that the market will remain balanced as OPEC has continued to do over the past many years.”
"In OPEC...we don’t target a certain price level. All our actions, all our decisions are made in order to have a good balance between global oil demand and global oil supply,” he added.
Market reaction
WTI was last seen trading at $72.43, down 0.70% on the day. The US oil is retreating from intraday highs of $73.38.
- EUR/USD prods 10-week low as bears keep reins for sixth consecutive day despite latest zigzag.
- Market sentiment dwindles as optimism surrounding US debt ceiling deal fades amid policymakers’ discomfort with compromises.
- Hawkish ECB talks fail to inspire Euro buyers amid fears of German recession, comparatively more optimistic Fedspeak.
- Eurozone, US consumer sentiment data, headlines about US debt ceiling deal will join ECB officials’ speeches to direct intraday moves.
EUR/USD remains depressed at 10-week low surrounding the 1.0700 threshold heading into Tuesday’s European session.
The Euro pair stays on the back foot for six days in a row amid hawkish Federal Reserve (Fed), as well as doubts about the European Central Bank’s (ECB) capacity to lift the rates further. Also exerting downside pressure on the major currency pair is the latest shift in the market sentiment as traders struggle to cheer the US policymakers’ agreement on the debt ceiling extension to January 2025 ahead of the House and Senate voting on the bill prior to the June 05 US default date.
The previous week’s downbeat German growth figures renew concerns about the old continent’s economic slowdown and pushed back the hawkish ECB bets even if the policymakers keep citing higher inflation woes and defend the tighter monetary policy. Among them, ECB Policymaker Pierre Wunsch was the latest who said on Saturday, “We hiked 400bp and we might have to do more.”
Apart from that, Spanish Prime Minister (PM) Pedro Sanchez announced snap elections in July while Greek President is up for appointing a caretaker PM ahead of a repeat election on June 25, which in turn flags geopolitical fears in the bloc and weighs on the EUR/USD prices.
On the other hand, traders struggle to cheer the successful negotiations to avoid the US default as some of the US policymakers, mostly Republicans, are against the compromises made to their previous demands to reach the deal. The policymakers also show readiness to challenge the agreement in the House, as well as in the Senate, which in turn prods the market’s previous risk-on mood and keeps the US Dollar on the front foot.
Against this backdrop, the US stock futures print mild gains but the Treasury bond yields remain pressured and challenge the US Dollar Index (DXY) bulls as the greenback’s gauge versus the six major currencies seesaws around a nine-week high.
Looking forward, Eurozone Consumer Confidence and the US Conference Boards’ (CB) Consumer Confidence data for May will offer immediate directions to the EUR/USD pair traders. However, Wednesday’s US House voting on the debt-ceiling agreement, Thursday’s Eurozone inflation data and the Senate’s approval for the same before June 05, as well as Friday’s US jobs report, become the key to watch for a clear guide.
Technical analysis
EUR/USD bears are likely to keep the reins unless crossing a one-month-old descending resistance line, close to 1.0725 by the press time. However, an upward-sloping support line from late November 2022, near 1.0700 at the latest, precedes the 200-day Exponential Moving Average (EMA) of around 1.0685 to limit the Euro pair’s short-term downside amid nearly oversold RSI (14) line.
- AUD/USD takes offers to refresh intraday low inside bearish chart formation.
- Absence of oversold RSI (14) line adds strength to downside bias.
- Aussie pair’s recovery remains elusive unless breaking one-week-old falling resistance line.
AUD/USD renews its intraday bottom around 0.6530 as it prints the first daily loss in three amid early Tuesday morning in Europe. In doing so, the Aussie pair fails to cheer broad US Dollar strength amid fears of softer economic growth in Australia.
While portraying the same, the AUD/USD pair prints a bearish flag chart pattern on the hourly timeframe.
Apart from the bearish chart formation, a near 50.0 level of the RSI (14) line allows the Aussie pair sellers to keep the reins.
That said, a convergence of the 50-Hour Moving Average (HMA) and an ascending support line from Friday restricts the AUD/USD pair’s immediate downside to around 0.6530 within the flag.
Following that, the 0.6510 level will be the key as a break of which confirms the bearish chart formation, making it vulnerable to refreshing the yearly low, currently around 0.6490.
It’s worth noting that the bear flag confirmation hints at a theoretical target of around 0.6340.
Meanwhile, the AUD/USD pair’s corrective bounce needs to cross the stated flag’s top line, close to 0.6560 at the latest.
Even so, the 200-HMA and a one-week-old descending resistance line, near 0.6615 by the press time, could challenge the Aussie bulls before giving them control.
AUD/USD: Hourly chart
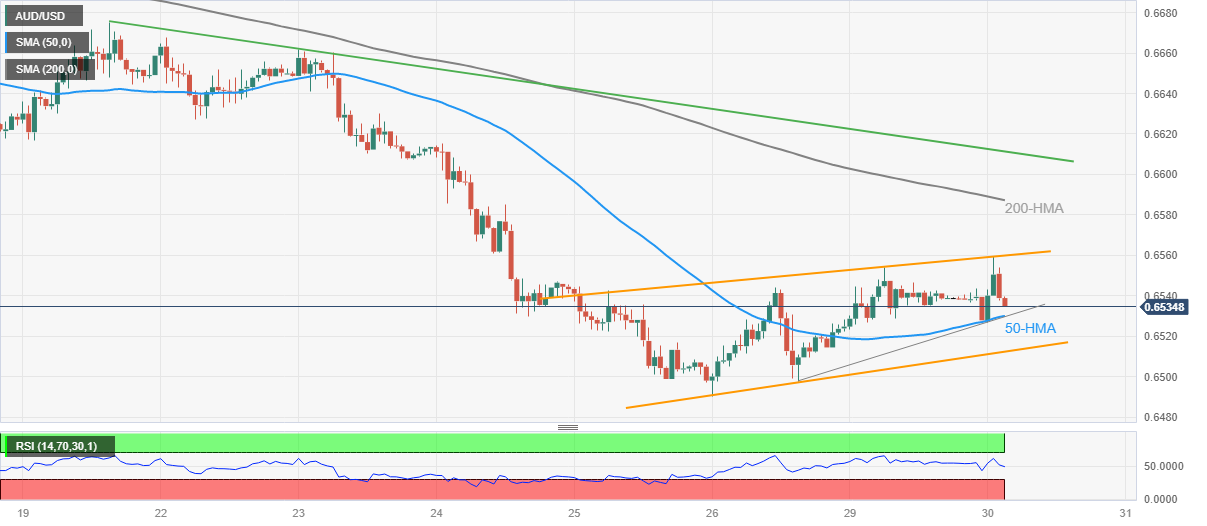
Trend: Further downside expected
- USD/CHF extends Friday’s pullback from seven-week high, remains pressured around intraday low.
- Market’s cautious optimism, positioning before the key data weigh on US Dollar.
- Swiss Q1 GDP, US CB Consumer Confidence will decorate calendar.
- Headlines surrounding US debt-ceiling extension, full markets’ reaction to shift in risk catalysts will be the key.
USD/CHF drops for the third consecutive day after refreshing a multi-week high as it prints mild losses around 0.9035 amid early Tuesday morning in Europe.
Swiss Franc (CHF) buyers cheer the broad US Dollar pullback amid mildly upbeat sentiment. Also likely to have favored the pair sellers could be the consolidation ahead of today’s key Swiss Gross Domestic Product (GDP) data for the first quarter (Q1) of 2023, as well as the US Conference Board’s (CB) Consumer Confidence for May.
That said, the US Dollar Index (DXY) reverses from a six-month-old resistance line to print the first daily loss in seven around 104.10 as firmer sentiment weigh on the US Dollar’s haven demand.
Underpinning the market’s cautious optimism is the return of the traders in major bourses after a long weekend and then the reaction to the US policymakers’ deal on the debt-ceiling extension to January 2025. Though, fears emanating from some of the US policymakers, mostly Republicans, are against the compromises made to their previous demands to reach the deal. The policymakers also show readiness to challenge the agreement in the House, as well as in the Senate, which in turn prods the market’s previous risk-on mood and keeps the US Dollar on the front foot.
“A handful of hard-right Republican lawmakers said on Monday they would oppose a deal to raise the United States' $31.4 trillion debt ceiling, in a sign that the bipartisan agreement could face a rocky path through Congress before the US runs out of money next week,” said Reuters.
While portraying the mood, the S&500 Futures print mild gains around 4,220 after retreating from the yearly high the previous day whereas the US Treasury yields drop by the press time.
Looking forward, Swiss Q1 GDP, expected to improve to 0.1% QoQ versus 0.0% prior, will offer immediate directions to the USD/CHF pair ahead of the US CB Consumer Confidence for May, expected to ease from 101.30 prior readings. Above all, Wednesday’s US House voting on the debt-ceiling agreement and the Senate’s approval for the same before June 05, as well as Friday’s US jobs report, become the key for the USD/CHF pair traders to watch for clear directions.
Technical analysis
A downside break of a three-week-old ascending support line, now immediate resistance near 0.9045, directs USD/CHF bears toward the 50-DMA level surrounding the 0.9000 threshold.
- USD/MXN takes offers to approach 13-day-old horizontal support zone, down for the third consecutive day.
- Oversold RSI (14) line challenges Mexican Peso pair’s further downside toward yearly bottom.
- 200-SMA, two-month-old descending resistance line check USD/MXN bulls before giving them control.
USD/MXN holds lower ground near the lowest levels in a fortnight, mildly offered around 17.57 during early Tuesday in Europe, as it prints a three-day losing streak.
In doing so, the Mexican Peso (MXN) pair approaches a short-term key horizontal support comprising multiple levels marked since May 11, around 17.53-54. Adding strength to the stated horizontal support is the RSI (14) line poking the oversold territory.
Should the USD/MXN pair remains bearish past 17.53, it can quickly prod the yearly low marked the last week around 17.42.
It’s worth noting that the quote’s sustained weakness past 17.42 makes it vulnerable to plunging towards the year 2016 bottom of around 17.05 and then to the 17.00 round figure.
Meanwhile, the USD/MXN pair’s expected recovery appears to have a limited upside room as the 17.62-63 zone, comprising multiple levels marked since May 11, guards the immediate rise.
Following that, the 200-SMA hurdle of 17.85 and a descending resistance line from early April, close to 17.92, can challenge the pair buyers ahead of directing them to the 18.00 round figure.
Overall, USD/MXN is likely to recover but the upside room appears limited.
USD/MXN: Four-hour chart
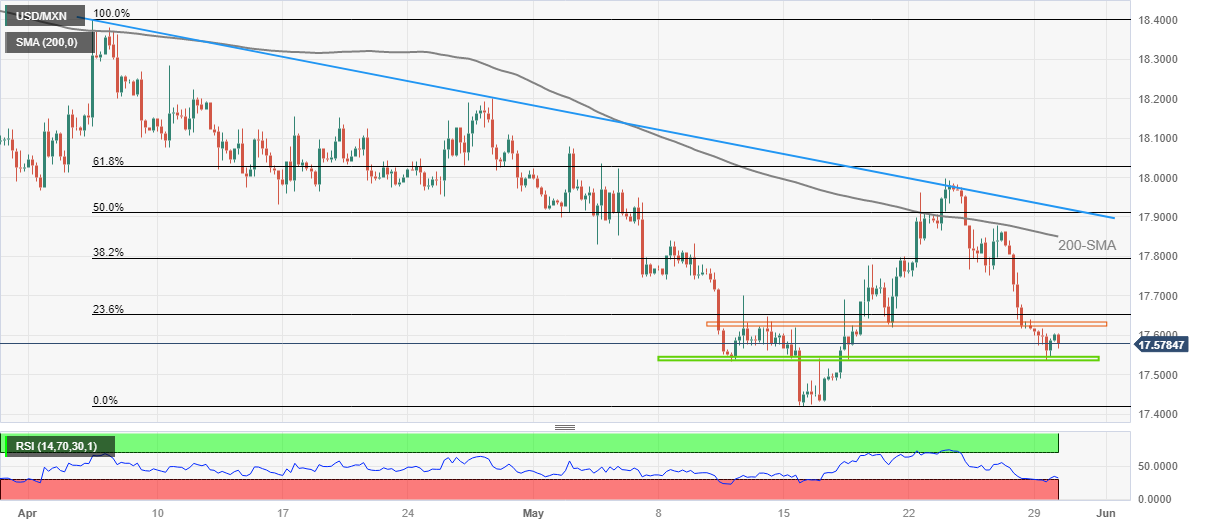
Trend: Limited downside expected
| Raw materials | Closed | Change, % |
|---|---|---|
| Silver | 23.169 | -0.44 |
| Gold | 1943.6 | 0.03 |
| Palladium | 1422.06 | -0.04 |
- USD/JPY has dropped sharply to near 140.00 amid a sell-off in the USD index.
- The risk profile would be cautious as investors are backing one more interest rate hike by the Fed considering resilience in consumer spending.
- The BoJ will continue with its bond-buying operations to keep inflation steadily above 2%.
The USD/JPY pair has slipped vertically to near 140.00 in the Asian session. The downside move in the asset is backed by a sheer sell-off in the US Dollar Index (DXY). Investors have trimmed longs in the USD/JPY pair as a raise approval for the US debt-ceiling has trimmed appeal for the USD index and deep discussions about tweaking Bank of Japan’s (BoJ) Yield Curve Control (YCC) are providing strength to the Japanese Yen.
S&P500 futures have trimmed some gains posted earlier as investors are anticipating a sheer volatile action in New York. Investors are expected to wrap up long-weekend positions, which could bring wild movements. The risk profile would be cautious as investors are backing one more interest rate hike by the Federal Reserve (Fed) considering resilience in consumer spending.
The US Treasury yields have dropped sharply as investors are optimistic that a raise in the US debt-ceiling for two years will get passage from Congress. The 10-year US Treasury yields have dropped below 3.76%.
This week, US Employment data will be keenly watched. Initially, Tuesday’s JOLTS Job Openings data will be released on Wednesday, which is expected to decline to 9.35M vs. the prior release of 9.59M. Later on Thursday, US Automatic Data Processing (ADP) Employment Change (May) will be released. As per the estimates, the US labor market has added fresh 170K payrolls vs. the former addition of 296K. On late Friday, the Nonfarm Payrolls (NFP) would be the show-stopper event.
On the Japanese Yen front, BoJ Governor Kazuo Ueda said on Tuesday, “The BoJ will patiently maintain the easy monetary policy as there is still a distance to go to stable 2% inflation.” He further added inflation is likely to bounce back after the middle of 2023 led by wage growth, and other factors but there is uncertainty on that outlook. Meanwhile, the BoJ will continue with its bonds buying operations.
- GBP/USD renews intraday high during three-day rebound from monthly low.
- UK shop price inflation jumps to record high, per BRC.
- Optimism surrounding US debt ceiling deal prod US Dollar bulls ahead of mid-tier US data.
- Risk catalysts are the key for clear directions amid full markets’ return after Monday’s holidays in major economies.
GBP/USD prints a three-day uptrend as bulls approach the 1.2400 resistance confluence during very early Tuesday morning in Europe, refreshing intraday high to around 1.2370 by the press time.
In doing so, the Cable pair not only cheers the US Dollar’s pullback amid the risk-on mood but also benefits from the hawkish hopes surrounding the Bank of England (BoE). It’s worth noting that the Pound Sterling pair dropped to the lowest levels in early April in the last week.
Earlier in the day, the British Retail Consortium (BRC) released Shop Price Index figures for April while conveying a record pressure on inflation due to the actual outcome. That said, the BRC Shop Price Index rises to 9.0% in April from 8.8% prior. It’s worth noting that BoE policymaker Jonathan Haskel said on Friday, “If we do see evidence of more inflation persistence, we will tighten policy.”
On the other hand, the US Dollar Index (DXY) reverses from a six-month-old resistance line to print the first daily loss in seven around 104.10 as firmer sentiment weigh on the US Dollar’s haven demand.
That said, the weekend news suggesting the US policymakers’ deal on the debt-ceiling extension to January 2025 allowed traders to remain hopeful after a long weekend in major economies. However, some of the policymakers, mostly Republicans, are against the compromises made to their previous demands to reach the deal. The policymakers also show readiness to challenge the agreement in the House, as well as in the Senate, which in turn prods the market’s previous risk-on mood and keeps the US Dollar on the front foot. “A handful of hard-right Republican lawmakers said on Monday they would oppose a deal to raise the United States' $31.4 trillion debt ceiling, in a sign that the bipartisan agreement could face a rocky path through Congress before the US runs out of money next week,” said Reuters.
Against this backdrop, the S&500 Futures print mild gains around 4,220 after retreating from the yearly high the previous day whereas the US Treasury yields drop by the press time.
Looking ahead, Wednesday’s US House voting on the debt-ceiling agreement and the Senate’s approval for the same before June 05, as well as Friday’s US jobs report, gains major attention. However, today’s US CB Consumer Confidence for May, expected to ease from 101.30 prior readings, will be important to determine the Cable pair’s intraday moves.
Technical analysis
GBP/USD picks up bids inside a three-week-old bearish channel, recently approaching the 1.2400 resistance confluence comprising the 10-DMA and the stated channel’s top line.
- USD/CAD slides in Asia as US Dollar bears move in.
- US debt ceiling, US jobs and Canadian GDP in focus.
USD/CAD is under pressure in Asia with the CAD clawing back some recent declines, as a deal to temporarily suspend the U.S. debt ceiling boosted investor sentiment. USDCAD was trading 0.12% lower at 1.3572 after moving in a range of 1.3584 to 1.3618 on Monday around its weakest intraday level since April 28 at 1.3654.
The Greenback, as per the DXY index, dropped on Tuesday against a basket of major currencies, although remains news of its two-month peak in the 104.40s. A deal over the US debt ceiling has lifted risk sentiment and now traders await to see how it goes through a process in Congress.
There are that a handful of hard-right Republican lawmakers will oppose a deal to raise the United States' $31.4 trillion debt ceiling meaning it will be a challenge to get the package through the Republican-controlled House of Representatives and Democratic-controlled Senate before the limit is reached. On Friday, US Treasury Secretary Janet Yellen said the government would default if Congress did not increase the debt ceiling by June 5. Meanwhile, longer-dated US Treasuries rallied in Asia on Tuesday on the debt ceiling deal.
Central bank sentiment
As for the Federal Reserve sentiment, markets are pricing in a 60% chance of a 25 basis-point hike in June, compared with a 26% chance a week earlier, according to CME FedWatch tool. Traders will look at Friday's job data and US Nonfarm payrolls likely slowed modestly in May, advancing at a still strong 200k+ pace for a second consecutive month, analysts at TD Securities said.
´´We also look for the UE rate to stay unchanged at a historical low of 3.4%, and for wage growth to print 0.3% MoM (4.4% YoY). Conversely, we look for the ISM mfg index to improve modestly, but to still signal contraction for the sector in May,´´ the analysts concluded.
Looking ahead to the domestic week, Canadian Gross Domestic Product data is due for release on Wednesday and there are expectations that the economy grew at an annualized rate of 2.5% in the first quarter. This comes ahead of next week´s interest rate decision by the Bank of Canada. Markets are pricing a roughly 30% chance of the central bank hiking its benchmark rate for the first time since January.
Citing former Reserve Bank of Australia (RBA) policymakers, MNI reported on Tuesday, the central bank is highly unlikely to undertake any form of quantitative tightening (QT) in the near future, as it would need the RBA to sell a large portion of its portfolio of long-term Australian Commonwealth Government Bonds to slow the economy significantly while injecting unpredictable volatility into fixed-income markets.
Key quotes
“A sale of the RBA's total portfolio of bonds would likely equate to a 30bp raise to the cash rate.”
"The RBA's research suggests that the purchases had about the same effect of loosening policy 30bp. So we're talking about the same impact as one more rate hike."
“While the RBA will not likely execute QT anytime soon, it could review its policy upon the maturity of other pandemic stimulus measures, such as the Term-funding Facility. The size of the central bank's balance sheet was material, at about 35% of total outstanding ACGBs.”
“The Board had agreed to hold its AUD300 billion portfolio until maturity but noted it would review the strategy in future.”
"I don't see a burning need for them to shrink the balance sheet very quickly. Yes, it carries a little interest rate risk, but the central bank can do that."
Market reaction
At the time of writing, AUD/USD is holding gains at around 0.6550, up 0.43% on the day.
Bank of Japan (BoJ)Governor Kazuo Ueda said on Tuesday, “ the BoJ will patiently maintain the easy monetary policy as there is still a distance to go to stable 2% inflation.”
Additional comments
Have not reached sustainable 2% inflation.
Inflation to slow a greatly around the middle of fiscal year 2023.
Inflation likely to bounce back thereafter on wage growth, other factors but there is uncertainty on that outlook.
BoJ will continue with bond buying operations.
Market reaction
USD/JPY is teasing 140.00 despite the dovish comments from the BoJ Chief. The spot is down 0.42% on the day, extending correction from near 141.00.
- NZD/USD picks up bids within three-day-old descending triangle.
- RSI’s rebound from oversold territory, bullish MACD signals suggest further corrective bounce of the Kiwi pair.
- Buyers to stay skeptical below 0.6250 resistance confluence.
NZD/USD prints mild gains around 0.6050 inside a bullish triangle formation portrayed at the yearly low. In doing so, the Kiwi pair justifies the RSI (14) line’s recovery from the oversold territory, as well as the bullish MACD signals, during early Tuesday.
As a result, the pair buyers may witness the further recovery of the quote towards the stated triangle’s top line, surrounding 0.6070 at the latest, ahead of poking the 0.6100 round figure.
Following that, a convergence of the previous support line stretched from late April and a 13-day-old descending resistance line, around 0.6250 by the press time, will be in the spotlight as it holds the key for the NZD/USD bull’s dominance.
It should be noted that the mid-May swing low around 0.6180-85 can act as an intermediate halt between 0.6100 and 0.6250.
Alternatively, a downside break of the stated triangle’s bottom line of around 0.6040 can quickly fetch the quote towards the 0.6000 psychological magnet.
Should the NZD/USD pair remains weak past the 0.6000 round figure, it becomes vulnerable to testing the early October 2022 peak of 0.5815.
Overall, NZD/USD stays bearish unless breaking the 0.6250 key hurdle.
NZD/USD: Four-hour chart
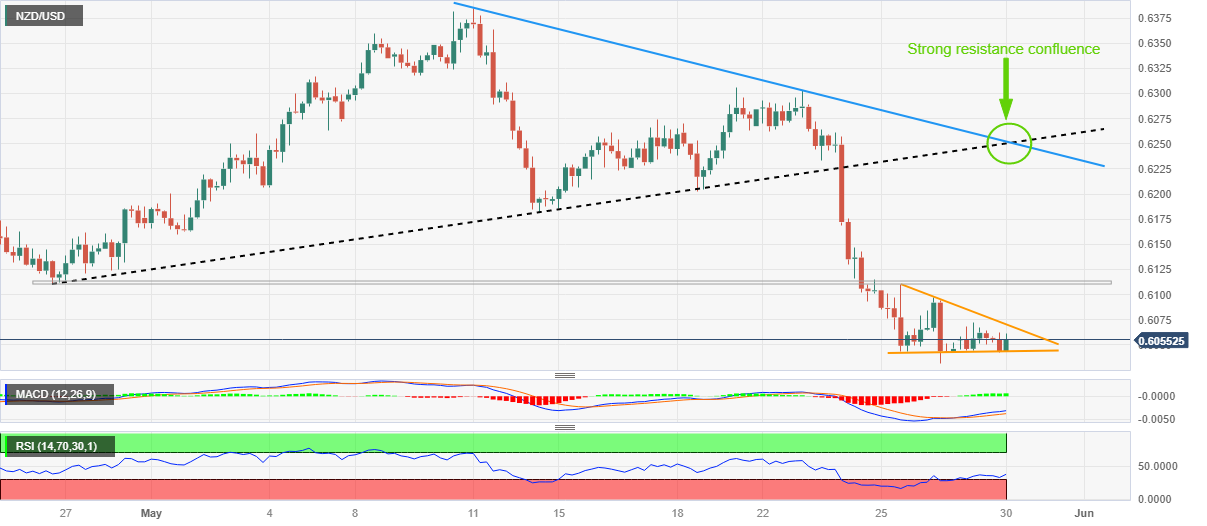
Trend: Further downside expected
- EUR/USD has shown a decent recovery from 1.0700 after witnessing sheer volatility in the USD index.
- Eurozone headline and core inflation are seen declining to 6.3% and 5.5% respectively.
- EUR/USD is attempting a breakout of the Descending Triangle chart pattern.
The EUR/USD pair has shown a decent recovery after defending its immediate support around 1.0700 in the Asian session. A recovery move in the major currency pair is being supported by a sell-off in the US Dollar Index (DXY). The USD index has slipped firmly below 104.20 as a raise in the US debt-ceiling is weighing heavily.
This week, the USD Index will be guided by the US Employment-linked economic indicators. From job openings to hiring figures, the entire gamut will portray current labor market conditions.
Meanwhile, the Euro bulls will also remain in action amid the release of the preliminary Eurozone inflation data (May). As per the consensus, headline inflation is seen declining to 6.3% vs. the former release of 7.0%. Core inflation is expected to show a minor deceleration to 5.5% against the prior release of 5.6%.
EUR/USD is attempting a breakout of the Descending Triangle chart pattern formed on an hourly scale. The downward-sloping trendline of the aforementioned chart pattern is potted from May 24 high around 1.0800. Horizontal support of the chart pattern is placed from May 25 low at 1.0707.
The shared currency pair has climbed above the 20-period Exponential Moving Average (EMA) at 1.0715 and is aiming to shift auction above the 50-EMA at 1.0724.
A break into the 60.00-80.00 range by the Relative Strength Index (RSI) (14) will trigger the upside momentum.
Should the asset break above the day’s high at 1.0726, Euro bulls would drive the major currency pair toward May 19 low at 1.0760. and the round-level resistance at 1.0800.
In an alternate scenario, the downside move will resume if the shared currency pair drops below the round-level support of 1.0700. This will drag the asset toward March 13 low at 1.0650 followed by March 03 low at 1.0588.
EUR/USD hourly chart
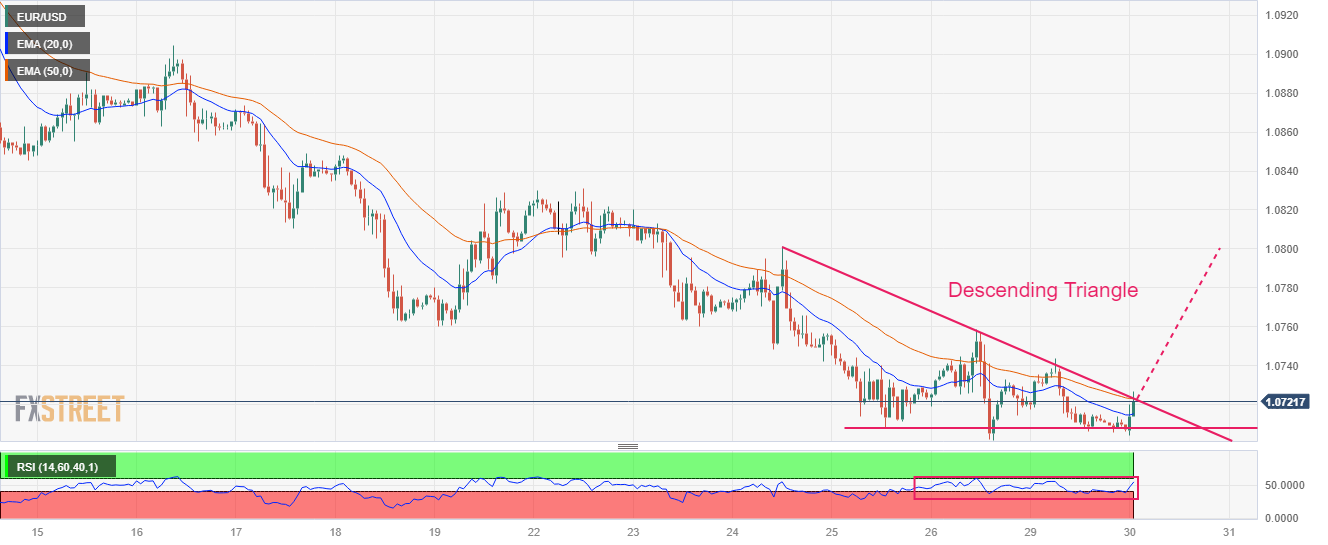
- Market sentiment improves on full markets’ initially positive reaction to US debt-ceiling deal.
- S&P500 Futures grind higher, yields fade upside momentum.
- Fears surrounding the agreement’s passage through Congress, hawkish Fed bets and anxiety before crucial data prod optimists.
- US CB Consumer Confidence will decorate calendar, risk catalysts are the key.
Risk profile remains mildly positive during early Tuesday as a return of the full markets cheer the weekend agreement in the US to avoid the ‘catastrophic’ default. Adding strength to the cautious optimism are the recently firmer US data and hopes of no recession in the world’s biggest economy, even as spending power bears the burden of higher inflation.
While portraying the mood, the S&500 Futures print mild gains around 4,220 after retreating from the yearly high the previous day. On the same line, the US 10-year Treasury bond yields dropped five basis points (bps) to 3.76% whereas the two-year counterpart reverses from the 11-week high to print the first daily loss since May 11 to around 4.58% by the press time.
Markets in the US, Germany, Switzerland and the UK were off the previous day and stopped traders from cheering the weekend news suggesting the US policymakers’ deal on the debt-ceiling extension to January 2025. The same allowed the traders to begin the ‘real’ trading week with hopes of overcoming the fears of the US failure to pay its debts.
However, some of the policymakers, mostly Republicans, are against the compromises made to their previous demands to reach the deal. The policymakers also show readiness to challenge the agreement in the House, as well as in the Senate, which in turn prods the market’s previous risk-on mood and keeps the US Dollar on the front foot. “A handful of hard-right Republican lawmakers said on Monday they would oppose a deal to raise the United States' $31.4 trillion debt ceiling, in a sign that the bipartisan agreement could face a rocky path through Congress before the US runs out of money next week,” said Reuters.
On a different page, fresh fears of the Eurozone recession, emanating from a downward revision to Germany’s first quarter (Q1) Gross Domestic Product (GDP) figures, join the US-China woes to also challenge the sentiment. Late on Monday, China turned down the US request for a meeting of the Defense Chiefs in Singapore, per the Wall Street Journal (WSJ).
Looking ahead, sentiment numbers from Eurozone and the US will decorate the calendar and should be watched closely amid recently increasing hawkish Fed bets. Additionally important will be the full market’s reaction to the latest developments about the US default. Above all, Wednesday’s US House voting on the debt-ceiling agreement and the Senate’s approval for the same before June 05, as well as Friday’s US jobs report, gains major attention.
Also read: Forex Today: With US debt ceiling deal reached, focus turns to economic data
In recent trade today, the People’s Bank of China (PBOC) set the yuan at 7.0818 vs the last close of 7.0706.
About the fix
China maintains strict control of the yuan’s rate on the mainland.
The onshore yuan (CNY) differs from the offshore one (CNH) in trading restrictions, this last one is not as tightly controlled.
Each morning, the People’s Bank of China (PBOC) sets a so-called daily midpoint fix, based on the yuan’s previous day's closing level and quotations taken from the inter-bank dealer.
- AUD/USD has advanced to near 0.6550 as the USD index is facing selling pressure.
- Loud expectations of more interest rate hikes by the Fed are failing to provide a cushion to the USD Index.
- Australian monthly inflation is seen rebounding to 6.4% from the former release of 6.3%.
The AUD/USD pair has jumped to near 0.6550 after a volatile action, which was inspired by the sheer gyration in the US Dollar Index (DXY) in the Asian session. The Aussie asset is expected to remain in action ahead amid the release of the Australian monthly Consumer Price Index (CPI) (April) data, which is scheduled for Wednesday.
S&P500 futures have trimmed decent gains in the Asian session as investors are worried that volatility would remain elevated amid the opening of US markets after an extended weekend. United States investors are expected to react heavily on weekend events such as the US debt-ceiling raise approval for two years and resilient consumer spending, which has accelerated hopes of a continuation of the policy-tightening spell by the Federal Reserve (Fed).
The US Dollar Index (DXY) has dropped below 104.20 as investors are anticipating that a raise in the US debt-ceiling issue is expected to force credit rating agencies to downgrade the long-term credibility of the US economy.
Meanwhile, loud expectations of more interest rate hikes by the Fed are failing to provide a cushion to the USD Index. Consumer spending in the United States economy has rebounded sharply despite higher interest rates from the Fed and easing heat from labor market conditions. Fed chair Jerome Powell could be forced to raise rates further if he finds signs of persistence in the US inflation.
Going forward, Australian inflation will remain in focus. Australian inflation is seen rebounding to 6.4% from the former release of 6.3%. Apart from that, the speech from Reserve Bank of Australia (RBA) Governor Philip Lowe will remain in the spotlight. RBA Lowe is expected to provide interest rate guidance for the June meeting.
- Silver Price retreats towards two-month low marked the last week, pressured for the second consecutive day.
- Bearish MACD signals, failure to keep the bounce off $22.70 to lure XAG/USD sellers.
- 200-DMA, ascending trend line from September 2022 on bear’s radar.
- Buyers remain off the table unless the quote crosses April’s low.
Silver Price (XAG/USD) remains depressed around the intraday low surrounding $23.15 during early Tuesday in Asia. In doing so, the bright metal drops for the second consecutive day while keeping the week-start U-turn from the 100-DMA hurdle.
Additionally favoring the Silver sellers are the downbeat MACD signals and the metal’s failure to defend Friday’s strong recovery from the $22.70 mark.
With this, the quote drops towards the $23.00 round figure ahead of revisiting the latest troughs around $22.70.
Following that, the 200-DMA level surrounding the $22.00 will gain the Silver seller’s attention. It’s worth noting, however, that an upward-sloping support line from September 2022, close to $21.00 by the press time, appears the key for the XAG/USD sellers to conquer before taking control.
On the contrary, the Silver Price recovery needs validation from the 100-DMA hurdle of around $23.35, as well as from the $24.00 round figure, ahead of challenging the final post of the XAG/USD bears around $24.50, comprising the monthly low of April.
Should the XAG/USD manage to remain firmer past $24.50, the odds of witnessing a run-up towards the yearly top marked earlier in the month around $26.15 can’t be ruled out.
Silver Price: Daily chart
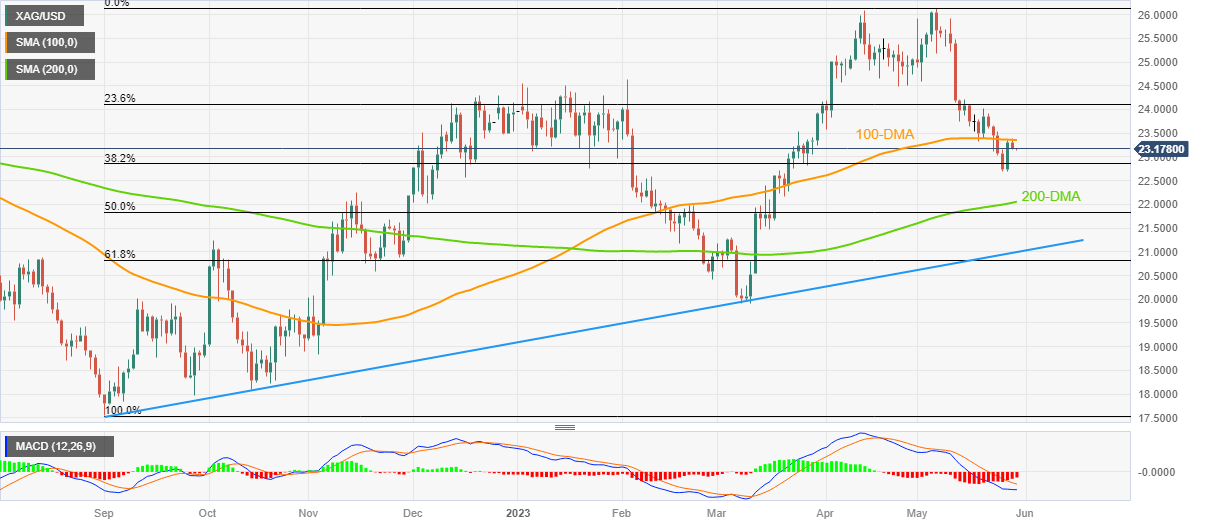
Trend: Further downside expected
- WTI bears in the market looking for a break of structure.
- The market s coiled and a breakout could be imminent.
West Texas Intermediate crude has been edging down in light holiday trade with a focus now on the OPEC+ ministers meeting. Technically, the price is coiling and a breakout could be imminent as the following will illustrate,
WTI daily charts
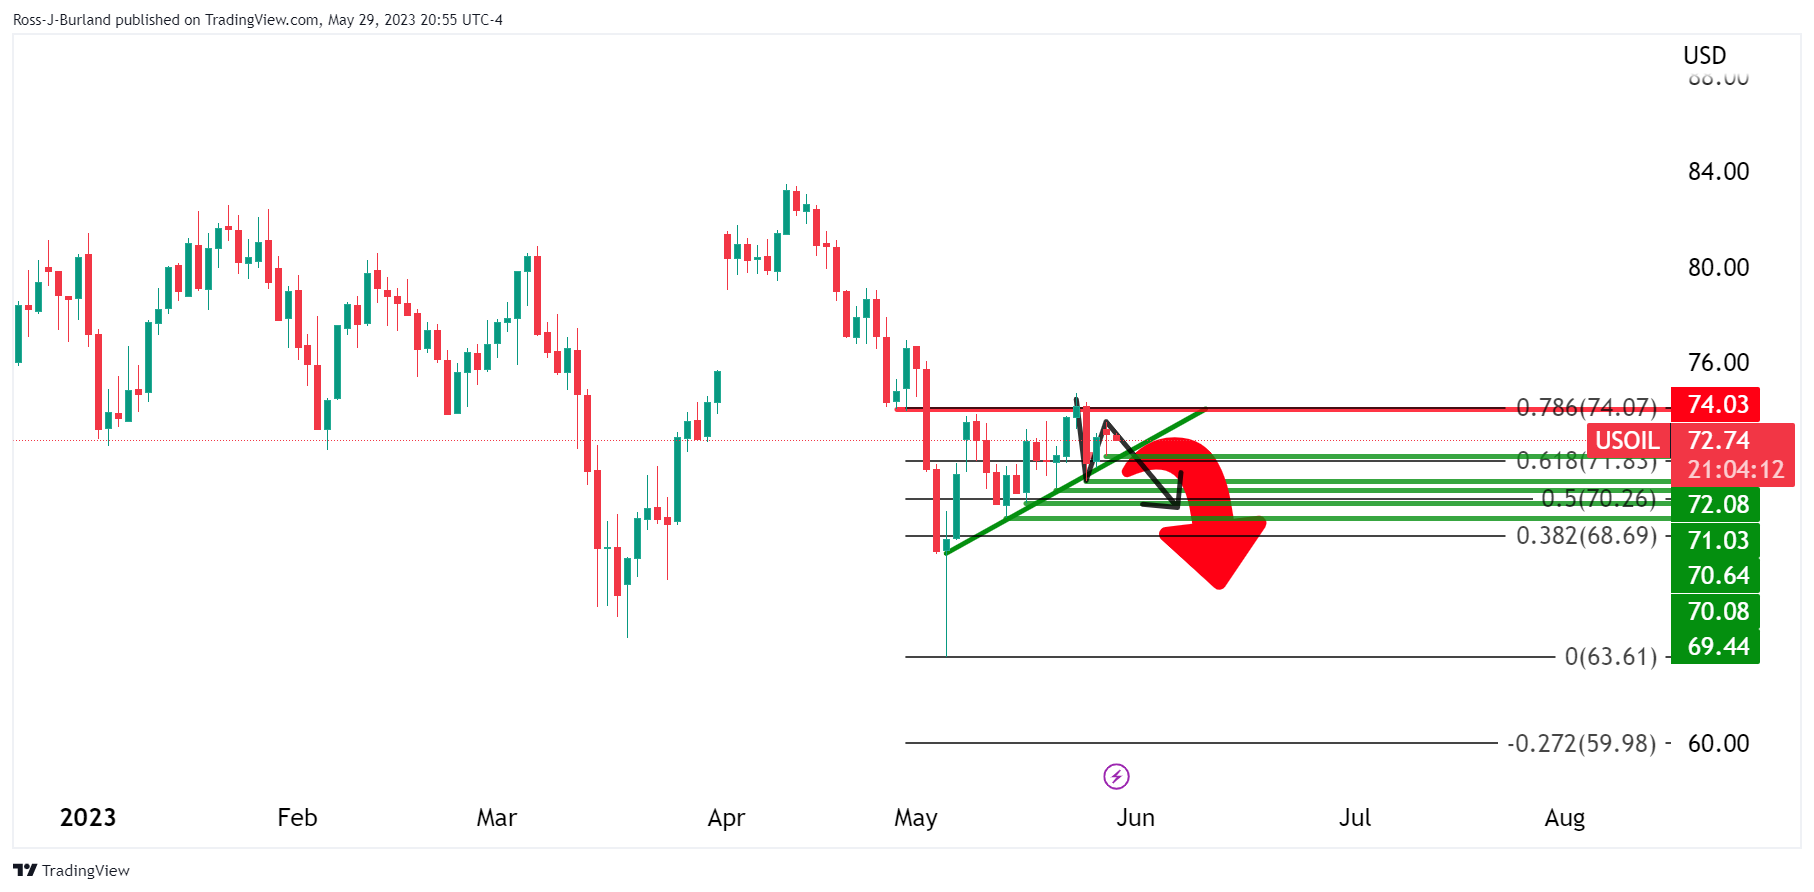
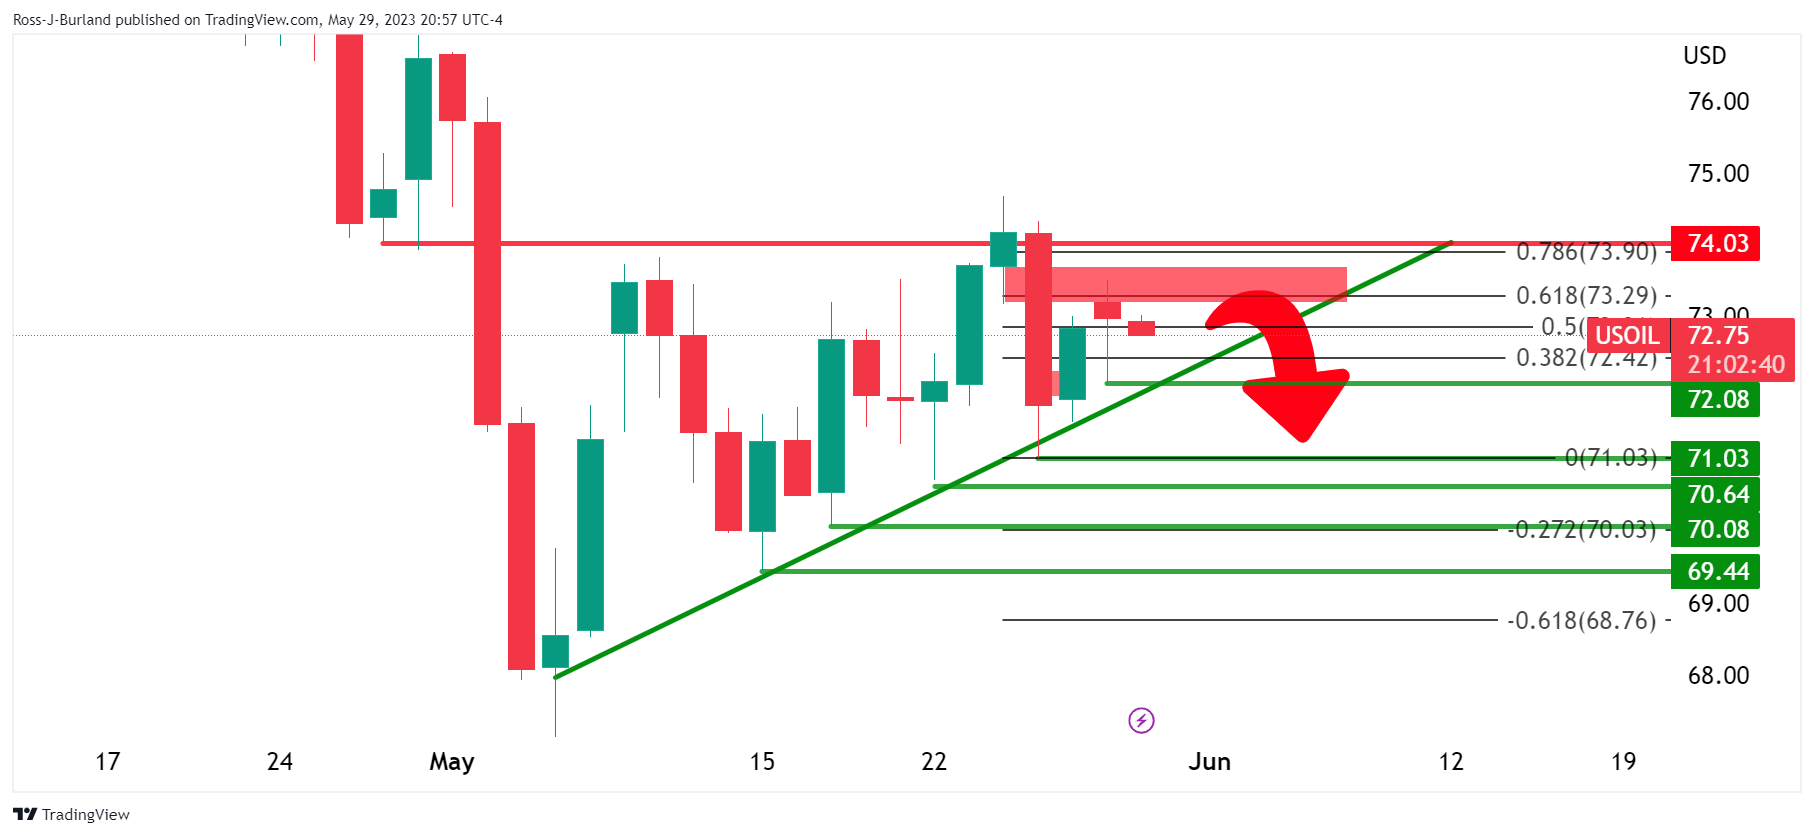
On the daily chart, the price has been building within a triangle and is now coiled in a tight range below $74.00 resistance. A break of structure oin the downside will needed to confirm a bearish bias.
WTI H4 chart
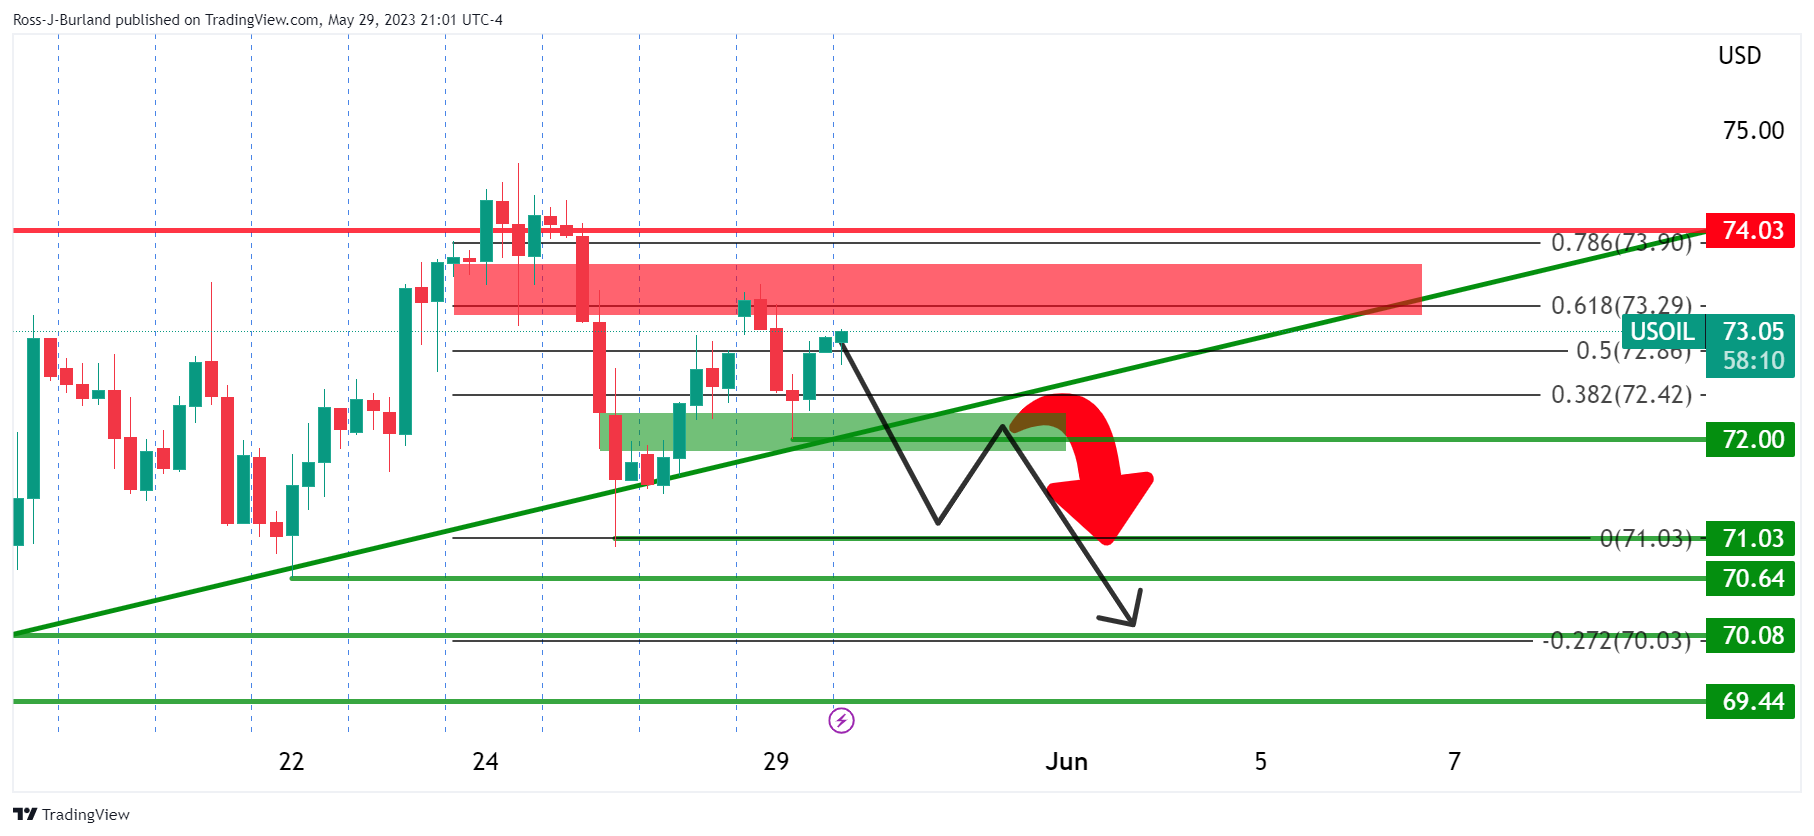
The 4-hour chart shows $72.00 as a key level as a structural point that meets the trendline support as well. Bears could well be encouraged at that juncture to commit to the move.
Japan's Finance Minister Shunichi Suzuki said that Japan Ministry of Finance fiscal panel calls for maintaining yen credibility in guiding fiscal policy. He said they must guide fiscal policy in line with the international norm.
USD/JPY update
- USD/JPY lures buyers around mid-140.00s despite downbeat Japan Unemployment Rate, focus on risk catalysts
- Gold Price seesaws near intraday low as United States Treasury bond yields drop on full markets’ return.
- Challenges for United States debt ceiling agreement in being a law and turning down default woes prod XAU/USD bulls.
- Holidays in multiple markets previously allowed Gold Price to pare recent losses, bears can sneak in on fresh risk aversion.
- Full markets’ reaction to debt limit deal, mid-tier US data eyed for intraday XAU/USD directions.
Gold price (XAU/USD) marks a zigzag move around the daily bottom near $1,940 as bears keep the reins, even with minor losses, amid the mid-Asia session on Tuesday.
In doing so, the precious metal bears the burden of the markets’ rush towards risk safety, which in turn underpins the US Dollar. However, the latest optimism in the bond markets, due to the first reaction to the United States policymakers’ agreement on extending the debt ceiling to avoid the default seems to have put a floor under the Gold price. That said, the XAU/USD bears occupy the driver’s seat amid challenges to sentiment, as well as due to the cautious mood ahead of the key data/events.
Gold Price stays pressured despite downbeat United States Treasury bond yields
Gold price holds lower ground even as the United States Treasury bond yields portray the market’s optimism about the US policymakers’ deal on the debt-ceiling extension to January 2025. The reason for the XAU/USD weakness could be linked to the risk-negative signals from some of the policymakers, mostly Republicans, as they’re against the comprises made to reach the deal and stay ready to challenge the move in the House, as well as in the Senate.
“A handful of hard-right Republican lawmakers said on Monday they would oppose a deal to raise the United States' $31.4 trillion debt ceiling, in a sign that the bipartisan agreement could face a rocky path through Congress before the U.S. runs out of money next week,” said Reuters.
That said, the United States 10-year Treasury bond yields dropped five basis points (bps) to 3.76% amid the initial hour of the week-start trading for the US bond markets, after Monday’s holiday.
Hawkish Federal Reserve bets, US-China woes also weigh on XAU/USD
Apart from the United States default fears, hawkish concerns about the Federal Reserve’s (Fed) next rate hike, backed by upbeat US data, also exert downside pressure on the Gold Price. That said, the upbeat prints of the US PMIs, Durable Goods Orders and Q1 GDP and inflation signals favor the market’s bullish bets on the interest rate futures suggesting a 0.25% Fed rate hike in June.
Additionally, fresh fears of the Eurozone recession, emanating from a downward revision to Germany’s first quarter (Q1) Gross Domestic Product (GDP) figures, join the US-China woes to also keep the Gold price depressed, via the market’s rush towards the US Dollar. Late on Monday, China turned down the US request for a meeting of the Defense Chiefs in Singapore, per the Wall Street Journal (WSJ).
Amid these plays, the US S&P500 Futures print mild gains around 4,225 and challenges the Gold price downside. It’s worth noting that the US Dollar Index (DXY) regains upside momentum after a struggle to renew the two-month high yesterday, which in turn weighs on the XAU/USD.
Moving on, developments about the US debt ceiling agreement and the US CB Consumer Confidence for May will be crucial for the Gold Price watchers to observe for intraday directions. Should there be risk-negative headlines from the political frontier, as well as upbeat US statistics, the Gold price may witness further downside depending upon the DXY’s capacity to remain firmer.
Also read: US Consumer Confidence Preview: Confidence remains down, but DXY aims up
Gold Price Technical Analysis
Gold Price struggles to defend the bounce off the 2.5-month-old horizontal support zone surrounding $1,933-35 amid below-50.0 levels of the Relative Strength Index (RSI) line, placed at 14, which in turn suggests a lack of upside momentum.
Adding strength to the downside bias are the sluggish signals from the Moving Average Convergence and Divergence (MACD) indicator.
However, a clear break of the $1,935-33 area becomes necessary for the Gold seller’s conviction.
Following that, the $1,900 round figure and the mid-March swing low of around $1,885 can prod the XAU/USD bears before directing them toward the yearly low marked in late February at around $1,804.
Alternatively, the previous support line stretched from early April, near $1,955, follows the 61.8% Fibonacci retracement of the Gold Price moves between mid-March and early May, near $1,960, to restrict the short-term upside of the bullion.
Even if the XAU/USD manages to cross the $1,960 hurdle, a convergence of the 50-SMA and a four-week-old descending resistance line, near $1,965, appears crucial to challenge the Gold buyers, a break of which suggests a short-term upside of the precious metal.
Overall, the Gold Price is likely to grind lower despite the latest corrective bounce from the short-term key support.
Gold Price: Four-hour chart
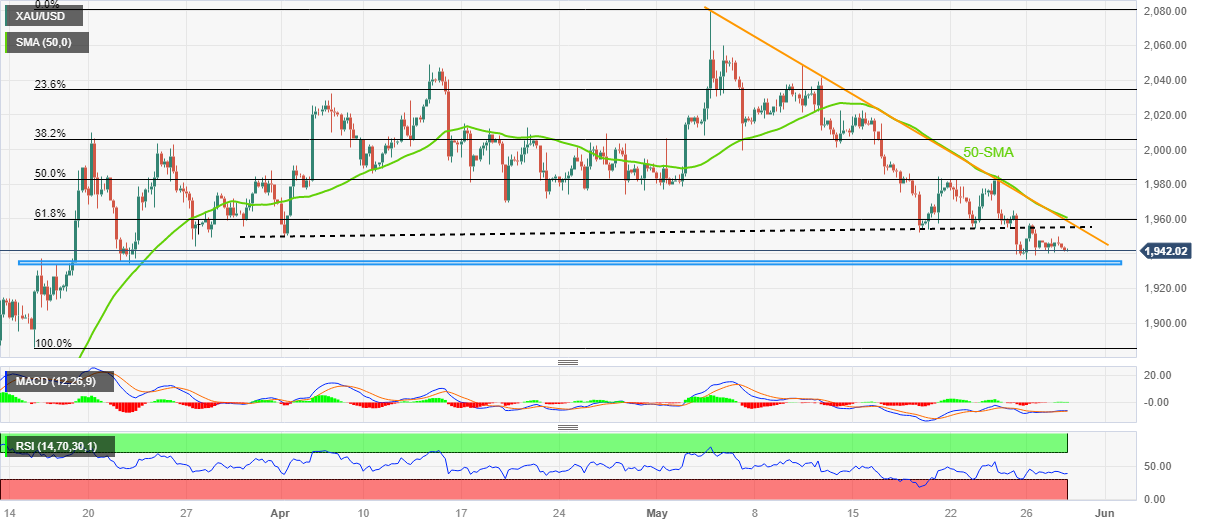
Trend: Further downside expected
| Index | Change, points | Closed | Change, % |
|---|---|---|---|
| NIKKEI 225 | 317.23 | 31233.54 | 1.03 |
| Hang Seng | -195.81 | 18551.11 | -1.04 |
| ASX 200 | 62.6 | 7217.4 | 0.87 |
| DAX | -31.24 | 15952.73 | -0.2 |
| CAC 40 | -15.37 | 7303.81 | -0.21 |
- USD/CHF has faced selling pressure above 0.9045 amid sheer volatility in the USD Index.
- The USD Index is a rerating candidate as the street is anticipating one more interest rate hike from the Fed.
- USD/CHF is demonstrating an inventory adjustment phase after delivering a breakout of the Wyckoff Accumulation pattern.
The USD/CHF pair has dropped sharply after multiple attempts of shifting the auction profile above 0.9045 in the Asian session. The Swiss Franc asset has attracted significant offers as the US Dollar Index (DXY) has turned extremely volatile as United States investors are returning after an extended weekend on account of Memorial Day.
S&P500 futures have trimmed some gains in Tokyo, portraying a minor caution ahead of reaction from investors over the US debt-ceiling raise approval. The USD Index has shown a wild gyration in a 25-pip range as investors are anticipated to re-rate the asset amid a rebound in expectations for an interest rate hike by the Federal Reserve (Fed).
Meanwhile, the Swiss Franc will remain in action amid the release of the Swiss Q1 Gross Domestic Product (GDP) data. Quarterly GDP is seen expanding by 0.1% vs. a stagnant performance. On an annual basis, the GDP figure is seen landing at 0.6%, lower than the former release of 0.8%.
USD/CHF is demonstrating an inventory adjustment phase after delivering a breakout of the Wyckoff Accumulation pattern formed on a four-hour scale. Broadly, the Swiss franc asset is expected to display wider bullish ticks and heavy volume as bulls remain solid in the markup phase. Upward-sloping 50-period Exponential Moving Average (EMA) at 0.9024 is providing support to the US Dollar bulls.
A confident break into the bullish range of 60.00-80.00 by the Relative Strength Index (RSI) would strengthen US Dollar bulls further.
Going forward, a decisive break above the immediate resistance plotted on May 25 high at 0.9073 will drive the asset toward the round-level resistance of 0.9100 followed by March 28 low at 0.9137.
In an alternate scenario, a downside move below May 16 low at 0.8929 will drag the asset toward April 14 low at 0.8867. A slippage below April 14 low will further drag the asset toward the Spring formation around May 04 low at 0.8820.
USD/CHF four-hour chart
-638210031717671070.png)
| Pare | Closed | Change, % |
|---|---|---|
| AUDUSD | 0.65376 | 0.22 |
| EURJPY | 150.326 | -0.45 |
| EURUSD | 1.07094 | -0.13 |
| GBPJPY | 173.453 | -0.25 |
| GBPUSD | 1.23549 | 0.05 |
| NZDUSD | 0.60545 | 0.08 |
| USDCAD | 1.35864 | -0.13 |
| USDCHF | 0.90402 | -0.16 |
| USDJPY | 140.383 | -0.31 |
“Australian economy may have already gone into a weak period of growth,” says Australian Treasury Secretary Steven Kennedy as he appears in the parliament before the Senate Estimates Committee on early Tuesday.
The policymaker further added that there are no signs of a wage-price spiral, suggesting further upside in the nominal wage growth.
AUD/USD seesaws
The news initially weighed on the AUD/USD price and dragged it towards refreshing the intraday low to 0.6527 before the latest fall in the yields favored the Aussie pair buyers as Tokyo opens for Tuesday.
Also read: AUD/USD grinds near mid-0.6500s amid cautious markets, US debt limit deal in focus
- USD/JPY picks up bids to reverse week-start retreat from the highest levels in six months.
- Japan Unemployment Rate eases, Jobs/Applicants Ratio remains static in April.
- Yields struggle ahead of full market’s return, challenges to sentiment from US debt ceiling deal favor Yen pair buyers.
USD/JPY regains upside momentum as it reverses the previous day’s corrective pullback from a six-month high near 140.50 amid early hours of Tokyo trading on Tuesday. In doing so, the Yen pair fails to cheer upbeat Japan data amid fresh challenges to the previous risk-on mood as full markets return.
That said, Japan’s Unemployment Rate eased to 2.6% in April versus 2.7% expected and 2.8% prior whereas the Job/Applicants Ratio remained static near 1.32 during the stated month.
USD/JPY began the week on a softer footing in reaction to US President Joe Biden and House Speaker Kevin McCarthy’s weekend announcement of an agreement to avoid the debt-ceiling expiration. However, some of the policymakers, mostly Republicans, are against the comprises made to reach the deal and stay ready to challenge the move in the House, as well as in the Senate, which in turn raises market fears as the US approaches the June 5 deadline for default.
Elsewhere, the recently upbeat US data propel the hawkish Fed bets despite fears that the US debt-limit agreement advocates for more bond issuance and negatively affect the market’s liquidity. The same, however, struggles with the challenges for the Bank of Japan’s (BoJ) further dovish bias amid recently firmer inflation numbers from the Asian major.
Amid these plays, S&P500 Futures print mild losses while the yields regain upside momentum after a downbeat start of the week. With this, the USD/JPY pair can keep the latest rebound on the table to challenge the yearly high marked in the last week.
Moving on, developments about the US debt ceiling agreement and the US CB Consumer Confidence for May will be crucial for the US Dollar Index traders to watch for intraday directions of the USD/JPY pair.
Also read: US Consumer Confidence Preview: Confidence remains down, but DXY aims up
Technical analysis
USD/JPY buyers appear running out of steam but the sellers need validation from the 200-DMA support of around 137.30 to convince the Yen pair bears.


© 2000-2026. Bản quyền Teletrade.
Trang web này được quản lý bởi Teletrade D.J. LLC 2351 LLC 2022 (Euro House, Richmond Hill Road, Kingstown, VC0100, St. Vincent and the Grenadines).
Thông tin trên trang web không phải là cơ sở để đưa ra quyết định đầu tư và chỉ được cung cấp cho mục đích làm quen.
Giao dịch trên thị trường tài chính (đặc biệt là giao dịch sử dụng các công cụ biên) mở ra những cơ hội lớn và tạo điều kiện cho các nhà đầu tư sẵn sàng mạo hiểm để thu lợi nhuận, tuy nhiên nó mang trong mình nguy cơ rủi ro khá cao. Chính vì vậy trước khi tiến hành giao dịch cần phải xem xét mọi mặt vấn đề chấp nhận tiến hành giao dịch cụ thể xét theo quan điểm của nguồn lực tài chính sẵn có và mức độ am hiểu thị trường tài chính.
Sử dụng thông tin: sử dụng toàn bộ hay riêng biệt các dữ liệu trên trang web của công ty TeleTrade như một nguồn cung cấp thông tin nhất định. Việc sử dụng tư liệu từ trang web cần kèm theo liên kết đến trang teletrade.vn. Việc tự động thu thập số liệu cũng như thông tin từ trang web TeleTrade đều không được phép.
Xin vui lòng liên hệ với pr@teletrade.global nếu có câu hỏi.
ngân hàng