- Phân tích
- Tin tức và các công cụ
- Tin tức thị trường
Tin tức thì trường
- WTI bulls take a breather at the weekly top after rising the most in a month.
- Softer US Dollar, risk-on mood and firmer China data allow Oil buyers to stay hopeful.
- Surprise building in EIA inventories, hopes of no OPEC+ supply cuts prods Oil buyers.
- US NFP, risk catalysts eyed for clear directions, USD moves are the key.
WTI crude oil fades upside momentum around $70.00 during early Friday in Asia, after rising the most in one month the previous day. In doing so, the Oil price portrays the typical pre-NFP positioning of the markets while also justifying the price-negative catalysts from the energy industry. However, risk-on mood, softer US Dollar and expectations of the delay in the Fed rate hike seem putting a floor under the Oil price.
The US Dollar weakness is the biggest catalyst to favor the Oil buyers. That said, US Dollar Index (DXY) seesaws around 103.56 after a 0.65% daily fall marked on Thursday, the most in a month, to reverse from the highest levels since mid-March.
That said, the United States Treasury bond yields also refreshed the weekly lows as the market’s pricing of the Fed rate hike dropped. Adding strength to the DXY could be mixed US data and receding hopes of a faster Fed rate hike, as well as firmer data from China and passage of the US debt ceiling agreement in the US House of Representatives.
Elsewhere, a surprise build in the weekly inventories reported by the US Energy Information Administration (EIA), 4.488M for the week ended on May 26, versus -1.386M expected and -12.456M prior, weigh on the Oil prices.
On the same line are the concerns that the Organization of the Petroleum Exporting Countries and allies led by Russia, known as the OPEC+, are unlikely to deepen supply cuts at their ministerial meeting on Sunday despite a fall in oil prices toward $70 per barrel, four sources from the alliance told Reuters.
Amid these plays, the Oil buyers are likely to wait for more clues to witness further upside.
Looking forward, developments surrounding the US bill to avoid default may entertain the Oil traders ahead of the US jobs report for May. forecasts surrounding the US Nonfarm Payrolls (NFP) to ease to 190K from 253K prior while the Unemployment Rate is also expected to increase to 3.5% from 3.4%.
Technical analysis
Unless crossing a descending resistance line from April 12, around $72.65 by the press time, WTI remains off the buyer’s table.
- The US Dollar Index is oscillating below 103.60 amid a cheerful market mood.
- Fed policymakers: Parker and Jefferson have supported a pause in the policy-tightening spell in June.
- Upbeat ADP Employment data has strengthened expectations from the US NFP report.
The US Dollar Index (DXY) is auctioning below the crucial support of 103.60 in the Tokyo session. The USD index was heavily dumped by the market participants in the New York session amid a cheerful market mood. Dovish commentary from Federal Reserve (Fed) policymakers eases chaos in financial markets.
S&P500 futures have carry-forwarded bullish sentiment lived on Thursday as a seventh straight contraction in United States ISM Manufacturing PMI bolstered the need of pausing the policy-tightening spell to avoid recession. However, upbeat labor market conditions are still pegging the need of raising interest rates further
Fed Parker and Jefferson support a pause in June
Dovish commentary from Philadelphia Federal Reserve Bank President Patrick Harker as he stated on Thursday that he believes it is time for the central bank to 'hit the stop button' for at least one meeting shrugged off negative market sentiment. Also, Fed Governor Philip Jefferson said in a speech on Wednesday that pausing rate hikes at the next FOMC meeting would offer time to analyze more data before making a decision about the extent of additional tightening. He added that a pause does not mean that rates peaked. An escalating number of dovish Fed policymakers has trimmed hawkish Fed bets.
US NFP is in the spotlight
To get clarity about US labor market health, investors will keep an eye on the US Nonfarm Payrolls (NFP) data. Considering the upbeat release of upbeat US Automatic Data Processing (ADP) Employment Change (May), which showed an addition of 278K jobs, significantly higher than the estimates of 170K, US NFP could be solid too.
Analysts at SocGen believe job growth is moderating, yet the pace remains strong. They predict a 210K advance in May NFP, and the Unemployment Rate holding at the 3.4% low. On wages, THEY expect a more modest 0.2% MoM increase.
"The US Senate will vote on a bill to suspend the US government's $31.4 trillion debt ceiling on Thursday night," per Senate Majority Leader Chuck Schumer reported Reuters.
“Senate reaches agreement on debating 11 amendments before final vote on debt limit bill,” adds US Senate Majority Leader Schumer.
It should be noted that the bill passed the House on Wednesday and needs to successfully through the Senate and reach US President Joe Biden for being a law before the looming June 05 deadline to avoid the US default.
Previously, chatters surroudning some Senators pushing Chuck to delay the process were making rounds and probed the optimism.
Also read: Forex Today: The rally is finally here, and the Dollar knows it
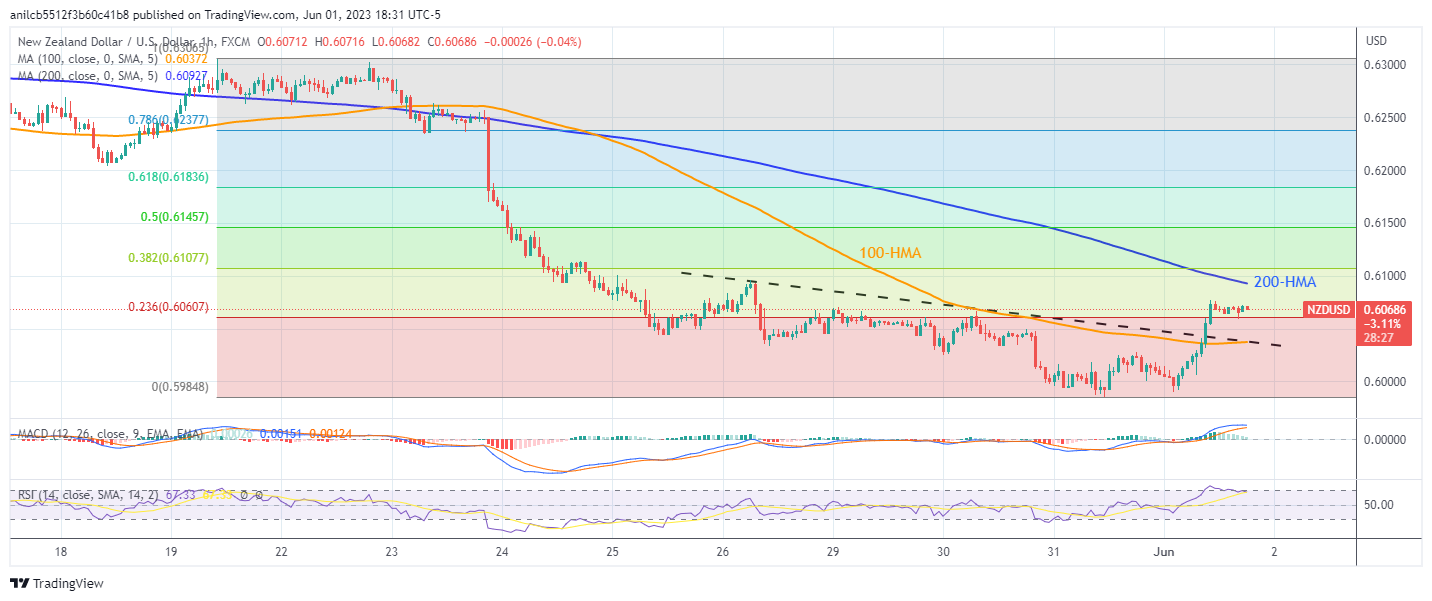
- NZD/USD remains sidelined after refreshing weekly top on crossing the key hurdles, now support.
- Convergence of 100-HMA, one-week-old descending trend line restricts immediate downside.
- NZ Q1 Terms of Trade Index drops, US NFP awaited amid softer US Dollar, easing Fed bets.
NZD/USD buyers take a breather at the weekly top surrounding 0.6070 as downbeat New Zealand (NZ) data prods upside momentum during early Friday in Asia. Also challenging the Kiwi pair buyers is the cautious mood ahead of the key US employment releases.
That said, the NZ Terms of Trade Index for the first quarter (Q1) of 2023 marches -1.5% market expectations versus 1.8% previous readings. Additionally, forecasts surrounding the US Nonfarm Payrolls (NFP) to ease to 190K from 253K prior while the Unemployment Rate is also expected to increase to 3.5% from 3.4%.
Also read: NZD/USD surges above 0.6050 amid US Dollar weakness
Technically, NZD/USD remains firmer after crossing a convergence of the 100-Hour Moving Average (HMA) and the one-week-old previous resistance line, around 0.6535-30 by the press time.
The upside momentum gains support from the bullish MACD signals but the RSI (14) line appears overbought and hence the Kiwi pair buyers may witness challenges in keeping the reins.
With this, the 200-HMA hurdle of around 0.6095, quickly followed by the 0.6100 round figure, can restrict the immediate upside of the NZD/USD pair.
Following that, 50% and 61.8% Fibonacci retracement levels of the pair’s May 19-31 downturn, respectively near 0.6145 and 0.6185, as well as the 0.6200 threshold, could probe the NZD/USD bulls before giving them control.
On the flip side, a clear break of the 0.6035-30 support confluence becomes necessary for the NZD/USD bear’s return. Even so, the 0.6000 psychological magnet and the previous monthly low of around 0.5985 can check the pair sellers.
NZD/USD: Hourly chart
Trend: Limited upside expected
- USD/CHF is expected to extend its downside journey towards 0.9050 amid dovish Fed Harker commentary.
- Fed Harker is confident that there will be no recession in the US economy.
- SNB Jordan is committed to bringing inflation back below 2% as soon as possible as he sees inflation risks higher than deflation.
The USD/CHF pair is in a declining stage in early Asia and is expected to drop further toward the crucial support of 0.9050. The Swiss Franc asset witnessed a steep fall after dovish commentary from Federal Reserve (Fed) policymakers.
S&P500 futures have added some gains in Asia after a bullish Thursday, portraying a risk-appetite theme. Fed policymakers’ dovish commentary infused fresh blood into risk-perceived assets and weighed heavily on the US Dollar Index (DXY).
The US Dollar Index (DXY) is gauging an intermediate support around 103.50 after an intense sell-off move. Philadelphia Federal Reserve Bank President Patrick Harker stated on Thursday that he believes it is time for the central bank to 'hit the stop button' for at least one meeting, reiterating his comments from Wednesday about a potential pause at the next meeting. Harker argued that such a move would be prudent at this time.
Regarding economic outlook, Fed Harker is confident that there will be no recession in the United States economy, however, a significant deterioration in the labor market cannot be ruled out.
Going forward, the release of the US Nonfarm Payrolls report will provide more clarity about the Employment status. Analysts at Danske Bank stated “We expect to see another relatively upbeat US Jobs Report. So far the signals from leading data have pointed towards healthy employment growth, which could be further supported by a renewed uptick in labor force participation. We think NFP grew by a solid 200K.”
On the Swiss Franc front, annual Real Retail Sales (April) contracted significantly by 3.7% while the street was anticipating a contraction of 1.4%, and previous data was contracted by 1.9%. On Wednesday, Swiss National Bank (SNB) Chairman Thomas Jordan cited that they have to bring inflation back below 2% as soon as possible and noted that he sees inflation risks higher than deflation in the future, due to deglobalization.
- USD/CAD seesaws at the lowest levels in two weeks after falling the most in a month.
- US Dollar weakness joins Oil price run-up to favor Loonie pair sellers.
- Cautious mood ahead of top-tier data prods USD/CAD traders.
- US NFP, debt ceiling debate in Senate eyed for clear directions.
USD/CAD aptly portrays the pre-data anxiety while making rounds to 1.3450 amid early Friday in Asia, at the lowest levels in two weeks by the press time. That said, the Loonie pair dropped the most in one month the previous day amid broad US Dollar weakness and firmer prices of Canada’s key export item, namely the WTI crude oil. However, anxiety ahead of the monthly US jobs report and passage of the US debt-ceiling deal seems to prod the pair sellers of late.
US Dollar Index (DXY) seesaws around 103.56 after a 0.65% daily fall marked on Thursday, the most in a month, to reverse from the highest levels since mid-March. That said, the United States Treasury bond yields also refreshed the weekly lows as the market’s pricing of the Fed rate hike dropped. Adding strength to the DXY could be mixed US data and receding hopes of a faster Fed rate hike, as well as firmer data from China and passage of the US debt ceiling agreement in the US House of Representatives.
Talking about the data, US ADP Employment Change eased to 278K in May from 291K prior (revised) but crossed the 170K market forecasts. On the same line, the weekly Initial Jobless Claims rose past 230K prior to 232K, versus 235K expected. Further, US ISM Manufacturing PMI eased to 46.9 in May compared to 47.0 anticipated and 47.1 previous readings whereas S&P Global Manufacturing PMI softened to 48.4 from 48.5 prior. Additionally, the US Employment Cost Index eased while the consumer sentiment gauge improved but the details were unimpressive.
On the other hand, the market’s pricing of the Federal Reserve (Fed) rate hike dropped, from 17 basis points (bps) in June on Wednesday to 7 bps on Thursday, which in turn weighed on the US Dollar and pleased the USD/CAD bears. It should be noted that the Federal Reserve Bank of St. Louis President James Bullard recently published an analysis wherein the Fed hawk accepts that the prospects for continued disinflation are good but not guaranteed, and continued vigilance is required.
Elsewhere, WTI crude oil rose the most in a month the previous day while snapping a two-day downtrend to end the day with over 3.0% daily gains to around $70.00, close to $70.15 by the press time. In doing so, the black gold cheers softer US dollars while ignoring a surprise build in the weekly inventories reported by the US Energy Information Administration (EIA). It should be noted that the concerns about no additional supply cuts from the OPEC+ also should have weighed the energy benchmark but did not.
Amid these plays, Wall Street closed in the green while the yields were down and technology shares were up, which in turn allowed the USD/CAD to remain depressed ahead of the top-tier data/events.
Looking ahead, monthly US employment clues and the last round of the Fed talks ahead of the pre-Federal Open Market Committee (FOMC) blackout period for policymakers will be eyed closely for clear directions. Forecasts suggest the headline Nonfarm Payrolls (NFP) to ease to 190K from 253K prior while the Unemployment Rate is also expected to increase to 3.5% from 3.4%.
Technical analysis
An impending “death cross” on the daily chart, a condition where the 50-DMA pierces the 200-DMA from above and suggests further downside of the Loonie pair, keeps the USD/CAD sellers hopeful unless the quote rises past 1.3510.
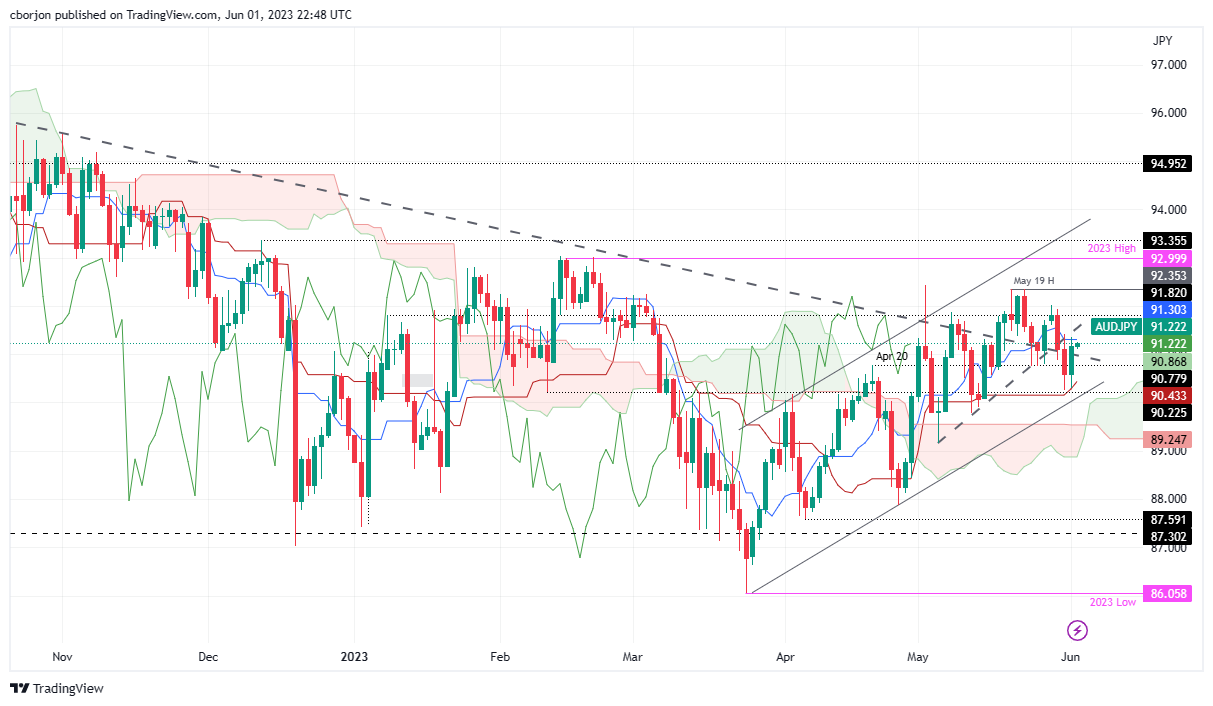
- AUD/JPY climbs from the Kijun-Sen support line, driven by risk appetite.
- The emergence of a two-candle bullish harami pattern suggests further upside, yet resistance at the Tenkan-Sen line and May highs remain key hurdles.
- If the AUD/JPY drops to challenge support at around 91.10-91.00, followed by the Kijun-Sen line and a support trendline around 90.00.
AUD/JPY climbs after finding support around the Kijun-Sen line at 90.53, rising above the 91.00 figure, sponsored by traders’ appetite for riskier assets. Federal Reserve officials opening the door for a pause is the main reason behind the AUD/JPY uptrend. As the Asian session begins, the AUD/JPY is trading at 91.21.
AUD/JPY Price Analysis: Technical outlook
The AUD/JPY daily chart still shows the pair as neutral biased, of late clinging to the Tenkan-Sen price level. Should be said that a two-candle bullish harami pattern emerged, warranting further upside expected, but on its way north, buyers of the AUD/JPY cross-currency pair must hurdle some resistance levels.
The first would be the Tenkan-Sen line at 91.30, followed by the May 29 high at 92.01. A breach of the latter will expose the May 19 swing high at 92.35, followed by the year-to-date (YTD) high of 92.99.
Conversely, the AUD/JPY must dive below a seven-month-old downslope resistance trendline, turning support at 91.10-91.00. If AUD/JPY breaks below that area, the next support would be the Kijun-Sen line at 90.43, ahead of testing a support trendline that passed at around the 90.00 figure. Once cleared, the next support would be the top of the Ichimoku Cloud at 89.55.
AUD/JPY Price Action – Daily chart
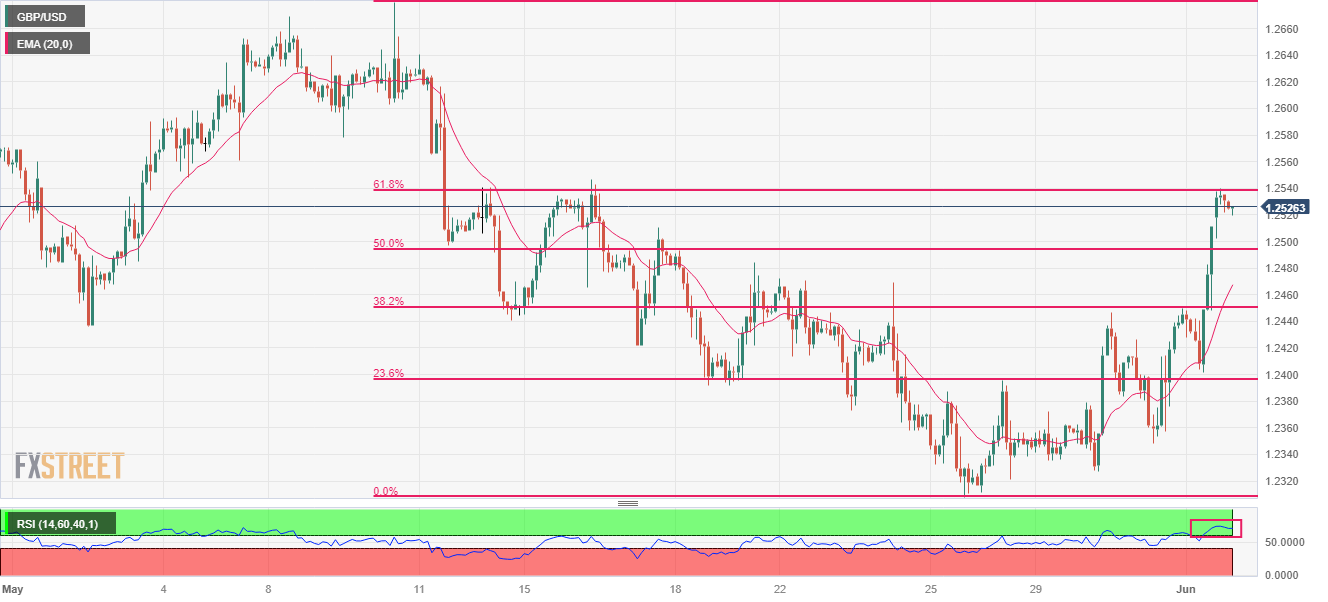
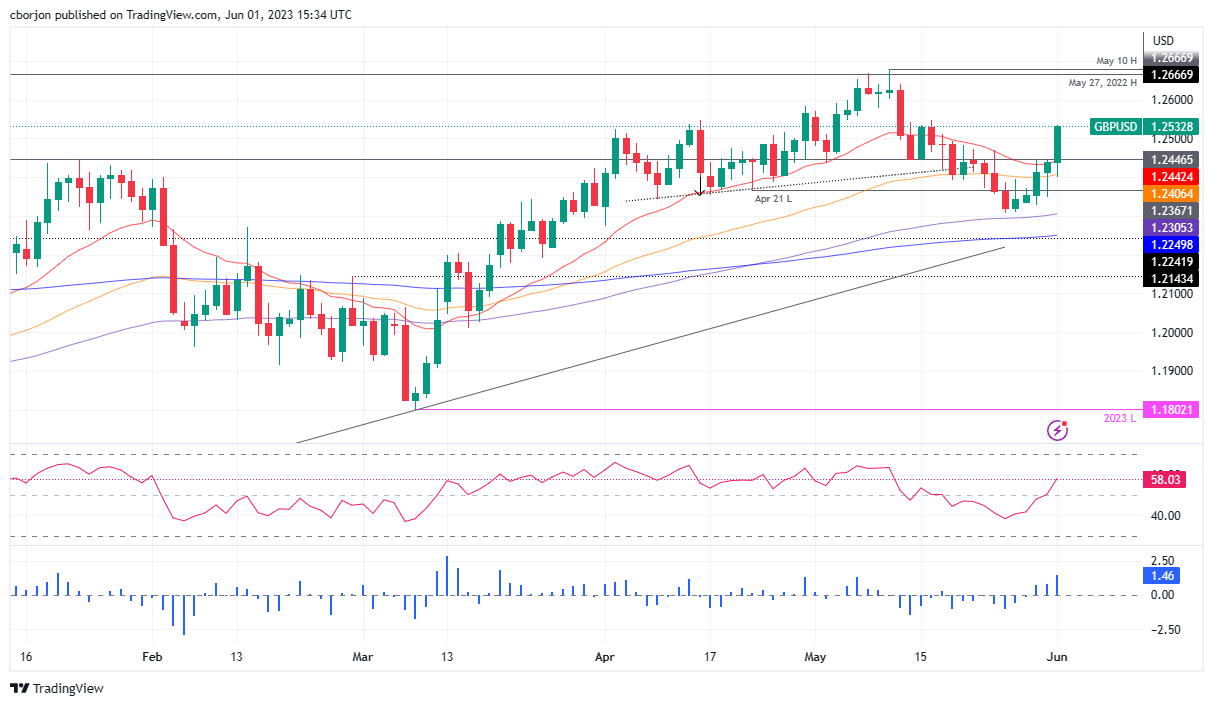
- GBP/USD is juggling in a narrow range above 1.2500 ahead of the US NFP data.
- Fed policymakers are divided over contracting US Manufacturing PMI vs. tight labor market conditions.
- GBP/USD is gathering strength for a breakout above the 61.8% Fibo retracement at 1.2539.
The GBP/USD pair is oscillating after a stalwart rally above the psychological resistance of 1.2500 in the early Tokyo session. The Cable has turned sideways as investors are confused that whether Federal Reserve (Fed) policymakers will focus on consistently contracting United States ISM Manufacturing PMI or tight labor market conditions while designing the monetary policy for June month.
On Thursday, the US ISM reported a seventh straight contraction in US factory activity due to higher interest rates while the Automatic Data Processing (ADP) agency reported an addition of 278K fresh payrolls against the consensus of 170K.
The US Dollar Index (DXY) showed a vertical fall after surrendering the crucial support of 104.00 and has now extended its downside below 103.60, at the time of writing.
GBP/USD is gathering strength for a breakout above the 61.8% Fibonacci retracement (plotted from May 10 high at 1.2680 to May 25 low at 1.2308) at 1.2539 on a two-hour scale.
Upward-sloping 20-period Exponential Moving Average (EMA) at 1.2468 indicates that the short-term trend is extremely bullish.
Also, the Relative Strength Index (RSI) (14) is oscillating in the bullish range of 60.00-80.00, which signals the bullish momentum has already been triggered.
For further upside, a confident break above May 16 high at 1.2547 will drive the Cable toward May 10 low at 1.2603 followed by May 10 high at 1.2680.
On the flip side, a breakdown below May 12 low at 1.2440 will drag the asset toward a 23.6% Fibo retracement near 1.2400 and May 31 low at 1.2348.
GBP/USD two-hour chart
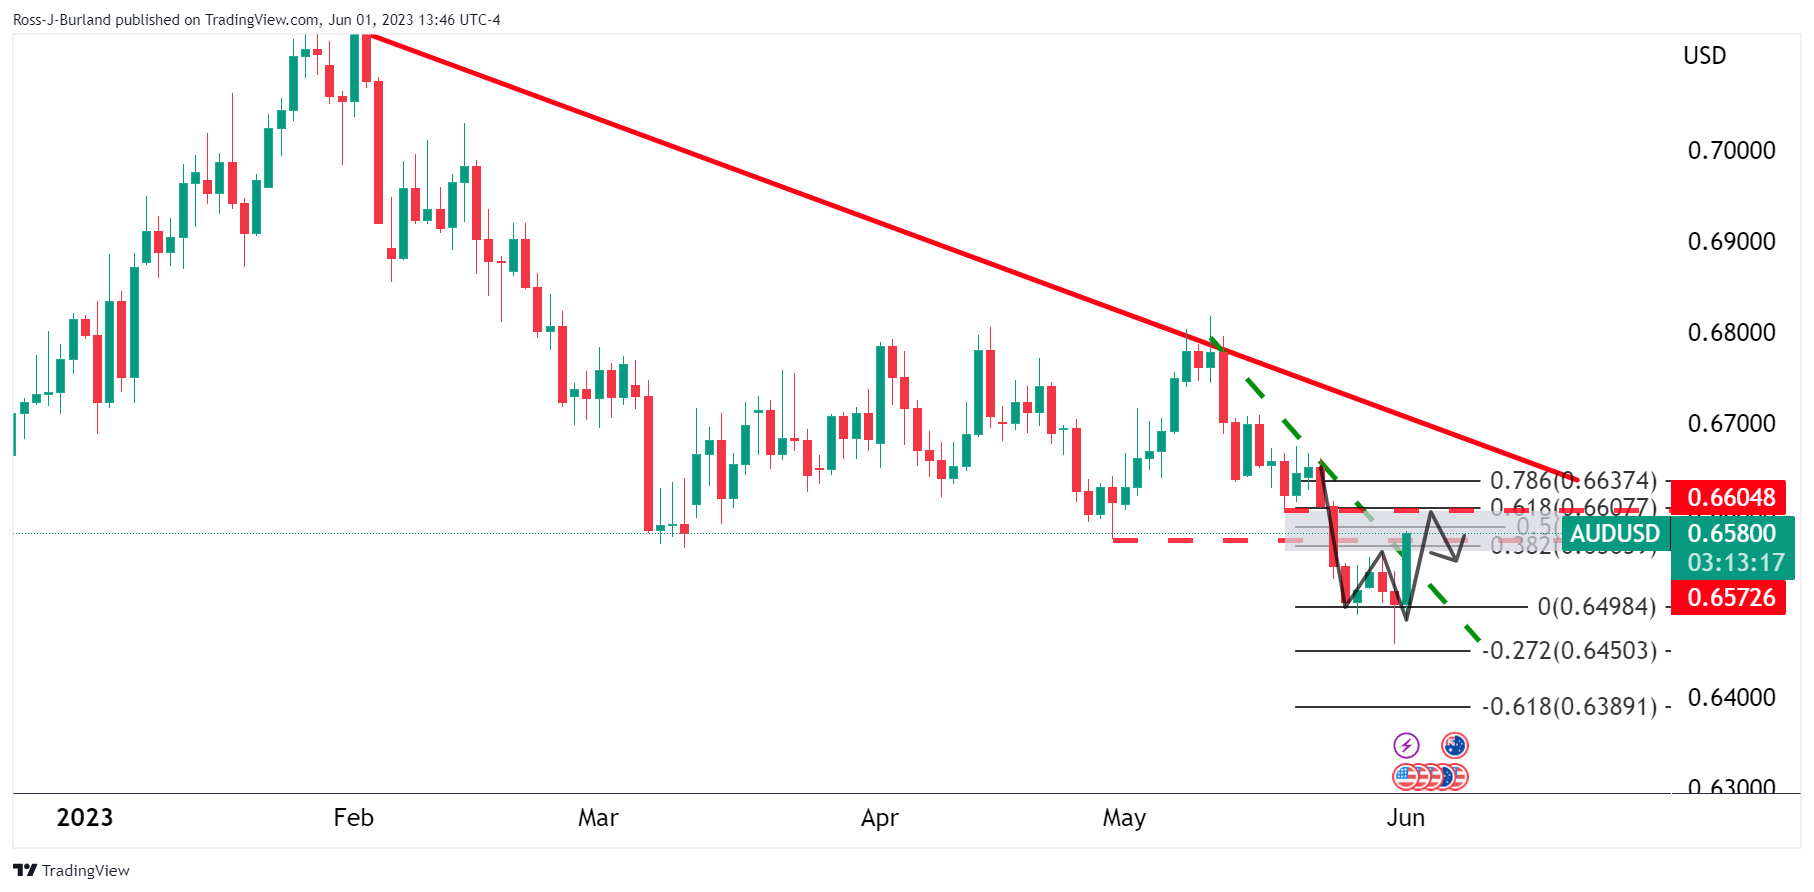
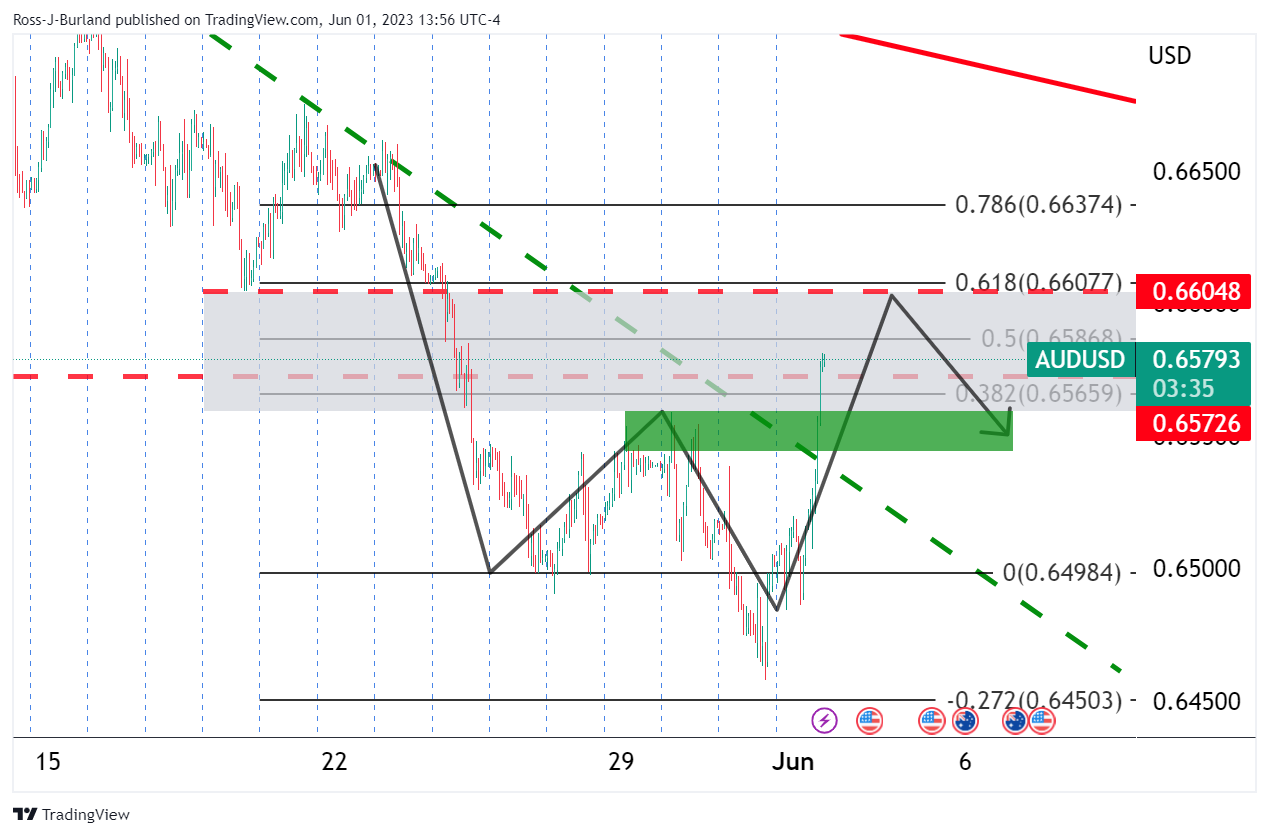
- AUD/USD grinds higher after rising the most in seven weeks.
- Broad US Dollar weakness, upbeat market sentiment and firmer China data underpin Aussie pair’s latest advances.
- Australia Fair Work Commission’s (FWC) Annual Wage Review, US Nonfarm Payrolls (NFP) eyed for clear directions.
AUD/USD buyers take a breather at the weekly top, making rounds to 0.6565-75 after rising the most in seven weeks the previous day. That said, the Aussie pair cheered the broad US Dollar weakness and upbeat catalysts from the biggest customer China the previous day to post a stellar run-up. However, the cautious mood ahead of top-tier data/events prods the risk-barometer pair during the early hours of Friday’s Asian session.
The US Dollar Index (DXY) dropped the most in a month to reverse from the highest levels since mid-March whereas the United States Treasury bond yields also refreshed the weekly lows as the market’s pricing of the Fed rate hike drops. Adding strength to the DXY could be mixed US data and receding hopes of a faster Fed rate hike, as well as firmer data from China and passage of the US debt ceiling agreement in the US House of Representatives.
On Thursday, US ADP Employment Change eased to 278K in May from 291K prior (revised) but crossed the 170K market forecasts. On the same line, the weekly Initial Jobless Claims rose past 230K prior to 232K, versus 235K expected. Further, US ISM Manufacturing PMI eased to 46.9 in May compared to 47.0 anticipated and 47.1 previous readings whereas S&P Global Manufacturing PMI softened to 48.4 from 48.5 prior. Additionally, the US Employment Cost Index eased while the consumer sentiment gauge improved but the details were unimpressive.
Following that, Federal Reserve Bank of St. Louis President James Bullard recently published an analysis wherein the Fed hawk accepts that the prospects for continued disinflation are good but not guaranteed, and continued vigilance is required.
Apart from the United States data and receding Fed bets, the passage of the agreement to avoid the US default also underpins the market’s optimism and favors the AUD/USD Price. On the same line could be the upbeat China data, due to the dragon nation’s business ties with Australia.
Further, the US Republican-controlled House of Representatives recently passed the debt-ceiling bill and favored the market’s optimism as the ruling Democrats dominate in the Senate and can easily avoid the default now. It’s worth noting that the upbeat China Caixin Manufacturing PMI adds strength to the AUD/USD’s upside momentum. It should be noted that China’s Caixin Manufacturing PMI rose beyond the 50.0 level for the first time in three months while suggesting an increase in activities. That said, the private manufacturing gauge rose to 50.9 versus 49.5 expected and prior.
Against this backdrop, Wall Street closed in the green while the yields were down and technology shares were up, which in turn allowed the AUD/USD to remain firmer ahead of the top-tier data/events.
Among them, Australia’s Fair Work Commission’s (FWC) Annual Wage Review and the monthly US employment clues, as well as the last round of the Fed talks ahead of the pre-Federal Open Market Committee (FOMC) blackout period for policymakers will be eyed closely for clear directions. Should the Aussie wages increase and the US jobs report offers no major positive surprise, the AUD/USD can stay on the front foot.
Technical analysis
A daily closing beyond the three-week-old previous resistance line, now immediate support around 0.6525, directs the AUD/USD bulls towards the 21-DMA hurdle of around 0.6630.
- USD/MXN tumbles by 0.78%, underpinned by Banxico’s hawkish stance on maintaining higher interest rates, countering mixed US economic data.
- US manufacturing activity slows, with ISM PMI signaling a recessionary trend; the job market remains tight despite a surge in private hiring.
- Federal Reserve officials hint at bypassing June’s rate hike, while Bank of Mexico signals holding record-high interest rates for at least two more meetings.
USD/MXN dropped sharply, as the Mexican Peso (MXN) was bolstered by hawkish remarks by Bank of Mexico (Banxico) policymakers, while its minutes show the central bank’s commitment to hold rates higher. Furthermore, mixed economic data from the United States (US) hit the greenback, with the US Dollar (USD) registering its biggest daily loss since May 3. The USD/MXN is trading at 17.5444, down 0.78%.
Mexican Peso bolstered by Banxico’s stance on rates; US Dollar registers biggest daily loss since May 3 as manufacturing activity slows
Wall Street began June on the front foot, with gains spurred by the AI frenzy. The financial markets narrative shifted towards the economy after the US debt-ceiling issue was solved, though pending approval by the US Senate.
Delving into the USD/MXN, economic data from the US showed that manufacturing activity in May slowed, with the ISM PMI coming at 46.9, below forecasts, and April’s 47.1 – a recessionary signal, falling for a seven-straight month. Aside from this, the US Department of Labor revealed that unemployment claims for the week ending May 27 edged lowered, at 232K beneath estimates but exceeding the prior’s week release.
Further labor data showed that private hiring crushed April’s data, as demonstrated by the ADP Report, indicating that the economy added 278K jobs, surpassing 170k estimates, but lagged April’s 291K. This underlines a tight labor market.
Switching to central bank speakers, Federal Reserve officials led by Patrick Harker emphasized his stance for skipping June’s rate hike and commented that it’s time to hit the stop button at least for one meeting.
In the meantime, Banxico’s latest meeting minutes showed that inflation and inflationary pressures were easing but remained high at a meeting where the central bank held rates unchanged at 11.25%, which has put the carry trade in play and the minutes highlighted comments made on Wednesday that rates would remain on hold for “an extended period.”.
Meanwhile, Bank of Mexico officials led by Governor Victoria Rodriguez Ceja will hold interest rates at a record-high for at least the next two meetings before considering easing, she said.
USD/MXN Technical Levels
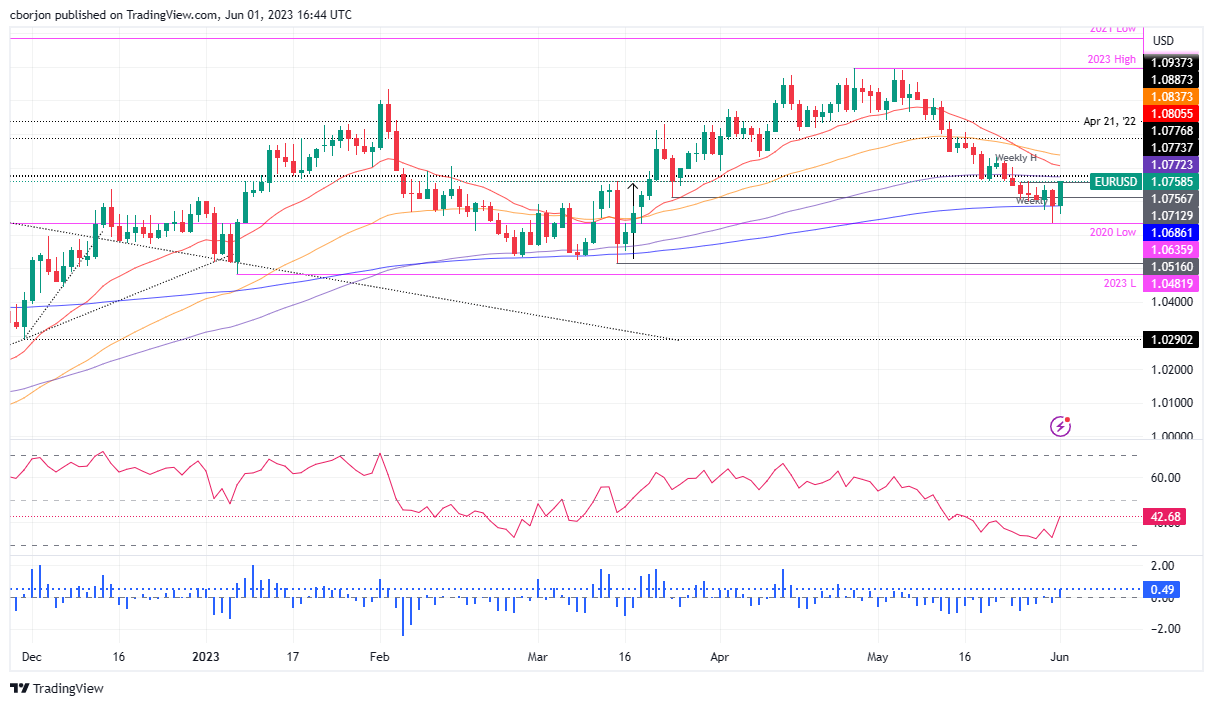
- EUR/USD is looking to shift its auction profile above 1.0760 amid weakness in the USD index.
- This could be a tug of war for the Fed as tight labor market conditions advocate for more rate hikes while contracting factory activities favor a pause.
- Lower-than-anticipated Eurozone inflation has deepened the debate over the interest rate hike by the ECB.
The EUR/USD pair has turned sideways after a massive rally to near 1.0760 in the early Asian session. The major currency pair is looking to shift its auction above the aforementioned resistance as the US Dollar Index (DXY) is going through a declining phase after printing a fresh 10-week high above 104.60.
S&P500 ended Thursday’s session with solid gains after the release of downbeat United States ISM Manufacturing PMI data (May). Investors’ risk appetite is extremely solid, however, confusion about interest rate guidance by the Federal Reserve (Fed) has deepened.
On Thursday, the US ISM Manufacturing PMI remained downbeat. The Manufacturing PMI landed consecutively for the seventh time below 50.0, which is a threshold figure that separates expansion from contraction. The economic data landed at 46.9 from the downwardly revised figure of 47.0. Also, the New Orders Index that indicates forward demand dropped significantly to 42.6 vs. the estimates of 44.9. It seems that higher interest rates by the Fed and tight credit conditions have forced firms to operate with lower capacity. Also, individuals are struggling to avail credit for core goods.
While US Automatic Data Processing (ADP) Employment Change (May) showed an addition of 278K jobs, significantly higher than the estimates of 170K. This could be a tug of war for Fed policymakers as tight labor market conditions advocate for more interest rate hikes while consistently contracting factory activities favor a pause this month.
On the Eurozone front, lower-than-anticipated preliminary inflation for May has deepened debate over an interest rate hike by the European Central Bank (ECB) for June month. ECB President Christine Lagarde is expected to raise interest rates by 25 basis points (bps) as core inflation is still persistent.
- Gold Price eyes first weekly gain in four amid downbeat United States Treasury bond yields, US Dollar.
- Market’s cautious optimism about US debt ceiling deal’s passage through Congress, easing hawkish Federal Reserve bets favor XAU/USD bulls.
- US Nonfarm Payrolls (NFP), Unemployment Rate need to portray tight job markets to prod the Gold Price.
Gold Price (XAU/USD) remains on the front foot at the weekly high, making rounds to $1,975-77 amid early Asian session on Friday following the two-day uptrend. With this, the yellow metal braces for the first weekly gains in four amid broad weakness in the United States Treasury bond yields and US Dollar. While trading the main catalysts, the market’s expectations of witnessing the Federal Reserve’s (Fed) rate hike pause in June gain major attention. Adding strength to the XAU/USD upside is the passage of the US debt-ceiling deal through the House of Representatives and the mixed US data. Furthermore, the upbeat China PMI also favored the Gold buyers.
Moving on, Gold traders should wait for the United States monthly employment report and Fed talks, as well as chatters about US default, for fresh clues.
Gold Price rises amid downbeat Federal Reserve bets
Gold Price grinds higher around the weekly top as the market’s pricing of the Federal Reserve (Fed) rate hike drops, from 17 basis points (bps) in June on Wednesday to 7 bps on Thursday. Behind the latest move could be the mixed United States data and a lack of strong hawkish comments from the Fed Officials.
On Thursday, US ADP Employment Change eased to 278K in May from 291K prior (revised) but crossed the 170K market forecasts. On the same line, the weekly Initial Jobless Claims rose past 230K prior to 232K, versus 235K expected. Further, US ISM Manufacturing PMI eased to 46.9 in May compared to 47.0 anticipated and 47.1 previous readings whereas S&P Global Manufacturing PMI softened to 48.4 from 48.5 prior. Additionally, the US Employment Cost Index eased while the consumer sentiment gauge improved but the details were unimpressive.
Elsewhere, Federal Reserve Bank of St. Louis President James Bullard recently published an analysis wherein the Fed hawk accepts that the prospects for continued disinflation are good but not guaranteed, and continued vigilance is required.
Hence, with the mixed US data and downbeat Fed talks, the market players rush toward the Gold in search of higher returns.
Passage of US debt-ceiling deal, China data also favor XAU/USD bulls
Apart from the United States data and receding Fed bets, the passage of the agreement to avoid the US default also underpins the market’s optimism and favors the Gold Price. On the same line could be the upbeat China data, due to the dragon nation’s status as one of the world’s biggest XAU/USD consumers.
US Republican-controlled House of Representatives recently passed the debt-ceiling bill and favored the market’s optimism as the ruling Democrats dominate in the Senate and can easily avoid the default now. It’s worth noting that the upbeat China Caixin Manufacturing PMI adds strength to the XAU/USD’s upside momentum. It should be noted that China’s Caixin Manufacturing PMI rose beyond the 50.0 level for the first time in three months while suggesting an increase in activities. That said, the private manufacturing gauge rose to 50.9 versus 49.5 expected and prior.
It’s worth noting that the US Dollar Index (DXY) dropped the most in a month to reverse from the highest levels since mid-March whereas the United States Treasury bond yields also refreshed the weekly lows to underpin the Gold Price upside.
All eyes on the United States Nonfarm Payrolls
Looking forward, the US employment clues and the last round of the Fed talks ahead of the pre-Federal Open Market Committee (FOMC) blackout period for policymakers will be eyed closely for clear directions of the Gold price.
Forecasts suggest the headline Nonfarm Payrolls (NFP) to ease to 190K from 253K prior while the Unemployment Rate is also expected to increase to 3.5% from 3.4%. Given the downbeat market expectations, any positive surprise could allow the XAU/USD to pare the weekly gains.
Also read: US May Nonfarm Payrolls Preview: Analyzing Gold price's reaction to NFP surprises
Gold Price technical analysis
Gold price extends recovery from the 100-DMA and a seven-month-old ascending support line, around $1,940 by the press time, to approach the 50-DMA hurdle surrounding $1,992.
Not only the U-turn from the key support line and DMA but a clear upside break of the previously important resistance line stretched from early May also keeps the XAU/USD buyers hopeful.
On the same line, the upbeat Relative Strength Index (RSI) line, placed at 14, as well as the receding bearish bias of the Moving Average Convergence and Divergence (MACD) indicator, add strength to the upside expectations of the Gold price.
That said, the 50-DMA breakout needs validation from the $2,000 round figure before approaching multiple resistances near $2,050.
Meanwhile, a convergence of the 100-DMA, the resistance-turned-support line and a multi-day-old rising trend line, near $1,938-40, appears an important challenge for the XAU/USD bears to conquer to regain control.
Following that, the Gold price south-run toward the peaks marked in early February and March, around $1,890 and $1,858 can’t be ruled out.
To sum up, the Gold Price appears well-set to recapture the $2,000 round figure.
Gold price: Four-hour chart
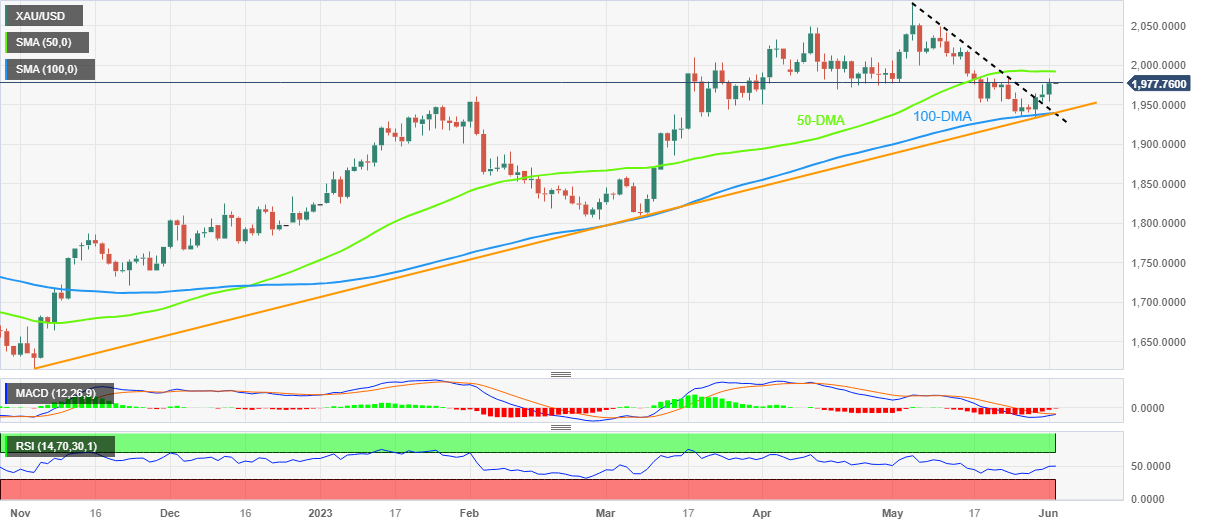
Trend: Limited upside expected
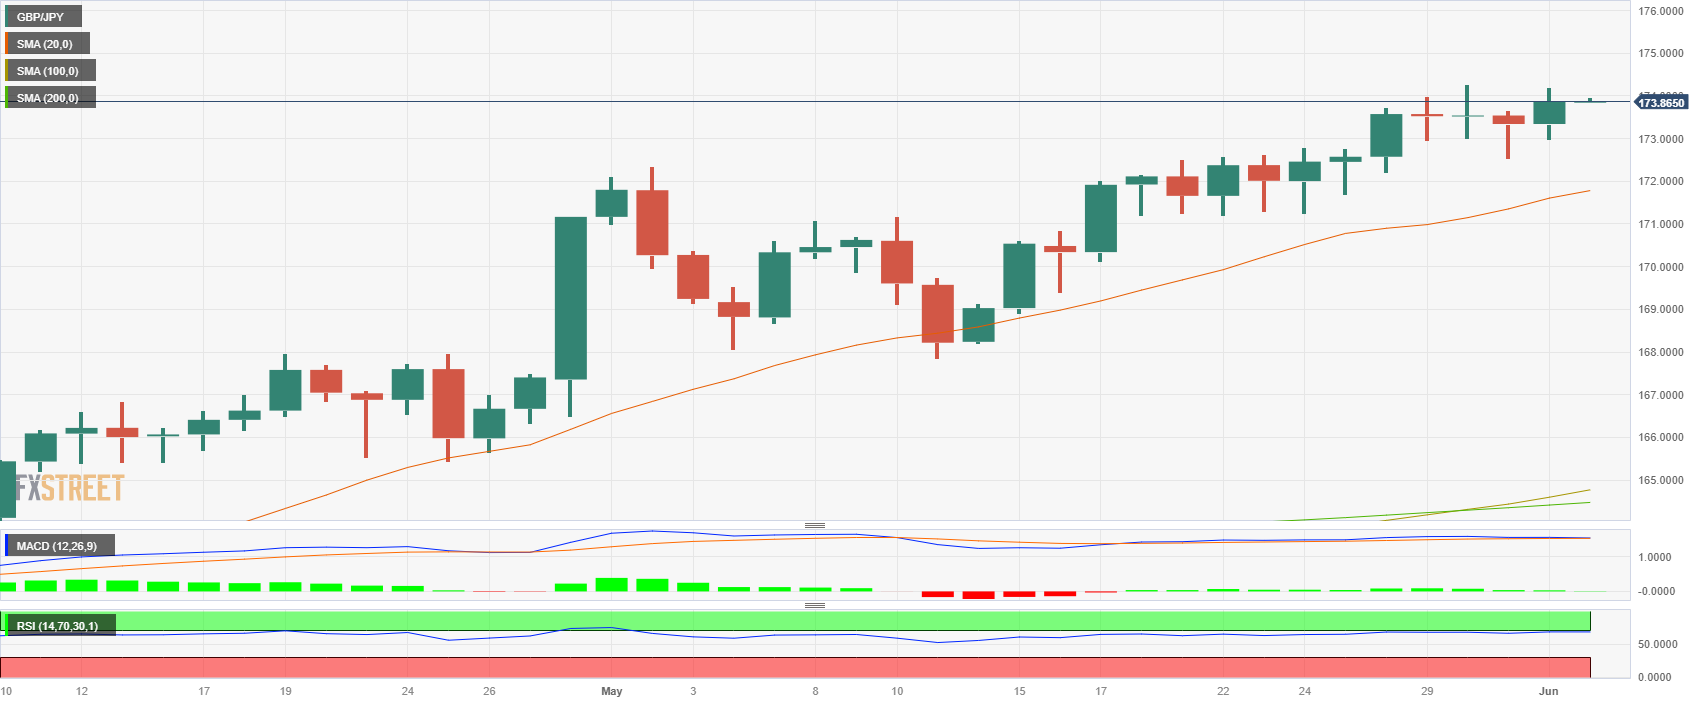
- GBP/JPY closed at its highest level since 2016 and reached overbought conditions
- UK’s S&P May’s Manufacturing PMI came in at 47.1 vs 46.9 expected
- The Yen weakened against its major rivals
The GBP/JPY traded with gains around the 173.80 area in Thursday’s session. The Sterling Pound strengthened against its major rivals while the Japanese Yen weakened against the Euro, Swiss and the Australian Dollar. In addition, upbeat manufacturing PMI from the UK and yield divergence between the British and Japanese yields seem to propel the pair.
Yield divergence favors the Sterling
The British yields are on the upswing. The 10-year bond yield reached 4.16% and exhibited a gain of 0.86%. The 2-year yield stands at 4.32% with an increase of 0.32%, while the 5-year yield is at 4.09% having increased 0.86%. In contrast, the Japanese yields experienced a downturn across the curve, with the 2 and 5-year rates seeing losses of more than 5% applying further pressure on the pair.
For Friday’s session, both British and Japanese economic calendars will remain empty and attention should turn to the US Nonfarm Payrolls from May. It may have an impact on the expectations for the upcoming June 13-14 Federal Reserve (Fed) meeting.
Levels to watch
According to the daily chart, the GBP/JPY holds a bullish outlook for the short term as the Relative Strength Index (RSI) and Moving Average Convergence Divergence (MACD) suggest that the buyers are in control while the pair trades above its main moving averages. However, the near overbought conditions of the pair may suggest a technical correction in the upcoming session.
The 172.50 zone is key for GBP/JPY to maintain its upside bias. If breached, we could see a more pronounced decline towards the psychological mark at 172.00 and 171.55 area where the 20-day Simple Moving Average (SMA) stands. Conversely, resistances line up at the 174.00 followed by the 174.30 and the 174.50 zone.
- The US Dollar bears are taking advantage of the less hawkish sentiment around the Fed.
- USD/JPY bulls are waiting in the flanks.
- The pair is meeting a key demand area on the charts.
USD/JPY was on the offer on Thursday with the US Dollar on track for its worst daily loss in nearly a month. US manufacturing data and comments by Federal Reserve officials struck a chord with the bears surrounding the expectations that the Federal Reserve will likely skip an interest rate hike later this month.
Technically, the price is now entering a demand area while could see a reversal as we move into the Nonfarm Payrolls event on Friday.
USD/JPY daily chart
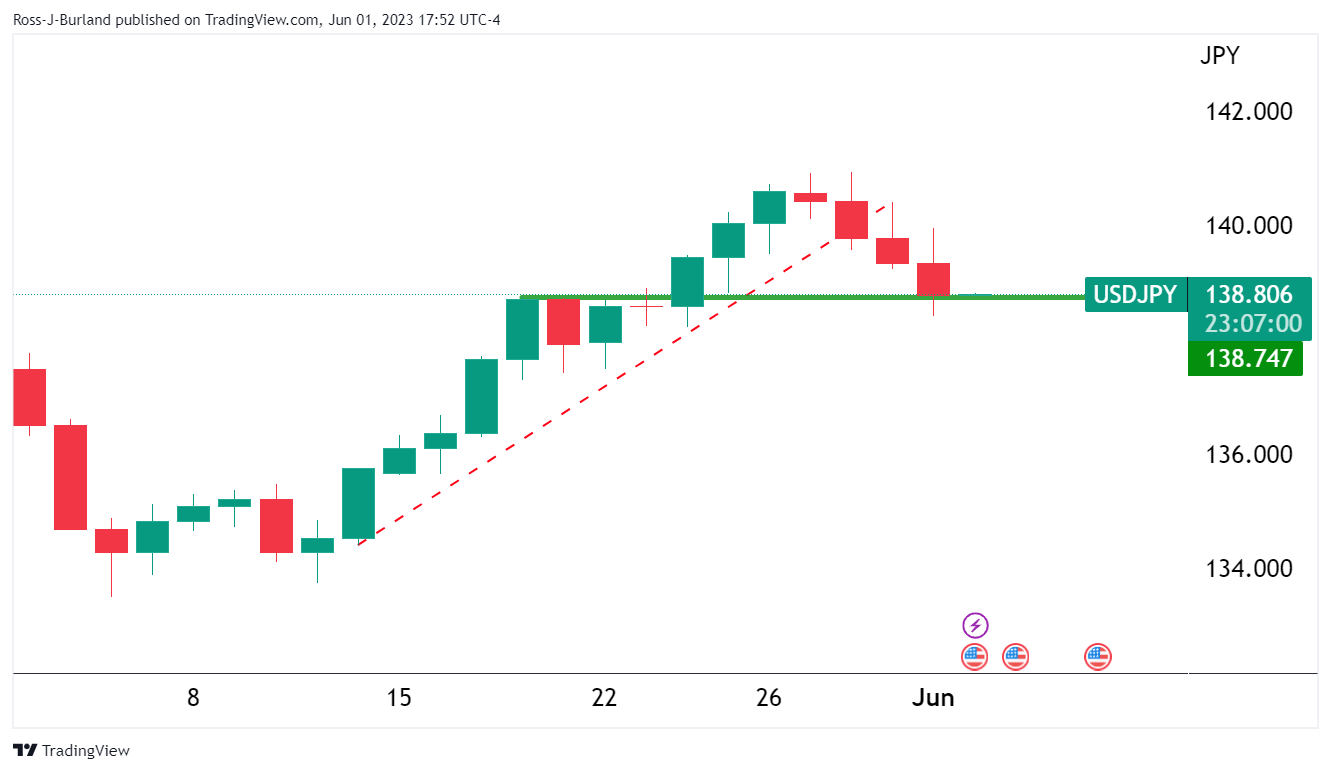
Bulls are lurking in the 138 area with eyes on a move up towards prior support in the 139.50s. However, while the price is on the front side of the trendline resistance, the focus remains a fade on rallies. With that being said, the NFP data will be key.
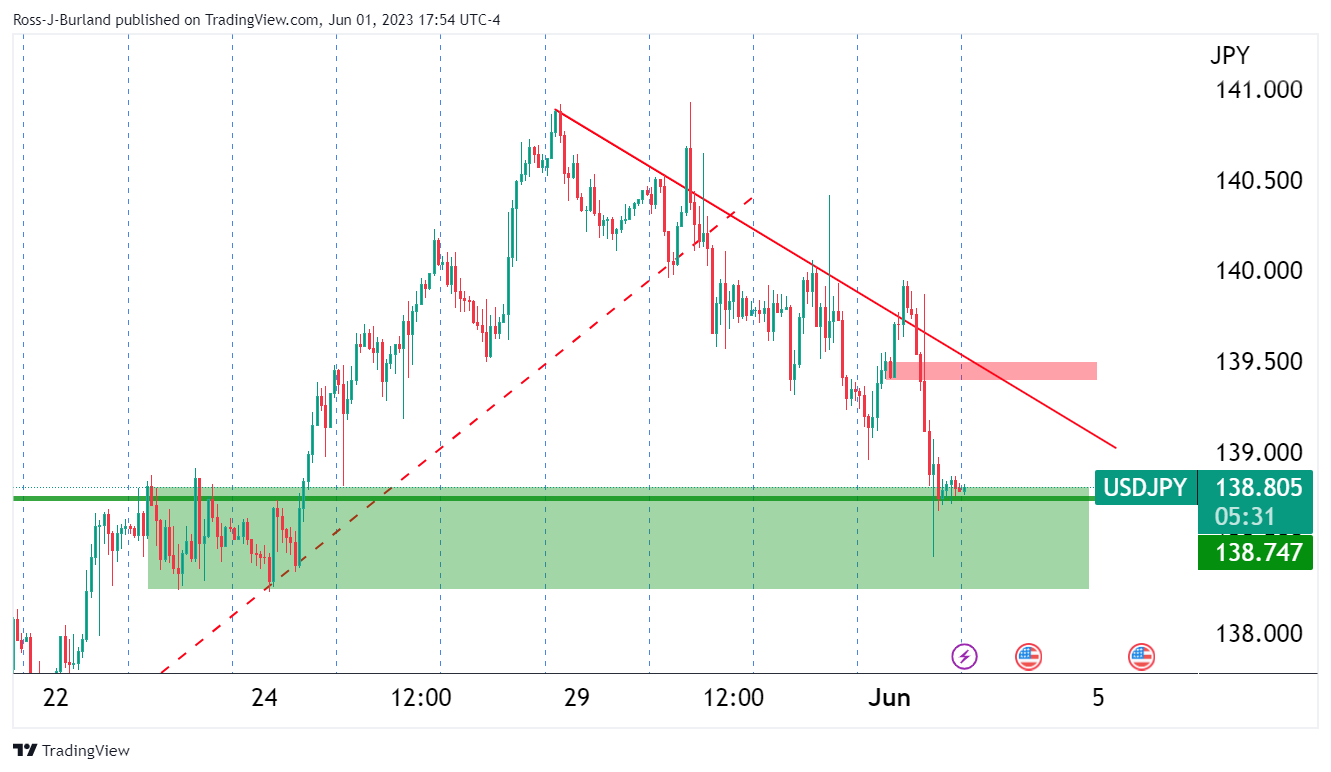
H1 chart:
During the Asian session, Australia released its April Home Loan data. The key report of the day will be the US Nonfarm Payroll. The US dollar remains under pressure amid falling expectations of a rate hike from the Fed and improvement in market sentiment.
Here is what you need to know on Friday, June 2:
On Thursday, US stocks rose amid an improvement in market sentiment, helped by Chinese data and the resolution of the debt-limit drama. The US dollar tumbled across the board as US yields dropped. Economic data from the US showed a still-vigorous labor market, a slowdown in inflation, and weak manufacturing activity. The mixed numbers led to an increase in bets of a Federal Reserve pause at the June meeting and rate cuts by year-end.
- US: ISM Manufacturing PMI drops to 46.9 in May vs. 47 expected
- US: Unit Labor Costs rise by 4.2% in Q1 vs. 6% expected
- US: Weekly Initial Jobless Claims rise to 232K vs. 235K expected
The US Dollar Index suffered its worst decline in months, falling from 104.50 to 103.50. The US 10-year yield dropped for the fifth consecutive day, settling at 1.59%, the lowest since May 18. On Friday, the May jobs report is due, with consensus pointing to an increase in payroll by 190K, compared to 253K in April. These numbers will be closely watched. Even a positive report may not help the Dollar if upbeat sentiment continues to prevail.
Nonfarm Payrolls Preview: Banks expect labor market to lose momentum only slowly
EUR/USD extended its rebound from monthly lows, breaking above 1.0750. Eurozone inflation numbers point to a slowdown in inflation. However, ECB President Lagarde said that more rate hikes are on the way.
A comment from Commerzbank Research:
Following the marked decline in energy prices, a correction is now also emerging in food prices, which had previously risen sharply. Even more important from the ECB's point of view, however, is the fact that underlying inflation has probably passed its peak. This supports our expectation that the ECB will raise key interest rates by 25 basis points for the last time in June.
The pound continues to be among the top performers of the week, with the Bank of England under pressure to do more to curb inflation in the UK. GBP/USD rose for the fourth consecutive day, posting the highest daily close since May 10 and trading comfortably above 1.2500.
The Japanese Yen performed well on Thursday, despite the rally in equities, driven by falling government bond yields. USD/JPY dropped for the third consecutive day, bottoming at 138.42; the pair so far lost 180 pips this week.
The weaker US dollar boosted AUD/USD and NZD/USD, with both pairs having their best day in weeks, rising to 0.6570 and 0.6070 respectively. In Australia, the Fair Work Commission (FWC) will announce the Annual Wage Review on Friday.
USD/CAD tumbled more than a hundred pips, with the Loonie holding firm on the back of a rally in crude oil prices, which gained more than 3%. The pair bottomed at 1.3435, the lowest in two weeks.
Emerging market currencies rallied against the US Dollar, with the exception of the Turkish lira, which hit fresh record lows with USD/TRY rising above 20.80.
Cryptocurrencies failed to benefit from a weaker US Dollar and positive investor sentiment. Bitcoin lost ground, falling to $26,870, while Ethereum traded flat around $1,870. Gold rose again to the 20-day Simple Moving Average (SMA) around $1,980, and Silver soared, approaching $24.00.
Like this article? Help us with some feedback by answering this survey:
- The Dow Jones Industrial Average rose 154.09 points, or 0.47%, to 33,062.36.
- The S&P 500 gained 41.26 points, or 0.99%, to 4,221.09.
- The Nasdaq Composite added 165.70 points, or 1.28%, to 13,100.98.
The S&P 500 rallied to a nine-month closing high on Thursday. the sentiment was boosted on Wall Street as the slowing wage pressure raised hopes the Federal Reserve will pause hiking interest rates. Additionally, investors cheered a vote in Congress to suspend the US debt ceiling.
A slump in productivity was revised lower, while the ISM PMI showed the manufacturing sector contracted for a 7th month. Initial jobless claims and the ADP report beat forecasts but the data indicates a less tight labour market. Meanwhile, Fed´s Governor Philip Jefferson and Philadelphia Fed President Patrick Harker suggested the central bank would skip a rate hike in the next meeting. Stocks were supported by the expectations that the Federal Reserve might not hike interest rates when its policy committee meets later this month. The CME Fedwatch Tool shows a 75% probability the central bank will keep rates unchanged.
Focus now shifts to the Labor Department's closely watched Nonfarm Payrolls report. ´´US payrolls likely slowed modestly in May, advancing at a still strong 200k+ pace for a second consecutive month. We also look for the Unemployment Rate to stay unchanged at a historical low of 3.4%, and for wage growth to print 0.3% MoM (4.4% YoY),´´ analysts at TD Securities said.
S&P 500 technical analysis
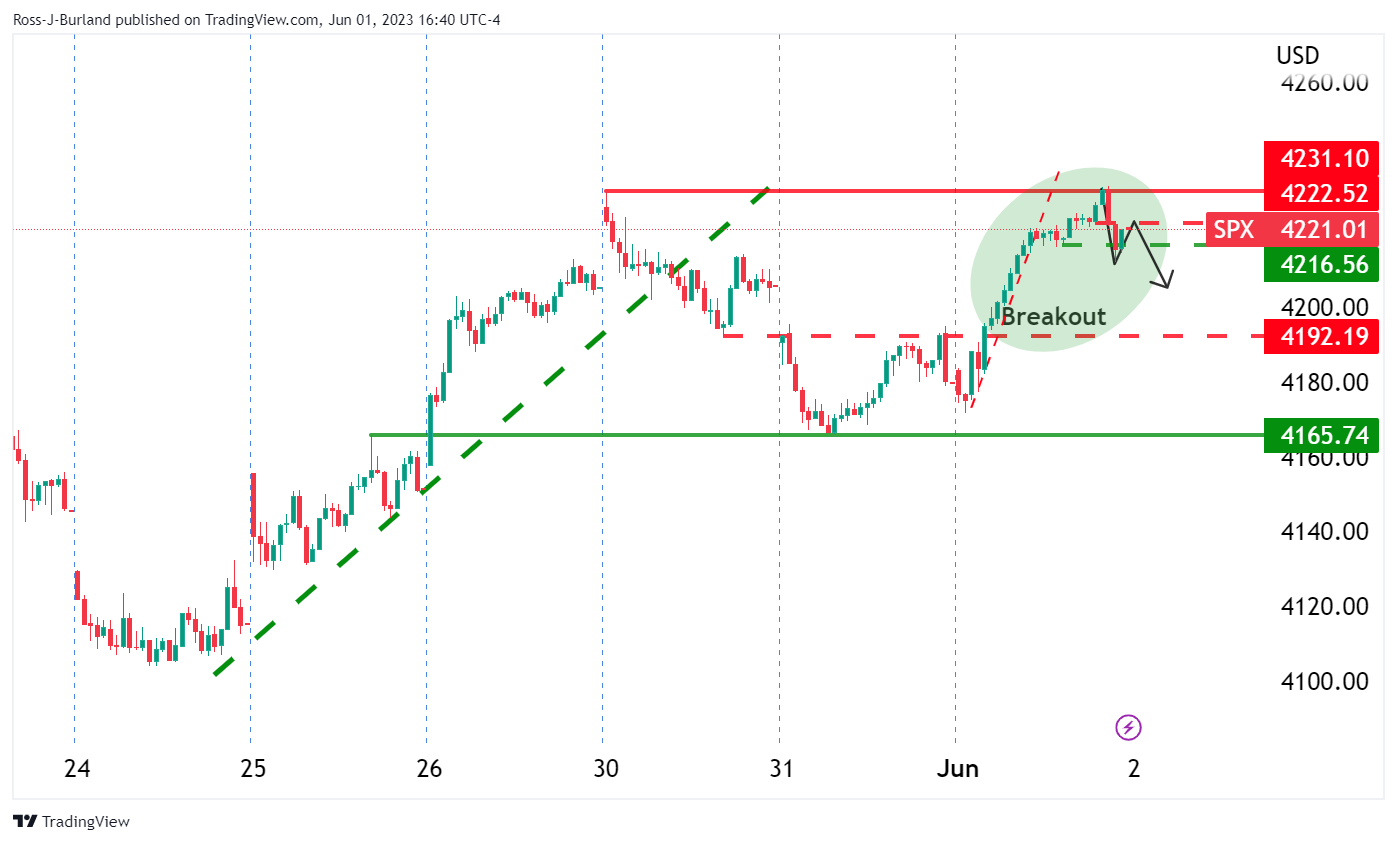
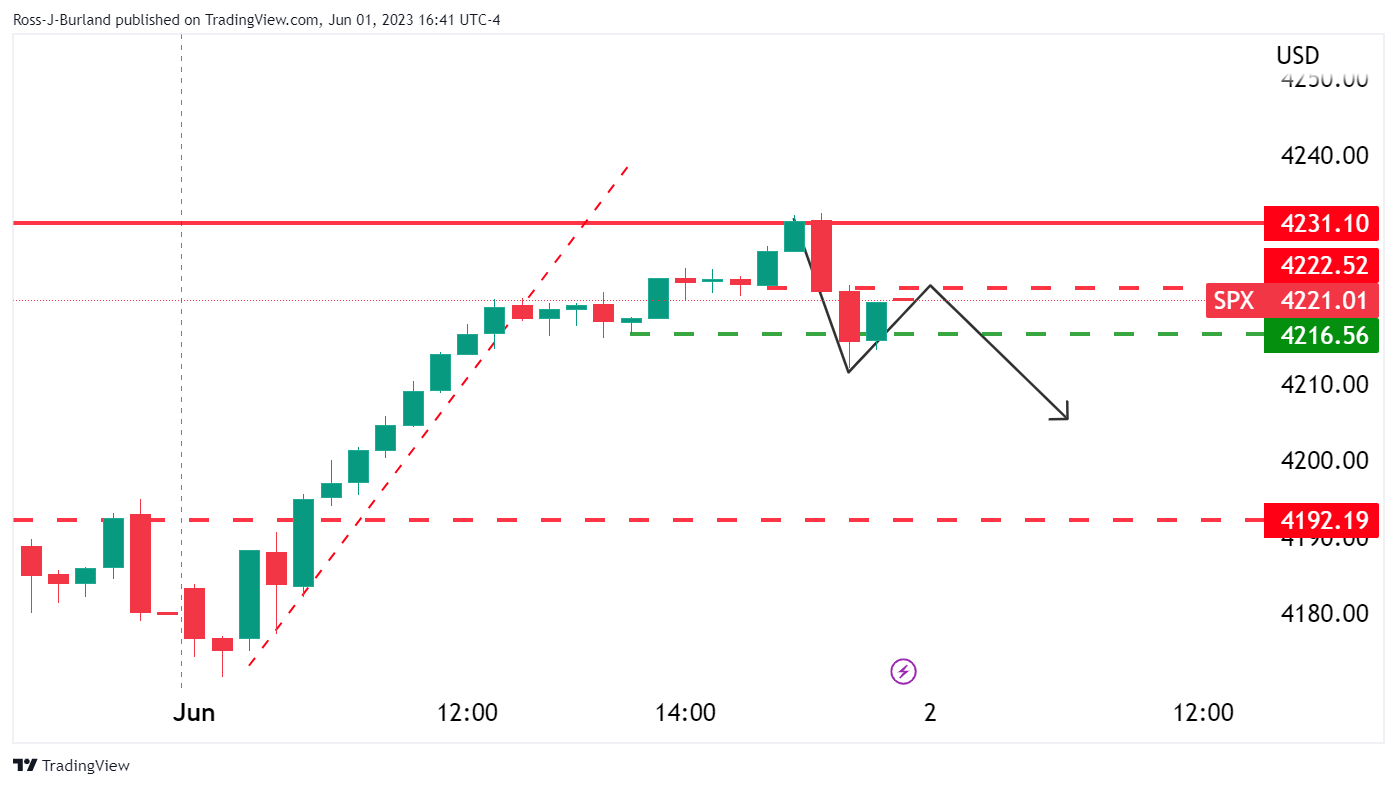
Following the breakout, there could be a move back into longs but alñl will depend on NFP.
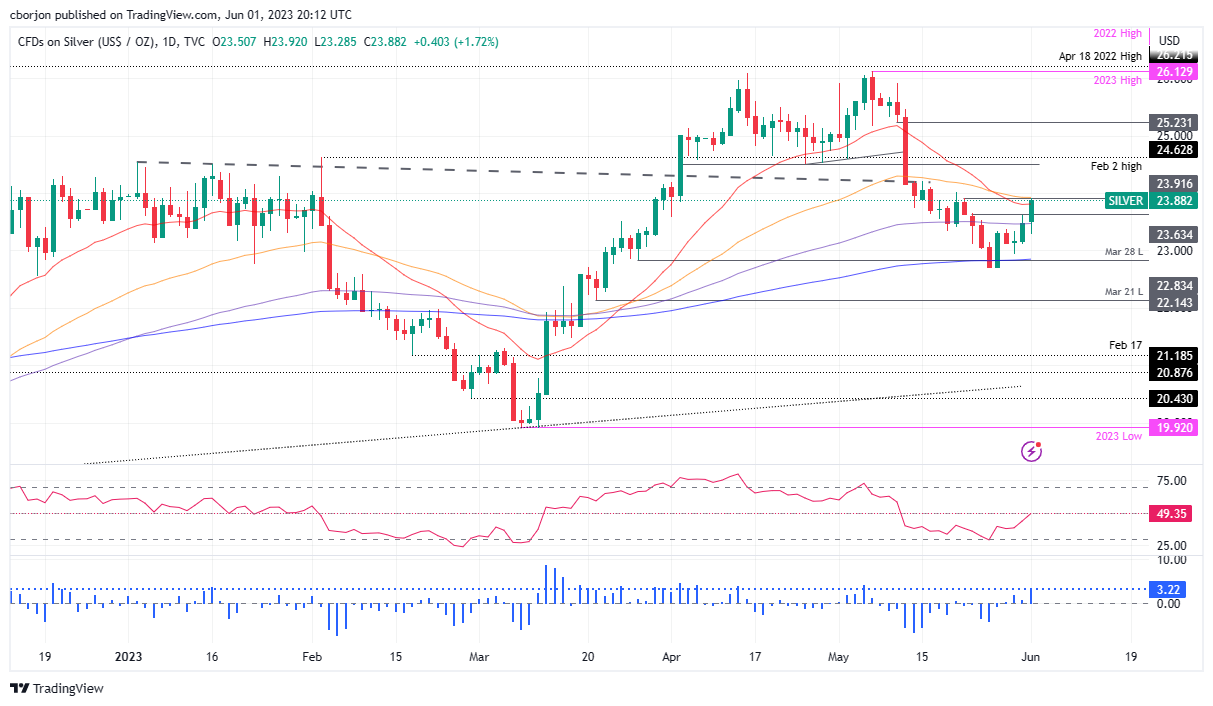
- Silver rises over 1.50%, benefitting from Fed’s dovish stance, and US bond yields fall.
- As investors priced in a pause in Fed’s tightening cycle, the 10-year bond yield and the US Dollar tumbled.
- Technical outlook shows a sideways trend as XAG/USD battles to stay below 20 and 50-day EMAs; Support areas and potential resistance levels are highlighted.
Silver price advanced steadily by more than 1.50% on Thursday, sponsored by several reasons. Firstly, dovish remarks by Federal Reserve (Fed) officials tumbled US bond yields in the last 48 hrs. Relief of the US debt-ceiling saga, advancing to the US Senate, and weakening in manufactury activity, were the final nails in the coffin for the greenback. Therefore, the XAG/USD is exchanging hands at $23.85 after diving as low as $23.28.
The US 10-year Treasury bond yield drops four basis points (bps) from around 3.64% to 3.60%, a tailwind for the non-yielding metal. Consequently, the US Dollar Index (DXY) plummeted more than 0.50%, at 103.573, as investors began to price in Fed’s first pause after hiking 500 bps.
XAG/USD Price Analysis: Technical outlook
XAG/USD remains sideways after an ongoing correction lifted Silver from around two-month lows of $22.68. Even though the 200-day Exponential Moving Average (EMA) price level cushioned Silver’s fall, downside risks persist as XAG/USD battles to stay below the 20 and 50-day EMAs, at $23.80 and $23.93, respectively.
In that outcome, the following support areas would be the 100—day EMA at $23.47. A breach of the latter and XAG/USD could dive below the $23.00 figure to re-test the 200-day EMA at $22.85, briefly tested on May 25 and 26.
Conversely, XAG/USD’s first resistance would be the 50-day EMA at $23.93. Once surrendered, the $24.00 mark is up for grabs, followed by a crucial April 25 swing low test, which turned resistance at $24.49.
XAG/USD Price Action – Daily chart
- The Kiwi gained more than 80 pips in Thursday's session and jumped to a daily high of 0.6075.
- Poor US ISM data from May and downward revision on the Unit Labor Costs weakened the dollar.
- Fed’s Harker dovish comments also seems to be putting pressure on the US Dollar
The NZD/USD pair set its biggest daily gains since mid-May. In that sense, the combination of weak ISM data, downward revision on the Unit Labor Costs and Fed’s Patrick Harker dovish remarks contributed to the selling pressure of the Greenback. On the other hand, as the economic calendar from New Zealand remains empty, the Kiwi also benefits from the positive market environment fueled by the passing of the US debt-ceiling limit bill by the US House of Representatives.
US economic data fueled dovish bets on the Fed ahead of NFP data
The US Bureau of Statistics, reported that the Unit Labor Costs in Q1 increased by 4.2%, which was revised down from the initial estimate of 6.3%. Moreover, the Institute for Supply Management (ISM) reported that the Manufacturing PMI for May was 46.9, slightly below the anticipated 47 and down from the previous month's 47.1. As this report can serve as an indicator of trends in production costs, share prices, and inflation it hints at a possible deceleration of inflationary pressures in May.
As a result, with the US economic activity showing signs of weakness ahead of the upcoming June 13-14 FOMC meeting, markets are now discounting higher chances of a pause. As a reaction, the US bond yields are falling. The 10-year bond yield retraced to 3.61% and showed a 1.03% decline while 2 and 5-year rates also experienced declines of more than 1% standing at 4.33% and 3.70% respectively and applied further pressure on the US Dollar. Adding to that, Fed's Patrick Harker commented ”I think we should at least skip raising rates in June” and that if inflation notably decelerates, then the Fed can start to cut rates.
For Friday’s session, investors predict that Nonfarm payrolls (NFP) for May show a deceleration in job creation in the US private sector, dropping to 190k from the previous figure of 253k. Hourly earnings are projected to remain stagnant at 0.4%, while the unemployment rate is expected to experience a slight increase, reaching 3.5%.
Levels to watch
Despite daily gains, the NZD/USD pair maintains a bearish outlook for the short term, as per the daily chart. The Relative Strength Index (RSI) and Moving Average Convergence Divergence (MACD) are both in negative territory while the pair remains below its main Simple Moving Averages (SMA).
If the Kiwi retakes its downside path, immediate support levels are seen at the 0.60 zone, followed by the 0.5995 area and the 0.5990 zone. Furthermore, resistances line up at the 0.6070 area, followed by the 0.6090 zone and the 0.6100 psychological mark.
-638212469601530420.png)
- Gold price bulls are in the money but target higher still.
- All now depends on the NFP data on Friday.
Gold price was rising on Thursday and climbed from a low of $1,953.44 to score a high of $1,983.15 on the day. The US Dollar eased following passage of the US debt-ceiling agreement through the House on Wednesday.
US lawmakers appeared to avert a financial crisis with the news that US debt-ceiling agreement got through the House. The deal is to raise the debt ceiling for two years and this now moves onto the Senate, with passage expected well ahead of the June 5 deadline.
Due to a combination of factors, the US Dollar index fell to 103.52, the lowest for some time as fresh data and comments from some Fed officials raised bets the central bank will pause in June. Firstly, a slump in productivity was revised lower, while the ISM PMI showed the manufacturing sector contracted for a 7th month. Initial jobless claims and the ADP report beat forecasts but the data indicates a less tight labour market.
As for Federal Reserve speak, Fed´sGovernor Philip Jefferson and Philadelphia Fed President Patrick Harker suggested the central bank would skip a rate hike in the next meeting. This all comes ahead of the US Nonfarm Payrolls showdown on Friday. A strong outcome will likely reignite a US Dollar rally and weigh on the Gold price.
Overall, expectations are that the Federal Reserve might not hike interest rates when its policy committee meets later this month. The CME Fedwatch Tool showing a 75% probability the central bank will keep rates unchanged.
´´US payrolls likely slowed modestly in May, advancing at a still strong 200k+ pace for a second consecutive month. We also look for the Unemployment Rate to stay unchanged at a historical low of 3.4%, and for wage growth to print 0.3% MoM (4.4% YoY),´´ analysts at TD Securities said.
Gold technical analysis
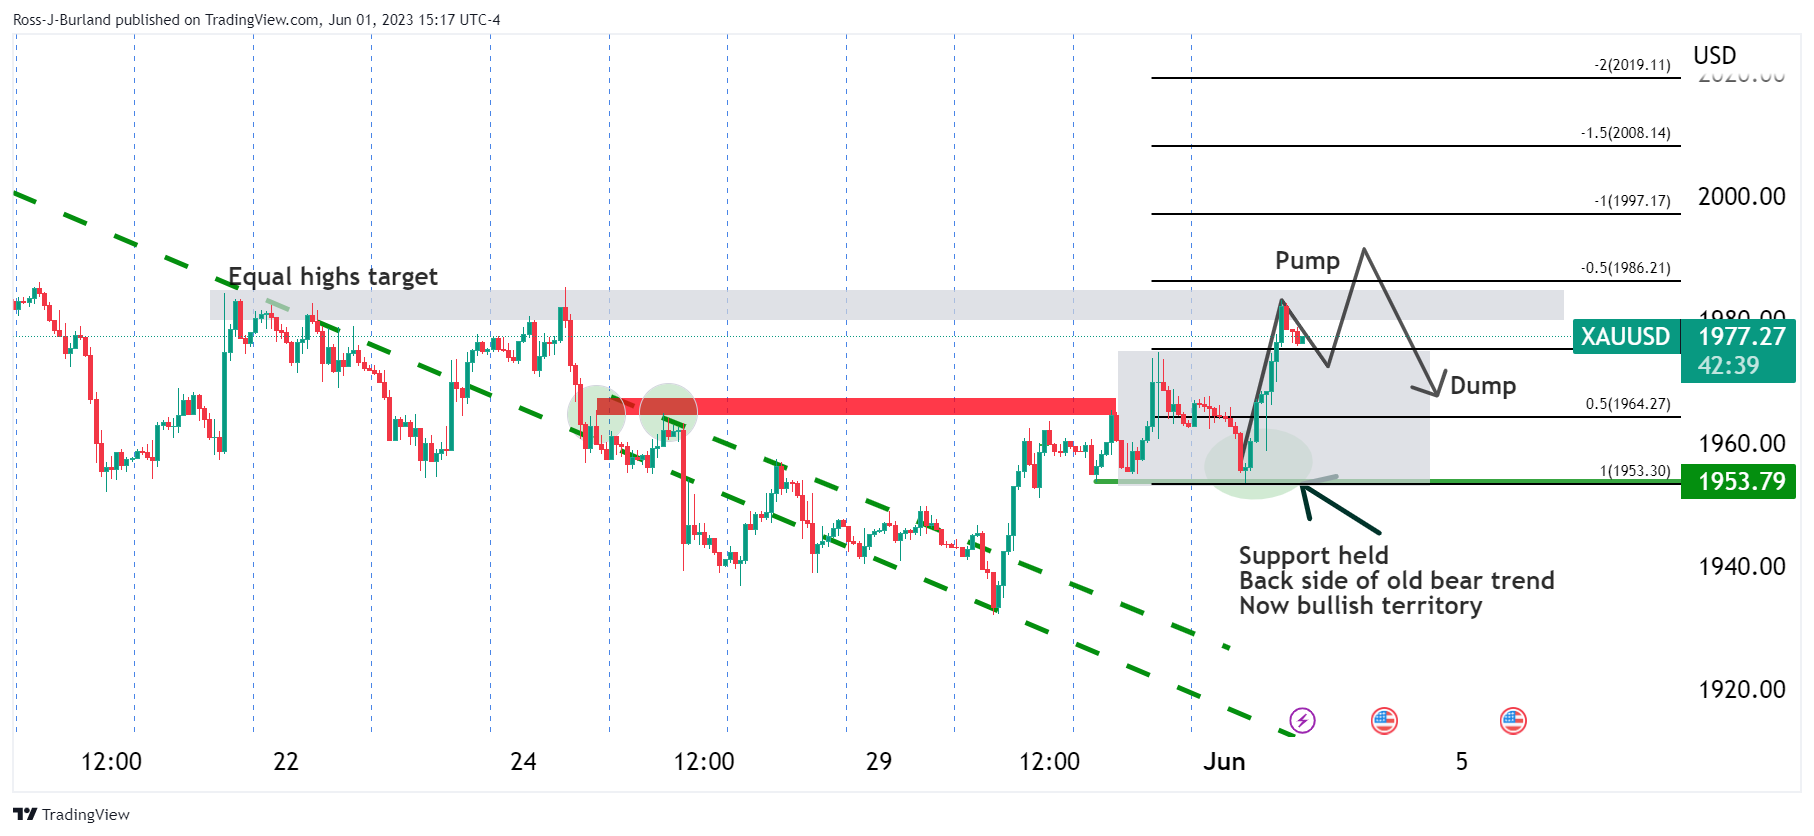
The above schematic is a hypothetical scenario for the Gold price as we head towards the Nonfarm Payrolls event on Friday. We are witnessing a pump towards equal highs in close to a 50% expansion of range between the prior swing highs and lows where support held on Thursday. The scenario illustrates a potential sell-off around the NFP data once the equal highs have been swept.
- EUR/JPY retakes the 149.00 area after three days of losses.
- Headline and Core HICP decelerated to 6.1% and 5.3% YoY in May in the EZ.
- ECB’s Christine Lagarde stated that she is not satisfied with the inflation outlook.
The EUR/JPY rebounded towards the 149.35 area after the bears got rejected at the 20-day Simple Moving Average (SMA) following three consecutive days of losses, and reached a daily high of 149.67. The Euro gained traction on the back of hawkish Christine Lagarde remarks despite the release of inflation figures from the Eurozone (EZ) from May which showed a deceleration in prices. On the other hand, the Japanese Yen weakened against most of its rivals but managed to strengthen against the US Dollar. For Thursday’s session, the Japanese economic calendar won’t have anything relevant to offer.
The Euro holds its foot despite falling German yields amid decelerating inflation figures
The European Union (EU) Harmonized Index of Consumer Prices (HICP), continued to decline in April as the headline figure came in at 6.1% (YoY) vs the 6.3% expected. The Core reading also decelerated to 5.3% YoY vs 5.5% expected from the previous 5.6%. Other data showed that the Unemployment Rate came in at 6.5% matching the consensus.
As a reaction, the German yields declined across the board. The 10-year bond yield is trading at 2.25%, having declined by 0.29 % on the day. The 2-year yield stands at 2.73% with a 0.49% decline and the 5-year yield is at 2.24% seeing a 0.29% retraction.
However, the Euro managed to hold its ground on the back of European Central Bank’s (ECB) president Christine Lagarde’s hawkish remarks. She highlighted concerns about persistently high inflation and its prolonged duration, emphasizing that the interest rate hikes are already exerting a significant impact on bank lending conditions, while also expressing dissatisfaction with the current inflation outlook.
Levels to watch
The EUR/JPY has a neutral outlook as per the daily chart while the Relative Strength Index (RSI) remains above 50 and the Moving Average Convergence Divergence (MACD) prints red bars. The 4-hour chart also suggests that neither the sellers nor the buyers have the control as indicators turned somewhat flat, seeming to be awaiting direction.
In case the EUR/JPY continues to gain traction, the following resistance line up at the 149.50 zone followed by the daily high near 149.70 and the psychological mark at 150.00. In addition,the 20-day Simple Moving Average (SMA) at 148.80 level is key for EUR/JPY. If breached, the pair could see a more pronounced decline towards the 148.50 area and 148.00 zone.
-638212434508829886.png)
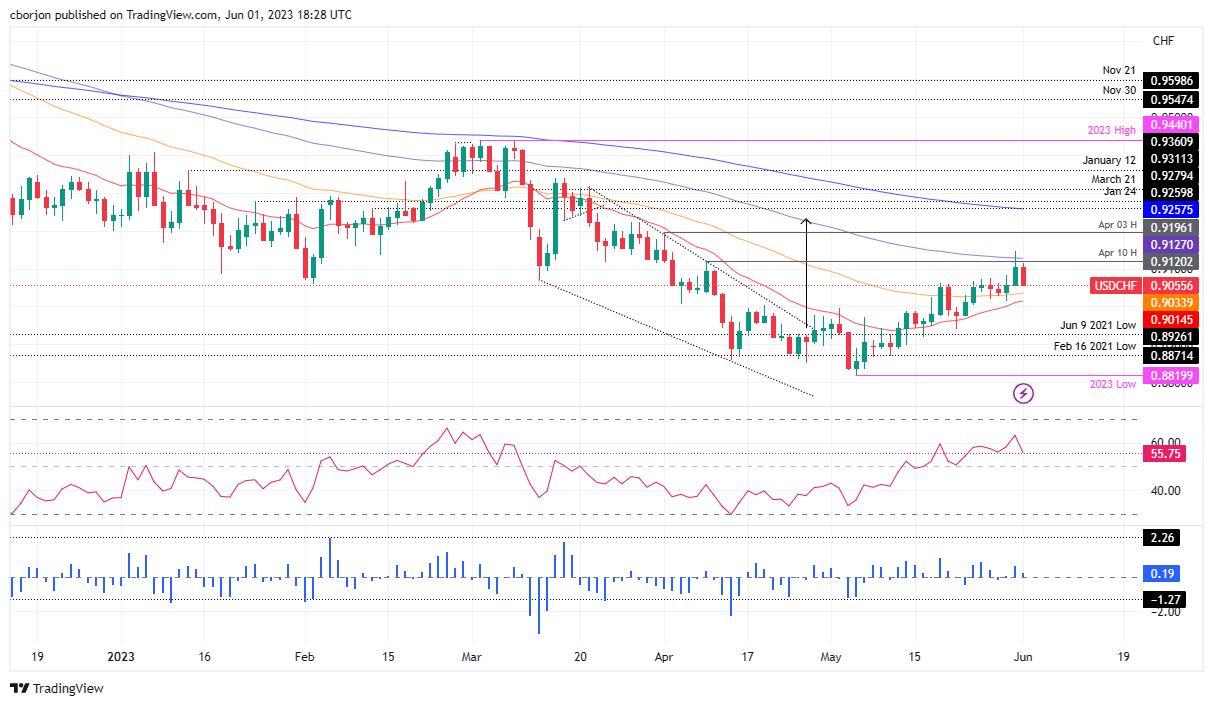
- USD/CHF forms a bearish harami pattern, reversing from resistance at 0.9120 to exchange around 0.9050.
- Despite a bullish RSI, the uptrend wanes due to strong resistance from the 100-day EMA and poor US economic data.
- The risk of a daily close below the 20-day EMA at 0.9058 poses a potential challenge to the 0.9000 mark.
USD/CHF pares some of its Wednesday’s gains, forming a bearish harami two candlestick pattern at a juncture with resistance at around the 0.9120 area, capping the advance of the major. Therefore, USD/CHF retreated below 0.9100 and exchanges hands around the 0.9050 area.
USD/CHF Price Analysis: Technical outlook
Since the beginning of the week, the USD/CHF meandered on top of the 50-day Exponential Moving Average (EMA) at 09034, which, acting as dynamic support, buyers saw it as a zone to open new positions, as the USD/CHF hit a fresh two-month high at around 0.9147. Nonetheless, the uptrend faded, as strong resistance emerged in the form of the 100-day EMA at 0.9127, alongside April 10 daily high at 0.9120.
Hence, bad US economic data was seen as an excuse for sellers to step in and drag the USD/CHF toward the lows of the day at 0.9054, below the 20-day EMA at 0.9058. In the outcome of a daily close below the latter, the next stop would be the 50-day EMA At 0.9034 before challenging the 0.9000 figure.
Even though price action remains neutral, in the short term, a pullback is likely. But traders should know that the Relative Strength Index (RSI) indicator is bullish, so upside risks remain.
USD/CHF Price Action – Daily chart
Federal Reserve Bank of St. Louis President James Bullard recently published an analysis titled 'Is Monetary Policy Sufficiently Restrictive?' in which he compares the policy rate under the Taylor rule to the Fed's policy rate. According to Bullard, “monetary policy is now in better shape after the rate hikes."
“The prospects for continued disinflation are good but not guaranteed, and continued vigilance is required”, said Bullard.
Key takeaways:
According to this analysis, monetary policy was about right shortly before the COVID-19 pandemic, as the actual policy rate was within the zone. During the pandemic, the policy rate recommended by the Taylor-type rules went to zero along with the actual policy rate. However, the policy rate was below the zone in 2022, suggesting that monetary policy was behind the curve at that point. But since the FOMC has raised the policy rate aggressively during 2022 and into 2023, monetary policy is now at the low end of what is arguably sufficiently restrictive given current macroeconomic conditions.
Monetary policy is in much better shape today with the policy rate at a more appropriate level than it was a year ago, according to this analysis. But where within the sufficiently restrictive zone should the policy rate be? And are there other factors to consider (e.g., financial stability)? Such assessments could be reflected in judgments by the FOMC going forward.
While both headline and core PCE inflation have declined from their peaks in 2022, they remain too high. An encouraging sign that inflation will decline to 2% comes from market-based inflation expectations, which had moved higher in the last two years but have now returned to levels consistent with the 2% inflation target. The prospects for continued disinflation are good but not guaranteed, and continued vigilance is required.
Market reaction
Bullard's words are having a muted impact on the market. The US Dollar is holding onto significant daily losses, driven by rising expectations of a potential pause at the Fed's next meeting.
- AUD/USD bulls are moving towards a key resistance area.
- Bears eye a correction into the W-formation´s neckline.
AUD/USD is better bid as we approach lunchtime in the New York session on Thursday. The pair has traveled from a low of 0.6484 and is testing 0.6581 so far.
The US Dollar index fell to 103.52, the lowest for some time as fresh data and comments from some Fed officials raised bets the central bank will pause in June. Firstly, a slump in productivity was revised lower, while the ISM PMI showed the manufacturing sector contracted for a 7th month. Initial jobless claims and the ADP report beat forecasts but the data indicates a less tight labour market.
Additionally, the Federal Reserve´s Governor Philip Jefferson and Philadelphia Fed President Patrick Harker suggested the central bank would skip a rate hike in the next meeting. This all comes ahead of the US Nonfarm Payrolls showdown on Friday. A strong outcome will likely reignite a US Dollar rally while a disappointment will likely boost AUD/USD.
´´US payrolls likely slowed modestly in May, advancing at a still strong 200k+ pace for a second consecutive month. We also look for the UE rate to stay unchanged at a historical low of 3.4%, and for wage growth to print 0.3% MoM (4.4% YoY),´´ analysts at TD Securities said.
AUD/USD technical analysis
Technically, AUD/USD has been pressing up against trendline resistance that it is now breaking at the time of writing. This puts the pair on the way to a test of a 50% mean reversion area. The break of this trendline resistance has opened risk to prior lows near 0.6605 and a 61.8% Fibonacci level. This, in turn, will leave behind a W-formation, a reversion pattern. The neckline will be eyed in the 0.6660s for a restest as support as follows:
- Dovish hints from Fed Governor Jefferson led to two-week USD/CAD lows.
- The recessionary US PMI trend clashes with robust Canadian GDP growth.
- Private sector hiring surge belied by tighter US labor market and rising jobless claims.
USD/CAD plunged more than 100 pips from around the 1.3580s area, as Fed dovish comments took center stage while manufacturing activity in the United States (US) decelerated. That, alongside solid growth figures from Canada, sponsored the USD/CAD fall of more than 0.90%. The USD/CAD exchanges hands at 1.3440, trading around fresh two-week lows.
Dovish stance by Fed policymakers and contractionary ISM PMI data overshadows upbeat ADP report
Market sentiment improved, as shown by Wall Street trading in the green. The Institute for Supply Management (ISM) revealed May PMI, which clocked in at 46.9, trailing April’s 47.1 and below a forecasted 47 – a recessionary signal, falling for a seven-straight month. The Fed’s aggressive tightening and sinking of new orders heavily burdened the PMI and the US Dollar.
The ADP Report indicated private sector hiring surged to 278K in May, surpassing 170K estimates but lagging behind April’s 291K. This underlines a tight labor market, further echoed by the rise in initial jobless claims to 232K – slightly below estimates but exceeding the prior week’s downwardly revised 230K.
Regarding US central bank speakers, on Wednesday, Fed Governor Philip Jefferson, backed by Harker, hinted at bypassing a rate hike at June’s meeting. Yet, Harker conceded that new data could shift his stance.
Recently, Harker reiterated Wednesday’s stance for skipping June “and see how it goes.” He added that it’s time to hit the stop button at least for one meeting so that the US central bank can assess the current economic situation.
Across the borders, the latest GDP figures in Canada showed the economy’s resilience, increasing investors’ speculations for a Bank of Canada (BoC) interest rate increase. The release of the S&P Global Manufacturing PMI for May showed that business activity decelerated, as the index dropped from 50.2 to 49.0 in May.
USD/CAD Price Analysis: Technical outlook
From a technical perspective, the USD/CAD is neutrally biased, though closing into the 200-day Exponential Moving Average (EMA) at 1.3417, the first support following the USD/CAD collapse. Should be said the Relative Strength Index (RSI) indicator portrays sellers gathering momentum, as well as the 3-day Rate of Change (RoC). But, with a flat slope, EMAs warrant caution, as the USD/CAD pair could be in a consolidation phase. For a bearish continuation, USD/CAD must claim the 200-day EMA, followed by the 1.3400 figure ahead of testing the May low of 1.3314. Conversely, the USD/CAD first resistance would be the 1.3500 figure, followed by the 100-day EMA at 13512. Next, resistance levels lie at the 50 and 20-day EMA, each at 1.3526 and 1.3531, respectively.
Philadelphia Federal Reserve Bank President Patrick Harker stated on Thursday that he believes it is time for the central bank to 'hit the stop button' for at least one meeting, reiterating his comments from Wednesday about a potential pause at the next meeting. Harker argued that such a move would be prudent at this time.
Speaking about the economic outlook, Harker stated that he does not anticipate a recession this year. He would be worried in the case of a significant deterioration in the job market. He added that if inflation were to unexpectedly decrease at a rapid pace, then the central bank could potentially cut rates.
Market reaction:
The US Dollar is falling sharply on Tuesday, as Treasury bonds rally amid expectations of a no hike at the next FOMC meeting. The DXY is losing 0.60%, trading at 103.57, at the lowest in a week.
- EUR/USD reaches 1.0746, surging over 0.50% from its opening price, following a weekly low of 1.0635.
- Weakening US manufacturing activity, as indicated by the ISM Manufacturing PMI falling to 46.9 in May, fuels speculation of a Fed pause on tightening.
- Mixed employment data shows private hiring surging but falling short of April’s numbers, while Initial Jobless Claims indicate a tight labor market.
EUR/USD shifted gears after printing a weekly low of 1.0635, climbs bolstered by dovish US Federal Reserve (Fed) officials’ comments, alongside soft economic data from the United States (US). Therefore, investors looking towards a less hawkish Fed dumped the US Dollar (US) in favor of riskier assets. At the time of writing, the EUR/USD exchanges hands at 1.0746, more than 0.50% above its opening price.
Sentiment improves as Fed takes a dovish stance; US economic data disappoints
US equities are trading in positive territory amidst weakening manufacturing activity in the United States (US), which could warrant a Fed’s pause on its tightening cycle. The ISM Manufacturing PMI in May, slipped to 46.9, falling under both April’s 47.1 and the expected 47. These sub-50 readings generally indicate a recessionary phase, weighed by a plunge in new orders.
The EUR/USD printed a subsequent leg-up toward 1.0750 in the release of the ISM, though mixed employment data already bolstered it. Although private hiring surged by 278K, as shown by the ADP National Employment report for May, smashing estimates of 170K, it fell short of April’s impressive 291K.
After that report, Initial Jobless Claims rose to 232K or the week ending May 27, slightly below estimates but higher than the previous week’s downward-revised 230K, pointing to a persistently tight labor market.
In light of these data, Philadelphia Fed President Patrick Harker is expected to weigh in later today. Notably, EUR/USD traders should remember recent remarks by Fed Governor Philip Jefferson, who suggested a pause in rate hikes at June’s meeting - a view Harker supports. However, he notes that upcoming data could sway his stance.
Concerning the Eurozone (EU) economic calendar, recently revealed data showed that inflation somewhat eased in the bloc. However, the European Central Bank (ECB) President Christine Lagarde delivered hawkish remarks, saying, “ There is no clear evidence that underlying inflation has peaked.”
Given the backdrop, interest rates futures markets expect another 25 bps lift by the ECB at the upcoming meeting. Even though Germany entered a recession, as shown by the latest Gross Domestic Product (GDP) report, a recovery in Retail Sales cushioned the German economy.
EUR/USD Price Analysis: Technical outlook
The EUR/USD is still neutral to downward biased, capped on the upside, by dynamic resistance levels, in the likes of the 100-day Exponential Moving Average (EMA) at 1.0772, followed by the psychological 1.0800 figure. The 20-day EMA immediately appears at 1.0805, followed by the 50-day EMA at 1.0837. Nevertheless, the Relative Strength Index (RSI) indicator and the 3-day Rate of Change (RoC) remain in bearish territory, warranting further downside. But, the EUR/USD must fall below the May 31 open of 1.0734, which could pave the way for further losses. Support levels lie at 1.0700, followed by the 20—day EMA at 1.0686, briefly tested on June 1.
- The USD/JPY sets a fourth consecutive day of losses and trades around the 138.80 area.
- Downward revision of Unit Labor Cost and weak ISM PMIs increased the dovish bets on the Fed.
- Declining US bond yields weigh on the US Dollar.
The USD/JPY continues to decline and fell to a low since May 24 as the weak US Dollar, driven by poor ISM PMIs and lower Q1 Unit Labor Cost, lead markets to anticipate a higher likelihood of no rate hike by the Fed at the June 13-14 meeting. In that sense, the decline in the US bond yields favors the downward trajectory of the pair.
US bond yields decline after US data
The Automatic Processing Inc. reported that the US economy added 278k jobs in May (MoM) above the 170k expected by the markets. However the figure managed to decelerate from its previous figure of 291k in April. On the other hand, Unit Labor Costs in Q1 were up by 4.2%, revised from 6.3%. Furthermore, the Institute for Supply Management (ISM) showed that the Manufacturing PMI from May came in at 46.9 vs the 47 expected from the previous 47.1.
In that sense, as the economic activity in the US continues to weaken while the Fed maintains its target rate at a considerably restrictive level, markets now discount higher possibilities of the Fed not hiking in the next meeting on June 13-14. As a reaction, US bond yields declined across the board with shorter-term rates seeing more than 1% declines on the day and applied further selling pressure on the US Dollar.
In that sense, according to the CME FedWatch tool, investors are betting on 71.6% probabilities on the Fed not hiking in their next meeting in June and maintaining the target rate at 5.00%-5.25%.
For Friday’s session, the US Nonfarm payrolls (NFP) for May from are expected to show an increase of 190K below the previous 253K while hourly earnings to stagnate at 0.4% and the Unemployment Rate to slightly increase to 3.5%.
Levels to watch
On the 4-hour chart, indicators fell to negative territory indicating that the bears have the upperhand for the immediate short term. It's worth mentioning that the Relative Strength Index (RSI) indicator is approaching the oversold threshold and may suggest that some consolidation may be incoming.
In case the pair consolidates losses, the upcoming resistance for USD/JPY is seen at the level at 139.00 level, followed by the zone at 140.50 and the psychological mark at 141.00. On the other hand,if the Ninja loses ground, immediate support levels are seen at the 138.90 zone, followed by the 138.50 level and the psychological mark at 138.00.
-638212325226299747.png)
- GBP/USD rises amid weak US data and potential Fed policy pause.
- Despite ISM’s seven-month PMI slump, Wall Street remains positive.
- The UK faces steep housing price fall; high inflation triggers BoE tightening speculation.
GBP/USD edges higher in the North American session, boosted by downbeat economic data from the United States (US), with business activity slowing. Additionally, US Federal Reserve (Fed) officials pushing for a “skip” on its tightening cycle eased the odds for a rate hike at the upcoming June meeting. The GBP/USD is trading at around 1.2510s after hitting a low of 1.2400.
GBP/USD climbs, Fed considers pausing tightening cycle, and Wall Street reacts to ISM Manufacturing PMI’s seven-month decline
Wall Street shifted positively as data from the Institute for Supply Management (ISM) revealed that manufacturing activity slid for the seven straight month. The ISM Manufacturing PMI came at 46.9, below April’s 47.1 and below estimates of 47, with readings below 50 seen as recessionary. Factors like 500 basis points (bps) of aggressive tightening by the Fed weighed on the index as new orders plunged.
ISM data weighed heavily on the US Dollar (USD), as shown by the GBP/USD skyrocketing from around 1.2470, back above 1.2500, following the release of another two US employment reports, triggering a bounce from 1.2440 towards the former.
Regarding employment, the ADP National Employment Report showed private hiring rose by 278K in May, crushing estimates of 170K, but trailed April’s astonishing 291K. Although it showed signs the labor market remains tight, that was further confirmed by US unemployment claims.
Initial Jobless Claims for the week ended May 27 rose by 232K, below estimates of 235K, but above the prior’s week 230K, a figure downward revised.
Given the latest round of data, the Philadelphia Fed President Patrick Harker is expected to deliver some remarks late in the day. Nonetheless, GBP/USD traders should remember the latest statements by Fed Governor Philip Jefferson aiming for a skip to raise rates at June’s meeting, comments supported by Harker. Nevertheless, Harker added that incoming data could “change my mind.”
Across the pond, the UK calendar revealed that housing prices fell the most since 2009, blamed on higher interest rates by the Bank of England (BoE). The latest inflation report shows signs of easing but remains four times the BoE’s target. After the release of the Consumer Price Index (CPI), investors priced in additional tightening by the BoE.
GBP/USD Price Analysis: Technical outlook
The GBP/USD resumed its upward trajectory after spending two days glued to the bottom of the 20-day Exponential Moving Average (EMA) at 1.2441. Fundamental News sponsored Cable appreciation, and since it claimed the 1.2500 figure, the path of least resistance is north. The following resistance levels lie at the May 16 high of 1.2546 and the 1.2600 figure. Technical indicators, like the Relative Strength Index (RSI) and the 3-day Rate of Change (RoC), show that bulls are gathering momentum, so any pullbacks could be seen to re-engage on the overall uptrend.
Economists at UBS discuss Gold (XAU/USD) outlook and maintain a bullish view.
Gold is on track to break its all-time high later this year
Gold fell below $1,950 last week amid progress on the US debt ceiling deal and a repricing of US rate hike expectations. But Gold’s role as an effective long-term hedge makes the yellow metal valuable in a portfolio context.
With solid central bank demand, renewed US Dollar weakness, and rising US recession risks, we continue to believe that Gold is on track to break its all-time high later this year and hit $2,250 by June 2024.
The US Bureau of Labor Statistics (BLS) will release the May jobs report on Friday, June 2 at 12:30 GMT and as we get closer to the release time, here are the forecasts by the economists and researchers of 10 major banks regarding the upcoming employment data.
Nonfarm Payrolls in the US are forecast to rise by 190K vs. 253K in April. Meanwhile, the unemployment rate is expected to rise a tick to 3.5% and average hourly earnings are seen steady at 4.4% year-on-year.
Commerzbank
Given the fairly stable downward trend in employment growth, we expect 200K new jobs to have been created in May after 253K in April. This would probably keep the unemployment rate at 3.4%. The noticeable weakening of the labor market desired by the US Federal Reserve, which could dampen inflation, would thus not yet be achieved.
Danske Bank
We expect to see another relative upbeat US Jobs Report. So far the signals from leading data have pointed towards healthy employment growth, which could be further supported by a renewed uptick in labor force participation. We think NFP grew by a solid 200K.
TDS
US payrolls likely slowed modestly in May, advancing at a still strong 200K pace for a second consecutive month. We also look for the UE rate to stay unchanged at a historical low of 3.4%, and for wage growth to print 0.3% MoM (4.4% YoY).
NBF
We expect job creation to remain solid in the month. Our call is for a 220K increase. The household survey should allow for a similar gain following April’s underperformance. Assuming a one-tick increase in the participation rate to 62.7%, these gains could still translate into a slight increase in the unemployment rate from 3.4% to 3.5%.
SocGen
We believe job growth is moderating, yet the pace remains strong. We predict a 210K advance in May NFP, and the unemployment rate holding at the 3.4% low. On wages, we expect a more modest 0.2% MoM increase.
CIBC
The previously reported jump in initial jobless claims was revised away, and the May payrolls survey reference period now shows a slight improvement in claims. That suggests that hiring was likely still a robust 195K in May, although that represents a deceleration from the recent 3-month average trend, in line with the softening in job openings seen so far this year. The unemployment rate likely ticked up to 3.5%, while wage growth could have slowed, but remained hot, at 0.4%. We’re more optimistic than the consensus on hiring and wages, which could lift bond yields.
Credit Suisse
We expect payroll gains to slow to 200K in May. Despite decelerating, the robust pace of job gains this year has largely beaten expectations. We expect the gradual deceleration to continue, underscored by a continued slowing in employment growth in the most cyclical sectors. We expect the unemployment rate to remain at 3.4%. We do not expect April’s acceleration in the monthly growth rate of average hourly earnings to be sustained. Instead, we forecast monthly growth of 0.3%, continuing the encouraging slowdown in wage growth that we have observed over the past year. YoY growth in average hourly earnings should fall to 4.3%, slightly above the rate we judge to be consistent with target inflation. Continued robust labor market data will likely keep the Fed hawkish, and biased toward hikes, not cuts.
Citi
We expect a 200K increase in NFP in May, with private payrolls rising by a softer 160K. However, despite strong labor demand, a shrinking pool of available workers to hire could still limit monthly job gains which could see job growth likely to continue to slow. We expect average hourly earnings to rise by a more modest 0.3% MoM in May after having risen a substantial 0.5% MoM in April and the unemployment rate to remain unchanged at 3.4% in May with balanced risks.
Wells Fargo
Our expectation is that NFP increased by 200K in May. We believe it is important to keep a close eye on wage growth and the labor force participation numbers. The labor force has grown at a healthy pace over the past year, and a further deceleration in wages alongside expanding supply would be an encouraging sign in the Federal Reserve's fight to get inflation back to 2%.
Deutsche Bank
We expect 200K on payrolls.
- XAU/USD accelerated to the upside after ULC and ISM PMI.
- US Dollar corrects further lower on Thursday.
Gold prices are risen for the third consecutive day as US Treasury yields continue to decline. XAU/USD pair recently jumped to $1,977, hitting a one-week high following the release of the US ISM Manufacturing PMI.
Gold turns positive on Thursday after US data
During the European session, the value of an ounce bottomed at $1,952, the weakest level in two days. It then started to recover and gained momentum, reaching levels above $1,970 following the release of US economic reports.
The ADP Employment report showed an increase in private payrolls by 278K, surpassing expectations of 174K. The US dollar initially rose briefly after the ADP, but then weakened again after the Bureau of Labor Statistics announced a revision of Q1 Unit Labor Costs (ULC) from 6.2% to 4.2%.
The dollar's decline accelerated after the May ISM Manufacturing PMI showed a decline in the main index from 47.1 to 46.9, below the market consensus of 47. The Price Paid Index also fell considerably from 53.2 to 44.2, against expectations of 52, while the Employment Index unexpectedly rose from 50.2 to 51.4.
As a result, the Greenback tumbled to fresh daily lows across the board, in line with a decline in Treasury yields. US stocks opened mixed on Wall Street.
Gold continues to move with an upside bias in the short-term, with the next resistance area located around $1,980. A consolidation above this level would set the stage for an extension towards $1,995. On the flip side, a firm break below $1,955 would likely remove the upside bias, adding pressure for a test of $1,946.
Technical levels
The USD is trading mixed, but off earlier highs in broad terms on the day. Economists at Scotiabank discuss the greenback outlook.
Hawkish ECB comments
Markets were pricing in around 17 bps for Fed tightening for this month – until comments from Jefferson and Harker (both voters) supported the Fed ‘skipping’ a hike at the upcoming meeting, dumping pricing back to 8 bps; Jul pricing still reflects around 80% probability of a 25 bps hike. And this morning, ECB officials have downplayed signs of softer core inflation and persisted with messaging that rates will move higher still in the coming months.
While short-term spreads have moved incrementally in support of recent USD gains (note elevated correlations with spreads for USD/JPY, EUR/USD and USD/CAD especially) the path to additional USD strength via yield differentials is likely to be choppy and perhaps somewhat limited.
- US ISM Manufacturing PMI declined slightly in May.
- US Dollar Index stays deep in negative territory below 104.00.
The economic activity in the US manufacturing sector continued to contract at an accelerating pace in May with the ISM Manufacturing PMI dropping to 46.9 from 47.1 in April. This reading came in worse than the market expectation of 47.
Further details of the publication revealed that the New Orders Index declined to 42.6 from 45.7 while the Employment Index improved to 51.4 from 50.2. Finally, the inflation component, Prices Paid Index, fell sharply to 44.2 from 53.2, compared to analysts' estimate of 52.
Commenting on the report, "the May composite index reading reflects companies continuing to manage outputs to better match demand for the first half of 2023 and prepare for growth in the late summer/early fall period," said Timothy R. Fiore, Chair of the Institute for Supply Management.
"The Prices Index fell back into ‘decreasing’ territory (and in dramatic fashion) after one month of increasing prices," Fiore added.
Market reaction
The US Dollar came under renewed selling pressure after this report and the US Dollar Index was last seen losing 0.4% on the day at 103.82.
Economists at Nordea discuss the ECB policy outlook.
Inflation risks are what the ECB continues to worry about most
The ECB’s May monetary policy account confirmed that the central bank remains preoccupied with upside inflation risks and despite slowing down the pace of hikes, it was seen as imperative to emphasize that hikes will continue going forward.
Our view continues to be one of two further 25 bps rate hikes from the ECB, in June and July, with risks tilted towards the hikes continuing also after the summer. We think it will require much more than one downside surprise in the inflation data to make the ECB stop its hiking cycle.
- AUD/USD attracts some buyers on Thursday and recovers further from the YTD low.
- The upbeat Chinese data and hawkish RBA expectations underpin the Australian Dollar.
- Reduced bets for another Fed rate hike in June weigh on the USD and further lend support.
- The risk-off impulse might cap any further appreciating move for the risk-sensitive Aussie.
The AUD/USD pair gains positive traction on Thursday and builds on the previous day's late recovery from the 0.6460-0.6455 region, or its lowest level since November 2022. The pair sticks to its intraday gains through the early North American session and is currently placed near the top end of its daily trading range, around the 0.6530-0.6535 region.
A private survey showed that China’s manufacturing sector unexpectedly registered modest growth in May. Apart from this, expectations that the Reserve Bank of Australia (RBA) could tighten its monetary policy further act as a tailwind for the Aussie. In fact, RBA Governor Philip Lowe had warned on Wednesday that sticky prices could invite more rate hikes by the central bank, which was followed by the release of stronger domestic consumer inflation figures. This, along with a modest US Dollar (USD) weakness, provides a goodish lift to the AUD/USD pair.
The USD attracts fresh supply following an early uptick and retreats further from its highest level since mid-March touched on Wednesday amid diminishing odds for another 25 bps rate hike by the Federal Reserve (Fed). It is worth recalling that a duo of FOMC members on Wednesday showed a willingness to pause interest rate hikes this month. This, in turn, triggers a steep intraday decline in the US Treasury bond yields, which exerts some downward pressure on the Greenback and remains supportive of the bid tone surrounding the AUD/USD pair.
The USD bulls, meanwhile, seem rather unimpressed by the better-than-expected release of the US ADP report, showing that private-sector employers added 278K jobs in May as compared to the 170K anticipated and the 296 in the previous month. That said, the risk-off impulse - amid worries about a global economic slowdown, particularly in China - could benefit the safe-haven buck and act as a headwind for the risk-sensitive Australian Dollar (AUD). This, in turn, warrants some caution for bullish traders and positioning for any further appreciating move.
Technical levels to watch
- The index puts the 104.00 region to the test on Thursday.
- The likelihood of a Fed’s pause in June weighs on the dollar.
- The ISM Manufacturing comes next in the docket.
The greenback now accelerates the daily decline and flirts with the 104.00 neighbourhood when tracked by the USD Index (DXY) on Thursday.
USD Index weaker on risk-on mood, Fed’s impasse
The index trades on the defensive and reverses two straight sessions with gains, including a new 2-month peak near 104.40 on May 31, against the backdrop of investors’ repricing of a pause in the Fed’s tightening cycle as soon as June.
Indeed, comments from FOMC Harker and Jefferson late on Wednesday suggested the Federal Reserve could "skip" a rate hike at the next gathering, triggering a change of heart among investors and a subsequent marked sell-off in the buck.
However, data releases in the US docket earlier on Thursday kept signalling a resilient US economy after the ADP report saw the US private sector adding nearly 280K jobs in May and weekly Claims rising by 232K in the week to May 26.
Later in the NA session, the ISM Manufacturing is expected to grab all the attention prior to Friday’s publication of May’s Nonfarm Payrolls (+190K exp.).
What to look for around USD
The index faces some selling pressure near the 104.00 region on the back of renewed optimism surrounding the risk-associated universe.
In the meantime, bets of another 25 bps at the Fed’s next gathering in June suddenly reversed course in spite of the steady resilience of key US fundamentals (employment and prices, mainly), denting the recent rally in the dollar and favouring a further decline in US yields.
Bolstering a pause by the Fed instead appears to be the extra tightening of credit conditions in response to uncertainty surrounding the US banking sector.
Key events in the US this week: ADP Employment Change, Initial Jobless Claims, Final Manufacturing PMI, ISM Manufacturing PMI, Construction Spending (Thursday) – Nonfarm Payrolls, Unemployment Rate (Friday).
Eminent issues on the back boiler: Debt ceiling. Persistent debate over a soft/hard landing of the US economy. Terminal Interest rate near the peak vs. speculation of rate cuts in late 2023/early 2024. Fed’s pivot. Geopolitical effervescence vs. Russia and China. US-China trade conflict.
USD Index relevant levels
Now, the index is losing 0.30% at 103.91 and faces the next support at 100-day SMA at 102.90 seconded by the 55-day SMA at 102.44 and finally 101.01 (weekly low April 26). On the other hand, the surpass of 104.69 (monthly high May 31) would open the door to 105.60 (200-day SMA) and then 105.88 (2023 high March 8).
Analysts at Credit Suisse discuss EUR/GBP outlook.
Sonia futures already price GBP as being a stand-out G10 high yielder by December
With spot now through our original, long-held EUR/GBP target at 0.8700, we now look for the pair to trade towards 0.8550.
Sonia futures already price GBP as being a stand-out G10 high yielder by December at a terminal rate around 5.50%, a rate reached by the BoE hiking by 25 bps at each of the next 4 meetings. While we think this is probably enough given the data flow and the BoE’s typically slow and deliberate approach, the simple fact that GBP will likely enjoy a material yield premium over the EUR for the far foreseeable future is likely still being digested after so many months of GBP having been a favourite market short. This is what allows for further EUR/GBP downside momentum towards our target.
Economists at Rabobank discuss USD/JPY outlook.
USD to remain firm this year
Given the risks that the US could be in recession by year-end, that the Eurozone could be stagnating in H2 and in view of the disappointing pace of China’s recovery, the window of opportunity for a policy change by the BoJ is likely to be very small and potentially non-existent.
We expect the USD to remain firm this year. Our forecast of a move back to USD/JPY 135.00 on a six-month view assumes the BoJ have made a step towards altering YCC.
- EUR/USD quickly reverses the post-ADP knee-jerk.
- US ADP report surprised to the upside in May.
- ISM Manufacturing takes centre stage later in the session.
The broad-based upbeat mood in the risk complex motivates EUR/USD to reclaim the area above the 1.0700 barrier on Thursday.
EUR/USD appears supported near 1.0630
EUR/USD manages to reverse a sharp weekly pullback to the 1.0630 region on Wednesday amidst the renewed downside pressure in the greenback, which in turn appears propped up by now rising expectations of a Fed’s pause at the June gathering.
The latter appears reinforced by comments from Fed’s Harker and Jefferson late on Wednesday, although firmer-than-expected results from the US labour market earlier on Thursday could put that idea to the test soon.
Extra support for the single currency emerges after ECB speakers – Lagarde, Kazaks, Rehn – who advocated for the continuation of the tightening bias in a context of sticky inflation.
Speaking about inflation, flash CPI for the broader Euroland saw prices gain 6.1% YoY in May and 5.3% from the Core print. Despite disinflationary pressures remained in place in May, the CPI still runs well above the ECB’s 2% goal.
In the US, the ADP report showed the US private sector added 278K jobs during last month and Initial Claims increased by 232K in the week ended on May 26th. Later in the NA session, the ISM Manufacturing will be in the centre of the debate seconded by Construction Spending and the final S&P Global Manufacturing PMI.
What to look for around EUR
The sell-off in EUR/USD seems to have met some initial contention around the 1.0630 region, or 2-month lows, so far this week.
In the meantime, the pair’s price action is expected to closely mirror the behaviour of the US Dollar and will likely be impacted by any differences in approach between the Fed and the ECB with regards to their plans for adjusting interest rates.
Moving forward, hawkish ECB speak continues to favour further rate hikes, although this view appears to be in contrast to some loss of momentum in economic fundamentals in the region.
Key events in the euro area this week: Germany Retail Sales/Final Manufacturing PMI, EMU Final Manufacturing PMI, Flash Inflation Rate, ECB Lagarde, ECB Accounts (Thursday).
Eminent issues on the back boiler: Continuation of the ECB hiking cycle in June and July (and September?). Impact of the Russia-Ukraine war on the growth prospects and inflation outlook in the region. Risks of inflation becoming entrenched.
EUR/USD levels to watch
So far, the pair is gaining 0.16% at 1.0705 and a break above 1.0811 (100-day SMA) would target 1.0883 (55-day SMA) en route to 1.1000 (round level). On the downside, initial contention comes at 1.0635 (monthly low May 31) seconded by 1.0516 (low March 15) and finally 1.0481 (2023 low January 6).
Economists at Scotiabank analyze USD/CAD technical outlook.
Another rejection of the 1.3650/60 area tilts near-term risks lower for USD/CAD
Another rejection of the 1.3650/60 area and a low close for the USD yesterday tilts near-term risks lower for USD/CAD.
After two failures at 1.3650 this week, more obvious USD weakness below the 1.3570 point (minor pivot and small double top trigger) should result in spot dropping back to 1.3490/00.
See – USD/CAD: Firm Canadian economic data should give Loonie a boost in the short run – Scotiabank
- Oil price recovers marginally after the House of Representatives votes through the debt-ceiling extension bill on Wednesday evening.
- Gains are capped by higher-than-expected inventory levels from the API, suggesting ample supply.
- Several Fed officials signal a “pause” may be appropriate at June meeting, though peak rate may be higher.
Oil price trades flat in the upper $67s (Brent in the lower $72s) on Thursday after making a small recovery from just above $67 reached the day before when sellers dominated the market. The rebound came after the US debt-ceiling extension bill was successfully voted through the House of Representatives, late on Wednesday evening. Oil price gained further support after several US Federal Reserve (Fed) officials said they thought interest rates should be left as they are at the next Fed meeting. Those gains were capped, however, after data from the American Petroleum Institute (API) showed a larger-than-expected rise in Oil inventories, indicating ample supply.
Oil news and market movers
- Oil recovers from the deep trough it fell into midweek after US Congressmen voted through the debt-ceiling extension deal, relieving investor fears that a rebel faction might derail the progress of legislation.
- The drama now moves to the Senate where a final vote on the agreement is expected before the end of Friday.
- Uncertainty over whether the Fed will hike or hold at the June 14 meeting shifted towards holding on Wednesday after Fed’s Philip Jefferson said he thought a pause before more hikes later might allow the economy time to digest current tightening and avoid bank stress.
- Expectations of a pause will weigh on the US Dollar, which is bullish for Oil price.
- Jefferson’s view of ‘pausing’ in June was backed up by Philadelphia Fed President Patrick Harker.
- Cleveland Fed President, Loretta Mester, however, said she saw no “compelling” reason to pause, in an interview with the Financial Times on Wednesday.
- The CME FedWatch tool, which provides an insight into the market view of the probability of future rate hikes, has flipped from previously showing odds favoring a 0.25% hike in June to an over 60% chance the Fed will leave rates unchanged.
- Two of OPEC+’s largest members, Russia and Saudi Arabia, appear to be clashing over policy ahead of the next OPEC meeting on June 4.
- According to sources in Riyadh, the Saudis are unhappy with the way Russia is allegedly flaunting quota cuts agreed at the October meeting, a report on Oilprice.com says.
- Although there is no official data available on Russian production, shipping data appears to corroborate the allegation they may have increased their Oil exports despite the OPEC+ agreement to cut.
- Last week, representatives of the two countries gave conflicting messages about the likely trajectory of the up-and-coming OPEC+ meeting.
- Saudi Oil Minister Prince Abdulaziz bin Salman seemed to imply OPEC+ might cut production quotas when he warned speculators (interpreted as short-sellers) to “watch out”, and expressed support for OPEC’s October decision to cut supply.
- On the other hand, Russia’s Energy Minister, Alexander Novak, played down the idea of production cuts, saying “I don't think that there will be any new steps, because just a month ago certain decisions were made regarding the voluntary reduction of oil production by some countries.”
Crude Oil Technical Analysis: Price bounces off support from 200-week SMA
WTI Oil price continues to decline as the longer-term bearish trend extends. Given the old saying about the trend being your friend, this favors short sellers over longs. WTI Oil is trading below all the major daily and weekly Simple Moving Averages (SMAs) but has found support at the 200-week SMA at $66.90 from where it is making an intraday recovery.
-638212215211439664.png)
WTI US Oil: Weekly Chart
Oil price has decisively broken below the May 22 lows of $70.65 as well as the $69.40 May 15 lows. Only the 200-week SMA now stands in the way of further losses. If it breaks below that too, it could lead to further weakness down to the year-to-date (YTD) lows of $64.31.
-638212215712795080.png)
WTI US Oil: Daily Chart
A break below the YTD lows would reignite the downtrend, with the next target at around $62.00, where trough lows from 2021 will come into play, followed by support at $57.50.
Oil price needs to climb back above the $74.70 May 24 highs to raise doubts about the dominant bearish trend.
Such a break might lead to a potential target in the $79.70s, which roughly coincides with the 200-day SMA and the main trendline for the bear market, heightening its importance as a key resistance level.
The long hammer Japanese candlestick pattern that formed at the May 4 (and YTD) lows is a sign that Oil price may have formed a strategic bottom at that level.
WTI Oil FAQs
What is WTI Oil?
WTI Oil is a type of Crude Oil sold on international markets. The WTI stands for West Texas Intermediate, one of three major types including Brent and Dubai Crude. WTI is also referred to as “light” and “sweet” because of its relatively low gravity and sulfur content respectively. It is considered a high quality Oil that is easily refined. It is sourced in the United States and distributed via the Cushing hub, which is considered “The Pipeline Crossroads of the World”. It is a benchmark for the Oil market and WTI price is frequently quoted in the media.
What factors drive the price of WTI Oil?
Like all assets, supply and demand are the key drivers of WTI Oil price. As such, global growth can be a driver of increased demand and vice versa for weak global growth. Political instability, wars, and sanctions can disrupt supply and impact prices. The decisions of OPEC, a group of major Oil-producing countries, is another key driver of price. The value of the US Dollar influences the price of WTI Crude Oil, since Oil is predominantly traded in US Dollars, thus a weaker US Dollar can make Oil more affordable and vice versa.
How does inventory data impact the price of WTI Oil
The weekly Oil inventory reports published by the American Petroleum Institute (API) and the Energy Information Agency (EIA) impact the price of WTI Oil. Changes in inventories reflect fluctuating supply and demand. If the data shows a drop in inventories it can indicate increased demand, pushing up Oil price. Higher inventories can reflect increased supply, pushing down prices. API’s report is published every Tuesday and EIA’s the day after. Their results are usually similar, falling within 1% of each other 75% of the time. The EIA data is considered more reliable, since it is a government agency.
How does OPEC influence the price of WTI Oil?
OPEC (Organization of the Petroleum Exporting Countries) is a group of 13 Oil-producing nations who collectively decide production quotas for member countries at twice-yearly meetings. Their decisions often impact WTI Oil prices. When OPEC decides to lower quotas, it can tighten supply, pushing up Oil prices. When OPEC increases production, it has the opposite effect. OPEC+ refers to an expanded group that includes ten extra non-OPEC members, the most notable of which is Russia.
- USD/JPY attracts fresh sellers following an early uptick amid a modest USD weakness.
- Diminishing odds for another 25 bps Fed rate hike in June continue to weigh on the buck.
- The upbeat US ADP report fails to impress the USD bulls or lend support to the major.
The USD/JPY pair struggles to capitalize on its intraday positive move and meets with a fresh supply in the vicinity of the 140.00 psychological mark on Thursday. Spot prices retreat to the lower end of the daily range and trade just above the 139.00 mark, or a one-week low touched earlier today, despite the better-than-expected US ADP report.
Data published by Automatic Data Processing (ADP) showed that US private sector employers added 278K jobs in May, lower than the 296K in the previous month, though well above consensus estimates for a reading of 170K. The initial market reaction fades rather quickly amid reduced bets for another 25 bps rate hike by the Federal Reserve (Fed) in June. This, in turn, keeps the US Dollar (USD) bulls on the defensive and acts as a headwind for the USD/JPY pair.
The Japanese Yen (JPY), on the other hand, is underpinned by the prospect of Japanese authorities intervening in the markets. In fact, Japan’s Vice Finance Minister for international affairs, Masato Kanda, hinted on Wednesday that authorities may act to curd the sinking Yen, saying that they will closely watch currency market moves and respond appropriately as needed. Apart from this, a weaker risk tone benefits the safe-haven JPY and exerts pressure on the USD/JPY pair.
The market sentiment remains fragile amid growing worries about a global economic slowdown, particularly in China. It is worth recalling that official PMI data released earlier this week had shown a sustained downturn in the world's second-largest economy. This, to a larger extent, overshadows a private survey, which showed that China’s manufacturing sector registered modest growth in May and the progress towards averting an unprecedented US debt default.
The aforementioned fundamental backdrop suggests that the path of least resistance for the USD/JPY pair is to the downside. Bearish traders, however, might refrain from placing aggressive bets and prefer to move to the sidelines ahead of the release of the closely-watched US monthly employment details, popularly known as the NFP report on Friday. In the meantime, the US ISM Manufacturing PMI, along with Fedspeak, might produce short-term trading opportunities on Thursday.
Technical levels to watch
- US Q1 Unit Labor Costs are revised sharply lower from 6.3% to 4.2%.
- US Dollar pulls back after the data, offsetting the ADP impact.
Nonfarm business sector labor productivity decreased 2.1% in the first quarter of 2023. Labor productivity was revised up 0.6%, the combined effect of a 0.3-percentage point upward revision to output and a 0.4-percentage point downward revision to hours worked.
“From the same quarter a year ago, nonfarm business sector labor productivity decreased 0.8 percent, reflecting a 1.4-percent increase in output and a 2.2-percent increase in hours worked. The 0.8-percent productivity decline is the first time the four-quarter change series has remained negative for five consecutive quarters; this series begins in the first quarter of 1948”, said the Bureau of Labor Statistics.
“Unit labor costs in the nonfarm business sector increased 4.2% percent in the first quarter of 2023, reflecting a 2.1-percent increase in hourly compensation and a 2.1-percent decrease in productivity. Unit labor costs increased 3.8 percent over the last four quarters”, added the press release. Unit labor costs in the manufacturing sector increased 3.1% in Q1, reflecting a 0.5%increase in hourly compensation and a 2.5% decrease in productivity. From the same quarter a year ago, manufacturing ULC increased 4.5%.
Market reaction:
Usually, the ULC report has a muted reaction but the sharp revision shows less inflationary pressures than initially reported. The US Dollar weakened after the report and US yields declined, offsetting the reaction to the ADP Employment report release earlier which surpassed expectations. The DXY turned negative for the day, and it was falling toward 104.00.
- Initial Jobless Claims in the US rose by 2,000 in the week ending May 27.
- Continuing Jobless Claims increased by 6,000 in the week ending May 20.
- US Dollar Index rebounds after ADP, losses momentum after Unit Labor Costs report.
Initial Jobless claims totaled 232,000 in the week ending May 27, the weekly data published by the US Department of Labor (DOL) showed on Thursday. The print follows the previous week's 230,000 and came in below market expectations of 235,000. It is the highest reading in four weeks. “The 4-week moving average was 229,500, a decrease of 2,500 from the previous week's revised average”, the DOL added in its press release.
“The advance seasonally adjusted insured unemployment rate was 1.2 percent for the week ending May 20, unchanged from the previous week’s unrevised rate”. Continuing Claims advanced by 6,000 in the week ended May 20 to 1.795 million, below the 1.8 million of market consensus.
Market reaction:
The US Dollar gained momentum following the release of the latest employment data. The ADP report exceeded expectations, revealing an increase in private payrolls by 278,000 in May. The next crucial jobs report is the Nonfarm payrolls due on Friday. The DXY is at 104.10, modestly lower for the day.
- GBP/USD turns positive for the fifth straight day and climbs to a two-week high.
- Diminishing odds for a Fed rate hike in June weigh on the USD and lend support.
- The upbeat US ADP report limits the USD losses and caps the upside for the pair.
The GBP/USD pair reverses an intraday dip to the 1.2400 round-figure mark and turns positive for the fifth successive day on Thursday. Spot prices, however, retreat a few pips from a two-week high touched during the early North American session and trade around mid-1.2400s following the release of the US ADP report.
The US Dollar (USD) ticks higher after Automatic Data Processing (ADP) reported that private sector employers added 278K jobs in May, higher than 170K expected, and caps the upside for the GBP/USD pair. That said, reduced bets for another 25 bps rate hike by the Federal Reserve (Fed) in June keep the USD below its highest level since mid-March touched the previous day and continues to lend support to the major.
It is worth recalling that a duo of FOMC members on Wednesday showed a willingness to pause interest rate hikes this month. Furthermore, the progress towards averting an unprecedented US debt default undermines the safe-haven buck and acts as a tailwind for the GBP/USD pair. In fact, the US House of Representatives voted in favour of a bill to suspend the debt ceiling late Wednesday and the deal now heads to the Senate for approval.
This, along with expectations that the Bank of England (BoE) could raise rates further, suggests that the path of least resistance for the GBP/USD pair is to the upside. Even from a technical perspective, a move beyond the 50-day Simple Moving Average (SMA) adds credence to the positive outlook. This, in turn, supports prospects for an extension of the recent bounce from the 1.2300 mark, or its lowest level since early April touched last week.
Technical levels to watch
CAD pushes higher as economy retains firm momentum, economists at Scotiabank report.
Recent narrowing in US/Canada spreads should help curb CAD softness
Canada’s GDP data reports yesterday reflected an economy that retains a lot of momentum. Q1 GDP was stronger than forecast (and well above BoC projections). Monthly data showed Mar activity holding up better than forecast, with early signs of a firm hand off to Apr. This should tilt risks more clearly towards our call that an additional 25 bps hike from the BoC is warranted.
Firm economic data and the recent narrowing in US/Canada spreads should help curb CAD softness and give it a bit of a boost in the short run.
- Employment in US private sector rose more than expected in May.
- US Dollar Index stays in daily range above 104.00 after the data.
The data published by Automatic Data Processing (ADP) showed on Thursday that private sector employment in the US rose by 278,000 in May. This reading surpassed the market expectation of 170,000 by a wide margin. The 296,000 increase recorded in April got revised lower to 291,000.
Regarding wage developments, "last month brought a broad-based slowdown in pay increases. Job changers saw a gain of 12.1%, down a full percentage point from April," the ADP noted. "For job stayers, the increase was 6.5 percent in May, down from 6.7%."
Commenting on the report's findings, “this is the second month we've seen a full percentage point decline in pay growth for job changers,” said Nela Richardson, chief economist, ADP. “Pay growth is slowing substantially, and wage-driven inflation may be less of a concern for the economy despite robust hiring.”
Market reaction
With the initial reaction, the US Dollar Index edged slightly higher and was last seen trading flat on the day near 104.20.
GBP/USD has regained a little ground on the session after weakening back to the 1.24 area. Economists at Scotiabank analyze the pair’s technical outlook.
Gains are still confined to a short-term consolidation range
The GBP/USD pair is firmer but gains are still confined to a short-term consolidation range which may limit the Pound’s ability to rally further in the near term.
Sustained gains through 1.2460/70 (40-Day Moving Average at 1.2467) in the near-term will confer a stronger technical tone on Cable and point towards gains extending to the mid-1.25s.
- EUR/USD stages decent support to the area above 1.0700.
- The resumption of the downside could retest 1.0635.
EUR/USD rebounds from 2-month lows in the 1.0630 region and reclaims the area just beyond 1.0700 the figure on Thursday.
The pair remains under heavy pressure and a breach of the May low at 1.0635 (May 31) could pave the way to a drop to 1.0600 prior to the March low at 1.0516 (March 15).
A deeper pullback to the 2023 low at 1.0496 (January 6) would likely need a sharp deterioration of the outlook, which appears not favoured for the time being.
Looking at the longer run, the constructive view remains unchanged while above the 200-day SMA, today at 1.0492.
EUR/USD daily chart
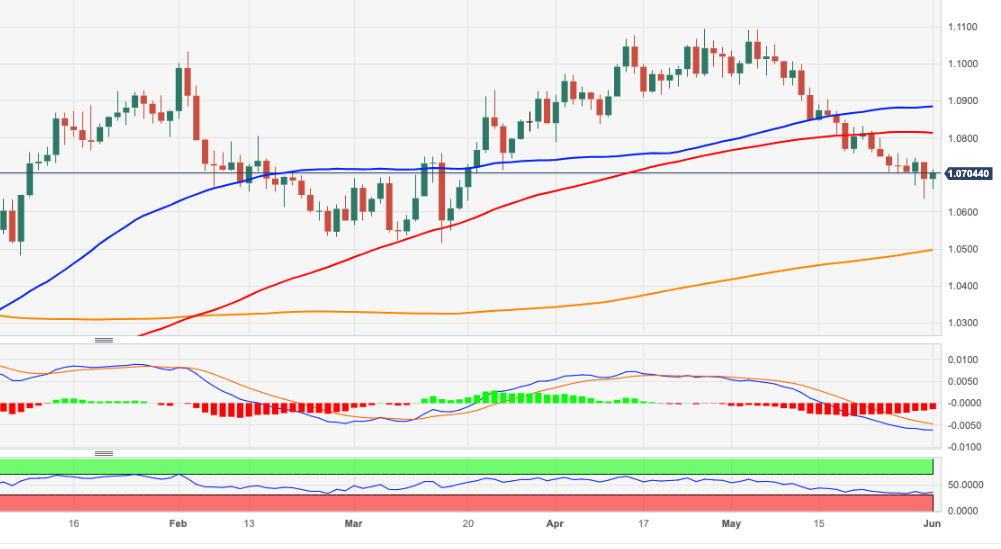
- DXY gives away some gains following Wednesday’s fresh tops.
- The index could embark on a consolidative phase in the near term.
DXY comes under pressure and challenges the 104.00 support on Thursday after hitting fresh multi-week peaks in the boundaries of the 104.70 zone in the previous session.
The index could move into a range bound theme in the very near term ahead of the potential resumption of the uptrend. That said, the surpass of the May high at 104.69 (May 31) should put a potential visit to the key 200-day SMA, today at 105.60, back on the radar prior to the 2023 top of 105.88 (March 8).
Looking at the broader picture, while below the 200-day SMA the outlook for the index is expected to remain negative.
DXY daily chart
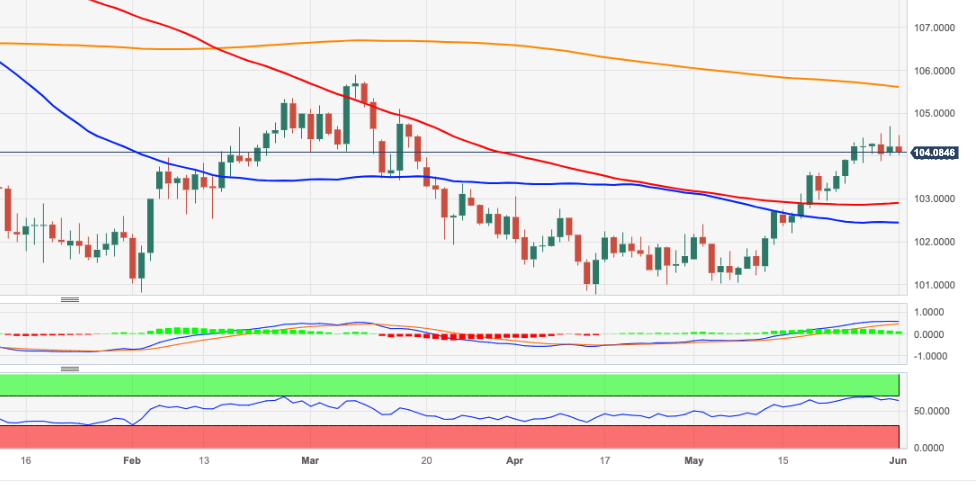
EUR/USD recovers from upper 1.06s. Economists at Scotiabank analyze the world's most popular currency pair technical outlook.
Broader signals are mixed
Modest gains back through the 1.07 area suggest a slightly firmer underlying tone for the EUR on the session, with the chance of gains extending towards the 1.0730/40 resistance zone again.
Broader signals are mixed; the EUR looks soft but has edged decisively off yesterday’s lows while bearish pressure on spot after losing support in the low 1.07s has not been consistent.
- EUR/JPY regains buying interest and surpasses 149.00.
- Immediately to the upside emerges the 151.00 zone.
EUR/JPY manages to pick up traction and retakes the 149.00 mark and beyond after three consecutive daily pullbacks on Thursday.
Further recovery appears a plausible near-term scenario, and a convincing breakout of the round level at 151.00 could encourage the cross to confront the 2023 top at 151.61 (May 2) in the not-so-distant future.
So far, further upside looks favoured while the cross trades above the 200-day SMA, today at 143.89.
EUR/JPY daily chart
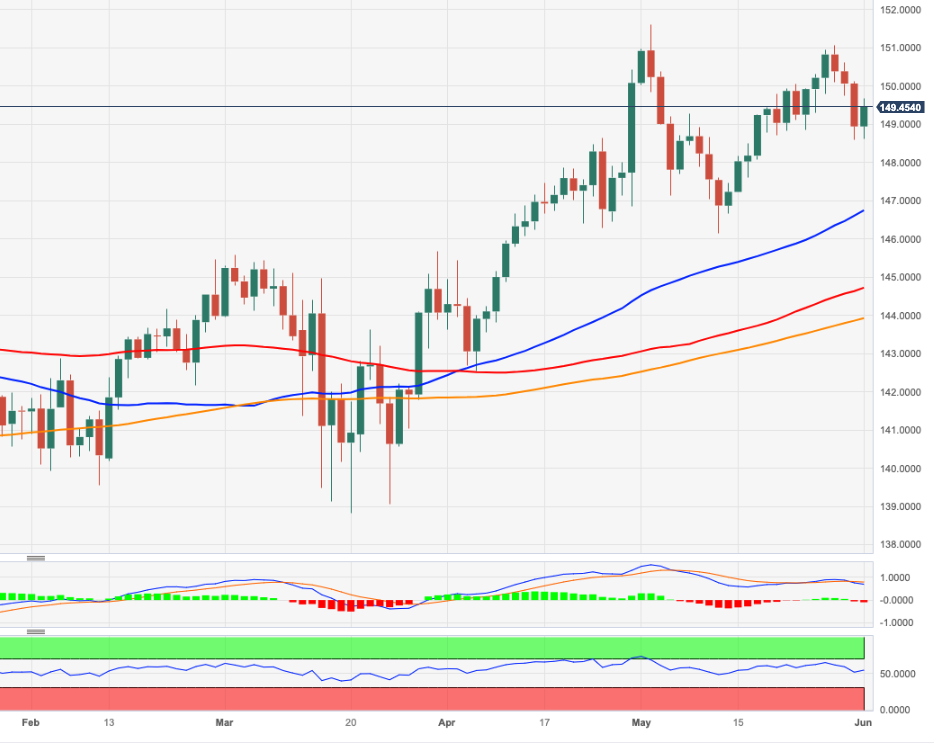
Strategists at Société Générale analyze Brent's technical outlook.
Inability to overcome resistance zone of $79/81 could lead to extension in the downtrend
Brent has so far defended the trough of March near $70 however a meaningful rebound has remained elusive.
Inability to overcome the resistance zone of $79/81 representing the 50-DMA and a multi-month descending trend line could lead to extension in the downtrend.
A break below $70 is expected to result in regain of downward momentum; next potential objectives could be at December 2021 low of $65/63 and $57.
The accounts of the European Central Bank's (ECB) May policy meeting revealed on Thursday that a number of members initially expressed a preference for increasing the key interest rates by 50 basis points.
Key takeaways
"More decisive action was warranted to move rates into sufficiently restrictive territory to ensure a timely return of inflation to target."
"Most of these members indicated that they could accept the proposed rate increase of 25 basis points."
"The ECB's communication should, however, convey a clear directional bias."
"Almost all members supported the 25 basis point rate rise."
"There was a strong preference against returning to outright forward guidance."
"Members widely viewed financial markets as being able to digest a full portfolio run-off."
"Caution was also expressed against too fast a contraction in the Eurosystem balance sheet."
"There was now more solid evidence that monetary policy was being transmitted to financing and credit conditions."
"It was also argued that transmission could be weaker than usual."
"Emphasis was placed on the evidence that various measures of longer-term inflation expectations had edged up above 2%."
Market reaction
EUR/USD continues to trade in positive territory above 1.0700 following the ECB's publication.
Economists at Credit Suisse discuss USD/JPY outlook after the pair broke above the 140 level.
Verbal intervention alone unlikely to turn the USD/JPY’s upward trajectory
As for USD/JPY, spot’s move above 140 finally elicited a response from the authorities. While this led to a reversal in USD/JPY back below 140.00, it is doubtful that verbal intervention of this kind alone is likely to turn the pair’s upward trajectory.
If US data further validate Fed hawkishness this week we can see USD/JPY quickly target 145.00, at which point the risks of actual intervention ahead of the next BoJ meeting would multiply.
US ADP jobs report overview
Wednesday's US economic docket highlights the ADP report on private-sector employment for May, due for release later during the early North American session, at 12:15 GMT. Consensus estimates point to an addition of 170K private-sector jobs during the reported month, down sharply from the 296K in April. The data will provide fresh insight into the US labour market conditions and drive expectations for the official jobs report, popularly known as NFP scheduled on Friday.
According to Yohay Elam, Senior Analyst FXStreet: “After leaping to the highest level since July 2022 in the latest April publication, the upcoming May report could be weak. If my scenario materializes, investors' knee-jerk reaction would be to sell the US Dollar on estimates that the odds for a rate hike in June are lower. It is essential to note that officials at the Federal Reserve (Fed) are split on whether to increase borrowing costs or pause. Bond markets reflect that uncertainty with roughly even odds – and any data point could make a difference.”
How could the data affect EUR/USD?
Ahead of the US labour market data, the US Dollar (USD) remains below its highest level since mid-March set on Wednesday amid reduced bets for another 25 bps rate hike by the Federal Reserve (Fed) in June. Hence, any disappointment from the ADP report might prompt fresh USD selling, allowing the EUR/USD pair to build on its modest intraday positive move back above the 1.0700 round-figure mark.
Conversely, a stronger reading is unlikely to impress the USD bulls amid bets that the Fed will eventually pause its rate-hiking cycle and ahead of the official jobs report, popularly known as NFP on Friday. This, in turn, suggests that the immediate market reaction to a positive surprise is more likely to be muted, warranting some caution before placing aggressive bearish bets around the EUR/USD pair.
Eren Sengezer, Editor at FXStreet, offers a brief technical outlook and outlines important technical levels to trade the major: “EUR/USD stays outside the descending regression but is yet to make a four-hour close above the 20-period Simple Moving Average (SMA), currently located at 1.0700. In case this level is confirmed as support, the pair could target 1.0740/50 (50-period SMA, Fibonacci 61.8% retracement level of the latest uptrend) and 1.0800 (100-period SMA, Fibonacci 50% retracement).”
“If EUR/USD drops below 1.0680 and returns within the descending channel, 1.0650 (mid-point of the descending channel) and 1.0630 (lower-limit of the descending channel) could be seen as next support levels,” Eren adds further.
Key Notes
• US ADP Employment, ISM Manufacturing PMI Preview: First down, then up for US Dollar?
• EUR/USD Forecast: Sellers struggle to retain control despite soft EU inflation
• EUR/USD to test 200-DMA at 1.0491 on strong US data – Credit Suisse
About the US ADP jobs report
The Employment Change released by the Automatic Data Processing, Inc, Inc is a measure of the change in the number of employed people in the US. Generally speaking, a rise in this indicator has positive implications for consumer spending, stimulating economic growth. So a high reading is traditionally seen as positive, or bullish for the USD, while a low reading is seen as negative, or bearish.
Economists at Commerzbank discuss USD outlook ahead of Friday’s Nonfarm Payrolls report.
Fed to take action and raise the key interest rate again on strong US data
If the US labour market report for May is strong and above expectations, the Dollar could rise.
Yesterday, the rebound in the number of job openings (JOLTS Job Openings) already came as a surprise. Today, the market is therefore likely to look at the ADP index and the subcomponents on prices and employment from the ISM index to get a first picture of how the labour market held up in May. After all, if it remained strong, this increases the likelihood that the Fed will take action and raise the key interest rate again.
- US Dollar has been struggling to preserve its bullish momentum on Thursday.
- US Dollar Index retreats toward 104.00 from multi-month high it set above 104.50.
- US ADP employment data could impact the US Dollar's valuation.
The US Dollar (USD) has lost its traction after having outperformed its major rivals on Wednesday. The US Dollar Index, which tracks the USD's valuation against a basket of six major currencies, was last seen declining toward 104.00 from the multi-month high it touched above 104.50 mid-week.
The USD's valuation could be impacted by the monthly private sector employment data published by Automatic Data Processing (ADP) in the second half of the day. The US economic docket will also feature a revision to the first-quarter Unit Labor Costs and the ISM's Manufacturing PMI survey for May. In the meantime, investors will be paying close attention to comments from Federal Reserve (Fed) officials before the blackout period starts on Saturday.
Daily digest market movers: US Dollar loses strength as dovish Fed bets return
- Philadelphia Fed President Patrick Harker noted on Wednesday that he was leaning toward a pause in rate hikes in June but noted that incoming data may change his mind.
- Federal Reserve Governor Philip Jefferson said that pausing rate hikes at the next FOMC meeting would offer time to analyse more data before making a decision about the extent of additional tightening.
- According to the CME Group FedWatch Tool, the probability of one more 25 basis points (bps) Fed rate hike at the upcoming meeting declined below 40% from nearly 70% early Wednesday.
- The House of Representatives passed a bill to suspend the debt limit through January 1, 2025. US stock index futures trade modestly higher on Thursday.
- The US Bureau of Labor Statistics reported on Wednesday that the number of job openings on the last business day of April stood at 10.1 million, compared to 9.74 million in March. This reading came in higher than the market expectation of 9.37 million and provided a short-lasting boost to the USD.
- In an interview with the Financial Times, Cleveland Federal Reserve (Fed) Bank President Loretta Mester said that she doesn't necessarily see a compelling reason for pausing rate increases amid a "really embedded, stubborn inflationary pressure.”
- Previewing the ADP data, "not only have ADP's figures jumped from miss to beat and the other way around, but these differences have also been significant, especially in recent months," said FXStreet Analyst Yohay Elam. "After leaping to the highest level since July 2022 in the latest April publication, the upcoming May report could be weak."
- Consumer sentiment in the US weakened slightly in May with the Conference Board's (CB) Consumer Confidence Index edging lower to 102.3 from 103.7 in April (revised from 101.3). The Present Situation Index declined to 148.6 from 151.8 and the Consumer Expectations Index stayed virtually unchanged at 71.5. Finally, the one-year consumer inflation expectations ticked down to 6.1% in May from 6.2% in April.
- House prices in the US rose by 0.6% on a monthly basis in March, the monthly data published by the US Federal Housing Finance Agency showed on Tuesday. This reading followed February's increase of 0.7% (revised from 0.5%) and came in better than the market expectation of +0.2%.
Technical analysis: US Dollar Index closes in on key support level
The recent action of the US Dollar Index (DXY) confirmed 104.50 as a strong technical resistance in the near term. 104.00 (Fibonacci 23.6% retracement of the November-February downtrend) aligns as key support for DXY and a daily close below that level could open the door for an extended slide toward 103.00, where the 100-day Simple Moving Average (SMA) and the 20-day SMA meet.
On the flip side, buyers could remain interested in case 104.00 stays intact. In that scenario, 104.50 (static level) aligns as first hurdle before DXY could target 105.00 (psychological level, static level) and 105.60 (200-day SMA, Fibonacci 38.2% retracement).
How does Fed’s policy impact US Dollar?
The US Federal Reserve (Fed) has two mandates: maximum employment and price stability. The Fed uses interest rates as the primary tool to reach its goals but has to find the right balance. If the Fed is concerned about inflation, it tightens its policy by raising the interest rate to increase the cost of borrowing and encourage saving. In that scenario, the US Dollar (USD) is likely to gain value due to decreasing money supply. On the other hand, the Fed could decide to loosen its policy via rate cuts if it’s concerned about a rising unemployment rate due to a slowdown in economic activity. Lower interest rates are likely to lead to a growth in investment and allow companies to hire more people. In that case, the USD is expected to lose value.
The Fed also uses quantitative tightening (QT) or quantitative easing (QE) to adjust the size of its balance sheet and steer the economy in the desired direction. QE refers to the Fed buying assets, such as government bonds, in the open market to spur growth and QT is exactly the opposite. QE is widely seen as a USD-negative central bank policy action and vice versa.
Economists at Credit Suisse revise their USD/CNH forecast range to 6.90-7.30 and expect FX “smoothening” to continue near key levels of 7.15, 7.20, and 7.25.
Yuan has further room to fall
Surprises in US data and the re-pricing of June / July Fed expectations have added the narrative of US-China monetary divergence: we revise our USD/CNH forecast range 3% higher (to 6.90-7.30) to reflect the recent USD rally.
The market’s current pessimism on China’s recovery, and its prior overweight position in China equities, suggest that the Yuan has further room to fall. However, we expect FX ‘smoothening’ to continue near key levels of 7.15, 7.20, and 7.25 to ensure that Yuan weakness does not amplify market pessimism.
For the PBoC, we think the short-term ‘red line’ is 7.35 – that would be above the Nov 2022 highs and a new all-time high for USD/CNH. Until USD/CNH nears 7.30-7.35, we think further Yuan weakness will be permitted, though the pace of weakness will likely continue to be managed.
- EUR/GBP gains positive traction on Thursday and snaps a four-day losing streak to the YTD low.
- Bets for more rate hikes by the ECB underpin the shared currency and lend support to the cross.
- The intraday uptick seems rather unaffected by softer-than-expected Eurozone consumer inflation.
The EUR/GBP cross attracts some buyers near the 0.8585-0.8580 region on Thursday and for now, seems to have snapped a four-day losing streak to a fresh YTD low touched the previous day. Spot prices add to the modest intraday gains and climb back above the 0.8600 mark during the first half of the European session, though any meaningful recovery still seems elusive.
The shared currency draws some support from the recent hawkish comments by several European Central Bank (ECB) officials, backing the case for additional rate hikes in the coming months, and assists the EUR/GBP cross to gain some positive traction. The bets were reaffirmed by ECB President Christine Lagarde on Thursday, saying that we need to continue our hiking cycle until we are sufficiently confident that inflation is on track to return to our target in a timely manner.
This, to a larger extent, overshadows softer-than-expected Eurozone consumer inflation figures. In fact, the latest data published by Eurostat showed that the annual Eurozone Harmonised Index of Consumer Prices (HICP) decelerated from the 7.0% YoY rate to 6.1% in May, missing consensus estimates for a reading of 6.3%. Furthermore, the Core HICP inflation dropped to 5.3% YoY in May as against market expectations for a modest downtick to 5.5% from the 5.6% in the previous month.
The upside potential for the EUR/GBP cross, meanwhile, seems limited amid expectations for further policy tightening by the Bank of England (BoE), which might continue to underpin the British Pound. In fact, the markets now predict the interest rate in the UK to reach 5.5% by the autumn and the bets were lifted by stronger UK consumer inflation figures released last week. This, in turn, warrants some caution before positioning for any meaningful appreciating move for the cross.
Technical levels to watch
During a speech in Brussels on Thursday, European Central Bank Governing Council member Klaas Knot said it’s not unlikely that 2024 interest rate-cut bets will have to be adjusted.
Additional quotes
“Financial markets are already pricing in interest-rate cuts for next year.”
“If they have to adjust this expectation, which is not unlikely, this could lead to new corrections.”
“It's time to rethink liquidity buffers after the collapse of SVB.”
In May, Euro area inflation surprised to the downside. Subsequently, economists at Commerzbank expect the ECB to deliver a final 25 basis points hike in June.
Euro area inflation rate drops to 6.1%
In the Euro area, the inflation rate continues to retreat. In May, it fell from 7.0% to 6.1%. Following the marked decline in energy prices, a correction is now also emerging in food prices, which had previously risen sharply.
Even more important from the ECB's point of view, however, is the fact that underlying inflation has probably passed its peak. This supports our expectation that the ECB will raise key interest rates by 25 bps for the last time in June.
Economist at UOB Group Enrico Tanuwidjaja comments on the recent interest rate decision by the Bank of Thailand (BoT).
Key Takeaways
Bank of Thailand (BOT) voted unanimously to raise the policy rate by 25bps from 1.75% to 2.00%, pushing its policy rate higher than the pre-pandemic level. BOT was not explicit in signaling the end of its rate hike cycle and seemed relatively sanguine.
BOT is more confident of stronger growth momentum ahead, of which we are less sanguine of. BOT forecasted the Thai economy to grow at 3.6% in 2023 and further accelerate to 3.8% in 2024. Full year inflation is projected to return to its 1-3% target range this year and next at 2.5% and 2.4% respectively.
We revised our view that BOT has reached its terminal rate of 2.00% and will keep it at the current level for the rest of this year. We also keep our forecast for the rate cut to start in the early part of 2024 as growth momentum may stall while inflation is coming back steadily to BOT’s target range of 1-3%.
Having enjoyed a decent rally on the back of some surprisingly strong JOLTS job opening data, the Dollar sold off late yesterday. Economists at ING expect USD to hold gains as we head into tomorrow's jobs report.
DXY could trade in a 104.00-104.50 range
Ahead of tomorrow's May Nonfarm Payrolls report, today sees the release of ISM Manufacturing, Initial Claims and the ADP employment report. A slightly better external environment – China's small-business PMI was better than expected in May – could see the Dollar edge marginally lower were US data to come in on the soft side today.
However, we doubt the USD will go too far ahead of tomorrow's more important jobs and wage data. DXY could trade in a 104.00-104.50 range and if the Fed policy rate could be flatlining after all this summer then expect further interest in the carry trade. Here, USD/JPY could grind back to the 141 area.
European Central Bank (ECB) President Christine Lagarde said in an appearance on Thursday, “we need to continue our hiking cycle until we are sufficiently confident that inflation is on track to return to our target in a timely manner.”
Additional comments
“Inflation is too high and it is set to remain so for too long.”
“Hikes are already feeding forcefully into bank lending conditions.”
“We cannot yet say that we are satisfied with the inflation outlook.”
“A period of catch-up wage growth need not cause unduly persistent inflation over time.”
Market reaction
EUR/USD is looking to 1.0700 on the above comments. The pair is trading at 1.0694, up 0.04% on the day.
- EUR/USD treads water just below the 1.0700 region.
- Flash EMU CPI rises 6.1% YoY in May, Core CPI up 5.3%.
- US ADP report, ISM Manufacturing take centre stage on Thursday.
EUR/USD alternates gains with losses below the 1.0700 hurdle following Wednesday’s bounce off multi-week lows near 1.0630 on Thursday.
EUR/USD now focuses on data
EUR/USD trades at shouting distance from the 1.0700 barrier, although without a clear direction, on the back of the equally flattish mood in the greenback on Thursday.
In fact, the pair manages to put further distance from Wednesday’s sharp pullback to the 1.0635/30 band, as investors continue to adjust to recent comments from Fed speakers suggesting the probability that the Fed could stay on the sidelines at its next meeting on June 14.
Further news bolstering optimism among traders notes that a divided House passed a bill suspending the $31.4 trillion debt ceiling late on Wednesday, with majority backing from both Democrats and Republicans, raising hopes that it would be approved by the Senate before the weekend.
In the domestic calendar, preliminary inflation figures in the broader euro bloc see the headline CPI rising 6.1% YoY in May and 5.3% YoY when it comes to the Core print. In addition, the Unemployment Rate in the region receded to 6.5% in April. Earlier, Retail Sales in Germany expanded 0.8% MoM in April and contracted 4.3% over the last twelve months, while the final Manufacturing PMI came in at 42.9. Later in the session, the ECB will publish its Accounts of the May 4 gathering.
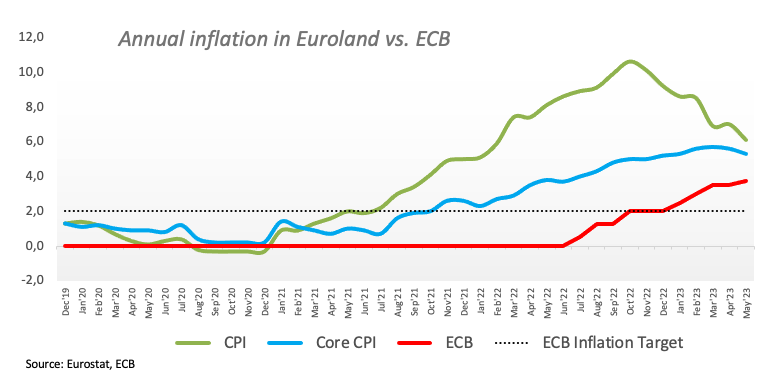
Across the pond, the ADP report is due, followed by Initial Claims, the ISM Manufacturing PMI, the final S&P Global Manufacturing PMI and Construction Spending. In addition, Philly Fed P. Harker is due to speak in the European evening.
What to look for around EUR
The sell-off in EUR/USD seems to have met some initial contention around the 1.0630 region, or 2-month lows, so far this week.
In the meantime, the pair’s price action is expected to closely mirror the behaviour of the US Dollar and will likely be impacted by any differences in approach between the Fed and the ECB with regards to their plans for adjusting interest rates.
Moving forward, hawkish ECB speak continues to favour further rate hikes, although this view appears to be in contrast to some loss of momentum in economic fundamentals in the region.
Key events in the euro area this week: Germany Retail Sales/Final Manufacturing PMI, EMU Final Manufacturing PMI, Flash Inflation Rate, ECB Lagarde, ECB Accounts (Thursday).
Eminent issues on the back boiler: Continuation of the ECB hiking cycle in June and July (and September?). Impact of the Russia-Ukraine war on the growth prospects and inflation outlook in the region. Risks of inflation becoming entrenched.
EUR/USD levels to watch
So far, the pair is gaining 0.03% at 1.0691 and a break above 1.0811 (100-day SMA) would target 1.0883 (55-day SMA) en route to 1.1000 (round level). On the downside, initial contention comes at 1.0635 (monthly low May 31) seconded by 1.0516 (low March 15) and finally 1.0481 (2023 low January 6).
- AUD/USD gains some positive traction on Thursday, albeit lacks follow-through.
- A goodish pickup in the US bond yields underpins the USD and caps the upside.
- The downside seems limited as traders look to the US data for a fresh impetus.
The AUD/USD pair attracts some buyers on Thursday, albeit lacks bullish conviction and trims a part of its modest intraday gains during the early part of the European session. Spot prices currently trade around the 0.6500 psychological mark and remain well within the striking distance of the lowest level since November 2022 touched on Wednesday.
The Australian Dollar (AUD) did get a minor lift after a private survey released today showed that China’s manufacturing sector unexpectedly registered modest growth in May, raising hopes of a recovery in the world's second-largest economy. That said, official data released earlier this week had shown a sustained downturn, which, along with broad-based US Dollar (USD) strength, keeps a lid on any further gains for the AUD/USD pair.
In fact, the USD Index (DXY), which tracks the Greenback against a basket of currencies, steadily climbs back closer to its highest level since mid-March touched on Wednesday amid a goodish pickup in the US Treasury bond yields. The upside for the USD, however, is likely to remain limited, at least for now, in the wake of reduced bets for another 25 bps rate hike by the Federal Reserve (Fed) at its upcoming monetary policy meeting in June.
Apart from this, expectations that the Reserve Bank of Australia (RBA) could tighten its monetary policy further could act as a tailwind for the AUD/USD pair and help limit losses. It is worth recalling that RBA Governor Philip Lowe had warned on Wednesday that sticky prices could invite more rate hikes by the central bank. This was followed by the release of stronger domestic consumer inflation figures, which might lend support to the Aussie.
Market participants now look forward to the US economic docket, featuring the ADP report on private-sector employment, the usual Weekly Initial Jobless Claims and the ISM Manufacturing PMI. This, along with Fedspeaks, the US bond yields and the broader risk sentiment, will influence the USD price dynamics and provide some impetus to the AUD/USD pair. The focus will then shift to the release of the crucial US NFP report on Friday.
Technical levels to watch
The annual Eurozone Harmonised Index of Consumer Prices (HICP) rose in May vs. April’s 7.0%, according to the latest data published by Eurostat this Thursday. The HICP inflation gauge beat expectations for a 6.3% increase.
The Core HICP inflation dropped to 5.3% YoY in May as against the expected 5.5% clip, down from the 5.6% figure booked in April.
On a monthly basis, the old continent’s HICP showed no growth in May vs. April’s 0.6% increase. The core HICP inflation arrived at 0.2% in the reported month when compared to 0.8% expected and 1.0% seen in April.
Germany’s annual HICP for May, released on Wednesday, rose 6.3%, missing 6.8% estimates while slowing from a 7.6% advance seen previously.
Note that the European Central Bank’s (ECB) inflation target is 2%.
The bloc’s HICP figures have a significant impact on the market’s pricing of the ECB rate hikes. Markets are currently pricing an 85% probability of a 25 basis points (bps) ECB rate increase in June.
Key details (via Eurostat)
“Looking at the main components of euro area inflation, food, alcohol & tobacco is expected to have the highest annual rate in May (12.5%, compared with 13.5% in April), followed by non-energy industrial goods (5.8%, compared with 6.2% in April), services (5.0%, compared with 5.2% in April) and energy (-1.7%, compared with 2.4% in April).”
EUR/USD reaction
The shared currency is picking up minor bids on softer Eurozone inflation data. EUR/USD is recovering toward 1.0700, currently trading at 1.0685, almost unchanged on the day.
Ho Woei Chen, CFA, Economist at UOB Group, reviews the latest set of data releases in the Chinese economy.
Key Takeaways
“China’s official manufacturing and non-manufacturing PMIs eased further and were both weaker than expected in May. The disinflationary pressure has also increased with the output and selling prices falling.”
“Economic indicators since Apr suggested that China’s recovery is losing momentum. For now, we maintain our growth forecast for China at 5.6% in 2023 with 2Q23 at 7.8% y/y (1Q23: 4.5%).”
“Looking ahead, positive drivers include improvements in domestic services demand, stabilising property market and an expected upturn in global electronics demand while tightening global liquidity, increase in domestic Covid19 infections and geopolitical tensions are the key risks.”
“We also maintain our call for another cut to banks’ reserve requirement ratio (RRR) this year but see less chance of a resumption in interest rate cut while there is also expectation that the government will be rolling out incentives to boost high-end manufacturing.”
According to the latest Bank of England (BoE) Monthly Decision Maker Panel (DMP) survey released on Thursday, the UK businesses see year-ahead Consumer Price Index (CPI) at 5.9% in May vs 5.6% in April.
Additional findings
UK businesses see year-ahead output price inflation at 5.4% in 3 months to May vs 5.5% in 3 months to April.
UK businesses see year-ahead output price inflation at 5.1% in May vs 5.9% in April.
UK businesses see 3-year-ahead CPI at 3.5% in May vs 3.4% in April.
54% of UK firms reported that the overall level of uncertainty facing their business was high or very high.
Annual investment growth has fallen back to around 5% over recent months.
Dmp survey closed before the latest CPI inflation release on 24 May.
Market reaction
GBP/USD was last seen trading at 1.2430, down 0.09% on the day.
Economists at Credit Suisse now look to fade AUD/USD rallies to 0.6600 targeting 0.6385.
Looking to fade AUD/USD rallies to 0.6600
While we’ve held a neutral target in Q2 on AUD, our strategic preference has been to fade rallies rather than to buy dips: the potential we see for AUD to lose some of the RBA policy support it enjoyed in May keeps this bias intact.
As such, while our 0.6600 neutral target has served us well so far in Q2, we are now inclined to view it as a level where we would look to fade AUD/USD strength into quarter-end, targeting 0.6385 and allowing us to set the appropriate risk-reward with a stop loss at the 200-DMA, around 0.6700.
- USD/JPY regains positive traction on Thursday and snaps a three-day losing streak.
- A goodish pickup in the US bond yields boosts the USD and lends support to the pair.
- Reduced bets for more Fed rate hikes and intervention warnings could cap the major.
The USD/JPY pair stages a solid bounce from sub-139.00 levels, or a one-week low touched this Thursday and builds on the momentum through the early part of the European session. Spot prices climb back closer to the 140.00 psychological mark in the last hour, snapping a three-day losing streak and stalling this week's retracement slide from the 141.00 neighbourhood, or the YTD peak.
The US Dollar (USD) attracts fresh buyers following the overnight modest pullback from its highest level since mid-March and turns out to be a key factor that assists the USD/JPY pair to regain positive traction. The USD uptick could be attributed to a goodish pickup in the US Treasury bond yields, resulting in the widening of the US-Japan rate differential. This, in turn, is seen weighing on the Japanese Yen (JPY) and providing an additional boost to the major.
That said, diminishing odds for another rate hike by the Federal Reserve (Fed) might hold back the USD bulls from placing fresh bets and cap the USD/JPY pair. In fact, Fed Governor Philip Jefferson said on Wednesday that pausing rate hikes at the next FOMC meeting would offer time to analyse more data before making a decision about the extent of additional tightening. Apart from this, Philadelphia Fed President Patrick Harker also favoured pausing at the next meeting.
This, along with the prospect of Japanese authorities intervening in the markets and the prevalent cautious mood, could lend support to the safe-haven JPY and contributes to keeping a lid on the USD/JPY pair. It is worth recalling that Japan’s Vice Finance Minister for international affairs, Masato Kanda, hinted on Wednesday that authorities may act to curd the sinking Yen, saying that they will closely watch currency market moves and respond appropriately as needed.
The market sentiment, meanwhile, remains fragile amid worries about a global economic slowdown, particularly in China. A private survey released today showed that China’s manufacturing sector unexpectedly move into the expansion territory in May. That said, official data earlier this week had shown a sustained downturn. This, to a larger extent, overshadows the progress towards averting an unprecedented US debt default and tempers investors' appetite for riskier assets.
Hence, it will be prudent to wait for strong follow-through buying before placing fresh bullish bets around the USD/JPY pair and positioning for any further appreciating move. Market participants now look to the US economic docket - featuring the release of the ADP report on private-sector employment, the usual Weekly Initial Jobless Claims and the ISM Manufacturing PMI. This might influence the USD price dynamics and produce short-term trading opportunities.
Technical levels to watch
The market is speculating about a soft Eurozone flash CPI number today. Economists at ING discuss EUR/USD outlook ahead of the inflation report.
1.05/1.07 area should prove a base for EUR/USD this summer
“Consensus expects the headline to drop to 6.3% year-on-year from 7.0% with the core falling to 5.5% from 5.6%.”
“Barring a major surprise in the Eurozone CPI data, we can probably see EUR/USD tracing out something like a 1.0650-1.0720 range today – i.e. a holding pattern ahead of tomorrow's NFP data.”
“Bigger picture, we reiterate that this 1.05/1.07 area should prove a base for EUR/USD this summer – given that conditions are nowhere near as severe as those that drove EUR/USD so much lower this time last year.”
See – Eurozone HICP Preview: Forecasts from four major banks, sharp drop in inflation
Antje Praefcke, FX Analyst at Commerzbank, analyzes EUR/USD outlook.
Headwinds continue
“I fear that short-term the Euro is unlikely to manage a sustainable recovery and that it might have to put up with exchange rates around 1.07 in EUR/USD.”
“I would not be at all surprised if the market had adjusted its expectations for the CPI numbers a little. But nonetheless: if today’s inflation data were to surprise on the downside it is likely to adjust its expectations further. And as this risk does exist in my view, the Euro is likely to face continued headwinds.”
See – Eurozone HICP Preview: Forecasts from four major banks, sharp drop in inflation
The continuation of the upside momentum in USD/CNH seems favoured while above the 7.0850 level, note UOB Group’s Economist Lee Sue Ann and Markets Strategist Quek Ser Leang.
Key Quotes
24-hour view: “While we expected USD to strengthen further yesterday, we were of the view that ‘it is unlikely to break clearly above 7.1200’. In other words, we did not anticipate the strong surge that sent USD to a high of 7.1345. Today, there is room for USD to advance further but severely overbought conditions suggest it is highly unlikely to break above the major resistance at 7.1500 (there is another resistance at 7.1400). On the downside, a breach of 7.1000 would indicate that the current upward pressure has faded.”
Next 1-3 weeks: “Yesterday (31 May, spot at 7.0930), we highlighted that ‘upward momentum has increased albeit not much’. We added, ‘the chance of USD breaking above 7.1200 has increased as well’. That said, we did not quite expect USD to quickly break above 7.1200 and soar to a high of 7.1345. Conditions are severely overbought but as long as 7.0850 (‘strong support’ level was at 7.0600 yesterday) is not breached, the USD strength that started in the middle of last month has a chance to extend to 7.1500.”
Here is what you need to know on Thursday, June 1:
Despite the upbeat market mood, the US Dollar (USD) preserves its bullish momentum in the second half of the week. Eurostat will release the May inflation figures in the European session and the European Central Bank will publish May Monetary Policy Meeting Accounts. In the second half of the day, ADP Employment Change for May, the US Department of Labor’s weekly Initial Jobless Claims data and the ISM Manufacturing PMI survey will be featured in the US economic docket.
US ADP Employment, ISM Manufacturing PMI Preview: First down, then up for US Dollar?
The US Dollar Index (DXY) touched its strongest level since mid-March above 104.50 on Wednesday after the US Bureau of Labor Statistics (BLS) reported that the number of job openings on the last business day of April stood at 10.1 million, compared to 9.74 million in March and the market of 9.37 million. Meanwhile, the Federal Reserve noted in its Beige Book that there was little change in the overall economic activity in April and early May. “Prices rose moderately over the reporting period, though the rate of increase slowed in many Districts,” the publication further read.
Investors breathed a sigh of relief late Wednesday after the House of Representatives passed a bill to suspend the debt limit through January 1, 2025. The DXY retreated from daily highs following this development but closed in positive territory. On the other hand, major equity indexes in the US, which closed before the vote, registered losses while the benchmark 10-year US Treasury bond yield managed to recover toward 3.7%. Early Thursday, US stock index futures trade flat while the 10-year yield holds near 3.7%. It's also worth noting that Philadelphia Federal Reserve (Fed) Bank President Patrick Harker and Fed Governor Philip Jefferson both said on Wednesday that they were in favor of skipping a rate hike at the next meeting. These comments, however, don't seem to be having a negative impact on the USD's valuation for the time being.
Pressured by the broad USD strength, EUR/USD continues to trade on the back foot below 1.0700 on Thursday. The annual Harmonized Index of Consumer Prices is forecast to rise 6.3% in the Eurozone in May, compared to 7% increase recorded in April.
After having closed the first three trading days of the week in positive territory, GBP/USD has lost its traction and started to stretch lower toward 1.2400 in the early European session.
USD/JPY regained its traction on Thursday and advanced toward 140.00. The data from Japan revealed earlier in the day that Capital Spending rose 11% in the first quarter, much higher than the market expectation for an increase of 5.5%.
Gold price climbed above $1,970 on Wednesday but erased a large portion of its daily gains before closing slightly above $1,960. XAU/USD stays under modest bearish pressure in the European morning and trades near mid-$1,950s.
Bitcoin continues to decline on Thursday and was last seen losing 1.5% on the day at around $26,800. Ethereum lost more than 1% on Wednesday and extended its slide toward $1,850 early Thursday.
- The index extends the weekly recovery north of 104.00.
- A Fed’s pause now looks likely in at the June event.
- ADP report, weekly Claims, ISM Manufacturing next on tap.
The USD Index (DXY), which gauges the greenback vs. a basket of its main competitors, maintains the bid bias well in place beyond the 104.00 mark on Thursday.
USD Index now looks at data
The index advances for the third session in a row and extends the weekly optimism past the 104.00 hurdle on Thursday despite the recent U-turn in expectations of a rate hike by the Fed at the June 14 gathering.
The upbeat mood in the dollar also appears bolstered after the House of Representatives passed legislation Wednesday night to extend the suspension of the nation's debt ceiling until January 1, 2025. The timetable for avoiding an unprecedented debt default is highly constrained. The bill must now be enacted by the Senate before it can be delivered to President Joe Biden for signature.
On the latter, FOMC members Harker and Jefferson opened the door to a pause in the hiking cycle in June, according to their comments late on Wednesday, which ultimately morphed into an abrupt change of heart from investors and forced the buck to surrender part of the recent uptick to fresh highs near 104.70 (May 31).
According to CME Group's FedWatch Tool, the probability of a pause at the Fed's meeting next month hovers around 65% (up from nearly 33% just a day ago).
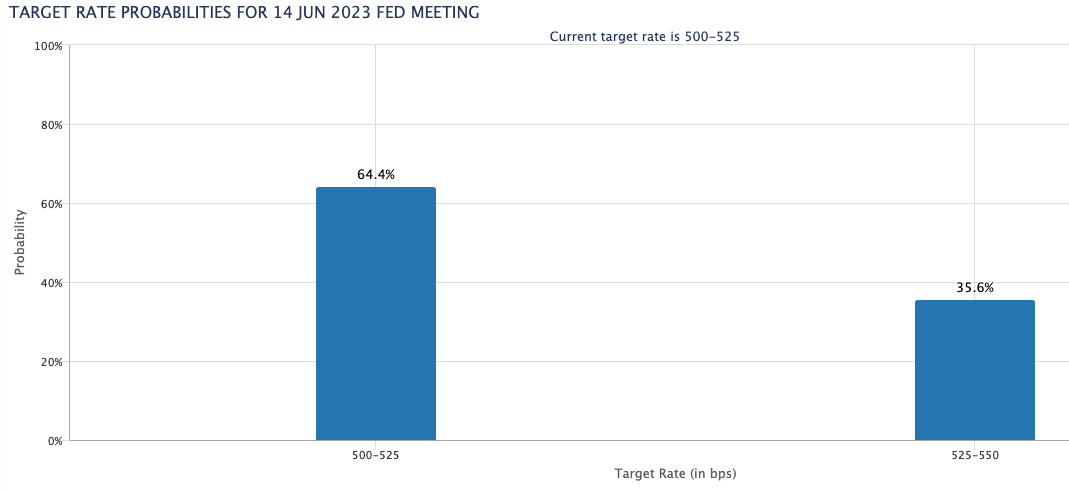
Very interesting session in the US docket, as the labour market will take centre stage in the first turn with the publication of the ADP report and weekly Initial Claims, seconded by the always relevant ISM Manufacturing PMI, the final S&P Global Manufacturing PMI and Construction Spending.
What to look for around USD
The index keeps the positive performance above the 104.00 hurdle on the back of optimism surrounding the debt ceiling and persistent lack of traction in the risk-associated universe.
In the meantime, rising bets of another 25 bps at the Fed’s next gathering in June appear underpinned by the steady resilience of key US fundamentals (employment and prices mainly) amidst the ongoing rally in US yields and the DXY.
Favouring a pause by the Fed, instead, appears the extra tightening of credit conditions in response to uncertainty surrounding the US banking sector.
Key events in the US this week: ADP Employment Change, Initial Jobless Claims, Final Manufacturing PMI, ISM Manufacturing PMI, Construction Spending (Thursday) – Nonfarm Payrolls, Unemployment Rate (Friday).
Eminent issues on the back boiler: Debt ceiling. Persistent debate over a soft/hard landing of the US economy. Terminal Interest rate near the peak vs. speculation of rate cuts in late 2023/early 2024. Fed’s pivot. Geopolitical effervescence vs. Russia and China. US-China trade conflict.
USD Index relevant levels
Now, the index is up 0.24% at 104.48 and the surpass of 104.69 (monthly high May 31) would open the door to 105.61 (200-day SMA) and then 105.88 (2023 high March 8). On the flip side, the next support emerges at the 100-day SMA at 102.90 seconded by the 55-day SMA at 102.44 and finally 101.01 (weekly low April 26).
- GBP/USD pulls back from over a one-week high amid the emergence of fresh USD buying.
- A positive risk tone and reduced bets for more Fed rate hikes could cap gains for the buck.
- Expectations that the BoE will raise rates further could underpin the GBP and limit losses.
The GBP/USD pair continues with its struggle to move back above the 50-day Simple Moving Average (SMA) and attracts some sellers near the 1.2450 area, or over a one-week high touched earlier this Thursday. The pair drops to a fresh daily low, around the 1.2415-1.2410 region during the early part of the European session and for now, seems to have snapped a four-day winning streak.
Following the overnight modest pullback from its highest level since mid-March, the US Dollar (USD) regains positive traction amid a goodish pickup in the US Treasury bond yields. This, in turn, is seen as a key factor exerting some downward pressure on the GBP/USD pair. That said, a combination of factors might hold back the USD bulls from placing aggressive bets, warranting caution before confirming that the pair's recent bounce from the 1.2300 neighbourhood, or its lowest level since early April, has run out of steam.
A duo of influential FOMC members on Wednesday showed a willingness to pause interest rate hikes this month. In fact, Federal Reserve (Fed) Governor Philip Jefferson said that pausing rate hikes at the next FOMC meeting would offer time to analyse more data before making a decision about the extent of additional tightening. Separately, Philadelphia Fed President Patrick Harker favoured pausing at the next meeting. Apart from this, a generally positive tone around the equity markets could cap the safe-haven Greenback.
The market sentiment gets a minor lift in reaction to the progress towards averting an unprecedented US debt default. In fact, the US House of Representatives voted in favour of a bill to suspend the debt ceiling late Wednesday and the deal now heads to the Senate for approval. Furthermore, a private survey showed that China’s manufacturing sector unexpectedly registered modest growth in May and boosts investors' confidence. This, along with expectations that the Bank of England (BoE) could raise rates further, should lend support to the GBP/USD pair.
Market participants now look forward to the release of the final UK Manufacturing PMI for some impetus. Later during the early North American session, traders will take cues from the US economic docket - featuring the ADP report on private-sector employment, the usual Weekly Initial Jobless Claims and the ISM Manufacturing PMI. This, along with Fedspeaks, the US bond yields and the broader risk sentiment, will influence the USD demand and contribute to producing short-term trading opportunities around the GBP/USD pair.
Technical levels to watch
Sterling continues to perform well. Economists at ING discuss the EUR/GBP outlook ahead of Eurozone Harmonised Index of Consumer Prices (HICP) data.
GBP looks like a decent intra-European target currency for the carry trade
“Sterling now looks like a decent intra-European target currency for the carry trade.”
“Unless Eurozone CPI today surprises on the upside to drag Eurozone swap rates higher, EUR/GBP looks as though it can drift to the 0.8550 area.”
See – Eurozone HICP Preview: Forecasts from four major banks, sharp drop in inflation
European Central Bank (ECB) Vice President, Luis de Guindos, said on Thursday, “recent inflation data are positive but still far from target.”
Key quotes
A big part of our journey to raise rates has been done.
But there is still some way to go.
Related reads
- EUR/USD to test 200-DMA at 1.0491 on strong US data – Credit Suisse
- German Retail Sales fall 4.3% YoY in April vs. -5.0% expected
Economists at Commerzbank discuss Reserve Bank of India (RBI) policy outlook.
There are few reasons for RBI to adjust policy
“There is a good mix between economic and price stability. As such, there are few reasons for RBI to adjust policy.”
“We expect RBI to leave rates unchanged at 6.50% at the next meeting on 8 June and possibly for the rest of the year.”
“For USD/INR, stability seems to be the focus for RBI. It has held within a narrow 2% range since the start of the year, between 81-83.”
An advance past the 141.00 region in USD/JPY seems to be losing momentum for the time being, comment UOB Group’s Economist Lee Sue Ann and Markets Strategist Quek Ser Leang.
Key Quotes
24-hour view: “Yesterday, we highlighted that ‘bias for USD is tilted to the downside but any decline is expected to face strong support at 139.30’. We added, ‘Resistance is at 140.20, followed by 140.40’. USD dropped to 139.30 in Asian trade, popped to a high of 140.37 and then dropped to a low of 139.22 in NY trade. USD continues to decline in early Asian trade today and the bias remains on the downside. However, any decline is not expected to break below 138.30. Resistance is at 139.60, followed by 140.00.”
Next 1-3 weeks: “Our update from yesterday (312 May, spot at 139.80) still stands. As highlighted, the sharp pullback from 140.93 and waning momentum suggest USD is unlikely to break above 141.00 this time around. From here, USD is likely to trade in a range between 137.00 and 141.00.”
- Silver is seen consolidating the previous day’s positive move to over a one-week high.
- The mixed technical setup warrants some caution before placing aggressive bullish bets.
- Sustained Weakness back below the $23.00 mark should pave the way for deeper losses.
Silver struggles to capitalize on the previous day's positive move and oscillated in a narrow trading band through the early part of the European session on Thursday. The white metal is currently placed around the $23.50-$23.55 region, representing the 23.6% Fibonacci retracement level of the recent downfall from over a one-year high.
From a technical perspective, the overnight sustained strength and close above the 100-day Simple Moving Average (SMA) favours bullish traders. That said, oscillators on the daily chart - though have been recovering - are yet to confirm the positive outlook. This makes it prudent to wait for some follow-through buying beyond the $23.60 area, or over a one-week high touched on Wednesday, before positioning for any further gains.
The XAG/USD might then surpass the $24.00 mark and accelerate the momentum towards the next relevant hurdle near the $24.20-$24.25 region en route to the $24.40-$24.50 horizontal support breakpoint. The latter coincides with the 50% Fibo. level, above which a fresh bout of a short-covering should allow bullish traders to reclaim the $25.00 psychological mark. The upward trajectory could get extended towards the $25.30-$25.35 supply zone.
On the flip side, weakness back below the 100-day SMA, currently around the $23..35 area, could find some support near the $23.00 round figure. This is followed by the May monthly swing low, around the $22.70-$22.65 region, which if broken decisively will be seen as a fresh trigger for bearish traders. The XAG/USD might then turn vulnerable to weaker further towards the $22.25 intermediate support before dropping to the $22.00 round figure.
Silver daily chart
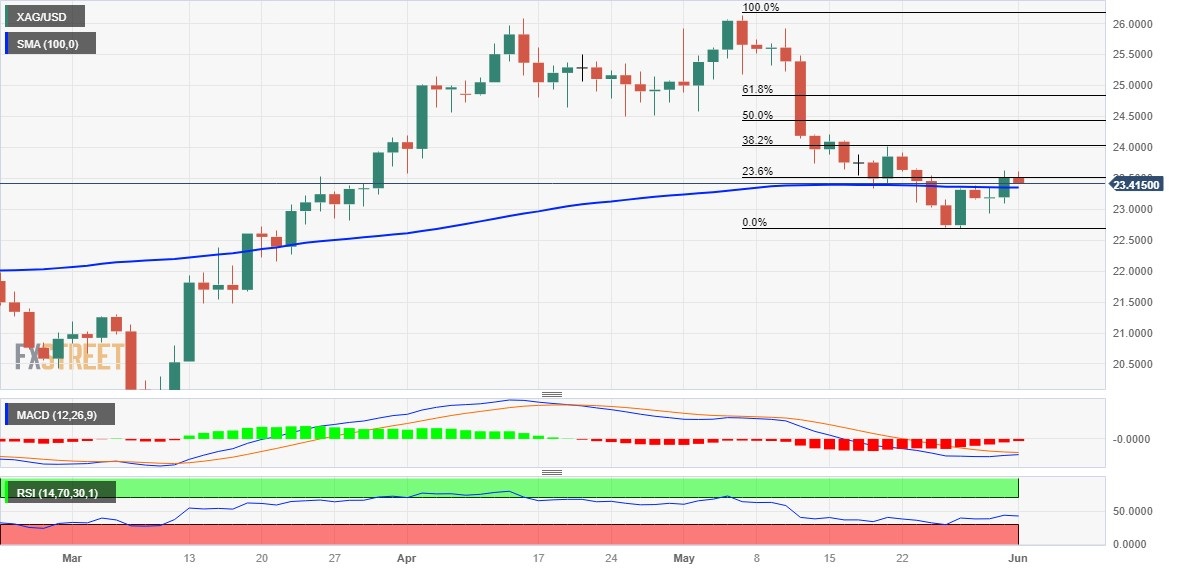
Key levels to watch
Economists at Credit Suisse expect the EUR/USD pair to push lower on strong US data.
Euro-area core CPI to drop to 5.4% YoY from 5.6% previously
“If US data are strong enough this week to shake convictions on priced-in rate cuts down the line, there is nothing to stop EUR/USD pushing still lower to test the 200-DMA around 1.0491. As such, tactically we would prefer to be short EUR/USD from 1.0732 with a stop at 1.0835, with a target of 1.0500.”
“We look nonetheless for Euro-area core CPI to drop to 5.4% YoY from 5.6% previously, below market expectations for 5.5%. Such an outcome would help our tactical short EUR/USD view by dissipating pressure for Euro-area rates to track US ones if the latter move higher again.”
See – Eurozone HICP Preview: Forecasts from four major banks, sharp drop in inflation
Considering advanced prints from CME Group for natural gas futures markets, open interest increased for the third session in a row on Wednesday, now by around 15.5K contracts. Volume, instead, remained erratic and shrank by around 42.7K contracts.
Natural Gas remains supported by $2.00
Wednesday’s downtick in prices of the natural gas was amidst increasing open interest and is supportive of extra losses in the very near term. The persistent choppiness in volume, in the meantime, seems to underpin the multi-week consolidation still in place. So far, the commodity is expected to meet decent contention around the $2.00 mark per MMBtu.
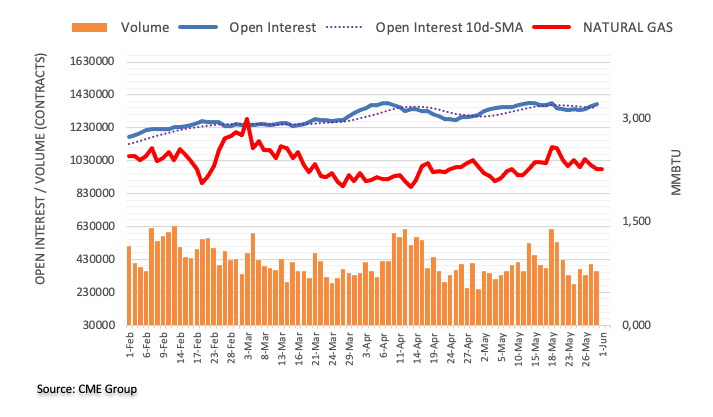
- USD/CHF struggles to extend two-day uptrend at the highest levels since early April.
- US Dollar lacks clear directions amid mixed sentiment, anxiety ahead of key data.
- Swiss trade numbers came in unimpressive for April.
- US preliminary activity data, employment numbers for May will be crucial for fresh impulse.
USD/CHF remains sidelined around 0.9110-15 as bulls and bears jostle ahead of the key data/events heading into Thursday’s European session. In doing so, the Swiss Franc (CHF) pair fails to justify the mixed prints of Swiss data, as well as anxiety before the top-tier events.
That said, the recent passage of the bill to overcome US default in the Republican-controlled House of Representatives underpins the cautious optimism ahead of tomorrow’s Senate voting on the debt-ceiling bill, which in turn should weigh on the USD/CHF price. On the same line, recently mixed US data and Federal Reserve (Fed) talks flag concerns that the US central bank has limited upside room for the rates. With this in mind, allowed Wall Street Journal’s (WSJ) Nick Timiraos to suggest that the Federal Open Market Committee (FOMC) is likely to hold interest rates steady in June.
Elsewhere, the Swiss Trade Balance eases to 2,601M in April from 4,526M (revised) prior. However, the Imports and Exports both rose from -22,505M and -27,031M respective previous readings to 17,302 and 19,902 in that order. It’s worth observing that the Swiss growth numbers and sentiment figures have also flashed mixed outcomes earlier in the week and prods the USD/CHF bears, mainly due to the broad US Dollar strength.
Amid these plays, the S&P500 Futures print mild gains to approach the 4,200 round figure, printing the first daily upside in three, whereas the US 10-year and two-year Treasury bond yields recover from weekly lows.
Looking ahead, the US ADP Employment Change and flash PMIs for May will be important to watch for clear directions. Also crucial will be the last round of the Fed talks ahead of the pre-FOMC blackout period for policymakers. Furthermore, the US Senators’ voting on the measures to avoid the default conditions should also be eyed closely even if the bill is likely to gain huge support in the Senate where Democrats are in the majority.
Also read: US ADP Employment, ISM Manufacturing PMI Preview: First down, then up for US Dollar?
Technical analysis
USD/CHF grinds higher within a one-month-old bullish trend channel, currently between 0.9315 and 0.9165, amid price-positive oscillators.
NZD/USD still risks extra losses in the short-term horizon according to UOB Group’s Economist Lee Sue Ann and Markets Strategist Quek Ser Leang.
Key Quotes
24-hour view: “After NZD dropped to 0.6026 and rebounded, we noted yesterday that ‘downward pressure appears to be intact but any decline is unlikely to challenge 0.5995’. The anticipated weakness exceeded our expectations as NZD dropped to 0.5986 and then rebounded. This time around, downward pressure appears to have faded and NZD is unlikely to weaken further. Today, NZD is more likely to trade sideways in a range of 0.5990/0.6050.”
Next 1-3 weeks: “In our most recent narrative from last Friday (26 May, spot at 0.6060), we held the view that NZD could weaken further, albeit likely at a slower pace. We added, ‘the next level to watch is at 0.5995’. Yesterday (31 May), NZD broke below 0.5995, dropped to 0.5986 and then rebounded. While NZD could continue to weaken, downward momentum is showing tentative signs of slowing and the likelihood for it to drop further to 0.5965 is not high. On the upside, a breach of 0.6085 (‘strong resistance’ level previously at 0.6100) would indicate that the NZD weakness that started in the middle of last week has stabilized.”
- Gold Price retreats from weekly top after two-day run-up.
- Cautious mood ahead of top-tier data, events join reassessment of Fed bias to challenge XAU/USD bulls.
- Preparations for US debt-ceiling passage also appear to weigh on the Gold Price.
- US employment clues, risk catalysts eyed for fresh impulse as bulls struggle to keep the reins.
Gold price (XAU/USD) teases bears after keeping the buyers hopeful in the last two days, retreating from the weekly top of late. In doing so, the yellow metal justifies the market’s dicey conditions as optimism surrounding the US debt-ceiling deal and receding hawkish bias about the Federal Reserve (Fed) contrasts with the cautious mood ahead of the top-tier US data. It’s worth noting that the upbeat China Caixin Manufacturing PMI adds strength to the XAU/USD’s upside momentum even as the 40.0% probability of the Fed’s 25 bps rate hike in June prods the Gold buyers.
Looking forward, the US employment clues and flash PMIs for May will be important to watch for clear directions. Also crucial will be the last round of the Fed talks ahead of the pre-FOMC blackout period for policymakers. Furthermore, the US Senators’ voting on the measures to avoid the default conditions should also be eyed closely even if the bill is likely to gain huge support in the Senate where Democrats are in the majority.
Should the hawkish Fed bias remain slightly less chattered, backed by mixed US data, the Gold price may witness a fresh recovery. However, upbeat data and optimism for the US economy may keep the XAU/USD bears hopeful.
Also read: Gold Price Forecast: XAU/USD bears stay hopeful while below $1,990, all eyes on US jobs data
Gold Price: Key levels to watch
Our Technical Confluence Indicator signals that the Gold Price retreats from the $1,970 resistance confluence comprising Fibonacci 38.2% in one-day and 61.8% on one-week, as well as 23.6% on one-month.
That said, the quote currently seesaws around Fibonacci 61.8% in one-day, around $1,961, a break of which will witness a bumpy road before testing the $1,948 support including the Fibonacci 23.6% on one-week.
Following that, Fibonacci 161.8% on one-day and 100-DMA can act as the last defense of the Gold buyers near $1,941 and $1,939 in that order.
Meanwhile, the XAU/USD’s successful break of the $1,970 hurdle could quickly recall $1,976 on the chart, comprising the Pivot Point one-week R1.
Should the Gold buyers manage to keep the reins, a run-up towards the previous weekly high of around $1,990 and then to the $2,000 round figure can’t be ruled out.
Here is how it looks on the tool
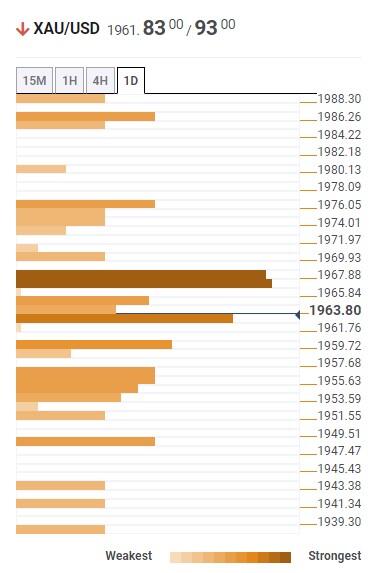
About Technical Confluences Detector
The TCD (Technical Confluences Detector) is a tool to locate and point out those price levels where there is a congestion of indicators, moving averages, Fibonacci levels, Pivot Points, etc. If you are a short-term trader, you will find entry points for counter-trend strategies and hunt a few points at a time. If you are a medium-to-long-term trader, this tool will allow you to know in advance the price levels where a medium-to-long-term trend may stop and rest, where to unwind positions, or where to increase your position size.
CME Group’s flash data for crude oil futures markets noted traders increased their open interest positions by around 2.3K contracts on Wednesday. In the same line, volume added to the previous daily build and went up by around 105.2K contracts.
WTI: A drop to the 2023 low is not ruled out
Prices of WTI dropped markedly on Wednesday amidst increasing open interest and volume, paving the way for potential extra pullbacks in the very near term. Against that, there is still room for a probable retracement to the 2023 low of $63.61 per barrel (May 4).
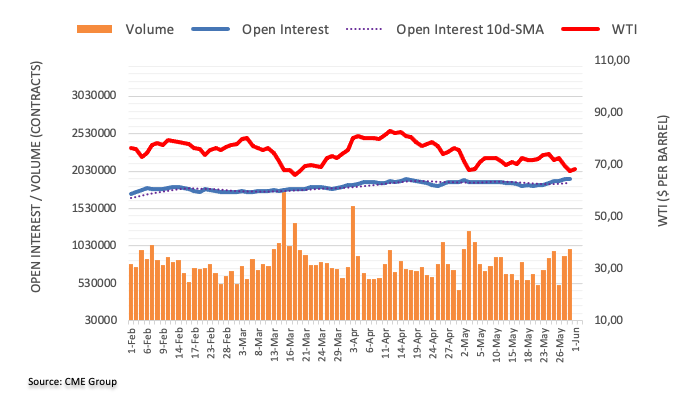
- USD/MXN is trading lackluster below 17.70 despite the USD index remaining extremely volatile.
- Clearance of US debt-ceiling bill in Congress has sent US Treasury yields on fire.
- The US ISM is set to report a seventh consecutive contraction in Manufacturing PMI.
The USD/MXN pair is displayed a sideways auction below 17.70 in the early European session. The asset is continuously trading lackluster despite immense volatility in the US Dollar Index (DXY). The USD Index has extended its recovery move above the crucial resistance of 104.30 as one more interest rate hike from the Federal Reserve (Fed) in its June monetary policy meeting is widely anticipated.
S&P500 futures are continuously adding gains from the Asian session as US debt-ceiling bill has hot clearance from Congress and fears of a default by the United States have been completely shrugged off. This has sent US Treasury yields on fire. The 10-year US treasury yields have climbed above 3.67%.
USD/MXN could turn volatile ahead as the United States Automatic Data Processing (ADP) Research Institute will report May’s Employment Change data. According to the consensus, the US economy added 170K jobs in May vs. April’s addition of 296K. A slowdown in the hiring process might ease some heat from labor market conditions, however, the fact that overall employment conditions are healthy cannot be ruled out. This will keep hopes of further policy-tightening by the Federal Reserve (Fed) extremely solid.
In addition to the US Employment data, ISM Manufacturing PMI will also remain in the limelight. As per the estimates, US ISM is set to report a seventh consecutive contraction in Manufacturing PMI. The economic data is seen landing at 47.0 and a figure below 50.0 is itself considered a contraction.
On the Mexican Peso front, investors will keep focusing on the Unemployment Rate, which will release on Friday. Mexico’s jobless rate (April) is seen higher at 2.7% vs. the prior release of 2.4%, which could be the consequence of higher interest rates by the Bank of Mexico (Banxico). Investors should note that Banxico has pushed interest rates to 11.25% in its battle against persistent inflation.
The Kiwi has had a challenging first half of the year, and it is back in the low-0.60s. Economists at ANZ Bank discuss NZD/USD outlook.
Carry and fair value to take centre stage
“If the Fed funds rate does go up one more time, it’ll get close to where the OCR is. It won’t surpass it, but we are certainly not talking about a situation where the NZD has significantly higher carry than the US. For the moment there is small positive spread in NZ’s favour, but what’s more important is that the NZD is the only currency for which that’s the case. That might not mean a lot in NZD/USD terms, but if anyone does want to go short the USD, then the Kiwi is an obvious currency to pick. The NZD’s advantage over other currencies may drive outperformance on crosses too, which may, in turn, feed into NZD/USD strength, even if to a lesser extent.”
“Our forecasts tend to be guided by fair value, and at the moment, our model puts NZD/USD fair value at around 0.6550. We are thus closer to fair value than we have been for a while. However, notice how our forward estimates of fair value (which are based on expectations for interest rates and commodity prices and the like) are lower (at around 0.6270 two years out).”
“At the moment, when we apply a one standard deviation band, we get a 0.60 to 0.71 range. Right now, we are inside those bands. But NZD/USD is below both our spot and forward estimates of fair value, and closer to the lower standard deviation band than it has been for some time. As a gravitational pull factor, that suggests there is scope for mild further appreciation.”
In the opinion of UOB Group’s Economist Lee Sue Ann and Markets Strategist Quek Ser Leang, GBP/USD is now seen trading within the 1.2330-1.2505 range in the next few weeks.
Key Quotes
24-hour view: “We highlighted yesterday that ‘there is room for GBP to strengthen further but a sustained rise above 1.2455 is unlikely’. We added, ‘any advance is likely part of a higher range of 1.2360/1.2455’. In early London trade, GBP dropped to 1.2350 and then rebounded to 1.2445. Upward momentum is beginning to build and we expect GBP to trade with an upward bias today. However, a break of the major resistance at 1.2505 is unlikely (minor resistance is at 1.2485). Support is at 1.2415, followed by 1.2385.”
Next 1-3 weeks: “Our update from yesterday (31 May, spot at 1.2415) is still valid. As highlighted, the recent GBP weakness has stabilized. While upward momentum has improved somewhat, it is premature to expect a reversal. For now, GBP is likely to trade in a range between 1.2330 and 1.2505.”
- German Retail Sales declined 4.3% YoY in April vs. -5.0% expected.
- Retail Sales in Germany came in at 0.8% MoM in April vs. 1.0% expected.
The latest official figures released by Destatis showed on Friday, Germany's Retail Sales increased 0.8% MoM in April versus 1.0% expected and -2.4% previous.
On a yearly basis, the bloc’s Retail Sales dropped 4.3% in April versus the -5.0% expected and an 8.6% slump seen in March.
FX implications
The Euro is unfazed by the mixed German data. At the time of writing, the EUR/USD is down 0.12% on the day at 1.0675.
About German Retail Sales
The Retail Sales released by the Statistisches Bundesamt Deutschland is a measure of changes in sales of the German retail sector. It shows the performance of the retail sector in the short term. Percent changes reflect the rate of changes of such sales. The changes are widely followed as an indicator of consumer spending. Positive economic growth is usually anticipated as "bullish" for the EUR, while a low reading is seen as negative, or bearish, for the EUR.
Open interest in gold futures markets dropped for yet another session on Wednesday, this time by nearly 4K contracts, according to preliminary readings from CME Group. Volume followed suit and went down by around 91.2K contracts, reversing the previous daily build.
Gold faces further consolidation in the near term
Wednesday’s small gains in gold prices were amidst shrinking open interest and volume, and this is suggestive that a more serious rebound seems unlikely for the time being. That said, the precious metal appears poised for further consolidation in the very near term, with the floor around the $1930 region.
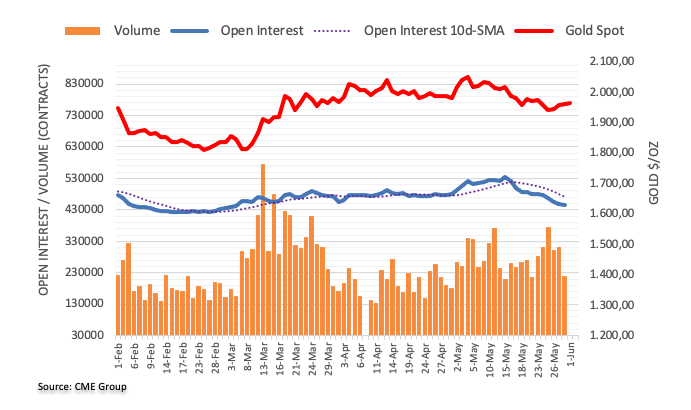
FX option expiries for June 1 NY cut at 10:00 Eastern Time, via DTCC, can be found below.
- EUR/USD: EUR amounts
- 1.0650 308m
- 1.0685 412m
- 1.0700 2.5b
- 1.0720 485m
- 1.0735 2.6b
- 1.0770 1.1b
- 1.0800 978m
- GBP/USD: GBP amounts
- 1.2400 678m
- USD/JPY: USD amounts
- 139.00 601m
- 140.00 590m
- USD/CHF: USD amounts
- 0.8820 400m
- USD/CAD: USD amounts
- 1.3345 770m
- 1.3590 401m
- EUR/GBP: EUR amounts
- 0.8810 409m
- 0.9100 894m
- EUR/USD is oscillating below 1.0700 as the USD Index has climbed above the immediate resistance of 104.30.
- Federal Reserve policymakers are divided about interest rate guidance, which are creating chaos in financial markets.
- European Central Bank Muller is confident that the central bank will hike by 25 bps more than once as core inflation is still stubborn.
- EUR/USD is expected to retrace the entire Fibonacci tool placement plotted from March 15 low at 1.0516 to April 26 high at 1.1095.
EUR/USD is consolidating in a narrow range below the round-level resistance of 1.0700 in the early European session. The major currency pair is expected to show a power-pack action ahead of the release of the Eurozone Inflation and United States Employment data.
S&P500 futures have posted decent gains in Asia amid a recovery in the risk-taking capability of investors. The market participants dumped US equities on Wednesday amid cautious market mood-inspired by soaring expectations of one more interest rate hike from the Federal Reserve (Fed).
The US Dollar Index (DXY) is gathering strength for fitting above the immediate resistance of 104.30 as the risk-aversion theme underpinned by investors is improving its appeal. The USD Index is stabilizing after a sell-off move as the context of the US debt-ceiling bill is fading after getting clearance from Congress. A recovery move in the USD Index has dampened the demand for US government bonds. This has led to a jump in 10-year US Treasury yields to near 3.67%.
US economic indicators remain in focus
After the release of solid US job market data, investors are keeping an eye on US Employment, which will provide wholesome condition of labor market. Before US Nonfarm Payrolls (NFP) data, investors will wait for the release of the Automatic Data Processing (ADP) Employment Change (May). The street is anticipating a fresh addition of 170K personnel in labor market lower than the prior addition of 296K recorded for April. Consideration of the labor market data is crucial for the Federal Reserve before building a stance for the interest rate policy. It is highly expected that upbeat labor additions along with solid Job Openings will bolster the case of further policy-tightening by the Federal Reserve.
In addition to US ADP Employment Change, ISM Manufacturing PMI (May) will also remain in the spotlight. As per the preliminary report, Manufacturing PMI is expected to soften marginally to 47.0 vs. the former release of 47.1. A figure below 50.0 is considered a contraction in factory activities and the May month contraction could be the seventh consecutive contraction in the United States economy.
While New Orders Index that indicates forward demand is expected to drop to 44.9 from the prior release of 45.7. This could weigh severe pressure on the US Dollar.
Mixed views coming from Federal Reserve policymakers about interest rate guidance
Considering the fact that, US consumer spending has remained resilient in April, labor market conditions are still healthy, and April inflation figures remained stubborn, Federal Reserve could continue tightening policy further to keep its side in full strength in the battle against sticky inflation. However, Federal Reserve policymakers are divided about interest rate guidance, which is creating chaos in financial markets.
Cleveland Federal Reserve Bank President, Loretta Mester, in an interview with Financial Times, cited “I don’t really see a compelling reason to pause — meaning wait until you get more evidence to decide what to do.” While Federal Reserve Governor Philip Jefferson said in a speech on Wednesday that pausing rate hikes at the next Federal Open Market Committee (FOMC) meeting would offer time to analyze more data before making a decision about the extent of additional tightening. He added that a pause does not mean that rates peaked.
Odds for soft Eurozone inflation figures soar
This week, the release of preliminary Germany, Spain, and France Harmonized Index of Consumer Prices (HICP) conveyed that inflationary pressures have softened more than expected in May led by lower energy prices and stagnant retail demand. Monthly headline figures from Spain and Germany have registered deflation, which has trimmed the odds of long-term hawkish European Central Bank (ECB) bets. An all-around decline in Germany, Spain, and France's inflation numbers indicates that Eurozone inflation would also soften dramatically.
However, European Central Bank policymaker Madis Muller cited on Wednesday, “It is very likely that the central bank will hike by 25 bps more than once as core inflation is still stubborn.” Also, European Central Bank President Christine Lagarde stated in the last monetary policy meeting that more than one interest rate hike is appropriate.
EUR/USD technical outlook
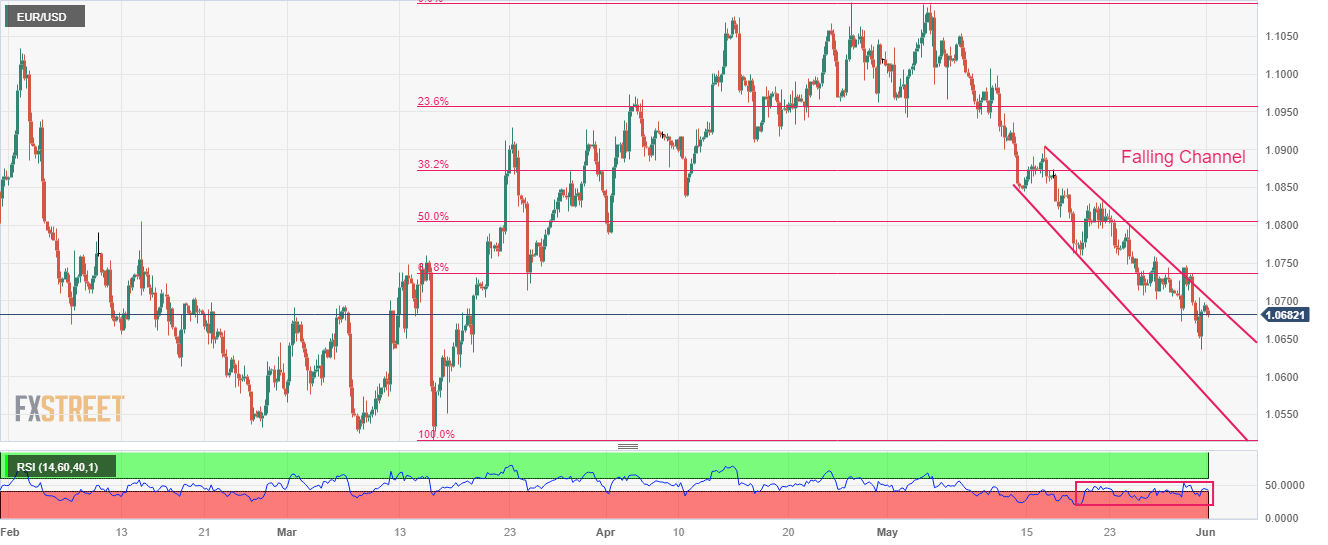
EUR/USD is expected to retrace the entire Fibonacci tool placement plotted from March 15 low at 1.0516 to April 26 high at 1.1095 on a four-hour scale. The major currency pair is still auctioning in the Falling Channel chart pattern in which each pullback is considered as a selling opportunity.
The Relative Strength Index (RSI) (14) is struggling to shift into the 40.00-60.00 range from the bearish range of 20.00-40.00, indicating strength in the US Dollar bulls
UOB Group’s Economist Lee Sue Ann and Markets Strategist Quek Ser Leang suggest a potential drop in EUR/USD to the 1.0600 region appears to have lost some traction.
Key Quotes
24-hour view: “Our view for EUR to strengthen yesterday was incorrect as it dropped to 1.0633 and then rebounded quickly to end the day at 1.0688 (0.42%). The rebound in severely oversold conditions suggests EUR is unlikely to weaken further. Today, EUR is more likely to trade sideways in a range between 1.0655 and 1.0725.”
Next 1-3 weeks: “Yesterday (31 May, spot at 1.0730), we indicated that the 3-week EUR weakness has stabilized and we held the view that it ‘is likely to trade in a range of 1.0670/1.0820 for the time being’. However, EUR fell to a fresh two-month low of 1.0633. While the price actions suggest our call for stabilization is premature, there is no significant improvement in downward momentum and the chance for EUR to drop further to 1.0600 is low. On the upside, a breach of 1.0750 would suggest 1.0600 is not coming into view.”
European Central Bank (ECB) Governing Council member Olli Rehn said on Thursday, “core inflation must slow before mulling easing.”
Additional quotes
“Monetary policy journey is not over yet.”
“Inflation outlook continues to be too high for too long.”
“A lasting rise in inflation expectations is an upside risk to inflation.”
“The lags and the strength of transmission (of rate hikes) to the real economy remain uncertain.”
Market reaction
At the press time, EUR/USD is on the back foot near 1.0680, down 0.07% on the day.
- WTI clings to mild gains during the first positive day in three, fades upside momentum of late.
- Sustained break of previous key support, bearish chart formation keeps Oil bears hopeful.
- Clear break of $67.95 can trigger fresh downswing, bulls remain cautious below $74.70.
WTI crude oil consolidates the biggest weekly loss in three by printing minor upside near $68.50, making 1.10% intraday gains heading into Thursday’s European session. In doing so, the black gold snaps two-day downtrend but stays within an immediate bear pennant chart formation suggesting further declines of the energy benchmark.
It’s worth noting that the quote’s early-week break of an upward-sloping support line from May 15, now resistance near $71.75, joins the near 50.0 level of RSI (14) line to keep the sellers hopeful.
However, a clear downside break of the stated pennant’s bottom line, close to $67.95 by the press time, becomes necessary for the Oil sellers to retake control.
Following that, a slump towards the previous monthly low of around $64.30 can’t be ruled out. Though, $66.75 may act as an intermediate halt during the anticipated fall.
On the flip side, a clear break of the pennant’s top-line, near $68.80 at the latest, will defy the bearish chart formation and can propel the black gold towards a converngence of the 50-Hour Moving Average (HMA) and 50% Fibonacci retracement level of May’s upside, near $69.50.
In a case where the Oil price remains firmer past $69.50, the $70.00 round figure and the previous support line near $71.80 may act as extra checks for the bulls.
It should be observed that the energy buyers need to remain cautious unless witnessing a successful run-up beyond the previous monthly peak of around $74.70
WTI crude oil: Hourly chart
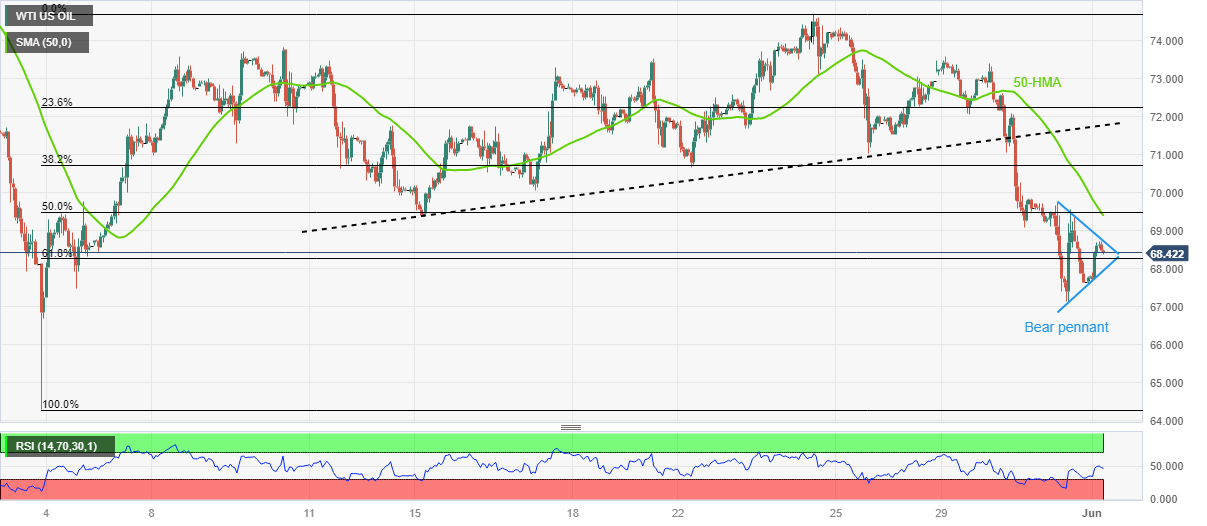
Trend: Further downside expected
- USD/CAD remains pressured at the lowest levels in seven days.
- US Dollar struggles on cautious optimism, mixed Fed concerns.
- Upbeat Canada GDP teases Loonie buyers; Oil benefits from sluggish USD, mildly positive sentiment.
- US/Canada PMIs, US employment clues eyed for clear directions.
USD/CAD holds lower ground at the weekly bottom as it extends the previous day’s fall amid a slightly upbeat risk profile and firmer Oil price, not to forget the sluggish US Dollar. That said, the Loonie pair prints mild losses around 1.3565 by the press time of early Thursday morning in Europe.
US Dollar Index (DXY) struggles to defend the weekly gains around 104.30, despite recently picking up bids, as mixed US data and Federal Reserve (Fed) talks flag concerns that the US central bank has limited upside room for the rates. With this in mind, allowed Wall Street Journal’s (WSJ) Nick Timiraos to suggest that the Federal Open Market Committee (FOMC) is likely to hold interest rates steady in June.
While US statistics were mostly unimpressive, Canada’s first quarter (Q1) Gross Domestic Product (GDP) offered a positive surprise to the Loonie buyers and drowned the USD/CAD pair the previous day. That said, the Canadian Q1 GDP rose to 0.8% QoQ versus 0.4% expected and 0.0% prior.
Elsewhere, the US Republican-controlled House of Representatives recently passed the debt-ceiling bill and favored the market’s optimism as the ruling Democrats dominate in the Senate and can easily avoid the default now. The same news exerts downside pressure on the US Dollar and the USD/CAD price of late.
Furthermore, WTI crude oil rises 1.22% on a day to around $68.50 as buyers return from the lowest levels in a month while snapping the two-day downtrend. It’s worth noting that the surprise build in the Oil inventories, per the industry reports, fails to weigh on the black gold ahead of this weekend’s OPEC+ meeting. The reason could be linked to the market sentiment, the recently firmer China Caixin Manufacturing PMI and the US Dollar’s failure to rise much.
Against this backdrop, S&P500 Futures print mild gains whereas the US Treasury bond yields rebound from weekly low.
Looking ahead, preliminary readings of the US and Canadian PMIs for May will join the US ADP Employment Change and vote on the bill to avoid the US default in the US Senate to direct intraday moves of the USD/CAD pair.
Technical analysis
A daily closing below the three-week-old rising support line, now immediate resistance around 1.3585, directs USD/CAD toward a convergence of the 50 and 100-DMA, around 1.3515-10.
- NZD/USD is struggling to defend the crucial support of 0.6000 as the USD index is aiming to extend recovery.
- The overall market mood is expected to remain cautious amid the release of the US Employment and Manufacturing PMI.
- Caixin Manufacturing PMI data landed higher at 50.9 vs. the consensus and the prior release of 49.5.
The NZD/USD pair is struggling to defend the psychological support of 0.6000 in the Asian session. The Kiwi asset is expected to test Wednesday’s low around 0.5985 as the USD Index (DXY) is gathering strength for breaking above the immediate resistance of 104.30.
S&P500 futures have generated some decent gains in the Tokyo session, indicating some improvement in the risk appetite of the market participants. The overall market mood is expected to remain cautious amid the release of the United States Employment and ISM Manufacturing PMI (May) data.
As per the consensus, US ISM Manufacturing PMI (May) is expected to soften marginally to 47.0 vs. the former release of 47.1. While the New Orders Index that indicates forward demand is expected to drop to 44.9 from the prior release of 45.7. A figure below 50.0 is considered a contraction in economic activities, which could put some pressure on the USD Index.
The US Dollar Index witnessed an intense sell-off on Wednesday as investors were confident that the US debt-ceiling bill will receive clearance from Congress. For now, the entire focus has shifted to economic indicators, which could keep the USD Index choppy ahead.
The New Zealand Dollar has failed to capitalize on upbeat Caixin Manufacturing PMI data (May). The IHS Markit reported the economic data at 50.9, higher than the consensus and the prior release of 49.5. Investors should note that China’s official Manufacturing data contracted to 48.8 vs. the estimates of 49.4 and the former release of 49.2.
It is worth noting that New Zealand is one of the leading trading partners of China and higher Chinese factory activity might support the New Zealand Dollar.
- AUD/USD picks up bids to refresh intraday high, snaps two-day downtrend.
- Upbeat China Caixin Manufacturing PMI, US debt-ceiling bill passage in the House favor bulls.
- Bulls sneak in from seven-month-old descending support line but multiple hurdle prod further upside.
- Bearish MACD signals, challenges to risk-on mood and hawkish Fed bets keep Aussie sellers hopeful.
AUD/USD prints the first daily gains in three around 0.6520 as cautious optimism in the market joins the mixed concerns about Federal Reserve (Fed) to recall buyers early Thursday.
However, the looming employment clues from the US and impending voting on the US debt-ceiling bill in the Senate check the risk-barometer buyers. It’s worth noting that upbeat China’s upbeat Caixin Manufacturing PMI for May also underpinned the pair’s upside moves.
Technically, the AUD/USD pair bounces off a descending support line from December 20, 2022, close to the 0.6500 round figure by the press time. The same joins the aforementioned catalysts to allow the Aussie pair to aim for a three-week-old descending resistance line, near 0.6545, to restrict the immediate upside of the quote.
Following that, the 61.8% Fibonacci retracement level of the pair’s October 2022 to February 2023 upside, near 0.6550, quickly followed by the 10-DMA hurdle of 0.6555, could tease the AUD/USD sellers.
It’s worth observing that a successful break of 0.6555 can escalate the quote’s short-term rebound.
Meanwhile, AUD/USD sellers need to conquer the aforementioned support line of around 0.6500 for conviction. Even so, the latest bottom of around 0.6455 can challenge the bears before returning control to them.
AUD/USD: Daily chart
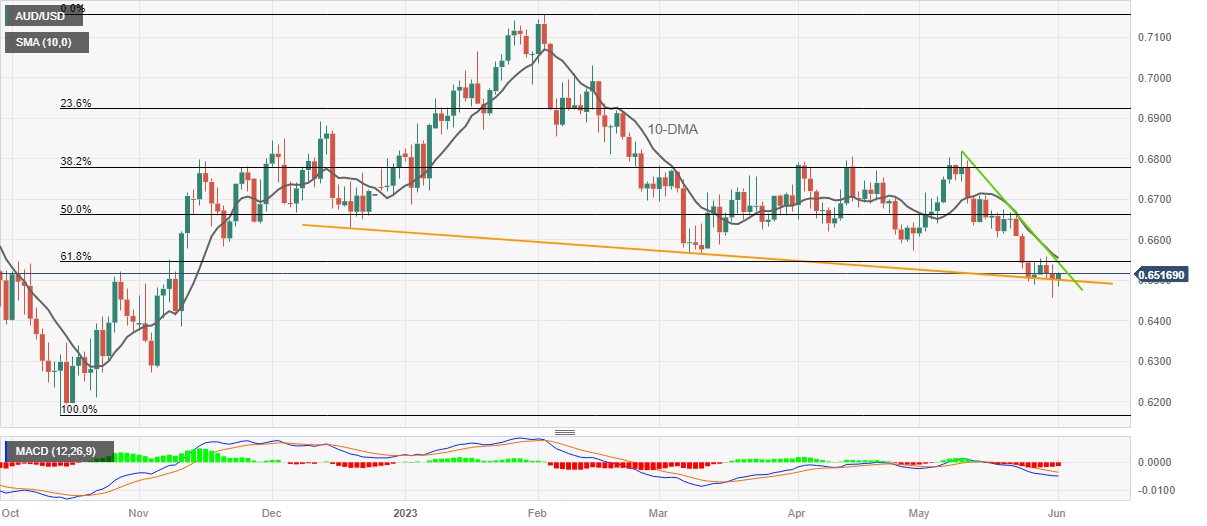
Trend: Limited upside expected
- Gold price is consolidating in a narrow range ahead of US Employment data.
- Fears of one more interest rate hike from the Fed are expected to improve the appeal for the USD Index.
- Gold price is making efforts for breaking above the 23.6% Fibo retracement at $1,967.18.
Gold price (XAU/USD) is demonstrating topsy-turvy moves in a $1,962-1,967 range in the Asian session. The precious metal has turned sideways as investors are awaiting the release of the United States Employment data to gain serious guidance about June’s interest rate policy of the Federal Reserve (Fed).
S&P500 futures are showing choppy moves in Asia after facing selling pressure from investors on Wednesday. The volatility associated with US labor market data weighed on risk-sensitive assets as upbeat numbers would leave no option for the Fed but to raise interest rates further.
The US Dollar Index (DXY) is aiming to extend its recovery above 104.30. Fears of one more interest rate hike from Fed chair Jerome Powell are expected to improve the appeal for the USD Index. After the upbeat US JOLTS Job Openings figure, investors are awaiting US Nonfarm Payrolls (NFP) data to get a clear picture of labor market health.
As per the preliminary report, fresh 190K payrolls were added to the labor market in May, lower than the additions of 253K made in April. The Unemployment Rate is increased to 3.5% vs. the former release of 3.4%. Annual Average Hourly Earnings are seen steady at 4.4% while monthly labor cost is seen expanding by 0.3% at a slower pace than the 0.5% registered in April. This might ease labor cost-push inflation ahead.
Gold technical analysis
Gold price has extended its recovery after delivering a breakout of the Falling Wedge chart pattern formed on a two-hour scale. A breakout of the aforementioned pattern indicates a bullish reversal. The precious metal is making efforts for breaking above the 23.6% Fibonacci retracement (plotted from an all-time high at $2,079.76 to May 30 low at $1,932.12) at $1,967.18.
Also, the Relative Strength Index (RSI) (14) is aiming to shift into the bullish range of 60.00-80.00. An occurrence of the same will activate the upside momentum.
Gold hourly chart
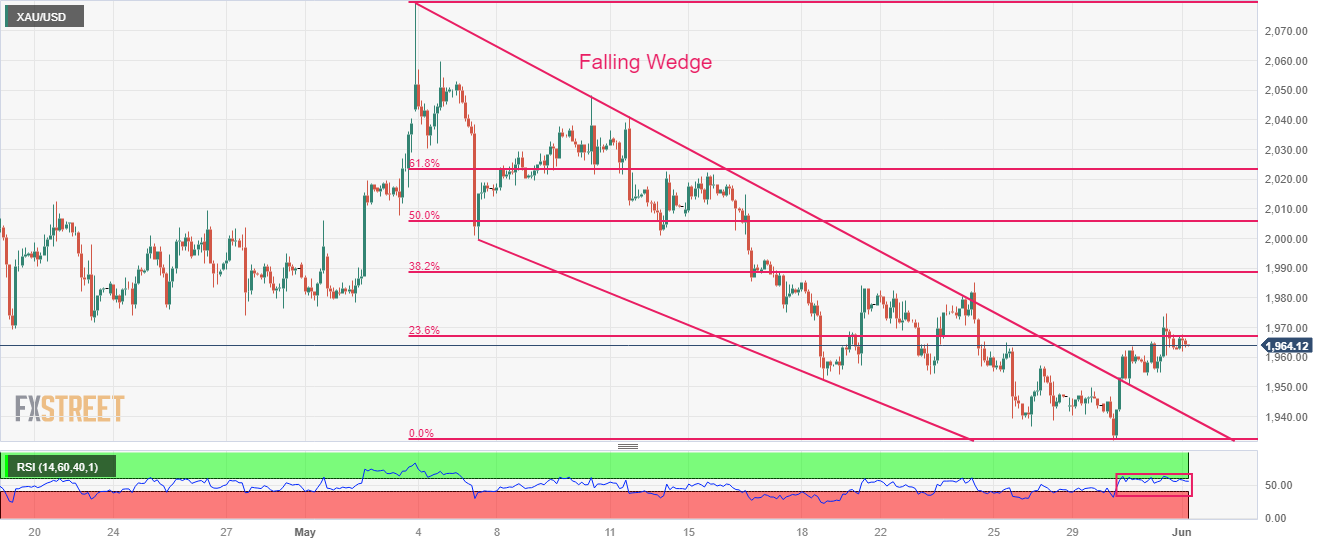
International Monetary Fund (IMF) Chief Economist Pierre-Olivier Gourinchas said on Thursday, it is “too early for the Bank of Japan (BoJ) to tighten monetary policy as re-anchoring inflation expectations to its 2% target will take time.
Additional quotes
BoJ must stand ready to tighten monetary policy if inflation remains too elevated.
BoJ will likely find it very difficult to tighten monetary policy while maintaining yield curve control.
It is probably safer for BoJ to first move away from control of long-term yield, then raise short-term rate when need arises to tighten policy.
Market reaction
USD/JPY is catching a fresh bid on the above comments, trading 0.13% higher on the day at 139.52, as of writing.
- USD/INR has tested territory below 82.50 as investors discount the impact of the overnight sell-off in the USD Index.
- The risk of recession still persists as the Fed is expected to continue its policy-tightening spell.
- The Indian Rupee remained in the spotlight after the release of upbeat Q4GDP data.
The USD/INR pair has displayed immense selling pressure at open as investors are discounting the impact of the overnight sell-off in the US Dollar Index (DXY). The asset has dropped to near the crucial support at 82.50.
S&P500 futures have added nominal gains in the Asian session after a bearish Wednesday. The overall market mood is quite cautious as investors have shifted their focus toward the United States Employment data, which will build a base of June’s monetary policy meeting by the Federal Reserve (Fed).
The US Dollar Index (DXY) has faced stiff barricades while attempting to extend recovery above 104.30. Meanwhile, clearance of the US debt-ceiling bill in Congress has entirely faded fears of a default by the Federal government. However, the risk of recession still persists as the Federal Reserve (Fed) is expected to continue its policy-tightening spell.
Wednesday’s job market data showed that the recruitment process by firms is quite healthy. Now table turns to the United States Employment data. A release of better-than-anticipated US labor market data would bolster the requirement for more interest rate hikes by the Fed. As per the estimates, US Automatic Data Processing (ADP) Employment Change (May) data is seen landing at 170K vs. the former release of 296K.
On Wednesday, the Indian Rupee remained in the spotlight after the release of upbeat Q4 Gross Domestic Product (GDP) data. The Indian economy expanded 6.1% in the fourth quarter of CY2022-23, higher than the prior expansion pace of 4.5%. Retail demand has remained resilient in the Indian economy and it could strengthen inflationary pressures again.
US inflation expectations, as per the 10-year and 5-year breakeven inflation rates from the St. Louis Federal Reserve (FRED) data, have been declining in the last one week, which in turn favors the market’s latest reassessment of the Federal Reserve’s (Fed) rate hike concerns.
That said, the downbeat prints of the US inflation precursors join mixed US data and unimpressive Fed talks to prod the US Dollar bulls amid cautious optimism in the market.
However, the anxiety ahead of the key ADP Employment Change, ISM Manufacturing PMI and S&P Global PMIs for May prods the US Dollar Index (DXY) bulls, which in turn allow the riskier assets to grind higher.
That said, the 5-year inflation expectations per the aforementioned calculations drop to the lowest levels since January 2021, around 2.07% by the press time whereas the 10-year counterpart revisit a two-week low surrounding 2.18% at the latest.
It’s worth noting, however, that the Fed policymakers are yet to confirm any softness in the price pressure and hence today’s key US data, as well as the US policymakers’ voting on the debt-ceiling bill in the Senate, should be closely eyed for clear market directions.
Also read: S&P500 Futures grind higher, yields stabilize as US House of Representatives pass debt ceiling deal
- GBP/USD struggles to extend four-day uptrend at weekly high.
- 50-DMA guards Cable’s immediate upside ahead of multi-month-old ascending resistance line.
- Previous resistance line from mid-May, impending bull cross on MACD challenge Pound Sterling sellers.
- Cautious mood ahead of top-tier data/events checks pair’s momentum but bulls stay hopeful.
GBP/USD grinds near weekly high as bulls and bears jostle ahead of the key data/events scheduled for publishing on Thursday. That said, the Cable pair makes rounds to 1.2450 during early Thursday morning in Europe amid the latest retreat in the US Dollar, mainly due to the cautious optimism and receding hawkish Fed bias. It’s worth noting that the increasing hopes of the Bank of England’s (BoE) further rate increases also favor the Pound sterling buyers.
Technically, the 50-DMA hurdle of 1.2450 restricts the immediate upside of the GBP/USD pair amid a steady RSI (14) line. However, an impending bull cross on the MACD and the quote’s sustained break of a one-week-old descending resistance line allow the buyers to remain hopeful.
Although the aforementioned catalysts suggest the GBP/USD pair’s run-up beyond the 50-DMA immediate hurdle of around 1.2450, an upward-sloping resistance line from late 2022, close to 1.2465 by the press time, could challenge the Cable pair buyers afterward.
Following that, the mid-April high of nearly 1.2550 will act as the last defense of the Pound Sterling bears.
On the contrary, GBP/USD pullback remains elusive unless staying beyond a two-week-old previous resistance line, around 1.2400 at the latest.
In a case where the GBP/USD pair drops below 1.2400, the latest trough surrounding 1.2305 will lure the Cable bears.
Should the Pound Sterling remains weak past 1.2305, the 50% and 61.8% Fibonacci retracement of its March-May upside, respectively near 1.2240 and 1.2135, will be in focus.
GBP/USD: Daily chart
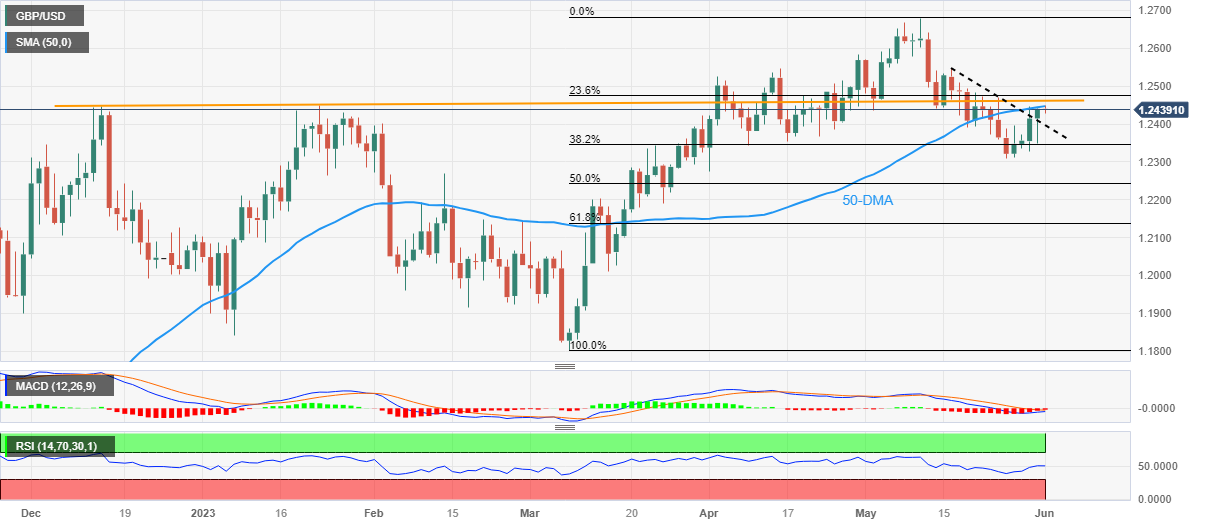
Trend: Further upside expected
- EUR/USD licks its wounds at the lowest levels in 10 weeks, remains sidelined of late.
- Fresh twist in Fed versus ECB formula amplifies importance of today’s Eurozone HICP, US ADP Employment Change.
- Risk catalysts, PMIs should be eyed closely amid a slew of data/events scheduled for publishing.
EUR/USD portrays the pre-data anxiety around 1.0690 amid very early Thursday morning in Europe. In doing so, the Euro pair fails to cheer the market’s risk-on mood, as well as receding hawkish bets on the Federal Reserve (Fed) ahead of the top-tier data/events scheduled for publishing in the US and Europe.
On Wednesday, Germany’s Inflation, per the Consumer Price Index (CPI), slid to 6.1% YoY in May from 7.2% in April, versus 6.5% expected. On the same line, the European Central Bank's (ECB) preferred gauge of inflation, namely the annual Harmonised Index of Consumer Prices (HICP), also eased to 6.3% YoY during the said month from 7.6% prior and compared to analysts' estimate of 6.8%.
Following the inflation data, ECB Vice President, Luis de Guindos, said that Victory over inflation is not there yet while also adding, “But the trajectory is correct.” However, ECB policymaker Madis Muller cited no signs of slowing in Core inflation while saying, “It is very likely that the ECB will hike by 25 bps more than once.”
Alternatively, US JOLTS Job Openings rose to 10.103M in April versus 9.375M expected and 9.745M prior whereas Chicago Purchasing Managers’ Index dropped to 40.4 for May from 48.6 prior and 47.0 market forecasts. Earlier in the week, the US consumer sentiment gauge improved but the details were unimpressive.
Furthermore, Not only the mixed US data but comments from multiple Fed speakers also raised doubts on the US central bank’s ability to lift the rates further, which in turn allowed Wall Street Journal’s (WSJ) Nick Timiraos to suggest that the Federal Open Market Committee (FOMC) is likely to hold interest rates steady in June.
It’s worth noting that the US Republican-controlled House of Representatives recently passed the debt-ceiling bill and favored the market’s optimism as the ruling Democrats dominate in the Senate and can easily avoid the default now. The same news exerts downside pressure on the US Dollar and puts a floor under the EUR/USD price of late.
Looking ahead, Eurozone CPI and HICP for May will be closely observed as multiple inflation data from the bloc have already pushed back the ECB hawks. Following that, the US ADP Employment Change, ISM Manufacturing PMI and S&P Global PMIs for May should be observed for fresh impulse. Above all, the US policymakers’ voting on the debt-ceiling bill in the Senate and ECB President Christine Lagarde’s speech will be crucial to observe as the EUR/USD buyers are flexing muscles but the US Dollar bulls are less likely to leave the ground.
Technical analysis
The bearish MACD signals join a convergence of the previous support line from November 2022 and a one-month-old descending resistance line, close to 1.0720 at the latest, to challenge the EURU/USD bulls. the latest low of 1.0635 and the 1.0600 round figure may prod the EUR/USD bears before directing them to March’s bottom surrounding 1.0515.
| Raw materials | Closed | Change, % |
|---|---|---|
| Silver | 23.521 | 1.4 |
| Gold | 1963.08 | 0.22 |
| Palladium | 1362.78 | -2.62 |
- USD/JPY picks up bids to snap three-day downtrend, stays within bullish chart formation.
- RSI rebound adds strength to the upside bias but bearish MACD signals, 139.80 hurdle prod Yen pair bulls.
- Multiple supports, recently upbeat market sentiment challenge Yen buyers.
USD/JPY picks up bids to refresh its intraday high near 139.50 as it prints the first daily gains in four during early Thursday. In doing so, the Yen pair recovers from the bottom line of a short-term bull flag formation.
That said, the RSI (14) line’s rebound from the below-50 region seems to underpin the USD/JPY pair’s latest recovery moves within the flag. However, the 50-SMA hurdle of near 139.50 joins the bearish MACD signals to challenge the bulls.
In a case where the USD/JPY pair manages to cross the 139.50 hurdle, the stated flag’s top-line surrounding 139.80 will be eyed closely as a break of which will confirm the bullish chart formation suggesting a theoretical target of around 146.50.
However, the 140.00 round figure and the yearly high marked on Monday near 140.45 can challenge the USD/JPY buyers before giving them control.
Also acting as an upside filter below 146.50 is the November 2022 high of near 142.25 and the last September’s peak of 145.90.
On the flip side, a clear break of the 139.00 immediate support will defy the bullish chart formation and can drag the USD/JPY price towards the mid-May swing high of near 138.75.
Following that, the 100-SMA level of near 137.85 may act as the last defense of the USD/JPY buyers.
USD/JPY: Four-hour chart
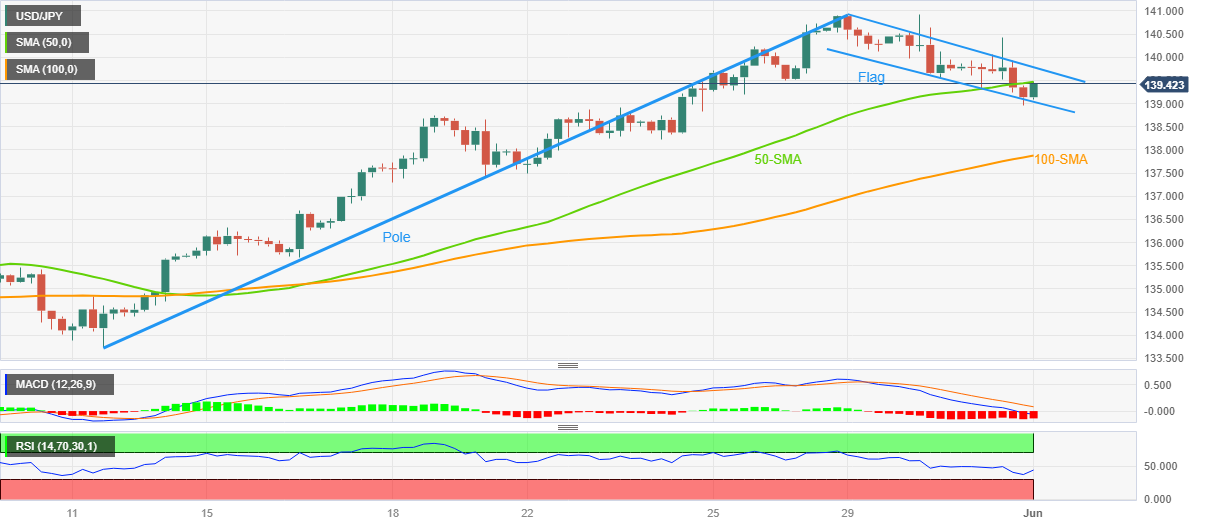
Trend: Further upside expected
- AUD/USD has pushed its recovery above 0.6500 after better than anticipated Caixin manufacturing PMI.
- The release of the Caixin Manufacturing PMI is widely diverged from China’s official Manufacturing PMI data.
- Higher expectations for one more interest rate hike from the Fed could keep the USD index in good shape.
The AUD/USD pair has attempted a recovery move as the IHS Markit has reported upbeat Caixin Manufacturing PMI (May) data. The economic data has landed at 50.9, higher than the consensus and the prior release of 49.5. A figure above 50.0 bifurcates expansion and contraction phases and Chinese factory activities have landed in expansionary territory.
The release of the Caixin Manufacturing PMI is widely diverged from China’s official Manufacturing PMI data. On Wednesday, China’s National Bureau of Statistics (NBS) reported Manufacturing PMI at 48.8, lower than the estimates of 49.4 and the former release of 49.2.
Investors should note that Australia is the leading trading partner of China and higher Chinese factory activity data supports the Australian Dollar.
The Australian Dollar witnessed a sell-off on Wednesday despite posting higher-than-anticipated inflation data. The monthly Australian Consumer Price Index (CPI) soared to 6.8% vs. estimates of 6.4% and the former release of 6.3%. A rebound in Australian inflationary pressures might force the Reserve Bank of Australia (RBA) to announce one more interest rate hike by 25 basis points (bps) in June and push the Official Cash Rate (OCR) above 4%.
Meanwhile, S&P500 futures have surrendered their entire losses posted in early Asia. The risk profile has turned depressed as investors are shifting their focus back to the United States Employment data post clearance of the US debt-ceiling bill in Congress.
Going forward, US Nonfarm Payrolls (NFP) data (May) will keep investors busy. As per the preliminary report, fresh 190K payrolls were added in the labor market in May, lower than the additions of 253K made in April. The Unemployment Rate increased to 3.5% vs. the former release of 3.4%. Annual Average Hourly Earnings were seen steady at 4.4%.
The US Dollar Index (DXY) has sensed selling pressure while extending its recovery above 104.30. Higher expectations for one more interest rate hike from the Federal Reserve (Fed) could keep the USD index in good shape.
- USD/CNH takes offers to refresh intraday low, prints the first daily loss in four at multi-day top.
- China Caixin Manufacturing PMI prints the first above 50.0 print in three months.
- Upbeat sentiment, easing hawkish Fed bets and the mixed US data also exert downside pressure on Chinese Yuan pair.
- US employment clues, Senate voting on debt ceiling eyed for clear directions.
USD/CNH recalls the sellers after their two-day absence as China’s private manufacturing gauge prints welcome figures during early Thursday. Adding strength to the offshore Chinese Yuan is the improvement in the risk profile after the US policymakers inch closer to avoiding the default. That said, the recent shift in the Fed bias and mixed US data also allow the quote to retreat from a six-month high marked the previous day.
China’s Caixin Manufacturing PMI rose beyond 50.0 level for the first time in three months while suggesting an increase in activities. That said, the private manufacturing gauge rose to 50.9 versus 49.5 expected and prior.
Also read: Caixin China Manufacturing PMI (May): 50.9, beats 49.5 prior and 49.5 expected, AUD bid
On the other hand, US JOLTS Job Openings rose to 10.103M in April versus 9.375M expected and 9.745M prior whereas Chicago Purchasing Managers’ Index dropped to 40.4 for May from 48.6 prior and 47.0 market forecasts. Earlier in the week, the US consumer sentiment gauge improved but the details were unimpressive.
Not only the mixed US data but comments from multiple Fed speakers also raised doubts on the US central bank’s ability to lift the rates further, which in turn allowed Wall Street Journal’s (WSJ) Nick Timiraos to suggest that the Federal Open Market Committee (FOMC) is likely to hold interest rates steady in June.
Talking about the risk, the US Republican-controlled House of Representatives recently passed the debt-ceiling bill and favored the market’s optimism as the ruling Democrats dominate in the Senate and can easily avoid the default now. “The Republican-controlled House voted 314-117 to send the legislation to the Senate, which must enact the measure and get it to President Joe Biden's desk before a Monday deadline, when the federal government is expected to run out of money to pay its bills,” said Reuters.
Having witnessing these catalysts, the USD/CNH pair traders should pay attention to the US ADP Employment Change, ISM Manufacturing PMI and S&P Global PMIs for May for fresh impulse.
Technical analysis
Although overbought RSI joined upbeat China data to trigger the USD/CNH pair’s pullback moves, a one-week-old ascending support line near 7.0950 puts a short-term floor under the offshore Yuan prices.
- Market sentiment improves as US Republican-controlled House of Representatives support the measures to avoid government default.
- Easing fears of hawkish Fed actions, mixed US data also allow optimists to return to the table.
- S&P500 Futures snap three-day downtrend, yields seesaw at weekly low.
- US ADP Employment Change, PMI data in focus ahead of Senate voting on debt-ceiling deal, Friday’s NFP.
Risk appetite solidifies on early Thursday as the US policymakers manage to inch closer to avoiding the ‘catastrophic’ default. Adding strength to the cautious optimism are the recently mixed US data and receding hawkish hopes from the Federal Reserve (Fed). It’s worth noting, however, that the anxiety ahead of the top-tier US employment and activity data, as well as before the Senate voting on the bill to extend the US debt-ceiling, seem to prod the optimists of late.
While portraying the mood, S&P500 Futures print the first daily gains in four while approaching the 4,200 round figure, up 0.05% intraday near 4,194 at the latest. On the same line, the US 10-year and two-year Treasury bond yields also stabilize around 3.65% and 4.42% after refreshing the weekly low during the previous fall.
“The Republican-controlled House voted 314-117 to send the legislation to the Senate, which must enact the measure and get it to President Joe Biden's desk before a Monday deadline, when the federal government is expected to run out of money to pay its bills,” said Reuters.
On the other hand, Wall Street Journal’s (WSJ) Nick Timiraos cites multiple Fed speakers and recently mixed US data to suggest that the Federal Open Market Committee (FOMC) is likely to hold interest rates steady in June.
That said, US JOLTS Job Openings rose to 10.103M in April versus 9.375M expected and 9.745M prior whereas Chicago Purchasing Managers’ Index dropped to 40.4 for May from 48.6 prior and 47.0 market forecasts. Earlier in the week, the US consumer sentiment gauge improved but the details were unimpressive.
Among the key Fed speakers was Governor Michelle Bowman who cited recovery in the residential real estate market while also adding, “The leveling out of home prices will have implications for the Fed's fight to lower inflation,” per Reuters. Before him, Cleveland Fed President Loretta Mester suggested that the Fed must go for a rate hike in June. Additionally, Fed Governor and vice chair nominee Philip Jefferson said that skipping a rate hike would allow the Fed "to see more data before making decisions about the extent of additional policy firming,” per Reuters. On the same line was Federal Reserve Bank of Philadelphia President Patrick Harker who also said on Wednesday that he is inclined to support a "skip" in interest rate hikes at the central bank's next meeting in June.
Looking forward, the market players will keep their eyes on the Senate’s voting on the debt ceiling bills and the US ADP Employment Change, ISM Manufacturing PMI and S&P Global PMIs for May for clear directions.
Also read: Forex Today: Dollar loses momentum, markets remain cautious
Caixin China Manufacturing PMI (May) has been released as follows:
- 50.9 (FORECAST 49.5, PREVIOUS 49.5)
AUD/USD update
In the prior AUD/USD Price Analysis: Bulls run into a wall of resistance bears eye downside breakout, and the downside was eyed as per the W-formation:
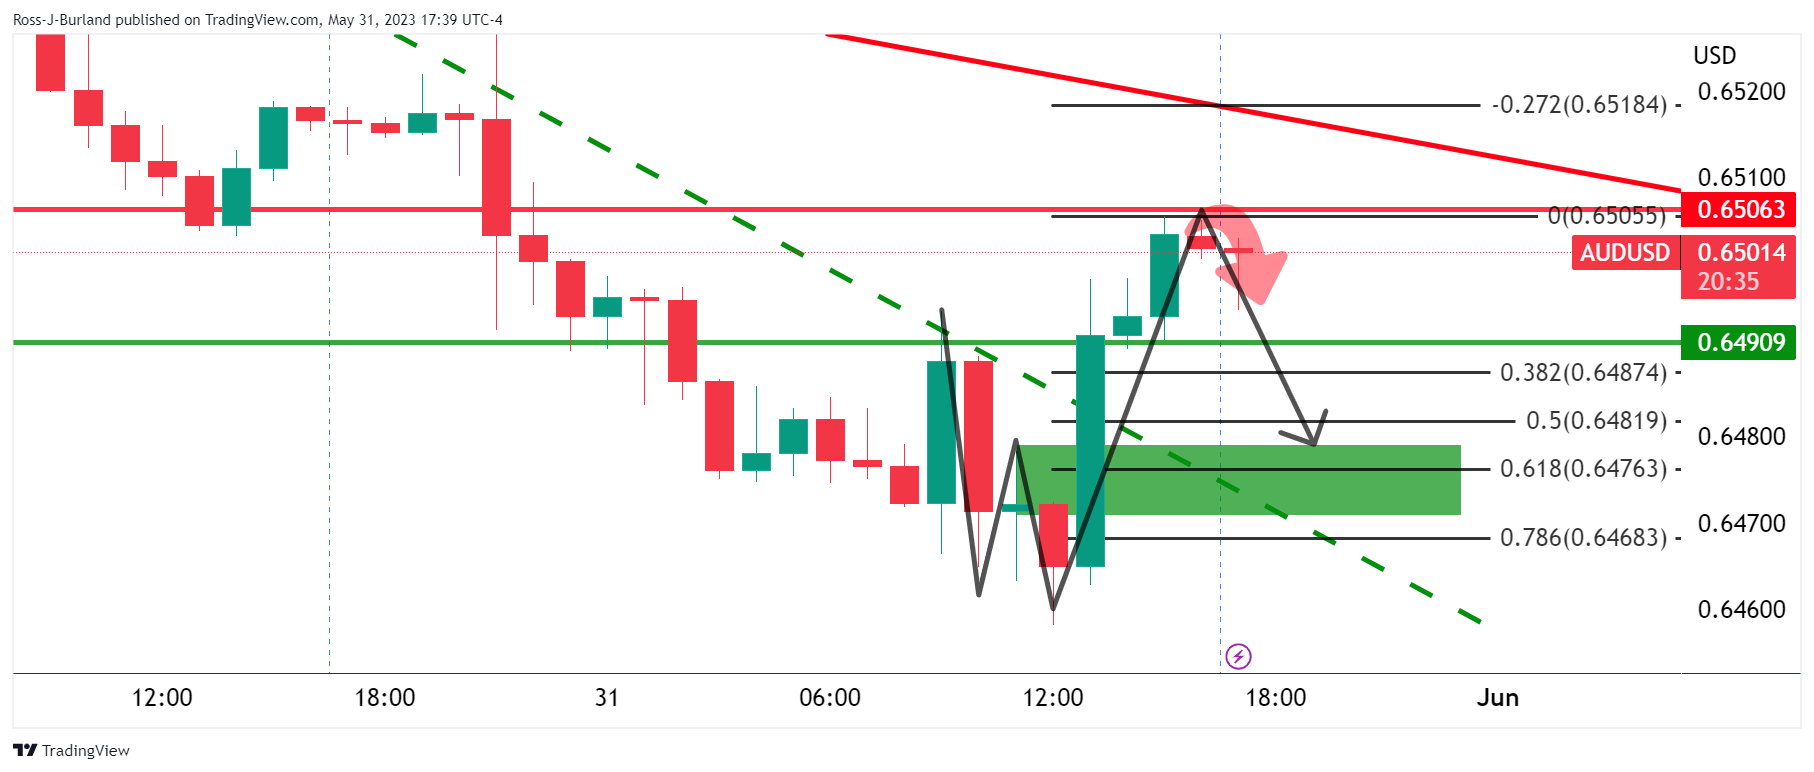
AUD/USD had followed that trajectory as follows:
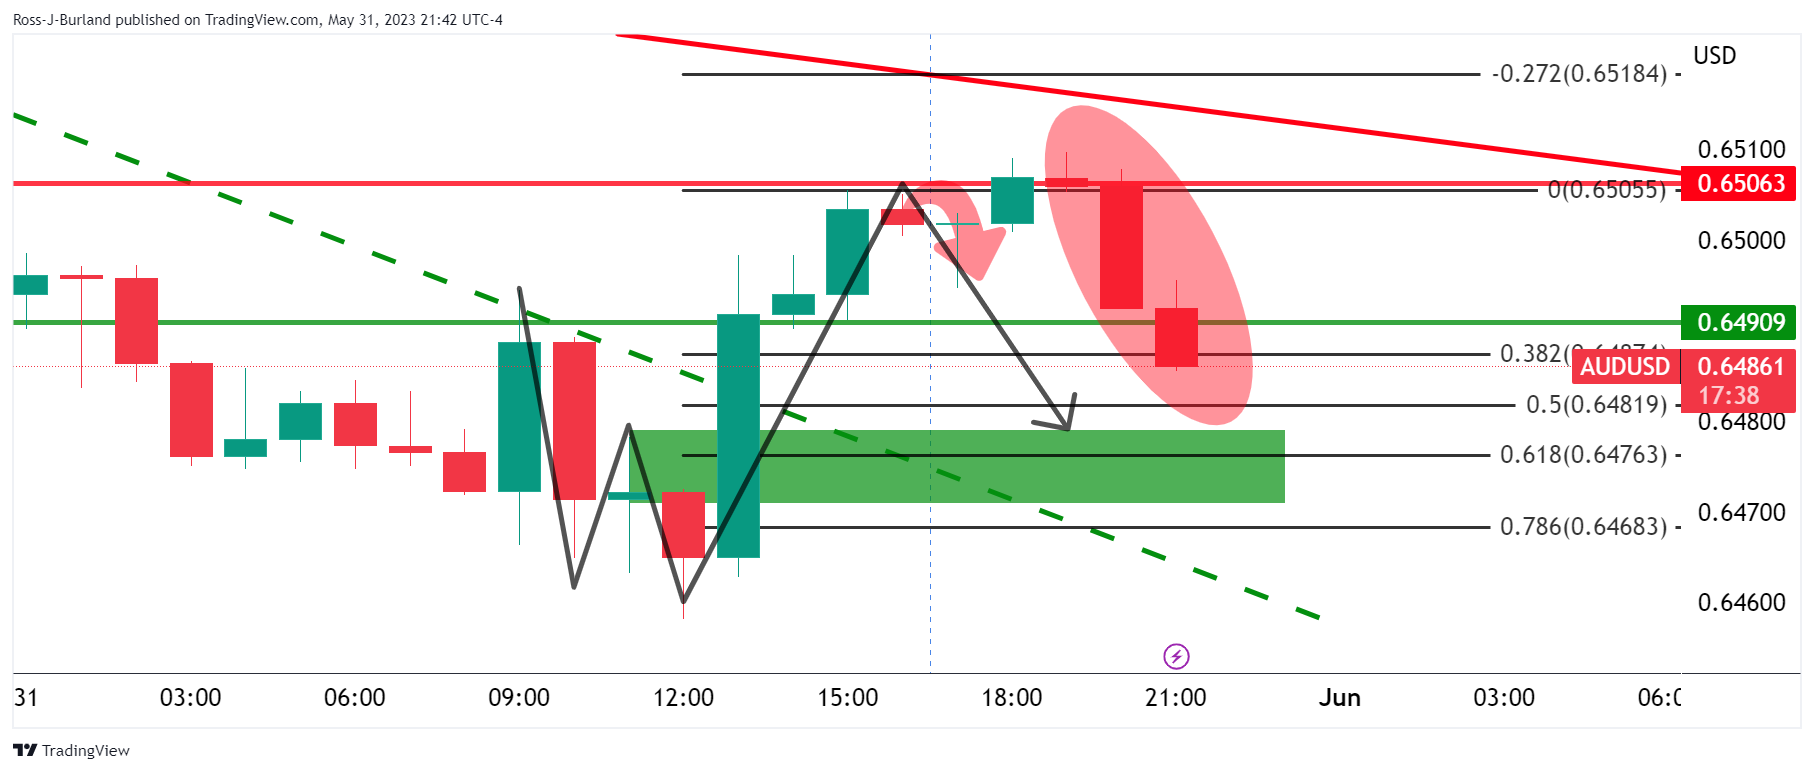
However, the data has put a bid into AUD:
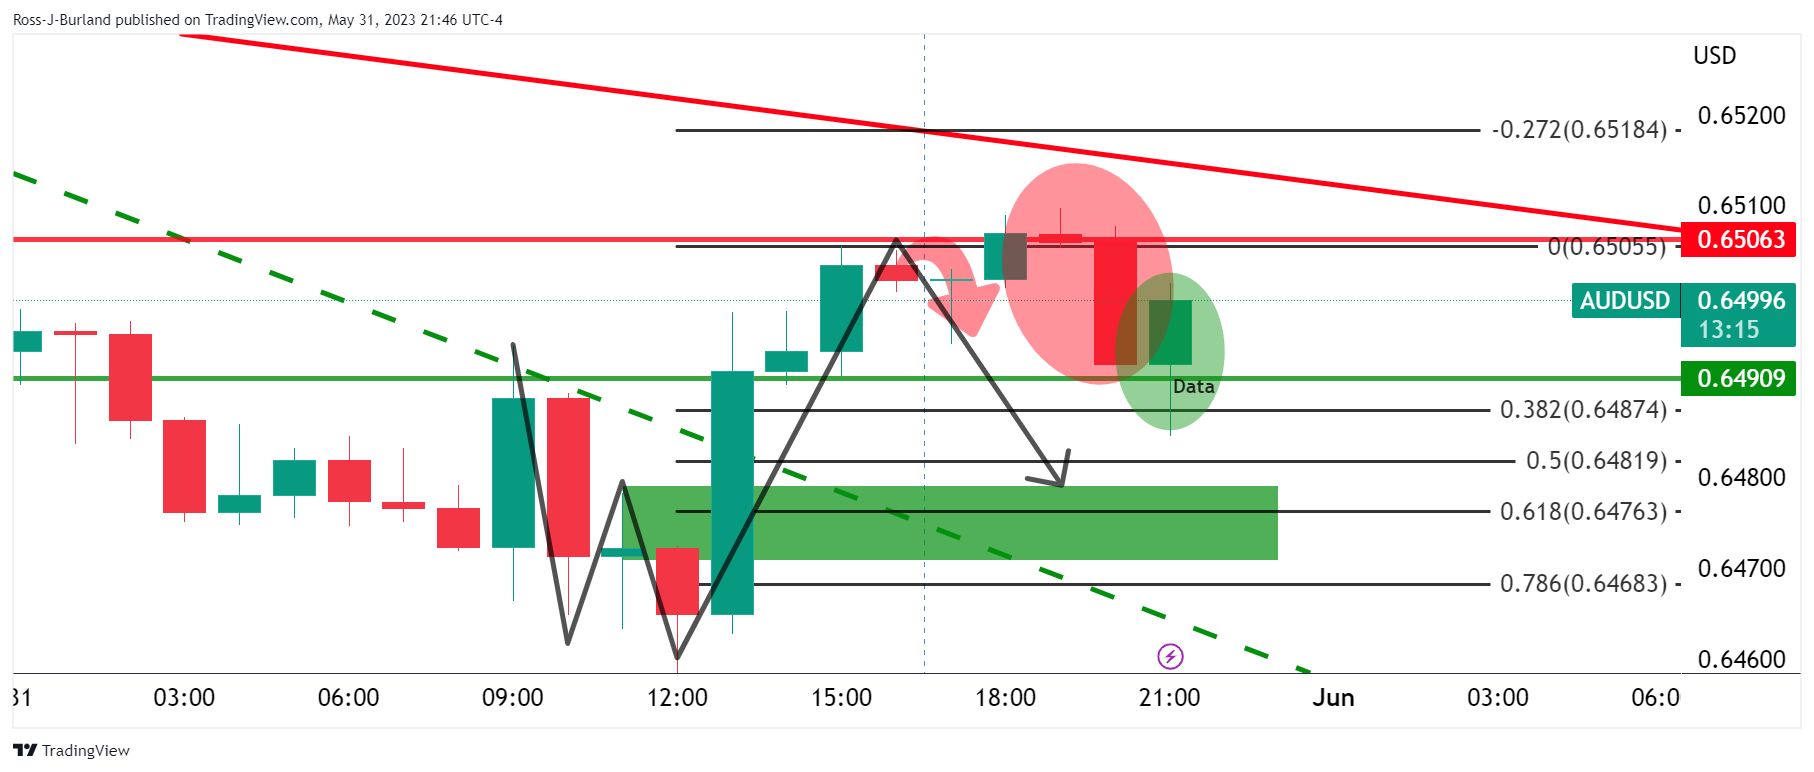
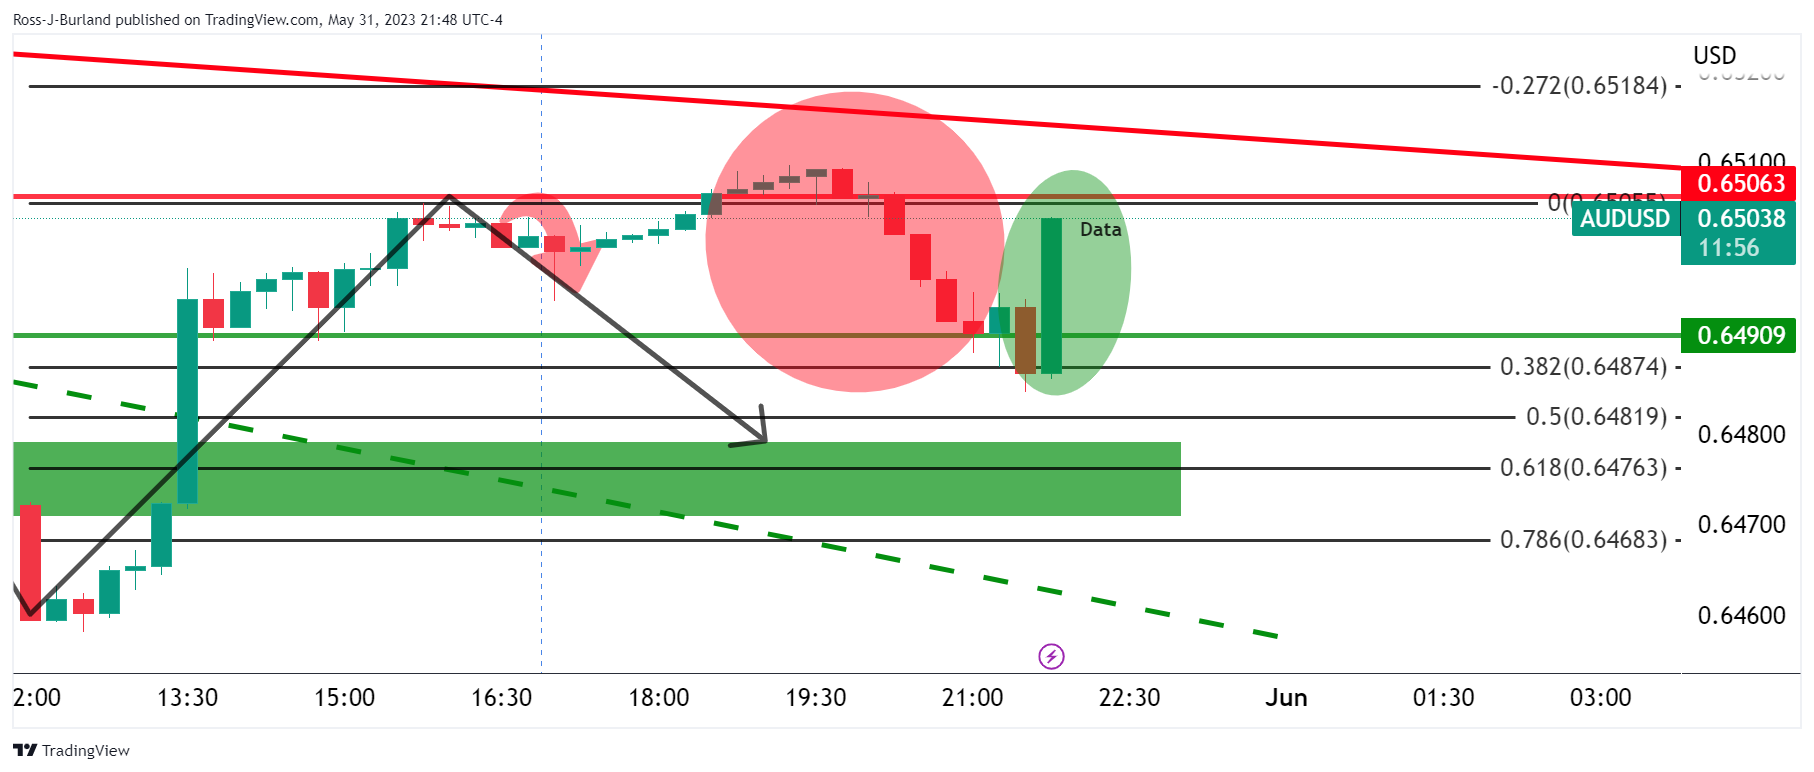
About the Caixin China Manufacturing PMI
The Caixin China Manufacturing PMI™, released by Markit Economics, is based on data compiled from monthly replies to questionnaires sent to purchasing executives in over 400 private manufacturing sector companies.
- USD/CAD has managed to defend 1.3560 for the time being amid a recovery in the USD Index.
- Canada’s quarterly GDP expanded by 0.8% against 0.4% as estimated and a stagnant performance was reported earlier.
- USD/CAD has formed a Double Top pattern which will be triggered after a confident breakdown of 1.3568.
The USD/CAD pair has managed to defend its downside near 1.3560 in the Tokyo session. The Loonie asset has got some strength propelled by a recovery in the US Dollar Index (DXY). The USD Index has shown a solid recovery after correcting to near 104.13 on hopes that the Federal Reserve (Fed) will push interest rates further in June.
The Canadian Dollar got some strength on Thursday after the release of upbeat Q1 Gross Domestic Product (GDP) numbers. Quarterly GDP expanded by 0.8% against 0.4% as estimated and a stagnant performance was reported in the prior quarter.
While monthly GDP (March) remained stagnant but managed to avoid contraction as expected by the market participants. The content is insufficient to force the Bank of Canada (BoC) to continue hiking interest rates again.
USD/CAD has formed a Double Top chart pattern on an hourly scale, which indicates a bearish reversal due to an absence of buying interest near critical resistance plotted from May 26 high at 1.3665. A confident breakdown of the trigger support around 1.3568 will activate the Double Top formation. Potential support is placed from May 22 low at 1.3485.
Downward-sloping 20-period Exponential Moving Average (EMA) at 1.3592 indicates that the short-term trend is bearish.
Meanwhile, the Relative Strength Index (RSI) (14) is oscillating in the bearish range of 20.00-40.00, which advocates more weakness ahead.
Going forward, a break below the intraday low at 1.3563 will drag the asset toward May 17 high at 1.3536. A breakdown below the latter will expose the Loonie asset to May 22 low at 1.3485.
On the contrary, a fresh buy would come above May 26 high at 1.3655, which would drive the asset toward the round-level resistance at 1.3700 followed by March 27 high at 1.3745.
USD/CAD hourly chart
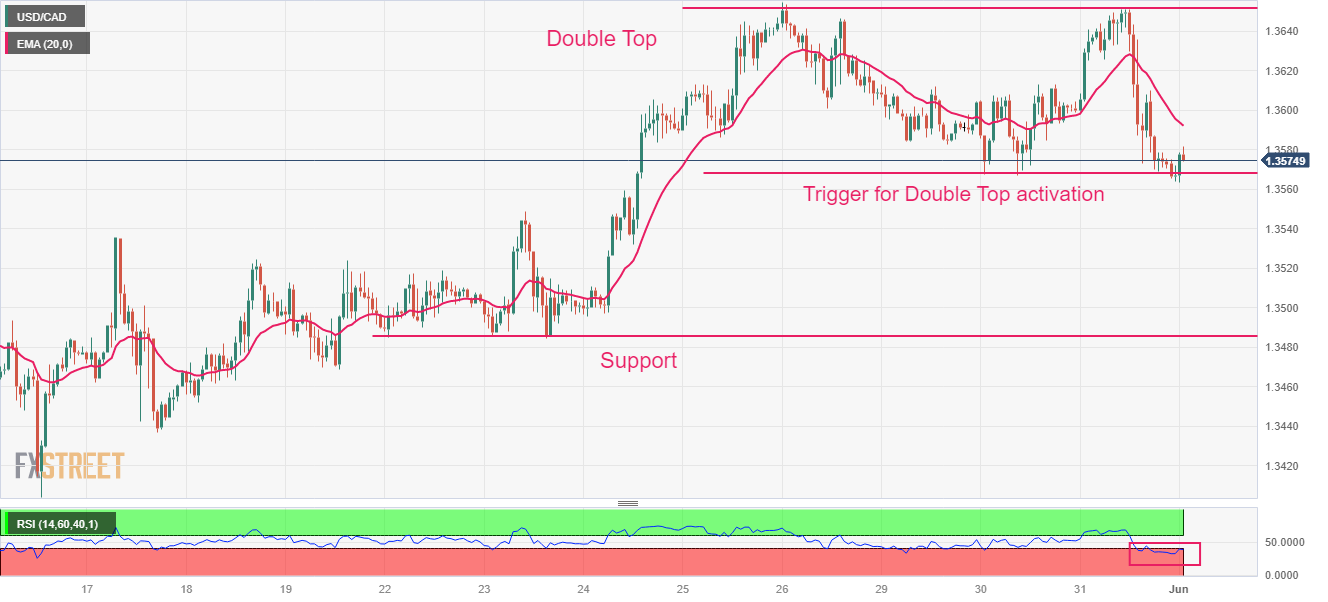
In recent trade today, the People’s Bank of China (PBOC) set the yuan at 7.0965 vs. the prev fix of 7.0821 prev close and prior 7.1090.
About the fix
China maintains strict control of the yuan’s rate on the mainland.
The onshore yuan (CNY) differs from the offshore one (CNH) in trading restrictions, this last one is not as tightly controlled.
Each morning, the People’s Bank of China (PBOC) sets a so-called daily midpoint fix, based on the yuan’s previous day's closing level and quotations taken from the inter-bank dealer.
The US House has the votes to pass the debt-limit deal, the vote is ongoing although this will now go to the Senate for voting. There are only a handful of days remaining until the nation hits the X-date on which it could default, June 5.
- Silver Price grinds near weekly high as bulls attack convergence of key resistance lines.
- Upbeat MACD signals suggest further XAG/USD advances but 200-SMA is the key hurdle.
- 50-SMA, weekly support line restricts immediate downside of the Silver Price.
Silver Price (XAG/USD) clings to mild gains near $23.50-55 as bulls take a breather while jostling with the short-term key resistance during early Thursday. In doing so, the bright metal also makes rounds to the weekly high amid a three-day uptrend.
A convergence of a downward-sloping trend line from May 05 and a fortnight-old descending resistance line appears challenging the XAG/USD buyers around $23.60.
That said, a sustained break of the 50-SMA and bullish MACD signals keep the Silver buyers hopeful of crossing the $23.60 hurdle, which in turn will allow them to meet the $24.00 round figure.
However, the 200-SMA level of around $24.50 can challenge the XAG/USD afterward, if not then the $25.00 round figure may act as an intermediate halt during the quote’s run-up targeting the previous monthly peak of around $26.15. It should be noted that April’s high of $26.08 also challenges the Silver buyers past the $26.00 threshold.
Alternatively, the 50-SMA level of around $23.25 precedes a one-week-long rising trend line, close to $23.20 at the latest, to restrict the intraday fall of the Silver price.
Following that, the latest trough marked the last Friday near $22.70 and November 2022 high near $22.25 may act as the last defenses of the XAG/USD buyers.
Silver Price: Four-hour chart

Trend: Limited upside expected
- EUR/JPY bears are looking for a move below support.
- Bulls have their eyes on the M-formation.
EUR/JPY is under pressure within a bearish schematic on the hourly charts as the following will illustrate:
EUR/JPY H1 chart
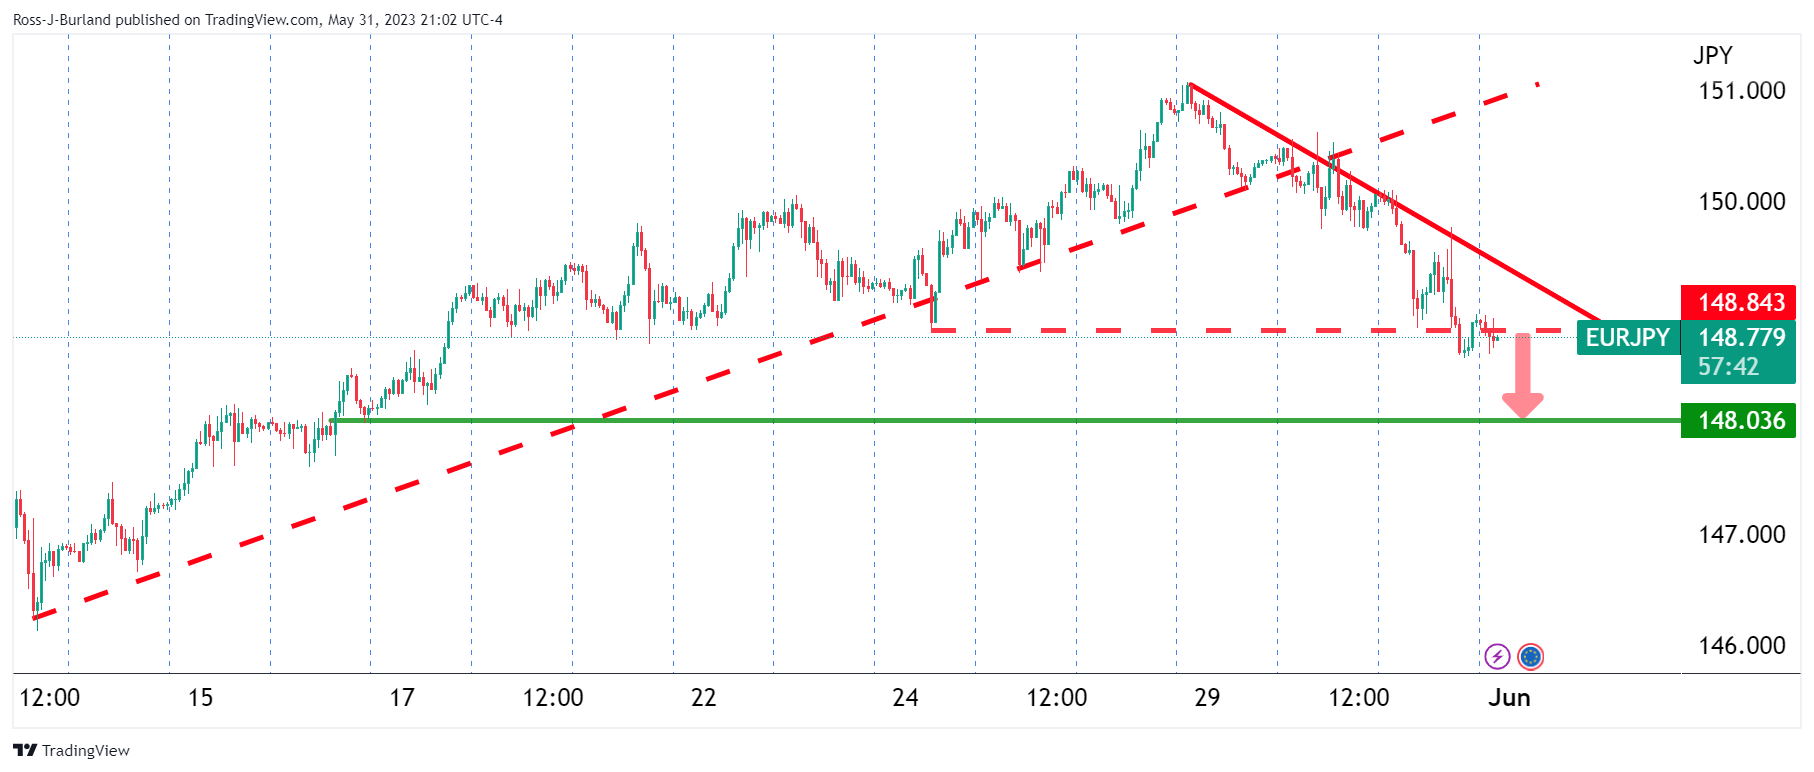
The price broke out of the bullish trend and has subsequently fallen to test a structural point on the chart around 148.80. EUR/JPY remains well below the trendline resistance but there are prospects of a bullish correction if the bears do not commit to the move at this juncture.
We have an area of orders in the greyed-out sections of the chart below.
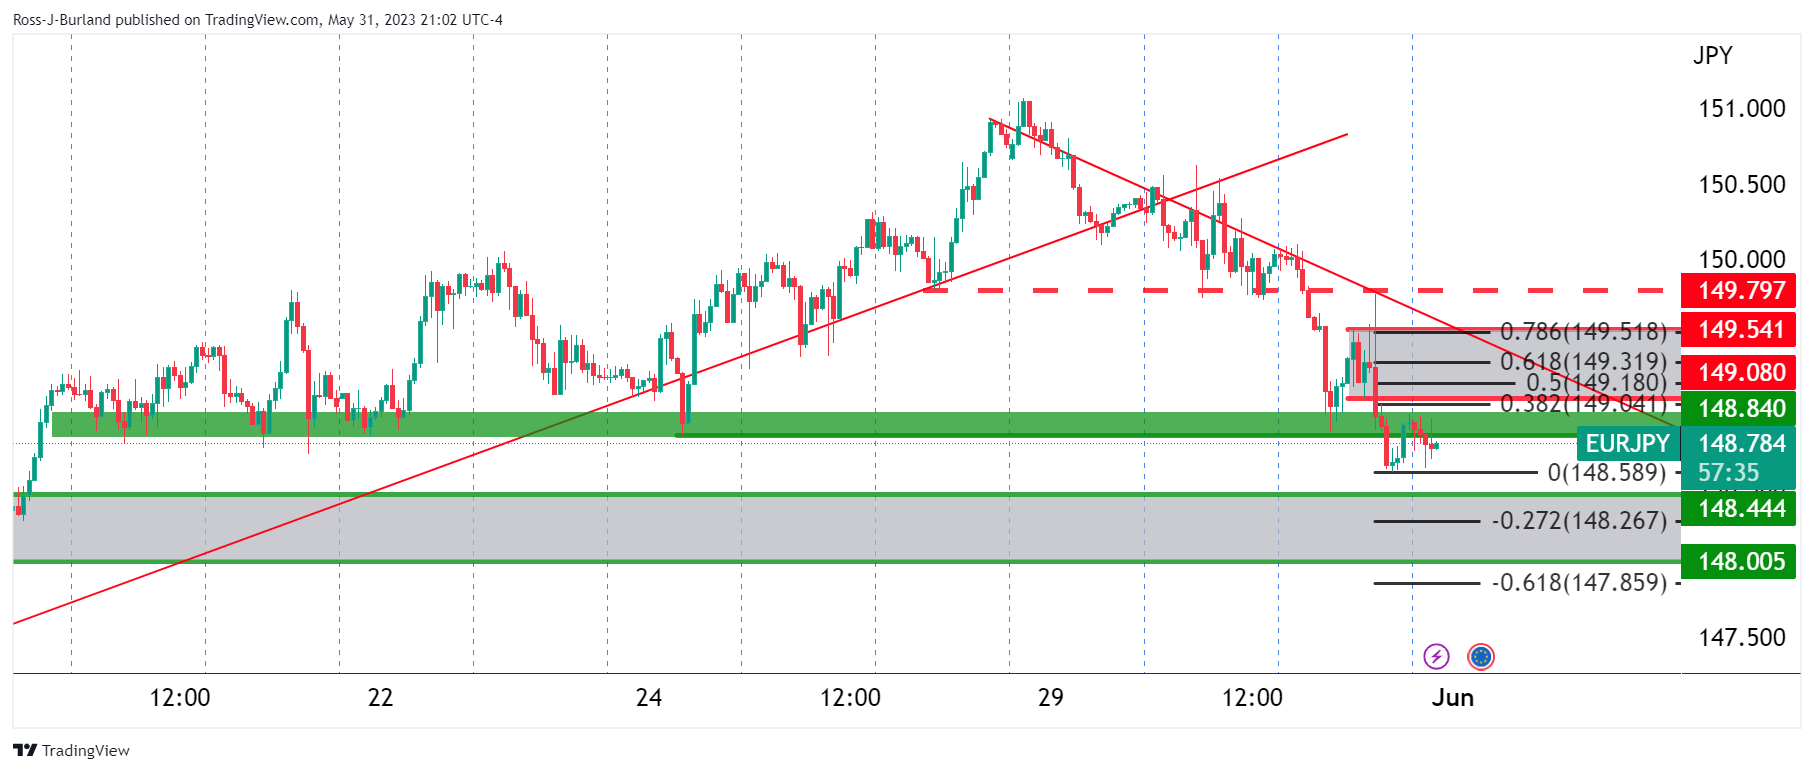
There are prospects of a move back into the Fibonacci scale.
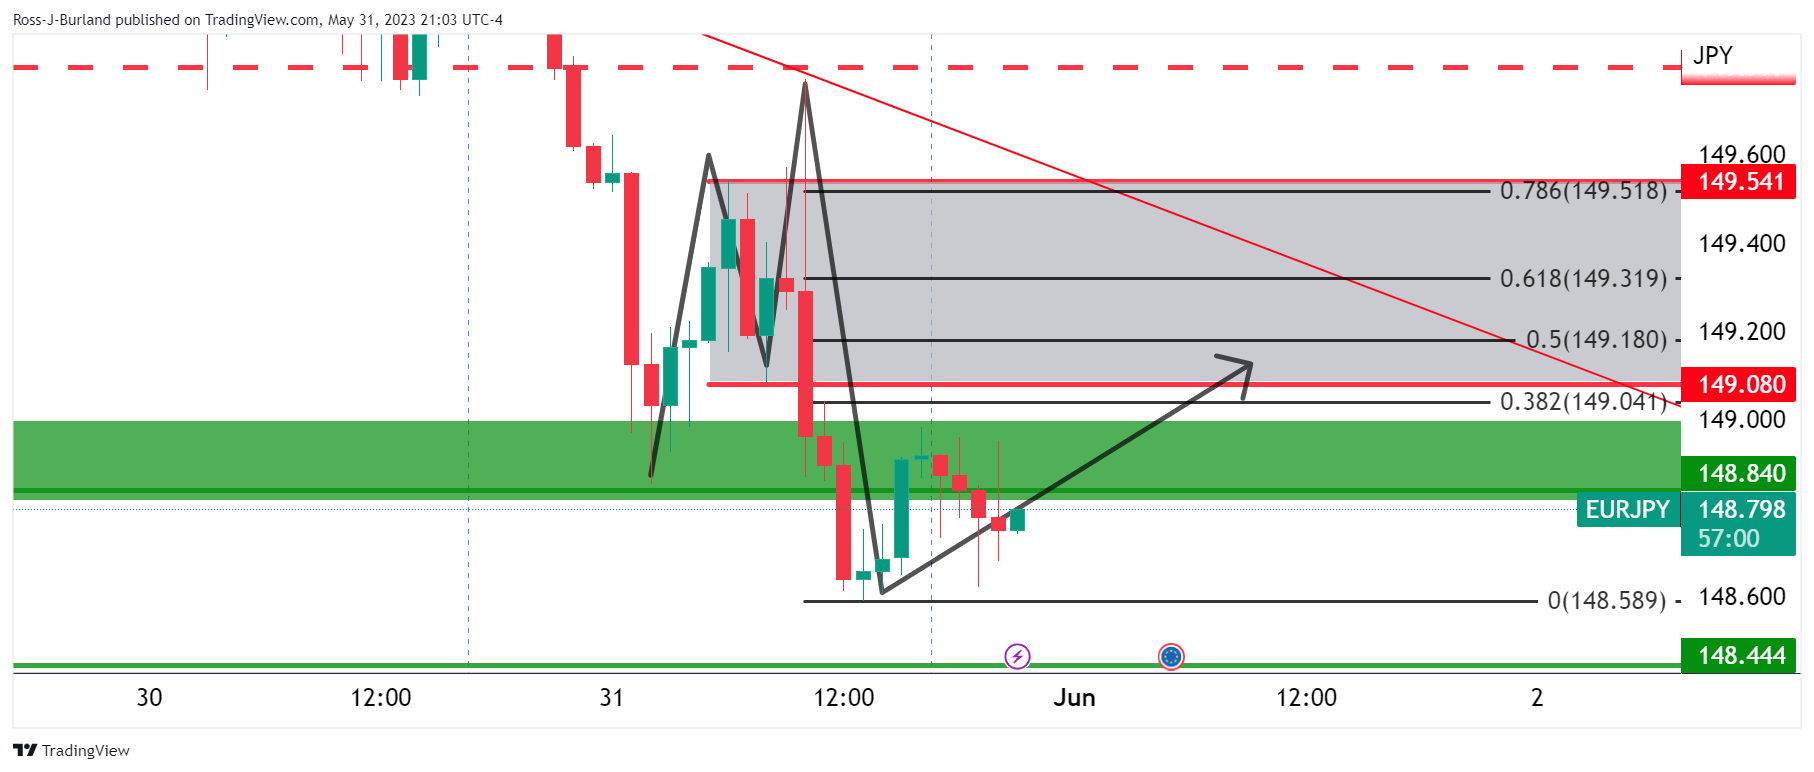
The M-formation is compelling in this regard. This is a reversion pattern that tends to pull the price back towards the neckline of the formation.
- EUR/GBP has turned sideways after slipping below 0.8600 as German inflation decelerated significantly.
- German deflation has faded long-term hawkish ECB bets.
- BoE Mann said the gap between the headline and core inflation in the UK is more persistent than in the US and the Euro area.
The EUR/GBP pair has shifted its auction below the round-level support of 0.8600 after a perpendicular sell-off in the Asian session. The cross was heavily sold on Wednesday after German Inflation softened more than anticipated.
German economy which is already in recession after reporting contraction in Gross Domestic Product (GDP) figures consecutively for two quarters, reported deflation for May by 0.2%, which could be the outcome of weak retail demand and higher interest rates from the European Central Bank (ECB). Annual preliminary German Harmonized Index of Consumer Prices (HICP) surprisingly softened to 6.3% vs. the estimates of 6.8% and the former release of 7.6%.
ECB President Christine Lagarde announced that more than one interest rate hike is appropriate to tame Eurozone inflation. However, fresh incoming data is fading longer-term hawkish ECB bets. However, ECB policymaker Madis Muller cited on Wednesday, “It is very likely that the ECB will hike by 25 bps more than once as core inflation is still stubborn.”
Going forward, Eurozone Inflation (May) will remain in the spotlight. Analysts at Societe Generale cited “We expect the May inflation data to deliver another massive decline in headline inflation from 7% yoy in April to 6% in May. Meanwhile, we think easing goods inflation will help core inflation fall from 5.6% to 5.5%, with a downside risk of 5.4% – which is set to increase the pressure on the ECB to do more rate hikes.”
Meanwhile, sticky United Kingdom inflation would keep forcing the Ban of England (BoE) to remain hawkish for a longer period. UK’s inflation softened to 8.7% in April but is expected to miss UK PM Rishi Sunak’s promise of halving inflation by year-end as food inflation is still hovering near 46 years high and labor shortages will remain a concern.
BoE Monetary Policy Committee (MPC) member Catherine Mann noted on Wednesday that the gap between the headline and core inflation in the UK is more persistent than in the US and the Euro area, as reported by Reuters. She further added that firms will use it if they have high pricing power and said that they will remain on a path that has an "awful a lot of volatility."
- Natural Gas prints mild gains at three-week low after declining in the last five consecutive days.
- US Dollar’s retreat struggles to defend XNG/USD traders amid mostly downbeat energy market news.
- US House voting on debt-ceiling bill, employment clues and weekly Natural Gas inventories eyed for immediate directions.
Natural Gas (XNG/USD) picks up bids to recover from the lowest levels in three weeks, up 0.60% intraday near $2.29 amid the mid-Asian session on Thursday. In doing so, the energy instrument cheers the latest retreat in the US Dollar Index (DXY) amid receding hawkish Fed bets and hopes of avoiding the US default. However, the price-negative headlines from the XNG/USD market seem to keep the bears hopeful ahead of the key US data and weekly Natural Gas stockpile from the US Energy Information Administration (EIA).
US Dollar Index (DXY) grinds near 104.22 after retreating from the highest levels since the mid-March late on Wednesday. That said, the greenback’s latest pullback could be linked to the optimism surrounding US debt-ceiling deal as it is being discussed in the US House of Representatives. Also exerting downside pressure on the DXY could be the latest shift in the Federal Reserve (Fed) concerns amid mixed US data and mostly downbeat comments from the Fed officials suggesting a pause in the rate hike.
Even so, concerns that the Natural Gas flaring will outline pipeline capacity, per Reuters, also exert downside pressure on the XNG/USD price. “East Daley and Validere, a measurement, reporting, and verification firm, estimated pipeline takeaway capacity will fall short of gas production by an average of 200 million cubic feet per day (mmcfd) in 2023 and the first half of 2024, before rising to about 500 mmcfd in May 2024,” said the news late in May.
It’s worth noting that the hopes of reduction in the European gas demand and recent downbeat China data also weigh on the Natural Gas Price. Late in the last week, Reuters came out with a news citing a document seen that suggests European Union gas demand could fall in the coming 12 months by more than the total volume of gas the EU expects to buy from Russia this year.
Amid these plays, the XNG/USD price remains sidelined as traders await the key risk catalysts, as well as the weekly Natural Gas Storage Change, prior 96B, for clear directions. Apart from that, the early signals for Friday’s US Nonfarm Payrolls (NFP), namely the ADP Employment Change, ISM Manufacturing PMI and S&P Global PMIs for May, will be crucial to watch for fresh impulse.
Technical analysis
Despite bouncing off a seven-week-old ascending support line, around $2.28 by the press time, a convergence of the 50-DMA and a downward-sloping resistance line from May 19, close to $2.36 at the latest, will be crucial to cross for the Natural Gas buyers before retaking control.
- EUR/USD licks its wounds at the lowest levels in 11 weeks.
- Eurozone inflation, US ADP Employment Change and PMI data to decorate calendar.
- Convergence of previous support line from November, one-month-old descending resistance line prods EUR/USD rebound.
- Oscillators suggest slow grind towards the south, bumpy road ahead of hitting yearly low.
EUR/USD stays defensive around 1.0690, after bouncing off a 2.5-month low, as Euro traders await the key political and economic developments surrounding Eurozone and the US early Thursday.
That said, the oversold RSI (14) seems to have triggered the EUR/USD pair’s corrective bounce off the lowest levels since mid-March.
However, the bearish MACD signals join a convergence of the previous support line from November 2022 and a one-month-old descending resistance line, close to 1.0720 at the latest, to challenge the Euro bulls.
Even if the EUR/USD buyers manage to cross the 1.0720 hurdle, February 14’s high of 1.0805 and the February month peak of 1.1033 could challenge the upside momentum. It’s worth noting that the 1.0900 and 1.1000 round figures are extra filters toward the north.
Alternatively, the latest low of 1.0635 and the 1.0600 round figure may prod the EUR/USD bears before directing them to March’s bottom surrounding 1.0515.
Following that, the 200-DMA support of around 1.0500 and January’s bottom near 1.0485 will be in the spotlight.
Overall, EUR/USD is likely to remain bearish despite the latest corrective bounce.
Also read: EUR/USD Forecast: Euro steadies, supported by a weaker Dollar
EUR/USD: Daily chart
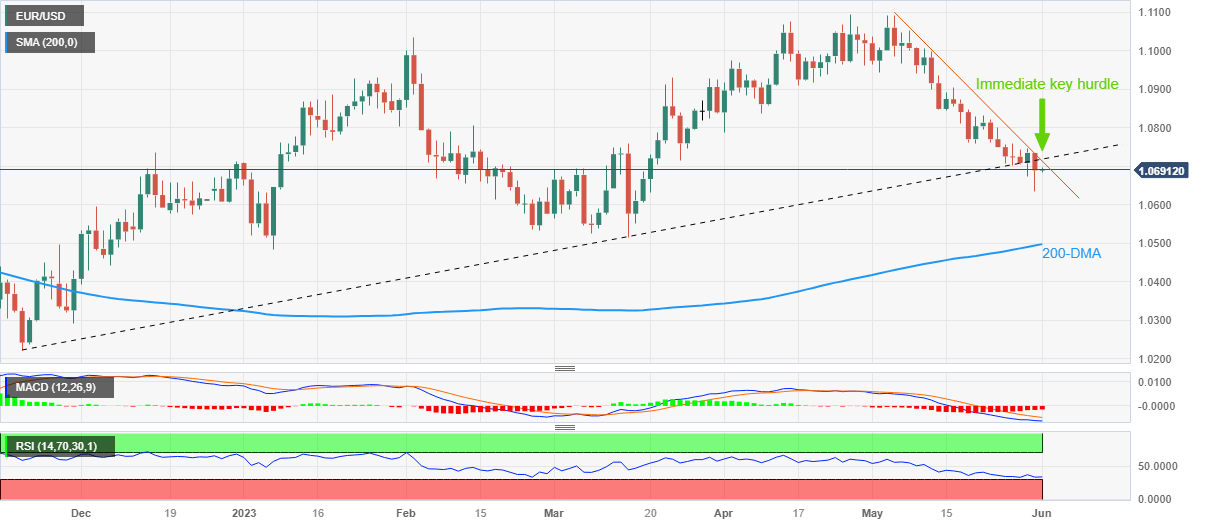
Trend: Bearish
- GBP/USD has printed a fresh weekly high at 1.2450 as Fed policymakers are divided over interest rate guidance.
- The US Dollar Index (DXY) is showing some strength after dropping sharply to near 104.13 as the focus shifts to US Employment.
- UK’s headline inflation decelerated to 8.7%, finally ditched double-digit territory but remained well-above estimates in April.
The GBP/USD pair is facing stiff barricades around 1.2450 in the Asian session. The Cable has printed a fresh weekly high at 1.2450 but is facing hurdles in extending recovery further amid mixed views from Federal Reserve (Fed) policymakers about interest rate guidance for June’s monetary policy meeting.
S&P500 futures have added more gains in early Tokyo on hopes that the US debt-ceiling proposal will get a clearance from in voting at Congress. Market mood is turning risk-on as investors have started digesting one more interest rate hike from the Federal Reserve (Fed) in its June monetary policy meeting.
Mixed views about interest rate guidance by Fed policymakers are creating chaos in financial markets. Cleveland Fed Bank President, Loretta Mester, in an interview with Financial Times, cited “I don’t really see a compelling reason to pause — meaning wait until you get more evidence to decide what to do.” While Fed Governor Philip Jefferson said in a speech on Wednesday that pausing rate hikes at the next FOMC meeting would offer time to analyze more data before making a decision about the extent of additional tightening. He added that a pause does not mean that rates peaked.
The US Dollar Index (DXY) is showing some strength after dropping sharply to near 104.13. It seems that investors are shifting their focus back to the United States Employment data. As per the estimates, the US economy added fresh 170K personnel in the labor market lower than the prior addition of 296K.
On the Pound Sterling front, stubborn United Kingdom inflation is empowering the case of one more interest rate hike by the Bank of England (BoE). Inflationary pressures in the UK economy are not easing as expected due to higher food inflation and labor shortages. UK’s headline inflation decelerated to 8.7%, finally ditched double-digit territory but remained well-above estimates in April.
Economists at Nomura cited “Following the latest inflation print, we have changed our call and now see the BoE raising rates by 25 bps at each of the next three meetings.” They further added “We thus forecast peak rates at 5.25% for the BoE.


© 2000-2026. Bản quyền Teletrade.
Trang web này được quản lý bởi Teletrade D.J. LLC 2351 LLC 2022 (Euro House, Richmond Hill Road, Kingstown, VC0100, St. Vincent and the Grenadines).
Thông tin trên trang web không phải là cơ sở để đưa ra quyết định đầu tư và chỉ được cung cấp cho mục đích làm quen.
Giao dịch trên thị trường tài chính (đặc biệt là giao dịch sử dụng các công cụ biên) mở ra những cơ hội lớn và tạo điều kiện cho các nhà đầu tư sẵn sàng mạo hiểm để thu lợi nhuận, tuy nhiên nó mang trong mình nguy cơ rủi ro khá cao. Chính vì vậy trước khi tiến hành giao dịch cần phải xem xét mọi mặt vấn đề chấp nhận tiến hành giao dịch cụ thể xét theo quan điểm của nguồn lực tài chính sẵn có và mức độ am hiểu thị trường tài chính.
Sử dụng thông tin: sử dụng toàn bộ hay riêng biệt các dữ liệu trên trang web của công ty TeleTrade như một nguồn cung cấp thông tin nhất định. Việc sử dụng tư liệu từ trang web cần kèm theo liên kết đến trang teletrade.vn. Việc tự động thu thập số liệu cũng như thông tin từ trang web TeleTrade đều không được phép.
Xin vui lòng liên hệ với pr@teletrade.global nếu có câu hỏi.
ngân hàng