- Phân tích
- Tin tức và các công cụ
- Tin tức thị trường
Tin tức thì trường
- Fed Barkin’s hawkish commentary on interest rates has failed to impact the Kiwi asset.
- A breakout of the Bullish Pennant pattern has strengthened the New Zealand Dollar.
- Range shift from the RSI (14) into the 60.00-80.00 territory, will trigger a bullish momentum.
The NZD/USD pair is juggling in a narrow range of around 0.6430 in the early Asian session. The Kiwi asset has turned sideways after refreshing the monthly high at 0.6437 despite the risk-off market mood. S&P500 futures are displaying more losses, portraying a further decline in investors’ risk appetite after hawkish commentary from Richmond Federal Reserve (Fed) Bank President Tom Barkin.
The US Dollar Index (DXY) has turned sideways around 102.00 after a V-shape recovery and is expected to extend gains amid a risk-aversion theme. Also, rising 10-year US Treasury yields are likely to infuse fresh blood into the safe-haven assets.
NZD/USD has delivered a breakout of the Bullish Pennant chart pattern that indicates a continuation of the upside momentum after consolidation on an hourly scale. Usually, the consolidation phase of the chart pattern serves as an inventory adjustment in which those participants initiate longs, which prefer to enter an auction after the establishment of a bullish bias.
The 20-and 50-period Exponential Moving Averages (EMAs) at 0.6415 and 0.6401 respectively have resumed their upside journey, which adds to the upside filters.
Meanwhile, the Relative Strength Index (RSI) (14) is still struggling to shift into the bullish range of 60.00-80.00. An occurrence of the same will trigger a bullish momentum.
For further upside, the Kiwi asset needs to break above Tuesday’s high at 0.6439, which will drive the asset towards December 15 high at 0.6470 followed by December 13 high at 0.6514.
Alternatively, a break below Monday’s low at 0.6361 will weaken the New Zealand Dollar and will drag the Kiwi asset towards January 12 low at 0.6304. A slippage below the latter will expose the asset for more downside toward December 28 low at 0.6263.
NZD/USD hourly chart
-638095961579533681.png)
- USD/CHF holds lower grounds after posting the biggest daily loss in over a week.
- Softer US data probed US Dollar buyers even as upbeat yields, downbeat EUR probed greenback bears.
- Mixed sentiment, dovish Fed talks highlight the need for softer US data to keep USD/CHF bears on the table.
USD/CHF remains depressed as sellers approach the 0.9200 threshold, close to 0.9215 during the early hours of Wednesday’s Asian session. In doing so, the Swiss currency (CHF) pair cheers the US Dollar’s failure to benefit from upbeat Treasury bond yields and the softer Euro amid softer US data, as well as downbeat comments from the Federal Reserve (Fed) officials.
On Tuesday, the US Dollar Index (DXY) marked a dismal closing around 102.35, after an initially positive performance. That said, the US Treasury bond yields allowed the US Dollar to remain firmer, downbeat prints of the New York manufacturing data, namely the Empire State Manufacturing Index for December, probed the US Dollar bulls and put a floor under the Gold price. That said, the NY Fed’s business gauge dropped sharply in January to -32.9 versus -4.5 market forecasts and -11.2 prior readings.
The data also helped the Federal Reserve Bank of Richmond’s President and CEO Thomas Barkin to state, “My hope is that we have passed the peak of inflation.” As a result, the US Dollar bulls had a tough ride.
It’s worth noting that the dovish concerns surrounding the ECB’s next move, which weighed on the Euro, could be linked to Bloomberg’s news saying, “ECB policymakers are starting to consider a slower pace of interest-rate hikes after a likely 50 basis-point step in February.”
Amid these plays, Wall Street closed mixed and the benchmark 10-year US Treasury bond yields ended the day with nearly four basis points (bps) of an upside to 3.55% even as the two-year counterpart retreated to 4.20%.
Moving on, mixed signals from the recently mixed US consumer-centric data, coupled with the Federal Reserve (Fed) policymakers’ inability to defend the hawkish bias, highlight today’s US Retail Sales and the Producer Price Index (PPI) for December. Forecasts suggest that the headlines US Retail Sales may improve with 0.1% monthly gains, versus the previous contraction of 0.6% while the PPI is likely to ease to -0.1% from 0.3% prior.
Technical analysis
USD/CHF is well-set to refresh the monthly low, around 0.9165 by the press time, unless the quote crosses a two-week-old resistance line, close to 0.9315 at the latest.
“US Secretary of State Antony Blinken said after meeting his British counterpart on Tuesday that Washington welcomed apparent progress in talks between Britain and the European Union aimed at resolving a post-Brexit trade row over Northern Ireland,” reported Reuters late Tuesday.
The news cites talks between US Secretary of State Blinken and Britain's Foreign Secretary James Cleverly's talks at the State Department in Washington for the news. The discussions were mainly focused on support for Ukraine in its war with Russia though.
Key quotes
The US position is that there must be a negotiated settlement that is acceptable to all sides.
We're heartened that in recent days the United Kingdom and the European Union have made substantive progress toward a negotiated solution.
GBP/USD grinds higher
GBP/USD holds onto the previous day’s run-up while picking up bids towards 1.2300.
Also read: GBP/USD aims to recapture 1.2300 ahead of UK CPI data
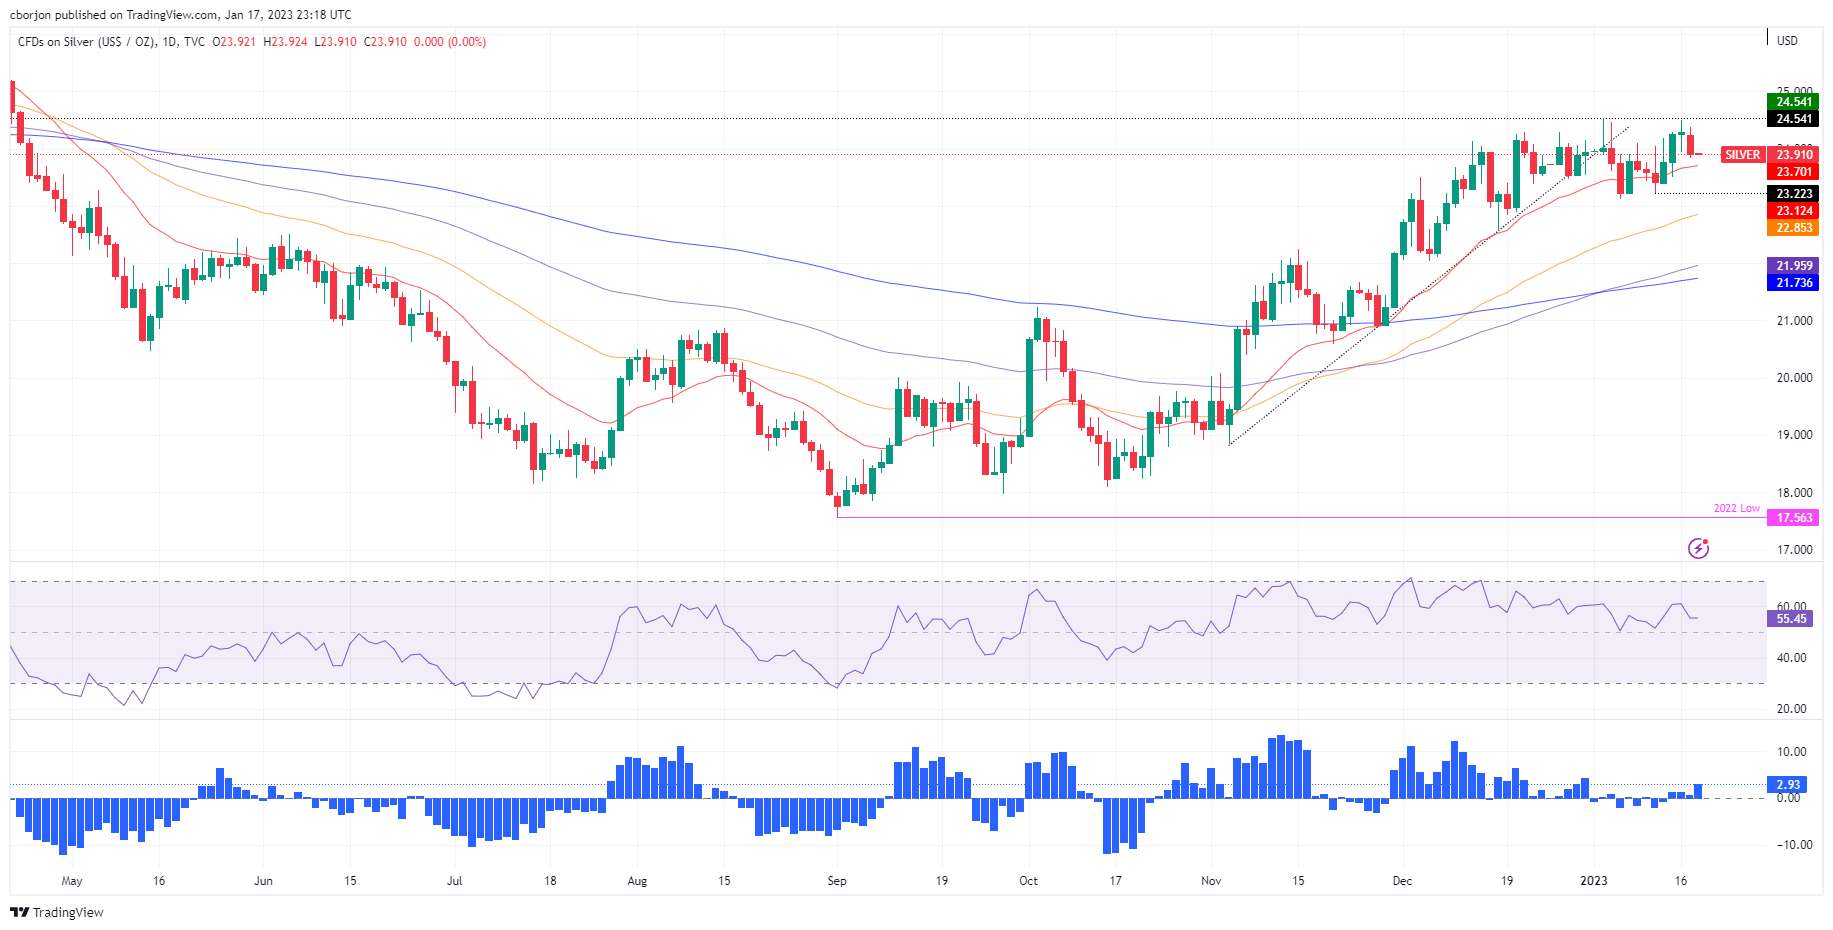
- Silver Prices plunged even though the US Dollar was on the defensive, and US T-bond yields dropped.
- Silver Price Analysis: The confluence of a double top and an evening star opens the door for further downside.
Silver spot prices, also known as XAG/USD, snapped three days of gains and plunged more than 1.50% on Tuesday, although the US Dollar (USD) remained offered, and US Treasury bond yields dropped. Hence, the XAG/USD is trading at $23.91 a troy ounce after reaching a daily high of $23.92.
Silver Price Analysis: XAG/USD Technical Outlook
After testing the YTD high of $24.54, the XAG/USD formed a double top, which could open the door for further losses. Also, an evening star emerged a three-candlestick chart pattern that could send Silver prices tumbling. With oscillators like the Relative Strength Index (RSI) registering lower peaks and aiming down, alongside the Rate of Change flashing that buyer’s momentum is fading, the XAG/USD downward bias remains intact.
Therefore, if XAG/USD slides below $23.83, silver would be poised to test the 20-day Exponential Moving Average (EMA) at $23.70. Once cleared, XAG/USD will prove January 11 daily low fo $23.22, ahead of $23.00.
Silver (XAG/USD) Key Technical Levels
- GBP/USD is looking to recapture Tuesday’s high around 1.2300 as focus shifts to UK Inflation.
- Higher Average Earnings due to the shortage of labor have accelerated hawkish Bank of England bets.
- Strength in the US Treasury yields has supported the USD Index and has triggered a risk-aversion theme.
The GBP/USD pair is marching higher to recapture the critical resistance of 1.2300 in the early Tokyo session. The Cable has resumed its upside journey after a corrective move to near 1.2247 and is expected to extend gains despite caution in the risk profile. The Pound Sterling has dodged the risk-aversion theme as the release of the higher wage growth has accelerated hawkish Bank of England (BoE) bets.
Average Earnings in the United Kingdom have climbed to 6.4% vs. the projection of 6.3%, which has triggered chances of continuation of an interest rate hike by the BoE. BoE Governor Andrew Bailey has already warned that rising wages due to labor shortage is offsetting the impact of the decline in energy prices.
S&P500 faced gradual selling pressure from the market participants amid volatility inspired by the stretched weekend. Also, further strengthening of the US Treasury yields weighed on investors’ risk appetite. The alpha generated by 10-year US Treasury yields climbed above 3.54%. This also provided a cushion to the US Dollar Index (DXY) and pushed it back toward the critical resistance of 102.00.
Meanwhile, commentary from Tom Barkin, the President, and CEO of the Federal Reserve (Fed) Bank of Richmond favoring the continuation of policy tightening as the inflation rate is well above the median Consumer Price Index (CPI) has also supported the risk-aversion theme.
For further guidance, investors will focus on the release of the United States Producer Price Index (PPI) data, which will release on Wednesday.
On the UK front, December’s inflation report will be keenly watched. Analysts at CitiBank expect headline CPI inflation to moderate further this week to 10.5% on an annual basis. Core CPI may prove somewhat more resilient at 6.2%.
As per the latest Reuters Tankan survey, published early Wednesday, “Business confidence at big Japanese firms slid in January with manufacturers showing a negative reading for the first time in two years.”
The Reuters Tankan index for big manufacturers stood at -6 in January, down from +8 last month. With this, the figures marked the first negative reading since January 2021.
“Morale was much stronger in the service sector, with that index at +20 in January, a drop from +25 in the prior month which was its highest level in more than three years,” per Reuters.
The monthly sentiment survey also asks manufacturers if they expect business conditions to improve or worsen over the coming three months. As a result, the big manufacturers' index saw a 12-point improvement to +6 for April, while for service sector firms the outlook fell 5 points to +15.
USD/JPY picks up bids
The news appears to tease USD/JPY buyers as the Yen pair rebounds from the intraday low to 128.30 by the press time.
Also read: USD/JPY Price Analysis: All eye son the BoJ, bulls need to commit at key H1 support area
- AUD/USD remains lackluster inside one-week-old bullish channel.
- Looming bull cross on the MACD, sustained trading beyond the key SMA, support line favor Aussie pair buyers.
- Clear break of 0.7050 becomes necessary for bull’s conviction.
AUD/USD bulls take a breather as markets await the key data/events scheduled for release on Wednesday. Even so, the Aussie pair remains inside a one-week-old bullish channel while flashing 0.6985 as the quote by the press time.
In addition to the ascending trend channel, the impending bullish cross on the MACD and the Aussie pair’s successful trading above the 100-bar Simple Moving Average (SMA), as well as a one-month-long ascending support line, keeps AUD/USD buyers hopeful.
However, the bullish bias gets rejected if the quote defies the channel formation by breaking the 0.6935 support, comprising the lower line of the bullish chart pattern.
Following that, the 100-SMA and the aforementioned support line, respectively near 0.6850 and 0.6775 in that order, will be in focus.
It’s worth noting that the AUD/USD weakness past 0.6775 appears a good sign for the bears targeting the previous monthly low surrounding 0.6630.
On the flip side, the 0.7000 psychological magnet and the current monthly peak near 0.7030 could challenge the AUD/USD buyers ahead of the stated channel’s top line, close to 0.7045.
Even if the quote rises past 0.7045, the early August 2022 peak surrounding 0.7050 could act as the last defense of the Aussie pair sellers before pushing the prices towards the 0.7136 mark, comprising the August monthly top.
AUD/USD: Four-hour chart
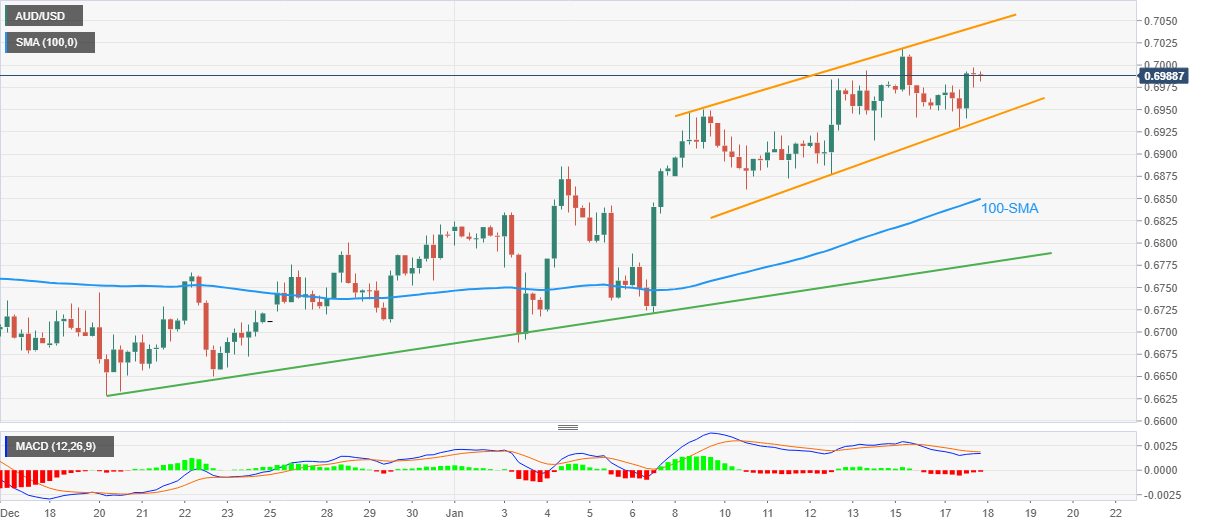
Trend: Bullish
- EUR/JPY rally stalled around 139.50 and collapsed on ECB’s dovish headlines.
- EUR/JPY Price Analysis: IF it clears 138.00, a fall toward 137.00 is on the cards.
The EUR/JPY reached a two-day high of around 139.61 but plunged due to a news headline crossing wires that stated that European Central Bank (ECB) policymakers could start to consider a slower pace of rate hikes. Therefore, the EUR/JPY plunged toward its daily low of 138.20 before stabilizing at current exchange rates. At the time of writing, the EUR/JPY is trading at 138.30, below its opening price by 0.53%.
EUR/JPY Price Analysis: Technical outlook
The EUR/JPY Tuesday’s pullback courtesy of headlines accelerated the downtrend ahead of the Bank of Japan (BoJ) monetary policy decision. Its daily high fell shy of testing the 200-day Exponential Moving Average (EMA) by 100 pips and plunged to print fresh weekly lows. In addition, oscillators remain in bearish territory, with the Relative Strength Index (RSI) aiming lower, while the Rate of Change (RoC), flashes bears are in control. Hence, the EUR/JPY might resume its downtrend in the near term.
Therefore, the EUR/JPY needs to clear the 138.00 figure, to prolong its downtrend further. Once cleared, the next stop would be the January 3 daily low of 137.38, followed by the 137.00 mark. As an alternate scenario, if the EUR/JPY reclaims 139.00, that would exacerbate a rally toward 140.00.
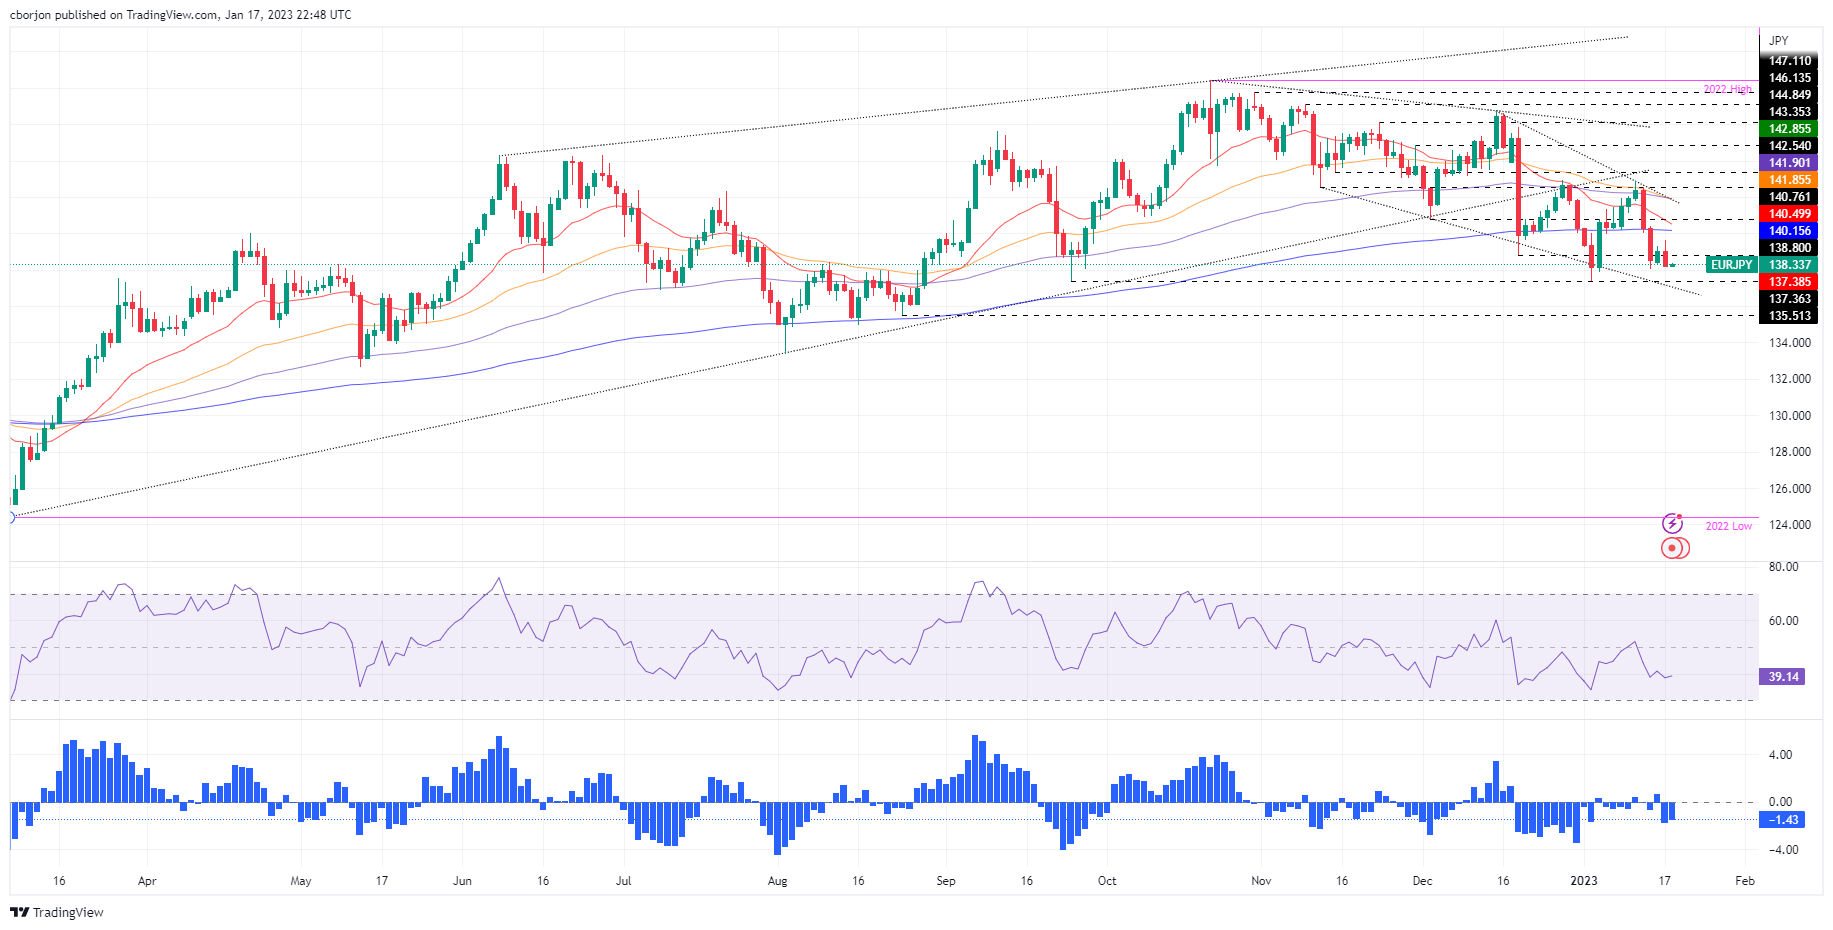
EUR/JPY Key Technical Levels
- EUR/USD has observed selling interest around 1.0800 as the risk-aversion theme is gaining traction.
- Fed Barkin is of the view that the inflation peak has been passed but halting policy tightening is not favorable.
- Investors' sentiment towards German prospects has uplifted as the risk of deeper recession has waived off
The EUR/USD pair has faced selling pressure while an attempt of a recovery above 1.0800 in the early Asian session. The major currency pair is expected to deliver a downside move if it fails to sustain above the immediate support of 1.0780 as investors have underpinned the risk-aversion theme amid the result season in the United States.
An end to the four-day winning spell by S&P500 futures on Tuesday conveyed that risk-perceived assets need more strength to extend the rally. Optimism on an overall basis still persists as correction in the 500-stock basket was very limited, which could be considered as a healthy correction for now. Meanwhile, solid return on US Treasury bonds supported the US Dollar Index (DXY) from any downside. The 10-year US Treasury yields climbed above 3.54% ahead of United States Producer Price Index (PPI) data.
The street is expecting a decline in the annual headline and core PPI (Dec) to 6.8% and 5.9% respectively. This might support the Federal Reserve (Fed) to cool down the pace of policy tightening further.
Tom Barkin, the President, and CEO of the Fed Bank of Richmond cited that the economy has passed the peak of inflation but we are still far from the median Consumer Price Index (CPI). Therefore, backing off from interest rate hiking too soon is not favorable.
On the Eurozone front, the German ZEW Survey- Economic Sentiment was released at 16.9 vs. the expectation of -15.5 and the former release of -23.3. Investors' sentiment towards the economic prospects of Germany has been strengthened as the risk of deeper recession has been waived off.
Germany’s Economy Minister Robert Habeck, in an interview with WELT TV, said that “if there is a recession, it would possibly be only very short and not very deep.”
Moreover, European Central Bank (ECB) board member and Bank of Portugal Governor Mario Centeno said on Tuesday, “Fourth quarter growth in Europe will be most likely still positive.”
- Gold price fades the week-start pullback from multi-month high but fails to recover.
- Softer data from United States failed to recall XAU/USD buyers as US Dollar benefits from firmer yields, downbeat Euro.
- US Retail Sales will be the key data, risk catalysts are important too.
Gold price (XAU/USD) remains lackluster as buyers struggle to defend the $1,900 threshold after declining during the first two days of the week. The yellow metal’s defensive performance could be linked to the recent increase in the United States Treasury bond yields and US Dollar despite softer US data. The reason could be linked to the downbeat Euro (EUR), as well as the cautious mood ahead of the key data, not to forget China’s inability to impress XAU/USD bulls despite firmer statistics.
United States Treasury bond yields, US Dollar tease Gold sellers
After a drop to refresh the monthly low on Friday, the United States Treasury bond yields bottomed out in the last three days and underpinned the US Dollar’s gradual rebound from the lowest levels since early June. That said, the benchmark 10-year US Treasury bond yields ended the day with nearly four basis points (bps) of an upside to 3.55% even as the two-year counterpart retreated to 4.20%.
Softer US data restricts XAU/USD downside
While the US Treasury bond yields allowed the US Dollar to remain firmer, downbeat prints of the New York manufacturing data, namely the Empire State Manufacturing Index for December, probed the US Dollar bulls and put a floor under the Gold price. That said, the NY Fed’s business gauge dropped sharply in January to -32.9 versus -4.5 market forecasts and -11.2 prior readings.
The data also helped the Federal Reserve Bank of Richmond’s President and CEO Thomas Barkin to state, “My hope is that we have passed the peak of inflation.” As a result, the US Dollar bulls had a tough ride and so do the Gold bears.
Downbeat Euro defends US Dollar, Gold bears
With the swirling talks of the European Central Bank’s (ECB) slower rate hike starting after February, the bloc’s currency Euro (EUR) had to trim some of the latest gains, which in turn allowed the US Dollar to remain firmer and weigh on the Gold price.
The dovish concerns surrounding the ECB’s next move could be linked to Bloomberg’s news saying, “ECB policymakers are starting to consider a slower pace of interest-rate hikes after a likely 50 basis-point step in February.”
In doing so, the EUR couldn’t cheer upbeat sentiment data from the Zentrum für Europäische Wirtschaftsforschung (ZEW) for Germany and Eurozone. That said, German ZEW headline numbers showed that the Economic Sentiment Index returned to positive territory, arriving at 16.9 in January from -23.3 in December, beating the market expectation of -15.5. On the other hand, the ZEW Economic Sentiment Index for the Eurozone rose to 16.7 from -23.6.
China fails to impress Gold buyers despite upbeat data
China’s inability to impress markets despite posting upbeat data gains the major attention of the Gold sellers. On Tuesday, China’s National Bureau of Statistics (NBS) released the fourth quarter (Q4) Gross Domestic Product (GDP), as well as Industrial Production and Retail Sales figures for December. However, downbeat comments from NBS joined the market’s doubts about the actual numbers seemed to have weighed on the risk profile.
China's Q4 GDP rose 2.9% YoY versus the 1.8% expected and 3.9% prior. Further details suggest that the Industrial Production for December grew 1.3% YoY versus 0.5% market forecasts and 2.2% prior readings. Additionally, Retail Sales improved to -1.8% YoY for December compared to -7.8% consensus and -5.9% prior. Even so, the NBS said that the foundation for economic recovery is not solid yet.
Given China’s condition as one of the world’s biggest Gold consumers, the pessimism surrounding Beijing could easily weigh on the XAU/USD prices.
United States Retail Sales, Producer Price Index eyed
Having witnessed mixed signals from the recently mixed consumer-centric data from the United States, coupled with the Federal Reserve (Fed) policymakers’ inability to defend the hawkish bias, today’s US Retail Sales and the Producer Price Index (PPI) for December will be crucial for the Gold traders.
Forecasts suggest that the headlines US Retail Sales may improve with 0.1% monthly gains, versus the previous contraction of 0.6%, and can favor the XAU/USD bears. However, the anticipated softening in the PPI, to -0.1% from 0.3% prior, could help recall the Gold buyers amid easing inflation fears.
Gold price technical analysis
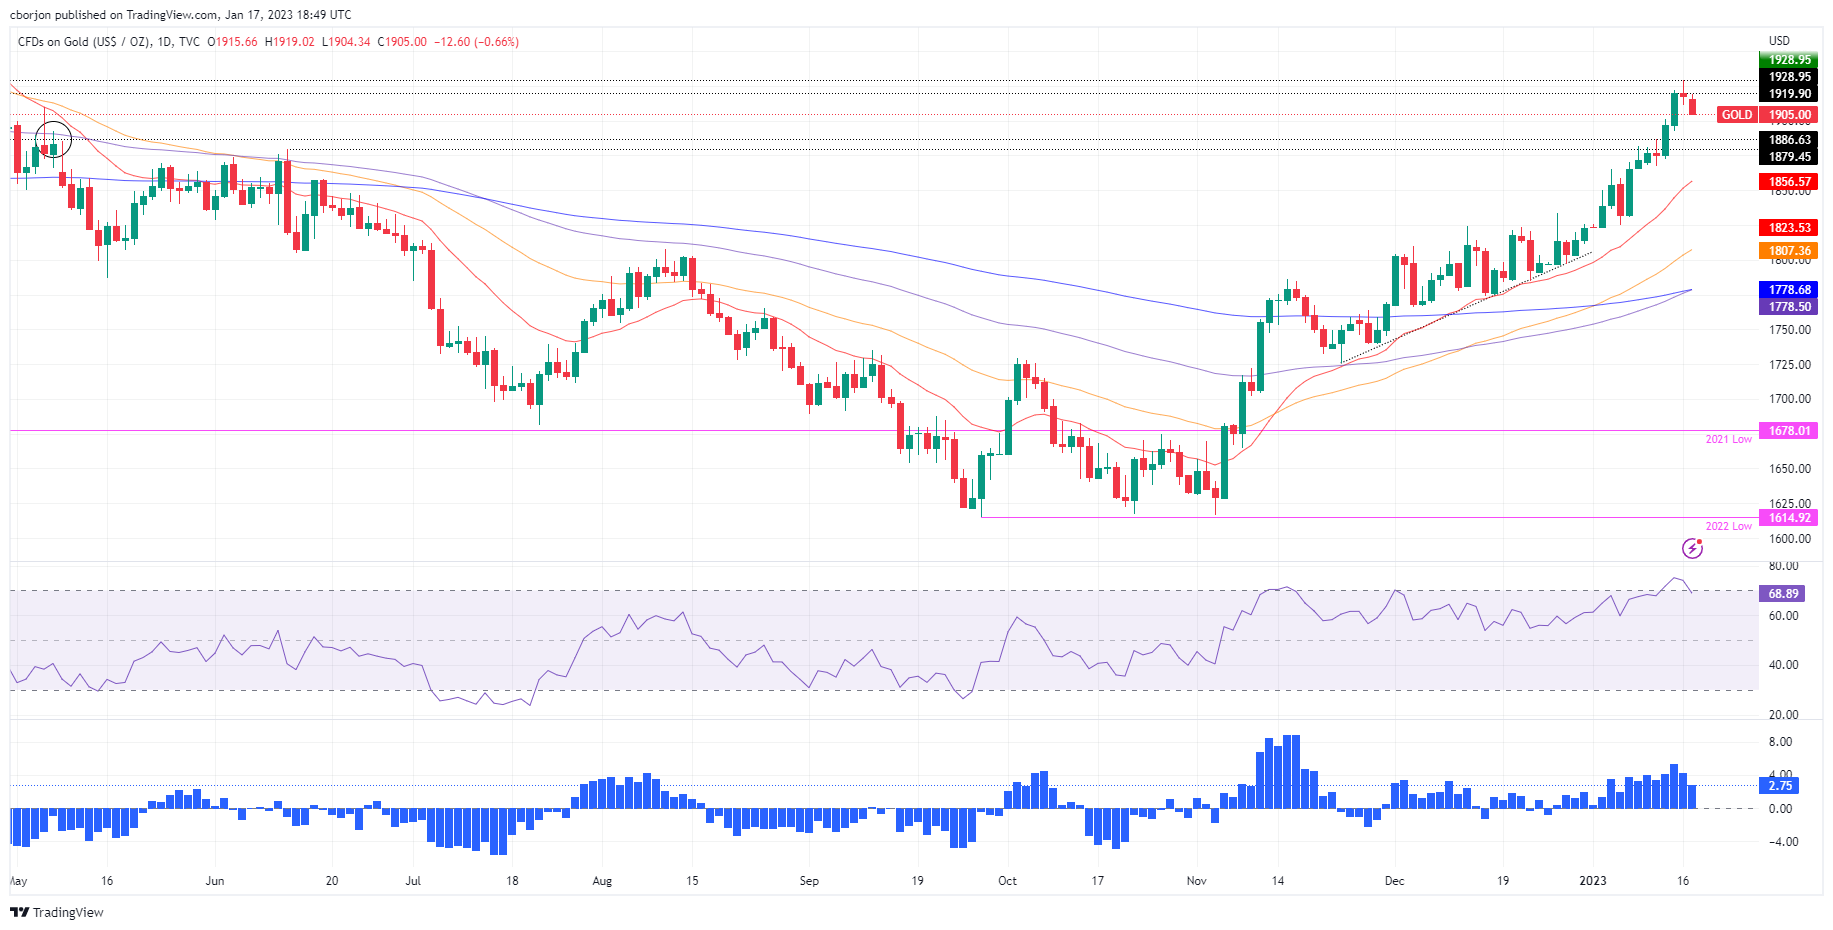
Gold price grinds lower inside a three-day-old bearish channel amid sluggish signals from the Moving Average Convergence and Divergence (MACD) indicator, as well as the steady Relative Strength Index (RSI) line, placed at 14.
Given the 50-Hour Moving Average (HMA) adding strength to the immediate upside hurdle surrounding $1,915, the sluggish MACD and RSI positions hint at the further weakening of the XAU/USD.
However, the stated channel’s lower line, close to the $1,900 threshold, limits the short-term downside of the bullion, a break of which could drag the quote towards the 200-HMA level surrounding $1,883.
Meanwhile, an upside clearance of the $1,915 resistance confluence won’t hesitate to challenge the multi-month high marked on Monday at around $1,930.
Following that, tops marked during late March 2022 near $1,966 and April 2022 peak of $1,998 could probe the Gold buyers before offering them the $2,000 psychological magnet.
Gold price: Hourly chart
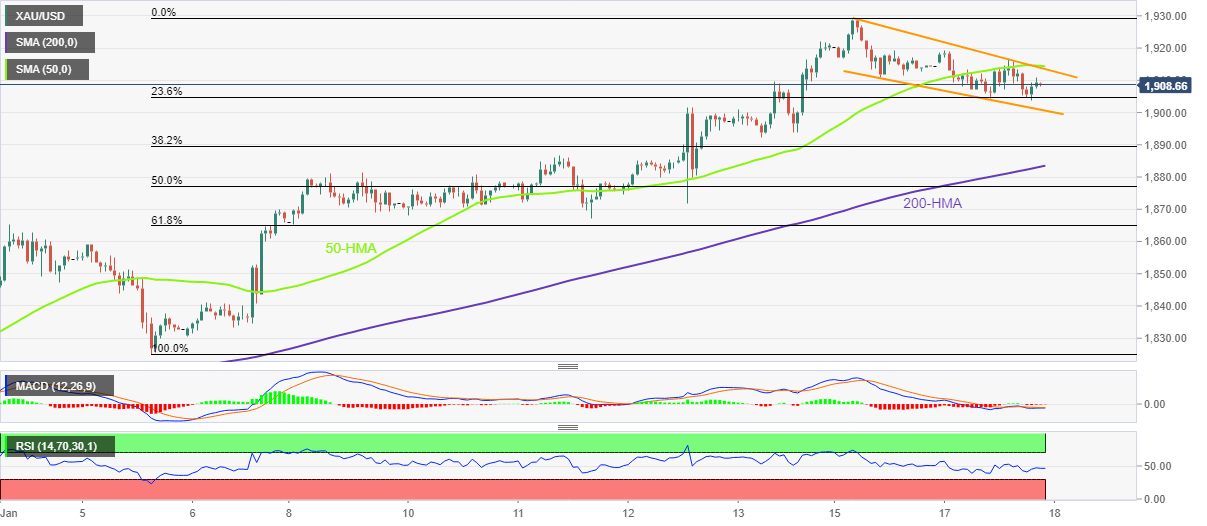
Trend: Further weakness expected
- USD/CAD has picked strength after testing the critical support at 1.3370.
- The end of the four-day winning spell by the S&P500 is portraying caution in the risk impulse.
- Lower-than-anticipated Canada’s December CPI report has delighted the BoC.
The USD/CAD pair has delivered a recovery move after gauging strength near the critical support of 1.3370 in the late New York session. The Loonie asset has sensed demand as investors are getting anxious ahead of the release of the United States Producer Price Index (PPI) data, which is scheduled for Wednesday.
Caution has been observed in the risk profile as S&P500 ended its four-day winning streak on Tuesday after a four-day winning spell. Mixed performance from companies amid the result season has impacted the 500-stock basket, portraying a decline in investors’ risk appetite. The US Dollar Index (DXY) delivered a V-shape recovery after dropping to near 101.60 and has now continued to trade lackluster around 102.00. The recovery in the USD Index was supported by strength in the US Treasury yields. The 10-year US Treasury yields scaled above 3.54%.
Investors are keenly focusing on the release of the US PPI numbers for fresh impetus. As per the consensus, the economic data is expected to decline further. The headline PPI (Dec) is seen lower at 6.8% while the core PPI is seen declining to 5.9%. Producers might look to trim their losses inspired by lower prices through easing wage growth or by lay-offs, which would trim inflation projections further.
On the Loonie front, the weak December Consumer Price Index (CPI) report has delighted the Bank of Canada (BoC). The annual headline CPI (Dec) remained in line with the expectations at 6.3% lower than the former release of 6.8%. While the core inflation that excludes oil and food prices dropped vigorously to 5.4%, however, the street was expecting an increase to 6.1% against the prior release of 5.8%.
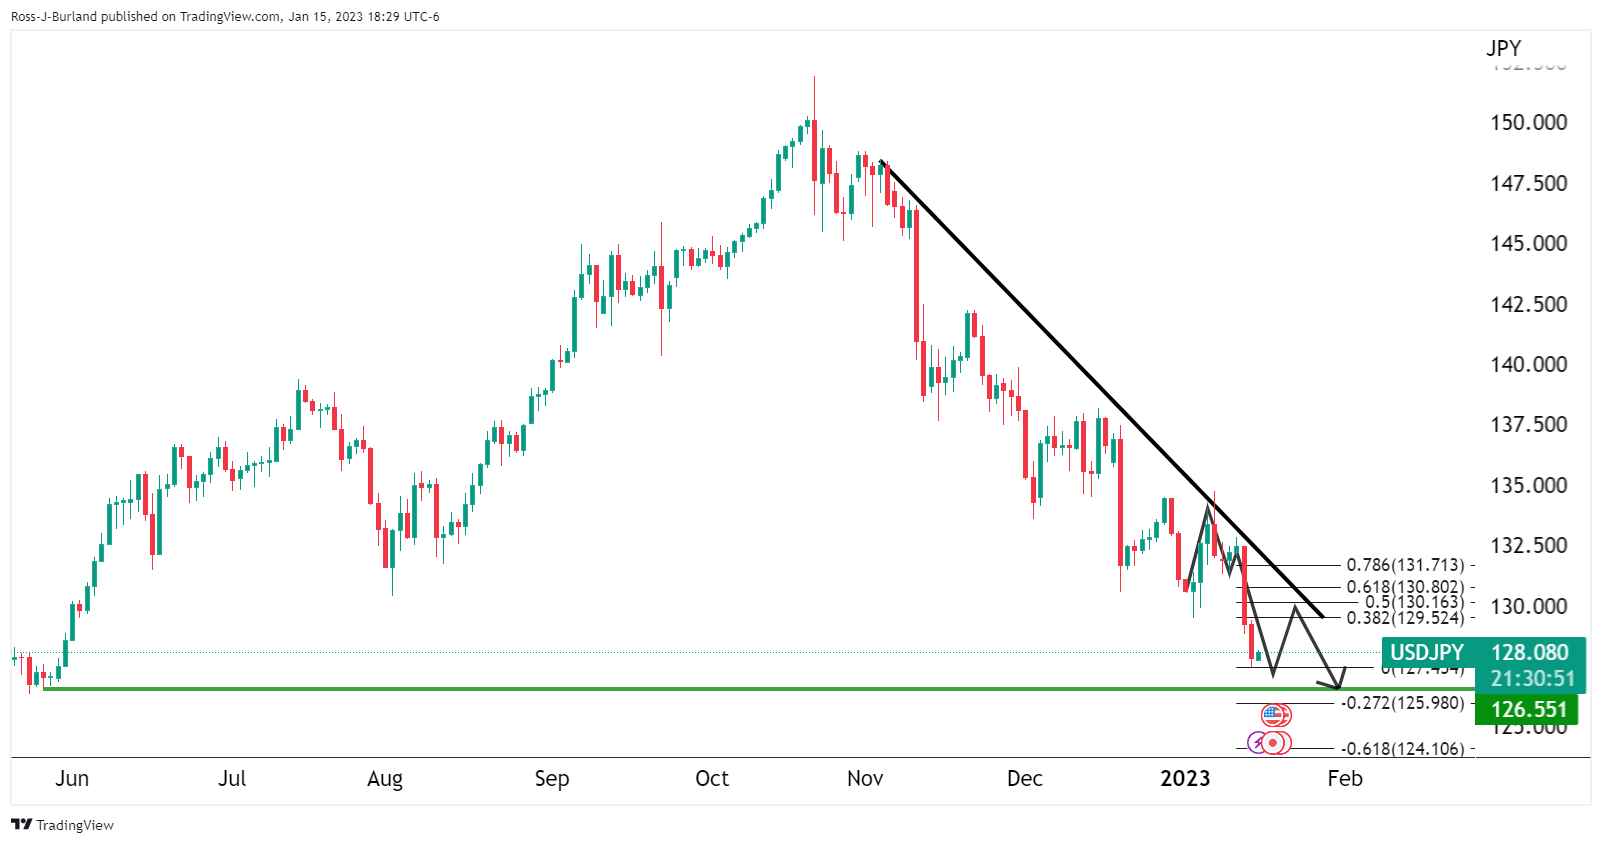
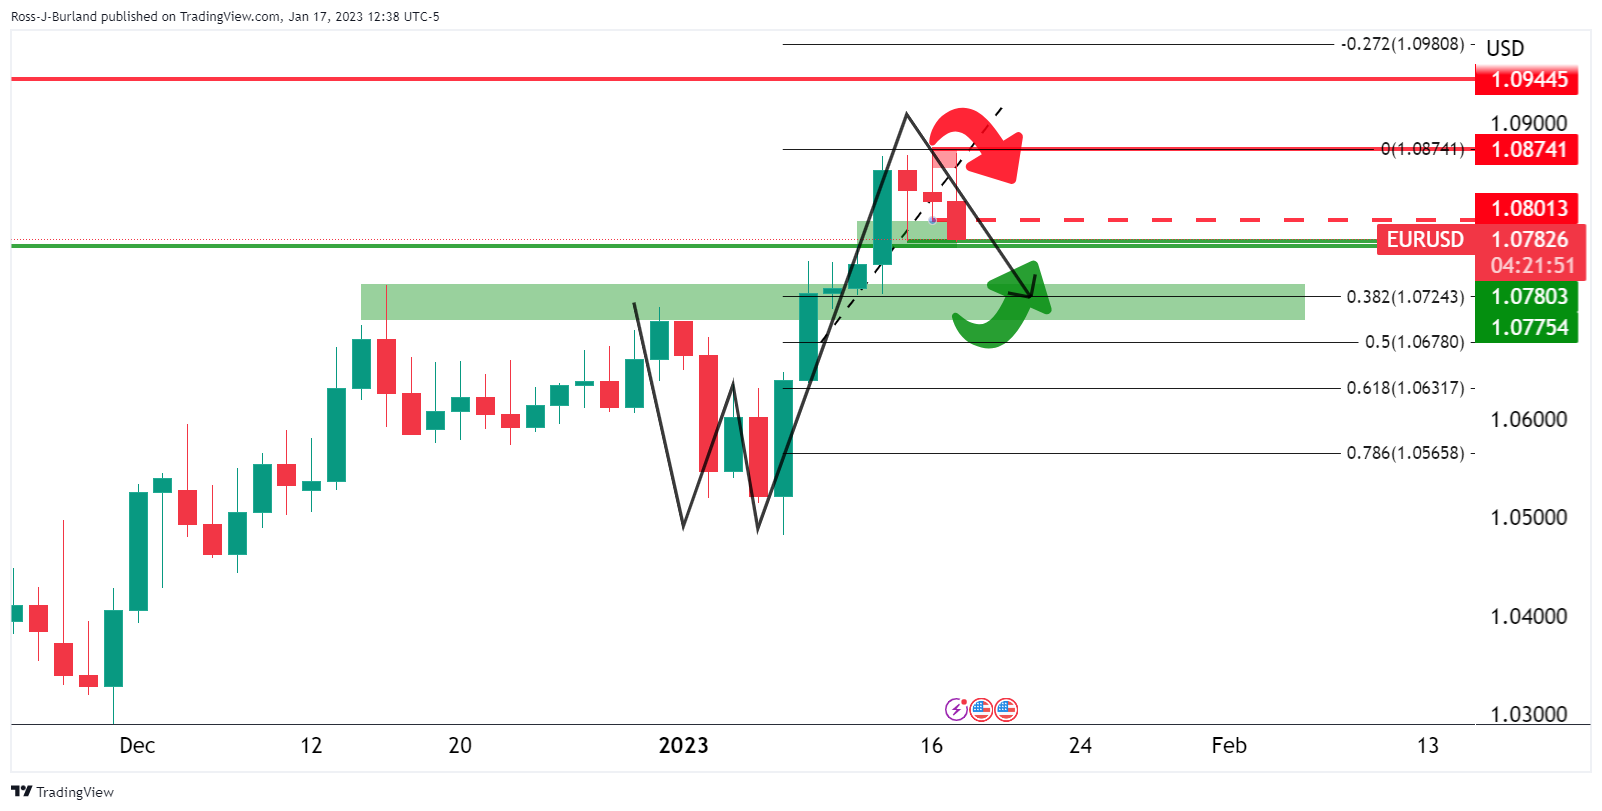
- All eyes are on the BoJ today as the price aligns with key technical structures.
- USD/JPY M-formation playing out and a downside impulse in play that targets the key support structures meeting the -272% and -61.8% Fibonacci brackets.
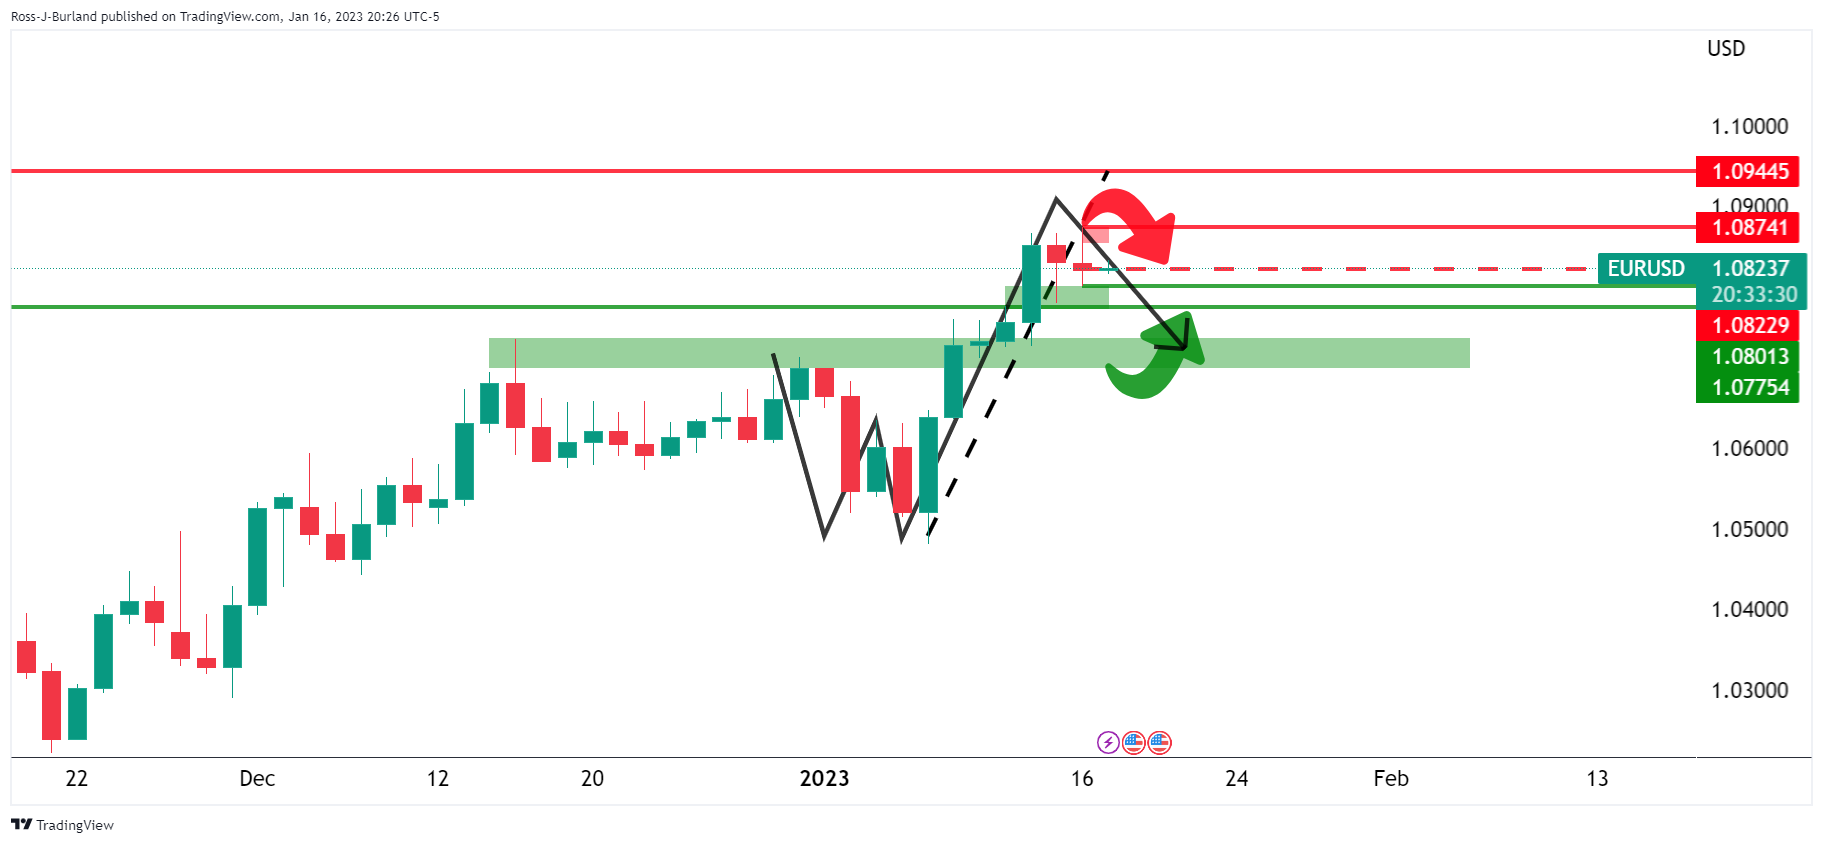
USD/JPY is teed up for the Bank of Japan meeting later today and is correcting on the charts towards a critical area that the following will illustrate. In the prior analysis, there were prospects of a reversion into the M-formation\s bearish impulse on the prior leg:
USD/JPY prior analysis
USD/JPY H1 chart
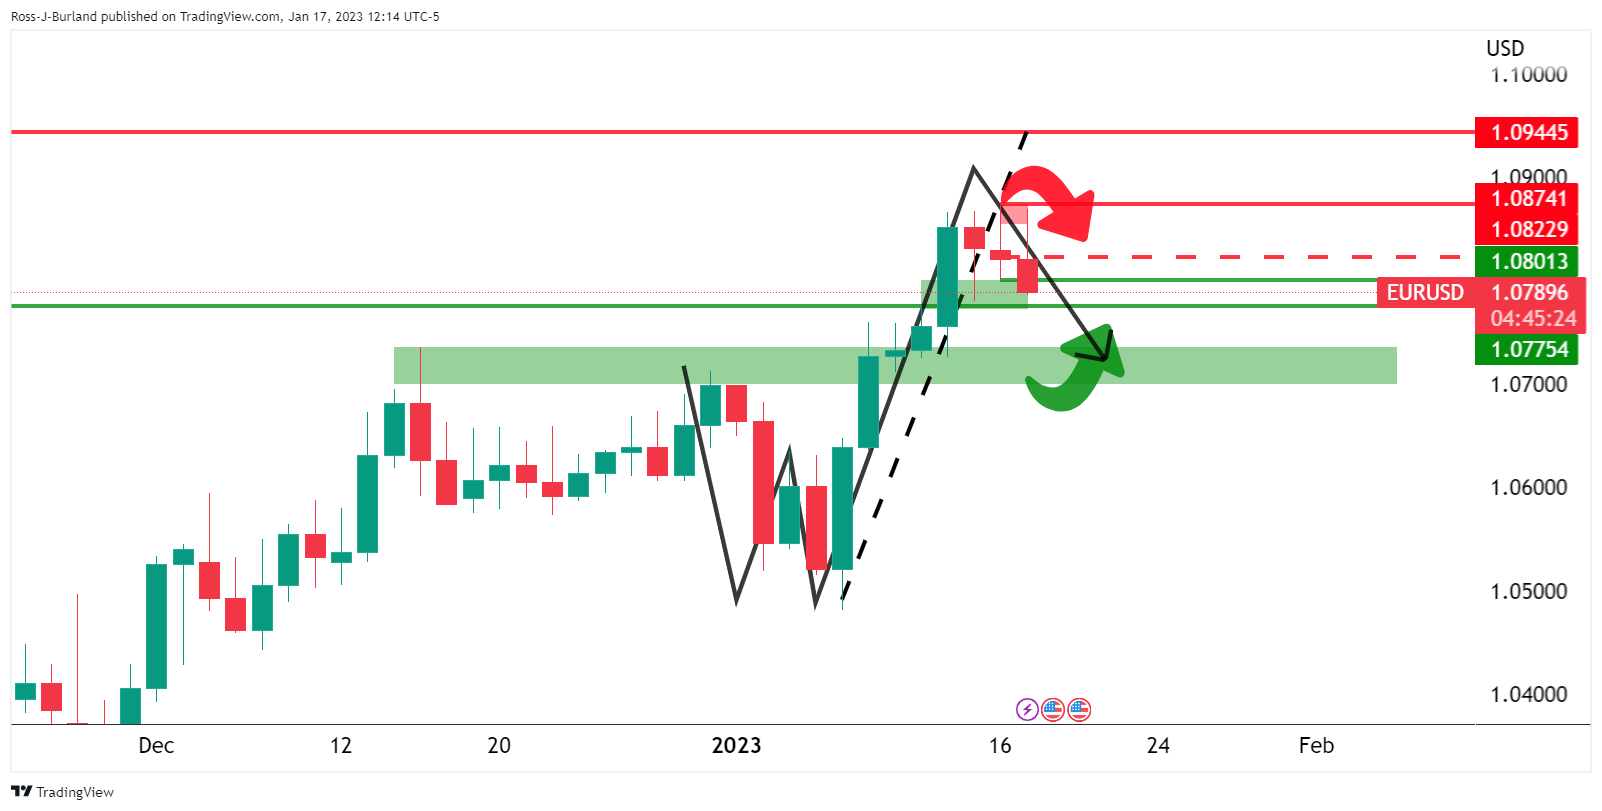
We are seeing this correction get underway and bulls will now be looking for a bullish structure to lean against in aiming for a reversion of sorts as follows:

As illustrated, the price was on the backside of the trend and a breakout to the upside had been gathering momentum after a test of the structure around 128.80. The 38.2% Fibonacci was a first target near 129.50 with 131.20's eyed thereafter.
USD/JPY update
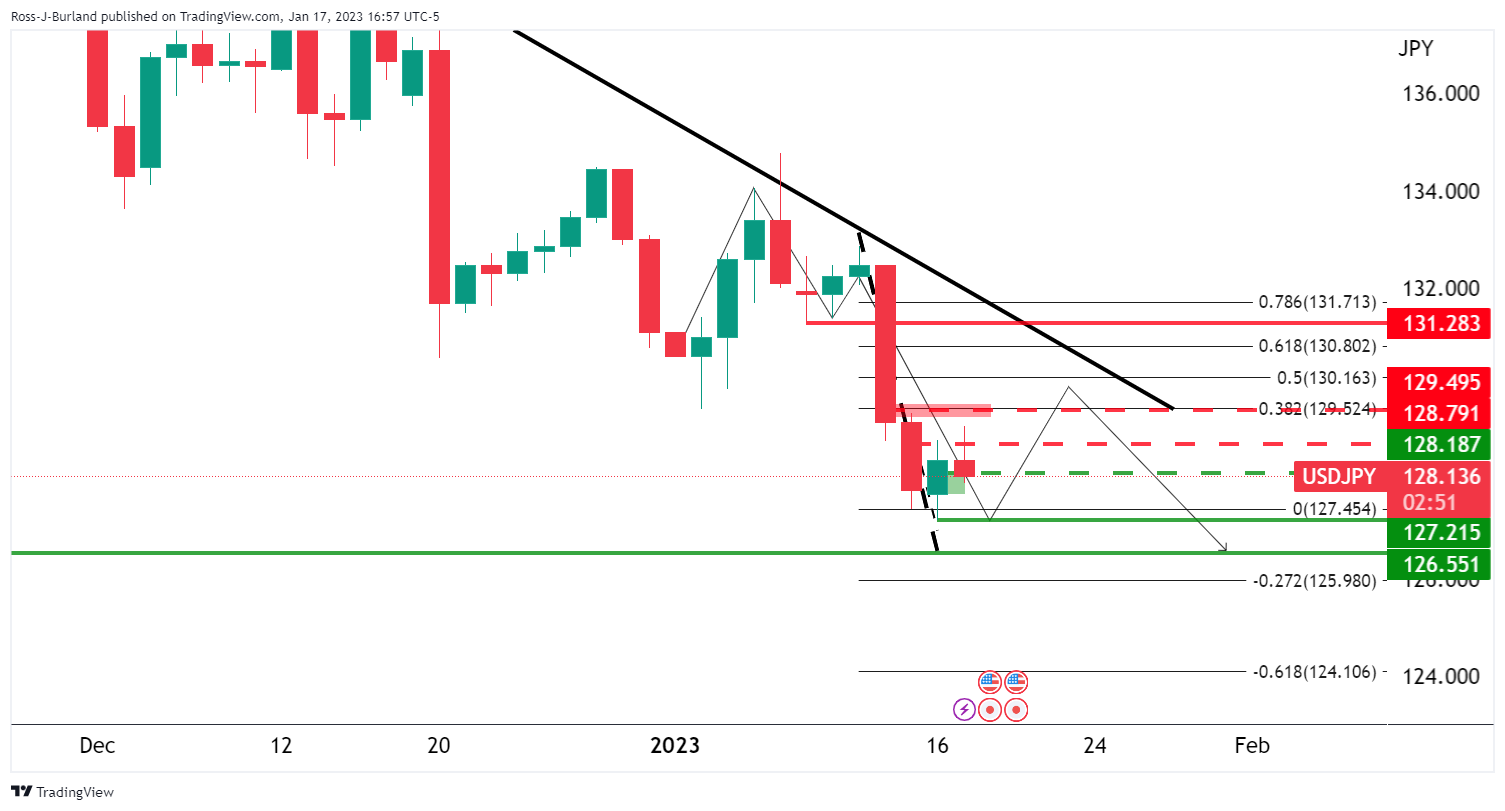
The bulls have fallen shy of the 38.2% Fibonacci so far and are headed for a bearish close on the day. However, while above 127.50/88, the bulls remain in playing what could be a phase of accumulation as per the hourly chart:

The following shows the price adhering to a textbook schematic with the M-formation playing out and a downside impulse in play that targets the key support structures meeting the -272% and -61.8% Fibonacci brackets.
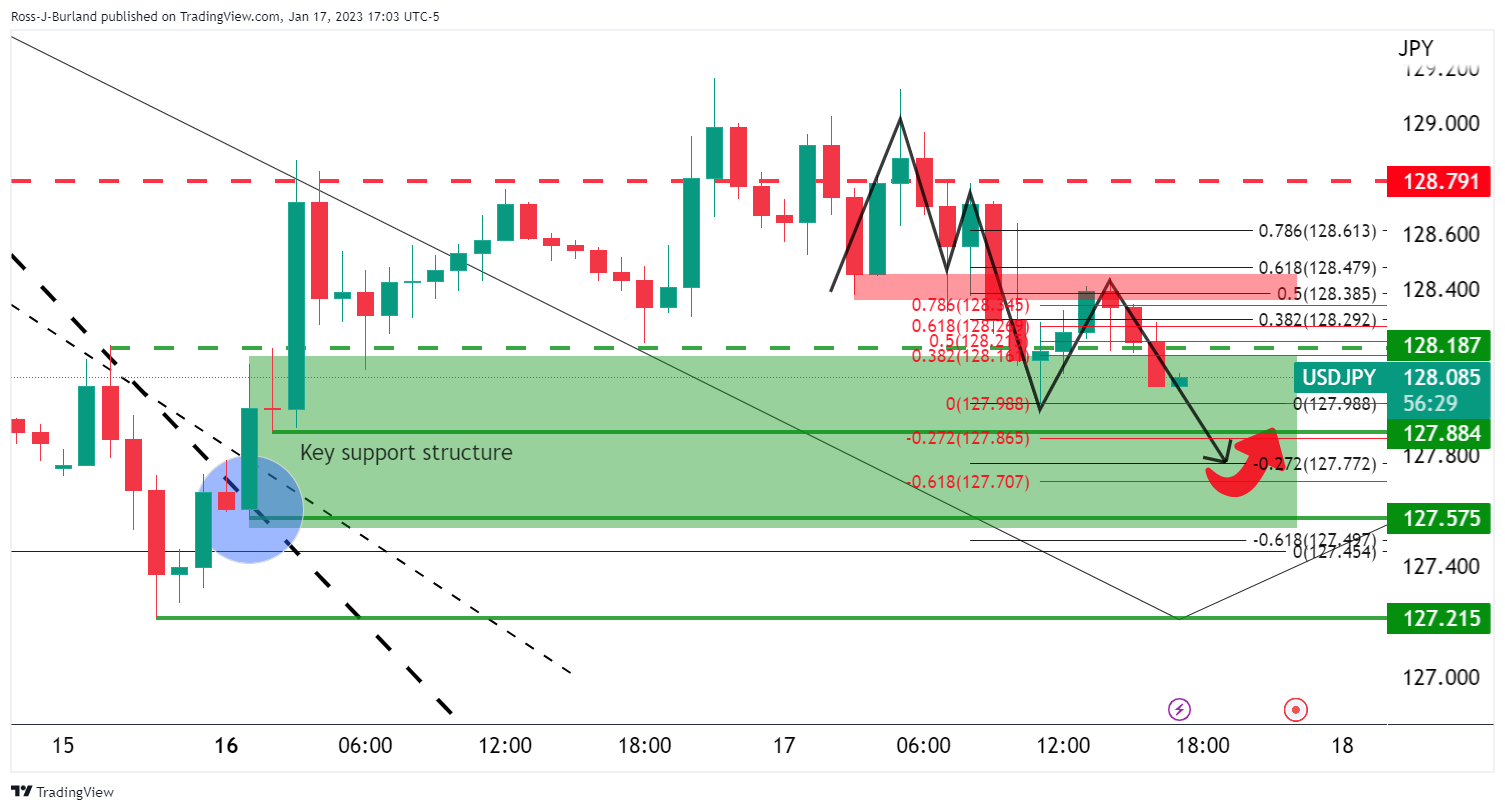
The support could prove critical in and around the BoJ event guarding 127.20.
A break below here opens the risk of a significant downside extension:

- Upbeat China’s data and the removal of strict Covid-19 measures to boost oil demand.
- A softer US Dollar was a tailwind for WTI.
- WTI Price Analysis: It could aim towards the 100-DMA around $83.00.
US Western Texas Intermediate (WTI) crude oil gains some ground and hits a two-week high above $80.00 per barrel on Tuesday after Chinese data beat estimates and painted an optimistic outlook amidst its borders reopening. Therefore, WTI is trading at $81.11 PB, up by more than 2.50%.
Chinese data revealed during the Asian session improved oil’s outlook for 2023. The National Bureau of Statistics showed that Gross Domestic Product (GDP) for Q4 improved to 2.9%, above estimates of 1.6%, while for the full year, GDP stood at 3% and trailed 2021 at 8.1%. Even though 2022 is the second worst reading since 1970, China’s relaxation of Covid-19 measures would positively impact its domestic economy.
In the meantime, a softer US Dollar makes greenback-denominated oil cheaper for other currency holders.
Elsewhere, the Organization of the Petroleum Exporting Countries (OPEC) said in a monthly report that Chinese oil demand would grow 510,000 barrels per day this year while it kept its 2023 global demand growth forecast unchanged at 2.22 million BPD.
WTI Technical Analysis
After bottoming around 2022 lows of $70.10 PB during December, WTI resumed an uptrend of almost one month that peaked at around $81.44. Last Friday, WTI broke a two-month-old downslope trendline on the upside, which kept WTI prices from falling below $78.00. Additionally, the Relative Strength Index (RSI) aimed higher, while the Rate of Change (RoC) suggests buyers are gathering momentum.
Therefore, WTI’s first resistance level would be $81.00, which, once cleared, would expose $82.00, followed by the 100-day EMA at $82.95.
Tom Barkin, the president and CEO of the Federal Reserve Bank of Richmond, is crossing the wires.
Key comments
My hope is that we have passed the peak of inflation.
The median CPI is still too high for what I want to see.
Cannot declare victory over inflation too soon.
Doesn’t favour backing off too soon, says he wants to see inflation ‘compellingly headed back to target’.
Terminal rate dependent on path of inflation.
US Dollar update
The US Dollar was losing traction on Tuesday with eyes on the Bank of Japan as investors expect the possible policy shift at the central bank that could end its so-called "yield curve control" in what would be a precursor to adopting a tighter monetary policy. At the time of writing, the DXY index is trading at 102.40 and is lower by some 0.15% but well off the lows of the day down at 101.937.
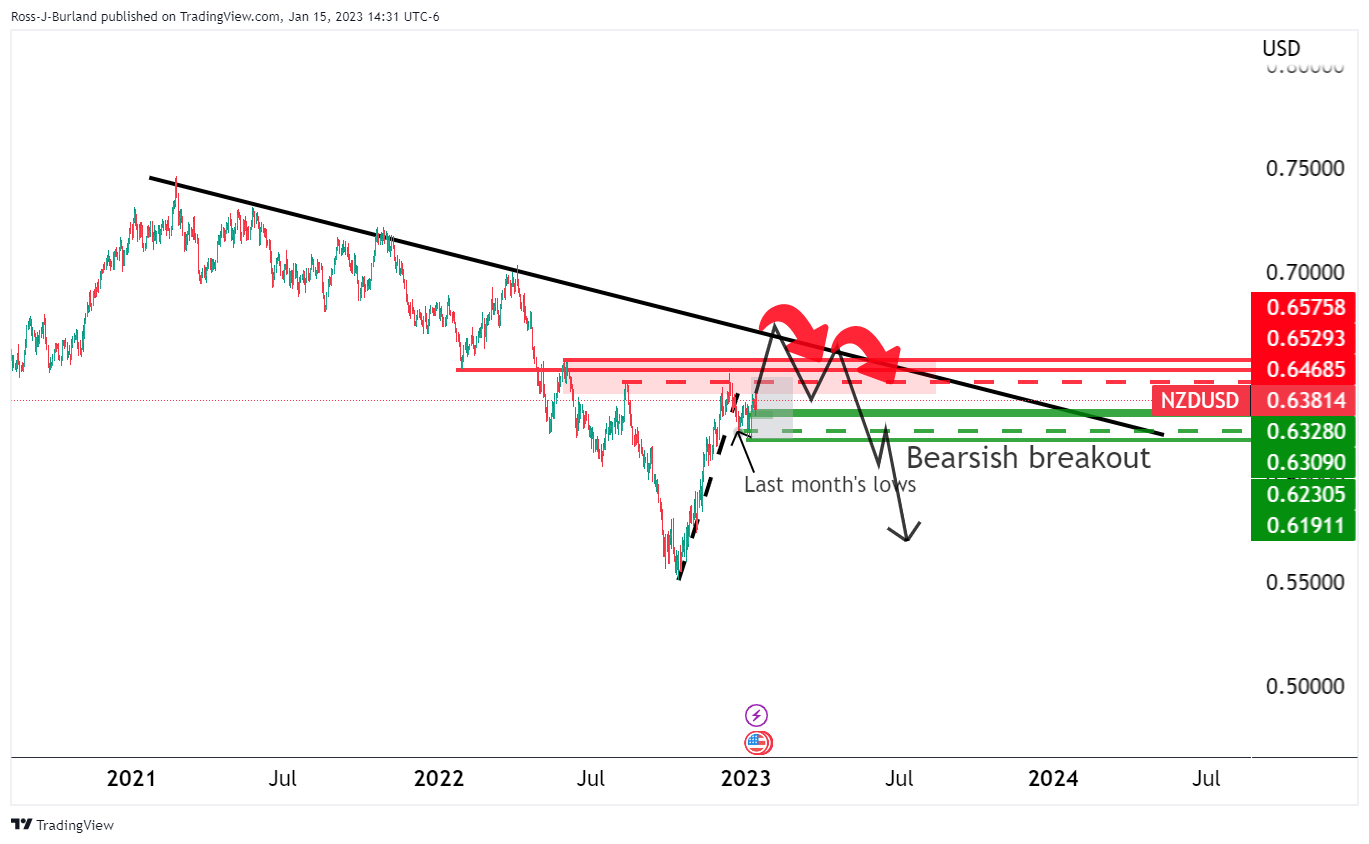
- NZD/USD bulls stay the course and target 0.6450s and then 0.6480s.
- The NZ CPI will be key next week.
NZD/USD is creeping higher towards an aforementioned target in prior analysis from earlier in the week, hovering in 1-month highs. At the time of writing, the bird is flying high by some 0.8% having rallied from a low of 0.6366 and extending the gains since breaking back above last month's lows of 0.6230 and trapping breakout bears, squeezing towards the 0.6470s ahead of critical data next week.
''Although difficult to pinpoint exactly why, the rally was NZ-specific, with strength seen across most crosses,'' analysts at ANZ Bank explained. ''One wonders whether worrying signs of sticky inflation in yesterday’s NZIER QSBO survey gave the Kiwi a boost (even though NZ short-end rates fell yesterday, preferring instead to focus on the collapse in confidence),'' the analysts added further. ''Either way, it’s all a bit messy, but high rates without the growth to boot is hardly a strong sign of confidence for NZ.Inc,'' the analysts at ANZ Bank concluded.
Meanwhile, NZ Consumer Price Index next week will be critical and could be pivotal, leading to a breakout one way or another as the pair heads into a potential stop gar before the data. With regards to the Reserve Bank of New Zealand, ''local markets have swung back to pricing broadly even odds of either a 50bp or 75bp Reserve Bank of New Zealand hike next month; that leaves near-term risks more balanced,'' the analysts at ANZ Bank argued.
NZD/USD technical analysis
In prior analysis, it was shown that while being on the backside of the daily bullish impulse and trend, there were still prospects of a move into the trendline resistance, acing as the final push before a major bearish breakout:
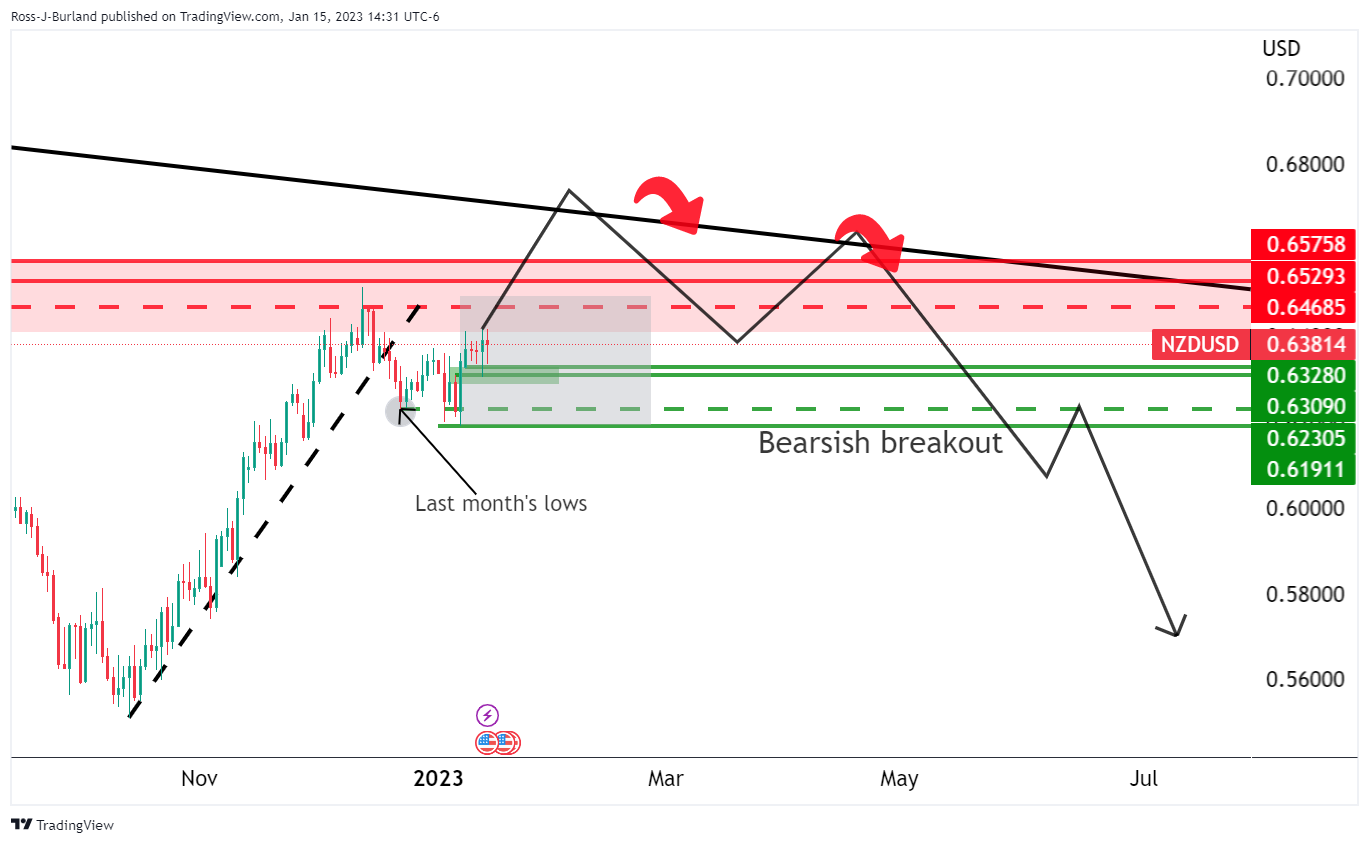
Zoomed in further...
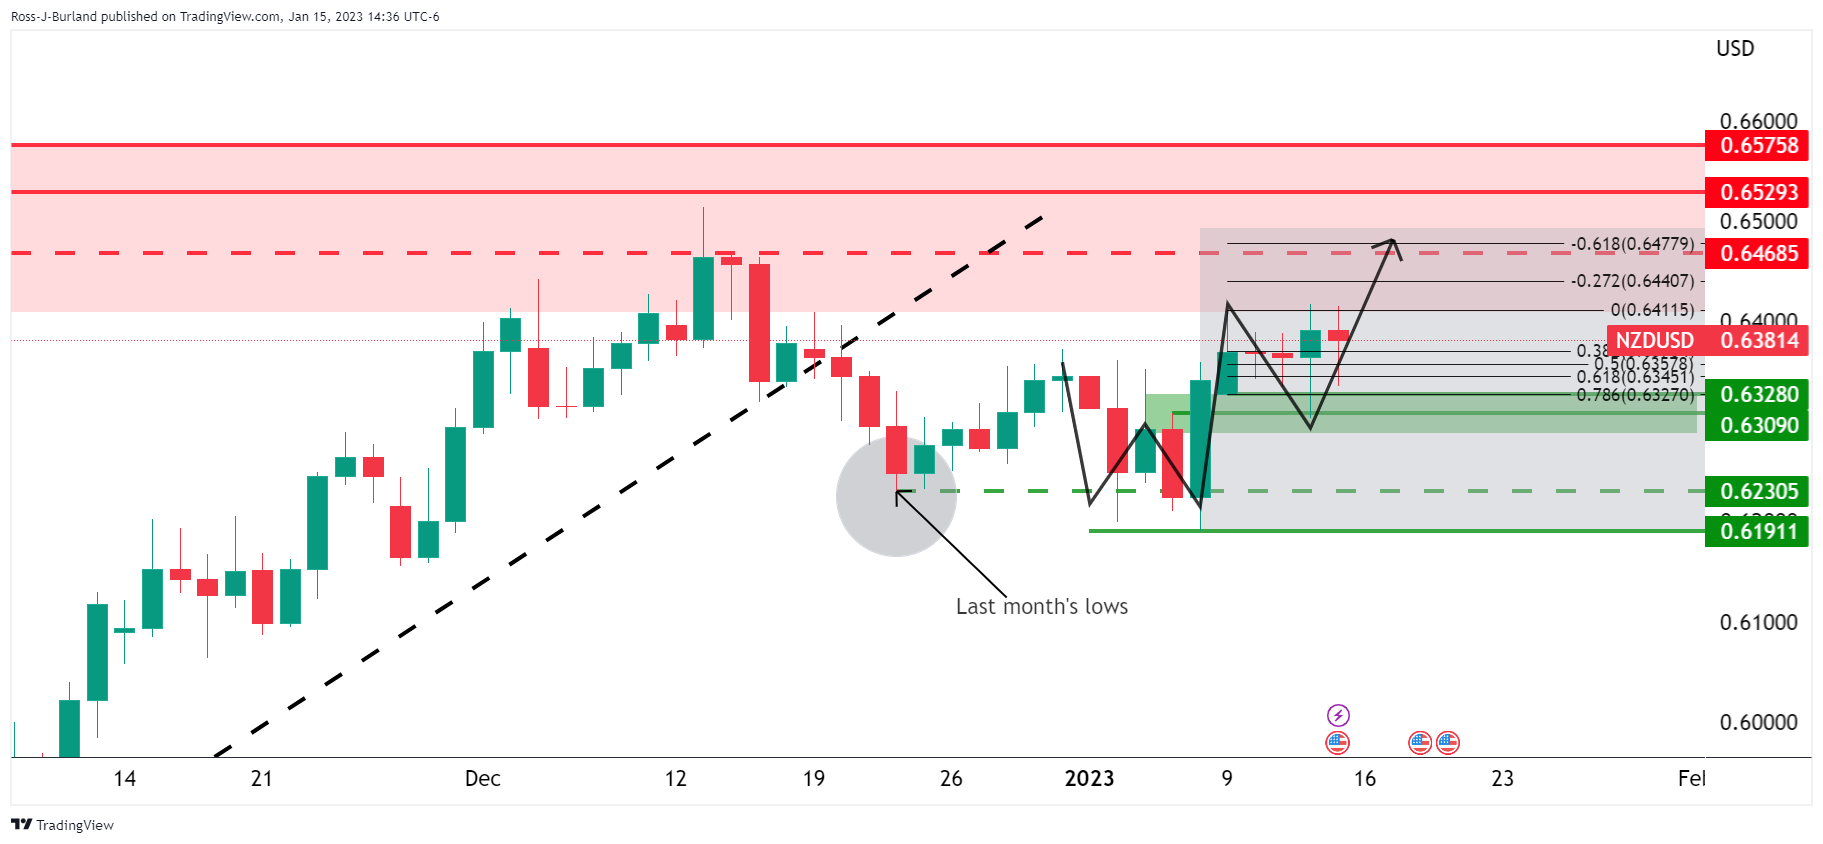
The W-formation was highlighted as a bullish bottoming pattern and the fact that the price broke the monthly lows, we had breakout traders trapped.
The upside towards 0.6480 was a probable scenario for this week to meet prior highs and a -61.8% ratio. The price remains on track for this target area:

Reuters reported that Federal Reserve Bank of New York leader John Williams said on Tuesday that the economy does better when everyone gets a shot at participating.
"An inclusive economy doesn't just help those that are in need of more or different opportunities, rather, it boosts the economy more broadly," Williams said in opening remarks for a conference at his bank.
Williams did not comment on the monetary policy outlook in his brief remarks.
US Dollar update
The US Dollar has been on the back foot on Tuesday in choppy trading. It is all about the Bank of Japan this week as investors expect the possible policy shift at the central bank that could end its so-called "yield curve control" in what would be a precursor to adopting a tighter monetary policy.
At the time of writing, the DXY index is trading at 102.38 and is lower by some 0.17% but well off the lows of the day down at 101.937.
What you need to take care of on Wednesday, January 18:
The US Dollar retained its intrinsic weakness on Tuesday, ending the day with losses against all of its major rivals. The Euro was the worst performer, while the British Pound was the best against the Greenback.
On the one hand, the EUR/USD pair fell to 1.0771 amid market talks suggesting European Central Bank (ECB) officials are considering slowing the pace of tightening. Rumors suggest President Christine Lagarde & co will opt for a 50 basis points (bps) rate hike in February, reducing hikes to 25 bps starting in March.
On the other hand, GBP/USD flirted with 1.2300 after the United Kingdom’s employment-related figures hinted at a relatively tight labour market. The Bank of England would then have room to push the benchmark rate higher and maintain it there for longer. The UK will publish December inflation figures on Wednesday.
The Canadian Consumer Price Index (CPI), rose at an annual pace of 6.3% in December, while the monthly CPI fell by 0.6%. USD/CAD trades around 1.3376.
The AUD/USD pair finished Tuesday near the 0.7000 level, retaining its positive momentum despite the poor tone of global equities.
The USD/JPY pair trades around 128.40 ahead of the Bank of Japan monetary policy decision.
Spot gold trades little changed at around $1,907, while crude oil prices were up, with WTI hovering around $81 per barrel.
Wednesday will bring an update on EU inflation, the US Producer Price Index and the UK CPI.
Like this article? Help us with some feedback by answering this survey:
- United Kingdom's Unemployment Rate data gave rise to a rally in the British Pound with Bank of England in focus.
- GBP/USD is in the hands of the bulls on the front side of an hourly trendline ahead of key Consumer Price Index inflation data Wednesday.
- GBP/USD bears eye a break of the solid trendline support and 1.2170 structure that could then result in a cascade of stops being triggered.
GBP/USD is higher by 0.6% at the time of writing, 14.00hrs New york time. The British Pound moved from a low of 1.2168 to a high of 1.2300 on Tuesday after Britain's Unemployment Rate data showed a tight labour market and accelerating pay growth. The Bank of England, BoE, is in focus in this regard as it battles with inflation at multi-decade highs.
Britain's Unemployment Rate held at 3.7%, close to its lowest level in almost 50 years. This was in line with the consensus and signalled a continued tight labour market. Pay excluding bonuses increased by an annual 6.4% in the September-to-November period, the Office for National Statistics (ONS) said. This was the largest increase since records began in 2001. For ex-bonus wage growth, this is the strongest number outside the COVID distortions. ''Overall, today's strong data should see lower odds of a 25bps hike from the Bank of England, BoE, at its February meeting, and further support our call for a 50bps hike instead,'' analysts at TD Securities said.
UK Consumer Price Index will be key for Bank of England sentiment
The British Pound is the best performing G10 currency on a 1-day view following the data due to the implication that this may mean higher for longer Bank of England, BoE, interest rates. Additionally, the strength of today’s UK earnings data could with hawkish comments by the BoE's Governor Andrew Bailey mean that tomorrow's UK December Consumer Price Index inflation data will be the highlight of the week in the forex space.
The Bank of England Governor Andrew Bailey said on Monday that inflation looks set to fall markedly this year as energy prices decrease. However, he said that a shortage of workers in the labour market poses a "major risk" to this scenario.
"I think that going forwards the major risk to inflation coming down ... is the supply side - and in this country particularly, the question of the shrinkage of the labour force," Bailey told lawmakers on parliament's Treasury Committee.
The ONS's inflation data on Wednesday is expected to be the next major trigger for the pound ahead of the BoE's meeting next month. The consumer price index is expected to have eased to 10.5% on an annual basis last month from 10.7% in November, according to a survey of economists polled by Reuters.
''We look for UK (Consumer Price Index) inflation to continue to soften, with the headline falling to 10.5% YoY (market: 10.5%, Bank of England: 10.9%) and core coming down to a five-month low of 6.2% YoY (market: 6.2%, Bank of England implied forecast of 6.3%),'' analysts at TD Securities said.
''Driving our forecast is primarily a near-5% MoM drop in petrol prices, however, we also look for a notable softness in the core goods component as retailers pushed through significant discounts in an attempt to rid themselves of high inventory levels ahead of Christmas,'' the analysts added.
''While our headline inflation forecast is quite significantly below the Bank of England's, a sizeable chunk of that difference comes from lower petrol prices, which the Bank will look through. Therefore, we think that data in line with our forecasts still supports another 50bps hike in February,'' the analysts at TD Securities concluded.
All eyes on the Bank of England
Meanwhile, looking ahead to next month's meeting, a tenth consecutive hike is expected and the money markets are pricing in a 65% chance of a 50 basis point (bps) hike and a 35% chance of a 25 bps increase.
''Even if the BoE has good reason to step up a hawkish tone, there were various instances last year when this failed to boost GBP, given the backdrop of weak investment growth, low productivity and overhanging uncertainties about the UK’s post-Brexit relationship with the EU,'' analysts at Rabobank said. Money markets are fully pricing in a 25 basis points (bps) rate hike at that meeting, with a roughly 75% chance of a larger 50 bps increase, according to Refinitiv data.
GBP/USD technical analysis
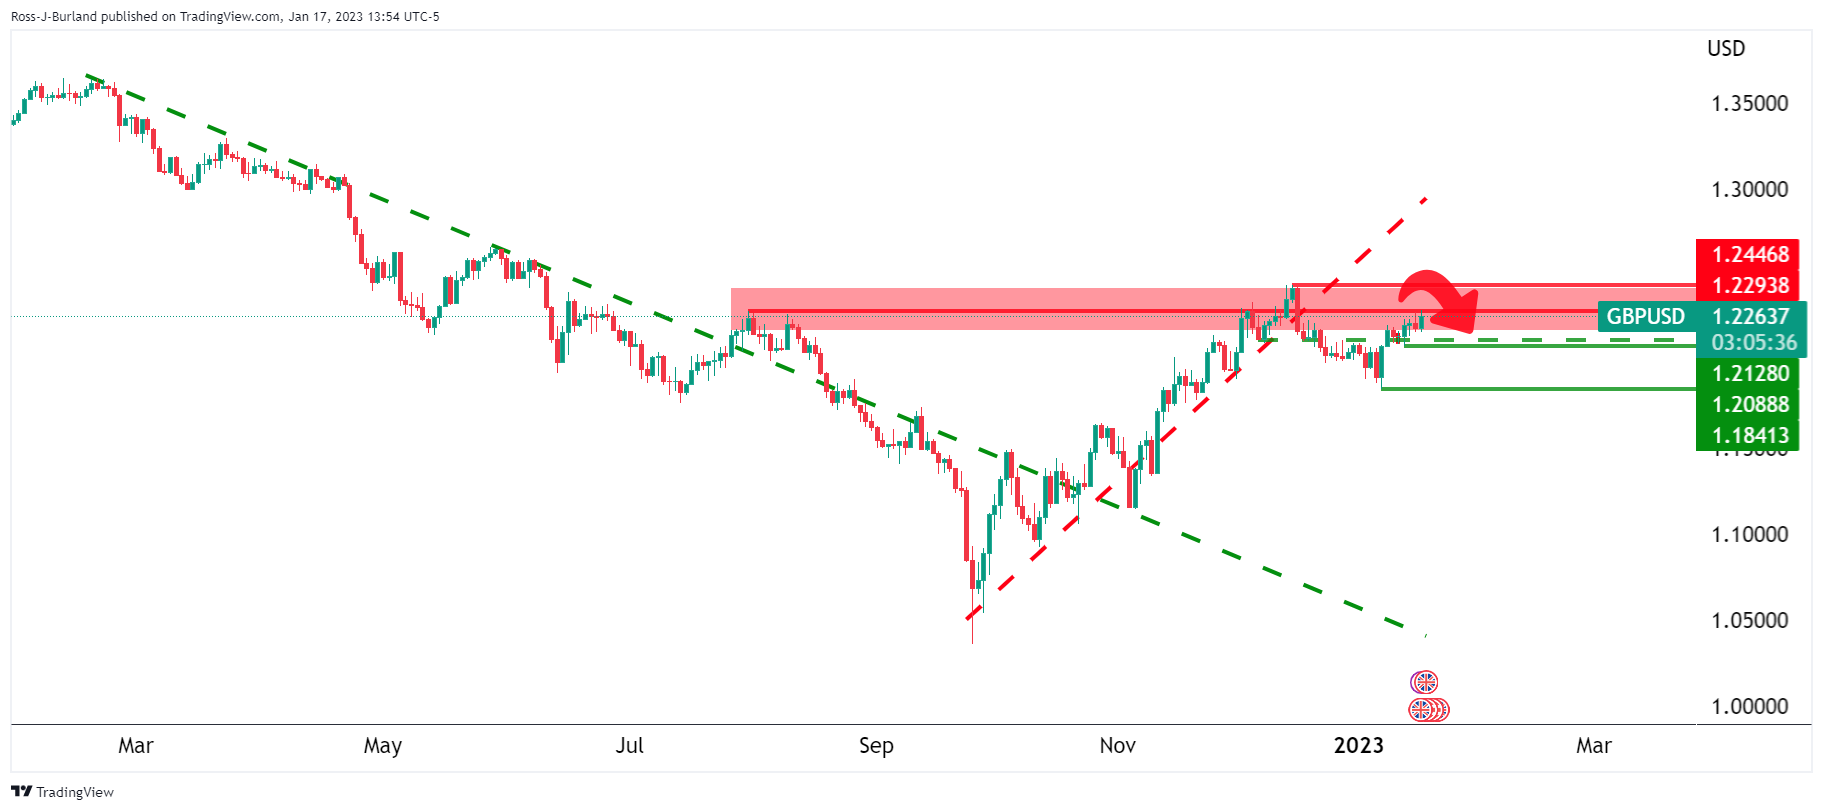
GBP/USD is on the backside of both the bearish trend and the bullish corrective trend making for a mixed outlook longer term, but potentially bearish for the nearer term.
The British Pound bulls are moving in following a break of the 1.2128 structure from swing lows of 1.1841. However, the bulls will need to get GBP/USD over the 1.2294 resistance and then 1.2446 swing highs if they are going to leave any significant spanner in the works for in-the-money shorts. Instead, this could be a typical distribution schematic playing out offering the bears a discount, resulting in a fade on rallies play for the days ahead:
GBP/USD H1 chart
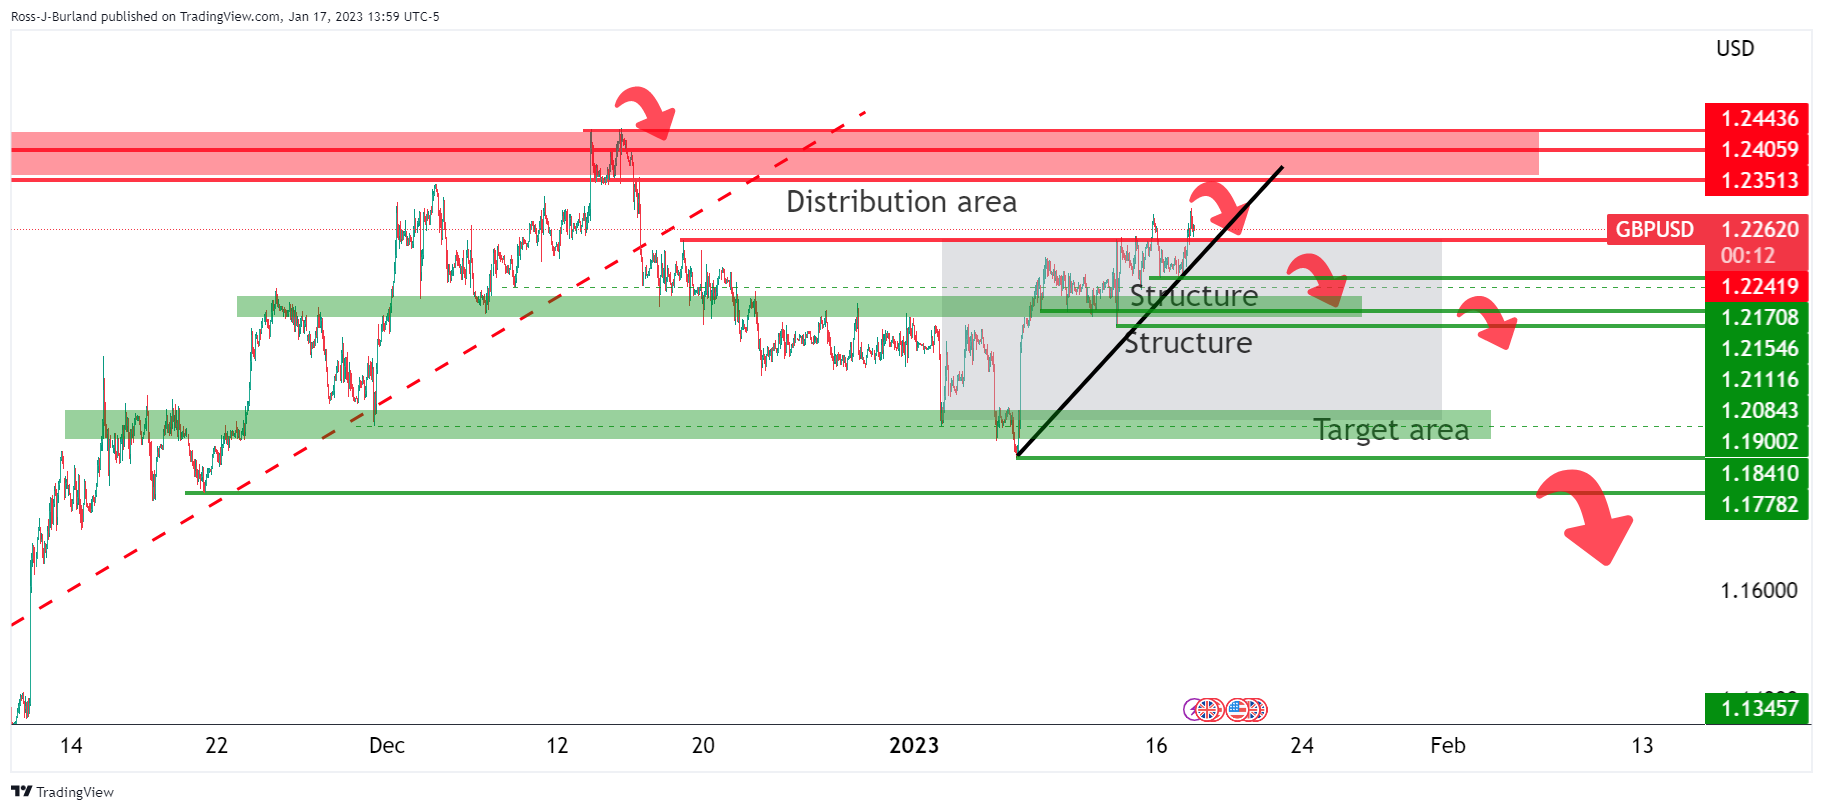
On the hourly chart, GBP/USD bears need to break the solid trendline support and 1.2170 structure that could then result in a cascade of stops being triggered in a waterfall sell-off below 1.2080 to test 1.1900 and below target areas.
- Gold prices fall after printing a doji on Monday, aiming toward $1900.
- The New York Empire State Manufacturing Index plummeted, augmenting expectations for a Fed pivot.
- Gold Price Forecast: An evening star candle pattern suggests further downside is expected.
Gold price retreats from daily highs nearby $1,920 and drops beneath the $1,910 mark, aiming toward $1,900 amidst a risk-off impulse. Even though the US Dollar (USD) continues to trade with losses, and US Treasury bond yields are bear flattening, the non-yielding metal losses traction. At the time of writing, the XAU/USD is trading at $1,906.69.
Gold remains on the defensive, despite an offered US Dollar
Risk aversion is the name of the game, as US equities dropped. Corporate earnings in the US are one of the reasons for a dampened mood. US economic data revealed by the New York Federal Reserve (Fed) showed that manufacturing activity and business conditions worsened. Speculations that the Fed might pivot improved, with traders expecting a 25 bps rate hike in the February 1 decision.
On the latter, sources cited by Bloomberg commented, “The Fed will have reached its terminal Fed funds rate in 1Q, and investors can start reacting to incoming data without the lens of what better news will mean for Monetary Policy. Good news for the economy can become good news for markets.”
Aside from this, the US Dollar Index, which measures the buck’s value vs. a basket of six currencies, losses 0.12%, exchanging hands at 102.440. The US 10-year benchmark note rate is 3.533%, almost unchanged and paired with earlier losses.
US data released that Manufacturing activity in New York plunged to its lowest in January, with business activity contracting sharply, with the index falling 22 points to -32.9. The report showed that new orders and shipments declined substantially, while delivery times were unchanged and inventories edged higher.
What to watch?
The US economic docket will feature the New York Fed President John Williams, crossing newswires Tuesday. On Wednesday, the calendar will feature Retail Sales, prices paid by producers (PPI), and further Fed speaking.
Gold Price Forecast: Technical outlook
From a technical perspective, the XAU/USD daily chart depicts the formation of a three-candlestick chart pattern known as the evening star. Mondays’ price action formed a doji, followed by Tuesday’s $12.00 fall. Nevertheless, a daily close of around $1,905 or below is needed to confirm the pattern validity, suggesting the yellow metal might push for a break below $1,900.
If the above scenario plays out, XAU/USD first support would be $1,900. A breach of the latter will expose last Friday’s low of $1,892.40, followed by the January 11 high of $1,886.63 and $1,870.
- The Australian Dollar got bolstered by China’s upbeat GDP and improvement in Australia’s consumer sentiment.
- New York Fed Empire State Manufacturing Index plunged as business conditions deteriorated, augmenting speculations for a Fed pivot.
- AUD/USD traders are eyeing Fed speaking, US PPI, Retail Sales, and Australia’s employment data.
The Australian Dollar (AUD) is trimming some of its Monday’s losses and rising due to an offered US Dollar (USD) across the board, despite a dampened market mood surrounding Wall Street. US corporate earnings would likely continue to drive the market sentiment amidst the lack of tier 1 data. At the time of writing, the AUD/USD is trading at 0.6974.
AUD/USD climbs but fails to crack 0.7000
Wall Street continues to lose traction as sentiment turns sour. US data released ahead of the US cash market equities open showed that Manufacturing activity in New York plunged to its lowest in January, as reported by the New York Federal Reserve (Fed). Delving into the report, business activity contracted sharply, with the index falling 22 points to -32.9. The report showed that new orders and shipments declined substantially, while delivery times were unchanged and inventories aimed higher.
The softer-than-expected data spurred a jump in the AUD/USD pair, reaching a new daily high of 0.6993, before retracing some of its gains. Meanwhile, the US Dollar Index, which tracks the buck’s value against a basket of six currencies, retraces 0.11%, down at 102.448, undermined by falling US Treasury bond yields.
On the Australian side, upbeat data from China, mainly the Gross Domestic Product (GDP) beating expectations of 1.6%, at 2.9% for Q4, bolstered the Aussie Dollar (AUD). Regarding the annual based data, China’s GDP came at 3%, well below the Communist Party’s 5% projection, and trailed 2021 by 8.1%.
Even though China’s data for the entire year disappointed, its reopening is being cheered by market investors, as the Hang Seng has risen almost 14% since the beginning of 2023. Further, the release of Australian consumer sentiment improved for the second consecutive month at 5.0%, vs. 3.0% in December.
Ahead of the week, the US economic docket will feature the New York Fed President John Williams, crossing newswires Tuesday. On Wednesday, the calendar will feature Retail Sales, prices paid by producers (PPI), and further Fed speaking.
AUD/USD Key Technical Levels
- EUR/USD bears are in control and eye the 38.2% Fibonacci retracement that aligns with the prior resistance near 1.0720.
- 1.0720 guards a deeper move into the Fibo scale and a 50% mean reversion within the scale cannot be ruled out near 1.0680.
- EUR/USD bears need to get below 1.0770 first.
As per the start of the week's analysis, EUR/USD Price Analysis: Bulls have been capped and eyes are on 1.0720, the downside is playing out as the week continues to move along with the price picking up the pace on the offer on Tuesday, helped along by ECB policymakers starting to consider a slower pace of interest-rate hikes.
EUR/USD start of the week analysis
A downside thesis was in play as bulls ran into a trap with breakout traders enthused by the US Consumer Price Index and a move through 1.0800 into 1.0850. However, there has been no follow-through:
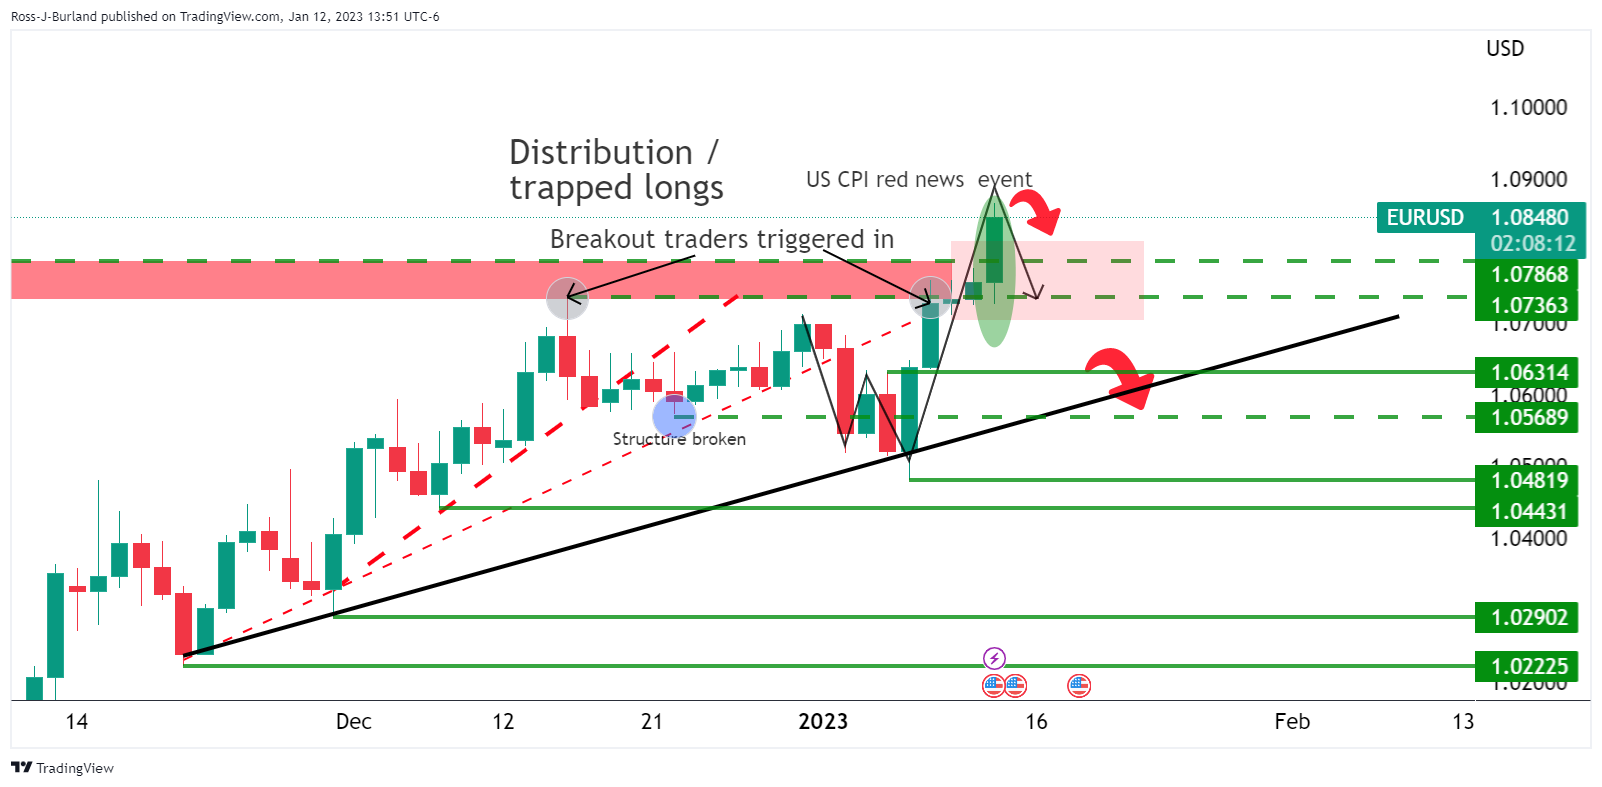
The analysis highlighted the downside risks as illustrated above. The price has since stalled and is on track for a re-test of 1.0780s and lower towards 1.0700. However, the bears needed to break trendline support on the lower time frames, such as the 4-hour chart as follows:
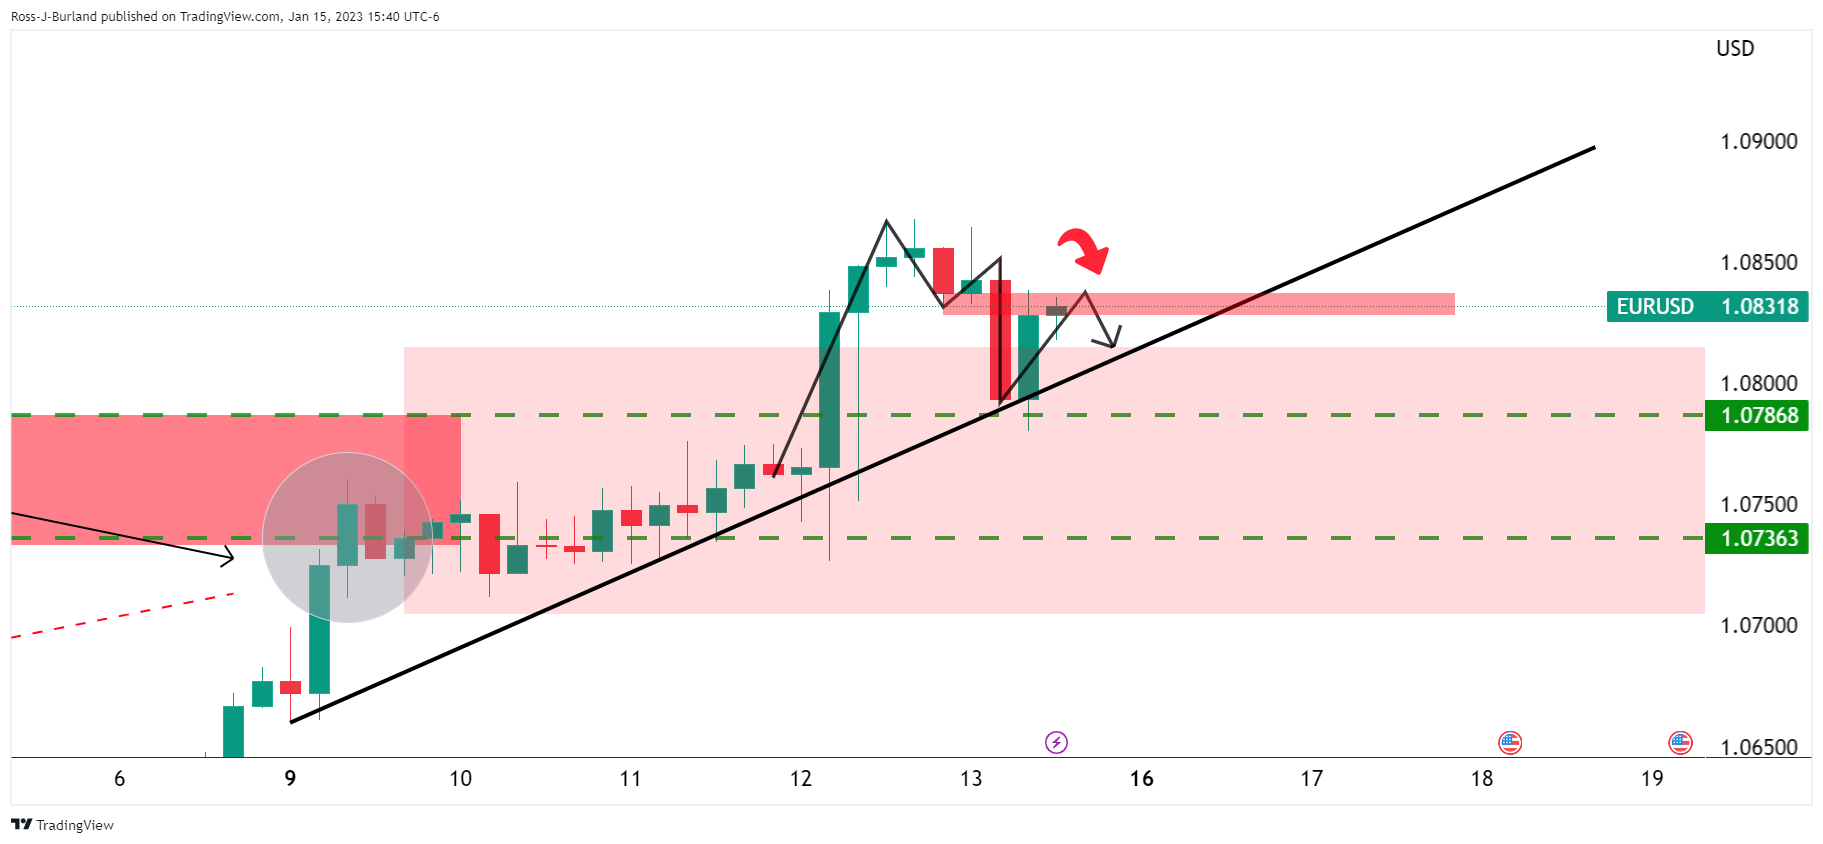
EUR/USD update
We got there eventually and today's thrust to the downside likely seals the deal for a deeper bearish correction with a bearish head and shoulders in play:
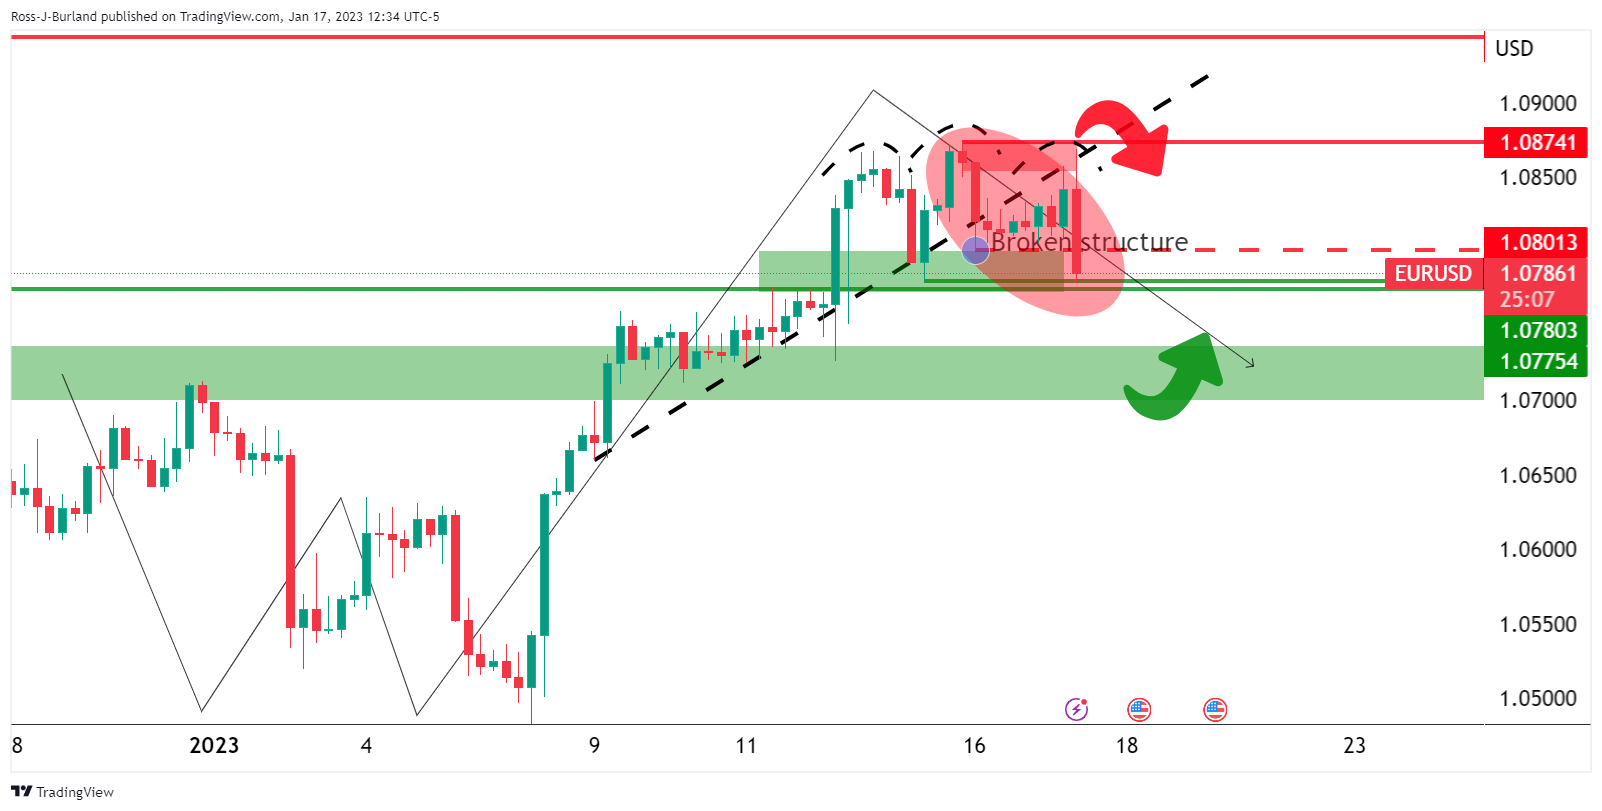
We have one broken structure at 1.0801 but bears need to get below 1.0780/70 to really nail in the coffin.
Nevertheless, the bears are on track for the daily downside targets as follows:
The 38.2% Fibonacci retracement that aligns with the prior resistance structures could be a target near 1.0720. This structure guards a deeper move into the Fibo scale and a 50% mean reversion within the scale cannot be ruled out near 1.0680.
However, the bears need to get below 1.0770 first.
ECB policymakers are starting to consider a slower pace of interest-rate hikes after a likely 50 basis-point step in February, sources say as reported by Bloomberg.
“The rapid energy-driven decline in headline inflation is giving the ECB a bit of breathing space, but policymakers will remain focused on persistent underlying pressures for now. If, as we expect, the core reading starts to ease from the end of the first quarter, this could be enough for the ECB to slow the pace of hikes to 25 basis points in March, possibly extending the cycle into the second quarter,” Bloomberg reported.
However, President Christine Lagarde indicated in December, a higher pace of tightening than indicated above, laying down the foundations for a 50 basis-point step in February. Nevertheless, the prospect of a smaller 25-point increase at the following meeting in March now has traction in the markets, despite officials saying today that no decisions have been taken, and that policymakers may still deliver the half-point move for the March meeting that Lagarde penciled in on Dec. 15.
The ECB spokesperson declined to comment on future action by the Governing Council.
EUR/USD update
Meanwhile, the euro is under pressure on Tuesday, falling from a high of 1.0869 to a fresh low of 1.0786 in a move signified in prior analysis as follows:
EUR/USD Price Analysis: Daily W-formation could be playing out, eyes on break of 1.0820/00
The W-pattern was regarded as a reversion formation and the price was expected to dip into the bullish impulse for a restest for the prior structure if not all the way into the neckline:
The euro is pressured and in pursuit of the downside targets while money markets ease tightening wagers further out, putting odds on a similarly sized 25bp increase in March at around 70%.
Weaker-than-expected inflation in the euro area, a drop in natural gas prices and the prospect of gentler tightening by the US Federal Reserve have brought some comfort to policymakers at the ECB.
A more resilient Eurozone economy and a more hawkish European Central Bank offer support for the Euro, explain analysts at Well Fargo. They have a forecast for EUR/USD at 1.13 for the first quarter of next year and warn risks are clearly titled to the upside.
Key quotes:
“From a currency perspective, a more resilient (albeit still subdued) Eurozone economic outlook and a more hawkish European Central Bank monetary policy outlook clearly offers a more supportive mix for the euro exchange rate against the U.S. dollar. With respect to our base case forecast, it is quite possible that some of the weakness we had anticipated in the EUR/USD exchange rate in early 2023 may in fact not materialize.”
“The risks to our Q1-2024 target for the EUR/USD exchange rate of $1.13 are clearly tilted to the upside. In the context of recent developments, our outlook for the euro versus the U.S. dollar is shifting appreciably in the direction of a more constructive medium-term trend.”
Analysts at Danske Bank see short-term risks in EUR/SEK titled to the upside. On a long term perspective, they expect a recovery and sustainable support to risk assets and the Swedish Krona and forecast EUR/SEK at 11.00 in 12 months.
Risk for correction, but we stick with bearish view on SEK
“We expect the Riksbank to hike by 50bp at the February meeting, taking the repo rate to 3%. That said, there is a clear risk for an additional 25bp in April. Overall, we expect that relative monetary policy will remain a negative for the SEK in 2023 as well.”
“Current bout of SEK weakness seems disconnected from both broader risk sentiment and relative rates and thus we view the EUR/SEK rally as overdone in the short-term. However, we still expect EUR/SEK to move higher over the coming months to 11.40 on the back of a global economic downturn, relative monetary policy and the Riksbank’s disregard for SEK weakness.”
“Risks are perhaps tilted to the upside as current momentum may favour EUR/SEK to remain elevated. In the medium-term, a Fed pivot, a global ‘soft landing’ and/or a change in Riksbank policy w.r.t the SEK could leave our forecast too elevated in 3-6M. In an even more protracted recession, on the other hand, our 12M point might be too low.”
Data released on Tuesday showed lower-than-expected inflation numbers in Canada. Analysts at CIBC point out the report was largely as anticipated and therefore, they continue to expect the Bank of Canada to raise rates by 25 bps next week before pausing for the rest of the year.
Looking through mortgage costs
“The BoC's core measures CPI-median and CPI-trim also decelerated by one tick to 5.0% and 5.3% respectively, after being revised up in the prior month. While core inflation remains too high, when excluding the increase in mortgage interest costs, which reflect the rapidly rising interest rates, things look better with a monthly gain of about 0.2%. Overall, this report is largely as anticipated and we therefore continue to expect the Bank of Canada to raise rates by 25 bps next week before pausing for the rest of the year.”
“The good news is that inflation is easing, and that will become more noticeable when the big monthly increases seen this past spring start to drop out of the annual calculation this year. Moreover, core inflation excluding mortgage costs is growing at a pace much closer to target. However, given the strong December job's report and tightness in the labour market, that likely won't be enough to deter the Bank of Canada from raising rates 25 bps one last time next week.”
The EUR/USD hit in January the highest levels in months. Analysts at Danske Bank point out their topside risk scenario to the pair has played out. Near-term they acknowledge the risk of this continuing, meanwhile, further ahead they believe too much positivity is priced into the EUR and that markets underestimate the re-tightening potential of financial conditions.
EUR optimism is strong, but eventually set to fade
“We still pencil in Fed hiking policy rates above 5.0% in Q1 and think the inversion embedded into the US curve for H2 2023 is overdone. Markets still price in c. 150bp more of ECB rate hikes, which is more than our base case, although we acknowledge the risk of ECB delivering more. In our view, continued tightening must ensure a re-tightening of financial conditions. This should act as a negative for EUR/USD on 3-6M.”
“EUR/USD remains overvalued on a 1-3Y horizon and unless we see global growth persistently accelerate risks are eventually skewed towards a setback. We lift our profile but still pencil in a lower cross on 3-12M, forecasting the cross at 1.03 in 12M.”
- Euro tumbles following comments from
- Pound among top performers of the day after UK GDP data, ahead of CPI numbers.
- EUR/GBP sharp reversal sends the price under 0.8800 and below the 20-day SMA.
The EUR/GBP is losing more than 50 pips, having the worst day in at least two months. Recently it hits levels under 0.8800 for the first time in a week.
The cross broke below 0.8830 and accelerated the downside. It bottomed at 0.8792 and remains near the lows, under pressure as the Euro tumbles.
ECB contemplating a lower path?
Bloomberg reported that “European Central Bank policymakers are starting to consider a slower pace of interest rate hikes” after a 50 basis points hike in February, “according to officials with knowledge of their discussions.”
The report triggered a decline of the Euro across the board with EUR/USD falling from near 1.0870 to levels under 1.0800. The common currency is the worst performer of the American session.
The Pound was already trading higher versus the Euro, supported by better-than-expected UK economic data. The unemployment rate remains unchanged at 3.7% in November while average weekly earnings, excluding bonuses, arrived at 6.4% in 3Mo/YoY in November versus 6.1% of the previous month and the 6.3% expected. On Wednesday, the UK will report the Consumer Price Index. The headline is expected at 10.6% (annual) in December down from 10.7% in November.
Technical outlook
The EUR/GBP is falling after facing resistance at the 0.8900 level and with the current bearish acceleration, it could test the next crucial support around 0.8770/75, that is the bottom of the recent range.
Technical indicators are turning south and could point to furthers losses if current levels are confirmed. The cross is back below the 20-day Simple Moving Average that stands at 0.8820. A recovery back above 0.8830 would alleviate the bearish pressure. A daily close above 0.8900 would open the doors to more gains.
Technical levels
Gold has pushed above $1,900 for the first time since April 2022. After the recent rally, Gold may need to consolidate over the near term, in the view of analysts at HSBC.
A weaker USD may be key in sustaining high Gold prices over 2023
“Evidence of easing US price pressures has helped buoy risk sentiment and undermine the USD, supporting Gold over the last several months. That said, it is possible that Gold may need to consolidate, or even dip, over the near term, after the recent spate of gains.”
“In the coming 12 months, we expect to see further USD weakness, as the drivers of the 2022 rally (a hawkish Fed, slower global growth, and risk aversion) either diminish or reverse. A weaker USD will likely lend strong support to Gold prices over 2023. That said, a likely peak in the Fed’s tightening cycle in 1Q23 could partially offset the positive impact of a weaker USD on Gold.”
“Whether the Fed sees fit to cut rates later in 2023, or keep rates steady – as implied by Fed rhetoric – will further impact Gold. XAU/USD is historically sensitive to US real yields, however, while there has been some disconnect in this relationship in recent months, we expect the relationship to resume as 2023 unfolds.”
“High Gold prices may weigh on underlying demand for jewellery, or even bars and coins, and moderating inflation may also cut into coin, bar and other Gold demand, while strong central bank demand will likely ease somewhat in 2023 but remain historically high, supported by geopolitical risks and portfolio diversification needs.”
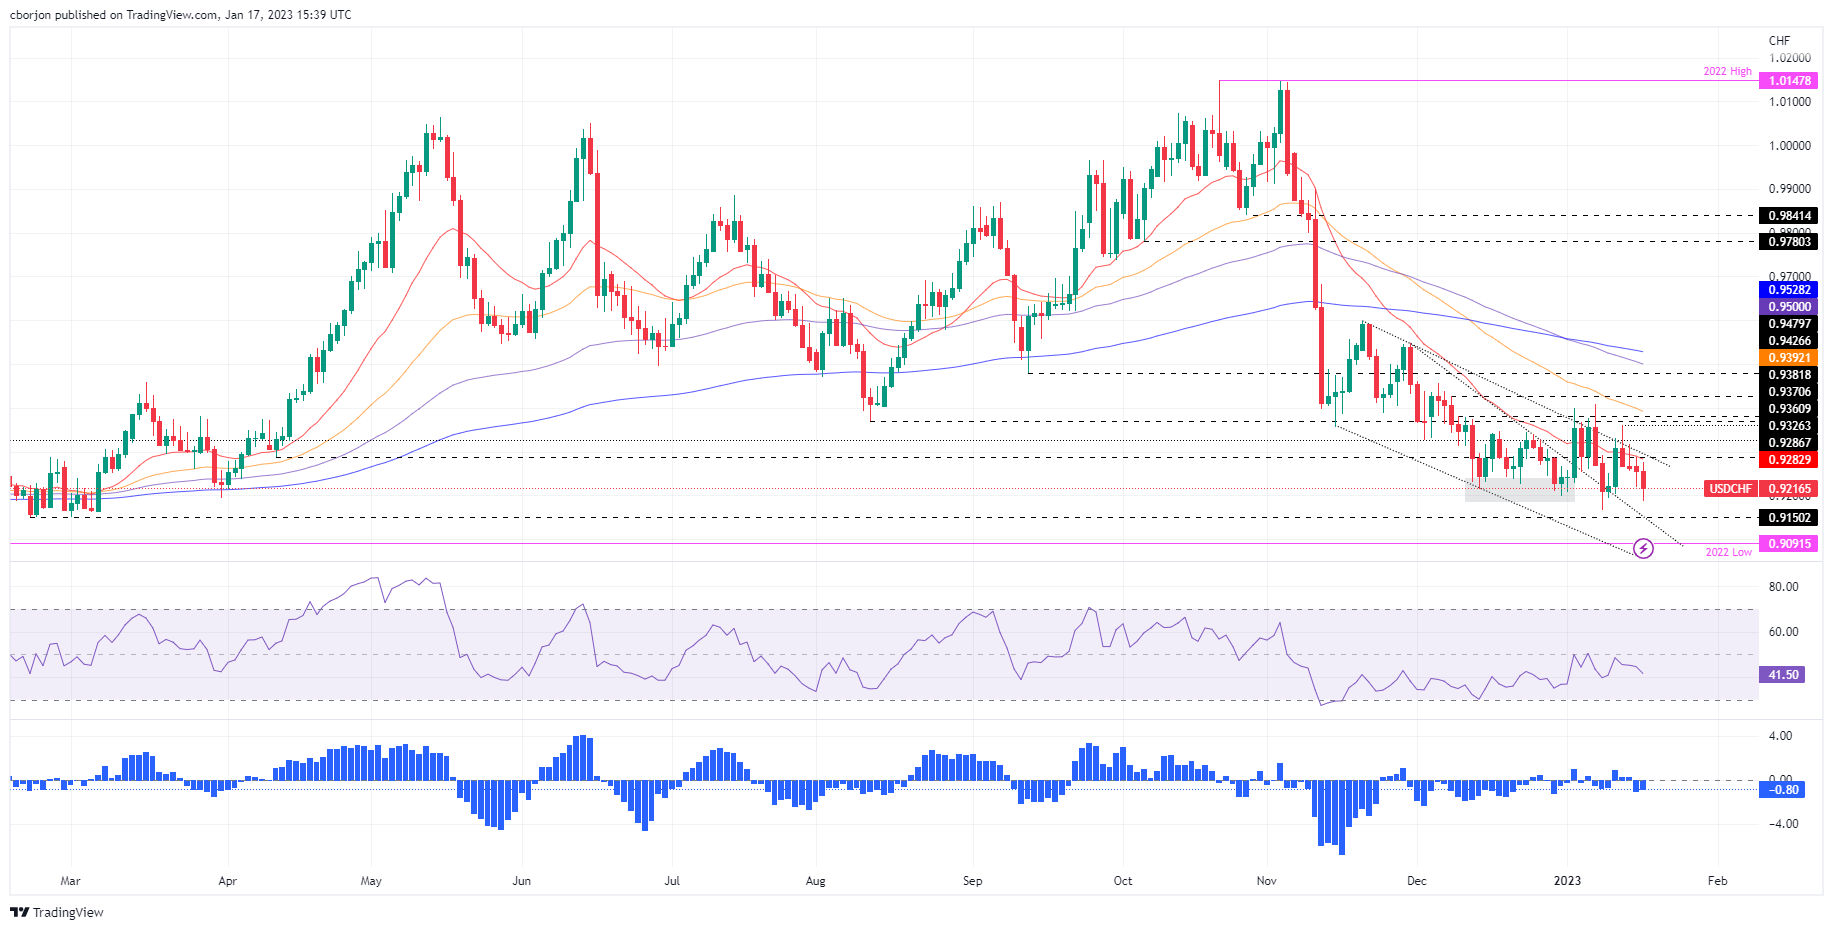
- USD/CHF remains below the 20-day EMA, unable to reclaim 0.9300.
- Although the pair is bearish, solid USD/CHF support to be found around 0.9150.
- If the USD/CHF climbs above the 20-day EMA, that will expose the 0.93 figure, followed by the 50-day EMA.
After failing to clear 0.9360 during the last week, the USD/CHF is extending its downtrend to four consecutive days, staying just below the 20-day Exponential Moving Average (EMA), which sits at around 0.9282, acting as a solid resistance. Hence, the USD/CHF is trading at 0.9213, below its opening price by 0.44%.
USD/CHF Price Analysis: Technical outlook
The USD/CHF is neutral-to-downward biased and continues to trade beneath the confluence of a three-month-old downslope trendline and the 20-day EMA. Although the bias suggests further downside, since December 2022, the USD/CHF bottomed around the February 2022 low of 0.9150 and remains unable to crack it. Therefore, bears need to clear the latter, to open the door towards 0.9100 first and then the 0.9000 figure.
As an alternate scenario, if the USD/CHF pair reclaims the 20-day EMA, that could send the pair climbing to 0.9300, followed by the January 12 high of 0.9360, ahead of the 0.9400 mark.
USD/CHF Key Technical Levels
The critical Bank of Japan (BoJ) policy decision due on Wednesday could lift the Yen as much as 5%, economists at Barclays report.
BoJ meeting poses further upside risks to the JPY
“The BoJ meeting poses further upside risks to the JPY. If the BoJ decides on further YCC adjustment, we estimate that the Yen could appreciate by as much as 5%.”
“Even if inaction leads to a knee-jerk USD/JPY rally, expectations for revision will likely remain intact and USD/JPY could stay on a downtrend, especially amid broad USD weakness.”
See – BoJ Preview: Forecasts from eight major banks, no rush to normalize monetary policy
The Bank of Japan (BoJ) will announce its monetary policy decision on Wednesday, January 18 at 03:00 GMT and as we get closer to the release time, here are the expectations forecast by the economists and researchers of eight major banks.
Back in December, the central bank introduced a change to its Yield Curve Control (YCC), lifting the ceiling of what the 10-year note could offer from 0.25% to 0.50%. A hike this week seems unlikely as the BoJ is set to leave its policy unchanged.
Standard Chartered
“We expect the BoJ to keep both the policy balance rate and the 10Y yield target unchanged at -0.1% and 0%, respectively. We believe policymakers will assess the potential impact of the recent decision to widen the 10-year JGB band to +/-50 bps (from +/-25 bps) at its December meeting. Local media reports suggest that policymakers will be looking to review the side effects of current ultra-easy monetary policy and potential risks following the BoJ’s December move. This has likely raised concern among policymakers that unwinding of the negative interest rate policy may result in unintended consequences and risk financial market instability.”
ING
“The BoJ is expected to stand pat after delivering its unexpected decision in December to expand the yield curve band. Governor Haruhiko Kuroda’s future guidance will remain dovish, but apart from that, the market appears to be pricing in additional normalisation steps from the next BoJ governor.”
TDS
“We expect a further widening of the YCC band by another 25 bps at this meeting, and if not now, at the March meeting. Market functioning has not improved as reflected in large unscheduled bond-buying operations. Additionally, there are growing signs of broadening inflation pressures. At the very least we expect the BoJ to revise its inflation forecasts higher.”
SocGen
“Our main scenario for the BoJ is still no change to the YCC policy, but the risk for some changes has risen quickly. We see 25% chance of BoJ scrapping JGB purchase limitation and increasing the types of bonds, and 25% chance of a wider band of ±75 bps for the 10-year yield. What would make BoJ’s job harder is that core CPI likely accelerated again in December to 4%, owing to broad-based inflationary pressure.”
Danske Bank
“Despite some speculations, consensus expects no changes in monetary policy this week, but even if the BoJ was to surprise the market, we think market reactions this time would be more muted.”
Deutsche Bank
“We expect no change in policy (even if we feel there are risks they will) but believe the associated Outlook Report will show an upgrade to the bank's inflation forecast to around 2% for 2022-2024. We expect the BoJ to abandon YCC by the end of Q2 this year, amid forces such as the ‘shunto’ spring wage negotiation, a positive output gap and leadership changes at the bank. If they do change the YCC guidelines this week, we think that another 25 bps widening of the band would be worth around 10 bps on 10yr USTs immediately. The eventual end of YCC would lead to a more substantial and permanent shift in term premium but this will take time.”
Citibank
“We expect YCC to be abolished. The BoJ decided on an unexpected policy change (i.e., widening of the target range for 10-year JGB yields) in December, but 10-year JGB yields have already stuck at the upper limit of the new range of +0.5%, resulting in renewed distortion in the yield curve. Even if the range is widened again, it is unlikely that the distortion of the yield curve will be fundamentally addressed. Moreover, comparing the impact of abolishing YCC under President Kuroda and under the next governor, the former would cause less damage to the organization.”
Wells Fargo
“Recall that in December of last year, the BoJ surprised market participants by adjusting its YCC policy, widening the tolerance band for the 10-year Japanese government bond (JGB) yield to +/- 50 bps (instead of +/- 25 bps) around a target of zero percent. Despite the policy tweak, Governor Kuroda asserted that the change in policy was not a form of monetary tightening, but a move to improve JGB market functioning. While this adjustment has added uncertainty to the outlook and has increased the likelihood of another policy change, we do not expect the BoJ to adjust monetary policy at its January meeting.”
Gold price climbed to $1,930 at the start of the week, thereby reaching its highest level since the end of April 2022. Nonetheless, economists at Commerzbank doubt that the currency increase is sustainable.
Gold price increase still accompanied by speculative buying
”There is still a considerable discrepancy between the interest rate path anticipated by the market and that indicated by the Fed. If the market changes its view and moves more into line with the Fed, the Gold price risks facing serious setback potential.”
“Net long positions held by speculative financial investors increased for the sixth week in a row in the week to 10 January to reach just shy of 62,000 contracts, their highest level since May 2022. Having said that, they were more than twice as high in March 2022, so there can be no talk of any overheating.”
“Since the start of the year, holdings in the gold ETFs tracked by Bloomberg declined by 3.4 tons, which is amazing in view of the steep price rise. This also makes us sceptical about the sustainability of the current upswing. After all, it is primarily the result of the weak USD and declining interest rate expectations.”
- A risk-off impulse, and speculations for the Bank of Japan quitting its YCC, are headwinds for the USD/JPY.
- The New York Fed Empire State Manufacturing report showed further deterioration in the region, sparking recession fears,
- USD/JPY Price Analysis: Failure to clear 129.40s exacerbated a drop below 129.00.
USD/JPY clings to its earlier gains as the North American session begins, though it’s retracing after hitting daily highs of 129.16 before the Wall Street open. The US Dollar (USD) is giving back earlier gains while sentiment continues to deteriorate. At the time of writing, the USD/JPY is trading at 128.46, up by 0.11%.
An offered US Dollar, a headwind for the USD/JPY
Wall Street is set to open lower as US stock futures remain in negative territory. The greenback is fallen off the cliff, as shown by the US Dollar Index, down 0.57% at 101.984. The US 10-year Treasury bond yield, which usually correlates closely with the USD/JPY pair, trims its gains and sits at 3.535%, unchanged.
The US Empire State Manufacturing Report revealed by the New York Federal Reserve showed that business activity contracted sharply, with the index falling 22 points to -32.9. The report showed that new orders and shipments declined substantially, while delivery times were unchanged and inventories aimed higher.
Even though the data was worse than expected, the USD/JPY reaction to it was muted as traders braced for the two-day monetary policy decision of the Bank of Japan.
Expectations for a rate hike are very slim, though the March meeting jumped by 45%. Market analysts think that the BoJ could abandon its Yield Curve Control (YCC) to prepare the markets for its first rate hike at March or April’s meeting.
Ahead of the week, the US economic docket will feature the New York Fed President John Williams crossing the media. On the Japanese front, the Reuters Tankan Index, Machinery Orders, and the so-awaited Bank of Japan monetary policy decision would entertain USD/JPY traders.
USD/JPY Price Analysis: Technical outlook
During the European session, the USD/JPY hit a daily high at 129.16 before pairing those gains. The rally stalled below last Friday’s high of 129.42, which exacerbated the drop toward 128.50. Hence, price action edging lower, oscillators like the Relative Strength Index (RSI) remaining in bearish territory, and the Rate of Change (RoC) pushing further to the downside paved the way for further losses.
Therefore, the USD/JPY first support would be the 128.00 figure, followed by the January 16 daily low of 127.21 and the May 24 pivot low of 126.36.
- Canada: inflation slowdowns further in December.
- US: Empire manufacturing index plummets unexpectedly in December.
- USD/CAD remains sideways, unable to hold above 1.3400.
The USD/CAD broke below 1.3400 following the release of US manufacturing and Canadian economic data. It printed a fresh daily low at 1.3383. It remains near the lows, with a bearish bias as the Loonie outperforms and the US Dollar falls across the board.
Data weighs on USD/CAD
The US Empire Manufacturing Index dropped sharply unexpectedly to the lowest level since May 2020. The index fell from -11.2 to -32.9, against expectations of a recovery to -4.5. Price indicators of the reports showed a slowdown. The Greenback fell after the report.
In Canada, inflation numbers came in below expectations. The Consumer Price Index fell by 0.6% in December with the annual rate slowing down from 6.8% to 6.3%. The Bank of Canada Prince Index Core fell by 0.3% and the yearly rate dropped from 5.8% to 5.4%, versus the 6.1% of markets consensus.
“Big picture, this probably doesn't change much for the Bank of Canada. Yesterday's Business Outlook Survey suggested that tightening is starting to have an impact, but today's data, coupled with the stronger than expected Q4 activity data, reinforces the notion that the economy is in excess demand. The most prudent move is for the BoC to lift rates by 25 bps next week. After last year, the BoC cannot afford to risk falling behind the curve again. We continue to look for 4.50% as the terminal rate”, said analysts at TD Securities.
Sideways, within a bearish trend
Last week, the rebound from monthly lows in USD/CAD was capped by the 1.3450 area. During the current week, the pair is showing difficulties in holding above 1.3400. Recent price action confirms that bearish risks prevail.
On the flip side, an initial support emerges at 1.3345 and then attention would turn to the January low at 1.3320.
Technical levels
Senior Economist at UOB Group Alvin Liew reviews the latest US inflation figures.
Key Takeaways
“US headline consumer price inflation (CPI) declined by -0.1% m/m in Dec, from 0.1% in Nov, exactly in line with Bloomberg’s survey and more importantly, was the first sequential contraction recorded since May 2020. As a result, headline inflation eased off further from the Jun 2022 peak of 9.1% y/y to 6.5% y/y in Dec, against 7.1% in Nov. In comparison, core CPI rose by a faster 0.3% m/m pace (from 0.2% m/m in Nov) which was also the consensus expectation. Despite the m/m increase, core CPI decelerated on a y/y basis to 5.7% against 6.0% in Nov, and exactly in line with Bloomberg’s median estimate and also the smallest y/y rise since Dec 2021.”
“Within the overall CPI, it was the decline in gasoline prices that contributed the most to the overall -0.1% m/m decrease, more than offsetting increases in the shelter cost index. In y/y terms, housing, food and services inflation continued to contribute strongly to overall inflation, while the improvement in the y/y overall CPI inflation was largely driven by declines in gasoline prices and used cars and truck prices.”
“US Inflation Outlook – If the CPI momentum is able to hold at around 0.1%-0.3% m/m in 2023 (vs. average of 0.5% m/m in 2022, 0.6% m/m in 2021), then there is a good chance for the inflation to move towards the US Fed’s target of 2% by the end of 2023. For the full year, we still expect both headline and core inflation to average 3.0% in 2023, above the Fed’s 2% objective. The balance of risk on inflation remains on the upside.”
- EUR/USD picks up a more convincing pace and flirts with 1.0870.
- The risk appetite continues to support the upbeat mood in spot.
- Economic Sentiment in Germany surprised to the upside in January.
Bulls push harder and lift EUR/USD to fresh daily highs near 1.0870 on Tuesday, just pips away from Monday’s YTD peak.
EUR/USD: Further gains need to clear 1.0874
The greenback loses its grip further and allows EUR/USD to gather extra steam and approach Monday’s so far yearly tops near 1.0880.
Indeed, investors remain tilted towards the risk complex on Tuesday, propped up by positive results from the Chinese docket during early trade as well as firm prints from the Economic Sentiment in both Germany (16.9) and the broader euro area (16.7) for the month of January.
The uptick in spot, however, comes in contrast to the weak tone from yields on both sides of the Atlantic.
In the US data space, the NY Empire State Manufacturing Index worsened to -32.9 for the current month (from -11.2).
What to look for around EUR
EUR/USD appears so far well underpinned by the 1.0800 neighbourhood and looks at another test of the 1.0880 region amidst favourable risk appetite trends on Tuesday.
Price action around the European currency should continue to closely follow dollar dynamics, as well as the impact of the energy crisis on the euro bloc and the Fed-ECB divergence.
Back to the euro area, the increasing speculation of a potential recession in the bloc emerges as an important domestic headwind facing the euro in the short-term horizon.
Key events in the euro area this week: ECOFIN Meeting, Germany Final Inflation Rate / ZEW Economic Sentiment, EMU ZEW Economic Sentiment, Italy Final Inflation Rate (Tuesday) - EMU New Car Registrations / Final Inflation Rate (Wednesday) – ECB Lagarde, ECB Accounts (Thursday) - ECB Lagarde (Friday).
Eminent issues on the back boiler: Continuation of the ECB hiking cycle amidst diminishing probability of a recession in the region. Impact of the war in Ukraine and the protracted energy crisis on the bloc’s growth prospects and inflation outlook. Risks of inflation becoming entrenched.
EUR/USD levels to watch
So far, the pair is gaining 0.40% at 1.0864 and faces the next up barrier at 1.0874 (monthly high January 16) followed by 1.0900 (round level) and finally 1.0936 (weekly high April 21 2022). On the flip side, the breakdown of 1.0481 (monthly low January 6) would target 1.0476 (55-day SMA) en route to 1.0443 (weekly low December 7).
The United Kingdom will release the Consumer Price Index (CPI) data on Wednesday, January 18 at 07:00 GMT and as we get closer to the release time, here are the forecasts by the economists and researchers of five major banks regarding the upcoming UK inflation print.
Headline is expected at 10.6% year-on-year vs. 10.7% in November while Core Inflation is likely to accelerate to 6.6% vs. 6.3% booked in November. If so, Headline would decelerate for the second straight month from the 11.1% peak in October but would remain far above the 2% target.
Nomura
“We are forecasting headline CPI inflation to ease from 10.7% YoY to 10.4% in December and core inflation to fall more gradually from 6.3% to 6.2%.”
TDS
“We look for another large decline in UK headline CPI, largely due to an almost 5% MoM drop in petrol prices but also as retailers pushed through significant discounts in the month to rid themselves of high inventory levels. While our forecast (10.5%) is quite a bit below the BoE's of 10.9% YoY, much of this gap is due to lower petrol prices rather than weaker underlying dynamics.”
SocGen
“The December CPI print is likely to add weight to our belief that the 11.1% recorded in October was the peak in inflation, especially given recent energy price trends. There should be only a modest increase by 0.1pp to 10.8%, driven by higher core and food inflation. More important for the BoE will be core inflation developments. Therefore, our expectation that core prices accelerate from 6.3% to 6.5% in December will worry the Bank, especially because we think it will be driven by services inflation that is more dependent on wages. On the other hand, we see goods inflation softening from 6.3% to 5.9% due to a combination of negative base effects and retailers using discounts to shed excess stock. For the coming year, strong wage growth should see core inflation only gradually falling from our forecasted value of 6.5% in December to 6% by year-end.”
Citibank
“We expect headline CPI inflation to moderate further this week to 10.5% YoY. Core CPI may prove somewhat more resilient at 6.2%. On the core goods side, we see risks to the downside with high inventory levels, in particular, likely to have averted significant further price pressure. Services are trickier to call, with a train strike on the observation date in question and widespread disruption throughout the month.”
ING
“Headline CPI has peaked but is likely to remain in double digits through early 2023. But the Bank’s favoured measure of ‘core services’ inflation, perhaps the cleanest gauge of domestically-driven price pressures, has edged higher in recent months and this will be key. Signs that this is reaching a peak would boost the case for a more modest rate hike in February.”
Economist at UOB Group Ho Woei Chen assesses the latest monetary policy meeting by the Bank of Korea (BoK).
Key Takeaways
“As expected, Bank of Korea (BOK) raised its benchmark 7-day repo rate by 25bps to 3.50% (on January 13), the highest level since Dec 2008.”
“However, the rate decision was not unanimous with 2 policy board members voting for interest rate to be unchanged in Jan. Board members also expressed different opinions on the interest rate outlook with 3 out of 6 (excluding Governor Rhee) indicating possibility for a ‘terminal rate’ of 3.75%. This is a departure from the previous meeting in Nov when the same number indicated that they see the ‘terminal rate’ at 3.50%.”
“Barring a change to global inflation trajectory where price gains are expected to slow this year, we maintain our view that the latest rate hike has marked the end of BOK’s tightening cycle.”
“Indicating how quickly the economic outlook has deteriorated, the BOK suggested that it may further downgrade its GDP forecast at the Feb review from current 1.7% for 2023. The outlook for inflation is largely intact based on BOK’s assessment.”
Further upside in Gold? Economists at Standard Chartered believe that the yellow metal is likely to stabilize in the near term.
Overbought technicals and narrowing investor diversity
“We believe a consolidation could be imminent in the short term. We continue to see real yields as a headwind given the risk of a nominal rebound in US government bonds yields.”
“From a technical standpoint, a stretched RSI (reflecting overbought conditions) and narrowing investor diversity also point to a consolidation.”
See – Gold Price Forecast: XAU/USD continues to face correction risks – TDS
JPY fortunes are reversing. Economists at Deutsche Bank see USD/JPY moving down to 120 by end-2023.
The Yen comeback has further to go
“The JPY was one of the worst FX performers in 2021 and 2022, as a dovish BoJ skirted the rise in global yields, and the energy price spike took Japan’s trade deficit deep into negative territory. This is all changing now.”
“BoJ policy has already started to shift and more is likely in 2023 under new leadership, particularly with the inflation pulse quickly accelerating. The balance of payments should improve, with spot LNG prices halving, and nuclear reactors restarting to cut reliance on fossil fuels. There is also scope for repatriation flows given Japanese institutions’ large USD cash holdings.”
“Forward points are quite depressed, given the large gap between Fed and BoJ rates. But downside hedges still look worthwhile and will pay off as long as USD/JPY goes below 125 over the next year. We see a move to 120 by end-2023.”
- NY Fed Empire State Manufacturing Index dropped sharply in December.
- US Dollar (USD) holds steady and reacts little to the dismal macro data.
The headline General Business Conditions Index of the Federal Reserve Bank of New York's Empire State Manufacturing survey deteriorated further and plunged to -32.9 for January. The reading was well below consensus estimates pointing to a slight improvement to -4.5 from -11.2 in December
Market reaction
The US Dollar (USD), meanwhile, reacts little to the dismal macro data and flat-lines below the 102.00 mark, awaiting fresh catalyst before the next leg of a directional move.
- Annual Core CPI in Canada decelerates to 6.3% in December.
- USD/CAD holds around 1.3400 after Canadian inflation figures.
Inflation in Canada, as measured by the Consumer Price Index (CPI), decelerated from 6.8% in November to 6.3% in December, matching consensus estimates. On a monthly basis, the CPI fell by 0.6% as compared to the 0.1% decline expected and the previous month's flat reading.
Additionally, the Bank of Canada's Core CPI, which excludes volatile food and energy prices, fell 0.3% MoM and unexpectedly eased to 5.4% on a yearly basis.
Market reaction
The USD/CAD pair moves little in reaction to the key macro data and remains confined in a narrow trading band, around the 1.3400 round-figure mark.
- GBP/USD regains positive traction on Tuesday following the release of the UK jobs report.
- Stronger wage growth data might force the BoE to hike further and boosts the British Pound.
- A combination of factors continues to underpin the USD and keeps a lid on any further gains.
The GBP/USD pair attracts fresh buying near the 1.2170-1.2165 region on Tuesday and steadily climbs back closer to a one-month high touched the previous day. The pair, however, trims a part of its intraday gains and retreats below mid-1.2200s during the early North American session.
The British Pound strengthens a bit following the release of the UK monthly employment details, which, in turn, is seen pushing the GBP/USD pair higher. The UK Office for National Statistics (ONS) reported that Average Earnings, both including and excluding bonuses, climbed 6.4% in the September-to-November period. Furthermore, the number of people claiming unemployment-related benefits fell to 19.7K in December from 30.5K previous and the jobless rate held steady at 3.7%, close to its lowest level in almost 50 years. This could add pressure on the Bank of England to raise interest rates by another 50 bps at the next policy meeting and provides a modest lift to the domestic currency.
The US Dollar, on the other hand, struggles to preserve its modest intraday gains and offers additional support to the GBP/USD pair. That said, a combination of factors continues to act as a tailwind for the greenback and keeps a lid on any further gains for the major, at least for the time being. A goodish intraday pickup in the US Treasury bond yields, along with a generally weaker tone around the equity markets, should limit the downside for the safe-haven buck. This, in turn, makes it prudent to wait for strong follow-through buying beyond the 1.2300 mark before traders start positioning for an extension of the pair's recent appreciating move witnessed over the past one-and-half-week or so.
Next on tap is the release of the Empire State Manufacturing Index, which, along with the US bond yields and the broader risk sentiment, might influence the USD and provide some impetus to the GBP/USD pair. The focus will then shift to the latest UK consumer inflation figures due on Wednesday. Apart from this, the US Producer Price Index and monthly Retail Sales figures will be looked upon to determine the near-term trajectory for the GBP/USD pair.
Technical levels to watch
In the view of Markets Strategist at UOB Group Quek Ser Leang, further downside in USD/IDR is expected to meet decent support at 14,850 ahead of 14,700.
Key Quotes
“Our view for USD/IDR to ‘consolidate and trade between 15,450 and 15,800’ last week was wrong as it lurched lower and plunged to a low of 15,130 before extending its decline today.”
“The rapid and strong buildup in momentum suggests USD/IDR is likely to weaken further. Support levels are at 14,850 and 14,700. On the upside, 15,280 is a solid resistance but the key level is at 15,350.”
Gold price saw a surprise rally after breaking resistance levels of $1,900 and $1,878. Technically, bullish momentum is still intact. Nevertheless, a rising wedge formation signals a trend reversal, economists at ANZ Bank report.
Macro environment not supportive enough to sustain the current price level
“Momentum looks strong until price trades above $1,800 level. However, prices need to continue settling above $1,900 to maintain this momentum.”
“We believe the macro environment is not supportive enough to sustain the current price level.”
“We notice that there is a rising wedge formation in the daily technical chart. Should prices fall from current levels to the $1,870-1,900 range, we expect trend to reverse.”
“Below $1,800 gives a confirmation of price falling fall back to $1,730.”
Sterling is firmer. Economists at Scotiabank note that the outlook for the GBP is positive.
Short-term momentum signals are bullish
“The solid rebound in the Pound from sub-1.19 levels last week cast a positive look to the charts and suggests that the corrective losses from the mid-1.24 zone is complete. Spot needs to regain and hold 1.2290/00 in order to ignite more buying interest, however.”
“Short-term momentum signals are bullish, which support the positive outlook for the Pound and should help limit losses.”
Canada CPI Overview
Statistics Canada will release the consumer inflation figures for December later during the early North American session on Wednesday, at 13:30 GMT. The headline CPI is expected to decline sharply by 0.5% during the reported month as compared to a modest 0.1% rise in November. Furthermore, the yearly rate is expected to decelerate from 6.8% to 6.3% in December. That said, the Bank of Canada's Core CPI, which excludes volatile food and energy prices, is estimated to edge higher by 0.1% in December and rise to 6.1% on a yearly basis from 5.8% in November.
Analysts at CIBC offer a brief preview of the key macro data and explain: “Canadians finally caught a break from ever rising prices in December, albeit mainly at the pumps. A sharp decline in gasoline prices will be the main factor behind an expected 0.6% MoM drop in headline CPI, and a deceleration in the annual rate to 6.3%, from 6.8% in the prior month. Used car prices could also have seen a slight dip. However, there are unfortunately a number of areas in which prices are likely to have risen even further, including food and potentially air fares as demand recovered closer to pre-pandemic norms over the holiday season.”
How Could it Affect USD/CAD?
Ahead of the release, the USD/CAD pair flat-lines around the 1.3400 mark and is influenced by a combination of diverging forces. A modest US Dollar strength acts as a tailwind for the major. Crude oil prices, meanwhile, hit a fresh two-week high and underpin the commodity-linked Loonie, which, in turn, caps the upside for the pair.
A surprisingly stronger Canadian CPI print will be enough to provide a fresh lift to the domestic currency and prompt aggressive selling around the USD/CAD pair. Conversely, a weaker-than-expected report should allow the pair to capitalize on its recent bounce from the lowest level since November 25 touched last Friday.
Key Notes
• Canadian CPI Preview: Forecasts from six major banks, inflation steering into calmer waters
• USD/CAD: Weak Canadian inflation to put selling pressure on the Loonie – Commerzbank
• USD/CAD struggles for a firm intraday direction, stuck in a range around 1.3400 mark
About Canadian CPI
The Consumer Price Index (CPI) released by Statistics Canada is a measure of price movements by the comparison between the retail prices of a representative shopping basket of goods and services. The purchasing power of CAD is dragged down by inflation. The Bank of Canada aims at an inflation range (1%-3%). Generally speaking, a high reading is seen as anticipatory of a rate hike and is positive (or bullish) for the CAD.
EUR/USD holds around 1.08. Economists at Scotiabank expect the pair to enjoy further gains.
Hawkish ECB policymakers’ talk
“Policymakers are persisting with strong messaging on the policy outlook.”
“Minor EUR dips to the 1.08 area remain well-supported and price action appears to be carving out a short-term consolidation ahead of another push higher (bull flag/wedge pattern on the intraday chart).”
“Momentum remains bullish, limiting EUR losses and pointing to further gains.”
“Support is 1.0775/00. Resistance (bull trigger) is 1.0870/75.”
See: EUR/USD could reach the 1.10 level amid cyclical support– MUFG
- EUR/USD picks up some upside traction following the recent drop.
- Occasional bullish attempts need to surpass 1.0874.
EUR/USD now looks somewhat consolidative and attempts to leave behind the recent couple of sessions in the negative territory.
It seems the pair is moving into a consolidation phase ahead of the potential resumption of the uptrend. Against that, further north of the so far YTD high at 1.0874 (January 16) should appear the round level at 1.0900 in the relatively short-term horizon.
Furthermore, while above the short-term support line near 1.0580, extra gains should remain in store.
In the longer run, the constructive view remains unchanged while above the 200-day SMA at 1.0308.
EUR/USD daily chart
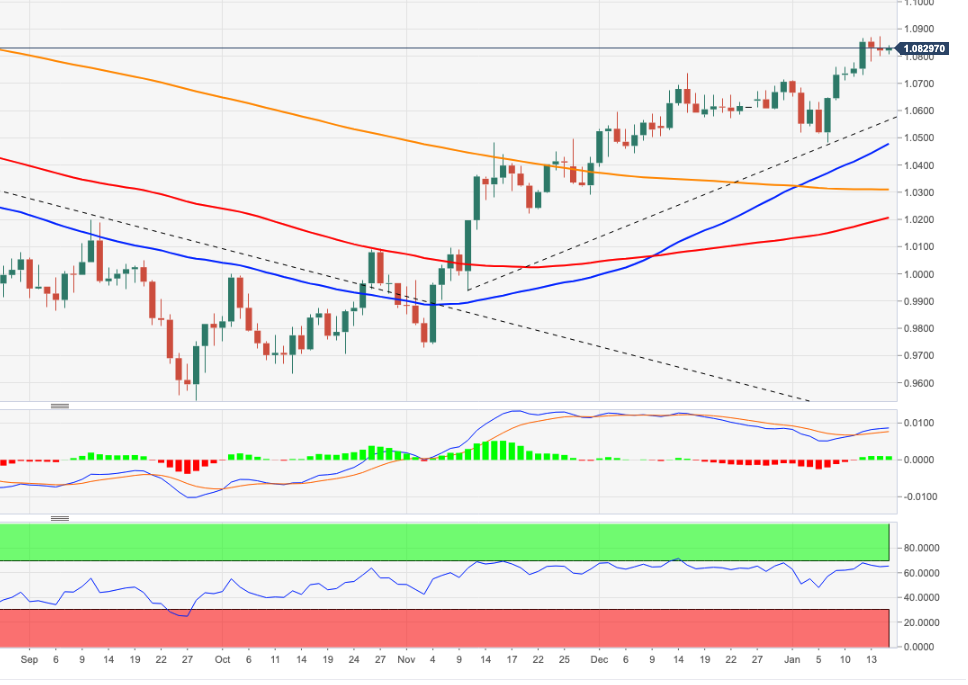
USD/IDR failed to overcome the resistance at previous bearish gap near 15810/15880 and evolved within a sideways consolidation.
Test of 14810 on the cards
“The pair is challenging the 200DMA and is approaching 14810, the 50% retracement from 2021. This is first layer of support. An initial bounce is expected however lower end of previous range near 15400 should provide resistance.
“Failure to reclaim 15400 would mean persistence in decline.”
“Below 14810, USD/IDR could unfold a deeper downtrend towards April 2021 high of 14600 and 14400.”
The loss of 4.3110 could put USD/MYR en route to a potential visit to the 4.3000 region in the short-term horizon, notes Markets Strategist at UOB Group Quek Ser Leang.
Key Quotes
“We highlighted last Monday (09 Jan, spot at 4.3730) that ‘downward momentum is beginning to build’ and we held the view that USD/MYR ‘is likely to trade with a downward bias toward last month’s low of 4.3570, possibly 4.3400’. The anticipated weakness exceeded our expectations as USD/MYR dropped sharply to a low of 4.3250.”
“Downward momentum has improved considerably and we continue to expect USD/MYR to weaken. There is a strong support at 4.3110, a break of this level could trigger a rapid drop to 4.3000, as low as 4.2750. Resistance is at 4.3300, but only a breach of 4.3500 would indicate the current weakness has stabilized.”
- AUD/USD drifts into negative territory for the second straight day amid firmer USD.
- Rebounding US bond yields and a softer risk tone benefits the safe-haven greenback.
- Bets for smaller Fed rate hikes could act as a headwind for the buck and limit losses.
The AUD/USD pair attracts fresh selling following an early uptick to the 0.6975-0.6980 area and turns lower for the second successive day on Tuesday. Spot prices retreat further from the highest level since August 17 touched on Monday and drop to the 0.6930 region during the mid-European session.
A combination of factors assists the US Dollar to build on the previous day's recovery from a seven-month low, which, in turn, is exerting some downward pressure on the AUD/USD pair. A goodish intraday pickup in the US Treasury bond yields unpins the greenback. Apart from this, the prevalent cautious mood benefits the safe-haven buck and weighs on the risk-sensitive Aussie.
Investors remain concerned about a deeper global economic downturn amid the worst yet COVID-19 outbreak in China and the protracted Russia-Ukraine war. The fears were fueled by Tuesday's release of the Chinese GDP report, which showed that growth decelerated from the third quarter's reading of 3.9% to 2.9% during the October-December period - marking one of the worst levels in nearly half a century.
This, to a larger extent, overshadows the improving trend in Chinese Retail Sales and Industrial Production data, though fails to boost investors' confidence. That said, growing acceptance that the Fed will soften its hawkish stance amid signs of easing inflationary pressure might keep a lid on the US bond yields and the USD. This, in turn, should lend some support to the AUD/USD pair.
Furthermore, rising odds for an additional interest rate hike by the Reserve Bank of Australia (RBA) in February should help limit the downside for the AUD/USD pair, at least for the time being. This makes it prudent to wait for strong follow-through selling before confirming that spot prices have topped out in the near term and positioning for a deeper corrective pullback.
Market participants now look to the US economic docket, featuring the Empire State Manufacturing Index. This, along with the US bond yields and the broader risk sentiment, will influence the USD price dynamics and provide some impetus to the AUD/USD pair. The focus will then shift to the US Producer Price Index and Retail Sales data, due for release on Wednesday.
Technical levels to watch
Thanks to its high beta, the Zloty should benefit from a stronger euro in 2023. However, the conflict with the EU and a hesitant central bank remain PLN-negative arguments pointing towards rising EUR/PLN rates in 2024, economists at Commerzbank report.
EUR/PLN to rise again towards 4.85 in 2024
“We forecast the Euro to appreciate further through the rest of 2023, but weaken once again during 2024. Given the Zloty’s high-beta relationship to the Euro, we see EUR/PLN drifting down to around 4.65 by the end of 2023 as inflation moderates globally, which will alter perceptions about Poland’s negative real interest rate.”
“In 2024, we forecast EUR/PLN to rise again towards 4.85 as inflation will likely remain stubbornly above target.”
“Inflation data now seem to support the doves and afford the central bank the luxury to continue with a negative real interest rate. But eventually, inflation may not moderate back to target easily, hence we see 2024 as a potential Zloty-negative period.”
“Another driver of volatility: the EC has stepped up its rule of law mechanism on Poland and Hungary, which demonstrates the broader risk of frequent EU disputes and delay of funding.”
- The index gives away part of Monday’s decent advance.
- Extra range bound around current levels appears favoured.
The auspicious start of the week for the greenback was short lived, as DXY sheds part of the recent gains on Tuesday.
So far, the continuation of the side-lined mood looks like the name of the game for the dollar, at least in the near term.
In case bears regain the upper hand, the loss of the January low at 101.98 (January 13) should put a potential deeper drop to the May 2022 low around 101.30 (May 30) back on the investors’ radar prior to the psychological 100.00 level. On the upside, there are no hurdles of note until the January high at 105.63 (January 6).
In the meantime, while below the 200-day SMA at 106.41 the outlook for the index should remain tilted to the negative side.
DXY daily chart
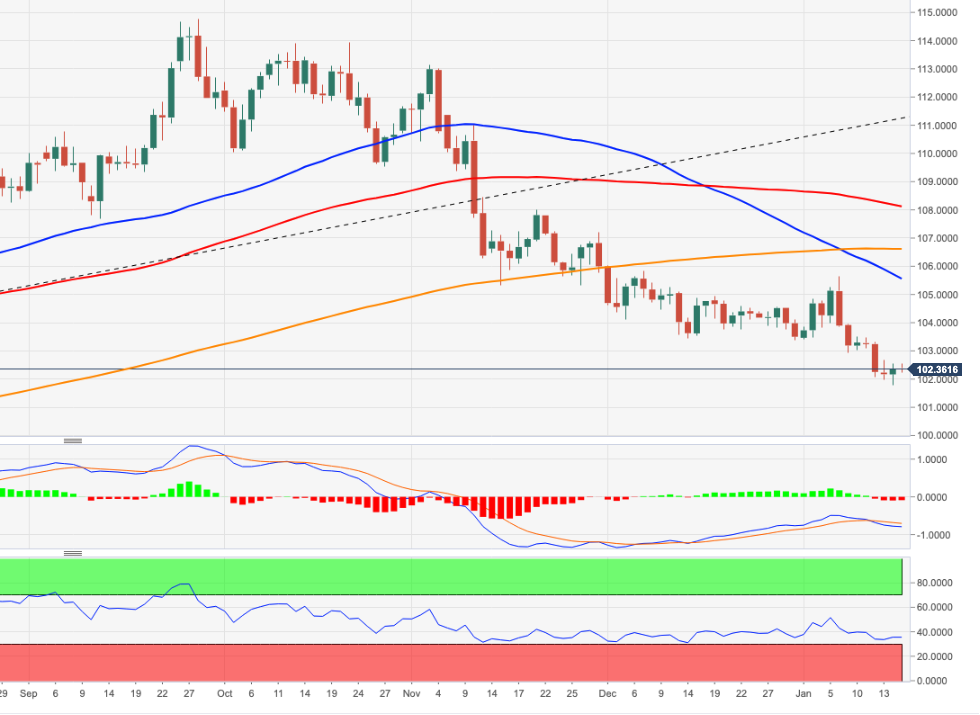
EUR/USD is approaching 1.0940, which is next potential hurdle. A break above here would open up next projections at 1.1040/1.1080, economists at Société Générale report.
Recent trough near 1.0480 could provide support
“The pair has re-established itself beyond the 200DMA in December and is approaching 1.0940, the 50% retracement from 2021. This is an interim resistance. An initial pullback is not ruled out however recent trough near 1.0480 could provide support.”
“Graphical level at 1.0220/1.0200 should now be an important level in case a deeper pullback materializes.”
“If EUR/USD overcomes the resistance near 1.0940, the rebound could persist towards next projections at 1.1040/1.1080.”
USD/CAD struggles for a firm direction stuck in a range around 1.34. Price action could remain rangebound, economists at Société Générale report.
Levels of 1.3000/1.2950 should be a significant support zone
“A clear direction is lacking as highlighted by crisscross moves around the 50DMA. The price action could remain rangebound roughly within limits of 1.3230 and 1.3660/1.3700. Reclaiming the upper end of this consolidation can lead to resumption in uptrend.”
“In case a deeper decline materializes, graphical levels of 1.3000/1.2950 should be a significant support zone.”
See – Canadian CPI Preview: Forecasts from six major banks, inflation steering into calmer waters
Euro Stoxx 600 cycliclas continue to outperform broader market pointing to continued EUR support, economists at MUFG Bank report.
Cyclical support for EUR
“The improving cyclical outlook after nearly six months of building pessimism, primarily related to energy concerns is lifting demand for EUR. The RSI points to the Euro Stoxx 600 as having entered overbought territory so the risk-reward balance is possibly beginning to shift. Still, from an FX perspective the outlook remains favourable. A correction from overbought levels in European equities is unlikely to trigger a large turn in FX.”
“With the ECB currently projecting inflation at 3.4% in 2024, a hawkish 50 bps hike on 2nd Feb could see the terminal rate move higher again. EUR/USD support would persist in such a scenario and could open up a move to the 1.1000 level.”
Markets Strategist at UOB Group Quek Ser Leang suggests USD/THB risks extra weakness in the short term.
Key Quotes
“We highlighted last Monday (09 Jan, spot at 33.48) that USD/THB ‘is likely to continue to weaken’. We indicated that ‘While a break of the support at 33.15 is likely, oversold conditions suggest a break of the next support at 32.80 is less likely this week’. Our view was not wrong as USD/THB dropped to a low of 32.85. Strong downward momentum continues to suggest USD/THB weakness.”
“That said, the 2022 low near 32.09 is likely out of reach for now (there is another support at 32.55). On the upside, the strong resistance at 33.25 is unlikely to come under threat.”
- EUR/JPY adds to Monday’s gains north of the 139.00 hurdle.
- Immediately to the upside now comes the 200-day SMA.
EUR/JPY advances for the second session in a row and extends the breakout of the 138.00 yardstick on Tuesday.
Last week’s pronounced pullback appears to have met quite solid support in the 138.00 neighbourhood for the time being. The subsequent rebound looks healthy and initially targets the key 200-day SMA, today at 140.70.
The outlook for EUR/JPY should remain negative while below the 200-day SMA.
EUR/JPY daily chart
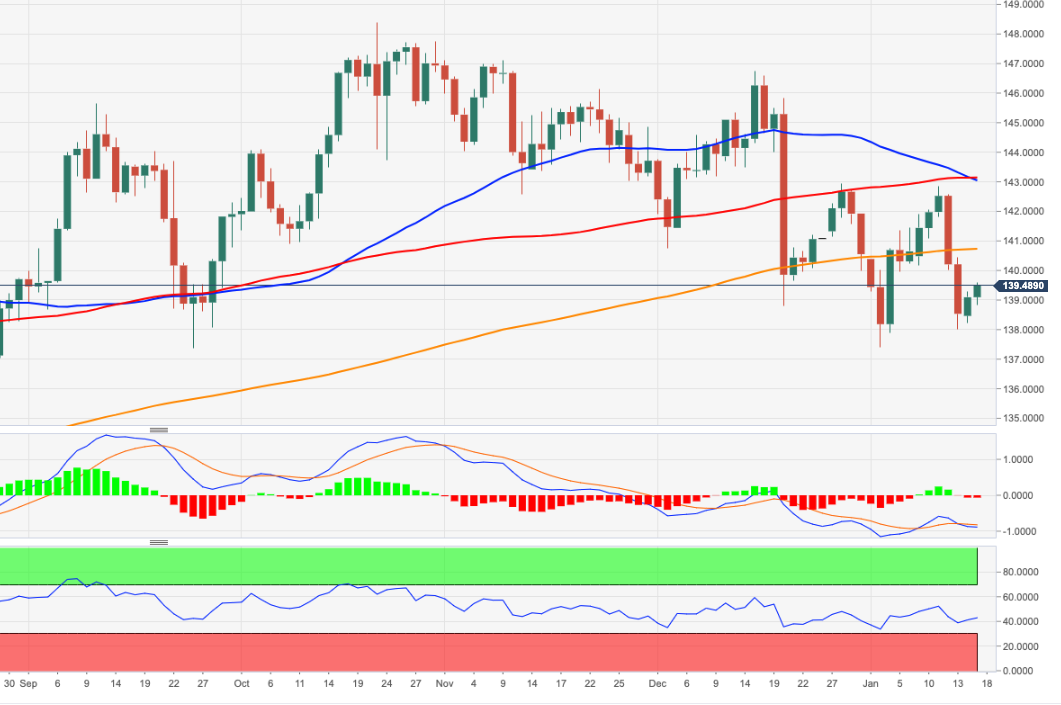
The Bank of Canada (BoC) looks set to face a hike/no-hike dilemma at next week’s policy meeting. Today’s CPI read will be key. Economists at ING expect USD/CAD to edge lower toward 1.31-1.33 barring a surprise golf by the BoC.
Inflation key for BoC January move
“Consensus expectations are centered around a deceleration in headline inflation from 6.8% to 6.4%, and from 5.0% to 4.9% in the core (median) rate. Any signs of resilience in inflation would likely see markets fully price in a 25 bps hike in January.”
“Below-consensus reads should support CAD short-dated bonds, but it seems hard that investors will completely rule out a hike next week.”
“The impact on CAD should be quite visible in both directions, although external forces should remain the key drivers on the Loonie.”
“Building USD weakness may favour a USD/CAD contraction to 1.31-1.33 in the coming weeks, although a surprise hold by the BoC is a clear upside risk for the pair.”
See – Canadian CPI Preview: Forecasts from six major banks, inflation steering into calmer waters
The market has already lowered its expectations for the February FOMC meeting and now only expects a 25 bps rate hike. Economists at Commerzbank note that the Dollar is unwanted.
Dollar-negative sentiment
“It might pay off to take a look at producer prices tomorrow or the PCE deflator and the labour cost index at the end of the month. Any publication that points more towards 25 than towards 50 bps on 1st February will be gratefully received by the market. On the other hand, the fact that the market has already lowered its expectations as regards the next rate step, means that most is already priced into the USD so that the effect of the data on the greenback is likely to be limited.”
“Over the course of the week the subject of the debt ceiling will probably increasingly become an issue. Even though the subject is only likely to become more burning in the spring, it might nonetheless ensure that in the current Dollar-negative environment the Dollar is denied more significant gains and that the upside pressure in EUR/USD will dominate for now.”
In an interview with WELT TV on Tuesday, Germany’s Economy Minister Robert Habeck said that “if there is a recession, it would possibly be only very short and not very deep.”
Further comments
“Want to get inflation below 5% by year's end.”
Ma be that we can avoid a recession.”
Market reaction
EUR/USD remains unresponsive to the German ZEW data and these above comments, changing hands at around 1.0815.
Following the release of the business sentiment surveys, Germany’s Zentrum für Europäische Wirtschaftsforschung (ZEW) said that “for the first time since February 2022, the indicator is thus back in positive territory.”
Additional takeaways
“The assessment of the economic situation in Germany has also improved further, but only slightly.”
“The more favorable situation on the energy markets and the german government’s energy price caps have contributed to this in particular.”
“Export conditions for the german economy are improving due to china’s lifting of covid-restrictions.“
“The earnings expectations of the export-oriented and energy-intensive sectors have gone up significantly.”
“The prospect that the inflation rate will continue to fall has brightened expectations for the consumer-related sectors.”
Related reads
- German ZEW Economic Sentiment Index rebounds to 16.9 in January vs. -15.5 expected
- Germany’s BDI: Economy expected to contract slightly in 2023
Chinese activity data for 4Q22 was much better than expected and supports the proposition that the 2023 Chinese growth story will support pro-cyclical currencies, economists at ING report.
China data supports 2023 FX trends
“FX markets have had a quiet start to the week – perhaps awaiting edicts from Mount Davos? However, Chinese data released overnight was material and very much supports this year's hottest trend that China's zero-Covid reversal will spark resurgent Chinese demand.”
“The Chinese data did not, however, trigger any follow-through buying of the Renminbi or Asian currencies in general. Rather than concluding that this story has already run its course in FX markets, we would prefer to see price action as merely quiet before the Chinese New Year starting next week, and the big event risk in early Asia tomorrow, which is the Bank of Japan (BoJ) meeting.”
The surpass of 6.7850 would be indicative that the likelihood of further weakness in USD/CNH appears mitigated, according to Economist Lee Sue Ann and Markets Strategist Quek Ser Leang at UOB Group.
Key Quotes
24-hour view: “We highlighted yesterday that USD ‘could dip below 6.7000 but a sustained decline below this level is still unlikely’. Our view was not wrong as USD dropped to 6.6982 before rebounding strongly to end the day at 6.7466 (+0.56%). Downward pressure has eased and the current price movements are likely part of a consolidation. In other words, USD is likely to trade in a range today, expected to be between 6.7250 and 6.7550.”
Next 1-3 weeks: “We have held a negative USD view for more than a week now. After USD fell sharply and rapidly, in our update from last Friday (13 Jan, spot at 6.7300), we highlighted that while USD is likely to weaken further, after such a large decline over a short period, the prospect of a sustained drop below 6.7000 is not high. Yesterday (16 Jan), USD dropped to 6.6982 before rebounding. Downward momentum is beginning to ease and a break of 6.7580 (no change in ‘strong resistance’ level) would indicate that the weakness in USD has stabilized.”
- Economic sentiment in Germany and the Eurozone unexpectedly turned positive in January.
- EUR/USD remains unimpressed by the upbeat ZEW surveys, keeping its range around 1.0815.
The German ZEW headline numbers showed that the Economic Sentiment Index returned to positive territory, arriving at 16.9 in January from -23.3 in December, beating the market expectation of -15.5.
Meanwhile, the Current Situation Index came in at -58.6 from -61.4 but missed the market expectation of -57.0
In the same period, the ZEW Economic Sentiment Index for the Eurozone rose to 16.7 from -23.6.
Market reaction
The EUR/USD pair is uninspired by the upbeat data, keeping its range near 1.0815, modestly flat on the day.
- USD/JPY edges higher on Tuesday, albeit lacks follow-through beyond the 129.00 mark.
- A combination of factors underpins the JPY and keeps a lid on any upside for the major.
- The downside seems cushioned amid a firmer USD and ahead of the BoJ on Wednesday.
The USD/JPY pair builds on the overnight bounce from its lowest level since late May and edges higher for the second successive day on Tuesday. Spot prices, however, retreat a few pips from the daily top and remain below the 129.00 mark through the first half of the European session.
The Japanese Yen continues to draw support from speculations that the Bank of Japan (BoJ) will tweak the yield control policy again at its meeting on Wednesday. Apart from this, a softer risk tone further benefits the JPY's relative safe-haven status and contributes to capping the upside for the USD/JPY pair. The downside, however, remains cushioned, at least for the time being, amid some follow-through US Dollar buying.
A goodish intraday pickup in the US Treasury bond yields assists the USD to build on the previous day's recovery from a seven-month low, which, in turn, lends some support to the USD/JPY pair. That said, the prospects for a less aggressive policy tightening by the Fed could act as a headwind for the US bond yields and the greenback. Investors seem convinced that the Fed will soften its hawkish stance amid easing inflationary pressures.
In fact, the markets are currently pricing in a greater chance of a smaller 25 bps Fed rate hike move in February. The bets were lifted by the US consumer inflation figures released last week, which showed that the headline CPI fell for the first time in more than 2-1/2 years in December. This, in turn, warrants some caution before placing aggressive bullish bets around the USD/JPY pair and positioning for any further gains.
Traders might also prefer to wait on the sidelines ahead of the highly-anticipated BoJ monetary policy decision. Heading into the key central bank event risk, the release of the Empire State Manufacturing Index, due later during the early North American session, along with the US bond yields, could drive the USD demand. Apart from this, the broader risk sentiment might produce short-term opportunities around the USD/JPY pair.
Technical levels to watch
Following the inflation data for December it is going to get tight for the Riksbank when it comes to sticking to its current rate path, according to economists at Commerzbank.
It is going to get tight for the Riksbank and SEK
“Inflation rate rose to a staggering 10.2% and was thus well above market expectations. The core rate excluding energy too surprised on the upside with 8.4%, albeit not as clearly. It nonetheless shows that price pressure exists on a broad basis. That means that the Riksbank will probably have to adjust its inflation projections to the upside again.”
“The market certainly sees the chance that the Riksbank might become more hawkish and after November is partially pricing in a further 50 bps to then 3% for February. If the Riksbank disappoints these expectations, SEK is likely to ease again rapidly, as at this stage the Riksbank is likely to be dropping behind the curve from the market’s point of view and will come across as hesitant in its fight against inflation compared with the ECB.”
Haitham Al Ghais, the Secretary-General of the Organization of the Petroleum Exporting Countries (OPEC), said on Tuesday that the cartel “sees oil demand rising in China by 500k “barrels per day) bpd this year.”
Additional quotes
“OPEC are cautiously optimistic about global economy.”
“OPEC are waiting to see what happens after China's new year holiday.”
“China's larger oil import quotas are a good sign.”
“OPEC are also eyeing the potential for a slowdown in Europe, US.”
“OPEC has to balance a growing Asia against a slowing West.”
“OPEC+ will do whatever it takes to keep the oil market stable.”
“OPEC now has greater spare production capacity.”
Market reaction
Amidst mixed comments from the OPEC Chief, the WTI price is reversing below the $80 mark, currently trading at $79.76. The US oil is still up 0.80% on the day.
Siegfried Russwurm, President of Germany's BDI industry association, said on Tuesday that the economy is expected to see a slight contraction this year.
Key takeaways
“The German economy is expected to contract by 0.3% this year.”
“Mild recessionary tendencies will predominate at the start of the year, see an upward trend from spring.”
“See real 1% increase in german exports of goods and services in 2023, lagging behind global trade which is expected to grow by around 1.5%.”
Market reaction
EUR/USD continues to move back and forth in a defined range between 1.0810 and 1.0840 so far this Tuesday, awaiting Germany’s ZEW survey for fresh impetus.
US Dollar looks to stabilize amid cautious markets. DXY is set to trade within a 102.00-102.50 range today, economists at ING report.
There are no Fed speakers during European hours today
“The Dollar itself is steady. The US data calendar only really kicks off with what may be a soft December US retail sales release tomorrow. And there are no Fed speakers during European hours today.”
“Some further DXY consolidation looks likely in a 102.00-102.50 range today. A downside break could emerge in Asia tomorrow, were the BoJ to again tweak its 10-year JGB yield target.”
In response to the US’ "Inflation Reduction Act" (IRA), European Commissioner for Economy Paolo Gentiloni said on Tuesday that “we have to strengthen our competitiveness by streamlining state aid rules.”
Additional quotes
“We have a very good US-EU partnership.”
“We have to support our competitiveness, not start a subsidy war with the US.”
Related reads
- EUR/USD turns positive near 1.0830 ahead of key data
- ECB’s Centeno: Q4 growth in Europe will be mostly likely still positive
Further downside could force USD/JPY to retest the 126.35 level in the near term, comment Economist Lee Sue Ann and Markets Strategist Quek Ser Leang at UOB Group.
Key Quotes
24-hour view: “We highlighted yesterday that ‘downward momentum appears to be slowing and this coupled with deeply oversold conditions suggests USD is unlikely to weaken much further’ and we expected USD to ‘trade between 127.40 and 129.25’. USD subsequently dipped to 127.21, rebounded to a high of 128.86 before closing at 128.54 (+0.52%). We view the price actions as part of a consolidation and expect USD to trade within a range of 127.85/129.05 today.”
Next 1-3 weeks: “There is not much to add to our update from yesterday (16 Jan, spot at 128.00). As highlighted, the risk for USD remains on the downside, and the next level to watch is 126.35. On the upside, a breach of 130.05 (no change in ‘strong resistance’ level) would indicate that USD is not weakening further.”
Commenting on the UK’s labor market statistics on Tuesday, British Finance Minister Jeremy Hunt said that “we must not do anything that risks permanently embedding high prices into our economy, which will only prolong the pain for everyone.”
GBP/USD is rising back above 1.2200, underpinned by the beat in the UK earning growth, which raised the probability of a 50 basis points (bps) Bank of England (BoE) rate hike to 74%. The UK Average Hourly Earnings rises to 6.4% in November vs 6.3% expectations.
Attention now turns toward Wednesday’s UK Consumer Price Index data due at 07:00 GMT for fresh cues on the BoE’s policy path for 2023.
- EUR/USD regains some poise near the 1.0830 region.
- German 10-year yields look to extend the recovery near 2.20%.
- Economic Sentiment in Germany and EMU come next in the docket.
The European currency attempts to leave behind the recent weakness and motivates EUR/USD to advance modestly and revisit the 1.0830 region on Tuesday.
EUR/USD remains well supported around 1.0800
EUR/USD so far sets aside two consecutive daily pullbacks against the backdrop of the improvement in the risk complex, especially after auspicious results from Chinese fundamentals released during early trade.
By the same token, the dollar sees its recent recovery somewhat curtailed and forces the USD Index (DXY) to surrender some of its recent gains amidst the resumption of the normal activity in the US markets.
Data wise in the region, all the attention is expected to be on the Economic Sentiment print of both Germany and the Euroland ahead of the ECOFIN Meeting. Earlier in the session, final inflation figures in Germany saw the CPI contract 0.8% MoM in December and rise 8.6% over the last twelve months.
Across the Atlantic, the NY Empire State Index will be in the limelight seconded by short-term bill auctions and the speech by FOMC’s J.Williams.
What to look for around EUR
EUR/USD appears so far well underpinned by the 1.0800 neighbourhood amidst some renewed weakness and inconclusive trends in the risk appetite.
Price action around the European currency should continue to closely follow dollar dynamics, as well as the impact of the energy crisis on the euro bloc and the Fed-ECB divergence.
Back to the euro area, the increasing speculation of a potential recession in the bloc emerges as an important domestic headwind facing the euro in the short-term horizon.
Key events in the euro area this week: ECOFIN Meeting, Germany Final Inflation Rate / ZEW Economic Sentiment, EMU ZEW Economic Sentiment, Italy Final Inflation Rate (Tuesday) - EMU New Car Registrations / Final Inflation Rate (Wednesday) – ECB Lagarde, ECB Accounts (Thursday) - ECB Lagarde (Friday).
Eminent issues on the back boiler: Continuation of the ECB hiking cycle amidst diminishing probability of a recession in the region. Impact of the war in Ukraine and the protracted energy crisis on the bloc’s growth prospects and inflation outlook. Risks of inflation becoming entrenched.
EUR/USD levels to watch
So far, the pair is gaining 0.09% at 1.0830 and faces the next up barrier at 1.0874 (monthly high January 16) followed by 1.0900 (round level) and finally 1.0936 (weekly high April 21 2022). On the flip side, the breakdown of 1.0481 (monthly low January 6) would target 1.0476 (55-day SMA) en route to 1.0443 (weekly low December 7).
Today's focus will be on Canadian Consumer Price Index (CPI) report. Weak figures could weigh on the Loonie, but losses should be limited, economists at Commerzbank report.
The final piece of the jigsaw?
“Today’s Canadian inflation data for December might form the last piece of the jigsaw in the Bank of Canada’s (BoC) decision next week as to if it will hike its key rate, and if so by how much. The market largely expects 25 bps, but also sees a chance of unchanged key rates.”
“If the inflation data is surprisingly weak today, the market might further lower its rate hike expectations which could put selling pressure on the Canadian dollar against the USD. On the other hand, the US dollar is not in particular demand at present either so the CAD losses should be limited.”
See – Canadian CPI Preview: Forecasts from six major banks, inflation steering into calmer waters
FX option expiries for Jan 17 NY cut at 10:00 Eastern Time, via DTCC, can be found below.
- USD/JPY: USD amounts
- 125.00 651m
- 127.85 325m
- 130.22 570m
- USD/CHF: USD amounts
- 0.9900 600m
- AUD/USD: AUD amounts
- 0.6800 2b
- 0.7210 1.4b
- USD/CAD: USD amounts
- 1.3335 300m
European Central Bank (ECB) board member and Bank of Portugal Governor Mario Centeno said on Tuesday, “the fourth quarter growth in Europe will be most likely still positive.”
Additional quotes
“Economy has been surprising us quarter after quarter.”
“Maybe we'll also be surprised in the first half of this year.”
“There are no signs of second-round effects in Europe.”
Market reaction
EUR/USD is trading in a narrow range at around 1.0830, unfazed by the above comments. The spot is adding 0.11% on the day.
Today's UK employment data saw EUR/GBP drop 15 pips – a move that makes sense, in the view of economists at ING.
The longer the BoE stays in hawkish mode, the more support Sterling can get
“We describe today's release of November jobs figures as ‘another month of relative resilience in the UK jobs market’. Wage growth was a little higher than expected and supports the latest findings from the Bank Of England's Decision Maker Panel survey.”
“EUR/GBP is trading close to 0.89 because of December's hawkish ECB shift. The longer the BoE stays in hawkish mode, the more support Sterling can get.”
“Expect EUR/GBP to trade on the soft side of an 0.8850-0.8900 range today, with tomorrow's UK CPI release proving the next major input.”
EUR/USD trades sideways around 1.0830. But the near-term macro trends remain supportive, economists at ING note.
Continuing fall in European gas prices
“China's demand trends are supportive of pro-cyclical currencies like the Euro. That better outlook for the Eurozone could appear in today's German January ZEW investor survey, where the expectations component is expected to have improved from -23 to -15.”
“The continuing fall in European natural gas remains a positive development for the Eurozone trade balance and is Euro supportive.”
“EUR/USD may consolidate in a 1.0780-1.0870 range today – but the near-term macro trends remain supportive.”
Statistics Canada will release December Consumer Price Index (CPI) data on Tuesday, January 17 at 13:30 and as we get closer to the release time, here are the forecasts by the economists and researchers of six major banks regarding the upcoming Canadian inflation data.
Headline is expected at 6.3% year-on-year vs. 6.8% in November. If so, it would continue the deceleration from the 8.1% peak in June to the lowest since February 2021.
TDS
“We look for headline CPI to slow to 6.4% YoY in December as a sharp drop in energy prices drives a 0.5% MoM decline. Clothing will also weigh on the headline print, while food prices, rents, and mortgage interest provide a source of strength. Core inflation measures will also remain in the spotlight with CPI-trim/median projected to edge lower to 5.1% from record highs.”
RBC Economics
“We expect headline CPI growth slowed to 6.4% in December from 6.8% in November.”
NBF
“Plunging gasoline prices, combined with expected weakness in the goods sector, should have weighed on the headline figure, offsetting sustained price pressure in the services segment and translating into a 0.7% monthly decline for the headline index. If we’re right, the 12-month rate should drop six ticks to 6.2%. We expect the moderation in core measures to have continued on MoM basis, something which should translate into a decline in the 12-month-rate for both the CPI-Trim (from 5.3% to 5.2%) and the CPI-Median (from 5.0% to 4.8%).”
Citibank
“We expect a 0.6% MoM decline in (non-seasonally adjusted) headline CPI in December, which would take the YoY reading to 6.3% after having stabilized close to 7% since August. Falling retail gas prices will weigh substantially on CPI in December with usual seasonal weakness in components like apparel prices and recreation. Core measures have stabilizing around 5% annualized in recent months and while we see some moderate downside risks in December (falling around 0.1 0.2pp), this still elevated level of core inflation is unlikely to change the outcome of a 25 bps hike by the BoC.”
CIBC
“Canadians finally caught a break from ever rising prices in December, albeit mainly at the pumps. A sharp decline in gasoline prices will be the main factor behind an expected 0.6% MoM drop in headline CPI, and a deceleration in the annual rate to 6.3%, from 6.8% in the prior month. Used car prices could also have seen a slight dip. However, there are unfortunately a number of areas in which prices are likely to have risen even further, including food and potentially air fares as demand recovered closer to pre-pandemic norms over the holiday season.”
Wells Fargo
“We expect headline CPI fell to 6.5% YoY in December from 6.8% in November, given some softening in energy prices. Seeing as though inflation is on a downward path, we believe a peak will soon be in sight for BoC policy interest rates, although not quite yet, as inflation is still well above the central bank's inflation target. In our view, the BoC will be paying close attention to the path of underlying inflation pressures to determine its monetary tightening path. We have seen some encouraging signs that underlying inflation could soon begin to ease, as shorter supplier delivery times show improvement in supply chains, while lower commodity prices should see CPI trend lower too. We expect the BpC to raise its policy rate 25 bps at its January meeting to a terminal rate of 4.50%. As long as core inflation begins receding noticeably in the months ahead, we anticipate the BoC's January rate hike to be the last of the current cycle.”
The Euro had a great second week of the year. Economists at Société Générale expect EUR/USD to test the 1.10 level on disappointing US data this week.
Retracements likely to be viewed as a buying opportunity
“Both EUR/USD and EUR/GBP are expensive based on 2y2y rate differentials but retracements are likely to be viewed as a buying opportunity.”
“The less downbeat view on the European economy (no contraction in 4Q GDP?), the inflows into stocks, the prospect of a narrowing Fed/ECB rate differential and improving demand from China all bode well for the single currency over the medium term.”
“Disappointing US retail sales and soft PPI on Wednesday would further cement the case for 25 bps by the Fed next month and guide EUR/USD closer to the next resistance levels at 1.0940 and 1.10.”
In the opinion of Economist Lee Sue Ann and Markets Strategist Quek Ser Leang at UOB Group, extra gains in NZD/USD appears on the cards in the near term.
Key Quotes
24-hour view: “We highlighted yesterday that NZD ‘is likely to trade sideways between 0.6340 and 0.6415’. However, NZD rose to a high of 0.6426, dropped to 0.6363 before closing little changed at 0.6382 (-0.05%). Upward momentum has improved a tad and NZD could test 0.6430 first before the risk of a more sustained pullback increases. The major resistance at 0.6470 is not expected to come into view. Support is at 0.6370, followed by 0.6350.”
Next 1-3 weeks: “Last Friday (13 Jan, spot at 0.6390), we highlighted that while the bias for NZD is on the upside, lackluster momentum suggests the chance of a break of the major resistance at 0.6475 is not high. Yesterday, NZD rose to a high of 0.6426 before pulling back. There is no significant improvement in momentum and we continue to hold the same view. Overall, only a breach of 0.6325 (‘strong support’ level previously at 0.6305) would indicate that the upward bias has faded.”
- GBP/USD takes offers to refresh intraday low, extends week-start pullback from one-month high.
- UK Claimant Count Change eased to 19.7K in December, Unemployment Rate remains unchanged for three months to November.
- US Dollar’s failure to track rebound in yields propel Cable prices despite negatives surrounding labor strike, inflation fears.
- Second-tier US data, risk catalysts can entertain traders ahead of the key Wednesday.
GBP/USD prints a two-day losing streak as it renews its intraday low after the UK’s employment data during early Tuesday. That said, the Cable pair slid to 1.2169 before recovering to 1.2190 by the press time.
The UK’s Office for National Statistics (ONS) released its monthly jobs report early Tuesday. Among the key data, the Claimant Count Change for December and the Unemployment Rate for three months to November gained major attention. That said, the Claimant Count Change came in as 19.7K versus 30.5K while the Unemployment Rate remained unchanged at 3.7%.
Also read: UK ILO Unemployment Rate steadies at 3.7% in November vs. 3.7% expected
Other than the mixed data, pessimism surrounding the UK’s labor strikes and downbeat testimony from Bank of England (BoE) Governor Andrew Bailey also weigh on the GBP/USD price. BoE’s Bailey testified against the Treasury Select Committee in London while stating that inflation looked set to fall markedly this year. BoE’s Bailey, however, cited growth fears emanating from workers’ strikes.
Elsewhere, the market’s skepticism about Chinese growth numbers joins the lack of major data/events, as well as fears of recession, to weigh on the risk profile. The same underpins the US Treasury yields’ rebound, as well as weighs on the S&P 500 Futures as it retreats from the one-month high. However, the US Dollar Index (DXY) fades the previous day’s bounce off the seven-month low.
“Two-thirds of private and public sector chief economists surveyed by the WEF expect a global recession this year, with some 18% considering it ‘extremely likely’ - more than twice as many as in the previous survey conducted in September 2022,” reported Reuters.
Looking ahead, NY Empire State Manufacturing Index for January, expected -4.5 versus -11.2 prior, may entertain intraday traders during the return of full markets. However, major attention will be given to Wednesday’s UK Consumer Price Index (CPI) and the US Retail Sales for December.
Also read: UK Inflation Preview: Another soft CPI to hit Pound Sterling, here’s why
Technical analysis
Although the GBP/USD pair’s ability to stay beyond the 100-day EMA level surrounding 1.1940 keeps buyers hopeful, together with the bullish MACD signals and firmer RSI, the upside momentum remains elusive unless crossing a six-week-old horizontal resistance near 1.2345.
- The Unemployment Rate in the UK arrived at 3.7% in November.
- UK Claimant Count Change came in at 19.7K in December.
- The UK wages excluding bonuses rose by 6.4% YoY in November vs. 6.3% expected.
According to the latest data released by the Office for National Statistics (ONS) on Tuesday, the UK’s ILO Unemployment Rate remained unchanged at 3.7% in November vs. the 3.7% expected while the claimant count change showed a mild decrease in the reported month.
The number of people claiming jobless benefits rose by 19.7K in December when compared to 30.5K booked previously.
The UK’s average weekly earnings, excluding bonuses, arrived at 6.4% 3Mo/YoY in November versus 6.1% last and 6.3% expected while the gauge including bonuses came in at 6.4% 3Mo/YoY in November versus 6.1% previous and 6.1% expected.
Key points (via ONS)
The number of vacancies in October to December 2022 was 1,161,000, a decrease of 75,000 from July to September 2022. Despite six consecutive quarterly falls, the number of vacancies remains at historically high levels.
UK Payrolls change 28k in December vs. 107k prior
GBP/USD reaction
GBP/USD picked up bids on mixed UK employment data, rising back to 1.2200, as of writing.
About UK jobs
The UK Average Earnings released by the Office for National Statistics (ONS) is a key short-term indicator of how levels of pay are changing within the UK economy. Generally speaking, positive earnings growth anticipates positive (or bullish) for the GBP, whereas a low reading is seen as negative (or bearish).
Gold price remains depressed for the second successive day. But bulls are not out whilst above $1,900, FXStreet’s Dhwani Mehta reports.
Gold bulls must defend the 21-SMA at $1,906 to resume the uptrend
“Should Gold buyers regain control, the price could head back toward the $1,920 round figure, above which the multi-month high will be on tap once again.”
“A four-hourly candlestick closing below the bullish 21-Simple Moving Average (SMA) at $1,906 could offer additional legs to the ongoing correction. Gold sellers will then aim for the $1,900 threshold. A fresh drop toward the upward-sloping 50SMA at $1,882 will be on the cards on a sustained break below the latter.”
See – Gold Price Forecast: XAU/USD to see substantial selling flow on a break below $1,865 – TDS
- Gold price remains depressed for the second successive day amid a modest US Dollar strength.
- A combination of factors should help limit any meaningful pullback from a multi-month peak.
- Bets for smaller Fed rate hikes could lend support amid the risk of a potential global recession.
Gold price edges lower for the second successive day on Tuesday and moves further away from its highest level since April, around the $1,929 region touched the previous day. The XAU/USD remains depressed heaving into the European session, though manages to hold its neck above the $1,900 round-figure mark.
Modest US Dollar strength weighs on Gold price
The US Dollar (USD) is seen building on the overnight bounce from a seven-month low and gaining follow-through traction amid a modest uptick in the US Treasury bond yields. This turns out to be a key factor weighing on the US Dollar-denominated commodities, including Gold. That said, bets for a less aggressive policy tightening by the Federal Reserve (Fed) act as a headwind for the Greenback.
Bets for smaller rate hikes by Federal Reserve to limit losses
Investors seem convinced that the Fed will soften its hawkish stance in the wake of signs of easing inflationary pressures and the risk of a potential recession. Moreover, several members of the Federal Open Market Committee (FOMC) backed the case for smaller rate hikes and lifted bets for a 25 bps lift-off in February. This, in turn, should continue to lend some support to the non-yielding Gold price.
Recession fears could further lend support to Gold price
Furthermore, a softer risk tone might further contribute to limiting any meaningful downside for the safe-haven XAU/USD, at least for the time being. The market sentiment remains fragile amid worries about headwinds stemming from the worst yet COVID-19 outbreak in China. Adding to this, the protracted Russia-Ukraine war has been fueling concerns about a deeper global economic downturn.
Slightly better Chinese macro data fails to provide impetus
This, to a larger extent, overshadows better-than-expected Chinese Gross Domestic Product (GDP) print, which showed that the economy grew at an annualized rate of 2.9% in the fourth quarter. Furthermore, improving trends in Chinese Retail Sales and Industrial Production fueled optimism over a recovery in the world's second-largest economy. This, however, fails to boost investors' confidence.
Corrective slide might still be seen as buying opportunity
The aforementioned fundamental backdrop suggests that the path of least resistance for the Gold price is to the upside. Hence, any corrective pullback might be seen as a buying opportunity and is more likely to remain limited. Market participants now look to the release of the Empire State Manufacturing Index from the United States (US) for some impetus later during the early North American session.
Gold price technical outlook
From a technical perspective, the $1,900 mark could act as immediate support. Any further decline, however, is likely to attract fresh buyers near the $1,885-$1,880 region. The latter should act as a strong base for the Gold price, which if broken decisively might prompt some technical selling and pave the way for a deeper corrective decline. On the flip side, the multi-month high, around the $1,929 zone, now seems to act as an immediate hurdle. Some follow-through buying has the potential to lift the XAU/USD further towards the next relevant resistance near the $1,948-$1,950 area.
Key levels to watch
Here is what you need to know on Tuesday, January 17:
The US Dollar is building on the previous recovery this Tuesday, as risk sentiment remains tentative following the release of China’s growth numbers. China’s Q4 GDP topped forecasts but expanded at the second-slowest pace since the 1970s. China’s GDP expanded by 2.9% in Q4 YoY, official data released by the National Bureau of Statistics (NBS) showed on Tuesday, above the 1.8% consensus forecasts and slowing from the 3.9% pace in the third quarter. China’s economy grew by 3.0% YoY in 2022. China’s December Retail Sales YoY, dropped 1.8% vs. -7.8% expected and -5.9% previous while the country’s Industrial Production came in at 1.3% YoY vs. 0.5% estimated and 2.2% prior.
Investors are digesting the Chinese data, turning anxious ahead of the critical Bank of Japan (BoJ) policy decision due on Wednesday. Meanwhile, the US Treasury statement that Treasury Secretary Janet Yellen will set her first face-to-face meeting with Chinese Vice Premier Liu He on January 18 in Zurich also keeps markets unnerved. The Asian stocks are a mixed bag, undermined by losses in Chinese stocks while the Japanese benchmark index, the Nikkei 225, sees a relief rally ahead of the BoJ decision. The US S&P 500 futures are down 0.11% on the day.
Across the G10 FX space, the USD/JPY pair keeps its corrective upside intact at around 129.00 amidst the BoJ’s continued efforts to defend its yields policy. The BoJ offered to buy JGBs once again earlier in the Asian session.
AUD/USD and NZD/USD are holding onto the recovery gains amidst upbeat Chinese economic data and ahead of the scheduled US-China talks. USD/CAD is flirting with lows below 1.3400, as the Canadian Dollar is capitalizing on a 1% rally in the WTI price. The US oil is nearing the $80 mark amid an encouraging demand outlook for 2023.
Following Friday’s negative price action, EUR/USD renewed the best levels in nine months at 1.0874 early Monday before retreating to near 1.0850.
GBP/USD is trading sideways in a narrow range of around 1.2200, awaiting the UK employment data for a fresh direction. “The UK ILO Unemployment Rate is likely to remain intact at 3.7% for the three months ending in November. It’s worth noting that the Claimant Count Change figures came in as 30.5K in November with the Claimant Count Rate of 3.9% during the stated period,” FXStreet Analyst Anil Panchal explains. The UK wages data will also hold the key ahead of Wednesday’s inflation data.
EUR/USD remains supported above 1.0800, despite a minor correction in the US Dollar and positive US Treasury bond yields across the curve. Hawkish commentary from the European Central Bank officials continues to underpin the Euro. In a Financial Times interview early Tuesday, ECB Chief Economist Philip Lane said that “interest rates do have to be higher than they are now.”
Gold price is holding lower ground just above the $1,900 threshold but the downside appears capped amid dovish Fed rate hike expectations.
Bitcoin is back above the $21,000 level, reversing losses so far this Tuesday while Ethereum stays in a familiar range around the $1,550 mark.
- USD/CHF takes offers to reverse the week-start rebound.
- DXY retreats despite firmer Treasury bond yields, sour sentiment as full markets return.
- Updates from Davos can entertain traders ahead of US Retail Sales.
USD/CHF holds lower ground near the intraday bottom of 0.9243 as European traders brace for an active Tuesday, mainly due to the return of the US market players after a long weekend. Adding strength to the pair’s pullback moves could be the mixed sentiment in the market, which in turn probes the US dollar’s rebound from a multi-month low.
That said, the market’s skepticism about Chinese growth numbers joins the lack of major data/events, as well as fears of recession, to weigh on the risk profile. The same underpins the US Treasury yields’ rebound, as well as weighs on the S&P 500 Futures as it retreats from the one-month high.
“Two-thirds of private and public sector chief economists surveyed by the WEF expect a global recession this year, with some 18% considering it ‘extremely likely’ - more than twice as many as in the previous survey conducted in September 2022,” reported Reuters.
On the same line, China reported upbeat prints of the fourth quarter (Q4) Gross Domestic Product (GDP), as well as Industrial Production and Retail Sales for December. However, the National Bureau of Statistics (NBS) from Beijing mentioned that the foundation for economic recovery is not solid yet, which in turn weighed on the risk profile afterward.
Alternatively, receding fears of the Fed’s monetary policy contraction, especially after the recently mixed US data, allow traders to remain hopeful ahead of this week’s key data, namely US Retail Sales for December, expected 0.1% YoY versus -0.6% prior.
Ahead of that, NY Empire State Manufacturing Index for January, expected -4.5 versus -11.2 prior, may entertain traders while updates from Davos could offer additional hints to the USD/CHF pair traders.
Technical analysis
Despite the latest weakness, the USD/CHF pair is yet to defy the previous day’s bullish signals, flashed via the Doji candlestick on the Daily formation, which in turn keeps the pair buyers hopeful of poking a one-week-old resistance line near 0.9320 by the press time. Alternatively, Monday’s low of 0.9218 puts a floor under short-term declines of the pair.
A convincing move above the 1.2330 level in GBP/USD looks unlikely for the time being, suggest Economist Lee Sue Ann and Markets Strategist Quek Ser Leang at UOB Group.
Key Quotes
24-hour view: “We expected GBP to edge higher yesterday but we held the view that ‘it is unlikely to break 1.2270’. However, GBP rose to 1.2288 before pulling back sharply to close at 1.2196 (-0.31%). There is hardly any improvement in upward momentum and GBP is unlikely to advance further. Today, GBP is more likely to trade in a range between 1.2160 and 1.2260.”
Next 1-3 weeks: “We have held a positive GBP view for more than a week now. In our most recent narrative from last Friday (13 Jan, spot at 1.2215), we indicated that GBP ‘must break 1.2270 these 1-2 days or the prospect of further GBP strength would diminish quickly’. While GBP broke above 1.2270 yesterday, it fell quickly from a high of 1.2288. Upward momentum has barely improved and while there is room for GBP to advance further, the likelihood of a sustained rise above 1.2330 is not high for now.”
- GBP/JPY is struggling to sustain above 157.00 as UK wage growth might trigger inflation projections.
- The Japanese Yen is gaining strength despite rising uncertainty ahead of the Bank of Japan policy.
- A shortfall of labor in the UK economy is creating troubles for the Bank of England policymakers.
- GBP/JPY is demonstrating an Inverted Flag formation which might result in further weakness in the cross.
GBP/JPY is struggling to shift its business above the immediate resistance of 157.00 in the early European session. The cross is facing barricades in escalating its recovery further amid rising chances that the Bank of England (BOE) will face stiff hurdles in achieving price stability. The Pound Sterling is expected to remain on tenterhooks as investors are waiting for the release of the United Kingdom Employment data, which is scheduled for Tuesday.
Meanwhile, the Japanese Yen is gaining strength despite rising uncertainty over the release of the first monetary policy by the Bank of Japan (BoJ) of CY2023. What has escalated curiosity among the market participants is that the Bank of Japan might call for an exit from its decade-long ultra-loose monetary policy. Considering the subdued performance of the GBP/USD pair, the GBP/JPY might display some volatility ahead.
Soaring wage inflation a major trouble for Bank of England policymakers
The United Kingdom's economy has been through turbulent times in CY2022 due to political instability and faulty risk-management systems in the banking sector. The economy seems a laggard in controlling the stubborn inflation in comparison to other Western leaders.
Monday’s speech from Bank of England (BoE) Governor Andrew Bailey in which he assures inflation softening failed to provide strength to the Pound Sterling. Bank of England’s Bailey has provided remarks of decelerating inflation on the basis of falling energy prices. However, the Bank of England Governor is still worried about rising wage growth, which could be a hurdle in decelerating inflation. He added that the 'Major risk to BoE's central case for inflation coming down is the UK labor shortage.'
Brexit seems to be the major catalyst responsible for the shortage of labor in the United Kingdom's economy. The post-Brexit UK economy is facing a shortfall of more than 300,000 workers as the result of ending the free movement of labor with the EU, according to a new estimate by leading researchers, reported by Financial Times.
Spotlight shifts to United Kingdom Employment data
For further action in the cross, investors are keenly awaiting the release of the United Kingdom Employment data. As per the projections, the Unemployment Rate for three months (Nov) is expected to remain steady at 3.7%. While the Average Earnings excluding bonus is expected to rise to 6.3% from the prior release of 6.1%.
The rationale behind higher consensus for the Average Earnings data could be the shortage of labor in the UK economy. This might escalate the upside risk for inflation ahead as more liquidity in the palms of the households will result in bumper retail demand, which will not provide any reason to producers to trim prices of goods and services at factory gates. The higher Producer Price Index (PPI) will continue to strengthen the inflationary pressures.
BOJ to provide cues about exit from easy monetary policy
For the past decade, the Bank of Japan is heavily pouring liquidity into the economy to fight deflation and spurt the growth rate. This has led to a serious cut in the value of the Japanese Yen, which is the reason why the Bank of Japan and other Japanese officials have started considering an exit from the loose monetary policy. In its first monetary policy on Wednesday, the BoJ might provide cues about changing policy stance ahead.
Apart from that, investors are curious about the novel leadership of the Bank of Japan. Headlines from Reuters that the new Bank of Japan governor nominee is likely to be presented to parliament Feb 10 have provided some development. Career c.bankers Amamiya, Nakaso, Yamaguchi are seen as top candidates for being the successor of current Bank of Japan Governor Haruhiko Kuroda.
GBP/JPY technical outlook
-638095328230838365.png)
GBP/JPY is forming an Inverted Flag chart pattern on an hourly scale that indicates a sheer consolidation, which is followed by a breakdown in the same. Usually, the consolidation phase of the chart pattern serves as an inventory adjustment in which those participants initiate shorts, which prefer to enter an auction after the establishment of a bearish bias.
The 50-period Exponential Moving Average (EMA) at 157.00 is acting as a major barricade for the Pound Sterling. Meanwhile, the Relative Strength Index (RSI) (14) is facing barricades around 60.00. A failure in stepping into the bullish range of 60.00-80.00 might trigger significant offers from the market participants.
- The index extends the range bound theme around 102.30.
- US markets return to normal activity following Monday’s holiday.
- NY Empire State index, short-term auctions, Fedspeak next on tap.
The greenback, in terms of the USD Index (DXY), navigates under some downside pressure in the 102.30 region on turnaround Tuesday.
USD Index looks to data, Fedspeak
The index surrenders part of the auspicious start of the new trading week and returns to the 102.30 area on Tuesday, as US markets also return to their usual activity following Monday’s Martin Luther King Jr. Day holiday.
The renewed softer stance in the dollar comes on the back of the pick-up in the sentiment surrounding the risk complex, in particular following better-than-expected results from the Chinese fundamentals published earlier in the Asian trading hours.
In the US data space, the manufacturing gauge measured by the NY Empire State Index will be the sole data release and will be accompanied by short-term auctions and the speech by NY Fed J.Williams.
What to look for around USD
The dollar keeps navigating levels last seen in June 2022 around 103.30 pari passu with the resumption of the buying interest in the risk complex.
The idea of a probable pivot in the Fed’s policy in the next months continues to weigh on the greenback and keeps the price action around the DXY depressed. This view, however, also comes in contrast to the hawkish message from the latest FOMC Minutes and recent comments from fed’s rate-setters, all pointing to the need to advance to a more restrictive stance and stay there for longer, at the time when rates are seen climbing above the 5.0% mark.
On the latter, the tight labour market and the resilience of the economy are also seen supportive of the firm message from the Federal Reserve and the continuation of its hiking cycle.
Key events in the US this week: NY Empire State Manufacturing Index (Tuesday) – MBA Mortgage Applications, Producer Prices, Retail Sales, Industrial Production, NAHB Index, Business Inventories, Fed’s Beige Book, Net Long-term TIC Flows (Wednesday) – Building Permits, Housing Starts, Philly Fed Manufacturing Index, Initial Jobless Claims (Thursday) – Existing Home Sales (Friday).
Eminent issues on the back boiler: Rising conviction of a soft landing of the US economy. Prospects for extra rate hikes by the Federal Reserve vs. speculation of a recession in the next months. Fed’s pivot. Geopolitical effervescence vs. Russia and China. US-China trade conflict.
USD Index relevant levels
Now, the index is losing 0.23% at 102.31 and the breach of 101.77 (monthly low January 16) would open the door to 101.29 (monthly low May 30) and finally 100.00 (psychological level). On the other hand, the next hurdle emerges at 105.63 (monthly high January 6) followed by 106.41 (200-day SMA) and then 107.19 (weekly high November 30).
- WTI picks up bids to reverse the week-start pullback from fortnight high.
- Confirmation of bullish chart pattern, looming bull cross on MACD favor buyers.
- Convergence of 100-EMA, flag’s lower line restricts immediate downside.
WTI crude oil grinds higher around the intraday top of $79.68 during early Tuesday morning in Europe. In doing so, the black gold prints mild gains while reversing the previous day’s pullback from a two-week top.
That said, the quote’s latest gains could be linked to the confirmation of a bullish chart pattern, namely the “bull flag” on the hourly play. Also underpinning the run-up could be the impending bull cross on the MACD indicator.
As a result, the WTI is on the way to the theoretical target surrounding $85.50. However, the monthly peak of $81.55 and the previous month’s high of $83.30 could probe the Oil buyers.
It’s worth noting that the energy benchmark’s latest run-up also takes clues from the firmer prints of the RSI (14).
Meanwhile, WTI pullback remains elusive unless the quote remains beyond the $78.45 resistance confluence, including the 100-bar Exponential Moving Average (EMA) and lower line of the two-day-old bull flag.
In a case where the energy benchmark stays weaker past $78.45, the odds of witnessing a slump toward the monthly low of $72.65 can’t be ruled out.
Overall, WTI crude oil remains on the buyer’s radar unless it drops below $78.45.
WTI: Hourly chart
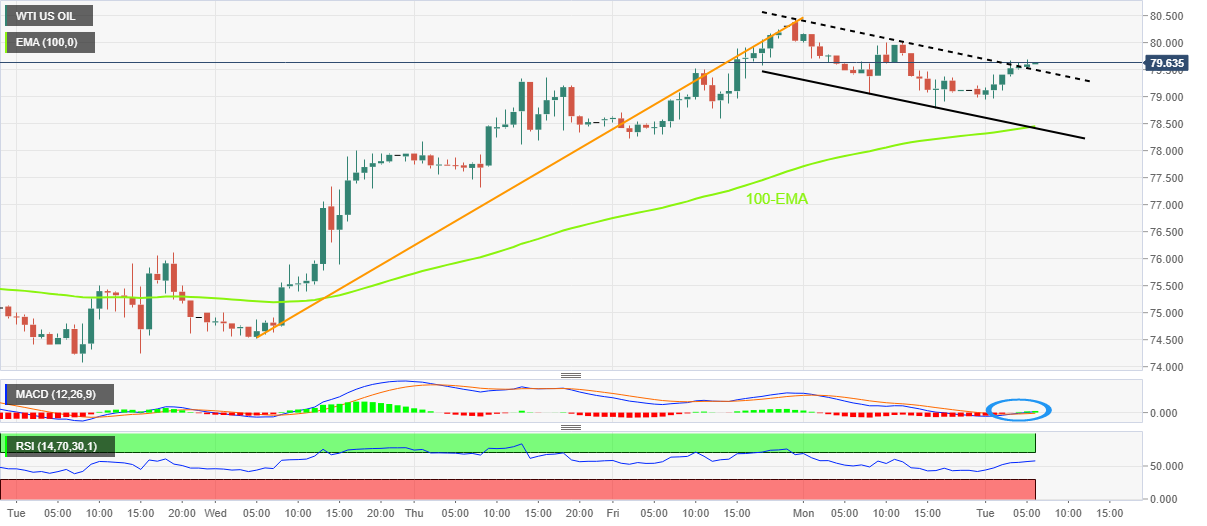
Trend: Further upside expected
- NZD/USD edges higher on Tuesday, though lacks follow-through buying beyond 0.6400.
- The upbeat Chinese macro data lends support, though a combination of factors cap gains.
- Recession fears, a modest USD strength keeps a lid on any meaningful upside for the pair.
The NZD/USD pair gains some positive traction during the Asian session on Tuesday, though struggles to capitalize on the move beyond the 0.6400 round-figure mark. Spot prices remain confined in a familiar trading range held over the past one-and-half week or so.
The better-than-expected Chinese economic data fueled optimism over a recovery in the world's second-largest economy and lends some support to the NZD/USD pair. In fact, China's recorded a growth of 2.9% during the fourth quarter and Industrial Production surpassed estimates. Furthermore, Retail Sales shrank less than anticipated and pointed to a positive trend among consumers.
That said, the worst yet COVID-19 outbreak in China continues to weigh on investors' sentiment. This is evident from a softer tone around the equity markets, which benefits the safe-haven US Dollar and acts as a headwind for the risk-sensitive Kiwi. This, in turn, warrants some caution for aggressive bullish traders and positioning for any meaningful appreciating move for the NZD/USD pair.
The USD uptick, meanwhile, is more likely to remain capped amid growing acceptance that the Fed will soften its hawkish stance amid signs of easing inflationary pressures. Moreover, several Fed officials backed the case for smaller rate hikes and reaffirmed bets for a 25 lift-off in February. This should keep a lid on the buck and limit the downside for the NZD/USD pair, at least for now.
The mixed fundamental backdrop might hold back traders from placing directional bets around the NZD/USD pair and supports prospects for an extension of the range-bound price action. Moving ahead, Tuesday's US economic docket features the release of the Empire State Manufacturing Index. This, along with the broader risk sentiment, might influence the USD and provide some impetus.
Technical levels to watch
Economist Lee Sue Ann and Markets Strategist Quek Ser Leang at UOB Group note the upside momentum in EUR/USD appears to be losing some traction.
Key Quotes
24-hour view: “We highlighted yesterday that ‘the price actions appear to be part of a consolidation phase’ and we expected EUR to ‘trade sideways between 1.0780 and 1.0870’. EUR subsequently traded within a range of 1.0800/1.0873 before closing at 1.0816 (-0.11%). The price actions still appear to be consolidative and we continue to expect EUR to trade sideways, likely between 1.0790 and 1.0860.”
Next 1-3 weeks: “There is not much to add to our update from yesterday (16 Jan, spot at 1.0825). As highlighted, upward momentum is easing and a break of 1.0760 (no change in ‘strong support’ level) would indicate that EUR could consolidate first before making another attempt to advance toward the resistance at 1.0900 later on.”
USD/JPY retreats from intraday high to 128.65 heading into Tuesday’s European session. In doing so, the Yen pair reverses the previous day’s rebound from the lowest levels since late May 2022, up 0.08% intraday by the press time.
That said, the quote’s latest performance could be linked to the indecision at the options market ahead of the key Bank of Japan (BoJ) monetary policy meeting, up for publishing on Wednesday.
It’s worth noting that the one-month risk reversal (RR) for the Yen pair, the ratio between call and put premiums, posted the biggest weekly fall since late December while posting a -0.520 figure by the end of Friday. However, Monday’s daily RR was positive to the tune of +0.190. Further to note is that the Daily RR marked the first positive print in four days while posting the biggest jump since January 05.
Also read: USD/JPY Price Analysis: Inverse H&S confirmation teases buyers around 129.00
- Silver ticks down on Tuesday, though lacks any follow-through selling.
- The setup still favours bulls and supports prospects for additional gains.
- A break below the $23.40-35 confluence might negate the positive bias.
Silver edges lower during the first half of trading on Tuesday, though lacks follow-through and remains well within the previous day's broader trading range. The white metal manages to hold its neck above the $24.00 mark and seems poised to appreciate further.
The recent price action witnessed over the past month or so constitutes the formation of an ascending channel. The lower end of the said trend channel, currently around the $23.40-$23.35 area, coincides with the 200-period SMA on the 4-hour chart and should act as a pivotal point for the XAG/USD.
Oscillators on 4-hour/daily charts - though have been losing traction - are holding in the positive territory and favour bullish traders. That said, it will be prudent to wait for some follow-through buying beyond the multi-month peak, around the $24.50 area, before positioning for further gains.
The subsequent move up has the potential to lift the XAG/USD towards the $25.00 psychological mark for the first time since April 2022. Some follow-through buying should pave the way for an extension of the appreciating move towards the next relevant hurdle near the $25.35-$25.40 resistance zone.
On the flip side, any meaningful slide below the $24.00 mark is more likely to attract fresh buyers and remain limited near the aforementioned confluence support, around the $23.40-$23.35 area. A convincing break below will negate the positive outlook and shift the bias in favour of bearish traders.
The XAG/USD might then turn vulnerable to weaken below the $23.00 round-figure mark and accelerate the fall towards the $22.60-$22.55 region. The downward trajectory could get extended further towards the next relevant support near the $22.10-$22.00 zone.
Silver 4-hour chart
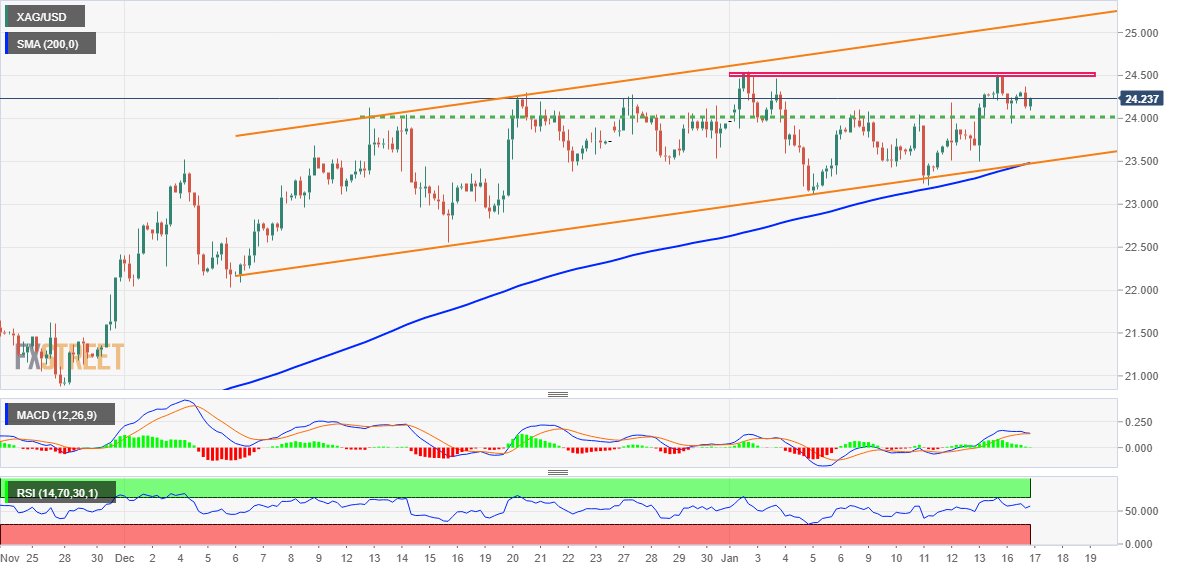
Key levels to watch
- Positive development on chatters over BoJ’s novel leadership is supporting Japanese stocks.
- Chinese indices failed to find strength despite the upbeat GDP data, Industrial Production, and Retail Sales data.
- Oil prices have delivered a recovery ahead of OPEC's monthly report.
Markets in the Asian domain are displaying mixed signals amid respective developments. The market mood has caught caution as US Treasury yields have extended their gains on early Tuesday. The return on 10-year US Treasury bonds has jumped to near 3.54%. S&P500 futures have extended their losses amid uncertainty due to the extended weekend. While the US Dollar Index (DXY) is struggling to save the 102.00 support.
At the press time, Japan’s Nikkei225 soared 1.23%, ChinaA50 drops 0.64%, Hang Seng tumbled 0.90% and Nifty50 gained 0.64%.
Volatility in the Japanese equities was highly expected as uncertainty for the Bank of Japan (BOJ)’s first monetary policy of CY2023 is soaring. Investors are keenly waiting for a commentary on the expression of exit from decade-long ultra-loose monetary policy. However, headlines from Reuters that the New BOJ governor nominee is likely to be presented to parliament on Feb 10 have infused fresh blood into the Japanese stocks. Career c.bankers Amamiya, Nakaso, and Yamaguchi are seen as top candidates for being the successor of current BoJ Governor Haruhiko Kuroda.
Meanwhile, Chinese indices failed to find strength despite the upbeat Gross Domestic Product (GDP) data. In the fourth quarter of CY2022, the Chinese economy expanded by 2.9% on an annual basis while the street was expecting an expansion of 1.8%, lower than the prior release of 3.9%. On a quarterly basis, the economy has remained steady but managed to avoid contraction as investors were expecting de-growth by 0.8%.
Trade deals between the United States and China are set build fresh record of $694.4B, fading fears of any grudge between the giant economies, Brooklyn said, reported by Bloomberg. Also, the US Treasury Department said late Monday, US Treasury Secretary Janet Yellen will hold her first face-to-face meeting with Chinese Vice Premier Liu He on January 18 in Zurich, per Bloomberg. The pair “will exchange views on macroeconomic developments and other economic issues.”
Apart from that, annual Industrial Production (Dec) has been reported stronger than anticipated at 1.3% vs. the expectations of 0.5% but lower than the former release of 2.2%. The annual Retail Sales have contracted lower than expected by 1.8% against the estimate of -7.8%.
On the oil front, oil prices have recovered dramatically from $79.00 as reopening reforms in China will produce sheer liquidity, which is expected to trigger a rally in commodities ahead. Moreover, investors are awaiting the monthly report from the Organization of Petroleum Exporting Countries (OPEC), which might deliver signs of a further squeeze in oil supply.
“Interest rates are now ‘ballpark’ neutral,” said European Central Bank (ECB) Chief Economist Phillip Lane during an interview with the Financial Times (FT), reported Reuters during early Tuesday.
The ECB policymaker also states, per FT, “We haven’t seen ‘normal’ in Europe for a long time.”
Additional important comments
Inflation pressures were starting to build from the summer of 2021.
What happened in the 1970s was a misdiagnosis over a long period of time.
We have proven our determination to deliver on inflation target.
Compared to December, there have been big declines in energy prices.
We are working under very high uncertainty.
This is why we must not be so confident about where rates need to go.
But interest rates do have to be higher than they are now.
Where we exactly end up will depend on a lot of factors.
EUR/USD picks up bids
Given the hawkish comments from the key ECB Governing Council member, EUR/USD picks up bids to print mild gains around 1.0830.
Also read: EUR/USD remains sideways around 1.0830 amid ambiguity in risk profile, US PPI eyed
UK Jobs report overview
Early Tuesday, the UK’s Office for National Statistics (ONS) will release the December month Claimant Count figures together with the Unemployment Rate in the three months to November at 07:00 AM GMT.
Today’s UK employment data becomes more important for the GBP/USD pair traders considering the latest comments from Bank of England (BoE) Governor Andrew Bailey, as well as due to the worsening conditions of the labor strikes in Britain. Also important is the fact that the British stock market benchmark is only half a percent away from an all-time high.
The UK job market report is expected to show that the Average Weekly Earnings, Including Bonuses, in the three months to November, remained unchanged at 6.1% while ex-bonuses, the wages are seen rising to 6.3% from 6.1% prior readings. It’s worth noting that the Employment Change could ease to 5K in the three months to November versus 27K in previous readouts.
Further, the ILO Unemployment Rate is likely to remain intact at 3.7% for the three months ending in November. It’s worth noting that the Claimant Count Change figures came in as 30.5K in November with the Claimant Count Rate of 3.9% during the stated period.
How could they affect GBP/USD?
GBP/USD struggles for clear directions after reversing from a one-month high the previous day, making rounds to 1.2200 heading into Tuesday’s London open. In doing so, the Cable pair fall short of portraying the price-negative headlines surrounding the UK. Among them, the chatters of Brexit-led labor shortage, workers’ strikes in the UK and hardships for UK PM Rishi Sunak gain major attention.
The reason could be linked to the fears of high price pressure and shortage of labor, marked by BoE Governor Bailey. As a result, the BoE hawks are hopeful of further rate hikes should today’s scheduled job reports manage to portray tight job markets. That said, a likely easing in the Employment Change may weigh on the GBP/USD prices amid the US dollar’s rebound, as well as the cautious sentiment.
Technically, a six-week-old horizontal resistance near 1.2345 appears a tough nut to crack for the GBP/USD bulls. Alternatively, the 100-day EMA level surrounding 1.1940 put a floor under the Cable prices.
Key notes
GBP/USD: Cable prints mild gains near 1.2200 ahead of UK employment data
GBP/USD Weekly Forecast: Pound Sterling looks to 1.2450 in the UK inflation week
About UK jobs
The UK Average Earnings released by the Office for National Statistics (ONS) is a key short-term indicator of how levels of pay are changing within the UK economy. Generally speaking, positive earnings growth anticipates positive (or bullish) for the GBP, whereas a low reading is seen as negative (or bearish).
- USD/CAD oscillates in a narrow band and is influenced by a combination of diverging forces.
- A modest uptick in crude oil prices underpins the Loonie and acts as a headwind for the pair.
- A softer risk tone benefits the safe-haven greenback and helps limit any meaningful downside.
- Traders now look to Canadian consumer inflation and the US macro data for a fresh impetus.
The USD/CAD pair is struggling to gain any meaningful traction on Tuesday and oscillating in a narrow trading band through the Asian session. The pair is currently hovering around the 1.3400 mark, nearly unchanged for the day, and is influenced by a combination of diverging forces.
A modest uptick in crude oil prices underpins the commodity-linked Loonie and acts as a headwind for the USD/CAD pair. The negative factor, to a larger extent, is offset by some follow-through US Dollar buying, which, in turn, lends some support to the major and helps limit the downside, at least for the time being.
Data released earlier this Tuesday showed that China's economy grew at a better-than-expected pace in the fourth quarter. Furthermore, improving trends in Chinese Retail Sales and Industrial Production fueled optimism over an economic recovery in the world's largest crude importer and acts as a tailwind for oil prices.
That said, worries about a potential global recession keep a lid on any meaningful upside for the black liquid. Traders also seem reluctant and prefer to wait on the sidelines ahead of the monthly OPEC report, due later this Tuesday, which will be looked upon for any change in the demand forecast for the current year.
The US Dollar, on the other hand, attracts some haven flows amid the prevalent cautious market mood, though lacks bullish conviction amid hopes for a less aggressive policy tightening by the Fed. The mixed fundamental backdrop warrants some caution before positioning for a firm intraday direction for the USD/CAD pair.
Moving ahead, the focus shifts to Canadian consumer inflation figures, due for release later during the early North American session. This, along with oil price dynamics, might influence the Canadian Dollar. Apart from this, the Empire State Manufacturing Index from the US should provide some impetus to the USD/CAD pair.
Technical levels to watch
- AUD/USD is displaying topsy-turvy moves in a 0.6960-0.6978 range amid caution in the market mood.
- The formation of a Rising Channel indicates an upside trend in a limited territory.
- The Aussie asset has been overlapped by the 20-EMA, which indicates a consolidation added.
The AUD/USD pair is displaying topsy-turvy moves in a tad wider range of 0.6960-0.6978 in the Asian session. The Aussie asset has turned sideways following the footprints of the US Dollar Index (DXY). The USD Index is showing a sideways profile amid uncertainty in the market after a stretched weekend.
Also, strengthening US Treasury yields has trimmed investors’ risk appetite. The 10-year US Treasury yields have climbed to near 3.54%. Meanwhile, S&P500 futures are displaying a subdued performance amid caution in the market mood.
AUD/USD is auctioning in a Rising Channel chart pattern on an hourly scale, which signals a continuation of the north-side trend in a marked boundary. On Monday, the Australian Dollar failed to keep the Aussie asset on the escalated levels after a failed breakout.
The asset has been overlapped by the 20-period Exponential Moving Average (EMA) at 0.6964, which indicates a sideways auction ahead.
Also, the Relative Strength Index (RSI) (14) is hovering in the 40.00-60.00 range, which adds to the volatility contraction filters.
A decisive move above Monday’s high at 0.7019 will drive the Aussie towards August high at 0.7137. A break above August high will send the major toward June 9 high around 0.7200.
On the contrary, a downside move below December 29 low at 0.6710 will drag the major further toward December 22 low at 0.6650 followed by November 21 low at 0.6585.
AUD/USD hourly chart
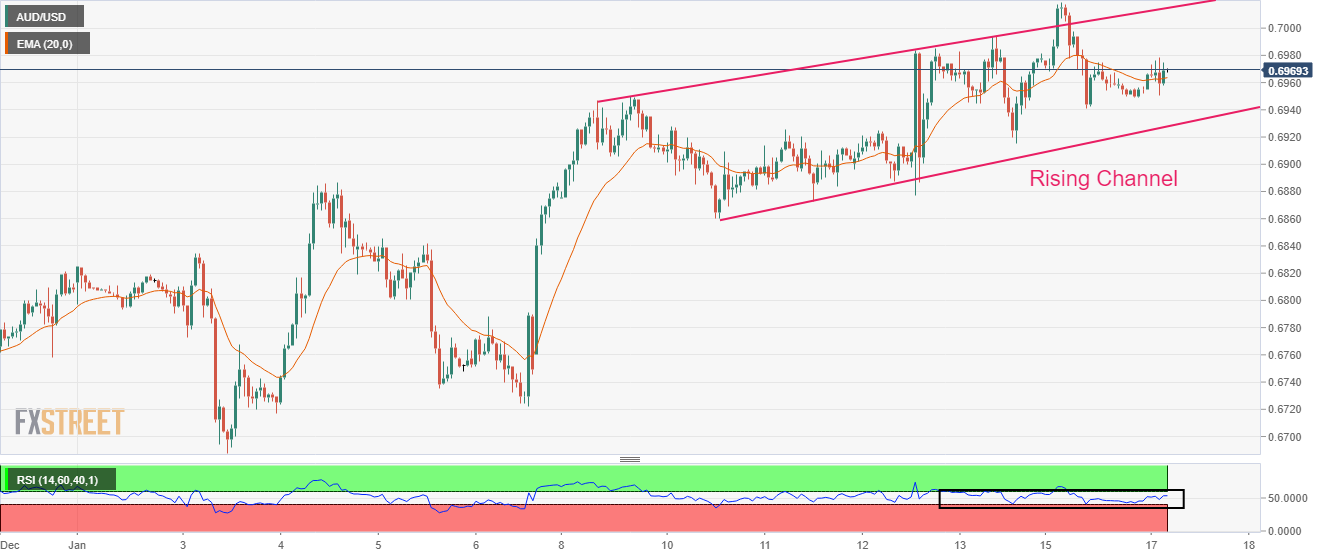
- USD/INR picks up bids to portray three-day winning streak, extends bounce off monthly low.
- China’s upbeat data-dump fails to trigger risk-on mood as full markets return.
- US Dollar Index traces yields to pare recent losses around multi-month low.
- Risk catalysts are the key ahead of US Retail Sales for December.
USD/INR remains on the front foot for the third consecutive day as the pair buyers approach 82.00, up 0.20% around 81.80 by the press time, during the initial trading hours of the Indian market opening on Tuesday.
The Indian rupee (INR) pair’s latest rebound could be linked to the market’s inability to extend the previous risk-on mood as the US traders return to the desk after a long weekend.
While tracing the link to sentiment, China’s ability to impress markets despite posting upbeat data gains major attention. Earlier in the day, China’s National Bureau of Statistics (NBS) released the fourth quarter (Q4) Gross Domestic Product (GDP), as well as Industrial Production and Retail Sales figures for December. However, downbeat comments from NBS joined the market’s doubts about the actual numbers seemed to have weighed on the risk profile.
That said, China's Q4 GDP rose 2.9% YoY versus 1.8% expected and 3.9% prior. Further details suggest that the Industrial Production for December grew 1.3% YoY versus 0.5% market forecasts and 2.2% prior readings. Additionally, Retail Sales improved to -1.8% YoY for December compared to -7.8% consensus and -5.9% prior. Even so, the NBS said that the foundation for economic recovery is not solid yet.
Elsewhere, the US 10-year Treasury yields defend the week-start recovery, up two basis points (bps) near 3.54% while S&P 500 Futures print mild losses as it retreats from the monthly high. It’s worth noting that shares in India remain mildly bid but those from China and Australia print losses and challenge the risk appetite.
As a result, the US Dollar Index (DXY) extends the previous day’s rebound from the lowest levels since June 2022.
Not only had the shift in the risk appetite but an improvement in the Oil prices and doubts over the Reserve Bank of India’s (RBI) capacity to defend the INR, considering the reliance on imports and wide budget deficit, also seem to propel the USD/INR prices of late. That said, WTI crude oil picks up bids to reverse the week-start pullback from a two-week high, up 0.60% intraday near $79.60 at the latest.
Looking forward, the second-tier US data like NY Empire State Manufacturing Index for January, expected -4.5 versus -11.2 prior, for clear directions. However, major attention will be given to Wednesday’s US Retail Sales for December, expected 0.1% YoY versus -0.6% prior. Above all, February 01 will the key day for the USD/INR pair traders as it will offer the budget proposal from Indian Finance Minister and the Federal Reserve (Fed) also holds its monetary policy meeting on that day.
Technical analysis
A fortnight-old descending resistance line challenges USD/INR bulls around 81.90.
- EUR/USD is in a rangebound territory as solid yields are weighing on risk-perceived currencies.
- The release of the US PPI will provide more cues about inflation projections.
- According to Bloomberg’s poll, the ECB is expected to find an interest rate peak at 3.25%.
The EUR/USD pair has continued to trade rangebound near 1.0830 in the Asian session. The major currency pair is displaying a lackluster performance amid ambiguity in the risk profile as the United States markets will open on Tuesday after a stretched weekend. A volatility contraction in the asset is likely to get exploded ahead.
S&P500 futures have shown a marginal loss as investors have turned anxious amid after holiday mood. The US Dollar Index (DXY) has sensed barricades after testing Monday’s high at 102.20. The USD Index is putting efforts in sustaining above the critical support of 102.00. Meanwhile, the 10-year US Treasury yields have escalated further to near 3.54%, weighing on the risk-appetite theme.
Investors should brace for a power-pack action after the release of the United States Producer Price Index (PPI) data. A change in the prices of goods and services at factory gates is going to provide more cues about inflation projections. The street sees a decline in headline factory gate prices of goods and services (Dec) to 6.8% from the former release of 7.4%. Also, the core PPI might trim to 5.9% from the former release of 6.2% in a similar period.
The Euro is expected to hog the limelight as the European Central Bank (ECB) is aiming to achieve the interest rate peak by the Summer.
A poll from Bloomberg indicates that ECB President Christine Lagarde is expected to push interest rates to 3.25%. The central bank will announce 50 basis points (bps) interest rate hike in February and March and a 25 bps rate hike in May that will support the ECB in achieving a terminal rate from the current rate of 2%.
- Gold price extends the week-start pullback from multi-month high.
- China reports upbeat GDP, Industrial Production and Retail Sales but NBS comments challenge optimism.
- Return of full markets underpins US Treasury yields rebound and challenge XAU/USD bulls.
Gold price (XAU/USD) drops for the second consecutive day after poking the highest levels since April 2022, down 0.20% intraday as sellers keep the reins near $1,910 during early Tuesday.
US Dollar Index rebound from the seven-month low, amid firmer US Treasury bond yields, underpinned the Gold price pullback on Monday. However, the price-negative market sentiment even after China’s upbeat economics seemed to have weighed on the XAU/USD of late.
Talking about the data, China's Gross Domestic Product (GDP) for the fourth quarter (Q4) printed 0.0% QoQ figure versus -0.8% expected and 3.9% prior. Further details suggest that the Industrial Production for December grew 1.3% YoY versus 0.5% market forecasts and 2.2% prior readings. Additionally, Retail Sales improved to -1.8% YoY for December compared to -7.8% consensus and -5.9% prior.
It should be observed, however, that the China National Bureau of Statistics (NBS) mentioned after the data that the foundation for economic recovery is not solid yet.
Also read: China’s NBS: Foundation for economic recovery not solid yet
Other than the NBS comments, the market’s lack of acceptance of the upbeat China data, amid hopes of witnessing a downbeat outcome due to the COVID-19 woes, also seemed to have weighed on the sentiment and the XAU/USD prices. Furthermore, recently positive US sentiment figures and the inflation expectations conveyed on Friday, probed the previously dovish bias for the Federal Reserve (Fed) and hence underpin a rebound in the US Treasury bond yields.
That said, the S&P 500 Futures print mild losses as it retreats from the monthly high while the US 10-year Treasury yields defend the week-start recovery, up two basis points (bps) near 3.54% by the press time.
Moving on, Gold traders should wait for the second-tier US data like NY Empire State Manufacturing Index for January, expected -4.5 versus -11.2 prior, for clear directions. However, major attention will be given to Wednesday’s US Retail Sales for December, expected 0.1% YoY versus -0.6% prior.
Gold price technical analysis
A clear downside break of the three-day-old bullish channel favors Gold sellers as they approach the previous resistance line from January 09, close to $1,898 by the press time.
That said, the bearish MACD signals and downbeat RSI (14), not oversold, also keep the Gold bears hopeful.
It’s worth noting that the $1,900 threshold can act as immediate downside support while the 200-HMA level surrounding $1,878 could probe the XAU/USD bears afterward.
Alternatively, the stated channel’s lower line, close to $1,923 at the latest, restricts the immediate upside of the XAU/USD.
Following that, an ascending trend line from the last Thursday, near $1,947, could challenge the Gold buyers before directing them toward the April 2022 peak surrounding $1,998.
Gold price: Hourly chart

Trend: Further downside expected
- USD/JPY picks up bids to extend the week-start rebound from the lowest levels since May 2022.
- Upbeat RSI backs confirmation of bullish chart pattern to tease buyers.
- 200-HMA acts as final defense of buyers, 50-HMA guards immediate downside.
USD/JPY refreshes intraday high around 129.15 as it pierces the neckline of a two-day-old inverse head-and-shoulders (H&S) bullish chart pattern during early Tuesday, retreating to 129.00 by the press time.
Not only the inverse H&S confirmation but the upbeat RSI (14), not overbought, also adds strength to the USD/JPY rebound from the lowest levels since late May 2022.
As a result, the Yen pair buyers are well-set to approach the 130.00 round figure before aiming for the theoretical target surrounding 130.40.
It’s worth observing that the RSI line is approaching the overbought territory and may probe the USD/JPY bulls around 130.40, if not then the 200-HMA level surrounding 131.25 will be in focus. Additionally, the 131.00 round figure could act as an extra filter towards the north.
On the flip side, the resistance-turned-support line of the stated inverse H&S, around 128.75 by the press time, restricts the immediate downside of the USD/JPY pair ahead of the 50-HMA level near 128.30.
In a case where the Yen pair remains bearish past 128.30, the monthly low around 127.20 and May 2022 low near 126.35 will gain the market’s attention.
Overall, USD/JPY is likely to witness further recovery but the upside room appears limited.
USD/JPY: Hourly chart
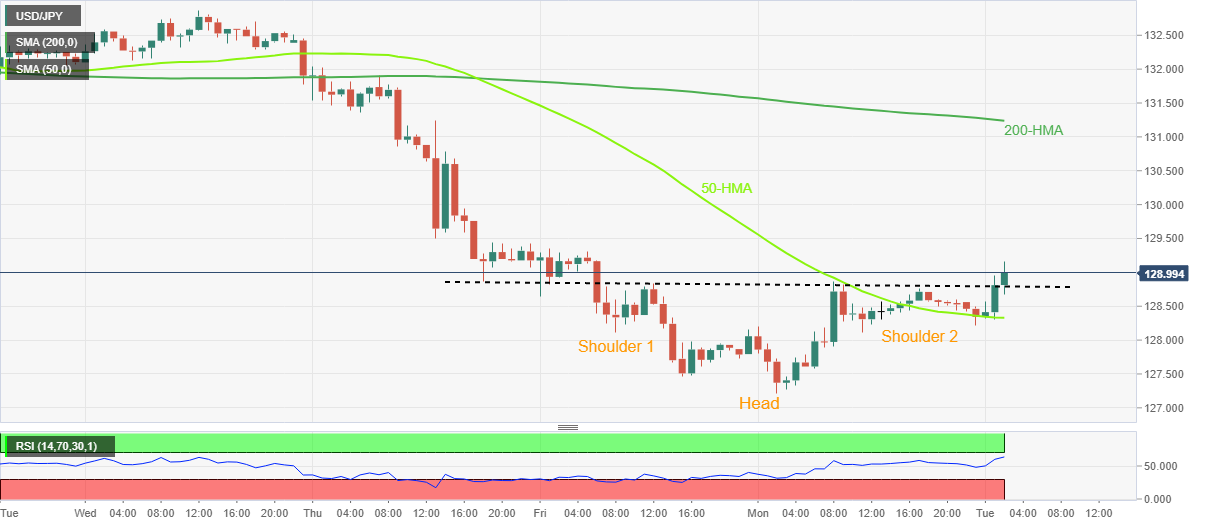
Trend: Further recovery expected
The US Treasury Department said late Monday, US Treasury Secretary Janet Yellen will hold her first face-to-face meeting with Chinese Vice Premier Liu He on January 18 in Zurich, per Bloomberg.
The pair “will exchange views on macroeconomic developments and other economic issues.”
China’s Commerce Ministry said that “trade teams have maintained sound communication.”
Meanwhile, Politico reported earlier on, citing Washington-based diplomats familiar with the travel plans, US Secretary of State Antony Blinken will meet in Beijing with his counterpart, Chinese Foreign Minister Qin Gang, on February 5-6.
Market reaction
At the press time, AUD/USD is trading modestly flat at around 0.6960, fading the Chinese data-led spike to 0.6978.
Japanese Finance Minister Shunichi Suzuki said in a statement on Tuesday, “rises in bond yields could push up costs of interest payment.”
Additional comments
“Bond yields are set by various factors.”
“Will strive to conduct debt management so as not to lose market confidence.”
“Will nominate "most appropriate" person as new Bank of Japan (BoJ) governor.”
Market reaction
USD/JPY is attempting another run to recapture the 129.00 level, now trading at 128.90, up 0.30% so far.
| Raw materials | Closed | Change, % |
|---|---|---|
| Silver | 24.252 | 0.1 |
| Gold | 1914.23 | -0.25 |
| Palladium | 1753.39 | -1.94 |
- NZD/USD prints mild gains on upbeat China data.
- China Q4 GDP joins Industrial Production, Retail Sales for December to please Kiwi buyers.
- Mixed sentiment, sluggish yields add strength to the recovery moves.
NZD/USD renewed its intraday high to 0.6400 on upbeat China data, before retreating to 0.6385 during early Tuesday. Even so, the Kiwi pair prints mild gains while defying the two-day losing streak amid mixed sentiment.
China's Gross Domestic Product (GDP) for the fourth quarter (Q4) printed 0.0% QoQ figure versus -0.8% expected and 3.9% prior. Further details suggest that the Industrial Production for December grew 1.3% YoY versus 0.5% market forecasts and 2.2% prior readings. Additionally, Retail Sales improved to -1.8% YoY for December compared to -7.8% consensus and -5.9% prior.
Earlier in the day, the New Zealand Institute of Economic Research (NZIER) released its Quarterly Survey of Business Opinion (QSBO) and probed the NZD/USD buyers. The reason could be linked to the lowest business confidence in the Pacific nation since 1974, as per the quarterly survey.
Also read: NZIER QSBO: New Zealand business confidence at lowest since 1974
Elsewhere, the return of full markets restores bearish bias for the US Dollar, after portraying a corrective bounce the previous day, as the US Treasury yields fade the week-start rebound. Even so, the market’s risk appetite remains unclear as the S&P 500 Futures print mild losses as it retreats from the monthly high.
Moving ahead, the second-tier US data like NY Empire State Manufacturing Index for January, expected -4.5 versus -11.2 prior, may entertain NZD/USD pair traders ahead of Wednesday’s US Retail Sales for December, expected 0.1% YoY versus -0.6% prior.
Technical analysis
A one-week-old symmetrical triangle restricts immediate NZD/USD moves between 0.6375 and 0.6425.
Following the release of the key economic data from China, the country’s National Bureau of Statistics (NBS) released a statement, via Reuters, expressing their outlook on the economy.
Key quotes
China is able to stabilize the economy in 2022.
Foundation for economic recovery not solid yet.
more to come ...
Related reads
-
China’s Q4 GDP expands 2.9% YoY vs. 1.8% expected
-
USD/CNH scales above 6.7500 despite upbeat China GDP data
The Bank of Japan (BoJ) announced on Tuesday that it bid to buy an unlimited amount of 5-10 year maturity Japanese government bonds (JGB).
Off late, it has been the BoJ’s regular daily operation to buy JGBs, in a persistent attempt to bring the yields down.
Markets are paying a little heed to the BoJ bond-buying ahead of Wednesday’s policy announcements, which is likely to be the main event risk of this week.
The USD/JPY pair is trading at 128.69, adding 0.13% on the day, at the time of writing.
- USD/CNH has crossed the crucial resistance of 6.7500 amid a recovery in the US Dollar Index.
- Upbeat China’s GDP, Retail Sales, and Industrial Production data failed to provide support to the Chinese Yuan.
- S&P500 futures have eased morning gains, portraying a risk-off market mood.
The USD/CNH has overstepped the critical resistance of 6.7500 despite China’s National Bureau of Statistics (NBS) having reported upbeat Gross Domestic Product (GDP) (Q4) data. The Chinese economy has expanded by 2.9% on an annual basis while the street was expecting an expansion of 1.8%, lower than the prior release of 3.9%. On a quarterly basis, the economy has remained steady but managed to avoid contraction as investors were expecting a de-growth by 0.8%.
Apart from that, annual Industrial Production (Dec) has been reported stronger than anticipated at 1.3% vs. the expectations of 0.5% but lower than the former release of 2.2%. The annual Retail Sales have contracted lower than expected by 1.8% against the estimate of -7.8%.
Broadly, the reopening reforms by the Chinese administration by shrugging-off uncertainty over rising Covid-19 cases are supporting a rally in commodities ahead. Usually, reopening measures boost liquidity in the economy, which initially strengthens the commodities, as witnessed in the case of reopening by other Western nations in CY2020 after the Covid-19 pandemic.
Economists at Société Générale think that China’s reopening will be bullish for commodities. They further added that “China should import more LNG which would put some pressure on gas prices and positive sentiment on the Copper markets will be significant. Oil prices have already displayed a bumper recovery
Meanwhile, the S&P500 futures have surrendered gains recorded in early Asia and have turned negative, portraying escalating caution among the market participants. The return on 10-year US Treasury bonds has jumped above 3.53%, which is weighing on the risk appetite of the market participants. The US Dollar Index (DXY) is aiming to recapture Monday’s high at 102.20 as the risk aversion theme is gaining traction.
- AUD/USD takes the bids to refresh intraday high on strong data from Australia’s biggest customer.
- China Q4 GDP improved to 2.9%, Industrial Production and Retail Sales also mark better-than-forecast figures for December.
- Risk profile remains unclear even as full markets return, yields dwindle but stock futures print mild losses.
- Recently mixed US data, cautious mood ahead of Aussie jobs report, US Retail Sales probe AUD/USD traders.
AUD/USD renews its intraday high around 0.6980 as firmer statistics from China joins the US Dollar retreat during early Tuesday. The Aussie pair buyers, however, remain cautious ahead of this week’s US Retail Sales and Australian employment data amid mixed sentiment.
That said, China's Gross Domestic Product (GDP) for the fourth quarter (Q4) printed 0.0% QoQ figure versus -0.8% expected and 3.9% prior. Further details suggest that the Industrial Production for December grew 1.3% YoY versus 0.5% market forecasts and 2.2% prior readings. Additionally, Retail Sales improved to -1.8% YoY for December compared to -7.8% consensus and -5.9% prior. Earlier in the day, Australia Westpac Consumer Confidence for January rose to 5.0% from 3.0% prior.
Also read: Breaking: China’s Q4 GDP expands 2.9% YoY vs. 1.8% expected
It should be noted that the return of full markets restores bearish bias for the US Dollar, after portraying a corrective bounce the previous day, as the US Treasury yields fade the week-start rebound. Even so, the market’s risk appetite remains unclear as the S&P 500 Futures print mild losses as it retreats from the monthly high.
Having seen the initial market reaction of the China dump, AUD/USD traders may pay attention to the aforementioned risk catalysts and the second-tier US data like NY Empire State Manufacturing Index for January expected -4.5 versus -11.2 prior. However, major attention will be given to Wednesday’s US Retail Sales for December, expected 0.1% YoY versus -0.6% prior, as well as Australian employment data for the said month.
Considering the recently positive Aussie numbers, in contrast to the mixed US data, the AUD/USD pair is likely to witness further upside unless the scheduled key statistics disappoint the bulls.
Technical analysis
The AUD/USD pair’s U-turn from a two-month-old ascending resistance line, close to 0.7025 at the latest, joins nearly overbought conditions of the RSI (14) to tease the Aussie pair sellers. It’s worth noting, however, that, a daily closing below the 200-DMA, around 0.6825 by the press time, becomes necessary for the Aussie bears to retake control.
- AUD/NZD bears eye a break of trendline support and then the 1.0720s will be eyed on a break of structure below 1.0800.
- Bulls are trying to fend off the bears above the W-formaiton's neckline.
AUD/NZD has been climbing into shorts throughout the start of the year in a continuation of the mid-December rally from the lows in the 1.0480s. The pair has gained over 4% since then. the following illustrates the prospects of a continuation to test the resistance of 1.0950 for the sessions ahead.
AUD/NZD daily chart
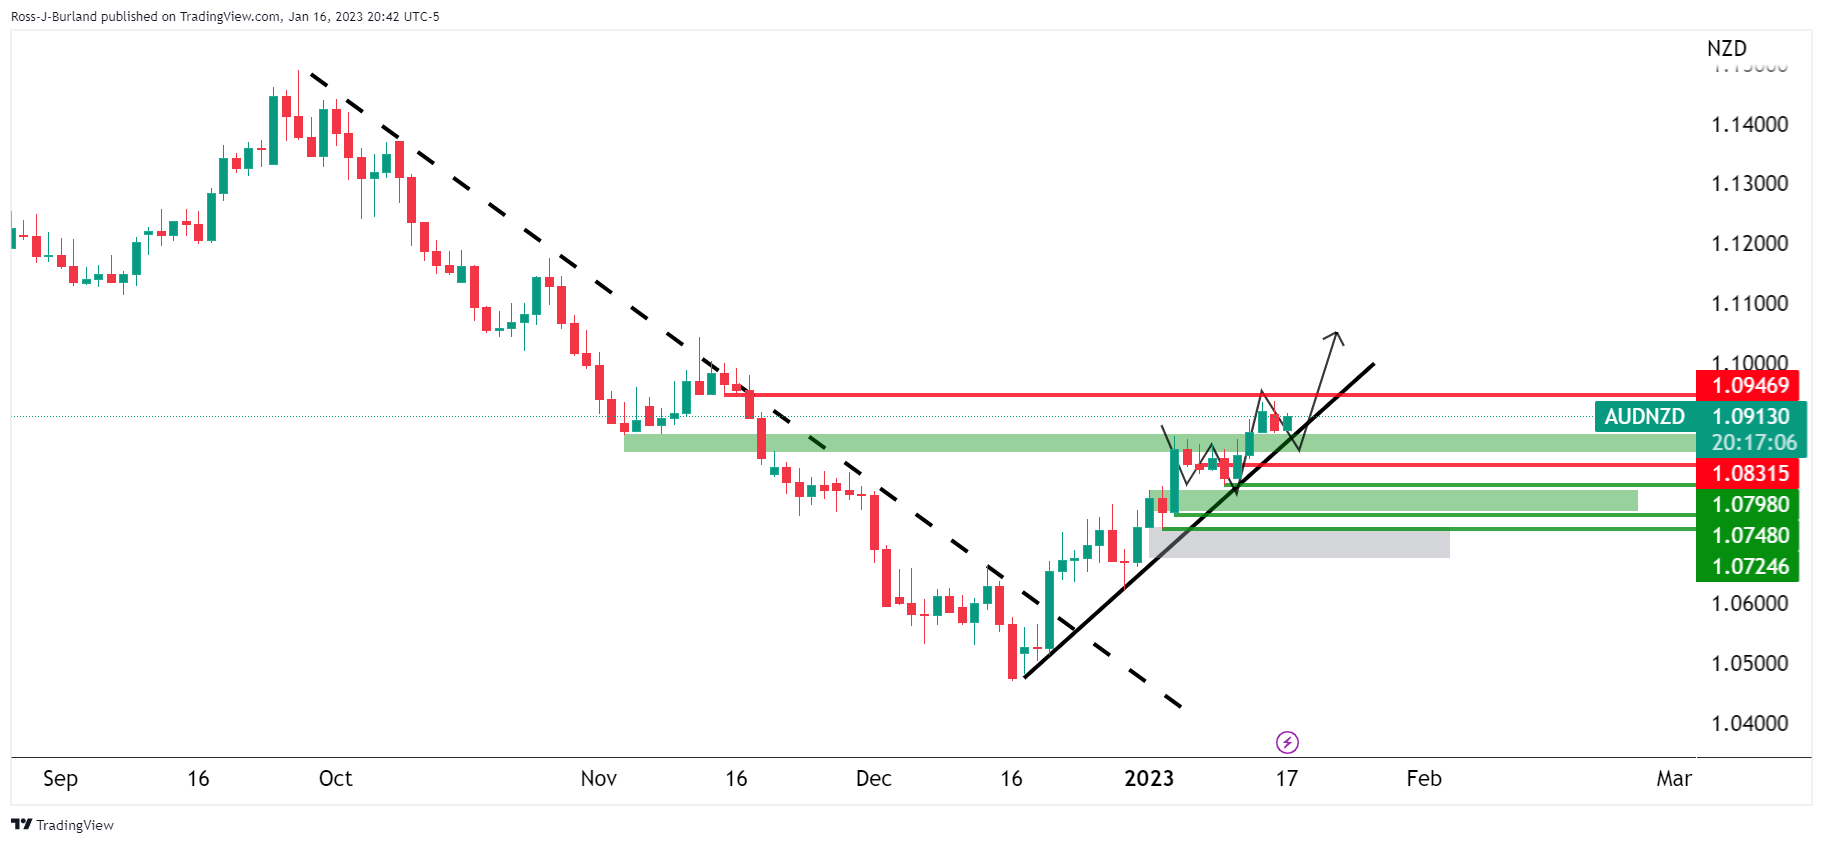
The W-formation is a reversion p[atternsa and the bulls are trying to defend the move into the neckline. Should the bulls succeed at fending off the bears, then the trendline support will remain intact and the prospects will be for a break of the 1.0950 resistance. However, failures here will open the risk of a significant move to the downside as follows:

The 1.0720s will be eyed on a break of structure below 1.0800.
Gross Domestic Product (GDP) in the world's second-biggest economy, China, expanded by 2.9% in the September-December quarter year-on-year, official data released by the National Bureau of Statistics (NBS) showed on Tuesday, above the 1.8% consensus forecasts and slowing from the 3.9% pace in the third quarter.
On a quarterly basis, China’s GDP came in at 0% in the fourth quarter vs. an expected 0.8% drop and a 3.9% growth in the previous quarter.
China’s economy grew by 3.0% YoY in 2022.
China’s December Retail Sales YoY, dropped 1.8% vs. -7.8% expected and -5.9% previous while the country’s Industrial Production came in at 1.3% YoY vs. 0.5% estimated and 2.2% prior.
Meanwhile, the Fixed Asset Investment fell to 5.1% YoY in December vs. 5.0% expected and 5.3% last.
Market reaction
The Australian dollar picked up a fresh bid on the upbeat Chinese data release. The AUD/USD pair jumped to fresh daily highs at 0.6978 on the data release before retreating to 0.6971, where it now wavers. The spot is up 0.23% on the day.
- EUR/JPY has managed to retreat back into the consolidation area placed in a range of 138.84-143.00.
- The cross has picked strength as anxiety among investors soars ahead of BOJ policy.
- A range shift by the RSI (14) into the 40.00-60.00 from the bearish territory indicates that the downside momentum has faded,
The EUR/JPY pair has sensed a buying interest after a marginal correction to near 139.00 in the Tokyo session. The cross has resumed its upside journey and has surpassed the immediate resistance of 139.30. The asset is gaining strength ahead of the monetary policy announcement by the Bank of Japan (BoJ).
Investors will keep an eye on commentary from BOJ Governor Haruhiko Kuroda amid growing chatters over an exit from the ultra-loose monetary policy by the BOJ.
EUR/JPY has managed to retreat back into the consolidation area placed in a range of 138.84-143.00. The cross sensed a responsive buying action after dropping to near 138.00 last week. A recovery move by the Euro is pushing the asset toward the 20-period Exponential Moving Average (EMA) at 139.56, which might strengthen the shared currency bulls further.
A range shift move by the Relative Strength Index (RSI) (14) from the bearish region of 20.00-40.00 to the 40.00-60.00 territory is indicating that the downside momentum has almost faded now.
For further upside, a break above January 5 low at 139.97 will drive the asset towards January 6 high at 141.45 followed by December 28 high around 143.00.
On the flip side, a downside move below the previous week’s low at 138.00 will drag the cross toward January 3 low at 137.39. A slippage below the latter will expose the asset for more downside toward April 14 low at 135.51.
EUR/JPY four-hour chart
-638095169252860025.png)
- USD/CHF remains sidelined inside one-month-old megaphone formation.
- 21-DMA challenges recovery moves favored by Monday’s Doji candlestick.
- Sluggish RSI line signals more grinding but bullish MACD signals probe bears of late.
USD/CHF steadiness near 0.9260-65 as the Swiss Franc (CHF) traders struggle to justify the previous day’s Doji candlestick during early Tuesday. In doing so, the major currency pair remains inside a one-month-long megaphone trend-widening chart formation.
That said, the steady RSI (14) suggests further grinding of the USD/CHF prices but the bullish MACD signals challenge the pair buyers. Additionally probing the quote’s immediate upside is the 21-DMA resistance near 0.9285.
It should be noted that the stated megaphone’s top line, close to 0.9420 by the press time, appears a tough nut to crack for the USD/CHF bulls before retaking control.
Ahead of that, the November 2022 low near 0.9355 may probe the recovery moves past 0.9285.
Alternatively, the 0.9200 round figure and the monthly bottom around 0.9165 could restrict the short-term USD/CHF downside ahead of highlighting the stated trend-widening chart pattern’s lower line, close to 0.9145 at the latest.
In a case where the USD/CHF bears keep the reins past 0.9145, the 0.9100 round figure will precede the previous yearly low of 0.9091 to please them.
Overall, USD/CHF is likely to remain sideways even if the pair sellers appear to have run out of steam of late.
USD/CHF: Daily chart
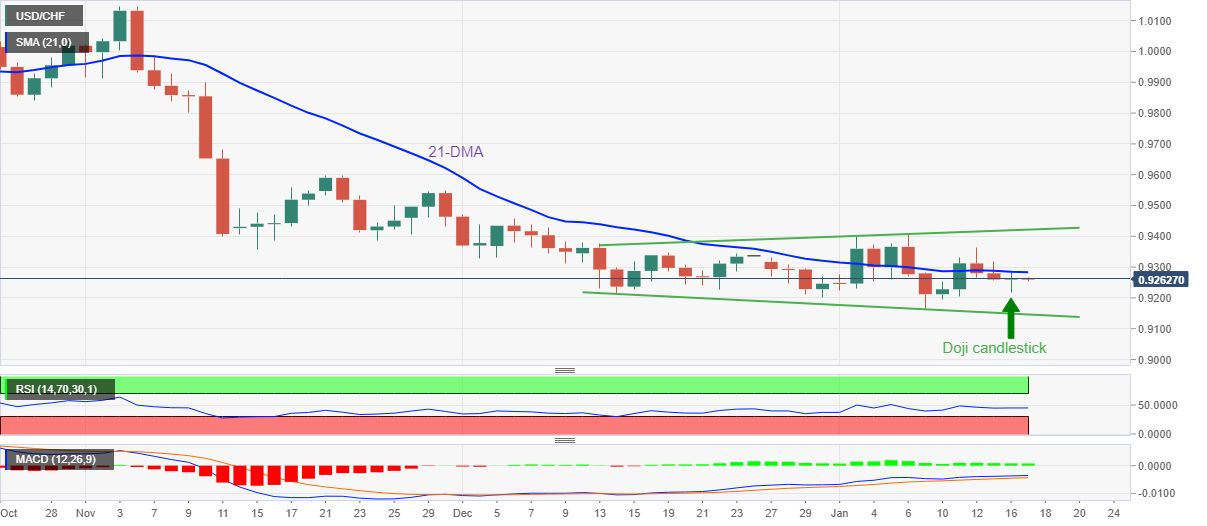
Trend: Limited downside expected
- EUR/USD bulls could be running into a wall of supply.
- EUR/USD Price Analysis: Bears have been capped and eyes are on 1.0720 is playing out as bears move in.
Following on from prior analysis on Monday, EUR/USD bulls remain in a precarious position on the charts, swamped by offers below the 1.0850s following a break of a microstructure around 1.0820. The following depicts the prospects of a significant breakout to the downside for the days ahead.
EUR/USD H4 chart
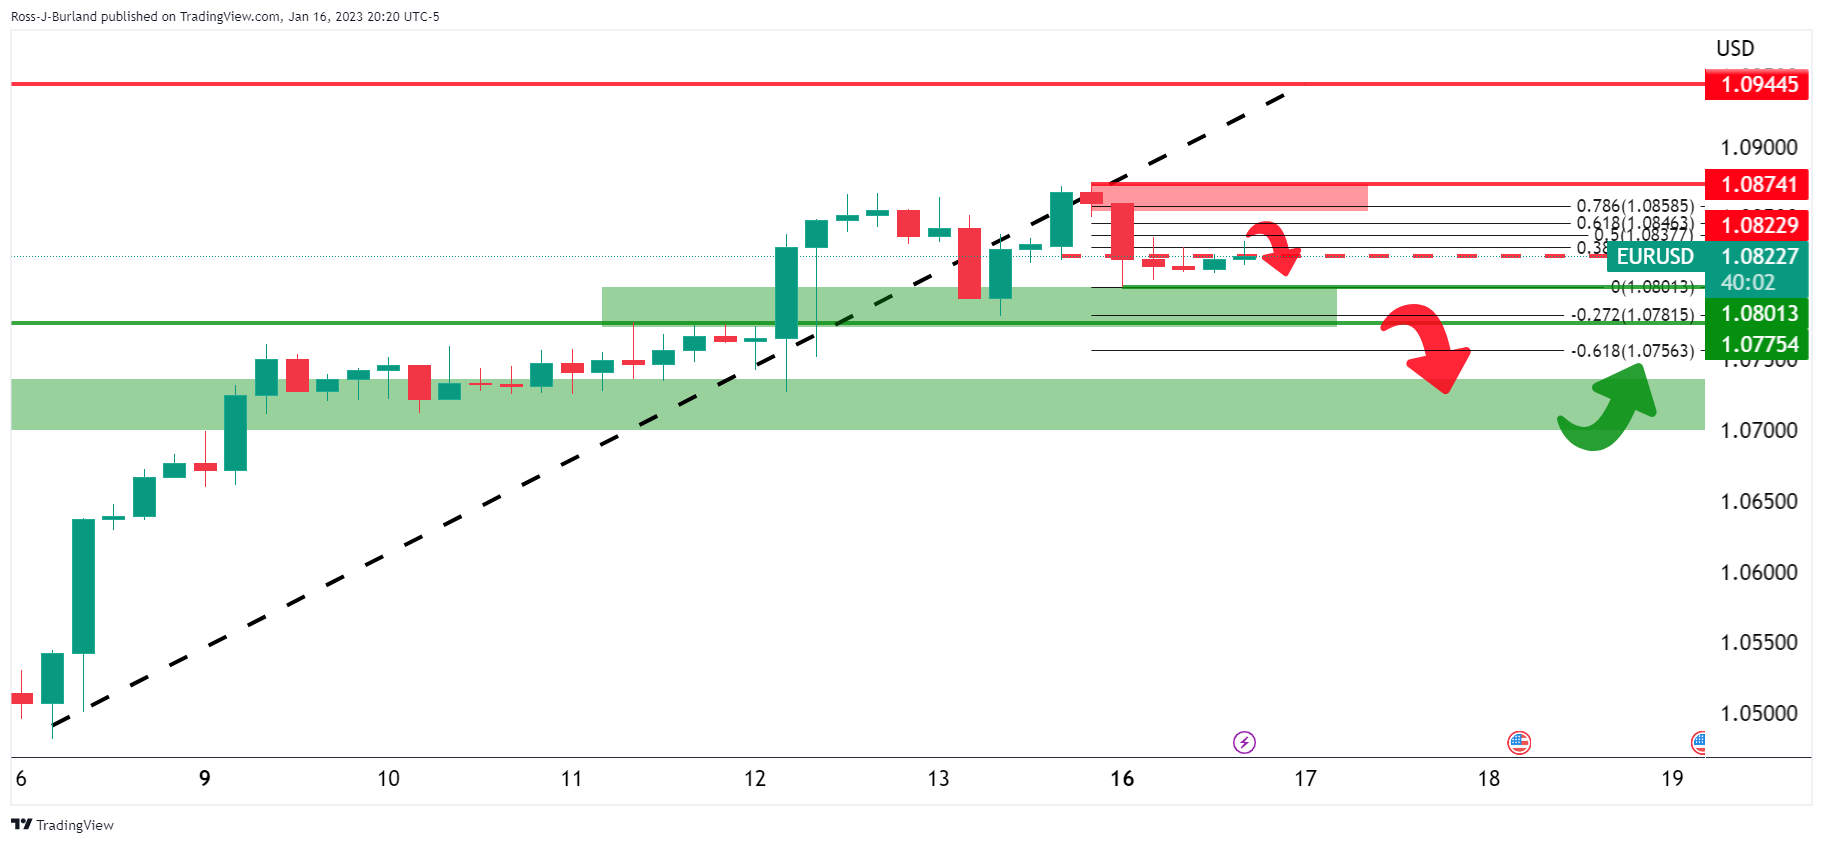
The price is moving into the 38.2% Fibonacci area as measured across the bearish impulse range between 1.0801 and 1.0874. Failures to break above the latter would be expected to see net shorts building up to swallow up the length that will eat into the in-the-money bulls from 1.0700 breakouts.
The above thesis is built upon the daily chart's W-formation as follows:
The W-pattern is a reverison formation and the price is expected to dip into the bullish impulse for a restest for prior structure if not all the way into the neckline.
- WTI struggles for clear directions after the week-start pullback from two-week top.
- US Dollar weakness jostles with market’s cautious mood to probe Oil buyers.
- Hopes of China demand, UAE Energy Minister’s comments keep WTI bulls hopeful.
WTI crude oil seesaws near $79.00 as energy traders await Chinese growth numbers during early Tuesday.
The black gold began the week’s trading on a negative note by reversing from the highest levels in two weeks as the US Dollar rebounds from a multi-month low despite the US holiday. However, the expectations of more Chinese energy demand and comments from the United Arab Emirates (UAE) Energy Minister seemed to have put a floor under the WTI crude oil prices.
US Dollar Index (DXY) fades bounce off the lowest levels since early June 2022, down 0.05% intraday near 102.30 by the press time, as the US Treasury bond yields retreat after an upside start to the week. That said, the benchmark US 10-year Treasury bond yields seesaw around 3.525% after extending the bounce off the one-month low the previous day. It’s worth noting that the two-year US bond coupons remain indecisive at around 4.25% by the press time.
Elsewhere, easing Covid restrictions allowed the world’s biggest oil consumer, China, to boost its energy import and favor WTI bulls. “China's crude imports rose 4% year-on-year in December, and an expected resurgence in travel for the Lunar New Year holiday at the end of the week raised the outlook for demand for transportation fuels,” per Reuters.
It should be noted that UAE Energy Minister Suhail al-Mazrouei said on Monday that oil markets were balanced, per Reuters. The news also quotes the diplomat as citing an imbalance in the gas market.
Moving on, China's Gross Domestic Product (GDP) for the fourth quarter (Q4), expected -0.8% QoQ versus 3.9% prior, will be crucial for energy traders to watch for clear directions. On the same line will be December month Industrial Production and Retail Sales data from the dragon nation. Should Beijing reports a positive surprise, the Oil price will have additional upside to track.
Technical analysis
WTI crude oil remains on the bull’s radar unless breaking the 50-DMA support near $78.40. The recovery moves, however, need to cross the downward-sloping resistance line from December 01, 2022, close to $80.85, to restore buyer’s confidence.
In recent trade today, the People’s Bank of China (PBOC) set the yuan (CNY) at 6.7222 vs. the previous fix of 6.7135 and the prior close of 6.7380.
About the fix
China maintains strict control of the yuan’s rate on the mainland.
The onshore yuan (CNY) differs from the offshore one (CNH) in trading restrictions, this last one is not as tightly controlled.
Each morning, the People’s Bank of China (PBOC) sets a so-called daily midpoint fix, based on the yuan’s previous day's closing level and quotations taken from the inter-bank dealer.
- EUR/GBP is marching towards 0.8880 amid soaring hawkish ECB bets.
- Bloomberg’s poll states that the ECB will achieve an interest rate peak at 3.25% by May.
- The Pound Sterling will dance to the tunes of UK employment data.
The EUR/GBP pair is aiming to recapture the crucial resistance of 0.8880 in the Asian session. The cross has remained sideways in a 0.8860-0.8875 range as investors are awaiting the release of the United Kingdom employment data for fresh impetus.
The asset recovered firmly on Monday from the critical support of 0.8850 after a Bloomberg poll on interest rate projections for the European Central Bank (ECB) indicated that the central bank will reach the terminal rate by May. According to the poll from Bloomberg, ECB President Christine Lagarde is expected to push interest rates to 3.25%. The central bank will announce 50 basis points (bps) interest rate hike in February and March and a 25 bps rate hike in May that will support the ECB in achieving a terminal rate from the current rate of 2%.
Also, ECB Governing Council member Olli Rehn cited on Monday, “I see significant rate hikes at the next meetings,”
On the United Kingdom front, the speech from Bank of England (BoE) Governor Andrew Bailey in which he assures inflation softening failed to provide strength to the Pound Sterling. However, BoE Governor is worried about rising wage growth, which could be a hurdle in decelerating inflation. He added that the major risk to BoE's central case for inflation coming down is the UK labor shortage.
On Tuesday, the UK labor data will hog the limelight. As per the projections, the Unemployment Rate for three months (Nov) is expected to remain steady at 3.7%. While the Average Earnings excluding bonus is expected to rise to 6.3% from the prior release of 6.1%. This might escalate the upside risk for inflation ahead.
- AUD/USD may have laid out the foundations for a bull trap.
- A move below the support of the 0.6950s could set off a landslide of stops and a mid-week-long squeeze, targeting the 0.6870s.
AUD/USD has been a volatile pair at the start of this year and has taken traders both ways around a 100-pip box which the following will illustrate. The bears are back inside and taking on the bull's commitments at a key juncture in the schematic of 2023. However, the bulls are seeking a break of the 0.6980s with prospects of regaining the 0.70s for the day ahead. Failures there, however, open risks of a significant move later in the week into the in-the-money longs that have been building since the break into the 0.68s:
AUD/USD H4 and H1 charts
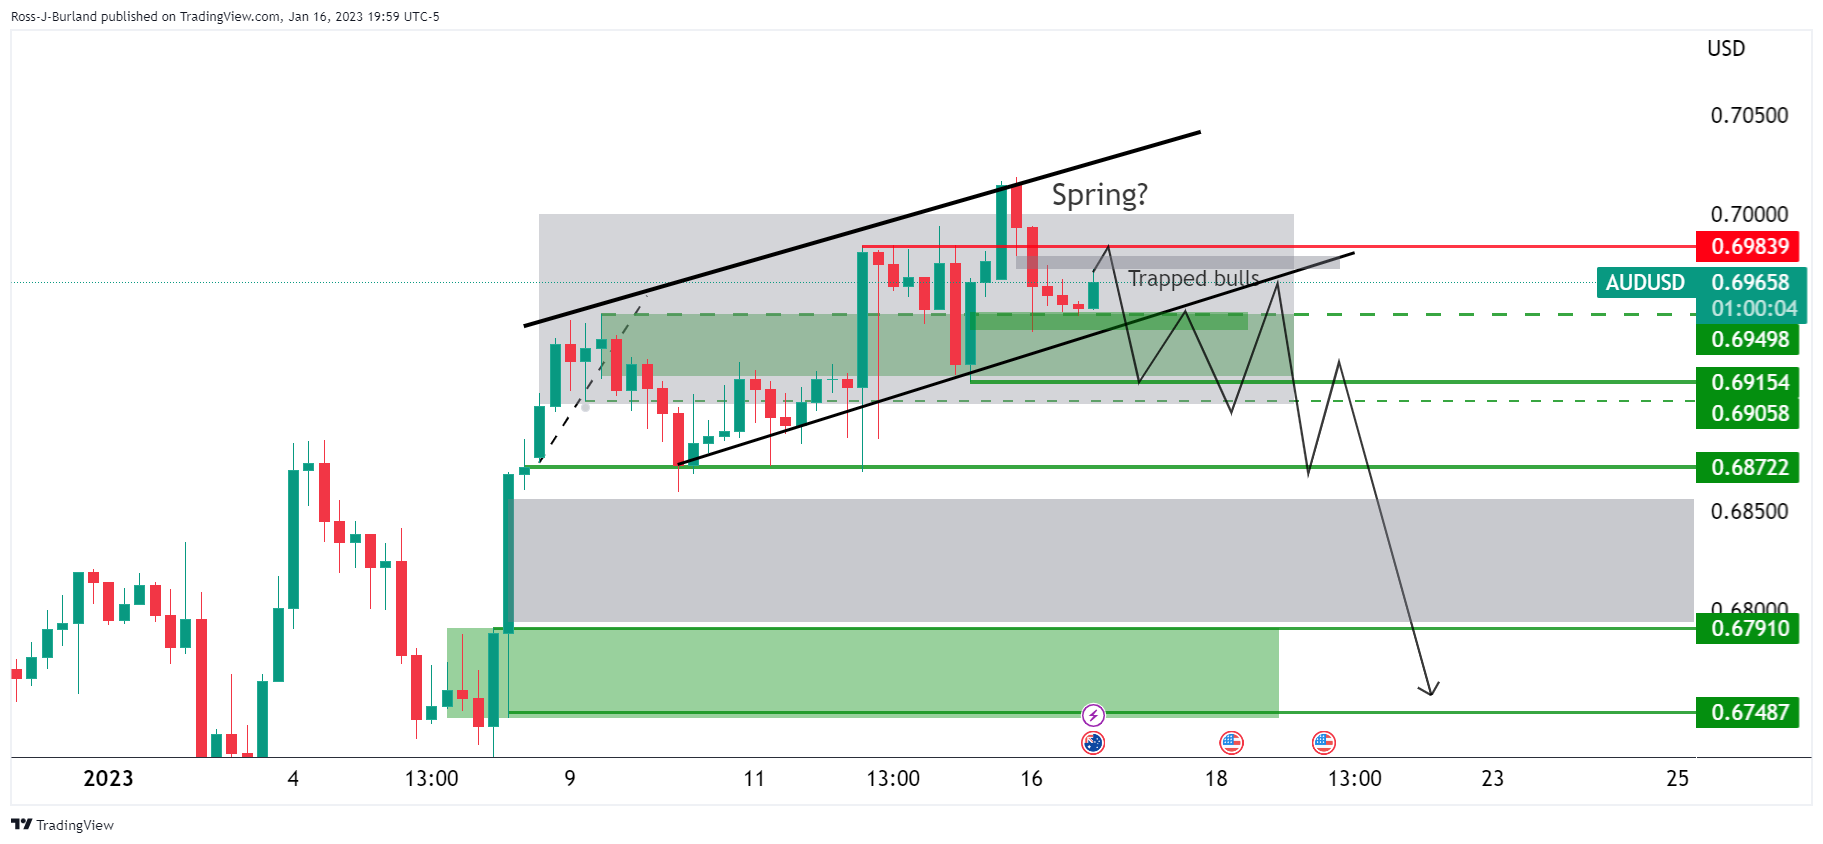
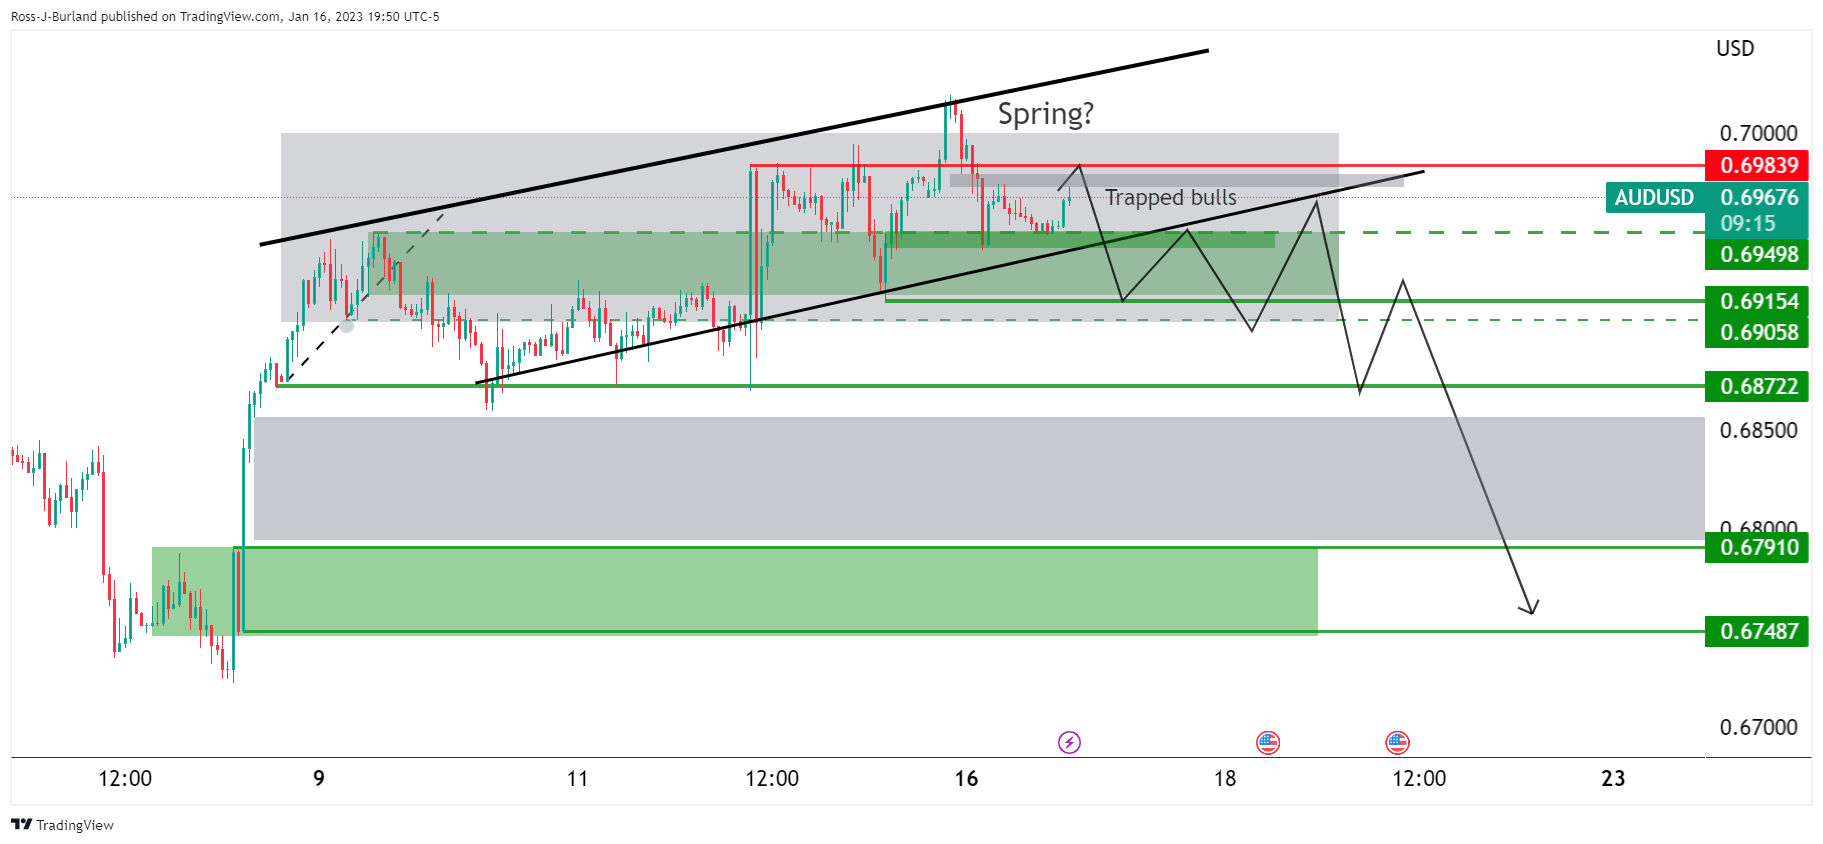
As shown, there is a channel being built but should the bears take over, then the bulls will be trapped and that spells danger for the stubborn hands targeting a breakout of the 0.69s this week. Instead, what could occur is a move below the support of the 0.6950s and a build-up of shorts that would trigger a significant blow-off into the price imbalance below the 0.6870s for the week's set-up to target space below 0.6790.
- Gold price is marching towards $1,920.00 as the risk-off impulse is fading away.
- A volatile action is expected from the US Dollar Index as the US markets are opening after a stretched weekend.
- A decline in the PPI figures is going to delight the Fed which is aiming to achieve price stability.
Gold price (XAU/USD) has scaled to near the critical resistance of $1,920.00 in the Asian session. The precious metal picked strength after sensing buying interest around $1,910.00 as the risk-off impulse is losing its grip.
S&P500 futures are aiming to recover their entire losses witnessed on Monday, portraying that investors are shrugging-off any sort of pessimism in an overall bullish market. The 10-year US Treasury yields have eased some gains and have dropped to 3.51%. Going forward, a volatile action is expected from the US Dollar Index (DXY) as the United States markets are opening after a stretched weekend.
Gold price is expected to display a power-pack action after the release of the US Producer Price Index (PPI) data, which will release on Wednesday. Investors should brace for a deceleration in the prices of goods and services at factory gates to match the decline in retail demand. A decline in the PPI figures is going to delight the Federal Reserve (Fed), which is making sheer efforts in achieving price stability in the US economy.
Apart from the US PPI, the release of the monthly Retail Sales data will be of utmost importance. As per the projections, the retail demand (Dec) will escalate by 0.1% vs. -0.6% reported earlier.
Gold technical analysis
Gold price has corrected after printing a fresh eight-month high at $1,929.00 on an hourly scale. The precious metal has turned sideways in a narrow range of $1,911-1,919 as investors await US PPI data. The 20-period Exponential Moving Average (EMA) at $1,915.54 is overlapping with the asset prices, which indicates a consolidation ahead.
Also, the Relative Strength Index (RSI) (14) is oscillating in a 40.00-60.00 range, which indicates that the asset is rangebound.
Gold hourly chart
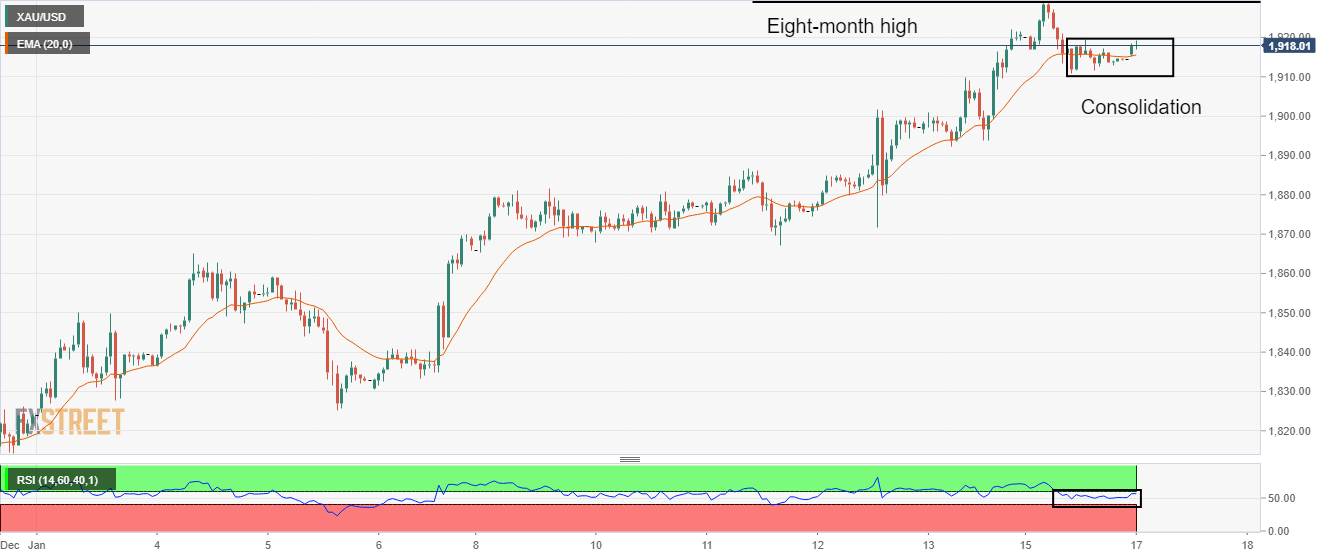
- GBP/USD picks up bids to reverse the week-start pullback from monthly high.
- Broad US Dollar retreat underpins Cable pair’s recovery ahead of the key jobs report.
- Chatters of Brexit-led labor shortage, workers’ strikes in the UK and hardships for UK PM Sunak probe GBP/USD bulls.
- BoE’s Bailey spread dovish remarks ahead of this week’s key data.
GBP/USD stays defensive around 1.2210, despite the downbeat week-start, as Cable traders await the key UK jobs report, up for publishing on early Tuesday. It’s worth noting that the multiple negatives surrounding the UK’s employment updates join the British political pessimism to probe the pair buyers even as the US Dollar Index (DXY) weakness underpins the recovery moves.
That said, the Financial Times (FT) quotes the latest statement from the UK in a Changing Europe and the Centre for European Reform think-tanks as it said that the post-Brexit UK economy is facing a shortfall of more than 300,000 workers as the result of ending free movement of labor with the EU.
On the same line, Reuters conveyed that teachers joining the employee strikes by joining nurses, rail workers and others in staging industrial action. “The National Education Union (NEU) said that the first strike would be on Feb. 1, a date when 100,000 public sector workers are due to strike in what could become Britain's biggest day of coordinated industrial action for decades,” mentioned Reuters.
Acting as an extra negative for the GBP/USD price could be the political hardships for UK Prime Minister (PM) Rishi Sunak as The Telegraph noted that the UK government backed down over Online Safety Bill after the Conservative rebellion.
On Monday, Bank of England (BOE) Governor Andrew Bailey testified against the Treasury Select Committee in London while stating that inflation looked set to fall markedly this year.
It should be noted that a retreat in the US Dollar Index (DXY) could be considered a major positive for the GBP/USD prices, despite the aforementioned price-negative catalysts. However, the Cable pair traders may wait for the UK employment data for fresh impulse.
That said, the UK’s Unemployment Rate for three months to November is expected to remain unchanged at 3.7% but a likely improvement in the Average Weekly Earnings might help the GBP/USD to remain firmer.
Also read: GBP/USD Weekly Forecast: Pound Sterling looks to 1.2450 in the UK inflation week
Technical analysis
A six-week-old horizontal resistance near 1.2345 appears a tough nut to crack for the GBP/USD bulls. Alternatively, the 100-day EMA level surrounding 1.1940 put a floor under the Cable prices.
| Index | Change, points | Closed | Change, % |
|---|---|---|---|
| NIKKEI 225 | -297.2 | 25822.32 | -1.14 |
| Hang Seng | 8.06 | 21746.72 | 0.04 |
| KOSPI | 13.77 | 2399.86 | 0.58 |
| ASX 200 | 60.1 | 7388.2 | 0.82 |
| FTSE 100 | 15.97 | 7860.07 | 0.2 |
| DAX | 47.52 | 15134.04 | 0.31 |
| CAC 40 | 19.81 | 7043.31 | 0.28 |
- USD/JPY has slipped below 128.50 after facing barricades around 129.00 ahead of BOJ policy.
- BOJ Governor might provide a roadmap to exit its long ultra-loose monetary policy.
- Analysts at GS see a further drop in USD/JPY by 3% to 125.00 due to US interest rates.
The USD/JPY pair has faced resistance while attempting to recapture the crucial resistance of 129.00 in the early Asian session. The asset has dropped below 128.50 and is likely to remain on the tenterhooks as investors are awaiting the announcement of the Bank of Japan (BoJ)’s first monetary policy of CY2023.
A recovery move in the S&P500 futures after a marginal sell-off on Monday is portraying that the risk-off impulse is fading away. However, the volatility will remain on Tuesday as United States markets will open after a stretched weekend. Meanwhile, the return on US Treasury bonds has escalated o 3.53%, which could trigger a caution among the market participants.
The US Dollar Index (DXY) is juggling around 102.00 after a recovery move on Monday. The USD Index witnessed a responsive buying action from the market participants but is likely to remain volatile as investors are shifting their focus toward the release of the United States Producer Price Index (PPI) data. The economic data is seen lower as declining gasoline prices have provided space for producers to trim prices of goods and services due to a decline in production costs.
On the Tokyo front, investors are awaiting the BOJ’s policy announcement for fresh cues. A shift in policy stance could be delivered by BOJ Governor Haruhiko Kuroda as the central bank is aiming to exit from its secular-long ultra-loose monetary policy. Japan Chief Cabinet secretary, Hirokazu Matsuno said on Monday, he “expects the Bank of Japan (BoJ) to continue with appropriate monetary policy, taking into account economic, prices and the financial situation.
Over USD/JPY projection, Analysts at Goldman Sachs (GS) anticipate the Yen pair to decline further by suggesting a 3.0% drop, or a fall to just below the 125.00 level. However, the GS also states that the bigger driver of the cross should be US interest rates rather than domestic monetary policy.
- US Dollar Index fades the week-start rebound from the lowest levels since June 2022.
- US Treasury bond yields struggle for clear directions amid mixed clues about Fed policy pivot.
- Long weekend in the US markets also allowed DXY to lick its wounds before recalling the bears.
- China Q4 GDP, US Retail Sales for December are the key for US Dollar Index watchers.
US Dollar Index (DXY) fails to extend the week-start recovery moves, easing back to 102.30 during the early hours of Tuesday, as full markets probe US Treasury bond sellers amid easing fears of high inflation and concerns surrounding the US “soft landing”.
That said, the benchmark US 10-year Treasury bond yields seesaw around 3.525% after extending the bounce off the one-month low the previous day. It’s worth noting that the two-year US bond coupons remain indecisive at around 4.25% by the press time.
The greenback’s gauge versus the six major currencies might have cheered Friday’s upbeat prints of the Michigan Consumer Sentiment Index (CSI) and 5-year inflation expectations to bounce off a multi-day low the previous day. However, China-inspired market optimism and concerns surrounding easing inflation fears, as per the latest US Consumer Price Index (CPI) and figures relating to wages and activities, seemed to have probed the DXY rebound.
Also challenging the US Dollar Index recovery could be the cautious mood ahead of China's Gross Domestic Product (GDP) for the fourth quarter (Q4) and the US Retail Sales for December, up for publishing on Tuesday and Wednesday respectively.
Amid these plays, S&P 500 Futures retreat from a one-month high, down 0.20% intraday near 4,009 at the latest. It’s worth noting that the equities in Europe and the UK managed to close with mild gains on Monday, which in turn probe DXY bulls.
Looking forward, a light calendar may test DXY traders even as the return of the full markets could portray US Dollar Index moves. That said, China's Q4 GDP is expected to print a contraction and can allow the greenback to defend the latest gains. However, any positive surprise could exert more downside pressure on the DXY amid Beijing-inspired optimism in the market, as well as due to the dovish concerns surrounding the Fed. Following that, a likely improvement in the US Retail Sales for December may also help the DXY to pare the monthly loss in case of an upbeat outcome.
Technical analysis
A one-month-old bearish channel, currently between 101.45 and 104.65, keeps US Dollar Index sellers hopeful.
| Pare | Closed | Change, % |
|---|---|---|
| AUDUSD | 0.69526 | -0.22 |
| EURJPY | 139.065 | 0.51 |
| EURUSD | 1.08216 | -0.07 |
| GBPJPY | 156.721 | 0.5 |
| GBPUSD | 1.21954 | -0.08 |
| NZDUSD | 0.63788 | 0.04 |
| USDCAD | 1.34088 | 0.2 |
| USDCHF | 0.92626 | 0.09 |
| USDJPY | 128.511 | 0.6 |


© 2000-2026. Bản quyền Teletrade.
Trang web này được quản lý bởi Teletrade D.J. LLC 2351 LLC 2022 (Euro House, Richmond Hill Road, Kingstown, VC0100, St. Vincent and the Grenadines).
Thông tin trên trang web không phải là cơ sở để đưa ra quyết định đầu tư và chỉ được cung cấp cho mục đích làm quen.
Giao dịch trên thị trường tài chính (đặc biệt là giao dịch sử dụng các công cụ biên) mở ra những cơ hội lớn và tạo điều kiện cho các nhà đầu tư sẵn sàng mạo hiểm để thu lợi nhuận, tuy nhiên nó mang trong mình nguy cơ rủi ro khá cao. Chính vì vậy trước khi tiến hành giao dịch cần phải xem xét mọi mặt vấn đề chấp nhận tiến hành giao dịch cụ thể xét theo quan điểm của nguồn lực tài chính sẵn có và mức độ am hiểu thị trường tài chính.
Sử dụng thông tin: sử dụng toàn bộ hay riêng biệt các dữ liệu trên trang web của công ty TeleTrade như một nguồn cung cấp thông tin nhất định. Việc sử dụng tư liệu từ trang web cần kèm theo liên kết đến trang teletrade.vn. Việc tự động thu thập số liệu cũng như thông tin từ trang web TeleTrade đều không được phép.
Xin vui lòng liên hệ với pr@teletrade.global nếu có câu hỏi.
ngân hàng