- Phân tích
- Tin tức và các công cụ
- Tin tức thị trường
Tin tức thì trường
- USD/JPY whipsawed around BoJ mystery.
- It is likely speculation of another adjustment to YCC will build again in March.
USD/JPY is down some 0.2% as we head into Tokyo following a turbulent time over the past few session due to the Bank of Japan deliberations that resulted in a surprise for financial markets not knowing at first quite what to make of it. At the time of writing, USD/JPY is trading at 128.58 and has moved within a range of between 128.44 and 128.88.
BoJ unravelled
To unravel the mystery behind the Bank of Japan here, a number of insights from various banks make for informative reading. Firstly, analysts at Westpac summed up the BoJ event as follows: ''The BoJ opted to keep the 10yr JGB yield target range at +/-0.5%, made no change to short end rates or the outlook and while nudging up CPI forecasts slightly, still projected core inflation below the 2% target by 2024. This sparked a bounce in USD/JPY from 128.50 to as high as 131.58, later steadying around 130.75 as Governor Kuroda spoke. The decision to keep loose policy sparked a sharp rally in Japanese equities, the Nikkei 225 closing up 2.5%.''
Looking forward, the BoJ — despite many arguments to the contrary — is expected to initiate a monetary tightening in the near future that will significantly support the yen, analysts at Commerzbank argued: ''But especially if the BoJ tightens its monetary policy now, that argues for the yen to remain a low-interest rate currency (and thus arguably a safe haven, much like the Swiss franc and gold). Because it then becomes likely that Japan will also remain a special case in terms of its return to zero or low inflation.''
The next BoJ policy meeting is scheduled for March 10. This will be the final meeting for Governor Kuroda. ''By the time the April BoJ meeting takes place, with the new governor in place, the outcome of the spring wage talks should be known. Additionally, both January and February CPI inflation releases will have been printed, in addition to Japanese Q4 GDP and a range of activity indicators for the early part of this year. This suggests that any further widening in the YCC band could be delayed until April,'' analysts at Rabobank explained who argue that It is very unlikely that there will be an aggressive change in BoJ policy settings this year.
''It is likely speculation of another adjustment to YCC will build again in March, although we would expect the April meeting to be a more likely source of change. Our 1 month USD/JPY130 forecast crudely reflects our view that both today’s and March’s policy meetings could bring steady policy,'' the analysts at Rabobank argued. ''That said, we forecast USD/JPY at 128 in a 3-month view and 126 in 6 months.''
- Hawkish commentaries from Fed policymakers have infused fresh blood into the US Dollar.
- A Spinning Top formation indicates indecisiveness in investors’ sentiment for further action.
- Upward-sloping 20-EMA and oscillation of the RSI (14) in the bullish range still favor the upside bias.
The NZD/USD pair is displaying a sideways auction profile in the early Asian session after a sell-off from above the psychological resistance of 0.6500 on Wednesday. The Kiwi asset is expected to witness pressure ahead as the risk appetite of the market participants has dropped vigorously after hawkish commentaries from Federal Reserve (Fed) policymakers.
S&P500 witnessed a massive sell-off amidst earnings season as lower bargaining power in the favor of producers will trim operating margins. Also, lower inflation projections due to the soft Producers Price Index (PPI) report were responsible for a plunge in the 10-year US Treasury yields to 3.37%. The US Dollar Index (DXY) is juggling around 102.00 after a V-shape recovery from a fresh seven-month low at 101.20.
NZD/USD is demonstrating signs of a bearish reversal led by the formation of a Spinning Top candlestick pattern. The aforementioned candlestick indicates indecisiveness in the sentiment of investors for further action, which also marks a reversal in the ongoing trend.
Other filters such as Exponential Moving Averages and momentum oscillators have not displayed signs of reversal yet, due to their lagging characteristic.
The 20-period EMA at 0.6366 is still upward-sloping, which adds to the upside filters.
Meanwhile, the Relative Strength Index (RSI) (14) has shifted into the bullish range of 60.00-80.00 but still needs to sustain above for bullish momentum.
For a downside move, a breakdown below January 16 high at 0.6426 will drag the Kiwi asset toward January 17 low at 0.6366 followed by January 12 low around 0.6300.
On the contrary, a decisive break above Wednesday’s high at 0.6530 will drive the asset toward June 3 high at 0.6576. A breach of the latter will expose the asset to the round-level resistance at 0.6600.
NZD/USD daily chart
-638096827773212687.png)
December month employment statistics from the Australian Bureau of Statistics, up for publishing at 00:30 GMT on Thursday, will be the immediate catalyst for the AUD/USD pair traders.
Market consensus suggests that the headline Unemployment Rate may remain unchanged at 3.4% on a seasonally adjusted basis whereas Employment Change could ease to 22.5K versus the previous addition of 64.0K. Further, the Participation Rate is expected to remain unchanged at 66.8% prior level.
Considering the Reserve Bank of Australia (RBA) policymakers’ recent retreat from the hawkish bias, in line with their global counterpart, today’s Aussie jobs report become crucial for the AUD/USD pair traders.
Ahead of the event, analysts at Westpac said,
Leading indicators suggest there will be another robust print for employment growth in December (Westpac forecast: 30k). The unemployment rate should meanwhile hold steady (Westpac forecast: 3.4%).
On the same line, analysts at the ANZ mentioned,
Given the tightness in the labor market, we expect solid employment growth to have continued in December with a 35k rise, participation to stay around November’s record high and the unemployment rate to remain steady at 3.4%. While job vacancies dropped 5% q/q in November, they are still very high relative to history and NAB’s Employment Index is also well above average.
How could the data affect AUD/USD?
AUD/USD picks up bids to consolidate the biggest daily loss in two weeks while staying around the highest levels since mid-August 2022, mildly bid near 0.6945 by the press time. In doing so, the Aussie pair cheers the broad US Dollar weakness and stays hopeful of witnessing upbeat data, not to forget cautious optimism in the market.
However, the recent Fed talks suggest a hawkish move and contrast the other central bankers which are on the verge of announcing less aggressive monetary policies going forward. As a result, the market’s sentiment remains mixed and can weigh on the AUD/USD prices should the scheduled Aussie numbers fail to impress the pair buyers.
Technically, Wednesday’s U-turn from the highest levels since mid-August 2022 portrays a rising wedge bearish chart pattern on the daily formation, currently between 0.7020 and 0.6810.
Key Notes
AUD/USD pauses pullback from five-month high near 0.6950 ahead of Aussie employment data
AUD/USD Forecast: Bearish case should gain adepts once below 0.6930
About the Employment Change
The Employment Change released by the Australian Bureau of Statistics is a measure of the change in the number of employed people in Australia. Generally speaking, a rise in this indicator has positive implications for consumer spending which stimulates economic growth. Therefore, a high reading is seen as positive (or bullish) for the AUD, while a low reading is seen as negative (or bearish).
About the Unemployment Rate
The Unemployment Rate released by the Australian Bureau of Statistics is the number of unemployed workers divided by the total civilian labor force. If the rate hikes, indicates a lack of expansion within the Australian labor market. As a result, a rise leads to weaken the Australian economy. A decrease of the figure is seen as positive (or bullish) for the AUD, while an increase is seen as negative (or bearish).
- WTI remains pressured after reversing from six-week high.
- Fears of US recession supersede hopes of more energy demand from China.
- Firmer US Dollar, hawkish Fedspeak also exert downside pressure on the Oil price.
- EIA inventories, risk catalysts will be crucial for fresh impulse.
WTI crude oil holds lower ground near $79.50 amid early Thursday, after witnessing a heavy sell-off from the 1.5-month high the previous day. In doing so, the black gold struggles to justify the hopes of more energy demand from China amid fresh economic slowdown fears emanating from the US. Also exerting downside pressure on the energy benchmark could be the firmer US Dollar and the recently hawkish comments from the Federal Reserve (Fed) officials.
Downbeat US data renewed fears of economic slowdown and weighed on the Oil prices the previous day. That said, US Retail Sales marked the biggest slump in a year while posting 1.1% MoM contraction for December, versus -0.8% market forecasts and -1.0% prior (revised). On the same line, Producer Price Index dropped to the lowest levels in six months with -0.5% MoM figure compared to -0.1% expected and 0.2% prior (revised).
Even so, the Fed policymakers remained hawkish as St. Louis Federal Reserve's President James Bullard said US interest rates have to rise further to ensure that inflationary pressures recede. On the same line, President of the Federal Reserve Bank of Cleveland Loretta Mester praised the Fed’s actions to tame inflation and Kansas City Fed President Esther George mentioned that the central bank must restore price stability, "that means returning to 2% inflation." Recently, Dallas Federal Reserve President Lorie Logan supported slower rate hike pace but also mentioned possibly higher stopping point.
Elsewhere, analysts at the Goldman Sachs expected stronger China growth and favored hopes of more energy demand from the dragon nation. However, fears of the US-China tension outweigh the optimism of late. US Treasury Secretary Janet Yellen and Chinese China’s Vice Premier Liu He met in Germany on Wednesday and initially boosted the risk appetite, together with the BOJ’s inaction. However, the diplomats’ mentioning of the areas of disagreement raised market fears of another round of US-China tension. Previously, the South China Morning Post (SCMP) mentioned that Beijing ‘should be wary’ as the US and Taiwan seeks closer economic ties.
On a different page, the American Petroleum Institute’s (API) Weekly Crude Oil Stock came in as 7.615M versus 14.865M prior.
Amid these plays, Wall Street closed in the red and yields were down too while the US Dollar recovered after refreshing the lowest levels since late May. That said, the US Dollar Index (DXY) also bounced off the lowest levels since May 31.
Moving on, risk catalysts will be more important than the weekly oil inventory data from the US Energy Information Administration, expected -1.75M versus 18.962M prior.
Technical analysis
Despite failing to cross the 100-DMA, around $81.90 by the press time, the WTI crude oil price remains above the 50-DMA support surrounding $78.20, which in turn suggests limited downside for the black gold.
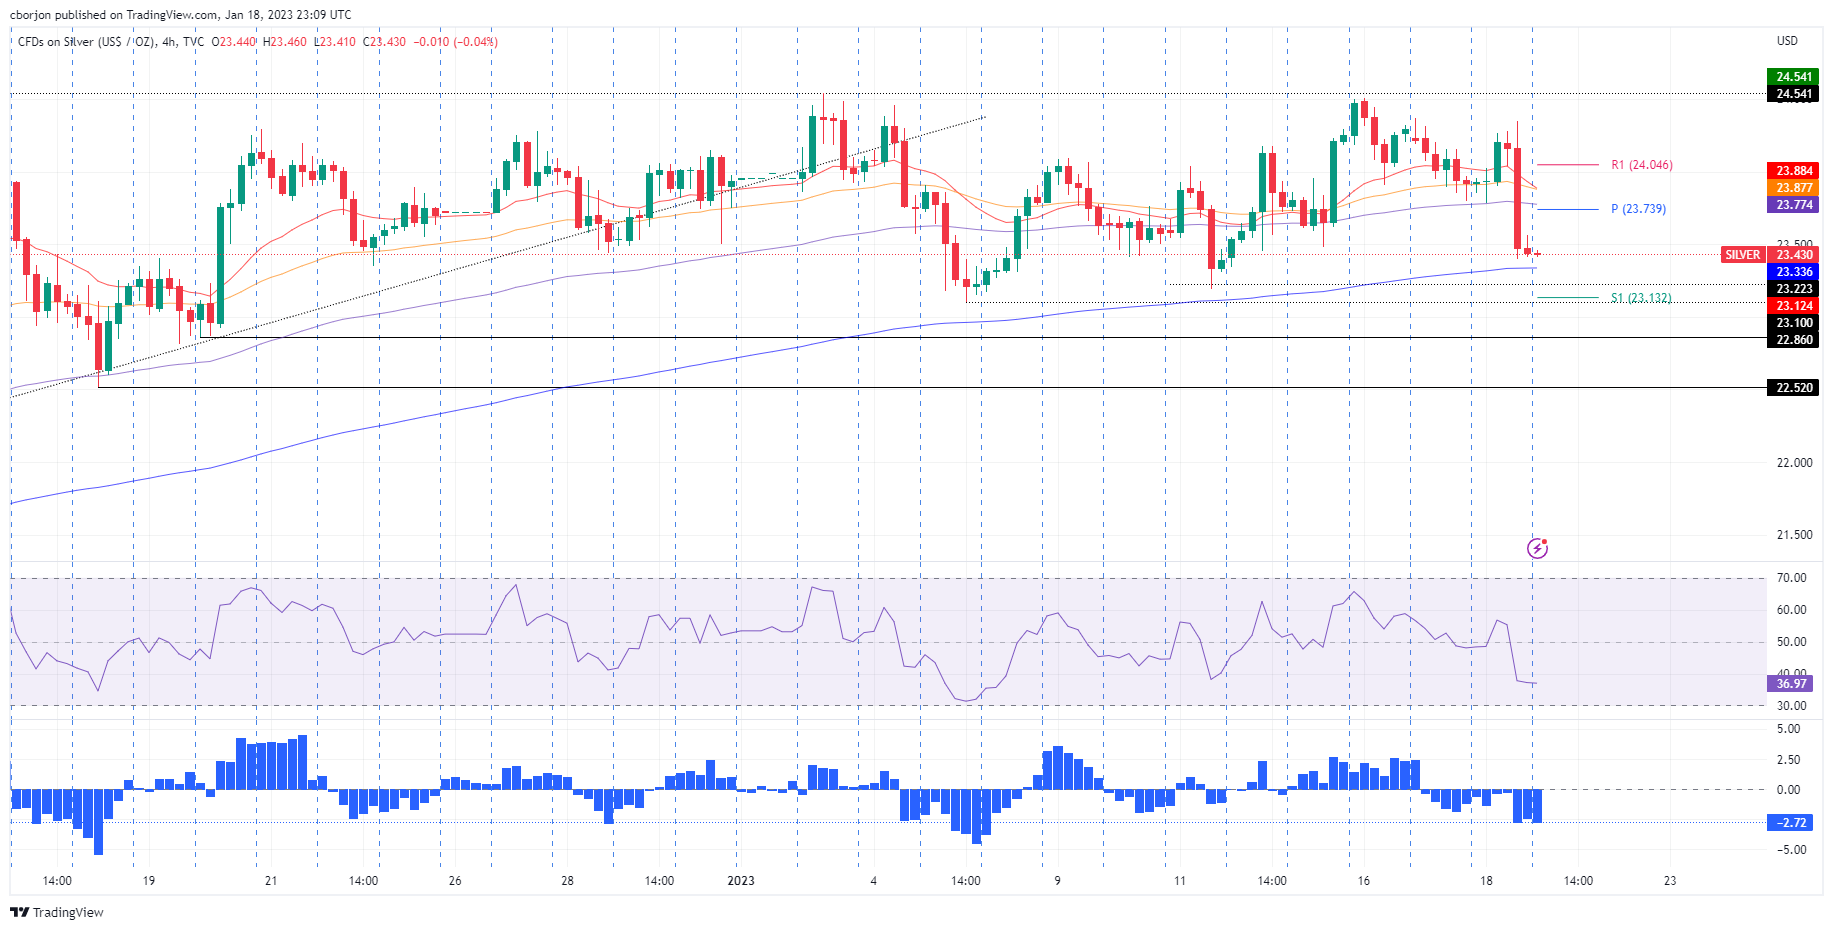
- Silver extended its losses to two-consecutive days, down by 1.97% on Wednesday.
- From a daily chart perspective, the XAG/USD is neutral to upward biased but needs to hold prices above $23.00 to extend its gains.
- XAG/USD Price Analysis: Neutral-to-downward biased, and once it clears $23.00, that could expose Silver to lower prices.
Silver price plummeted for the second straight day, extending its losses below $23.50 on Wednesday, as late US Dollar (USD) strength erased the greenback losses in the day, a headwind for the white metal. At the time of writing, the XAG/USD is trading at $23.45, below its opening price by 1.97%.
Silver Price Forecast: XAG/USD Technical Outlook
The XAG/USD daily chart suggests Silver is neutral-to-upward biased. Even though the pullback cleared the 20-day Exponential Moving Average (EMA), a decisive break below the January 5 daily low of $23.12 is needed to shift the bias to neutral; additionally, it will expose the 50-day EMA at $22.86. Oscillators like the Relative Strength Index (RSI) suggest that sellers are beginning to gather momentum, so the last line of defense for XAG/USD buyers would be $23.00.
Analyzing Silver from an intraday perspective, the XAG/USD 4-hour chart portrays the pair as neutral-to-downward biased, as the Exponential Moving Averages (EMAs) reside above XAG/USD price. However, to further extend its downtrend, the white metal needs to clear the 200-EMA at $23.33, which, once cleared, could open the door for further losses. Therefore, the XAG/USD first support would be the January 5 swing low at $23.22. Once cleared, it would expose the December 19 daily low of $23.10, followed by the December 16 pivot low at $22.52.
Silver Key Technical Levels
- USD/CHF is expected to extend its gains above 0.9180 considering the strength in the USD Index.
- The lower-than-projected US PPI report weighed heavily on S&P500 and US Treasury yields.
- Fed Harker sees inflation at 2% in CY2025 and a terminal rate in a 5.25-5.50% range despite lower retail demand.
The USD/CHF pair is oscillating in a narrow range below the crucial hurdle of 0.9180 in the early Tokyo session. On Wednesday, the Swiss Franc asset displayed a V-shape recovery after recording a fresh 14-month low at 0.9085 as the United States Producer Price Index (PPI) and retail sales December report remained lower than anticipation. Hawkish commentaries from Federal Reserve (Fed) policymakers remained responsible for infusing strength into the US Dollar again and pushing USD/CHF to near 0.9180.
Declining prices of goods and services at factory gates, according to the US PPI report, triggered the risk of expensive valuation for equities due to lower projections for net profit margins. This forced investors to dump US stocks, which weighed heavily on S&P500 and supported the risk-aversion theme. Also, it sent the return on US Treasury bonds into the bearish territory as the lower Producer Price Index is a pre-requisite for lower Consumer Price Index (CPI) projections. The 10-year US Treasury yields nosedived to 3.37%.
Hawkish commentaries from Fed policymakers came as a savior for the US Dollar Index (DXY). Although Fed policymakers are favoring slowing down the pace of hiking interest rates but expect terminal rate projection steady in a 5.25-5.50% range and achievement of 2% inflation in CY2025, cited by Philadelphia Fed President Patrick Harker, as reported Reuters.
Meanwhile, Swiss franc investors are awaiting the release of the Producer and Import Prices (Dec) data, which is scheduled for Thursday. According to the consensus, annual data will drop to 3.1% vs. the former release of 3.8%. While the monthly data will expand by 0.1% against a contraction of 0.5% released earlier.
More than half of Japanese companies, 53% to be exact, are planning to raise wages this year, according to a Reuters monthly poll. This meets a key request from Prime Minister Fumio Kishida to help workers cope with surging consumer prices, reported Reuters.
Also read: Japan’s PM Kishida calls on firms to give wage hikes that exceed inflation
Additional findings
Ahead of spring "shunto" labour negotiations, managers at 24% of the companies polled said they planned on across-the-board bumps in base salary along with regularly scheduled wage increases. Another 29% said they would carry out regular pay increases only, while 38% were undecided.
A total of 34% of firms said they planned wage increases of at least 3%, a jump from 10% in a Reuters survey in October.
The survey showed companies are less eager to bear the brunt of another Kishida plan: unprecedented military spending to counter growing threats from China and North Korea.
Among 495 firms polled, 54% supported the defence spending plan, but just 29% backed the increase in corporate tax rates.
Asked what expenses would be curtailed if corporate levies go up, the top answer was capital spending, at 42%, followed by dividends and wages.
On the overall business environment, corporate managers turned slightly more pessimistic, with 81% saying conditions would be "not so good" to "bad" in the next three months, compared with 77% in the December survey.
USD/JPY retreats
Following the news, USD/JPY fades the bounce off 127.57 while declining to 128.60 by the press time.
- EUR/USD holds lower ground inside a one-week-old bullish chart pattern.
- 50-SMA restricts immediate downside but bearish MACD signals, steady RSI hints at further weakness.
- Monthly horizontal support, 200-SMA add to the downside filters.
- Bulls need validation from 1.0890 to break the monotony.
EUR/USD stays pressured around 1.0790 amid the early hours of Thursday’s Asian session, after refreshing the nine-month high but posting a daily negative. In doing so, the major currency pair remains inside a weekly bullish channel, poking the 50-SMA immediate support as of late.
However, the bearish MACD signals and steady RSI (14), not to forget the weekly trading range, keeps the EUR/USD sellers hopeful of breaking the 1.0780 immediate support and approaching the 1.0770 key level comprising the stated channel’s lower line.
It’s worth noting that the quote’s weakness past 1.0770 could quickly drag it to the horizontal area comprising levels marked since 2022’s end, around 1.0710. Following that, the 200-SMA level of 1.0642 could probe the EUR/USD bears.
Alternatively, recovery moves may initially aim for the 1.0830 hurdle before challenging the aforementioned channel’s top line, close to 1.0890 by the press time.
Also acting as an upside filter is the 1.0900 threshold, a break of which could propel the EUR/USD prices towards poking the April 2022 peak near 1.0935. Even so, lows marked during late March 2022, around 1.0945 could challenge the EUR/USD buyers afterward.
EUR/USD: Four-hour chart
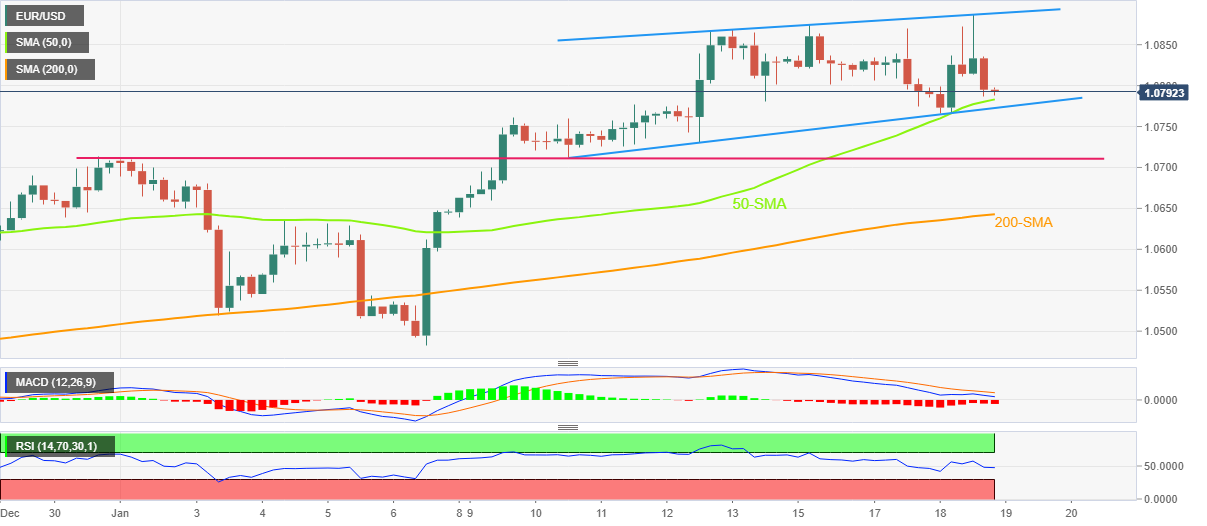
Trend: Further downside expected
- GBP/USD is jugging below 1.2350, preparing for further downside amid a risk-off mood.
- Fed Harker sees the achievement of 2% inflation in CY2025 but has favored slower rate hikes ahead.
- The BOE might continue its hawkish stance on interest rates despite a lower-than-expected December inflation report.
The GBP/USD pair is displaying back-and-forth moves after a south-side drive below the critical resistance of 1.2350 in the early Tokyo session. The Cable witnessed sheer selling pressure on Wednesday after failing to sustain above 1.2435 as hawkish commentaries from Federal Reserve (Fed) policymakers trimmed the risk appetite of the market participants heavily.
Weaker-than-projected United States Producer Price Index (PPI) and Retail Sales data weighed on S&P500. The 500-stock basket weighed down as lower PPI and retail sales figures guarantee that firms will demonstrate weaker operating margins amidst the quarterly earnings season. However, a meaningful drop in the prices of goods and services at factory gates supports weaker inflation projections, which resulted in a heavy drop in the 10-year US Treasury yields to 3.37%.
Contrary to the plunging yields, the US Dollar Index (DXY) displayed a V-shape recovery after refreshing its seven-month low at 101.20 and recaptured the critical resistance of 102.00. The release of the lower-than-anticipated US PPI and Retail Sales data failed to trim the hawkish stance in Fed policymakers’ commentaries.
To achieve price stability in the United States economy, St. Louis Fed's President James Bullard still sees the interest rate peak in a 5.25-5.50% range. Also, Philadelphia Fed President Patrick Harker favored slower interest rates hike ahead but see inflation at 2% in CY2025, which indicates that Fed chair Jerome Powell will remain restrictive beyond CY2024.
On the United Kingdom front, inflation softening below expectations both in headline and core numbers might fail to restrict the Bank of England (BOE) from hiking interest rates further. A note from ING states that "Depending on the resilience of December UK CPI data, it seems too early to dismiss the risk of another 50 basis points (bps) rate hike.”
- USD/CAD has witnessed an intermediate resistance around 1.3500 after a juggernaut rally.
- US equities witnessed a massive sell-off as retail demand and PPI figures dropped heavily.
- Fed’s Bullard remained restrictive on interest rate projections despite weaker inflation projections.
The USD/CAD pair has witnessed a pause after a juggernaut rally around the psychological resistance of 1.3500 in the early Asian session. The Loonie asset is expected to turn sideways as the US Dollar bulls will need more fuel to extend the rally further. The major witnessed a steep fall amid a plunge in the oil price, which weakened the Canadian Dollar.
S&P500 witnessed an intense sell-off from the market participants after a lower-than-projected release of the United States Producer Price Index (PPI) and monthly Retail Sales data. The fight against stubborn inflation is demanding a cost from the economy in terms of weaker bargaining power in favor of producers and lower productivity due to rising interest rates by the Federal Reserve (Fed).
A sheer decline in the headline PPI (Dec) to 6.2% on an annual basis vs. the expectations of 6.8% and core PPI at 5.5% against the consensus of 5.9%, cleared that producers are forced to trim the prices of goods and services to maintain equilibrium due to declined retail demand. Apart from that, monthly Retail Sales data contracted by 1.1% while the street was expecting a contraction of -0.8%.
A decline in the US economic data cleared that inflation projections are expected to trim further, which supported the demand for US government bonds and a nosedive move in the 10-year US Treasury yields to 3.37%. The US Dollar Index (DXY) sensed a recovery after recording a fresh seven-month low at 101.20 to near 102.00 after hawkish commentary from St. Louis Fed's President James Bullard. Fed policymaker projected the interest rate peak in a 5.25-5.50% range despite a sheer fall in US PPI and Retail Sales data.
On the oil front, oil prices dropped firmly as weaker retail demand in the United States is going to trim oil demand. Producers will be forced to slash their production activities amid falling retail demand, which might impact oil demand heavily. This led to a plunge in the oil price to $79.40. It is worth noting that Canada is a leading oil exporter to the United States and lower oil prices may impact the Canadian Dollar.
Dallas Federal Reserve President Lorie Logan laid out a case for slowing the pace of the U.S. central bank's interest-rate hikes so as to better calibrate monetary policy to an uncertain economic outlook, but signaled rates could ultimately rise further than many now expect, reported Reuters on late Wednesday.
Key comments
If you’re on a road trip and you encounter foggy weather or a dangerous highway, it’s a good idea to slow down.
That’s why I supported the (Fed's) decision last month to reduce the pace of rate increases. And the same considerations suggest slowing the pace further at the upcoming meeting.
My own view is that we will likely need to continue gradually raising the Fed funds rate until we see convincing evidence that inflation is on track to return to our 2% target in a sustainable and timely way.
The most important risk I see is that if we tighten too little, the economy will remain overheated, and we will fail to keep inflation in check.
Need to be flexible, robust.
Not helpful at this time to lock in peak rate or precise rate path.
Some signs of slower labor market, but would need to see a lot more data to be convinced it is no longer overheated.
Tightening too much or too fast could weaken labor market more than necessary.
Confident we have room to continue reducing balance sheet 'for quite some time'.
Would be comfortable seeing temporary use of fed's standing repo facility.
Market reaction
Considering the usual inactivity during the early market hours on Thursday, the US Dollar remained unimpressive of these comments while keeping the late Wednesday’s rebound from the lowest levels since May 31, 2022.
- AUD/USD remains sidelined after positing the daily loss by reversing from five-month high.
- Sour sentiment, cautious mood ahead of Aussie data underpinned AUD/USD weakness.
- Hawkish Fedspeak, fears of US recession and mixed headlines on China gained major attention.
- Australian employment numbers for December will be crucial amid fears of east rate hikes.
AUD/USD stabilizes around the mid-0.6900s as traders await the key Australia jobs report for December, after taking a U-turn from the highest levels in nearly five months and posting the biggest daily loss in a fortnight the previous day.
The Aussie pair’s losses on Wednesday could be linked to the market’s fresh fears of recession, even if the Bank of Japan (BOJ) tried to please the bulls earlier in the day. Adding strength to the bearish move could be the mixed headlines surrounding China and the cautious mood ahead of Australia’s December employment data.
The risk-aversion could be linked to the hawkish Fedspeak and downbeat US data, as well as fears of the US-China tension.
That said, St. Louis Federal Reserve's President James Bullard said US interest rates have to rise further to ensure that inflationary pressures recede. On the same line, President of the Federal Reserve Bank of Cleveland Loretta Mester praised the Fed’s actions to tame inflation and Kansas City Fed President Esther George mentioned that the central bank must restore price stability, "that means returning to 2% inflation."
Elsewhere, US Retail Sales marked the biggest slump in a year while posting 1.1% MoM contraction for December, versus -0.8% market forecasts and -1.0% prior (revised). On the same line, Producer Price Index dropped to the lowest levels in six months with -0.5% MoM figure compared to -0.1% expected and 0.2% prior (revised).
It should be noted that US Treasury Secretary Janet Yellen and Chinese China’s Vice Premier Liu He met in Germany on Wednesday and initially boosted the risk appetite, together with the BOJ’s inaction. However, the diplomats’ mentioning of the areas of disagreement raised market fears of another round of US-China tension. Previously, the South China Morning Post (SCMP) mentioned that Beijing ‘should be wary’ as the US and Taiwan seeks closer economic ties.
Amid these plays, Wall Street closed in the red and yields were down too while the US Dollar recovered after refreshing the lowest levels since late May.
Looking forward, AUD/USD traders will pay attention to Australia’s employment numbers for December amid talks of easing hawkish bias at the major central banks, including the Reserve Bank of Australia (RBA). Hence, a softer outcome may exert more downside pressure on the AUD/USD prices. Forecasts suggest the headline Employment Change to ease to 22.5K versus 64K prior while the Unemployment Rate is expected to remain unchanged at 3.4%.
Technical analysis
Wednesday’s U-turn from the highest levels since the mid-August 2022 portrays a rising wedge bearish chart patter on the daily formation, currently between 0.7020 and 0.6810.
- Gold holds near $1,900 critical support as Fed hawks keep the greenback bid.
- The US dollar flipped bullish in the US session, leaving the outlook for Gold price bearish on a break below support.
Gold is holding near $1,900 towards the close for the day. XAU/USD travelled between a low of $1,896.67 and a high of $1,925.94 on the day but fell into the lows despite the US session as a weak US Dollar gained traction on hawkish comments from Federal Reserve speakers.
St. Louis Federal Reserve's President James Bullard said US interest rates have to rise further to ensure that inflationary pressures recede.
''We’re almost into a zone that we could call restrictive - we’re not quite there yet,” Bullard said Wednesday in an online Wall Street Journal interview. Officials want to ensure inflation will come down on a steady path to the 2% target. “We don’t want to waver on that,” he said.
“Policy has to stay on the tighter side during 2023” as the disinflationary process unfolds, Bullard added.
Bullard has pencilled in a forecast for a rate range of 5.25% to 5.5% by the end of this year.
However, investors expect the Federal Reserve to raise interest rates by just 25 basis points when its policy committee meets at month's end.
Fed official Loretta Mester also warned more hikes are needed and said,'' we're beginning to see the kind of actions that we need to see."
Her comments to the Associated Press fall in following today's slew of economic data, specifically the Producer Price Index and Retail Sales. These showed disinflationary tendencies in the data and reinforced expectations that the Fed will continue to reduce its tightening pace in upcoming meetings.
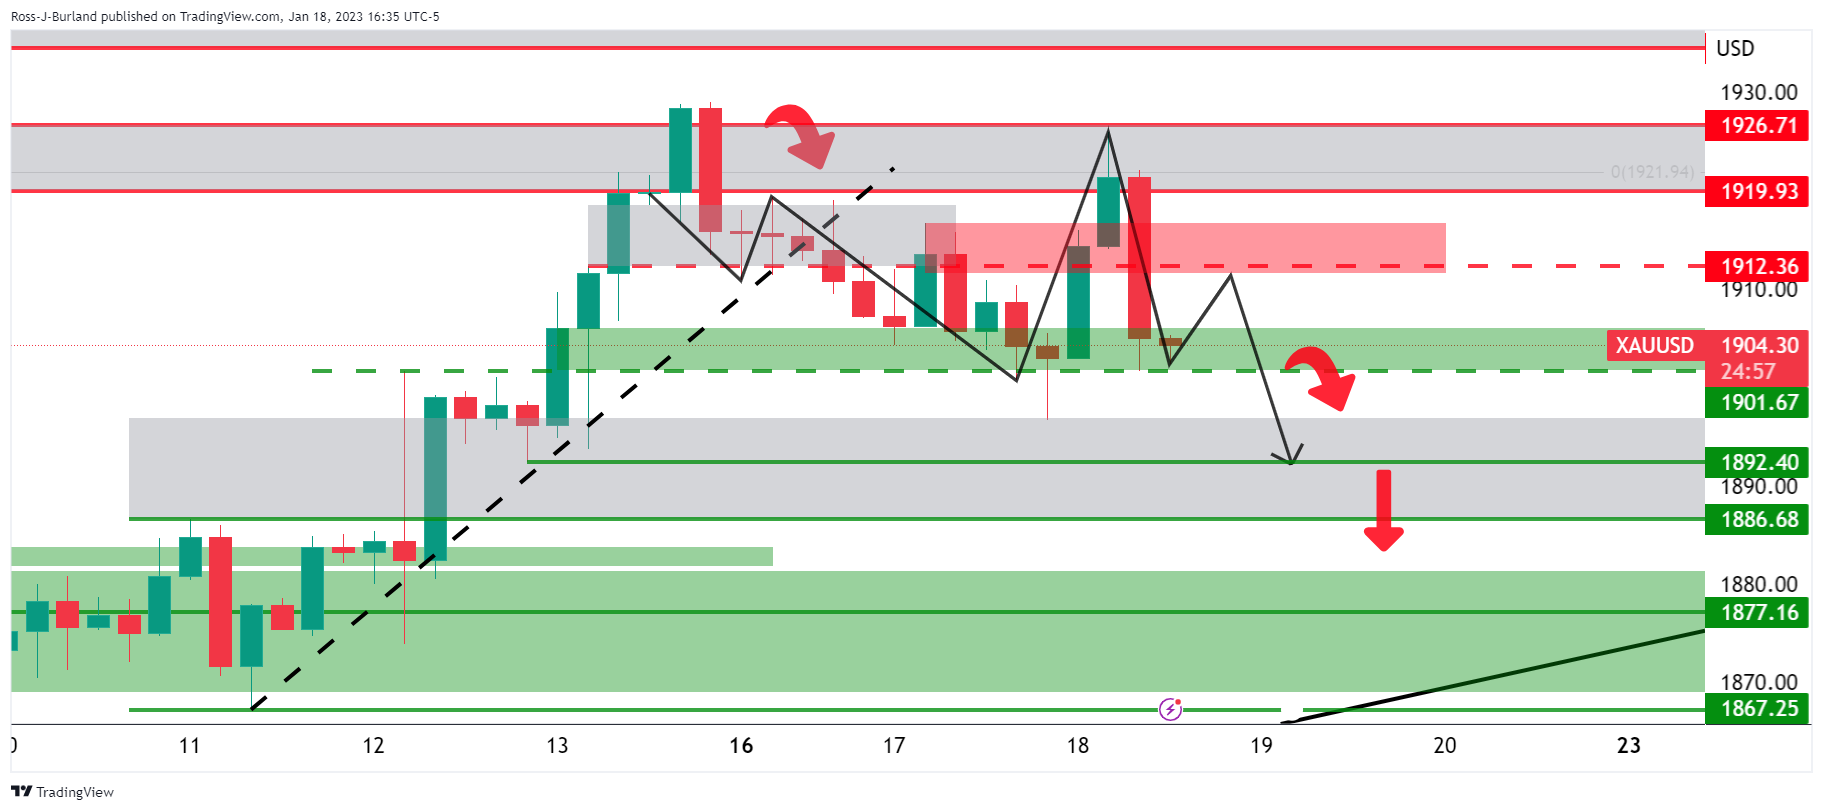
Gold technical analysis
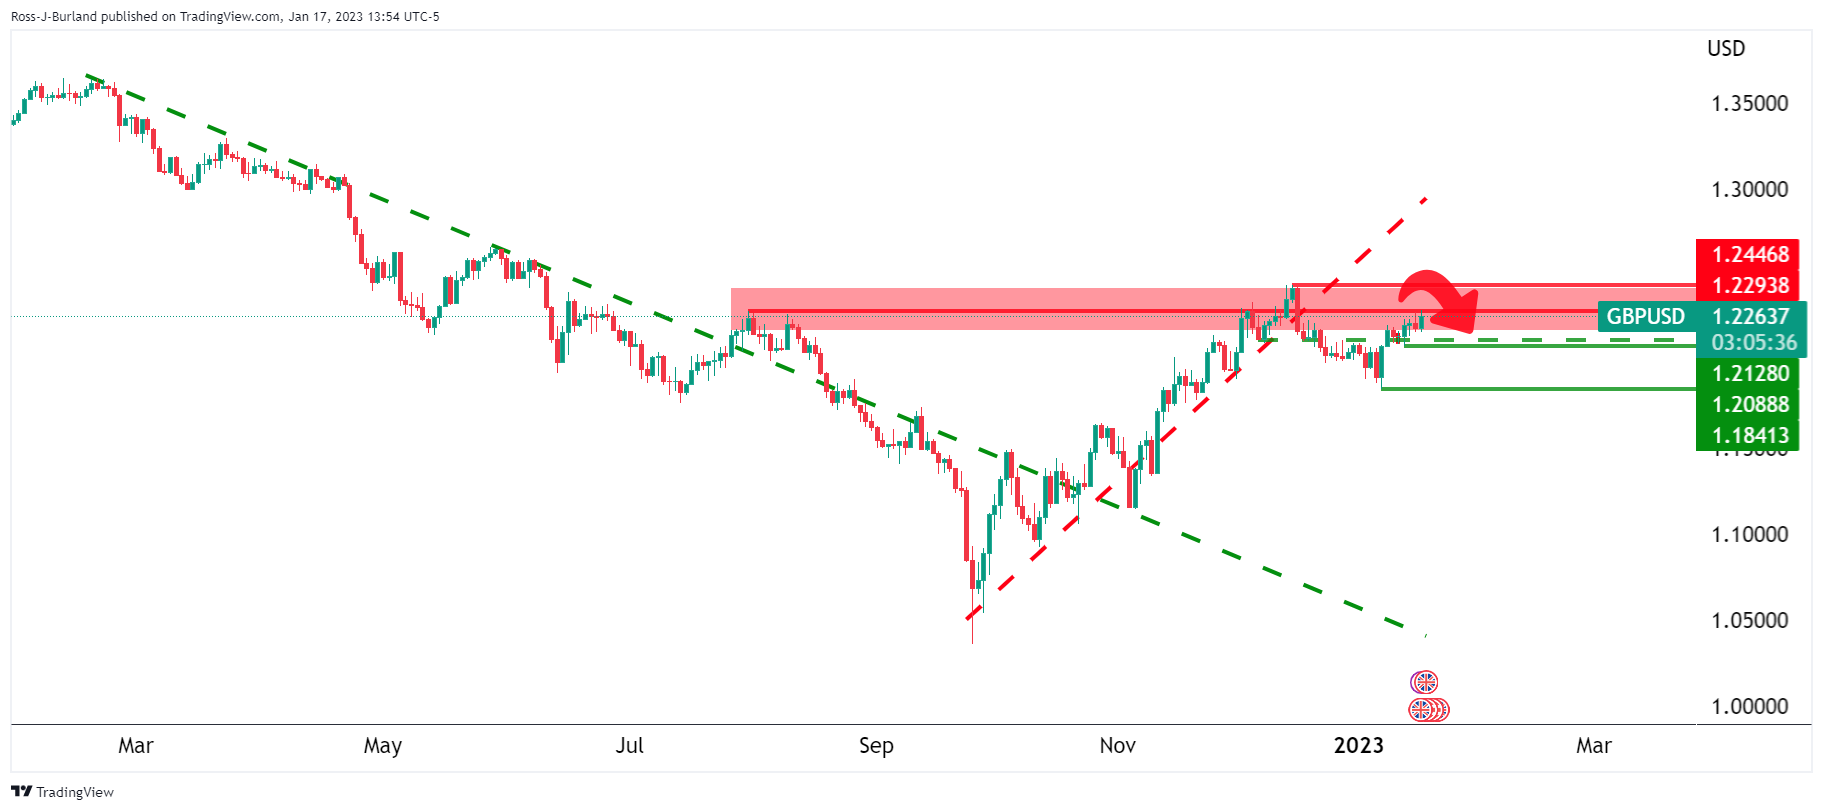
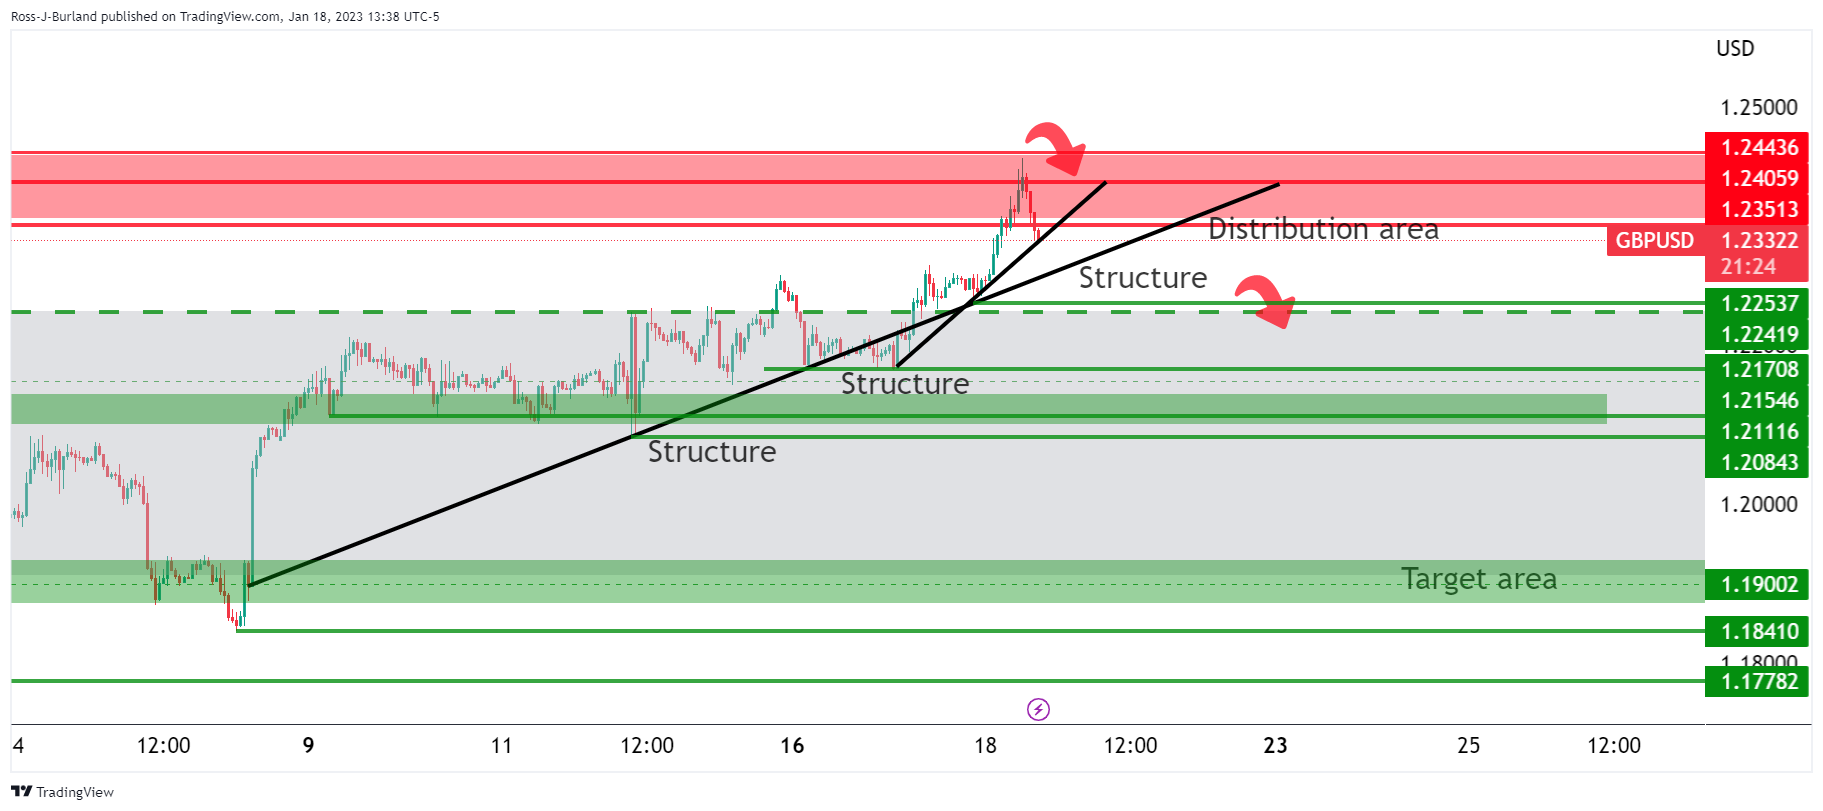
In this week's pre-open Gold price analysis, Gold, Chart of the Week: XAU/USD meets $1,920 resistance area, eyes on 4-hour structures to the downside, it was explained that the Gold price bears need to get the market on the backside of the 4-hour trendline as follows:
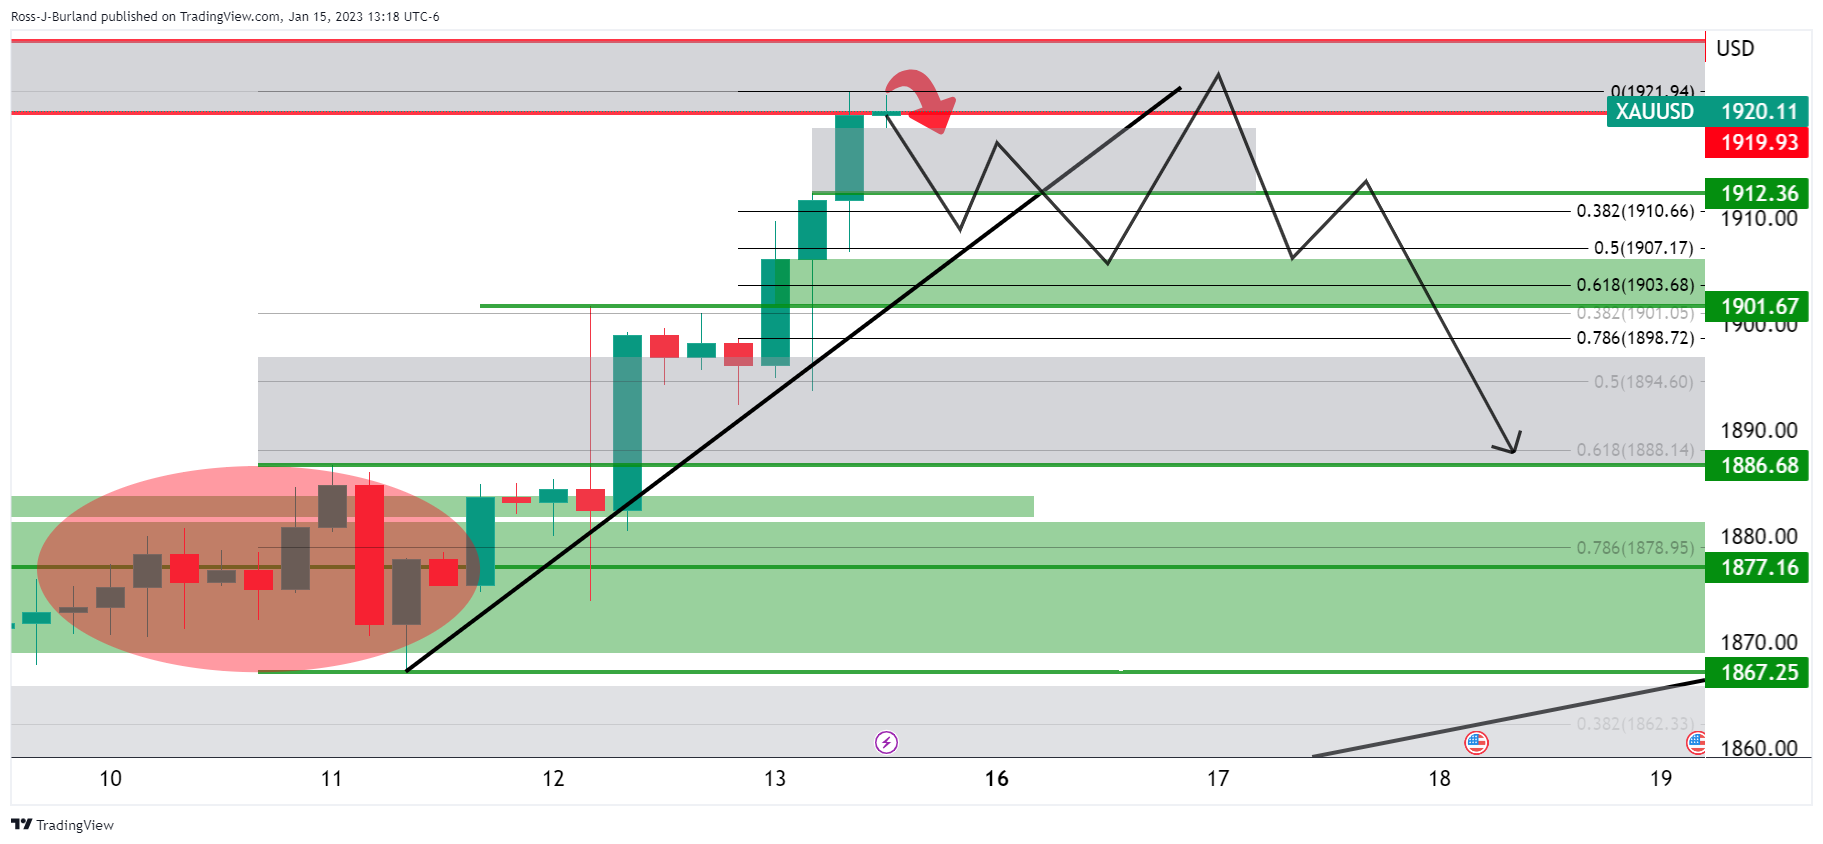
The above Gold price schematic was illustrated as typical of such a breakdown and deceleration of the trend, in a) breaking the trendline, b) retesting the peak formation highs and c), eventually breaking the horizontal support structure.
Gold update
We have seen all of the criteria met for a move lower to $1,890 and then $1,880:
- US Retail Sales plummet while PPI cools down, effects of the Federal Reserve’s monetary policy.
- US Industrial Production stumbles for the second consecutive month.
- WTI Price Analysis: Daily close below the 50-day EMA could exacerbate a fall beneath $78.00.
The US crude oil Western Texas Intermediate collapsed from around daily highs reached during the North American session at $82.35 due to recession fears back in play following the release of soft US economic data. That, alongside hawkish Fed commentary, paired the greenback’s earlier losses, a headwind for oil prices. At the time of typing, WTI trades at $79.08 per barrel.
Wall Street’s finished Wednesday session with losses due to sentiment shifting sour on a gloomy economic outlook in the US. Inflation data at the factory gate, also known as the Producer Price Index (PPI) for December, plunged on its monthly reading, data that could encourage Fed officials to slow down the pace of rate hikes. Retail Sales for the same period shrank by some margin, while Industrial Production dropped.
“Coming on the back of the weakness in retail sales, the steep drop in industrial production and news of more job lay-offs adds to fears the US could already be in recession,” analysts at ING wrote in a note.
Another reason that put a lid on WTI’s rally was the comeback of the greenback. The US Dollar Index (DXY), a gauge of the buck’s value against a basket of six currencies, dropped to an 8-month low but bounced off and erased those losses, exchanging hands at 102.392, almost unchanged.
But what was the reason behind the US Dollar (USD) recovery? Two Fed officials, namely St. Louis Fed President James Bullard and Cleveland’s Loretta Mester, emphasized the need for the US Federal Reserve (Fed) to raise rates above the 5% threshold, with the former stating “as quickly as we can.”
In the meantime, China’s lifting of Covid-19 restrictions should boost oil demand, per the International Energy Agency (IEA)., though Russia’s oil embargo could dent supply.
WTI Technical Analysis
From a daily chart perspective, WTI’s could continue to press upwards, though Wednesday’s high clashed and failed to break above the 100-day Exponential Moving Average (EMA) at $82.87 PB, exacerbating its drop towards $79.00, slightly below the 50-day EMA at 79.17. The Relative Strength Index (RSI), although above the 50 midlines, is accelerating toward its central line, about to cross under, which would open the door to open fresh shorts. WTI key support lie at $79.00, followed by $78.00 and the e0-day EMA at $77.73.
WTI Key Technical Levels
Reuters reports that Philadelphia Federal Reserve President Patrick Harker reiterated on Wednesday that he's ready for the US central bank to move to a slower pace of interest rate rises amid some signs that hot inflation is cooling off.
"High inflation is a scourge, leading to economic inefficiencies and hurting Americans of limited means disproportionately," Harker said in prepared remarks for a speech that closely followed remarks from earlier in the month. To get inflation under control, the Fed's "goal is to slow the economy modestly and to bring demand more in line with supply," he told a group in Newark, Delaware.
More to come...
US Dopllar update
More to come...
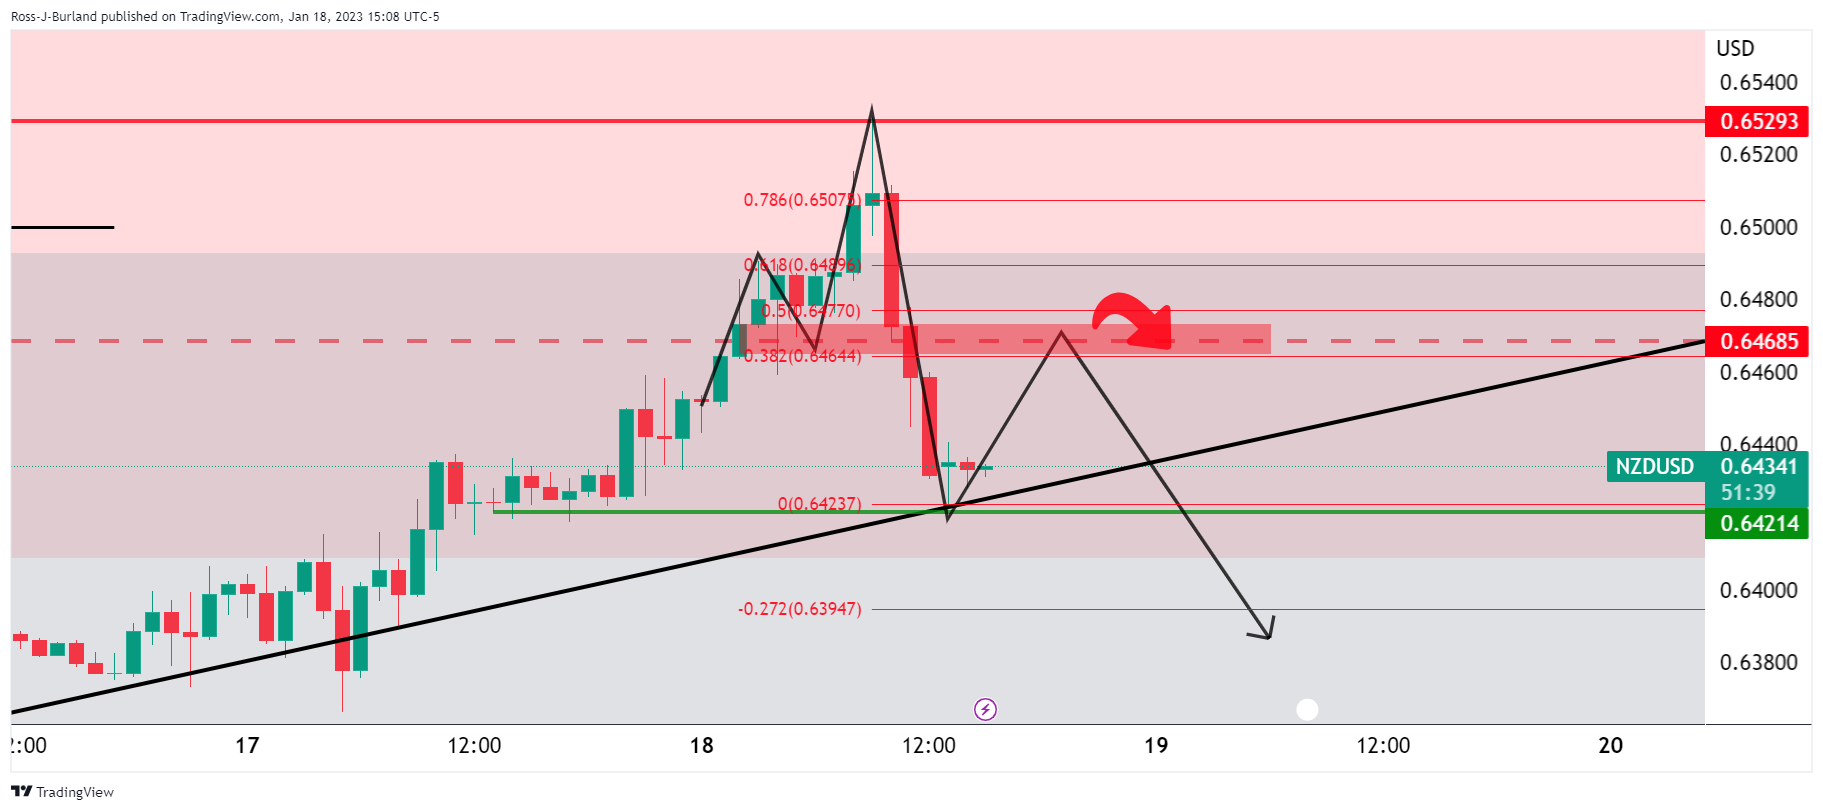
- NZD/USD backs off from fresh bull cycle highs on hawkish Fed speakers.
- However, bulls can eye a move towards a 38.2% Fibonacci retracement near the 0.6470s.
- However, key support structure is eyed for a significant sell-off with 0.6200 a target area.
NZD/USD has been testing the 0.6420s in recent trade and a break thereof opens the risk of a significant downside correction for the week's cycle. The pair was sold off from critical resistance near the day's highs of 0.6530 and a low of 0.6418 has been achieved so far as market sentiment flips bearish.
''Global financial market sentiment remains fickle – bond yields are falling everywhere as recession fears bite, but at the same time many think the prospect of fewer hikes or eventual easing is a positive thing,'' analysts at ANZ Bank said in a note at the start of the early Asian day. ''Expect volatility to remain elevated into local Consumer Price Index data next week and the Federal Reserve decision the following week,'' the analysts said.
''NZ food prices today will be watched closely; many economists will finalise their CPI picks once it’s in hand. As these estimates are published, the Kiwi may see yet more volatility.''
Meanwhile, the US dollar is gaining traction despite weaker data that portrayed disinflationary tones, fueling the belief that the Federal Reserve will continue to reduce its tightening pace in upcoming meetings. However, Fed speakers later poured cold water on that which helped the US Dollar to pare back losses from the weak data. For instance, St. Louis Federal Reserve's President James Bullard said US interest rates have to rise further to ensure that inflationary pressures recede.
''We’re almost into a zone that we could call restrictive - we’re not quite there yet,” Bullard said Wednesday in an online Wall Street Journal interview. Officials want to ensure inflation will come down on a steady path to the 2% target. “We don’t want to waver on that,” he said.
“Policy has to stay on the tighter side during 2023” as the disinflationary process unfolds, Bullard added.
Bullard has pencilled in a forecast for a rate range of 5.25% to 5.5% by the end of this year.
NZD/USD technical analysis
In prior analysis, it was shown that while being on the backside of the daily bullish impulse and trend, there were still prospects of a move into the trendline resistance, acting as the final push before a major bearish breakout:
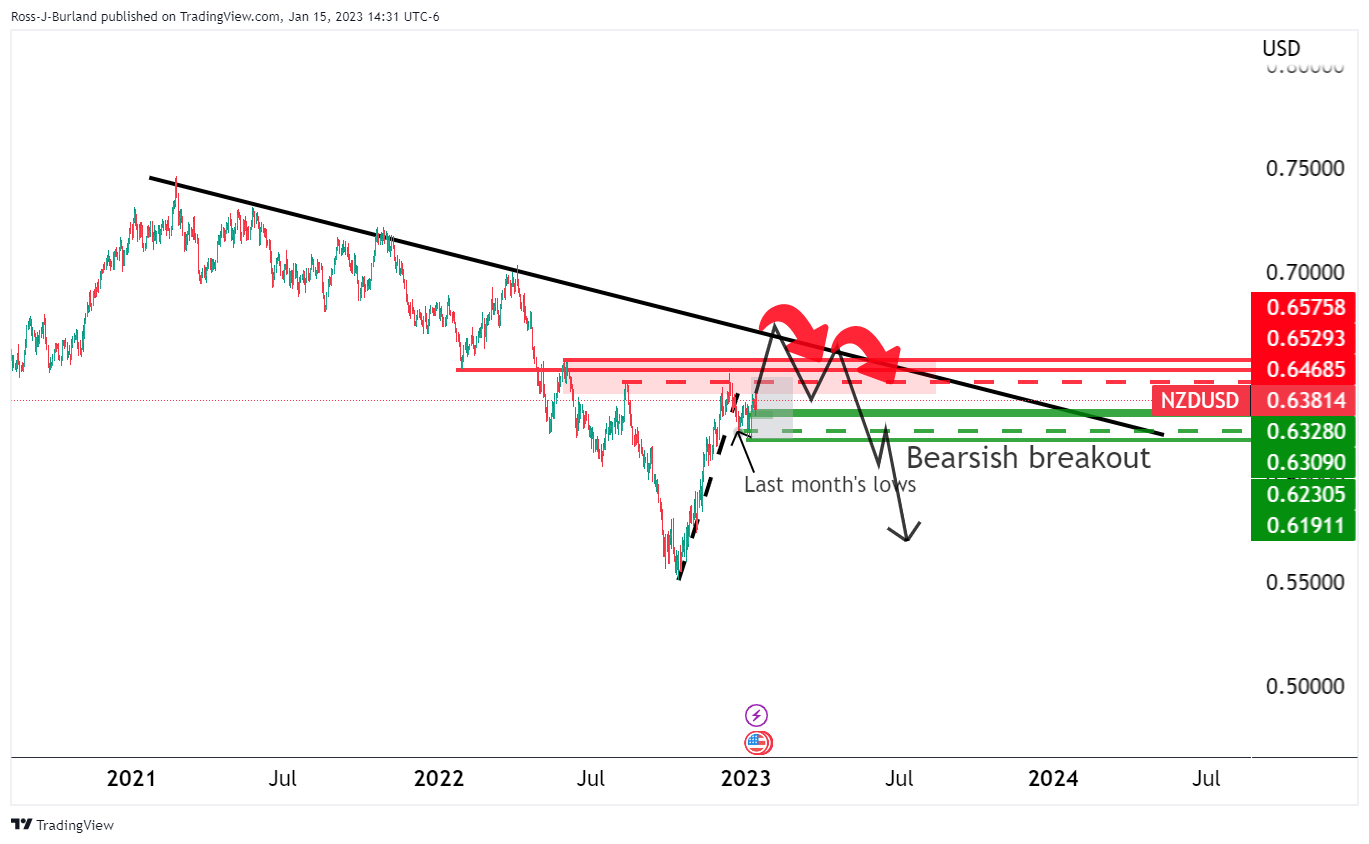
The W-formation was highlighted as a bullish bottoming pattern and the fact that the price broke the monthly lows, we had breakout traders trapped.
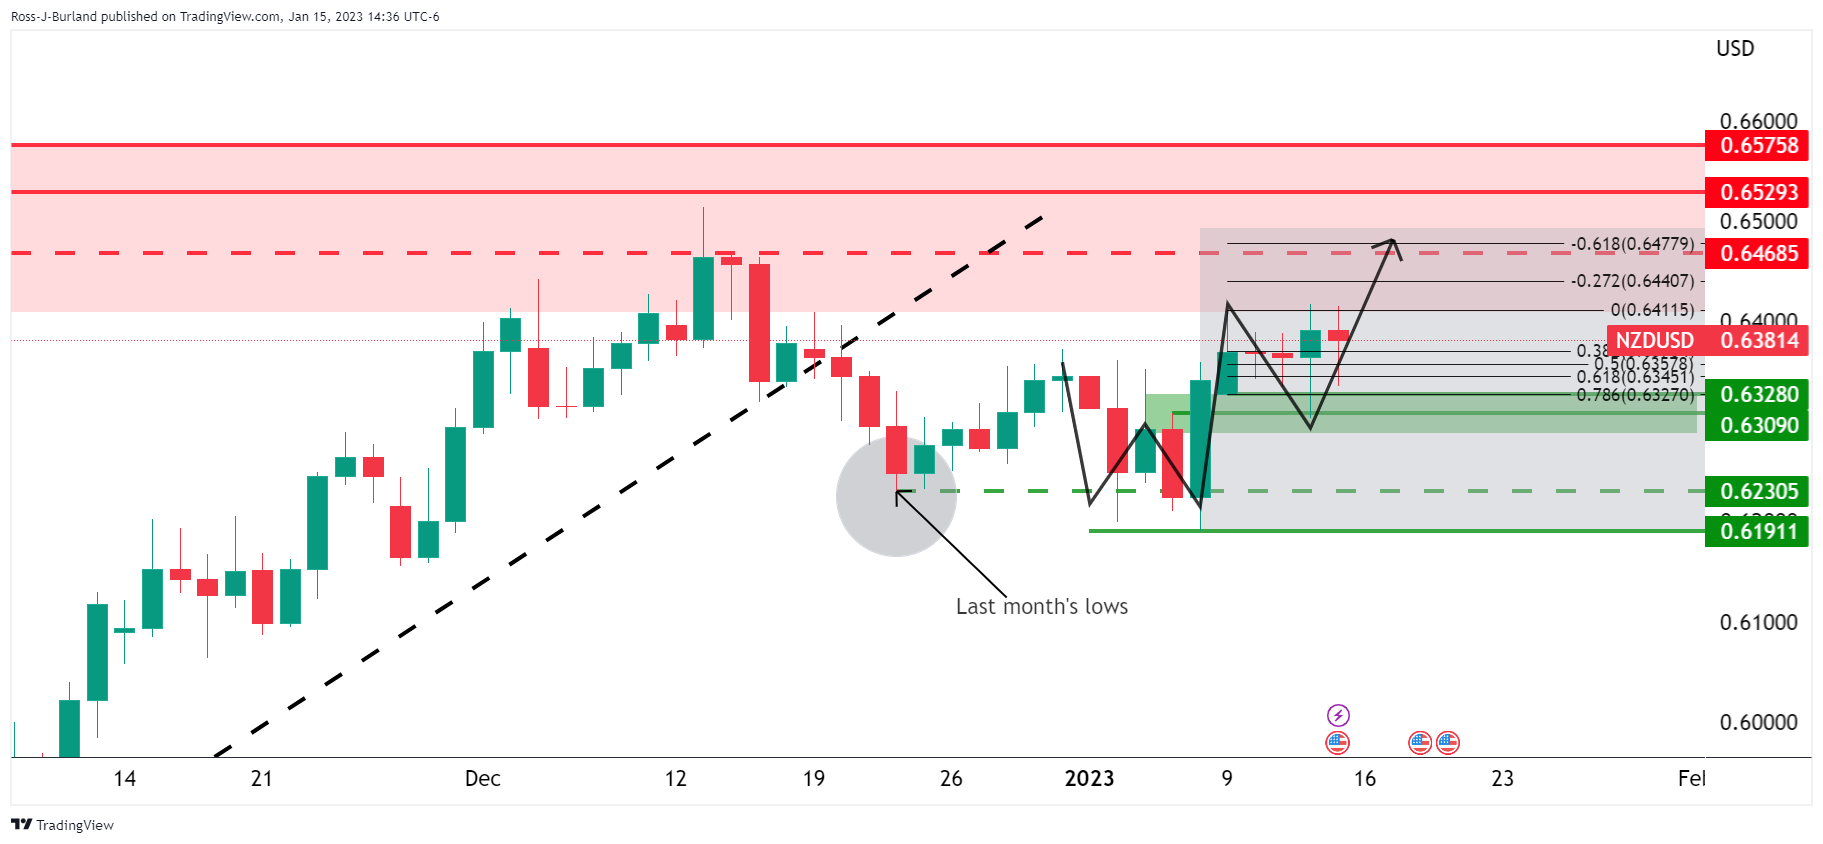
The upside towards 0.6480 was a probable scenario for this week to meet prior highs:

NZD/USD update
The price shot higher and exceeded the 0.6480s target, meeting higher resistance and the start of last year's lows as follows:

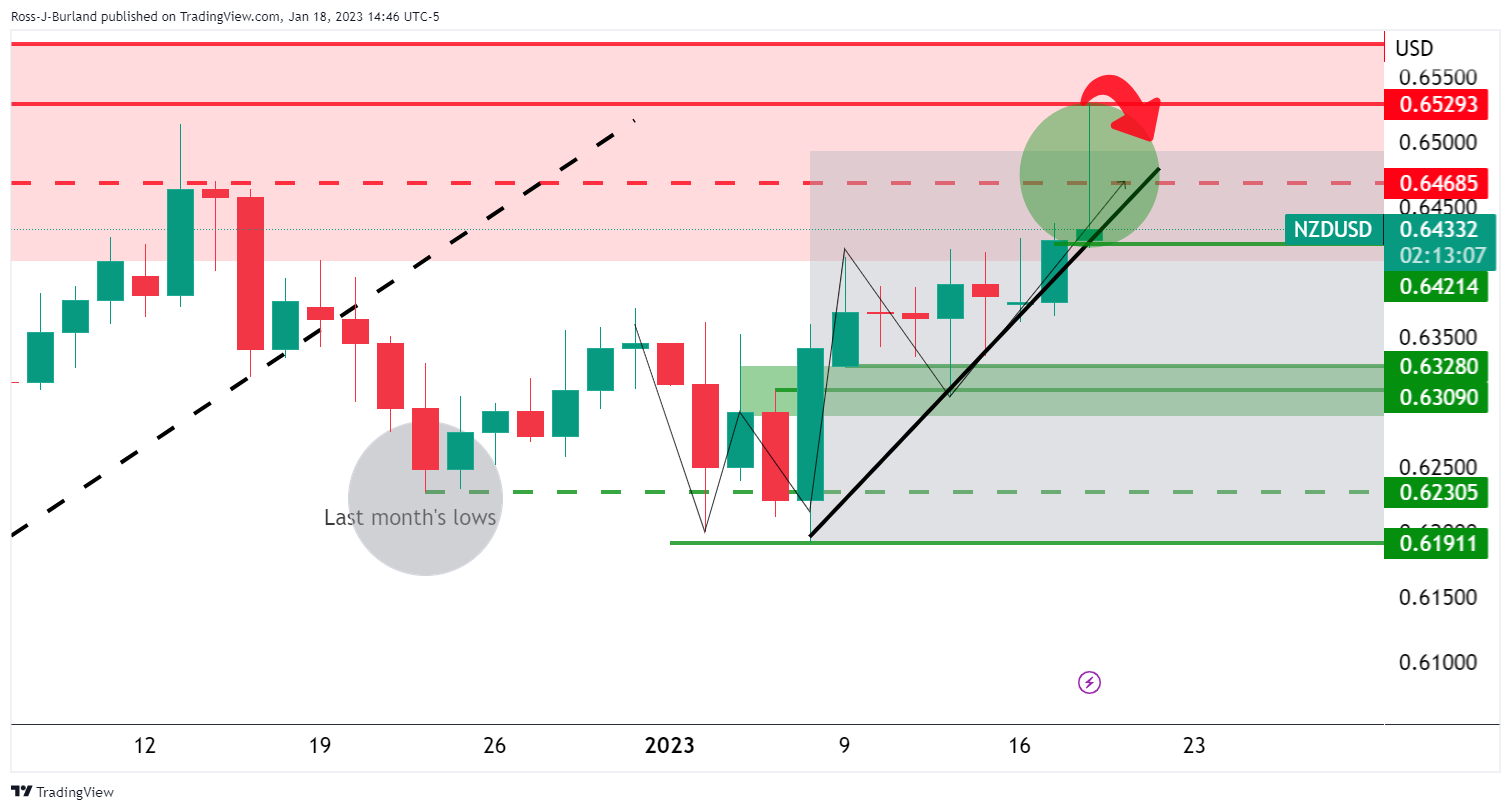
The bulls need to break out of these highs or face the prospects of a significant correction for days ahead towards 0.6200:

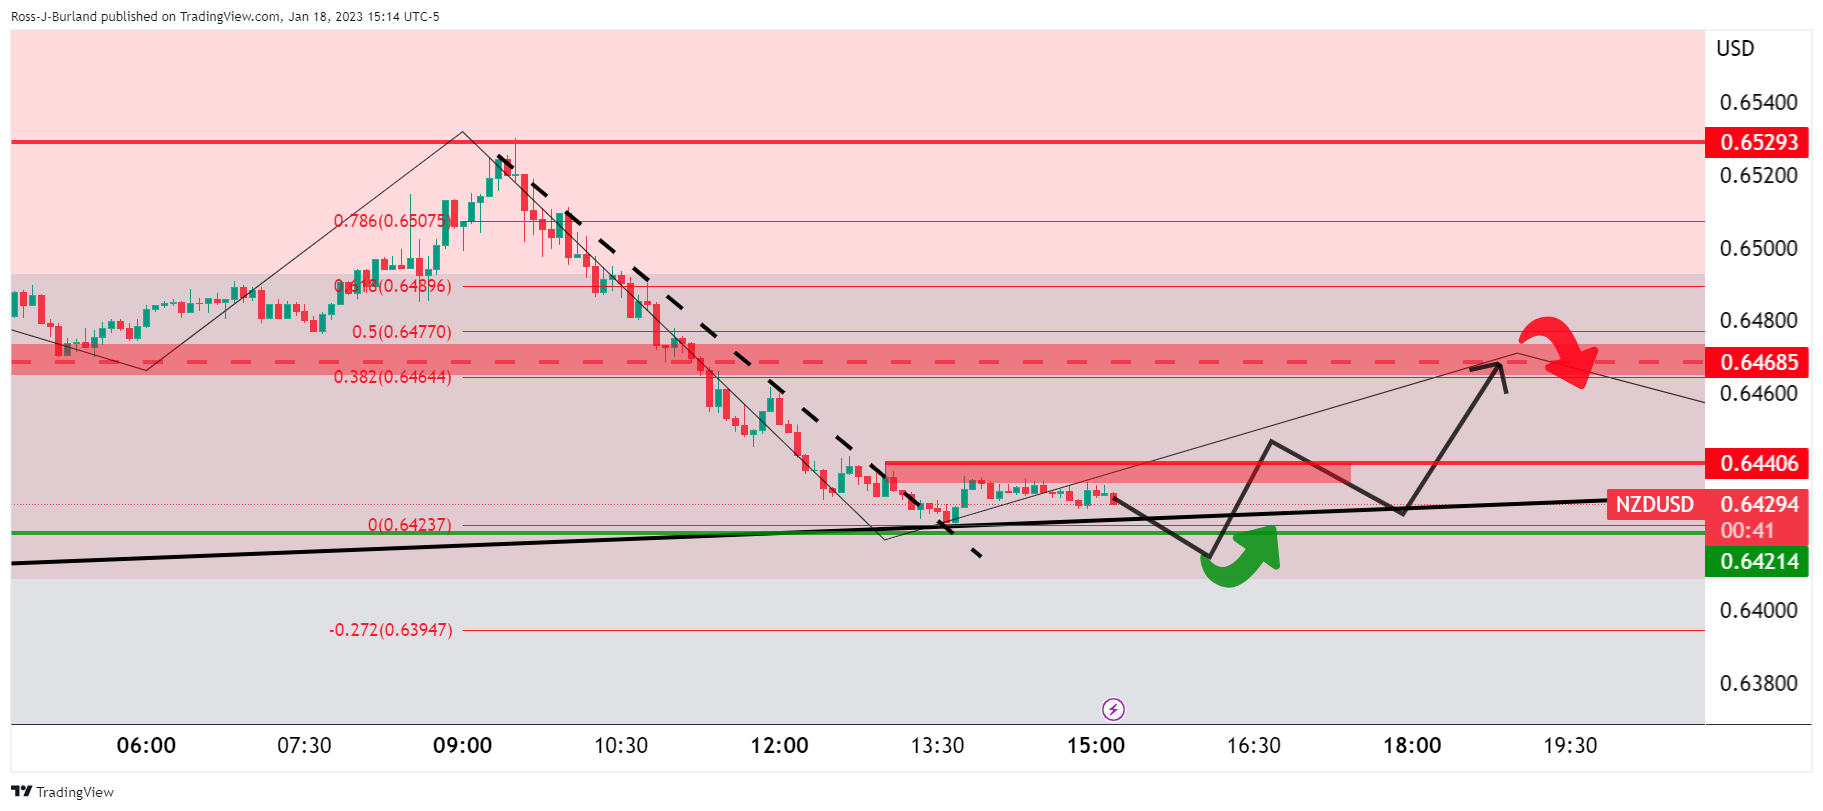
NZD/USD H1 chart
However, while on the front side of the micro supporting trendline on the hourly time frame, as illustrated below, there are prospects of a revisit to retest the M-formations neckline as follows:
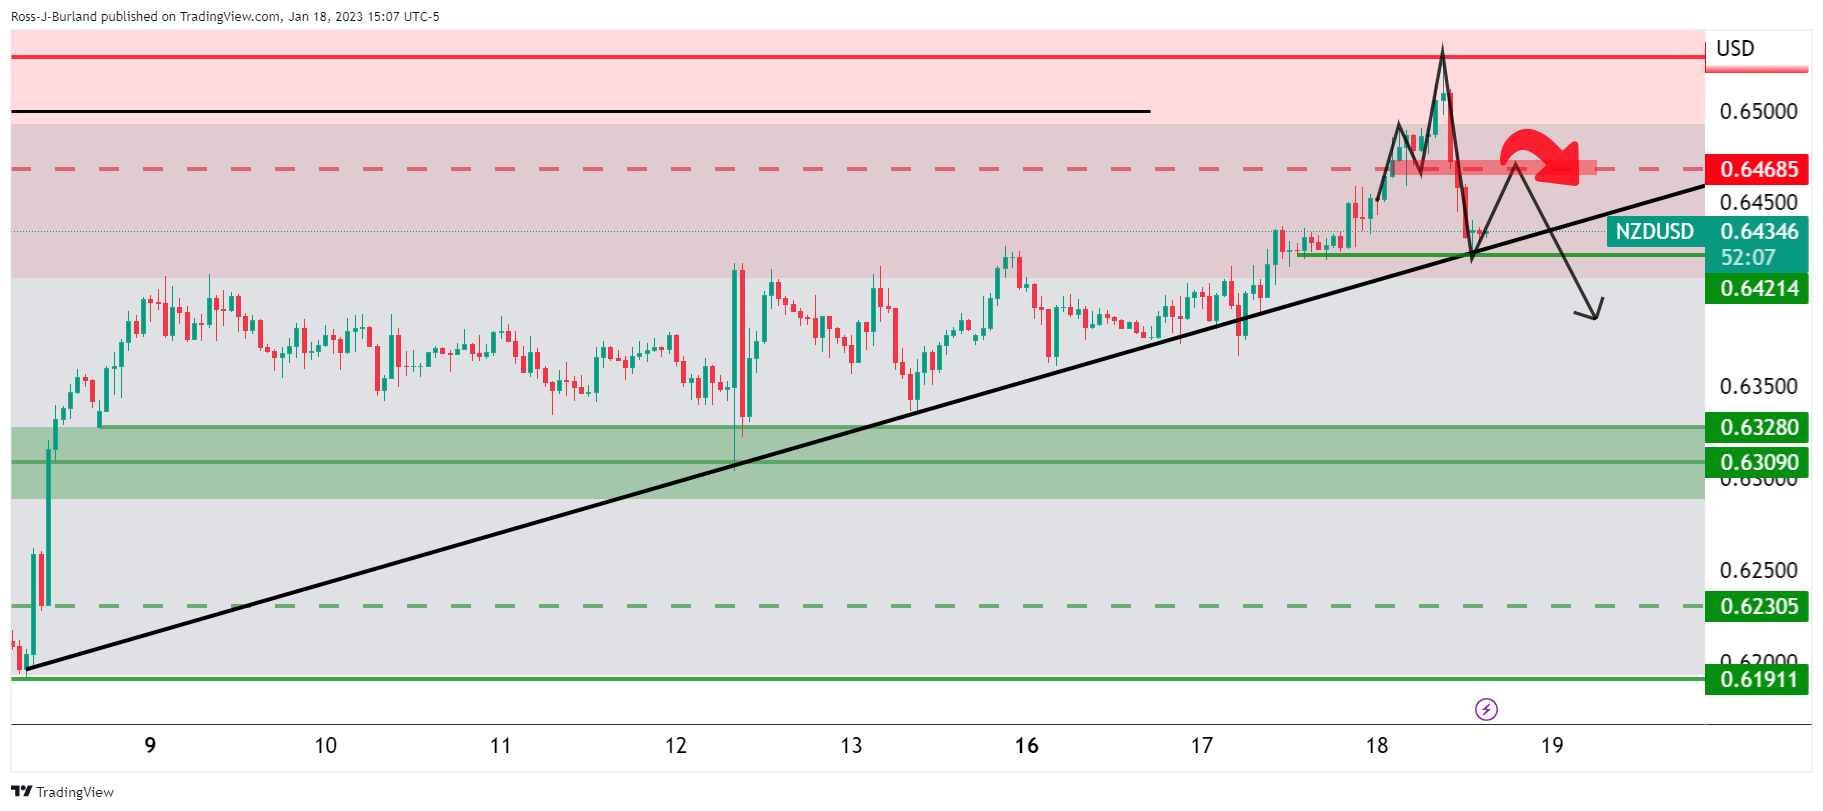
The bulls can eye a move towards the 38.2% Fibonacci retracement of the prior bearish impulse from trendline support to target the 0.6470s on lower time frames, such as the 15-minute and 5-minute charts. A break of 0.6440 structure will be key in this regard.
What you need to take care of on Thursday, January 19:
The US Dollar ended Wednesday with gains against most major rivals, reverting early losses that saw it trade at fresh multi-month lows against most major rivals. The Bank of Japan (BoJ) announced its monetary policy at the beginning of the day, triggering quite a volatile reaction. The central bank decided to maintain its benchmark rate at -0.10%, and the JGB yield target unchanged at 0.00%, with an upper limit of 0.50%. BoJ's Governor Haruhiko Kuroda then noted that they will maintain their ultra-loose monetary policy until achieving sustainable, stable inflation while adding that there was "no need to further expand bond target band."
Global yields plunged, initially weighing on the American Dollar, later reflecting risk aversion and rising alongside the Greenback. Softer-than-expected US data revived recession fears. The US Producer Price Index (PPI) increased at an annual pace of 6.2%, declining from 7.3% in November. On the other hand, December Retail Sales contracted by 1.1% MoM, while Industrial Production declined 0.7% in the same month, both missing the market expectations. On a positive note, MBA Mortgage Approvals for the week ended January 13 were up a whopping 27.9%, as interest rates dropped to their lowest point in months.
Wall Street started the day with modest gains but ended up collapsing, with the Dow Jones Industrial Average roughly 500 points down in the day.
The EUR/USD pair hit a multi-month high of 1.0886 but settled at around 1.0790. On the other hand, GBP/USD jumped to 1.2435 following the release of UK inflation figures. The Consumer Prices Index (CPI) rose at an annualized pace of 10.5% in December, below the 10.7% posted in November. The pair later retreated on demand for safety towards the 1.2330 price zone.
European Central Bank policymaker Francois Villeroy de Galhau said on Wednesday that it is "too early to speculate about what we will do in March." His words partially offset speculation the ECB would hike rates by 25 bps in March.
St. Louis Federal Reserve's President James Bullard said US interest rates have to rise further to ensure that inflationary pressures recede. Also, Fed's Loretta Mester, president of the Federal Reserve Bank of Cleveland, welcomed actions to tame inflation, while Fed's Esther George said that the central bank must restore price stability, "that means returning to 2% inflation." Overall, Fed speakers maintained their hawkish stance and hinted at more rate hikes ahead.
The AUD/USD pair peaked at 0.7063 but settled in the red at 0.9640. The USD/CAD pair approaches the 1.3500 level. Finally, the USD/JPY pair soared to 131.57 but trimmed most of its intraday gains to end at around 128.80.
Gold changes hand at $1,903 a troy ounce, while the negative momentum of US equities weighed on oil prices. The barrel of WTI trades at $70.50.
Like this article? Help us with some feedback by answering this survey:
- EUR/USD erases its earlier gains, despite registering a 9-month high around 1.0887.
- Big Tech companies slashing 28K jobs, and weaker US economic data, sparked recession fears.
- Fed officials support interest rate hikes until 5% or slightly above.
EUR/USD reversed its course after hitting a nine-month high around 1.0887 on Wednesday after US economic data could further cement the case for US Federal Reserve (Fed) officials to slow down the pace of tightening. Additionally, the US Dollar (USD) found a bid and erased all of its losses at the time of writing. The EUR/USD exchanges hands at 1.0793, still above its opening price.
US big tech companies cutting jobs, and soft US economic data, weighed on the EUR
Wall Street edged lower as crossing newswires announced that Microsoft and Amazon are set to slash 28K jobs. Therefore, investors’ moods dampened, as earlier US economic data showed signs of deterioration in the US economy. Data released showed that inflation continued to ease, with December’s US Producer Price Index (PPI) sliding to 6.2% YoY, below estimates of 6.8%, while the core PPI advances by 5.5% YoY, beneath 5.7% forecasts.
In the meantime, US Retail Sales plunged 1.1% MoM in December, below the downward revised November’s figures, which shrank by 1%. However, annually based were unchanged at 6%. Later, Industrial Production decreased by 0.7% MoM and 1.7% in Q4, as reported by the Federal Reserve.
Later, two Fed officials, namely St. Louis Fed President Bullard and Cleveland’s President Loretta Mester, said that the Federal Funds rate (FFR) needs to be at around 5%, at the minimum. Bullard commented that the central bank needs to get “as quickly as we can,” while Mester added that rates need to be above 5%, per her forecasts.
What to watch?
Thursday’s economic calendar in the Eurozone would feature the EU’s Current Account, ECB’s Monetary Policy Meeting Accounts, and ECB’s Lagarde speech. Across the pond, the US docker will reveal housing data, the Philadelphia Fed Index, Initial Jobless Claims, and Fed speak.
EUR/USD Key Technical Levels
The Federal Reserve's Beige Book shows that since the previous report, overall economic activity has remained relatively stable and overall, contacts expected little growth in the coming months.
Key notes
Selling prices increased at a modest or moderate pace in most districts, though many said that the pace of increases had slowed from that of recent reporting periods.
Employment continued to grow at a modest to moderate pace for most districts.
On balance, contacts generally expected little growth in the months ahead.
Wage pressures remained elevated across districts, though five reserve banks reported that these pressures had eased somewhat.
US Dollar update
Earlier in the day, the US Dollar was pressured following US economic reports, the Producer Price Index and Retail Sales, which showed disinflationary tendencies in the data, reinforced expectations that the Fed will continue to reduce its tightening pace in upcoming meetings.
It is also worth noting that today's US Atlanta Fed GDPNow Q4: 3.5% (prev 4.1%).
However, hawkish Federal Reserve speakers have seen markets come under pressure again, fuelling a bid back into the US Dollar:
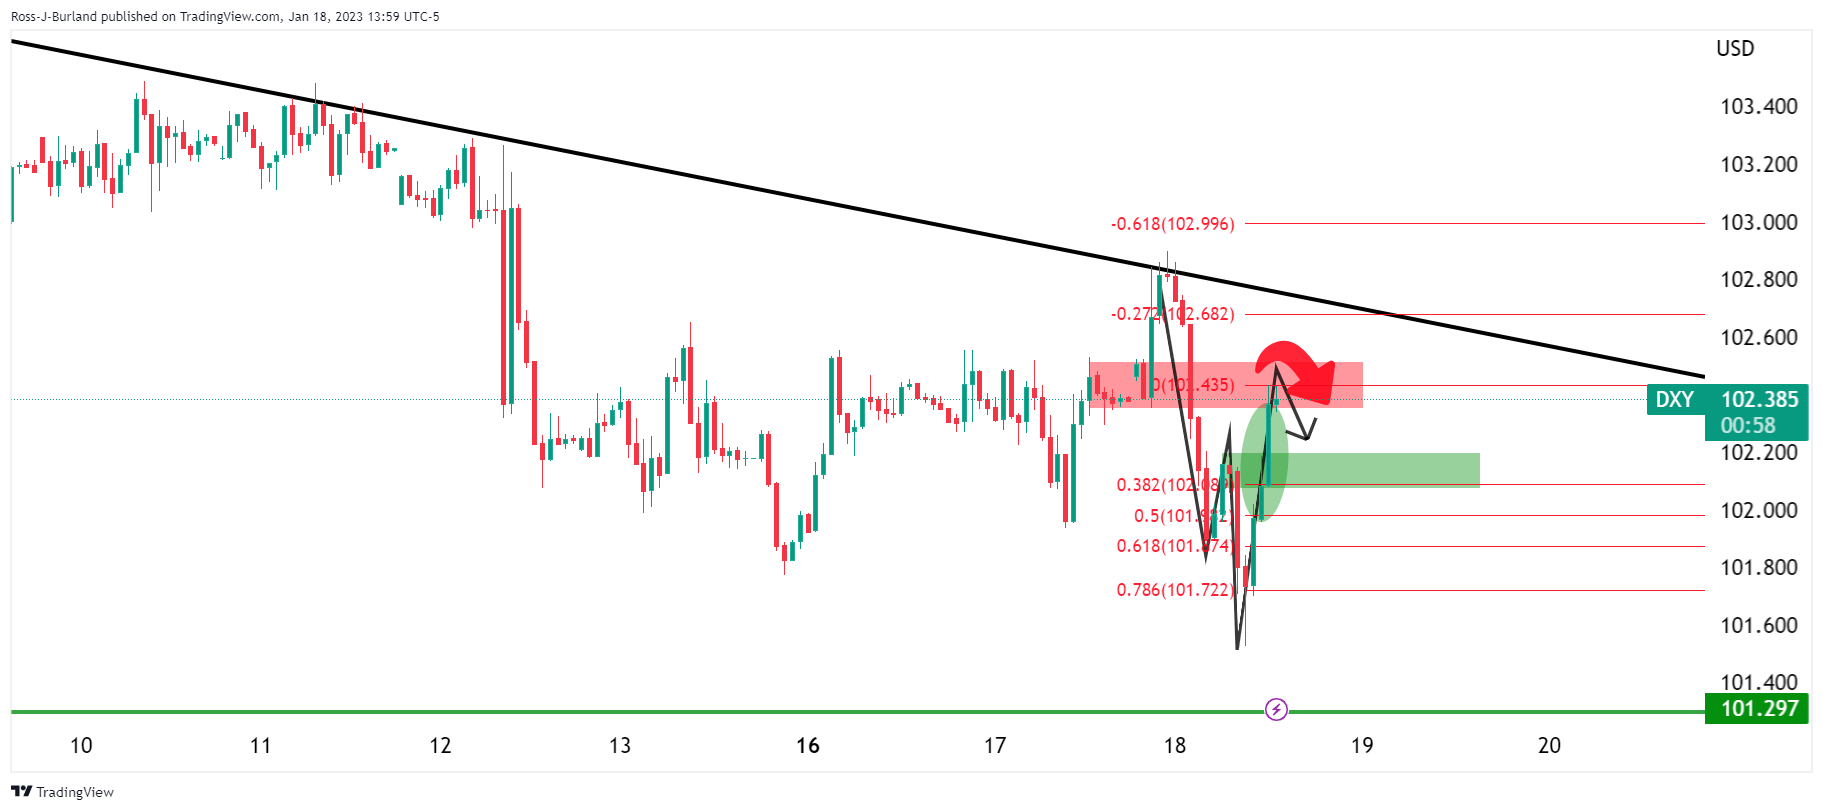
The DXY index, above, shows the US Dollar meeting resistance in a W-formation on the hourly chart. A correction of the bid could be expected to meet the 102.00/20s in the coming sessions as the price reverts to the neckline of the pattern in a 38.2% Fibonacci correction.
About the Beige Book
The Beige Book reports on the current US economic situation. Interviews with key business contacts, economists, market experts, and other sources are gathered by each of the 12 Federal Reserve Districts. The survey gives a picture of the overall US economic growth. An optimistic view of those authorities is considered positive, or bullish for the USD, whereas a pessimistic view is considered negative, or bearish for the Dollar.
Federal Reserve's Esther George explained that the Fed must restore price stability, ‘that means returning to 2% inflation’.
She also said that markets may have a different view of what the Fed needs to do but the central bank's commitment is to 2%.
Her comments follow today's economic data, specifically the Producer Price Index and Retail Sales. The data showed disinflationary tendencies in the data and reinforced expectations that the Fed will continue to reduce its tightening pace in upcoming meetings.
US Dollar update
The Fed's Beige Book is coming up and Fed's Patrick Harker will also speak on the economy, both of which could be a catalyst for the greenback that has been whipsawed today in conflicting sentiment surrounding the Fed. The data spared a sell-off in the greenback but the moves in forex have been faded due to hawkish commentary from Fed officials.
- GBP/USD momentarily bid on United Kingdom's Consumer Price Index and weak United states economic data.
- The British Pound reached critical highs before a fade to test key technical dynamic support.
- Bank of England and Federal Reserve sentiment in the hot seat.
- GBP/USD's micro-trendline support guards structure around 1.2250 and then 1.2170.
The GBP/USD bulls got what they wished for from the United Kingdom's Consumer Price Index that showed while inflation fell to a three-month low of 10.5% in December, it remains near 40-year highs. Specifically, the increase in services inflation and accelerating food and drink prices are a cause for some concern for the Bank of England's policy-makers.
GBP/USD, as per analysis written earlier in the week, was propelled towards last month's six-month high of 1.2446, reaching a high of 1.2435 on the day so far from a low of 1.2253. However, a recent rally in the US Dollar and softer US stocks are fuelling a sell-off in the pound currently, dragging the price a buck lower to $1.2345.
Given a gloomy domestic economic outlook and recession fears due to high inflation and a cost-of-living crisis, this may ultimately weigh on the British Pound. Nevertheless, a hawkish Bank of England could inject some resilience into the pound.
GBP/USD buoyed by Bank of England expectations
The Bank of England's Governor Andrew Bailey suggested earlier this week that a shortage of workers in the labour market posed a “major risk to inflation coming down”. ''The implication is that the Bank could remain more hawkish on its policy decisions this year,'' analysts at Rabobank said. ''We expect another 50 bps rate hike in February and then three more 25 bps moves as the Bank struggles to slice the final few percentage points from services sector inflation, which will be most impacted by wage growth,'' the analysts at Rabobank argued.
Analysts at ING Bank, commenting on today's consumer Price Index concur and said "it's important to note that core services jumped from 6.4% to 6.8%, a development that the BoE should particularly take into consideration, and when added to yesterday’s wage data should tilt the balance towards a 50 bps hike in February." Of note, the BoE has hiked interest rates nine times since December 2021 to try to lower inflation. Money markets are currently placing an 82% chance of a 50 bps rate hike at the next meeting, set for Feb 2.
US Dollar bid in midday US session
The US Dollar was injected with a bout of demand following hawkish comments from Federal Reserve officials that sparked worries that the central bank may not be pausing interest rate hikes any time soon. GBP/USD dropped with St. Louis Federal Reserve's President James Bullard saying US interest rates have to rise further to ensure that inflationary pressures recede.
''We’re almost into a zone that we could call restrictive - we’re not quite there yet,” Bullard said Wednesday in an online Wall Street Journal interview. Officials want to ensure inflation will come down on a steady path to the 2% target. “We don’t want to waver on that,” he said.
“Policy has to stay on the tighter side during 2023” as the disinflationary process unfolds, Bullard added.
Bullard has pencilled in a forecast for a rate range of 5.25% to 5.5% by the end of this year.
GBP/USD technical analysis
As per the prior analysis, GBP/USD bulls move in on a critical area on the charts ahead of the key Consumer Price Index, where GBP/USD was headed towards 1.24s resistance, the area was achieved but a fade on the rally was anticipated:
GBP/USD update
On the hourly time frame, GBP/USD's micro-trendline support guards structure around 1.2250. A break there will open the risk of a blow-off in GBP/USD to test 1.2170 and then 1.2080 structure.
- After bad US data, AUD/USD reversed its course and dived below 0.7000.
- Federal Reserve officials pushed back against interest rates peaking below 5%.
- AUD/USD Price Analysis: FAilres at 0.7000, exacerbated the fall toward 0.6960s.
AUD/USD erases its earlier gains after hitting a multi-month high at 0.7063, plunges below 0.7000, and turning down in the day by 0.27%. Risk appetite deteriorated amidst the lack of catalyst, though US data showed the economy is decelerating, which could have been the reason for sentiment shifting sour. The AUD/USD is trading at 0.6961.
US economic indicators were worse than expected but bolstered the USD
Wall Street is registering losses between 0.77% and 1.21%. Retail Sales for December in the United States (US) were reported by the Commerce Department, with figures shrinking by 1.1% MoM, more than the 0.8% contraction estimated and worst than November’s downward revision to 1%. On an annual basis, sales were unchanged at 6%.
At the same time, the Department of Labor (DoL) revealed that the Producer Price Index (PPI) for December plunged to -0.5% MoM, smashing estimates of 0.1%. Year-over-year figures rose by 6.2%, beneath forecasts of 6.8%, while core PPI advanced 5.5%, vs. 5.7% estimates.
Aside from that, the Federal Reserve reported that Industrial Production in the US decreased -0.7% in December and -1.7% in Q4. Additionally, US manufacturing output fell -1.3% last month, albeit November’s data was downward revised -1.3%.
Elsewhere a slew of Federal Reserve officials, led by the St. Louis Fed President James Bullard, crossed wires. Bullard said policymakers should get “as quickly” as they can rate above 5%. Echoing some of his comments, Cleveland’s Fed President Loretta Mester said that rates need to rise “a little bit” above 5%, emphasizing that it would be needed according to her projections.
After those remarks, the AUD/USD reversed its course after trading above the 0.7000 mark. No catalyst spurred the market’s reaction, only hawkish comments by Fed officials, which had been repeated since the beginning of the year.
AUD/USD Price Analysis: Technical outlook
From a technical perspective, the AUD/USD daily chart is forming an inverted hammer, which, if it closes below Tuesday’s open of 0.697, would exacerbate a deeper pullback, with the 20-day Exponential Moving Average (EMA) at 0.6863 as the first support. AUD/USD price action achieved successive series of higher highs, while the Relative Strength Index (RSI) failed to crack its previous peak. So, a negative divergence between price action and the RSI could pave the way for further downside.
The AUD/USD key support levels would be the January 17 low of 0.6929, followed by the January 12 daily low of 0.6869, ahead of the abovementioned 20-day EMA at 0.6863.
Federal Reserve's Loretta Mester, president of the Federal Reserve Bank of Cleveland, crossed the wires in recent trade and said,'' we're beginning to see the kind of actions that we need to see."
Her comments to the Associated Press fall in following today's slew of economic data, specifically the Producer Price Index and Retail Sales. These showed disinflationary tendencies in the data and reinforced expectations that the Fed will continue to reduce its tightening pace in upcoming meetings.
"Good signs that things are moving in the right direction ... That's an important input into how we're thinking about where policy needs to go.
US Dollar update
It has been a volatile spell in the forex space with the US Dollar whipsawed on the day during the Bank of Japan deliberations and subsequent announcements combined around the weak US data.
We are seeing the bulls move into the greenback as follows:

The hourly W-formation is a reversion pattern and the resistance could prove to be a tough nut to crack for the rest of the day.
US Industrial Production in the US fell 0.7% in December and November’s numbers were revised lower. With industrial production having fallen in six of the past eight months, the largest of which being November and December, it is evident that the manufacturing sector is already in recession, said analysts at Wells Fargo.
Key quotes:
“This is not an encouraging report for industrial activity particularly for the manufacturing sector which comprises roughly three quarters of all output and where the decline in December was a larger 1.3%.”
“Manufacturers are not blind to the challenges they face. Slower demand for consumer goods, higher borrowing costs and fear of recession are all weighing on activity. In our own discussions with clients, many of them have been intrigued by the deviating dynamic between a slowing in U.S. industrial production and still elevated industrial backlogs and trying to figure out when those will converge.”
“While we suspect the slowdown in activity doesn't bode well for overall economic growth, the fact that manufacturers are more 'wise to the game' this cycle suggests they may be better positioned to weather an economic slowdown.”
- USD/MXN rebounds sharply from lowest level in almost three years.
- Strong support area above 18.50 and risk aversion triggers rebound.
The USD/MXN is rising on Wednesday after hitting at 18.55, the lowest level since February 2020. The rebound represents a correction after falling constantly since the beginning of the year.
The ongoing run is facing resistance at 18.75. A break higher would target 18.85. The next vital resistance stands at 19.00/05 that should limit the upside. Above then comes 19.20 that if broken should weaken the Mexican Peso.
A deterioration in market sentiment favored the correction in USD/MXN that would continue to receive support as stocks in Wall Street keep falling.
The Mexican peso needs to hold below 18.70 in order to keep the doors open to another test of the 18.55 area and the 2020 low at 18.50. A break lower would target 18.30
USD/MXN daily chart
-638096589618823355.png)
St. Louis Federal Reserve's President James Bullard said US interest rates have to rise further to ensure that inflationary pressures recede.
''We’re almost into a zone that we could call restrictive - we’re not quite there yet,” Bullard said Wednesday in an online Wall Street Journal interview. Officials want to ensure inflation will come down on a steady path to the 2% target. “We don’t want to waver on that,” he said.
“Policy has to stay on the tighter side during 2023” as the disinflationary process unfolds, Bullard added.
Bullard has pencilled in a forecast for a rate range of 5.25% to 5.5% by the end of this year.
US Dollar update
It has been a volatile spell in the forex space with the US Dollar whipsawed on the day after a slew of weak data suggested the world's largest economy is finally slowing down. Wednesday's economic reports, Producer Price Index and Retail Sales which showed disinflationary tendencies in the data, reinforced expectations that the Fed will continue to reduce its tightening pace in upcoming meetings.
The data followed a turbulent Bank of Japan event. At a two-day policy meeting, the BOJ kept intact its YCC targets and made no change to its guidance that allows the 10-year bond yield to move 50 basis points on either side of its 0% target. The yen was broadly weaker, supporting the US Dollar momentarily before the Yen walked back some of its losses amid speculation that the BOJ was likely to tighten policy soon.
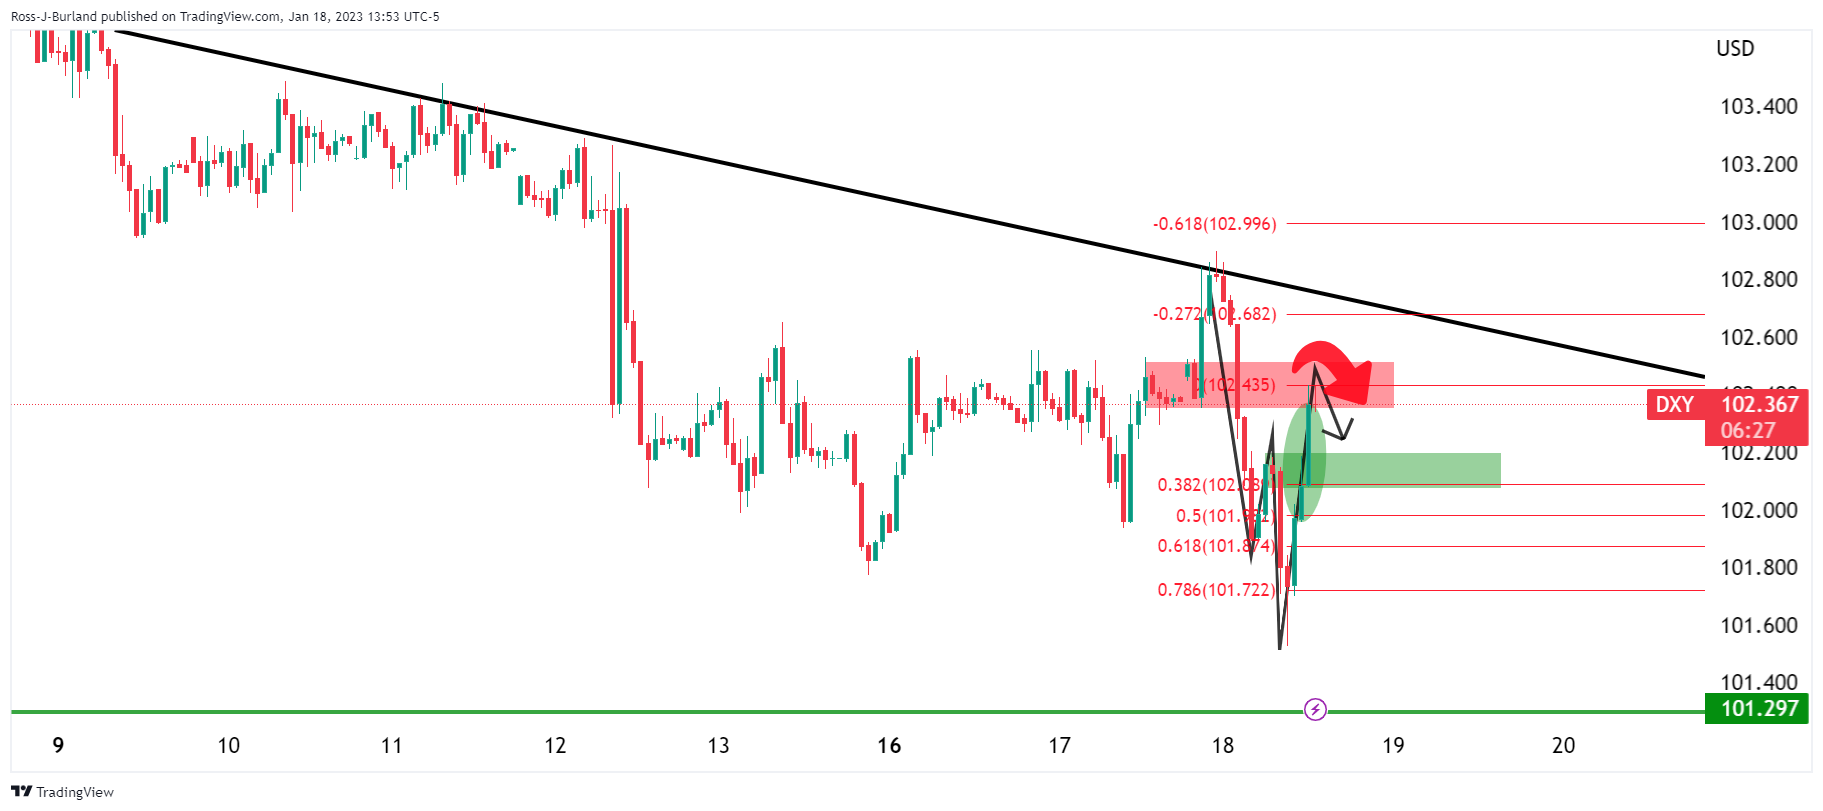
DXY index:

We are getting a burst of life from the bulls in recent trade as follows:
The hourly W-formation is a reversion pattern and the resistance could prove to be a tough nut to crack for the rest of the day.
- USD/JPY trims some of its Asian session gains courtesy of the Bank of Japan’s decision.
- USD/JPY Price Analysis: Failure to conquer the 20-day EMA exacerbated a 200-plus pip fall beneath 128.50.
The USD/JPY clings to gains after hitting a daily high of 131.57 following the release of the Bank of Japan’s (BoJ) monetary policy decision, which sparked a 400 pip rally. However, throughout the North American session, the Japanese Yen (JPY) stages a comeback against its counterpart, the US Dollar (USD), and so far is down 0.24%. At the time of writing, the USD/JPY is trading at 128.56.
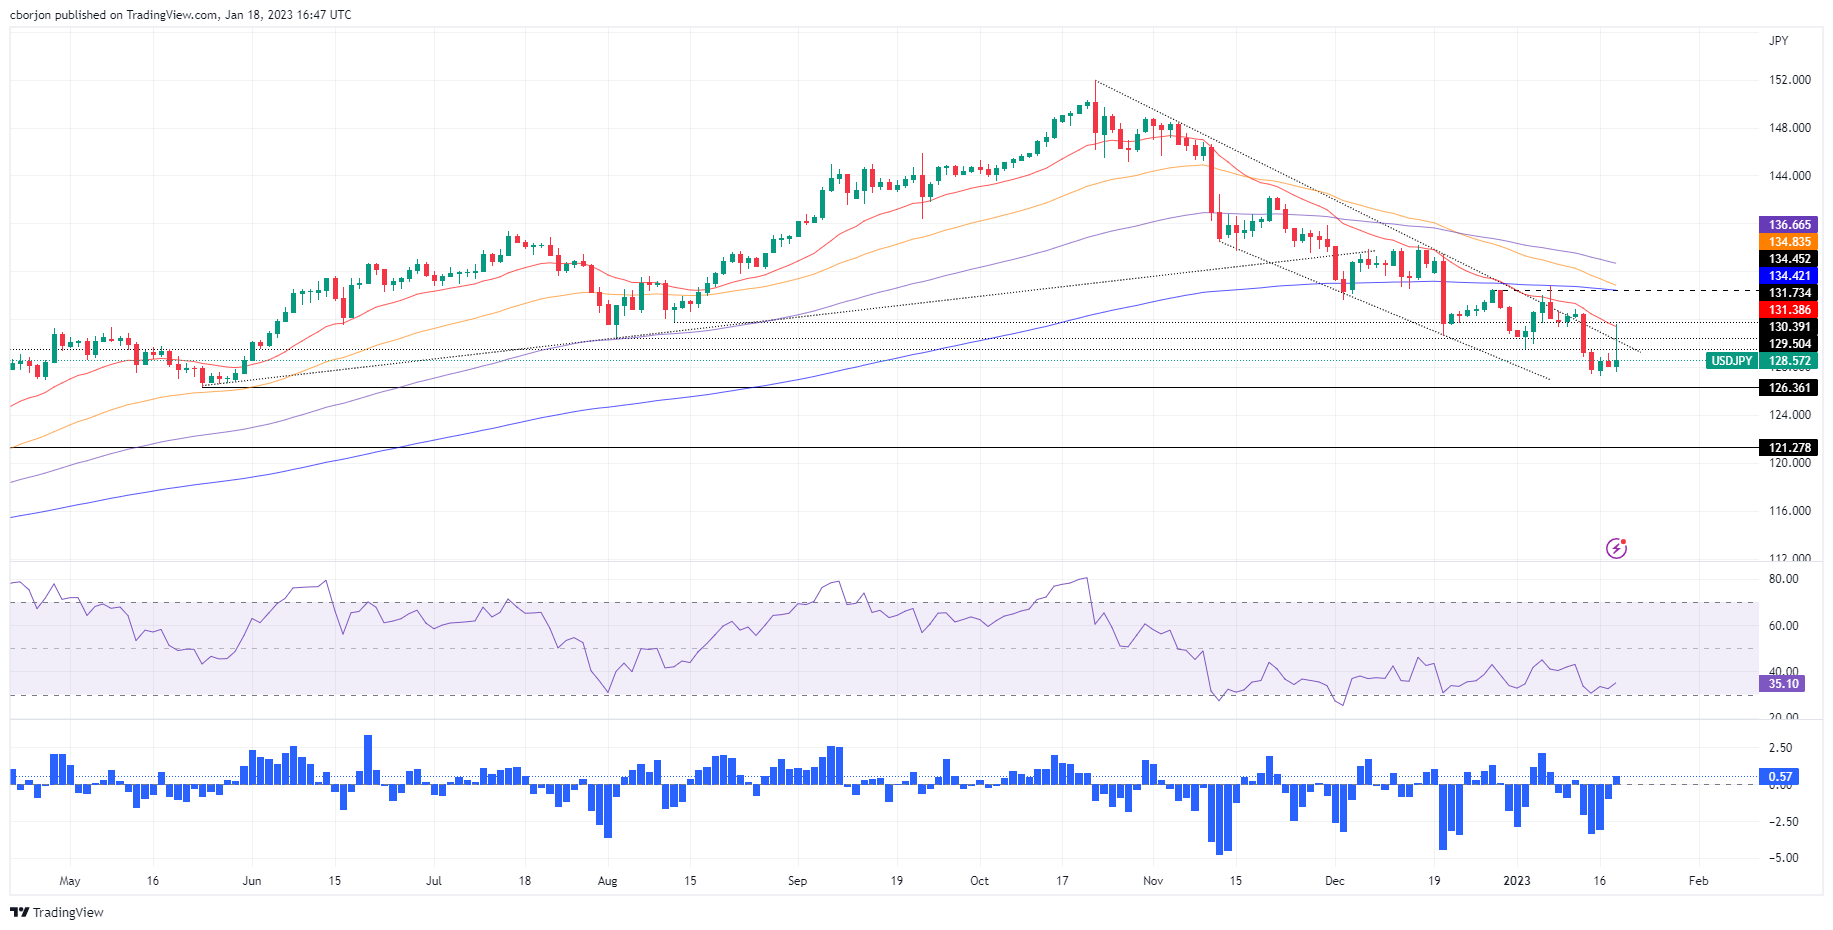
USD/JPY Price Analysis: Technical outlook
The USD/JPY daily chart portrays the major tested the confluence of the 20-day Exponential Moving Average (EMA) and the day’s high at 131.37 and failed to sustain the uptrend. Furthermore, on its way down, the USD/JPY retraced below a four-month downslope resistance trendline that passed around 130.30 ad extended its downtrend beneath 129.00 toward the current spot price.
However, oscillators like the Relative Strength Index (RSI although at bearish territory, its slope aims up, which could mean a reversal could happen. But the Rate of Change (Roc) suggests buyers are losing momentum as it retraces to the zero level.
The path of least resistance in the USD/JPY is downward biased, though if the USD/JPY prints a daily close above 128.46, that could open the door for further upside and might test the 129.00 mark. Otherwise, the USD/JPY first support would be 128.00. A breach of the latter will expose the May 24 swing low of 126.36, followed by the March 31 daily low of 121.27.
USD/JPY Key Technical Levels
Economist at Danske Bank point out the after the stronger-than-expected growth data for the fourth quarter data as well as indications that the Covid wave has peaked earlier, they lift their GDP forecast and PMI profile once again.
More frontloaded recovery
“We now look for an even more frontloaded recovery starting already in early Q1 rather than late Q1 as the service sector is already showing clear signs of rebounding and companies are likely to raise production in anticipation of better demand in the coming quarters. It follows a Q4 GDP release on Monday that came out flat at 0.0% q/q versus our expectations of -1.0% q/q.”
“The frontloading lifts our GDP forecast for 2023 to 5.5% from 4.6% as 1) the stronger-than-expected Q4 lifts the carry over into 2023 and 2) an increase in the Q1 forecast lifts the starting point for 2023 further. However, a more front loaded recovery leaves room for less growth in 2024 as the effect from pent-up demand fades earlier.”
Data released on Wednesday in the US showed Retail Sales dropped more than expected in December by falling 1.1%. Analysts at Wells Fargo point out that ten of 13 retailers saw sales fall in December while back-to-back declines in control group sales suggest a weak end to the year for goods spending. They see more weakness ahead as excess savings and recent real income gains fade.
Rough Finish to 2022 Sets the Stage for Spending Slowdown in 2023
“December was another ugly month for retail sales. Not only did sales decline 1.1% in the month, which was more than expected, but revisions to prior data left overall sales even lower. Excluding autos and gas stations, sales still fell 0.7% in December with ten of 13 categories posting declines.”
“Consumer goods prices slipped 1.1% in December, marking the fifth decline in six straight months, and so we estimate real retail sales were flat in the month. But slowing inflation wasn't enough to offset slowing demand. In short, even the "bright spots" in this report were rather grim.”
“We still broadly expect a gradual spending slowdown, and on goods specifically, is underway as tighter financial conditions, a slowing labor market and low-confidence weigh on spending this year.”
- Swiss Franc rises sharply versus Dollar and Euro.
- Expectations about a less hawkish ECB support the Swiss Franc.
- USD/CHF falls for the fifth consecutive day on Wednesday.
The USD/CHF is falling by almost a hundred pips on Wednesday after trimming some losses during the last hour. The pair bottomed at 0.9084, the lowest level since November 2021 and then rebounded rising back above 0.9100.
The decline in European and US government bond yields weakened the US Dollar and favored the Swiss Franc. The Switzerland 10-year bond yield dropped to 1.05%, the lowest since early December and the US 10-year yield fell to 3.38%, lowest since September.
The demand for European bond strengthened after data showed a slowdown in inflation and some “not so bad” activity figures; and particularly following a media report on Tuesday that mentioned European Central Bank policymakers are starting to consider a slower pace of interest rate hikes after the February meeting.
Expectations of a less hawkish ECB sent the Euro to the downside, and it continues to be a drag. EUR/CHF has fallen sharply, reversing sharply from six-month highs near 1.0100 to levels under 0.9900.
Economic data released on Wednesday weighed further on USD/CHF. Inflation numbers came in below expectations, while Retail Sales and Industrial Production dropped more than market consensus.
USD/CHF breaks 0.9200
The USD/CHF is consolidating below 0.9200, reinforcing the bearish bias. On the flip side, the next critical support is the 0.9100 area. A daily close below would open the doors to more losses. A recovery back above 0.9220 would alleviate the negative tone.
Technical levels
The Yen did not take long to reverse its post-BoJ meeting weakness, as the Dollar fell again. Kit Juckes, Chief Global FX Strategist at Société Générale, thinks that delaying the end of YCC will not stop the Yen’s bounce.
Delaying the end of YCC will not stop the Yen
“The sheer scale of the Yen’s decline in the last three years means that once the tide has turned, there is lot of scope for it to strengthen.”
“There’s plenty of room left for the Yen to bounce, even if the market must wait a while longer before yield curve control (YCC) is adjusted and then abandoned.”
“The Dollar reached its highest level in real terms since 1985 last September, and if the Yen has fallen far enough to have lot of potential upside, the USD has reached high enough heights to be able to fall a long way before it will appear absurdly cheap.”
The US Dollar strengthened strongly against G10 currencies during 2022, before paring back some gains during the winter. Looking ahead, economists at Nordea see a weaker USD and forecast EUR/USD at 1.15 by the end of the year.
Weaker USD ahead
“We believe global factors are in favour of a weaker USD against the EUR and see EUR/USD at 1.15 by year-end of this year. However, the tensions in markets will likely continue.”
“An economic recession and stock market taking a leg lower (earnings recession) is a risk to our USD view, but we are in the cautiously optimistic camp. Moreover, it is quite difficult to pinpoint exactly if and when stock markets will fall.”
- US Retail Sales plummeted, while PPI flashed that inflation continues to ease.
- Industrial Production in the United States shranks for two consecutive months.
- Gold Price Analysis: A daily close above $1900 is needed to exacerbate a rally to $2000.
Gold price snaps two days of straight losses, gaining traction on Wednesday, as the US Dollar (USD) slides to eight-month lows, as shown by the US Dollar Index (DXY). Data released in the United States (US) showed an improvement in inflation, while retail sales slowed a tick, further cementing the case for the US Federal Reserve (Fed) to slow down its tightening policy. At the time of writing, XAU/USD exchanges hand at $1914.91.
Retail Sales in the United States plunged
Wall Street opened in the green, bolstered by US data. The US Commerce Department reported that December Retail Sales plunged -1.1% MoM, below estimates of a -0.8% contraction, tumbling for two consecutive months. November figures were downward revised to -1.0% from -0.6%. Retail Sales on an annual basis rose 6%, unchanged from November’s data.
US inflation at the gate, also known as PPI, eases
Inflation-wise, the US Producer Price Index (PPI) for December slides from -0.1% to -0.5% MoM data that could encourage the Federal Reserve to raise rates significantly higher. Excluding volatile items like food and energy, the so-called core PPI rose by 0.1% MoM, unchanged when compared to consensus and lower than November’s 0.2%. Annually based figures showed an increase of 6.2% in PPI, below estimates of 6.8%, while core PPI rose by 5.5%, beneath the 5.7% expected.
Industrial Production in the US contracts for two straight months
Aside from that, the Federal Reserve reported that Industrial Production in the US decreased -0.7% in December and -1.7% in Q4. Additionally, US manufacturing output fell -1.3% last month, albeit November’s data was downward revised -1.3%.
Fed’s Bullard insists on increasing rates above 5%
Elsewhere Fed officials began crossing newswires, led by the St. Louis Fed President James Bullard. He said the Fed should get rates above 5% “as quickly as we can” before pausing rate hikes as the US central bank tries to curb sticky inflation. Bullard added that inflation “will probably recede in 2023 but not as fast as financial markets expect.”
In the meantime, the US Dollar Index (DXY), which tracks the buck’s value against a basket of six currencies, tumbled to eight-month lows around 101.528 but lately has recovered some ground and exchanged hands around 101.871. Another reason that keeps the XAU/USD underpinned is falling US Treasury bond yields, with the 10-year benchmark note rate plunging below 3.40%, at 3.390%, as it slides 16 bps.
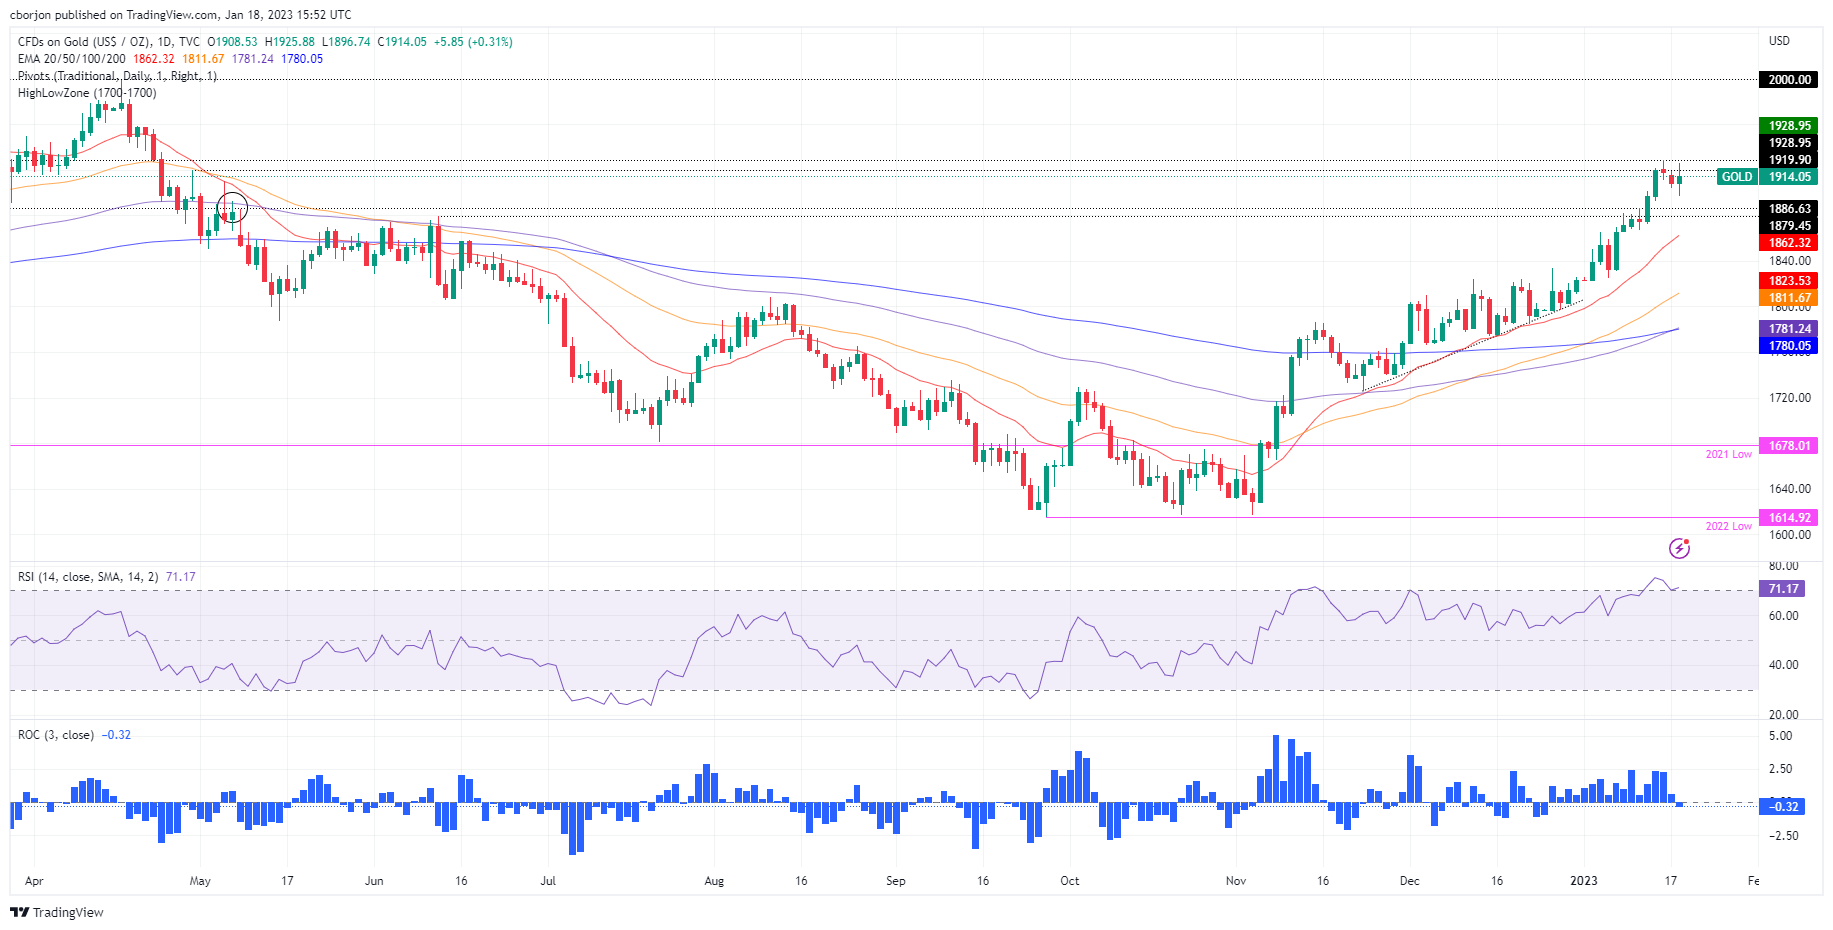
Gold Price Analysis: Technical outlook
Technically speaking, the XAU/USD extended its gains, though retraced somewhat from its daily highs of $1925.88, probably influenced by a mild recovery of the greenback and the Relative Strength Index (RSI) entering overbought conditions. The Rate of Change (RoC) suggests that buying pressure begins to wane. If XAU/USD misses printing a daily close above $1900, that will exacerbate a resume of a downtrend toward the 20-day Exponential Moving Average at $1862.60. Otherwise, and the path of least resistance, the XAU/USD might test the YTD high at $1928.95, followed by the April 21 high of $1957.72, ahead of the $2000 mark.
USD/CAD remains in a bullish trend, but recent price action has been soft. Economists at Rabobank expect the pair to head gradually higher over the coming months towards 1.37.
More downward pressure in the short term
“The technical picture points to more downward pressure in the short term, but we expect strong support at 1.3230 and are of the view that the 1.32 handle will hold.”
“As we move into the middle of the year, we see room for USD strength to re-emerge as the market prices out potential Fed rate cuts. Although we expect a true consumer-driven recession south of the border, inflation will remain well above target, and unemployment is likely to rise slower than is usually seen heading at that stage of the cycle.”
“Our expectation of a USD retracement means we see USD/CAD trading around the 1.37 level towards the end of 2023. However, we expect price action to be a rocky ride and see room for USD/CAD implied to head higher.”
- US Dollar weakens across the board after US data.
- Loonie among wakens currencies following Canadian inflation numbers.
- USD/CAD slightly below 1.3400, without clear direction.
The USD/CAD is moving toward 1.3400 as the US Dollar trims some of its recent losses that followed the releases of US economic data. The pair held around daily highs despite the slide of the greenback supported by Canadian data.
Loonie weakens after Canadian data
Inflation numbers from Canada came in below expectations on Wednesday. The Industrial Product Price Index (IPPI) declined 1.1% month over month, lower than the slide of 0.3% of market consensus. Compared to a year ago it was up 7.6%. The Raw Materials Price Index (RMPI) fell 3.1% in December against expectations of a 1.3% slide.
“These decreases were partially influenced by lower prices for crude oil, which fell partially on macroeconomic concerns as well as global production slightly in excess of demand. Diesel prices remained relatively higher than gasoline prices, partially due to the effects of the Russian invasion of Ukraine. Russia was a major supplier of diesel to Europe, which increased its imports from other sources”, said Statistics Canada in its report.
The Loonie weakened after the numbers. The USD/CAD held around 1.3375 after the numbers even amid a slide of the US Dollar following US data. In the US, the Producer Price Index declined 0.5% in December, versus market consensus of a 0.1% slide; and the annual rate dropped to 6.2%, the lowest since March 2021. A different report showed Retail Sales fell 1.1% in December, more than the 0.8% decline expected. Industrial Production contracted by 0.7% in December.
US bond yields tumbled after the numbers, hitting fresh multi-day lows across the curve. The DXY fell below 101.80, to the lowest level since May.
Despite the weaker dollar, USD/CAD is hovering near 1.3400, moving without a clear direction. On the upside, the pair faces initial resistance at 1.3410 and then 1.3445/50. A consolidation above 1.3450 should open the doors to more gains. On the flip side, support is located at 1.3365 followed by 1.3350 (daily low).
On a wider perspective, risks are tilted to the downside in USD/CAD. Losses seem limited as long as it holds above 1.3350 on a closing basis.
Technical levels
Economists at Credit Suisse are now neutral on EUR/CHF, following the pair’s breach of 1.0050 last week.
SNB policymakers are due to speak
“In our last update on EUR/CHF, we aimed for 0.9500 by the end-Q1. The pair briefly traded through the 1.0050 level, where we said our view would be invalidated. This leaves us neutral on EUR/CHF for now. Still, our bias would be for a stronger Franc versus the Euro, but we suggest waiting for more clarity regarding the SNB’s future monetary policy stance.”
“SNB President Thomas Jordan and Governing Board member Martin Schlegel are due to speak on January 20 and 19, respectively. If they insist on a continued restrictive monetary policy stance, it should stop the recent trend of wider interest rate differentials and could even reverse it, with EUR/CHF lower as a result. Should the outcome be neutral, we expect EUR/CHF to trade in a 1.0200-0.9800 trading range.”
Economists at Danske Bank pencil in 2023 to be a good year for the Norwegian Krone. They forecast EUR/NOK at 10.40 and 10.10 in three and twelve months, respectively.
EUR/NOK at 10.40 in 3M and 10.10 in 12M
“If we are right in our base case that the global recession does not prove too severe or deep and/or energy will prove a top-performing equity sector in the coming years, this leaves a much improved backdrop for NOK in 2023.”
“We forecast EUR/NOK at 10.40 in 3M and 10.10 in 12M.”
“A severe global recession and a sharp sell-off in risk could send EUR/NOK substantially above our projection. On the other hand, a persistent move higher in oil and natural gas prices combined with an improved growth outlook could send EUR/NOK even lower than what we project.”
- EUR/USD advances markedly and prints new tops near 1.0890.
- The dollar sinks to new multi-month lows near 101.50.
- US Retail Sales, Producer Prices disappointed expectations.
EUR/USD gathers extra steam and advances to fresh YTD highs near 1.0890 on Wednesday.
EUR/USD stronger on USD sharp selling
The bullish sentiment continues to grow around the risk complex on the back of the pronounced sell-off in the dollar, which reached new 8-month lows near 101.50 when tracked by the USD Index (DXY).
Against that backdrop, EUR/USD reversed the recent 3-day weakness and climbed to the boundaries of the 1.0890 level, recording at the same time new highs in an area last visited in late April 2022.
Collaborating with the better tone in the single currency emerges comments from ECB’s Board member O.Rehn, who suggested that significant rate raises appear justified in the short term to keep inflation expectations contained.
In the domestic calendar, results for the month of December in the euro bloc saw New Car Registrations expand 12.8% YoY, while the final CPI rose 9.2% YoY and 5.2% YoY when it comes to the Core CPI.
In the US, Retail Sales contracted 1.1% MoM in December and Producer Prices dropped at a monthly 0.5% in the same period. In addition, MBA Mortgage Applications rose 27.9% in the week to January 13 and Industrial Production contracted 0.7% in December vs. the previous month.
Later in the session comes the NAHB Index, Business Inventories, TIC Flows and the Fed’s Beige Book.
Furthermore, FOMC’s Bostic, Bullard, Harker and Logan are also due to speak.
What to look for around EUR
EUR/USD gathered renewed steam and now trades closer to the key round level at 1.0900, always in response to the persevering selling bias surrounding the dollar.
Price action around the European currency should continue to closely follow dollar dynamics, as well as the impact of the energy crisis on the euro bloc and the Fed-ECB divergence.
Back to the euro area, the increasing speculation of a potential recession in the bloc emerges as an important domestic headwind facing the euro in the short-term horizon.
Key events in the euro area this week: EMU New Car Registrations / Final Inflation Rate (Wednesday) – ECB Lagarde, ECB Accounts (Thursday) - ECB Lagarde (Friday).
Eminent issues on the back boiler: Continuation of the ECB hiking cycle amidst diminishing probability of a recession in the region. Impact of the war in Ukraine and the protracted energy crisis on the bloc’s growth prospects and inflation outlook. Risks of inflation becoming entrenched.
EUR/USD levels to watch
So far, the pair is gaining 0.68% at 1.0860 and faces the next up barrier at 1.0887 (monthly high January 18) followed by 1.0900 (round level) and finally 1.0936 (weekly high April 21 2022). On the flip side, the breakdown of 1.0776 (weekly low January 17) would target 1.0481 (monthly low January 6) en route to 1.0443 (weekly low December 7).
Mexican Peso (MXN) was one of the best-performing currencies in 2022. MXN is likely to stay firm in the near term but economists at Rabobank expect USD/MXN to hit 20.50 later in the year.
Support at 18.50 likely to hold
“We disagree with the view that the Fed will cut rates this year, but in the short term, the market is unlikely to change its outlook. This is currently providing support for risk assets across the board. As a result, we see MXN as likely to remain firm on a 1-3 month view, with the pair likely to stay below 19.80. That said, we see support at 18.50 as likely to hold.”
“As we move into the middle of the year and the peak for Fed funds has been reached, we expect the Fed to continue extolling the view that it won’t cut rates this year.”
“We expect a true consumer-driven US recession this year, but this recession is likely to be accompanied by a more robust labor market than in previous cycles. To our mind, that creates a scenario where the Fed holds through the recession. Risk assets are likely to take a hit when this becomes clear to the market.”
“MXN will be somewhat insulated given we expect a terminal rate of 10.75% in Mexico (a final 25 bps hike on February 9), but a move towards 20.50 is highly likely.”
After spiking towards a peak around 131.50 from near 128.50 right after the BoJ decision, USD/JPY quickly retraced all the way back below 129.00. Economists at Credit Suisse still believe that the pair could slump to 120.00.
BoJ stood its ground this time
“The decision to leave YCC intact, and also to leave current 10y JGB targets and trading bands unchanged, was a disappointment to many in the market. But JPY price action since the meeting is in line with our inclination to anticipate another wave of speculation that YCC will end at the March meeting.”
“Our USD/JPY view in our Q1 Outlook was to sell rallies, with an initial target at 125.00 and a possible extension as far as 120.00 in high-vol environments. We see no reason to change this, despite the fact that the BoJ stood its ground this time.”
The GBP is looking quite robust on the session. Economists at Scotiabank expect the GBP/USD to retest the mid-December high at 1.2445/50.
GBP is developing a strong uptrend
“The GBP is developing a strong uptrend on the short-term charts and has been looking in relatively good form technically, at least, since its rebound from sub-1.19 levels in the first week of Jan.”
“Trend momentum is bullish on the intraday chart and new, short-term cycle highs above 1.23 target a retest of the mid-Dec peak at 1.2445/50 at least.”
- USD/JPY retreats over 350 pips from the daily low amid aggressive intraday USD selling.
- The USD adds to its losses following the release of weaker-than-expected US macro data.
- A positive risk tone might undermine the safe-haven JPY and help limit losses for the pair.
The USD/JPY pair surrenders its intraday gains that followed the Bank of Japan policy decision and retreats to the lower end of its daily range during the early North American session. The pair is currently placed around the 128.00 mark and has now moved well within the striking distance of its lowest level since May 2022 touched earlier this week.
As investors digest the BoJ's dovish stance, the emergence of aggressive US Dollar selling turns out to be a key factor leading to the USD/JPY pair's sharp intraday fall of over 350 pips. The USD adds to its heavy losses and drops to a seven-month low following the release of softer-than-expected US macro data, which boosted bets for smaller rate hikes by the Federal Reserve.
Data published by the US Bureau of Labor Statistics showed that the Producer Price Index (PPI) declined to the 6.2% YoY rate in December. This was well below consensus estimates for a fall to 6.8% from November's downwardly revised reading of 7.3%. The data further points to easing inflationary pressure, which could allow the Fed to slow the pace of its policy tightening.
The US monthly Retail Sales also fell short of market expectations and declined by 1.1% MoM in December, missing estimates for a 0.8% fall. Excluding autos, core retail sales also contracted by 1.1% during the reported month as compared to a 0.4% drop anticipated, suggesting a slowdown in consumer demand and reaffirming expectations that the Fed will soften its hawkish stance.
This, in turn, leads to a further decline in the US Treasury bond yields, which continues to weigh on the greenback. That said, a generally positive tone around the equity markets seems to undermine the safe-haven Japanese Yen. This might hold back traders from placing fresh bearish bets around the USD/JPY pair and help limit the downside, at least for the time being.
Technical levels to watch
- Retail Sales in the US declined more-than-expected, by 0.8% in December.
- US Dollar Index remains heavily offered near a multi-month low after the data.
Retail Sales in the United States declined by 1.1% on a monthly basis in December. This follows November’s fall of 0.6% and misses consensus estimates for a 0.8% fall.
Excluding autos, core retail sales also contracted by 1.1% during the reported month as compared to a 0.4% fall anticipated and a modest 0.2% drop in November, pointing to a slowdown in consumer demand.
Market reaction
The US Dollar Index maintains its heavily offered tone and drops back closer to a seven-month low amid rising bets for smaller interest rate hikes by the Fed.
- Annual PPI in the US declined to 6.2% in December, as expected.
- US Dollar Index languishes near a multi-month low after the data.
data published by the US Bureau of Labor Statistics revealed that the Producer Price Index (PPI) for final demand in the US declined to 6.2% on a yearly basis in December from the previous month’s downwardly revised reading of 7.3%. This reading missed consensus estimates for a fall to 6.8%.
Furthermore, the annual Core PPI decelerated to 5.5% during the reported month from the previous month’s reading of 6.2%, again missing market expectations. On a monthly basis, the Core PPI came in at 0.1%, down from 0.2% in November (revised lower from 0.4% reported previously).
Market reaction
The US Dollar fail to gain any respite from the softer inflation data and languishes near a seven-month low amid firming expectations for a less aggressive policy tightening by the Fed.
Strategists at Credit Suisse expect Gold to extend its race higher toward the $1,973/98 resistance zone.
Initial support seen at $1,867
“Gold is expected to extend its rally to resistance next at the 78.6% retracement of the 2022 fall and April 2022 high at $1,973/98, with a fresh cap expected here. Only above the $2,070/75 record highs of 2020 and 2022 would suggest we are seeing a significant and meaningful long-term break higher.”
“Support is seen at $1,867 initially, then $1,825.”
See – Gold Price Forecast: Sustainability of the current XAU/USD upswing is uncertain – Commerzbank
- AUD/USD scales higher for the second straight day and climbs to a fresh multi-month peak.
- The emergence of heavy selling around the USD is seen acting as a tailwind for the major.
- Rising bets for an additional rate hike by the RBA remain supportive of the positive move.
- Traders now look forward to the US PPI and monthly Retail Sales data for a fresh impetus.
The AUD/USD pair gains strong follow-through traction for the second successive day on Wednesday and continues scaling higher through the mid-European session. The positive momentum lifts spot prices to the 0.7035 area, or the highest level since August 16, during the mid-European session and is sponsored by the heavily offered tone surrounding the US Dollar.
In fact, the USD Index, which tracks the greenback's performance against a basket of currencies, drops closer to a seven-month low touched earlier this week and is pressured by a combination of factors. The prospects for smaller interest rate hikes by the Fed trigger a fresh leg down in the US Treasury bond yields. Apart from this, a generally positive tone around the equity markets further undermines the safe-haven greenback and benefits the risk-sensitive Aussie.
Investors turned optimism amid hopes that more stimulus measures announced by the Chinese government will lead to a strong recovery in the world's second-largest economy. Apart from this, rising odds for an additional interest rate hike by the Reserve Bank of Australia (RBA) in February lends some support to the domestic currency and acts as a tailwind for the AUD/USD pair. Wednesday's positive move could also be attributed to technical buying above the 0.7000 psychological mark.
The aforementioned fundamental backdrop favours bullish traders and supports prospects for a further near-term appreciating move for the AUD/USD pair. Hence, any meaningful corrective pullback could be seen as a buying opportunity and is more likely to remain limited. Market participants now look forward to the US economic docket, highlighting the release of the Producer Price Index and monthly Retail Sales data for short-term trading opportunities.
Technical levels to watch
The CAD is showing a marginal gain on the USD on the session. Economists at Scotiabank expect the USD/CAD pair to test support at 1.3325, then 1.3275.
Technical risks are tilted lower
“The ceiling of the trading band at 1.3450 has been fairly solid over the past week and we still rather think technical risks are tilted lower following the early Dec breakdown from the USD’s late 2022 1.35/1.37 range; these factors (plus developing bearish momentum on the intraday chart) load the dice against the USD to some extent in the short run.”
“Look for a test of USD support at 1.3325, followed by 1.3275.”
US Monthly Retail Sales Overview
Wednesday's US economic docket highlights the release of monthly Retail Sales figures for December, due later during the early North American session at 13:30 GMT. The headline sales are estimated to have declined by 0.8% in December, marking the second straight month of contraction. Excluding autos, core retail sales probably climbed by 0.4% during the reported month as compared to a modest 0.2% fall in November.
Analysts at TD Securities (TDS) offer a brief preview of the key macro data and explain: “We look for retail sales to have retreated sharply in December (-1.2%), building on a more modest decline from the prior month. Spending was dented by significant contractions in auto and gasoline station sales. Importantly, control group sales likely also fell for a second consecutive time (-0.3%), while those for bars/restaurants probably advanced slightly for a fifth month straight.”
How Could it Affect EUR/USD?
Ahead of the release, the US Dollar languishes near a seven-month low amid a fresh leg down in the US Treasury bond yields and the prospects for a less aggressive policy tightening by the Fed. Weaker-than-expected US Retail Sales figures will point to a slowdown in consumer demand and reaffirm bets for smaller rate hikes by the US central bank. This, in turn, should exert additional downward pressure on the greenback and allow the EUR/USD pair to capitalize on its intraday positive move beyond the multi-month high touched on Monday.
Conversely, better-than-expected data could trigger a short-covering around the buck. The immediate market reaction, however, is likely to be limited as investors now seem convinced that the Fed will soften its hawkish stance amid signs of easing inflation pressures. This, in turn, suggests that the path of least resistance for the EUR/USD pair is to the upside and any meaningful dip might still be seen as a buying opportunity.
Key Notes
• US Retail Sales Preview: Forecasts from six major banks, consumers cautious about opening wallets to retailers
• EUR/USD Forecast: Bulls retain control ahead of final Eurozone CPI, US macro data
• EUR/USD likely to trade in 1.12-1.15 range ahead – Citigroup
About US Retail Sales
The Retail Sales released by the US Census Bureau measures the total receipts of retail stores. Monthly per cent changes reflect the rate of changes in such sales. Changes in Retail Sales are widely followed as an indicator of consumer spending. Generally speaking, a high reading is seen as positive (or bullish) for the USD, while a low reading is seen as negative (or bearish).
EUR/USD rebounds. Economists at Scotiabank expect the world’s most popular currency pair to enjoy further gains toward the 1.1000/50 region.
The technical odds favour gains
“There is solid support for the EUR in the sub-1.08 range but the EUR is clearly having trouble extending gains through the upper 1.08s. This is the fourth time the EUR has failed to advance beyond 1.0875 since last Thursday.”
“The technical odds favour gains amid a strong upwards trend and bullish trend momentum.”
“I think EUR gains to extend to the 1.1000/50 range shortly.”
The JPY sold off sharply on news that the BoJ was not loosening its accommodative policy but it has subsequently recovered a large part of these falls. Any further widening in the YCC band could be delayed until April, in the view of economists at Rabobank.
USD/JPY seen at 128 in a three-month view and 126 in six-months
“It is likely speculation of another adjustment to YCC will build again in March, although we would expect the April meeting to be a more likely source of change.”
“Our one-month USD/JPY 130 forecast crudely reflects our view that both today’s and March’s policy meetings could bring steady policy. That said, we forecast USD/JPY at 128 in a three-month view and 126 in six- months.”
- EUR/USD rebounds from earlier lows near 1.0770 on Wednesday.
- The next up barrier of note remains at the YTD high at 1.0874.
EUR/USD reverses three consecutive daily pullbacks and regains the 1.0800 hurdle and beyond midweek.
It seems the pair is moving within a range bound theme ahead of the potential resumption of the uptrend. Against that, the immediate resistance level comes at the so far YTD high at 1.0874 (January 16), which once cleared it could lead up to a probable visit to the round level at 1.0900 in the relatively short-term horizon.
Furthermore, while above the short-term support line near 1.0600, extra gains should remain in store.
In the longer run, the constructive view remains unchanged while above the 200-day SMA at 1.0307.
EUR/USD daily chart
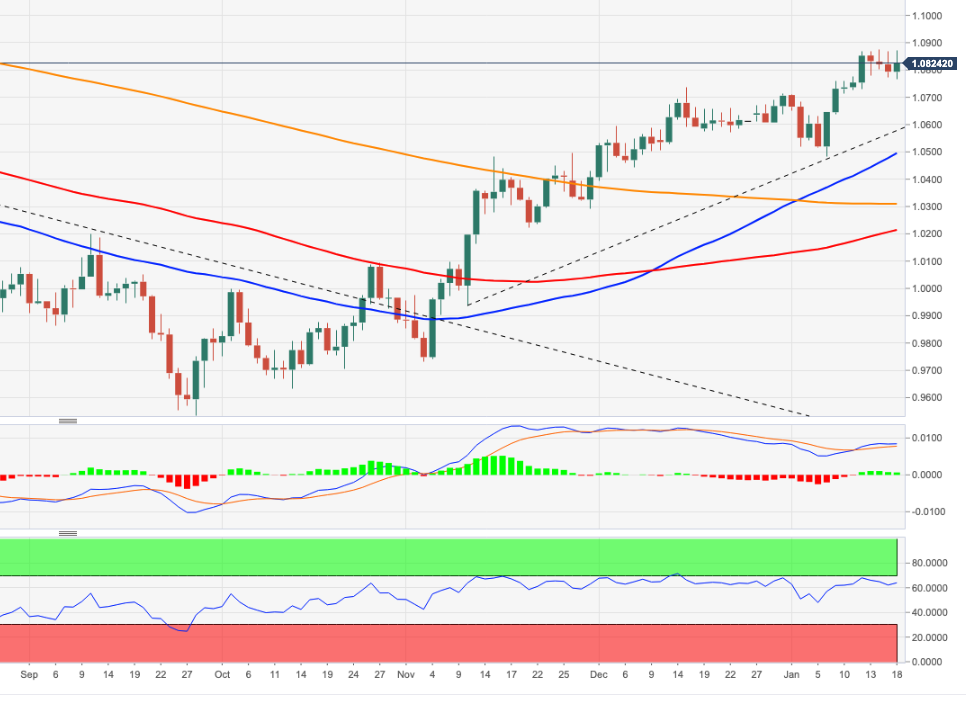
Norges Bank will announce a new rate decision on Thursday, January 19 at 09:00 GMT and as we get closer to the release time, here are the expectations forecast by the economists and researchers of three major banks regarding the upcoming central bank's Interest Rate Decision.
Norges Bank is expected to hike rates by 25 basis points to 3.0%. This could end the tightening cycle. At the last policy meeting on December 15, the bank hiked rates by 25 bps to 2.75%.
ING
“We expect a 25 bps rate hike, which would mean that the 3% level is reached. We see little reason not to take Norges Bank at its word and we suspect that will indeed be the peak, though much depends on oil prices and what other central banks end up doing through the spring.”
Swedbank
“Norges Bank will likely keep the policy rate unchanged at the interim policy meeting as no big deviations from the December projections are seen.”
TDS
“We now look for an unchanged policy rate at 2.75%, in line with the Bank's rate path projection. With data coming in roughly in line with the Bank's latest forecasts, we think the Bank will wait for more data before delivering another 25 bps hike in March. Strong GDP data presents some hawkish risk to our call, and might be enough to warrant a 25 bps hike at this meeting.”
- GBP/USD climbs to over a one-month high and draws support from a combination of factors.
- Elevated UK CPI might force the BoE to continue raising rates and boost the British Pound.
- Bets for smaller Fed rate hikes, sliding US bond yields weigh on the USD and extend support.
- Traders now look forward to important US economic data for some short-term opportunities.
The GBP/USD pair gains positive traction for the second successive day on Wednesday and scales higher through the mid-European session. Spot prices climb to the highest level since mid-December, around the 1.2360-1.2365 region in the last hour and seem poised to prolong the ascending trend witnessed over the past two weeks or so.
The British Pound strengths following the release of the UK consumer inflation figures, which remain elevated and could maintain pressure on the Bank of England (BoE) to continue raising interest rates. The UK Office for National Statistics reported that the annual CPI fell to a three-month low level of 10.5% in December, though the core reading stayed at 6.3% or more than three times the BoE's 2% target. Apart from this, the emergence of heavy selling around the US Dollar provides an additional boost to the GBP/USD pair.
Firming expectations for a less aggressive policy tightening by the Fed triggers a fresh leg down in the US Treasury bond yields. In fact, the markets now seem convinced that the US central bank will soften its hawkish stance amid signs of easing inflationary pressures and have been pricing in a 25 bps rate hike in February. This, along with a generally positive risk tone - amid hopes for a strong economic recovery in China - further dents the Greenback's relative safe-haven status against its British counterpart.
Moreover, technical buying on a sustained strength above the 1.2300 mark further contributes to the GBP/USD pair's positive move on Wednesday. The fundamental backdrop as well as the technical setup favours bullish traders and supports prospects for a further near-term appreciating move. Investors now look to the US economic docket, highlighting the release of the Producer Price Index and Retail Sales data. Apart from this, speeches by influential FOMC members and the USD bond yields could provide a fresh impetus.
Technical levels to watch
- The index adds to Tuesday’s losses and returns below 102.00.
- A move below the January low at 101.77 exposes extra retracements.
The DXY trades on the defensive and revisits the area below the 102.00 mark amidst intense selling pressure on Wednesday.
So far, the continuation of the side-lined mood looks like the name of the game for the dollar, at least in the near term. In case bears regain the upper hand, the loss of the January low at 101.77 (January 16) should put a potential deeper drop to the May 2022 low around 101.30 (May 30) back on the investors’ radar prior to the psychological 100.00 level.
In the meantime, while below the 200-day SMA at 106.42 the outlook for the index should remain tilted to the negative side.
DXY daily chart
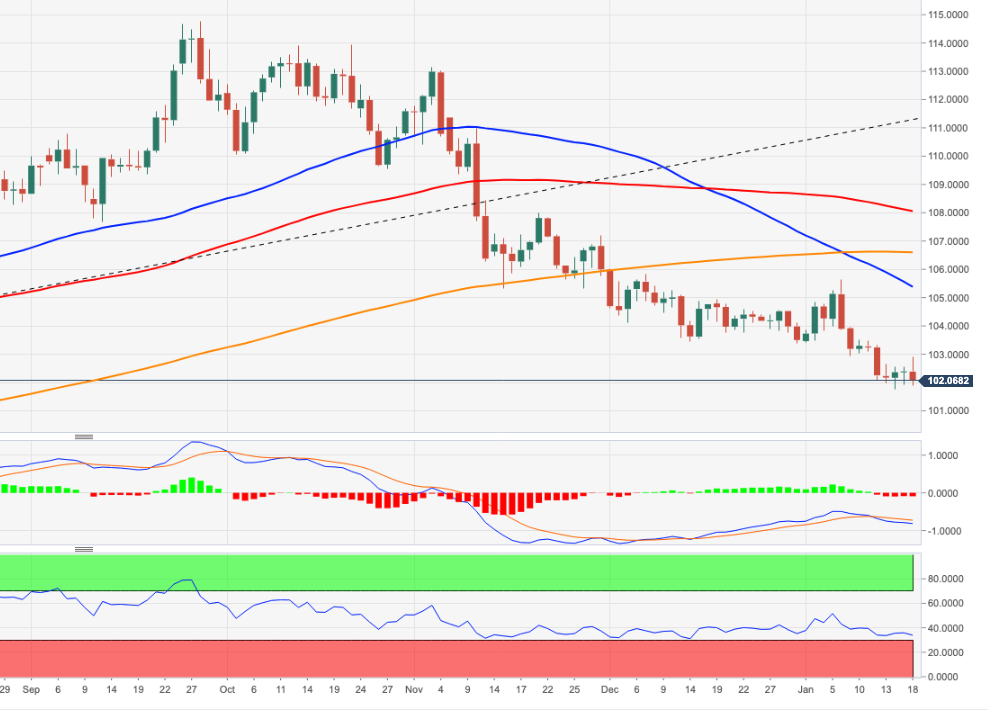
Bad start to the year, but the Swedish Krona and the Norwegian Krone should see improvement ahead, in the view of analysts at Nordea.
Risk-sensitive currencies should do better if calls for global recession do not materialise
“China’s reopening and other governments’ investments will support commodity prices ahead and underpin the global economy, which should favour risk-sensitive currencies such as the CAD, AUD, NZD, NOK and SEK. These currencies should do better if the calls for a global recession do not materialise and the USD weakens.”
“After a bad start of the year, we expect somewhat lower EUR/NOK and EUR/SEK ahead, but both will jump during periods when risk-sentiment turns sour and if a recession comes about. We remain in the cautiously optimistic camp.”
- EUR/JPY climbs sharply and pierces the 141.00 mark on Wednesday.
- The breakout of the 200-day SMA should restore the bullish outlook.
EUR/JPY picks up marked buying interest and trespasses the 141.00 barrier to clinch new multi-day highs on Wednesday.
The cross needs to clear the 200-day SMA in quite a convincing fashion to shift the outlook to a more constructive one, ideally in the very near term. Extra gains from here should revisit the key resistance area near 143.00 (high December 28, January 11).
This key up barrier also appears underpinned by the 55-day SMA (142.92) and the 100-day SMA (143.10).
EUR/JPY daily chart
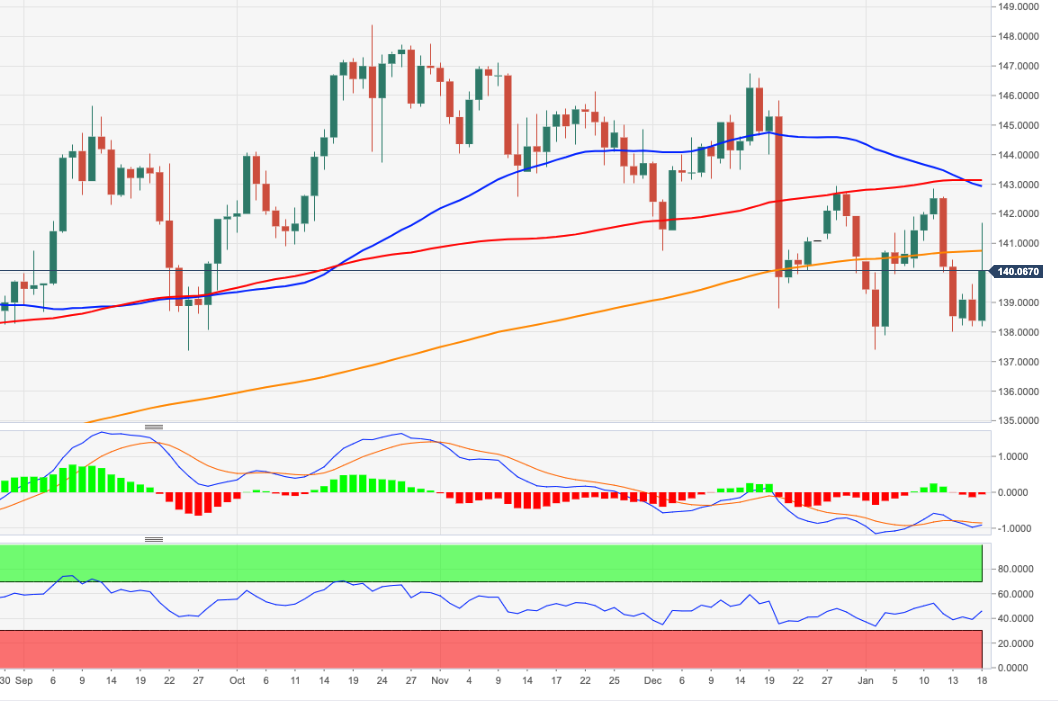
Due to the sanctions, the RUB exchange rate now only reflects current account flows. Hence, the Ruble is likely to depreciate medium-term due to the declining current account surplus, eeconomists at Commerzbank report.
RUB exchange rate now only reflects current account flows
“Russia’s capital account is closed for major hard currencies. The absence of capital flows means that the exchange rate does not perform its forward-looking role based on expectations – it only reflects day to day trade flows, much of which is energy trade.”
“In the longer-term, Russia’s current-account will drift more towards neutral (from surplus) which points towards weaker RUB levels.”
“Fundamental factors are less relevant for the Ruble due to the closed capital account.”
FX Strategists at Citigroup expect the EUR/USD pair to be trading in a 1.12-1.15 range, laying out the reasoning behind their bullish outlook.
Key quotes
“China reopen coinciding with US inflation peaking and lower Natural gas price.”
“Represents material shift in market narrative, opening a new FX regime.”
“Risk to view is renewed equity weakness that would support US Dollar. “
“Technicals favor EUR/USD gains toward major Fib 1.0938.”
“However, dealers beware option-related headwinds thereafter.”
Since its low in October, AUD/USD has been recovering strongly. Economists at Société Générale believe that China reopening is set to boost AUD/USD beyond 0.70.
RBA meeting in February should see only a 25 bps hike
“The Chinese reopening remains the dominant macro theme in FX, while AUD/USD performance is strongly linked to Chinese equities. China grew faster than expected in 4Q22, as GDP printed at 0.0% QoQ (consensus expected -1.1%), and December activity data also surprised positively.”
“The next RBA meeting in February should see only a 25 bps hike, and the street only expects one other hike of that size to reach the terminal rate.”
“As the RBA turned dovish before most central banks, Australian growth should be one of the least impaired in G10 by the global tightening cycle, likely securing further AUD/USD gains towards 0.75.”
UOB Group’s Economist Ho Woei Chen reviews the latest GDP releases in the Chinese economy.
Key Takeaways
“China’s economy slowed in 4Q22 amid a surge in domestic Covid infections and deaths but the outcome turned out to be better-than-expected. The GDP rose by 2.9% y/y (Bloomberg est: 1.6%, UOB est: 2.2%, 3Q22: 3.9%) in 4Q22 with the full-year 2022 growth at 3.0%.”
“The economy also avoided a quarter-on-quarter contraction as GDP was flat (Bloomberg est: -1.1%, 3Q22: +3.9%) compared to 3Q22, on a seasonally adjusted basis. This compares well against the two-month lockdown in Shanghai which resulted in -2.4% q/q for the GDP in 2Q22.”
“Better-than-expected data across most economic indicators in Dec suggests that the recovery momentum may turn out to be stronger in 1Q23. Industrial production (IP), retail sales, fixed asset investment (FAI) were all above expectation in Dec and the surveyed jobless rate unexpectedly improved.”
“Our 5.2% GDP growth forecast for 2023 has factored in a more moderate recovery compared to the 2020-21 period when China’s growth had averaged 5.3%, mainly due to the absence of support from a strong global demand. We envisage a greater contribution from final consumption expenditure of more than 4.0ppt to the headline GDP growth rate while gross capital formation and net exports are likely to contribute just around 1.0ppt in 2023.”
“We expect the fiscal and monetary support to stay in place until the economy has stabilised. As the mild inflation backdrop is likely to persist in 1Q23, there will be opportunities for the People’s Bank of China (PBOC) to lower its interest rate or banks’ reserve requirement ratio (RRR).”
Economists at Standard Chartered expect a near-term bounce in the US Dollar over the next month as the Fed continues to tighten.
US government bond yields to rise towards 4%
“While technicals are not yet at extremely oversold levels, USD has declined nearly 9% since its recent peak in late 2022. History suggests markets or currencies rarely witness such large moves without being followed by a period of consolidation.”
“Over the next 1-3 months, we expect US government bond yields to rise towards 4% as we expect another 75 bps of Fed rate hikes in H1 23, which should be supportive for the USD.”
“China’s rapid reopening could lead to a slower-than-forecast decline in inflation. This could lead to a market reassessment of current expectations of a relatively rapid Fed easing in 2023, which could drive flows into the safe-haven USD, at least temporarily.”
The Yen has weakened sharply after the Bank of Japan’s (BoJ) decision to keep the monetary policy settings and yield curve control policy unchanged. Nevertheless, the BoJ update does not alter MUFG Bank’s bullish outlook.
Expectations for imminent shift in YCC settings disappointed
“BoJ’s decision to leave YCC policy settings unchanged has resulted in the Yen weakening by around 2% against other major currencies. The scale of the initial sell-off is broadly in line with our expectations for a 2-3% decline for the JPT if the BoJ left policy settings unchanged.”
“There is a risk though that the Yen sell-off could still extend further in the near-term. The decision is unlikely to completely remove speculation that another shift in policy will be forthcoming at upcoming policy meetings which will help to dampen how much further and for how the JPY weakens. The BoJ’s next policy meeting though is not until 10th March so speculation over an imminent shift in policy could remain lower in the month ahead.”
“We expect market participants to remain sceptical over the sustainability of YCC policy settings. Furthermore, the upcoming end to Governor Kuroda’s term at the end of April will continue to encourage speculation over a shift in policy under new leadership. In these circumstances, the Yen sell-off should prove temporary and we maintain a bullish outlook for the JPY in the year ahead.”
At the start of the meeting with Chinese Vice Premier Liu He met in Zurich on Wednesday, US Treasury Secretary Janet Yellen said that she planned to address issues of concern in their first in-person meeting, but said both countries needed to manage "our differences and prevent competition from becoming anything ever near conflict."
"While we have areas of disagreement, and we will convey them directly, we should not allow misunderstandings, particularly those stemming from a lack of communication, to unnecessarily worsen our bilateral economic and financial relationship," Yellen added.
Related reads
- China’s Liu to Yellen: US-Sino relationship is highly consequential, hopes they can work together
- USD/CNH moved into a consolidative phase – UOB
- USD/CAD turns lower for the second straight day and is pressured by a combination of factors.
- Bullish crude oil prices underpin the Loonie and weigh on the pair amid renewed USD selling.
- Traders now look forward to the US PPI and Retail Sales data for short-term opportunities.
The USD/CAD pair attracts fresh selling on Wednesday following an early uptick to the 1.3410 area and turns lower for the second successive day. The steady intraday descent drags spot prices to a fresh weekly low, around mid-1.3300s, during the first half of the European session and is sponsored by a combination of factors.
Crude oil prices climb to the highest level since early December amid the optimism that the easing of strict COVID-19 curbs in China will boost fuel demand. This, in turn, underpins the commodity-linked Loonie, which, along with the emergence of heavy intraday selling around the US Dollar, exerts some downward pressure on the USD/CAD pair.
In fact, the USD Index, which tracks the greenback's performance against a basket of currencies, fails to preserve its strong intraday gains amid bets for a less aggressive policy tightening by the Fed. The markets now seem convinced that the Fed will soften its stance and have been pricing in a smaller 25 bps rate hike in February.
The bets were reaffirmed by the US CPI report released last week, which pointed to signs of easing inflationary pressure. This led to a fresh leg down in the US Treasury bond yields and is seen weighing heavily on the greenback, dragging the USD/CAD pair back closer to its lowest level since November 25 touched on Friday.
Market participants now look to the US economic docket, highlighting the release of the Producer Price Index and monthly Retail Sales later during the early North American session. This, along with speeches by influential FOMC members, the US bond yields and the broader market risk sentiment, will drive the USD demand.
Apart from this, traders will take cues from oil price dynamics to grab short-term opportunities around the USD/CAD pair. Nevertheless, the fundamental backdrop seems tilted in favour of bears and suggests that the path of least resistance for spot prices is to the downside. Hence, any attempted recovery could get sold into.
Technical levels to watch
In its latest oil market report published on Wednesday, the International Energy Agency (IEA) said that China is set to account for half of 2023 oil demand growth after COVID-19 reopening.
Additional takeaways
Global refinery activity steady in Dec as US runs plunged due to weather-related outages.
Global oil stocks rose by 79.1 mln barrels MoM in Nov, hitting the highest since Oct 2021.
World oil supply growth in 2023 is set to slow to 1 mln bpd, led by declines in Russian exports.
Russian diesel exports surged to a multi-year high of 1.2 mln bpd ahead of Feb sanctions on them.
Russian oil exports fell by 200,000 bpd MoM in December to 7.8 mln bpd on new price cap sanctions.
OECD oil demand slumped by 900,000 bpd in q4 2022 on weak industrial activity, mild weather.
Global oil demand is set to rise by 1.9 mln bpd in 2023, to a record 101.7 mln bpd.
Market reaction
WTI is paring back gains from daily highs of $82.12 despite the upbeat IEA’s outlook on global oil demand. The US oil is trading at $81.75, still adding 0.55% on the day.
Copper has broken a range of major resistances. However, economists at Credit Suisse suspect strength is capped at $9,359 for now.
Support at $8,640/00 set to hold
“Copper (LME) extends its strong start to the year for a test of the ‘neckline’ to the medium-term top at $9,135. With the 78.6% retracement of the 2022 fall also just above at $9,359 we look for a cap below here for now. Should strength directly extend though we see resistance next at $9,916.”
“Support at $8,640/00 now ideally holds. Below $8,188 though is needed to warn the best of the strength may have been seen.”
In the view of UOB Group’s Economist Lee Sue Ann and Markets Strategist Quek Ser Leang, USD/CNH is now expected to navigate between 6.7200 and 6.8550 in the next few weeks.
Key Quotes
24-hour view: “Our view for USD to ‘trade in a range’ yesterday was incorrect as it soared to a high of 6.7900 before closing at 6.7700 (+0.35%). While upward momentum has not improved much, USD could advance to 6.8000 before the likelihood of a pullback increases. The next resistance at 6.8350 is unlikely to come into view. Support is at 6.7600, followed by 6.7400.”
Next 1-3 weeks: “We have held a negative USD view for more than a week now. Yesterday (17 Jan, spot at 6.7400), we highlighted that downward momentum is beginning to ease and a break of 6.7580 would indicate that the weakness in USD has stabilized. USD subsequently soared to a high of 6.7900. The price actions suggest USD has entered a consolidation phase and will likely trade between 6.7205 and 6.8550 for the time being.”
- Gold price stages a decent comeback as US Dollar falls with Treasury bond yields.
- USD/JPY reversal post-BoJ also weighs down on the US Dollar ahead of US data.
- Gold price needs to take out the key $1,918 barrier to resume the uptrend.
Gold price has stalled its ongoing corrective downside, staging a decent comeback so far this Wednesday. The US Dollar has reversed its early gains amid falling US Treasury bond yields, which has helped Gold price recover lost ground. Meanwhile, Gold price continues to benefit from increased bets of smaller US Federal Reserve (Fed) rate hikes, although the US Retail Sales and Producer Price Index (PPI) will help shed more light on the same. Earlier in the day. the Bank of Japan (BoJ) stood pat on its yield control policy, which drove USD/JPY through the roof, propelling the US Dollar in tandem. Although the moves are seen reversing, as investors gear up for the high-impact US economic data.
Also read: Gold Price Forecast: XAU/USD eyes further correction toward $1,870 amid bearish technicals
Gold Price: Key levels to watch
The Technical Confluence Detector shows that the gold price is facing immediate resistance at $1,914, which is the Fibonacci 61.8% one-day.
A break above which will put the powerful hurdle at $1,918 under threat. That level is the convergence of the pivot point one-month R3 and pivot point one-day R1.
Acceptance above the latter is critical to extending the renewed upside toward the previous week’s high at $1,922. Further up, the nine-month top at $1,929 will challenge bearish commitments.
On the flip side, a dense cluster of healthy support levels awaits around $1,909, which is the meeting point of the Fibonacci 23.6% one-week, Fibonacci 38.2% one-day and SMA5 four-hour.
Should bears flex their muscles, then the previous day’s low at $1,903 could be put to test. The last line of defense for Gold buyers is seen at the Fibonacci 38.2% one-week at $1,899.
Here is how it looks on the tool
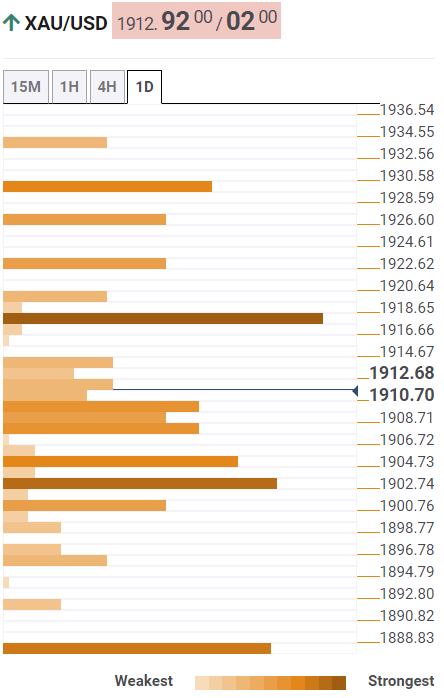
About Technical Confluences Detector
The TCD (Technical Confluences Detector) is a tool to locate and point out those price levels where there is a congestion of indicators, moving averages, Fibonacci levels, Pivot Points, etc. If you are a short-term trader, you will find entry points for counter-trend strategies and hunt a few points at a time. If you are a medium-to-long-term trader, this tool will allow you to know in advance the price levels where a medium-to-long-term trend may stop and rest, where to unwind positions, or where to increase your position size.
- USD/JPY retreats over 200 pips from a multi-day top touched in the aftermath of the BoJ decision.
- Bets for smaller Fed rate hikes, sliding US bond yields weigh heavily on the USD and exert pressure.
- Traders now look to the US PPI and monthly Retail Sales figures for some meaningful opportunities.
The USD/JPY pair trims a major part of the Bank of Japan (BoJ)-inspired gains to a multi-day peak and slides back below mid-129.00s during the first half of the European session.
The US Dollar comes under heavy selling pressure following a strong intraday rally and turns out to be a key factor attracting some sellers around the USD/JPY pair at higher levels. Firming expectations for a less aggressive policy tightening by the Fed trigger a fresh leg down in the US Treasury bond yields and weigh on the Greenback. In fact, the markets now seem convinced that the US central bank will soften its hawkish stance amid signs of easing inflationary pressure and have been pricing in a smaller 25 bps rate hike in February.
Despite the sharp intraday pullback of over 175 pips from the 131.55-131.60 area, the USD/JPY pair is still up nearly 1% for the day in the wake of the BoJ's dovish policy decision. The Japanese central bank maintained ultra-low interest rates and left its yield curve control measures unchanged, defying expectations for more hawkish signals. The announcement triggers a steep fall in the Japanese bond yields, recording the biggest drop since September 2003. This, in turn, might continue to weigh on the JPY and lend support to the USD/JPY pair.
Market participants now look forward to the US economic docket, featuring the release of the Producer Price Index (PPI) and monthly Retail Sales figures later during the early North American session. Apart from this, speeches by a slew of FOMC members and the US bond yields might influence the USD price dynamics. Traders will further take cues from the broader market risk sentiment, which tends to drive demand for the safe-haven JPY. This, in turn, should provide some impetus to the USD/JPY pair and allow traders to grab short-term opportunities.
Technical levels to watch
Canadian Consumer Price Index (CPI) growth slowed further in December. Loonie rose after the data. A hawkish Bank of Canada next week could provide furthe support.
CAD stronger following publication of inflation data
“Even though the overall rate eased a little more than expected to 6.3% (Bloomberg 6.4%), and the core rates (median and trim) eased slightly to 5.0% and 5.3% respectively (Bloomberg: 4.9% and 5.2% respectively), the previous month’s result was corrected to the upside. That means the impression of an overall rate slowly easing is confirmed, as is the image of a core rate still stubbornly moving sideways above 5%.”
“Just like the (small) majority of analysts polled by Bloomberg we expect the BoC to take a further step of 25 bps to then 4.5% at its meeting next week. This seems to have been increasingly priced in by the market.”
“The Loonie was able to benefit from yesterday’s inflation data. A surprisingly hawkish BoC might provide further support, in particular if the other central banks surprise on the dovish side.”
Jane Fraser, the Chief Executive Officer of Citigroup said in her speech at Davos that “central bank tightening is likely to continue.”
Additional takeaways
“Opportunities in Saudi to start building up SMEs and middle market companies are important.”
“We are expecting to see a rolling series of country recessions around the world.”
“We have seen good news from an economic opening and market-friendly measures in China.”
“China opening up is important for the world.”
“It is quite a choppy time in the world.”
- GBP/USD gains traction for the second straight day and climbs to over one-month high.
- The prospects for more BoE rate hikes underpin the Sterling and extend some support.
- A combination of factors weighs on the USD and remains supportive of the momentum.
The GBP/USD pair scales higher for the second straight day on Wednesday and climbs to its highest level since mid-January during the early part of the European session. The British Pound remains supported by the stronger wage growth data released on Tuesday, which is expected to keep inflation elevated. The UK Office for National Statistics, meanwhile, reported earlier today that consumer price inflation fell to a three-month low level of 10.5% in December. This, however, is still running at levels last seen in the early 1980s and should maintain pressure on the Bank of England to continue raising interest rates. Apart from this, the emergence of fresh selling around the US Dollar provides an additional boost to the major.
The intraday USD rally - led by the Bank of Japan-inspired sell-off in the Japanese Yen - fades rather quickly amid firming expectations for a less aggressive policy tightening by the Fed. Investors seem convinced that the US central bank will soften its hawkish stance amid signs of easing inflationary pressures. Moreover, the current market pricing indicates a greater chance of a smaller 25 bps lift-off in February. This leads to a fresh leg down in the US Treasury bond yields and continues to weigh on the buck. Apart from this, a mildly positive tone around the equity markets also seems to undermine the safe-haven greenback and supports prospects for an extension of a two-week-old appreciating move for the GBP/USD pair.
Traders now look forward to the US economic docket, highlighting the release of the Producer Price Index (PPI) and monthly Retail Sales figures later during the early North American session. The data, along with the US bond yields and the broader risk sentiment, might influence the USD price dynamics and provide a fresh impetus to the GBP/USD pair. Nevertheless, the fundamental backdrop favours bulls and suggests that the path of least resistance for spot prices is to the upside. Hence, any immediate market reaction to the upbeat US macro data is more likely to remain limited and might do little to hinder the pair's ongoing positive move.
Technical Outlook
From a technical perspective, the overnight break through the 1.2250 supply zone and a subsequent move beyond the 1.2300 mark add credence to the positive outlook. Furthermore, oscillators on the daily chart have just started gaining positive traction and support prospects for a further near-term appreciating move. Hence, some follow-through strength towards reclaiming the 1.2400 mark, en route to the December 2022 swing high near the 1.2445 area, looks like a distinct possibility. The momentum could get extended further and allow the GBP/USD pair to reclaim the 1.2500 psychological mark for the first time since June.
On the flip side, any meaningful slide below the 1.2300 mark now seems to attract fresh buyers and remain limited near the 1.2250 resistance breakpoint. A convincing break below the latter might prompt some technical selling and drag the GBP/USD pair further towards the 1.2200 mark. This is followed by support near the 1.2170-1.2165 area, below which the fall could get extended towards the 1.2100 mark.
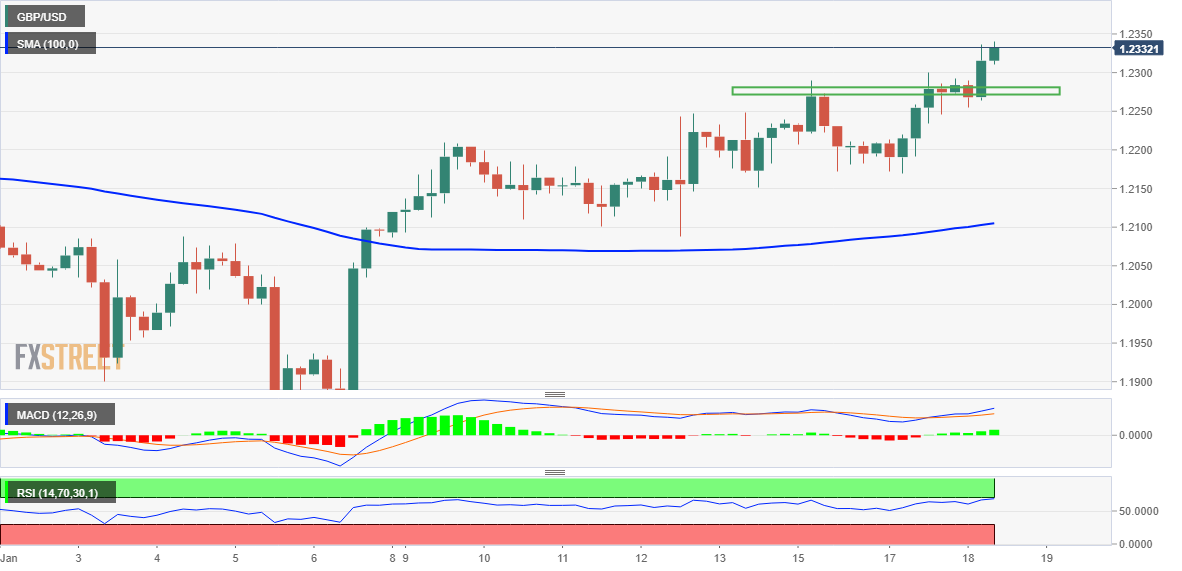
- EUR/USD resumes the uptrend and retakes 1.0800 and beyond.
- Final inflation figures in the euro area take centre stage on Wednesday.
- Retail Sales, Producer Prices take centre stage across the pond.
The European currency regains part of its shine and encourages EUR/USD to reclaim the area north of 1.0800 the figure midweek.
EUR/USD focuses on EMU, US data
After three consecutive daily pullbacks, EUR/USD finally regains the smile and returns to the area past the 1.0800 hurdle on Wednesday.
The improvement in the pair comes pari passu with the equally rising optimism in the risk complex and the renewed offered stance in the greenback despite the sharp depreciation of the Japanese yen vs. the latter.
Earlier in the session, New Car Registrations in the euro area expanded 12.8% in the year to December, while the final inflation figures measured by the CPI in the bloc are due later.
In the NA session, the main attraction will be the publication of Retail Sales and Producer Prices seconded by weekly Mortgage Applications, the NAHB Index, Business Inventories, TIC Flows and the Fed’s Beige Book.
In addition, speeches by FOMC’s Bostic, Bullard, Harker and Logan will also be in the limelight.
What to look for around EUR
EUR/USD bounces off recent lows in the 1.0770/65 band and manages to regain the 1.0800 mark and beyond amidst the strong improvement in the sentiment around the risk-associated universe.
Price action around the European currency should continue to closely follow dollar dynamics, as well as the impact of the energy crisis on the euro bloc and the Fed-ECB divergence.
Back to the euro area, the increasing speculation of a potential recession in the bloc emerges as an important domestic headwind facing the euro in the short-term horizon.
Key events in the euro area this week: EMU New Car Registrations / Final Inflation Rate (Wednesday) – ECB Lagarde, ECB Accounts (Thursday) - ECB Lagarde (Friday).
Eminent issues on the back boiler: Continuation of the ECB hiking cycle amidst diminishing probability of a recession in the region. Impact of the war in Ukraine and the protracted energy crisis on the bloc’s growth prospects and inflation outlook. Risks of inflation becoming entrenched.
EUR/USD levels to watch
So far, the pair is gaining 0.49% at 1.0838 and faces the next up barrier at 1.0874 (monthly high January 16) followed by 1.0900 (round level) and finally 1.0936 (weekly high April 21 2022). On the flip side, the breakdown of 1.0776 (weekly low January 17) would target 1.0481 (monthly low January 6) en route to 1.0443 (weekly low December 7).
Japan Trade Minister Yasutoshi Nishimura said on Wednesday that it is “not realistic to decouple completely from China, but we have to manage risks from an economic security perspective.”
Further comments
Want to ask Japan businesses to hike wages by 5% 'plus something extra' this year.
Hope it will lead to moderate demand-driven inflation rather than cost-push inflation.
Japan can make huge contribution to global gas market through reducing lng imports by restarting nuclear power plants.
Market reaction
USD/JPY is keeping its reversal intact, trading at 129.78, up 1.29% on the day, at the press time.
The Japanese Yen plunged to the 131 level after the BoJ’s decision to leave its policy tools unchanged. Economists at ING expect the USD/JPY rcovery to stall at 132.50/133 and see the pair with chances to trade at 120 by year-end.
A volatile bear trend
“USD/JPY remains priced as one of the most volatile currencies in the G10 FX space and notably delivers on those expectations of volatility. One week realised volatility is being delivered at 20% versus the priced levels of 19%. We expect that volatility to continue, especially in the March/April window when Governor Kuroda will hand over the reins of the BoJ governing board.”
“We expect further broad Dollar weakness this year as Federal Reserve easing expectations build in the second quarter. This should probably mean the current USD/JPY correction stalls in the 132.50/133.00 area, with outside risk to 135.”
“We have an end 1Q23 target of 128 and our current year-end target of 125 should probably be closer to 120.”
China’s Vice Premier Liu He said in a meeting with US Treasury Secretary Janet Yellen on Wednesday, “US-China relationship is highly consequential,” adding that he “hopes they can work together.”
Additional quotes
“Two countries need ‘serious communication’ and coordination on climate change, macroeconomic issues and others.”
“Important to maintain dialogue and exchanges, seek common ground.”
“Ready to carry out the pragmatic, professional and in-depth exchange.”
Market reaction
AUD/USD is holding sizeable gains on the above comments, trading 0.52% higher at 0.7021.
Bank Indonesia (BI) will hold its monthly governor board meeting on Thursday, January 19. Here you can find the expectations as forecast by the economists and researchers of four major banks regarding the upcoming central bank's rate decision.
BI is expected to hike rates by 25 basis points to 5.75%. At the last policy meeting on December 22, the bank hiked rates by 25 bps to 5.5%.
ANZ
“We expect BI to stick with this measured approach with another 25 bps hike. Domestic inflation dynamics remain reasonably benign and do not warrant outsized rate hikes. A downshift by the US Fed also gives BI scope to move gradually. Overall, we expect the central bank to match the US Fed with two 25 bps hikes in Q1 2023 given its FX stability mandate, thereby taking BI’s terminal policy rate to 6.00%. A sustained rebound in the IDR would raise the odds of an earlier stop at 5.75%.”
Standard Chartered
“We expect BI to increase the 7-day reverse repo rate by 25 bps to 5.75% to maintain an attractive interest rate spread against US rates, supporting IDR stability. The recent resumption of foreign inflows to the bond market and slowing Fed hikes have driven IDR appreciation, likely reducing the urgency to hike policy rates. However, we think BI may opt to stay cautious and hike, delivering the last rate increase of this cycle. We think BI will continue with its mixed policy approach, with macroprudential policy set to support growth, while monetary policy focuses on macro stability. Furthermore, BI is likely to combine tight monetary policy with FX measures (i.e., higher interest rates for exports proceeds placement onshore) to prevent overtightening of monetary policy.”
ING
“We expect Governor Perry Warjiyo to start the year with a rate hike to support the Indonesian Rupiah. Softer inflation reported in the past few months and fading growth momentum suggest that BI will likely opt for a 25 bps rate increase which would widen interest rate differentials to support the currency.”
SocGen
“We expect the BI to deliver a final 25 bps hike, with a terminal rate of 5.75%.”
CME Group’s flash data for natural gas futures markets noted open interest dropped for the first time since December 27 on Tuesday, this time by around 5.2K contract. On the other hand, volume added to the previous daily build and went up by around 10.5K contracts.
Natural Gas: Extra losses likely below $3.00
The multi-week downtrend in prices of the natural gas remains unchanged so far. Tuesday’s small advance was on the back of shrinking open interest and curtails the likelihood of occasional bullish attempts. On this, a breach of the key $3.00 per MMBtu should expose a deeper retracement in prices of the commodity in the near term.
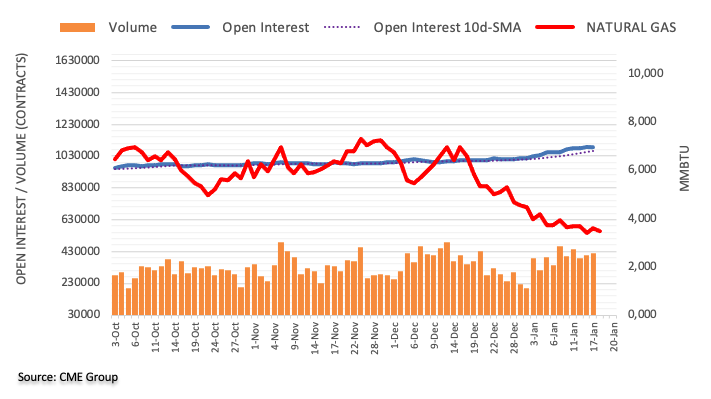
The prospects for USD/JPY continue to signal a probable drop to the 126.35 levels in the next few weeks, note UOB Group’s Economist Lee Sue Ann and Markets Strategist Quek Ser Leang.
Key Quotes
24-hour view: “We expected USD to ‘trade within a range of 127.85/129.05’ yesterday. USD subsequently traded between 127.98 and 129.13 before settling at 128.13 (-0.32%). The price actions still appear to be consolidative and we expect USD to trade between 127.40 and 129.40 today.”
Next 1-3 weeks: “There is not much to add to our update from Monday (16 Jan, spot at 128.00). As highlighted, the risk for USD remains on the downside, and the next level to watch is 126.35. On the upside, a breach of 130.05 (no change in ‘strong resistance’ level) would indicate that USD is not weakening further.”
Considering advanced prints from CME Group for crude oil futures markets, traders increased their open interest positions for the second session in a row on Tuesday, now by around 19.3K contracts. In the same line, volume went up by around 272.6K contracts after two daily drops in a row.
WTI: Next on the upside comes $83.32
Tuesday’s decent uptick in prices of the barrel of the WTI was in tandem with rising open interest and volume, exposing the continuation of the ongoing rebound in the very near term. Against that, the next hurdle of note is now expected at the December 2022 high at $83.32 (December 1).
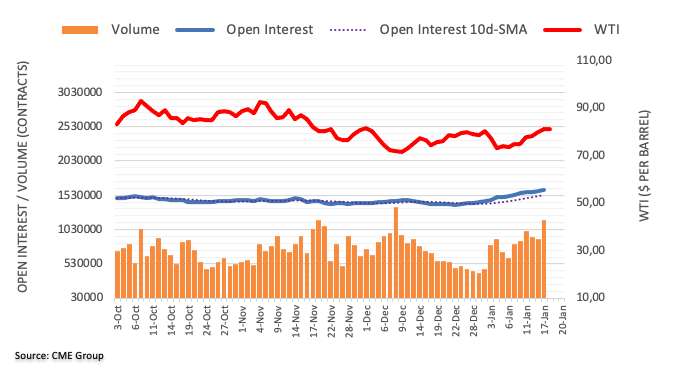
European Central Bank (ECB) policymaker Francois Villeroy de Galhau said on Wednesday, it's “too early to speculate about what we will do in March.”
Additional quotes
We must stay the course in battle against inflation.
Cannot say where the terminal rate will be but should be there by the summer.
ECB is pragmatic regarding rates and policy.
The pace of rate hikes is probably less important this year.
Lagarde's earlier 50 bps guidance is still valid.
Market reaction
EUR/USD is extending the renewed uptick toward 1.0850 on the above comments, adding 0.54% on the day.
The Bank of Japan decided to leave its monetary policy unchanged. The BoJ’s inaction shot the USD/JPY pair through the roof. However, economists at TD Securities expect the 132/133 region to cap.
BoJ stands pat, all eyes on new Governor
“BoJ kept policy unchanged in a unanimous vote quelling speculation of a widening or even dismantling of the YCC band. BoJ revised higher its inflation forecasts and revised growth lower. BoJ will continue large-scale bond buying and increase it on a flexible basis if needed. This suggests that the Bank will defend the YCC target for now.”
“We look for a policy shift in terms of the band and even the 10y JGB target once there is a new BOJ Governor in place in April but it appears that they have bought time with tweaks of YCC operations for now.”
“Short squeeze in USD/JPY following the BoJ hold. We expect some limitations to this move however as a BoJ policy change is still likely this year. That implies better levels to get short USD/JPY again.”
“For now, we think some patience is required and look for 132/133 to be an important tech pivot near-term (as it coincides with downtrend resistance).”
“We still think the Yen trading bias remains asymmetric (to the upside) over the medium-term.”
In the opinion of UOB Group’s Economist Lee Sue Ann and Markets Strategist Quek Ser Leang, extra upside remains likely in AUD/USD in the next weeks.
Key Quotes
24-hour view: “AUD traded within a range of 0.6931/0.6997 yesterday, slightly narrower than our expected range of 0.6930/0.7000. Upward momentum has improved a tad and while the bias for AUD is to the upside today, a sustained advance above 0.7025 is unlikely. Support is at 0.6965, a breach of 0.6940 would indicate the current mild upward pressure has faded.”
Next 1-3 weeks: “There is not much to add to our update from yesterday (17 Jan, spot at 0.6965). As highlighted, while the bias for AUD is still on the upside but without improvement in momentum, we continue to think that 0.7070 is unlikely to come into view so soon. On the downside, a break of 0.6915 (‘strong support’ level previously at 0.6890) would indicate that the AUD strength from more than a week ago has ended.”
Rumours about the ECB’s medium-term course were making the rounds on the market yesterday: Following 50 bps in February the ECB was considering a 25 bps rate step in March. As a result, EUR/USD came under pressure. Understandable, in the view of Ulrich Leuchtmann, Head of FX and Commodity Research at Commerzbank.
Euro feels the pain from the dovish ECB report
“So far one might have hoped that between the end of the Fed rate hike cycle and the ECB cycle there might be a period when the ECB is still hiking its key rate but not the Fed. We have not had a situation such as that for quite a while. And once again it is getting less likely that we will see it. That is reason enough for the market to abandon EUR/USD exchange rates above 1.0850 for now. Understandable in my view.”
“I think that smaller ECB rate steps would be EUR negative on a sustainable basis above all if the European central bankers were to commit to it too firmly at their meeting the week after next.”
“What FX traders are interested in is whether the central bank concerned will act sufficiently quickly in case of an inflation shock and whether it will implement sufficiently robust counter-measures. If there is this confidence then the currency concerned is attractive. If, with inflation levels at 9%, the ECB were to consider easing its efforts in its fight against inflation very notably this confidence would be tarnished.”
The US Census Bureau will release the December Retail Sales report on Wednesday, January 18 at 13:30 GMT and as we get closer to the release time, here are the forecasts of economists and researchers of six major banks regarding the upcoming data.
Economists expect the US to report only a meager 0.1% increase in sales after a drop of 0.6% in November. Expectations for Retail Sales Control Group are for a second consecutive drop of 0.2%.
Citibank
“We are expecting a 0.8% MoM decline in total retail sales in December with the main drag coming yet again from auto dealers and gasoline stations as both unit of auto sales and average retail gasoline prices declined . Higher frequency credit card data point to continued strength in the only services category in retail sales. The drop in real retail sales will likely not be as large since some of the weakness comes from lower goods prices, particularly for gasoline. This, in combination with very strong retail sales in October and strong restaurant sales, keep Q4 consumption close to previous expectations.”
RBC Economics
“The slowdown in US unit auto sales, combined with a drop in gas station sales in December, was likely to result in a 1% drop in US retail sales.”
NBF
“Car dealers likely contributed negatively to the headline number, as auto sales contracted during the month. Gasoline station receipts could have decreased as well judging from a drop in pump prices. All told, headline sales could have sunk 0.7% in the month. Spending on items other than vehicles may have decreased a bit less, sliding 0.3%.”
TDS
“We look for retail sales to have retreated sharply in December (-1.2%), building on a more modest decline from the prior month. Spending was dented by significant contractions in auto and gasoline station sales. Importantly, control group sales likely also fell for a second consecutive time (-0.3%), while those for bars/restaurants probably advanced slightly for a fifth month straight.”
CIBC
“A sharp drop in unit auto sales, combined with a decline in gasoline prices, will weigh on total retail sales, which likely fell by 0.9% in December. That will also likely include a 0.4% decrease in the control group of sales (ex. autos, gasoline, restaurants, and building materials), as sales volumes in that group remain well above their pre-pandemic trend line, and spending likely continued to be skewed towards services in December, away from discretionary goods. We are more pessimistic than the consensus, which could cause bond yields and the USD to ease off.”
Wells Fargo
“While we expect high financing costs to continue to depress goods spending, we look for services spending to keep growing in the medium term. The tight job market continues to support income growth, and there is increasing evidence that inflation is slowing. However, holiday sales were likely pulled forward this year by retailers’ early discounts, which would make the case for a December decline. We look for retail sales to drop by 0.9% in December, but accounting for a 1.1% decline in consumer goods prices last month, real retail sales are likely to be positive.”
Indian Rupee was the second worst performer vs USD in 2022, behind only the Yen. Economists at Commerzbank look for a stable to slightly firmer INR in 2023.
RBI nearing end of hike cycle
“The RBI is expected to tighten policy further by another 30-50 bps in the next six months. Nevertheless, RBI is nearing the end of its tightening cycle.”
“Inflation is expected to have averaged 6.8% in 2022. RBI is projecting inflation to dip below 6% in Q1 2023 but it is expected to hold at around 5% in 2023. This should pave the way for RBI to pause rate hikes but not enough to cause them to cut.”
“We look for a stable to lower USD/INR in 2023 at 81.50 by year-end.”
Open interest in gold futures markets reversed the recent uptrend and shrank by around 3.5K contracts on Tuesday according to preliminary readings from CME Group. Volume followed suit and dropped for the second consecutive session, now by nearly 2K contracts.
Gold: Immediately to the upside comes $1930
Tuesday’s drop in gold prices was amidst shrinking open interest and volume, which is indicative that a deeper pullback appears out of favour in the very near term. That said, the resumption of the upside bias could see the recent top around $1930 per ounce troy revisited.
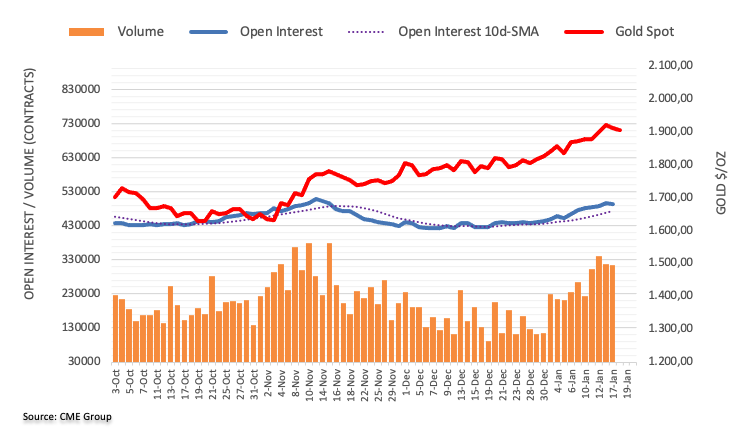
- GBP/USD ticks up to renew five-week high after UK inflation numbers.
- UK CPI, RPI came in softer for December.
- UK Chancellor Jeremy Hunt hints at no tax cuts in the next budget.
- Downbeat yields underpinned US Dollar rebound ahead of US Retail Sales, PPI.
GBP/USD fails to justify the easing inflation pressure as it marches towards refreshing a five-week high to 1.2320 during early Wednesday morning in London. In doing so, the Cable pair also ignores fears of higher taxes in the next British budget.
That said, the UK Consumer Price Index (CPI) eased to 10.5% YoY versus 10.6% expected and 10.7% prior while the Retail Sales Index (RPI) dropped to 13.4% compared to 13.9% market expectations and 14.0% previous readings. Further, the Core CPI also reprinted 6.3% YoY level compared to market expectations of 6.6%.
Also read: Breaking: UK annualized inflation eases to 10.5% in December vs.10.6% expected
It should be noted that The Guardian ran a story suggesting more political drama over the tax cuts in the days ahead. “Jeremy Hunt is planning a “slimmed down” spring budget with no immediate tax cuts as the Conservatives press ahead with attempts to win back economic credibility after the damage inflicted by the Truss administration,” mentioned the news.
The early-week comments from Bank of England (BoE) Governor Andrew Bailey could be held responsible for the GBP/USD pair’s upside despite the softer inflation numbers. The policymaker has already expected softer inflation but didn’t retreat from rate hike bias.
On the other hand, the US Dollar Index (DXY) braces for the biggest daily gains in two weeks, up for the third consecutive day around 102.70 by the press time. In doing so, the greenback’s gauge versus the six major currencies cheers a slump in the Treasury yields triggered by the Bank of Japan’s (BoJ) inaction.
US Treasury bond yields reverse the early-day rebound while declining to 3.477% at the latest. The downbeat bond coupons, however, helped the S&P 500 futures to print mild intraday gains as we write. On the same line, Japanese Government Bonds (JGB) slumped to 0.362% after the BoJ announcements from 0.50% just before the BoJ.
Having witnessed the initial market reaction of the BoJ and the UK inflation, GBP/USD pair traders will wait for the US Retail Sales and Producer Price Index (PPI) for December, expected 0.1% and -0.1% MoM versus -0.6% and 0.3% respective priors, for clear directions.
Technical analysis
GBP/USD portrays an eight-day-old rising wedge bearish chart formation. Not only the rising wedge but bearish RSI (14) divergence also keeps the Cable pair sellers hopeful. That said, the oscillator’s inability to back the higher-high on prices portrays the bearish RSI divergence.
Also read: GBP/USD Price Analysis: Rising wedge, bearish RSI divergence lure sellers ahead of UK inflation
- UK CPI softens to 10.5% YoY in December vs. 10.6% expected.
- Monthly UK CPI arrives at 0.4% in December vs. 0.4% expected.
- GBP/USD holds gains above 1.2300 on mixed UK CPIs.
The UK annualized Consumer Prices Index (CPI) came in at 10.5% in December against the 10.7% booked in November while missing estimates of a 10.6% print, the UK Office for National Statistics (ONS) reported on Wednesday. The index continues to retreat from its highest level since December 1981.
Meanwhile, the core inflation gauge (excluding volatile food and energy items) rose 6.3% YoY last month versus 6.3% seen in November, missing the forecasts of 6.6%.
The monthly figures showed that the UK consumer prices rose by 0.4% in December vs. 0.4% expectations and 0.4% previous.
The UK Retail Price Index for December arrived at 0.6% MoM and 13.4% YoY, falling short of expectations across the time horizon.
Additional takeaways (via ONS)
“The largest upward contributions to the annual CPIH inflation rate in December 2022 came from housing and household services (principally from electricity, gas, and other fuels), and food and non-alcoholic beverages.”
“The largest downward contribution to the change in both the CPIH and CPI annual inflation rates between November and December 2022 came from transport (particularly motor fuels), clothing and footwear, and recreation and culture, with rising prices in restaurants and hotels, and food and non-alcoholic beverages making the largest partially offsetting upward contributions.”
FX implications
In an initial reaction to the UK CPI numbers, the GBP/USD pair eased toward 1.2300, still up 0.15% on the day.
Why does UK inflation matter to traders?
The Bank of England (BOE) is tasked with keeping inflation, as measured by the headline Consumer Price Index (CPI) at around 2%, giving the monthly release its importance. An increase in inflation implies a quicker and sooner increase in interest rates or the reduction of bond-buying by the BOE, which means squeezing the supply of pounds. Conversely, a drop in the pace of price rises indicates looser monetary policy. A higher-than-expected result tends to be GBP bullish.
Gold price is on a three-day corrective decline. XAU/USD eyes further correction toward $1,870 amid bearish technicals, FXStreet’s Dhwani Mehta reports.
Gold buyers have given up control
“Gold price yields a downside break of a symmetrical triangle on the four-hour chart as XAU/USD breached the rising trendline support at $1,907 validating the triangle breakdown.”
“The downside remains exposed toward the $1,870 previous critical support should the bullish 50-Simple Moving Average (SMA) at $1,890 cave in.”
“Recapturing the triangle support-turned-resistance is critical to resuming the recent uptrend. The next key upside target is seen at the mildly bullish 21SMA at $1,911, which coincides with the triangle resistance. Gold price could accelerate toward the $1,920 round figure on a sustained bullish momentum.”
See – Gold Price Forecast: XAU/USD rally seems overstretched over the near term – HSBC
Bank of Japan (BOJ) Governor Haruhiko Kuroda is speaking at the post-policy meeting conference on Wednesday, saying that there is “no need to further expand bond target band.”
Additional quotes
Will carry out flexible adjustments in market operations by making use of fund-supplying operations against pooled collateral.
Expects market functions to improve ahead.
Still early days since adjustment to yield band made in December, need more time to assess impact on market functions.
Labour crunch expected to push up wages from now on.
Japan’s economy still on path towards recovery from pandemic.
BoJ aiming to achieve 2% inflation target sustainably, stably in tandem with wage growth.
Not expecting 10-year jgbs to continue trading with yields higher than 0.5%.
Expect market functionality to improve by conducting nimble market operations .
Expect output gap to close soon and turn positive.
Will take some time for market's yield curve formation under new policy operation to settle.
Amended rules for funds-supplying operations to encourage yield curve formation consistent with market operation guideline.
Market reaction
USD/JPY was last seen trading at 131.14, +2.35% so far.
- USD/MXN bears poke the 2020’s yearly low during three-week losing streak.
- Clear downside break of multi-month-old support line, bearish MACD signals favor sellers.
- Oversold RSI conditions suggest limited downside room before a corrective bounce.
USD/MXN stands on slippery grounds as bears keep the reins for the third consecutive week, down 0.14% intraday around 18.65 by the press time of early Wednesday in Europe.
In doing so, the Mexican Peso (MXN) pair extends the previous day’s losses to drop to the lowest levels since February 2020.
The quote’s bearish trajectory could be linked to the downside break of the previous key support line from July 2017, now resistance around 19.73. Also keeping the pair sellers hopeful is the USD/MXN’s pullback from the 21-SMA, close to 19.62 at the latest. Furthermore, bearish MACD signals are extra positives for selling the pair.
However, the oversold RSI (14) line and nearness to the key support, namely the year 2020’s low of 18.52, hints at limited downside room for the USD/MXN bears to cheer.
In a case where the pair drops below 18.52 support, a slump toward 2017’s bottom of 17.44 can’t be ruled out.
Meanwhile, an upside clearance of the 21-SMA level of 19.62 will need validation from the 61.8% Fibonacci retracement level of the pair’s run-up from July 2017 to April 2020, close to 20.65, to convince USD/MXN buyers. That said, the 20.00 round figure could also challenge the pair’s recovery.
USD/MXN: Weekly chart
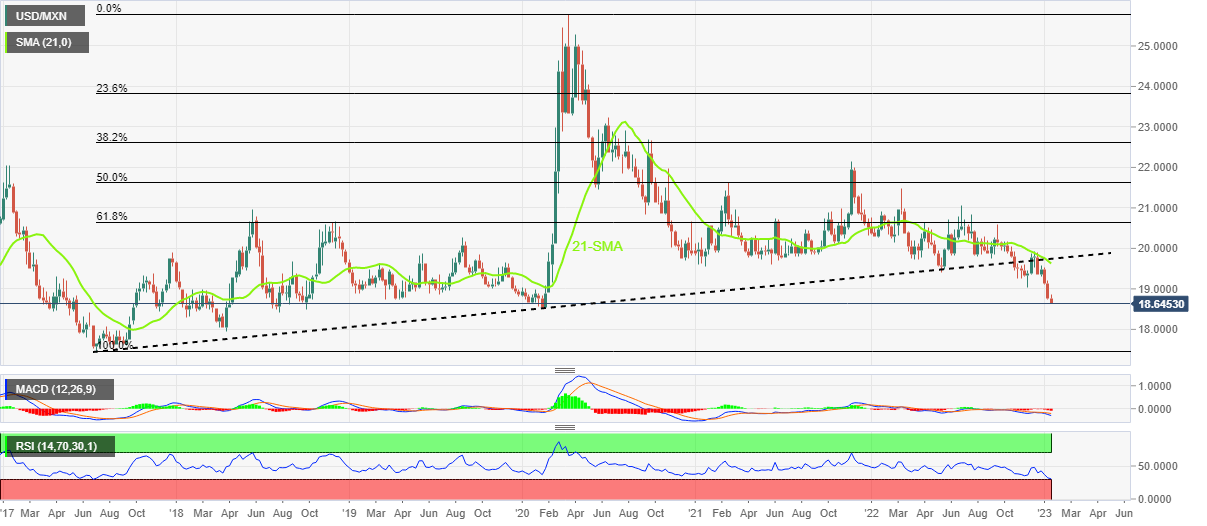
Trend: Limited downside expected
Bank of Japan (BOJ) Governor Haruhiko Kuroda is speaking at the post-policy meeting conference on Wednesday, noting that “will continue monetary easing to achieve sustainable, stable inflation to take hold.”
Additional quotes
Won't hesitate to ease monetary policy further if necessary.
Core CPI is around 3% now but expect it to fall to below 2% next fiscal year.
Cannot say we have reached a stage where prices are expected to grow sustainably and stably.
Japan’s economy still on path towards recovery from pandemic.
Will conduct flexible market operations.
It is now important to support economy and encourage companies to raise wages.
Market reaction
USD/JPY is rising back above 131.00 on Kuroda's dovish remarks. The spot is trading at 131.09, up 2.30% on the day.
Further upside momentum could lift GBP/USD to the 1.2390 region in the near term, comment UOB Group’s Economist Lee Sue Ann and Markets Strategist Quek Ser Leang.
Key Quotes
24-hour view: “We did not expect the strong advance in GBP to 1.2300 (we were expecting GBP to range trade). Upward momentum has improved, albeit not by much. While GBP is likely to strengthen further, it is unlikely to maintain a foothold above 1.2330 (next resistance is at 1.2390). Support is at 1.2260, a breach of 1.2230 would indicate that GBP is not advancing further.”
Next 1-3 weeks: “We have held a positive GBP view for more than a week now. Yesterday (17 Jan, spot at 1.2205), we indicated that while there is room for GBP to advance further, the likelihood of a sustained rise above 1.2330 is not high. GBP rose to a high of 1.2300 in NY trade before closing on a firm note at 1.2287 (+0.75%). Upward momentum has improved, albeit not much. From here, we expect GBP to edge higher to 1.2390. On the downside, a breach of 1.2170 (‘strong support’ level previously at 1.2125) would indicate that the current upward pressure has eased.”
Here is what you need to know on Wednesday, January 18:
The US Dollar recovery from multi-month troughs gathers steam early Wednesday, triggering a fresh selling wave across the FX board. The main catalyst behind the resurgent US Dollar demand is the Bank of Japan’s (BoJ) decision to keep the monetary policy settings and yield curve control policy unchanged at its first policy review of this year. The BoJ’s inaction, despite the market pressure to act, triggered a sharp sell-off in the Japanese yen, which shot the USD/JPY pair through the roof. The global bond market breathed a sigh of relief, as the latest BoJ move smashed the 10-year Japanese Government Bond (JGB) yields to near 3.60%, down 13.5 basis points or a massive 27% so far. The US Treasury bond yields also plunged in tandem, checking the further upside in the US Dollar. The USD/JPY pair leaped as high as 131.57 before reversing to near 130.85, still over 2% higher on the day.
Markets remained jittery, following a mixed close on Wall Street, as traders digest lackluster US banking earnings reports. The Japanese benchmark, the Nikkei 225 index, soared 2.50% in reaction to the BoJ smackdown. The US S&P 500 futures are defending minor bids ahead of a fresh batch of US corporate earnings results, Retail Sales and Producer Price Index (PPI) data due later in the day.
Read: US Retail Sales and PPI Preview: Low expectations may trigger upside surprise, US Dollar boost
AUD/USD and NZD/USD are consolidating gains, awaiting the scheduled meeting between US Treasury Secretary Janet Yellen and China’s Vice-Premier Liu He. Meanwhile, USD/CAD is on the back foot below 1.3400 amid the persistent rise in the WTI price. The US oil is trading close to $81.50, as OPEC’s upbeat outlook on Chinese oil demand underpins.
EUR/USD is looking vulnerable below 1.0800 amid a stronger US Dollar while the Euro continues to feel the pain from the dovish ECB report. Bloomberg reported on Tuesday, citing sources, the European Central Bank (ECB) was considering a slower pace of interest rate hikes, with a prospect of a 25 bps rate hike following a 50 bps increase in February. Traders will await the second revision to the Eurozone HCIP data after Tuesday’s strong Germany ZEW survey.
GBP/USD is holding the higher ground near 1.2300 ahead of the all-important UK Consumer Price Index (CPI) data release. Another soft UK CPI print is likely to encourage the Bank of England (BoE) to slow down its tightening pace or bring it to a halt altogether. Cable climbed on Tuesday after the UK labor market report showed a solid pay growth rise in November.
Read: UK Inflation Preview: Another soft CPI to hit Pound Sterling, here’s why
Gold price is keeping its corrective downside intact, although regained the $1,900 threshold in early Europe amid falling US Treasury bond yields. Near-term technical setup points to more declines in the offing.
Bitcoin is holding gains above the $21,000 level, lacking a clear directional bias while Ethereum is challenging the $1,600 barrier amid multiple bearish signals.
- The index accelerates gains and flirts with the 103.00 area.
- US yields remain on the defensive on Wednesday.
- Retail Sales, Producer Prices, Fedspeak next of note in the docket.
The USD Index (DXY), which tracks the greenback vs. a basket of its main rivals, climbs to multi-day highs near the 103.00 mark on Wednesday.
USD Index focuses on key data
The index resumes the uptrend and leaves behind Tuesday’s downtick mainly on the back of the pronounced sell-off of the Japanese yen in the wake of the BoJ monetary policy meeting earlier in the session.
On this, the BoJ left no room for surprises and voted unanimously to keep the current ultra-accommodative stance unchanged vs. markets’ speculation of another potential tweak of the Yield Curve Control (YCC) or even the announcement of an exit strategy.
US yields, in the meantime, remain tilted to the downside ahead of the release of key results in the US docket as well as speeches by FOMC’s Bostic, Bullard, Harker and Logan.
In the docket, Producer Prices and Retail Sales will take centre stage seconded by MBA Mortgage Applications, Industrial Production, Business Inventories, the NAHB Housing Market Index, TIC Flows and the Fed’s Beige Book.
What to look for around USD
The dollar keeps marching north and already trades at shouting distance from the key 103.00 barrier when tracked by the USD Index (DXY).
The idea of a probable pivot in the Fed’s policy in the next months continues to weigh on the greenback and keeps the price action around the DXY depressed. This view, however, also comes in contrast to the hawkish message from the latest FOMC Minutes and recent comments from fed’s rate-setters, all pointing to the need to advance to a more restrictive stance and stay there for longer, at the time when rates are seen climbing above the 5.0% mark.
On the latter, the tight labour market and the resilience of the economy are also seen supportive of the firm message from the Federal Reserve and the continuation of its hiking cycle.
Key events in the US this week: MBA Mortgage Applications, Producer Prices, Retail Sales, Industrial Production, NAHB Index, Business Inventories, Fed’s Beige Book, Net Long-term TIC Flows (Wednesday) – Building Permits, Housing Starts, Philly Fed Manufacturing Index, Initial Jobless Claims (Thursday) – Existing Home Sales (Friday).
Eminent issues on the back boiler: Rising conviction of a soft landing of the US economy. Prospects for extra rate hikes by the Federal Reserve vs. speculation of a recession in the next months. Fed’s pivot. Geopolitical effervescence vs. Russia and China. US-China trade conflict.
USD Index relevant levels
Now, the index is gaining 0.26% at 102.65 and faces the next hurdle at the weekly high at 102.89 (January 18) followed by 105.63 (monthly high January 6) and then 106.43 (200-day SMA). On the downside, the breach of 101.77 (monthly low January 16) would open the door to 101.29 (monthly low May 30) and finally 100.00 (psychological level).
- NZD/USD regains strong positive traction and jumps to over a one-month high on Wednesday.
- The optimism over a Chinese economic recovery provides a strong lift to the risk-sensitive Kiwi.
- Bulls seem rather unaffected by a stronger USD and might now aim to reclaim the 0.6500 mark.
The NZD/USD pair attracts fresh buying following an early dip to the 0.6375 area and jumps to over a one-month high during the latter part of the Asian session on Wednesday. The pair is currently placed around mid-0.6400s, up nearly 0.40% for the day, and has now moved well within the striking distance of a multi-month peak touched in December.
The mostly upbeat Chinese macro data released on Monday, along with more stimulus measures announced by the Chinese government, fueled optimism over a strong recovery in the world's second-largest economy. This, in turn, boosts investors' confidence, which benefits the risk-sensitive Kiwi and provides a goodish lift to the NZD/USD pair. The momentum seems rather unaffected by resurgent US Dollar demand, bolstered by the Bank of Japan-inspired sell-off in the Japanese Yen.
The USD strength, meanwhile, remains limited amid firming expectations for a less aggressive policy tightening by the Fed. In fact, the markets now seem convinced that the US central bank will soften its hawkish stance amid signs of easing inflationary pressure and have been pricing in a smaller 25 bps rate hike in February. This leads to a fresh leg down in the US Treasury bond yields, which should act as a headwind for the buck and favours the NZD/USD bulls.
Even from a technical perspective, sustained strength beyond the top end of a one-and-half-week-old trading range supports prospects for a further near-term appreciating move for the NZD/USD pair. Hence, some follow-through move up, back towards reclaiming the 0.6500 psychological mark, now looks like a distinct possibility. Traders now look to the US economic docket, highlighting the Producer Price Index and monthly Retail Sales, for a fresh impetus.
Technical levels to watch
- EUR/GBP is at a make or a break level around 0.8772 ahead of the UK Inflation release.
- Considering the UK’s stubborn inflation, the Bank of England might hike interest rates further by 50 bps.
- European Central Bank might decelerate the pace of hiking interest rates led by declining energy prices.
- EUR/GBP is expected to continue its downside momentum to near 0.8750 after breaking the 0.8772 support.
The EUR/GBP pair is attempting to recover after dropping to near the crucial support around 0.8770 in the early European session. The cross has been declining dramatically after a surge in United Kingdom’s employment bills data has resulted in an upward revision in the inflation projections. This has also triggered the expectations of further policy tightening by the Bank of England (BoE), which is rigorously working to tame the stubborn inflation from its multi-decade high at 11.1%.
The cross delivered a bumper fall on Tuesday after the British Office for National Statistics provided the expression of a tight labor market and higher wage growth, which are sufficient to set inflation on fire in the United Kingdom economy. For further guidance, investors will be laser-focused on the release of the UK Consumer Price Index (CPI) data, which will release on Wednesday at 07:00 GMT.
Higher wage growth dampens BoE’s efforts of inflation softening
Bank of England Governor Andrew Bailey and other policymakers are putting their blood and sweat in decelerating the pace of soaring inflation for almost a year. Mammoth efforts from Bank of England policymakers by hiking interest rates have managed to trim the annual headline inflation from its multi-decade high of 11.1% to a mere 10.7%. Slowing energy prices in the UK economy have infused a sense of confidence in the Bank of England’s Bailey that the price index will start declining meaningfully. However, escalating wage inflation due to the holding of bargaining power by job-seekers to address labor shortage is creating troubles for the Bank of England policymakers.
Meanwhile, Financial Times reported that the post-Brexit UK economy is facing a shortfall of more than 300,000 workers as the result of ending the free movement of labor with the European Union.
Even UK inflation softening won’t trim BOE’s policy tightening pace
Going forward, the release of the UK Consumer Price Index (CPI) data will remain in focus. As per the consensus, the headline CPI inflation will soften by 10 basis points (bps) to 10.6% YoY figure versus 10.7% released for November while the Core CPI, which excludes volatile food and energy items, is likely to ramp further to 6.6% YoY during December, from 6.3% previous readouts. Regarding the monthly figures, the CPI is expected to remain steady at 0.4% amid softening energy prices.
On a broader note, escalating the wage price index might offset the impact of declining energy prices. This might keep the stubbornness of inflationary pressures intact and will force the Bank of England (BOE) to continue hiking interest rates. A note from ING states that "Depending on the resilience of December UK CPI data, it seems too early to dismiss the risk of another 50 basis points rate hike.”
Recession likely to be short in Eurozone
The Euro failed to find strength despite the release of the upbeat German ZEW Survey- Economic Sentiment data. The economic data was released at 16.9 vs. the expectation of -15.5 and the former release of -23.3. Declining energy prices and the inflation pace have improved investors' sentiment toward Eurozone prospects. Also, commentary from Germany’s Economy Minister Robert Habeck, that “if there is a recession, it would possibly be only very short and not very deep”, in an interview with WELT TV, has strengthened sentiment data.
Also, European Central Bank (ECB) board member and Bank of Portugal Governor Mario Centeno said on Tuesday, “Fourth quarter growth in Europe will be most likely still positive.”
Information that has weakened the shared currency bulls is the expectation of a slowdown in the pace of hiking interest rates by the European Central Bank. Bloomberg reported that European Central Bank policymakers are starting to consider a slower pace of interest-rate hikes after a likely 50 basis-point step in February. “The rapid energy-driven decline in headline inflation is giving the ECB a bit of breathing space, but policymakers will remain focused on persistent underlying pressures for now.
However, European Central Bank President Christine Lagarde indicated in December’s monetary policy meeting that the pace of hiking interest rates will be higher in CY2023.
EUR/GBP technical outlook
-638096194809268450.png)
EUR/GBP demonstrated a vertical sell-off after a breakdown of the Head and Shoulder chart pattern formed on an hourly scale, which triggered volatility and resulted in a bearish reversal. The cross is expected to weaken further after breaking below the horizontal support plotted from December 16 high at 0.8772.
Downward-sloping 20-period Exponential Moving Average (EMA) at 0.8800 will continue to act as a barrier for the Euro. Also, an oscillation in the bearish range of 20.00-40.00 by the Relative Strength Index (RSI) (14) is indicating that the downside momentum is active.
- USD/CHF prints the biggest daily gain in a week despite retreating from intraday high.
- Convergence of one-week-old descending trend line, 50-HMA restricts immediate upside.
- MACD, RSI also suggest a reduction in bullish momentum.
USD/CHF retreats from intraday high to 0.9225 amid the initial hour of Wednesday’s European session as bulls take a breather ahead of the key US data. Even so, the quote braces for the biggest daily gains in a week.
In doing so, the Swiss currency (CHF) pair takes a U-turn from the 50-HMA, as well as a downward-sloping resistance line from the last Thursday, close to 0.9245 by the press time.
It’s worth noting that the receding bullish bias of the MACD signals and the downward-sloping RSI (14) line also raises doubts about the USD/CHF pair’s latest recovery.
That said, the 0.9200 threshold and the recent low surrounding 0.9185 could lure intraday sellers of the USD/CHF pair ahead of directing them to the monthly bottom of 0.9167.
In a case where the quote remains bearish past 0.9167, the odds of witnessing a slump toward the March 2022 low of 0.9150 and then to the 0.9100 round figure can’t be ruled out.
On the flip side, recovery moves must remain successfully beyond the 0.9245 resistance confluence to convince USD/CHF buyers.
Following that, the previous weekly high of 0.9362 and the monthly peak close to 0.9410 could lure the bulls.
It should be observed, however, that the upside momentum remains elusive unless the pair trades below the August 2022 bottom near 0.9370.
USD/CHF: Hourly chart

Trend: Further downside expected
UOB Group’s Economist Lee Sue Ann and Markets Strategist Quek Ser Leang suggest EUR/USD is now seen within the 1.0680-1.0880 range.
Key Quotes
24-hour view: “We expected EUR to ‘trade sideways between 1.0790 and 1.0860’ yesterday. However, EUR rose briefly to 1.0869, dropped sharply to 1.0773 and closed at 1.0788 (-0.26%). The rapid decline in EUR has scope to extend but it is unlikely to break 1.0730 (there is another support at 1.0760). Resistance is at 1.0815, followed by 1.0840.”
Next 1-3 weeks: “Two days ago (16 Jan, spot at 1.0825), we highlighted that upward momentum is easing and a break of our ‘strong support’ at 1.0760 would indicate that EUR could consolidate first before attempting to advance toward the resistance at 1.0900 later on. EUR dropped to a low of 1.0773 in NY trade and while our ‘strong support’ level was not breached, upward momentum has more or less faded. In other words, the EUR strength from a week ago has come to an end and EUR is likely to consolidate between 1.0680 and 1.0880 for the time being.”
- USD/INR picks up bids to reverse the previous day’s pullback from one-week high.
- Bank of Japan’s inaction drowned Treasury bond yields, underpinned US Dollar demand.
- Increased hedging by Indian importers, foreign outflows weigh on the INR.
- US Retail Sales, PPI will be crucial to forecast further USD run-up.
USD/INR grinds higher past 81.50, around 81.70 by the press time, as bond buyers underpin the US Dollar run-up during early Wednesday. Also adding strength to the Indian Rupee (INR) pair could be the chatters of increased hedging by importers and foreign outflows from India.
“Average dollar purchases by importers, beyond the spot date, rose to $1.64 billion last week from $1.14 billion the week before, latest data collated by The Clearing Corporation of India Ltd (CCIL) revealed,” stated Reuters while suggesting an increase in hedging in India. On the same line, Reuters quotes data to mention about a 246.51 billion rupees ($3.02 billion) outflow by Foreign institutional investors in the last 17 days to portray challenges for the INR.
Elsewhere, the receding optimism surrounding China as expectations of upbeat growth figures from China, as conveyed by economists from Goldman Sachs, contrast the fears of more Sino-American tussles over Taiwan to probe China-linked optimism. Earlier in the day, South China Morning Post (SCMP) mentioned that Beijing ‘should be wary’ as the US and Taiwan seeks closer economic ties.
Above all, a slump in the Treasury bond yields triggered by the Bank of Japan’s (BoJ) inaction seemed to have underpinned the US Dollar run-up. That said, the US Dollar Index (DXY) braces for the biggest daily gains in two weeks, up for the third consecutive day around 102.90 by the press time. US Treasury bond yields as they reverse the early-day rebound to drop towards 3.48% while the S&P 500 futures printed 0.30% intraday gains, following the mildly negative marks of the intraday performance. On the same line, Japanese Government Bonds (JGB) slumped to 0.362% after the BoJ announcements from 0.50% just before the BOJ.
Amid these plays, stocks in Asia remain firmer, led by Nikkei 225, whereas the S&P 500 Futures also seesaws around the monthly high past 4,000 by the press time.
Moving on, USD/INR traders should pay attention to the US US Retail Sales and Producers Price Index for December, expected 0.1% and -0.1% MoM versus -0.6% and 0.3% respective priors, for clear directions.
Technical analysis
After a one-week-long stay below the 100-DMA, around 81.70 by the press time, the USD/INR pair struggles to regain its place beyond the stated key moving average. However, downbeat MACD and RSI (14) challenge the buyers.
- Silver attempts a modest recovery from the weekly low touched earlier this Wednesday.
- Mixed oscillators setup warrants some caution before placing aggressive directional bets.
- A convincing break below channel support is needed to support prospects further losses.
Silver bounces off the weekly low touched during the Asian session on Wednesday and is currently placed in neutral territory, just below the $24.00 round-figure mark.
From a technical perspective, the recent price action witnessed over the past month or so constitutes the formation of an ascending channel, pointing to a short-term bullish trend. Moreover, the XAG/USD, so far, has managed to hold its neck comfortably above the 200-period SMA on the 4-hour chart. This, in turn, favours bullish traders and supports prospects for additional near-term gains.
That said, oscillators on the daily chart have been losing traction and have just started drifting in the negative territory on the 4-hour chart. Hence, any intraday move-up is more likely to confront some resistance near the $24.30 area, which is followed by the multi-month peak, around the $24.50 area. Bulls might wait for sustained strength beyond the said barriers before placing fresh bets.
The XAG/USD might then climb towards challenging the top end of the aforementioned trend channel, currently around the $24.80-$24.85 region. Some follow-through buying beyond the $25.00 psychological mark will mark a fresh breakout and pave the way for a further near-term appreciating move. This, in turn, could lift the white metal to the next relevant hurdle near the $25.35-$25.40 zone.
On the flip side, the 200-period SMA on the 4-hour chart, currently around the $23.45 region, is likely to protect the immediate downside ahead of the trend-channel support, near the $23.30-$23.25 area. A convincing break below the latter might turn the XAG/USD vulnerable to weaken further below the $23.00 mark and fall to the $22.60-$22.55 support en route to the $22.10-$22.00 region.
Silver 4-hour chart
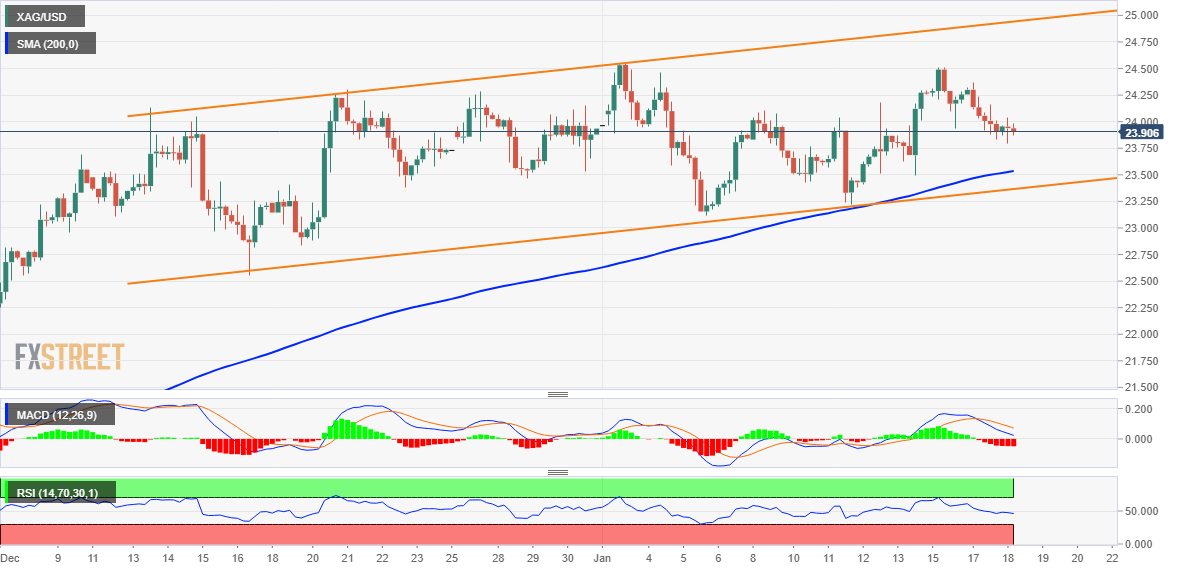
Key levels to watch
The UK CPIs Overview
The cost of living in the UK, as represented by the Consumer Price Index (CPI) for October, is due early on Wednesday at 07:00 GMT.
Given the recently released decline in jobless benefits claims and steady Unemployment Rate at 3.7% led by a shortage of labor, today’s data will be watched closely by the GBPUSD traders.
The headline CPI inflation is expected to soften by 10 basis points (bps) to 10.6% YoY figure versus 10.7% released for November while the Core CPI, which excludes volatile food and energy items, is likely to ramp further to 6.6% YoY during December, from 6.3% previous readouts. Regarding the monthly figures, the CPI is expected to remain steady at 0.4% amid softening energy prices.
Deviation impact on GBP/USD
Readers can find FXStreet's proprietary deviation impact map of the event below. As observed the reaction is likely to remain confined around 20-pips in deviations up to + or -2, although in some cases, if notable enough, a deviation can fuel movements over 30-40 pips.
How could it affect GBP/USD?
Pound Sterling has been outperforming other risk-perceived currencies this week as rising wages in the United Kingdom region are passing all checks for a continuation of sheer policy tightening by the Bank of England (BoE). Unlike, other Western nations, the UK economy has not delivered any meaningful signs of deceleration in the inflationary pressures despite the continuation of hiking interest rates.
BoE Governor Andrew Bailey highlighted the risk of rising wage growth due to a shortage of labor as it could infuse fresh blood into the inflation rate. BoE’s Bailey claimed that inflation will start slowing down amid falling energy prices. However, he is still worried about rising wage growth, which could be a hurdle in decelerating inflation. He added that a major risk to BoE's central case for inflation coming down is the UK labor shortage.
Recently Financial Times, reported that the post-Brexit UK economy is highly responsible for the labor shortage, which has shifted the bargaining power in the favor of job seekers. The post-Brexit UK economy is facing a shortfall of more than 300,000 workers as the result of ending the free movement of labor with the European Union.
Technically, the cable is auctioning in a Rising Channel chart pattern on an hourly scale and is confidently sloping north to recapture a seven-month high at 1.2446. Upward-sloping 20-and 50-period Exponential Moving Averages (EMAs) at 1.2265 and 1.2242 respectively, add to the upside filters. The Relative Strength Index (RSI) (14) is oscillating in the bullish range of 60.00-80.00, which indicates that the upside momentum is active.
Keynotes
GBP/USD Price Analysis: Rising wedge, bearish RSI divergence lure sellers ahead of UK inflation
GBP/USD aims to recapture 1.2300 ahead of UK CPI data
About the UK CPIs
The Consumer Price Index released by the Office for National Statistics is a measure of price movements by the comparison between the retail prices of a representative shopping basket of goods and services. The purchasing power of GBP is dragged down by inflation. The CPI is a key indicator to measure inflation and changes in purchasing trends. Generally, a high reading is seen as positive (or bullish) for the GBP, while a low reading is seen as negative (or Bearish).
- EUR/USD drops for the fourth consecutive day as bears tighten grips amid firmer US Dollar.
- BoJ-led slump in yields helps US Dollar regain its strength.
- Firmer EU statistics allow ECB officials to ease hawkish bias.
- US data can add to upside strength in case of firmer outcome for December.
EUR/USD stays on the bear’s radar as it slides to 1.0770 during the four-day south-run heading into Wednesday’s European session. In doing so, the major currency pair bears the burden of the broad US Dollar rebound, as well as receding hawkish bias over the European Central Bank’s (ECB) next move.
That said, the US Dollar Index (DXY) braces for the biggest daily gains in two weeks, up for the third consecutive day around 102.90 by the press time. In doing so, the greenback’s gauge versus the six major currencies cheers a slump in the Treasury yields triggered by the Bank of Japan’s (BoJ) inaction.
US Treasury bond yields as they reverse the early-day rebound to drop towards 3.48% while the S&P 500 futures printed 0.30% intraday gains, following the mildly negative marks of the intraday performance. On the same line, Japanese Government Bonds (JGB) slumped to 0.362% after the BoJ announcements from 0.50% just before the BOJ.
Additionally favoring the US Dollar is the receding optimism surrounding China as expectations of upbeat growth figures from China, as conveyed by economists from Goldman Sachs, contrast the fears of more Sino-American tussles over Taiwan to probe China-linked optimism. Earlier in the day, South China Morning Post (SCMP) mentioned that Beijing ‘should be wary’ as the US and Taiwan seeks closer economic ties.
At home, Bloomberg’s news triggered swirling talks of the European Central Bank’s (ECB) slower rate hike starting after February and weighed on the Euro (EUR). “ECB policymakers are starting to consider a slower pace of interest-rate hikes after a likely 50 basis-point step in February,” said Bloomberg. The news might have taken clues from the recently positive data from Germany and Eurozone, as well as mixed comments from the ECB policymakers.
On Tuesday, German ZEW headline numbers showed that the Economic Sentiment Index returned to positive territory, arriving at 16.9 in January from -23.3 in December, beating the market expectation of -15.5. On the other hand, the ZEW Economic Sentiment Index for the Eurozone rose to 16.7 from -23.6.
It should be noted that ECB board member and Bank of Portugal Governor Mario Centeno said the previous day, “The fourth quarter growth in Europe will be most likely still positive.” On the contrary, Chief Economist Phillip Lane told the Financial Times (FT) that interest rates do have to be higher than they are now.
Considering, the EUR/USD bears are likely to regain control. However, it all depends upon how well today’s US Retail Sales and PPI for December, expected 0.1% and -0.1% MoM versus -0.6% and 0.3% respective priors, could propel the US Dollar.
Technical analysis
One-month-old previous resistance line joins the 21-DMA to highlight 1.0680 as the short-term key support for the EUR/USD bears to crack.
- USD/CAD turns lower for the second straight day, albeit lacks follow-through selling.
- Bullish crude oil prices underpin the Loonie and act as a headwind for the major.
- Broad-based USD strength lends some support ahead of important US macro data.
The USD/CAD pair attracts some sellers following an early uptick to the 1.3410 area dips into negative territory for the second straight day on Wednesday. The pair is currently placed near the daily low, around the 1.3380 region, and looks to extend the previous day's pullback from the weekly top.
Crude oil prices stand tall near the monthly peak amid optimism over a recovery in Chinese fuel demand. This, in turn, underpins the commodity-linked Loonie and acts as a headwind for the USD/CAD pair. That said, a combination of factors should help limit deeper losses for the major and warrants some caution before placing aggressive intraday bearish bets.
Worries about a deeper global economic downturn might cap crude oil prices, which, along with a sharp deceleration in Canadian consumer inflation, could act as a headwind for the Canadian Dollar. Apart from this, resurgent US Dollar demand, bolstered by the Bank of Japan-inspired sell-off in the Japanese Yen, should further lend support to the USD/CAD pair.
The USD rally, meanwhile, is likely to run out of steam amid a fresh leg down in the US Treasury bond yields, weighed down by growing acceptance that the Fed will soften its hawkish stance. In fact, the current market pricing points to a greater chance of a smaller 25 bps Fed rate hike move in February, which should keep a lid on the greenback.
The aforementioned fundamental backdrop, along with repeated failures to find acceptance above the 1.3400 mark, favour bearish traders. That said, it will still be prudent to wait for strong follow-through selling below mid-1.3300s before positioning for any further depreciating move as traders now look to important US macro data for a fresh impetus.
Wednesday's US economic docket highlights the release of the Producer Price Index (PPI) and monthly Retail Sales figures, due later during the early North American session. Apart from this, the US bond yields might influence the USD demand. Traders will further take cues from oil price dynamics to grab short-term opportunities around the USD/CAD pair.
Technical levels to watch
- USD/JPY is struggling to extend its storm further above the prior auction area in a 131.38-132.93 range.
- The asset has conquered the 200-EMA swiftly post unchanged monetary policy by the BoJ.
- The US Dollar Index (DXY) has surpassed 102.40 after delivering a breakout above 102.20 resistance.
The USD/JPY pair is continuously driving vertically, showing no mercy to intermediate resistances amid weakness in the Japanese Yen after the announcement of the unchanged monetary policy by the Bank of Japan (BoJ). The major has recorded an intraday high of 131.50 as BoJ Governor Haruhiko Kuroda has kept the interest rate steady at -0.10% and the 10-year Japanese Government Bonds (JGBs) around 0%.
An unchanged monetary policy has created ambiguity among the market participants. Investors were also expecting that the BoJ might dismantle the extended target of yield curve control as it demand massive bond-buying for defending the cap, as reported by Reuters.
The US Dollar Index (DXY) has scaled sharply above 102.40 after delivering a breakout of the crucial resistance at around 102.20. S&P500 futures have turned positive after a subdued performance in early Asia, portraying sheer volatility in the market.
USD/JPY is struggling to extend its storm after reaching the previous auction area placed in a range of 131.38-132.93 on an hourly scale. The asset has conquered the 200-period Exponential Moving Average (EMA) at 130.13 comfortably, which indicates that the long-term trend is super-bullish now.
A range shift into the bullish territory of 60.00-80.00 by the RSI (14) is indicating that the upside momentum is active.
For further upside, the asset needs to settle above the aforementioned auction area in a 131.38-132.93 range, which will drive the asset towards January 6 high at 134.77 followed by December 19 low around 136.00.
On the flip side, a decisive drop below Monday’s low at 127.22, will expose the asset for more downside towards the horizontal support plotted from May 24 low at 126.36. A slippage below the latter will open room for further downside toward the psychological support at 125.00.
USD/JPY hourly chart
-638096139102757297.png)
- Gold price takes offers to refresh intraday low during three-day downtrend.
- US Dollar contrasts yields as BoJ inaction pleases bond buyers.
- Mixed US data, Fedspeak previously probed DXY bulls.
- US Retail Sales, PPI will be important for fresh impulse.
Gold price (XAU/USD) stands on slippery grounds while refreshing the weekly bottom around $1,897 during early Wednesday morning in Europe. The yellow metal’s latest weakness could be linked to the US Dollar’s upside, as well as mixed concerns surrounding one of the world’s biggest XAU/USD users, namely China.
Bank of Japan (BoJ) disappointed the hawks while defending the ultra-loose monetary policy and drowned the yields earlier in the day.
As a result, market players rushed toward US Dollar Index (DXY) which braces for the biggest daily gains in two weeks, up for the third consecutive day around 102.90 by the press time. That said, the Bank of Japan’s (BoJ) disappointment weighed the US Treasury bond yields as they reverse the early-day rebound to drop towards 3.48% while the S&P 500 futures printed 0.30% intraday gains, following the mildly negative marks of the intraday performance. On the same line, Japanese Government Bonds (JGB) slumped to 0.362% after the BoJ announcements from 0.50% just before the BOJ.
Elsewhere, expectations of upbeat growth figures from China, as conveyed by economists from Goldman Sachs, join the fears of more Sino-American tussles over Taiwan to probe China-linked optimism and favor the Gold sellers. Earlier in the day, South China Morning Post (SCMP) mentioned that Beijing ‘should be wary’ as the US and Taiwan seeks closer economic ties.
It should be noted that the downbeat prints of the New York manufacturing data, namely the Empire State Manufacturing Index for December, joined downbeat comments from Federal Reserve Bank of Richmond’s President and CEO Thomas Barkin to weigh on the Gold price previously.
Looking forward, a speech from BoJ Governor Haruhiko Kuroda will be important for the immediate direction of the XAU/USD, due to its latest reaction to yields. However, major attention will be given to the US Retail Sales and PPI for December, expected 0.1% and -0.1% MoM versus -0.6% and 0.3% respective priors, amid the BoJ’s latest disappointment.
Also read: US Retail Sales and PPI Preview: Low expectations may trigger upside surprise, US Dollar boost
Gold price technical analysis
Gold price jostles with a 10-month-old horizontal resistance-turned-support as the RSI (14) retreats from overbought territory. Adding strength to the downside bias is the receding strength of the bullish signals from the MACD indicator. As a result, the bullish price is likely to decline further.
However, the XAU/USD needs to provide a daily closing below the aforementioned horizontal support, previous resistance around $1,895-90, to convince the sellers.
Even so, an ascending trend line from mid-November, close to $1,867 by the press time, could challenge the Gold bears before giving them control.
Alternatively, the recent high surrounding $1,930 precedes the late March swing top near $1,966 to restrict short-term Gold upside.
In a case where the metal price rises past $1,966, the August 2022 peak of $1998 will be in focus.
Overall, the Gold price may witness further downside but the bears are far from retaking control.
Gold price: Daily chart
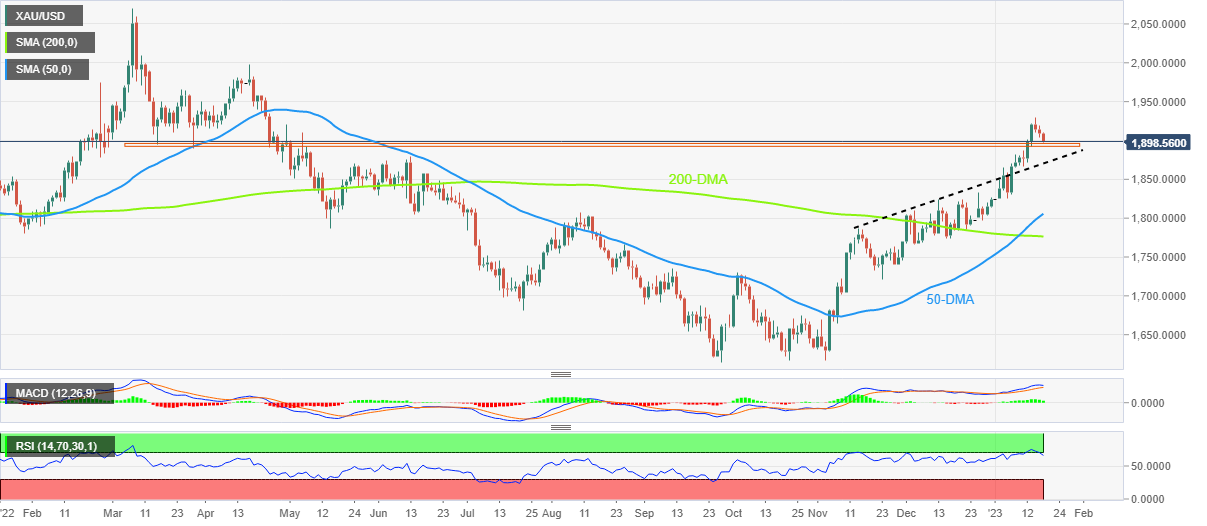
Trend: Further weakness expected
- AUD/USD struggles to preserve its modest intraday gains amid broad-based USD strength.
- Bets for smaller Fed rate hikes and declining US bond yields might cap gains for the buck.
- Odds for an additional rate hike by the RBA should help limit the downside for the major.
- Traders now look forward to important US macro releases for some meaningful impetus.
The AUD/USD pair continues with its struggle to find acceptance above the 0.7000 psychological mark and surrenders its modest intraday gains registered during the Asian session. Spot prices retreat to the lower end of the daily range, around the 0.6980-0.6975 region, and remain at the mercy of the US Dollar price dynamics.
Following a brief consolidation, the USD catches aggressive bids in reaction to the Bank of Japan-led sell-off in the Japanese Yen. Apart from this, the cautious market mood - amid growing worries about a deeper global economic downturn - further benefits the greenback's relative safe-haven status and acts as a headwind for the risk-sensitive Aussie. That said, a combination of factors should help limit any meaningful corrective decline for the AUD/USD pair, at least for the time being.
Investors seem convinced that the Fed will soften its hawkish stance in the wake of easing inflationary pressures. In fact, the markets are currently pricing in a greater chance of a smaller 25 bps Fed rate hike move in February. This leads to a fresh leg down in the US Treasury bond yields, which might hold back the USD bulls from placing aggressive bets and lend some support to the AUD/USD pair. Furthermore, optimism over a Chinese economic recovery could underpin the China-proxy Aussie.
Apart from this, rising odds for an additional interest rate hike by the Reserve Bank of Australia (RBA) in February support prospects for the emergence of some dip-buying around the AUD/USD pair. This makes it prudent to wait for strong follow-through selling before confirming that spot prices have topped out and positioning for any meaningful corrective pullback. Traders now look forward to important US macro releases for a fresh impetus later during the early North American session.
Wednesday's US economic docket features the release of the Producer Price Index (PPI) and monthly Retail Sales figures. This, along with the US bond yields and the broader risk sentiment, will drive the USD demand and allow traders to grab short-term opportunities around the AUD/USD pair. The focus will then shift to the Australian employment details, scheduled during the Asian session on Thursday.
Technical levels to watch
- The continuation of further policy easing by the BoJ has infused fresh blood into Japanese equities.
- Chinese indices have failed to capitalize on decent growth projections from China’s Vice-Premier Liu He.
- The odds of higher China oil demand by OPEC have strengthened the oil price.
Markets in the Asian domain are displaying mixed signals amid respective developments. Japanese equities have got an adrenaline rush as the Bank of Japan (BoJ) has announced an unchanged interest rate policy. Meanwhile, Chinese stocks are driving lower since the opening trade despite optimist commentary from China’s Vice-Premier Liu He.
Investors’ risk appetite has improved which has weighed heavily on the US Treasury yields. The alpha generated by the 10-year US Treasury bonds has dropped below 3.49%. S&P500 futures have recovered their entire losses recorded in early Asia, portraying a recovery in the risk-on impulse. The US Dollar Index (DXY) has scaled higher to near 102.40 ahead of the release of the United States Producer Price Index (PPI) data and monthly Retail Sales.
At the press time, Japan’s Nikkei225 soared 2.70%, ChinaA50 dropped 0.20%, Hang Seng eased 0.10%, and Nifty50 remained almost flat.
The continuation of an ultra-loose monetary policy by the BoJ has brought a rally in Japanese indices. The BoJ has kept the interest rate unchanged at -0.1% and the 10-year Japan Government bonds (JGBs) target at around 0%. The absence of inflation revision and no commentary over BoJ Governor Haruhiko Kuroda’s successor has shocked the market participants.
Chinese stocks have witnessed a sheer fall despite China’s Vice-Premier Liu He has claim that the country’s “growth rate in CY2023 is likely to return to normal, as firms increase investment and consumption rebounds” at Davos late Tuesday. He further added that Beijing welcomes foreign investment and seeks to expand foreign trade, as these are strong pillars of China's economic progress.”
Meanwhile, oil prices have reclaimed the critical resistance of $81.00 after Organization of the Petroleum Exporting Countries (OPEC) Secretary-General, Haitham Al Ghais, said that the cartel is expecting a rise in China’s oil demand by 500k bpd in CY2023. However, the oil cartel is expecting a slowdown in Eurozone and the United States.
- AUD/JOY has been injected with an adrenaline rush amid the unchanged BoJ’s interest rate policy.
- BoJ’s interest rate has remained unchanged at -0.1% and 10-year JGBs at around 0%.
- Investors were expecting upward revision in inflation projections for CY2023 and 2024
The AUD/JPY pair has witnessed significant bids as the Bank of Japan (BoJ) has kept its stance on interest rate policy unchanged. The maintenance of status-quo by BoJ Governor Haruhiko Kuroda has brought an intense sell-off for the Japanese Yen. The risk barometer has surpassed the critical resistance of 91.00 in a single move. At the press time, the cross made an intraday high above 91.30.
The BoJ has kept the interest rate unchanged at -0.1% and the 10-year Japan Government bonds (JGBs) target at around 0%. The street was already expecting an unchanged monetary policy but the absence of upward revision in inflation projections for CY2023 and 2024 and no development on BoJ Kuroda’s successor has forced investors to dump the Japanese Yen. The central bank has announced that it will continue large-scale JGB buying, and make nimble responses for each maturity.
Meanwhile, the release of the BoJ quarterly outlook report is also providing cues about further action. Japan's economy is likely to recover with the help of policy easing of impact from coronavirus pandemic, and supply constraints. The central bank will not hesitate to take additional easing measures as necessary.
On the Aussie front, the release of December’s employment report will trigger a power-pack action for the Australian Dollar. As per the consensus, the Unemployment Rate is expected to remain steady at 3.4%. Apart from that, the Australian economy must have added 22.5K fresh jobs in the labor market in December, lower than the former additions of 64K.
China’s National Development and Reform Commission of the People's Republic of China (NDRC), the country’s 'state planner’ said in a statement on Wednesday, “the economic development situation in 2023 is still complicated.”
Additional quotes
“The external environment is turbulent.”
“Pressure on China's economy is still large.”
“Confident and capable of promoting the continuous recovery and overall improvement of China's economy.”
Related reads
- China’s Vice-Premier Liu: Economic growth will return to normal in 2023
- S&P 500 Futures, Treasury bond yields depict market’s anxiety ahead of key catalysts
- GBP/JPY jumps more than 200 pips on BoJ status-quo.
- Bank of Japan left benchmark rate, YCC policy unchanged despite high expectations.
- Yields drop, US stock futures regain upside momentum on BoJ move.
- BoJ Governor Kuroda’s speech, UK CPI, RPI for December will be watched for clear directions.
GBP/JPY braces for the biggest daily gains in two weeks after the Bank of Japan (BoJ) disappointed the Yen buyers during early Wednesday, up 1.80% intraday near 160.40 by the press time. Adding strength to the cross-currently pair’s upside momentum could be the hopes of upbeat inflation data from the UK.
BoJ announces no changes to their monetary policy settings in December, maintaining rates at -10bps and the 10-yr Japanese Government Bond (JGB) yield target unchanged at 0.00%. Other than the absence of change in the BoJ’s Yield Curve Control (YCC) policy and the intact rates, the BoJ’s quarterly outlook report also allowed the GBP/JPY pair to brace for the biggest daily upside since mid-June 2022.
In a reaction to the BoJ’s disappointment, the US Treasury bond yields reverse the early-day rebound to drop towards 3.50% while the S&P 500 futures printed 0.30% intraday gains, following the mildly negative marks of the intraday performance.
Although the BoJ has already disappointed the GBP/JPY bears, traders will pay attention to Governor Haruhiko Kuroda’s speech as the policymaker may convey his dislike for the YCC policy after it pushed the Japanese central bank to spend roughly 6% of the Gross Domestic Product (GDP) defending its yield target in the last month alone.
Following that, the UK’s Consumer Price Index (CPI) and Retail Price Index (RPI) for December will be crucial after the British jobs report impressed the Sterling buyers the previous day.
Also read: UK Inflation Preview: Another soft CPI to hit Pound Sterling, here’s why
Technical analysis
Despite crossing the downward-sloping resistance-turned-support line from early December, close to 159.40 by the press time, as well as the 160.00 round figure, a three-week-old resistance line near 160.65 challenges the GBP/JPY bulls.
- USD/JPY rises over 200-pips on the BoJ inaction, eyes the biggest daily jump in seven months.
- Bank of Japan leaves benchmark rate, YCC policy unchanged.
- Yields rally following the BoJ announcements while equities, stock futures and DXY decline.
- BoJ Governor Kuroda’s speech will offer immediate directions ahead of US Retail Sales, PPI.
USD/JPY prints nearly 2.0% intraday gains as the Bank of Japan (BoJ) surprises markets by taking no action in the latest monetary policy meeting on early Wednesday. The reason could be linked to the market’s high expectations from the Japanese monetary policy officials.
That said, the BoJ announces no changes to their monetary policy settings in December, maintaining rates at -10bps and the 10-yr Japanese Government Bond (JGB) yield target unchanged at 0.00%.
Other than the absence of change in the BoJ’s Yield Curve Control (YCC) policy and the intact rates, the BoJ’s quarterly outlook report also allowed the USD/JPY pair to brace for the biggest daily upside since mid-June 2022.
As per the latest BoJ report, “Heightening of price growth is likely to sustainable price increase involving wage hikes.”
With this, the US Treasury bond yields reverse the early-day rebound to drop towards 3.50% while the S&P 500 futures print 0.30% intraday gains, following the mildly negative marks of the intraday performance. As a result, the US Dollar Index (DXY) marches towards 103.00, up 0.38% intraday but the press time.
Moving on, a speech from BoJ Governor Haruhiko Kuroda will be important for the immediate direction of the USD/JPY pair. However, major attention will be given to the US Retail Sales and PPI for December, expected 0.1% and -0.1% MoM versus -0.6% and 0.3% respective priors, amid the BoJ’s latest disappointment.
Technical analysis
Successful trading the beyond the May 2022 peak surrounding 131.35 becomes necessary for the USD/JPY bulls to retake control.
- EUR/JPY has delivered a perpendicular north-side move on the unchanged BoJ policy.
- BoJ Kuroda has kept the interest rate unchanged at -0.1% and the 10-year JGBs target at around 0%.
- The cross has surpassed the 200-period EMA at 140.00 in one go and is expected to extend gains further.
The EUR/JPY pair has displayed a juggernaut run as the Bank of Japan (BOJ) has kept the monetary policy unchanged. BoJ Governor Haruhiko Kuroda has kept the interest rate unchanged at -0.1% and the 10-year Japan Government bonds (JGBs) target at around 0%.
Investors are expecting cues about an exit from the decade-long ultra-easy monetary policy, however, an unchanged policy stance has weakened the Japanese Yen.
On an hourly scale, EUR/JPUY has recovered dramatically after forming a Triple Bottom chart pattern. The formation of the aforementioned chart pattern around 138.00 is demonstrating a sheer bullish reversal. The cross has surpassed the 200-period Exponential Moving Average (EMA) at 140.00 in one go and is expected to extend gains further, considering the momentum in the north-side move.
The Relative Strength Index (RSI) (14) has aggressively entered into the bullish range of 60.00-80.00, which indicates more upside ahead.
After a run-up, a minor corrective move to near January 5 low at 139.97 will be a decent opportunity of bargain buy for the market participants, which will drive the asset towards January 6 high at 141.45 followed by December 28 high around 143.00.
On the flip side, a downside move below the previous week’s low at 138.00 will drag the cross towards January 3 low at 137.39. A slippage below the latter will expose the asset for more downside towards April 14 low at 135.51.
EUR/JPY hourly chart
-638096072749114500.png)
Following are the key highlights from the Bank of Japan’s (BOJ) quarterly outlook report, reported by Reuters.
Key takeaways
Japan's economy likely to recover with easing of impact from coronavirus pandemic, supply constraints.
Price growth expected to narrow towards the middle of next fiscal year.
Prices to deviate upward in fiscal 2024.
Uncertainty over japanese economy extremely high.
Need to pay close attention to effects of financial, currency market movements on japan's economy and prices.
Price outlook skewed to upside.
Inflation expection is on the rise.
Will determine duration of each loan for fund supplying operation against collateral taking into account conditions in markets, duration shall not exceed 10 years.
Amendment to rules on fund supply operations against collateral shall be effective on the days determined by the governor.
Will determine interest rate of each loan to encourage formation of yield curve consistent with guidelines for market operation.
Heightening of price growth is likely to sustainable price increase involving wage hikes.
At its first monetary policy meeting of this year, the Bank of Japan (BoJ) board members decided to make no changes to their monetary policy settings in December, maintaining rates at -10bps and 10yr JGB yield target unchanged at 0.00%.
Summary of the statement
No change to yield band.
Decided to extend by one year fund operation to support financial institutions' lending.
No change to forward guidance on interest rates.
Decided to enhance fund supply operation against pooled collateral.
Expands range of eligible parties for climate change funding scheme.
BoJ maintains guidance that it will continue large-scale JGB buying, make nimble responses for each maturity.
Market reaction
USD/JPY storms through the 130.00 level on BoJ’s inaction. The pair is currently trading at 130.20, adding 1.57% on the day.
Speaking at an audience at Davos late Tuesday, China’s Vice-Premier Liu He said that the country’s “growth rate in 2023 is likely to return to normal, as firms increase investment and consumption rebounds.”
Additional comments
“Beijing welcomes foreign investment and seeks to expand foreign trade, as these are strong pillars of China's economic progress.”
“On real estate, the rapid pace of urbanization provides strong demand fundamentals for future stability, and the government will continue to work on de-risking the sector. “
“International cooperation should focus on ensuring energy and food security.”
Market reaction
At the time of writing, AUD/USD is defending minor gains while trading at around 0.7000. Markets are in a cautious mode ahead of the Bank of Japan (BoJ) policy announcements.
- Market sentiment remains divided as traders await BoJ decision, US Retail Sales and PPI.
- S&P 500 Futures print mild losses after reversing from a one-month high the previous day.
- US 10-year Treasury bond yields grind higher following three-day uptrend.
- Mixed concerns surrounding China, Fed also challenge momentum traders.
The risk profile remains unclear as market players await crucial data/events early Wednesday. Also challenging the sentiment could be the unclear signals about China and the US Federal Reserve.
While portraying the mood, the S&P 500 Futures print mild losses of around 4,003 by the press time, after reversing from a one-month high the previous day. Additionally, the benchmark 10-year US Treasury bond yields defends Tuesday’s nearly four basis points (bps) of an upside to 3.55% at the latest.
It should be noted that the Japanese Government Bond (JGB) yields remain sidelined near 0.50% after the benchmark 10-year JGB poked the highest levels since June 2014 the previous day while flashing 0.59% figure, just above the upper limit of the BoJ’s desired range.
Amid these plays, the US Dollar Index seesaws around 102.35-40 after staying on the bull’s radar in the last two days. Furthermore, the WTI crude oil also prints mild losses near $81.15 while the Gold price treads water around $1,910.
Other than the cautious mood ahead of the aforementioned key catalysts, already up on the calendar, the downbeat prints of the New York manufacturing data, namely the Empire State Manufacturing Index for December, join mixed concerns over China to challenge the risk appetite.
That said, the NY Fed’s business gauge dropped sharply in January to -32.9 versus -4.5 market forecasts and -11.2 prior readings. The data also pushed the Federal Reserve Bank of Richmond’s President and CEO Thomas Barkin to state, “My hope is that we have passed the peak of inflation.” As a result, the US Dollar bulls had a tough ride.
On the other hand, expectations of upbeat growth figures from China, as conveyed by economists from Goldman Sachs of late, join the fears of more Sino-American tussles over Taiwan. Earlier in the day, South China Morning Post (SCMP) mentioned that Beijing ‘should be wary’ as the US and Taiwan seeks closer economic ties.
Moving on, the Bank of Japan’s (BoJ) monetary policy announcements could offer immediate directions to the markets and are more important considering the latest tweak to its Yields Curve Control (YCC). Following that, US Retail Sales and PPI, expected 0.1% and -0.1% MoM versus -0.6% and 0.3% respective priors, could entertain the market players during a likely busy Wednesday.
| Raw materials | Closed | Change, % |
|---|---|---|
| Silver | 23.934 | -1.54 |
| Gold | 1908.44 | -0.41 |
| Palladium | 1743.25 | -0.37 |
Economists at ING Bank believe that the Bank of Japan (BoJ) will stand pat at its monetary policy decision this Wednesday after announcing a surprise band widening in December.
Key quotes
"10Y JGB yields have traded above 0.50% over the past few days, which suggests that the market is expecting another widening of the yield band or even abandoning the yield curve control (YCC) policy in near future."
"In our view, the economy is not ready for a reduction in stimulus yet. Today’s core machinery orders data recorded a fall of 8.3% MoM in November (vs 5.4% in October and -1.0% market consensus) and other recent activity data have also been weak."
"We believe that the BoJ’s outlook will support our view. We expect BoJ's GDP forecast for FY2022 and FY2023 to be revised lower. For CPI, we expect the BoJ to revise their forecast up a bit, but for it to remain below 2.0% next year."
"Another reason for the BoJ to leave policy alone today is that another band adjustment would probably just increase market expectations for even more policy tightening after that, and this is not what the BoJ would like to see."
- GBP/USD grinds near five-week high inside bearish chart formation.
- Divergence between higher-high on prices and lower high on RSI (14) tease sellers.
- Upside break of 1.2345 could defy the bearish signals and challenge previous monthly top.
- UK Inflation may disappoint pair buyers amid mixed forecasts.
GBP/USD picks up bids to defend the previous day’s run-up around the 1.2300 round figure, despite posting only 0.08% intraday gains, as the Cable pair traders await the UK’s key inflation data on early Wednesday. Even so, the quote stays inside an eight-day-old rising wedge bearish chart formation.
Not only the rising wedge but bearish RSI (14) divergence also keeps the GBP/USD sellers hopeful. That said, the oscillator’s inability to back the higher-high on prices portrays the bearish RSI divergence.
However, the quote’s current upside could lure GBP/USD buyers if the scheduled UK data offers a positive surprise and allow the pair to cross the stated wedge’s upper line, close to 1.2325 by the press time.
Following that, the mid-December 2022 low around 1.2345 may probe GBP/USD bulls before directing them toward the previous monthly peak surrounding 1.2445.
Alternatively, pullback moves need validation from the 200-SMA level of 1.2153 while the aforementioned wedge’s lower line, near 1.2200 at the latest, restricts the quote’s immediate downside.
It’s worth noting, however, that the GBP/USD weakness past 1.2153 won’t hesitate to refresh the monthly low, currently around 1.1840.
GBP/USD: Four-hour chart
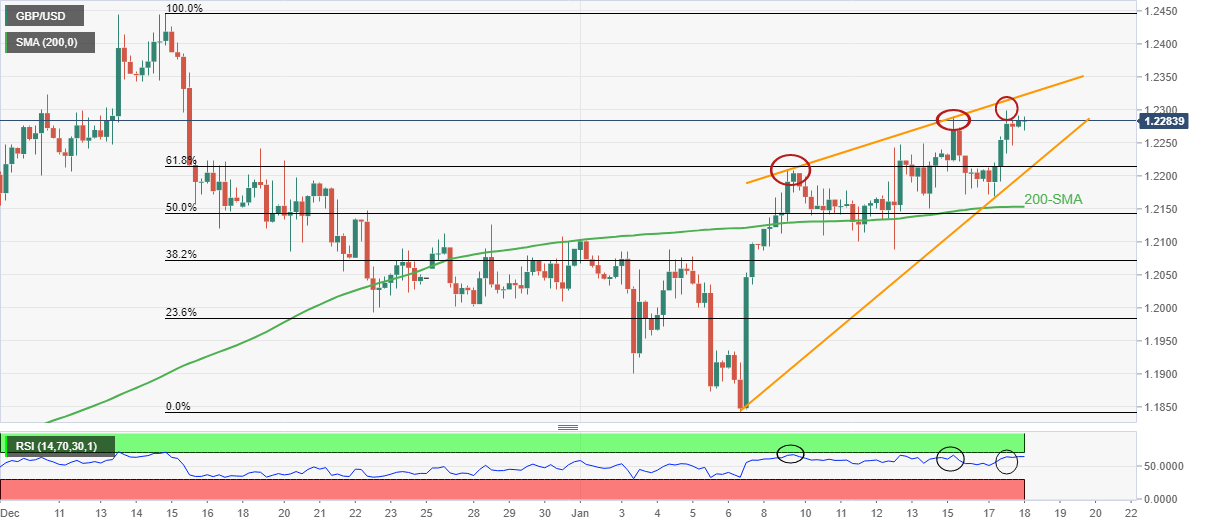
Trend: Further downside expected
The Bank of Japan is scheduled for today and should be expected any time from about 11:30 am Tokyo, or 1:30 pm Sydney, that's GMT 02:30. The announcement for the meeting a year ago was made at 02:46 GMT. Governor Kuroda’s press conference is expected to start at 06.30 GMT.
Analysts at Westpac explained that ''after the Bank of Japan’s shock decision in December to widen the 10-year government bond yield target range from -0.25% to +0.25% to -0.5% to +0.5%, there is keen anticipation of the outcome of the meeting which concludes today.''
BoJ bazookas at the ready?
''Local media report that the BoJ will raise its inflation forecasts again in the quarterly update. But the intense market focus is on whether any policy adjustments will also be revealed,'' the analysts explained.
''Options include further widening the 10yr yield target range (it has been trading around or above 0.50% in recent days), shifting the yield target to the 5yr JGB, dumping yield curve control entirely and raising the benchmark policy rate which has been -0.1% since 2016.'' On a side note, it is worth mentioning that BoJ bought 5-10yr to maturity JGBs unlimited amount again today.
How might BoJ affect USD/JPY
Meanwhile, the Japanese yen is up 2.2% this month suggesting that investors are pricing a notable policy change today. As stated in a prior analysis, hourly support is going to be critical today. This is seen at around 128.00 / 127.70.
The support could prove critical in and around the BoJ event guarding 127.20.
A break below here opens the risk of a significant downside extension:

''The market is keen to learn if the December decision to widen the yield curve target was a first step to exit the BoJ's ultra-expansionary monetary policy stance. If so, the yen could strengthen further,'' analysts at Commerzbank argued.
As for the hourly chart, we have a W-formation in play in the countdown to the announcements:
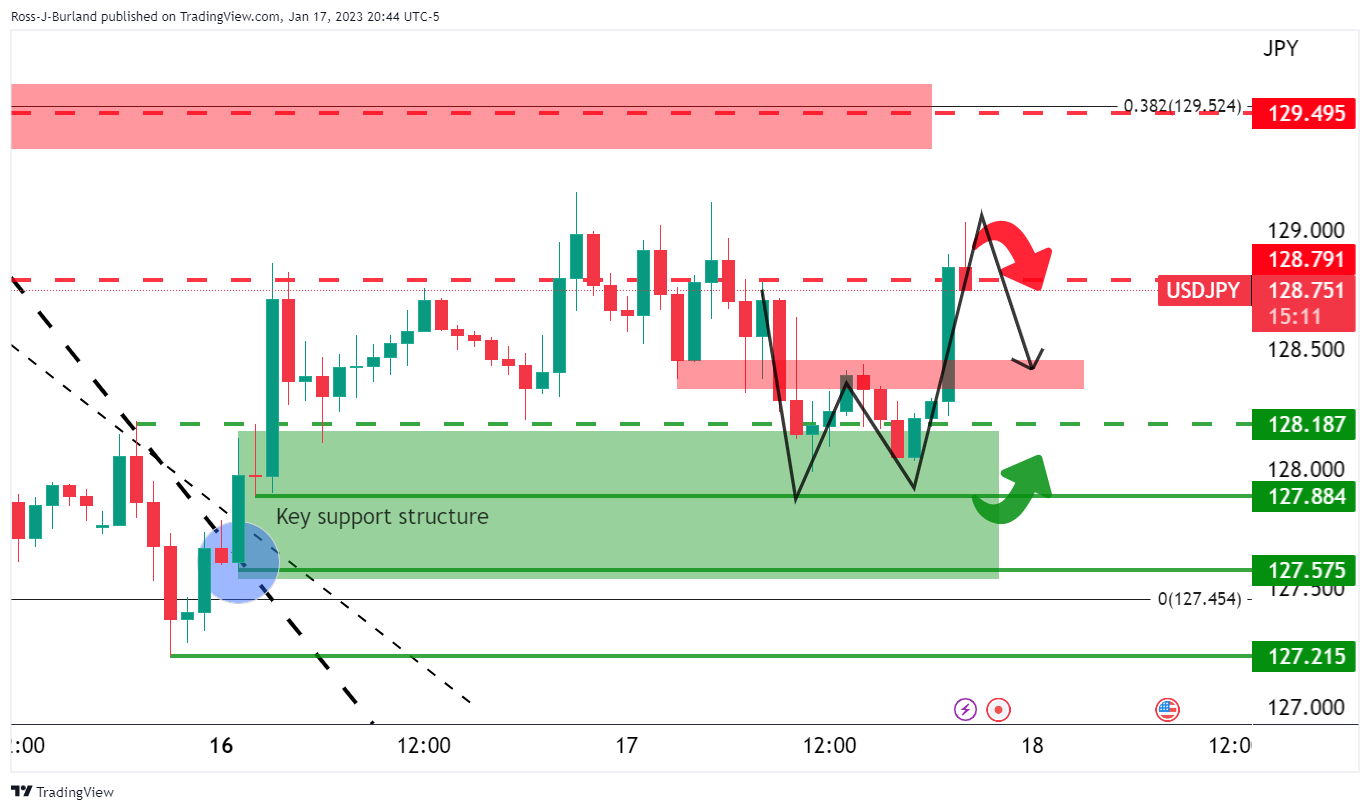
Resistance could be expected to hold and thus the neckline is a target near 128.50 that guards the support structure below it.
On the whole, analysts at Commerzbank said that ''it is quite possible that the BoJ — despite many arguments to the contrary — will initiate a monetary tightening in the near future that will significantly support the yen.''
''If the BoJ tightens its monetary policy now, that argues for the yen to remain a low-interest rate currency (and thus arguably a safe haven, much like the Swiss franc and gold). Because it then becomes likely that Japan will also remain a special case in terms of its return to zero or low inflation.''
About the Bank of Japan interest rate decision
BoJ Interest Rate Decision is announced by the Bank of Japan. Generally, if the BoJ is hawkish about the inflationary outlook of the economy and rises the interest rates it is positive, or bullish, for the JPY. Likewise, if the BoJ has a dovish view on the Japanese economy and keeps the ongoing interest rate, or cuts the interest rate it is negative, or bearish.
- AUD/USD remains sidelined around the highest levels in five months, recently picking up bids.
- Market sentiment dwindles as traders await key data/events.
- Mixed concerns surrounding China, light calendar at home also probe Aussie pair buyers.
- Dismal hopes from US data could surprise traders as bulls seem to struggle of late.
AUD/USD treads water around 0.6980-90 during early Wednesday, after reversing the week-start losses the previous day.
In doing so, the Aussie pair portrays the market’s indecision ahead of the key US Retail Sales and the Producer Price Index (PPI) for December. Also likely to challenge the market’s performance, as well as the Aussie pair, could be the immediate release of the Bank of Japan’s (BoJ) monetary policy announcements.
Additionally, expectations of upbeat growth figures from China, as conveyed by economists from Goldman Sachs of late, join the fears of more Sino-American tussles over Taiwan to challenge the AUD/USD pair traders. Earlier in the day, South China Morning Post (SCMP) mentioned that Beijing ‘should be wary’ as the US, Taiwan seeks closer economic ties.
Elsewhere, the US Dollar Index (DXY) picks up bids to print mild gains as DXY marked a dismal closing around 102.35 the previous day, after an initially positive performance, close to 102.50 at the latest. The reason could be linked to the downbeat prints of the New York manufacturing data, namely the Empire State Manufacturing Index for December.
That said, the NY Fed’s business gauge dropped sharply in January to -32.9 versus -4.5 market forecasts and -11.2 prior readings. The data also pushed the Federal Reserve Bank of Richmond’s President and CEO Thomas Barkin to state, “My hope is that we have passed the peak of inflation.” As a result, the US Dollar bulls had a tough ride.
Amid these plays, the benchmark 10-year US Treasury bond yields ended Tuesday with nearly four basis points (bps) of an upside to 3.55%, mostly the same at the latest, while the S&P 500 Future print mild losses by tracking mixed closing of Wall Street.
Looking ahead, AUD/USD could remain lackluster due to the pair’s risk-barometer status and the mixed sentiment in the market ahead of the key data/events. It’s worth noting, however, that the US Dollar appeared to have had enough downside and the scheduled releases may surprise the markets. As a result, the pair traders should remain cautious ahead of the aforementioned data/events.
That said, the BoJ isn’t expected to alter the monetary policy but a tweak to its Yields Curve Control (YCC), or dumping it, could propel the Yen and Japanese Government Bond yields, which in turn could weigh on the US Dollar and propel AUD/USD prices. Following that, US Retail Sales growth is expected to improve with 0.1% monthly increase versus the previous contraction of 0.6% whereas the PPI may ease to -0.1% from 0.3% prior.
Technical analysis
A one-week-old ascending trend channel, currently between 0.7045 and 0.6775, keeps the AUD/USD buyers hopeful despite the quote’s latest inaction.
- EUR/USD bears taking on the key 1.0780/70s.
- EUR/USD could be on the 3way to 1.0720 for the days ahead.
As per the prior analysis, EUR/USD Price Analysis: Downside thesis gaining traction, bears hunting down 1.0770s that guard 1.0750, there remains a bearish bias in play while the price is below the 1.0870s. The 1.0800 structure was broken in trade on Tuesday and should the bears commit below there, there is every likelihood of a sharp move into 1.0720 for the sessions ahead. The following illustrates the bias across a multi-timeframe analysis:
EUR/USD H1 chart
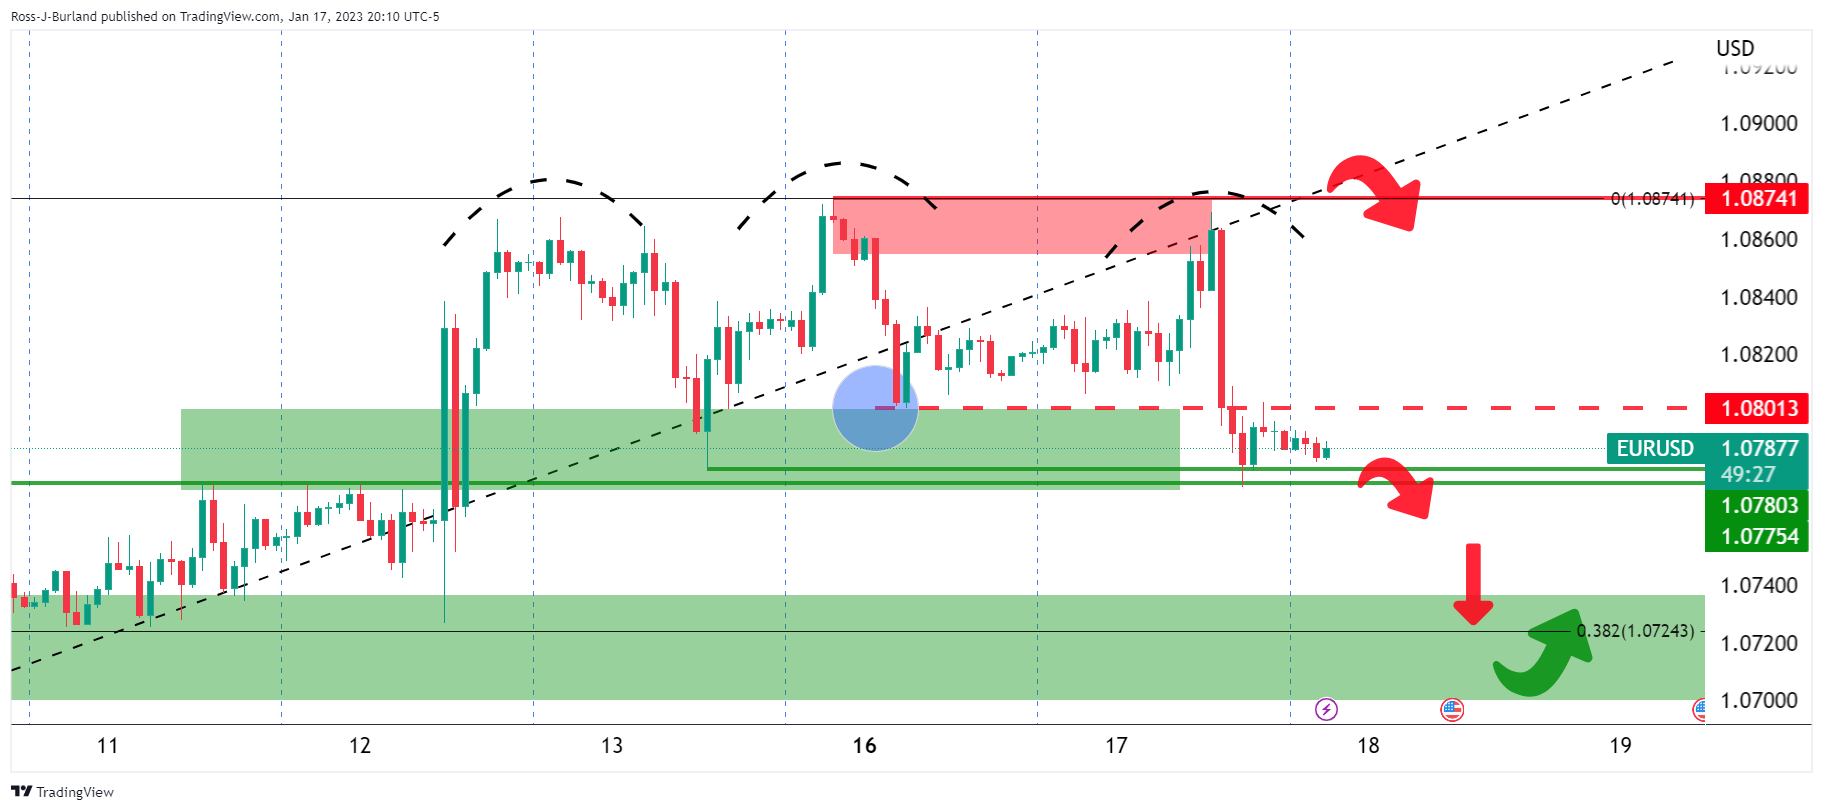
While there are possibilities of another remove higher into the sell-off from overnight, mitigating the price imbalance, a break of 1.0770 could be expected to be the nail in the coffin for the stubborn bulls with 1.0720 eyed.
EUR/USD daily chart

The daily chart sees the price chipping away at the key support with little sign of letting up, so far, as we progress through the Tokyo session. The W-formation is in play which is a pull on the price and the prior resistance, now support, is eyed as a target area.
- Gold price is oscillating above $1,900.00, however, the downside seems favored amid soaring yields.
- Fed Barkin cited that backing off from interest rate hiking too soon is not favorable.
- Higher monthly US Retail Sales data might rebound inflation projections.
Gold price (XAU/USD) is displaying a sideways auction profile above the round-level support of $1,900.00 in the Asian session. The precious metal is managing to sustain above $1,900.00, however, the downside seems supportive amid rising US Treasury yields after the hawkish commentary from Richmond Federal Reserve (Fed) Bank, President, Tom Barkin.
Fed policymaker cited that the economy has passed the phase of inflation peak but we are still far from the median Consumer Price Index (CPI). Therefore, backing off from interest rate hiking too soon is not favorable.
Meanwhile, volatility in the market is escalating as risk-perceived assets are losing traction. S&P500 futures have accelerated their losses, indicating strength in the risk-aversion theme. A decline in the risk appetite of the market participants has also weakened the demand for US government bonds. This has led to an increment in the 10-year US Treasury yields above 3.54%.
Going forward, investors will focus on the United States Producer Price Index (PPI) (Dec) and monthly Retail Sales (Dec) data. As per the estimates, the headline PPI (Dec) is seen lower at 6.8% while the core PPI is seen declining to 5.9%. Apart from that, monthly Retail Sales data might show an expansion of 0.1% vs. the contraction of 0.6% released earlier. Improvement in Retail Sales data might bolster the odds of a rebound in inflation projections.
Gold technical analysis
Gold price is demonstrating the formation of Lower Highs on an hourly scale, communicating signs of bearish reversal. The precious metal might display sheer weakness after breaking the horizontal support plotted from Tuesday’s low marginally below $1,905.00.
The 20-and 50-period Exponential Moving Averages (EMAs) are on the verge of delivering a bearish cross over around $1,909.00.
The Relative Strength Index (RSI) (14) is oscillating in a 40.00-60.00 range. A slippage into the bearish range of 20.00-40.00 will activate a bearish momentum.
Gold hourly chart
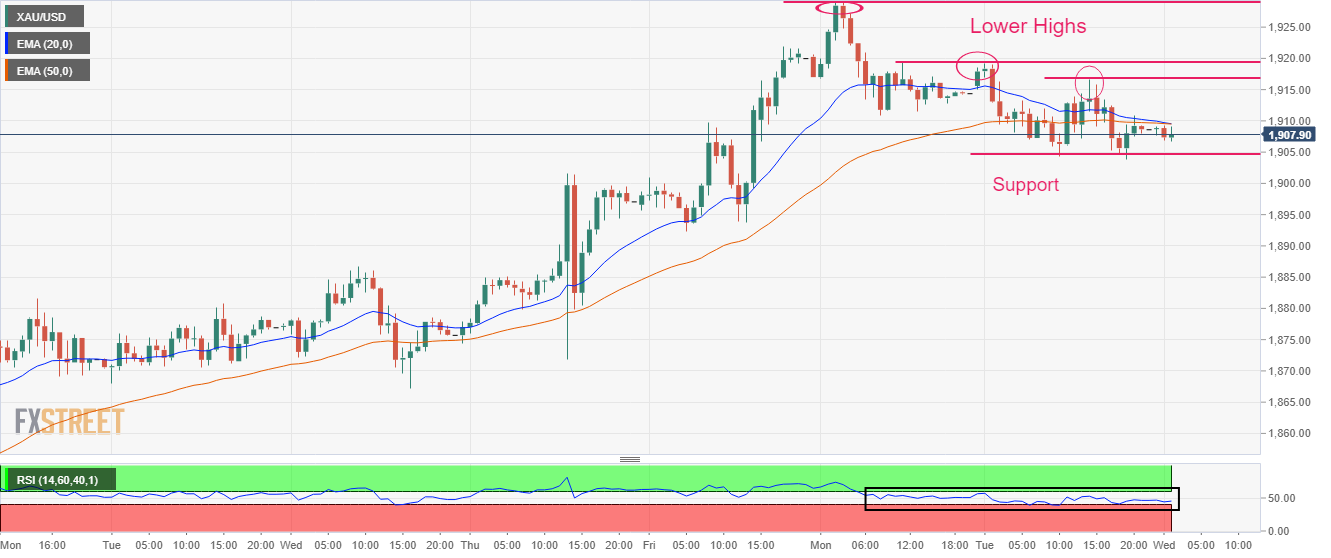
In recent trade today, the People’s Bank of China (PBOC) set the yuan (CNY) at 6.7602 vs. the previous fix of 6.7222 and the prior close of 6.7689.
About the fix
China maintains strict control of the yuan’s rate on the mainland.
The onshore yuan (CNY) differs from the offshore one (CNH) in trading restrictions, this last one is not as tightly controlled.
Each morning, the People’s Bank of China (PBOC) sets a so-called daily midpoint fix, based on the yuan’s previous day's closing level and quotations taken from the inter-bank dealer.
As markets await the key US Retail Sales and Producer Price Index (PPI) data for December, Morgan Stanley (MS) conveys hawkish bias about the Federal Reserve (Fed).
That said, economists at the MS stated that they see inflation coming down to about 3% by the end of 2023, and to about 2% by the end of 2024.
The investment bank’s economists also stated that they don’t see the Fed considering reducing rates until the US reaches that 3% inflation range.
Previously, Morgan Stanley CEO James Gorman mentioned that the Fed’s next move will likely be a 0.25 percentage point rate hike, followed by a pause. MS CEO Gorman also said, “I’m not sure if the Fed will cut rates this year,” adding that he is little more confident about the medium-term outlook for the markets.
Also read: Forex Today: Inflation in the eye of the storm
- GBP/JPY picks up bids to portray three-day winning streak.
- Upbeat oscillators back further recovery but key SMA confluence, monthly resistance line challenge upside momentum.
- Bears need validation from 155.00 to retake control.
GBP/JPY bulls attack 158.00 during the three-day uptrend amid early Wednesday. In doing so, the cross-currency pair portrays the broad Yen weakness ahead of the key Bank of Japan (BoJ) monetary policy meeting decision, as well as the British Pound’s (GBP) strength before the UK Consumer Price Index (CPI) release.
It’s worth noting that the quote’s upside momentum joins the upside RSI (14), not overbought, as well as the bullish MACD signals, to suggest that the buyers have more time to keep the reins.
However, a convergence of the 50-Simple Moving Average (SMA) and the 100-SMA, around 158.80-159.00, appears a tough nut to crack for the GBP/JPY bulls.
Even if the pair rises past 159.00, a downward-sloping resistance line from early December, close to 159.40 by the press time, will precede the 160.00 round figure to probe the buyers.
Following that, a run-up towards a three-week-old resistance line near 160.65 can’t be ruled out.
Alternatively, pullback moves remain elusive unless the GBP/JPY pair stays beyond the weekly support line, around 156.90 by the press time.
Should the quote drops below 156.90, lows marked on Friday and during late December, respectively around 155.60 and 155.35, could challenge the GBP/JPY bears.
GBP/JPY: Four-hour chart
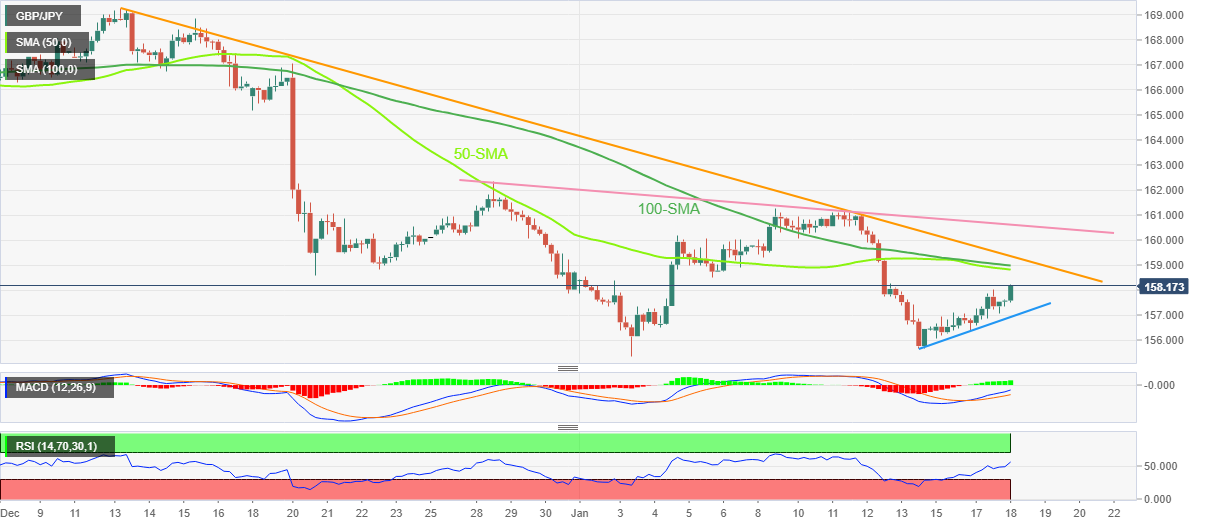
Trend: Limited upside expected
- USD/CAD is marching higher despite upbeat oil prices.
- Stretched consolidation after a downfall is demonstrating signs of inventory accumulation.
- A 40.00-60.00 range oscillation by the RSI (14) indicates a consolidation ahead.
The USD/CAD pair is gradually moving towards the round-level resistance of 1.3400 after a recovery move to near 1.3370 in the Asian session. The Loonie asset is inching higher despite rising oil prices amid optimism about a recovery in Chinese economic prospects.
It seems that rising US Treasury yields have weighed on risk-sensitive assets. The return generated by 10-year US Treasury bonds has climbed above 3.54%. S&P500 futures have resumed their correction, portraying a further drop in investors’ risk appetite. The US Dollar Index (DXY) continues to juggle around 102.00.
A stretched consolidation in USD/CAD for the past two weeks after a healthy sell-off is demonstrating signs of Wyckoff’s inventory accumulation in a 1.3360-1.3460 range. A Spring formation on an hourly scale of around 1.3322 is indicating the presence of responsive buyers, which considered the Loonie asset a ‘value buy’ at lower prices.
The 20-period Exponential Moving Average (EMA) at 1.3392 is overlapping on the USD/CAD price, which indicates a consolidation.
Also, the Relative Strength Index (RSI) (14) is oscillating in a 40.00-60.00 range, which adds to the consolidation filters.
Should the asset break above January 12 high at 1.3461, US Dollar bulls will drive the asset towards the psychological resistance at 1.3500 followed by January 6 low at 1.3540.
On the contrary, the Loonie asset will witness weakness if it drops below January 13 low at 1.3322. This will expose the asset for further weakness towards November 18 low at 1.3300 and November 15 low at 1.3226.
USD/CAD hourly chart
-638095996138973199.png)
- US Dollar Index picks up bids after the previous day’s mixed performance, mildly bid on weekly basis.
- Yields, downbeat Euro put a floor under the DXY but softer US data, unimpressive Fed talks weigh on prices.
- Recently mixed US consumer-centric data highlights today’s US Retail Sales, PPI for December as low expectations can trigger upside surprise.
US Dollar Index (DXY) holds onto the week-start recovery moves with a slower pace on early Wednesday. That said, the US Dollar’s gauge versus the six major currencies picks up bids to 102.40 as it struggles to overcome the lowest levels since June 2022.
The DXY marked a dismal closing around 102.35 the previous day, after an initially positive performance. The reason could be linked to the downbeat prints of the New York manufacturing data, namely the Empire State Manufacturing Index for December. That said, the NY Fed’s business gauge dropped sharply in January to -32.9 versus -4.5 market forecasts and -11.2 prior readings. The data also pushed the Federal Reserve Bank of Richmond’s President and CEO Thomas Barkin to state, “My hope is that we have passed the peak of inflation.” As a result, the US Dollar bulls had a tough ride.
However, the US Treasury bond yields allowed the US Dollar to remain firmer. That said, the benchmark 10-year US Treasury bond yields ended the day with nearly four basis points (bps) of an upside to 3.55%, mostly the same at the latest, even as the two-year counterpart retreated to 4.20%.
It should be noted that the previously downbeat inflation and activity data from the US contrasted with the strong US Michigan Consumer Sentiment Index and 5-year inflation expectations to put a floor under the US Dollar. Also likely to have challenged the DXY could be the recent optimism linked to China reopening and easing fears of the global economic slowdown. Even so, the swirling talks of the European Central Bank’s (ECB) slower rate hike starting after February, weighed on the bloc’s currency Euro (EUR) and allowed the US Dollar to remain firmer. The dovish concerns surrounding the ECB’s next move could be linked to Bloomberg’s news saying, “ECB policymakers are starting to consider a slower pace of interest-rate hikes after a likely 50 basis-point step in February.”
Against this backdrop, Wall Street closed mixed while the S&P 500 Futures printed mild losses by the press time.
Moving on, DXY traders should pay attention to the Treasury bond yields ahead of the US Retail Sales and the Producer Price Index (PPI) for December. Forecasts suggest that the headlines US Retail Sales may improve with 0.1% monthly gains, versus the previous contraction of 0.6%, whereas the PPI is likely to ease to -0.1% from 0.3% prior.
Technical analysis
Tuesday’s Doji candlestick on the daily formation challenges the DXY’s corrective bounce off the lowest levels since June.
| Index | Change, points | Closed | Change, % |
|---|---|---|---|
| NIKKEI 225 | 316.36 | 26138.68 | 1.23 |
| Hang Seng | -169.08 | 21577.64 | -0.78 |
| KOSPI | -20.47 | 2379.39 | -0.85 |
| ASX 200 | -1.9 | 7386.3 | -0.03 |
| FTSE 100 | -9.07 | 7851.03 | -0.12 |
| DAX | 53.03 | 15187.07 | 0.35 |
| CAC 40 | 33.85 | 7077.16 | 0.48 |
| Dow Jones | -391.76 | 33910.85 | -1.14 |
| S&P 500 | -8.12 | 3990.97 | -0.2 |
| NASDAQ Composite | 15.95 | 11095.11 | 0.14 |
- WTI bears are holding the fort at $81.00 which guards the key structure of $83.30.
- While below resistance, there are prospects of a move lower into the coil that is in progress between $81.00 and $70.10 bear cycle lows.
As per the prior analysis, WTI Price Analysis: Bulls press against daily trendline resistance, bears are lurking, the resistance in the $80s is of key importance for the foreseeable future. The following illustrates recent developments that resulted in a break of the bear cycle's daily trendline and prospects of a phase of accumulation that could result in a significant bullish correction going forward.
WTI prior analysis
it was stated that A break of structure opens risk to a run towards 93.25 / 95.33 and higher in a correction of the 2022 summer commencing bearish cycle:
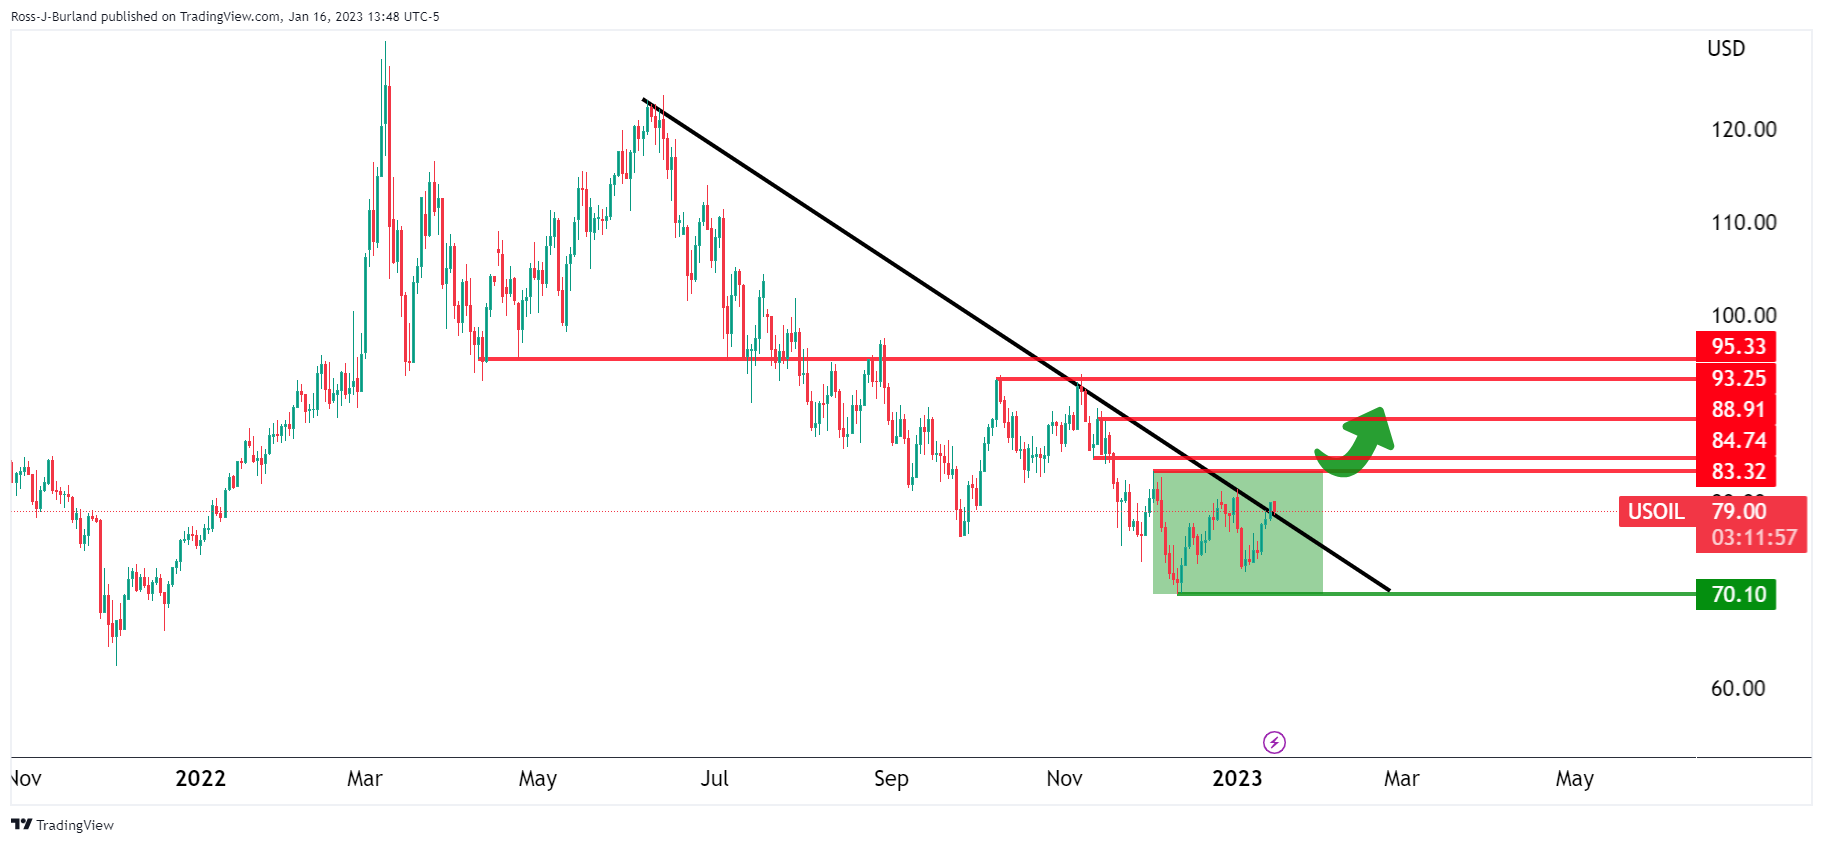
However, were are not there yet. The bulls have only managed to pierce the trendline resistance and the breakout structure remains intact:
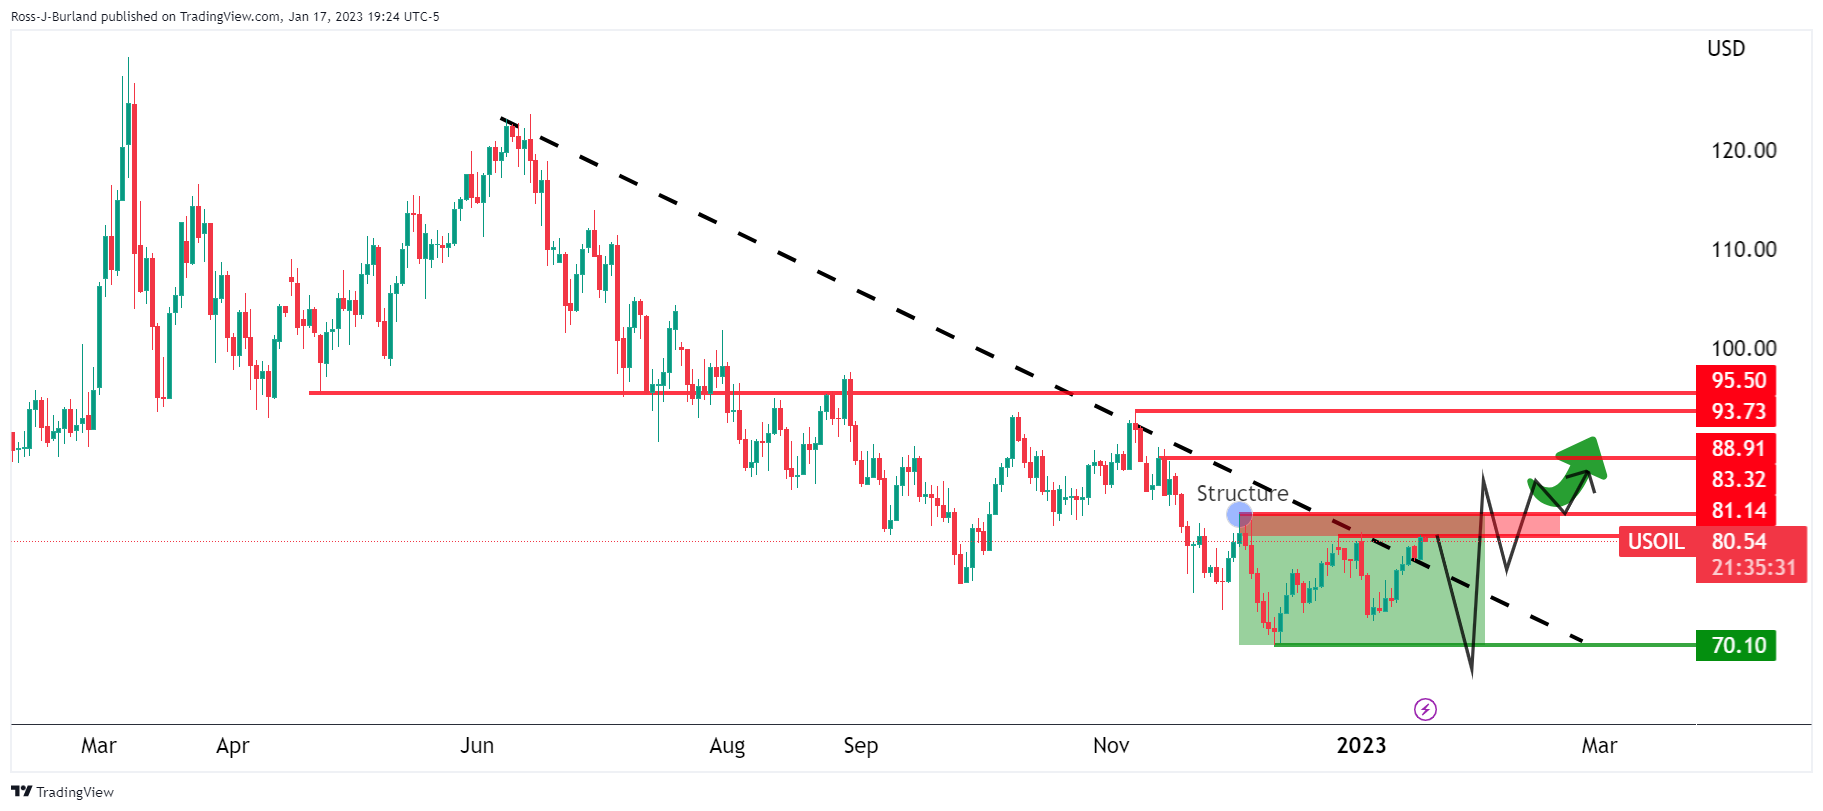
While the proposed price action from here is typical of such a break in structure and accumulation schematics, it is yet to be seen how the bears will react to the recent developments in price action. The certainty is that 81.00 is holding as resistance for the time being guarding the key structure of 83.20. While below this area of resistance, there are prospects of a move lower into the coil that is in progress between there and 70.10 bear cycle lows.
- AUD/JPY is oscillating below 90.00 as investors await BoJ policy announcement for fresh cues.
- Development over the successor for current BoJ Governor Haruhiko Kuroda will be keenly watched.
- Australian employment data will be keenly watched this week.
The AUD/JPY pair is displaying topsy-turvy moves in a narrow range below the round-level resistance of 90.00 in the early Asian session. The risk barometer is demonstrating a sideways auction ahead of the announcement of the first monetary policy of CY2023 by the Bank of Japan (BoJ). AUD/JPY is following the footprints of consolidating AUD/USD, portraying an ambiguity in the risk profile.
Broadly, the cross is gradually scaling higher from Friday as investors are expecting that the BoJ might not come up with any change in the policy stance as it could trigger financial market risk and efforts of ramping inflation might go in vain. Earlier, the BoJ announced that the central will review the side effects of the decade-long ultra-loose monetary policy, which created an expression that the central bank is keen to exit from the easy policy.
Analysts at Standard Charted expect the BoJ to keep both the policy balance rate and the 10Y yield target unchanged at -0.1% and 0%, respectively. They further added that policymakers will assess the potential impact of the recent decision to widen the 10-year JGB band to +/-50 bps (from +/-25 bps) at its December meeting.
Development over the successor for current BoJ Governor Haruhiko Kuroda will be keenly watched. Reuters reported on Tuesday that the new BoJ governor nominee likely to be presented to parliament on Feb 10 has provided some development. Career c.bankers Amamiya, Nakaso, and Yamaguchi are seen as top candidates
On the Australian front, investors are awaiting the release of the employment data, which is scheduled for Thursday. As per the consensus, the Unemployment Rate is expected to remain steady at 3.4%. Apart from that, the Australian economy must have added 22.5K fresh jobs in the labor market in December, lower than the former additions of 64K.
| Pare | Closed | Change, % |
|---|---|---|
| AUDUSD | 0.69898 | 0.52 |
| EURJPY | 138.293 | -0.47 |
| EURUSD | 1.07899 | -0.29 |
| GBPJPY | 157.488 | 0.55 |
| GBPUSD | 1.2288 | 0.78 |
| NZDUSD | 0.64308 | 0.9 |
| USDCAD | 1.33882 | -0.11 |
| USDCHF | 0.92196 | -0.32 |
| USDJPY | 128.168 | -0.25 |
- USD/JPY struggles for clear directions around the lowest levels since June 2022.
- Mixed performance of bond markets, indecisive DXY despite downbeat catalysts put a floor under the prices.
- Markets have high hopes from BoJ after YCC tweak, upbeat Japan JGB fuelled JPY strength.
- Any disappointment could offer notable rebound of the Yen pair amid oversold RSI conditions.
USD/JPY portrays the typical pre-event anxiety as it seesaws near 128.20-30, picking up bids of late, as markets in Tokyo open for the key Wednesday. In doing so, the Yen pair justifies the traders’ cautious mood ahead of the Bank of Japan’s (BoJ) monetary policy decision. It’s worth noting that the recent data from Japan seemed to underpin the quote’s corrective bounce after falling the most in a week the previous day.
That said, the Reuters Tankan index for Japan’s big manufacturers stood at -6 in January, down from +8 last month, to mark the first negative reading since January 2021. Additionally, Japan’s Machinery Orders for November slumped -8.3% MoM versus -0.9% forecast and 5.4% previous readings.
USD/JPY dropped the previous day as the Japanese Government Bond (JGB) yields infused strength into the JPY. That said, the 10-year JGB poked the highest levels since June 2014 the previous day while flashing 0.59% figure, just above the upper limit of the BoJ’s desired range.
Additionally, the US Dollar Index (DXY) marked a dismal closing around 102.35, after an initially positive performance, which in turn weighed on the USD/JPY prices previous day. However, the US Treasury bond yields allowed the US Dollar to remain firmer, downbeat prints of the New York manufacturing data, namely the Empire State Manufacturing Index for December, probed the US Dollar bulls and put a floor under the Gold price. That said, the NY Fed’s business gauge dropped sharply in January to -32.9 versus -4.5 market forecasts and -11.2 prior readings. The data also helped the Federal Reserve Bank of Richmond’s President and CEO Thomas Barkin to state, “My hope is that we have passed the peak of inflation.” As a result, the US Dollar bulls had a tough ride.
Against this backdrop, Wall Street closed mixed and the benchmark 10-year US Treasury bond yields ended the day with nearly four basis points (bps) of an upside to 3.55% even as the two-year counterpart retreated to 4.20%. That said, the S&P 500 Future print mild losses while the US Treasury bond yields remain firmer at the latest.
Looking forward, USD/JPY pair’s fate relies on how well the BoJ policymakers defend their easy money policy amid hopes of witnessing hints of an exit, especially after the last meeting's surprise tweak into the Yields Curve Control (YCC) policy. Should the BoJ disappoints and announces no change, the USD/JPY may portray the much-awaited recovery.
Also read: Bank of Japan Preview: Expectations are high, but will the BoJ deliver?
Other than the BoJ verdict and comments from Governor Haruhiko Kuroda, US Retail Sales and the Producer Price Index (PPI) for December are also important for the USD/JPY traders. Forecasts suggest that the headlines US Retail Sales may improve with 0.1% monthly gains, versus the previous contraction of 0.6%, whereas the PPI is likely to ease to -0.1% from 0.3% prior.
Technical analysis
Although a six-week-old descending trend line joins oversold RSI (14) to put a floor under the USD/JPY prices around 127.40, the pair buyers need successful trading beyond the May 2022 peak surrounding 131.35 to retake control.


© 2000-2026. Bản quyền Teletrade.
Trang web này được quản lý bởi Teletrade D.J. LLC 2351 LLC 2022 (Euro House, Richmond Hill Road, Kingstown, VC0100, St. Vincent and the Grenadines).
Thông tin trên trang web không phải là cơ sở để đưa ra quyết định đầu tư và chỉ được cung cấp cho mục đích làm quen.
Giao dịch trên thị trường tài chính (đặc biệt là giao dịch sử dụng các công cụ biên) mở ra những cơ hội lớn và tạo điều kiện cho các nhà đầu tư sẵn sàng mạo hiểm để thu lợi nhuận, tuy nhiên nó mang trong mình nguy cơ rủi ro khá cao. Chính vì vậy trước khi tiến hành giao dịch cần phải xem xét mọi mặt vấn đề chấp nhận tiến hành giao dịch cụ thể xét theo quan điểm của nguồn lực tài chính sẵn có và mức độ am hiểu thị trường tài chính.
Sử dụng thông tin: sử dụng toàn bộ hay riêng biệt các dữ liệu trên trang web của công ty TeleTrade như một nguồn cung cấp thông tin nhất định. Việc sử dụng tư liệu từ trang web cần kèm theo liên kết đến trang teletrade.vn. Việc tự động thu thập số liệu cũng như thông tin từ trang web TeleTrade đều không được phép.
Xin vui lòng liên hệ với pr@teletrade.global nếu có câu hỏi.
ngân hàng