- Phân tích
- Tin tức và các công cụ
- Tin tức thị trường
Tin tức thì trường
- US Dollar Index remains pressured after declining the most in a week.
- Mostly dull US data renews recession fears, hawkish Fed talks fail to lift the DXY.
- Light calendar, pre-FOMC blackout highlights risk catalysts as the key for fresh impulse.
US Dollar Index (DXY) holds lower ground near 102.00, bracing for the second weekly loss on early Friday amid fears of the US recession. In doing so, the greenback’s gauge versus the six major currencies ignores hawkish comments from the Federal Reserve (Fed) officials.
That said, the US Unemployment Claims dropped to the lowest levels since late April 2022, to 190K for the week ended on January 13 versus 214K expected and 205K prior. Further, the Philadelphia Fed Manufacturing Survey Index improved to -8.9 for January compared to -11.0 market forecasts and -13.7 previous readings. However, US Building Permits eased in December to 1.33M MoM versus 1.37M consensus and 1.351M prior while the Housing Starts also dropped to 1.382M during the stated month from 1.401M in November, versus 1.359M expected. It’s worth noting that the downbeat US Retail Sales and Producer Price Index (PPI) raised fears of an economic slowdown in the world’s largest economy after the softer wage growth and activity data flashed earlier.
It should be noted that Federal Reserve Bank of New York President John Williams said on Thursday that the US central bank has more rate hikes ahead and sees signs inflationary pressures might be starting to cool off from torrid levels. Additionally, Federal Reserve Vice Chair Lael Brainard said that it will take time and resolve to get high inflation down to the fed's 2% target. The policymaker also added, “The policy will need to be sufficiently restrictive for some time.” On the same line, Boston Fed President Collins signaled that the baseline remains that the effective fed funds rate should settle slightly above 5.0%, implying three more 25bp rate rises.
Amid these plays, Wall Street closed with losses for the second consecutive day and the US 10-year Treasury yields also improved. However, receding fears of the Fed’s hawkish move and softer data weigh on the DXY of late.
Moving on, a light calendar emphasizes today’s Fedspeak as the key catalyst due to the pre-Fed blackout starting this Saturday. Should the policymakers keep their hawkish bias, the DXY may lick its wounds. However, the US Dollar rebound needs a solid base to reverse the losses made during 2023.
Technical analysis
Although a four-month-old descending support line puts a floor under the DXY around 101.70, recovery remains elusive unless the quote crosses the previous monthly low surrounding 103.60. That said, oversold RSI conditions hint at limited downside room.
- AUD/JPY is marching towards 89.00 after a recovery move ahead of PBoC’s policy announcement.
- A dovish monetary policy is expected from the PBoC considering China’s reopening reforms.
- The Japanese Yen has managed to recover its BoJ’s unchanged policy-inspired losses.
The AUD/JPY pair is inching higher towards 89.00 in early Tokyo after rebounding from 88.12 on Thursday. Earlier, the risk barometer witnessed an intense sell-off after the release of the downbeat Australian Employment report for December.
The Australian Bureau of Statistics reported that the Australian labor market has witnessed a lay-off of 14.6K employees while the street was expecting an addition of fresh 22.5k jobs. Also, the Unemployment Rate has climbed to 3.5% vs. the expectation and the prior release of 3.4%.
Firms have been forced to rely on retrenchment of a lay-off of employees amid weak growth projections. Higher interest rates by the Reserve Bank of Australia (RBA) are impacting heavily on the e economic activities. However, RBA Governor Philip Lowe could be delighted with an increment in the Unemployment Rate as it will open room for a downside in the Consumer Price Index (CPI), which has been stubborn due to robust consumer spending.
For further action, investors will focus on the interest rate decision by the People’s Bank of China (PBoC). Odds are favoring a dovish monetary policy as reopening reforms are needed to be supported by higher liquidity to spurt the scale of economic activities. Also, the PBoC policymakers are required to support the Chinese vulnerable real estate market. Investors should be aware of the fact that Australia is a leading trading partner of China and a PBoC’s easy monetary policy will provide strength to the Australian Dollar.
On the Tokyo front, after the maintenance of status-quo by Bank of Japan (BoJ) Governor Haruhiko Kuroda, investors are shifting their focus to further development for gauging a successor for BOJ’s Kuroda. The Japanese Yen has managed to recover their losses, which were recorded after the BoJ kept interest rates and bond yields target unchanged. This indicates that investors are still betting on an exit from an expansionary monetary policy by the BoJ ahead.
Reuters reported that Federal Reserve Bank of New York President John Williams said on Thursday the US central bank has more rate hikes ahead and sees signs inflationary pressures might be starting to cool off from torrid levels.
“With inflation still high and indications of continued supply-demand imbalances, it is clear that monetary policy still has more work to do to bring inflation down to our 2% goal on a sustained basis,” Williams said in the text of a speech to be delivered before the Fixed Income Analysts Society in New York.
“Bringing inflation down is likely to require a period of below-trend growth and some softening of labour market conditions,” Williams warned.
Key comments and notes
US inflation is still too high, the Fed has more work to do on rate rises.
Lowering inflation will need a period of slower growth, a softer job market.
Fed must stay the course until inflation is brought back to 2%.
Balance sheet reduction is going well.
Williams sees signs inflation pressures starting to moderate.
Williams expects inflation to cool to 3% this year.
Williams expects US growth of 1% this year.
He expects US Unemployment to rise to 4.5% this year.
He said it is very important for the public to understand Fed's desire to lower inflation.
He explained market pricing is roughly consistent with Fed's rate outlook.
Made sense for the Fed to slow rate rises in December.
Won't prejudge the size of a rate rise at the upcoming FOMC meetings.
Fed still has a ways to go on rate rises.
The hike cycle stopping point is dependent on data.
The jobs market is more resilient than expected.
More to come...
US Dollar update
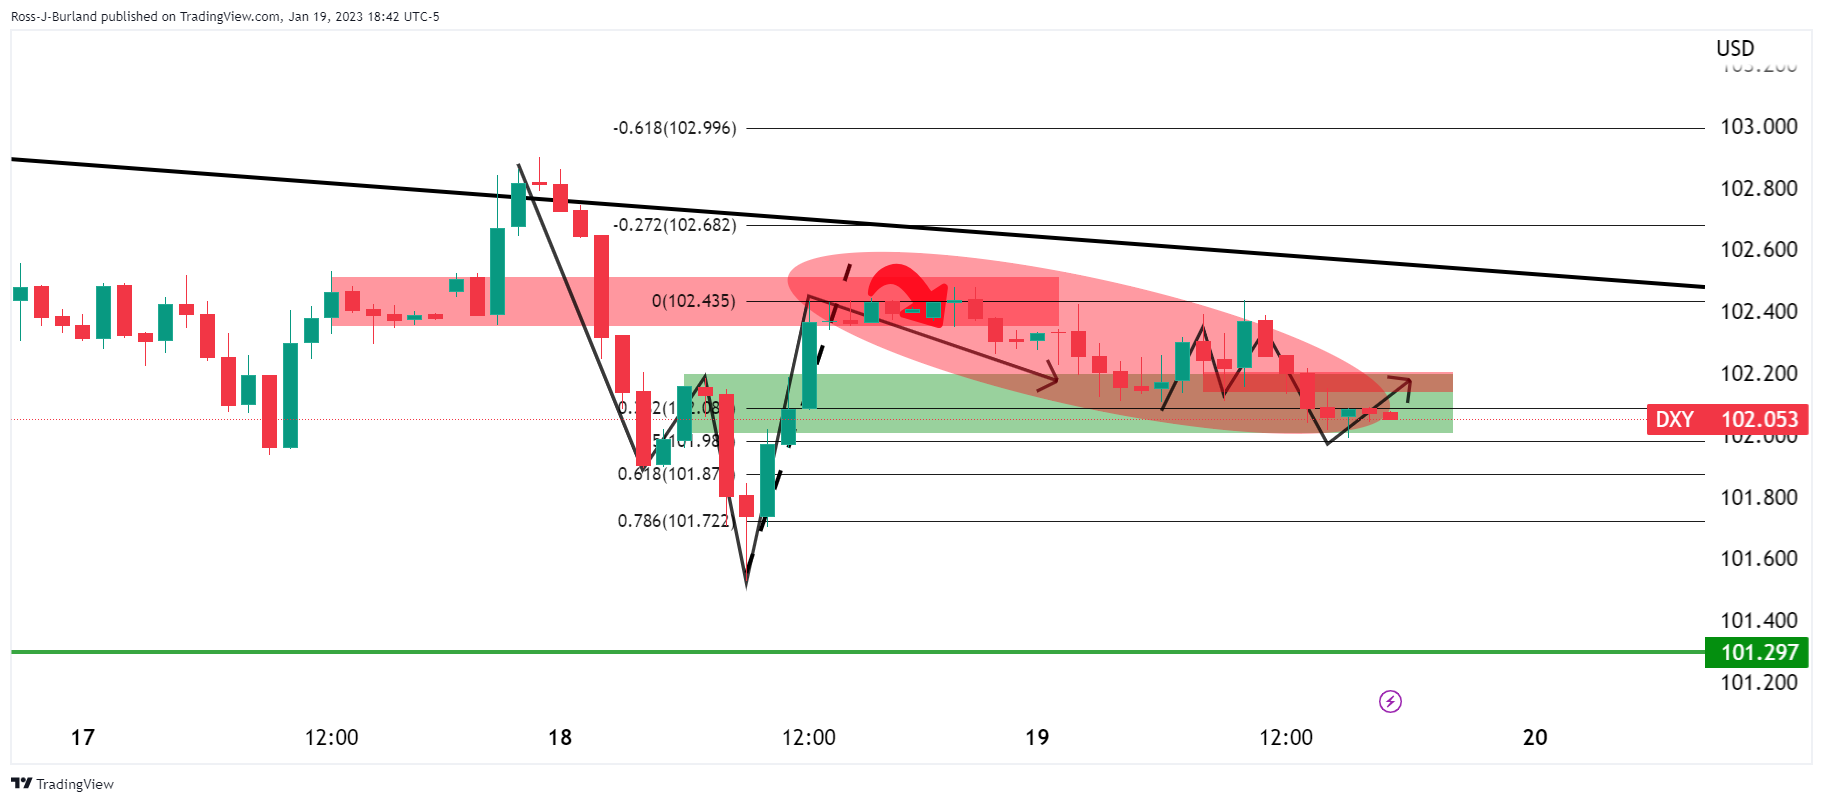
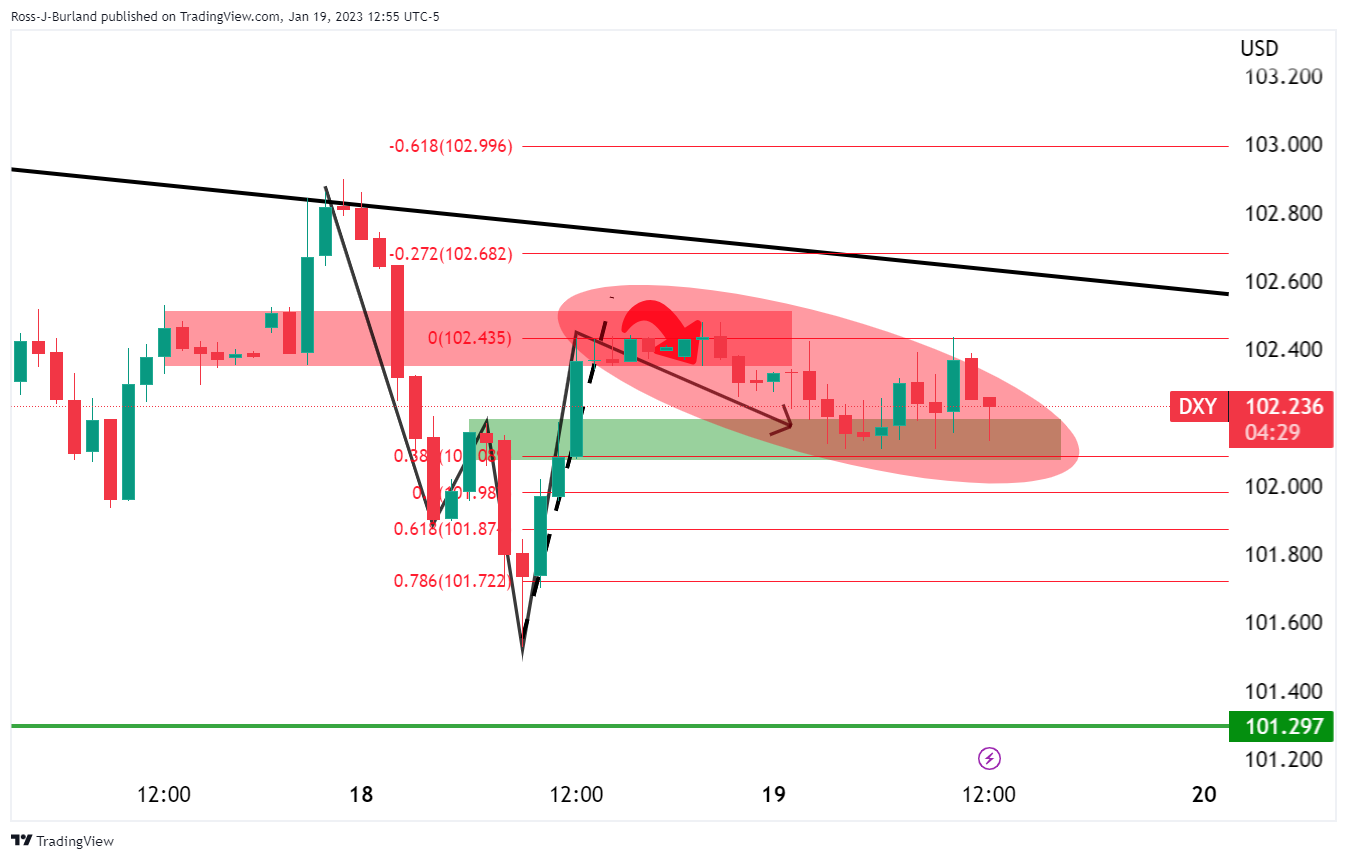
The price of the DXY index moved into the W-formation's neckline and has since stalled in the support. The new M-formation is the next compelling phenomenon on the charts that may serve to pull the price higher. If the neckline breaks, then 102.20 will be important.
US inflation expectations as per the 10-year and 5-year breakeven inflation rates per the St. Louis Federal Reserve (FRED) data justify the recent hawkish commentary from Federal Reserve (Fed) Officials and keeps the US Dollar buyers hopeful, despite its latest weakness.
That said, the US Dollar Index (DXY) dropped the most in a week while snapping the three-day recovery the previous day amid mixed data.
It’s worth noting that the latest prints of the 5-year and 10-year inflation expectations portray a rebound from the multi-month low to 2.21% and 2.20% respectively. That said, the 5-year precursor of the inflation dropped to the lowest levels in two years while the 10-year counterpart refreshed a 23-month low on Wednesday.
On Thursday, Federal Reserve Vice Chair Lael Brainard said that it will take time and resolve to get high inflation down to the fed's 2% target. The policymaker also added, “The policy will need to be sufficiently restrictive for some time.” On the same line, Boston Fed President Collins signaled that the baseline remains that the effective fed funds rate should settle slightly above 5.0%, implying three more 25bp rate rises.
Given the recently upbeat US inflation expectations and the hawkish Fedspeak, the riskier assets may witness further hardships.
Also read: Forex Today: The focus remains on sentiment
- EUR/JPY is range-bound around 139.00 awaiting the release of Japanese CPI.
- EUR/JPY Price Analysis: Bullish above 140.00; otherwise, exposed to selling pressure.
The EUR/JPY finished Thursday’s session flat and remained trading sideways ahead of December’s release of the Japanese Consumer Price Index (CPI). As the Asian session begins, the EUR/JPY is trading at 139.06, almost flat.
EUR/JPY Price Analysis: Technical outlook
The EUR/JPY daily chart portrays the pair as neutral-downward biased, as it remains below the daily Exponential Moving Averages (EMAs). Also, the 20-day EMA at 140.29 is about to cross below the 200-day EMA at 140.14, which would resume the downtrend in the near term. Solid support is found around the last week’s low of 138.01, tested on Thursday, though the EUR/JPY quickly rebounded towards the 139.00 figure.
Oscillators-wise, the Relative Strength Index (RSI) in the bearish territory is flat, while the Rate of Change (RoC), portrays buyers losing momentum. Therefore, the EUR/JPY remains sideways, awaiting a possible breakout.
The EUR/JPY first support would be 138.00. A breach of the latter would send the pair aiming towards 137.38, the YTD low, followed by the September 26 pivot low at 137.36. on the upside, the EUR/JPY first resistance would be the 200-day EMA at 140.14, which, once cleared, could expose additional resistance levels. The 20-day EMA at 140.30 would be put in play, followed by the 141.00 figure.

EUR/JPY Key Technical Levels
- WTI picks up bids to approach short-term key hurdles during the second consecutive weekly gains near 1.5-month high.
- Successful trading above two-week-old ascending trend line, upbeat RSI favor the black gold’s further upside.
- Three-month-old horizontal resistance precedes 100-DMA to guard immediate run-up.
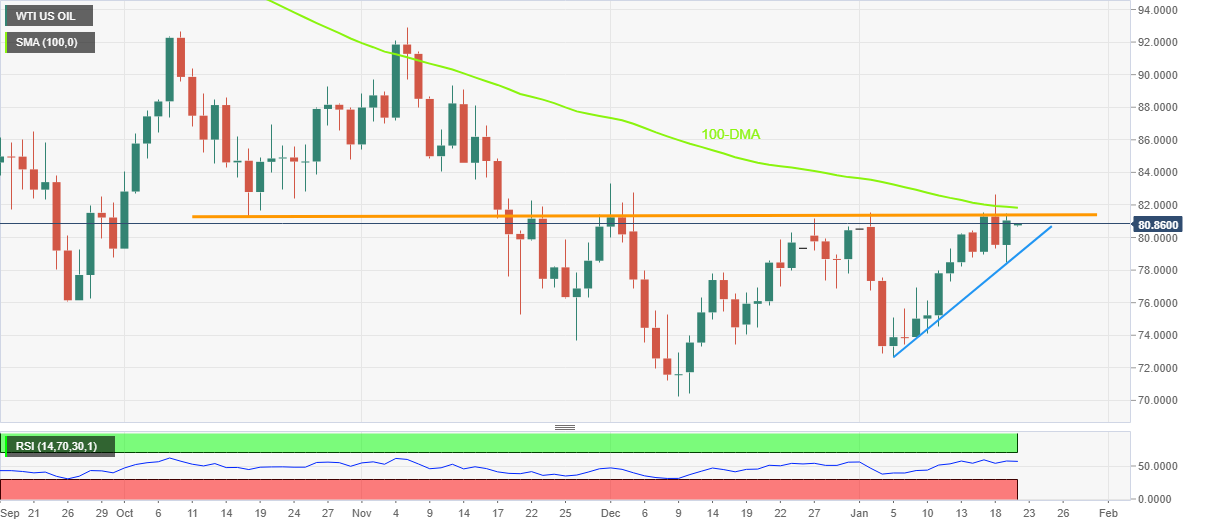
WTI crude oil stays defensive around $80.85, despite keeping the previous day’s gains, as bulls approach important hurdles toward the north during early Friday in Asia.
In doing so, the energy benchmark braces for the second consecutive weekly gain while staying around the highest levels since early December 2022, marked on Wednesday.
That said, the black gold’s upside momentum could be witnessed by a fortnight-long ascending trend line, as well as a firmer RSI (14), not overbought.
However, a horizontal area comprising multiple levels marked since October 2022, near $81.30 by the press time, appears a tough nut to crack for Oil buyers.
Even if the quote manages to cross the $81.30 hurdle, the 100-DMA level surrounding $81.85 could challenge the energy bulls.
It’s worth noting that the tops marked on Wednesday and in early December, respectively around $82.70 and $83.30, could lure the commodity buyers on breaking the $81.85.
On the flip side, pullback moves remain elusive unless the quote stays beyond the aforementioned two-week-old support line, around $79.00 as we write.
Following that, the September 2022 low near $76.00 and the monthly bottom of $72.64 could gain the WTI bear’s attention.
To sum up, Oil remains on the buyer’s radar but the road towards the north appears bumpy.
WTI: Daily chart
Trend: Limited upside expected
- NZD/USD is displaying a lackluster performance as investors await PBoC’s policy announcement for fresh cues.
- A surprise resignation from Prime Minister Jacinda Ardern has triggered political instability in New Zealand.
- The US Dollar Index is expected to display power-pack action after commentaries from Fed policymakers.
The NZD/USD pair is oscillating in a narrow range around the critical resistance of 0.6400 in the early Tokyo session. The Kiwi asset has turned sideways as investors are awaiting the announcement of the interest rate decision by the People’s Bank of China (PBoC), which is scheduled for Friday.
Considering the recent reopening measures by the Chinese administration to get back on the progress track after remaining locked in the fight against the Covid-19 epidemic, the PBoC might announce an easy monetary policy. It is highly required to inject severe liquidity into the economy to spur the growth rate, provide support to the vulnerable real estate sector, and to boost infrastructure. Therefore, the central bank could trim the Prime Lending Rate (PLR) ahead.
It is worth noting that New Zealand is one of the leading trading partners of China and a loose monetary policy announcement by the PBoC will also provide support to the New Zealand Dollar.
Meanwhile, political instability in the New Zealand economy has grown after a surprise resignation from Prime Minister Jacinda Ardern. This might keep the New Zealand Dollar volatile for a period of time ahead.
The risk profile is highly negative considering the three-day selling spell in risk-perceived assets like S&P500. United States equities witnessed severe selling pressure amid escalating recession worries as Industrial Production has fallen in six out of eight last months. Rising interest rates by the Federal Reserve (Fed) are squeezing the activities in the economy and sooner may dampen the labor market.
The US Dollar Index (DXY) has dropped to near 101.60 after failing to extend recovery above the critical resistance of 102.00. For further guidance, investors will focus on commentaries from Federal Reserve (Fed) policymakers.
- USD/CAD licks its wounds after reversing from two-week high.
- Oil price remains firmer amid softer US Dollar, hopes of China demand.
- Recession woes, hawkish Fedspeak challenge Loonie bears ahead of the key Canadian statistics.
USD/CAD pares the recent losses around 1.3465 as it picks up bids to reverse the previous day’s pullback from a fortnight high during Friday’s Asian session. In doing so, the Loonie pair ignores the firmer prices of Canada’s key export item, namely the WTI crude oil. The reason could be linked to the fresh fears surrounding the US economic growth and the hawkish Fedspeak.
WTI crude oil braces for the second weekly gains as it dribbles near $81.00 despite the US Energy Information Administration (EIA) reporting an increase in weekly Crude Oil Stocks Change with 8.408M versus -1.75M expected and 18.962M. The reason could be linked to the hopes of more energy demand from China, as well as the softer US Dollar. “Chinese oil demand climbed by nearly 1 million barrels per day (bpd) from the previous month to 15.41 million bpd in November, the highest level since February, according to the latest export figures published by the Joint Organisations Data Initiative,” reported Reuters.
On the other hand, the US Dollar Index (DXY) dropped the most in a week to snap a three-day uptrend as mixed data raised fears of a recession in the world’s biggest economy. In doing so, the greenback’s gauge versus the six major currencies failed to cheer the hawkish comments from the Federal Reserve (Fed) officials ahead of the pre-FOMC blackout starting this Saturday.
US Unemployment Claims dropped to the lowest levels since late April 2022, to 190K for the week ended on January 13 versus 214K expected and 205K prior. Further, the Philadelphia Fed Manufacturing Survey Index improved to -8.9 for January compared to -11.0 market forecasts and -13.7 previous readings. Alternatively, US Building Permits eased in December to 1.33M MoM versus 1.37M consensus and 1.351M prior while the Housing Starts also dropped to 1.382M during the stated month from 1.401M in November, versus 1.359M expected. It’s worth noting that the downbeat US Retail Sales and Producer Price Index (PPI) raised fears of an economic slowdown in the world’s largest economy after the softer wage growth and activity data flashed earlier.
That said, Federal Reserve Vice Chair Lael Brainard said that it will take time and resolve to get high inflation down to the fed's 2% target. The policymaker also added, “The policy will need to be sufficiently restrictive for some time.” On the same line, Boston Fed President Collins signaled that the baseline remains that the effective fed funds rate should settle slightly above 5.0%, implying three more 25bp rate rises.
At home, Canadian Wholesale Sales growth eased to -0.5% MoM in November versus the 1.9% expected and prior.
Against this backdrop, Wall Street closed negative while the yields bounced off a multi-day low.
Looking forward, Canadian Retail Sales for November, expected -0.5% versus 1.4% prior, could help the USD/CAD pair to remain firmer on matching market forecasts. However, more attention will be given to the Fed speak and risk catalysts for clear directions.
Technical analysis
A looming bull cross on the MACD and steady RSI backs the USD/CAD pair’s attempt to cross the 100-DMA hurdle, currently around 1.3515, despite failing to cross the same the previous day.
- USD/CHF is displaying a sideways auction amid the absence of a potential trigger.
- The downward-sloping trendline plotted from 0.9137 will act as a major barricade for the US Dollar.
- The US Treasury yields have rebounded after printing a multi-month low.
The USD/CHF pair is displaying topsy-turvy moves above the immediate support of 0.9150 in the early Tokyo session. The Swiss franc asset oscillated in a mere 40-pips range on Thursday amid an absence of a potential trigger that could trigger a power-pack action. Also, the US Dollar Index (DXY) is displaying signs of volatility contraction.
The USD Index has slipped to near 101.60, demonstrating a subdued performance. Meanwhile, the US Treasury yields have rebounded after printing a multi-months low. The 10-year US Treasury Yields have recovered to above 3.39%.
On an hourly scale, USD/CHF is displaying a rangebound structure, which indicates volatility contraction that will be exploded after a critical trigger. The asset witnessed a responsive buying action after dropping to near 0.9085 on Wednesday. The absence of a follow-up buying is indicating that the recovery move could be faded sooner. Apart from that, the downward-sloping trendline from January 13 high at 0.9137 will act as a major barricade for the US Dollar.
The 20-period Exponential Moving Average (EMA) at 0.9162 has overlapped the asset, demonstrating a sideways auction profile.
Also, the Relative Strength Index (RSI) (14) is oscillating in a 40.00-60.00 range, showing a rangebound structure.
For an upside move, USD/CHF needs to break above January 11 low of around 0.9200, which will drive the asset towards January 18 high at 0.9246 followed by January 16 high at 0.9289.
On the contrary, a breakdown of Wednesday’s low at 0.9085 will drag the major towards 4 June 2021 high at 0.9054. A slippage below the latter will drag the asset further towards 4 August 2021 low at 0.9018.
USD/CHF hourly chart
-638097650146714049.png)
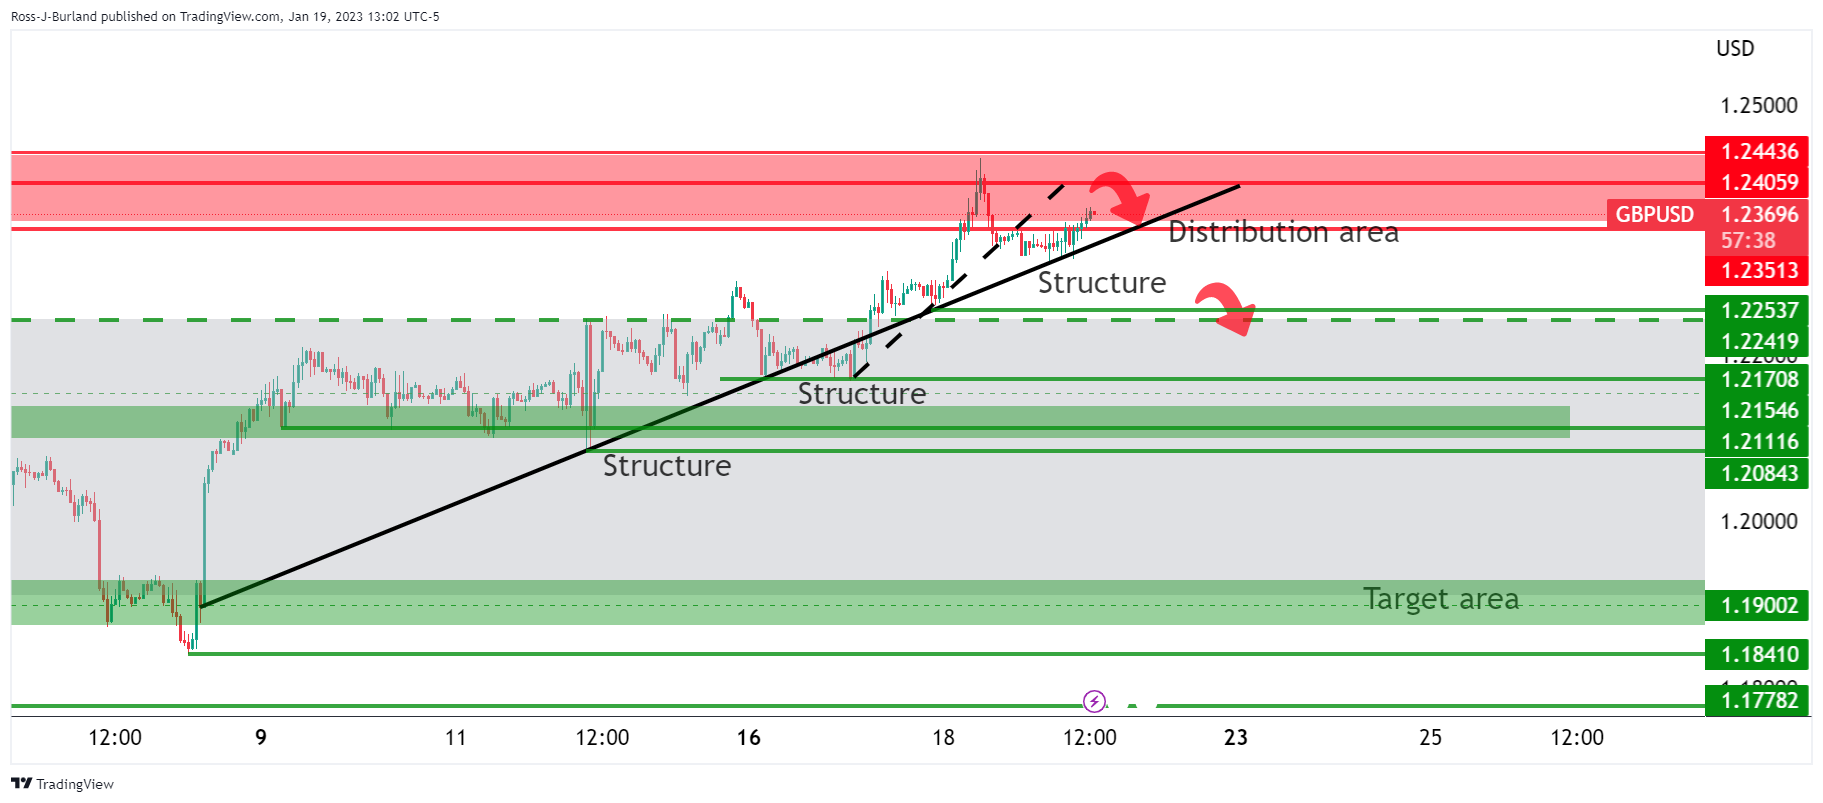
- GBP/USD struggles to refresh five-week high as the key resistance line probe bulls.
- Descending trend line from late May 2022 restricts immediate upside.
- Convergence of 200-DMA, 2.5-month-long ascending support line appears tough nut to crack for bears.
- RSI conditions suggest limited room towards the north.
GBP/USD bulls take a breather around the multi-day high near 1.2400, retreating to 1.2390 by the press time, as a downward-slopping resistance line from May 2022 restricts the immediate upside of the Cable pair.
Adding strength to the bullish bias could be the quote’s successful trading beyond the 200-DMA, as well as the successful rebound from 1.1841.
However, the RSI conditions hint at the limited upside room, which in turn highlights the aforementioned resistance line near 1.2400 as the short-term key hurdle.
Even if the GBP/USD buyers manage to cross the 1.2400 resistance, an ascending resistance line from August 2022, close to 1.2490 at the latest, could act as an additional upside filter.
It’s worth noting that the Cable pair’s run-up beyond 1.2490 could help the buyers approach the May 2022 peak surrounding 1.2665.
Alternatively, pullback moves may initially aim for the August 2022 peak surrounding 1.2290 before witnessing multiple supports near 1.2120 and 1.2100.
Though, a convergence of the 200-DMA and an ascending trend line from the last November, near 1.1980, appears the key support to watch for the GBP/USD bears.
Should the quote breaks the 1.1980 support confluence, the odds of witnessing a fresh monthly low, currently around 1.1840, can’t be ruled out.
GBP/USD: Daily chart

Trend: Further upside expected
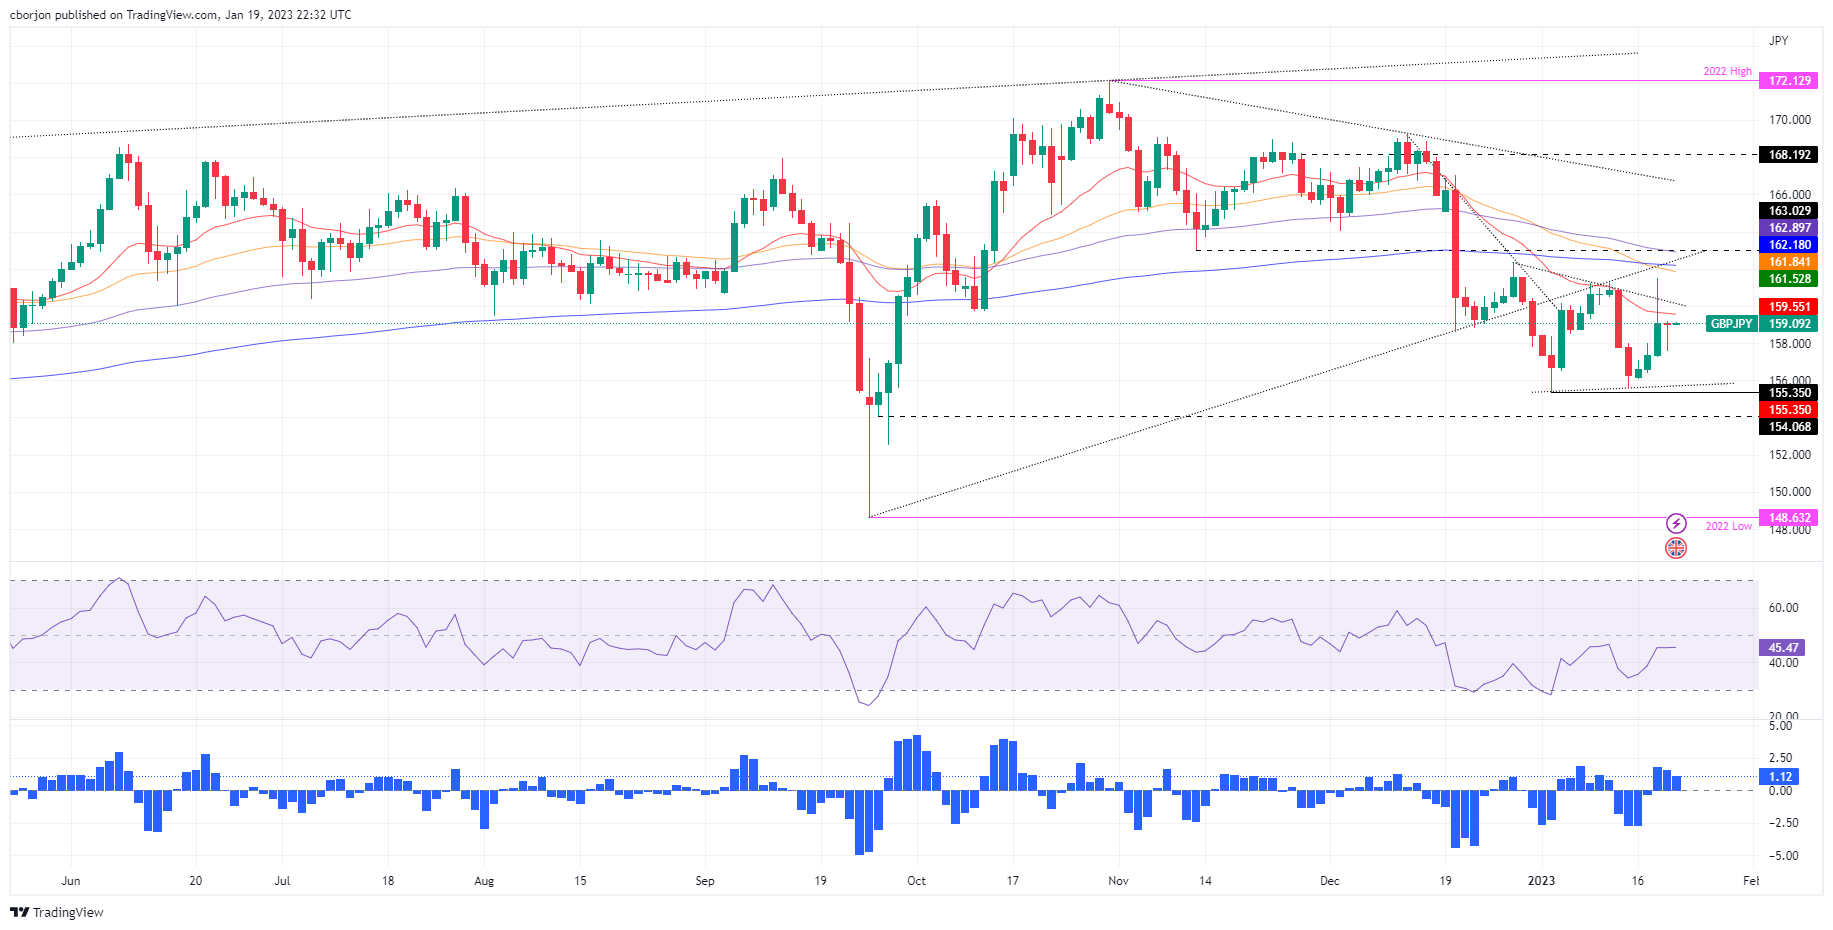
- The GBP/JPY finished Thursday’s session with minuscule losses of 0.01%.
- GBP/JPY Price Analysis: Subdued, but once 159.00 is cleared, further downside is expected; otherwise, breaks above the 20-DMA, the uptrend will resume.
The GBP/JPY recovered from earlier losses and finished Thursday’s session with minuscule gains after plummeting to daily lows of 157.56. However, the GBP/JPY stages a comeback and is set to finish the gains almost flat. As the Asian Pacific session begins, the GBP/JPY is trading at 159.04.
GBP/JPY Price Analysis: Technical outlook
The daily chart shows that the GBP/JPY remains neutral-to-downward biased but trendless during the last seven days. Even though the GBP/JPY was hit by a jump in volatility, on the Bank of Japan’s decision, the exchange rate settled at around Thursday’s close.
Oscillators like the Relative Strength Index (RSI), although its slope is almost flat at bearish territory, while the Rate of Change (RoC) suggests that buying pressure is fading. Therefore, the GBP/JPY might continue to be range-bound unless it clears the first support/resistance levels.
The GBP/JPY, the first support level, would be the 159.00 psychological level. Once cleared, the next support would be the 158.00 figure, followed by the January 19 daily low of 157.56. As an alternate scenario, and the least likely, the GBP/JPY first resistance would be the 20-day Exponential Moving Average (EMA) at 159.54, followed by 160.00 and then the January 18 daily high of 161.52.
GBP/JPY Key Technical Levels
- EUR/USD is looking to stretch its recovery move above 1.0840 amid soaring hawkish ECB bets.
- Weakness in S&P500 due to soaring recession fears are restricting the upside in the risk-perceived currencies.
- US Treasury yields have displayed a recovery after printing fresh multi-month lows.
The EUR/USD pair is struggling to extend its rebound above the immediate resistance of 1.0840 in the early Asian session. The major currency pair is expected to stretch its recovery move amid hawkish commentary from European Central Bank (ECB) President Christine Lagarde and hawkish cues from ECB December meeting accounts.
Fineprints from ECB’s Monetary Policy Meeting Accounts indicated that the majority of the policymakers were favoring an interest rate hike by 75 basis points (bps) but later supported the view of ECB President Christine Lagarde that it might dampen the overall demand and favored a 50 bps interest rate hike.
ECB Lagarde at World Economic Forum (WEF), in Davos reiterated the view that inflation is too high, however, the ECB is determined to bring it down to 2% in a timely manner. She further added that “We may only see a small contraction in the Eurozone.”
The market mood remained risk-averse amid escalating chances of a recession in the United States economy. Analysts at Wells Fargo stated that US Industrial Production fell 0.7% in December and November’s numbers were revised lower. With industrial production has fallen in six of the past eight months, the largest of which being November and December, it is evident that the manufacturing sector is already in recession.
Further, Vice Chair Lael Brainard said "significant weakening in the manufacturing sector," a moderation in consumer spending, and other data pointing to now "subdued growth" in 2023.
S&P500 is facing the impact of the solidifying case of recession. The 500-stock basket recorded a three-day losing streak, portraying negative market sentiment. The demand for US government bonds faded after remaining firmer in the past few sessions. The 10-year US Treasury yields rebounded to near 3.39% after recording a fresh five-month low at 3.33%. Meanwhile, the US Dollar index (DXY) has dropped to near 101.60 after surrendering the critical support of 101.80.
- AUD/USD stays pressured after two-day losing streak, braces for the first negative week in five.
- Downbeat Aussie data, mixed statistics in the US keep recession woes on the table.
- Policymakers at Fed, ECB defend hawkish bias while citing inflation fears.
- Final round of Federal Reserve talks ahead of pre-meeting blackout appears crucial amid light calendar.
AUD/USD justifies its risk-barometer status, as well as bears the burden of downbeat statistics at home, as it holds lower ground near 0.6900 after declining for the last two consecutive days. In doing so, the Aussie pair braces for the first negative weekly closing in five while keeping the reversal from the highest levels since August.
On Thursday, Australia’s Consumer Inflation Expectations for January improved to 5.6% versus 5.2%. However, the employment numbers for December disappointed the AUD/USD pair traders afterward as the headline Employment Change turned negative on a seasonally adjusted basis, printing a -14.6K figure versus 22.5K expected and 64K prior. Further, the Unemployment Rate also rose to 3.5% compared to the market consensus of witnessing no change in the 3.4% previous readings.
On the other hand, US Unemployment Claims dropped to the lowest levels since late April 2022, to 190K for the week ended on January 13 versus 214K expected and 205K prior. Further, the Philadelphia Fed Manufacturing Survey Index improved to -8.9 for January compared to -11.0 market forecasts and -13.7 previous readings. Alternatively, US Building Permits eased in December to 1.33M MoM versus 1.37M consensus and 1.351M prior while the Housing Starts also dropped to 1.382M during the stated month from 1.401M in November, versus 1.359M expected.
It’s worth noting that the downbeat US Retail Sales and Producer Price Index (PPI) raised fears of an economic slowdown in the world’s largest economy after the softer wage growth and activity data flashed earlier.
Elsewhere, Federal Reserve Vice Chair Lael Brainard said that it will take time and resolve to get high inflation down to the fed's 2% target. The policymaker also added, “The policy will need to be sufficiently restrictive for some time.” On the same line, Boston Fed President Collins signaled that the baseline remains that the effective fed funds rate should settle slightly above 5.0%, implying three more 25bp rate rises. The same view was shared by most Fed speakers as they sneak into the pre-FOMC blackout period from this Saturday.
Amid these plays, Wall Street closed negative while the yields bounced off multi-day low but the US Dollar struggled to improve.
Moving on, a lack of major data/events highlights Fedspeak as the key catalyst.
Technical analysis
Rising wedge confirmation favors the AUD/USD bears. That said, the monthly support line near 0.6835 appears the immediate target for sellers.
- Gold price is pressured from recent cycle highs and bears eye a correction to the 38.2% Fibo.
- US Dollar needs to get over 102.20 to assist the Gold bears.
Gold price made a strong move to test $1,935 on Thursday, denying the bears a free ride into low-hanging fruit below $1,900 and hitting stops at $1,920 and above. At the time of writing, Gold price is 1.45% higher at around the highs of the day after rallying from a low of $1,901.
US Dollar pressured to W-formation support
A risk-off session on Wall Street did little to support the greenback, with the US dollar index caving to a low of 101.99 in a move that had been telegraphed in prior analysis as follows:
The US Dollar index, DXY, has subsequently been unable to pick itself up from the floor, an area on the charts that was highlighted as a downside target as follows:
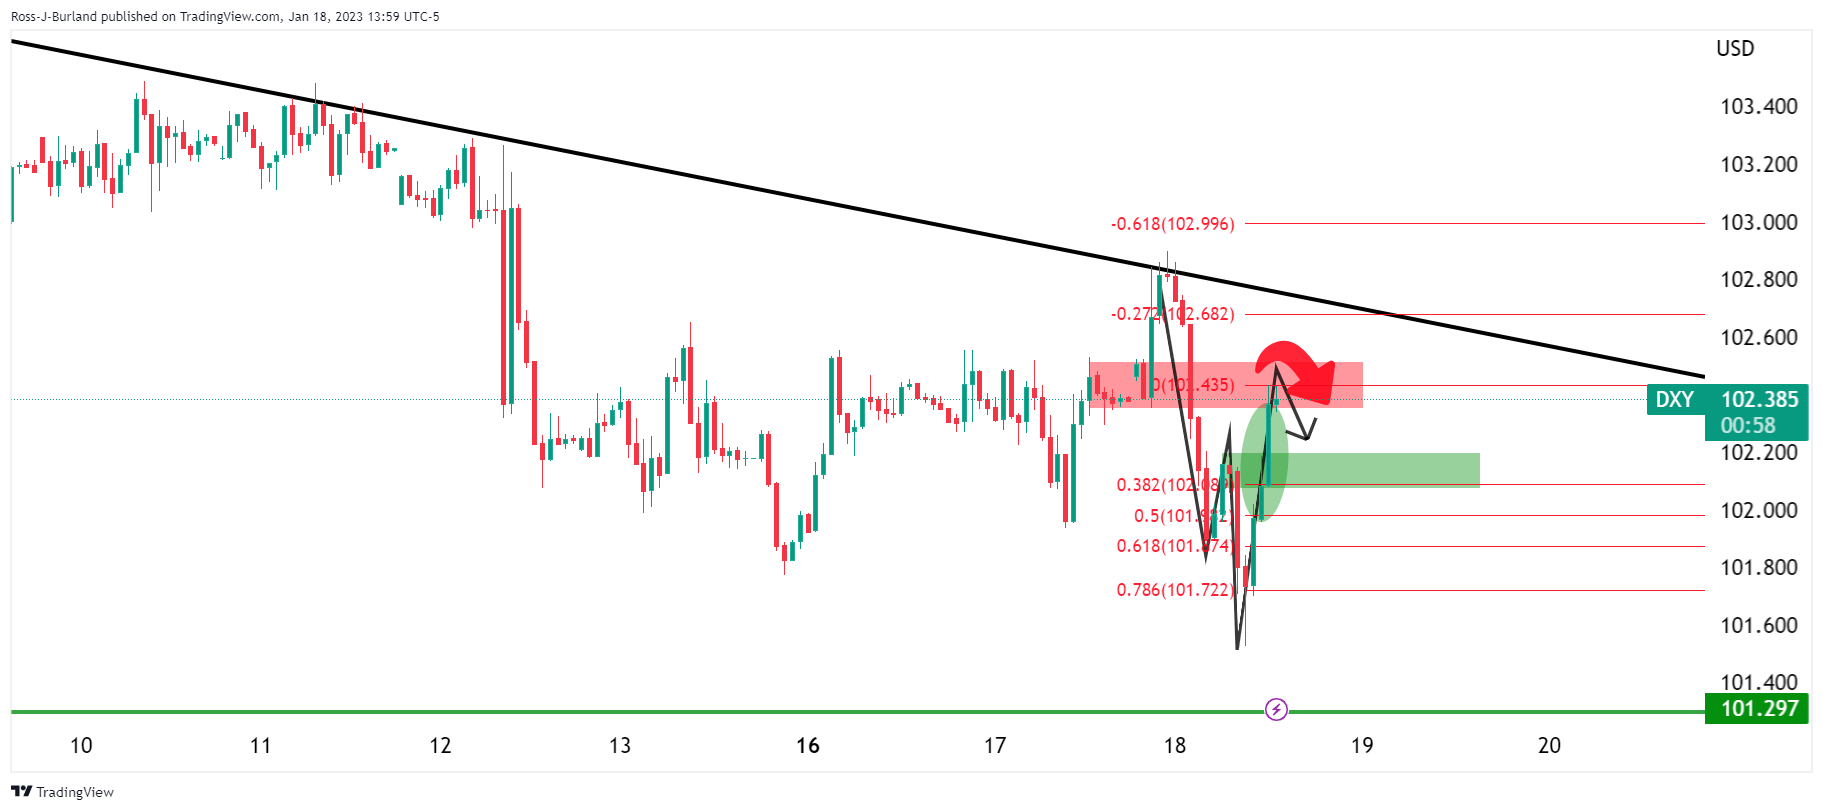
''The DXY index, above, shows the US Dollar meeting resistance in a W-formation on the hourly chart. A correction of the bid could be expected to meet the 102.00/20s in the coming sessions as the price reverts to the neckline of the pattern in a 38.2% Fibonacci correction.''
US Dollar index update:

102.20 is now important, guarding a move to the upside.
Meanwhile, there are a number of themes in play following yet more disinflationary economic data on Thursday that has shown that the US economy is losing momentum. Also, the Yen has been rebounding as traders continued to bet the Bank of Japan, BoJ, will shift away from an ultra-loose monetary policy.
Initial jobless claims fell to 190k from an average of 218k over December, suggesting the January labour market report may improve a touch. However, the Philadelphia Federal Reserve's monthly manufacturing survey showed a notable improvement in the prices paid index, which skidded to 24.5 in January from 36.3 last month, the reading, however, which is a key measure of inflation at the producer level, was the lowest since August 2020. The fourth-quarter earnings outlook also ''looks bleak'', as reported by Reuters: ''Companies are reporting earnings 2.6% above expectations, compared to a long-term average of 4.1% since 1994 and 5.3% for the past four quarters, according to IBES data from Refinitiv.''
On Wednesday, the Federal Reserve's Beige Book showed that since the previous report, overall economic activity has remained relatively stable and overall, contacts expected little growth in the coming months.
Key notes
Selling prices increased at a modest or moderate pace in most districts, though many said that the pace of increases had slowed from that of recent reporting periods.
Employment continued to grow at a modest to moderate pace for most districts.
On balance, contacts generally expected little growth in the months ahead.
Wage pressures remained elevated across districts, though five reserve banks reported that these pressures had eased somewhat.
Prior to that release, the Producer Price Index, PPI, and Retail Sales, which showed disinflationary tendencies in the data, reinforced expectations that the Federal Reserve will continue to reduce its tightening pace in upcoming meetings.
It is also worth noting that the US Atlanta Fed GDPNow Q4: 3.5% (prev 4.1%).
Fed speakers remain hawkish
Despite the series of deflationary data this week, US Federal Reserve speakers remained hawkish this week. Vice Chair Lael Brainard stated on Thursday that "even with the recent moderation, inflation remains high, and policy will need to be sufficiently restrictive for some time to make sure inflation returns to 2 percent on a sustained basis," Brainard said.
Earlier in the week, St. Louis Federal Reserve's President James Bullard said US interest rates have to rise further to ensure that inflationary pressures recede.
''We’re almost into a zone that we could call restrictive - we’re not quite there yet,” Bullard said Wednesday in an online Wall Street Journal interview. Officials want to ensure inflation will come down on a steady path to the 2% target. “We don’t want to waver on that,” he said. “Policy has to stay on the tighter side during 2023” as the disinflationary process unfolds, the Fed hawk added. Bullard has pencilled in a forecast for a rate range of 5.25% to 5.5% by the end of this year.
Nevertheless, Gold price has shown resilience in the face of such hawkishness and has found fresh bids on any pullback taking directional input from the softness in the US Dollar.
Gold technical analysis
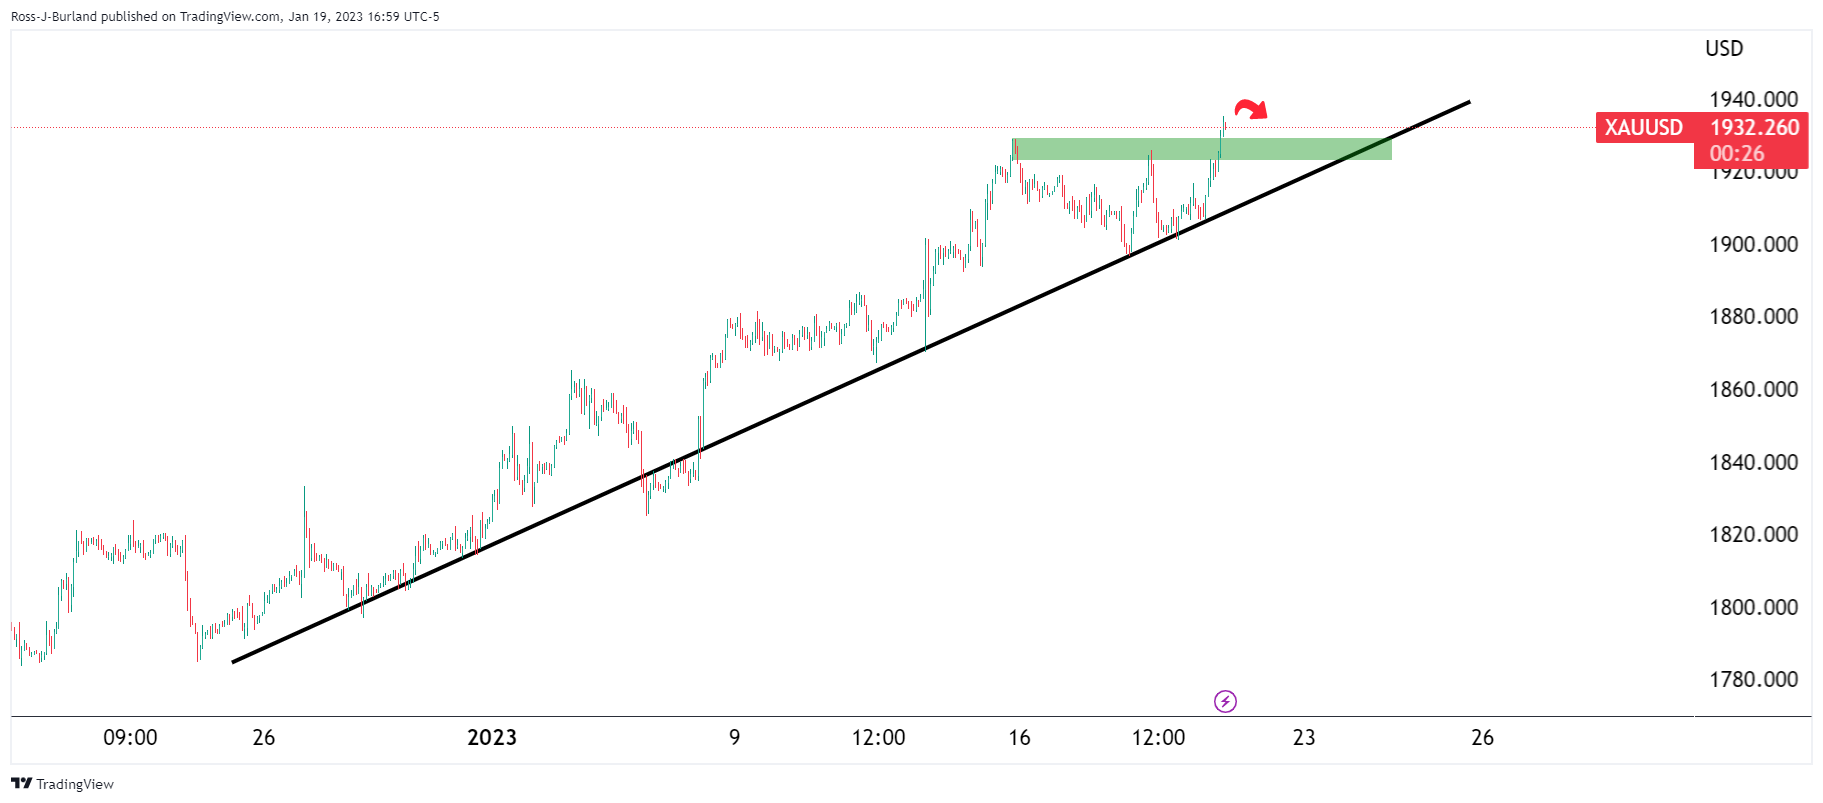

A move into the 38.2% Fibonacci could be in order for the Asian session. this meets the prior resistance for mid-January near 41,929. Below there, there will be a risk to the trendline support should the greenback get over 102.20 and stay bid into Friday.
- USD/JPY hovers around Wednesday’s close of 128.85, aiming to close below to extend its downtrend.
- Unemployment claims in the US came lower than expected, as traders expect further tightening.
- Japanese inflation data is expected to edge higher; what would the BoJ do?
The USD/JPY reverses its course and edges lower late in the North American session, down by 0.33% on Thursday. Risk aversion weighed on the US Dollar (USD), which extended its losses but was capped by the rise in US Treasury bond yields. At the time of writing, the USD/JPY is trading at 128.33 after hitting a daily high of 128.88.
USD/JPY in choppy trading before Japanese CPI release
Wall Street continues to show a dampened mood. Thursday’s economic data in the United States (US) pointed to a tight labor market, as Initial Jobless Claims for the last week edged lower, by 190K less than the 214K consensus. Further data reported that the US housing market continues to deteriorate. Housing Starts and Building Permits missed estimates, while the Philadelphia Fed Manufacturing Index, although in contractionary territory at -8.9, improved compared to November’s -13.7 reading.
As traders brace for a critical Japanese inflation report, the USD/JPY has been hovering around 128.40 for the last three hours.
Last month’s inflation in Japan rose by 3.8% YoY in November, exceeding October’s 3.7%. Excluding fresh foods but including fuel costs rose by 3.7% YoY vs. 3.6% on its previous reading. Excluding food and energy, the so-called core Consumer Price Index (CPI) rose by 2.8%.
If the Japanese CPI increased above last month’s figures, that could result in the USD/JPY prolonging its downtrend, and it might test the YTD low of 127.21, followed by a challenge to the May 24 swing low at 126.36.
Elsewhere. the US Dollar Index, a measure of the buck against a basket of peers, extended its losses for two straight days, sliding 0.34% to 102.034.
Also read: USD/JPY Price Analysis: The yen strengthens, as bears stepped in around 128.60s
What to watch?
The Japanese economic calendar will feature inflation figures. On the US front, the US calendar will feature Existing Home Sales alongside Fed speaking.
USD/JPY Key Technical Levels
- NZD/USD W-double bottom has formed and a break of 0.6400 could trigger the bullish bias further for a look-in at 0.6420.
- 0.6420 guards key resistances ahead of the price imbalances (PIs) above.
- If 0.6420 holds, convincingly, i.e. on a number of tests, then the blow-off could come sooner than later.
NZD/USD bulls are making their moves from double-bottom lows following the sell-off that occurred on the back of the Aussie jobs data that attracted bears into the market at key support, taking trapped bulls for a ride to 0.6900 and then 0.6870 lows. NZD/USD has mirrored the Aussie in this regard and the following illustrates the prospects of a move higher before the next slide.
NZD/USD weekly and daily charts
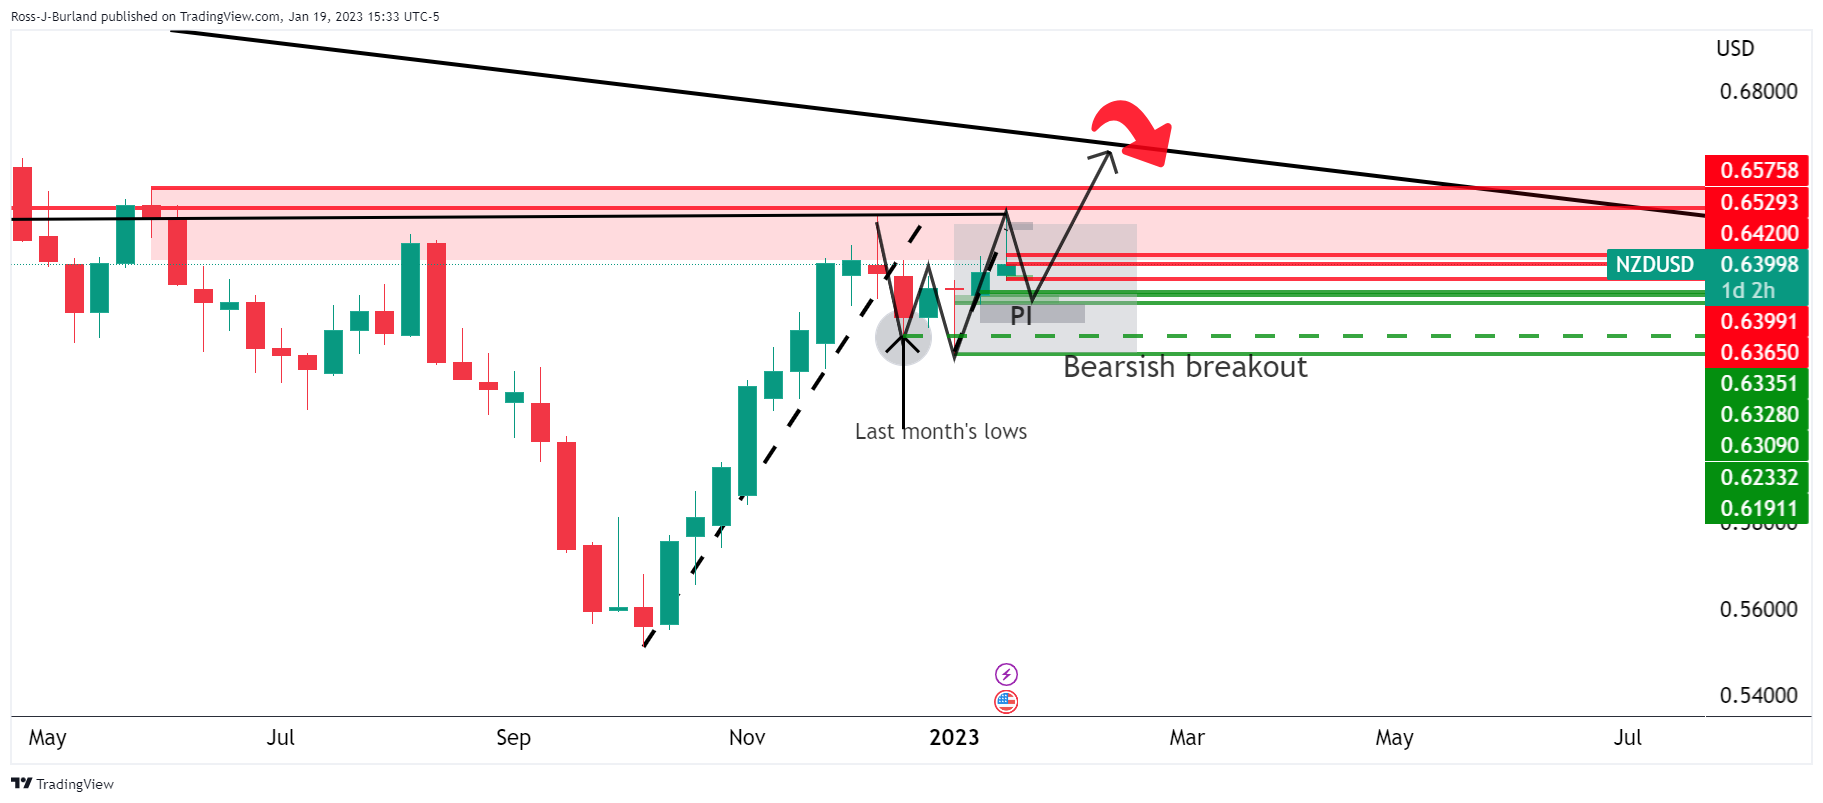
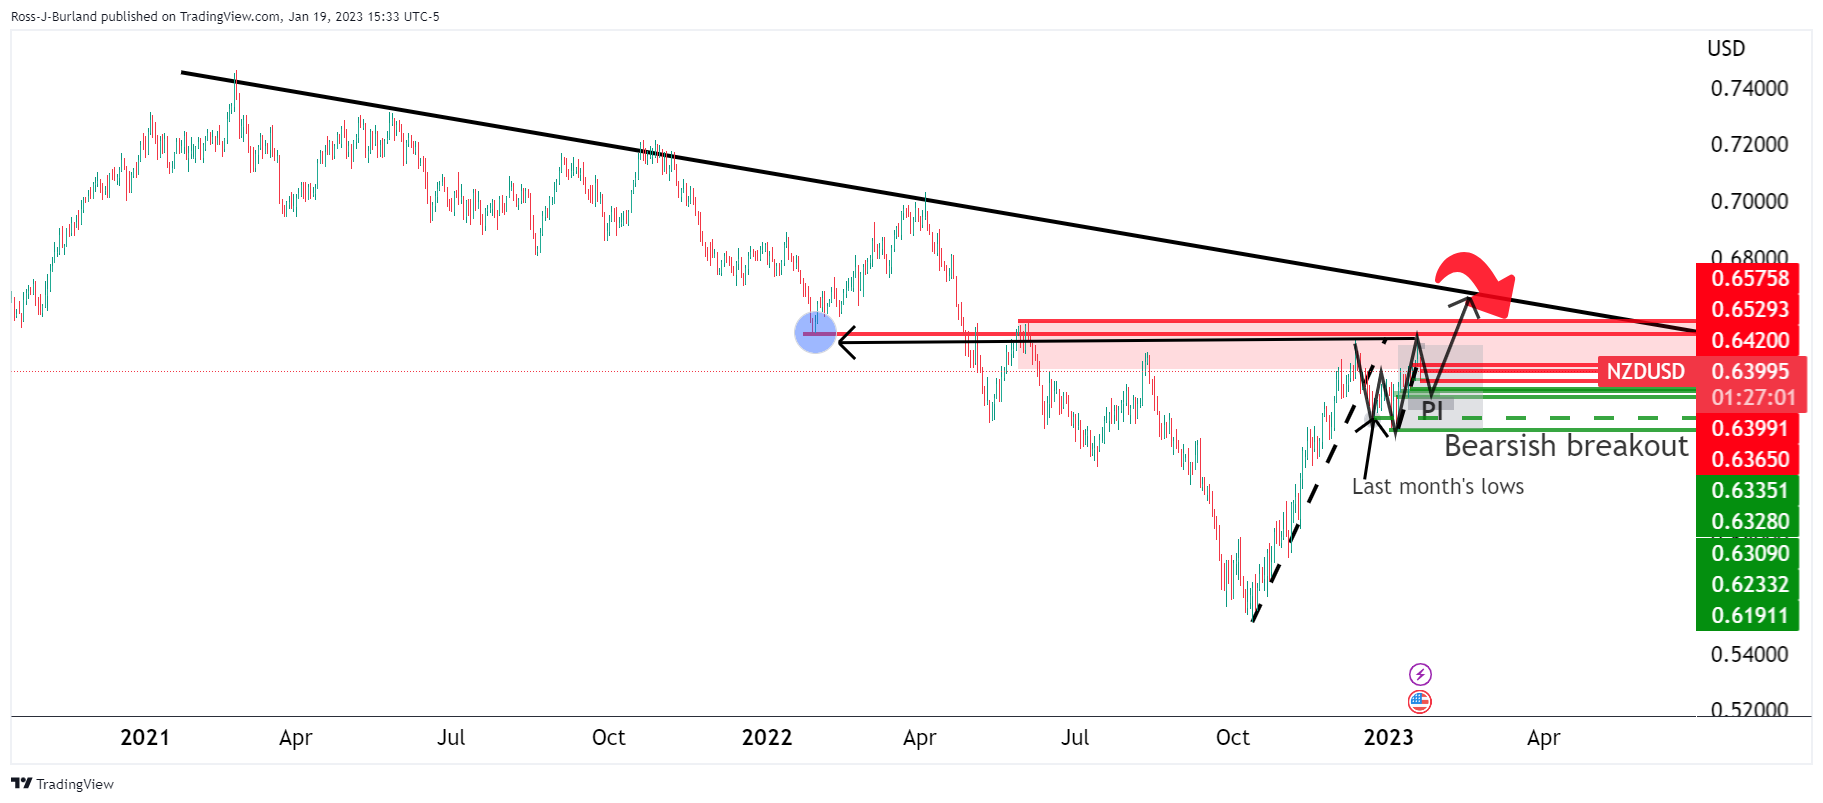
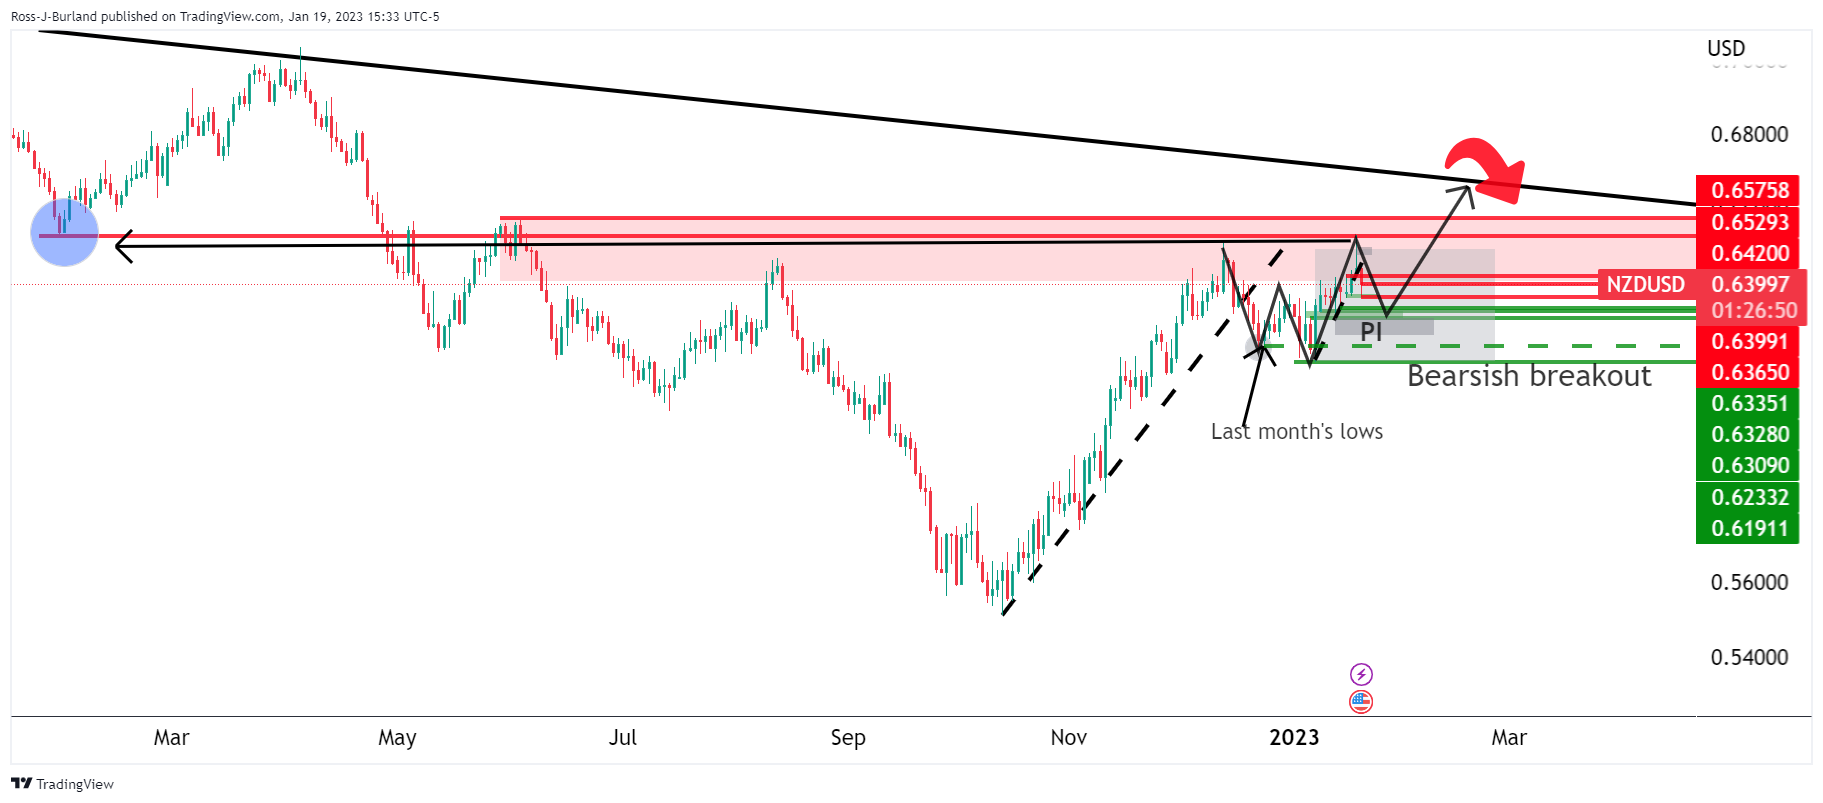
Assuming the price is on course for the trendline resistance, the W-formation is compelling in this regard with support seen at 0.6300 with the 0.6530s targeted to confirm the bias towards 0.6670s trendline resistance.
NZD/USD H1 chart

Dealing with the matter at hand, the price is forming a W-double bottom and a break of 0.6400 could trigger the bullish bias further for a look-in at 0.6420 that guards key resistances ahead of the price imbalances (PIs) above. Given that the price is on the backside of the trendline, however, the bias is to the downside and if 0.6420 holds, convincingly, i.e on a number of tests, then the blow-off could come sooner than later from which point the bullish thesis to the daily trendline resistance will be reassessed vs. a downside continuation below 0.6300.
What you need to take care of on Friday, January 20:
The US Dollar lost some ground on Thursday, as the dismal mood that ruled financial markets eased as the day went by. Still, most European and American indexes closed in the red, as hawkish comments from ECB and US Federal Reserve officials suggested central banks are far from done with quantitative tightening.
On Thursday, Klaas Knot, a member of the Governing Council of the European Central Bank, said that there would be more than one 50 basis points (bps) increase in interest rates, adding that market participants may be underestimating the ECB's commitment to tame prices. Later, President Christine Lagarde, noted that the central bank will stay on course with rate hikes, adding that the job market in Europe has never been as vibrant as now. More relevantly, she said that they are not seeing inflation expectations unanchoring. EUR/USD kept seesawing around 1.0800, ending the day at 1.0820.
The GBP/USD pair gained upward traction ahead of the daily close and approached the 1.2400 figure, AUD/USD recovered the 0.6900 level following a slump to 0.6871, as poor Australian employment and inflation figures weighed on the AUD. USD/CAD retreated and trades at around 1.3450. Finally, USD/JPY spent the day consolidating at around 128.50.
Gold soared in a risk-averse environment, with the bright metal trading around $1,930 a troy ounce. Crude oil picked up and WTI settled at $80.65 a barrel.
Like this article? Help us with some feedback by answering this survey:
- USD/CAD bears are taking on a double bottom near 1.3450 support area.
- Bears eye a 61.8% Fibonacci retracement near 1.3415 should the double bottom (DB) be breached.
USD/CAD is eating into the bullish rally's tracks from yesterday's business with 1.3450/30 eyed as a potential support structure in what has been a choppy descent from above 1.3500 on the day so far. The following illustrates the downside bias prior to the next wave of demand to the upside should the US dollar bulls be motivated by a discount in price in the coming sessions and days ahead.
USD/CAD prior analysis
It was stated at the start of the week, in the following analysis, USD/CAD Price Analysis: Bulls eye a break of 1.3450 for a look in at the 1.35 area, that the price was embarking on a correction but 1.3450 had to give out first:
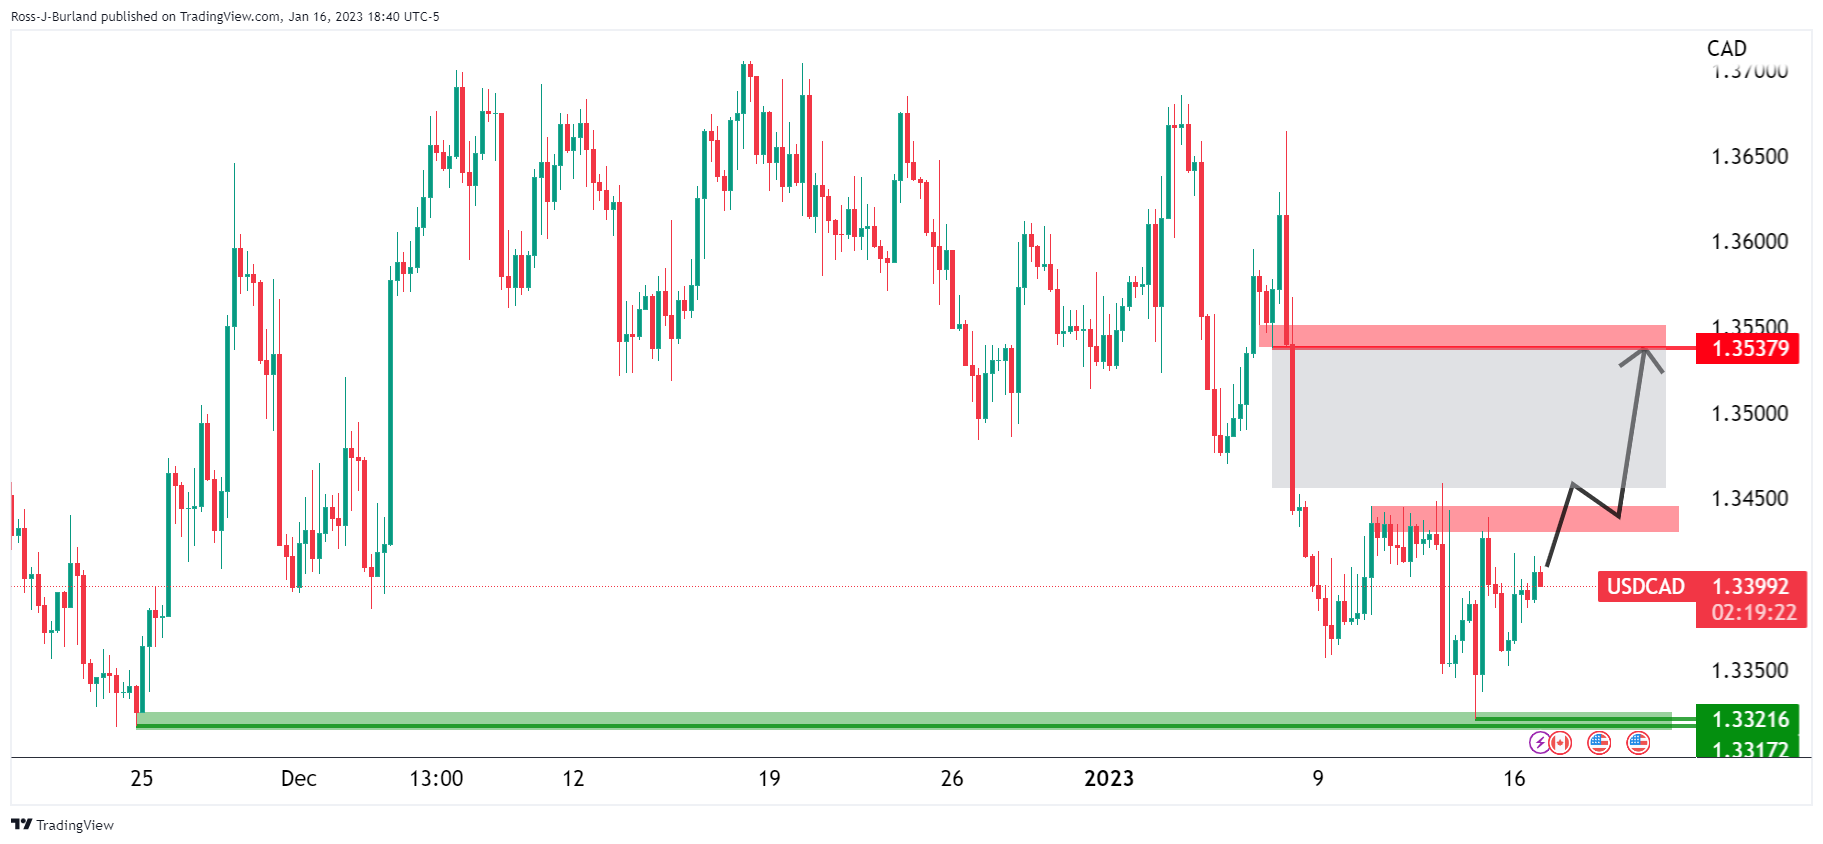
There was a price imbalance that had been left behind since the major sell-off at the start of the year. There was a thesis of mitigation towards 1.3550.
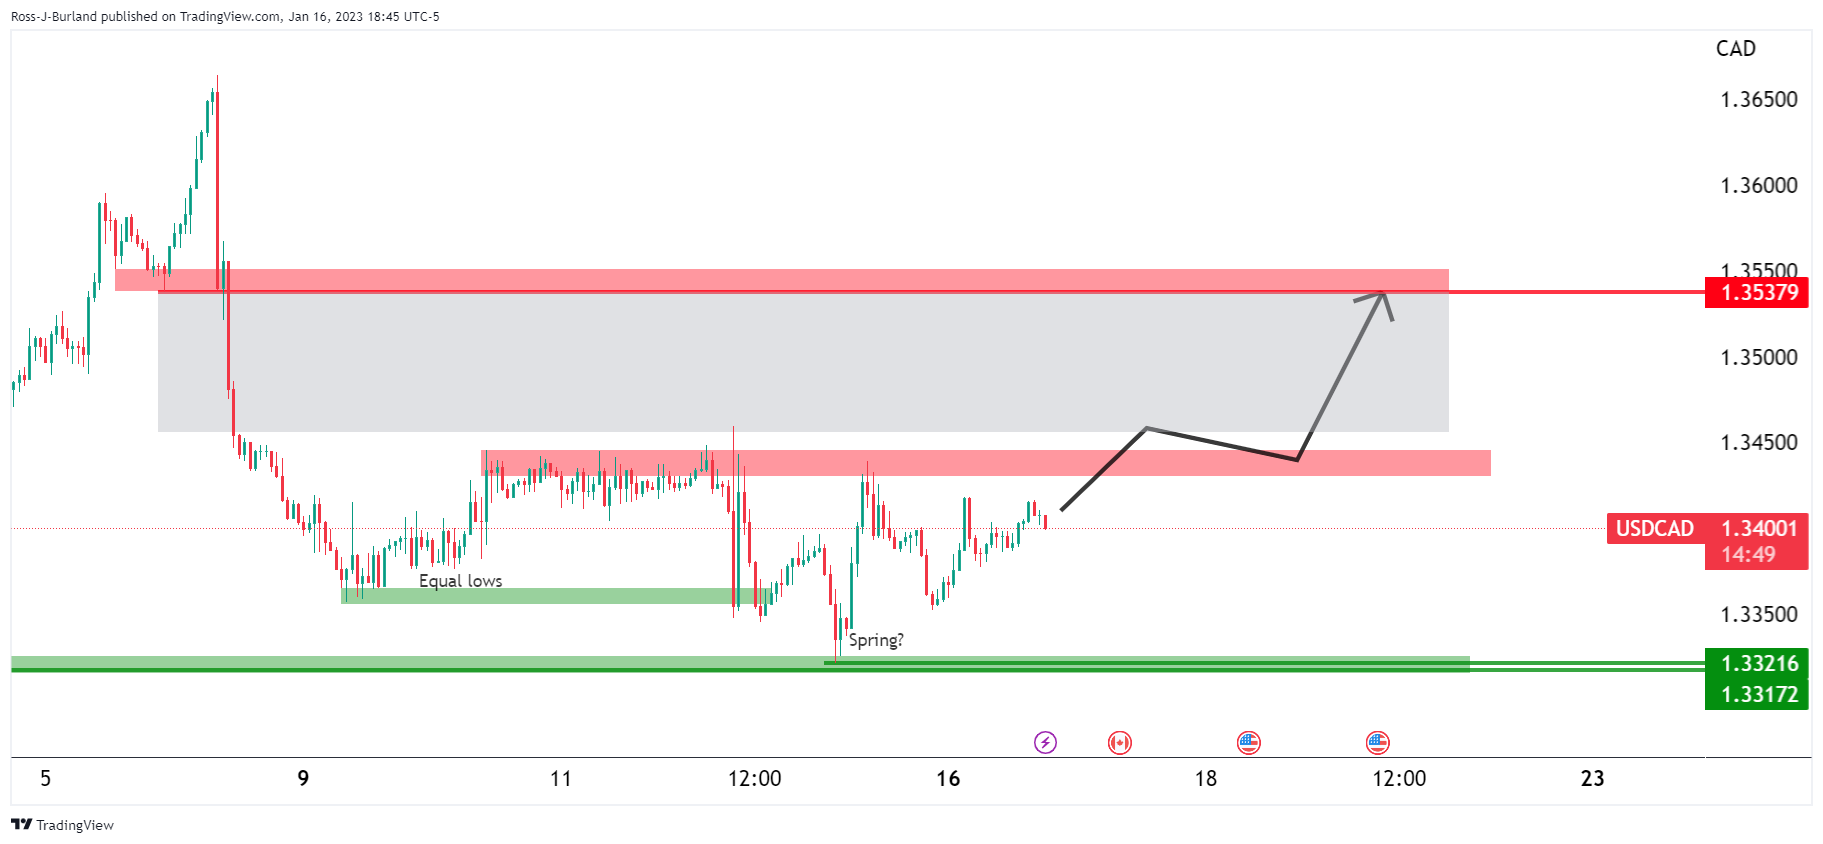
USD/CAD update
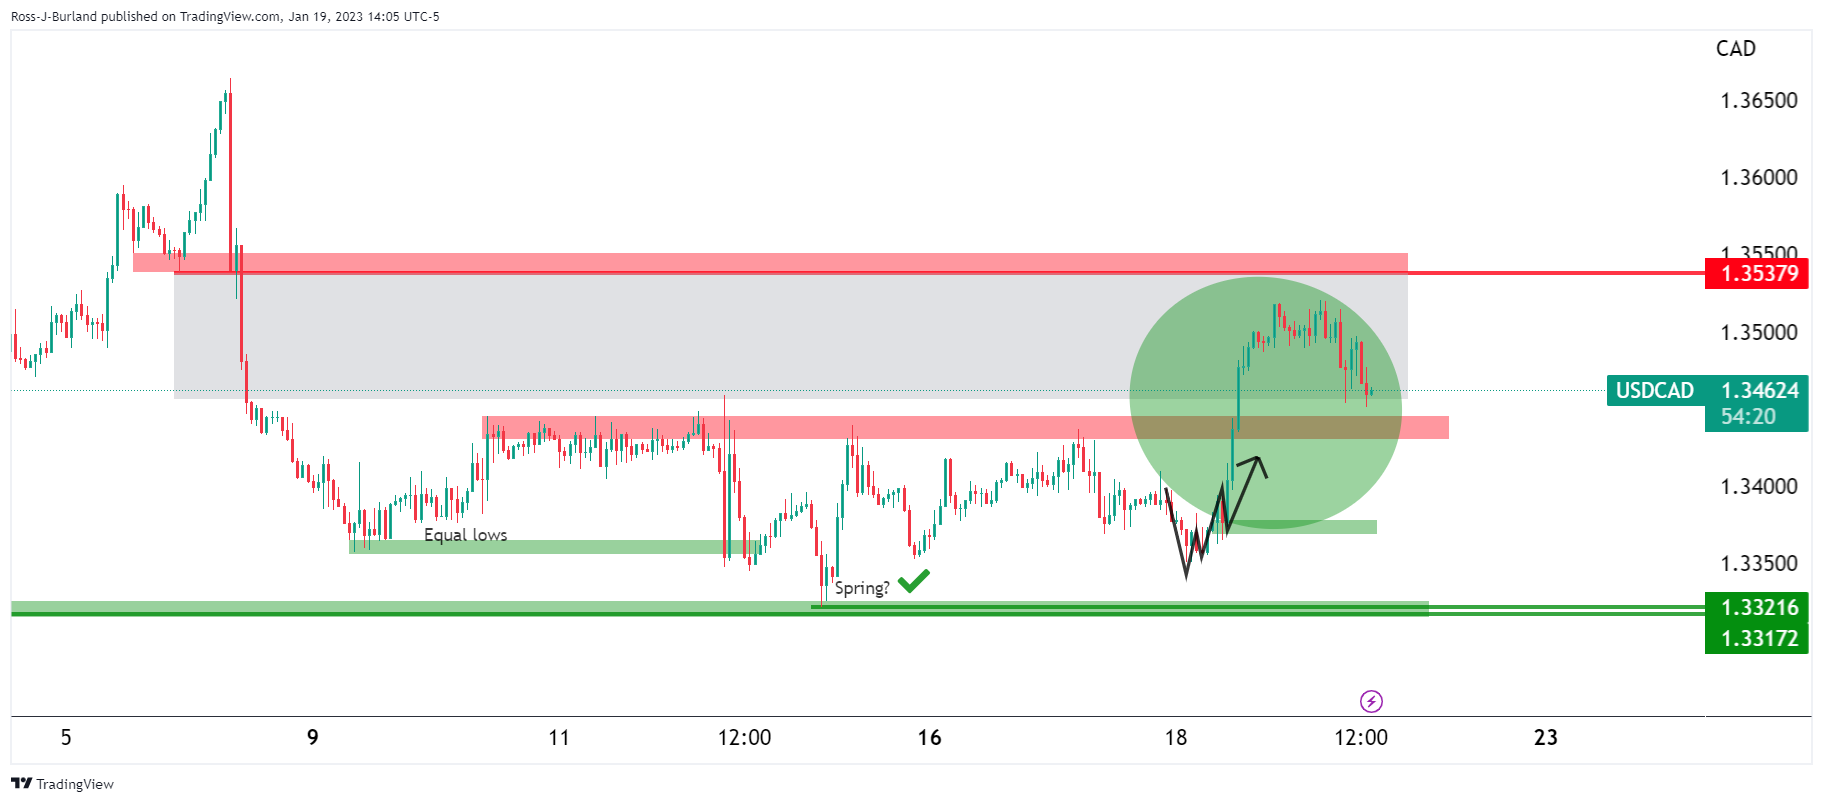
As illustrated, the bullish accumulation schematic played out, with the price respecting the spring and a subsequent break of resistance near 1.3450 leading to a drive to mitigate the price imbalance, albeit not in its entirety.
At this juncture, it is a matter of wait-and-see, but the bias is bullish while above the old resistance:
USD/CAD H4 chart
The price is forming an M-formation on the 4-hour chart. The pattern is a reversion set-up for the sessions ahead where the price would be expected to move back into the bearish impulse and target the neckline near 1.3490. However, the downside may not have been concluded as of yet, although there is a current deceleration near 1.3450 and a 38.2% Fibonacci retracement area of the prior bullish leg's range. Lower time frames can be assessed to gauge whether the bears are throwing in the towel which might prompt a move by the bulls in the day ahead:
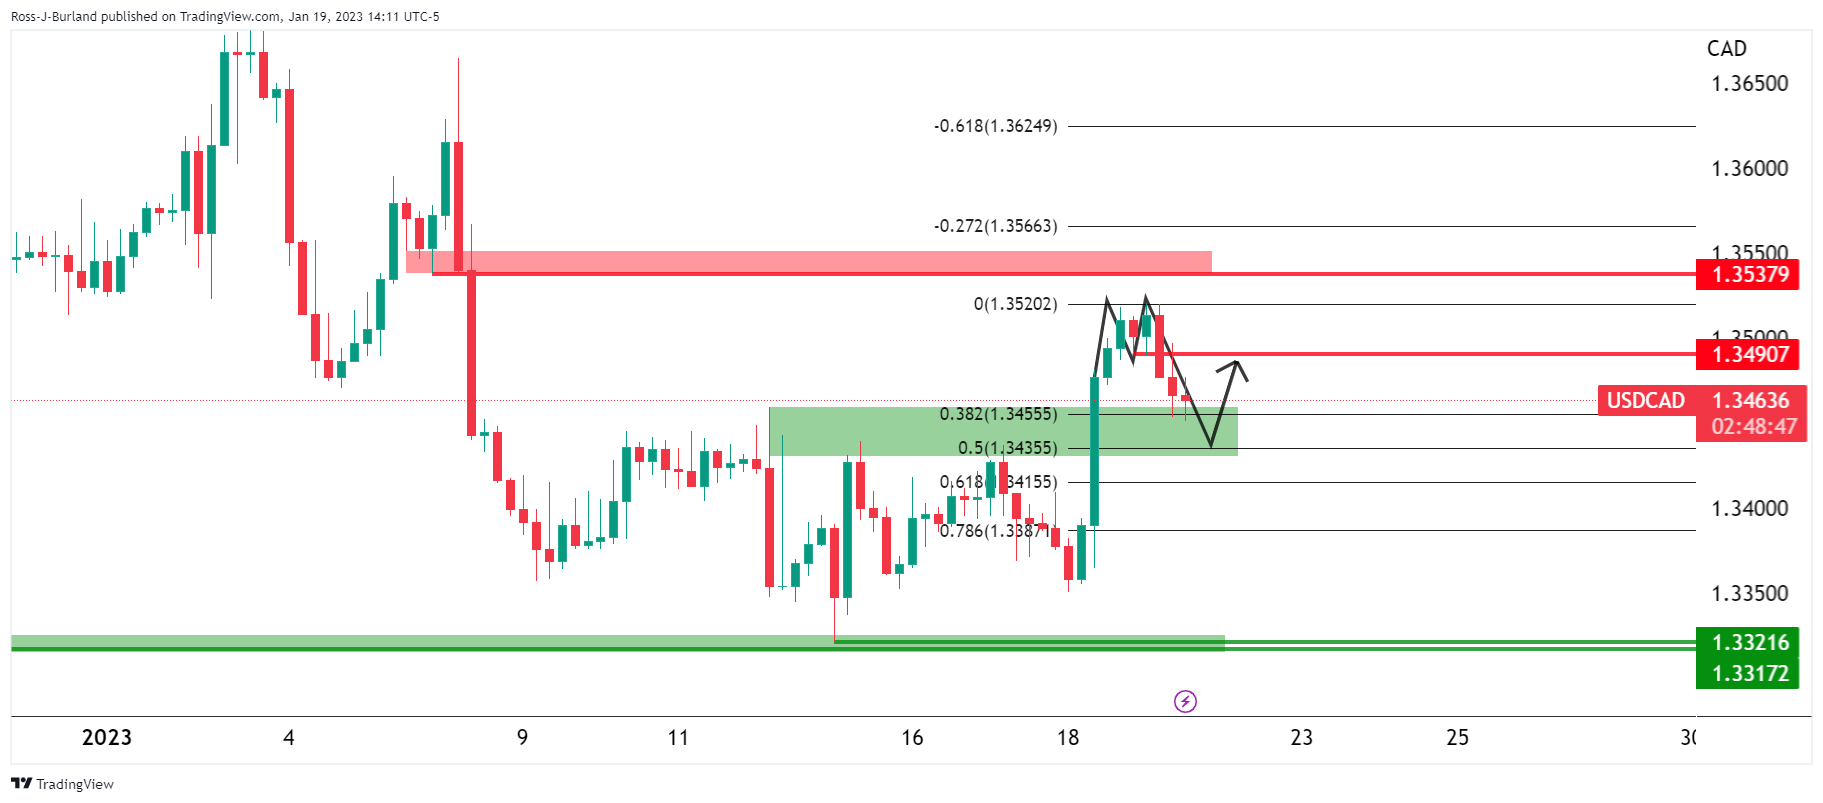
USD/CAD 15-min chart
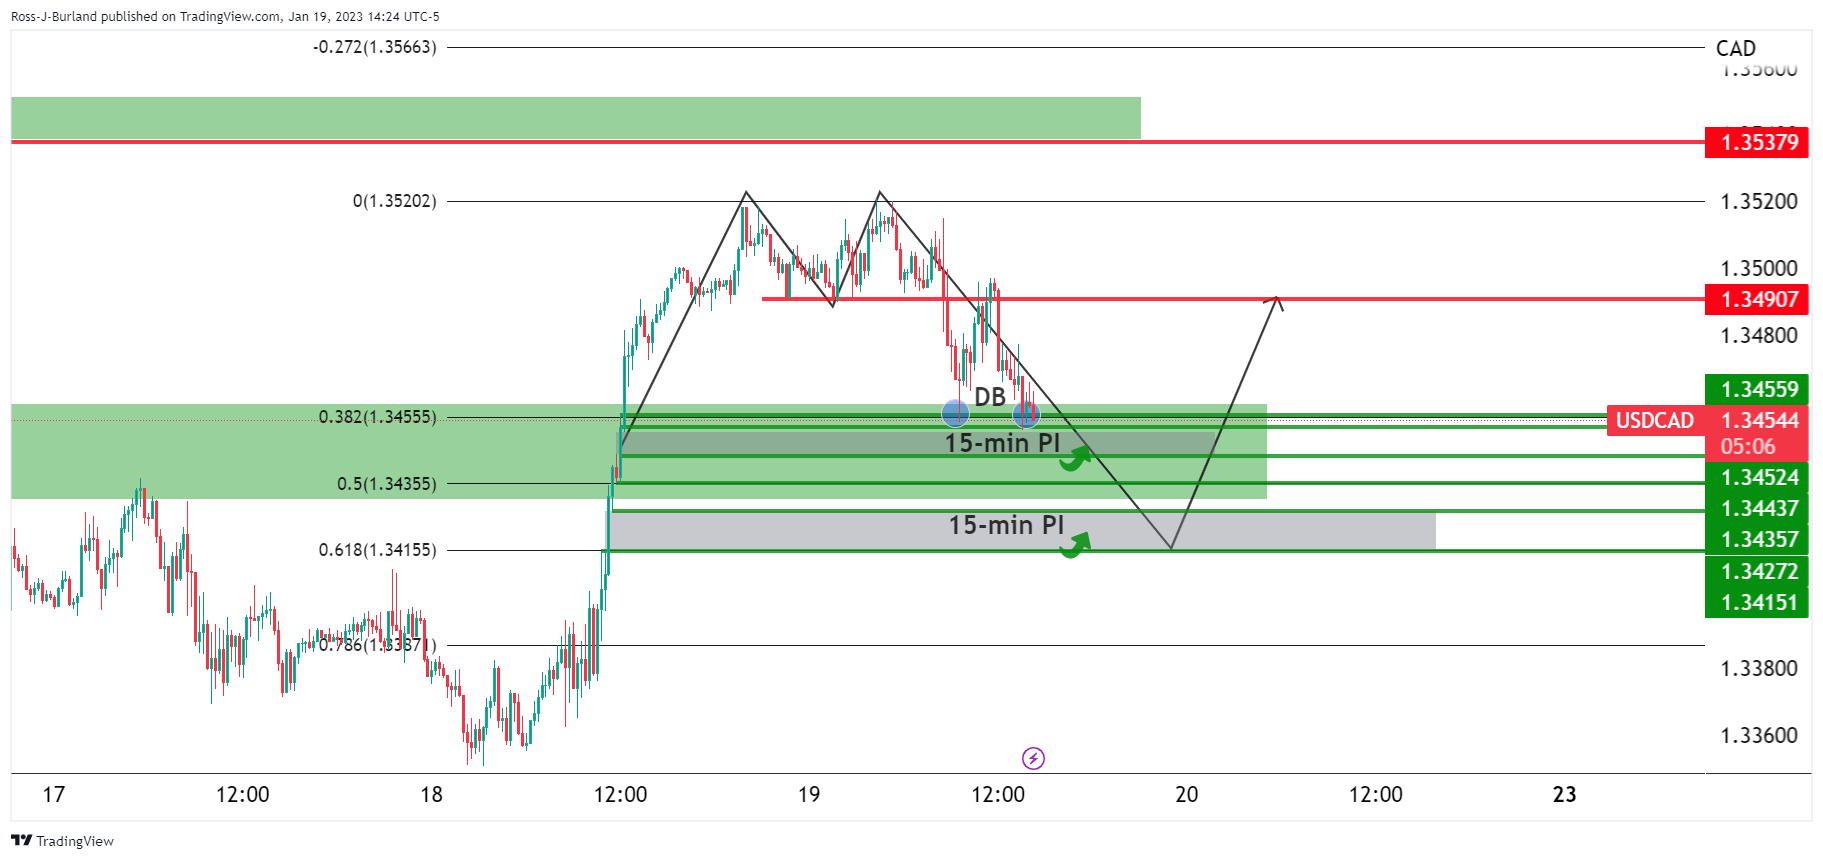
As per the 15-min chart, there are two price imbalances (PIs) that could be mitigated on the way to a 61.8% Fibonacci retracement near 1.3415 should the double bottom (DB) be breached.
- Silver’s bounced off daily lows nearby the $23.00 figure and is climbing sharply, gaining 1.33%.
- US Dollar continued to weaken, but US Treasury bond yields put a lid on XAG/USD’s rally.
- XAG/USD is exposed to selling pressure below $23.60; otherwise, it could re-test the YTD high.
Silver price is trimming some of Wednesday’s losses and probes the 20-day Exponential Moving Average (EMA) around $23.65 on a trading session characterized by a weaker US Dollar (USD) and a downbeat market mood spurred by recession fears after dismal US data. Therefore, the XAG/USD is trading at $23.74 after hitting a daily low of $23.17.
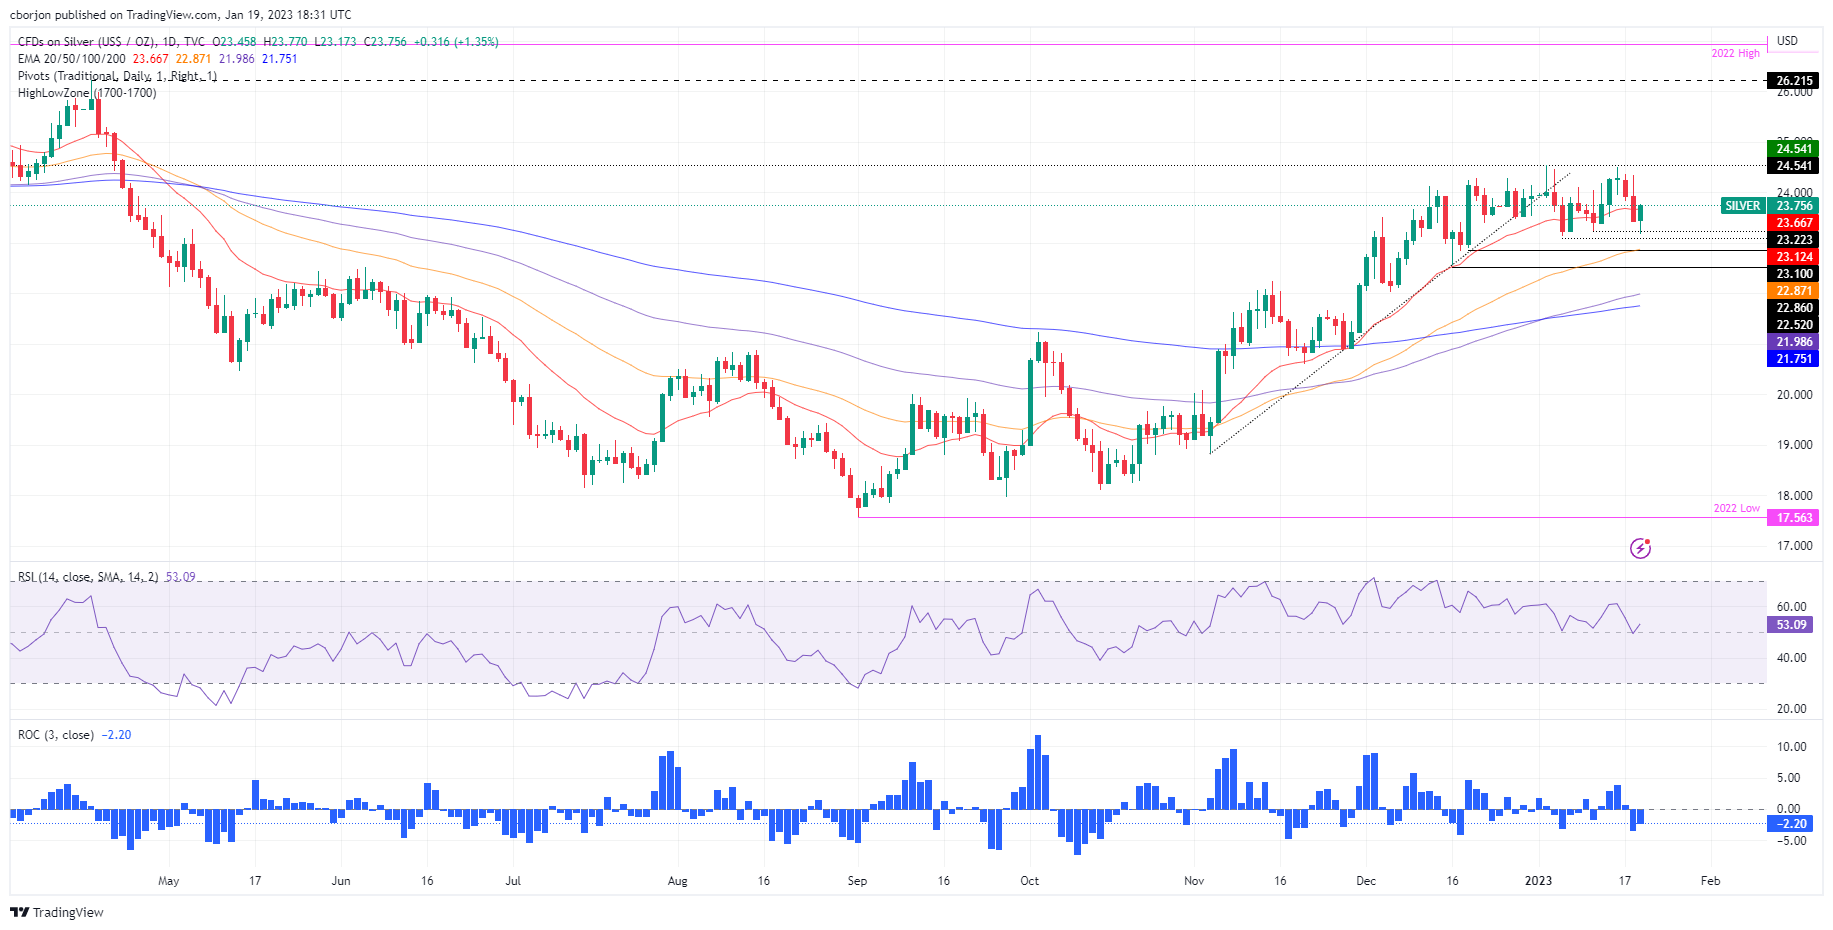
Silver Price Analysis: XAG/USD Technical Outlook
Silver's daily chart suggests the white metal could peak around the $24.50s area. The non-yielding metal hasn’t been able to crack the latter, keeping Silver bears hopeful. As XAG/USD has reached higher peaks, the Relative Strength Index (RSI) did not, opening the door for a negative divergence. In addition, the Rate of Change (RoC) in the last two days suggests bearish momentum increased. Hence, a pullback in XAG/USD is on the cards.
For that scenario to play out, the XAG/USD needs to drop below $23.17, so the $23.00 psychological level could be exposed. A breach of the latter will open the door to test the 50-day EMA at $22.87, which, once cleared, will send XAG/USD dropping toward the December 16 low of $22.56.
As an alternate scenario, if Silver reclaims and achieves a daily close above the 20-day EMA, that could pave the way for a re-test of the YTD high of $24.54. Firstly, reclaiming the former would expose the $24.00 handle. The break above will reveal the YTD high at $24.54.
Silver Key Technical Levels
Vice Chair Lael Brainard states that ''there are reasons to think high inflation in the more labour sensitive “core services ex-housing” basket might reflect the pass-through of pandemic and war one-offs and not solely cyclical strength from tight labour markets.
"Inflation has been declining over the past several months against a backdrop of moderate growth," Brainard said in prepared remarks for a speech that noted a "significant weakening in the manufacturing sector," a moderation in consumer spending, and other data pointing to now "subdued growth" in 2023.
Key comments
"It is likely that the full effect on demand, employment, and inflation of the cumulative tightening that is in the pipeline still lies ahead," Brainard said in the remarks for a speech at the University of Chicago's Booth School of Business.
"It remains possible that a continued moderation in aggregate demand could facilitate continued easing in the labor market and reduction in inflation without a significant loss of employment," Brainard said.
"Even with the recent moderation, inflation remains high, and policy will need to be sufficiently restrictive for some time to make sure inflation returns to 2 percent on a sustained basis," Brainard said.
Key notes
The recent downshift in the pace of rate hikes allows u.s. central bank to assess more data as it moves policy to a sufficiently restrictive level.
It will take time and resolve to get high inflation down to the fed's 2% target.
.
The policy will need to be sufficiently restrictive for some time.
Inflation has been declining, and data point to subdued growth ahead.
Monetary policy's drag on US economic growth and employment 'likely to increase' in 2023.
Tentative signs labour demand is cooling says labour supply likely to remain constrained.
Wages do not appear to be driving inflation, and sees no 1970s-style wage-price spiral.
Sees tentative signs of moderating wage growth.
Says risk-management posture needed to defend inflation expectations anchor.
US Dollar update
Despite continued hawkish rhetoric from the Fed officials this week, the US dollar has been on the backfoot owing to disinflationary data contrary to the hawkishness at the Fed:
The US Dollar index, DXY, has subsequently been unable to pick itself up from the floor, an area on the charts that was highlighted as a downside target as follows:
''The DXY index, above, shows the US Dollar meeting resistance in a W-formation on the hourly chart. A correction of the bid could be expected to meet the 102.00/20s in the coming sessions as the price reverts to the neckline of the pattern in a 38.2% Fibonacci correction.''
- GBP/USD bears could be lurking and ready to move in while below 1.2400.
- US data remains a thorn in the side of the US Dollar bulls.
GBP/USD is higher on the day having traded up to 1.2377 in recent trade while the US Dollar tails off and gives flight to risky assets and risk-on forex such as GBP. The Great British Pound rallied from a low of 1.2312 as interest rate sentiment for the Bank of England continues to support the currency despite the bearish technical developments on the charts (more on that below),
Meanwhile, there are a number of themes in play: The US Dollar, for one, has been under pressure following yet more disinflationary economic data on Thursday that has shown that the US economy is losing momentum. Then, the Yen has been rebounding as traders continued to bet the Bank of Japan, BoJ, will shift away from an ultra-loose monetary policy.
United States of America's disinflationary backdrop
In terms of data, yesterday, the Federal Reserve's Beige Book showed that since the previous report, overall economic activity hasd remained relatively stable and overall, contacts expected little growth in the coming months.
Key notes
Selling prices increased at a modest or moderate pace in most districts, though many said that the pace of increases had slowed from that of recent reporting periods.
Employment continued to grow at a modest to moderate pace for most districts.
On balance, contacts generally expected little growth in the months ahead.
Wage pressures remained elevated across districts, though five reserve banks reported that these pressures had eased somewhat.
Prior to that release, the Producer Price Index, PPI, and Retail Sales, which showed disinflationary tendencies in the data, reinforced expectations that the Federal Reserve will continue to reduce its tightening pace in upcoming meetings.
It is also worth noting that the US Atlanta Fed GDPNow Q4: 3.5% (prev 4.1%).
Meanwhile, on Thursday, while the Philadelphia Federal Reserve's monthly manufacturing survey showed a notable improvement in the prices paid index, which skidded to 24.5 in January from 36.3 last month, the reading, however, which is a key measure of inflation at the producer level, was the lowest since August 2020.
The fourth-quarter earnings outlook also ''looks bleak'', as reported by Reuters: ''Companies are reporting earnings 2.6% above expectations, compared to a long-term average of 4.1% since 1994 and 5.3% for the past four quarters, according to IBES data from Refinitiv.''
US Dollar on the backfoot
The US Dollar index, DXY, has subsequently been unable to pick itself up from the floor, an area on the charts that was highlighted as a downside target as follows:
''The DXY index, above, shows the US Dollar meeting resistance in a W-formation on the hourly chart. A correction of the bid could be expected to meet the 102.00/20s in the coming sessions as the price reverts to the neckline of the pattern in a 38.2% Fibonacci correction.''
US Dollar index update:
Bank of England outlook supports GBP/USD
Nevertheless, the British Pound Sterling has been unable to really take off on its own accord despite the United Kingdom's Consumer Price Index showing the prior day that it remains near 40-year highs. Specifically, the data showed yesterday that there was an increase in services inflation and accelerating food/drink prices which will be a cause for some concern for the Bank of England's policy-makers. Analysts at ING Bank, making remarks on the Consumer Price Index said "it's important to note that core services jumped from 6.4% to 6.8%, a development that the BoE should particularly take into consideration, and when added to wage data should tilt the balance towards a 50 bps hike in February."
Therefore, a hawkish Bank of England could still inject some resilience into the pound. The Bank of England's Governor Andrew Bailey argued at the start of the week that a shortage of workers in the labour market posed a “major risk to inflation coming down”.
''The implication is that the Bank of England could remain more hawkish on its policy decisions this year,'' analysts at Rabobank said. ''We expect another 50 bps rate hike in February and then three more 25 bps moves as the Bank struggles to slice the final few percentage points from services sector inflation, which will be most impacted by wage growth,'' the analysts at Rabobank argued.
GBP/USD technical analysis
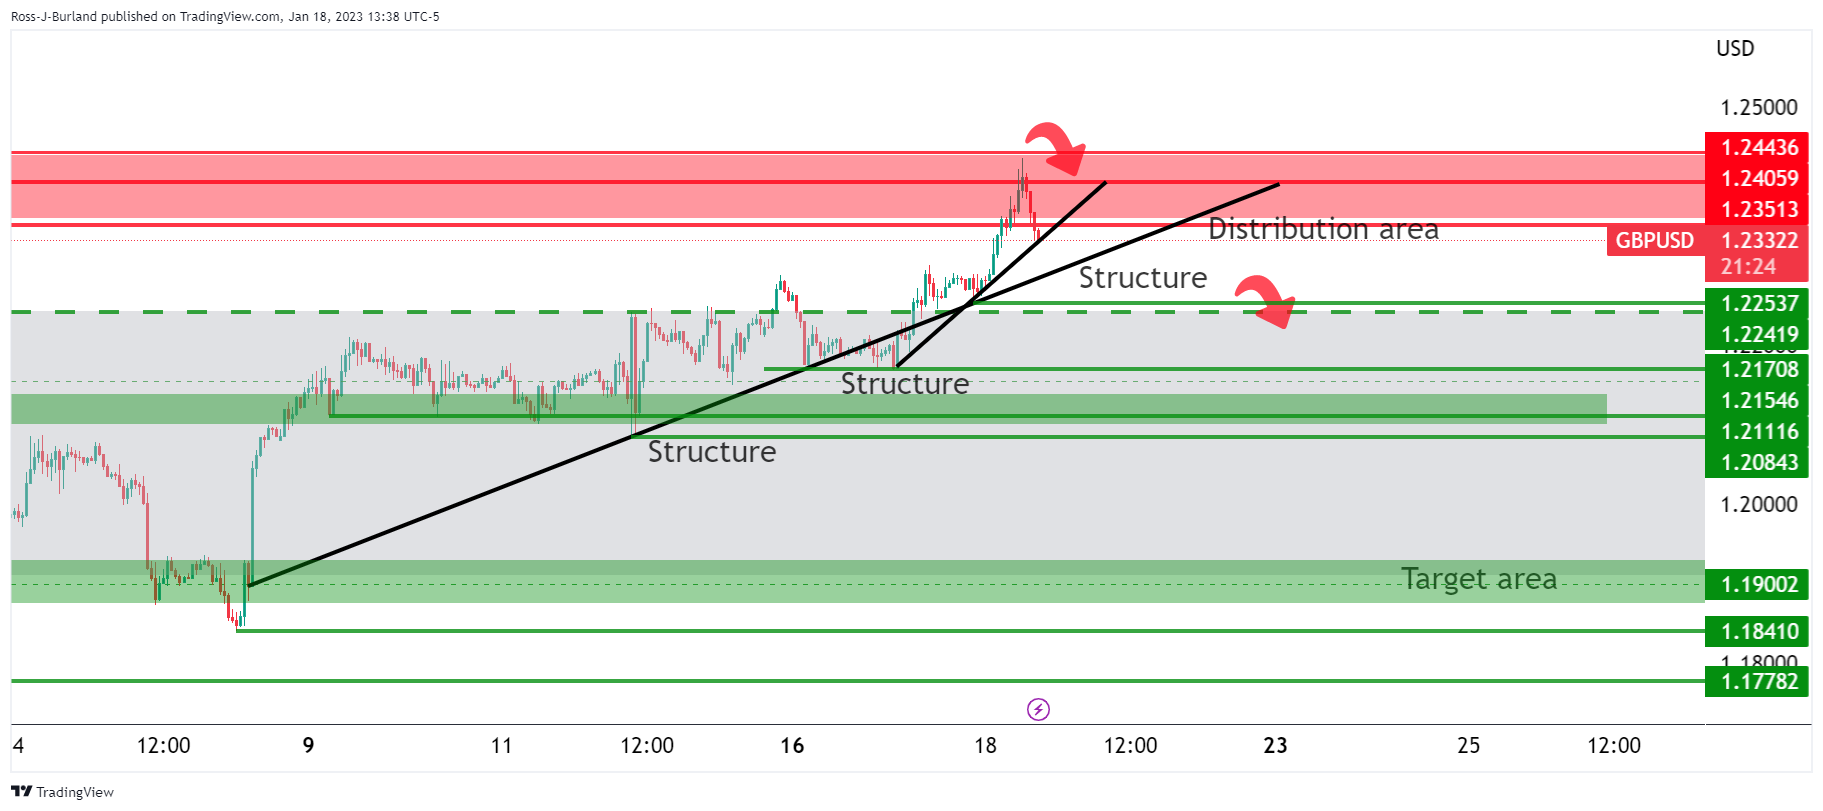
On the hourly time frame, it was noted yesterday that GBP/USD's micro-trendline support guarded structure around 1.2250. A break there was explained to be a key development if it occurred, as it would open the risk of a blow-off in GBP/USD to test 1.2170 and then 1.2080 structure.
GBP/USD update
As seen, the GBP/USD price has indeed broken the micro trendline. It is perfectly natural for the subsequent price action, as a function of the market, to eat into prior highs and that is what we are seeing: mitigation of price imbalances left behind:
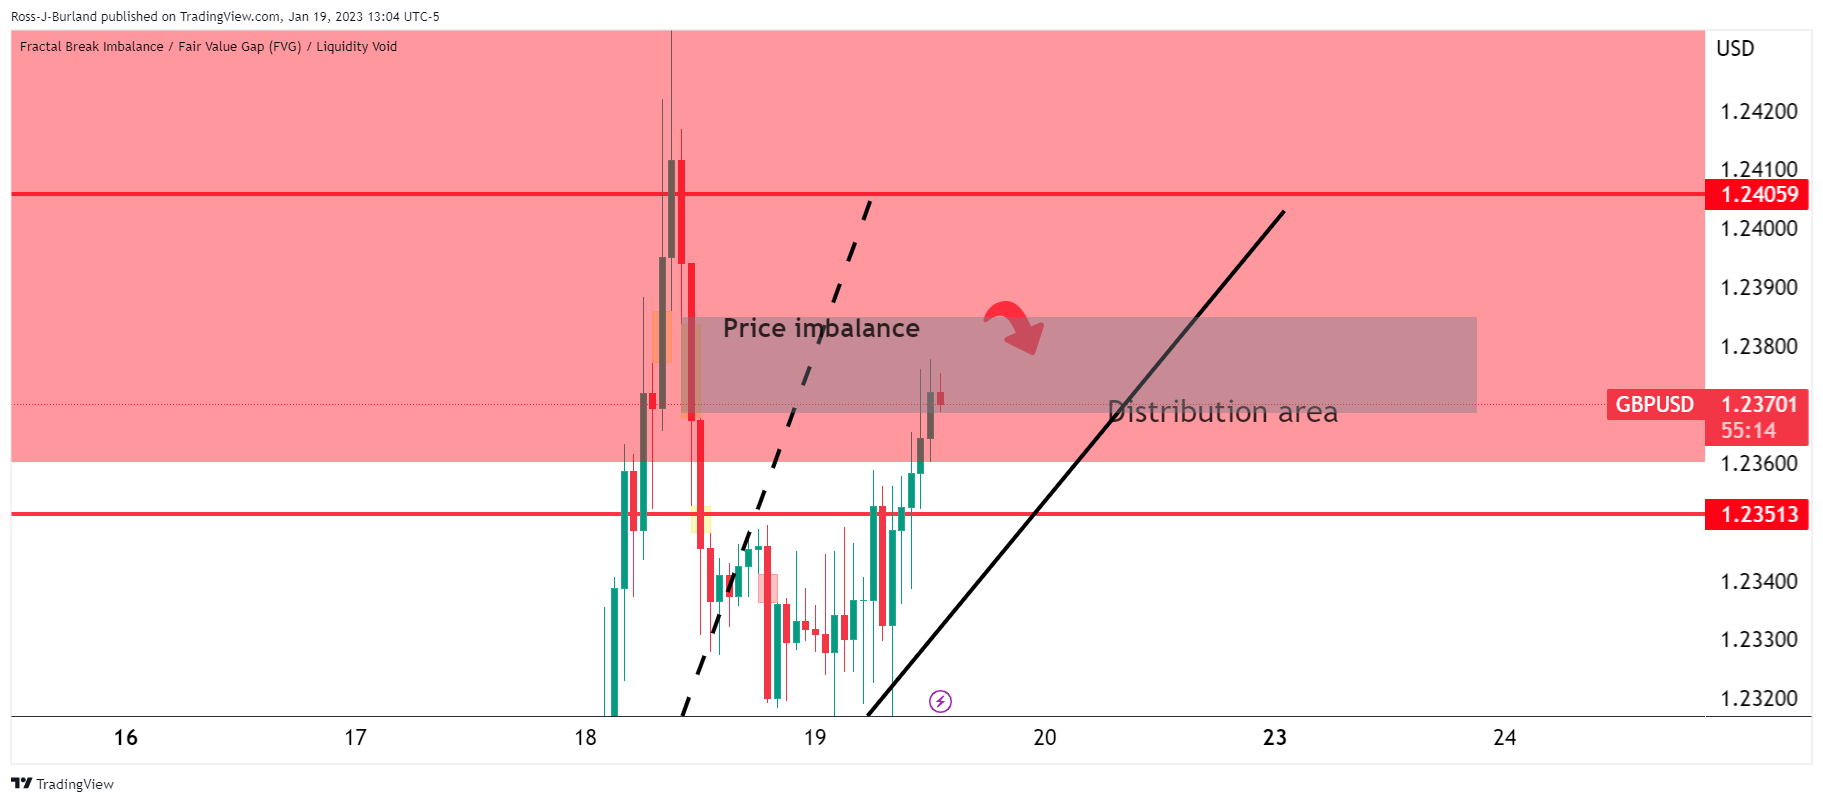
Therefore, the technical bias for GBP/USD remains bearish while below 1.2400.
- AUD/USD failed to gain traction on rising US recession fears and poor Ausslie’s employment data.
- US Initial Jobless Claims were better than expected, cushioning the US Dollar fall.
- RBA’s odds for a rate hike lie around 60%, while 40% expects no change to its monetary policy.
AUD/USD slides for the second consecutive day, registering a new weekly low of 0.6871 due to a risk-off impulse spurred by recession worries mounting after US economic data, indeed showed the economy is slowing. Hawkish Fed commentary spooked investors, who flew to safety. At the time of writing, the AUD/USD is trading at 0.6901, below its opening price by 0.61%.
Growing concerns in the US, a headwind for the AUD/USD
The AUD/USD continues to weaken, even though the US Dollar (USD), remains offered across the board. Wednesday’s inflation data in the United States (US) cooled down, reflecting the tightening monetary conditions imposed by the US Federal Reserve (Fed). However, consumers are feeling the effects, as Retail Sales plunged on a monthly basis, while Industrial Production (IP) fell for the second straight month.
Thursday’s US economic docket witnessed unemployment claims rising by 190,000, 24,000 below expectations, while the Continuing Claims edged lower. At the same time, Housing Starts and Building Permits missed estimates, while the Philadelphia Fed Manufacturing Index, although in contractionary territory at -8.9, improved compared to November’s -13.7 reading.
The US Dollar Index, a measure of the buck against a basket of peers, extended its losses for two straight days, sliding 0.24% to 102.165. Nevertheless, a late recovery in US Treasury yields, namely the 10-year bond rate, climbs four bps at 3.411%, a headwind for the AUD/USD.
On the Australian side, employment figures unexpectedly fell in December, a headwind for the Aussie (AUD). Money market futures imply a 60% probability for the Reserve Bank of Australia (RBA) to lift rates in February, but there’s also a 40% chance the RBA will pause, given rates have risen by 300 bps.
What to watch?
An absent Australian economic docket will leave AUD/USD traders leaning on US Dollar dynamics. The US calendar will feature Existing Home Sales alongside Fed speaking.
AUD/USD Key Technical Level
- The USD/JPY daily chart is bearish biased, though it remains unable to extend its losses beneath 128.00
- The USD/JPY is trading sideways in the near term, awaiting a break above/below 129.00/128.00.
On Thursday, the USD/JPY fails to hold to its gains and trades beneath its opening price by 0.33% after hitting a daily high of 128.88. At the time of writing, the USD/JPY exchanges hand at 128.40, amidst a risk-off impulse and a soft US Dollar (USD).
USD/JPY Price Analysis: Technical outlook
Failure to crack the 20-day Exponential Moving Average (EMA) at 131.13 exposed the USD/JPY to selling pressure. In addition, price action dived back below a three-month-old downslope resistance trendline, which tracks the USD/JPY downtrend. Therefore, the path of least resistance is downwards, but a decisive break below the YTD low of 127.21 is needed, so the USD/JPY might get poised towards the May 24 daily low of 126.36.
Short term, the USD/JPY 4-hour chart suggests the pair as range bound, although the Relative Strength Index (RSI) is at bearish territory. The Rate of Change (RoC) shows buyers gathering momentum. Hence, mixed signals surrounding the USD/JPY pair might refrain traders from opening fresh positions unless a decisive break is achieved.
The USD/JPY key resistance levels are 129.00, the daily pivot at 129.33, and the 50-EMA at 129.60. On the other hand, the USD/JPY first support would be 128.00, followed by the January 18 daily low of 127.55, ahead of 127.00.
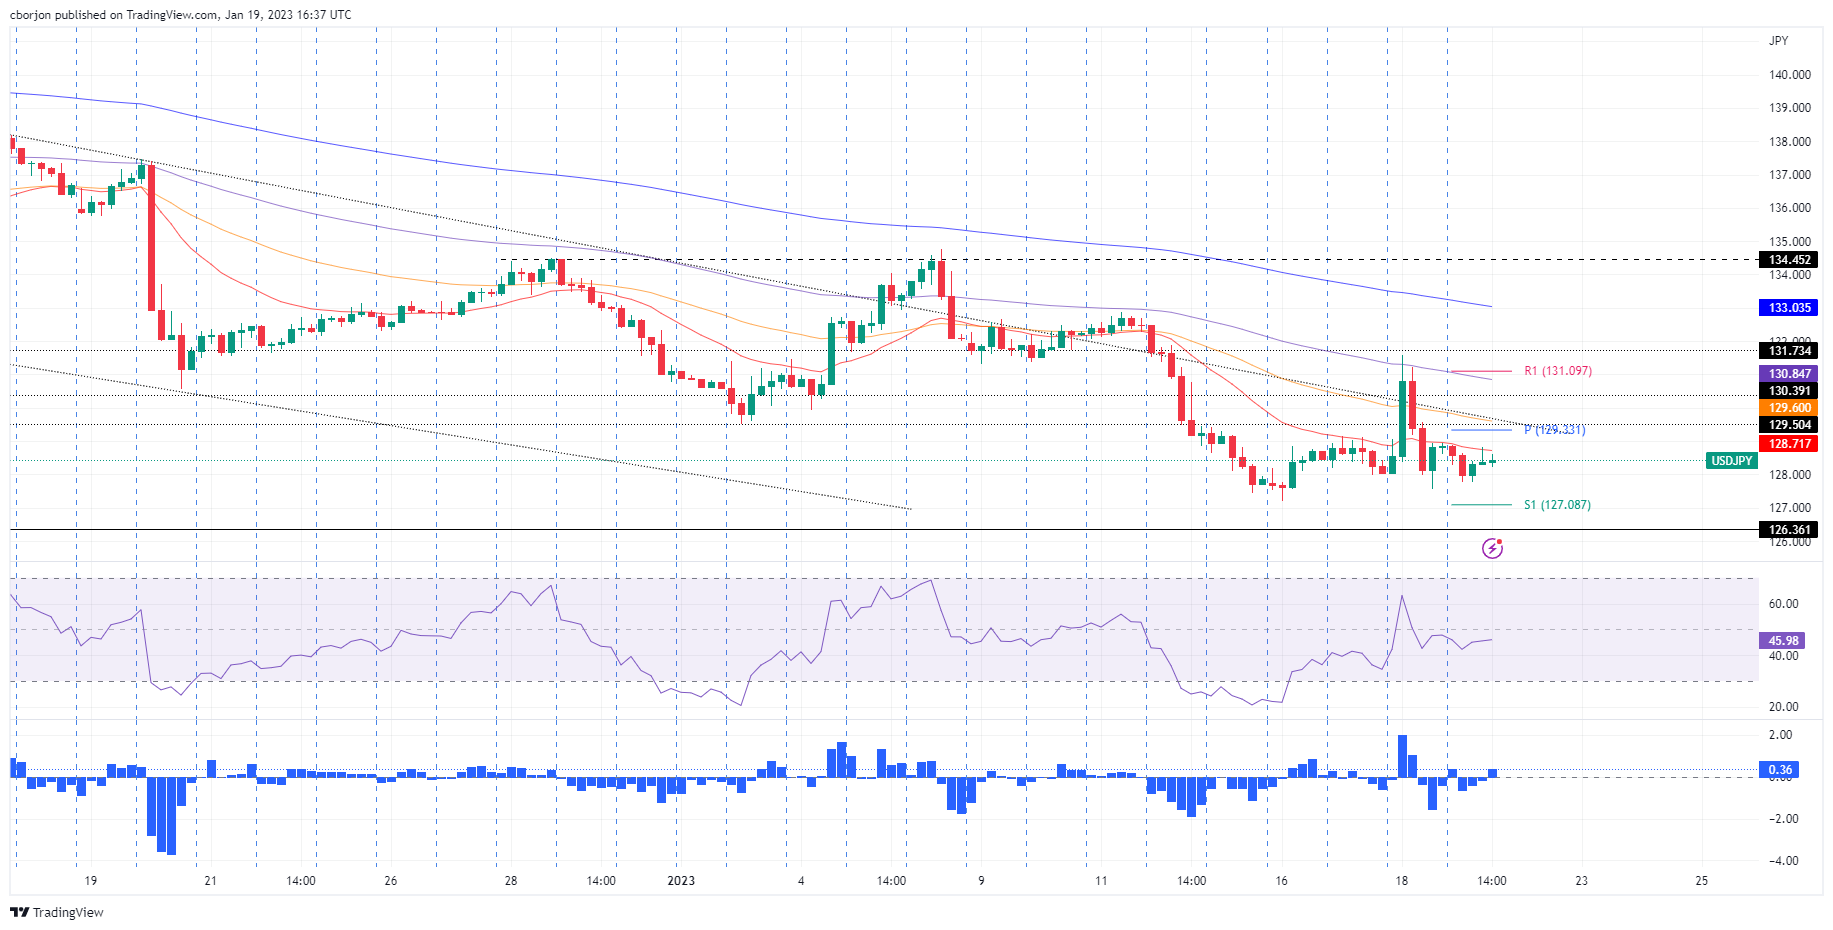
USD/JPY Key Technical Levels
The decade-long bull market in the US Dollar may be leveling off, but economists at Charles Schwab do not anticipate a major bear market in 2023.
Further narrowing in the yield gap in early 2023
“For the Dollar in 2023, we look for further downside in the near term, but expect it to stabilize by mid-year.”
“With the pace of Fed tightening likely to slow, the Dollar has room to retreat further in early 2023 should central bank policies become more aligned.”
“A reasonable target would be the average of the range that prevailed prior to the pandemic, or about 3% to 5% lower.”
- Mexican Peso remains under pressure versus the US Dollar
- USD/MXN tests levels above 19.00, up 2.5% from Wednesday’s low.
The USD/MXN is trading slightly above 19.00, looking at the weekly high it hit earlier on Thursday at 19.05. The pair resume the upside after a brief pullback to 18.89. On Wednesday, it traded as low as 18.56, the lowest since February 2020.
The Mexican Peso has been unable to benefit from the rebound in commodity prices. At the same time, the US Dollar remains firm supported by economic data and higher US yields.
New data, the old debate and a new member for Banxico
Economic data released on Thursday in the US came in above expectations (Initial Jobless Claims and Philly Fed) and helped market sentiment. Still, Wall Street's indexes are in red. Emerging market currencies remain under pressure, extending the correction from multi-day highs. The rebound in commodity prices on Thursday is being offset by higher US yields.
The US hit the debt limit and the Treasury started to implement special measures to avoid a default. The debate on raising the debt ceiling at Congress is set to be complex as Republicans hold the House and Democrats the Senate.
In Mexico, Congress voted to confirm Omar Mejía, the government’s nominee for the Bank of Mexico for an eight-year period. Relatively unknown to market participants prior to his nomination, Mejía’s first vote at the board will be at the next meeting February 9. He backed the current interest rate hike cycle and promised transparency and independence.
USD/MXN technical outlook
The USD/MXN is staging a solid rebound. Technical indicators are turning to the upside in the daily chart. Price still remains below the 20-day Simple Moving Average that awaits at 19.17. If the pair manages to break and hold above 19.00/05, the next strong barrier emerges at 19.30.
A slide back to 18.80 would be seen as a normal correction to the recent rally. If it drops below, the Mexican Peso would recover some strength.
USD/MXN daily chart
-638097403631248783.png)
ECB’s Governing Council (GC) is determined to deliver considerable further rate hikes, economists at Nordea report.
Firmly on a road of further 50 bps rate hikes
“We think the ECB continues to be determined to deliver further several 50 bps rate hikes.”
“Market pricing of rate cuts looks quite aggressive compared to the ECB’s current thinking.”
“Risks tilted towards the ECB proceeding faster in reducing its bond holdings.”
See: Euro to come under pressure if inflation not ease back to target lower rate levels by summer – Commerzbank
AUD is no longer the best performing G10 currency in the year to date, as it was just a few days ago. Economists at Rabobank believe that the AUD/USD pair could drop to the 0.67 mark over the next quarter before recovering later in the year.
Australian economy will avoid recession this year
“We see risks that AUD/USD could dip back to the 0.67 level on a three-month view on a combination of US recession concerns, a still hawkish Fed and expectations that the RBA is close to a peak in policy. However, on the expectation that the Australian economy will avoid recession this year we expect AUD/USD to find support and edge higher again in the second half of the year.”
“We forecast a move to 0.71 in 12 months.”
- Gold buyers stepped in around $1901 and lifted the yellow metal amidst an offered US Dollar.
- Weak US economic data revealed on Wednesday increased the likelihood of a US recession.
- Sentiment remains dampened, although US unemployment claims edged lower.
- Federal Reserve officials continued to express the need to lift rates above 5%.
Gold price snaps two days of losses and grinds higher on Thursday, lifted by a weak US Dollar (USD) and a dampened market mood, as Wall Street opened with losses. Soft US economic data released on Wednesday sounded the alarms of an upcoming recession amidst a high inflation environment. Therefore, the XAU/USD is trading at 1921.54, above its opening price by 0.95%.
Gold rises after US economic data and weakening USD
Before the US cash equity markets opened, the US Department of Labor revealed that Initial Jobless Claims for the week ending January 14 rose by 190K, less than the 214K estimated. The same report updated Continuing Jobless Claims rising to 1647K beneath the 1660K foreseen. At the same time, Building Permits dropped less than estimates, and the percentage change compared to November’s -10.6%, improved to -1.6%.
Staying in the US housing market data, Housing Starts slid to -1.4%, less than November’s -1.8% contraction. Aside from this, the Philadelphia Fed Manufacturing Index in the US rose to -8.9 in January from a revised -13.7 plunge in December. The report showed that more than 33% of the firms reported declines in activity.
Elsewhere, the US Dollar Index, a gauge of the buck’s value against a basket of G7 currencies, slides 0.17%, down at 102.239, while US bond yields recover some ground. The 10-year benchmark note rate sits at 3.397%, up two bps.
Money market futures traders are pricing in a 25 bps rate hike at the Federal Reserve’s January 31-February 1 meeting.
Despite softer-than-expected US economic data revealed on Wednesday, with Retail Sales plunging and Industrial Production nosediving, nevertheless, Fed officials stayed the course, vocal about lifting rates at least to the 5% threshold.
On Thursday, Boston Fed President Susan Collins said that it was appropriate to slow the pace of rate increases, though she emphasized its need to move above 5% and be held around for “some time.”
Gold Technical Analysis
XAU/USD daily chart supports the thesis of higher Gold prices. But buyers need to decisively clear the January 16 swing high of $1928 if they want to climb toward $2000. Once XAU/USD clears the former, that would pave the way to a $1958.April 20 swing high, ahead of the $2000 figure. Otherwise, a correction to $1900 is on the cards.
The recent GBP underperformance is largely due to a less hawkish BoE and sluggish domestic activity data but its underperformance is unlikely to continue in the light of a rebound in global risk sentiment and improving domestic dynamics, economists at HSBC report.
GBP to benefit from the UK’s improving external balance
“With inflation in the UK having likely peaked and potentially set to decelerate more than consensus expects, a less aggressive tightening tone from the BoE now may mean a less abrupt turn of stance later in the year, which may end up becoming a marginal positive for the GBP in the months ahead. A shift towards better-than-expected domestic data should also be positive for the GBP.”
“The UK’s external rebalancing continues at pace, due to the combination of a cheaper currency and higher interest rates. Indeed, the UK’s trade balance for 3Q22 showed the narrowest deficit since December 2021. This may bode well for the GBP.”
“GBP has a very strong tie to global risk appetite in recent years. A bottoming out in global growth dynamics (compared to excessively pessimistic expectations), as well as a peak in global interest rates on the back of softening inflation pressure could allow the GBP to strengthen against the USD in an environment where risk appetite looks less febrile.”
- US economic data helped risk appetite and the New Zealand Dollar on Thursday.
- Wall Street is in red after the opening but off lows, commodities rebound.
- NZD/USD attempts to regain 0.6400, still negative for the day.
- NZ Prime Minister Jacinda Arden is to step down.
The NZD/USD rebounded from the lowest level since last Friday and climbed to 0.6402, supported by an improvement in market sentiment following the release of better-than-expected US economic data. The New Zealand Dollar is still down for the day, unaffected by the resignation of NZ PM Jacinda Ardens.
Positive economic news from the US
Thursday is proving to be a different day than Wednesday when Retail Sales and Industrial Production reports showed larger-than-expected declines for December. Data released on Thursday came in mostly above expectations. Initial Jobless Claims fell below 200K to the lowest level in four months. The Philly Fed rose more from -13.7 to -8.9.
Wall Street in red, but sentiment improves
The economic figures helped the US Dollar but also risk appetite that ended up weighing more on the Greenback, pushing NZD/USD away from the lows. Equity prices in Wall Street are still down but off lows, falling on average 0.50%. Crude Oil and Gold are rising by around 0.54%.
Politics in New Zealand
New Zealand Prime Minister Jacinda Ardern announced her term would end by February 7. She “does not have the energy” to seek re-election in the general elections that will take place on October 14. A new leader will be voted in a few days. The announcement had little impact on the Kiwi. The NZ main stock index fell 0.28%.
Volatility in AUD/NZD
The AUD/NZD bottomed during the Asian session at 1.0735 following the weaker-than-expected Australian employment report and then rebounded and turned positive for the day. It is back above 1.0800.
NZD/USD technical outlook
The NZD/USD is looking to trade back in the range with support at 0.6330/50 and resistance at 0.6410/20, after the retreat from the multi-month high it reached on Wednesday at 0.6529. The bias is still to the upside, as it holds above the 20-day Simple Moving Average that stands at 0.6335.
A firm daily close above 0.6450 should point to a test of the recent top and toward more gains. If NZD/USD is unable to do so in the short term, a deeper correction seems likely.
Technical levels
If the energy crisis is really over, there is a long way for the Euro to rise, according to economists at Société Générale.
EUR/USD can get close to 1.20
“Our end-2022 forecast for EUR/USD is 1.12, and we’re conscious that the currency is rising much faster than expected. If we could get our heads properly around the idea that the energy crisis is over despite the war in Ukraine rumbling on and Russian gas flows to Europe having largely dried up, we’d need to raise the forecast to around 1.20.”
“No need for a risk premium due to the fragility of gas supplies? No doubts that the global LNG market can grow in time for next winter? Take out those concerns and European recession risks melt away, leaving all the focus on the ECB.”
Gold price hit levels last seen in April 2022 above $1,900. Economists at ANZ bank believe that the yellow metal has a bright outlook in the year ahead.
Central bank purchases of Gold are likely to continue
“A deteriorating economic outlook will add to safe-haven demand for Fold. Geopolitical risks are also likely to remain elevated for the second year, encouraging investors to hedge.”
“We expect jewellery demand to grow 4% YoY, surpassing 2021he prospects for physical demand have also improved. As China’s economic activity normalises in the aftermath of its reopening, consumer demand for Fold is likely to rebound. India is relatively well positioned, underpinning jewellery demand. We levels.”
“Central bank purchases of Gold are likely to continue, albeit at a slower pace from record purchases this year. Elevated geopolitical risks, trade tensions and currency risks will continue to prompt them to diversify their foreign reserves into Gold.”
- EUR/USD meets initial hurdle near 1.0840 on Thursday.
- ECB Accounts showed members initially favoured a 75 bps rate hike.
- The US Philly Fed Index improved to -8.9 in January.
Bulls remain in control of the sentiment around the single currency, with EUR/USD charting decent gains above the 1.0800 mark as the European session draws to a close on Thursday.
EUR/USD: Weekly performance capped near 1.0890
EUR/USD adds to Wednesday’s small advance and manages well to keep business above 1.0800 the figure so far on Thursday.
Indeed, the selling interest around the greenback allows the continuation of the improvement in the risk complex and helps with the pair’s upside bias, while hawkish ECB-speak also props up the march north in spot.
From the ECB, the Accounts of the latest meeting showed an initial attempt to hike rates by 75 bps and some participants advocated for a quicker reduction of the APP.
In the US calendar, Building Permits contracted 1.6% MoM in December and Housing Starts shrank at a monthly 1.4%. Additionally, Initial Claims went up by 190K in the week to January 14 and the Philly Fed Manufacturing Index improved to -8.9 for the current month.
What to look for around EUR
EUR/USD bounces off recent lows in the 1.0770/65 band and manages to regain the 1.0800 mark and beyond amidst the better mood in the risk-associated universe.
Price action around the European currency should continue to closely follow dollar dynamics, as well as the impact of the energy crisis on the euro bloc and the Fed-ECB divergence.
Back to the euro area, the increasing speculation of a potential recession in the bloc emerges as an important domestic headwind facing the euro in the short-term horizon.
Key events in the euro area this week: ECB Lagarde, ECB Accounts (Thursday) - ECB Lagarde (Friday).
Eminent issues on the back boiler: Continuation of the ECB hiking cycle amidst diminishing probability of a recession in the region. Impact of the war in Ukraine and the protracted energy crisis on the bloc’s growth prospects and inflation outlook. Risks of inflation becoming entrenched.
EUR/USD levels to watch
So far, the pair is gaining 0.25% at 1.0821 and faces the next up barrier at 1.0887 (monthly high January 18) followed by 1.0900 (round level) and finally 1.0936 (weekly high April 21 2022). On the flip side, the breakdown of 1.0766 (weekly low January 17) would target 1.0513 (55-day SMA) en route to 1.0481 (monthly low January 6).
EUR/USD rebounds from sub-1.08 levels. Economists at Scotiabank note ongoing upside risks.
Support looks pretty solid in the upper 1.07s
“The EUR has run into solid resistance in the upper 1.08s on a number of occasions in the past week but losses remain limited and the short-term charts continue to suggest a consolidation (bull flag) ahead of another push higher.”
“Trend intensity signals remain bullishly aligned for the EUR across a range of timeframes which should serve to sustain this situation (i.e., limited EUR losses and ongoing upside risks).”
“The charts suggest firm support on minor dips to the upper 1.07s and ongoing upside pressure for gains towards 1.1000/50.”
- USD/CAD retreats from over a one-week high and is pressured by a combination of factors.
- A modest uptick in crude oil prices underpins the Loonie and acts as a headwind for the pair.
- The USD remains on the defensive amid bets for smaller Fed rate hikes and exerts pressure.
- The prevalent risk-off mood could lend support to the safe-haven buck and help limit losses.
The USD/CAD pair edges lower during the early North American session and drops to a fresh daily low, around the 1.3480-1.3475 region in the last hour.
The US Dollar continues to be weighed down by expectations for a less aggressive policy tightening by the Fed and acts as a headwind for the USD/CAD pair. In fact, investors now seem convinced that the US central bank will soften its hawkish stance and the current market pricing indicates a greater chance of a smaller 25 bps rate hike in February.
Apart from this, a modest bounce in oil prices underpins the commodity-linked Loonie and further contributes to capping the upside for the USD/CAD pair. The USD bulls, meanwhile, seem unimpressed by the better-than-expected release of the Philly Fed Manufacturing Index and Weekly Initial Jobless Claims, which does little to provide any impetus.
That said, worries about a deeper global economic downturn might continue to keep a lid on the black liquid. Apart from this, a fresh wave of the global risk-aversion trade - as depicted by a sea of red across the global equity markets - could lend some support to the safe-haven buck and the USD/CAD pair, warranting caution for bearish traders.
From a technical perspective, spot prices, so far, have struggled to find acceptance above the 1.3500 psychological mark or build on the momentum beyond the 100-day SMA. This makes it prudent to wait for strong follow-through buying before placing fresh bullish bets around the USD/CAD pair and positioning for any further appreciating move.
Technical levels to watch
Markets Strategist at UOB Group Quek Ser Leang suggests further losses lie ahead for USD/CNH in the short term.
Key Quotes
“… when USD/CNH was trading at 6.8900, we noted that ‘the rapid pace of drop suggests USD/CNH could break both 6.8400 and the 55-week exponential moving average (currently at 6.8240)’.”
“While our view was correct, we did not quite expect the steep selloff as USD/CNH plunged below both 6.8400 and 6.8240 and nosedived to a low of 6.7045 last week before extending its decline to 6.6982 yesterday (16 Jan). It is worth noting that on a 2-week basis, USD/CNH lost a whopping 1.71% last Friday, the biggest 2-week drop on record.”
“Further USD/CNH weakness is not ruled out but after such a sharp drop over a short time, the risk is for USD/CNH to consolidate first before heading lower at a later stage. Even if USD/CNH were to weaken further, the pace of any decline is likely to be slower especially when there are several strong support levels between 6.5730 and 6.6670. Resistance-wise, a breach of 6.8550 would indicate that the sharp drop in USD/CNH over the past few weeks has stabilized.”
- Housing Starts and Building Permits in the US declined in December.
- The US Dollar Index stays on the defensive around the 102.00 mark.
The monthly data published by the US Census Bureau revealed on Thursday showed that Housing Starts declined by 1.4% on a monthly basis in December following November’s 1.8% drop.
In the same period, Building Permits fell by 1.6% as compared to the 10.6% fall recorded in November.
Market reaction
The data does little to impress the US Dollar bulls amid growing acceptance that the Fed will soften its hawkish stance and rising bets for a smaller 25 bps rate hike in February.
- Initial Jobless Claims in the US declined by 15,000 last week.
- The US Dollar Index stays on the defensive near 102.00.
There were 190,000 initial jobless claims in the week ending January 13, data published by the US Department of Labor (DOL) showed on Thursday. This print followed the previous week's print of 205,000 and came in better than the market expectation of 214,000.
Further details of the publication revealed that the 4-week moving average was 206K, a decrease of 6,500 from the previous week's average of 212.5K
Market reaction
The US Dollar Index continues with its struggle to gain any meaningful traction and remains on the defensive around the 102.00 mark amid rising bets for smaller Fed rate hikes.
- Philly Fed Manufacturing Index improved modestly in January.
- The US Dollar fails to gain any respite and remains depressed.
The Federal Reserve Bank of Philadelphia's Manufacturing Business Outlook Survey's diffusion index for current general activity improves to -8.9 in January from -13.8 in December. This print comes in better than market expectations, though does little to provide any meaningful impetus.
Market reaction
The US Dollar remains on the defensive amid rising bets for a less aggressive policy tightening by the Fed, though a fresh wave of the global risk-aversion trade helps limit the downside.
The Canadian Dollar cannot avoid pull from stock market trends, accrodign to strategists at Scotiabank.
Firm resistance at 1.3520, losses limited to 1.3490
“Weak stocks suggest limited potential for the CAD to recover at the moment.”
“The USD rise has run into firm resistance at 1.3520, with losses limited to 1.3490; a move either side of this range will determine short-term gains or losses (of 30-40 pips) but might also point towards either a return to the 1.36 area or a drop back to the low 1.34s.”
- GBP/USD struggles to gain any meaningful traction and oscillates in a range on Thursday.
- Recession fears weigh on investors’ sentiment and benefit the greenback, capping gains.
- The prospects for more BoE rate hikes underpin the British Pound and acts as a tailwind.
The GBP/USD pair finds some support ahead of the 1.2300 round figure on Thursday and for now, seems to have stalled the previous day's pullback from its highest level since December 14. The pair, however, struggles to gain any meaningful traction and remains confined in a range below mid-1.2300s through the mid-European session.
A fresh wave of the global risk-aversion trade - amid rising fears of a potential recession - benefits the US Dollar's relative safe-haven status and caps the upside for the GBP/USD pair. Investors remain concerned about headwinds stemming from the worst COVID-19 outbreak in China and the protracted Russia-Ukraine war. Adding to this, the weaker US macro data released on Wednesday further fuels worries about a deeper global economic downturn and take its toll on the risk sentiment.
The USD bulls, however, remain on the defensive amid firming expectations for a less aggressive policy tightening by the Fed. In fact, the markets now seem convinced that the US central bank will soften its hawkish stance and have been pricing in a smaller 25 bps rate hike in February. This leads to a further decline in the US Treasury bond yields and weighs on the buck. Furthermore, speculations that the Bank of England will stick to a more hawkish stance extends support to the GBP/USD pair.
Investors expect the UK central bank to continue raising interest rates to combat stubbornly high inflation. The bets were lifted by the stronger wage growth data released on Tuesday, which could keep inflation elevated. Furthermore, the headline UK CPI - though fell to a three-month low in December - is still running at levels last seen in the early 1980s. This might continue to act as a tailwind for the British Pound and supports prospects for a further appreciating move for the GBP/USD pair.
Next on tap is the US economic docket, featuring the release of the Philly Fed Manufacturing Index, the usual Weekly Initial Jobless Claims and housing market data. This, along with speeches by influential FOMC members, the US bond yields and the broader risk sentiment, will drive the USD demand and provide some impetus to the GBP/USD pair. Nevertheless, the fundamental backdrop favours bulls, suggesting that any pullback could attract fresh buyers and remain limited.
Technical levels to watch
GBP/USD is expected to remain below the 1.2445/47 December highs for now, in the view of analysts at Credit Suisse.
Support seen at 1.2204, then 1.2169
“We maintain our view that the 1.2245/47 December high is likely to remain a tough barrier and we thus continue to look for this to cap for now, even if the broader trend is still seen higher.”
“Support stays seen at 1.2301/1.2291 initially, then the 13-day exponential average at 1.2204.”
“A close below 1.2169 remains needed to ease the immediate upside bias to clear the way for a retest of support at 1.2099/89, with the 55-day average now at 1.2045.”
“Resistance is seen at 1.2355, then 1.2417. An eventual break above 1.2447 should see strength extend to 1.2668/1.2758 – the May 2022 high and 61.8% retracement of the 2021/22 fall.”
Fall in the December inflation is the beginning of a sign that a corner has been turned, notes Bank of England (BoE) Governor Andrew Bailey.
Key quotes:
The most likely outcome is that inflation will fall quite rapidly this year, probably starting in the late spring.
There is more optimism now that we are going to get through the next year with an easier path on inflation.
We don’t target a particular peak for rates.
I am not endorsing a 4.5% bank rate peak, but in December is that we did not include the comment about the market being in our view rather out of line
We think there will be a recession.
The recession will be a shallow one by historic standards.
The labour force has shrunk, and that is putting pressure on the labour market.
Below are key highlights from the European Central Bank (ECB) Monetary Policy Meeting Accounts released earlier this Thursday.
Key points:
A large number of members initially expressed a preference for increasing the key ECB interest rates by 75 basis points.
Raising interest rates by less than 75 basis points would send the wrong message and risk being perceived as inconsistent with the 2% inflation target, some argued.
Concern was therefore expressed as to how domestic demand would hold up.
A broad majority of members supported Mr Lane’s proposal to raise the key ECB interest rates by 50 basis points.
A smaller output gap would be more consistent with the observed strong dynamics of core inflation.
A compromise was in some ways seen as broadly equivalent to raising rates by 75 basis points at the present meeting.
The steadiness of rate hikes and the time over which interest rates remained in restrictive territory mattered more.
The recent strengthening of the Euro constituted a noteworthy change in the external environment and would likely imply somewhat lower inflationary pressures for the euro area in the period ahead.
An increase of 50 basis points at the current meeting would allow the governing council to tighten monetary policy over a longer period.
The current projection for 2025 could therefore be seen as not significantly different from 2%.
It was also felt that the risks to the baseline inflation projections could be assessed as more balanced in the medium run.
Some held out for 75 bps.
Some members expressed a preference for reducing the APP portfolio at a faster pace.
Members, overall, assessed that the risks to the inflation outlook were primarily on the upside.
A reversal of this downward shift in market pricing was called for.
AUD/USD is testing 0.6894/6720, which analysts at Credit Suisse look to hold to keep the risk skewed higher for a retest of retracement resistance at 0.7089/92.
Stable close below 0.6821 to trigger more neutral and choppy trading
“Despite the setback, medium-term momentum is still rising and the breakout remains intact and we, therefore, stick with our bullish bias whilst the market holds above the 0.6894/21 zone. With that in mind, a quick move back above 0.6948 is needed to ease yesterday’s bearish pressure and pave the way for a retest of 0.7063 yesterday’s high, though with the key resistance zone seen not far above at 0.7089/7138.”
“Only a stable close below the 200DMA at 0.6821 would speak in favor of a more neutral and choppy trading environment, with next support below seen at the 55DMA at 0.6749 and then at 0.6721.”
- EUR/USD reclaims the 1.0800 area and above after dropping to 1.0770.
- Immediately to the upside now emerges the 2022 peak at 1.0887.
EUR/USD adds to Wednesday’s uptick and manages to retake the area above the key 1.0800 barrier on Thursday.
It seems the pair is moving within a range bound theme ahead of the potential resumption of the uptrend. Against that, the immediate resistance level comes at the so far YTD high at 1.0887 (January 18). Once cleared, it could lead up to a probable visit to the round level at 1.0900 in the relatively short-term horizon.
Furthermore, while above the short-term support line near 1.0610, extra gains should remain in store.
In the longer run, the constructive view remains unchanged while above the 200-day SMA at 1.0307.
EUR/USD daily chart
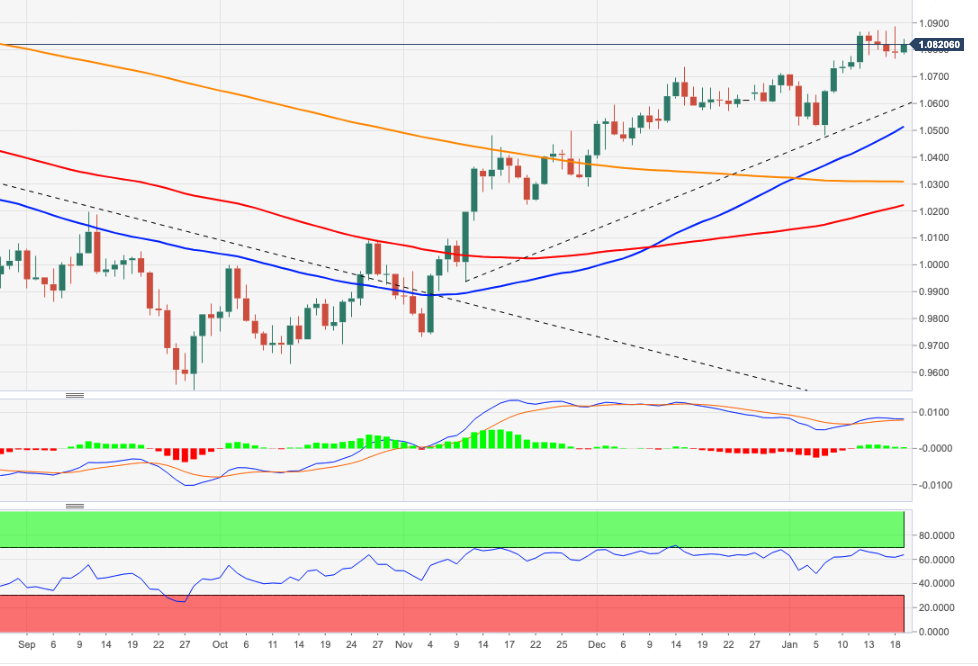
- AUD/USD continues to lose ground for the second successive day and dives to a one-week low.
- Recession fears weigh on investors' sentiment and drive flows away from the risk-sensitive Aussie.
- Bets for smaller Fed rate hikes continue to undermine the USD, albeit do little to lend support.
The AUD/USD pair extends the overnight sharp pullback from the 0.7060-0.7065 area, or its highest level since August 16 and remains under heavy selling pressure for the second straight day on Thursday. The downward trajectory remains uninterrupted through the mid-European session and drags spot prices to a one-week low, around the 0.6875 region in the last hour.
The prevalent risk-off environment - as depicted by a sea of red across the equity markets - is seen as a key factor driving flows away from the risk-sensitive Aussie. The weaker US macro data released on Wednesday comes on the back of concerns about economic headwinds stemming from the worst yet COVID-19 outbreak in China. This, in turn, fuels recession fears and take its toll on the global risk sentiment.
The AUD/USD bulls, meanwhile, fail to gain respite from a weaker US Dollar, which remains depressed amid expectations for a less aggressive policy tightening by the Fed. In fact, the markets now seem convinced that the US central bank will soften its stance and deliver a smaller 25 bps rate hike in February. This leads to a further decline in the US Treasury bond yields and undermines the greenback.
Thursday's downfall could further be attributed to some technical selling below the 0.6935 horizontal support. A subsequent break below the 0.6900 mark is seen as a fresh trigger for bearish traders and supports prospects for additional losses. Market participants now look forward to the US economic docket, which, along with the broader risk sentiment, should provide some impetus to the AUD/USD pair.
Technical levels to watch
Norges Bank stands pat. Economists at Commerzbank expect only a moderate appreciation of the NOK.
End of the hiking cycle in sight?
“Norges Bank left the key interest rate unchanged at 2.75% in January but continues to signal a further step in March. However, the end of the interest rate cycle is slowly coming into sight.”
“The NOK should appreciate thanks to sustained high energy prices. But as Norges Bank is slowly coming to the end of its interest rate cycle, the NOK recovery should be slow and will be characterized by setbacks time and again.”
- The index remains within the consolidative theme in the low-102.00s.
- The breach of the YTD low at 101.77 could open the door to further decline.
The index navigates within a narrow range just above the 102.00 mark on Thursday.
So far, the continuation of the side-lined mood looks the most likely scenario for the dollar in the very near term. In case bears regain the upper hand, the loss of the January low at 101.77 (January 16) should put a potential deeper drop to the May 2022 low around 101.30 (May 30) back on the investors’ radar prior to the psychological 100.00 level.
In the meantime, while below the 200-day SMA at 106.44 the outlook for DXY should remain tilted to the negative side.
DXY daily chart
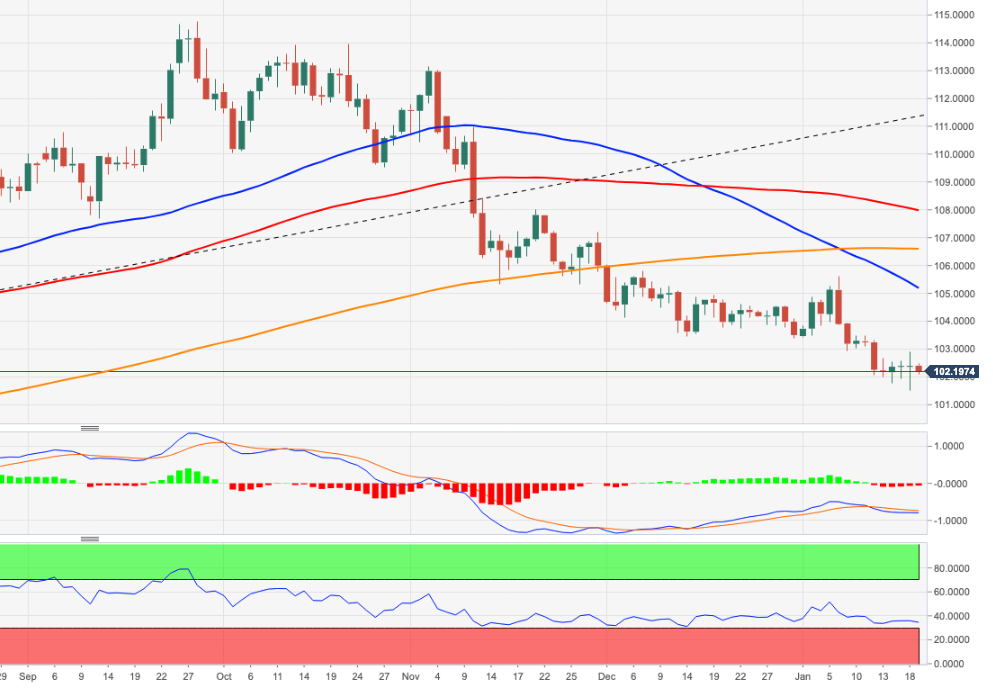
The Dollar has been falling against everything. Kit Juckes, Chief Global FX Strategist at Société Générale, pens his view on the FX market for the day ahead.
Best to sell the Dollar against EUR, CHF and JPY for now
“If you want to sell the Dollar, EUR, CHF, JPY are a better bet today than NOK, AUD (down more than softish jobs data warrant today), or Latam currencies.”
“Yen is rallying amid speculation that the YCC range won’t be adjusted in the months ahead. This move may need the bond market to join in, to take USD/JPY to new lows, but my underlying view – that the cat’s out of the bag, YCC is doomed, and the yen will be volatile but stronger over time – is unchanged.”
“EUR/USD may test the topside if US claims, particularly if claims, housing starts, permits and Philly Fed data are soft, but not too soft. Though Fed speakers have the chance to push back against falling yields, too.”
“GBP has had a nice short-covering bounce and is now back at levels where EUR/GBP is an attractive buy.”
- EUR/JPY trades in a volatile fashion and bounces off the 138.00 area.
- The loss of the latter could prompt losses to accelerate in the near term.
EUR/JPY manages to stage quite a firm rebound after briefly trespassing the key contention in the 138.00 region on Thursday.
The cross needs to clear the 200-day SMA in a convincing note, ideally in the very near term, to shift the outlook to a more constructive one. Extra gains from here should revisit the key resistance area near 143.00 (high December 28, January 11).
The breakdown of the 138.00 support zone could spark further weakness in the cross to, initially, the so far YTD low at 137.38 (January 3).
EUR/JPY daily chart
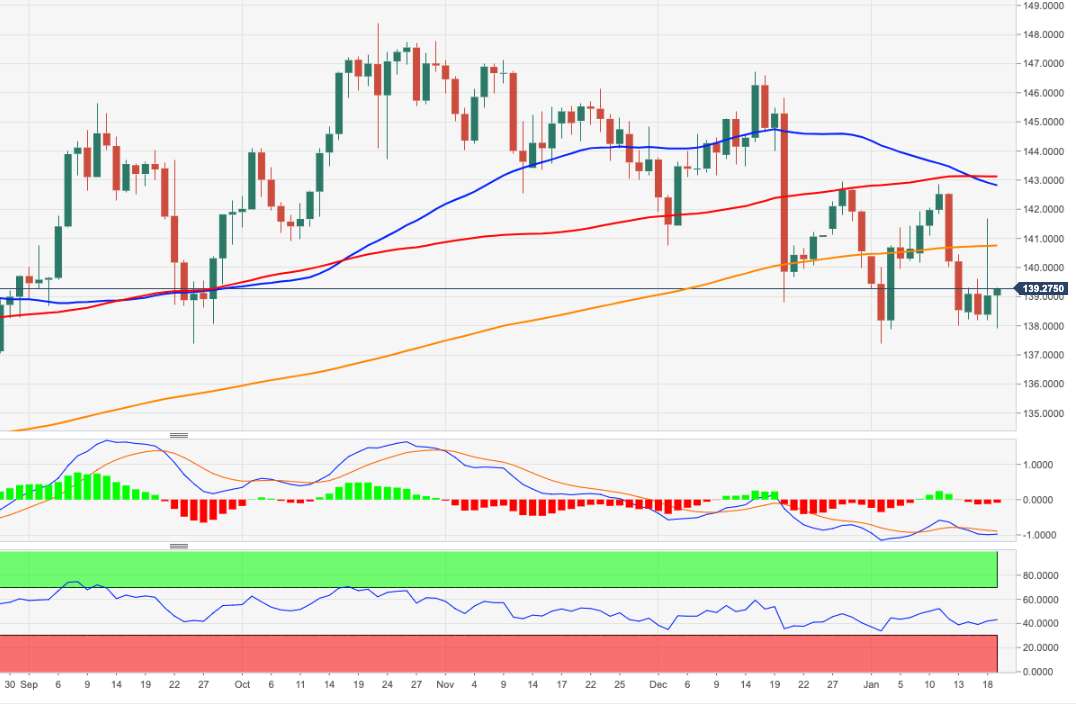
The Yen’s losses following yesterday’s Bank of Japan meeting did not last long. Yen investors are likely to focus on the successor of the current BoJ governor Haruhiko Kuroda, economists at Commerzbank report.
Yen remains torn between hope and foreboding
“JPY is defending the gains it made following the December meeting and continues to trade 6% stronger against the USD. I cannot imagine that this is solely due to the effect of 0.25% higher interest rates long term. Instead, the risk that the BoJ will implement a less expansionary monetary policy in the future remains in place.”
“Reportedly, a number of possible successors will be presented to parliament on 10th February, with a first hearing of the candidates following the week after that. Yen investors are likely to focus on that next, so as to get a better idea of whether any hope of a monetary policy reversal (and thus a stronger JPY) is justified or not.”
Economists at ING note that the Pound could thrive in the long term as the Labour party leader aims to rebuild good trade relationships with the bloc.
Starmer to pledge Brexit fix
“The leader of the opposition Labour Party, Keir Starmer, is reported to deliver a rather conciliatory speech in Davos today about the future of EU-UK relationships. The Labour party is leading by a rather large margin in the latest opinion polls ahead of next year’s general elections and evidence of a softer stance on Brexit should benefit the Pound in the long run.”
“Some recovery in the EUR may still send EUR/GBP back to 0.8800+ by the end of this week.”
European Central Bank (ECB) President Christine Lagarde is speaking at a panel discussion titled "Finding Europe's New Growth" at the World Economic Forum (WEF), in Davos this Thursday.
Key quotes
Economic news have become much more positive.
We may only see a small contraction in the Eurozone.
Job market in europe has never been as vibrant as now.
2023 won't be as brilliant but better than feared.
Inflation is way too high.
ECB is determined to bring it down to 2% in a timely manner.
Will stay course with rate hikes.
Inflation expectations are not de-anchoring.
We have to avoid the case of that happening.
Market reaction
In an immediate reaction to Lagarde’s comments, EUR/USD is trading unfazed at around 1.0820, up 0.28% on the day.
The Australian employment data disappointed. Economists at Commerzbank note that the Aussie is unlikely to enjoy further gains for the time being.
Labour market report takes the wind out of AUD’s sails
“The weak December labour market report confirmed the end of AUD/USD’s advance on the 0.70 mark for now. Although nothing changed about the short-term rate hike expectations – the market is likely to wait for the publication of the Q4 inflation data next week to fine tune its short-term rate expectations.”
“Today’s labour market report makes it seem unlikely though that the Reserve Bank of Australia (RBA) will continue to hike interest rates for longer than currently expected after all.”
“The imminent end of the rate hike cycle seems a done deal as soon the monetary tightening has too much of an effect on the real economy. That is likely to take the wind out of the Aussie’s sails for now.”
- USD/JPY comes under fresh selling pressure and is weighed down by a combination of factors.
- The risk-off mood benefits the safe-haven JPY and acts as a headwind amid a softer greenback.
- The BoJ’s dovish policy decision on Wednesday warrants caution for aggressive bearish traders.
The USD/JPY pair extends the previous day's sharp retracement slide from the 131.55-131.60 area, or the weekly high and remains under some selling pressure on Thursday. The pair, however, recovers a few pips from the daily low and is currently placed just below mid-128.00s, still down nearly 0.50% for the day.
The prevalent risk-off mood - as depicted by a sea of red across the equity markets - benefits the safe-haven Japanese Yen and exerts some downward pressure on the USD/JPY pair. Investors remain concerned about headwinds stemming from the worst yet COVID-19 outbreak in China. This, along with the protracted Russia-Ukraine war, has been fueling worries about a deeper global economic downturn.
Furthermore, the weaker US economic data released on Wednesday sparks recession fears and weigh on investors' sentiment. Meanwhile, The anti-risk flow, along with bets for smaller Fed rate hikes, drag the yield on the rate-sensitive two-year US government bond to its lowest level since October. This keeps the US Dollar bulls on the defensive and fails to lend support to the USD/JPY pair.
The downside, however, seems limited, at least for the time being, in the wake of the Bank of Japan's (BoJ) dovish policy decision on Wednesday. In fact, the Japanese central bank maintained ultra-low interest rates and left its yield curve control measures unchanged, defying expectations for more hawkish signals. This, in turn, warrants caution for aggressive bearish traders and before positioning for the resumption of the recent downtrend witnessed over the past three months or so.
Market participants now look forward to the US economic docket, featuring the Philly Fed Manufacturing Index, the usual Weekly Initial Jobless Claims and housing market data. This, along with speeches by influential FOMC members and the US bond yields, will drive the USD demand and provide some impetus to the USD/JPY pair. Traders will further take cues from the broader market risk sentiment to grab short-term opportunities around the major.
Technical levels to watch
The US Dollar Index is somewhat offered in the low-102.00s. DXY could re-test yesterday’s 101.55 lows by the end of the week, economists at ING report.
Dollar on unstable ground
“One could argue that the dollar is facing a rather uniquely-timed combination of negative factors and that the sustainability of the optimistic growth re-rating in Europe and China may be challenged by fresh commodity price volatility and high infection numbers – respectively. We see value in such an argument, and a straight-lined Dollar depreciation in the first quarter is far from assured. But global and US-specific dynamics continue to suggest a bearish bias on the Dollar in the near term.”
“DXY may re-test yesterday’s 101.55 lows by the end of the week.”
- Gold price regains positive traction on Thursday and snaps a three-day losing streak.
- Recession fears, rising bets for smaller Fed rate hikes, softer US Dollar lend support.
- The fundamental backdrop favours bulls and supports prospects for additional gains.
Gold price attracts some buyers near the $1,900 mark on Thursday and stalls a three-day-old downtrend from its highest level since April 25. The intraday uptick pushes the XAU/USD to a fresh daily peak, around the $1,916-$1,917 region, during the first half of the European session and is sponsored by a combination of factors.
Recession fears boost safe-haven Gold price
The prevalent risk-off environment - as depicted by the ongoing decline in the equity markets - is seen benefiting the safe-haven Gold price. The weaker-than-expected economic data released from the United States (US) on Wednesday fueled concerns about a broader slowdown in the country. Furthermore, worries about the economic headwinds stemming from the worst yet COVID-19 outbreak in China sparks recession fears and tempers investors' appetite for riskier assets.
Bets for smaller rate hikes by Federal Reserve also benefit Gold price
The global flight to safety, along with firming expectations for a less aggressive policy tightening by the Federal Reserve (Fed), continue to exert downward pressure on the US Treasury bond yields. In fact, the yield on the rate-sensitive two-year US government bond drops to its lowest level since October amid rising bets for a smaller 25 bps Fed rate hike in February. This, in turn, keeps the US Dollar (USD) bulls on the defensive and underpins the non-yielding Gold price.
Overnight hawkish comments from several Fed officials could cap gains
In fact, the USD Index, which tracks the greenback's performance against a basket of currencies, hangs near a multi-month low amid growing acceptance that the US central bank will soften its hawkish stance. That said, several Fed officials indicated on Wednesday that they will push on with more rate hikes even as inflation shows signs of easing and economic activity is slowing. This helps limit losses for the buck and acts as a headwind for the US Dollar-denominated Gold price.
Dips could be seen as a buying opportunity
Nevertheless, the fundamental backdrop remains tilted firmly in favour of bullish traders and supports prospects for further gains in Gold price. Hence, any corrective pullback could be seen as a buying opportunity and is likely to remain limited. Traders now look to the US economic docket, featuring the Philly Fed Manufacturing Index, the usual Weekly Initial Jobless Claims and housing market data. This, along with Fedspeaks and the US bond yields, should provide some impetus to the XAU/USD.
Gold price technical outlook
From a technical perspective, any subsequent move up might continue to confront resistance near the $1,927-$1,929 region ahead of the next relevant hurdle is seen near the $1,942 zone. Some follow-through buying will be seen as a fresh trigger for bullish traders and set the stage for an extension of the recent uptrend witnessed over the past two months or so. On the flip side, the $1,900-$1,895 area is likely to protect the immediate downside ahead of the $1,882-$1,880 region. A convincing break below the latter might negate the positive outlook and shift the near-term bias in favour of bearish traders.
Key levels to watch
Economists at Commerzbank note that the Euro could come under downside pressure in case inflation does not fall to target the lower rate levels in the Eurozone by the summer.
Euro is well served with the ECB ending its rate hikes by summer
“Yes, for the time being the Euro is well served with the ECB ending its rate hikes by the summer, above all as we expect rate cuts from the Fed due to the cooling of the economy.”
“However, if inflation does then not ease back to target the lower rate levels in the Eurozone are likely to seem that much more inappropriate to the FX market, with the Euro coming under pressure.”
Australia’s dismal jobs data weighed on the Reserve Bank of Australia’s (RBA) rate hike expectations, smashing AUD/USD. However, economists at ING maintain a bullish bias.
Too early to make strong calls about the end of the RBA hiking cycle
“The Australian Dollar has come under pressure after a surprise contraction in employment in December, which endorses the recent cautious stance by the Reserve Bank of Australia. Still, we’d need to see inflation come off more convincingly before making strong calls about the end of the RBA hiking cycle.”
“We continue to favour AUD/USD on the back of positive external developments (China, risk sentiment).”
- EUR/USD adds to Wednesday’s gains and advances through 1.0800.
- ECB Accounts, Chairwoman Lagarde come next in the docket.
- Weekly Claims, housing results and the Philly Fed Index due next in the US.
The European currency kicks in the second half of the week in a positive fashion and lifts EUR/USD back above the 1.0800 hurdle on Thursday.
EUR/USD looks at ECB, data
EUR/USD advances for the second session in a row and keeps well in place the multi-day consolidative mood around the 1.0800 neighbourhood.
The daily improvement in the pair comes in tandem with further decline in the greenback and the continuation of the retracement in US and German yields, all against the backdrop of a favourable context for the risk complex.
Extra support for the European currency also comes after ECB’s Board member Knot suggested the central bank is expected to raise rates by 50 bps multiple times and that underlying inflation pressures remain unabated.
Later in the session, the ECB Accounts will take centre stage along with the speech by Chair Lagarde at the WEF in Davos on “Finding Europe’s New Growth”.
In the US calendar, Building Permits, Housing Starts, Initial Jobless Claims and the Philly Fed Manufacturing Index are all due followed by speeches by FOMC’s S.Collins (voter, centrist) and Vice Chair L.Brainard (permanent voter, dove).
What to look for around EUR
EUR/USD bounces off recent lows in the 1.0770/65 band and manages to regain the 1.0800 mark and beyond amidst the better mood in the risk-associated universe.
Price action around the European currency should continue to closely follow dollar dynamics, as well as the impact of the energy crisis on the euro bloc and the Fed-ECB divergence.
Back to the euro area, the increasing speculation of a potential recession in the bloc emerges as an important domestic headwind facing the euro in the short-term horizon.
Key events in the euro area this week: ECB Lagarde, ECB Accounts (Thursday) - ECB Lagarde (Friday).
Eminent issues on the back boiler: Continuation of the ECB hiking cycle amidst diminishing probability of a recession in the region. Impact of the war in Ukraine and the protracted energy crisis on the bloc’s growth prospects and inflation outlook. Risks of inflation becoming entrenched.
EUR/USD levels to watch
So far, the pair is gaining 0.20% at 1.0815 and faces the next up barrier at 1.0887 (monthly high January 18) followed by 1.0900 (round level) and finally 1.0936 (weekly high April 21 2022). On the flip side, the breakdown of 1.0766 (weekly low January 17) would target 1.0513 (55-day SMA) en route to 1.0481 (monthly low January 6).
International Energy Agency (IEA) Chief Fatih Birol said on Thursday that “we may see tighter markets in 2023, more than some others may think.”
Additional quotes
Does not see tightness in the market currently but have to be aware of uncertainties.
Two uncertainties to highlight are Russia and China.
If China's economy rebounds this year as expected will see stronger demand that will pressure markets.
May see tighter markets in 2023, more than some others may think.
Russian oil exports seem to be more resilient than first thought.
Russia's oil exports declining as IEA forecast, will fall further in the first quarter and beyond.
There are questions about Russia's ability to export because of sanctions and its own challenges.
Related reads
- Crude Oil Futures: Extra losses in store
- Upbeat IEA’s oil market report
European Commissioner for Economy Paolo Gentiloni said in a statement on Thursday, “we're in a period of economic contraction.”
Further comments
“Contraction can be limited to two quarters.”
“A technical recession in Germany is uncertain.”
“China's reopening means LNG prices are going up.”
“Real inflation challenge is adapting fiscal policy.”
“We need more flexible, enforceable EU fiscal rules.”
“Finding a fiscal rule accord in March is challenging.”
Market reaction
EUR/USD was last seen trading at 1.0817, up 0.25% on the day.
Senior Economist at UOB Group Alvin Liew reviews the latest NODX figures for the past year.
Key Takeaways
“Singapore’s non-oil domestic exports (NODX) headline again came in worse than even our pessimistic forecast, falling sharply by -20.6% y/y in Dec from the revised -14.7% in Nov, the third straight month of contraction after 22 months of unabated expansion. On a seasonally adjusted sequential basis, NODX fell 3.3% m/m in Dec compared to -9.2% in Nov. This is the fifth consecutive m/m decline for NODX and the longest of such down stretch since end-2008/early 2009.”
“Both electronics and non-electronics exports fared poorly in Dec, just like Nov. The difference is that the fall in electronics exports was -17.9% y/y (compared to -20.2% in Nov), the fifth consecutive month of y/y contraction. In comparison, non-electronics fell deeper by -21.3% y/y (from -12.8% in Nov), the third consecutive decline after 13 months of gains. Importantly, the nominal values of both integrated circuits and pharmaceutical exports fell to significantly low levels. Exports to major destinations also reflected the weaker global demand backdrop, as only two markets reported positive y/y outcomes in Dec, with the weakness in China and ASEAN regional demand especially concerning.”
“NODX Outlook – The cracks in the export outlook became more visible now with the consecutive and deeper y/y contractions. We are likely to see a few more months of y/y declines in NODX for 1H 2023 before factoring an improvement in the second half of the year. We expect full year NODX to contract by -5.5% in 2023.”
Considering advanced prints from CME Group for natural gas futures markets, open interest reversed the previous daily drop and resumed the uptrend after increasing by around 11.8K contracts on Wednesday. Volume, instead, left behind two daily builds in a row and went down by around 41.1K contracts.
Natural Gas remains en route to $3.00
Prices of natural gas dropped further on Wednesday and revisited levels last seen back in May 2021. The downtick was amidst increasing open interest, which leaves the prospects for extra losses well on the cards for the time being. That said, the $3.00 mark per MMBtu still emerges as the next support of note for the commodity.
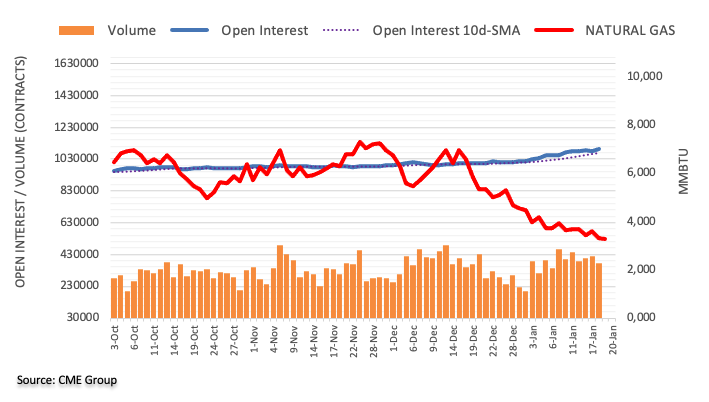
Norges Bank announces monetary policy this morning. Economists at ING expect a 25 bps hike by NB and see upside risks for NOK.
Norges Bank may deliver last hike today
“The latest projections saw the Bank signal a 3.00% peak rate (now at 2.75%) in early 2023, and a combination of resilient underlying inflation, growth and employment suggests – in our view – this should be the right time to deliver the last hike of the cycle.”
“In line with our call, we see upside risks for NOK today. EUR/NOK could trade close to 10.60-10.65 again today, but idiosyncratic EUR strength suggests most NOK gains may be channelled against the Dollar.”
See – Norges Bank Preview: Forecasts from three major banks, will this hike be the last?
“The European Central Bank (ECB) is planning to hike by 50 bps multiple times,” the central bank policymaker Klaas Knot said on Thursday.
Additional quotes
I would take our words quite seriously.
Sees no signs of underlying inflation pressures abating.
ECB won't stop after a single 50 bps rate hike.
The Eurozone could avoid a recession but growth will be slow.
The ECB are only focused on the risk of doing too little right now.
Makret reaction
EUR/USD has picked up fresh bids above 1.0800 on the above comments, adding 0.23% on the day to trade at 1.0815.
US Dollar struggles. In the view of economists at Commerzbank, USD weakness might not have run its course yet.
USD correction set to continue
“The more notable the economic slowdown becomes, the more the market is therefore likely to feel confirmed in its view that the Fed will eventually waver. In particular as disagreement about the size of the next rate step is already emerging amongst Fed members.”
“I expect that the USD correction will only come to an end if the divergence between Fed and market expectations as regards the development of interest rates in the second half of the year has been resolved.”
EUR/USD is wavering around 1.0800. Economists at ING expect to see some consolidation/further upside in the pair by the end of the week.
EUR/USD could trade around 1.0850/1.0900
“ECB President Christine Lagard will speak in Davos today, and there is a good chance she will reiterate the ECB’s hawkish stance despite lower energy prices.”
“Dovish speculation should be further challenged by the release of the December 2022 ECB meeting minutes, as the details of the dissent to a ‘too conservative’ 50 bps hike should emerge, as well as guidance to ‘multiple’ 50 bps increases.”
“We expect to see some consolidation/further upside in EUR/USD by the end of the week when the pair could trade around 1.0850/1.0900.”
Markets expect Norges Bank (NB) to keep rates unchanged. Thus, the Krone is unlikely to weaken as a result of the meeting, Antje Praefcke, FX Analyst at Commerzbank, reports.
Norges Bank likely to leave everything on hold
“Norges Bank was one of the first central banks that had started the rate hike cycle to fight inflation risk. That is why it could wait until March to hike its key rate again if necessary, based on more information on inflation rates and growth as well as its most recent projections. I, therefore, consider it to be quite likely that it will keep everything on hold today and will only issue a short statement, which will contain a reference to a further step.”
“The market too expects rates to remain unchanged today and has already significantly adjusted its rate cut expectations for the longer-term. I, therefore, don't see a lot of downside potential for NOK as a result of the meeting.”
See – Norges Bank Preview: Forecasts from three major banks, will this hike be the last?
Last week’s Dollar selloff pushed USD/INR below 82.00. Economists at Credit Suisse now widen their USD/INR range to 81.00-84.0 and highlight the risk of RBI intervention near 81.00.
USD/INR target widened to 81.00-84.00
“Although we still think the Rupee will weaken vs USD over the long term, in the short term REER stability means that USD/INR will reflect broad USD weakness, as the RBI occasionally shifts its intervention corridor accordingly.”
“Now that the 82.00 level has broken, we expect more rigorous intervention by the central bank near 81.00.”
“Although further USD weakness means the RBI could shift its intervention corridor yet again, recent history suggests that 81.00 is a firmer ‘red line.’ As such, we widen our Q1 USD/INR forecast range to 81.00-84.00.”
Open interest in crude oil futures markets increased for the third day in a row on Wednesday, now by around 8.1K contracts according to preliminary readings from CME Group. On the other hand, volume kept the choppy activity in place and shrank by around 181.3K contracts, partially reversing the previous build.
WTI: Immediate support comes at the YTD low near $72.50
Wednesday’s daily decline in prices of the WTI came in tandem with further increase in open interest, which remains supportive of extra weakness in the very near term. Against that, the next contention of significance emerges at the so far 2022 low at $72.50 recorded on January 5.
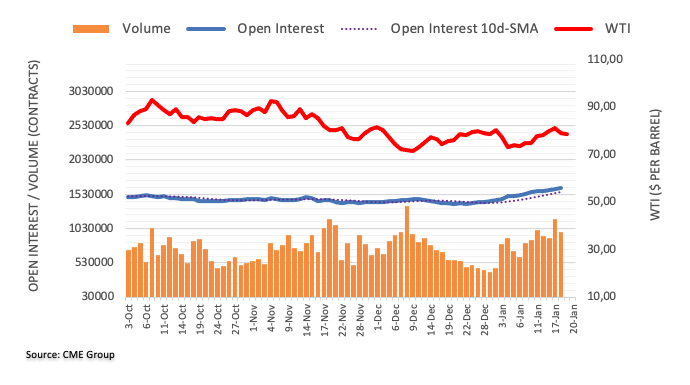
CME Group’s flash data for gold futures markets noted traders trimmed their open interest positions for the second session in a row on Wednesday, this time by more than 3K contracts. Volume followed suit and dropped for the third straight session, now by around 61.6K contracts.
Gold: Further gains lies beyond $1930
Gold prices charted the third consecutive daily pullback on Wednesday. The leg lower was amidst shrinking open interest and volume and leaves the door open to a potential near-term rebound with the immediate target at recent peaks near $1930 per ounce troy.
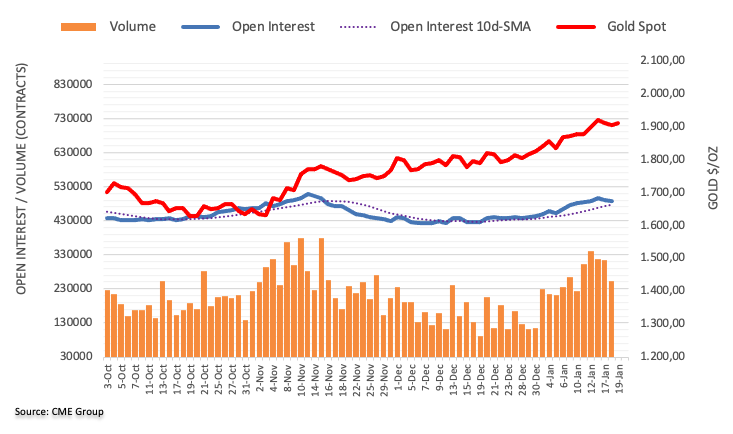
- USD/MXN picks up bids to renew intraday high, defends two-day gains.
- US Dollar remains pressured as softer US data fails to support hawkish Fed talks.
- Mexican Peso is among the top Emerging Market performers as commodity prices surge.
USD/MXN reveres intraday losses to 18.95 heading into Thursday’s European session as Mexican Peso consolidates recent gains around the multi-month low.
The resource-rich Latin America (LATAM) cheers softer US Dollar, as well as higher commodity prices to exert downside pressure on the USD/MXN prices. That said, the quote’s downside move also takes clues from the softer US Treasury yields and fears of US recession, mainly due to the downside US data. However, consolidation of the recent losses ahead of Friday's Mexican Retail Sales seem to have triggered the latest corrective bounce.
While checking the details the US Retail Sales marked the biggest slump in a year while the Producer Price Index also dropped to the lowest level in six months during December.
Alternatively, St. Louis Federal Reserve's President James Bullard said US interest rates have to rise further to ensure that inflationary pressures recede. On the same line, President of the Federal Reserve Bank of Cleveland Loretta Mester praised the Fed’s actions to tame inflation. Further, Kansas City Fed President Esther George mentioned that the central bank must restore price stability, "that means returning to 2% inflation." Recently, Dallas Federal Reserve President Lorie Logan supported a slower rate hike pace but also mentioned possibly a higher stopping point.
Elsewhere, the US 10-year Treasury yields refresh a four-month low whereas the two-year counterpart drops to the lowest levels since early October at the latest.
Against this backdrop, the S&P 500 Futures print mild losses by the press time, while tracking Wall Street’s close.
Looking forward, Friday’s Mexican Retail Sales could direct USD/MXN moves amid a light calendar before that. However, the risk catalysts and yields will be crucial to watch for clear directions.
Technical analysis
The downside break of the previous key support line from July 2017, now resistance around 19.73, keeps USD/MXN bears hopeful. Meanwhile, the pair buyers need validation from 61.8% Fibonacci retracement level of the pair’s run-up from July 2017 to April 2020, close to 20.65, to retake control.
Gold price is rising for the first time in four trading days this Thursday. XAU/USD could retake $1,920, FXStreet’s Dhwani Mehta reports.
Bulls continuing to guard the downside
“Four-hourly candlestick close above the 21-Simple Moving Average hurdle at $1,913 will drive the recovery further toward the upper boundary of the pennant, aligned at $1,925. However, Gold buyers need to find a strong foothold above the $1,920 round level, at first.”
“On the downside, if sellers extend their control below the key support of $1,897, where bullish 50SMA emerges, a sharp drop toward the $1,870 intermittent cap cannot be ruled out. Deeper declines will call for a test of the ascending 100SMA at $1,854.”
See – Gold Price Forecast: XAU/USD rally to extend toward $1,973/98, with fresh cap expected here – Credit Suisse
- Silver extends its descent for the third successive day and drops to over a one-week low.
- The technical setup now favours bearish traders and supports prospects for a further fall.
- A convincing break below the trend-channel support will reaffirm the negative outlook.
Silver extends this week's retracement slide from the $24.50 horizontal resistance and edges lower for the third straight day on Thursday. The white metal remains on the defensive heading into the European session and is currently placed just below the mid-$23.00s, or the 200-period SMA on the 4-hour chart.
Bearish traders now await some follow-through selling below support marked by the lower boundary of over a one-month-old ascending channel before placing fresh bets. Technical indicators on the daily chart have just started gaining negative traction and support prospects for an eventual breakdown. That said, RSI (14) on hourly charts is on the verge of breaking into the oversold zone and warrants some caution.
A convincing break, however, might turn the XAG/USD vulnerable to weaken further below the $23.00 mark and accelerate the fall to the $22.60-$22.55 region. The downward trajectory could get extended further and drag spot prices to the next relevant support near the $22.10-$22.00 zone. The latter represents a static resistance breakpoint and might help limit losses, which if broken will be seen as a fresh trigger for bears.
On the flip side, any meaningful recovery attempt now seems to confront an immediate hurdle ahead of the $24.00 round-figure mark. This is followed by resistance near the $24.30 region and the multi-month peak, around the $24.50 area. A sustained strength beyond has the potential to lift the XAG/USD towards challenging the trend channel barrier, currently around the $24.80-$24.85 zone, en route to the $25.00 psychological mark.
Silver 4-hour chart
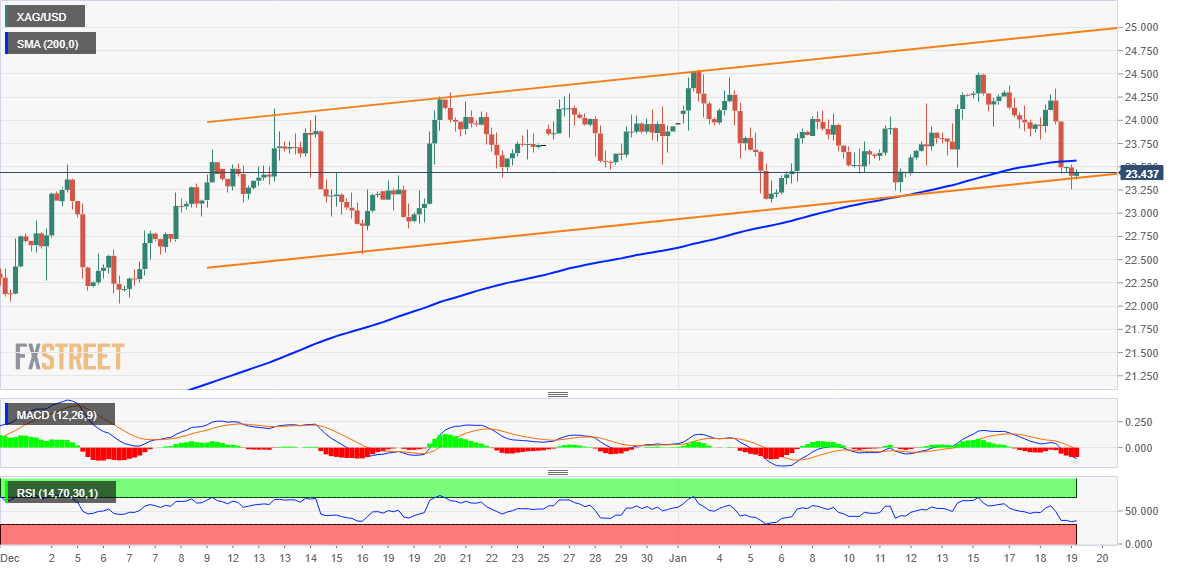
Key levels to watch
- The index trades slightly on the defensive around 102.30.
- The dollar meets resistance near the 103.00 mark so far this week.
- The Philly Fed Index, weekly Claims and housing data next on tap.
The greenback, in terms of the USD Index (DXY), remains under pressure in the lower end of the range near 102.30 on Thursday.
USD Index now focuses on data
The index starts the second half of the week somewhat offered in the low-102.00s following Wednesday’s volatile session, where the dollar climbed to the vicinity of the 103.00 hurdle soon afterwards hawkish remarks from FOMC’s L.Mester (Cleveland) and J.Bullard (St. Louis).
In the meantime, market participants continue to gauge the emergence of a pivot in the Fed’s monetary policy stance vs. the persistent hawkish narrative from Fed’s rate setters, who continue to advocate for a move beyond 5% in the interest rate.
Later in the session, Building Permits and Housing Starts are due along with usual weekly Initial Claims as well as the Philly Fed Manufacturing Index.
In addition, Boston Fed S.Collins (voter, centrist) and Vice Chair L.Brainard (permanent voter, dove) are also due to speak.
What to look for around USD
The dollar remains side-lined in the lower end of the recent range near the 102.00 mark on Thursday.
The idea of a probable pivot in the Fed’s policy continues to weigh on the greenback and keeps the price action around the DXY depressed. This view, however, also comes in contrast to the hawkish message from the latest FOMC Minutes and recent comments from fed’s rate-setters, all pointing to the need to advance to a more restrictive stance and stay there for longer, at the time when rates are seen climbing above the 5.0% mark.
On the latter, the tight labour market and the resilience of the economy are also seen supportive of the firm message from the Federal Reserve and the continuation of its hiking cycle.
Key events in the US this week: Building Permits, Housing Starts, Philly Fed Manufacturing Index, Initial Jobless Claims (Thursday) – Existing Home Sales (Friday).
Eminent issues on the back boiler: Rising conviction of a soft landing of the US economy. Prospects for extra rate hikes by the Federal Reserve vs. speculation of a recession in the next months. Fed’s pivot. Geopolitical effervescence vs. Russia and China. US-China trade conflict.
USD Index relevant levels
Now, the index is losing 0.14% at 102.24 and a breakdown of 101.77 (monthly low January 16) would open the door to 101.29 (monthly low May 30) and finally 100.00 (psychological level). On the other hand, the next hurdle comes at the weekly high at 102.89 (January 18) followed by 105.63 (monthly high January 6) and then 106.44 (200-day SMA).
- GBP/USD treads water as bulls and bears jostle between crucial resistance and support.
- Looming bear cross on MACD, failure to cross 1.2450 hurdle tease sellers.
- Two-week-old ascending trend line, 200-SMA limit downside moves.
- RSI conditions suggest further grinding towards the north.
GBP/USD struggles for clear directions as it floats around 1.2330 amid the initial hour of London open on Thursday. In doing so, the Cable pair trades within an important trading region amid contrasting oscillators.
That said, a five-week-old horizontal resistance area restricts the GBP/USD pair’s immediate upside to around 1.2450 while an ascending trend line from January 06, close to 1.2260 at the latest, challenges the bears.
It’s worth noting that the MACD signals are losing the bullish bias but the RSI (14) defends the two-week-old bullish bias despite the latest retreat.
In addition to the 1.2260 support, the 200-SMA level surrounding 1.2155 and the 1.2000 psychological magnet also challenge the GBP/USD sellers, making it harder for them to retake control.
Should the quote drops below the 1.2000 mark, a south-run to refresh the monthly low, currently around 1.1841, can’t be ruled out.
Alternatively, an upside break of 1.2450 will confirm the “rounding bottom” bullish chart pattern that theoretically suggests a rally towards 1.3050.
However, the May 2022 high of 1.2665 and the late April 2022 low of 1.2975 could act as additional upside filters to challenge the GBP/USD buyers during the aforementioned rally.
GBP/USD: Four-hour chart
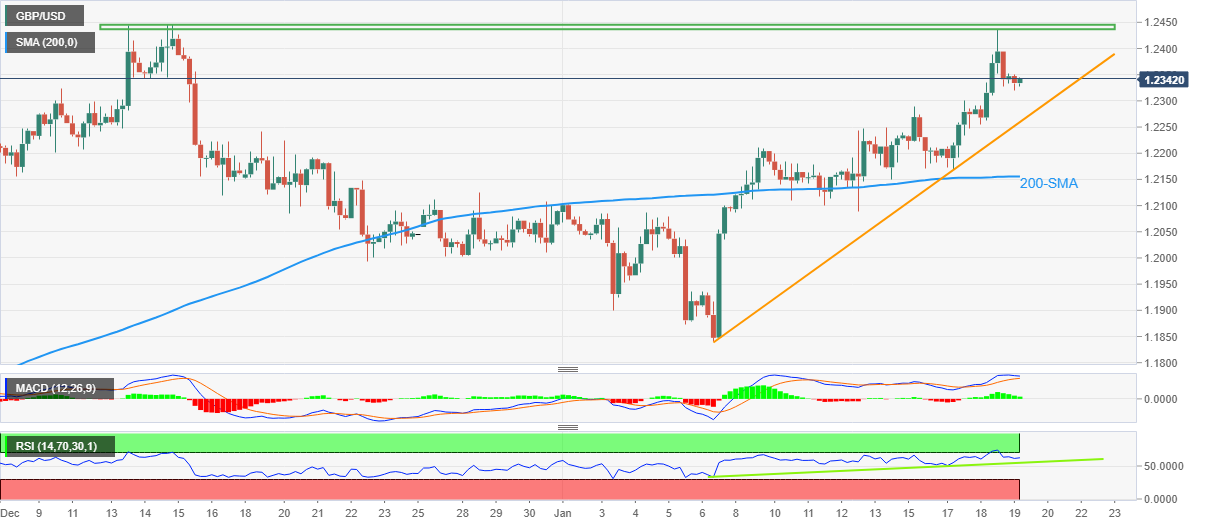
Trend: Sideways
FX option expiries for Jan 19 NY cut at 10:00 Eastern Time, via DTCC, can be found below.
- USD/JPY: USD amounts
- 127.95 300m
- 128.15 876m
- AUD/USD: AUD amounts
- 0.6800 309m
- USD/CAD: USD amounts
- 1.3825 300m
- AUD/USD bears poke previous monthly top during a two-day downtrend from five-month high.
- Australia jobs report bolstered case for slower rate hike from the RBA.
- US Treasury bond yields renew multi-day low even as downbeat data, hawkish Fedspeak renew recession fears.
AUD/USD holds lower ground near the intraday low near 0.6890 as the previous monthly top probes the bears during the second loss-making day amid early Thursday in Europe. In doing so, the Aussie pair extends the previous day’s pullback from the highest levels since August 2022 amid a downbeat Australian employment report for August, as well as growing fears of recession.
Australia’s headline Employment Change turned negative on a seasonally adjusted basis, printing -14.6K figure versus 22.5K expected and 64K prior. Further, the Unemployment Rate also rose to 3.5% compared to the market consensus of witnessing no change in the 3.4% previous readings.
Elsewhere, softer prints of the US data and hawkish Fed talks renew economic slowdown fears and weigh on the sentiment, which in turn exert downside pressure on the risk-barometer AUD/USD pair.
That said, US Retail Sales marked the biggest slump in a year while the Producer Price Index also dropped to the lowest level in six months during December. Further, St. Louis Federal Reserve's President James Bullard said US interest rates have to rise further to ensure that inflationary pressures recede. On the same line, President of the Federal Reserve Bank of Cleveland Loretta Mester praised the Fed’s actions to tame inflation. Further, Kansas City Fed President Esther George mentioned that the central bank must restore price stability, "that means returning to 2% inflation." Recently, Dallas Federal Reserve President Lorie Logan supported a slower rate hike pace but also mentioned possibly a higher stopping point.
As the AUD/USD bears cheer the recession woes in the US, as well as fears of a less hawkish Reserve Bank of Australia (RBA) due to the downbeat Aussie jobs report, the pair traders ignore upbeat concerns surrounding China. Recently, Gita Gopinath, the first Deputy Managing Director of the International Monetary Fund (IMF) said, “China could see a sharp recovery in economic growth from the second quarter onwards based on current infection trends after the dismantling of most COVID-19 restrictions.”
Amid these plays, the S&P 500 Futures and Australia’s ASX 200 print mild losses while the US 10-year Treasury yields refresh a four-month low and the two-year counterpart drops to the lowest levels since early October at the latest.
Looking forward, AUD/USD traders should pay attention to the risk catalysts, mainly the central bank speakers amid a light calendar, for clear directions as bears struggle to retake control.
Technical analysis
The AUD/USD pair’s confirmation of a two-week-old rising wedge keeps the bears hopeful of witnessing a fresh monthly low.
Also read: AUD/USD Price Analysis: Bears cheer rising wedge confirmation around 0.6900
- GBP/JPY witnessed heavy selling on Thursday and retreats further from a three-week high.
- Recession fears boost demand for the safe-haven JPY and exert some downward pressure.
- The prospects for more BoE rate hikes underpin the GBP and should limit deeper losses.
The GBP/JPY cross extends the previous day's retracement slide from the 161.50 region, or a three-week high and remains under heavy selling pressure on Thursday. Spot prices snap a three-day winning streak and drop back closer to mid-157.00s, hitting a fresh daily low heading into the European session.
As investors digest the Bank of Japan's (BoJ) dovish policy decision on Wednesday, looming recession risks boost demand for the safe-haven Japanese Yen and exert pressure on the GBP/JPY cross. Investors remain concerned about the potential headwinds stemming from the worst yet COVID-19 outbreak in China. Apart from this, the protracted Russia-Ukraine war has been fueling worries about a deeper global economic downturn.
The fears were fueled by Wednesday's weaker US macro data, which showed that retail sales in December fell by the most in a year and manufacturing output recorded its biggest drop in nearly two years. This, in turn, forces investors to take refuge in traditional safe-haven assets and benefits the JPY. Apart from this, a modest pullback in the British Pound contributes to the heavily offered tone surrounding the GBP/JPY cross.
Despite the downfall, spot prices remain well above the weekly low amid expectations that the Bank of England will continue raising interest rates to combat stubbornly high inflation. The bets were lifted by the stronger wage growth data released on Tuesday, which is expected to keep inflation elevated. Furthermore, the headline UK CPI - though fell to a three-month low in December - is still running at levels last seen in the early 1980s.
In the absence of any relevant market-moving economic releases from the UK, the aforementioned mixed fundamental backdrop warrants some caution for aggressive bearish traders. Hence, it will be prudent to wait for strong follow-through selling before positioning for any further depreciating move for the GBP/JPY cross.
Technical levels to watch
Here is what you need to know on Thursday, January 19:
The US Dollar is struggling to extend Wednesday’s V-shaped recovery so far this Thursday, in the wake of the persistent weakness in the US Treasury bond yields amid risk-aversion. Risk-off flows dominate, as the Asian markets follow the Wall Street indices lower. Major US indices lost over 1% on renewed fears over a potential US recession following the disappointing US consumer spending and industrial data. The fight to safety rush into the US government bond market is driving the Treasury bond yields lower across the curve. The recent sell-off in global yields was triggered by the Bank of Japan’s (BoJ) decision to make no changes to its yield control policy a day before and smaller US Federal Reserve (Fed) rate hike expectations.
At the time of writing, the two-year US Treasury bond yields are trading at their lowest level since October 2022, near 4.0% while the US S&P 500 futures lose 0.12% on the day. Meanwhile, the US Dollar index has edged lower, erasing early gains to trade flat at around 102.30.
Mixed Fed commentary is also leaving markets in limbo, although markets continue pricing 25 basis points (bps) Fed rate hike in the next two months. Early Asia, Philadelphia Fed President Patrick Harker reiterated that he's ready for the Federal Reserve to move to a slower pace of interest rate rises. Dallas Fed Chief Lorie Logan also supported the case for 25 bps rate increments going forward.
Across the FX board, the Japanese Yen is the strongest while the Australian Dollar remains the weakest. Renewed recession fears boost the safe-haven status of the Yen, as markets digest the BoJ deliberations. USD/JPY has surrendered the 128.00 level, enduring heavy selling pressure in early Europe.
AUD/USD and NZD/USD are reeling from the domestic fundamentals-induced blow. The Australian employment data disappointed, with the number of employed Australians falling by 14.6K in December vs. 22.5K and 64K previous. The Australian Unemployment Rate edged higher to 3.5% in December vs. the 3.4% expected while the Participation Rate dropped to 66.6% from 66.8. The dismal jobs data weighed on the Reserve Bank of Australia’s (RBA) rate hike expectations, smashing AUD/USD to near 0.6900.
Meanwhile, the NZD/USD pair tumbled toward 0.6400 after New Zealand’s Prime Minister Jacinda Ardern said she would step down from the leadership position on February 7, well ahead of the October 14 general election. Meanwhile, USD/CAD is holding steady at around 1.3500 amid a subdued US Dollar and falling WTI prices. The US oil is down 1.25% on the day at $78.53 so far, amid recession risks.
EUR/USD is wavering around 1.0800, awaiting European Central Bank (ECB) President Christine Lagarde’s speech for fresh hints on the rate hike path. Meanwhile, the Eurozone Current Account data and ECB monetary policy accounts will be closely scrutinized by market participants.
GBP/USD is trading on the back foot below 1.2350, retreating from five-week highs amid risk-aversion. The Bank of England (BoE) Q4 Credit Conditions Survey is the only relevant data for the Pound Sterling this Thursday. Although traders will await the US Jobless Claims, Housing data and Fed speeches for fresh trading incentives.
Gold price is holding higher ground above $1,900 amid falling US Treasury bond yields, as investors assess chances of slower Fed rate hikes pace.
Bitcoin is off the lows but still trading below the $21,000 level, defending minor gains while Ethereum is struggling above the $1,500 barrier amid reduced risk appetite.
- Gold price has displayed a recovery move and has surpassed $1,910.00 amid weaker yields.
- The absence of demand in the S&P500 futures is restricting risk-perceived currencies in achieving solid upside bias.
- The US Dollar Index has failed to sustain above the critical resistance of 102.00
Gold price (XAU/USD) has rebounded firmly and has surpassed the immediate resistance of $1,910.00 in the early European session. The precious metal is gaining strength amid falling returns on US government bonds. The 10-year US Treasury yields has dropped firmly below 3.33% amid falling inflation projections.
Meanwhile, the risk profile is still negative as S&P500 futures are failing to find a cushion. The absence of demand in the S&P500 futures is restricting risk-perceived currencies in achieving solid upside bias. The US Dollar Index (DXY) has shifted its auction profile comfortably below the 102.00 resistance.
US yields are facing severe pressure as Federal Reserve (Fed) policymakers have started considering an interest rate hike by 25 basis points (bps) for February’s monetary policy meeting. Philadelphia Federal Reserve President Patrick Harker reiterated on Wednesday that he's ready for the US central bank to move to 25 basis points (bps) interest rate hike context amid some signs that hot inflation is cooling off. Also, the CME FedWatch tool displays more than 96% chances of hiking interest rates by bps to 4.50-4.75%.
Gold technical analysis
Gold price has rebounded firmly after testing the horizontal support plotted from January 12 high at $1,901.66 on an hourly scale. The downward-sloping trendline from January 16 high at $1,929.02 will continue to act as a major barricade for the Gold price.
The 100-period Exponential Moving Average (EMA) at $1,905.05 is acting as a major support for Gold price. Also, the Relative Strength Index (RSI) (14) has sensed support around 40.00, which indicates that the downside is restricted.
Gold hourly chart
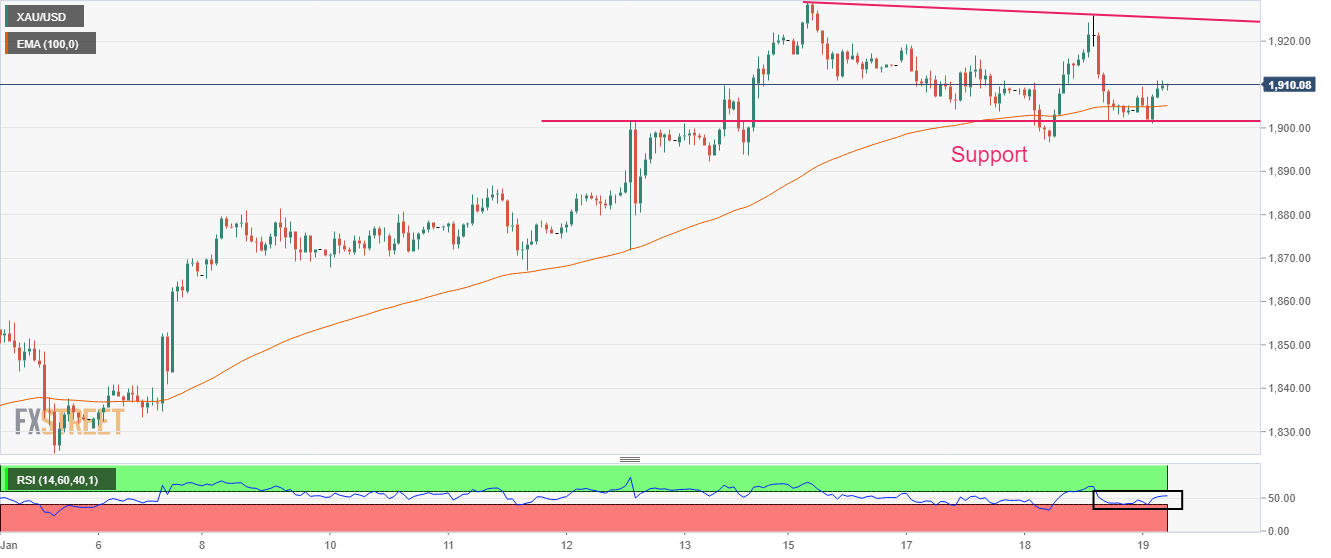
- USD/IDR struggles to extend losses despite breaking seven-month-old support line as traders await Bank Indonesia (BI) Rate decision.
- 200-DMA, oversold RSI conditions also challenge bears around multi-day low.
- Buyers remain off the table unless rising back beyond 100-DMA.
- BI is expected to end the rate-hike cycle with 0.25% lift in benchmark interest rate.
USD/IDR bears pressure on the key moving average as the key awaits the Bank Indonesia (BI) Rate decision during early Thursday. In doing so, the Indonesia Rupiah (IDR) extends the retreat from seven-month-old previous support to $15,100 by the press time.
That said, the BI is up for the final blow in the fight again inflation as market forecasts suggest the last 0.25% rate hike before the end of monetary policy contraction, at least for now. Bank Indonesia will deliver another 25 basis points interest rate hike on Thursday as it tries to bring inflation under control without having a big impact on economic growth, a Reuters poll of economists forecast.
On the technical front, the quote’s sustained weakness below an upward-sloping trend line from early June 2022 joins the bearish MACD signals to keep the USD/IDR sellers hopeful.
However, the oversold RSI conditions join the 200-DMA, around $15,100 by the press time, to challenge the bears.
Should the quote drops below $15,100, the August 2022 peak surrounding $14,980 and the 61.8% Fibonacci retracement level of the USD/IDR pair’s June-November upside, near $14,910, could challenge the pair sellers.
On the flip side, a daily closing beyond the support-turned-resistance line, close to $15,200 by the press time, appears necessary to recall the USD/IDR bulls.
Even so, the early December swing low near $15,290 and the 100-DMA level around $15,420, could test the upside momentum.
USD/IDR: Daily chart

Trend: Further downside expected
- NZD/USD trades with modest losses on Thursday, though the downside remains cushioned.
- Looming recession risks weigh on investors’ sentiment and undermine the risk-sensitive Kiwi.
- Subdued USD price action lends some support to the major and helps limit any deeper losses.
The NZD/USD pair edges lower during the Asian session on Thursday and moves away from its highest level since June 2022, around the 0.6530 area touched the previous day. Spot prices, however, manage to hold above the 0.6400 mark, making it prudent to wait for strong follow-through selling before positioning for any further intraday downfall.
The weaker US macro data released on Wednesday adds to worries about a deeper global economic downturn and continues to weigh on investors' sentiment. This is evident from a softer tone around the equity markets and acts as a headwind for the risk-sensitive Kiwi, which reacts little to news that Prime Minister Jacinda Ardern will step down next month. That said, subdued US Dollar price action lends some support to the NZD/USD pair and helps limit the downside, at least for the time being.
A further decline in the US Treasury bond yields, amid firming expectations for a less aggressive policy tightening by the Fed, keeps the USD bulls on the defensive. In fact, the markets now seem convinced that the US central bank will soften its stance and have been pricing in a smaller 25 bps rate hike in February. The bets were reaffirmed by the US data, showing that retail sales in December fell by the most in a year and manufacturing output recorded its biggest drop in nearly two years.
That said, several FOMC members indicated on Wednesday that they will push on with more interest rate hikes even as inflation shows signs of easing and economic activity is slowing. Apart from this, looming recession risks should benefit the greenback's relative safe-haven status and exert some downward pressure on the NZD/USD pair. Traders now look to the US economic docket, featuring the Philly Fed Manufacturing Index, the usual Weekly Initial Jobless Claims and housing market data.
This, along with speeches by Fed officials and the US bond yields, might influence the USD price dynamics later during the early North American session. Apart from this, traders will take cues from the broader risk sentiment to grab short-term opportunities around the NZD/USD pair. Nevertheless, the mixed fundamental backdrop warrants some caution before placing aggressive directional bets.
Technical levels to watch
- EUR/USD is aiming to sustain above 1.0800 as the USD Index is displaying a subdued performance.
- Accelerating odds of a slower interest rate hike by the Federal Reserve have weakened US Treasury yields.
- The speech from European Central Bank President Christine Lagarde will guide investors about the likely policy action ahead.
- EUR/USD is looking for demand around the upward-sloping trendline of the Ascending Triangle.
The EUR/USD pair has managed to claim the critical resistance of 1.0800 in early Europe after remaining sideways in the Asian session. The major currency pair is aiming to deliver a recovery move after a vertical fall as the US Dollar index (DXY) is losing traction. The Euro still needs to clear more filters to infuse confidence in the sentiment of the market participants for a recovery move.
The US Dollar Index is struggling to sustain above the crucial resistance of 102.00 as investors are still in a fix on whether to pump liquidity into the safe-haven assets due to hawkish commentary from the Federal Reserve (Fed) policymakers or to dump the USD Index due to declining inflation projections in the United States.
Meanwhile, S&P500 futures have shown a marginal recovery after facing heat in the Asian session. However, the 500-stock basket futures still need to prove more to improve traction for the risk-appetite theme.
Solidifying case for a slowdown in the pace of hiking interest rates by the Federal Reserve is weighing heavily on the alpha generated by the US government bonds.
Yields nosedive on weaker Retail Sales and lower US PPI data
Wednesday’s lower United States Producer Price Index (PPI) and weaker Retail Sales data dragged US Treasury yields to a multi-month low. The 10-year US Treasury yields recorded a fresh four-month low below 3.33%. And, the two-year US Treasury yields dropped to a fresh three-month low near 4.07%.
The context that impacted heavily on yields is the decline in PPI numbers against expectations. The headline US PPI dropped to 6.2% and the core PPI that excludes oil and food prices trimmed to 5.5%. Lower prices of goods and services at factory gates come when producers feel that current prices are unable to fetch demand from the public. Therefore, softening of demanded price would maintain equilibrium with weakened retail demand and eventually push the overall inflation to the south side.
No doubt that the cool-off in the ultra-hot inflation has provided confidence to the Federal Reserve policymakers to sound-less hawkish for further hikes in interest rates. Reuters reports that Philadelphia Federal Reserve President Patrick Harker reiterated on Wednesday that he's ready for the US central bank to move to 25 basis points (bps) interest rate hike context amid some signs that hot inflation is cooling off.
Higher terminal rate projection still a concern for the risk-on mood
After finding confidence that the inflation rate will continue its downward trend, Federal Reserve policymakers have started focusing on the lower extent of the interest rate hike. However, the higher projection for terminal rate and the maintenance of higher interest rates for a longer period is still supporting the US Dollar Index and impacting the risk-taking capacity of investors.
Projections of St. Louis Fed's President James Bullard state that the interest rate peak will be in a 5.25-5.50% range. This might trigger a further slowdown in economic activities. Analysts at Wells Fargo stated that US Industrial Production fell 0.7% in December and November’s numbers were revised lower. With industrial production has fallen in six of the past eight months, the largest of which being November and December, it is evident that the manufacturing sector is already in recession.
Investors focus on ECB Lagarde’s speech for further action
On Thursday, the speech from the European Central Bank (ECB) President Christine Lagarde will guide investors about the likely monetary policy action in February. Declining energy prices in Eurozone have softened inflation, however, the current inflation rate is still far from the median rate. Therefore, investors should brace for a hawkish commentary from European Central Bank’s Lagarde ahead.
According to economists polled by Bloomberg, the deposit rate will be raised to a peak of 3.25% from its current level of 2% in three steps. The survey shows two half-point hikes at the February and March meetings, followed by a 25 basis-point increase in May or June.
Meanwhile, European Central Bank (ECB) policymaker Francois Villeroy de Galhau said on Wednesday, it's “too early to speculate about what we will do in March.” However, he believed that Lagarde's earlier 50 bps guidance is still valid.
EUR/USD technical outlook
-638097018955186153.png)
EUR/USD is looking to find support around the upward-sloping trendline of the Ascending Triangle chart pattern plotted from January 10 low at 1.0712 on an hourly scale. The horizontal resistance of the aforementioned chart pattern is placed from January 12 high at 1.0867.
The 20-period Exponential Moving Average (EMA) at 1.0800 is acting as a major barrier for the Euro. While, the 200-EMA at 1.0774 is still advancing, which indicates that the upside trend is still solid.
Meanwhile, the Relative Strength Index (RSI) (14) is oscillating in a 40.00-60.00 range, which indicates a consolidation ahead.
- USD/JPY consolidates the previous day’s gains as yields renew multi-month low.
- Downbeat Japan trade numbers, fears of softer demand from China and US recession woes fail to stop JPY bulls.
- US Dollar remains depressed amid softer US data, mixed updates.
USD/JPY holds lower grounds near 128.00 as it fades the previous day’s run-up amid softer Treasury bond yields, as well as downbeat US Dollar, during early Thursday. In doing so, the Yen pair pays little heed to the fears emanating from downbeat foreign trade numbers from Japan and the US recession concerns.
Japan’s Merchandise Trade Balance Total improved to ¥-1,448.5B in December versus ¥-1,652.8B expected and ¥-2,029B previous readings. However, the details suggest easing Exports and Imports from the previous month. While digging more, Reuters mention that China-bound shipments fell for the first time in seven months.
Elsewhere, US Dollar Index (DXY) traces the downbeat US Treasury bond yields, as well as softer US data, to remain pressured around the lowest levels since May 2022, marked the previous day.
That said, US Retail Sales marked the biggest slump in a year while posting 1.1% MoM contraction for December, versus -0.8% market forecasts and -1.0% prior (revised). On the same line, Producer Price Index dropped to the lowest level in six months with -0.5% MoM figure compared to -0.1% expected and 0.2% prior (revised).
On the other hand, the US 10-year Treasury yields refresh four-month low while the two-year counterpart drops to the lowest levels since early October at the latest.
It’s worth mentioning that the yields on the 10-year Japanese Government Bond (JGB) remain pressured around 0.40% after declining 15% on the Bank of Japan’s (BoJ) inaction the previous day.
It should be observed that China-linked optimism also exerts downside pressure on the USD/JPY pair. While fueling the same, Gita Gopinath, the first Deputy Managing Director of the International Monetary Fund (IMF) said, “China could see a sharp recovery in economic growth from the second quarter onwards based on current infection trends after the dismantling of most COVID-19 restrictions.”
Additionally weighing on the USD/JPY price could be the mostly hawkish comments from the Federal Reserve (Fed) policymakers. St. Louis Federal Reserve's President James Bullard said US interest rates have to rise further to ensure that inflationary pressures recede. On the same line, President of the Federal Reserve Bank of Cleveland Loretta Mester praised the Fed’s actions to tame inflation. Further, Kansas City Fed President Esther George mentioned that the central bank must restore price stability, "that means returning to 2% inflation." Recently, Dallas Federal Reserve President Lorie Logan supported a slower rate hike pace but also mentioned possibly a higher stopping point.
Given the lack of major data/events, USD/JPY traders should closely observe the bond market moves, which in turn highlight the yields, for clear directions.
Technical analysis
A clear downside break of the weekly support, now resistance around 128.65, directs USD/JPY bears towards the monthly low of 127.21. Also acting as an immediate downside filter is the May 2022 bottom surrounding 126.35.
- USD/CAD hits a nearly two-week high on Thursday, albeit lacks follow-through.
- Retreating crude oil prices undermines the Loonie and lends support to the major.
- Falling US bond yields keep the USD bulls on the defensive and act as a headwind.
The USD/CAD pair adds to the overnight strong gains and edges higher for the second successive day on Thursday. Spot prices touch a one-and-half-week high during the Asian session, albeit seem to struggle to find acceptance above the 1.3500 psychological mark or build on the momentum beyond the 100-day SMA.
A further pullback in crude oil prices, from the highest level since December 5 touched on Wednesday, undermines the commodity-linked Loonie and acts as a tailwind for the USD/CAD pair. Investors remain concerned about the fuel demand outlook amid growing worries about a deeper global economic downturn. Adding to this, data from the American Petroleum Institute (API) signalled another big weekly build in US crude inventories and exerts pressure on the black liquid.
The US Dollar, on the other hand, is weighed down by the ongoing slide in the US Treasury bond yields, which, in turn, is holding back bulls from placing aggressive bets around the USD/CAD pair. In fact, the
yield on the rate-sensitive two-year US government bond drops to its lowest level since October amid expectations for a less aggressive policy tightening by the Fed. The bets were further lifted by weaker-than-expected US macroeconomic released on Wednesday.
That said, several FOMC members indicated on Wednesday that they will push on with more interest rate hikes even as inflation shows signs of easing and economic activity is slowing. Apart from this, looming recession fears temper investors' appetite for riskier assets. This is evident from a softer tone around the equity markets, which is seen benefitting the safe-haven greenback and supports prospects for a further appreciating move for the USD/CAD pair.
Market participants now look forward to the US economic docket, featuring the release of the Philly Fed Manufacturing Index, the usual Weekly Initial Jobless Claims and housing market data. This, along with speeches by Fed officials, the US bond yields and the broader risk sentiment, might influence the USD demand later this Thursday. Apart from this, traders will take cues from oil price dynamics to grab short-term opportunities around the USD/CAD pair.
Technical levels to watch
- WTI crude oil refreshes weekly low as it breaks short-term key support.
- Convergence of 50-SMA, 61.8% Fibonacci retracement restricts immediate downside.
- Two-week-old ascending support line, 76.85 support confluence to test the bears.
- Upside momentum remains elusive below $81.00 round figure.
WTI takes offers to renew weekly bottom around $78.50 during early Thursday in Europe. In doing so, the black gold bears cheer the downside break of a one-week-old ascending trend line support, now resistance, amid bearish MACD signals and downbeat RSI conditions.
It’s worth noting, however, that a convergence of the 50-SMA and the 61.8% Fibonacci retracement level of the quote’s weakness during the early December, near $78.30, appears a tough nut to crack for the short-term WTI bears.
In a case where the energy benchmark remains weaker past $78.30, an upward-sloping support line from January 05, close to $77.50, could probe the oil bears.
Also acting as the key downside filter is the $76.85-80 support confluence that encompasses the 200-SMA and the 50% Fibonacci retracement level of the aforementioned move in December.
It should be observed that the RSI is declining towards the oversold territory and hence the quote’s downside past $76.80 appears difficult.
Meanwhile, recovery moves need to cross the support-turned-resistance line, close to $80.30, to recall the WTI bulls.
Even so, a horizontal area comprising the levels marked during late December and early January, close to $81.00-10, may further check the upside momentum.
WTI: Four-hour chart
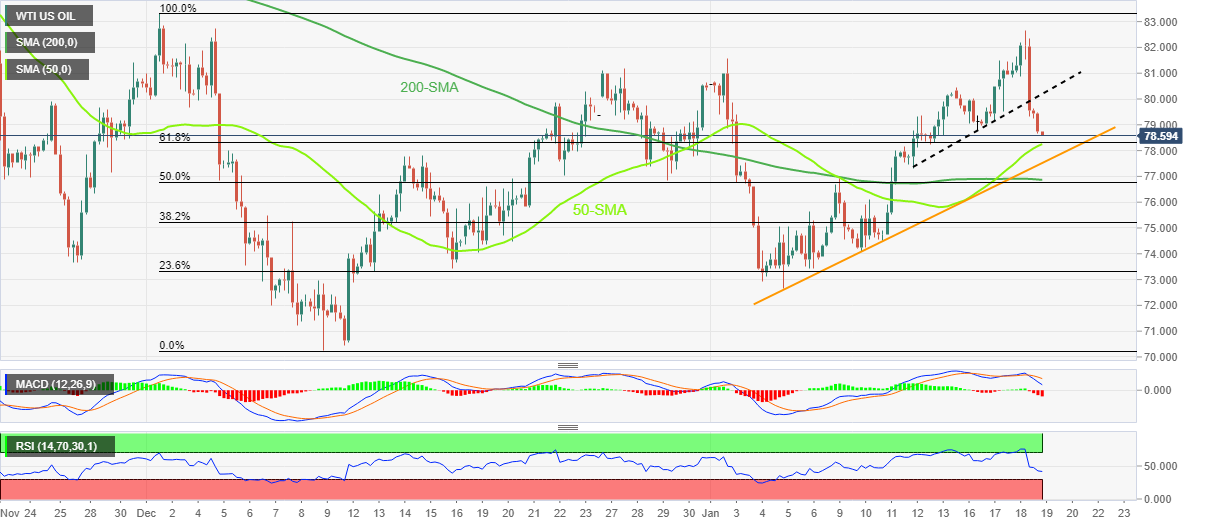
Trend: Further downside expected
- USD/INR holds lower ground as bears cheer three-day downtrend amid softer US Dollar.
- Downbeat US data, mixed Fedspeak weigh on the greenback.
- Optimism surrounding China, softer Oil price adds strength to the INR.
USD/INR stays pressured for the third consecutive day, mildly offered near 81.30 amid the initial hour of Thursday’s Indian trading session. In doing so, the Indian Rupee (INR) pair cheers the broad US Dollar weakness, as well as firmer prices of Oil. Also keeping the INR firmer is the cautious optimism in Asia, mainly due to upbeat concerns surrounding China and softer yields.
WTI crude oil remains pressured for the second consecutive day as it renews the weekly low to $78.25 due to downbeat US data that renewed the recession fears and superseded hopes of more energy demand from China.
US Dollar Index (DXY) snaps three-day rebound, down 0.10% intraday near 102.30, amid mixed Fedspeak and downbeat US data. That said, US Retail Sales marked the biggest slump in a year while posting 1.1% MoM contraction for December, versus -0.8% market forecasts and -1.0% prior (revised). On the same line, Producer Price Index dropped to the lowest level in six months with -0.5% MoM figure compared to -0.1% expected and 0.2% prior (revised).
On the other hand, St. Louis Federal Reserve's President James Bullard said US interest rates have to rise further to ensure that inflationary pressures recede. On the same line, President of the Federal Reserve Bank of Cleveland Loretta Mester praised the Fed’s actions to tame inflation. Further, Kansas City Fed President Esther George mentioned that the central bank must restore price stability, "that means returning to 2% inflation." Recently, Dallas Federal Reserve President Lorie Logan supported a slower rate hike pace but also mentioned possibly a higher stopping point.
It should be noted that Gita Gopinath, the first Deputy Managing Director of the International Monetary Fund (IMF) said, “China could see a sharp recovery in economic growth from the second quarter onwards based on current infection trends after the dismantling of most COVID-19 restrictions.”
Amid these plays, S&P 500 Future print mild losses while the US 10-year Treasury yields remain depressed near the lowest level in four months. Further, the stocks in the Asia-Pacific zone trade mixed, mostly firmer, by the press time.
Looking forward, a light calendar and a lack of clarity on macros can keep disturbing USD/INR traders. However, the yields may exert downside pressure on the US Dollar and can help the pair bears to keep the reins.
Technical analysis
Failure to cross the 100-DMA hurdle, around 81.75 by the press time, directs USD/INR toward the monthly bottom surrounding 81.07.
- GBP/USD is finding an immediate cushion above 1.2300 as USD Index displays a subdued performance.
- US Treasury yields have fallen to fresh multi-month lows amid a decline in inflation projections.
- Minor softening of UK inflation is insufficient to trim hawkish BoE bets.
The GBP/USD pair is looking for intermediate support around 1.2320 in the Asian session. The cable is aiming to resume its upside journey as the US Dollar Index (DXY) is displaying a subdued performance, failing to capitalize on Wednesday’s V-shape recovery. Also, falling US Treasury yields have weighed on the USD Index.
The return generated by US Treasury bonds was weighed down by solidifying signs of softening inflation. The 10-year US Treasury yields recorded a fresh four-month low below 3.36%. And, the two-year US Treasury yields dropped to a fresh three-month low near 4.07%. The lower-than-projected United States Producer Price Index (PPI) report and weaker retail demand have bolstered the odds of deceleration in the pace of further policy tightening by the market participants.
Market sentiment is still not supporting the risk-perceived currencies amid the weaker risk-taking capacity of the market participants. S&P500 futures are facing heat amid uncertainty over US-China trade relations.
China’s Vice Premier Liu He said in a meeting with US Treasury Secretary Janet Yellen on Wednesday, “US-China relationship is highly consequential,” adding that he “hopes they can work together.” He further added that “Two countries need ‘serious communication’ and coordination on climate change, macroeconomic issues, and others.”
On the United Kingdom front, inflationary pressures have softened as per the December’s Consumer Price Index (CPI) report, released on Wednesday. The headline inflation has been eased to 10.5% on an annual basis and the core CPI that excludes oil and food prices remained steady at 6.3%. The extent of the decline in the inflation rate is not sufficient to infuse confidence among the market participants that UK inflation is easing on a promising note. Therefore, investors should brace of continuation extreme hawkish monetary policy by the bank of England (BoE) ahead.
- Market sentiment remains negative as lower US PPI has pushed S&P500 valuations to the expensive side.
- Firms have been forced to trim the prices of their offerings to match weaker demand.
- Lower US PPI-inspired downward revision for inflation projections has sent US Treasury yields to a multi-month low.
Intense sell-off by the market participants in the United States equities after a weak US Producer Price Index (PPI) December report and monthly Retail Sales on Wednesday has been carry-forwarded to Thursday morning. S&P500 futures are facing the heat as firms have been forced to trim the prices of goods and services at their factory gates to maintain equilibrium with declining retail demand.
At the press time, S&P500 futures displayed mild losses and further dropped to near 3,925.00, portraying a deep shrink in investors’ risk appetite.
The headline US PPI dropped to 6.2% against the consensus of 6.8% on an annual basis. And, the core PPI that excludes oil and food prices was trimmed to 5.5% from the expectations of 5.9%. Apart from that, monthly Retail Sales contracted heavily by 1.1% vs. the estimates of -0.8%. As producers have been forced to trim offered prices to maintain the overall sales, valuations of various firms have scaled to the expensive side amidst the earnings season, which forced investors to dump American stocks. This might also force producers to trim the scale of their offerings ahead, which could trigger a slowdown due to a fall in production activities.
Lower-than-anticipated US PPI report is inspiring for a further decline in the inflation projections. This has bolstered the case of deceleration in the pace of hiking interest rates by the Federal Reserve (Fed) in monetary policy meetings ahead.
Reuters reports that Philadelphia Fed President Patrick Harker reiterated on Wednesday that he's ready for the US central bank to move to 25-basis-point interest rate hikes amid some signs that hot inflation is cooling off.
- AUD/USD extends the previous day’s pullback from five-month high, renews weekly low.
- Confirmation of bearish chart pattern, sustained break of 50-SMA favor sellers.
- 200-SMA, monthly support line probe bears even as oscillators suggest further downside.
AUD/USD remains on the back foot for the second consecutive day after refreshing the multi-month high, down half a percent as bears poke the 0.6900 threshold during early Thursday.
In doing so, the Aussie pair justifies the previous confirmation of the two-week-old rising wedge bearish chart pattern, as well as the 50-SMA breakdown.
Also favoring the AUD/USD pair in refreshing the weekly low is the downbeat RSI (14) line, not oversold, as well as the bearish MACD signals.
That said, the rising wedge confirmation signals the theoretical target of around 0.6630 but the RSI line has limited room before it hits the oversold territory. As a result, the 200-SMA and an upward-sloping support line from December 20, 2022, respectively near 0.6800 and 0.6785, could challenge the AUD/USD sellers.
Meanwhile, recovery moves need to cross the 50-SMA hurdle of 0.6945 to restore bullish confidence.
Following that, the lower line of the stated wedge, close to 0.6980, precedes the 0.7000 psychological magnet to probe the upside momentum.
In a case where the AUD/USD price remains firmer past 0.7000, the monthly high of 0.7065 and the August 2022 peak surrounding 0.7135, will gain the market’s attention.
Overall, AUD/USD is likely to decline further but the downside room appears limited.
AUD/USD: Four-hour chart
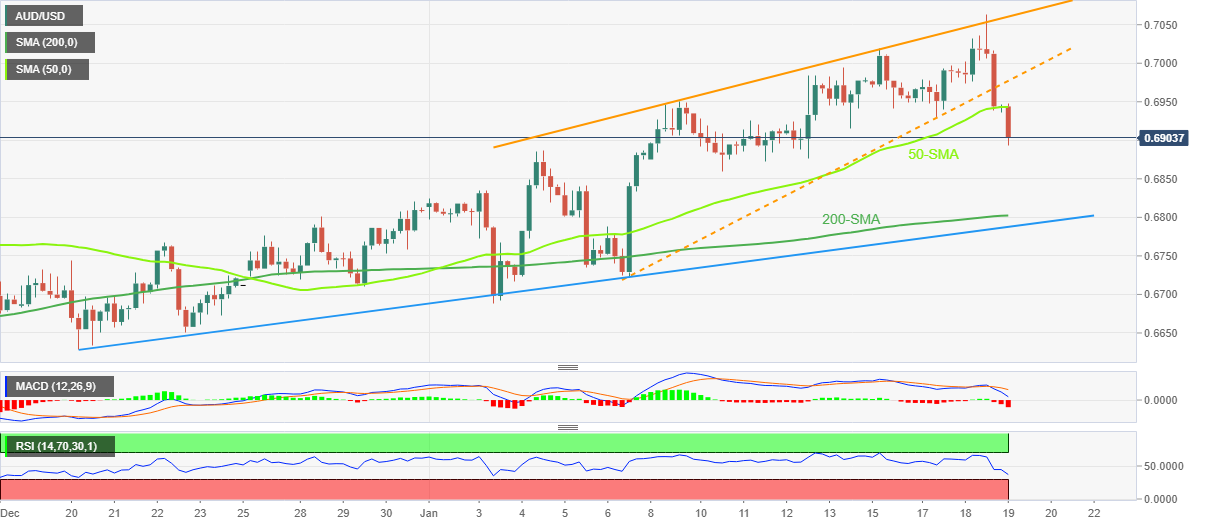
Trend: Further downside expected
- Gold price prints four-day downtrend as US Dollar licks its wounds near multi-day low.
- Failure to stay beyond $1,910 hurdle keeps XAU/USD bears hopeful amid mixed sentiment.
- Fed talks, China concerns should be watched carefully for clear directions.
Gold price (XAU/USD) remains depressed around the weekly low near the $1,900 threshold, declining for the fourth consecutive day, as the US Dollar bounces off a multi-day low amid contrasting signals from the US data and Federal Reserve (Fed) officials. Also challenging the Gold price are the mixed concerns surrounding China, one of the biggest XAU/USD consumers. Furthermore, a pause in the US Treasury bond yields amid fresh recession fears also weighs on the Gold price amid a light calendar. That said, central bankers could entertain the Gold traders ahead of the likely inactive week due to the Chinese Lunar New Year holidays.
Also read: Gold Price Forecast: Recession fears weighing on XAU/USD
Gold Price: Key levels to watch
The Technical Confluence Detector shows that the gold price grinds lower past the $1,910 key resistance comprising the 50-HMA, 5-DMA and Middle band of the Bollinger on the hourly play.
Also keeping the Gold sellers hopeful is the metal’s recent dip below the previous low on the Four-hour (4H).
It’s worth noting, however, that the $1,900 threshold that encompasses Fibonacci 38.2% on one week and the Lower Bollinger on 4H appears a tough nut t to crack for short-term XAU/USD bears.
Following that, a slump towards the $1,890 support confluence, including the Fibonacci 61.8% on weekly and 10-DMA, can’t be ruled out.
Meanwhile, recovery moves need validation from the $1,910 hurdle to recall the Gold buyers. Also challenging XAU/USD bulls is the Pivot point one-month R3, near $1,920.
It should be noted that the previous weekly high of around $1,925 and the $1,930 could act as the last defense of the Gold bears.
Here is how it looks on the tool
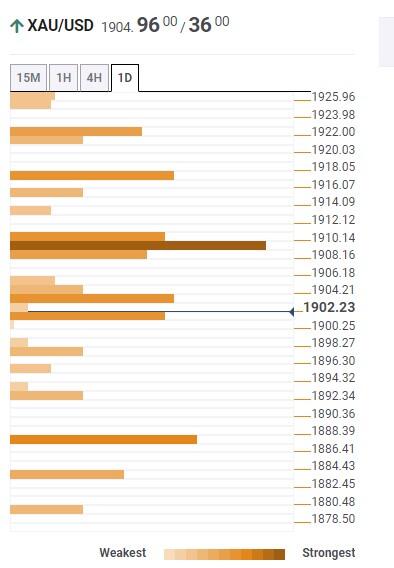
About Technical Confluences Detector
The TCD (Technical Confluences Detector) is a tool to locate and point out those price levels where there is a congestion of indicators, moving averages, Fibonacci levels, Pivot Points, etc. If you are a short-term trader, you will find entry points for counter-trend strategies and hunt a few points at a time. If you are a medium-to-long-term trader, this tool will allow you to know in advance the price levels where a medium-to-long-term trend may stop and rest, where to unwind positions, or where to increase your position size.
| Raw materials | Closed | Change, % |
|---|---|---|
| Silver | 23.45 | -1.93 |
| Gold | 1904.08 | -0.22 |
| Palladium | 1719.14 | -0.93 |
- USD/CHF consolidates recent losses around the lowest levels since November 2021.
- A two-month-old bearish channel, downbeat oscillators keep sellers hopeful.
- Bear cross, clear downside break of key ascending trend line adds strength to the bearish bias.
- Recovery remains elusive unless the quote stays below 200-DMA.
USD/CHF picks up bids to lick its wounds around the lowest levels since November 2021, marked the previous day, during Thursday’s quiet Asian session.
Even so, the Swiss currency (CHF) pair remains on the bear’s radar as it stays inside a bearish channel connecting multiple levels marked since November 2022.
Also, the impending bear cross on the MACD and descending RSI line, not oversold, suggest the quote’s further downside.
Above all, the USD/CHF pair’s sustained trading below the key support line from mid-2021, as well as the 100-DMA’s piercing off the 200-DMA from above, known as the “death cross”, offer extra reasons to expect the quote’s further weakness.
It should be noted that the 61.8% Fibonacci retracement level of the pair’s June 2021 to November 2022 upside, near 0.9390, acts nearby hurdle for the pair.
That said, a broad bearish range between 0.9040 and 0.9320 restrict short-term USD/CHF moves ahead of the multi-month-old previous support line, around 0.9420.
In a case where USD/CHF manages to cross the 0.9420 hurdle, the 100-DMA and the 200-DMA, respectively near 0.9600 and 0.9640 could act as the last defenses of the USD/CHF bears.
On the contrary, a downside break of 0.9040 could witness the 0.9000 psychological manget as an extra filter to the south before challenging the mid-2021 bottom surrounding 0.8925.
USD/CHF: Daily chart
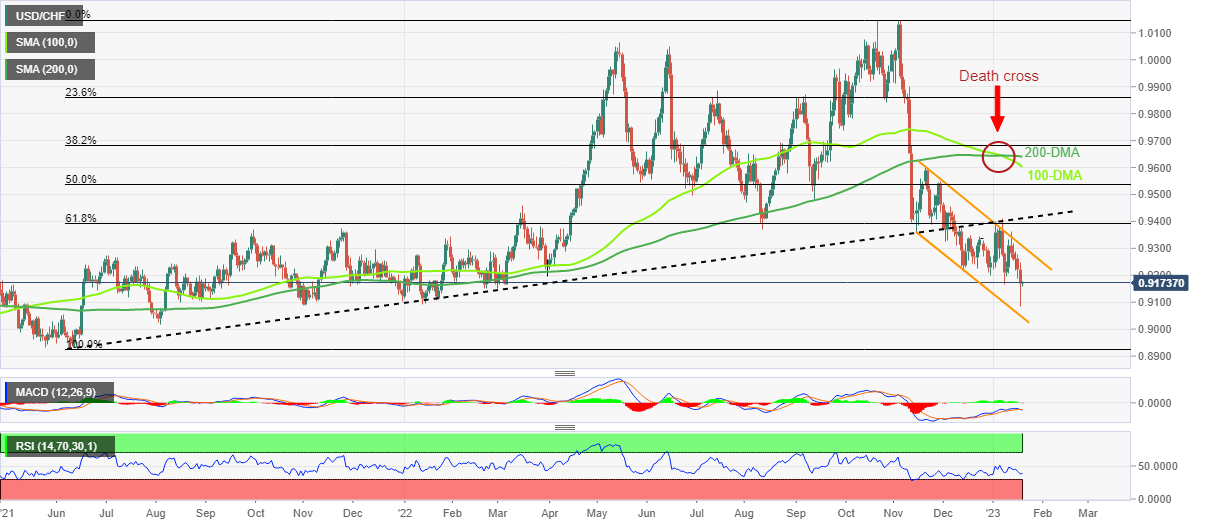
Trend: Further downside expected
Takatoshi Ito, a contender to succeed Bank of Japan (BoJ) Governor Haruhiko Kuroda, said on Thursday that “the BoJ's next step may be to widen band around its 10-year yield target,” adding that the central bank could raise yield cap to 0.75% or 1.0% by mid-year.”
Key quotes
BoJ likely won't tweak yield curve control at least until April.
BoJ may abandon negative rates this year depending on inflation, wage developments.
If BoJ were to abandon yield curve control, it would need to conduct a comprehensive examination of its policy framework.
Market reaction
At the time of writing, USD/JPY is sustaining its rebound near 128.60, still down 0.20% on the day.
- USD/JPY bulls eye a break of the key trendline resistance.
- Bears eye a break of the critical support structure.
USD/JPY bulls continue to hold the fort at the key support structure despite the surprising conclusions of the Bank of Japan's recent deliberations. The following illustrates the prospects of a downside continuation on the front side of the daily trendline resistance and M-formation's neckline on the daily chart:
USD/JPY daily chart

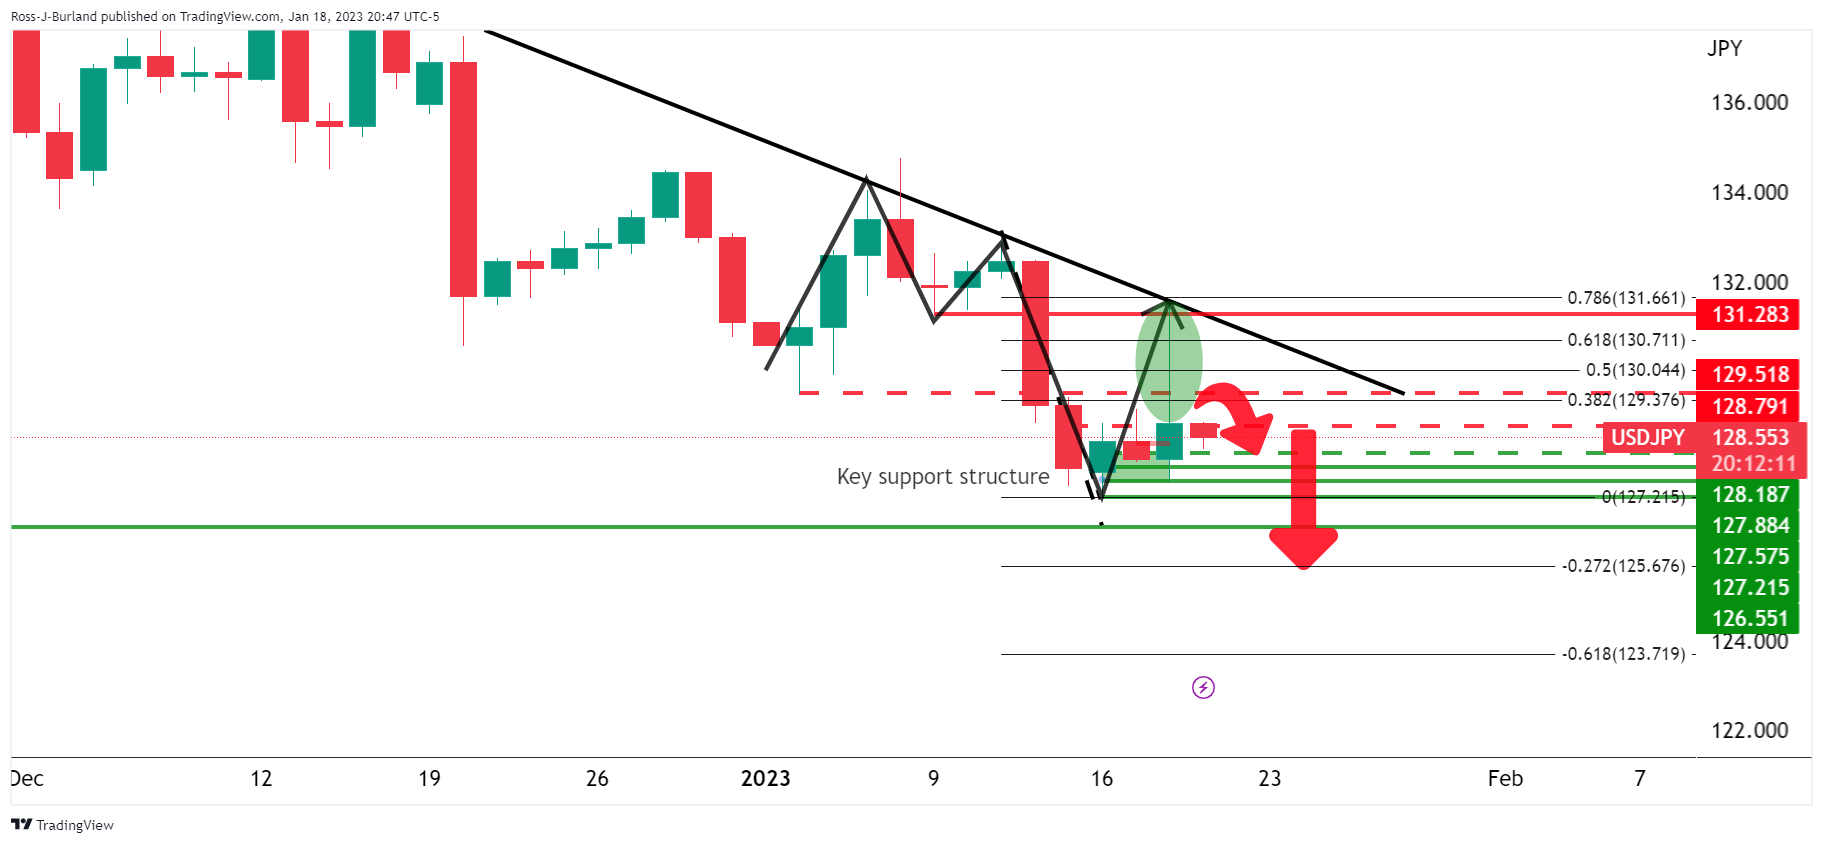
As seen, the support structure in the 127.70s is holding up and the price is correcting towards the 38.2% ratio, bar the BoJ's rally beyond during the volatility where the trendline was already touched.
A break of 126.50 opens the risk of a significant move lower into the bullish cycle's trend:
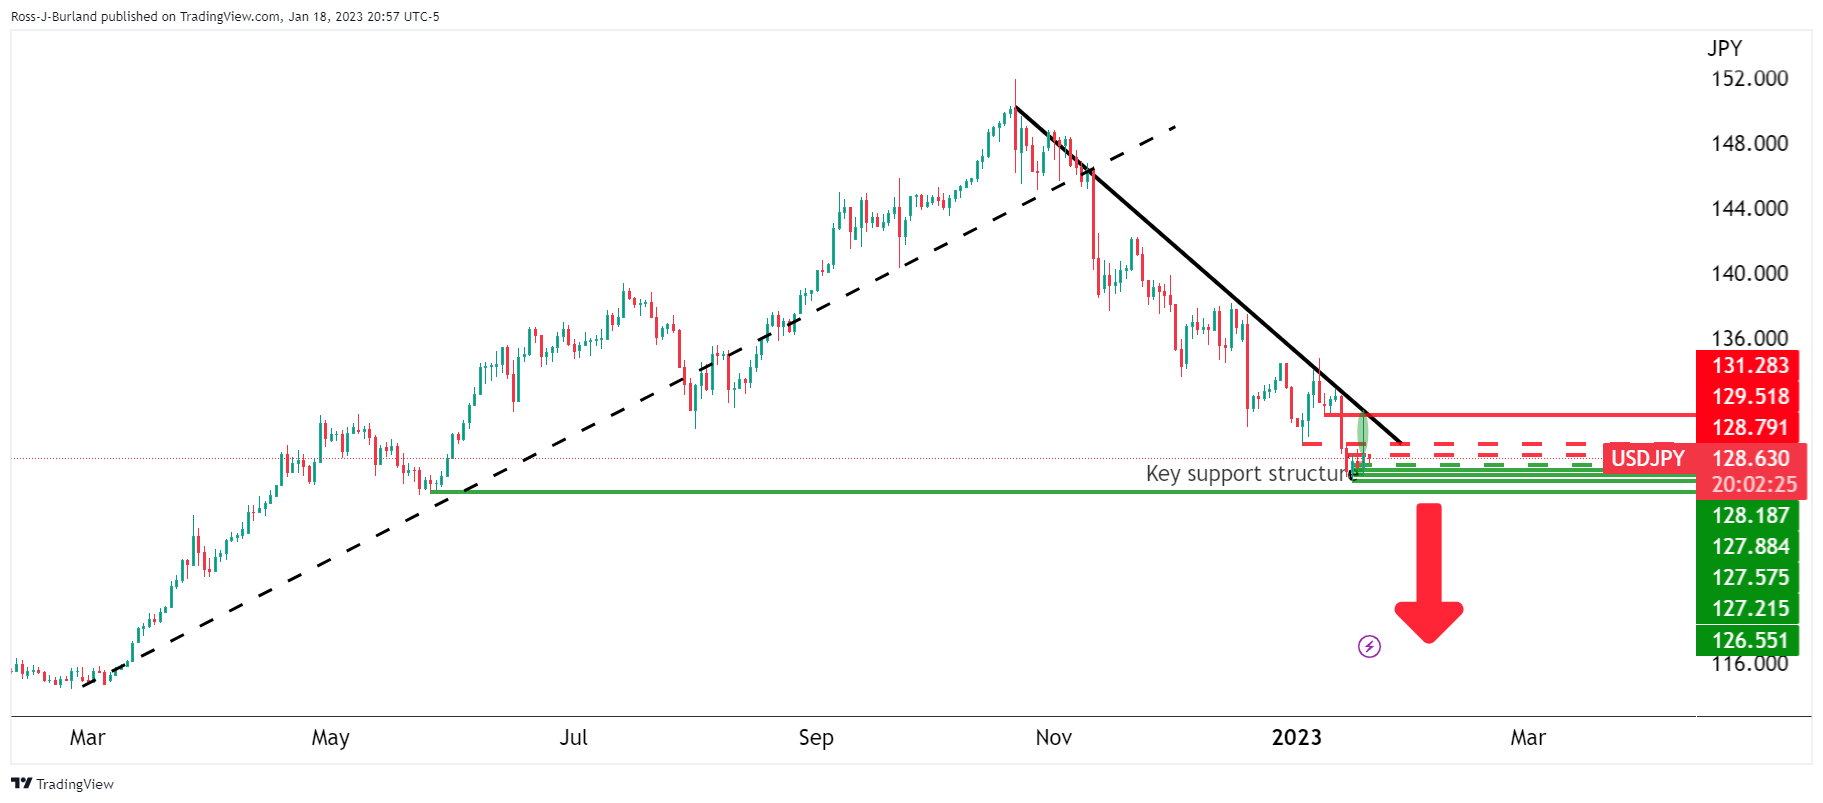
This makes the upside more appealing as the bulls seek to defend against such a scenario and puts the trendline in jeopardy.
- EUR/USD has continued to juggle below 1.0800 as the focus has shifted to ECB Lagarde’s speech.
- Weak retail demand and lower US PPI resulted in a sell-off in the S&P500 futures.
- The speech from ECB’ Lgarade will provide cues about the likely monetary policy action ahead.
The EUR/USD pair is displaying a lackluster performance below the critical resistance of 1.0800 in the Asian session. The major currency pair has turned sideways as investors are awaiting the speech from European Central Bank (ECB) President Christine Lagarde for fresh impetus.
The risk-off profile is turning huge further as the carry-forwarded selling pressure in the S&P500 futures is demonstrating a weaker risk appetite of the market participants. Weakness in United States equities was driven by the lower-than-anticipated Producer Price Index (PPI) and Retail Sales report. Poor retail demand has triggered the risk of lower sales, which might impact the operating margins of various firms.
Hawkish commentary from Federal Reserve (Fed) policymakers resulted in a V-shape recovery for the US Dollar Index (DXY). The majority of Fed policymakers are favoring slowing the pace of hiking interest rates but haven’t trimmed terminal rate projections. Philadelphia Fed President Patrick Harker expects terminal rate projection in a 5.25-5.50% range and achievement of 2% inflation in CY2025, as reported by Reuters.
The US Treasury yields are displaying volatility as investors are in a fix on whether to provide strength to the yields due to hawkish commentary from Fed policymakers or to build shorts amid lower PPI-inspired drop in inflation projections.
On the Eurozone front, the speech from ECB’s Lagarde will provide fresh cues about the likely monetary policy action in February. Earlier, Bloomberg reported that ECB policymakers are starting to consider a slower pace of interest-rate hikes after a likely 50 basis-point step in February. “The rapid energy-driven decline in headline inflation is giving the ECB a bit of breathing space, but policymakers will remain focused on persistent underlying pressures for now.
- USD/CAD grinds higher as buyers jostle with the key hurdle.
- DXY, yields stabilize after a volatile day, lack of major data/events adds to market’s inaction.
- Mixed Fed talks, China headlines join US recession fears to weigh on Oil price.
USD/CAD seesaws near 1.3500-3510 as bulls struggle to overcome the key resistance, namely the 100-DMA, during early Thursday. In doing so, the Loonie pair justifies the steady US Dollar Index (DXY) amid inactive markets. However, the downbeat prices of Canada’s key export item, namely WTI crude oil, underpin the upside momentum.
That said, WTI crude oil sellers poke the weekly low surrounding $78.80 as downbeat US data renewed the recession fears, which in turn superseded hopes of more energy demand from China.
On Wednesday, US Retail Sales marked the biggest slump in a year while posting 1.1% MoM contraction for December, versus -0.8% market forecasts and -1.0% prior (revised). On the same line, Producer Price Index dropped to the lowest level in six months with -0.5% MoM figure compared to -0.1% expected and 0.2% prior (revised).
Alternatively, Gita Gopinath, the first Deputy Managing Director of the International Monetary Fund (IMF) said, “China could see a sharp recovery in economic growth from the second quarter onwards based on current infection trends after the dismantling of most COVID-19 restrictions.”
At home, a softening of the Canada Industrial Production and Raw Material Price Index for December also favor the USD/CAD buyers. That said, the industrial output contracted 1.1% versus -0.3% forecast and 0.5% revised prior while the Raw Material Price slumped to -3.1% from -0.8% prior and -1.3% market consensus.
It’s worth mentioning that the mixed comments by the Fed policymakers also confuse USD/CAD bulls amid an absence of major data/events. St. Louis Federal Reserve's President James Bullard said US interest rates have to rise further to ensure that inflationary pressures recede. On the same line, President of the Federal Reserve Bank of Cleveland Loretta Mester praised the Fed’s actions to tame inflation.
Further, Kansas City Fed President Esther George mentioned that the central bank must restore price stability, "that means returning to 2% inflation." Recently, Dallas Federal Reserve President Lorie Logan supported a slower rate hike pace but also mentioned possibly a higher stopping point.
Against this backdrop, S&P 500 Future print mild losses while the US 10-year Treasury yields remain inactive around the lowest level in four months.
Looking forward, a light calendar and mixed risk catalysts could challenge the USD/CAD traders ahead of Friday’s key Retail Sales.
Technical analysis
Although the 100-DMA hurdle challenges the USD/CAD pair’s immediate upside near 1.3510, the looming bull cross on the MACD and steady RSI (14) keep buyers hopeful of witnessing further advances of the Loonie pair.
In recent trade today, the People’s Bank of China (PBOC) set the yuan (CNY) at 6.7674 vs. the previous fix of 6.7602 and the prior close of 6.7620.
About the fix
China maintains strict control of the yuan’s rate on the mainland.
The onshore yuan (CNY) differs from the offshore one (CNH) in trading restrictions, this last one is not as tightly controlled.
Each morning, the People’s Bank of China (PBOC) sets a so-called daily midpoint fix, based on the yuan’s previous day's closing level and quotations taken from the inter-bank dealer.
- NZD/USD is stuck in a ranger around the Aussie data.
- Bears need to break current lows and support or face a correction into 0.6470.
NZD/USD has been pressured on the back of the Australian jobs report but the bulls are moving in on anticipation that the data will do little to steer the Reserve Bank of Australia away from its tightening bias. At the time of writing, NZD/USD is down some 0.1% and has travelled between a low of 0.6420 and 0.6449 so far on the day.
The Aussie labour report, released by the Australian Bureau of Statistics, was released as follows:
- Australia December Employment -14.6k s/adj (Reuters poll: +22.5k).
- Unemployment rate +3.5 pct, s/adj (Reuters poll: +3.4).
- Full-time employment +17.6k s/adj.
- Participation rate +66.6 pct, s/adj (Reuters poll: +66.8 pct).
Meanwhile, speculation has been rising that the RBA could be nearing the peak of its interest rate cycle while hopes for improved trade ties with China support the view that Australia will avoid recession this year. Nevertheless, domestic dada had been showing signs of resilience and has been strengthening expectations of another 25 bps rate hike from the RBA next month.
''While the Australian economy is expected to slow overall this year, recessionary risks appear low.,'' analysts at Rabobank had argued. ''This should increase the resilience of the AUD and provide insulation against headwinds implied by forecasts of a slowdown in global growth.''
NZD/USD technical analysis
As for the Kiwi, which tends to trade in the same direction as the Aussie, should the bulls commit to the bid, then the following chart analysis could play out:
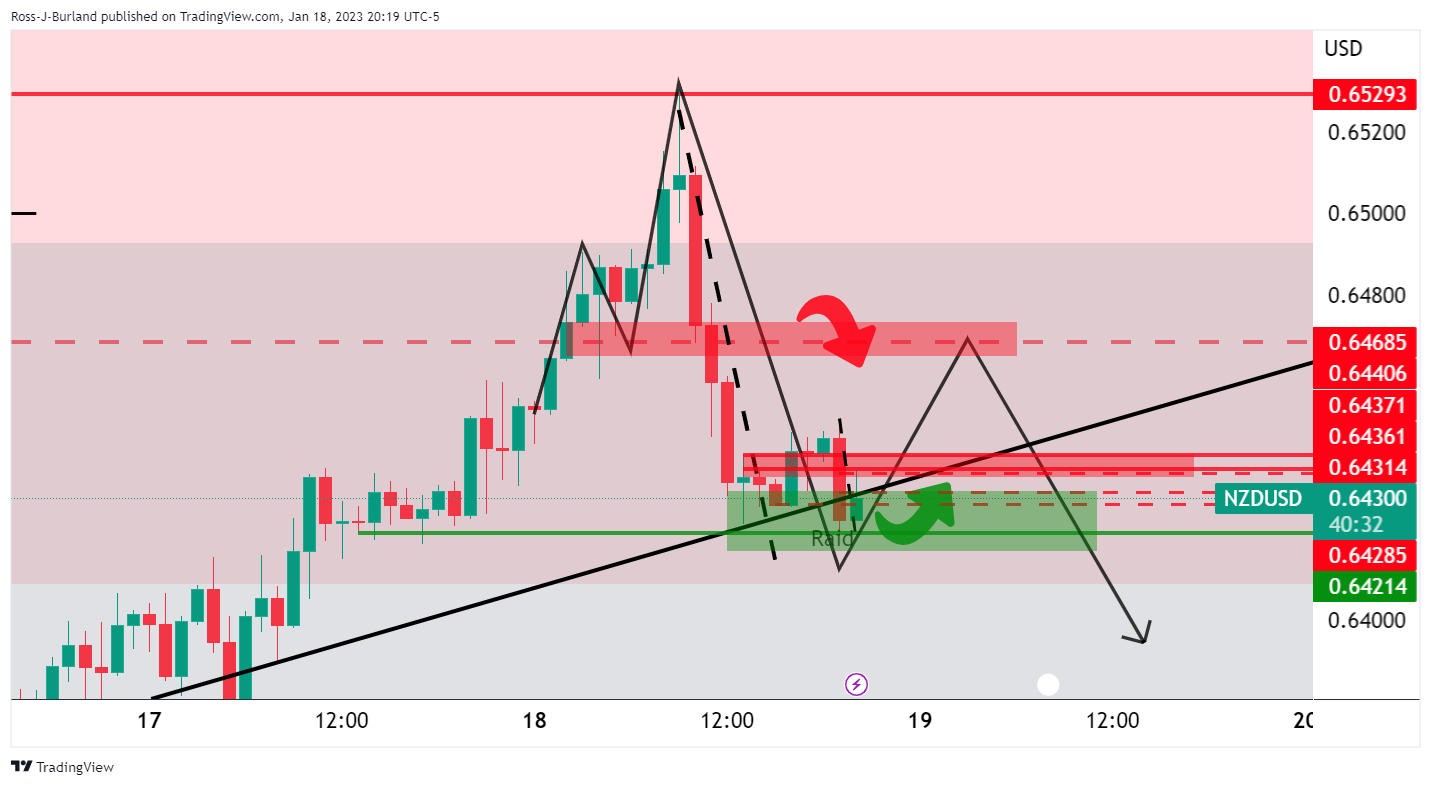
The bulls need to get over 0.6440/50 for a look into the M-formation's neckline near 0.6470 for the day ahead. On the other hand,m should the micro M-formation's neckline hold up, a subsequent break of the current support opens the risk of a considerable move to the downside in an extension of the bearish correction:

- AUD/NZD has dropped to near 1.0750 on downbeat Australian Employment data.
- A one-time weak employment report might not de-rail the RBA from its path of policy tightening.
- This week, the interest rate decision from the PBoC will be of utmost importance.
The AUD/NZD pair has witnessed a sell-off by the market participants after the release of downbeat Australian Employment data. Higher interest rates by the Reserve Bank of Australia (RBA,) in its fight against soaring inflation, has forced the firms to lay off their workforce due to a decline in investment avenues and expansion plans.
In December, the Australian labor market has been shrunk by 14.6K employees while the street was expecting fresh addition of 22.5k jobs. The Unemployment Rate has jumped to 3.5% against the consensus and the former release of 3.4%.
The release of the downbeat employment data could be music to the ears of the RBA as it making consistent efforts in achieving price stability. Lower employment numbers might result in weaker retail demand, which will trim the mammoth household spending in the Australian economy. The Australian Bureau of Labor Statistics reported an 11.4% increase in consumer spending in November compared to the same time last year.
A one-time weak employment report is not expected to derail the RBA policymakers from their path of policy tightening, therefore, investors should brace for a continuation of interest rate hikes further.
Going forward, investors from the smallest continent and New Zealand will focus on the interest rate decision by the People’s Bank of China (PBoC), which is scheduled for Friday. Considering the deflation in the Producer’s Price Index (PPI) and reopening reforms after the Covid-19 epidemic, the PBoC might look for policy easing to spurt the pace of economic activities. It is worth noting that Australia and New Zealand are major trading partners of China and China’s monetary policy decision may have a significant impact on them.
- GBP/USD retreats from five-week high, snaps two-day winning streak.
- Break of immediate support line, downbeat oscillators favor bears.
- Convergence of 100-HMA, fortnight-long ascending trend line appears a tough nut to crack for sellers.
GBP/USD takes offers to refresh the intraday low near 1.2320 after breaking an immediate support line during early Thursday. In doing so, the Cable pair extends late Wednesday’s pullback from the highest level since December 14, 2022, while printing the first daily loss in three.
Not only the downside break of the immediate trend line but bearish MACD signals and the RSI (14) pullback from the overbought territory also suggest the continuation of the latest declines by the Cable pair.
That said, the tops marked during Monday and Tuesday, around 1.2290, offer nearly support to the quote. However, a convergence of the 100-Hour Moving Average (HMA) and an ascending trend line from January 06, close to 1.2250 by the press time, could challenge the GBP/USD bears afterward.
In a case where the pair remains bearish past the 1.2250 support confluence, the 200-HMA level near the 1.2200 round figure could act as the final defense of the GBP/USD buyers.
Alternatively, recovery moves need to cross the support-turned-resistance line stretched from Tuesday, close to 1.2350 by the press time.
Following that, a run-up towards the 1.2400 round figure and the recent peak surrounding 1.2435 can’t be ruled out. It should be observed that the previous monthly peak near 1.2450 will act as an additional upside filter to watch for the GBP/USD bulls.
GBP/USD: Hourly chart

Trend: Limited downside expected
- AUD/USD has stretched its south-side journey to near 0.6900 as the Australian labor market shrinks.
- The Australian economy reported a lay-off in December. The Unemployment Rate rose to 3.5%.
- Investors’ risk appetite has trimmed further as the S&P500 futures continued their downside journey.
The AUD/USD pair has extended its downside journey to near 0.6900 as the Australian Bureau of Statistics has reported weaker-than-projected Employment (Dec) data. The Australian labor market has witnessed a lay-off of 14.6K employees while the street was expecting an addition of fresh 22.5k jobs. Also, the Unemployment Rate has climbed to 3.5% vs. the expectation and the prior release of 3.4%.
No doubt, the rising jobless rate is negative for the Australian economy, however, it will provide a sense of relief to the Reserve Bank of Australia (RBA). RBA Governor Philip Lowe has hiked the Official Cash Rate (OCR) to 3.10% in its fight against stubborn inflation and it seems that it has started impacting the labor market
Australian Property Investor (API) news report claimed on Wednesday that “Regardless of the pain felt by homeowners trying to meet mortgage repayments, recent buyers staring into the abyss of negative equity, or property prices falling at the fastest pace in memory, any hope that rate rises might abate soon appears slim. They further added that the continuous rise in household spending, as increased by 11.4% in November, is responsible for bulking interest rates.
The Australian Dollar has been punished by weaker Employment data and lower demand for risk-perceived assets. Investors’ risk appetite has trimmed further as the S&P500 futures have resumed their downside journey after a bearish Wednesday. Growing traction for the risk aversion theme is supporting the US Treasury yields. The return generated by the 10-year US Treasury bonds has rebounded above 3.38%.
- AUD/JPY takes offers to refresh intraday low, extends the previous day’s pullback from one-month high.
- Australia Unemployment Rate increased, Employment Change turned negative in December.
- Treasury bond yields keep the post-BoJ south-run as most Japan companies ready the higher wages.
AUD/JPY renews its intraday low near 88.85 after Australia’s downbeat jobs report for December on early Thursday. In doing so, the cross-currency pair also takes clues from the downbeat Treasury bond yields amid mixed sentiment in the market.
That said, Australia’s headline Employment Change turned negative on a seasonally adjusted basis, printing -14.6K figure versus 22.5K expected and 64K prior. Further, the Unemployment Rate also rose to 3.5% compared to the market consensus of witnessing no change in the 3.4% previous readings.
Also read: Aussie labour report weighs on AUD to fresh sessison lows
Elsewhere, the downbeat US Treasury bond yields also weighed on the AUD/JPY prices. The Bank of Japan’s (BOJ) surprise inaction and receding fears of the Federal Reserve’s (Fed) aggressive monetary policy actions drowned the United States Treasury bond yields on Wednesday. That said, the BOJ left monetary policy and the interest rates unchanged but the US 10-year Treasury bond yields dropped the most in 10 weeks, pressured around the four-month low near 3.37% by the press time.
It should be noted that the mixed concerns surrounding China and fears of more inflation in Japan, due to the latest Reuters Corporate survey suggested the wage increase by major firms, also exert downside pressure on the AUD/JPY prices.
Also read: Reuters Corporate Survey: Most Japan firms heed PM Kishida's call to raise wages this year
Amid these plays, S&P 500 Futures remain directionless while the stocks in Australia and Japan contradict each other as Japan’s Nikkei drops 1.05% but Australia’s ASX 200 rises 0.25% at the latest.
Looking forward, a lack of major data/events may allow the AUD/JPY traders to extend the latest bearish move. However, the Treasury bond yields will be important to watch for clear directions.
Technical analysis
Failure to provide a daily close beyond the 21-DMA, around 89.80 by the press time, directs AUD/JPY towards the monthly support line, at 87.90 by the press time.
The Aussie labour report, released by the Australian Bureau of Statistics, has been released as follows:
- Australia December Employment -14.6k s/adj (Reuters poll: +22.5k).
- Unemployment rate +3.5 pct, s/adj (Reuters poll: +3.4).
- Full-time employment +17.6k s/adj.
- Participation rate +66.6 pct, s/adj (Reuters poll: +66.8 pct).
The data is a disappointment and is weighing on the Aussie Dollar.
AUD/USD update
AUD/USD broke below the channel support and the data is supporting the case for a continuation. However, should 0.6915 structure hold, then there are going to be prospects of a correction into the bearish impulse with the 0.6970s eyed:
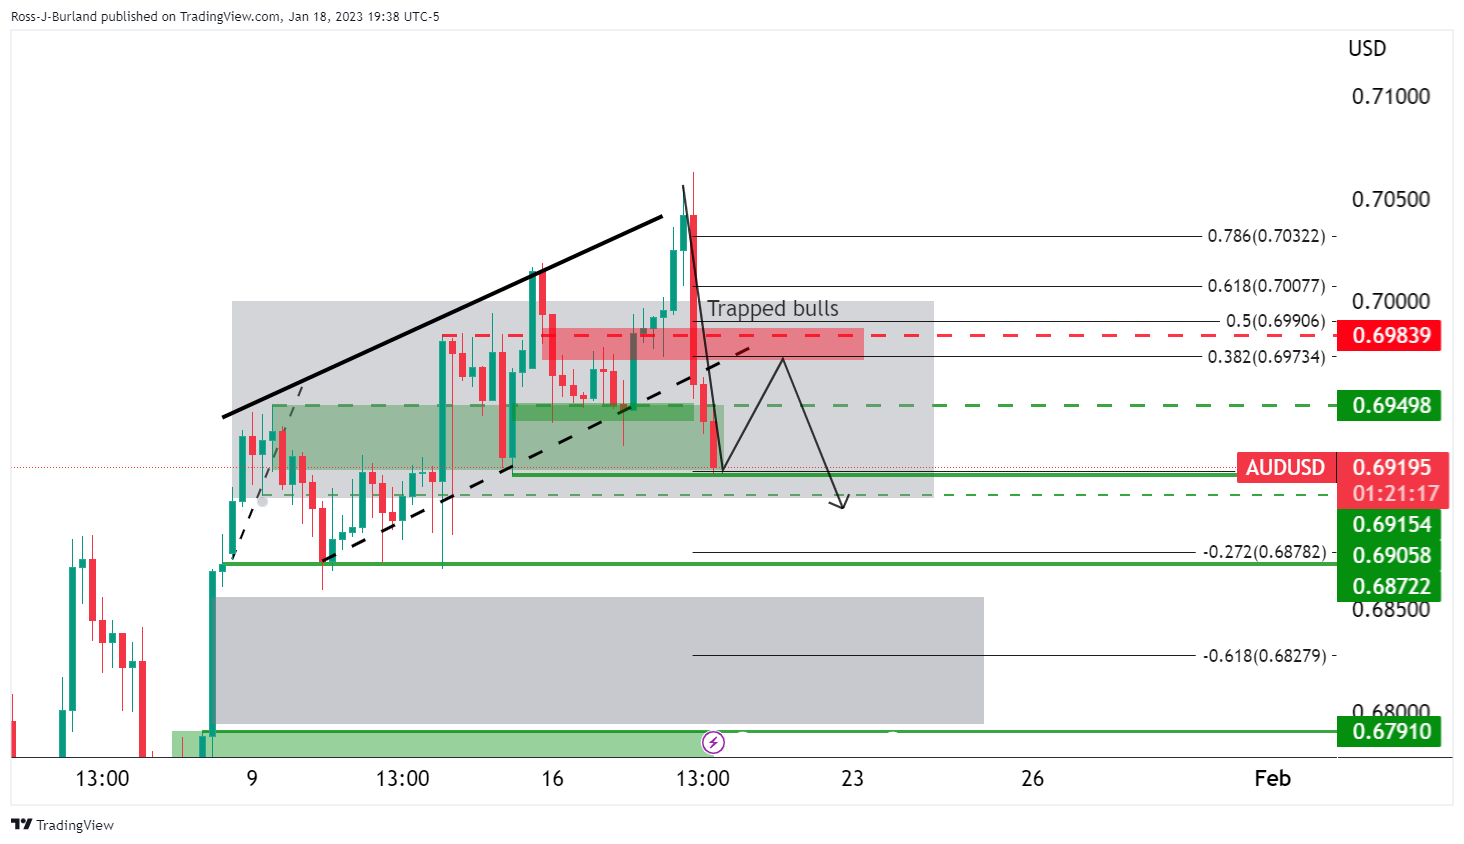
About the Aussie labour report
The key component of the data for markets, the Employment Change, released by the Australian Bureau of Statistics is a measure of the change in the number of employed people in Australia. Generally speaking, a rise in this indicator has positive implications for consumer spending which stimulates economic growth. Therefore, a high reading is seen as positive (or bullish) for the AUD, while a low reading is seen as negative (or bearish).
| Index | Change, points | Closed | Change, % |
|---|---|---|---|
| NIKKEI 225 | 652.44 | 26791.12 | 2.5 |
| Hang Seng | 100.36 | 21678 | 0.47 |
| KOSPI | -11.07 | 2368.32 | -0.47 |
| ASX 200 | 7.1 | 7393.4 | 0.1 |
| FTSE 100 | -20.3 | 7830.7 | -0.26 |
| DAX | -5.27 | 15181.8 | -0.03 |
| CAC 40 | 6.23 | 7083.39 | 0.09 |
| Dow Jones | -613.89 | 33296.96 | -1.81 |
| S&P 500 | -62.11 | 3928.86 | -1.56 |
| NASDAQ Composite | -138.1 | 10957.01 | -1.24 |
- Gold price picks up bids to justify the bullish technical formation.
- US Dollar’s failure to keep late Wednesday’s rebound adds strength to the XAU/USD rebound.
- US recession woes contradict the Fed talks while mixed concerns over China also probe Gold buyers.
Gold price (XAU/USD) picks up bids to pare the previous day’s losses, snapping three-day downtrend, as the US Dollar fails to defend the late Wednesday’s corrective bounce off the lowest level since May 31, 2022. Adding strength to the XAU/USD rebound could be the recent comments from Dallas Federal Reserve (Fed) President Lorie Logan.
While most of the Fed policymakers appeared hawkish on Wednesday, Fed’s Logan supported a slower rate hike pace but also mentioned possibly a higher stopping point during her first speech as the Fed representative.
Previously, St. Louis Federal Reserve's President James Bullard said US interest rates have to rise further to ensure that inflationary pressures recede. On the same line, President of the Federal Reserve Bank of Cleveland Loretta Mester praised the Fed’s actions to tame inflation. Further, Kansas City Fed President Esther George mentioned that the central bank must restore price stability, "that means returning to 2% inflation."
It should be noted that the downbeat US data allowed the Gold traders to regain upside momentum and probes the Fed hawks. That said, the Bank of Japan’s (BOJ) surprise inaction but the receding fears of the Federal Reserve’s (Fed) aggressive monetary policy actions also drowned the United States Treasury bond yields on Wednesday. That said, the BOJ left monetary policy and the interest rates unchanged but the US 10-year Treasury bond yields dropped the most in 10 weeks, pressured around the four-month low near 3.37% by the press time. As a result, the US Dollar Index traces the US Treasury bond yields amid the mixed signals from the Fed.
Elsewhere, mixed concerns surrounding China seemed to have probed the Gold buyers as Analysts at Goldman Sachs expected stronger China growth and favored hopes of more energy demand from the dragon nation. However, fears of the US-China tension outweigh the optimism of late. US Treasury Secretary Janet Yellen and Chinese China’s Vice Premier Liu He met in Germany on Wednesday and initially boosted the risk appetite, together with the BOJ’s inaction. However, the diplomats’ mentioning of the areas of disagreement raised market fears of another round of US-China tension. Ahead of that, the South China Morning Post (SCMP) mentioned that Beijing ‘should be wary’ as the US and Taiwan seeks closer economic ties.
It should be noted that the downbeat US Treasury bond yields put a floor under the Gold price. The Bank of Japan’s (BOJ) surprise inaction and receding fears of the Federal Reserve’s (Fed) aggressive monetary policy actions drowned the United States Treasury bond yields on Wednesday. That said, the BOJ left monetary policy and the interest rates unchanged but the US 10-year Treasury bond yields dropped the most in 10 weeks, pressured around the four-month low near 3.37% by the press time.
Amid these plays, markets remain cautiously optimistic and hence the Gold price recovers amid a light calendar of Thursday. The market sentiment could be witnessed by mildly bid US stock futures, softer US Dollar Index (DXY) and the downbeat US Treasury bond yields.
Gold price technical analysis
Gold price bounces off support line of a two-week-old ascending trend channel as it prints mild gains amid a sluggish session. It’s worth noting that the receding bearish bias of the MACD And the steady RSI also back the XAU/USD’s defence of the bullish chart pattern and suggest further advances.
However, the weekly resistance line near $1,925 restricts immediate upside of the XAU/USD, a break of which could challenge the nine-month high marked earlier in the week surrounding $1,930.
It’s should be observed, however, that the aforementioned channel’s top-line, close to $1,950, will challenge the Gold buyers afterward.
Alternatively, a downside break of the channel’s lower line, around $1,902 at the latest, could quickly drag the Gold price towards the 100-SMA level near $1,863.
Following that, a five-week-old horizontal support area near $1,825-23 will gain the XAU/USD trader’s attention.
Gold price: Four-hour chart
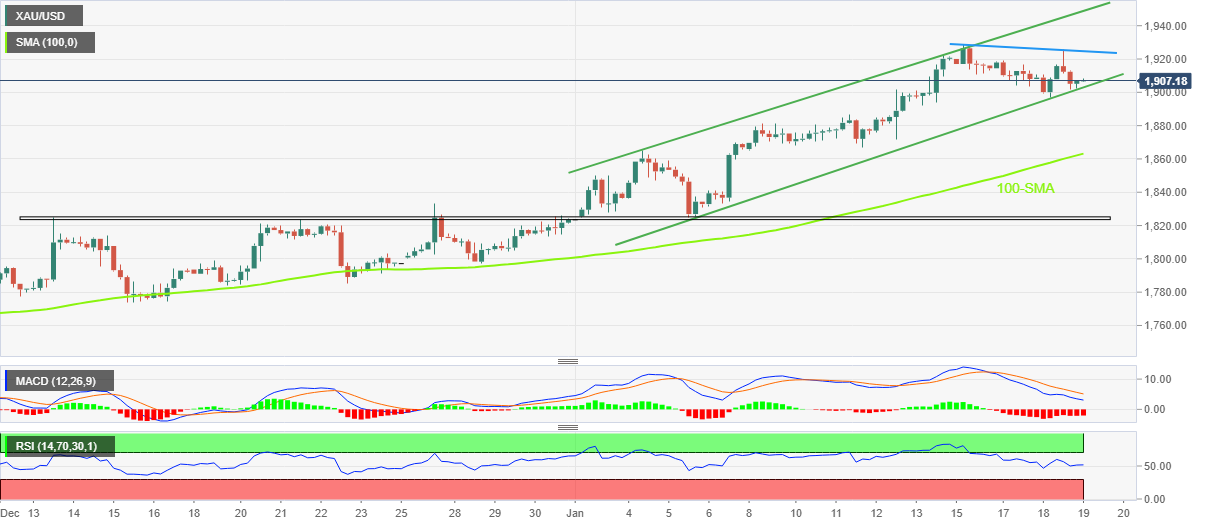
Trend: Limited upside expected
Reuters reported that China could see a sharp recovery in economic growth from the second quarter onwards based on current infection trends after the dismantling of most COVID-19 restrictions, IMF Deputy Managing Director Gita Gopinath said on Wednesday.
Key comments
"We expect growth in China to come back, to rebound," Gopinath told Reuters in an interview at the World Economic Forum in Davos.
"Looking at the infection trends, and if those persist, we could see a very quick recovery starting from after the first quarter of this year," she said of a current surge in infections seen as an "exit wave" linked to the economic reopening.
Gopinath said that a growth rate "in the 4%-plus ballpark" would likely mean that any global inflationary pressures would be counter-balanced by the slowdown in demand elsewhere.
"But if growth in China comes in much more strongly, which is a possibility, then we could see another spike in oil prices or energy prices," she said.
- GBP/JPY is oscillating around 159.00 as investors await Japan’s inflation release for fresh cues.
- The cross surrendered BoJ’s unchanged policy-inspired gains after Kuroda’s commentary.
- Lower-than-projected UK inflation might not delight the BoE as the median rate is excessively skewed.
The GBP/JPY pair is displaying topsy-turvy moves around the critical hurdle of 159.00 in early Asia. The cross has shifted into a rangebound territory after a downside move from Wednesday’s high above 161.50. The asset witnessed a steep fall as GBP/JPY surrendered Bank of Japan’s (BoJ) unchanged policy-inspired gains despite dovish commentary from BoJ Governor Haruhiko Kuroda.
GBP/JPY surrendered gains at a decent pace when BoJ Kuroda, after keeping the interest rate at -0.10% and the 10-year Japanese Government Bonds (JGBs) around 0% steady, commented that there is “no need to further expand bond target band.” He further added that Japan’s economy is still on the path towards recovery from the pandemic and the BoJ is aiming to achieve a 2% inflation target sustainably, stably in tandem with wage growth.
Meanwhile, analysts at MUFG claim that the Yen sell-off should prove temporary and reiterates a bullish outlook for the JPY in the year ahead on the grounds that the upcoming end to Governor Kuroda’s term at the end of April will continue to encourage speculation over a shift in policy under new leadership. They further added that “We expect market participants to remain skeptical over the sustainability of YCC policy settings.
Further guidance on the Japanese Yen will arise from the National Consumer Price Index (CPI) data, which will release on Friday. As per the consensus, the annual headline CPI (Dec) is expected to accelerate to 4.4% vs. the former release of 3.8%. The core inflation that excludes oil and food prices is seen higher at 2.9% against 2.8% released earlier.
On the United Kingdom front, headline inflation softening to 10.5% from the expectations of 10.6% is not going to delight the Bank of England (BoE) as the current CPI is extremely far from the median rate. The street believes that BoE Governor Andrew Bailey might hike rates somewhat more than earlier expectations.
| Pare | Closed | Change, % |
|---|---|---|
| AUDUSD | 0.69415 | -0.55 |
| EURJPY | 139.141 | 0.68 |
| EURUSD | 1.07952 | 0.07 |
| GBPJPY | 159.111 | 1.17 |
| GBPUSD | 1.23448 | 0.56 |
| NZDUSD | 0.6442 | 0.3 |
| USDCAD | 1.34895 | 0.75 |
| USDCHF | 0.91628 | -0.56 |
| USDJPY | 128.887 | 0.62 |
- US Dollar Index fades bounce off 7.5-month low marked the previous day.
- Doji candlestick challenges early-week DXY rebound from multi-day low.
- United States data fails to challenge the Federal Reserve’s hawkish bias but the US Dollar struggles.
- Fewer important catalysts to track, qualitative factors are the key to clear directions.
US Dollar Index (DXY) remains pressured around 102.30, after a failed attempt to recover from the lowest levels since May 31, 2022. In doing so, the US Dollar gauge versus the six major currencies struggles for clear directions as fears of the United States recession contradicts the recent Federal Reserve (Fed) talks.
Fears of United States recession defend US Dollar Index bulls
After witnessing downbeat US data in recent days, disappointment from the US economic calendar highlighted the economic recession woes inside the world’s biggest economy, which in turn weigh on the hawkish Fedspeak and challenge the US Dollar Index bulls.
That said, US Retail Sales marked the biggest slump in a year while posting 1.1% MoM contraction for December, versus -0.8% market forecasts and -1.0% prior (revised). On the same line, Producer Price Index dropped to the lowest level in six months with -0.5% MoM figure compared to -0.1% expected and 0.2% prior (revised).
Mixed Federal Reserve speech, China concerns probe DXY traders
Federal Reserve (Fed) policymakers remained hawkish as St. Louis Federal Reserve's President James Bullard said US interest rates have to rise further to ensure that inflationary pressures recede. On the same line, President of the Federal Reserve Bank of Cleveland Loretta Mester praised the Fed’s actions to tame inflation.
Further, Kansas City Fed President Esther George mentioned that the central bank must restore price stability, "that means returning to 2% inflation." Recently, Dallas Federal Reserve President Lorie Logan supported a slower rate hike pace but also mentioned possibly a higher stopping point.
Other than the Fed talks, China-related headlines also put a floor under the US Dollar Index (DXY). That said, Analysts at Goldman Sachs expected stronger China growth and favored hopes of more energy demand from the dragon nation. However, fears of the US-China tension outweigh the optimism of late. US Treasury Secretary Janet Yellen and Chinese China’s Vice Premier Liu He met in Germany on Wednesday and initially boosted the risk appetite, together with the BOJ’s inaction. However, the diplomats’ mentioning of the areas of disagreement raised market fears of another round of US-China tension. Previously, the South China Morning Post (SCMP) mentioned that Beijing ‘should be wary’ as the US and Taiwan seeks closer economic ties.
Downbeat United States Treasury bond yields probe DXY buyers
Not only the Bank of Japan’s (BOJ) surprise inaction but the receding fears of the Federal Reserve’s (Fed) aggressive monetary policy actions also drowned the United States Treasury bond yields on Wednesday. That said, the BOJ left monetary policy and the interest rates unchanged but the US 10-year Treasury bond yields dropped the most in 10 weeks, pressured around the four-month low near 3.37% by the press time. As a result, the US Dollar Index traces the US Treasury bond yields amid the mixed signals from the Fed.
Nothing major on the calendar
Given the light calendar ahead, US Dollar Index (DXY) may take clues from the risk catalysts, mainly the headlines from China and the Federal Reserve talks for clear directions, not to forget the Treasury bond yields. Should cautious optimism prevails, the DXY may refresh the multi-day low.
US Dollar Index technical analysis
US Dollar Index justifies the previous day’s bearish Doji candlestick as it retreats toward the lowest levels marked during late May 2022. Also adding strength to the bearish bias could be the downbeat signals from the Moving Average Convergence and Divergence (MACD) indicator.
As a result, the DXY is well-set to probe the mid-2022 bottom surrounding 101.30 while citing the 102.00 round figure as the immediate support.
It’s worth noting that a downward-sloping support line from mid-November 2022, around 101.10 by the press time, could challenge the US Dollar Index weakness past 101.30.
Alternatively, the 10-Day Moving Average (DMA) level near 102.75 guards the DXY recovery moves, a break of which highlights the previous monthly low surrounding 103.40 as the key hurdle.
In a case where the US Dollar Index remains firmer past 103.40, the odds of its run-up to the monthly peak near 105.65 can’t be ruled out.
DXY Price: Daily chart
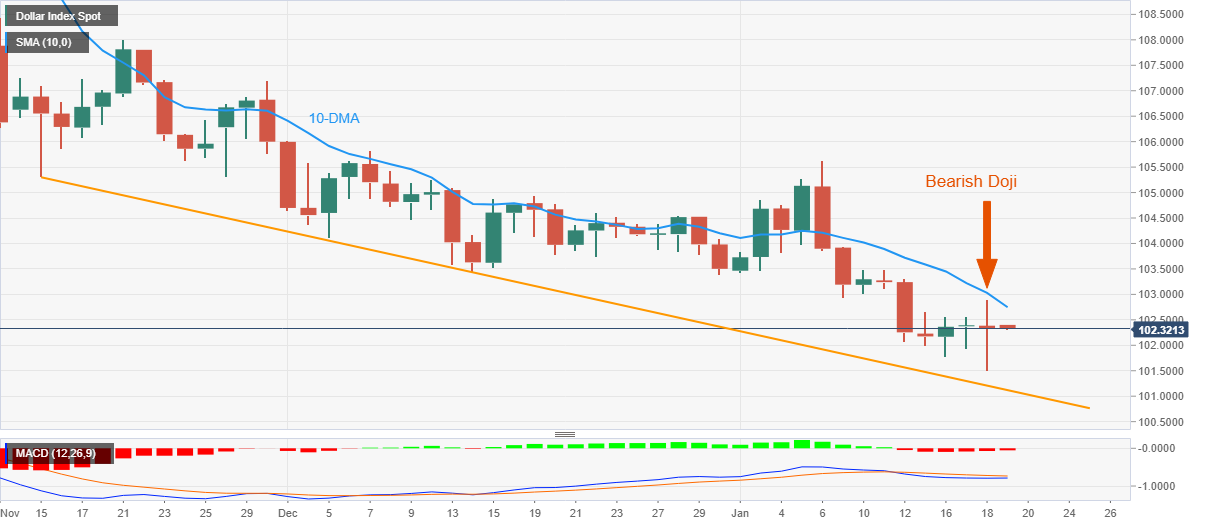
Trend: Further weakness expected


© 2000-2026. Bản quyền Teletrade.
Trang web này được quản lý bởi Teletrade D.J. LLC 2351 LLC 2022 (Euro House, Richmond Hill Road, Kingstown, VC0100, St. Vincent and the Grenadines).
Thông tin trên trang web không phải là cơ sở để đưa ra quyết định đầu tư và chỉ được cung cấp cho mục đích làm quen.
Giao dịch trên thị trường tài chính (đặc biệt là giao dịch sử dụng các công cụ biên) mở ra những cơ hội lớn và tạo điều kiện cho các nhà đầu tư sẵn sàng mạo hiểm để thu lợi nhuận, tuy nhiên nó mang trong mình nguy cơ rủi ro khá cao. Chính vì vậy trước khi tiến hành giao dịch cần phải xem xét mọi mặt vấn đề chấp nhận tiến hành giao dịch cụ thể xét theo quan điểm của nguồn lực tài chính sẵn có và mức độ am hiểu thị trường tài chính.
Sử dụng thông tin: sử dụng toàn bộ hay riêng biệt các dữ liệu trên trang web của công ty TeleTrade như một nguồn cung cấp thông tin nhất định. Việc sử dụng tư liệu từ trang web cần kèm theo liên kết đến trang teletrade.vn. Việc tự động thu thập số liệu cũng như thông tin từ trang web TeleTrade đều không được phép.
Xin vui lòng liên hệ với pr@teletrade.global nếu có câu hỏi.
ngân hàng