- Phân tích
- Tin tức và các công cụ
- Tin tức thị trường
Tin tức thì trường
New Zealand's Finance Minister, Grant Robertson, has commented following the recent jobs data and said, ''while unemployment remains low, there’s still plenty to do. We will continue to invest heavily in training up New Zealanders.''
NZ jobs data
- New Zealand Unemployment Rate Q4: 3.4% (est 3.3%; prev 3.3%).
- Employment Change (QoQ) Q4: 0.2% (est 0.3%; prev 1.3%).
- Employment Change (YoY) Q4: 1.3% (est 1.5%; prev 1.2%).
- Participation Rate Q4: 71.7% (est 71.7%; prev 71.7%).
''We are seeing a significant number of people coming into New Zealand through the Accredited Employer Work Visa and the Working Holiday Visa schemes and we are constantly assessing our immigration settings to help fill vacancies in what is a competitive global market for workers,” Grant Robertson said.
“This year is expected to be a tough year for the global economy and New Zealand won’t be immune to the impacts of that. However, we are in a strong starting position with low unemployment and government debt levels substantially below the countries with which we compare ourselves,'' he added.
“The Government will keep the economy moving in the right direction in this challenging environment and continue to invest in creating a stronger, inclusive and more resilient economy to withstand future shocks,” Grant Robertson said further.
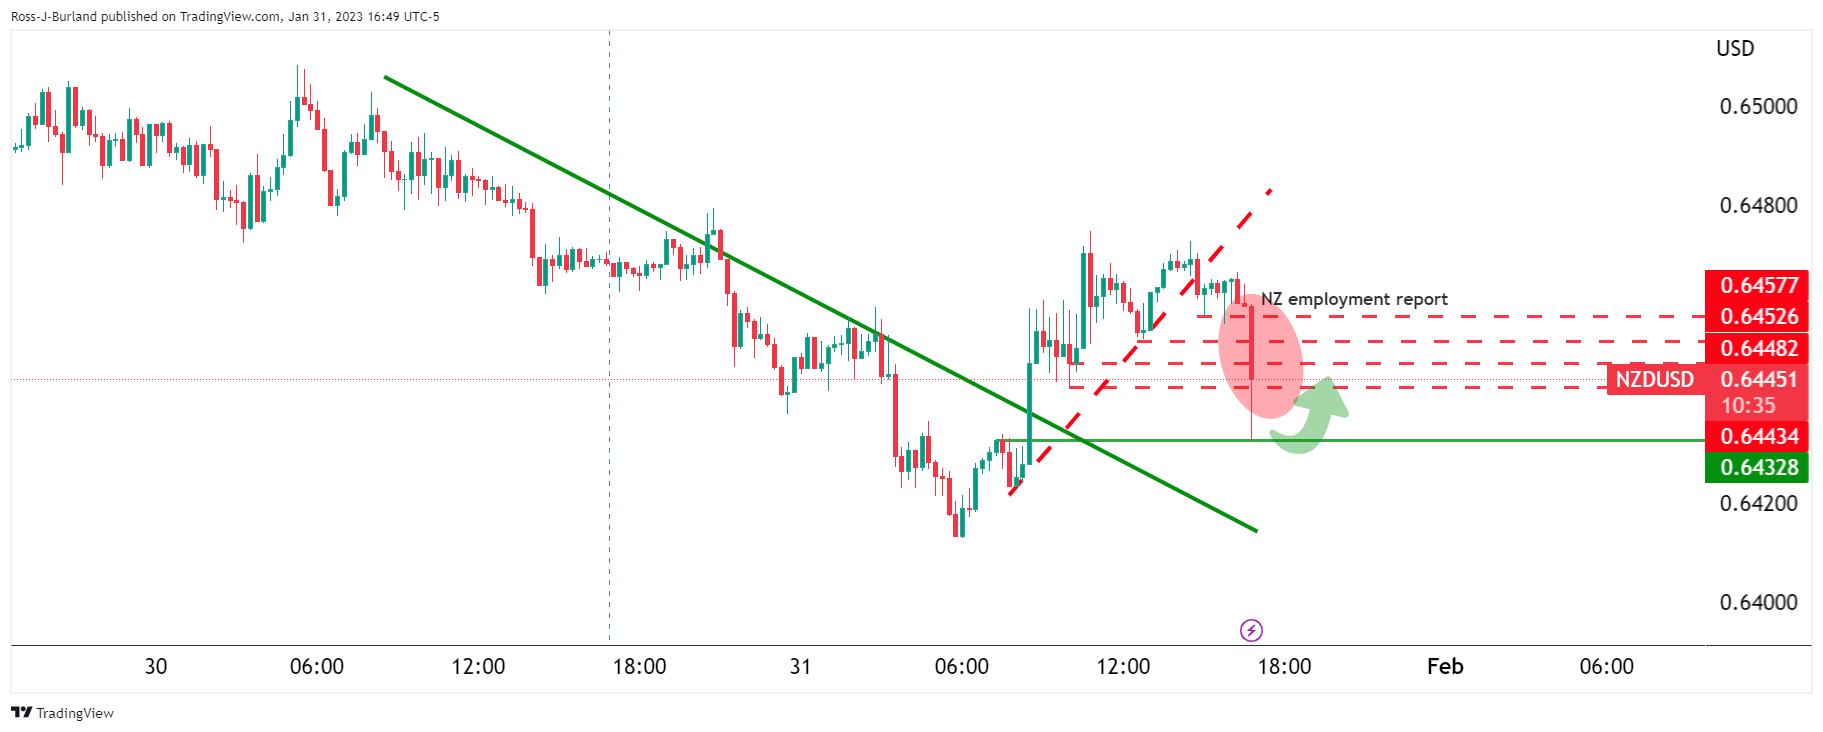
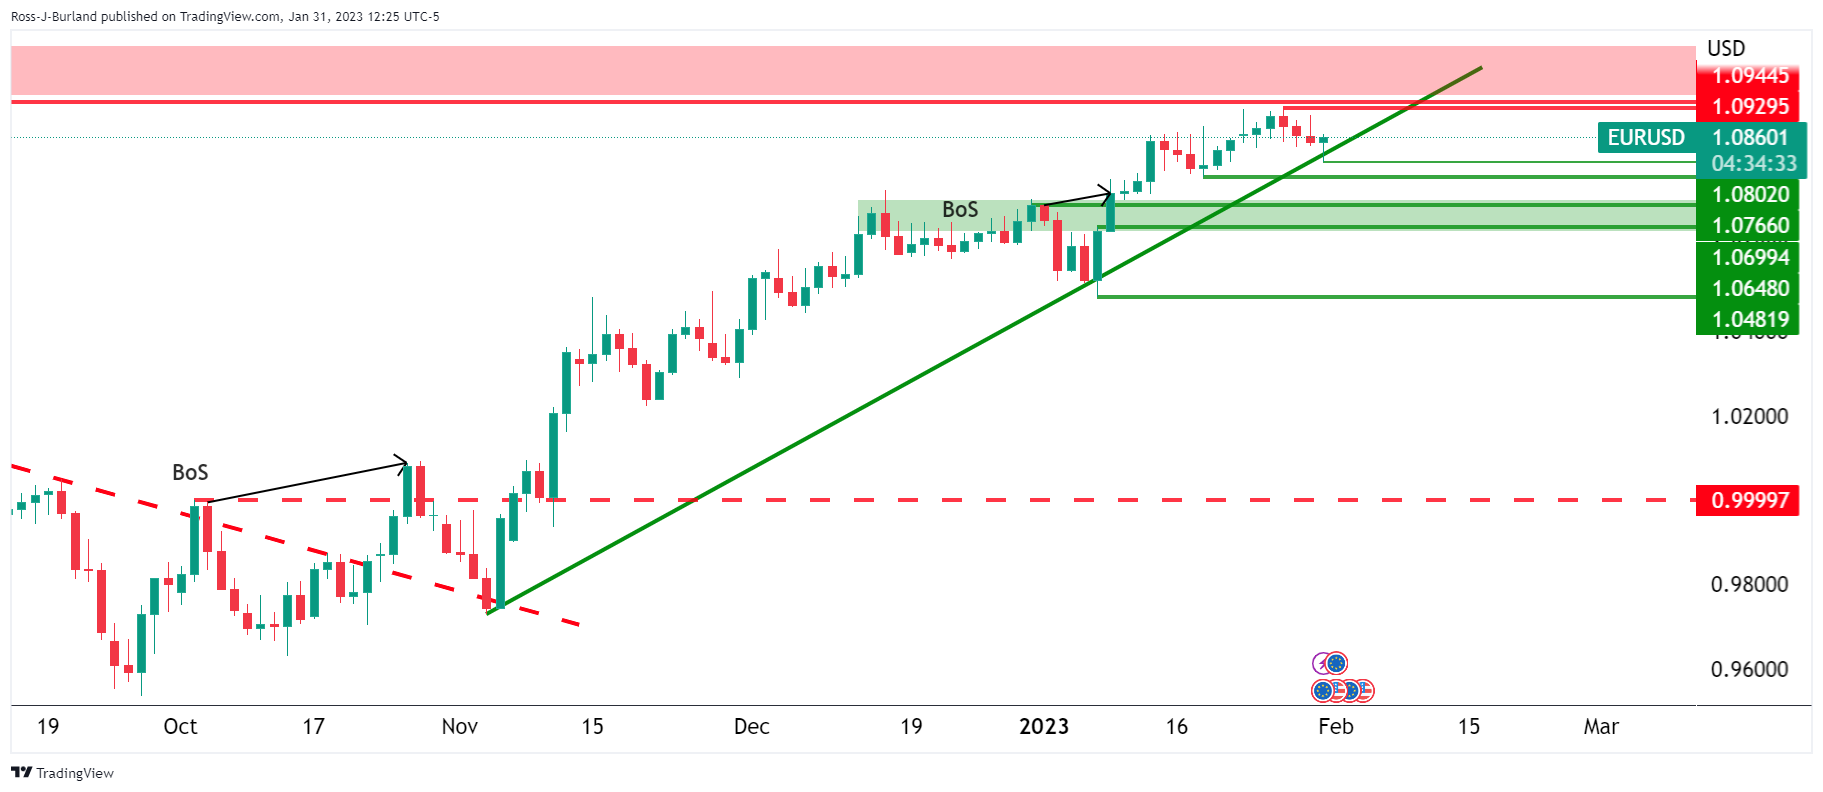
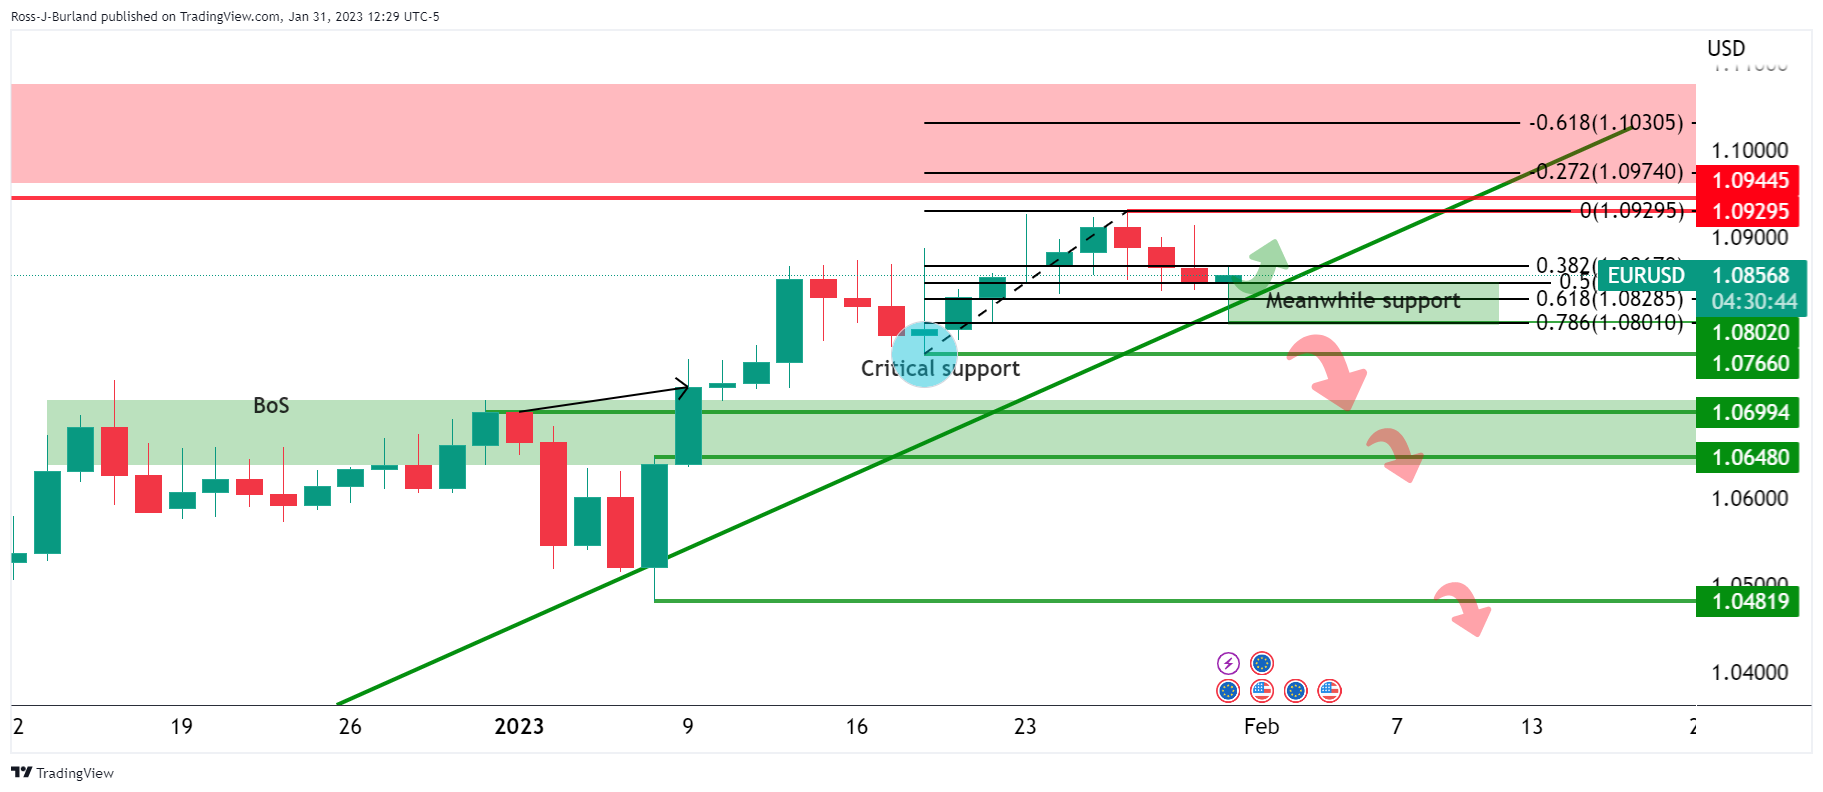
NZD/USD update
NZD/USD dropped following the New Zealand jobs data:
The data is not as strong as the Reserve Bank of New Zealand expected and hence the sell-off in the kiwi.
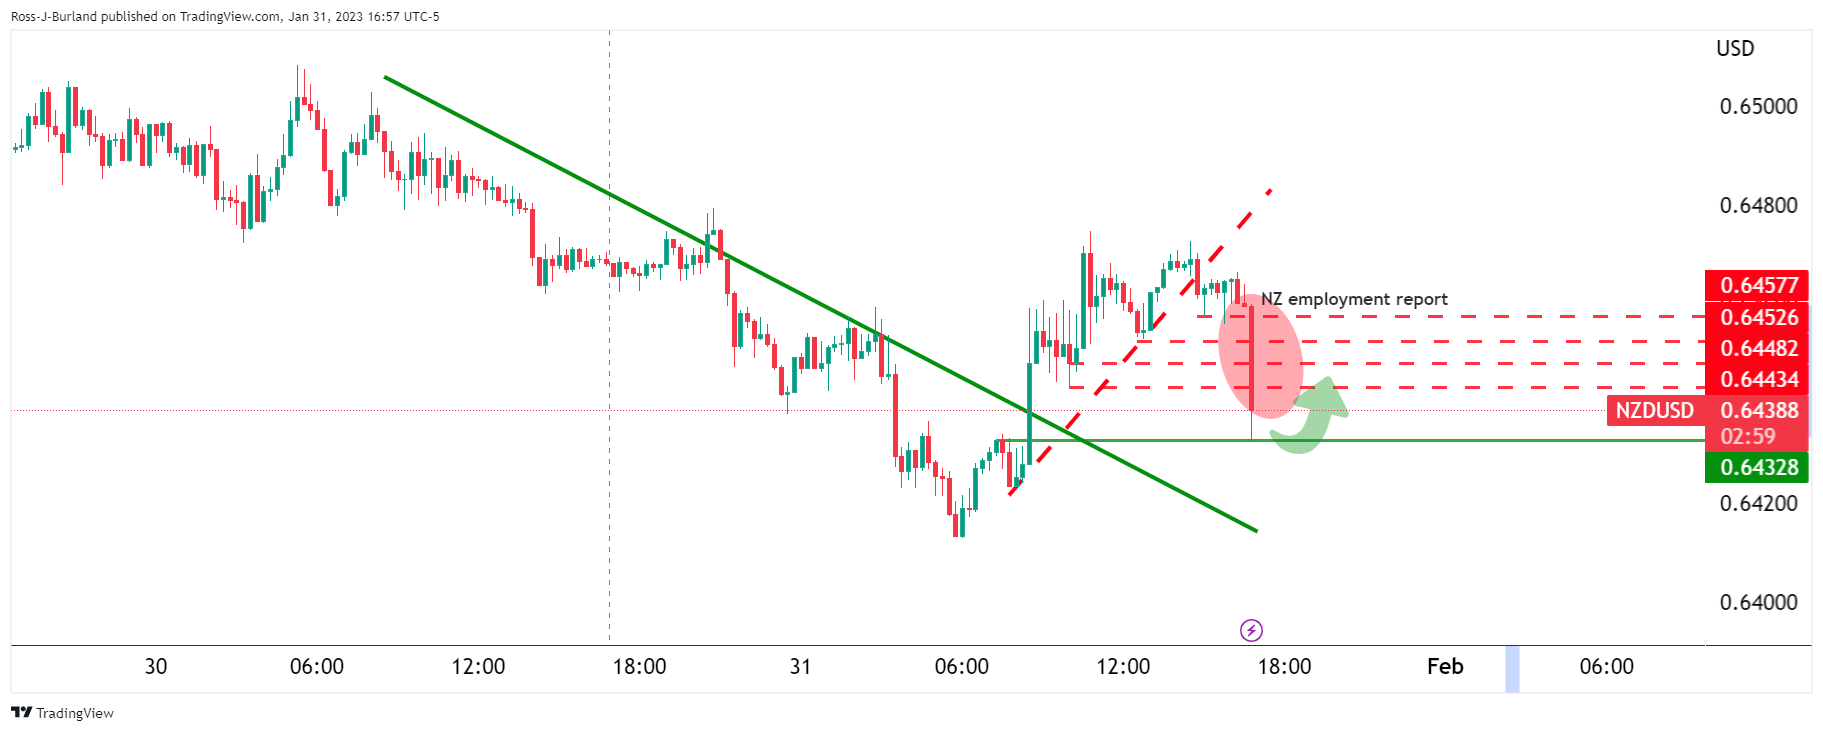
NZD/USD is on the brink of a move to test lower and 0.6360 is key, but in doing so, an M-formation will be left on the charts which is a reversion pattern.
- USD/CAD has turned sideways around 1.300 ahead of the interest rate decision by the Fed.
- The USD Index and Treasury yields dropped as the Fed is highly expected to announce a smaller interest rate hike.
- Oil prices recovered dramatically after upbeat China’s official PMI data.
The USD/CAD pair is displaying a back-and-forth move around the immediate support of 1.3300 in the early Tokyo session. The Loonie asset witnessed an immense sell-off on Tuesday after a decline in the United States Employment Cost Index improved the risk appetite of the market participants. The US Dollar Index (DXY) sensed intensified selling as a decline in the labor cost index bolstered the expectations of a smaller interest rate hike by the Federal Reserve (Fed).
The USD Index dropped firmly below 101.70 after failing to sustain an auction above the 102.00 resistance. Meanwhile, S&P500 futures are showing some losses after a fantastic Tuesday, portraying a caution in the overall upbeat market mood. The 10-year US Treasury yields have dropped to near 3.51%.
The FX domain is going through sheer volatility as investors are awaiting the release of the interest rate decision by the Fed. Fed chair Jerome Powell is highly expected to hike interest rates by 25 basis points (bps) to the 4.50-4.75% range, therefore investors are much concerned about the further roadmap of achieving a 2% inflation target.
Analysts at TD Securities are of the view that The Federal Open Market Committee (FOMC) is likely to emphasize that despite slowing the pace of rate increases it is still determined to reach the terminal rate projected in the December dot plot.”
On the Loonie front, monthly Gross Domestic Product (GDP) (Nov) expanded by 0.1% while the street was expecting flat growth. A minor change in the GDP numbers might not force the Bank of Canada (BoC) to change its stance of remaining paused on interest rates. Last week, BoC Governor Tiff Macklem announced a pause in their interest rate hiking spell after pushing interest rates by 25 bps to 4.5%.
Meanwhile, oil prices recovered sharply on Tuesday after investors shrugged off uncertainty about global recession as the western central banks are set to announce fresh hikes to contain stubborn inflation. Also, upbeat China’s official PMI data-infused fresh blood into the oil price. It is worth noting that Canada is a leading exporter of oil to the United States and higher oil prices strengthen the Canadian Dollar.
- Gold price steadies after bouncing off short-term key support confluence, snapping three-day downtrend.
- United Stated economics exert downside pressure on US Dollar, favoring XAU/USD buyers.
- US Treasury bond Yields also retreat after three-day uptrend while equities’ recovery underpins Gold demand.
- Federal Reserve’s dovish hike is on the cards but Chairman Jerome Powell can please the Gold bears.
Gold price (XAU/USD) struggles to extend the previous day’s recovery beyond $1,930-28 as the market braces for the key Federal Reserve (Fed) verdict on Wednesday. The yellow metal managed to cheer the broad US Dollar weakness, backed by the United States data and firmer equities, as traders brace for a dovish hike from the US central bank.
US Dollar weakness teases Gold buyers
Gold price snapped a three-day downtrend and bounced off a two-week low the previous day after the US Dollar Index (DXY) reported the first daily loss in four, around 102.10 by the press time. In doing so, the greenback’s gauge versus the six major currencies justified downbeat market expectations from the US Federal Reserve (Fed) amid softer United States statistics.
Among them, the Employment Cost Index (ECI) for the fourth quarter (Q4) gained major attention as it eased to 1.0% versus 1.1% market forecasts and 1.2% prior readings. Further, the Conference Board (CB) Consumer Confidence eased to 107.10 in January versus 108.3 prior. It should be noted that no major attention could be given to the US Chicago Purchasing Managers’ Index (PMI) for January which rose to 44.3 versus 41 expected and 44.9 previous readings.
Softer United States Treasury bond yields propel XAU/USD
Not only the downside United States data but the upbeat Wall Street performance, backed by firmer earnings from industry majors like General Motors, Exxon and McDonalds, also seemed to have weighed on the US Treasury bond yields and favored Gold buyers. That said, the benchmark 10-year Treasury bond yields snapped a three-day uptrend while revisiting 3.51% while the two-year counterpart also dropped to 4.20%, near the same levels by the press time.
China economics, Covid news also propel Gold price
Apart from the US Dollar driven recovery, the upbeat China Purchasing Managers’ Indexes (PMI) for January and news surrounding COVID-19 from the US also seemed to have favored the Gold buyers. That said, the news suggesting US President Joe Biden’s administration’s readiness to revoke the Covid-led emergencies appeared to have favored the sentiment of late. On Monday, China’s Center for Disease Control and Prevention (CDC) said, reported by Reuters, “China's current wave of COVID-19 infections is nearing an end, and there was no significant rebound in cases during the Lunar New Year holiday.”
Furthermore, China’s NBS Manufacturing PMI rose to 50.1 versus 49.7 market forecasts and 47.0 prior whereas Non-Manufacturing PMI also came in upbeat with 54.4 figure compared to 51.0 expected and 41.6 previous readings.
All eyes on the Federal Reserve Chairman Jerome Powell
Although the Gold sellers have been pushed back ahead of the key Federal Reserve (Fed) Interest Rate Decision, the XAU/USD bears aren’t off the table as the Fed has ammunition to bolster the US Dollar with hawkish rate bias. In doing so, Fed Chair Jerome Powell’s press conference will be crucial amid a widely expected 0.25% rate hike. That said, clues for a further rate increase and no policy pivot in the near term should weigh on the Gold price.
Gold price technical analysis
Gold price bounced off a convergence of the 21-Daily Moving Average (DMA) and an upward-sloping trend line from early November 2022 while portraying the previous day’s recovery.
However, the bearish signals from the Moving Average Convergence and Divergence (MACD) indicator join the absence of an overbought Relative Strength Index (RSI) line, placed at 14, to keep sellers hopeful.
With this, the XAU/USD pullback towards the $1,906 support confluence appears imminent.
Following that, the $1,900 threshold and a 10-week-old ascending support line near $1,866 will gain the Gold seller’s attention.
Alternatively, the metal’s further upside could aim for an ascending resistance line stretched from mid-January, close to $1,960 at the latest.
Even if the XAU/USD manages to cross the $1,960 hurdle, the tops marked during March 2022 near $1,966 will challenge the metal ahead of highlighting the $2,000 psychological magnet.
Overall, Gold buyers appear running out of steam but the bears have a tough task ahead.
Gold price: Daily chart
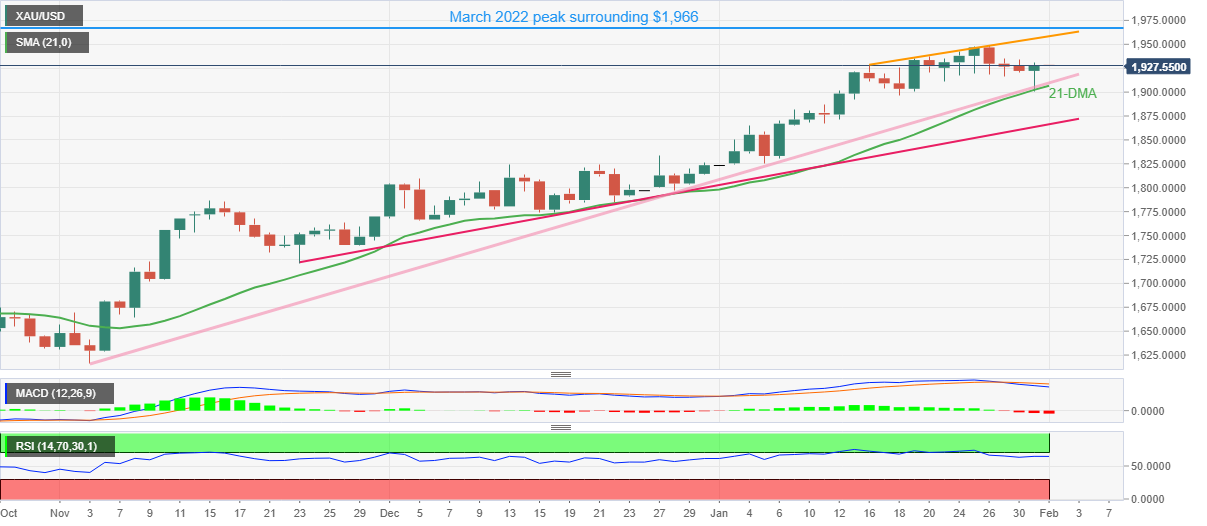
Trend: Downside expected
- GBP/JPY is scaling south towards 160.00 as the UK public inflation projections have cooled off.
- The BoE is expected to hike its interest rates by 50 bps to 4.0%.
- An upbeat Japan retail trade data might add to the BoJ’s 2% inflation target.
The GBP/JPY pair sensed selling interest after a pullback to near 160.60 and is declining toward the round-level support of 160.00 in the early Tokyo session. The cross has faced selling pressure despite rising odds of a bigger interest rate hike announcement by the Bank of England (BoE) on Thursday.
In the interest rate week, investors are watching closely for the interest rate decision by the BoE as the inflation rate in the United Kingdom economy is in a double-digit figure despite being the early adopter of restrictive monetary policy after the pandemic period.
A poll from Bloomberg showed that BoE Governor Andrew Bailey will announce an interest rate hike by 50 basis points (bps) to 4.0%. And, the BoE will reach to the terminal rate of 4.50% by the summer. The poll also revealed that the BoE will start cutting its key interest rate later this year to shore up a flagging economy.
Strategists at Jefferies cited “We are turning more positive on the economic prospect for Europe, but still remain negative on the UK.” For the BoE, even if we get a 50 basis point (bps) hike in February, it would be a dovish 50 basis points.”
Meanwhile, a monthly survey conducted by Citi and YouGov showed that the UK public's inflation expectations cooled off consecutively for the second month in January. British public expectations for five to 10 years ahead fell to 3.5% in January from 3.6% in December, just short of the 3.0%-3.4% range seen ahead of the COVID-19 pandemic. For 12 months ahead, the UK public inflation expectations declined to 5.4% in January from 5.7% in the previous survey. This might provide a sigh of relief to BoE policymakers.
On the Japanese Yen front, upbeat Retail Trade (Dec) data is going to add up to the Bank of Japan (BoJ)’s target of achieving 2% inflation on a sustainable basis. The annual Retail Trade data soared to 3.8% from the consensus of 3.0% and the former release of 2.5%. While the monthly data expanded by 1.1% vs, the expectations of 0.5%. Japan's Finance Minister Shunichi Suzuki reiterated on Tuesday that “wage increases are important to both the government and the BoJ.
- WTI grinds higher after posting the biggest daily gains in two weeks.
- Bearish MACD signals, steady RSI (14) probes rebound from 50-DMA.
- 100-DMA, fortnight-old horizontal hurdle also challenge Oil buyers.
- Ascending support line from December 2022 adds to the downside filters.
WTI crude oil buyers appear unconvinced from the previous day’s recovery moves as the quote seesaws near $79.20 amid the early hours of the key Wednesday. In doing so, the black gold fades the bounce off the 50-DMA while taking a breather after rising the most in a fortnight.
Although the 50-DMA puts a floor under the Oil price at around $77.80, the bearish MACD signals and the steady RSI (14), fail to appreciate the quote’s rebound. The reason could be linked to the commodity’s sustained trading below the key hurdles.
Among them, the $80.00 round figure gains immediate attention ahead of the 100-DMA level surrounding $81.30.
Following that, a horizontal area comprising multiple tops marked since January 18, near $82.70, appears as the last defense of the black gold bears.
On the contrary, a daily closing below the 50-DMA level near $77.80 could quickly direct the WTI bears towards challenging the key support line from early December, close to $76.50 by the press time.
Should the energy benchmark remains bearish past $76.50, the odds of its slump to January 2023 low near $72.60 can’t be ruled out.
WTI: Daily chart
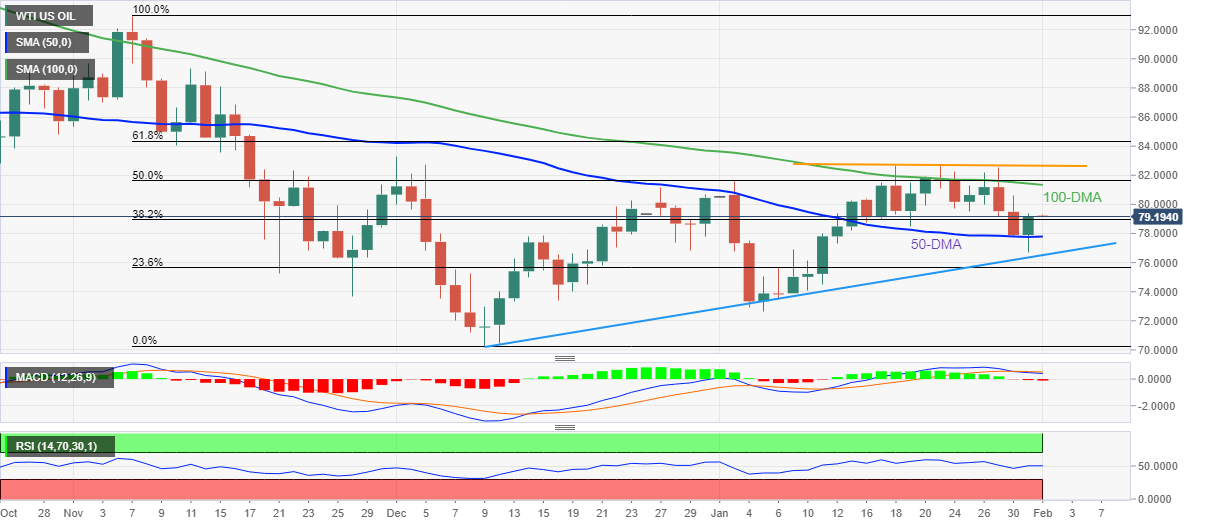
Trend: Further downside expected
- Sentiment remains upbeat, as shown by US equities finishing with gains.
- The US Dollar dropped on the back of expectations that the Fed might slow the pace of rate increases.
- Australian Retail Sales capped the AUD rally towards 0.7200.
- AUD/USD Traders eye Aussie PMIs, and a busy US calendar led by FOMC’s monetary policy decision.
The AUD/USD is recovering some ground after falling to weekly lows of 0.6938, courtesy of a dismal Retail Sales report from Australia. Nevertheless, the Australian Dollar (AUD) stages a recovery, and although finished with losses, they were minimal. As the Asian session begins, the AUD/USD is trading at 0.7053, almost flat.
Risk appetite improvement weighed on the US Dollar
Wall Street finished on a higher note in January. US corporate earnings and recent economic data revealed by the Labor Department weighed on the greenback, which is losing, as the US Dollar Index shows, 0.15%, down at 102.089. The Employment Cost Index (ECI), a measure of wage inflation, cooled as data showed, down from 1.2% to 1% QoQ. That data, along with the US Core PCE, the Federal Reserve’s (Fed) favorite inflation gauge, edging lower for the fourth consecutive month, increased the likelihood of a Fed pivot.
The greenback tumbled on the data release, as shown by the US Dollar Index, dipping towards its daily lows of 102.008 before recovering some ground. The AUD/USD paired some of its losses, though mostly towards Wall Street’s close.
Aside from this, Australian Retail Sales for December disappointed analysts, tumbling to -3.9% MoM vs. -0.3% estimations, reported the Australian Bureau of Statistics (ABS). Even though it was the first drop in 2022 after eleven months of consecutive monthly rises, sales fell sharply, with department stores, among other sectors like clothing, footwear, and personal accessories, sliding to -27%. That said, it was a headwind for the AUD/USD, which extended its losses toward the day’s lows, slumping below the 0.7000 figure.
What to watch?
Ahead of the week, the Australian economic docket will feature Manufacturing PMIs, alongside Governor Kohler’s Reserve Bank of Australia (RBA) speech. On the US front, the calendar will reveal S&P Global and ISM Manufacturing PMIs, JOLTs Openings, and the US Federal Reserve’s monetary policy decision on Wednesday.
AUD/USD Key Technical Levels
- USD/CHF holds lower grounds after declining the most since late November.
- Broad US Dollar weakness favored bears despite downbeat Swiss Retail Sales.
- Softer US Employment Cost Index, Consumer Confidence joined firmer equities to weigh on USD ahead of Fed’s verdict.
- Fed’s 0.25% rate hike is almost given and hence Powell need to save the USD with his hawkish statements.
USD/CHF steadies around 0.9160 after marking the biggest daily slump in nearly 2.5 months the previous day. The Swiss currency pair’s fall on Tuesday could be linked to the broad US Dollar weakness and the firmer equities, which in turn enabled the quote to ignore downbeat data at home.
That said, the Swiss Retail Sales for December slumped to -2.8% YoY versus 2.6% expected and -1.4% prior.
On the other hand, the US Employment Cost Index (ECI) for the fourth quarter (Q4) gained major attention as it eased to 1.0% versus 1.1% market forecasts and 1.2% prior readings. Further, the Conference Board (CB) Consumer Confidence eased to 107.10 in January versus 108.3 prior. It should be noted that no major attention could be given to the US Chicago Purchasing Managers’ Index (PMI) for January which rose to 44.3 versus 41 expected and 44.9 previous readings.
Further, upbeat Wall Street closing, due to firmer earnings from industry majors like General Motors, Exxon and McDonalds, also exert downside pressure on the US Treasury bond yields and favored the US Dollar bears.
Amid these plays, the US Dollar Index (DXY) snapped a three-day rebound, staying defensive near 102.00 by the press time.
Moving on, multiple US PMIs for January may entertain USD/CHF pair traders ahead of the Federal Reserve’s (Fed) interest rate decision. Even so, major attention will be on how Fed Chairman Jerome Powell could defend his hawkish bias as the 0.25% rate hike is already priced-in.
Also read: Federal Reserve Preview: The Good, the Bad and the Ugly, why the US Dollar would rise
Technical analysis
A clear downside break of the two-week-old ascending trend line, now immediate resistance around 0.9205, directs USD/CHF towards the previous monthly low of 0.9085.
- AUD/NZD has refreshed its four-day high at 1.0970 as NZ Employment has missed estimates.
- A decline in labor demand higher jobless rate might trim inflation projections in the NZ region ahead.
- The Australian Dollar remained extremely volatile this week after the release of the downbeat Retail Sales data.
The AUD/NZD pair has printed a fresh four-day high at 1.0970 in the early Asian session. The cross has got strength after the release of downbeat New Zealand Employment (Q4) data. The Employment Change dropped to 0.2% from the expectations of 0.3% and the former release of 1.3%. While the Unemployment Rate has increased to 3.4% from the consensus and the prior release of 3.3%.
Signs of losing threads in the tight labor market of New Zealand indicate that inflation projections will trim further as retail demand may get dents. Meanwhile, the Labor cost index has remained mixed, which will still be a concern for the Reserve Bank of New Zealand (RBNZ) ahead. The quarterly Labor cost index has landed at 1.1% lower than the estimates of 1.3% but similar to the prior release of 1.1%. On an annual basis, the economic data has remained in line with the expectations of 4.3% and higher than the 3.8% the prior release.
The interest rate hike spell by the RBNZ Governor Adrian Orr is not paused yet as the Consumer Price Index (CPI) is still beyond 7%. However, lower employment generation might trim inflation projections ahead.
On the Australian front, the Australian Dollar has picked strength on upbeat S&P Global Manufacturing PMI data. The economic data has climbed to 50.0 vs. the consensus and the former release of 49.8. This week, the Australian Dollar remained extremely volatile after the release of the downbeat monthly Retail Sales (Dec) data. Lower retail demand might force the firms to look for easing prices of goods and services at factory gates. This would also delight the Reserve Bank of Australia (RBA) ahead.
For further guidance, the New Zealand Dollar and the Australian Dollar will dance to the tunes of the Caixin Manufacturing PMI (Jan) data, which is seen higher at 49.5 from the former release of 49.0. It is worth noting that the antipodeans are the leading trading partners of China.
- GBP/USD struggles to defend the bounce off one-week low despite upbeat Brexit news.
- UK inflation expectations drop for the second month in a row, Mortgage Approvals slump to financial crisis era.
- Data driven weakness of US Dollar put a floor under the Cable price.
- Fed’s 0.25% rate hike is almost given but Chairman Powell’s play will be crucial to watch.
GBP/USD fails to cheer the US Dollar weakness much as Cable’s recovery from the weekly low fades around 1.2320 during early Wednesday. In doing so, the quote seems to justify the downbeat catalysts at home, mainly relating to inflation and housing markets.
That said, a monthly survey conducted by Citi and YouGov showed on Tuesday that the 12 months ahead UK public inflation expectations declined to 5.4% in January from 5.7% in the previous survey. This was the second straight decline in the UK public's inflation expectations. Following the data, Reuters reports, citing the survey that the declining trend in the UK public inflation expectations should further comfort to the Bank of England that high prices will not become permanently embedded in expectations.
Further, Reuters also quotes the Bank of England’s (BOE) housing market numbers to state that Mortgage approvals in Britain slumped in December to levels seen during the global financial crisis. The news also raised concerns over the housing market’s weakness which is faster than the consensus predicted. “The BoE said 35,612 mortgages were approved last month, compared with 46,186 in November,” the news said.
Alternatively, The Times reported the European Union (EU) and the UK’s breakthrough in the customs deal as a positive catalyst for Brexit and should have helped the GBP/USD but could not.
On the same line, the US Dollar Index (DXY) snapped a three-day rebound amid downbeat US data and firmer equities. Among them, the Employment Cost Index (ECI) for the fourth quarter (Q4) gained a major attention as it eased to 1.0% versus 1.1% market forecasts and 1.2% prior readings. Further, the Conference Board (CB) Consumer Confidence eased to 107.10 in January versus 108.3 prior. It should be noted that no major attention could be given to the US Chicago Purchasing Managers’ Index (PMI) for January which rose to 44.3 versus 41 expected and 44.9 previous readings.
In addition to the softer US data, upbeat Wall Street closing, due to firmer earnings from industry majors like General Motors, Exxon and McDonalds, also exert downside pressure on the US Treasury bond yields and should have weighed on the GBP/USD prices. The benchmark 10-year Treasury bond yields snapped a three-day uptrend by easing 3.51% on Tuesday.
Looking forward, US economic calendar has a slew of data to watch but major attention will be given to how the Federal Reserve (Fed) Chairman could push back market chatters over policy pivot. That said, the US central bank is widely expected to announce a 0.25% rate hike.
Also read: Federal Reserve Preview: The Good, the Bad and the Ugly, why the US Dollar would rise
Technical analysis
A first daily closing below the 10-DMA, around 1.2370 by the press time, in a monthly directs GBP/USD towards the 21-DMA support surrounding 1.2260.
“Britain and the European Union have struck a customs deal that could pave the way to ending years of post-Brexit wrangling over Northern Ireland,” said The Times late Tuesday.
The Times also stated that it understood that Brussels has accepted a proposal that would avoid the need for routine checks on products destined for the province.
“Separately the EU has conceded for the first time that the European Court of Justice could rule on issues relating to the province only if a case was referred by the Northern Irish courts,” adds The Times.
Previously Brussels had insisted that the European Commission should be able to take cases straight to the court.
GBP/USD remains sidelined
GBP/USD fails to cheer the upbeat news, as well as the softer US Dollar, as downbeat UK inflation expectations and housing data raise fears of dovish Bank of England (BOE) actions.
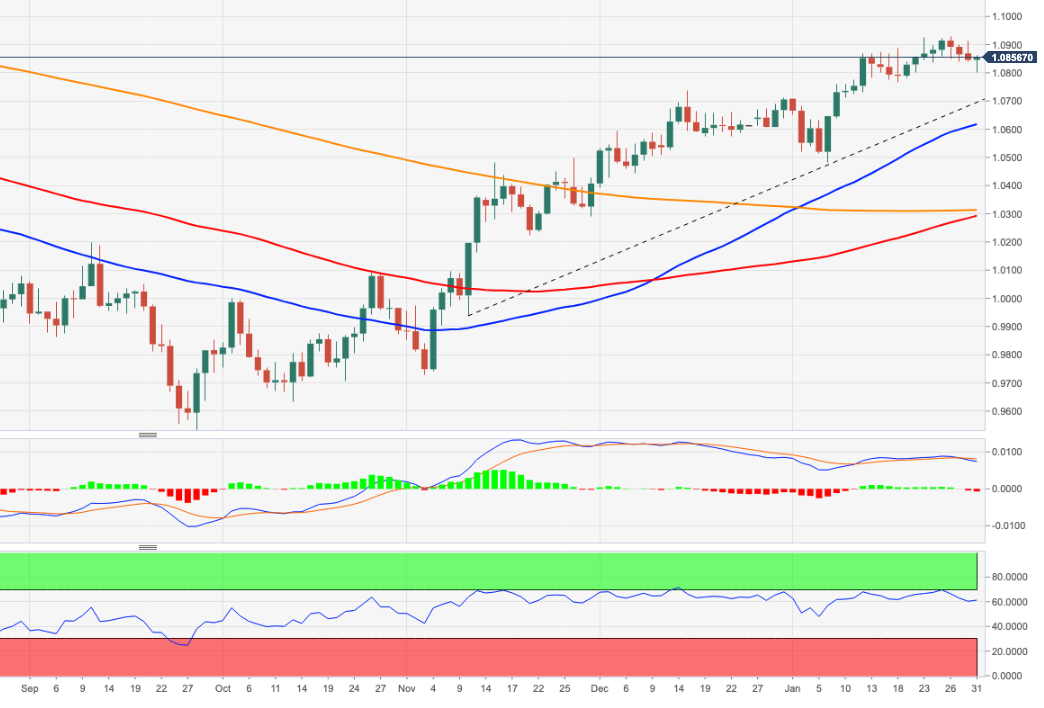
- EUR/USD is facing hurdles in extending the rally above 1.0870 ahead of Fed-ECB policy.
- A decline in US Employment Cost Index has bolstered the odds of a smaller interest rate hike by the Fed.
- Investors should brace for a bigger interest rate hike by the ECB as the inflationary pressures are still solid.
The EUR/USD pair is showing signs of a loss in the upside momentum after reaching to near the immediate resistance of 1.0870 in the early Tokyo session. The shared currency pair has already displayed a responsive buying action after dropping to near the round-level support at 1.0800 but is failing to bring initiative buyers on board, however, more upside is still on cards.
The rationale behind the strength of the Euro is the improved risk appetite of the market participants. Risk-perceived assets like S&P500 witnessed stellar demand after the United States Bureau of Labor Statistics showed that the Employment Cost Index for the fourth quarter of CY2022 has landed lower than expectations. The economic data was recorded at 1.0% lower than the consensus of 1.1% and the prior release of 1.2%.
Easing negotiation power for labor costs is music to the ears of the Federal Reserve (Fed), which is working hard to achieve price stability in the United States. A decline in the labor cost is going to leave less liquidity in the palms of households for disposal, which will further squeeze their spending and will trim inflation projections.
The US Dollar Index (DXY) fell heavily to near 101.70 from Tuesday’s high around 102.20 on the fact that the easing labor cost index has bolstered the odds of a decline in the policy tightening pace by the Fed. According to the projections, Fed chair Jerome Powell is expected to announce a 25 basis point (bps) interest rate hike to 4.50-4.75%.
On the Eurozone front, investors are awaiting the interest rate decision by the European Central Bank (ECB). Labor cost in the shared continent is still upbeat and the inflation rate is hovering above 9%, therefore, a bigger interest rate hike is expected by the market participants. ECB President Christine Lagarde might announce an interest rate hike of 50 bps ahead.
- NZD/USD under pressure as jobs miss the mark.
- All eyes turn to the Fed for the day ahead.
NZD/USD has dropped following the New Zealand jobs data:
- New Zealand Unemployment Rate Q4: 3.4% (est 3.3%; prev 3.3%).
- Employment Change (QoQ) Q4: 0.2% (est 0.3%; prev 1.3%).
- Employment Change (YoY) Q4: 1.3% (est 1.5%; prev 1.2%).
- Participation Rate Q4: 71.7% (est 71.7%; prev 71.7%).
The data is not as strong as the Reserve Bank of New Zealand expected and hence the sell-off in the kiwi. Prior to the data, NZD/USD was around flat on the day and traded between a low of 0.6413 and 0.6479, recoiling some of the day's losses as the US Dollar piped down ahead of critical events for the remainder of the week.
The greenback was softer on eh back of slightly slower-than-expected wage gains. The market is focussed on the Nonfarm Payrolls event this Friday where there is less certainty around the data, as compared to the expectations of the Federal Reserve. A 25 basis point hike is fully price din following the series of disinflationary data. The Federal Open Market Committee is likely to emphasize that despite slowing the pace of rate increases it is still determined to reach the terminal rate projected in the Dec dot plot which is also expected by the markets, so there will be no shocks in this regard. However, if the Fed overall emphasises this point, there could be a pick-up in demand for the greenback and a sell-off in risk assets.
NZD/USD technical analysis
NZD/USD is on the brink of a move to test lower and 0.6360 is key, but in doing so, an M-formation will be left on the charts which is a reversion pattern. There is no telling what will come of the Fed.
Statistics New Zealand has released the employment as follows:
- New Zealand Unemployment Rate Q4: 3.4% (est 3.3%; prev 3.3%).
- Employment Change (QoQ) Q4: 0.2% (est 0.3%; prev 1.3%).
- Employment Change (YoY) Q4: 1.3% (est 1.5%; prev 1.2%).
- Participation Rate Q4: 71.7% (est 71.7%; prev 71.7%).
NZD/USD is breaking structures in a 27 pips drop:
The data is not as strong as the market was expecting and hence the Kiwi is losing ground at a rapid pace.
About New Zealand employment data
Statistics New Zealand releases employment data on a quarterly basis. The statistics shed a light on New Zealand’s labor market, including unemployment and employment rates, demand for labor and changes in wages and salaries. These employment indicators tend to have an impact on the country’s inflation and Reserve Bank of New Zealand’s (RBNZ) interest rate decision, eventually affecting the NZD. A better-than-expected print could turn out to be NZD bullish.
- The EUR/JPY lost almost 0.05% after hitting a high at around 141.60s.
- EUR/JPY Price Analysis: To remain sideways, ahead of the ECB’s decision.
The EUR/JPY trims some of its earlier gains after hitting a daily high of 141.61, shy of the 100-day Exponential Moving Average (EMA) at 141.79, and drops towards the 141.40 area, holding to its gains. At the time of writing, the EUR/JPY is trading at 141.47, above its opening price by a slight margin of 0.02%.
EUR/JPY Price Analysis: Technical outlook
During the last seven days, the EUR/JPY pair has been unable to reach new highs, above the January 25 daily high at 142.29, exacerbating a consolidation within the 20 and 50-day EMA. Backed by the Relative Strength Index (RSI) and the Rate of Change (RoC) almost flat at neutral levels, the EUR/JPY pair would remain trendless, awaiting the Europen Central Bank (ECB) monetary policy on Thursday.
A bullish scenario would trigger once the EUR/JPY breaks above the 50-day EMA At 141.68, closely followed by the 100-day EMA at 141.79. A breach of those two EMAs will set the EUR/JPY to test the January 11 daily high of 142.85 and the 143.00 figure.
On the other hand, the EUR/JPY would resume its bearish bias, below the 20-day EMA at 140.98. Once cleared, the 200-day EMA at 140.25 would be tested by EUR bears, followed by a dip towards the 140.00 mark.
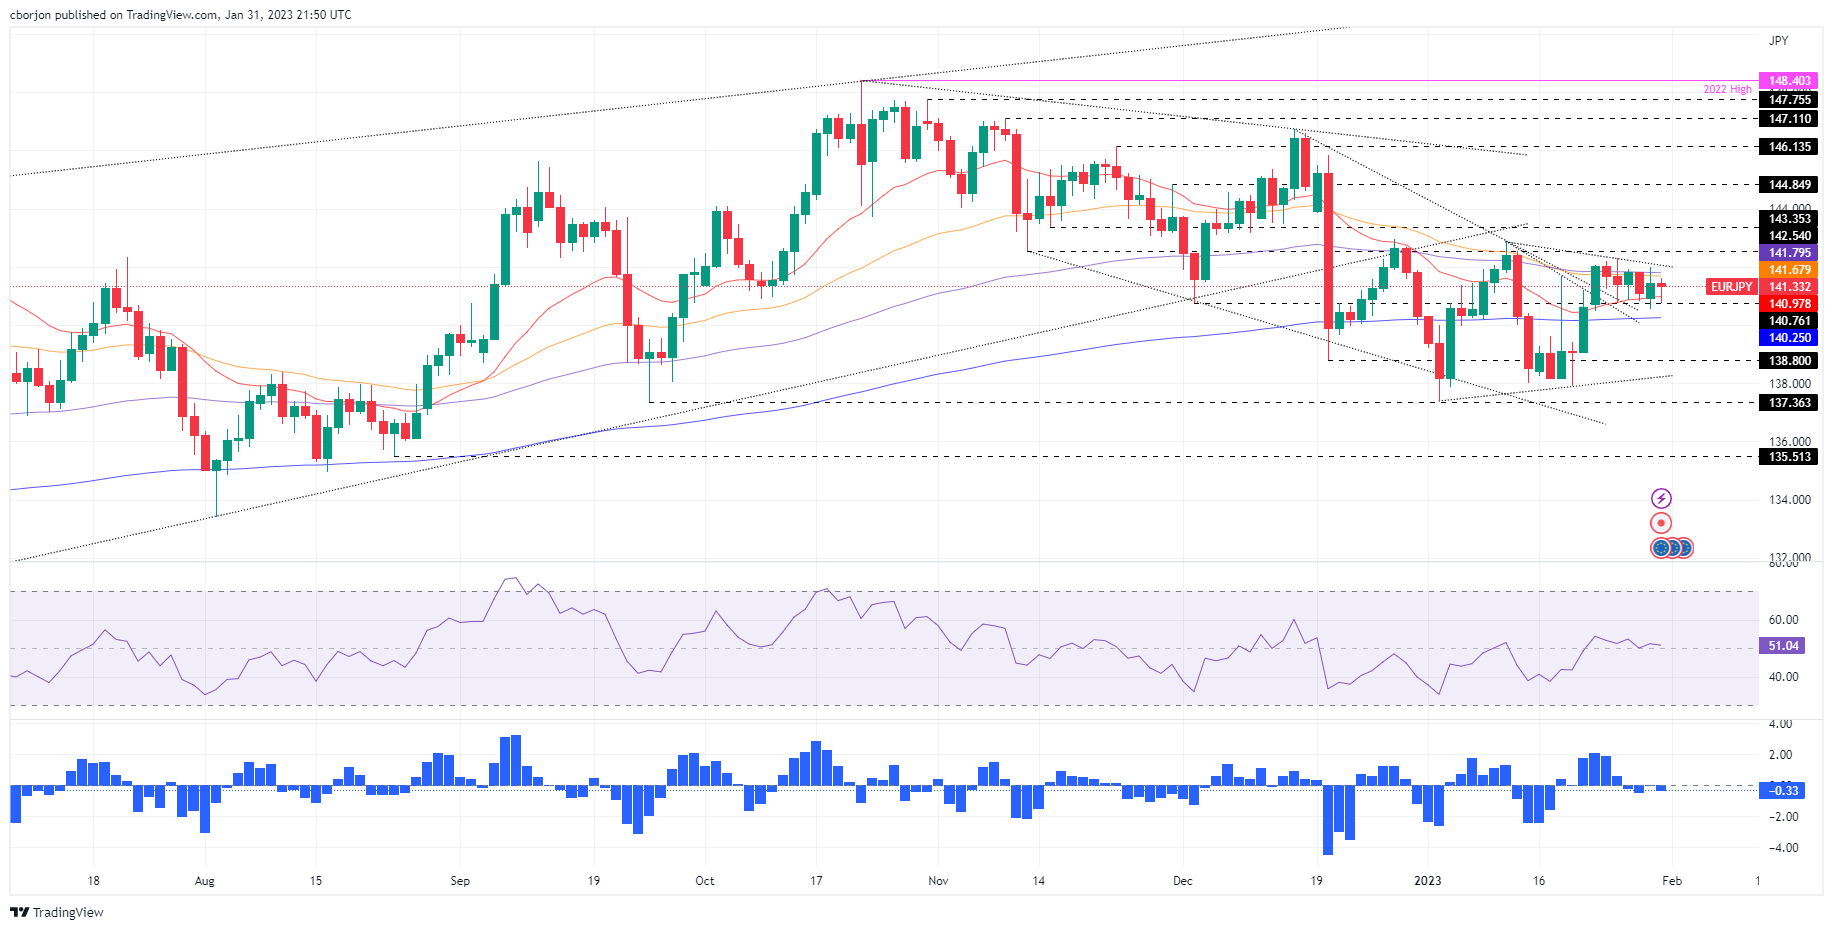
EUR/JPY Key Technical Levels
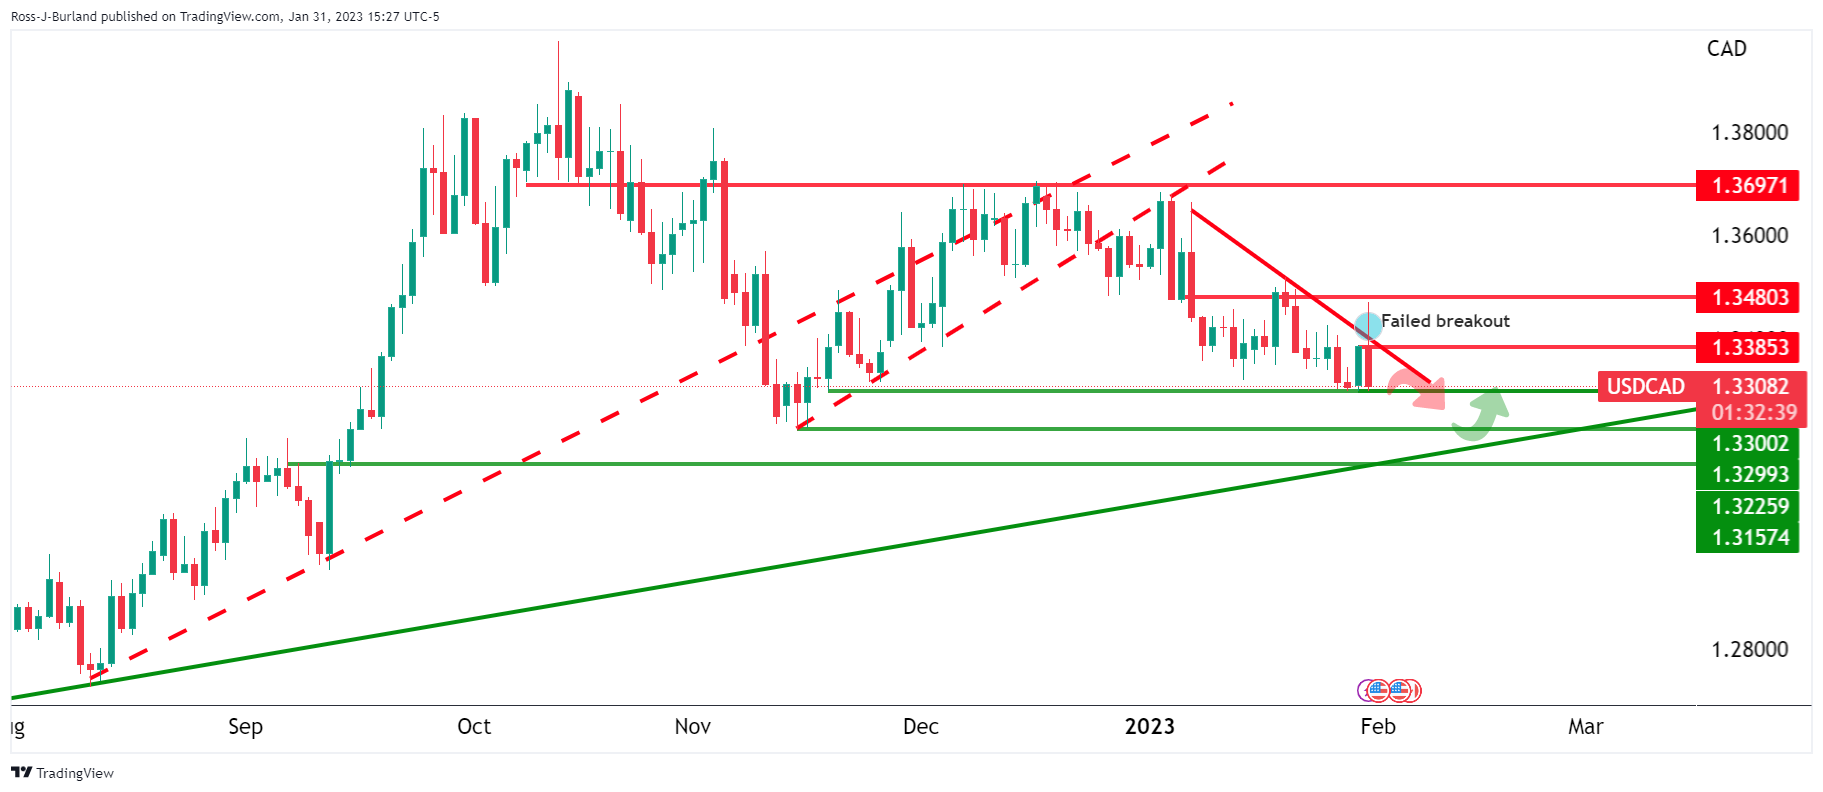
- USD/CAD bulls look to the 50% mean reversion target of the bearish impulse.
- Bears eye supports below 1.3300, targeting 1.3250/20 and then 1.3200 / 1.3150.
USD/CAD has blown off on Tuesday as preliminary domestic data showed the economy growing at a slightly faster pace than the Bank of Canada expected in the fourth quarter. This brings us to the Federal Reserve meeting on Wednesday with the technicals well entrenched for a breakout to the downside if the market gets what it's looking for from the meeting.
The following illustrates a bearish outlook for the short term to 1.3150 based on the daily and 4-hour charts:
USD/CAD daily charts
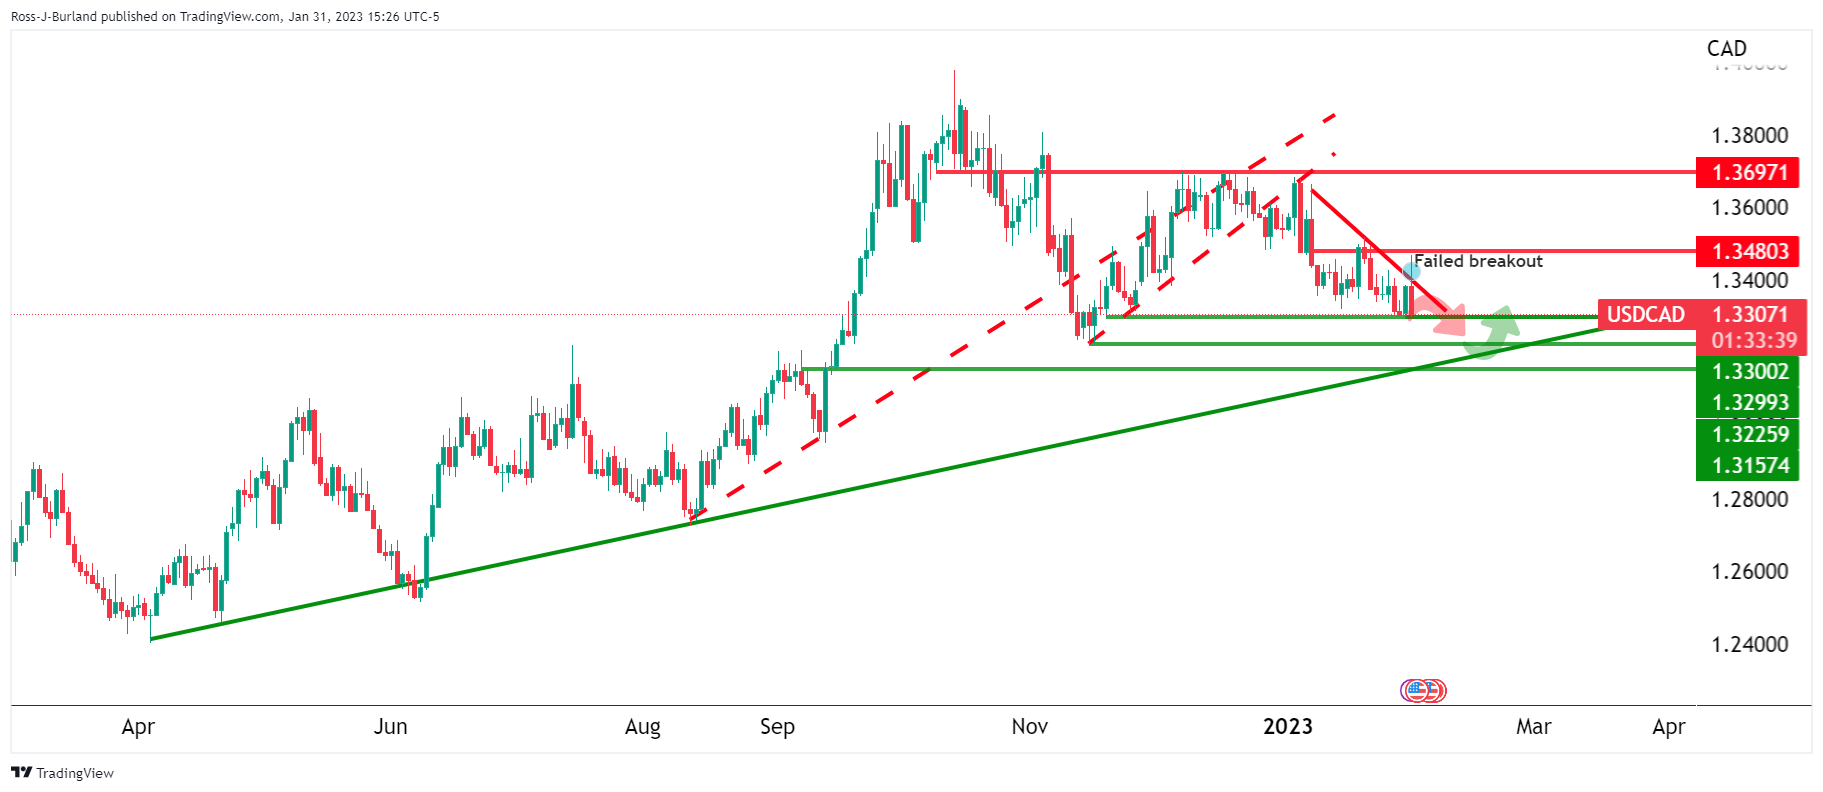
Zoomed in ...
USD/CAD has started to make its way to the bull cycle's supportive trendline by breaking down structures along the way.
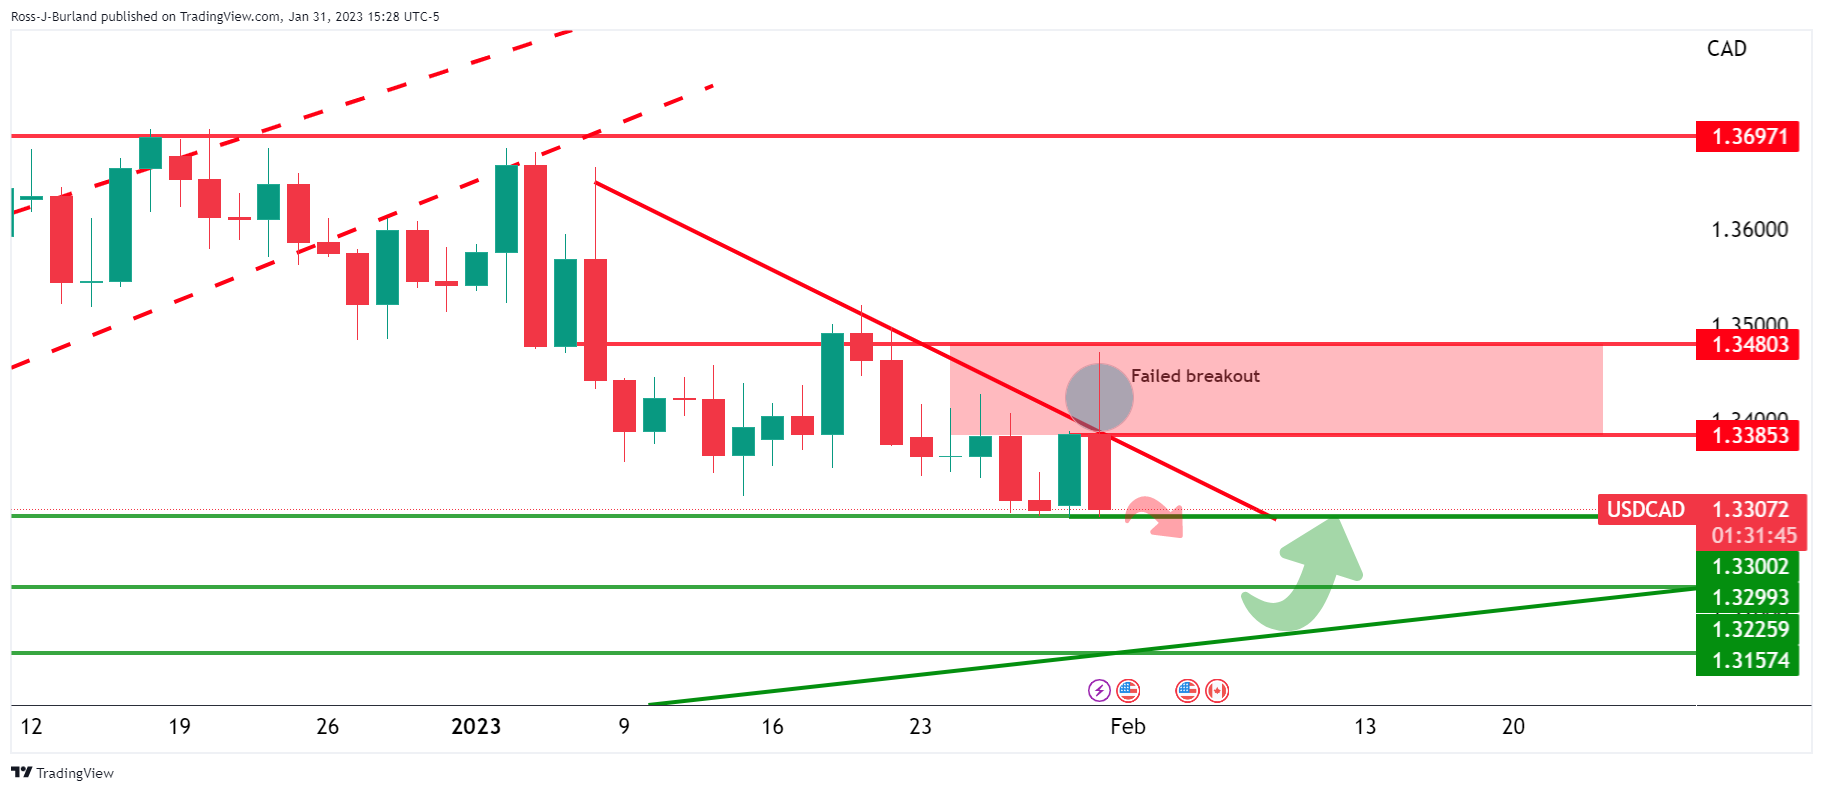
It failed to stay above the near-term bearish dynamic resistance as illustrated above which keeps the focus on the downside, for now.
USD/CAD H4 charts
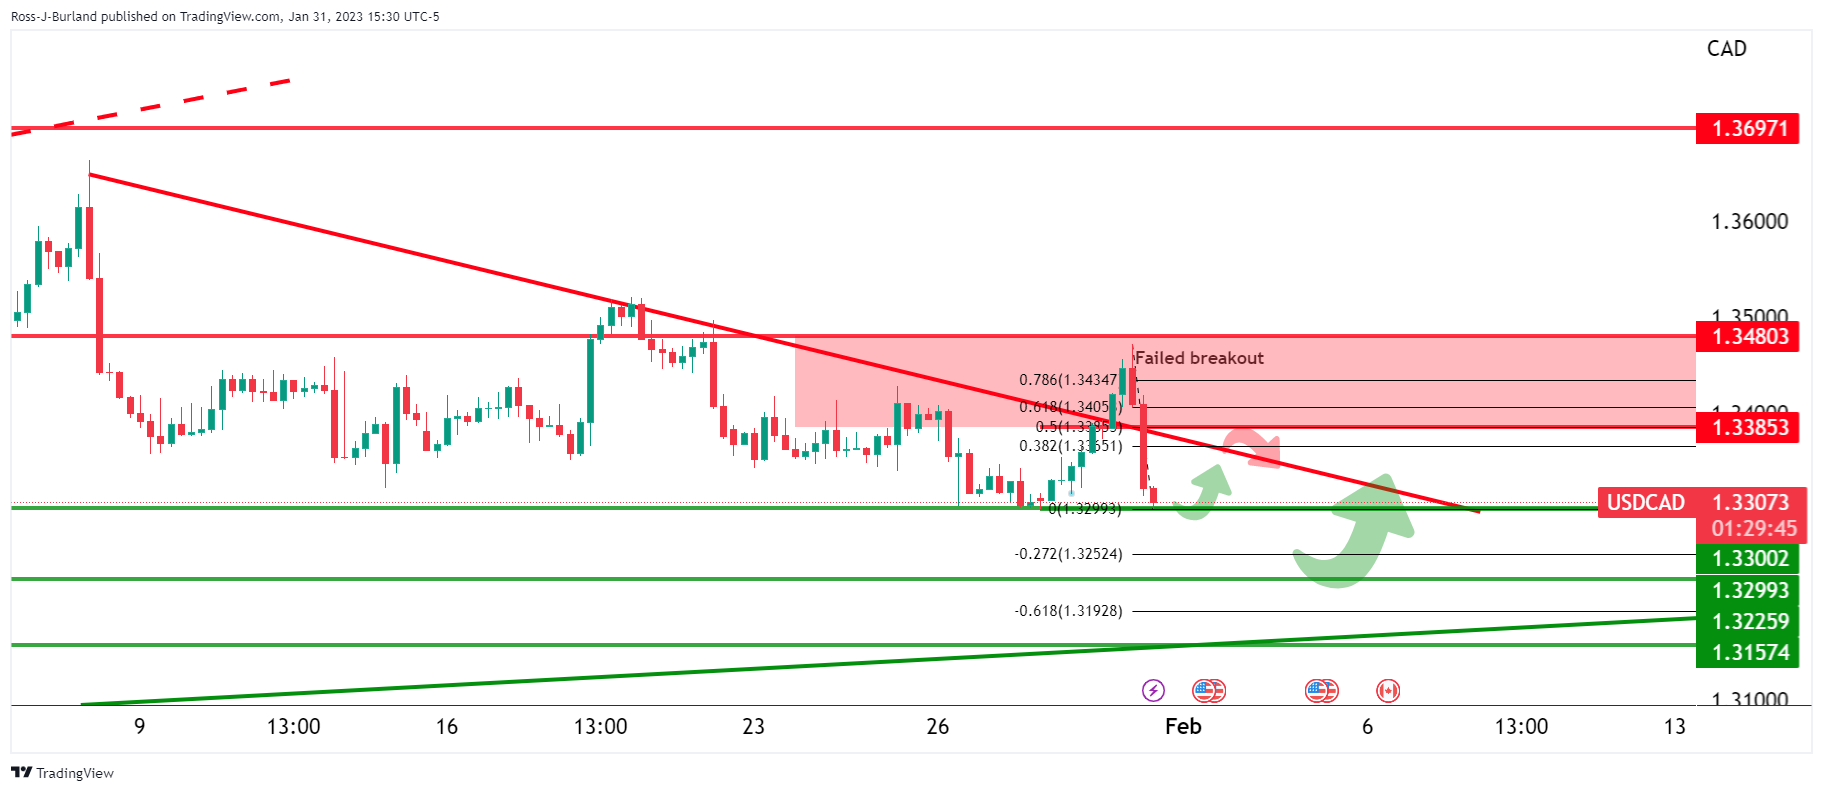
The price could stall here and correct towards the 50% mean reversion of the bearish impulse before meeting resistance again and dropping into test the supports below 1.3300, targetting 1.3250/20 and then 1.3200 / 1.3150.
- Gold price is testing the bull's commitments into highly important events for the rest of this week.
- Gold bears are waiting to pounce, chipping away at critical support structures.
- Federal Reserve and European Central Bank meetings will start off the chorus of expected volatility before the showdown, Nonfarm Payrolls.
Gold price had given two-way business on Tuesday as markets get set for the Federal Reserve, Fed, at month-end making for a particularly choppy day. However, the Gol price is headed for a third straight monthly gain, with the US Dollar and bond yields weakening despite higher interest rates expected from this week's meetings of the Federal Reserve's policy committee.
Federal Reserve and central bank meetings to impact Gold price
The US Dollar index was last seen down 0.2% at 102.03 after falling from a high of 102.607 and 102.013 while the US Treasury 10-year note is paying 3.523%, down 0.54% on the day as we move into the Federal Reserve interest rate decision and accompanying announcements. We also have the European Central Bank, ECB, which is also expected to increase rates on Thursday as both central banks look to slow their economies to combat high inflation. As a result, the Gold prices during the events are likely to be volatile.
First up, we have the US central bank policy decision that is due at 1900 GMT on Wednesday, followed by a news conference from Federal Reserve Chair Jerome Powell and while markets have priced in a 25 basis point Fed rate hike to a range of 4.5-4.75% and expect rates to peak at 4.9% in June, some analysts are sceptical. For instance, analysts at Brown Brothers Harriman said the hard part for the Fed will be convincing the markets that they are wrong about its perceived pivot.
''The Federal Reserve will leave the door wide open for further rate hikes and Federal Reserve Chair Powell will stress that the Fed is prepared to continue hiking rates beyond 5% and keep them there until 2024, as the December Dot Plots showed,'' the analysts argued. ''As things stand, the Fed is seen starting an easing cycle in H2 and we view that as highly unlikely,'' they said.
New Federal Reserve Dot Plots and macro forecasts won’t come until the March 21-22 meeting, so the Fed official's rhetoric between this meeting and the next will be important, starting with the Federal Reserve's Chairman, Jerome Powell, when he speaks to the press. For instance, while we have been in a blackout period ahead of the Fed, where Fed speakers go quiet, prior to this, Federal Reserve's James Bullard said he expects inflation to recede this year but not as fast as the market sees. He said the Fed policy is almost restrictive but not quite there yet, adding that his 2023 rate projection last month was for 5.25-5.50%. He stressed that rates need to remain above 5% in order to push inflation down. He would prefer that the Fed policy were to err on the tighter side as insurance. This is bearish for the Gold price and bullish for the US Dollar.
Additionally, the European Central Bank and Bank of England are expected to hike rates by 50 basis points on Thursday. These too could be a spanner in the works for the Gold price as lower rates tend to be beneficial for bullion, decreasing the opportunity cost of holding the non-yielding asset. If the outcomes of both meetings a determined by hawkish rhetoric, then this in turn could be bad news for the Gold price bugs among us.
United States of America Nonfarm Payrolls and data in general are key
Markets also await Friday's US Nonfarm Payrolls report for January, with weakening in the labour market translating to decreasing inflation. Job creation likely remained solid, with payrolls gains staying above the 200k mark in Jan, analysts at TD Securities expect. ''We look for the Unemployment Rate rate to stay put at 3.5%.''
In this regard, analysts at ANZ Bank said that the weaker economic data recently released in the United States of America does raise the question as to when the Federal Reserve will start to ease rates, or pause their hikes. However, they added that they '' think that the Federal Open Market Committee, FOMC, will acknowledge there has been some progress in weakening demand but we do not think that trends are yet sufficiently established in the labour market or service prices for the Federal Reserve to be able to step back from its hawkish disposition just yet.''
Depending on the outcome of these events this week, the technical outlook for Gold price will be just as key as the yellow metal tinkers on the edge of falling below $1,900. Analysts at TD Securities said that a move below $,1890 would likely spark a notable selling program totalling -6% of the trend following cohort's maximum historical position size. ''Upside trend signals continue to deteriorate across the complex, pulling the thresholds for trend reversals closer.''
Gold price technical analysis
As per the prior analysis, Gold Price Forecast: XAU/USD bulls could emerge ahead of Federal Reserve, the Gold price has been forced out of a geometrical pattern and dropped to test $1,900 on what could have been clear out of stale sell-stops:
Prior Gold price analysis
We can see that we had a 3-line strike in play for the Gold price:
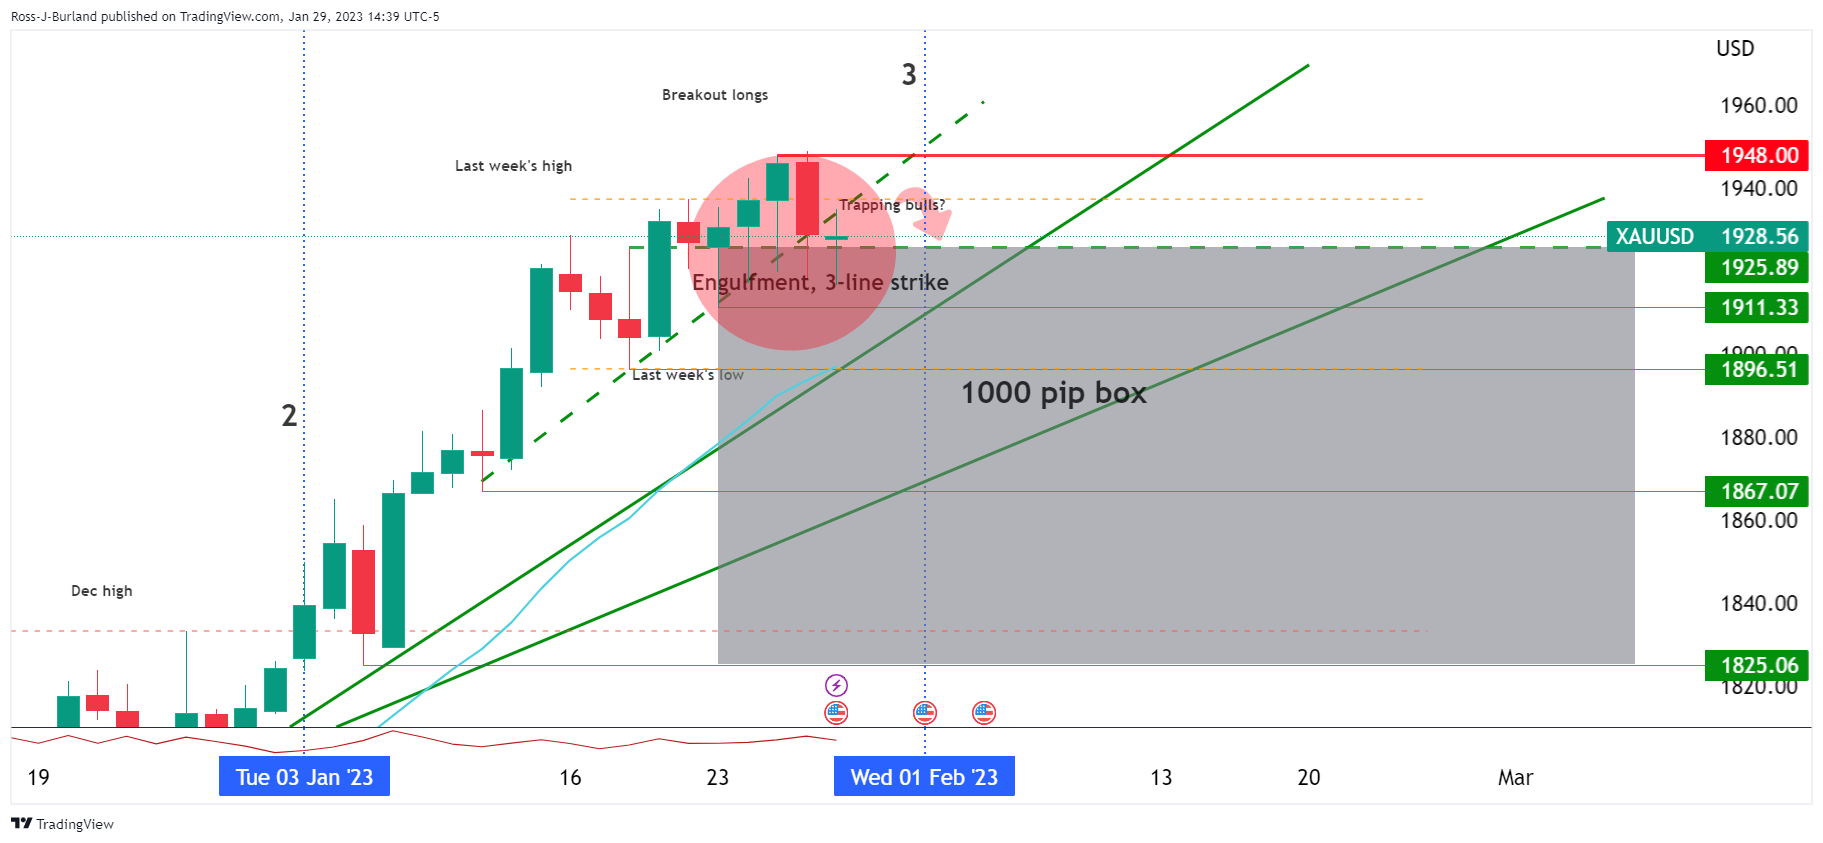
This was a Gold price trend continuation candlestick pattern consisting of four candles. In this particular scenario, we did not have the close below the first of the four candles, but this was a bearish scenario nonetheless for Monday and bears capitalized on it as follows:
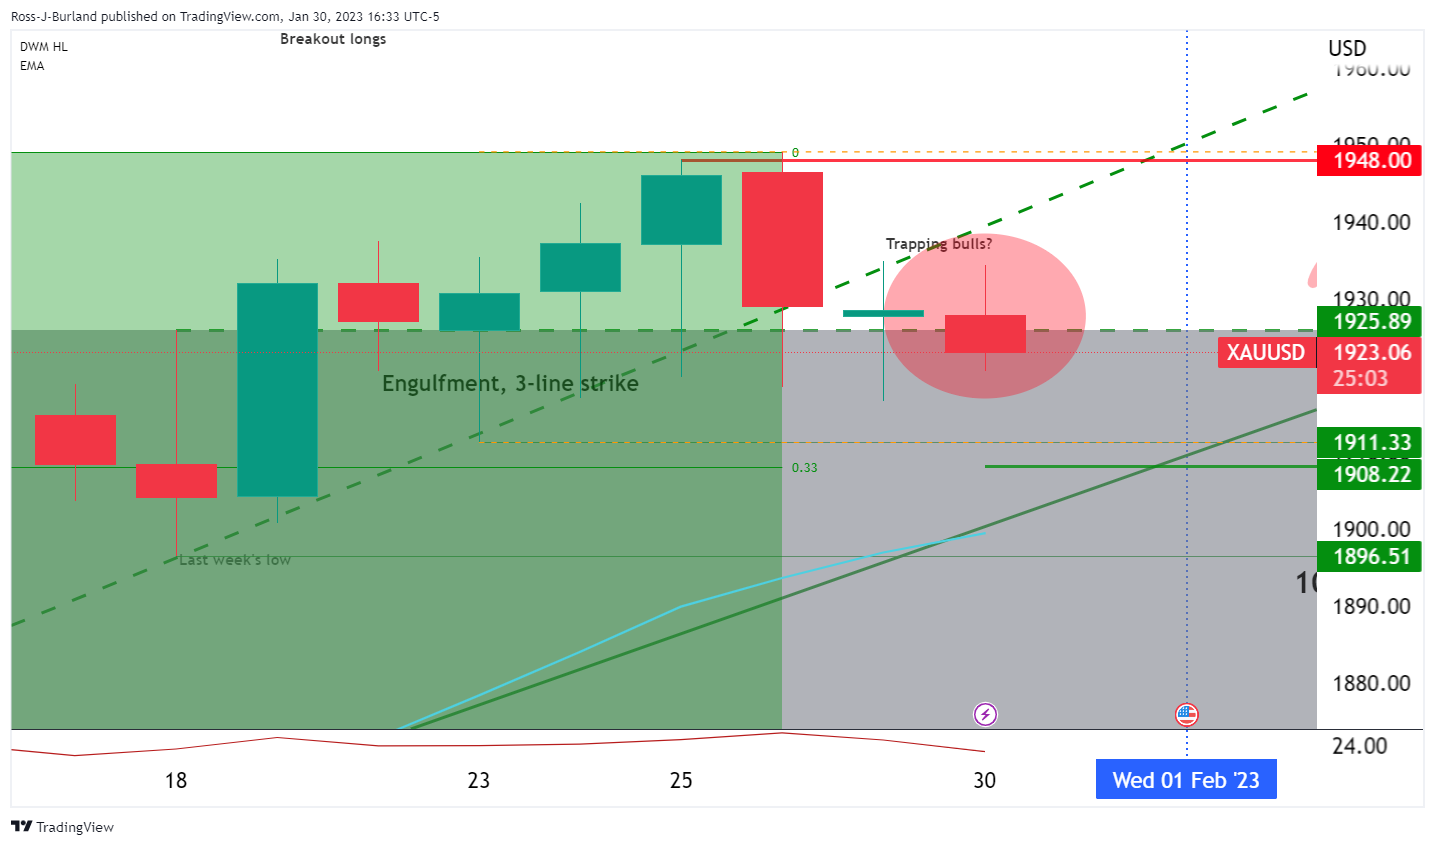
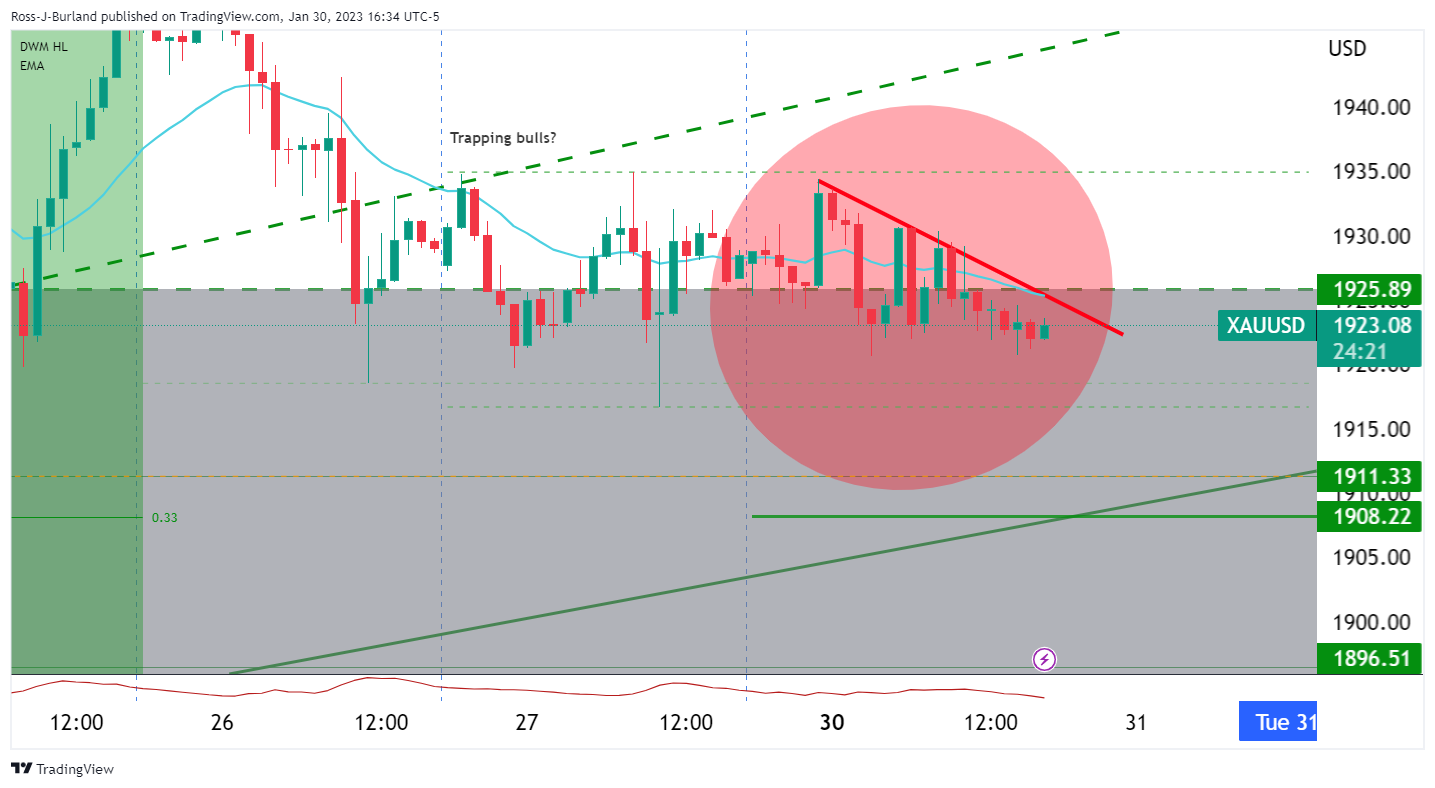
The Gold price hourly chart showed that the Gold price is being jammed into the lows and a subsequent sell-off occurred as follows:
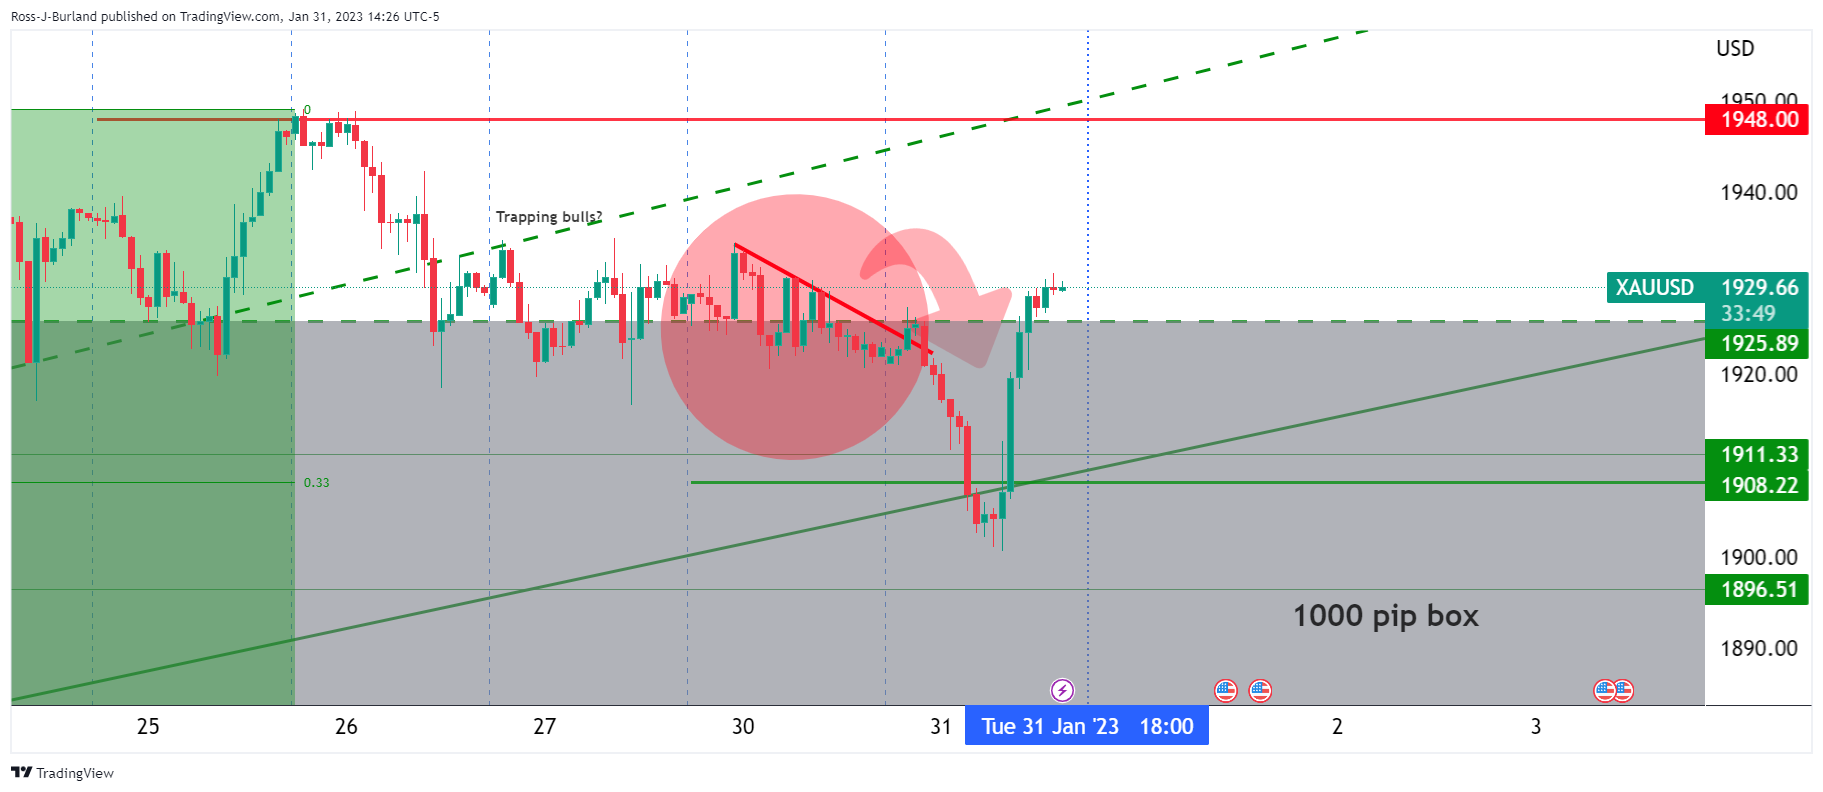
At this juncture, we are likely to see consolidation as we head into the Federal Reserve. however, for a full analysis of the Gold price that was made at the start of the week and remains valid for the events, see here: Gold, Chart of the Week: XAU/USD trapped bulls into the Fed and NFP, and here: Gold, Chart of the Week: XAU/USD trapping longs for a significant squeeze ahead of key red-hot events.
What you need to take care of on Wednesday, February 1:
Financial markets were quite volatile on Tuesday, as market players aimed to anticipate the upcoming US Federal Reserve decision. The United States central bank will be the first but not the last as the European Central Bank and the Bank of England will do the same on Thursday.
The US Dollar surged throughout the first half of the day helped by risk aversion. Asian stocks spent the day on the back foot, while European ones trimmed losses ahead of the close, led by gains in Wall Street. The mood improved after the release of US data signaling easing inflationary pressures. The Employment Cost Index rose in the last quarter of 2022 by 1%, below the 1.1% expected and easing from 1.2% in the previous quarter. Afterwards, the US Dollar gave up its intraday gains, ending the day unevenly across the FX board.
The Canadian Dollar was the strongest USD rival, helped by firmer oil prices, while the British Pound was the weakest. USD/CAD settled at near the 1.3300 figure, while GBP/USD stands in the 1.2330/40 price zone.
The EUR/USD pair tested the 1.0800 price zone, to end the day at around 1.0860. The Euro Zone the Q4 Gross Domestic Product (GDP) showed the economy grew at an annualized pace of 1.9%, better than the 1.8% anticipated by financial markets. On a negative note, German Retail Sales plunged by 5.3% MoM in December, much worse than expected.
Australian data released at the beginning of the day was disappointing, with AUD/USD bottoming at 0.6983 during the European session. The pair later recovered to end the day unchanged in the 0.7050 price zone.
USD/JPY remain steady, now trading at around 130.15.
Gold met buyers around the $1,900 figure and finished the day at $1,929, while crude oil prices posted modest intraday advances and WTI currently changes hands at $78.50 a barrel.
Polygon Price Forecast: What crypto traders are looking for from Jerome Powell on Wednesday
Like this article? Help us with some feedback by answering this survey:
- Silver is trapped within the 20 and 50-day Exponential Moving Averages, trendless.
- Silver Price Analysis: Sideways but slightly tilted upwards, with buyers eyeing $25.00.
Silver price extended its consolidation around the $23.00-$24.50 during the week, capped by the 20 and 50-day Exponential Moving Averages (EMAs), and remains unable to break the range decisively. However, XAG/USD erased some of its earlier losses and shifted positively in the day, trading at $23.71, gaining 0.53%.
Silver Price Analysis: Technical outlook
XAG/USD’s price action has remained sideways for almost a month, around the $23.00-$24.50 range, in the near term. The lack of a catalyst keeps the white metal at around a peak, though it’s too early to call it like that, with the US Federal Reserve’s decision on Wednesday. At the time of typing, the XAG/USD hovers around the 20-day EMA at $23.69, which has been used as a pivot in the last 19, with the price fluctuating around it.
As the XAG/USD continues to rally in the session, a break above the 20-day EMA could pave the way for further upside, being the psychological $24.00 figure, the first supply area. Once cleared, the XAG/USD would be poised to challenge the YTD high at $24.54, followed by the $25.00 mark.
On the flip side, XAG/USD’s fall below the 50-day EMA at $23.10, and Silver will soon test the $23.00 mark. A breach of the latter will send Silver slumping to the YTD low at $22.76, followed by the 100-day EMA at $22.24 and then the 200-day EMA at $21.90.
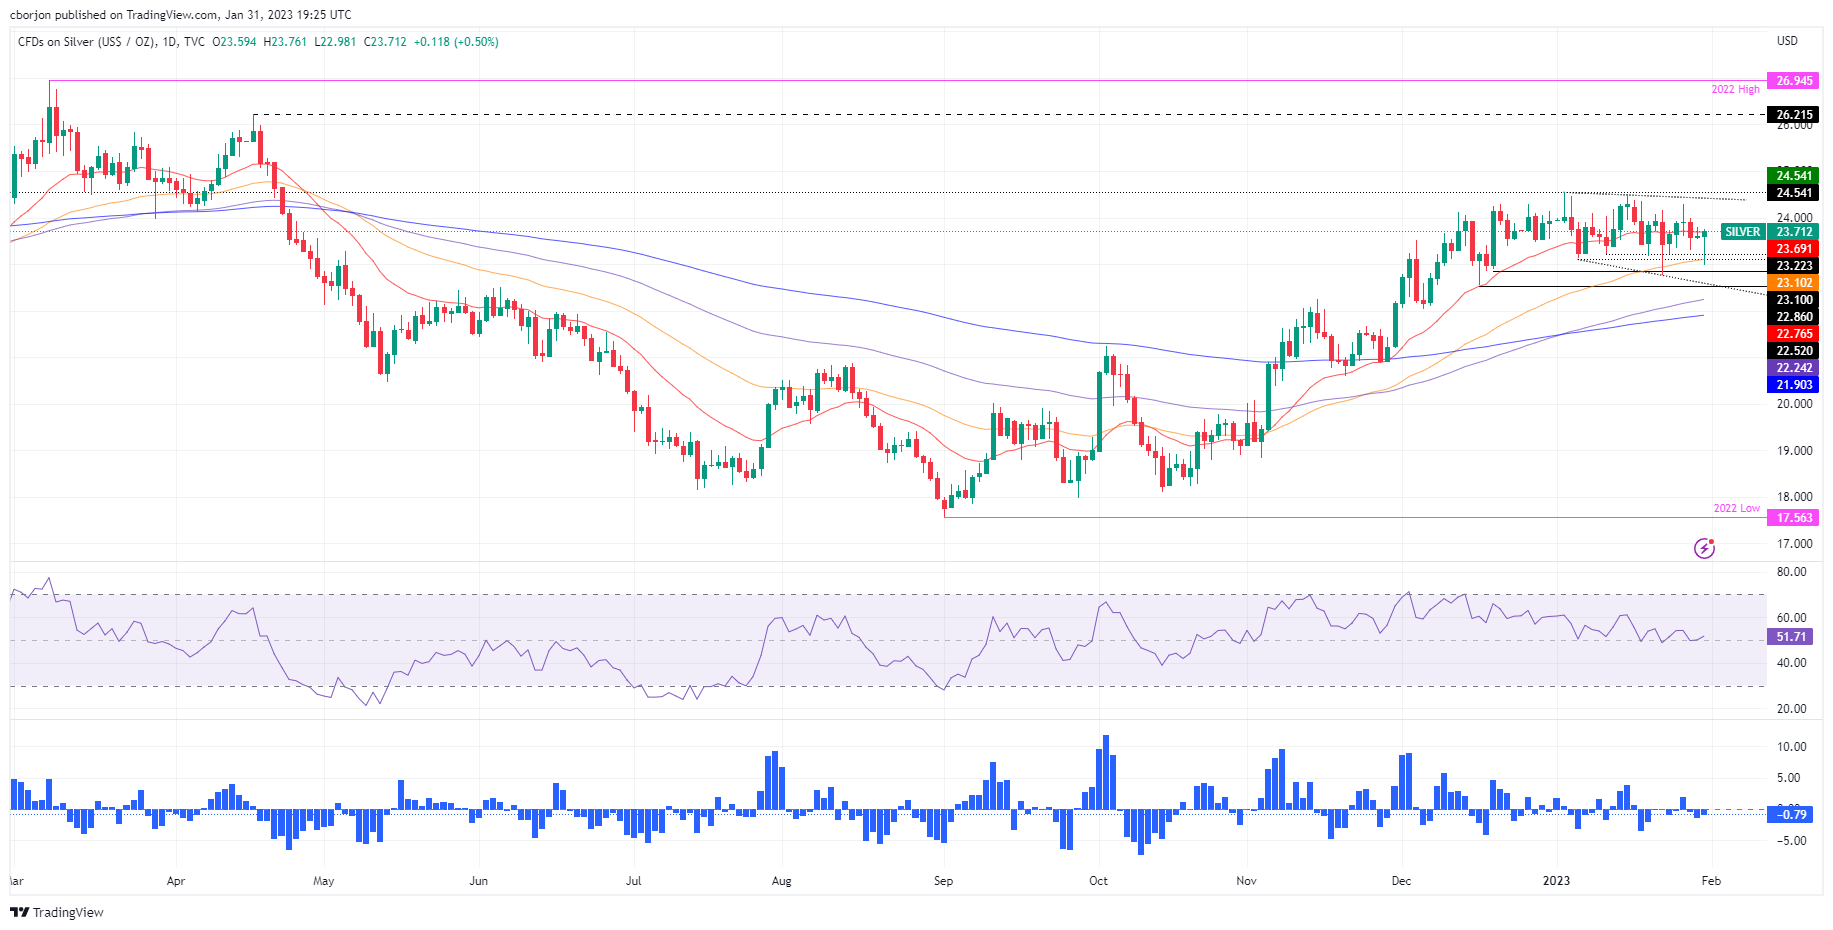
Silver Key Technical Levels
- Inflation in the United States continues to fall, as the ECI showed, sparking talks about a Fed pivot.
- Canada’s economy stalled and grew at a 0.1% pace in December.
- USD/CAD Price Analysis: It would likely extend its downtrend and test the 200-day EMA.
The USD/CAD retreated on Tuesday, as the US Dollar (USD), extended its losses following a report by the US Department of Labor (DoL), which showed that employment costs cooled down. At the same time, Canada’s economy grew as expected. Therefore, the USD/CAD is trading at 1.3319 after hitting a daily high of 1.3471.
US data weighed on the USD and boosted the CAD
The US Dollar continued its downtrend, weighed by the US Employment Cost Index (ECI), which measures workers’ compensation, decelerated after printing 1.2%, resting at 1%, below estimates of 1.1%. After the data was released, the greenback slashed some of its earlier gains against most G8 currencies, particularly the Loonie (CAD). Speculations arise that the US Federal Reserve (Fed) could pause after February and March’s meetings, as another inflation gauge revealed last week data showed the inflation downtrend extended to four straight months. Meanwhile, financial analysts estimate the US Fed would end lifting rates once they hit the 4.75% to 5% peak.
At the same time, Statistics Canada revealed that the economy in December grew at a 0.1% pace, unchanged compared to November’s data. On an annual basis, the Gross Domestic Product (GDP) likely gained 1.6% in Q4. If the flash estimate proves correct, the economy will expand by 3.8% in 2022 from the previous year, above the central bank’s 3.6% forecast.
Reflecting on the abovementioned, the USD/CAD dropped from around daily highs and extended its losses towards 1.3340, while the US Dollar Index, a gauge for measurement of the buck’s value vs. six peers, slides 0.13%, clings above 102.00 for the second day in a row.
Ahead of the week, the US economic docket will feature the S&P Global and ISM Manufacturing PMIs and the US Federal Reserve’s (Fed) decision. If the Fed sounds dovish, that would likely weaken the USD/CAD pair, which could extend its losses below 1.3300.
USD/CAD Technical Analysis
The USD/CAD, Tuesday’s candle, shows that the trading range has been wide throughout the session. Even though the pair reclaimed the 20 and 50-day Exponential Moving Averages (EMAs), each at 1.3406 and 1.3457, dropped sharply beneath both, and formed a candle with a considerable up-wick, suggesting that sellers are in charge. Therefore, the USD/CAD first support would be the YTD low at 1.3300, followed by the 200-day EMA at 1.3255, before sliding towards the psychological 1.3200 mark. On the other hand, if USD/CAD buyers reclaimed 1.3400, a test of the 100-day EMA is on the cards.
- EUR/USD is now about the key events coming up for the rest of the week, including the Fed and ECXB as well as NFP.
- For the time being, the meanwhile support of the 78.6% Fibonacci and the 50% mean reversion areas between 1.0800 and 1.0850 are keeping the bulls in play.
EUR/USD is at a crossroads trading around 1.0863 and slightly up on the day by .015% having ranged between a low of 1.0802 and 1.0867 in what has been a two-way business day ahead of central bank meetings.
The Federal Reserve showdown on Wednesday is the first major risk for EUR/USD and then the European Central Bank will be on Thursday, but the icing on the cake could be the US nonfarm Payrolls on Friday, especially if there are any surprises to come from that event. The central bank outcomes are expected to see the Federal Reserve hike by no more than 25 basis points and the European Central Bank by 50 basis points.
The communication leading up to these interest rates decisions has pretty much sealed the deal in this respect and markets are also expecting hawkish rhetoric from the central bank governors, Jermoe Powell and Christine Lagarde respectively. However, their tone around growth and inflation as well as guidance on further potential hikes could be market-moving. Indeed, the Federal Open Market Committee will want to flag the fact that we are going to see higher rates for a little bit longer, but it’s all about whether or not the market believes that narrative.
With respect to the US Dollar, analysts at TD Securities argued that it is not as sensitive to STIR pricing, ''so a higher for longer stance may not resonate as much. USD is stretched, though the catalyst for reversal by the Fed seems like a high bar. Parts of FX are displaying signs of rally fatigue, however. ''
EUR/USD technical analysis
EUR/USD is at a critical juncture on the charts ahead of the Federal Reserve event. The bulls remain in play but there are prospects of a significant correction if the market finds itself wrong on the Fed. A break of the bull cycle's trendline support and a hawkish outcome at the Fed would see the price plummet over time for a test all the way down to 1.0650/00.
EUR/USD daily charts
Zoomed in...
For now, the price is holding on the front side of the trendline so the bias remains bullish with eyes on 1.0930/50 and then the upper quarter area of the 1.09s and 1.10s after that.
Zoomed in x2 ...
As we can see, the critical horizontal support is located at 1.0765, just below the quarter level that guards a run on 1.0700 and into 1.0650 and even 1.0600 as a 100% measured move of the current consolidation range:
.
For the time being, the meanwhile support of the 78.6% Fibonacci and the 50% mean reversion areas between 1.0800 and 1.0850 are keeping the bulls in play on the front side of the bullish trendline, so again, the bias remains bullish at this point.
On Wednesday, the Federal Reserve will announce its decision on monetary policy with a 25 basis points hike already priced in. Analysts at TD Securities point out that the tone of the FOMC regarding growth and inflation and the guidance on future potential hikes could be what moves markets.
Key quotes:
“We expect the FOMC to deliver a 25bp rate increase at its February meeting, down from 50bp in December. The FOMC is likely to emphasize that despite slowing the pace of rate increases it is still determined to reach the terminal rate projected in the Dec dot plot.”
“Markets are already priced for a 25bp rate hike, but pricing for coming months and the terminal rate remains less certain. The Fed's tone around growth and inflation as well as guidance on further potential hikes could be market-moving.”
“USD is not as sensitive to STIR (Short-term interest rate) pricing, so a higher for longer stance may not resonate as much. USD is stretched, though catalyst for reversal by the Fed seems like a high bar. Parts of FX are displaying signs of rally fatigue however.”
Data released on Tuesday showed the Canadian economy grew 0.1% in November, with Q4 GDP estimated to have increased at a 1.6% annualized pace. Analysts at CIBC point out that the Canadian economy cooled during the final quarter of last year but was far from ice cold.
Key quotes:
“A 0.1% increase in GDP during November, combined with a marginal upward revision to the prior month and a flat estimated reading for December, resulted in a 1.6% annualized growth rate for the quarter as a whole. While that is a clear deceleration relative to the pace of growth seen earlier in the year, it is still better than most forecasters were anticipating before the quarter began.”
“While the Canadian economy hasn't cooled as quickly as we (and others) previously expected given the rapid rise in interest rates, there are growing signs of fragility. The recovery in many services has slowed even with activity still well below pre-pandemic levels, and a dip in restaurant activity could be an early sign of consumers changing their behaviour in the face of inflationary pressures and rising interest rates. Because of that we suspect that the economy will stall and possibly even contract modestly in Q1, which will keep the Bank of Canada on the sidelines.”
The Employment Cost Index (ECI) report released on Tuesday had an unusual impact across financial markets, with the US Dollar weakening after the numbers. Analysts at Well Fargo point out that the figures are one more in the list of inflation readings over which the Federal Reserve is breathing a little easier. They point out that while the report further supports inflation moving back toward the 2% target, labor cost growth remains too strong to be consistent with it staying there for the long haul. They think more slowing will be needed before the FOMC feels comfortable declaring victory on inflation.
ECI slowed for a third consecutive quarter
“The ECI report offers the FOMC one of its cleanest looks at how a tight labor market is translating into elevated wage pressures. Before the pandemic, employment cost growth was running at just shy of a 3% pace alongside core PCE inflation that was similarly just below 2%. The 5.1% increase in the ECI over the past year and 4.0% annualized increase in Q4 suggest that labor costs are still growing about a percentage point above what would be consistent with the FOMC's 2% inflation target given trend-like productivity growth.”
“But when it comes to inflation, easing labor cost growth should not be conflated with benign labor cost growth. The labor market remains incredibly tight. Plenty of household-name companies have announced layoffs over the past few months, but initial jobless claims continue to hover near record lows, and more independent businesses report having a hard time to filling jobs than at any point before COVID. Therefore, while the deceleration in labor costs is a welcome development from the Fed's perspective and further sign that inflation is headed back toward 2%, it is too soon to declare that it will stay there for the long-haul.”
- USD/CHF dips below 0.9200 as the US Dollar weakens and tumbles below the 20-day EMA.
- USD/CHF Price Analysis: Downward biased and might test the YTD low if it slides below 0.9100.
The USD/CHF stumbles sharply after hitting a two-week new high at 0.9288 and drops beneath 0.9200, to fresh two-day lows around 0.9174, before settling at around the current exchange rate. The USD/CHF changes hands at 0.9173, below its opening price by 0.75%.
USD/CHF Price Analysis: Technical outlook
During Tuesday’s session, the USD/CHF was quickly rejected, slightly above the January 24 daily high of 0.9279, with bears stepping in aggressively, sending the USD/CHF sliding firstly towards the 0.9200 figure, followed by a dip towards the 0.9180 area.
On its way downward, the USD/CHF pair cleared the 20-day Exponential Moving Average (EMA) at 0.9230 and also was seen back below downslope resistance trendlines, drawn since November and January. Therefore, the USD/CHF is downward biased in the short term and might test crucial demand levels.
The USD/CHF first support would be the January 26 high at 0.9158. The break below will expose the 0.9100 psychological level, followed by the YTD low at 0.9085.
As an alternate scenario, the USD/CHF reclaiming the 0.9200 figure, that would open the door for further gains. The next ceiling level would be the 20-day EMA at 0.9230, followed by the January 31 high at 0.9288
USD/CHF Key Technical Levels
- US Dollar tumbles during the American session as FOMC meeting kicks off.
- US yields move down, then rebounds, making USD/JPY volatile.
- The pair trades above 130.00 after hitting a fresh daily low at 129.73.
The USD/JPY tumbled and then redounded during the American session, but overall it remained in a familiar range, hovering around 130.00
Mixed US data
The surprise of the day so far was the influence of the Employment Cost Index (ECI). The numbers triggered price action across financial markets. The ECI rose 1% in the fourth quarter, below the 1.1% of market consensus. It points to a continuation of the slowdown in inflation. Following the report, the Dollar tumbled, Wall Street soared and Treasury yields rose.
A different economic report showed the S&P/Case-Shiller Home Price Index rose by 6.8% (y/y) in November below the 6.9% of market consensus and the 8.7% of the previous month. Conference Board announced the Consumer Confidence Index came in at 107.1 in January below the expected 109.0.
The two-day FOMC meeting has started. Market participants expect the Federal Reserve to raise interest rates by 25 basis points. The focus will be on the statement and the projections. Analysts will look for clues about the future path of monetary policy.
USD/JPY down, then trims losses
The USD/JPY bottomed at 129.73 after the ECI. It was rejected from under 130.00 as US yields rebounded amid risk appetite. It climbed to the 130.20 area. Despite the moves, the pair continues to trade within last week’s range.
A consolidation above the upper limit around 130.50 should clear the way to more gains while below 129.00, the slide could accelerate. Before the 129.00 zone, an intermediate support is located at 129.60.
Technical levels
Economists at UBS expect the US Dollar to travel along a weaker path, with limited and short-lived bouts of strength.
US Dollar on a weaker path
“The Fed is getting closer to the end of its rate-hiking cycle. With markets growing comfortable with a terminal fed funds rate close to or at 5%, and US inflation likely to quickly roll over in the first half of this year, downward pressure on the USD should continue to mount.”
“Reduced carry advantage could weigh on the Dollar over the medium term. Last year, an increasing US-Germany 10-year interest rate differential was a tailwind for the strong Dollar rally. However, the yield differential is likely to be less supportive this year.”
“Better growth outlook ex-US supports other currencies. We believe that a rebound in global growth expectations for the second half of 2023 and 2024 should support the Euro and the currencies of Asia’s major exporters.”
S&P 500 carved out a higher trough at 3765 as compared to the one in October near 3490. The index could test 4218/4310 on a move above 4120, economists at Société Générale report.
Defending the 50DMA at 3930 would be crucial for persistencein up move
“It is worth noting that the index is about to witness a golden crossover (i.e. the 50DMA crossing beyond the 200DMA); this highlights potential upside.”
“S&P 500 is now close to the upper limit of the range since September at 4120. If this hurdle is overcome, ongoing bounce could extend towards previous bearish gap at 4218 and projections of 4310/4370.”
“Defending the 50DMA at 3930 would be crucial for persistence in up move.”
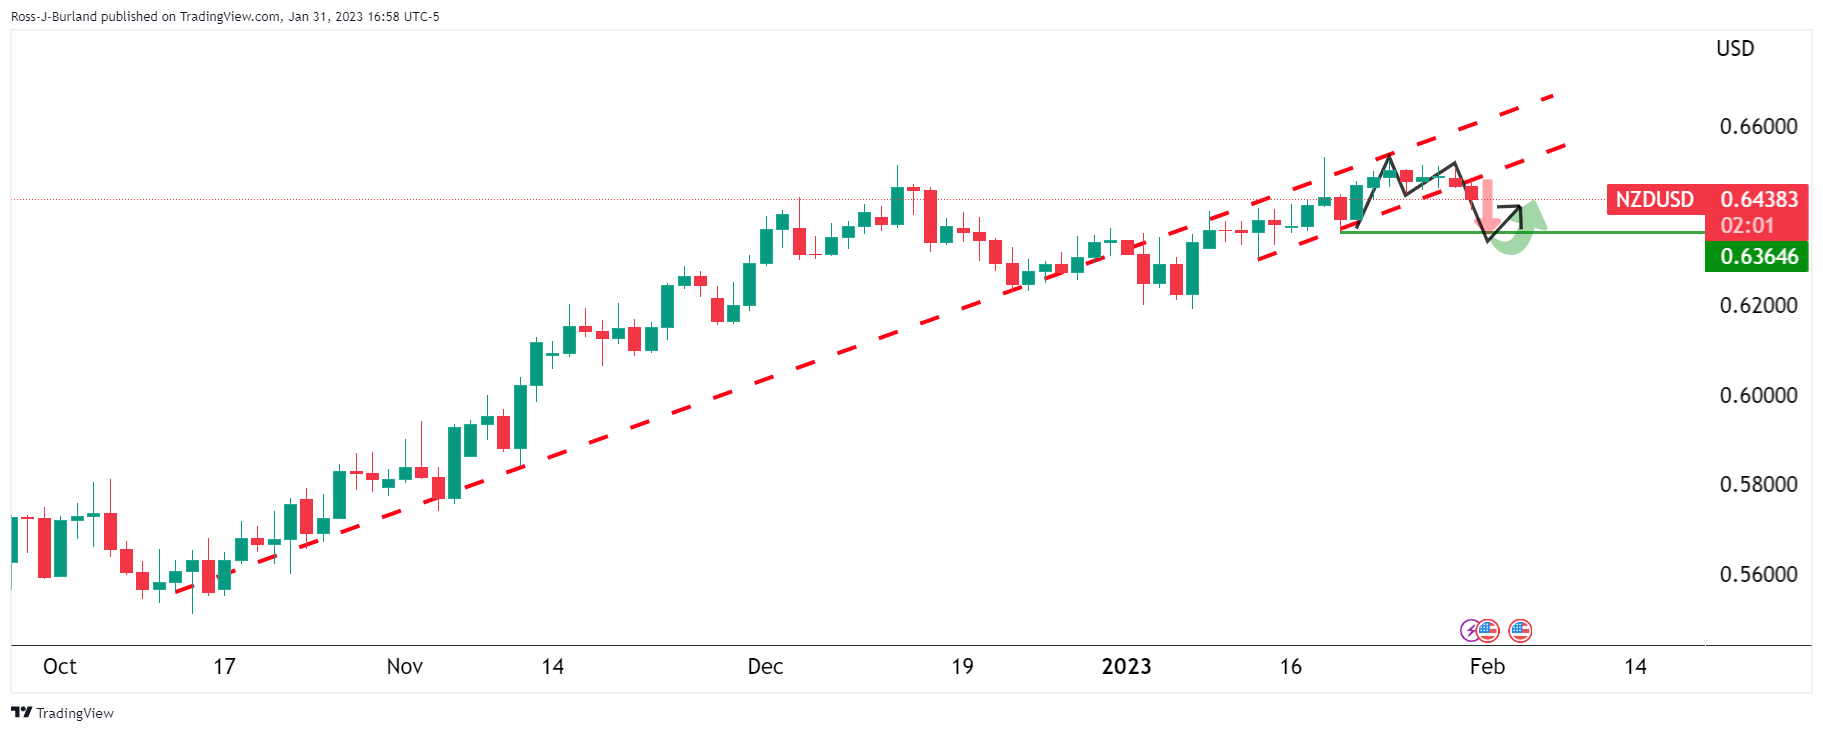
NZD/USD stays on the back foot and trades in negative territory near 0.6450. The pair is set to extend its decline towards 0.62 in the coming months, economists at Rabobank report.
Strong print for wage data is likely to give the NZD/USD a fillip
“A strong print for wage data this evening is likely to give the NZD/USD a fillip. However, the impact is likely to be soon overwhelmed by the response to the FOMC meeting tomorrow.”
“On the basis that we expect the market to price out expectations of a Fed rate cut this year, we see the potential for NZD/USD to dip back to its January low in the 0.62 area on a three-to-six month view. However, we expect NZD/USD to end the year on a stronger note.”
See – NZ Labour Market Preview: Forecasts from four major banks, unemployment around record low
- The Pound Sterling continued to soften vs. the US Dollar ahead of the Fed’s decision.
- US inflation continues to grind lower as the Employment Cost Index drops.
- The International Monetary Fund expects the UK economy to hit a recession in 2023.
The Pound Sterling (GBP) extended its losses to three straight days against the US Dollar (USD), albeit a report from the Commerce Department showed that inflation continued to ease, incrementing expectations that US Federal Reserve’s (Fed) rate hikes would moderate. At the time of typing, the GBP/USD is trading at 1.2291.
US data slightly weakened the US Dollar, though it remains stronger than the GBP
Wall Street advances after employment costs data cooled down. The US Department of Labor (DoL) revealed that the Employment Cost Index (ECI) used by Fed officials as a measure of inflation in the labor market eased from 1.2% to 1% QoQ. Today’s data added to last week’s US Core Personal Consumer Expenditure (PCE), another inflation indicator used by the Fed, edged lower by the fourth straight month, from 4.7% YoY to 4.4%. All that said, speculations had mounted that the Fed will increase rates by 25 bps at its two-day meeting, which begins today and finishes on Wednesday when the US central bank releases its monetary policy statement.
In the meantime, the US Dollar Index, a measure of the American Dollar (USD) value versus its peers, has paired some of its losses and is up 0.08%, at 102.316, a tailwind for the GBP/USD.
Across the pond, the UK’s economic docket was absent. However, newswires reported that the International Monetary Fund (IMF) revealed that Britain’s economy would slide into a recession. The IMF foresees the economy to shrink 0.5% between the 2022 Q4 and the final quarter of 2023.
It should be said that the IMF updated its forecasts and expects the global economy to grow by 2.9% compared to its last projections of 2.7%, citing economic resilience and China’s reopening.
Given the backdrop, the GBP/USD would be greatly influenced by monetary policy decisions by the Federal Reserve and the Bank of England (BoE). On Wednesday, the Fed would be the first to act, while the BoE is estimated to raise rates by 50 basis points (bps), leaving the Bank Rate at 4%. Most analysts expect this would be the last increase by the BoE, which could lead to some Sterling weakness, as rates in the US are expected to peak at 5%.
GBP/USD Key Technical Levels
Gold price registered gains in the first three days of the last week. However, the yellow metal lost its traction and erased its gains to close the week virtually unchanged. The Federal Reserve's (Fed) policy announcements and January jobs report this week could help investors decide whether the XAU/USD's bullish rally has more legs.
Fed policy announcements and US January jobs report could ramp up volatility
“The Fed is widely expected to raise its policy rate by 25 bps to the range of 4.5-4.75%. In case Powell continues to push back against the 'Fed pivot' narrative and tries to convince markets that they have no plans of cutting the policy rate before 2024, US T-bond yields could edge higher and weigh on XAU/USD. However, investors are unlikely to bet on a steady USD rebound before seeing the employment and inflation figures for January.”
“On the last trading day of the week, the wage inflation of the labour market data could influence the US Dollar's valuation. If the data reveals a further softening of wage inflation in January, the greenback could come under selling pressure and help XAU/USD push higher.”
“Finally, the Prices Paid sub-index of the ISM's PMI report will be watched closely. The component is expected to decline to 65.5 from 67.6 in December. A lower-than-consensus print should hurt the USD and provide a boost to XAU/USD and vice versa.”
- Consumer confidence in the US weakened modestly in January.
- US Dollar Index posts small daily gains above 102.30 after the data.
Consumer sentiment in the US deteriorated modestly in January with the Conference Board's Consumer Confidence Index declining to 107.1 from 109.0 in December. This reading came in below the Reuters estimate of 109.0.
Further details of the publication revealed that the Jobs Hard-to-Get Index edged lower to 11.3 from 11.9 and the one-year consumer inflation rate expectations rose to 6.8% from 6.6% in December.
Market reaction
US Dollar Index gained traction with the initial reaction and was last seen posting small daily gains at 102.35.
- The index fades the initial spike to the 102.60 zone.
- US Employment Cost Index disappoints at 1.0% in Q4.
- CB Consumer Confidence surprised to the downside in January.
The USD Index (DXY), which gauges the greenback vs. a bundle of its main rivals, comes all the way down to the 102.30 region after climbing to as high as the 102.60 area earlier on Tuesday.
USD Index surrenders gains post-labour data
The index saw its earlier uptick to multi-day highs around 102.60 suddenly trimmed after the US Employment Cost Index rose 1.0% QoQ in Q4, less than estimated and down from the previous 1.2%.
Indeed, that disheartening results seem to have given extra legs to the Fed’s pivot narrative and therefore forced the buck to give away almost all of the earlier advance to the 102.60 area.
Additional US data saw the House Price Index tracked by the FHFA contract at a monthly 0.1% in November, while the Chicago PMI receded to 44.3 in January (from 44.9) and the Conference Board’s Consumer Confidence retreated marginally to 107.1, also for the current month.
What to look for around USD
The dollar picks up pace and manages to leave behind the key 102.00 mark against the backdrop of persistent prudence ahead of the imminent FOMC gathering (Wednesday).
The idea of a probable pivot in the Fed’s policy continues to hover around the greenback and keeps the price action around the DXY somewhat subdued. This view, however, also comes in contrast to the hawkish message from the latest FOMC Minutes and recent comments from rate setters, all pointing to the need to advance to a more restrictive stance and stay there for longer, at the time when rates are seen climbing above the 5.0% mark.
On the latter, the tight labour market and the resilience of the economy are also seen supportive of the firm message from the Federal Reserve and the continuation of its hiking cycle.
Key events in the US this week: Employment Cost Index, FHFA House Price Index, CB Consumer Confidence (Tuesday) – MBA Mortgage Applications, ADP Employment Change, Final Manufacturing PMI, ISM Manufacturing, Construction Spending, FOMC Interest Rate Decision (Wednesday) – Initial Jobless Claims, Factory Orders (Thursday) – Nonfarm Payrolls, Unemployment Rate, Final Services PMI ISM Non-Manufacturing (Friday).
Eminent issues on the back boiler: Rising conviction of a soft landing of the US economy. Prospects for extra rate hikes by the Federal Reserve vs. speculation of a recession in the next months. Fed’s pivot. Geopolitical effervescence vs. Russia and China. US-China trade conflict.
USD Index relevant levels
Now, the index is up 0.04% at 102.27 and the immediate hurdle comes at the weekly high at 102.89 (January 18) followed by 105.63 (monthly high January 6) and then 106.47 (200-day SMA). On the flip side, the breach of 101.50 (2023 low January 26) would open the door to 101.29 (monthly low May 30 2022) and finally 100.00 (psychological level).
- US Dollar weakens following Q4 US Employment Cost Index.
- Data points to more evidence of a slow down in inflation.
- XAU/USD erases daily losses with a rebound of more than $10.
Gold prices bounced sharply higher following the release of US labor costs data for the fourth quarter. More evidence of a slowdown in inflation pushed US yields to the downside and Wall Street to the upside, weakening the greenback.
The Employment Cost Index (ECI) rose 1% in the fourth quarter, below the 1.1% of market consensus and marked the third consecutive slowdown. Still the index is up by 4% compared to a year ago. The evidence of an improvement in the inflation outlook boosted US yields ahead of Wednesday’s FOMC decision.
Still the numbers are high, suggesting that inflation is still not consistent with Fed’s target. “Even as supply chain pressures ease, commodity prices cool and housing costs temper, we think the FOMC still wants to see a bit more slowing in wage growth before the Committee feels confident inflation is firmly headed to 2% over the medium term”, said analysts at Wells Fargo.
The greenback tumbled after the report and also did Treasuries, boosting gold. Also equity and crude oil price rose. XAU/USD erased all losses and it is hovering around daily highs at $1,927.
Earlier on Tuesday, gold bottomed at $1,900 a critical support. Now price is back above the $1,920 zone, another relevant technical area. If it remains above, a test of $1,935 will be on the cards.
Technical levels
Eurostat will release the Eurozone Harmonised Index of Consumer Prices (HICP) data for January on Wednesday, February 1 at 10:00 GMT and as we get closer to the release time, here are the expectations forecast by the economists and researchers of seven major banks regarding the upcoming EU inflation print.
Headline is expected at 9.1% year-on-year vs. 9.2% in December, while core is expected at 5.1% YoY vs. 5.2% in December. On a monthly basis, the HICP in the old continent is expected to fall by -0.3% in the reported period while the core HICP is also down by -0.2%.
Commerzbank
“The ECB expects the rate to rise again in January. In fact, however, it is likely to remain at 9.2%. As is often the case at the beginning of a year, the inflation rate for January 2023 will also be influenced by a number of special factors. This time, various measures taken by governments to curb the rise in energy prices complicate matters further, in addition to the usual update of the goods basket. Although some effects dampening the rise in energy prices lost influence, the contribution of energy prices to the overall inflation rate is unlikely to increase much. The same applies to food prices. By contrast, the inflation rate excluding energy, food, alcohol and tobacco is likely to have fallen slightly from 5.2% to 5.1%. However, this decline is solely attributable to the change in the basket of goods. There can therefore be no talk of a weakening of underlying inflation.”
Danske Bank
“We look for an uptick both in headline (9.6%; from 9.2%) and core (5.4%, from 5.2%) terms.”
Nomura
“We forecast a large fall in the annual rate of euro area inflation in January from 9.2% to 8.4%.”
TDS
“New energy subsidies likely pulled down German headline HICP for the third consecutive month. Combined with further household support in the Netherlands and the impact of lower wholesale energy prices, this should push EZ headline inflation down to 8.4% YoY. Core is what will matter for the ECB though, and here we see no indication of a softening of the recent strong momentum.”
SocGen
“The euro area January flash HICP is likely to print down 0.4pp at 8.8% YoY, with core 0.2pp lower at 5.0% YoY, temporarily dragged down by the annual weighting changes.”
Citibank
“HICP Inflation, January: Citi Forecast 8.9% YoY, Prior 9.2% YoY; Core Inflation, January: Citi Forecast 5.3% YoY, Prior 5.2% YoY.”
Deutsche Bank
“We expect Eurozone HICP to decline to 8.4% in January and continue falling to c.3.5% in Q4 this year. Core inflation is seen staying in a 5.0-5.5% range throughout the first half of this year.”
EUR/SEK challenges critical levels around 11.30. If Swedish economic data disappoints, the Krona could come under further downside pressure.
The Riksbank’s work is not getting any easier
“Some important economic data, such as the PMI tomorrow or household consumption next week, is on the agenda ahead of the rate decision next week, and the Riksbank is going to keep a close eye on it too.”
“For now, the market is pricing in a 50 bps rate step. If the data disappoints it might lower its expectations though, putting pressure on SEK as a result.”
S&P 500 backed away from the brink yesterday after being capped below ‘last resort’ resistance at 4101. This keeps the market with the long-term downtrend still intact whilst below this level, in the view of analysts at Credit Suisse.
Key short-term support is at 3956/49
“S&P 500 backed away from the brink yesterday, reversing its recent close above the important 2022 downtrend after being capped below ‘last resort’ resistance at the 4101 December bearish ‘reversal week’ high. This keeps the market finely poised into this week’s FOMC meeting, with the long-term downtrend still intact whilst below this level.
“We reverse into a tactically bearish stance, with first key support at 3956/49. Back below here would be the first step to reasserting the still intact, at least at this stage, bear market. Next supports thereafter are seen at 3926/25 and then 3886/77.”
“We are still very wary of the potential for an aggressive short-covering rally. However, we remain of the view that a weekly closing break above the 4101 December high is needed to trigger a capitulation-driven move higher, whilst also confirming that we have seen an important change of longer-term trend from down to sideways.”
GBP has weakened in line with the overall gain in the USD against its core European peers. However, more significant losses look technically unlikely, in the view of analyst at Scotiabank.
GBP eases but holds range
“Sterling has slipped and short-term technical signals have turned more negative but price action has not extended to a point where more significant losses look technically likely.”
“Cable is essentially holding within its recent trading range and while the Pound holds above last week’s 1.2265 low, downside risks should remain limited. A break below that point would, however, indicate growing risk of a dip to the lows 1.21s.”
- House prices in the US declined modestly in November.
- US Dollar Index continues to stretch lower toward 102.00.
House prices in the US declined by 0.1% on a monthly basis in November, the monthly data published by the US Federal Housing Finance Agency showed on Tuesday. This reading came in below the market expectation for an increase of 0.8%.
Meanwhile, the S&P/Case-Shiller Home Price Index arrived at 6.8% on a yearly basis in November, down from 8.7% in October.
Market reaction
US Dollar Index stays under modest bearish pressure after this data and was last seen posting small daily losses at 102.19.
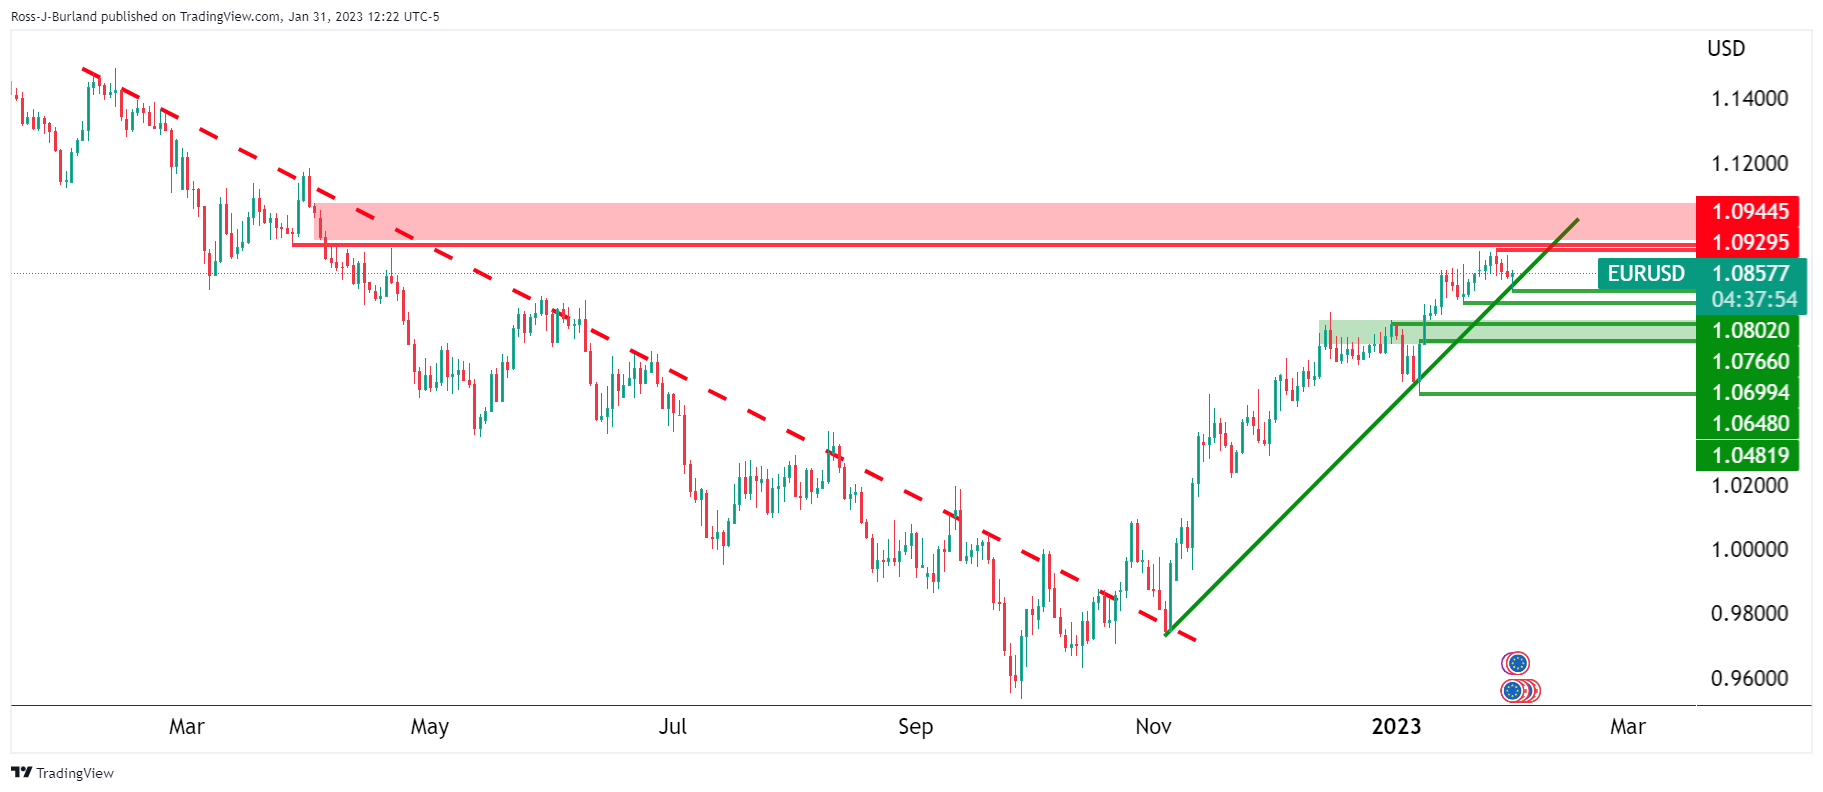
- EUR/USD bounces off lows near the 1.0800 mark.
- Bets for another test of the 2023 high seem to be losing ground.
EUR/USD manages to reverse the earlier pullback to 2-week lows near the 1.0800 region on Tuesday.
If the downside picks up pace, then the next support of note is seen emerging at the weekly low at 1.0766 (January 18) prior to the 3-month support line just above 1.0700.
The continuation of the uptrend now needs to clear the 2023 high at 1.0929 (January 26) to allow for a test of the weekly top at 1.0936 (April 21 2022). A sustainable break above this level could pave the way for a challenge of the key barrier at 1.1000
In the longer run, the constructive view remains unchanged while above the 200-day SMA, today at 1.0311.
EUR/USD daily chart
- USD/JPY remains capped near a two-week-old descending trend-line hurdle.
- The formation of a bearish pennant supports prospects for a fresh leg down.
- A sustained move beyond mid-130.00s is needed to negate the bearish outlook.
The USD/JPY pair struggles to capitalize on the previous day's rally of over 135 pips from the 129.20 area and oscillates in a narrow range through the early North American session on Tuesday.
From a technical perspective, a descending trend-line extending from January 18, currently around the 130.50 area, caps the upside for the USD/JPY pair. This, along with another upward-sloping trend line, constitutes the formation of a symmetrical triangle and points to a consolidation phase.
Given the recent sharp decline from over a three-decade high, the aforementioned triangle might now be categorized as a bearish pennant. This, in turn, favours bearish traders and supports prospects for the resumption of the well-established declining trend witnessed over the past three months or so.
That said, it will still be prudent to wait for a convincing break below the triangle support, 129.25 region, before placing fresh bearish bets. The USD/JPY pair might then turn vulnerable to weaken below the 129.00 mark and test intermediate support near the 128.75-128.70 horizontal zone.
The downward trajectory could get extended further towards the 128.00 round-figure mark, below which the USD/JPY pair seems all set to challenge the multi-month low, around the 127.20 zone touched on January 16.
That said, a sustained strength beyond mid-130.00s, or the top end of the symmetrical triangle, will negate the negative outlook and prompt some near-term short-covering rally. The USD/JPY pair might then accelerate the momentum towards the 131.00 mark, en route to the post-BoJ swing high, around the 131.55-131.60 area. Some follow-through buying should pave the way for additional near-term gains.
USD/JPY 4-hour chart
Key levels to watch
At the start of the week USD/MXN traded further sideways below the 19 mark. Mexican GDP data for Q4 2022 will be published today. A downside surprise could put pressure on the Peso, economists at Commerzbank report.
Economic momentum likely to have weakened
“Today, the Mexican office of statistics (INEGI) will publish a first estimate of growth in Q4 2022 – which will provide a backward glance. Bloomberg consensus expects that economic momentum will have weakened and expects seasonally adjusted QoQ growth of 0.3%, following 0.9% the previous quarter. Year-on-year consensus expects growth of 3.4% (in Q3 the rate stood at 4.3%). As a result, growth would be below Banxico’s projections.”
“If the data were to surprise on the downside and come in well below Banxico’s projections that is likely to put pressure on the Peso, above all in a more risk-averse market environment.”
- The index extends the corrective upside beyond 102.00.
- The breakout of the 102.90 region could lend extra legs to the index.
DXY advances for the fourth consecutive session well north of the 102.00 hurdle on Tuesday.
Further recovery faces the immediate hurdle at the 3-month resistance line around 102.90. If the index manages to clear this region it could accelerate gains to the provisional 55-day SMA at 104.22.
Below this line, the dollar is expected to keep the short-term bearish bias unchanged.
In the longer run, while below the 200-day SMA at 106.47, the outlook for the index remains negative.
DXY daily chart
- Employment Cost Index in the US rose less than expected in Q4.
- US Dollar Index lost its traction and erased daily recovery gains after the data.
The data published by the US Bureau of Labor Statistics revealed on Tuesday that the Employment Cost Index, compensation costs for civilian workers, increased by 1.1% in the fourth quarter.
This reading came in below the market expectation of 1% and followed the 1.2% increase recorded in the third quarter.
"Wages and salaries increased 1.0% and benefit costs increased 0.8% from September 2022," the BLS further noted in its publication.
Market reaction
With the initial reaction, the US Dollar lost some strength against its major rivals and the US Dollar Index was last seen trading virtually unchanged on the day at 102.22.
- Canadian economy grew by 0.1% on a monthly basis in November.
- USD/CAD holds in positive territory slightly below 1.3450 after the data.
Real Gross Domestic Product (GDP) in Canada grew by 0.1% on a monthly basis in November, the data published by Statistics Canada revealed on Tuesday.
This reading matched October's expansion of 0.1% and came in slightly better than the market expectation of 0%.
"Advance information indicates that real GDP was essentially unchanged in December," Statistics Canada noted in its publication. "Increases in the retail, utilities, and public sectors were offset by decreases in the wholesale, finance and insurance, and mining, quarrying, and oil and gas extraction sectors."
Market reaction
USD/CAD pair edged slightly lower with the initial reaction and was last seen trading at 1.3437, gaining 0.4% on a daily basis.
- AUD/USD continues losing ground for the second straight day and drops to a one-week low.
- The dismal Australian data weighs on the domestic currency amid a modest USD strength.
- Traders look to the US macro data for a fresh impetus ahead of the FOMC on Wednesday.
The AUD/USD pair remains under heavy selling pressure for the second straight day on Tuesday and drops to over a one-week low heading into the North American session. The pair is currently placed around the 0.7000 psychological mark and seems vulnerable to prolonging its recent pullback from the highest level since June 2022 touched last week.
The Australian Dollar weakens across the board in reaction to the dismal domestic macro data, which showed that Retail Sales slumped 3.9% in December amid the persistent rise in prices. Furthermore, investors are increasingly pessimistic about the economic outlook amid expectations that additional rate hikes by the Reserve Bank of Australia (RBA) will contribute to the cost of living crisis. This, along with a modest US Dollar strength, exerts downward pressure on the AUD/USD pair.
The worst COVID-19 outbreak in China raises uncertainty about a strong recovery in the world's second-largest economy and continues to weigh on investors' sentiment. This is evident from a generally weaker tone around the equity markets, which is driving some haven flows towards the buck and weighing on the risk-sensitive Aussie. The USD uptick could also be attributed to some repositioning trade ahead of the highly-anticipated FOMC monetary policy decision, due to be announced on Wednesday.
The Fed is expected to further slow the pace of its policy-tightening cycle and deliver a smaller 25 bps rate hike. The recent US macro data, however, point to an economy that is resilient despite the rapidly rising borrowing costs and backs the case for the Fed to stick to its hawkish stance for longer. This, in turn, prompts traders to lighten their USD bearish positions, though a downtick in the US Treasury bond yields keeps a lid on any meaningful upside, at least for now.
Heading into the key central bank event risk, traders on Tuesday will take cues from the US economic docket, featuring the Chicago PMI and the Conference Board's Consumer Confidence Index. This, along with the US bond yields and the broader risk sentiment, might influence the USD price dynamics and provide some impetus to the AUD/USD pair.
Technical levels to watch
USD/CAD tested the 1.33 area yesterday but is trading through the mid-1.34 area today. The pair could exnted its race higher to the 1.3515/20 region, economists at Scotiabank report.
CAD slips back all to easily
“The USD made quick work of pushing through minor resistance in the mid-1.33s and has extended through stiffer, short-term resistance in the low-1.34s.”
“USD/CAD gains risk extending to retest key near-term resistance around 1.3515/20 in the short run, where we expect more solid resistance to the USD’s advance.”
GBP/USD has retested the peak of 1.2450 resulting in a brief pause. A break past this level is set to resume the race higher towards 1.2550/1.2600 and 1.2750, economists at Société Générale report.
50DMA at 1.2160/1.2130 is crucial support
“Daily MACD is at a much lower level as compared to previous high denoting receding upward momentum. However, signals of an extended pullback are not yet visible.”
“50DMA at 1.2160/1.2130 is an important support. Only if a break below this materializes, there could be a risk of a deeper correction.”
“Ongoing pause could be short-lived. Once the pair reclaims 1.2450, the uptrend is likely to persist towards 1.2550/1.2600 and 1.2750, the 61.8% retracement from 2021.”
EUR/USD dips to 1.08 on month-end sales. Economists at Scotiabank expect EUR losses to remain limited.
Broader trend remains bullish
“Further losses remain a risk in the next few hours but I still rather think moderate dips remain a buy.”
“The broader trend in the EUR remains bullish from a technical point of view and a push on to 1.10+ remains on the cards before a deeper consolidation develops.”
“Support is 1.0775/00.”
See: EUR/USD could extend the rally towards 1.1040/1.1080 on a break past 1.0940 – SocGen
USD/JPY has formed a tentative low near 127.20. A break above 131.20 is essential to affirm short-term bounce, economists at Société Générale report.
Signals of a trend reversal are not yet visible
“A pause is underway, however, signals of a trend reversal are not yet visible.”
“Last week high of 131.20 is short-term resistance. Failure to overcome this would mean continuation in the phase of decline.”
“If the pair breaches recent trough at 127.20, the downtrend could extend towards 2015 levels of 125.85 and 124.00.”
- USD/CAD gains strong follow-through traction for the second successive day on Tuesday.
- Sliding crude oil prices undermines the Loonie and acts as a tailwind amid a stronger USD.
- Technical buying above the 1.3400 mark further contributes to the strong intraday rally.
The USD/CAD pair builds on the previous day's solid bounce from the 1.3300 mark, or a nearly two-week low and gains strong follow-through traction for the second successive day on Tuesday. The momentum remains uninterrupted and lifts spot prices to a one-and-half-week high, around the 1.3470 region heading into the North American session.
Crude oil prices prolong last week's rejection slide from the 100-day SMA for the third straight day, which, in turn, undermines the commodity-linked Loonie and acts as a tailwind for the USD/CAD pair. In fact, the black liquid drops to a nearly three-week low amid fears of a near-term supply glut, led by data indicating a rise in crude exports from Russia's Baltic ports in early February.
Apart from this, the worst COVID-19 outbreak in China raises uncertainty about strong economic growth in the country. This, to a larger extent, overshadows the optimism about a fuel demand recovery in the world's top importer. Furthermore, expectations that OPEC+ will likely keep output unchanged during a meeting on Wednesday exert downward pressure on crude oil prices.
This, along with a modest US Dollar strength, turns out to be another factor providing an additional boost to the USD/CAD pair. The prevalent cautious mood - as depicted by a generally weaker tone around the equity markets - is seen driving some haven flows towards the greenback. The USD uptick could also be attributed to some repositioning trade ahead of the key central bank event risk.
The Fed will announce its policy decision at the end of a two-day meeting on Wednesday and is expected to deliver a smaller 25 bps rate hike. The recent US macro data, however, point to an economy that is resilient despite the rapidly rising borrowing costs and backs the case for the Fed to stick to its hawkish stance for longer. This prompts traders to lighten their USD bearish bets.
The strong intraday move up, meanwhile, pushes the USD/CAD pair through the 1.3400-1.3410 resistance zone, triggering a fresh bout of a short-covering and supporting prospects for additional gains. Traders now look to Tuesday's economic docket, featuring the monthly Canadian GDP print, along with Chicago PMI and the Conference Board Consumer Confidence Index from the US.
Technical levels to watch
New Zealand is set to report its employment figures for the fourth quarter on Tuesday, January 31 at 21:45 GMT and as we get closer to the release time, here are forecasts from economists and researchers at four major banks regarding the upcoming labour market data.
Unemployment is expected to remain steady at 3.3%. Economists also update their rate hikes expectations based on the labour market data.
ANZ
“Unemployment is forecast to dip 0.1ppt to 3.2% thanks to a 0.3% QoQ (1.5% YoY) lift in employment. But the whims of quarterly volatility in the HLFS data mean it will be hard to read much into the unemployment figure without the context of the wider survey. We expect wage growth continued to accelerate, with labour remaining the biggest constraint facing firms in Q4. We think private sector average hourly earnings (ordinary time) were up 1.9% QoQ (9.1% YoY), and that productivity-adjusted private sector labour costs were up 1.0% QoQ (4.1% YoY). While data should confirm that the labour market ended 2022 on a high note, that doesn’t tell us much about the outlook for 2023. Forward indicators of labour demand have softened significantly in recent months, and we expect the RBNZ will downshift to a 50 bps OCR hike in February as signs of deteriorating domestic demand become increasingly established.”
Westpac
“We estimate that unemployment held steady at 3.3% for the December quarter. The tight labour market has spurred a sharp pickup in wage growth over the last year. We expect to see that continue in the latest quarter. The Reserve Bank is already braced for some very strong figures, recognising that the labour market tends to lag behind the economic cycle. We expect further OCR increases this year, although the latest’s inflation figures have tipped us towards a 50 bps rise next month rather than the 75 bps that the RBNZ signalled.”
TDS
“We expect another firm labour market print in Q4 though we don't think it is a game-changer to nudge the RBNZ towards a 75 bps point hike after the Q4 CPI print last week squarely missed the RBNZ's forecast. However, we see a terminal rate of 5% as necessary to quell the risk of a wage-price spiral as quarterly wages growth rise and set a new record for annual wage growth.”
Citibank
“For the final labor force release of 2022, we expect jobs growth to slow in Q4. Higher official interest rates, guidance that the OCR would reach 5.50% and weaker business confidence argue for fewer new jobs being created. The participation rate should remain high, however, with solid wages growth and reported labor shortages keeping a large number of citizens in the labor force. Mechanically, we have the unemployment rate rising from 3.3% to 3.4%, but this remains historically low and below what the RBNZ considers a sustainable unemployment rate. With labor shortages, wages growth is likely to remain elevated. we forecast private sector wages growth of 1.3%, which would bring yearly wage cost inflation to 4.3%.”
- EUR/JPY partially fades the positive start of the week on Tuesday.
- Further range bound appears likely in the short-term horizon.
EUR/JPY keeps the side-lined phase well in place for yet another session on Tuesday.
Extra consolidation should not be ruled out in the very near term. In case the downside accelerates, the next support of note emerges at the 200-day SMA, today at 140.87. A sustainable drop below the latter exposes extra weakness to, initially, the 138.00 neighbourhood. On the upside, the breakout of the weekly low at 142.29 (January 25) could open the door to a potential test of the key resistance area around 143.00.
The constructive outlook for EUR/JPY is seen unchanged above the 200-day SMA for the time being.
EUR/JPY daily chart
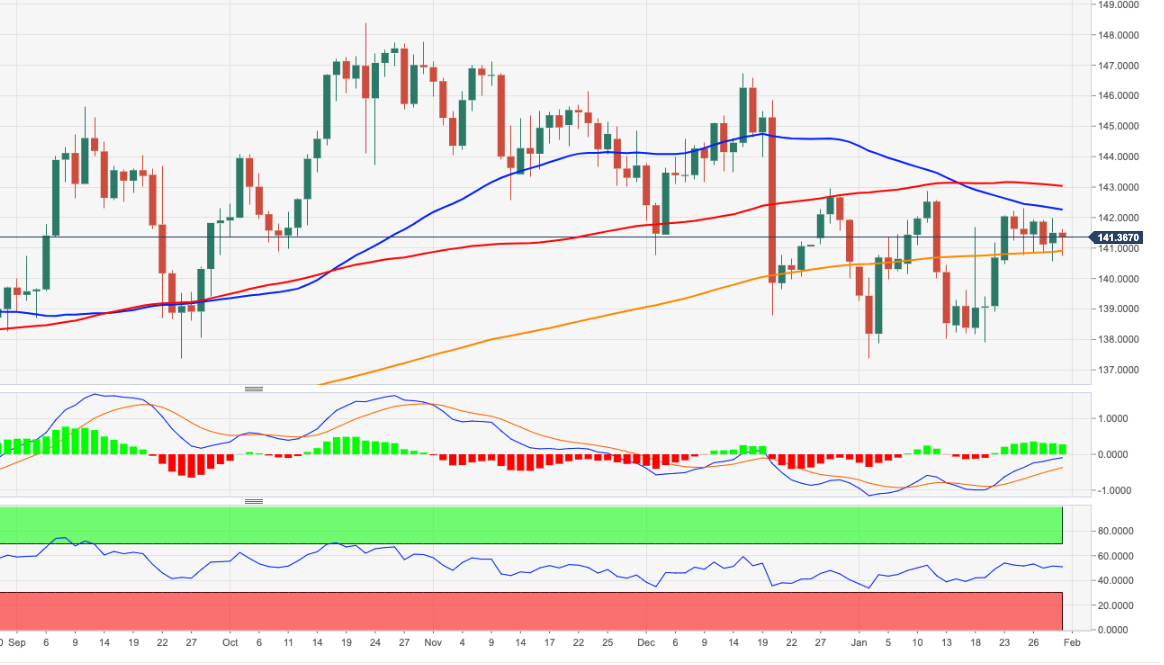
EUR/USD has extended its up move after breaking above the December high of 1.0730. Economists at Société Générale note that the pair could target the 1.1040/1.1080 area.
Break of 1.0940 brings 1.1040/1.1080 in play
“Daily MACD has turned flattish and is at a much lower level as compared to the highs achieved in November denoting receding upward momentum. This is not a reversal signal however a pause is not ruled out.”
“December high of 1.0730 is near-term support.”
“In case the pair crosses 1.0940, the up move could extend towards 1.1040/1.1080 and April 2022 high of 1.1185.”
Gold price failed to make a decisive move in either direction for the second straight week. In the view of FXStreet’s Eren Sengezer, bulls are set to remain in control as long as $1,900 stays intact.
Static resistance seems to have formed at $1,950
“In case XAU/USD makes a daily close below $1,920, it could extend the downward correction toward the lower limit of the channel at $1,900. If the pair falls below that level and starts using it as resistance, this could be seen as a bearish development and attract sellers. In that scenario, $1,880 aligns as the next short-term support.”
“On the upside, static resistance seems to have formed at $1,950. Above that level, $1,960 (static level from April) and $1,980 (static level from April) could be seen as next hurdles. With these levels aligning outside the ascending channel, buyers could hesitate to bet on additional gains and await another downward correction.”
According to a recently conducted Reuters poll, Gold price is expected to average $1,852.50 in 2023 and $1,890 in 2024.
Silver is seen averaging $23 in 2023 and $24 in 2024.
Reuters noted that that analysts expect higher interest rates to limit Gold price's upside.
Market reaction
Gold price continue to push lower following this headline. As of writing, XAU/USD was trading at $1,902, where it was down more than 1% on a daily basis. Meanwhile, Silver was last seen losing 2.4% on the day at $23.05.
Economists at Rabobank continue to look for the EUR/GBP pair to edge towards 0.90 around the middle of the year.
There may be some near-term downside potential for EUR/GBP
“If Lagarde’s guidance this week disappoints the hawks, there may be some near-term downside potential for EUR/GBP.”
“We would view any move lower as an opportunity to sell GBP and maintain our forecast of a move to EUR/GBP 0.90 on a six-month view.”
See: EUR/GBP may hold below 0.8800 until “super Thursday” – ING
Fed policy announcements are unlikely to be helpful for the US Dollar, according to economists at Commerzbank.
Not a good week for the Dollar
“In case of a surprise in connection with the CPI data tomorrow, the Euro might show some flickering moves but in the end, the focus will be on the ECB’s assessment and its comments. Only the ECB should be able to provide cause for a re-valuation of the EUR really if its comments were to change significantly – something we do not currently expect. At the same time, that means that for now there is no reason for a significantly weaker Euro either, although there is already much priced into the EUR.”
“The Dollar might get into trouble if the Fed sounds more moderate regarding wage growth and inflation tomorrow evening, as the market is then likely to become even more set on its rate cut expectations.”
“Everything all told a lot, therefore, points towards this week becoming yet another bad one for the Dollar – unless the Fed sounds surprisingly hawkish to the market.”
Economists at Rabobank discuss their forecasts for the EUR/USD pair for the coming moths.
Market has now built substantial EUR longs
“The market has now built substantial EUR longs meaning that the single currency will become increasing sensitive to the realisation that headwinds to Eurozone growth remain, albeit at a far more reduced level than was anticipated towards the end of last year.”
“While we expect EUR/USD to hold around 1.09 on a one-month view, we see scope for a move back to the 1.06 area into the spring.”
- Gold price drops to over a one-week low on Tuesday amid notable US Dollar strength.
- Bets for a less aggressive Federal Reserve to cap the USD and lend support to the metal.
- A weaker risk tone could also contribute to limiting losses for the safe-haven XAU/USD.
- Traders might further prefer to wait for the crucial FOMC policy decision on Wednesday.
Gold price extends its recent retracement slide from the vicinity of the $1,950 level, or a nine-month high touched last week and remains under some selling pressure on Tuesday. The XAU/USD continues to lose ground through the first half of the European session and drops to over a one-week low, closer to the $1,900 mark in the last hour.
Stronger US Dollar weighs on Gold price
The US Dollar (USD) gains traction for the second successive day and climbs to a one-week high, which, in turn, is seen driving flows away from the US Dollar-denominated Gold price. The uncertainty over the Federal Reserve's (Fed) future rate hike path turns out to be a key factor prompting traders to lighten their USD bearish bets. In fact, the markets have been expecting the Fed to further moderate the pace of its policy-tightening cycle. That said, the recent US macro data pointed to an economy that is resilient despite the rapidly rising borrowing costs and backed the case for the Fed to stick to its hawkish stance for longer.
A combination of factors to limit losses for Gold price
Nevertheless, the CME's FedWatch Tool still points to a nearly 100% chance of a smaller 25 basis points (bps) rate hike at the end of a two-day Federal Open Market Committee (FOMC) meeting on Wednesday. This leads to a fresh leg down in the US Treasury bond yields, which is holding back the USD bulls from placing aggressive bets and might lend support to the non-yielding Gold price. Adding to this, the prevalent cautious mood - as depicted by a generally weaker tone around the equity markets - could also contribute to limiting losses for the safe-haven XAU/USD. This, in turn, warrants some caution before positioning for any further downside.
Investors remain sceptic about a strong recovery in the Chinese economy amid the worst yet COVID-19 outbreak in the country. This, to a larger extent, overshadows the better-than-expected Chinese PMI prints released earlier this Tuesday, which showed that business activity in both manufacturing and services sectors swung back to growth in January. Apart from this, the protracted Russia-Ukraine war has been fueling recession fears and keeping a lid on any optimism in the markets. Hence, it will be prudent to wait for strong follow-through selling before confirming that the Gold price has formed a near-term top and positioning for a deeper corrective pullback.
Traders eye macro data from the United States for some impetus
Market participants now look forward to the US economic docket, featuring the release of the Chicago PMI and the Conference Board's Consumer Confidence Index. This, along with the US bond yields, might influence the USD price dynamics and provide some impetus to Gold price. Apart from this, traders will take cues from the broader risk sentiment to grab short-term opportunities around the XAU/USD.
Gold price technical outlook
From a technical perspective, sustained weakness below the $1,900-$1,895 region might prompt some technical selling and expose the $1,880-$1,877 support. Gold price could eventually slide to test the next relevant support near the $1,856-$1,855 region, which if broken decisively will shift the near-term bias in favour of bearish traders.
On the flip side, the $1,925-$1,926 horizontal zone now seems to act as an immediate hurdle ahead of the multi-month peak, around the $1,949 region. A sustained strength beyond has the potential to lift the Gold price to the $1,969-$1,970 region. The momentum could get extended further and allow the XAU/USD bulls to surpass an intermediate hurdle near the $1,980 zone, towards reclaiming the $2,000 psychological mark for the first time since March 2022.
Key levels to watch
The Eurozone economy expanded by 0.1% in the quarter in the three months to December of 2022, meeting the 0% expected and 0.3% registered in the third quarter, the preliminary release published by Eurostat revealed on Tuesday.
On an annualized basis, the bloc’s GDP rate grew by 1.9% in Q4 vs. 2.3% booked in the third quarter of 2022 while matching 1.8% expectations.
Market reaction
EUR/USD was last seen trading at 1.0828, down 0.15% on the day. The euro failed to capitalize on the upbeat Eurozone GDP data, pausing its rebound at 1.0835.
About Eurozone Preliminary GDP
The Gross Domestic Product released by Eurostat is a measure of the total value of all goods and services produced by the Eurozone. The GDP is considered as a broad measure of the Eurozone's economic activity and health. Usually, a rising trend has a positive effect on the EUR, while a falling trend is seen as negative (or bearish).
Widening policy rate differential with ECB suggests CHF weakness ahead, according to economists at CIBC Capital Markets.
SNB to be less activist than ECB
“Although we expect additional SNB pro-activity, we expect the bank to be less activist than its ECB counterpart.”
“Narrowing growth differentials add to the presumption widening ECB/SNB policy divergence. Policy differential ended 2022 at 100 bps, we would expect that to widen to 150 bps by the end of Q1. Such policy widening points towards EUR/CHF remaining well supported.”
“Q1 2023: 0.99 | Q2 2023: 1.00 (EUR/CHF)”
US Dollar clings to modest recovery gains. Economists at ING expect the greenback to remain resilient ahead of the Federal Reserve's (Fed) policy announcements.
Some support going into the Fed meeting
“Our view for tomorrow is that the Fed still has an interest in hanging on to hawkish rhetoric and pushing back against speculation of an early peak and – above all – rate hikes in 2023. The net result for the Dollar may be positive.”
“We think the Dollar can hold on to yesterday’s gains going into the FOMC meeting, and high-beta currencies could remain key underperformers in a risk-off environment.”
“Volatility looks likely to pick up quite markedly during the remainder of the week.”
Considering advanced figures from CME Group for natural gas futures markets, open interest rose for yet another session on Monday, this time by nearly 2K contracts. In the same line, volume resumed the uptrend and left behind the previous pullback, rising by around 45.8K contracts.
Natural Gas still targets the $2.45 region
Monday saw another negative performance of prices of the natural gas, extending further the recent breakdown of the key $3.00 mark. The move was on the back of increasing open interest and volume and is supportive of extra weakness in the very near term, always with the immediate target around the $2.45 mark per MMBtu.
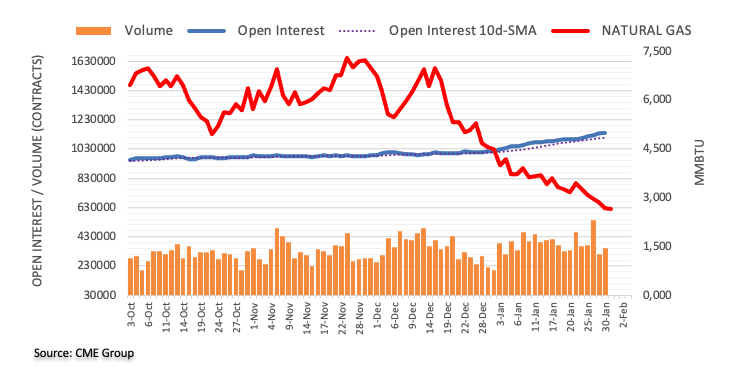
- GBP/USD turns lower for the third successive day amid notable USD demand.
- The prevalent cautious market mood is seen underpinning the safe-haven buck.
- Retreating US bond yields might cap the greenback and lend support to the pair.
- Traders also seem reluctant ahead of the FOMC and the BoE meetings this week.
The GBP/USD pair attracts fresh sellers following an early uptick to the 1.2370 area and turns negative for the third successive day on Tuesday. The downward trajectory drags spot prices to a four-day low during the first half of the European session, with bears now awaiting a break below the 1.2300 mark before placing fresh bets.
The US Dollar builds on the previous day's positive move and climbs to a one-week high, which, in turn, is seen as a key factor exerting downward pressure on the GBP/USD pair. The uncertainty about a strong recovery in the Chinese economy - amid the worst yet COVID-19 outbreak in the country - continues to weigh on investors' sentiment. This is evident from a generally weaker tone around the equity markets and drives some haven flows towards the greenback.
Apart from this, the USD further benefits from some repositioning trade ahead of the highly-anticipated FOMC decision, scheduled to be announced on Wednesday. The US central bank is expected to deliver a smaller 25 bps rate hike at the end of a two-day meeting. The recent US macro data, however, point to a resilient economy and backs the case for the Fed to stick to its hawkish stance for longer. This, in turn, prompts traders to lighten their bearish USD positions.
That said, a fresh leg down in the US Treasury bond yields might hold back the USD bulls from placing aggressive bets. Apart from this, speculations that elevated consumer inflation will force the Bank of England (BoE) to continue lifting rates might offer some support to the British Pound and limit losses for the GBP/USD pair. This, in turn, warrants some caution for aggressive bearish traders ahead of this week’s key central bank event risks – the FOMC on Wednesday and the BoE on Thursday.
In the meantime, traders on Tuesday might take cues from the US economic docket, featuring the release of the Chicago PMI and the Conference Board’s Consumer Confidence Index. This, along with the US bond yields and the broader market risk sentiment, might influence the USD price dynamics and provide some impetus to the GBP/USD pair.
Technical levels to watch
USD/CNH now appears exposed to some range bound trade within 6.7270-6.7950, note Markets Strategist Quek Ser Leang and Senior FX Strategist Peter Chia at UOB Group.
Key Quotes
24-hour view: “We highlighted yesterday that ‘the price movements are likely part of a broad consolidation range’ and we expected USD to ‘trade between 6.7300 and 6.7700’. USD subsequently traded within a narrower range than expected (6.7395/6.7598). Further consolidation appears likely, expected to be between 6.7400 and 6.7700.”
Next 1-3 weeks: “Last Friday (27 Jan, spot at 6.7310), we highlighted that downward momentum is building and we expected USD to weaken toward the month-to-date low near 6.6985. USD traded in a relatively quiet manner the past couple of days and downward momentum has faded quickly. USD is unlikely to weaken further. From here, USD is more likely to trade sideways within a range of 6.7270/6.7950.”
The latest Bank Lending Survey conducted by the European Central Bank (ECB) showed on Tuesday, “rising rates are making a substantial dent on loan demand.”
Additional findings
Eurozone banks tightened credit standard substantially in Q4.
Tightening in corporate credit standards was the largest since the 2011 sovereign debt crisis.
Banks see continued tightening of credit standards in Q1 .
Loan demand to drop further in Q1 with "strong net decline" seen for loans to households.
Related reads
- EUR/USD comes under further pressure and challenges 1.0800
- EUR/GBP may hold below 0.8800 until “super Thursday” – ING
- EUR/USD adds to the ongoing weakness and flirts with 1.0800.
- The greenback rose to multi-day highs well past the 102.00 mark.
- German Retail Sales disappointed in December.
The corrective decline remains well and sound around the European currency and now drags EUR/USD to the boundaries of the 1.0800 mark on turnaround Tuesday.
EUR/USD looks at EMU GDP, US data
EUR/USD loses ground for the fourth consecutive session and sheds more a cent since last week’s fresh tops near 1.0930 on Tuesday,
The acceleration of the decline in the pair comes in response to the persistent risk-off mood among investors and the continuation of the upside momentum in the greenback, which propels the USD Index (DXY) to fresh multi-session tops in tandem with declining US yields.
Yields of the German 10-year Bund, in the meantime, follow their US peers and struggle to extend the recent bounce.
Earlier in the domestic calendar, German Retail Sales contracted at a monthly 5.3% in December and 6.4% over the last twelve months. Still in Germany, the Unemployment Rate held steady at 5.5% in January and the Unemployment Change shrank by 15K people in the same month.
Later in the session, advanced EMU Q4 GDP Growth Rate are due, while the Consumer Conference tracked by the Conference Board and housing data will take centre stage across the Atlantic later in the NA session.
What to look for around EUR
The pronounced rebound in the dollar forced EUR/USD to shed further ground and flirt with the key 1.0800 neighbourhood on Tuesday.
In the meantime, price action around the European currency should continue to closely follow dollar dynamics, as well as the potential next steps from the ECB and the Federal Reserve at their upcoming gatherings in the next week.
Back to the euro area, recession concerns now appear to have dwindled, which at the same time remain an important driver sustaining the ongoing recovery in the single currency as well as the hawkish narrative from the ECB.
Key events in the euro area this week: Germany Retail Sales/Unemployment Rate/Flash Inflation Rate, EMU Flash Q4 GDP Growth Rate (Tuesday) – Germany, EMU Final Manufacturing PMI, EMU Flash Inflation Rate/Unemployment Rate (Wednesday) – Germany Balance of Trade, ECB Interest Rate Decision, ECB Lagarde (Thursday) - Germany, EMU Final Services PMI (Friday).
Eminent issues on the back boiler: Continuation of the ECB hiking cycle amidst dwindling bets for a recession in the region and still elevated inflation. Impact of the Russia-Ukraine war on the growth prospects and inflation outlook in the region. Risks of inflation becoming entrenched.
EUR/USD levels to watch
So far, the pair is retreating 0.36% at 1.0808 and the breakdown of 1.0766 (weekly low January 17) would target 1.0616 (55-day SMA) en route to 1.0481 (monthly low January 6). On the other hand, the next up barrier emerges at 1.0929 (2023 high January 26) followed by 1.0936 (weekly high April 21 2022) and finally 1.1000 (round level).
The Pound is having a difficult time staging a rebound following Monday's decline. Economists at ING expect the EUR/GBP to continue trading below the 0.88 level until key central banks meetings.
Standing by before 'super Thursday'
“There are no key data releases in the UK before Thursday’s Bank of England meeting. Markets are currently pricing in 46 bps (our call is for 50 bps) at this meeting and an additional 25 bps in March. We expect a broadly neutral impact on the Pound, and GBP/USD moves may be mostly dictated by the FOMC reaction.”
“EUR/GBP may hold below 0.8800 until ‘super Thursday’ (ECB and BoE meetings), although inflation figures in the eurozone mean the balance of risk is tilted to the upside for the pair.”
Further upside in USD/JPY is expected to gather fresh traction once 131.15 is cleared, comment Markets Strategist Quek Ser Leang and Senior FX Strategist Peter Chia at UOB Group.
Key Quotes
24-hour view: “Yesterday, we expected USD to ‘consolidate within a range of 129.35/130.30’. We did not expect the elevated volatility as USD dropped sharply to 129.18 before rebounding quickly to end the day at 130.44 (+0.45%). The rebound from the low has room to extend but a sustained advance above 130.80 appears unlikely (the next resistance is at 131.15). On the downside, a breach of 129.70 (minor support is at 130.05) would indicate that the current upward pressure has eased.”
Next 1-3 weeks: “In our most recent narrative from last Thursday (26 Jan, spot at 129.25), we highlighted that the movement in USD is likely part of a consolidation phase and we expected USD to trade within a range of 128.00/130.80. Yesterday, USD rose to a high of 130.59 and upward momentum is showing signs of increasing. However, USD has to break above 131.15 before a sustained advance is likely. The chance of USD breaking above 131.15 will remain in place as long as USD stays above 129.30 within the next few days. Looking ahead, the next resistance level above 131.15 is at 132.00.”
The UK public's inflation expectations cooled off for the second straight month in January, a monthly survey conducted by Citi and YouGov showed on Tuesday.
Key takeaways
British public expectations for five to 10 years ahead fell to 3.5% in January from 3.6% in December, just short of the 3.0% to 3.4% range seen ahead of the COVID-19 pandemic.
For 12 months ahead, the UK public inflation expectations declined to 5.4% in January from 5.7% in the previous survey.
The declining trend in the UK public inflation expectations should further comfort to the Bank of England that high prices will not become permanently embedded in expectations, Reuters reports, citing the survey.
Market reaction
GBP/USD is holding the lower ground on the above survey findings, which fan dovish BoE expectations. The pair is trading at 1.2318, down 0.26% on the day, as of writing.
CME Group’s flash data for crude oil futures markets noted traders added around 14.3K contracts to their open interest positions at the beginning of the week, extending the uptrend in place since January 20. Volume, instead, reversed two consecutive daily builds and went down by around 147.6K contracts.
WTI now targets $72.50
Prices of the WTI added to the previous decline on Monday against the backdrop of increasing open interest. That said, the continuation of the downtrend appears on the cards and targets the so far 2023 low at $72.50 per barrel (January 5).
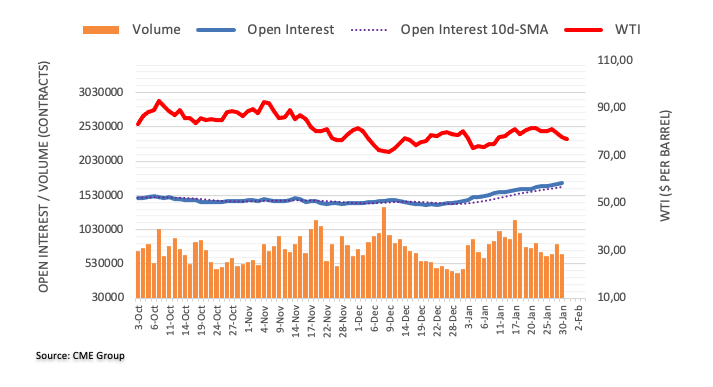
- NZD/USD remains under some selling pressure for the second successive day on Tuesday.
- The cautious mood benefits the safe-haven greenback and weighs on the risk-sensitive Kiwi.
- Bets for smaller Fed rate hikes might cap the USD and help limit the downside for the major.
The NZD/USD pair adds to the previous day's modest losses and remains under some selling pressure for the second successive day on Tuesday. Spot prices drop to over a one-week low during the first half of the European session, with bears looking to extend the downward trajectory further below horizontal support near mid-0.6400s.
The prevalent cautious mood provides a modest lift to the safe-haven US Dollar and turns out to be a key factor exerting pressure on the NZD/USD pair. Despite the better-than-expected Chinese macro data released earlier this Tuesday, investors remain uncertain about a strong economic recovery - amid the worst yet COVID-19 outbreak in the country. This, in turn, dents demand for perceived riskier assets, including the Kiwi.
That said, a fresh leg down in the US Treasury bond yields might keep a lid on the USD and help limit losses for the NZD/USD pair, at least for the time being. The markets now seem convinced that the Fed will soften its hawkish stance and deliver a smaller 25 bps rate hike at the end of a two-day policy meeting on Wednesday. This, in turn, drags the US bond yields lower and should hold back the USD bulls from placing fresh bets.
Heading into the key central bank event risk, the aforementioned fundamental backdrop makes it prudent to wait for strong follow-through selling before confirming that the NZD/USD pair has topped out. Next on tap is the US macro data - the Chicago PMI and the Conference Board's Consumer Confidence Index. This, along with the broader risk sentiment, will influence the USD and provide some impetus to the NZD/USD pair.
From a technical perspective, weakness below the 0.6450 area marks a breakdown through a one-week-old trading range and supports prospects for deeper losses. Traders, however, might prefer to move to the sidelines and await the highly-anticipated FOMC policy decision on Wednesday before determining the next leg of a directional move for the NZD/USD pair.
Technical levels to watch
As far as the Gold market is concerned, Tuesday will see the World Gold Council (WGC) publish the supply and demand figures for the fourth quarter and for 2022 as a whole. Interest among ETF investors is likely to continue to dictate the direction of prices, in the view of economists at Commerzbank.
Physical demand in Asia to provide little impetus on balance
“As the brisk buying interest in China was countered by rather muted demand in India – the second-largest consumer country – recently, physical demand in Asia will probably provide little impetus on balance.”
“Interest among ETF investors is likely to continue to dictate the direction of prices: if the first tentative indications of recent days turn out to confirm a trend reversal, this should lend a tailwind to the Gold price. Increased interest could be generated in particular if the central banks at their meetings were to hint at an end to the rate hike cycle.”
EUR/USD closed in negative territory on Monday and seems to have gone into a consolidation phase near 1.0850. Economists at ING expect the pair to continue trading around this level.
Dollar may stay broadly supported going into the FOMC meeting
“The Dollar may stay broadly supported going into the FOMC meeting. The Euro, however, may show more resilience than other G10 peers (especially high-beta currencies) given the shift in the inflation narrative in the eurozone which can surely fuel ECB hawkish speculation.”
“EUR/USD may hover around the 1.0850 handle until tomorrow’s FOMC.”
“Our commodities team just revised their gas price forecasts, now expecting TTF to stay below 80 EUR/MWh throughout 2023. This is a bullish scenario for eurozone sentiment and the Euro in the medium term.”
- Silver meets with a fresh supply on Tuesday and seems vulnerable to sliding further.
- Last week’s breakdown below the $23.80-$23.75 confluence favours bearish traders.
- A sustained move back above the $24.00 mark is needed to negate the negative bias.
Silver comes under heavy selling pressure on Tuesday and slides back to the $23.30-$23.20 support zone during the early part of the European session. The technical setup, meanwhile, favours bearish traders and supports prospects for a further near-term depreciating move.
The XAG/USD last week confirmed a breakdown below the $23.70-$23.80 confluence support, comprising the 200-hour SMA and the lower end of a short-term ascending channel. The overnight failure near the said support breakpoint, now turned resistance, adds credence to the negative outlook. Moreover, oscillators on the daily chart have just started gaining negative traction.
Some follow-through selling below the $23.30-$23.20 area will reaffirm the bearish outlook and make the XAG/USD vulnerable to weaken further below the $23.00 mark. The next relevant support is pegged near the $22.75 area, below which the downward trajectory could get extended and drag the white metal towards the $22.20-$22.15 intermediate support en route to the $22.00 level.
Meanwhile, Relative Strength Index (RSI) on the 1-hour chart has moved on the verge of breaking into oversold territory. This makes it prudent to wait for some intraday consolidation or a modest rebound before positioning for additional losses. That said, any attempted recovery might now confront stiff resistance near the $23.60-$23.70 region, or the 100-hour SMA.
Any subsequent move up could attract fresh sellers and remain capped near the ascending trend-channel support breakpoint, currently around the $24.00 mark. The latter should act as a pivotal point, which if cleared decisively is likely to trigger a short-covering rally. The XAG/USD might then aim to retest the multi-month to, around the $24.50-$24.55 area touched in January.
Silver 1-hour chart
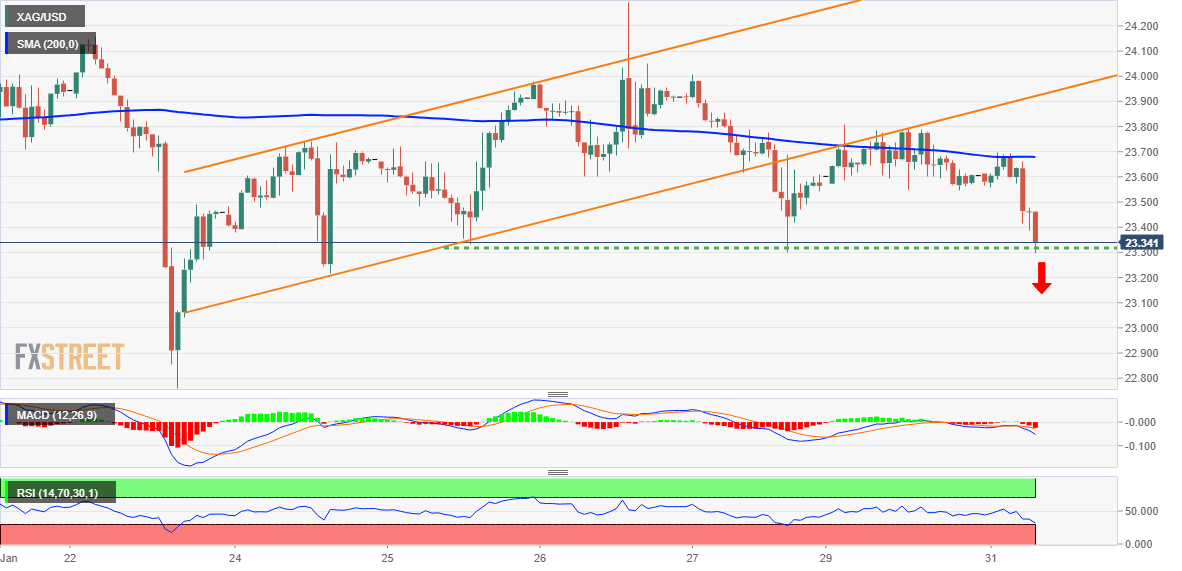
Key levels to watch
Here is what you need to know on Tuesday, January 31:
The US Dollar holds steady above 102.00 early Tuesday after having closed the last three trading days in the positive territory. Following the risk-off action on Monday, markets remain cautious with US stock index futures trading modestly lower on the day. Eurostat will release the fourth-quarter Gross Domestic Product (GDP) for the Eurozone. Later in the day, November GDP data from Canada, US CB Consumer Confidence Index and the US November Housing Price Index figures will be featured in the US economic docket.
Earlier in the day, the International Monetary Fund (IMF) announced that it expect the global economy to grow by 2.9% in 2023 and 3.1% in 2024 amid falling gas prices and the China re-opening. Meanwhile, the data from China revealed that the NBS Manufacturing PMI rose to 50.1 in January and the Non-Manufacturing PMI improved to 54.4 from 41.6 in December. Both of these readings came in better than analysts' estimates but the Shanghai Composite Index struggled to gain traction.
The Australian Bureau of Statistics reported that Retail Sales declined by 3.9% on a monthly basis in December, missing the market expectation for a decrease of 0.3% by a wide margin. On a positive note, Reuters reported that the trade ministers of Australia and China were scheduled to hold a virtual meeting next week. Nevertheless, AUD/USD turned by south pressured by the disappointing data and was last seen losing 0.4% on the day at 0.7030.
NZD/USD stays on the back foot and trades in negative territory near 0.6450. During the Asian trading hours, New Zealand’s new Prime Minister (PM) Chris Hipkins announced a Cabinet reshuffle and caused the NZD to lose interest.
EUR/USD closed in negative territory on Monday and seems to have gone into a consolidation phase near 1.0850 in the early European morning. The data from Germany revealed that Retail Sales decreased by 5.3% in December following the 1.9% increase recorded in November.
GBP/USD is having a difficult time staging a rebound following Monday's decline and was last seen trading flat on the day at around 1.2350.
Gold price came under renewed bearish pressure early Tuesday and touched its lowest level in a week near $1,910. The benchmark 10-year US Treasury bond yield holds steady above 3.5% after having gained more than 1% on Monday, not allowing XAU/USD to erase its losses.
USD/JPY fluctuates in a tight channel slightly above 130.00. Japan's Finance Minister Shunichi Suzuki said that wage increases were important to both the government and the Bank of Japan (BoJ). “It is too early to judge whether the joint statement needs to be revised,” the minister added but these comments failed to trigger a market reaction.
Bitcoin lost nearly 4% on Monday and seems to have settled below $23,000 early Tuesday. Ethereum failed to build on Sunday's gains and fell 5% on the first trading day of the week. ETH/USD, however, holds comfortably above $1,500.
The high beta status of the SEK has done little to protect its value of late. Economists at CIBC Capital Markets expect the EUR/SEK pair to move back lower and dip under 11 in the second half of the year.
More constructive SEK backdrop would help ease inflationary pressures
“A 50 bps hike next month will see the target rate reach 3.00% and levels not seen since Q4 2008. Moreover, in view of CPI having yet to peak, a terminal rate in excess of 3.25% is now being priced in by the market. Part of the reasoning for the higher and later CPI peak comes via the currency, a more constructive SEK backdrop would help ease inflationary pressures and moderate the policy burden on the central bank.”
“The SEK remains leveraged to both risk and European growth prospects. With the former benefitting from the Chinese re-opening narrative and the retreat in benchmark European gas prices despite domestic risk criteria we would expect graduated SEK gains through 2023.”
“Q1 2023: 11.15 | Q2 2023: 10.85 (EUR/SEK)”
- AUD/USD drops to a one-week low on Tuesday and is pressured by a combination of factors.
- Disappointing Australian Retail Sales figures weigh on the Aussie amid a modest USD strength.
- Bets for smaller Fed rate hikes keep a lid on the buck and might help limit losses for the major.
The AUD/USD pair remains under some selling pressure for the second straight day on Tuesday and extends its recent pullback from the highest level since June 2022 touched last week. The downward trajectory drags spot prices to a one-week low, below mid-0.7000s during the early European session and is sponsored by a combination of factors.
The Australian Dollar is weighed down by the disappointing domestic macro data, which showed that Retail Sales tumbled in December. Apart from this, a modest US dollar strength turns out to be another factor exerting some downward pressure on the AUD/USD pair. The prevalent cautious mood is seen driving some haven flows towards the greenback and undermining the risk-sensitive Aussie.
The market sentiment remains fragile in the wake of the uncertainty about a strong recovery in the Chinese economy, amid the worst yet COVID-19 outbreak in the country. This, to a larger extent, offsets the better-than-expected Chinese PMI prints for January and does little to impress traders or provide any immediate respite to the China-proxy Australian Dollar, at least for the time being.
The USD uptick, meanwhile, lacks bullish conviction amid rising bets for a smaller 25 bps Fed rate hike move at the end of a two-day policy meeting on Wednesday. This, along with the flight to safety, leads to a modest downtick in the US Treasury bond yields and acts as a headwind for the buck. This, in turn, warrants some caution before positioning for any further downfall for the AUD/USD pair.
Traders might also prefer to move to the sidelines ahead of the critical FOMC monetary policy decision on Wednesday. In the meantime, Tuesday's US economic docket, featuring Chicago PMI and the Conference Board's Consumer Confidence Index, will be looked upon for some impetus. This, along with the broader risk sentiment, could drive the USD and produce short-term opportunities around the AUD/USD pair.
Technical levels to watch
According to Markets Strategist Quek Ser Leang and Senior FX Strategist Peter Chia at UOB Group, NZD/USD could navigate within 0.6400 and 0.6535 in the next few weeks.
Key Quotes
24-hour view: “We held the view that NZD ‘is likely to trade sideways within a range of 0.6465/0.6510’ yesterday. Our view of sideways trading was not wrong even though NZD traded within a slightly narrower range than expected (0.6465/0.6507). The underlying tone has softened and NZD is likely to edge lower toward 0.6440. The major support at 0.6400 is unlikely to come into view. Resistance is at 0.6490, followed by 0.6505.”
Next 1-3 weeks: “Our update from last Thursday (26 Jan, spot at 0.6492) is still valid. As highlighted, NZD is likely to trade between 0.6400 and 0.6535 for the time being.”
- German Retail Sales slumped 6.4YoY in December vs. -4.3.% expected.
- Retail Sales in Germany came in at -5.3% MoM in December vs. 0.2% expected.
According to the official figures released by Destatis on Tuesday, Germany's Retail Sales plunged by 5.3% MoM in December versus 0.2% expected and 1.1% previous,
On an annualized basis, the bloc’s Retail Sales plummeted by 6.4% in December versus the -4.3% expected and a 5.9% slump seen in November.
FX implications
The Euro shrugs off the awful German data. At the time of writing, the major trades at 1.0836, down 0.07% on the day.
About German Retail Sales
The Retail Sales released by the Statistisches Bundesamt Deutschland is a measure of changes in sales of the German retail sector. It shows the performance of the retail sector in the short term. Percent changes reflect the rate of changes of such sales. The changes are widely followed as an indicator of consumer spending. Positive economic growth is usually anticipated as "bullish" for the EUR, while a low reading is seen as negative, or bearish, for the EUR.
Gold price has reversed early recovery gains and remains on the defensive this Tuesday. XAU/USD could see an extended correction, FXStreet’s Dhwani Mehta reports.
Buyers need to reclaim the $1,935 hurdle to end the corrective downside
“With the 14-day Relative Strength Index (RSI) inching slightly higher, risks remain skewed to the upside in the near term. But Gold buyers need to reclaim the $1,935 hurdle, at first, to end the corrective downside. The next critical resistance is seen at the $1,950 psychological level, above which the wedge confluence at $1,959 will be the level to beat for Gold bulls.”
“A sustained move below the support near $1,915, will expose the previous week’s low at $1,911. The final threshold for Gold buyers to defend remains the $1,900 level should the correction regain traction. The bullish 21-Daily Moving Average (DMA) hangs around at that level.”
- EUR/GBP reverses the previous day’s corrective bounce off one-week low.
- Euro struggles to defend hawks after downbeat German data challenge hawkish ECB bias.
- IMF’s warning over the UK’s economic conditions challenge EUR/GBP bears.
- Preliminary readings of Eurozone Q4 GDP will be crucial for immediate directions, ECB vs. BoE battle eyed.
EUR/GBP remains depressed around 0.8780, fading the week-start recovery, as traders await Eurozone Q4 GDP for fresh impulse during early Tuesday.
The cross-currency pair managed to begin the key week comprising central bank announcements on a positive side amid fears of the UK drama over tax cuts. However, downbeat prints of German GDP, later on, weighed on the prices.
That said, Economic Sentiment Indicator for the Euro area improved to 99.9 in January from an upwardly revised 97.1 prior and 97.0 market forecasts. The Consumer Confidence, however, matched 20.9 market forecast and previous readings during the stated month. That said, the Industrial Confidence and Services Sentiment also improved during January.
On the other hand, the preliminary readings of Germany’s fourth quarter (Q4) Gross Domestic Product (GDP) came in softer than 0.0% expected and 0.4% prior to -0.2% QoQ. "After the German economy managed to perform well despite difficult conditions in the first three quarters, economic performance slightly decreased in the fourth quarter of 2022", Destatis noted in its publication. The same raises fears of downbeat Eurozone GDP and challenges the EUR/GBP buyers.
Alternatively, the International Monetary Fund’s (IMF) downbeat economic projections for the UK seem to keep the EUR/GBP on the front foot. As per the latest forecasts, the IMF projects the British economy will mark the weakest performance among the Group of Seven (G7) nations.
Also read: IMF: Emerging markets growth slowdown bottomed out in 2022, but risks remain
Looking forward, the first readings of the Eurozone Q4 GDP, expected 0.0% QoQ versus 0.3%, will offer immediate directions to the EUR/GBP and is likely to witness further weakness unless marking a surprise. However, major attention should be given to Thursday’s monetary policy meetings of the European Central Bank (ECB) and the Bank of England (BOE) for clear directions.
Technical analysis
Although a convergence of the 100-DMA and the 50-DMA provides strong support to the EUR/GBP price around 0.8740-35, recovery remains elusive unless the quote stays below a 12-day-old resistance line, close to 0.8830 at the latest.
Open interest in gold futures markets shrank for the third session in a row on Monday, this time by nearly 7K contracts according to preliminary readings from CME Group. Volume followed suit and dropped for the second straight session, now by around 130.7K contracts.
Gold: Decent support comes around $1900
Prices of the ounce of gold extended the decline for the third consecutive day on Monday. The daily retracement, however, came against the backdrop of diminishing open interest and volume and this underpins the idea that a sustained decline remains out of favour in the very near term. Further weakness should meet firm contention around the weekly low at $1896 (January 18).
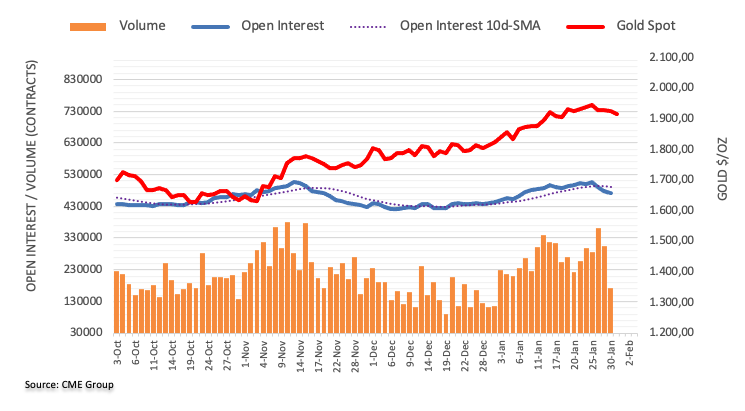
FX option expiries for Jan 31 NY cut at 10:00 Eastern Time, via DTCC, can be found below.
- EUR/USD: EUR amounts
- 1.0875 1.02b
- 1.0855 841.4m
- 1.0900 812.6m
- USD/JPY: USD amounts
- 130.00 591m
- 129.00 515.2m
- 127.50 500.3m
- AUD/USD: AUD amounts
- 0.7075 360m
- USD/CAD: USD amounts
- 1.3400 1.2b
- 1.3515 300m
- USD/CNY: USD amounts
- 6.8000 1.77b
GBP/USD is now seen trading between 1.2250 and 1.2430 in the next few weeks, suggest Markets Strategist Quek Ser Leang and Senior FX Strategist Peter Chia at UOB Group.
Key Quotes
24-hour view: “Yesterday, we expected GBP to ‘trade sideways between 1.2350 and 1.2425’. GBP rose to a high of 1.2416 in London trade before declining to a low of 1.2339 in late NY. The underlying tone has softened somewhat but while GBP is likely to edge lower today, it is unlikely to break the major support at 1.2295 (minor support is 1.2315). Resistance is at 1.2375, followed by 1.2400. The high of 1.2416 is unlikely to come into view today.”
Next 1-3 weeks: “We highlighted yesterday (31 Jan, spot at 1.2400) that upward momentum has waned but as long as 1.2315 (‘strong support’ level) is not breached, there is still a slim chance for GBP to break above 1.2450. GBP dropped to a low of 1.2339 in NY trade before closing on a soft note at 1.2349 (-0.41%). While our ‘strong support’ has not been breached, upward momentum has more or less dissipated. In other words, the GBP strength from earlier this month (see annotations in the chart below) has ended. GBP has likely moved into a consolidation phase and is likely to trade between 1.2250 and 1.2430 for the time being.”
- The index moves further north of the 102.00 barrier.
- The Fed starts its 2-day meeting later on Tuesday.
- CB Consumer Confidence, housing data next of note in the docket.
The greenback extends the rebound and now looks to consolidate the recent breakout of the key 102.00 hurdle when gauged by the USD Index (DXY).
USD Index now focuses on key data
The index advances for the fourth consecutive session on turnaround Tuesday, surpassing the 102.00 yardstick and gradually approaching the initial resistance at the 3-month line around 102.80.
In the meantime, cautiousness continues to run high and the risk-off mood prevails among market participants ahead of the key FOMC event due on Wednesday, where the Fed is expected to hike rates by ¼ percentage point.
Later in the NA session, the Consumer Confidence for the month of January measured by the Conference Board will take centre stage seconded by the FHFA House Price Index and the Chicago PMI.
What to look for around USD
The dollar picks up pace and manages to leave behind the key 102.00 mark against the backdrop of persistent prudence ahead of the imminent FOMC gathering (Wednesday).
The idea of a probable pivot in the Fed’s policy continues to hover around the greenback and keeps the price action around the DXY somewhat subdued. This view, however, also comes in contrast to the hawkish message from the latest FOMC Minutes and recent comments from rate setters, all pointing to the need to advance to a more restrictive stance and stay there for longer, at the time when rates are seen climbing above the 5.0% mark.
On the latter, the tight labour market and the resilience of the economy are also seen supportive of the firm message from the Federal Reserve and the continuation of its hiking cycle.
Key events in the US this week: FHFA House Price Index, CB Consumer Confidence (Tuesday) – MBA Mortgage Applications, ADP Employment Change, Final Manufacturing PMI, ISM Manufacturing, Construction Spending, FOMC Interest Rate Decision (Wednesday) – Initial Jobless Claims, Factory Orders (Thursday) – Nonfarm Payrolls, Unemployment Rate, Final Services PMI ISM Non-Manufacturing (Friday).
Eminent issues on the back boiler: Rising conviction of a soft landing of the US economy. Prospects for extra rate hikes by the Federal Reserve vs. speculation of a recession in the next months. Fed’s pivot. Geopolitical effervescence vs. Russia and China. US-China trade conflict.
USD Index relevant levels
Now, the index is up 0.08% at 102.32 and the immediate hurdle comes at the weekly high at 102.89 (January 18) followed by 105.63 (monthly high January 6) and then 106.47 (200-day SMA). On the flip side, the breach of 101.50 (2023 low January 26) would open the door to 101.29 (monthly low May 30 2022) and finally 100.00 (psychological level).
- EUR/USD takes offers to refresh intraday low as bears tighten the grip.
- A clear break of three-week-old ascending trend line, sustained trading below 200-HMA favor sellers.
- Bearish MACD signals add strength to the downside bias.
- Buyers need to cross the 1.0930 hurdle to retake control.
EUR/USD slides to a one-week low while taking offers around 1.0830 during the early hours of Tuesday morning in Europe.
In doing so, the major currency pair declines for the fourth consecutive day while reversing late Monday’s corrective bounce off 1.0838. Also keeping the EUR/USD bears hopeful are the bearish MACD signals and the clear downside break of the three-week-old support line, not to forget sustained trading below the 200-Hour Moving Average (HMA).
As a result, the quote is well-set to approach the 1.0800 round figure before hitting the 61.8% Fibonacci retracement level of January 10-26 upside, close to 1.0795.
In a case where the EUR/USD price fails to rebound from the key Fibonacci retracement level, also known as the golden ratio, the bears won’t hesitate to challenge the early January swing low near 1.0710.
On the flip side, the aforementioned support-turned-resistance and the 200-HMA could challenge the EUR/USD recovery, respectively near 1.0850 and 1.0865.
Following that, multiple resistances near 1.0900 could challenge the EUR/USD rebound before highlighting the monthly top near 1.0930.
If the pair buyers keep the reins past 1.0930, the odds of witnessing 1.1000 on the chart can’t be ruled out.
EUR/USD: Hourly chart

Trend: Further downside expected
In the opinion of Markets Strategist Quek Ser Leang and Senior FX Strategist Peter Chia at UOB Group, EUR/USD appears to have now embarked on a consolidative phase.
Key Quotes
24-hour view: “We expected EUR to ‘trade sideways within a range of 1.0840/1.0900’ yesterday. EUR popped briefly to a high of 1.0913 before dropping to a low of 1.0837. Downward momentum has improved somewhat and EUR is likely to trade with a downward bias today. As downward momentum is not strong, EUR is unlikely to challenge the major support at 1.0800 (minor support is at 1.0820). Resistance is at 1.0875, a breach of 1.0895 would indicate that the current mild downward pressure has eased.”
Next 1-3 weeks: “Yesterday (30 Jan, spot at 1.0870), we highlighted that EUR appears to have entered a consolidation phase and it is likely to trade between 1.0800 and 1.0930 for the time being. We continue to hold the same view. Looking ahead, if EUR breaks below 1.0800, it could lead to a pullback toward the next major support at 1.0720.”
- GBP/USD has gauged an intermediate cushion around 1.2330, still, further downside is on cards.
- Federal Reserve is expected to announce a smaller interest rate hike by 25 bps to the 4.50-4.75% range.
- A continuation of a bumper interest rate hike is expected from the Bank of England to contain stubborn inflation.
- GBP/USD is testing the strength of the downside break of the Descending Triangle.
GBP/USD has gauged intermediate support around 1.2330 after a vertical decline move in the early European session. The further downside in the Cable is still favored as the risk-off impulse is strengthening vigorously. Investors are dumping the risk-perceived assets amid rising volatility ahead of the interest rate decision by the Federal Reserve (Fed), scheduled for Wednesday. Also, the Bank of England (BoE) is going to announce its first monetary policy on Thursday.
United States equities are facing immense as investors are expecting that further interest rate hike by the Federal Reserve will escalate recession fears. S&P500 futures have turned negative after surrendering morning gains in no time. Also, the 500-stock basket futures ended Monday’s trading session on a weaker note, which indicates sheer pessimism among the market participants. Contrary to the USD Index, the alpha on US government bonds is displaying a subdued performance. The 10-year US Treasury yields are hovering around 3.54%.
Federal Reserve to decelerate policy tightening pace further
Economic indicators that provide nuggets about the state of United States inflation have conveyed an expression of deceleration in the Consumer Price Index (CPI). A contraction in consumer spending and lower prices fixed by producers at their factory gates in the month of December are indicating that the inflationary pressures are no more extremely stubborn now and are in a declining trend.
Therefore, the think tanks have started considering a further slowdown in the pace of policy tightening by the Federal Reserve (Fed).
Analysts at Rabobank point out that it has become increasingly likely that the Federal Reserve will slow down its hiking cycle to 25 bps. For interest-rate guidance “We continue to think that based on the fading momentum of inflation, the Federal Open Market Committee (FOMC) is likely to stop at a 4.75-5.00% target range and pause for the remainder of the year.”
It is worth mentioning that after hiking interest rates by 75 basis points (bps), straight for four times, Fed chair Jerome Powell trimmed the scale of the interest rate hike to 50 bps in its December monetary policy meeting. And now, is considering a further decline in the scale of the interest rate hike to 25 bps.
United States Employment data hogs limelight
Wednesday’s trading session is going to be a power-pack one amid the release of the United States Automatic Data Processing (ADP) Employment data and ISM Manufacturing PMI apart from the Federal Reserve policy. According to the estimates, the economic data is seen at 170K, lower than the former release of 235K.
The US labor market remained extremely tight in CY2022 but the continuation of interest rate hikes by Federal Reserve chair Jerome Powell is denting the expression of optimism in producers. Firms are aiming to optimally use their current labor force to handle operations and have paused the recruitment process due to the dismal economic outlook.
Meanwhile, an absence of expansion plans from various firms to avoid higher interest obligations has resulted in lower demand for fresh talent.
The US ISM Manufacturing PMI data is expected to contract to 48.0 from the former release of 48.4. As firms are operating with less capacity to avoid higher inventory due to lower demand, a contraction in manufacturing activities won’t be a surprise for the market participants. However, this might accelerate United States' recession fears.
Bank of England is keen to contain its double-digit inflation figure
Despite being the early adopter of hawkish monetary policy, the Bank of England has failed in achieving a decent decline in the inflation rate. The United Kingdom economy is operating with a double-digit inflation rate despite pushing interest rates to 3.50%. Rising food prices and labor costs have been a major hurdle for Bank of England Governor Andrew Bailey in achieving price stability. According to a poll from Reuters, Investors are mostly betting on another half percentage-point increase to 4.0% and that Bank Rate will peak at 4.5% soon.
A fresh rate hike cycle by the central banks is going to trim the Federal Reserve-Bank of England policy divergence.
GBP/USD technical outlook
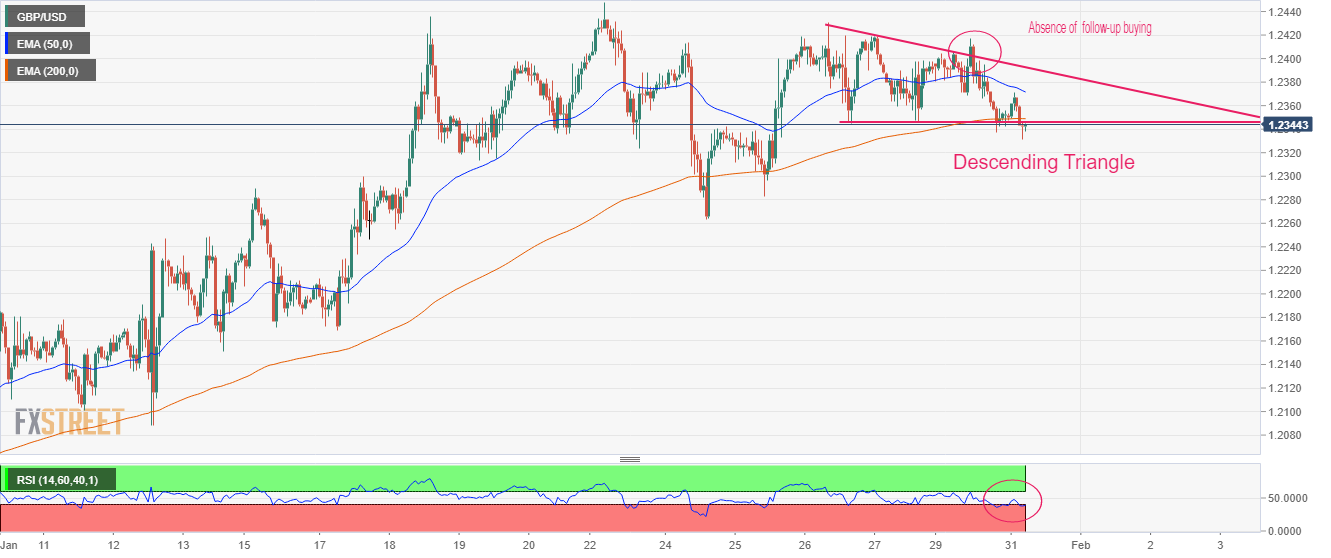
GBP/USD is aiming to shift its auction profile below the horizontal support of the Descending Triangle chart pattern plotted from January 26 low at 1.2344 on an hourly scale. The downward-sloping trendline of the aforementioned chart pattern is placed from January 26 high at 1.2430. On Monday, the Cable attempted to deliver a breakout of Descending Triangle, however, the lack of follow-up buying failed to maintain momentum in the Pound Sterling.
The asset has slipped below the 50-and 200-period Exponential Moving Averages (EMAs) at 1.2372 and 1.2348, which indicates more weakness ahead.
Also, the Relative Strength Index (RSI) (14) has slipped into the 20.00-40.00 range, which has triggered the downside momentum.
- Gold price fades corrective bounce from intraday low during four-day downtrend.
- Risk profile appears unclear even as Covid news, China data join IMF’s hopes of economic revival.
- Cautious mood ahead of FOMC, sluggish yields and IMF’s fears of inflation seem to weigh on XAU/USD price.
Gold price (XAU/USD) holds lower grounds as sellers attack a short-term key support line near $1,920 heading into Tuesday’s European session. In doing so, the precious metal reverses the mid-Asian session’s corrective bounce off the stated trend line support.
The reason for the metal’s weakness could be linked to the mixed details of the International Monetary Fund (IMF) updates as the global lender cited inflation fears while showing hopes of economic recovery. On the same line could be the recent action from the Bank of Japan (BoJ) to defend the Yield Curve Control (YCC), which in turn puts a floor under the global yields and weigh on the Gold price.
Additionally, Monday’s upbeat US data and hopes that the Federal Reserve (Fed) will do anything to defend its hawkish monetary policy moves also seem to exert downside pressure on the XAU/USD price.
It’s worth noting that the likely end of the Covid-led activity restrictions in the US from May 11 and upbeat China PMIs previously triggered the XAU/USD rebound from the $1,920 support.
While portraying the mood, the US 10-year Treasury yields struggle to extend a three-day uptrend near 3.54% while the US Dollar Index (DXY) retreats to 102.20 at the latest. Further, the S&P 500 Futures remain mildly offered and so do stocks in the Asia-Pacific region.
Looking forward, the second-tier US data relating to sentiment and employment cost may entertain Gold traders but major attention will be given to the US Federal Reserve’s (Fed) monetary policy meeting.
Gold price technical analysis
Although a short-term ascending support line challenges the Gold sellers around $1,920, the metal’s retreat from the 200-Hour Moving Average (HMA) joins bearish MACD signals and downbeat RSI (14) to keep bears hopeful of conquering the $1,920 support.
Following that, the previous weekly low of around $1,911 may act as an intermediate halt before directing the Gold price toward the $1,900 round figure. It should be observed that the January 18 swing low near $1,896 adds to the downside filters.
Meanwhile, the 200-HMA and the 100-HMA restrict the short-term upside of the XAU/USD near $1,928 and $1,930 in that order.
Even if the Gold price remains firmer past $1,930, multiple hurdles near $1,935 and $1,943 could challenge the XAU/USD bulls.
Gold price: Hourly chart
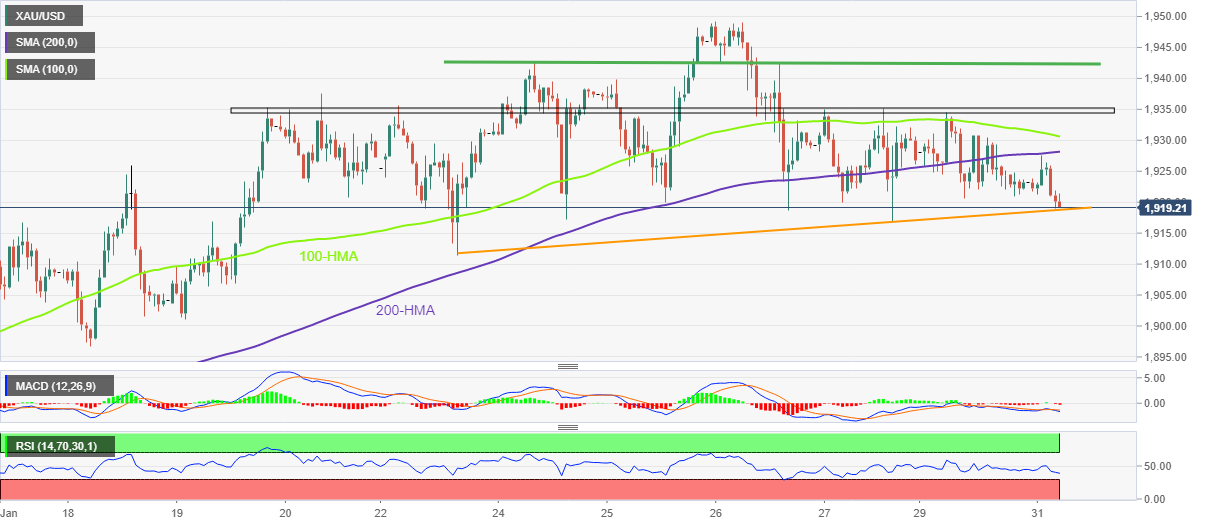
Trend: Further downside expected
Citing Australian broadcaster ABC, Reuters reported on Tuesday that the trade ministers of Australia and China are scheduled to hold a virtual meeting next week.
No further details are provided about the same.
Market reaction
AUD/USD remains unimpressed by the above headline, trading pressured at 0.7038, as of writing. The pair is down 0.28% on the day.
Bank of Japan (BoJ) confirmed in a statement on Tuesday, it will offer JPY1 trillion worth of five-year loans against collateral from banks.
This measure was announced on Friday but the central bank confirmed the amount on Tuesday.
Meanwhile, Reuters reported on Monday, a panel of academics and business executives urged the BoJ to make its 2% inflation target a long-term goal.
Market reaction
USD/JPY is keeping its range at around 130.30, marginally lower on the day. The pair is holding its recovery momentum
- USD/JPY picks up bids to pare intraday losses, up for the third week in a row.
- Yields remain pressured, stock futures grind higher amid growth optimism, Covid-linked news.
- BoJ Chief Contestant warn of government meddling to defend JPY.
- Second-tier US data may entertain traders but FOMC is the key.
USD/JPY trims daily loss around 130.30 during early Tuesday morning in Europe as mixed sentiment in the market joins a pause in the US Treasury bond yields. Adding to the Yen pair traders’ confusion are the fresh fears of government meddling to defend the Japanese currency.
While firmer Japan data recently fuelled fears of the Bank of Japan’s (BOJ) exit from ultra-easy monetary policy, backed by a suggestion from the key policymakers, fears of government’s defense of Japanese Yen (JPY) probe the pair traders. “Hirohide Yamaguchi, among the top candidates to become the next Bank of Japan (BOJ) governor, warned about the danger of signing a joint policy document with the government when he was deputy governor in 2012, minutes of that meeting showed on Tuesday,” per Reuters.
Elsewhere, the International Monetary Fund (IMF) recently raised its global growth estimates while also saying that the emerging markets' growth slowdown bottomed out in 2022. The global lender also stated that estimates come with the backdrop of a slight increase in the 2023 global growth outlook helped by "surprisingly resilient" demand in the United States and Europe, an easing of energy costs and the reopening of China's economy after Beijing abandoned its strict COVID-19 restrictions. It’s worth mentioning that the IMF’s fears over inflation seem to tame the optimism afterward.
On the same line, receding fears of the COVID-19, after the US White House statement suggesting removal of virus-led activity restrictions, also propel the risk barometer USD/JPY pair. However, stronger Japan data underpin the hawkish bias from the BoJ and weigh on the quote.
Against this backdrop, the US 10-year Treasury yields struggle to extend a three-day uptrend near 3.54% while the US Dollar Index (DXY) retreats to 102.20 at the latest. Further, the S&P 500 Futures remain mildly offered and so do stocks in the Asia-Pacific region.
Looking forward, the US fourth-quarter (Q4) Employment Cost Index (ECI) and the Conference Board’s Consumer Confidence gauge for January will be eyed for immediate directions. As per the market consensus, the US Consumer sentiment gauge may improve but a likely softer print of the US ECI, to 1.1% from 1.2%, could strengthen the dovish bias surrounding Fed and can recall the USD/JPY bears.
Technical analysis
A daily closing beyond the 21-DMA hurdle, currently around 130.40, becomes necessary to keep USD/JPY buyers on the table.
- NZD/USD has refreshed its weekly low around 0.6440 amid negative market sentiment.
- The Kiwi asset has delivered a breakdown of the consolidation and a Rising Wedge pattern.
- A slippage of the RSI (14) into the 20.00-40.00 range has weakened the New Zealand Dollar.
The NZD/USD pair has printed a fresh weekly low at 0.6440 in the Asian session as investors' risk-taking ability has faded dramatically. The Kiwi asset has been dumped by the market participants as the US Dollar Index (DXY) is advancing vertically.
The risk aversion theme is impacting risk-sensitive assets like S&P500 futures, which have surrendered their entire gains recorded in Asia and have resumed their downside journey. Volatility in the market has accelerated ahead of the interest rate decision by the Federal Reserve (Fed).
NZD/USD has delivered a downside break of the consolidation formed in a range of 0.6451-0.6515 on a four-hour scale, which indicates a volatility explosion that set grounds for wider ticks and heavy volume. The asset has also delivered a breakdown of the Rising Wedge chart pattern, which indicates a bearish reversal.
The Kiwi asset has also surrendered the 23.6% Fibonacci retracement support (placed from January 6 low at 0.6190 to January 18 high at 0.6531) at 0.6450.
Also, the Relative Strength Index (RSI) (14) has shifted into the bearish range of 20.00-40.00, which indicates more downside ahead.
Going forward, a breakdown below January 16 high at 0.6426 will drag the Kiwi asset toward January 17 low at 0.6366 followed by January 12 low around 0.6300.
On the flip side, the asset needs to surpass Wednesday’s high at 0.6530 for a resumption in the upside, which will drive the asset toward June 3 high at 0.6576. A breach of the latter will expose the asset to the round-level resistance at 0.6600.
NZD/USD four-hour chart
-638107371054887780.png)
- USD/CAD picks up bids to refresh intraday high, extends bounce off 1.5-month low.
- Firmer RSI, looming bull cross on MACD keep buyers hopeful.
- 100-DMA appears crucial hurdle for the bulls to cross.
- Pullback remains elusive unless the quote stays beyond 1.3300.
USD/CAD holds onto the week-start recovery from a six-week low as it crosses the monthly resistance line during early Tuesday, refreshing intraday high around 1.3415 by the press time.
In doing so, the Loonie pair justifies the rebound from the 1.3300 round figure, as well as the recovery in the RSI (14) line. With this, the MACD also teases buyers and adds strength to the upside bias.
However, the 21-DMA hurdle surrounding 1.3425 holds the key for the USD/CAD pair’s further upside towards the 1.3500 round figure.
In a case where the Loonie pair remains firmer past 1.3500, the January 19 swing high near 1.3520 and the 100-DMA hurdle surrounding 1.3530 could probe the bulls before directing them to the monthly high of 1.3680.
It’s worth noting that the 61.8% Fibonacci retracement level of the USD/CAD pair’s October-November downside, near 1.3690, precedes the 1.3700 round figure to act as the last defense of the bears.
On the contrary, a daily closing below the stated resistance line, close to 1.3400 by the press time, could renew the downside move targeting the latest swing low near 1.3300.
However, any further weakness in the USD/CAD price won’t hesitate to challenge the late 2022 bottom near 1.3225.
USD/CAD: Daily chart
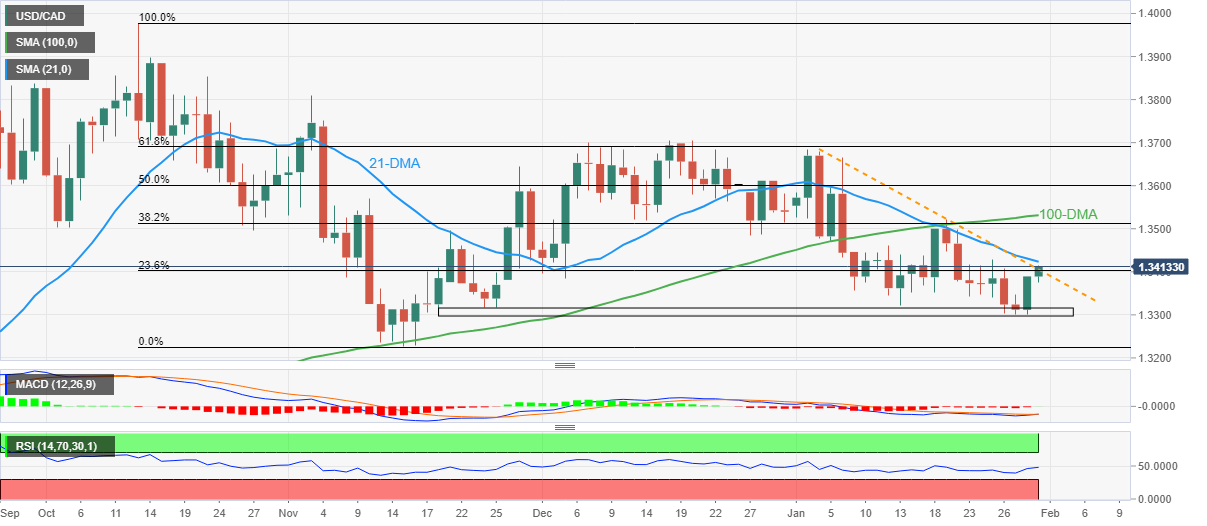
Trend: Further upside expected
- Asia-Pacific equities trade mixed, grinding lower of late as traders remain cautious ahead of top-tier data/events.
- Upbeat China PMI, IMF growth forecasts join Covid-linked headlines to underpin bullish bias.
- Mixed concerns surrounding China, due to downbeat Industrial Profits, sour sentiment in India and hawkish BoJ talks probe equity buyers.
- S&P 500 Futures hesitate in extending Wall Street’s losses amid hopes of economic rebound.
Markets in Asia fail to cheer the upbeat signals from China and the International Monetary Fund (IMF) as sentiment remains cautious ahead of the top-tier data and central bank meetings. Adding strength to the market’s anxiety could be the recently firmer US data and looming economic fears surrounding Asia.
Amid these plays, the MSCI’s index of Asia-Pacific shares outside Japan traces Wall Street’s losses while posting 1.20% daily downside whereas Japan’s Nikkei 225 drops 0.25% to 27,375 by the press time. In doing so, the Japanese shares can’t cheer mostly upbeat data from Tokyo, as well as risk-positive news surrounding the coronavirus and the emerging market growth amid fears of hawkish moves of the Bank of Japan (BoJ).
Japan’s Unemployment Rate remains unchanged near 2.5% in December but the Retail Trade rose past 0.5% in market forecasts to 1.1% during the stated month. On the same line, the Industrial Production also crossed -1.2% consensus with -0.1% figure for December.
On the other hand, Chinese equities grind higher as the headline NBS Manufacturing PMI rose to 50.1 versus 49.7 market forecasts and 47.0 prior whereas Non-Manufacturing PMI also came in upbeat with 54.4 figure compared to 51.0 expected and 41.6 previous readings. Even so, the nation’s Industrial Profits contract in 2022.
Elsewhere, the International Monetary Fund (IMF) recently raised its global growth estimates while saying that the emerging markets' growth slowdown bottomed out in 2022. The global lender also stated that estimates come with the backdrop of a slight increase in the 2023 global growth outlook helped by "surprisingly resilient" demand in the United States and Europe, an easing of energy costs and the reopening of China's economy after Beijing abandoned its strict COVID-19 restrictions. It’s worth mentioning that the IMF’s fears over inflation seem to weigh on the market sentiment.
Earlier favoring the risk profile could be the news suggesting US President Joe Biden’s administration’s readiness to revoke the Covid-led emergencies from May 11 appeared to have favored the risk-on profile of late. On Monday, China’s Center for Disease Control and Prevention (CDC) said, reported by Reuters, “China's current wave of COVID-19 infections is nearing an end, and there was no significant rebound in cases during the Lunar New Year holiday.”
Other than the risk catalysts, downbeat Oil prices also put a floor under the Asia-Pacific equities. That said, the WTI crude oil prints a three-day downtrend near $78.00 by the press time. On the same line could be mildly offered US equities and S&P 500 Futures.
Alternatively, fears of equity rout in India due to Adani Enterprise fiasco and hopes of slowest growth in three years seem to exert downside pressure on the Indian equities. Furthermore, downbeat Aussie Retail Sales and fears of China growth keep equities in Australia and New Zealand sidelined.
Moving on, traders in the Asia-Pacific region will pay close attention to India’s Union Budget for the Fiscal Year 2023-24 and New Zealand quarterly employment data for immediate directions. However, the Fed’s verdict is the key for clear guide.
- USD/INR is aiming to shift its business above confidently 81.60 amid the souring market mood.
- The Fed is expected to further decelerate the pace of policy tightening further.
- Indian Rupee might display sheer volatility on Budget Day ahead.
The USD/INR pair is generating gains after a recovery move from 81.40 and is looking to shift its auction profile above the critical resistance of 81.60 in the Asian session. The asset is picked strength amid a firmer recovery in the US Dollar Index (DXY) after a corrective move below 101.80. The appeal for safe-haven assets is escalating as investors have underpinned the risk-aversion theme ahead of the monetary policy announcement by the Federal Reserve (Fed).
S&P500 futures have surrendered gains added in early Asia and turned into a negative trajectory now. The 500-US stock basket futures settled Monday’s trading session with significant losses and a continuation of the downside journey has weakened the risk appetite of the market participants. Due to a loss in the risk-taking ability of the market participants, the Indian Rupee is facing the heat.
The demand for US government bonds is increased marginally as the Fed is highly expected to slow down the pace of policy tightening again. It is worth mentioning that after hiking interest rates by 75 basis points (bps), straight for four times, Fed chair Jerome Powell trimmed the scale of the interest rate hike to 50 bps in its December monetary policy meeting. And now, after observing a decline in consumer spending and Producer Price Index (PPI) in January, Fed policymakers are favoring further deceleration in the policy tightening pace to 25 bps.
On the Indian Rupee front, investors are awaiting the announcement of the Financial Budget 2023-2024, which will provide a detailed explanation of the expenditure to be undertaken and revenue to recover through taxes by the Indian government. A significant injection of liquidity by the government and a lower Fiscal Deficit target could impact the Indian Rupee further.
- EUR/USD has extended its downside below 1.0850 as the risk-off impulse has strengthened.
- Following the footprints of the German GDP, Eurozone GDP could display a contraction too.
- The street is expecting a 25 bps interest rate hike from the Fed and a 50 bps rate hike from the ECB.
The EUR/USD pair has extended its downside move below 1.0850 after an intensive selling action by the market participants around 1.0860. The pullback move displayed by the shared currency pair met with significant offers as the US Dollar Index (DXY) has shown a stellar recovery after correcting to near 101.80.
Gains recorded by the S&P500 futures have disappeared as investors have underpinned the risk-aversion theme ahead of the interest rate decision by the Federal Reserve (Fed). Investors are worried that further interest rate hike announcements by Fed chair Jerome Powell will accelerate recession fears significantly.
The USD Index is recovered dramatically as a 25 basis point (bps) interest rate hike is widely expected by the street. The roadmap of achieving price stability is far from over as the current inflation rate in the United States is three times more than the desired rate of 2%. Therefore, the Fed cannot pause hiking interest rates at this point in time.
Apart from the policy decision, investors will keenly focus on the interest rate guidance. Analysts at Rabobank cited “We continue to think that based on the fading momentum of inflation, the Federal Open Market Committee (FOMC) is likely to stop at a 4.75-5.00% target range and pause for the remainder of the year.”
On the Eurozone front, investors are also awaiting the interest rate decision by the European Central Bank (ECB). Rising labor cost and an inflation rate above 9% is still a concern for ECB President Christine Lagarde. As per the consensus, ECB President will announce an interest rate hike of 50 bps to 2.50%.
But before that, preliminary Eurozone Gross Domestic Product (GDP) (Q4) data will remain in focus. The economic data is seen at 0% vs. the prior release of 0.3% on a quarterly basis. While the annual GDP might contract to 1.8% from 2.3% reported earlier. Investors should be prepared for a contraction in Eurozone GDP as the German economy reported a contraction of 0.2% on Monday against a flat reading as expected.
- Gold price prints the first daily gains in four while reversing from monthly support line.
- Market sentiment improves on upbeat China Purchasing Managers’ Indexes, International Monetary Fund growth forecasts.
- Anxiety ahead of Federal Reserve monetary policy, key earnings probe XAU/USD run-up.
- United States CB Consumer Confidence for January, Employment Cost Index for Q4 eyed for intraday directions.
Gold price (XAU/USD) licks its wounds around $1,925 after a three-day downtrend as market sentiment improves during early Tuesday. The reason could be linked to China’s official activity data and the upbeat growth forecasts from the International Monetary Fund (IMF). Adding strength to the optimism are the Covid headlines. However, the anxiety ahead of top-tier central bank meetings and the key earnings report probe the Gold buyers of late.
COVID-19 headlines probe Gold bears
A cautious mood ahead of this week’s bumper data joined the upbeat United States Dallas Fed manufacturing index for January, which marked the highest reading since May 2022, to favor the Gold bears the previous day. However, risk-positive headlines surrounding the Coronavirus-led restrictions from China and the US seemed to have probed the XAU/USD sellers afterward.
News suggesting US President Joe Biden’s administration’s readiness to revoke the Covid-led emergencies from May 11 appeared to have favored the risk-on profile of late. On Monday, China’s Center for Disease Control and Prevention (CDC) said, reported by Reuters, “China's current wave of COVID-19 infections is nearing an end, and there was no significant rebound in cases during the Lunar New Year holiday.”
China Purchasing Managers’ Indexes renew XAU/USD buying
Having heard the positive updates over the Covid-linked restrictions, the upbeat prints of China’s NBS Purchasing Managers’ Indexes (PMI) for January added strength to the Gold price recovery. That said, China’s NBS Manufacturing PMI rose to 50.1 versus 49.7 market forecasts and 47.0 prior whereas Non-Manufacturing PMI also came in upbeat with 54.4 figure compared to 51.0 expected and 41.6 previous readings.
International Monetary Fund’s growth forecasts add strength to Gold price
The International Monetary Fund (IMF) recently raised its global growth estimates while saying that the emerging markets' growth slowdown bottomed out in 2022. The global lender also stated that estimates come with the backdrop of a slight increase in the 2023 global growth outlook helped by "surprisingly resilient" demand in the United States and Europe, an easing of energy costs and the reopening of China's economy after Beijing abandoned its strict COVID-19 restrictions.
Second-tier United States data to probe US Dollar bulls amid sluggish yields
In addition to the aforementioned risk-positive catalysts, the lack of hawkish concerns in the market also weighs on the United States Treasury bond yields and the US Dollar, which in turn probe the Gold sellers. That said, the US 10-year Treasury yields struggle to extend a three-day uptrend near 3.54% while the US Dollar Index (DXY) retreats to 102.20 at the latest.
That said, the US fourth-quarter (Q4) Employment Cost Index (ECI) and the Conference Board’s Consumer Confidence gauge for January will be eyed for immediate directions. As per the market consensus, the US Consumer sentiment gauge may improve but a likely softer print of the US ECI, to 1.1% from 1.2%, could strengthen the dovish bias surrounding Fed and can recall the XAU/USD buyers.
It should, however, be noted that the cautious mood ahead of the earnings reports from the equity heavyweights like Amazon, Alphabet, Apple and Meta also could challenge the market’s optimism and the Gold price.
Gold price technical analysis
Gold price recovers from a one-month-old ascending support line while teasing the XAU/USD buyers amid the mostly steady Relative Strength Index (RSI).
However, a clear downside break of the 50-bar Simple Moving Average (SMA) joins the bearish signals from the Moving Average Convergence and Divergence (MACD) indicator to keep the Gold sellers hopeful.
As a result, the metal’s rebound remains elusive unless it remains below the 50-SMA, around $1,930 by the press time.
Following that, multiple swing highs marked since Thursday could probe the Gold buyers around $1,935 before highlighting the monthly peak of $1,949 and the $1,950 round figure.
It’s worth noting, however, that an upward-sloping resistance line from January 16, close to $1,958 by the press time, appears the last defense for the XAU/USD bears.
Alternatively, a downside break of the aforementioned support line, close to $1,920, could trigger a quick fall of the Gold price towards the $1,900 threshold.
However, the metal’s sustained weakness past $1,900 will make it vulnerable to testing the 200-SMA, near $1,863 at the latest.
Gold price: Four-hour chart
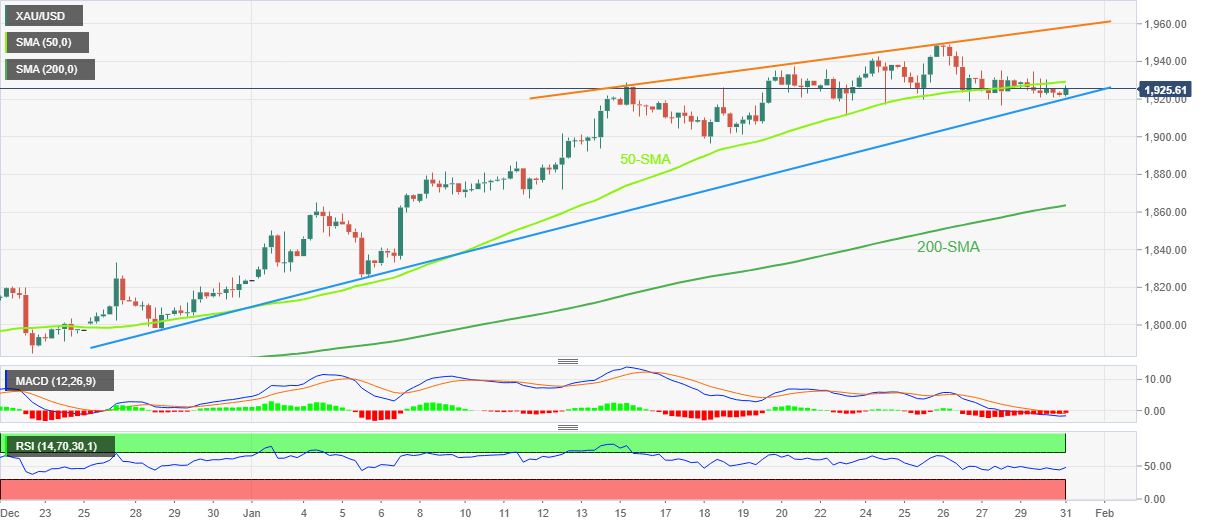
Trend: Limited recovery expected
New Zealand’s new Prime Minister (PM) Chris Hipkins announces a Cabinet reshuffle on Tuesday, dragging the New Zealand Dollar a few pips lower.
New Zealand PM Hipkins reaffirmed Grant Robertson's appointment as Finance Minister.
Market reaction
NZD/USD is testing daily lows at 0.6448 on the above announcement. The pair is losing 0.26% on the day.
- USD/CHF takes offers to refresh intraday low, snaps three-day uptrend.
- Bullish MACD signals, key trend line breakout keeps buyers hopeful.
- Two-month-old bearish channel, 50-DMA challenges upside bias below 0.9320.
USD/CHF bulls struggle to keep the reins after a three-day uptrend as the Swiss currency pair drops to 0.9240 while flashing the first daily loss in four during early Tuesday. In doing so, the quote retreats toward the previous resistance line from January 06.
However, the bullish MACD signals and the pair’s trading beyond the resistance-turned-support, around 0.9225 by the press time, keeps the USD/CHF buyers hopeful.
Even if the pair drops back below the previous resistance line, a two-week-old ascending support line near 0.9190 could challenge the USD/CHF bears.
In a case where the quote remains bearish past 0.9190, the monthly low and lower line of the two-month-long bearish channel, respectively near 0.9085 and 0.9040, will be in focus.
On the contrary, a convergence of the 50-DMA and the stated bearish channel’s top line highlights the 0.9320 as a tough nut to crack for the USD/CHF bulls.
Following that, a run-up towards refreshing the monthly high, currently around 0.9410 becomes imminent before challenging the late November 2022 swing high close to the 0.9600 round figure.
It’s worth observing that the 0.9500 round figure may act as an intermediate halt during the quote’s rally between 0.9410 and 0.9600.
USD/CHF: Daily chart
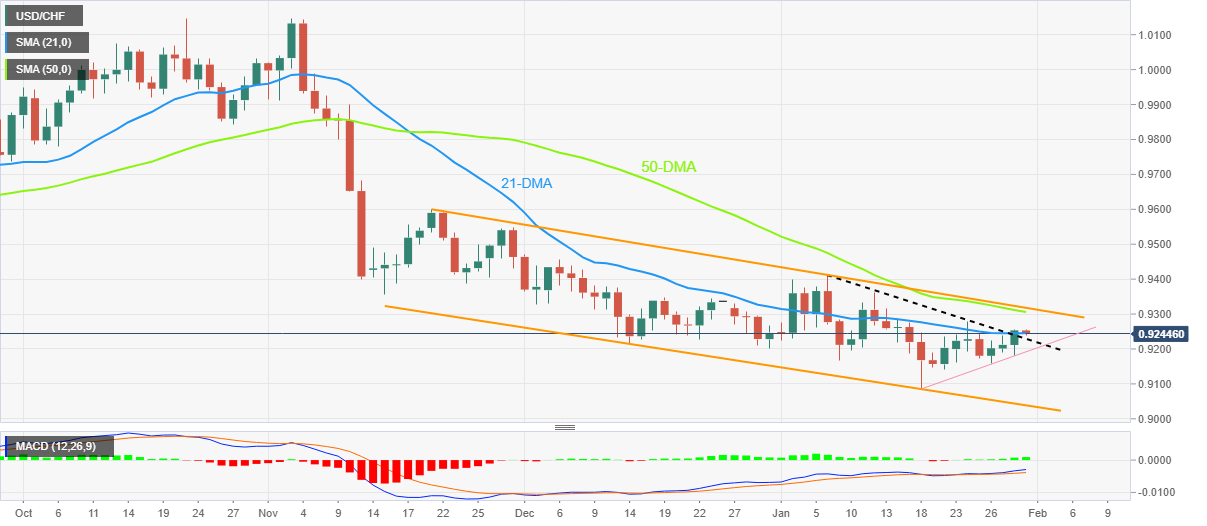
Trend: Recovery expected
| Raw materials | Closed | Change, % |
|---|---|---|
| Silver | 23.603 | 0.1 |
| Gold | 1923.12 | -0.19 |
| Palladium | 1639.74 | 1.58 |
After raising the global GDP growth forecasts, the International Monetary Fund (IMF) unveils it's Gross Domestic Product (GDP) expectations for the Emerging Market economies, the UK and Japan.
Key takeaways
IMF lifts 2023 GDP growth estimate for China by 0.8 percentage point to 5.2%; 2024 view unchanged at 4.5%.
IMF lifts 2023 emerging, developing economies GDP growth estimate to 4.0%, 2024 rate view lowered to 4.2%.
IMF sees annualized inflation in emerging, developing economies slowing to 8.1% in 2023 from 9.9% in 2022; 2024 view at 5.5%.
IMF holds view on 2023, 2024 GDP growth in India at 6.1%, 6.8% respectively.
IMF sees Russia GDP growth rate at 0.3% in 2023, up 2.6 percentage points from its October projection.
IMF raises 2023 GDP growth estimate for Mexico by 0.5 pct pt to 1.7%; 2024 view lowered to 1.6%.
IMF raises 2023 GDP growth estimate for Brazil by 0.2 pct pt to 1.2%; 2024 view lowered to 1.5%.
IMF raises 2023 GDP growth estimate for LatAm and Caribbean by 0.1 pct pt to 1.8%; 2024 view lowered to 2.1%.
IMF lowers 2023 GDP growth estimate for Saudi Arabia by 1.1 pct pts to 2.6%; 2024 view raised to 3.4%.
IMF upgraded its forecast for growth in Japan's GDP this year to 1.8% from its October estimate of 1.6%, but lowered its 2024 growth forecast to 0.9% from October's 1.3%.
IMF expects the UK GDP to contract 0.6% this year and expand 0.9% in 2024.
Related reads
- S&P 500 Futures recover, Treasury bond yields retreat as IMF revises up global growth forecasts
- Pressure building rate hike week
- AUD/USD picks up bids to challenge two-day downtrend.
- China official PMIs came in firmer for January, IMF revised up growth forecasts.
- Aussie Retail Sales, cautious mood ahead of the key data/events previously weighed on prices.
- US data eyed ahead of Fed meeting, risk catalysts are important too.
AUD/USD probes the two-day downtrend while picking up bids from the intraday low amid the risk-positive headlines from China and the International Monetary Fund (IMF). Even so, the buyers seem to struggle in retaking control amid anxiety ahead of this week’s top-tier central bank meeting. That said, the Aussie pair makes rounds to 0.7055 during early Tuesday, following the recent bounce off intraday low of 0.7038.
The IMF recently raised its global growth estimates while saying that the emerging markets' growth slowdown bottomed out in 2022. The global lender also stated that estimates come with the backdrop of a slight increase in the 2023 global growth outlook helped by "surprisingly resilient" demand in the United States and Europe, an easing of energy costs and the reopening of China's economy after Beijing abandoned its strict COVID-19 restrictions.
Before that, China’s NBS Manufacturing PMI rose to 50.1 versus 49.7 market forecasts and 47.0 prior whereas Non-Manufacturing PMI also came in upbeat with 54.4 figure compared to 51.0 expected and 41.6 previous readings.
Adding to the cautious optimism could be the news suggesting US President Joe Biden’s administration’s readiness to revoke the Covid-led emergencies from May 11 appeared to have favored the risk-on profile of late. On Monday, China’s Center for Disease Control and Prevention (CDC) said, reported by Reuters, “China's current wave of COVID-19 infections is nearing an end, and there was no significant rebound in cases during the Lunar New Year holiday.”
It should be noted that downbeat Aussie Retail Sales for December joined the cautious mood ahead of the Federal Open Market Committee (FOMC) monetary policy meeting to weigh on the AUD/USD prices earlier in the day. It’s worth noting that Aussie Retail Sales marked a contraction figure of 3.9% for December versus -0.3% number expected and 1.4% prior.
While portraying the mood, the S&P 500 Futures print mild gains despite downbeat Wall Street performance whereas the US 10-year Treasury yields retreat to 3.54% after posting a three-day winning streak in the last.
Looking ahead, the US fourth-quarter (Q4) Employment Cost Index (ECI) and the Conference Board’s Consumer Confidence gauge for January will be eyed for immediate directions. As per the market consensus, the US Consumer sentiment gauge may improve but a likely softer print of the US ECI, to 1.1% from 1.2%, could strengthen the dovish bias surrounding Fed and can recall the AUD/USD buyers.
Technical analysis
A one-month-old bullish channel’s lower line restricts AUD/USD pair’s downside near the 0.7000 round figure.
Japan's Finance Minister Shunichi Suzuki said in a statement early Tuesday that “wage increases are important to both the government and the Bank of Japan (BoJ).
“It is too early to judge whether the joint statement needs to be revised,” the minister added.
Market reaction
USD/JPY is threatening the 130.00 level, down 0.23% on the day so far. The Japanese Yen outperforms in Tuesday’s Asian trading amid upbeat domestic Industrial Production and Retail Trade data. Meanwhile, broad US Dollar weakness also weighs down on the USD/JPY pair.
- USD/JPY bulls eye a 50% mean reversion towards 130.30 that meets the prior support.
- The outlook is bearish for the day ahead with a test of 130.00 eyed ahead of the Federal Reserve on Wednesday.
USD/JPY is under pressure in Tokyo but the bulls are moving in from a support area as the following charts will illustrate. Meanwhile, the US Dollar rose on Monday, ahead of the Federal Reserve's two-day policy meeting which is likely to keep traders at bay and USD/JPY range bound until the outcome of the meeting. Nevertheless, the market structure is as follows:
USD/JPY H1 charts
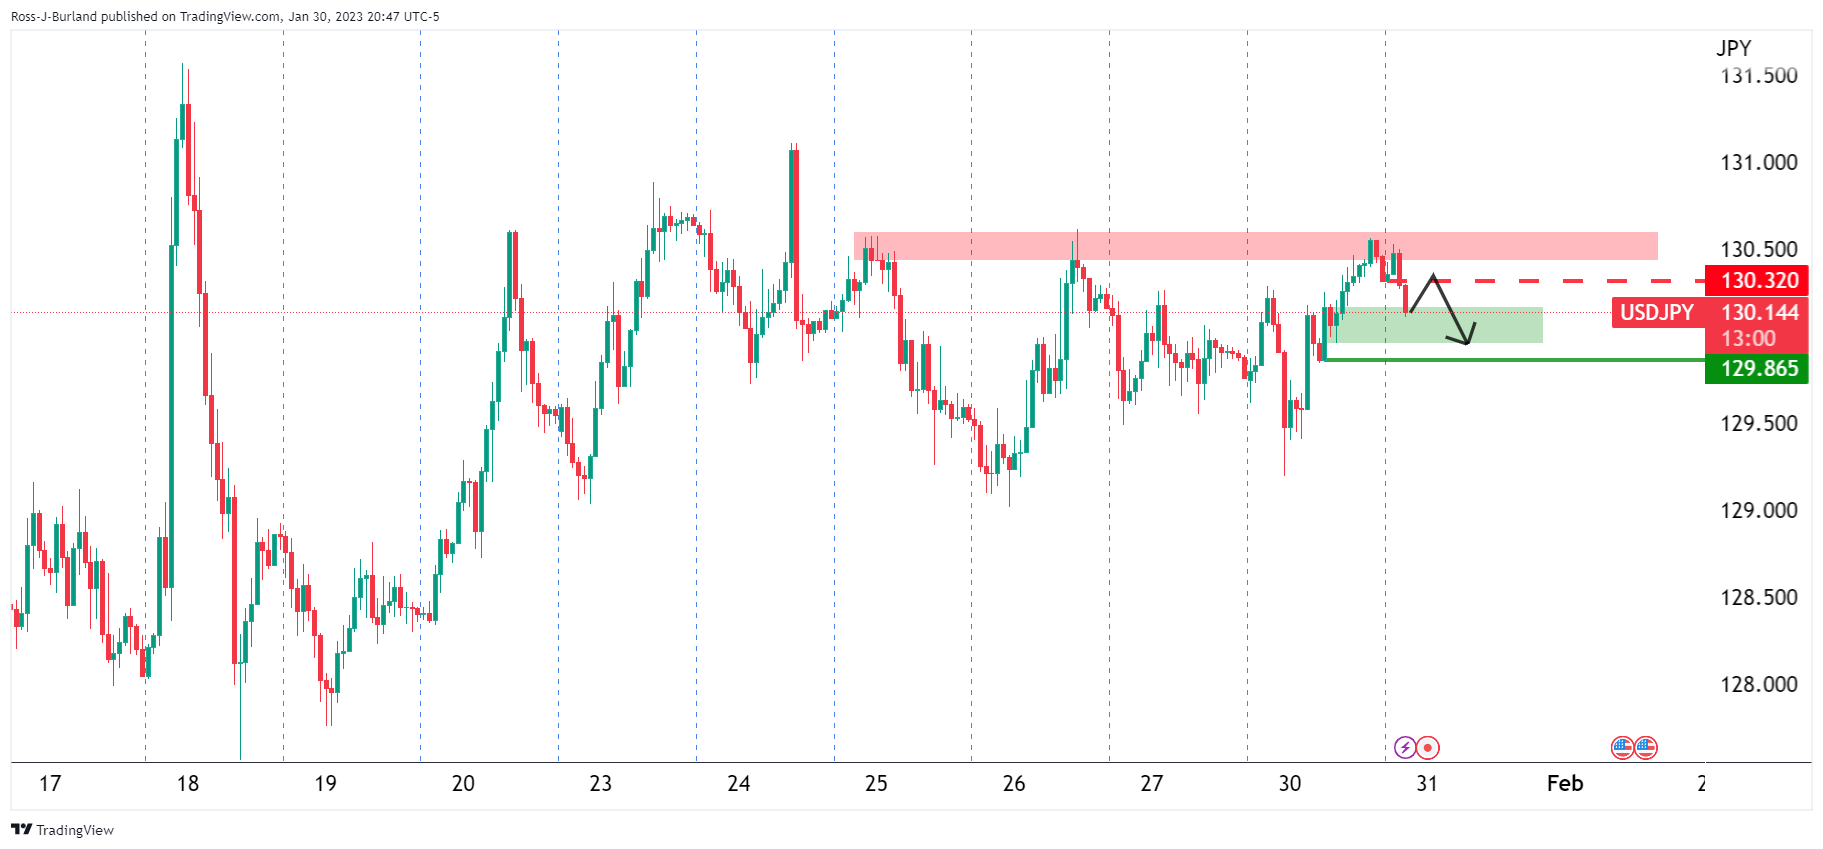
The price is on the backside of the rising trend and the bears are keenly awaiting a discount to move in again:
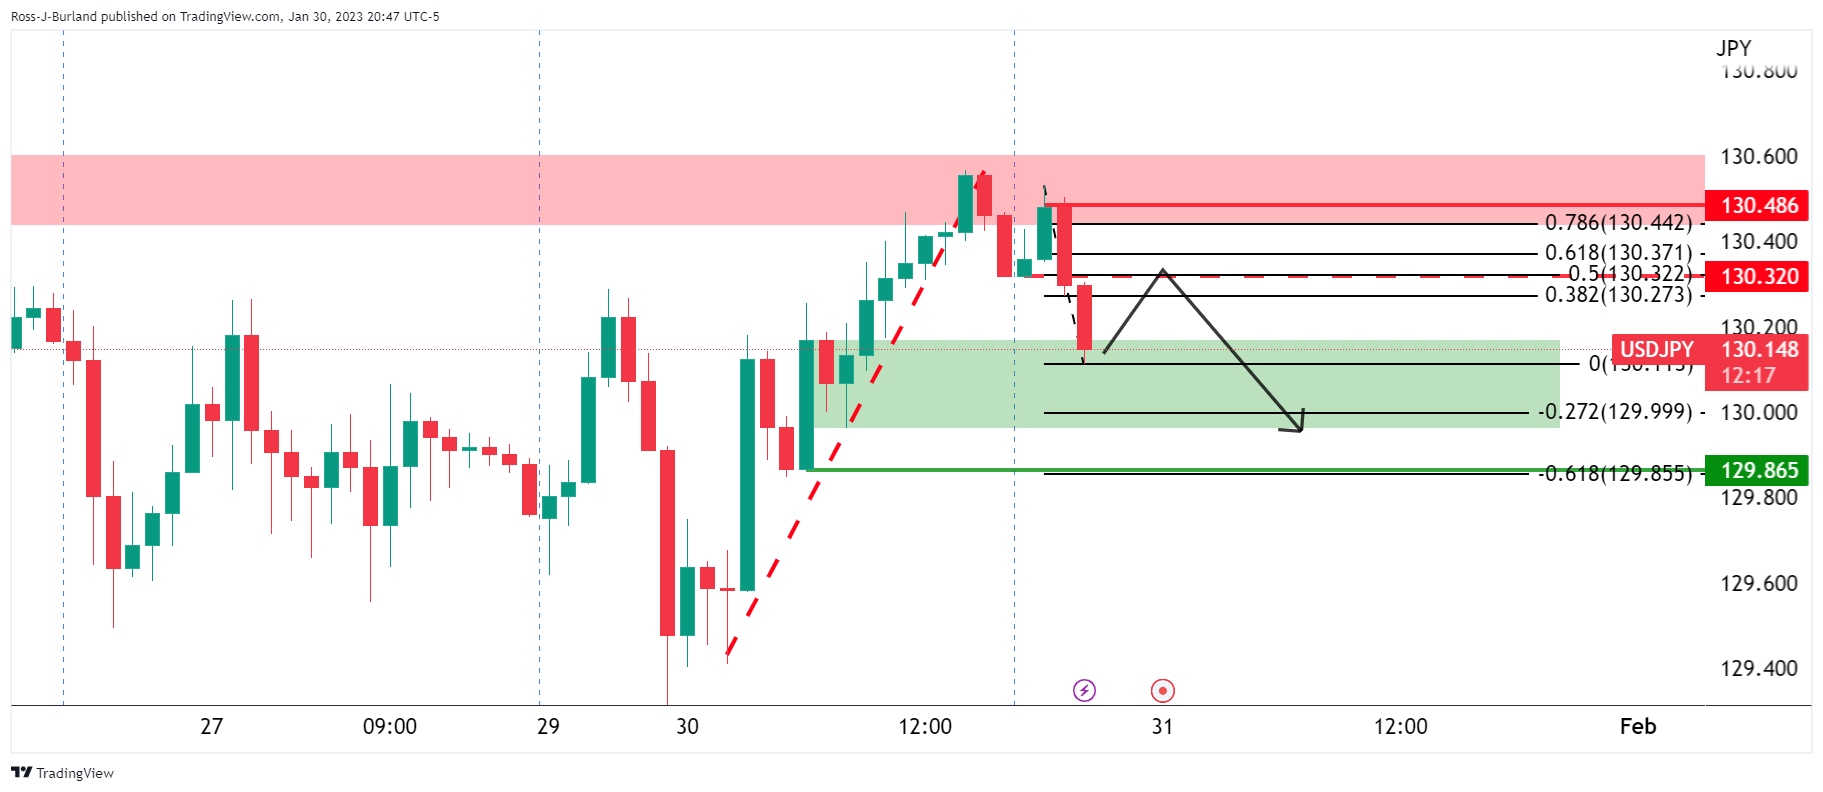
USD/JPY M15 chart

As seen, the bulls have steppe din in the 15-minute candle rotation and eye a 50% mean reversion towards 130.30 that meets the prior support that was broken in early Asian trade. This does leave the outlook bearish for the day ahead with a test of 130.00 eyed ahead of the Federal Reserve on Wednesday.
- The Cable has found a cushion as the USD Index has extended its correction.
- Pound Sterling bulls have found support from the 200-EMA around 1.2350.
- A breakdown of the RSI (14) into the 20.00-40.00 range will trigger the bearish momentum.
The GBP/USD pair has sensed a buying interest after dropping below 1.2340 in the Asian session. On Monday, the Cable witnessed selling pressure after failing to sustain above the round-level resistance of 1.2400. The major has shown a rebound amid a correction in the US Dollar Index (DXY) below 101.80, however, the downside bias for Cable is still solid amid overall pessimism in the market.
S&P500 futures have surrendered half of their gains recorded in early Asia, which indicates that the risk appetite of the market participants is declining again. Meanwhile, the 10-year year US Treasury yields are still holding above 3.54% despite a minor correction.
GBP/USD has picked significant bids after dropping to near the horizontal support of the Descending Triangle chart pattern plotted from January 26 low at 1.2344 on an hourly scale. The downward-sloping trendline of the aforementioned chart pattern is placed from January 26 high at 1.2430. On Monday, the Cable attempted to deliver a breakout of Descending Triangle, however, the lack of follow-up buying failed to maintain momentum in the Pound Sterling.
The asset is oscillating below the 50-period Exponential Moving Average (EMA) at 1.2375, which indicates that the short-term trend is bearish now.
On the contrary, the 200-EMA at 1.2350 has acted as a cushion for the Pound Sterling bulls.
The Relative Strength Index (RSI) (14) has yet not surrendered the 40.00-60.00 range. A breakdown into the 20.00-40.00 range will trigger the downside momentum.
Should the Cable break above the seven-month high of 1.2448 decisively, Pound Sterling bulls will drive the asset towards the psychological resistance of 1.2500 and June 7 high around 1.2600.
The Cable will display a sheer downside if it drops below Monday’s low at 1.2171 as it will drag the major toward January 11 low at 1.2100 followed by the psychological support at 1.2000.
GBP/USD hourly chart
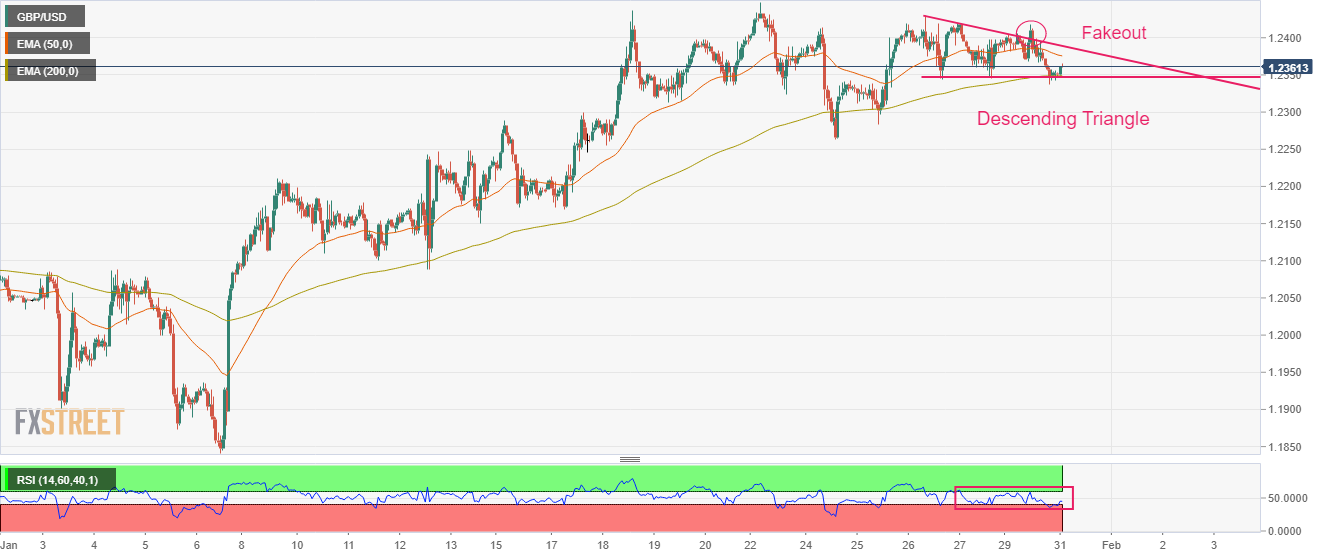
- Market sentiment improves a bit amid Covid-linked headlines, hopes of economic recovery.
- IMF revises up global growth forecast, China PMIs came in firmer.
- US President Biden’s Administration braces for ending the Covid-led emergencies by May 11.
- US CB Consumer Confidence, risk catalysts eyed for intraday move, Fed is the key.
Risk profile improves during early Tuesday, after a sour start to the key central bank week, as hopes of economic growth and easing Covid woes allowed traders to better brace for the top-tier data/events. Adding strength to the cautious optimism could be the upbeat China activity data.
That said, the International Monetary Fund (IMF) recently raised its global growth estimates while saying that the emerging markets' growth slowdown bottomed out in 2022. The global lender also stated that estimates come with the backdrop of a slight increase in the 2023 global growth outlook helped by "surprisingly resilient" demand in the United States and Europe, an easing of energy costs and the reopening of China's economy after Beijing abandoned its strict COVID-19 restrictions.
Also read: IMF raises growth forecasts as gas prices fall and China reopens
Earlier in the day, China’s NBS Manufacturing PMI rose to 50.1 versus 49.7 market forecasts and 47.0 prior whereas Non-Manufacturing PMI also came in upbeat with 54.4 figure compared to 51.0 expected and 41.6 previous readings.
On the same line, news suggesting US President Joe Biden’s administration’s readiness to revoke the Covid-led emergencies from May 11 appeared to have favored the risk-on profile of late. On Monday, China’s Center for Disease Control and Prevention (CDC) said, reported by Reuters, “China's current wave of COVID-19 infections is nearing an end, and there was no significant rebound in cases during the Lunar New Year holiday.”
Against this backdrop, the S&P 500 Futures print mild gains despite downbeat Wall Street performance whereas the US 10-year Treasury yields retreat to 3.54% after posting a three-day winning streak in the last.
Even so, anxiety ahead of this week’s key central bank meetings and earnings reports from the equity heavyweights like Amazon, Alphabet, Apple and Meta seems to challenge the market’s optimism.
Moving on, the US fourth-quarter (Q4) US Employment Cost Index (ECI) and the Conference Board’s Consumer Confidence gauge for January will be eyed for clear directions. It should be noted that the US Consumer sentiment gauge to improve but a likely softer print of the US ECI, to 1.1% from 1.2% could strengthen the dovish bias surrounding the Fed and probe the Kiwi pair bears. However, major attention will be given to Wednesday’s Federal Open Market Committee (FOMC) monetary policy meeting.
- USD/CNH is showing wild ticks on better-than-projected China’s official PMI data.
- Official Manufacturing PMI has soared to 50.1 while the Non-Manufacturing PMI has climbed to 54.4.
- The risk-perceived assets are failing to find a cushion amid Fed policy inspired-volatility.
The USD/CNH pair is displaying wild gyrations as China’s National Bureau of Statistics (NBS) has reported upbeat official PMI data. The Official Manufacturing PMI has landed at 50.1, higher than the consensus of 49.7 and the prior release of 49.0. Also, the Non-Manufacturing PMI has soared to 54.4 from the projections of 51.0 and the prior release of 41.6. The scale of economic activities in the Chinese economy improved significantly in January despite the households being busy celebrating the Lunar New Year festival.
However, the major catalyst that will trigger a power-pack action in the Chinese Yuan will be the Caixin Manufacturing PMI data, which will release on Wednesday. The economic data might advance to 49.5 from the prior release of 49.0.
Firms in the Chinese economy are operating at maximum capacity as the administration has removed restrictions over the movement of men, materials, and machines. A Reuters poll showed that China's economic growth is likely to rebound to 4.9% in 2023, before steadying in 2024, as policymakers pledge to step up support for the COVID-ravaged economy. Also, the poll showed that the People’s Bank of China will cut Loan Prime Rate (LPR) by 5 basis points (bps) in the first quarter of CY2023.
Meanwhile, the risk-off impulse is regaining traction as the S&P500 futures have surrendered more than half gains generated in early Asia. The risk-perceived assets are likely to remain on the tenterhooks as the Federal Reserve (Fed) is set to hike interest rates further to achieve the 2% inflation target. Fed chair Jerome Powell is expected to announce a 25 basis point (bps) interest rate hike as the consumer spending and Producer Price Index (PPI) have significantly dropped in the United States economy.
The International Monetary Fund projects global growth to fall from 3.4% in 2022 to 2.9% in 2023, and then rise to 3.1% in 2024. Inflation is peaking amid low growth.
Key notes
Worldwide inflation would decline to 6.6% in 2023 and 4.3% in 2024, from 8.8% in 2022, due to reduced commodity prices and rate hikes decreasing demand.
Meanwhile, we have just seen some promising numbers court of the world's second-largest economy, China:
China's Non-Manufacturing and Manufacturing PMIs have been released as follows:
- Manufacturing 50.1 vs. expected 49.8 vs prior 47.
- Services 54.4 vs, expect 52.0 and prior 41.6
- Composite 52.9 vs. porior 42.6.
Market implications
The bulls will be cheering the sentiment, but much more will depend on this week's central bank meetings with the Federal Reserve, Bank of England and the European Central Bank deciding on interest rates followed by the governors speaking to the press. Corporate earnings are also due this week from the tech giants on Wall Street. Markets will also grapple with a host of US economic data, culminating in Friday's Nonfarm Payrolls report for January.
China's Non-Manufacturing and Manufacturing PMIs have been released as follows:
- Manufacturing 50.1 vs. expected 49.8 vs prior 47.
- Services 54.4 vs, expect 52.0 and prior 41.6
- Composite 52.9 vs. porior 42.6.
AUD/USD update
AUD/USD is still under pressure despite vast improvements.
As illustrated following the Aussie Retail Sales shocker, the Aussie was destined to test the 38.2% Fibonacci as follows:

It was suggested that data might just see the target reached as illustrated above. The analysis was drawn for the market open this week and has played out as a high-probability scenario considering the trapped volume as was explained in the following article: AUD/USD Price Analysis: Inside day Friday opens risk of a lower close on Monday, 0.7050 eyed.
About China NBS Manufacturing and Non-Manufacturing PMIs
China Federation of Logistics and Purchasing (CFLP) publishes the Non-Manufacturing and Manufacturing PMIs on a monthly basis. The gauges highlight the performance of China’s manufacturing and service sectors, which have a significant impact on the global FX market, given the size of the Chinese economy. An expansion in the Chinese sector's activities point to signs of economic improvement and vice-versa.
- NZD/USD fails to extend the week-start bearish bias, staying pressured around intraday low.
- China’s officials NBS Manufacturing PMI, Non-Manufacturing PMI arrived stronger in January.
- Markets sentiment remains divided ahead of the top-tier data in the West.
- US CB Consumer Confidence may entertain Kiwi pair traders ahead of the key FOMC.
NZD/USD probes the week-start losses, making rounds to 0.6465-70 by the press time, as upbeat activity data from China contrast with the previous bearish bias surrounding the Kiwi pair during early Tuesday.
That said, China’s NBS Manufacturing PMI rose to 50.1 versus 49.7 market forecasts and 47.0 prior whereas Non-Manufacturing PMI also came in upbeat with 54.4 figure compared to 51.0 expected and 41.6 previous readings.
It should be observed that the market’s cautious mood ahead of this week’s central bank announcements exerts downside pressure on the Kiwi pair. Not only the pre-data anxiety but mixed concerns surrounding China also probe the market sentiment and the NZD/USD pair traders.
On the other hand, upbeat Covid-linked headlines surrounding China and the US probe the quote’s bearish move. That said, news suggesting US President Joe Biden’s administration’s readiness to revoke the Covid-led emergencies from May 11 appeared to have favored the risk-on profile of late. On Monday, China’s Center for Disease Control and Prevention (CDC) said, reported by Reuters, “China's current wave of COVID-19 infections is nearing an end, and there was no significant rebound in cases during the Lunar New Year holiday.”
Amid these plays, the S&P 500 Futures print mild gains despite downbeat Wall Street performance whereas the US 10-year Treasury yields remain unchanged at around 3.55% after posting a three-day winning streak in the last.
Having reacted to China’s key activity data, the NZD/USD pair traders may pay close attention to the risk catalysts ahead of the fourth-quarter (Q4) US Employment Cost Index (ECI) and the Conference Board’s Consumer Confidence gauge for January for clear directions. It should be noted that the US Consumer sentiment gauge to improve but a likely softer print of the US ECI, to 1.1% from 1.2% could strengthen the dovish bias surrounding the Fed and probe the Kiwi pair bears. However, major attention will be given to Wednesday’s New Zealand Q4 employment data and the Federal Open Market Committee (FOMC) monetary policy meeting.
Technical analysis
Unless providing a daily closing beyond the three-week-old support line, currently around 0.6520, the NZD/USD price is likely declining towards the 21-DMA level of 0.6405.
- USD/CAD retreats from intraday high, consolidates the biggest daily gains in a fortnight.
- Covid-linked headlines put a floor under the Oil price after it dropped amid risk-aversion, fears of more supplies.
- Market sentiment remains divided ahead of the key data/events.
- Canada GDP for November, US CB Consumer Confidence can entertain traders ahead of FOMC.
USD/CAD runs out of ammunition to extend the previous day’s rebound amid sluggish markets on early Tuesday. In doing so, the Loonie pair justifies the pause in the Oil price downturn, as well as the halt in the risk-aversion wave, ahead of Canada’s monthly Gross Domestic Product (GDP) data.
That said, WTI crude oil pauses the two-day downtrend near $78.00 as hopes of an end to the Covid woes renew energy demand hopes. Earlier in the data, the news suggesting US President Joe Biden’s administration’s readiness to revoke the Covid-led emergencies appeared to have favored the sentiment of late. On Monday, China’s Center for Disease Control and Prevention (CDC) said, reported by Reuters, “China's current wave of COVID-19 infections is nearing an end, and there was no significant rebound in cases during the Lunar New Year holiday.”
Elsewhere, headlines from Chinese media signaling the state banks’ cheap loans to spur consumption in Beijing also underpin the cautious optimism.
However, the anxiety ahead of this week’s top-tier central bank events and the US jobs report, not to forget China’s return from one-week-long Lunar New year (LNY) holidays, seems to challenge the risk-on mood and keep the USD/CAD buyers hopeful.
Additionally, Monday’s upbeat prints of the US Dallas Fed manufacturing index for January, which jumped to -8.4 while adding 11.6 points and marking the highest reading since May 2022, also underpin the bullish bias surrounding the USD/CAD pair.
Against this backdrop, the S&P 500 Futures print mild gains despite downbeat Wall Street performance whereas the US 10-year Treasury yields remain unchanged at around 3.55% after posting a three-day winning streak in the last.
Looking forward, Canadian GDP for November, expected 0.0% versus 0.1% prior may offer immediate directions to the Loonie pair ahead of the fourth quarter (Q4) US Employment Cost Index (ECI) and the Conference Board’s Consumer Confidence gauge for January for clear directions. That said, forecasts suggest the US Consumer sentiment gauge to improve but a likely softer print of the US ECI, to 1.1% from 1.2% could strengthen the dovish bias surrounding the Fed and tease the USD/CAD bears.
Technical analysis
The monthly falling wedge bullish chart pattern, currently between 1.3410 and 1.3290, keeps the USD/CAD buyers hopeful.
In recent trade today, the People’s Bank of China (PBOC) set the yuan (CNY) at 6.7604 vs. the estimate at 6.7607 and the last close of 6.7522.
About the fix
China maintains strict control of the yuan’s rate on the mainland.
The onshore yuan (CNY) differs from the offshore one (CNH) in trading restrictions, this last one is not as tightly controlled.
Each morning, the People’s Bank of China (PBOC) sets a so-called daily midpoint fix, based on the yuan’s previous day's closing level and quotations taken from the inter-bank dealer.
- AUD/USD has witnessed a vertical sell-off on higher-than-anticipated de-growth in Australian Retail Sales.
- The RBA might continue to hike interest rates further as the Q4CY2022 CPI has refreshed multi-year highs at 7.8%.
- Volatility has escalated ahead of the interest rate policy by the Fed.
The AUD/USD pair has sensed immense selling pressure and has dropped to near 0.7030 as the Australian Bureau of Statistics has reported downbeat monthly Retail Sales data (Dec). The economic data has shown a de-growth of 3.9% vs. the expectations of -0.3% and the prior release of 1.4%.
Retail demand has been slowed down dramatically despite the Christmas season, which was expected to spur consumer spending after three consecutive pandemic-locked Christmases.
Despite a massive decline in retail demand, the Reserve Bank of Australia (RBA) might continue to hike interest rates further as the fourth quarter Consumer Price Index (CPI) has refreshed multi-year highs at 7.8%.
Going forward, the Australian Dollar will dance to the tunes of the Caixin Manufacturing PMI data, which will release on Wednesday. As per the projections, the manufacturing PMI will advance to 49.5 from the prior release of 49.0. The Chinese economy is operating at full capacity levels after dismantling the pandemic controls and therefore, a recovery in economic demand cannot be ruled out.
Meanwhile, Bloomberg reported that Bloomberg’s aggregate index of eight early indicators showed a slight uptick in Chinese economic activities in January, versus a contraction in December. Also, confidence among small businesses was better in January than in December, with real estate, transport, accommodation, and catering activity seeing a sharp rebound, according to Standard Chartered Plc.
It is worth noting that Australia is a leading trading partner of China and rising economic activities in the Chinese economy will support the Australian Dollar.
On the United States front, the US Dollar Index (DXY) is aiming to extend its upside journey after a minor pullback. Volatility has been spurted ahead of the interest rate decision by the Federal Reserve (Fed), which has trimmed the risk appetite of the market participants.
- AUD/NZD bears move in on the back of big Retail Sales miss.
- AUD/NZD Fibonacci scale is being run, but bulls are lurking.
AUD/NZD has been sent lower on the Retail Sales miss: Australia Retail Sales (MoM) Dec: -3.9% (est -0.2%; prev 1.4%).

AUD/NZD has been on the backside of the dominant bear trend that has been in play since the end of September but is on the backside of the correction of the trend as well. Nevertheless, there are prospects of a move higher according to the following daily charts:
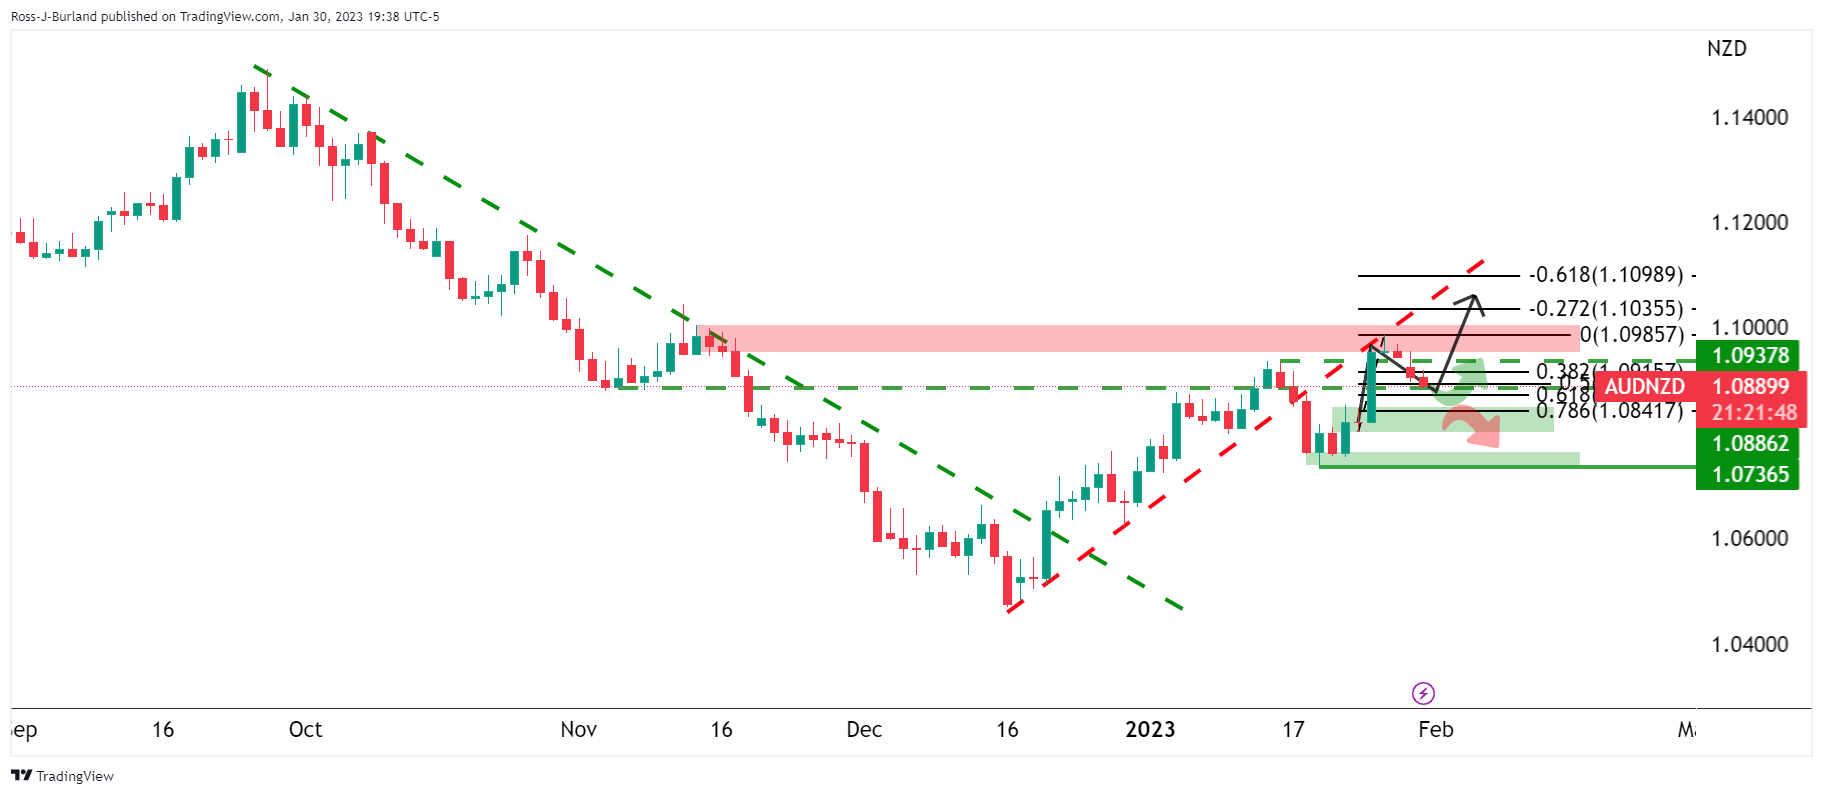
Zoomed in...

The upside is favourable with the tepid correction into the 50% mean reversion area but there is room to go should the bears fancy a crack at the 61.8% ratio or even lower to the prior resistance of the W-formation located near the 78.6% ratio.
- AUD/JPY remains pressured, renews intraday low after downbeat Aussie data, firmer Japan statistics.
- Australia Retail Sales came in -3.9% MoM in December versus 1.4% previous growth.
- Shift in sentiment, sluggish yields and firmer Japan data also weigh on AUD/JPY.
- Hawkish concerns over BoJ keep bears hopeful, risk catalysts eyed.
AUD/JPY remains pressured as Australia’s downbeat Retail Sales join mostly firmer Japan data and comparatively more hawkish concerns surrounding the Bank of Japan (BoJ) than the Reserve Bank of Australia (RBA). Following the data, the cross-currently pair refreshed intraday low to 91.74 while printing a three-day downtrend during early Tuesday, near 91.85 by the press time.
That said, Australia’s seasonally adjusted Retail Sales for December slumped with a contraction figure of 3.9% versus -0.3% number expected and 1.4% prior.
Earlier in the day, Japan’s Unemployment Rate remains unchanged near 2.5% in December but the Retail Trade rose past 0.5% in market forecasts to 1.1% during the stated month. On the same line, the Industrial Production also crossed -1.2% consensus with -0.1% figure for December.
It should be noted that the Covid-linked news from the US and China joins the market’s reassessment of the pre-data action to underpin the latest cautious optimism. Before a few hours, the news suggesting US President Joe Biden’s administration’s readiness to revoke the Covid-led emergencies from May 11 appeared to have favored the risk profile of late. On Monday, China’s Center for Disease Control and Prevention (CDC) said, reported by Reuters, “China's current wave of COVID-19 infections is nearing an end, and there was no significant rebound in cases during the Lunar New Year holiday.”
Elsewhere, the Japanese government panel’s suggestion to push the 2.0% inflation target to a broader timeframe triggered hopes of the BoJ’s hawkish move and probed AUD/JPY buyers the previous day. On the same line could be the comments from BoJ Governor Haruhiko Kuroda who signaled that the inflation target is achievable.
Against this backdrop, the S&P 500 Futures print mild gains despite downbeat Wall Street performance whereas the US 10-year Treasury yields remain unchanged at around 3.55% after posting a three-day winning streak in the last.
Moving on, China’s official NBS Manufacturing PMI and Non-Manufacturing PMI for January could offer immediate directions to the AUD/JPY pair but concerns surrounding BoJ
Technical analysis
The AUD/JPY pair’s bounce off the 200-day Exponential Moving Average (EMA), around 91.60 by the press time, hints at the cross-currency pair’s rebound.
The primary gauge of Australia’s consumer spending, Retail Sales, is released as follows:
Australia Retail Sales (MoM) Dec: -3.9% (est -0.2%; prev 1.4%).
AUD/USD update
AUD/USD has been trying to break to the 38.2% Fibonacci as follows:
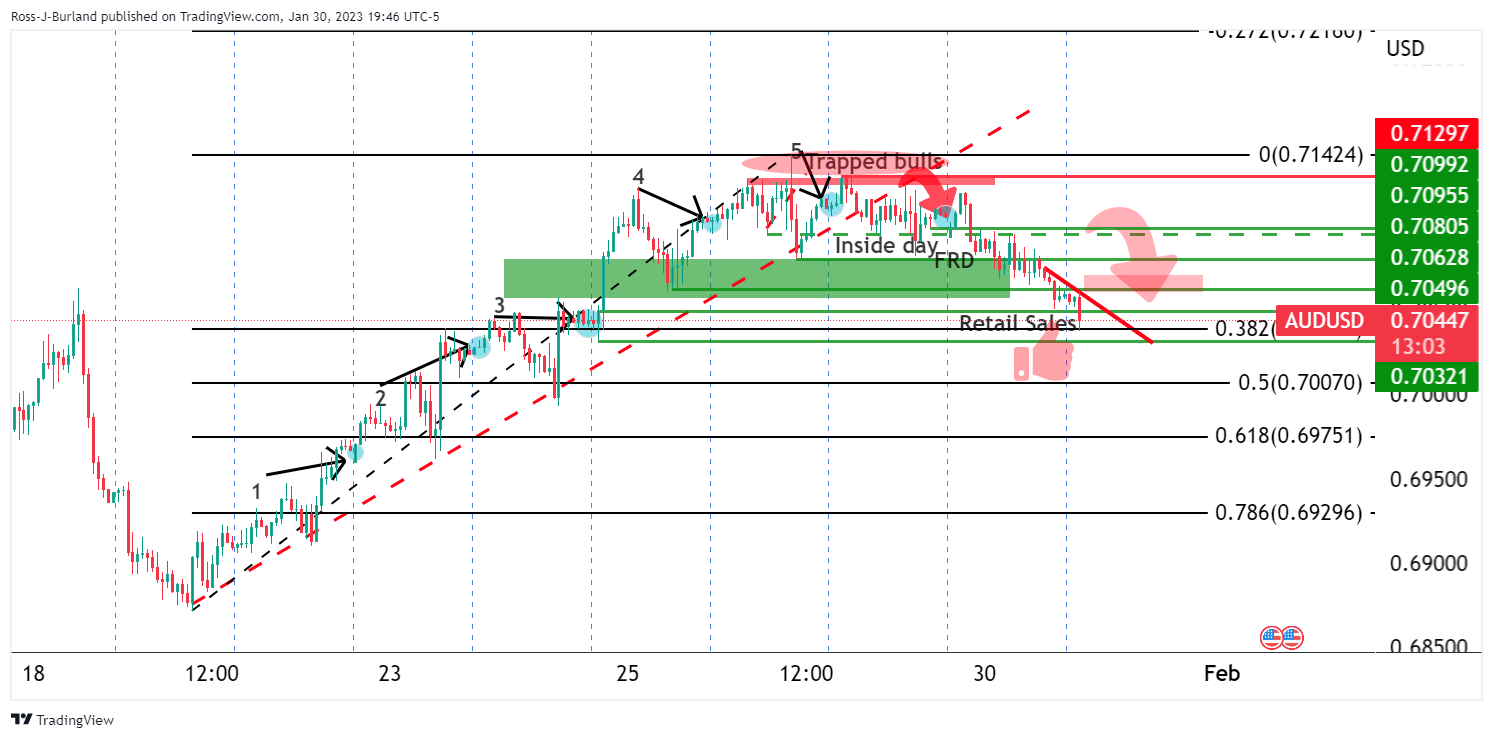
The data might just see the target reached as illustrated above. The analysis was drawn for the market open this week and has played out as a high-probability scenario considering the trapped volume as was explained in the following article: AUD/USD Price Analysis: Inside day Friday opens risk of a lower close on Monday, 0.7050 eyed
About Aussie Retail Sales
The data is released by the Australian Bureau of Statistics (ABS) about 35 days after the month ends. It accounts for approximately 80% of total retail turnover in the country and, therefore, has a significant bearing on inflation and GDP. This leading indicator has a direct correlation with inflation and the growth prospects, impacting the Reserve Bank of Australia’s (RBA) interest rates decision and AUD valuation. The stats bureau uses the forward factor method, ensuring that the seasonal factors are not distorted by COVID-19 impacts.
| Index | Change, points | Closed | Change, % |
|---|---|---|---|
| NIKKEI 225 | 50.84 | 27433.4 | 0.19 |
| Hang Seng | -619.17 | 22069.73 | -2.73 |
| KOSPI | -33.55 | 2450.47 | -1.35 |
| ASX 200 | -12.1 | 7481.7 | -0.16 |
| FTSE 100 | 19.67 | 7784.87 | 0.25 |
| DAX | -23.95 | 15126.08 | -0.16 |
| CAC 40 | -15.2 | 7082.01 | -0.21 |
| Dow Jones | -260.99 | 33717.09 | -0.77 |
| S&P 500 | -52.79 | 4017.77 | -1.3 |
| NASDAQ Composite | -227.9 | 11393.81 | -1.96 |
- EUR/USD picks up bids to pare three-day losing streak, bounces off one-week low with slower pace.
- Market’s cautious optimism seems to weigh on the US Dollar amid the inactive yields.
- Downbeat German GDP, challenges to sentiment raise doubts on the latest recovery.
- US CB Consumer Confidence for January, Q4 Employment Cost Index will also be important for fresh impulse.
EUR/USD licks its wounds near 1.0850 as traders reassess the previous bearish bias amid Tuesday’s sluggish mid-Asian session. In doing so, the major currency pair also takes clues from the market’s sigh of relief after a downbeat start to the key week.
It should be noted that the news suggesting US President Joe Biden’s administration’s readiness to revoke the Covid-led emergencies appeared to have favored the sentiment of late. On Monday, China’s Center for Disease Control and Prevention (CDC) said, reported by Reuters, “China's current wave of COVID-19 infections is nearing an end, and there was no significant rebound in cases during the Lunar New Year holiday.”
While portraying the mood, the S&P 500 Futures print mild gains despite downbeat Wall Street performance whereas the US 10-year Treasury yields remain unchanged at around 3.55% after posting a three-day winning streak in the last.
On Monday, the risk-off mood joined firmer Treasury bond yields to favor the US Dollar buyers. The sour sentiment could be linked to the anxiety ahead of this week’s top-tier data/events, as well as the mixed headlines over China’s capacity to justify the latest optimism. Adding strength to the risk-off mood could be the cautious risk profile before the equity heavyweights like Amazon, Alphabet, Apple and Metal release their quarterly earnings.
Elsewhere, downbeat prints o German data also weighed on the EUR/USD prices. The Economic Sentiment Indicator in the Euro area improved to 99.9 in January from an upwardly revised 97.1 prior and 97.0 market forecasts. The Consumer Confidence, however, matched 20.9 market forecast and previous readings during the stated month. That said, the Industrial Confidence and Services Sentiment also improved during January.
On the other hand, the preliminary readings of Germany’s fourth quarter (Q4) Gross Domestic Product (GDP) came in softer than 0.0% expected and 0.4% prior to -0.2% QoQ. "After the German economy managed to perform well despite difficult conditions in the first three quarters, economic performance slightly decreased in the fourth quarter of 2022", Destatis noted in its publication. The same raises fears of downbeat Eurozone GDP and a sustained EUR/USD pullback.
In addition to the Eurozone Q4 GDP, expected 0.0% QoQ versus 0.3%, the Q4 US Employment Cost Index (ECI) and the Conference Board’s Consumer Confidence gauge for January will also be crucial for the pair traders to watch for fresh impulses.
Technical analysis
Despite the latest corrective bounce, a clear upside break of the support-turned-resistance line from January 10, close to 1.0860 at the latest, becomes necessary to recall EUR/USD buyers.
- Gold price is expected to continue its downside journey toward $1,920.00 amid a solid USD Index.
- The Fed is expected to announce a smaller interest rate hike as US inflation is in a downtrend.
- The US labor market has remained extremely tight in CY2022 but the continuation of rate hikes is denting producers’ optimism.
Gold price (XAU/USD) is scaling downside towards the immediate support of $1,920.00 in the Asian session. The precious metal has been displaying a topsy-turvy move amid rising traction for the US Dollar Index (DXY) ahead of the interest rate decision by the Federal Reserve (Fed), which is scheduled for Wednesday. The Gold price is auctioning in a $1,922-1,933 range and is expected to remain on tenterhooks ahead.
S&P500 futures have added some gains after a sheer sell-off on Monday, portraying that optimism is stemming as the Fed is expected to slow down the pace of hiking interest rates. The USD Index is looking to extend its breakout above the 101.80 resistance to near 102.00 amid overall pessimism in the market. Also, the risk-aversion theme underpinned by the market participants is supporting the 10-year US Treasury yields, which have shifted above 3.54%.
In addition to the Fed’s interest rate policy, the release of the United States Automatic Data Processing (ADP) Employment data will keep volatility at its peak. According to the estimates, the economic data is seen at 170K, lower than the former release of 235K.
The US labor market has remained extremely tight in CY2022 but the continuation of interest rate hikes by Fed chair Jerome Powell is denting the expression of optimism in producers. Firms are aiming to optimally use their current labor force to handle operations and have paused the recruitment process due to the dismal economic outlook.
Gold technical analysis
Gold price has formed a Head and Shoulder chart pattern on an hourly scale, which indicates a prolonged consolidation. The precious metal might demonstrate a bearish reversal after a breakdown below the neckline plotted from January 24 low at $1,917.20.
A bear cross, represented by the 20-and 50-period Exponential Moving Average (EMAs), adds to the downside filters.
The Relative Strength Index (RSI) (14) has yet not surrendered the 40.00-60.00 range. A breakdown into the 20.00-40.00 range will trigger the downside momentum.
Gold hourly chart
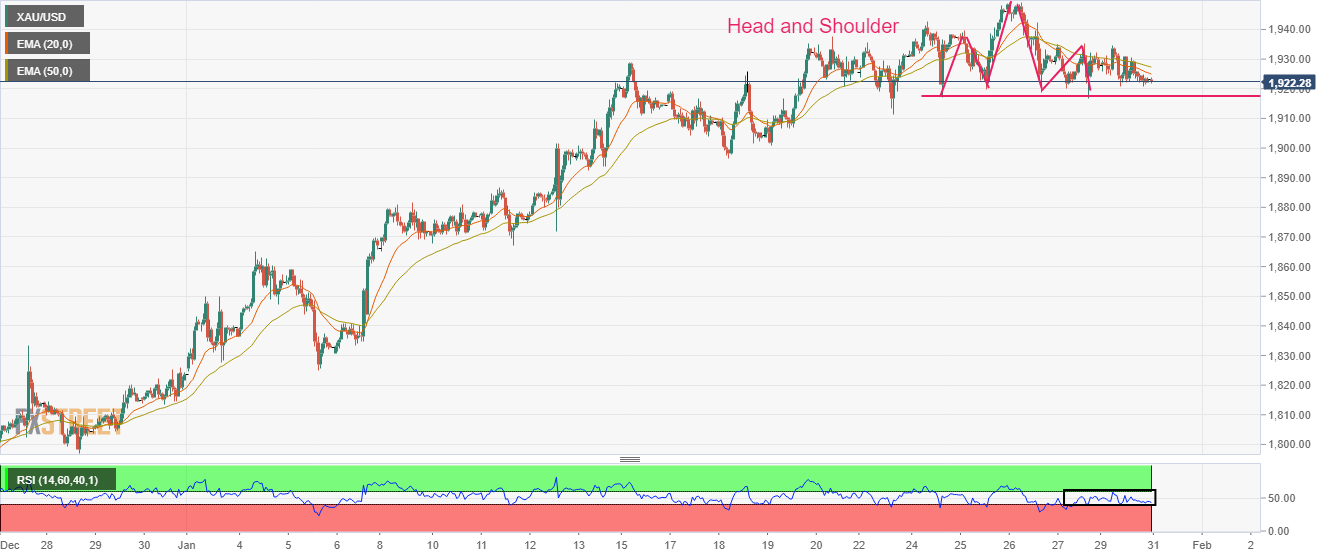
| Pare | Closed | Change, % |
|---|---|---|
| AUDUSD | 0.70602 | -0.54 |
| EURJPY | 141.535 | 0.51 |
| EURUSD | 1.08509 | -0.09 |
| GBPJPY | 161.1 | 0.34 |
| GBPUSD | 1.23512 | -0.3 |
| NZDUSD | 0.64694 | -0.2 |
| USDCAD | 1.33868 | 0.57 |
| USDCHF | 0.92496 | 0.54 |
| USDJPY | 130.435 | 0.62 |
- USD/JPY struggles to extend week-start rebound amid strong statistics from Tokyo.
- Japan’s Unemployment Rate remains unchanged but Industrial Production, Retail Trade cross market forecasts in December.
- Mixed sentiment, hawkish concerns surrounding BoJ keeps Yen pair sellers hopeful.
- US CB Consumer Confidence, risk catalysts will be crucial ahead of the FOMC.
USD/JPY grinds higher around 130.50 as strong Japanese statistics renew the market’s concerns surrounding the Bank of Japan’s (BoJ) hawkish move during early Tuesday. In doing so, the Yen pair also probes the week-start run-up amid the sour sentiment ahead of the top-tier data/events.
Japan’s Unemployment Rate remains unchanged near 2.5% in December but the Retail Trade rose past 0.5% in market forecasts to 1.1% during the stated month. On the same line, the Industrial Production also crossed -1.2% consensus with -0.1% figure for December.
It should be noted that the market’s cautious mood ahead of this week’s Federal Open Market Committee (FOMC) and the US monthly jobs report triggered the rush toward the US Dollar the previous day, especially amid the firmer US Treasury bond yields. In doing so, the Yen pair ignored chatters surrounding the BoJ’s likely pushback to the 2.0% inflation commitment.
That said, the US 10-year Treasury bond yields rose 2.4 basis points (bps) to 3.542% while rising for the third consecutive day, mostly unchanged by the press time. As dovish bets on the Federal Reserve (Fed) take a halt even if the hawks are far from the entry.
Behind the moves could be the stronger prints of the US Dallas Fed manufacturing index for January which jumped to -8.4 while adding 11.6 points and marking the highest reading since May 2022.
Additionally, China’s inability to spread optimism after returning from the one-week-old Lunar New Year holiday, even with hopes of witnessing an end to the Covid wave, also favored the USD/JPY buyers.
It should be noted that the cautious risk profile before the equity heavyweights like Amazon, Alphabet, Apple and Metal release their quarterly earnings, also underpinned the USD/JPY run-up the previous day.
Alternatively, a government panel suggested the push to the 2.0% inflation target to a broader timeframe and triggered hopes of the BoJ’s hawkish move. On the same line could be the comments from BoJ Governor Haruhiko Kuroda who signaled that the inflation target is achievable.
Looking forward, USD/JPY may remain sidelined amid the dicey markets. However, the fourth quarter (Q4) US Employment Cost Index (ECI) and the Conference Board’s Consumer Confidence gauge for January will be crucial for the pair traders to watch for fresh impulses.
Technical analysis
A daily closing beyond the 21-DMA level surrounding 130.35, the first early November 2021, keeps USD/JPY buyers hopeful.


© 2000-2026. Bản quyền Teletrade.
Trang web này được quản lý bởi Teletrade D.J. LLC 2351 LLC 2022 (Euro House, Richmond Hill Road, Kingstown, VC0100, St. Vincent and the Grenadines).
Thông tin trên trang web không phải là cơ sở để đưa ra quyết định đầu tư và chỉ được cung cấp cho mục đích làm quen.
Giao dịch trên thị trường tài chính (đặc biệt là giao dịch sử dụng các công cụ biên) mở ra những cơ hội lớn và tạo điều kiện cho các nhà đầu tư sẵn sàng mạo hiểm để thu lợi nhuận, tuy nhiên nó mang trong mình nguy cơ rủi ro khá cao. Chính vì vậy trước khi tiến hành giao dịch cần phải xem xét mọi mặt vấn đề chấp nhận tiến hành giao dịch cụ thể xét theo quan điểm của nguồn lực tài chính sẵn có và mức độ am hiểu thị trường tài chính.
Sử dụng thông tin: sử dụng toàn bộ hay riêng biệt các dữ liệu trên trang web của công ty TeleTrade như một nguồn cung cấp thông tin nhất định. Việc sử dụng tư liệu từ trang web cần kèm theo liên kết đến trang teletrade.vn. Việc tự động thu thập số liệu cũng như thông tin từ trang web TeleTrade đều không được phép.
Xin vui lòng liên hệ với pr@teletrade.global nếu có câu hỏi.
ngân hàng