- Phân tích
- Tin tức và các công cụ
- Tin tức thị trường
Tin tức thì trường
Retail Sales Overview
Early Tuesday, the market sees preliminary readings of Australia's seasonally adjusted Retail Sales for December month at 00:30 GMT. Market consensus suggests a softer seasonally adjusted MoM print of -0.3% versus 1.4% prior, suggesting the lack of sustained improvement in economic activity.
Given the recently stronger Aussie inflation data and the previously downbeat comments from the Reserve Bank of Australia's (RBA) cautious mood, not to forget the challenges to sentiment ahead of this week’s key data/events, today’s Aussie Retail Sales appear crucial for the AUD/USD traders.
It should be noted that China’s official NBS Manufacturing PMI and Non-Manufacturing PMI, up for publishing around 01:00 AM GMT, also increases the importance of the Asia-Pacific economic calendar on Tuesday. Forecasts suggest that the former is likely to remain below 50, close to 49.7, despite improving from 47.0 prior while the latter could regain above 50 level of 51.0 after slumping to 41.6 the previous month. It should be noted that the above 50 prints describe the activity increase while the below 50 numbers hint at a contraction in the activities.
Ahead of the data, Westpac said,
After a strong 1.4% gain in November, Australia nominal retail sales are expected to post a modest decline in December as interest rate pressures continue to build (Westpac f/c: -0.3%mth, median forecast -0.2%). Meanwhile, the gradual slowdown in private credit growth should continue to crystalise in December (Westpac f/c: 0.5%).
How could it affect AUD/USD?
AUD/USD remains pressured around 0.7050 after beginning the week’s trading with a downside gap. Although the Covid updates from China and the US have recently been trying to stop the Aussie pair bears, the market’s fears ahead of the top-tier US data and events, as well as China’s official activity numbers, exert downside pressure on the Aussie pair as of late.
That said, the likely easy economics from Australia and China may add losses to the AUD/USD prices amid recently sluggish sentiment and doubts over the RBA’s next move, despite firmer inflation data. It’s worth noting, however, that a strong print will join the upbeat Aussie Consumer Price Index (CPI) figures and could enable the Aussie pair to better position for this week’s volatile session.
Technically, a one-month-old bullish channel restricts AUD/USD pair’s downside near the 0.7000 round figure.
Key Notes
AUD/USD Forecast: Aussie weakens ahead of first-tier Asian figures
AUD/USD finds intermediate support around 0.7050, risk-off mood still intact
About Australian Retail Sales
The Retail Sales released by the Australian Bureau of Statistics is a survey of goods sold by retailers based on a sampling of retail stores of different types and sizes and it's considered an indicator of the pace of the Australian economy. It shows the performance of the retail sector over the short and mid-term. Positive economic growth anticipates bullish trends for the AUD, while a low reading is seen as negative or bearish.
- Oil price has shifted its business below $78.00 as western central banks stare a fresh rate hike.
- The continuation of hawkish monetary policy by the central banks might advance global recession fears.
- China’s Caixin Manufacturing PMI might remain upbeat as the economy is now operating at full capacity levels.
West Texas Intermediate (WTI), futures on NYMEX, have shifted their auction below the crucial support of $78.00 in the early Asian session. On Monday, the oil price extends its losses after failing to hold the psychological resistance of $80.00. Rising fears of a global recession as western central banks are expected to hike their interest rates further have weakened oil demand projections dramatically.
Various developed economies have been demonstrating contraction in the scale of economic activities as western central banks are on a mission to tame soaring inflation in achieving price stability.
Starting from the mighty Federal Reserve (Fed) which is expected to hike interest rates by 25 basis points (bps) to the 4.50-4.75% range to the European Central Bank (ECB), which is worried about rising wages is likely to push interest rates by 50 bps to 2.50%. And, last, the Bank of England (BoE) which is struggling to ease the double-digit inflation figure in the United Kingdom economy might follow the footprints of the ECB ahead and will accelerate global recession fears after continuing their interest rates hiking sage of CY2022 this year.
Apart from that, investors will also look toward the release of the Caixin Manufacturing PMI data, which is scheduled for Wednesday. The economic data is expected to expand to 49.5 from the former release of 49.0 as the Chinese economy is open for operating at full capacity after remaining locked due to pandemic controls. It is worth noting that China is the largest importer of oil and accelerating manufacturing activities in that region might express optimism for the oil price.
On the supply front, oil flows from Russia are advancing despite sanctions from the western cartel after its invasion of Ukraine. Earlier, the oil price was rising on expectations that Russia might not be ready in delivering oil at deeply discounted prices. However, Moscow’s oil outflows have risen, which has trimmed supply worries firmly.
- The Nasdaq 100, the S&P 500, and the Dow Jones registered losses between 0.77% and 2% due to a risk-off impulse that bolstered the US Dollar.
- Last week’s US economic data supported some Fed officials’ calls for lifting rates by 25 bps on Wednesday.
- A busy US economic calendar will feature Fed’s decision, PMIs, and the Nonfarm Payrolls report.
The US Dollar Index (DXY), a measure of the greenback’s value against a basket of six currencies, continues to recover and prints gains for three straight days, finishing Monday’s session with gains of 0.30% amidst risk aversion. At the time of writing, the DXY exchanges hand at 102.224.
US Dollar appreciates the courtesy of risk-off impulse
Wall Street finished with hefty losses, led by the Nasdaq 100, tumbling almost 2%. The S&P 500 and the Dow Jones slashed 1.30% and 0.77% of their value as traders prepared for the US Federal Reserve Open Market Committee (FOMC) decision on Wednesday. Hence, a busy US economic calendar was one of the main reasons for the US Dollar (USD) to appreciate against most G8 currencies.
Data from the previous week, dominated by the Q4 Advanced GDP release, indicated a robust economy with a growth rate of 2.9%, exceeding predictions of 2.6% QoQ. Nevertheless, the pace was slower than the previous quarter’s 3.2%, as confirmed by the US Department of Commerce. Also, the release of the US Core Personal Consumption Expenditures (PCE), the Federal Reserve’s preferred measure of inflation, came within expectations and below November’s 4.7% YoY data, indicating inflation has declined for four consecutive months. Therefore, some Fed officials advocated for a slower pace of interest rate increases but stressed that no reductions are anticipated for 2023.
Reflection of the aforementioned is US Treasury bond yields, precisely the US 10-year benchmark note rate, finished Monday with gains of three and a half basis points (bps). Up at 3.542%, underpinned the greenback.
In the meantime, the CME FedWatcth Tool, odds for a 25 bps rate hike by the Fed stand at 97.6%, above last Friday’s 99% chances, though it’s priced in by the markets.
What to watch?
Ahead of the week, the US economic calendar will feature the Conference Board (CB) Consumer Confidence, alongside the S&P Global and ISM Manufacturing PMI readings for January, ahead of the Fed’s decision on Wednesday. On Thursday, Initial Jobless Claims and the ADP report, and the US Nonfarm Payrolls report on Friday.
US Dollar Index Key Technical Levels
- Silver price remains pressured despite softer start of the key week.
- Failure to keep the bounce off 50-DMA, bearish MACD signals underpin downside bias.
- Monthly resistance line appears crucial for buyer’s entry.
Silver price (XAG/USD) holds lower ground near $23.60 as it fades the previous day’s attempt to recover during early Tuesday.
That said, the bright metal refreshed the monthly low the last week but bounced off $22.76. The recovery moves, however, failed to cross a downward-sloping resistance line from January 03, close to $24.30 by the press time, which in turn keeps the bears hopeful.
Not only does the XAG/USD retreat from the key resistance line but bearish MACD signals also favor the sellers.
As a result, the quote is likely to market another attempt at breaking the 50-DMA support, close to $23.30 at the latest.
Even so, upward-sloping support lines from November 03 and 21, respectively near $23.20 and $23.05, as well as the $23.00 round figure, will challenge the bright Silver bears afterward.
If at all the XAG/USD price remains weak past $23.00, the odds of witnessing a fresh monthly low, currently around $22.75, can’t be ruled out.
On the flip side, the $24.00 round figure may entertain the Silver buyers ahead of directing them to the aforementioned monthly resistance line, close to $24.30 by the press time.
Also acting as the short-term key hurdle is the monthly high near $24.50, a break of which could quickly propel Silver price towards the $25.00 threshold and then to the April 2022 peak surrounding $26.25.
Silver price: Daily chart
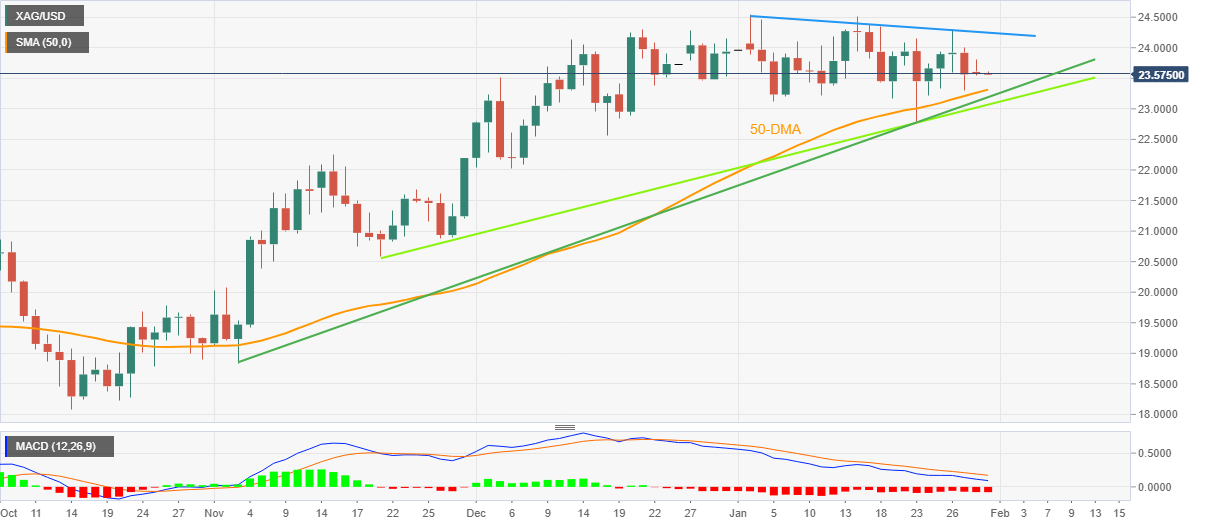
Trend: Further weakness expected
- AUD/JPY has slipped sharply below 92.00 as the focus has shifted to Australian Retail Sales data.
- Australian monthly Retail Sales data might show resilience due to revenge buying after three straight Covid Christmases.
- In addition to higher Australian CPI (Q4CY2022), higher Retail Sales might bolster the odds of a hawkish RBA policy.
The AUD/JPY pair has corrected firmly below the crucial support of 92.00 in the early Asian session. The risk barometer witnessed a steep fall after failing to extend recovery above 92.30. Considering the downside traction in the AUD/USD pair, AUD/JPY is following the footprint and is demonstrating a risk-off mood.
The cross is expected to meet sheer volatility ahead as the Australian Bureau of Statistics will report monthly Retail Sales (Dec) data. Global Strategy Team at TD Securities (TDS) sounds optimistic and expects Australian Retail Sales to rise by 0.5% in December. A note from TD Securities indicates that the Australian economy will continue November’s outperformance as three straight COVID Christmases have forced individuals to revenge buying.
An incline in consumer spending might create more troubles for the Reserve Bank of Australia (RBA) policymakers. The recent surge in fourth-quarter Consumer Price Index (CPI) figures in Australia is already compelling RBA Governor Philip Lowe to continue hiking interest rates further. And, now higher consumer spending might force the RBA to sound more hawkish than casual.
On the Japanese Yen front, investors are keeping an eye on the release of the employment data. The Job/Applicant ratio is expected to escalate to 1.36 from the prior release of 1.35. While the Unemployment Rate is seen unchanged at 2.5%. Apart from that, Retail Trade data is in focus. The annual Retail Trade (Dec) is seen higher at 3.0% vs. the prior release of 2.6%.
Early Tuesday morning in Asia, an Associated Press (AP) reporter quotes the White House statement suggesting that US President Joe Biden will end COVID-19 emergency declarations in the United States on May 11.
The news also mentions US President Biden’s pledge to use the veto if congress passes a bill to eliminate Covid vaccine mandate on healthcare providers working on certain federal programs.
On the previous day, China’s Center for Disease Control and Prevention (CDC) said, reported by Reuters, “China's current wave of COVID-19 infections is nearing an end, and there was no significant rebound in cases during the Lunar New Year holiday.”
Also read: China CDC: Current wave of COVID infections nearing an end
AUD/USD remains pressured
Despite the upbeat news, the risk-barometer AUD/USD pair remains depressed around 0.7050, down for the third consecutive day, as traders await Aussie Retail Sales for December and China’s official activity data for January.
Also read: AUD/USD finds intermediate support around 0.7050, risk-off mood still intact
- NZD/USD bears take a breather ahead of data from the key customer.
- China’s official PMIs seem crucial to defend the early 2023 optimism.
- Mixed New Zealand trade numbers joined risk-off mood to welcome bears the previous day.
- Federal Reserve’s monetary policy meeting will be most important, NZ employment eyed as well.
NZD/USD holds its place on the bear’s radar, after confirming the seat on the previous day, as the Kiwi pair traders remain cautious ahead of the key data/events. That said, the quote seesaws near 0.6470 following the downbeat start to the crucial week comprising the US Federal Reserve’s (Fed) monetary policy meeting, as well as New Zealand’s (NZ) quarterly employment data. It should be noted that China’s officials NBS Manufacturing PMI and Non-Manufacturing PMI could offer immediate directions to the pair traders.
The major currency pair failed to cheer the return of Chinese traders after a one-week-long Lunar New Year (LNY) holiday as market sentiment worsened ahead of the top-tier data/events. Adding strength to the risk-off mood could be the cautious risk profile before the equity heavyweights like Amazon, Alphabet, Apple and Metal release their quarterly earnings. It should be noted that mixed NZ trade numbers also offered a reason for the Kiwi pair traders to probe the previous three-week uptrend.
On Monday, New Zealand’s headline Trade Balance improved to $-475M MoM for December versus $-2,108M prior while the yearly figure rose to $-14.46B compared to $-14.98B previous readings. Further details suggest that the Imports eased to $7.19B compared to $8.52B whereas the Exports increased to $6.72B for December compared to $6.34B prior.
That said, the US 10-year Treasury bond yields rose 2.4 basis points (bps) to 3.542% while Wall Street benchmarks closed in the red as market players rushed to risk safety ahead of the key front-line catalyst. Also challenging the sentiment could be the mixed headlines over China’s capacity to justify the latest optimism surrounding the world’s biggest commodity user even if it signals upbeat holiday spending and nearness to the current Covid wave.
Given the mixed mood and a light calendar at home, the NZD/USD price may remain depressed ahead of China’s NBS Manufacturing PMI and Non-Manufacturing PMIs for January. Forecasts suggest that the former is likely to remain below 50, close to 49.7, despite improving from 47.0 prior while the latter could regain above 50 level of 51.0 after slumping to 41.6 the previous month. It should be noted that the above 50 prints describe the activity increase while the below 50 numbers hint at a contraction in the activities. Other than the China PMI, Australia’s Retail Sales for December could also entertain NZD/USD traders ahead of the US Conference Board Consumer Confidence gauge for January. Also important will be the fourth quarter (Q4) Employment Cost Index (ECI).
Technical analysis
A sustained daily closing below the three-week-old support line, now resistance around 0.6520, directs NZD/USD price towards the 21-DMA level of .6405.
- USD/CAD is testing the strength of the breakout above the downward-sloping trendline from 1.3520.
- Investors have underpinned the risk aversion theme ahead of the Fed’s monetary policy.
- A bullish range shift by the RSI (14) indicates that the upside momentum is active.
The USD/CAD pair has turned sideways after a juggernaut rally near 1.3400 in the early Asian session. A sheer drop in investors’ risk appetite amid rising volatility ahead of the interest rate decision by the Federal Reserve (Fed) strengthened the US Dollar.
The US Dollar Index (DXY) has delivered a confident breakout above the crucial resistance of 101.80 amid the risk-aversion theme. Also, the 10-year US Treasury yields moved above 3.54% on expectations of a further hike in the interest rates.
USD/CAD delivered a stalwart rally after forming a volatility divergence on an hourly chart. The Loonie asset tested January 26 low at 1.3300 with less volatility on January 27 as the asset remained inside the Bollinger Bands. After demonstrating signs of a bullish reversal, the major rode the rally with the upper Bollinger Band to near 1.3390.
The US Dollar has pushed the asset above the downward-sloping trendline plotted from January 19 high at 1.3520 and is now testing the waters before resuming the upside trend.
Meanwhile, the Relative Strength Index (RSI) (14) has shifted into the bullish range of 60.00-80.00, which indicates that the upside momentum is active.
Should the asset break above January 26 high at 1.3408, US Dollar bulls will drive the asset toward January 19 low at 1.3446 followed by January 19 high at 1.3521.
On the contrary, a break below January 30 low at 1.3300 will drag the Loonie asset toward a fresh 10-week low around 1.3226. A slippage below the latter will further drag the asset toward Septermber 1 high around 1.3300.
USD/CAD hourly chart
-638107152567638820.png)
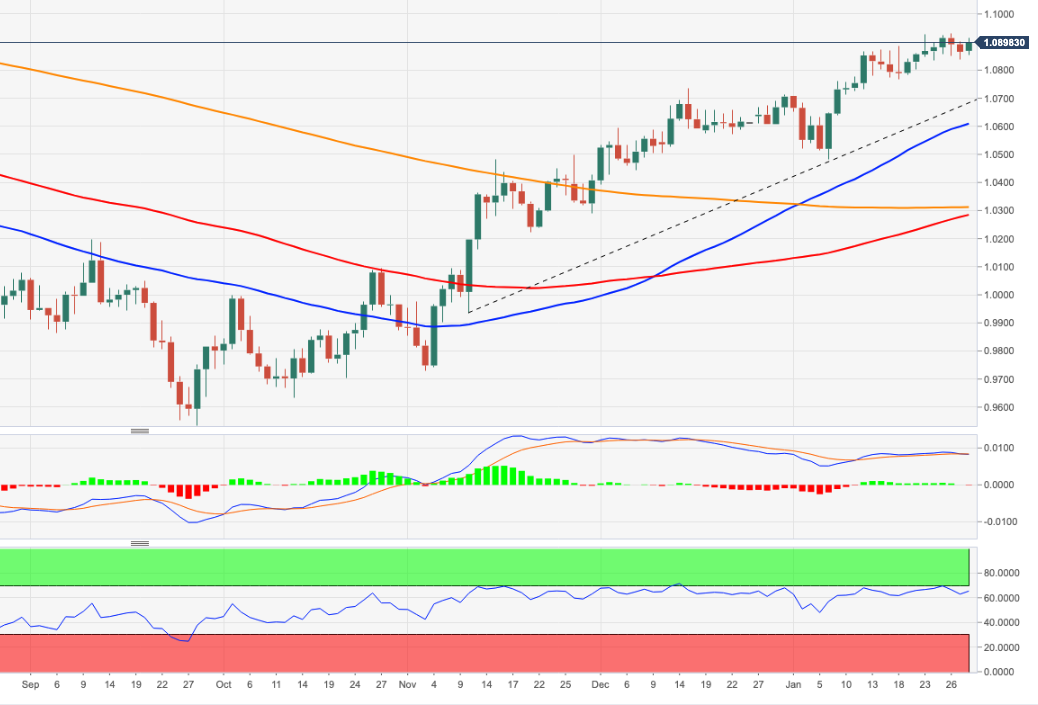
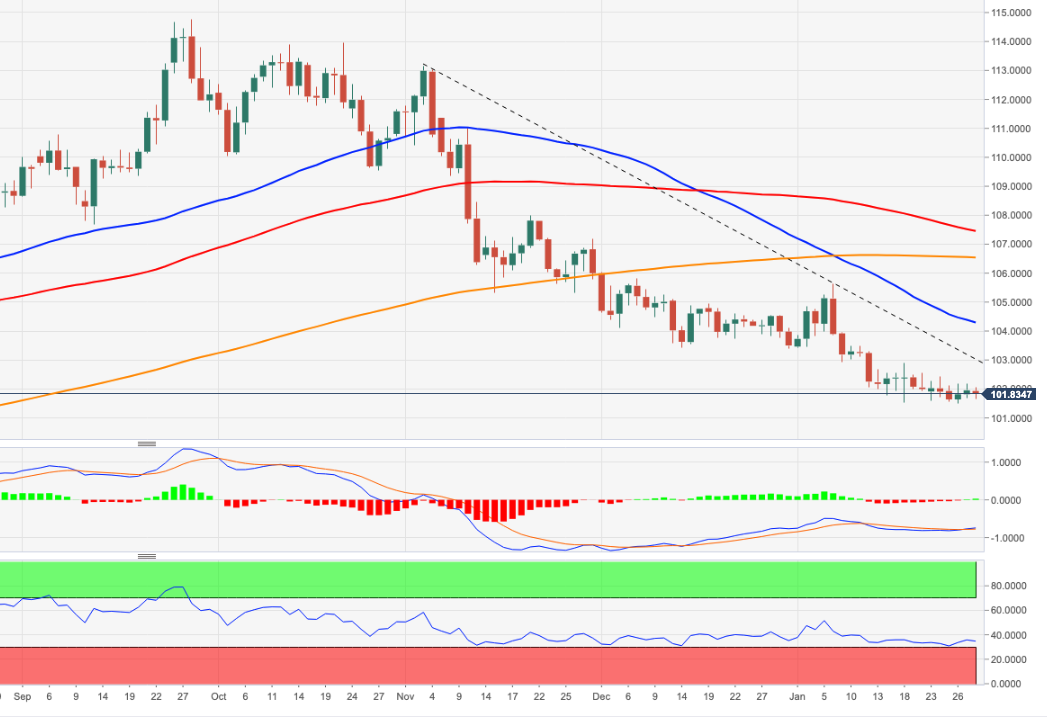
- EUR/USD remains pressured after breaking short-term key support.
- Bearish MACD signals, downbeat RSI adds strength to the downside bias targeting 100-SMA.
- Double tops around 1.0930 also favor sellers to keep the reins.
EUR/USD seesaws around 1.0850 as bears take a breather after breaking important support. With this, the major currency pair confirms its place on the seller’s radar even if it probes the three-day downtrend with its latest inaction.
Not only the trend line breakdown but the bearish MACD signals and the downbeat RSI (14), not oversold, also keep the EUR/USD sellers hopeful. On the same line could be the double-top bearish formation marked around 1.0930.
As a result, the quote’s further downside towards the 100-bar Simple Moving Average (SMA), close to 1.0825 by the press time, appears imminent.
However, the 200-SMA and January 10 low, respectively near 1.0720 and 1.0710, could challenge the EUR/USD bears afterward.
In a case where the EUR/USD pair remains bearish past 1.0710, its slump toward the monthly low near 1.0480 can’t be ruled out.
Alternatively, recovery moves must cross the support-turned-resistance line from January 10, close to 1.0860 at the latest, to tease EUR/USD buyers.
Even so, the aforementioned double tops near 1.0930 will be a tough nut to crack for the pair bulls, a break of which could quickly propel the price towards the 1.1000 round figure.
Should the EUR/USD pair remains firmer past 1.1000, its rally toward January 2022 low near 1.1120 can’t be ruled out.
EUR/USD: Four-hour chart
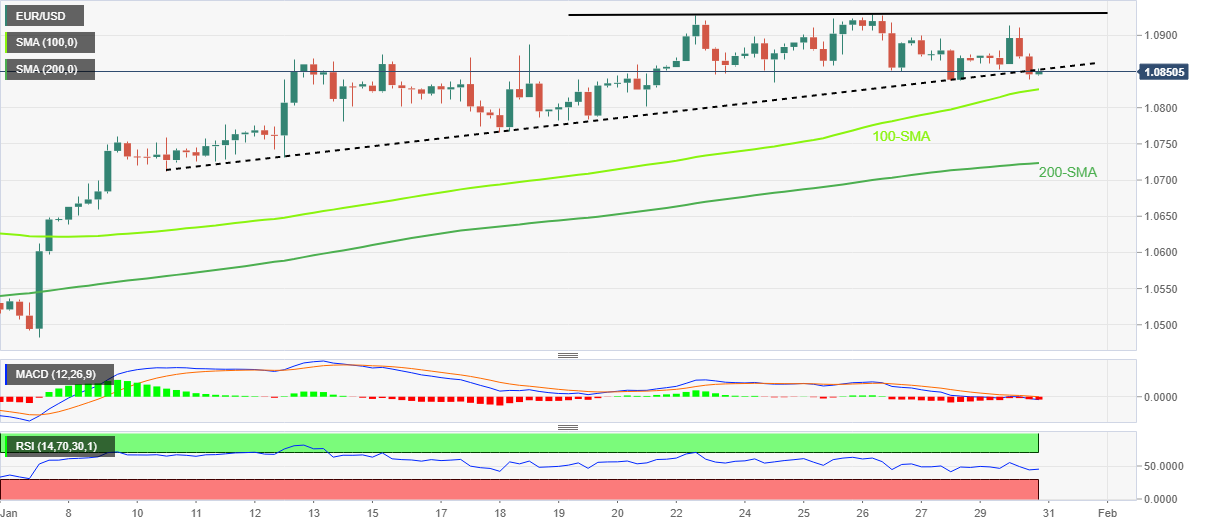
Trend: Further downside expected
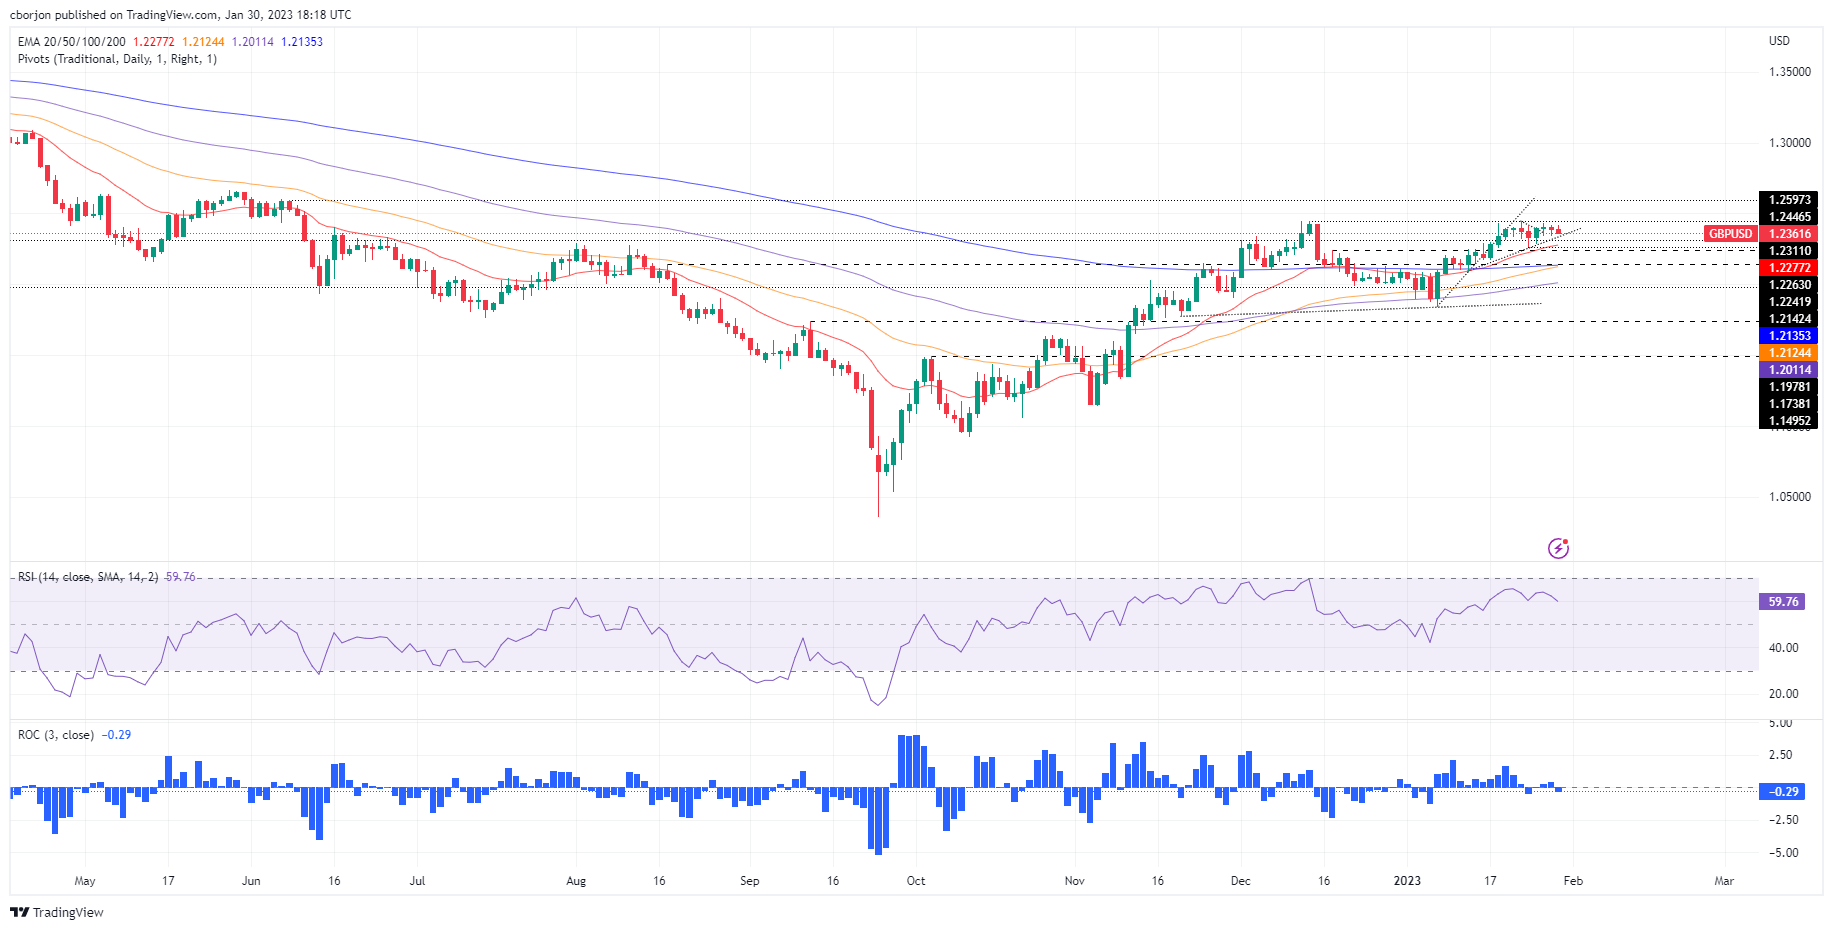
- GBP/USD began the key week on a back foot, stays pressured of late.
- Market sentiment dwindles amid trader’s anxiety ahead of top-tier data/events.
- Mixed concerns surrounding UK’s tax cuts, workers’ strikes keep bears hopeful even as BoE hawks flex muscles.
- No major from Britain but US CB Consumer Confidence, Employment Cost Index may gain attention.
GBP/USD holds lower grounds after a two-day downtrend, making rounds to 1.2350 during early Tuesday morning in Asia. In doing so, the Cable pair takes clues from the broad US Dollar rebound as the market mood sours ahead of the key data/events. Adding strength to the quote’s from the key 1.2450 hurdle could be the economic problems and challenges for the UK policymakers.
At home, UK Treasury Secretary Jeremy Hunt’s indecision over the tax cuts and the economic complications due to the workers’ strikes weigh on the GBP/USD prices. Even so, the policymakers propose the fight to tame inflation as a cure to overcome the workers’ halting of workers and generate problems surrounding the same, including higher inflation and low productivity.
On the other hand, the US Dallas Fed manufacturing index for January jumped to -8.4 while adding 11.6 points and marking the highest reading since May 2022.
Not only the downbeat US data but firmer US Treasury bond yields and softer equities also weighed on the GBP/USD prices. That said, the US 10-year Treasury bond yields rose 2.4 basis points (bps) to 3.542% while Wall Street benchmarks closed in the red.
It’s worth noting that China’s return from a week-long Lunar New Year (LNY) holiday also couldn’t impress markets as traders received mixed signals surrounding the dragon nation’s economic transition during the holiday period, which in turn weighed on the risk appetite and the GBP/USD prices.
Having witnessed a sluggish start to the key week, mostly favoring the GBP/USD bears, the pair traders will pay attention to today’s US Conference Board Consumer Confidence gauge for January. Also important will be the fourth quarter (Q4) Employment Cost Index (ECI). That said, the Cable pair may witness a comparatively more active day than the previous one but a cautious mood can keep challenging the traders ahead of the monetary policy meeting of the US Federal Reserve (Fed) and the Bank of England.
Technical analysis
The GBP/USD pair’s failure to cross the 1.2450 hurdle joins the clear downside break of the three-week-old ascending trend line, around 1.2370 by the press time, to direct the Cable bears towards the 21-DMA support near 1.2250.
- AUD/USD has found an intermediate cushion around 0.7050, however, more downside is on cards.
- Investors have turned risk-averse ahead of the release of the interest rate policy by the Fed.
- A decline in monthly Australian Retail Sales might ease some troubles for the RBA.
The AUD/USD pair has managed to gauge an intermediate cushion around 0.7050 in the early Asian session. The Aussie asset has witnessed immense selling pressure and is showing a less-confident pullback move, however, the downside is still favored as the risk profile is still negative. Federal Reserve (Fed)’s monetary policy-inspired volatility has forced investors to dump risk-perceived assets vigorously.
S&P500 tumbled on Monday as investors are worried that further interest rate hikes by Fed chair Jerome Powell will escalate recession fears. Consumer spending will get trimmed, employment opportunities will get limited and producers might operate on the lower capacity to augment higher interest rates by the Fed. The US Dollar Index (DXY) delivered a breakout above the critical resistance of 101.80 and drove to near 101.90 as investors underpinned the risk aversion theme. Also, the return generated by 10-year US Treasury bonds scaled above 3.54%.
The Fed is highly likely to announce a hike in interest rates by 25 basis points (bps) to 4.50-4.75% as a significant decline in the Consumer Price Index (CPI) has infused confidence among Fed policymakers that the roadmap of achieving price stability in demonstrating desired results. Also, the street is expecting that the Fed might pause hiking interest rates after pushing them to 4.75-5.00% for the remaining year.
On the Australian front, investors are keeping an eye on Tuesday’s monthly retail sales data, which is expected to display de-growth of 0.3% from the prior release of 1.4%. This might ease some troubles for the Reserve Bank of Australia (RBA), which is struggling the cap the stubborn inflation in the Australian economy.
- Gold price hourly chart shows that the price is being jammed into the lows of the day.
- Gold price could see a short squeeze for the day ahead as traders get set for the Federal Reserve.
The Gold price has drifted lower for a third day and is testing structure as we head towards key events this week, including the Federal Reserve and the European Central Bank as the key events, the Bank of England and also the United States of America jobs data. The Gold price is down some 0.29% so far having lost territory from a high of $1,934.56 and running into a low of $1,920.74 so far.
The US Dollar and US Treasury bond yields rose ahead of this week's meeting of the Federal Reserve's policy committee. The markets are pricing in a 25 basis point hike but they are also looking for the benchmark rate to peak at 4.93% in June, up from 4.33% now. There are also calls for the central bank to cut it to 4.52% by December.
Gold price depends on US Nonfarm Payrolls and the Federal Reserve
However, if the market is wrong considering how tight the labour market is, then there could be a surge in the US Dollar and that would weigh on the Gold price. On the other hand, a move representing a second consecutive downshift in the Federal Reserve's hiking pace would be deemed positive for the Gold price but the post-meeting communication could still emphasize that the Fed is not done yet in terms of tightening its policy stance. Some Federal Reserve officials have been pushing back against market calls for a pivot and said that they will need to keep rates in restrictive territory for a period of time in order to bring down inflation.
Analysts at Brown Brothers Harriman argued that headline Personal Consumption Expenditure inflation of 5.0% YoY in December is still running more than double the Fed’s 2% target. ''As we’ve said many times before, getting inflation down from 8% to 4% is the easy part; getting it from 4% to 2% is the hard part and that’s what markets continue to miss,'' the analysts argued, adding, 'the Fed needs to continue reminding the markets that the road ahead remains difficult and full of surprises.''
We also get the US Nonfarm Payrolls employment report that likely continued to rise in January, although the expectations of 175k increase in payrolls would not be far off the smallest gain since a drop in December 2020. Nevertheless, the labour market remains tight and layoffs are still very low. However, the Unemployment Rate will be key and the expectation is a rise to 3.6% from 3.5% in December which would be likely damaging to the US Dollar and supportive of the Gold price.
Gold price technical analysis
As per the start of the week's ore-open analysis, a weekly article written before the open each Monday in early Asia, we are seeing the makings of a move lower in Gold price.
Gold price daily chart, pre-open
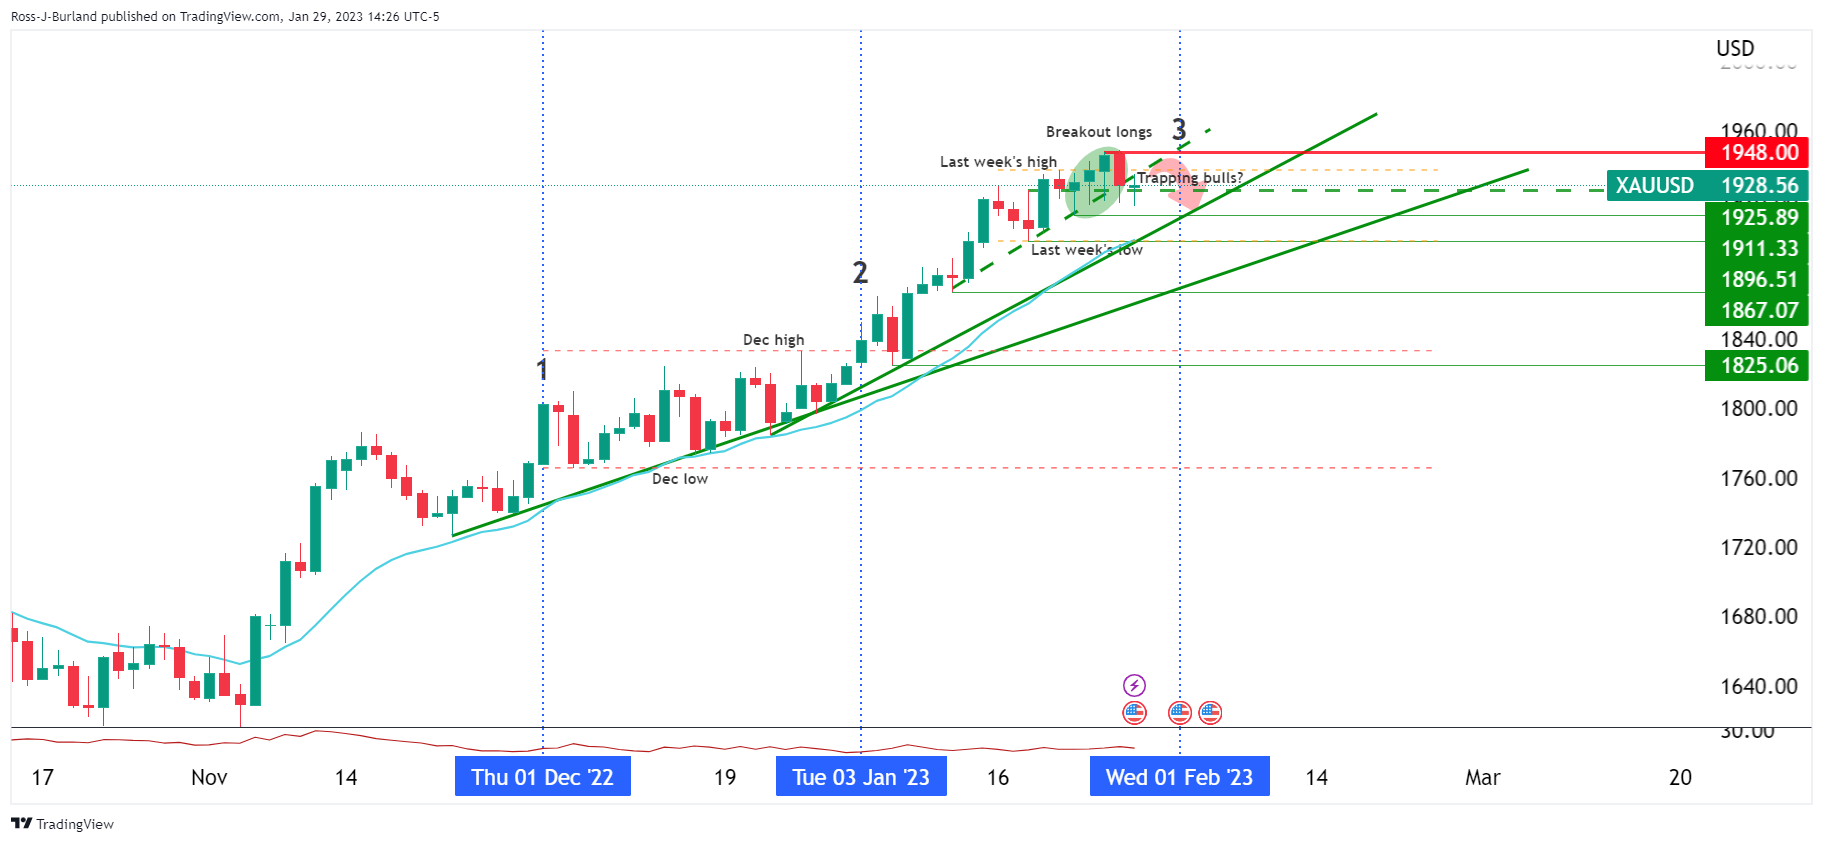
As illustrated, there were a number of compelling features to the Gold price daily chart highlighted in the reopen analysis. There are two positive monthly closes and we could be headed for the third monthly rise this week by the close of January's business having made a fresh high for the cycle last Thursday.
However, we have also made for three weeks of interrupted weekly gains for Gold price and the price action is trapping stubborn bulls:
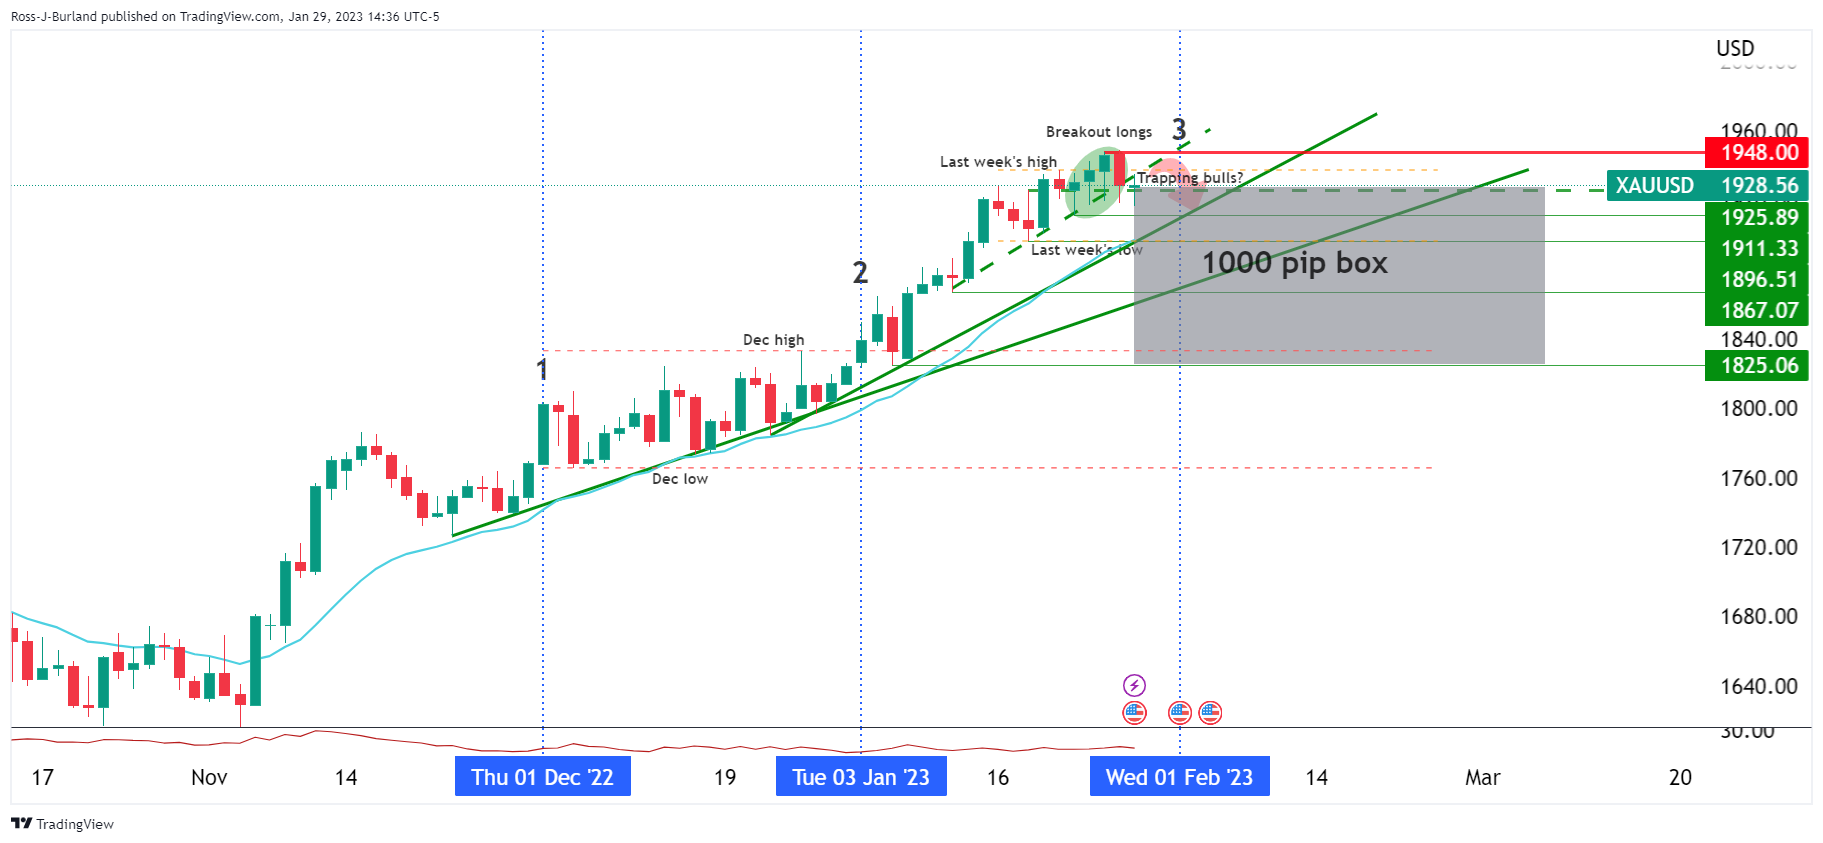
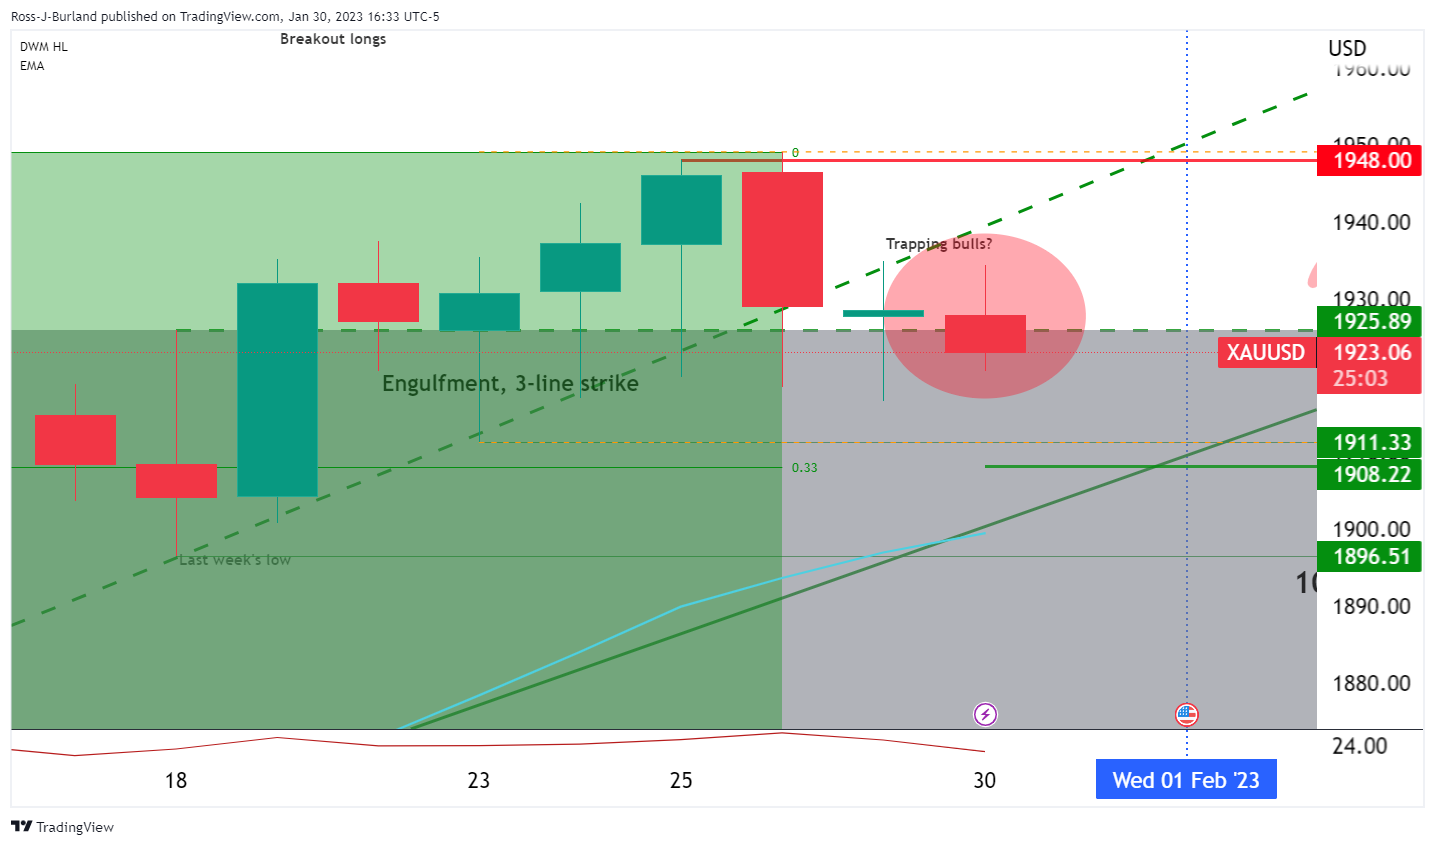
Zooming in we can see that we had a 3-line strike in play for the Gold price:
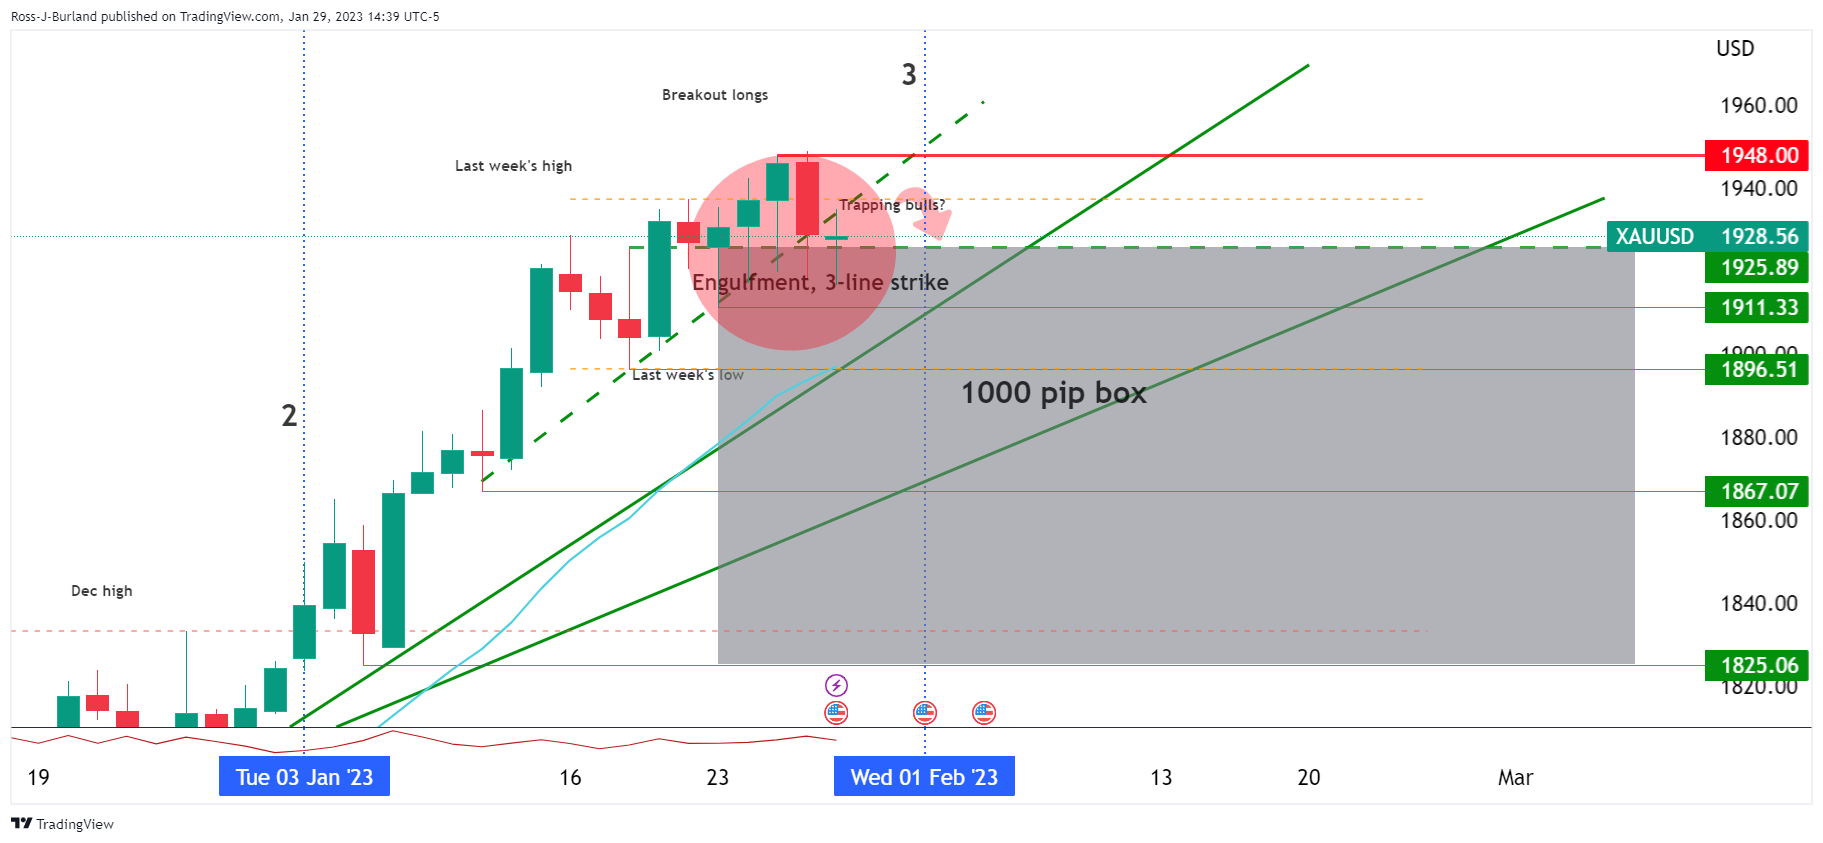
This was a Gold price trend continuation candlestick pattern consisting of four candles. In this particular scenario, we did not have the close below the first of the four candles, but this was a bearish scenario nonetheless for Monday and bears capitalized on it as follows:
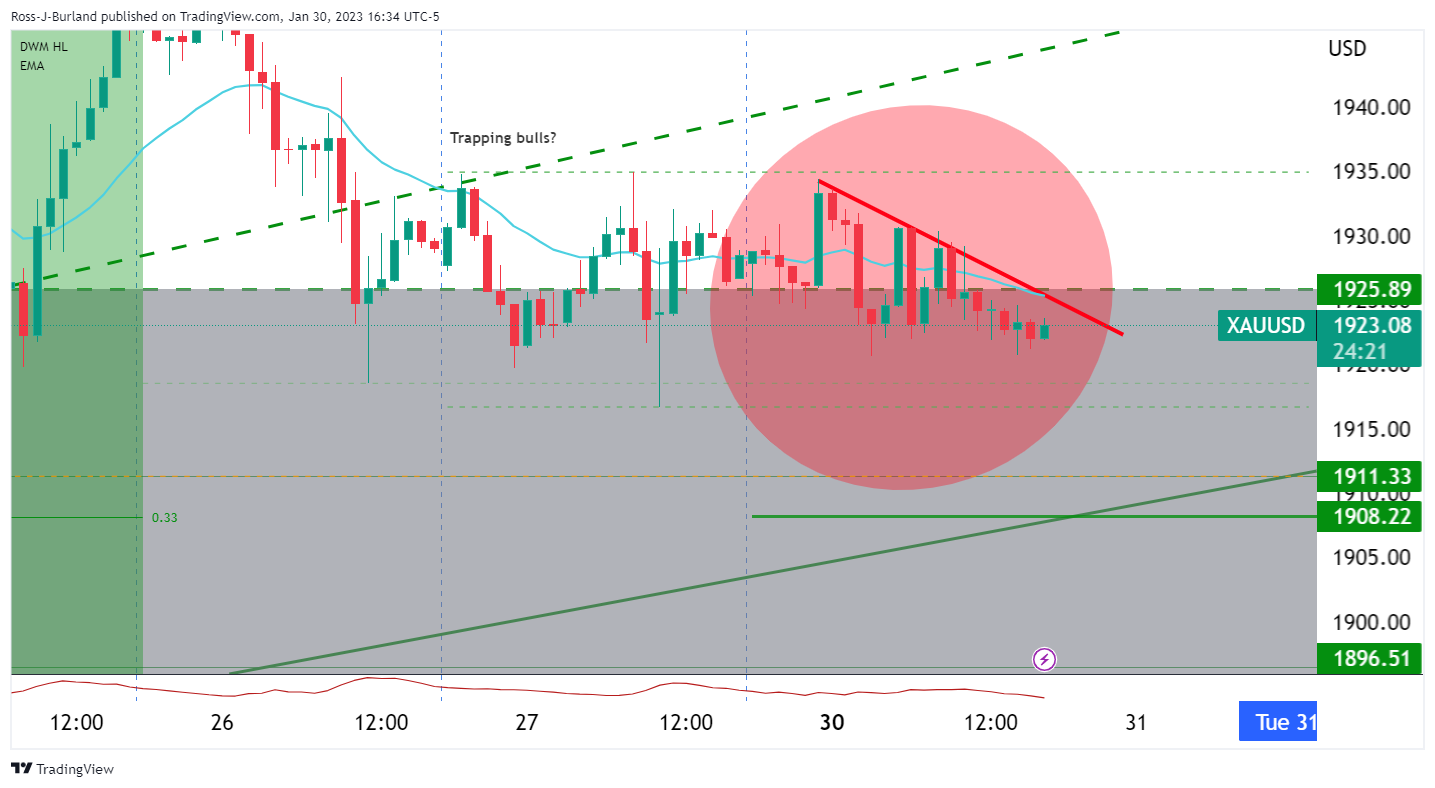
The Gold price hourly chart shows that the Gold price is being jammed into the lows o the day which could open the risk of a squeeze for the day ahead as traders get set for the Fed on Wednesday and ECB on Thursday.
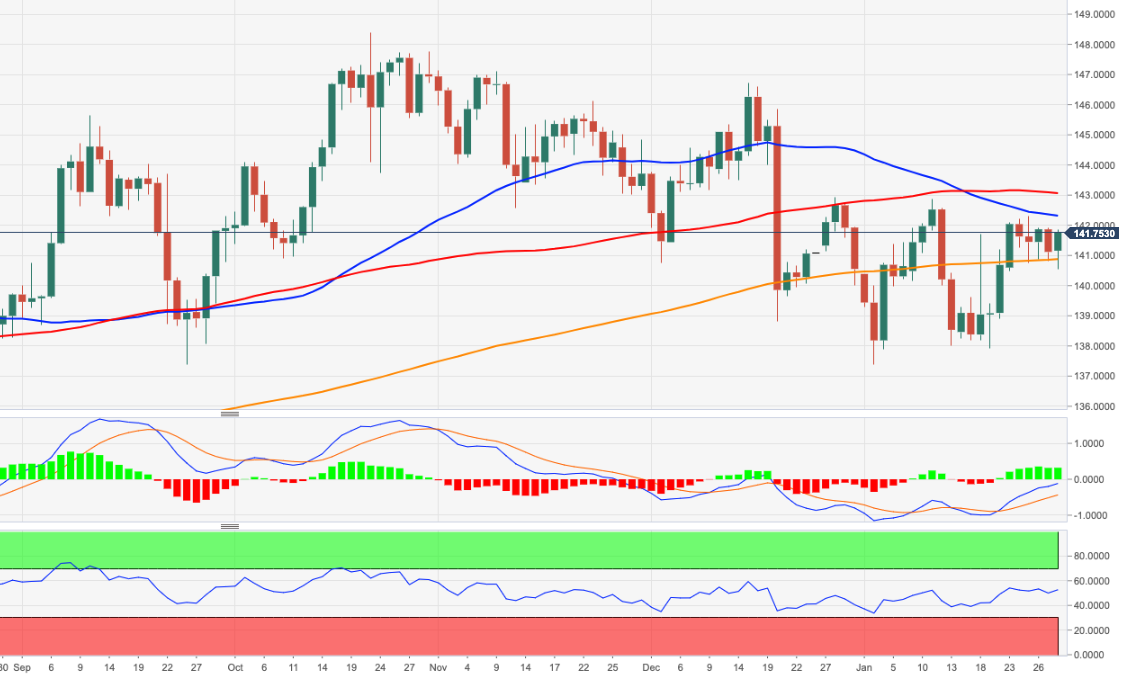
- EUR/JPY stages a comeback and hits a three-day new high at 141.97, shy of the 142.00 mark.
- EUR/JPY Price Analysis: Sideways awaiting a catalyst to gather direction.
The Euro (EUR) is recovering some ground against the Japanese Yen (JPY), as the Wall Street close looms, after hitting two-week lows of 140.55, though it staged a comeback and traveled back to the day’s high at 141.97. At the time of writing, the EUR/JPY exchanges hands at 141.50, above its opening price.
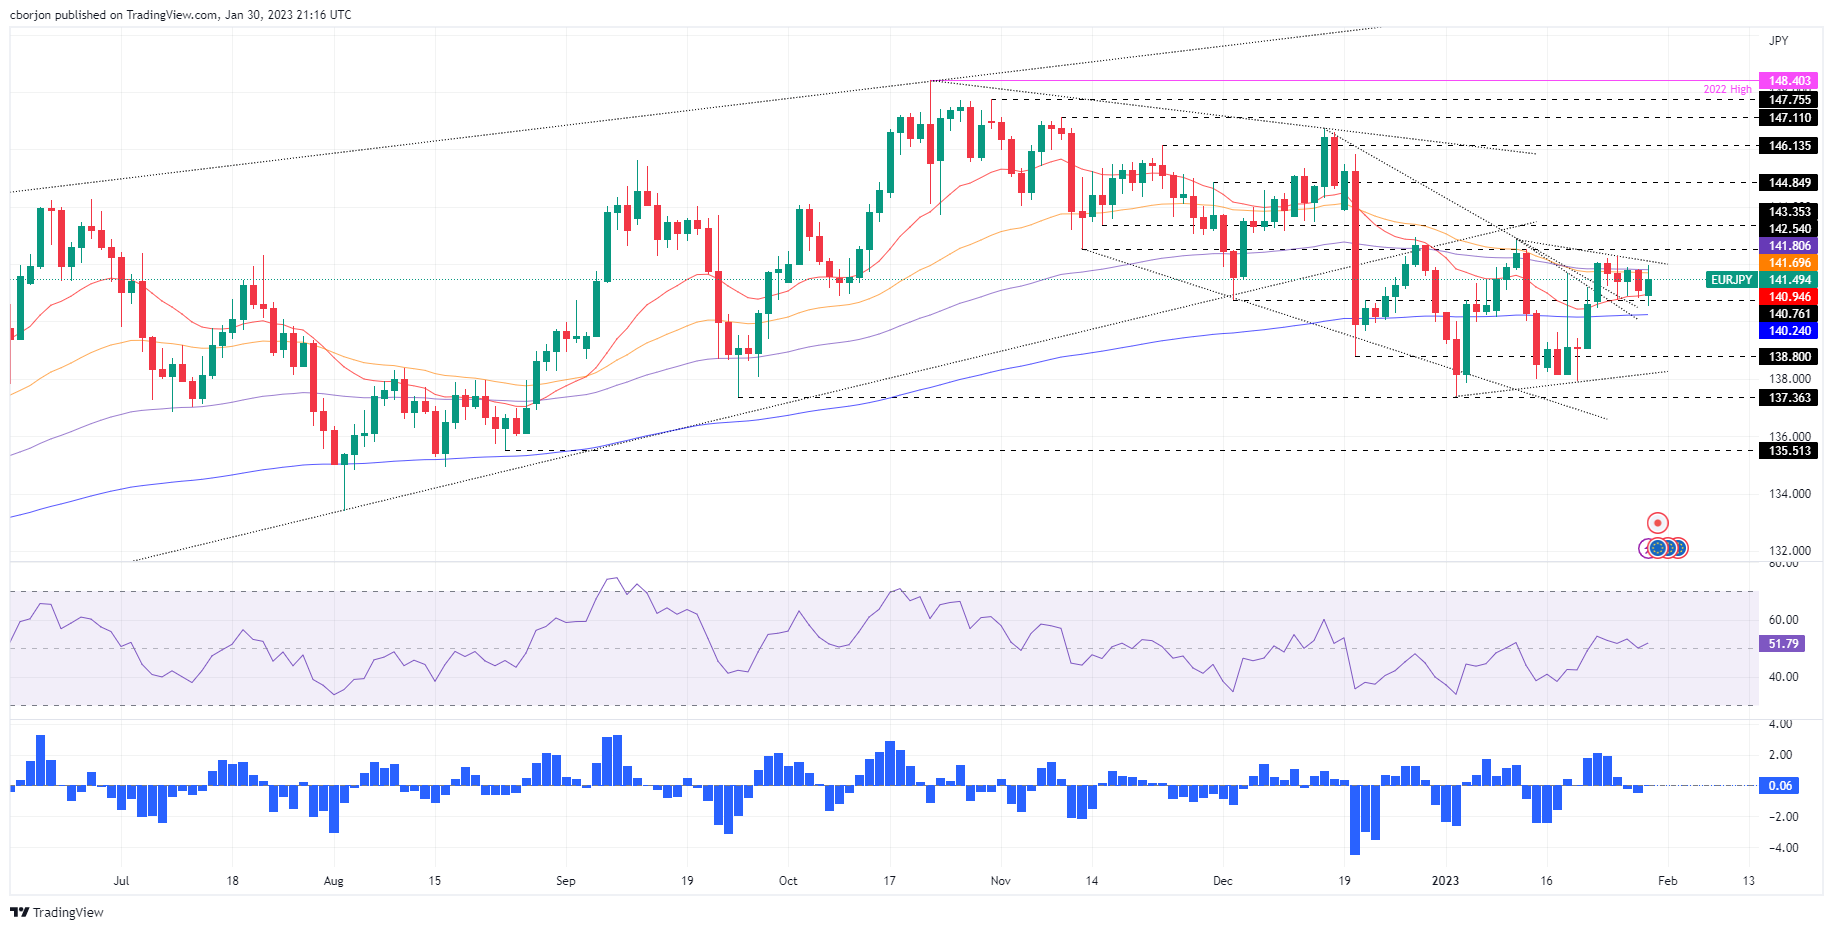
EUR/JPY Price Analysis: Technical outlook
After rallying from the January 19 daily low of 137.91 towards the January 25 daily high of 142.29, the USD/JPY remains trapped in a 250 pip range within the 140.75-142.39 range for the last five days. Furthermore, the 20-day Exponential Moving Average (EMA) at 140.94 and the 50-day EMA at 141.70 acted as the support/resistance of the range. Therefore, the EUR/JPY is trendless amid the lack of a catalyst.
Oscillator-wise, the Relative Strength Index (RSI) at bullish territory backed today’s price action, contrary to the Rate of Change (RoC), which indicates sellers are beginning to gather momentum.
Therefore, the EUR/JPY first resistance would be the 50-day EMA at 141.70 and might rally once broken. The next resistance would be the 142.00 psychological level, ahead of the Wednesday 25 high at 142.29, followed by the 143.00 figure.
In an alternate scenario, if the USD/JPY pair breaks downwards, it would expose key support levels. First, the 20-day EMA at 140.94, followed by the 200-day EMA at 140.24, and then the psychological 140.00 mark.
EUR/JPY Price Analysis
- EUR/USD bears on board into the final stretch on Wall Street.
- US stocks are sinking ahead of earnings this week and major calendar events such as the ECB, Fed and US NFP.
EUR/USD has been sent onto the backfoot as US stocks slide to fresh session lows led by the tech-focused Nasdaq which is down by more than 1% on Monday. At the time of writing, EUR/USD is losing around 0.2% and dropped from a high of 1.0913 to a low of 1.0839 recently printed.
It's a big week ahead and the markets are squaring up before major events such as the Federal Reserve, European Central Bank and the US nonfarm, Payrolls as the showdown and grand finale. Firstly, the Federal Reserve has been price din by the markets for a 25 basis point hike but they are also factoring in a benchmark rate to peak at 4.93% in June, up from 4.33% now. there are also calls for the central bank to cut it to 4.52% by December. However, some analysts are of the mind that the market is wrong considering how tight the labour market is. Some Fed officials have been pushing back against market calls for a pivot and said that they will need to keep rates in restrictive territory for a period of time in order to bring down inflation.
ECB will be key
As for the ECB, markets have been starved of comments from ECB officials in recent times and there has not been much in the way of data to go by either,. Instead, the sentiment is for a 50 basis point hike followed by hawkish commentary from governor Christine Lagarde. '' There is room for things to get interesting during the press conference,'' analysts at TD Securities argued, adding ''and here we think Lagarde will sound more hawkish than expected and repeat her earlier guidance of possibly further 50bps hikes in March and May.''
Analysts at Danske Bank ultimately see the ECB's terminal rate at 3.25% in May but argued that risks remain tilted to the upside. They note also that the January Flash HICP figures will be released just ahead of the meeting on Wednesday. ''We look for an uptick both in the headline (9.6%; from 9.2%) and core (5.4%, from 5.2%) terms.''
The grand finale will come with the US Nonfarm Payrolls on Friday whereby the consensus sees 185k jobs added vs. 223k in December, as analysts at Brown Brothers Harriman said, explaining that the Unemployment Rate is seen up a tick to 3.6% and average hourly earnings at 4.3% YoY vs. 4.6% in December. ''All in all, the labour market remains tight and it’s hard to see how wage pressures can fall that much further given this tightness,'' the analysts argued.
What you need to take care of on Tuesday, January 31:
The US Dollar posted a modest advance at the beginning of the week, backed by a dismal market mood. The Greenback retains its positive bias ahead of the Asian opening, although caution dominates the scenes as the macroeconomic calendar offers multiple first-tier events this week.
Early on Tuesday, Australia will release December Retail Sales, foreseen down by 0.3% in the month. Additionally, China will unveil the NBS Manufacturing and Non-Manufacturing PMIs. The first is expected to improve from 47 in November to 49.7, while services output is foreseen jumping from 41.6 to 51.
Between Wednesday and Thursday, the US Federal Reserve, the European Central Bank and the Bank of England will unveil their monetary policy decisions. At the time being, market players are betting on a 25 basis points (bps) rate hike. For the ECB, a 50 bps rate hike is fully priced in, while the BoE is expected to hike its benchmark rate by 50 bps.
Earlier in the day, the focus was on the Bank of Japan, as a panel of academics and business executives urged the BoJ to make its 2% inflation target a long-term goal. The proposal reportedly also included the need to have interest rates rise more in line with economic fundamentals and normalize Japan's bond market function. BOJ Gov Haruhiko Kuroda stated that its biggest responsibility was price stability and reiterated it is possible to achieve 2% inflation with wage growth and the current easy policy. USD/JPY declined to 129.19 but ended the day at around 130.50 amid broad US Dollar demand.
EUR/USD briefly traded above 1.0900 but settled at around 1.0840. European data failed to impress as the German economy grew at an annualized pace of 1.1% in the last quarter of 2022, missing expectations of 1.3%. Also, as reported by the Harmonized Index of Consumer Prices (HICP), Spanish inflation unexpectedly rose by 5.8% YoY in January, an alarm bell ahead of the ECB monetary policy meeting later this week.
GBP/USD is down to 1.2340, while AUD/USD hovers around 0.7050. The USD/CAD pair advanced towards the current 1.3390 price zone.
Spot gold eased modestly and currently trades at around $1,922 a troy ounce. Crude oil prices edged sharply lower, with WTI currently hovering around $77.70 a barrel.
Ripple Price Forecast: XRP in dire need of nearby support in order to avoid imploding
Like this article? Help us with some feedback by answering this survey:
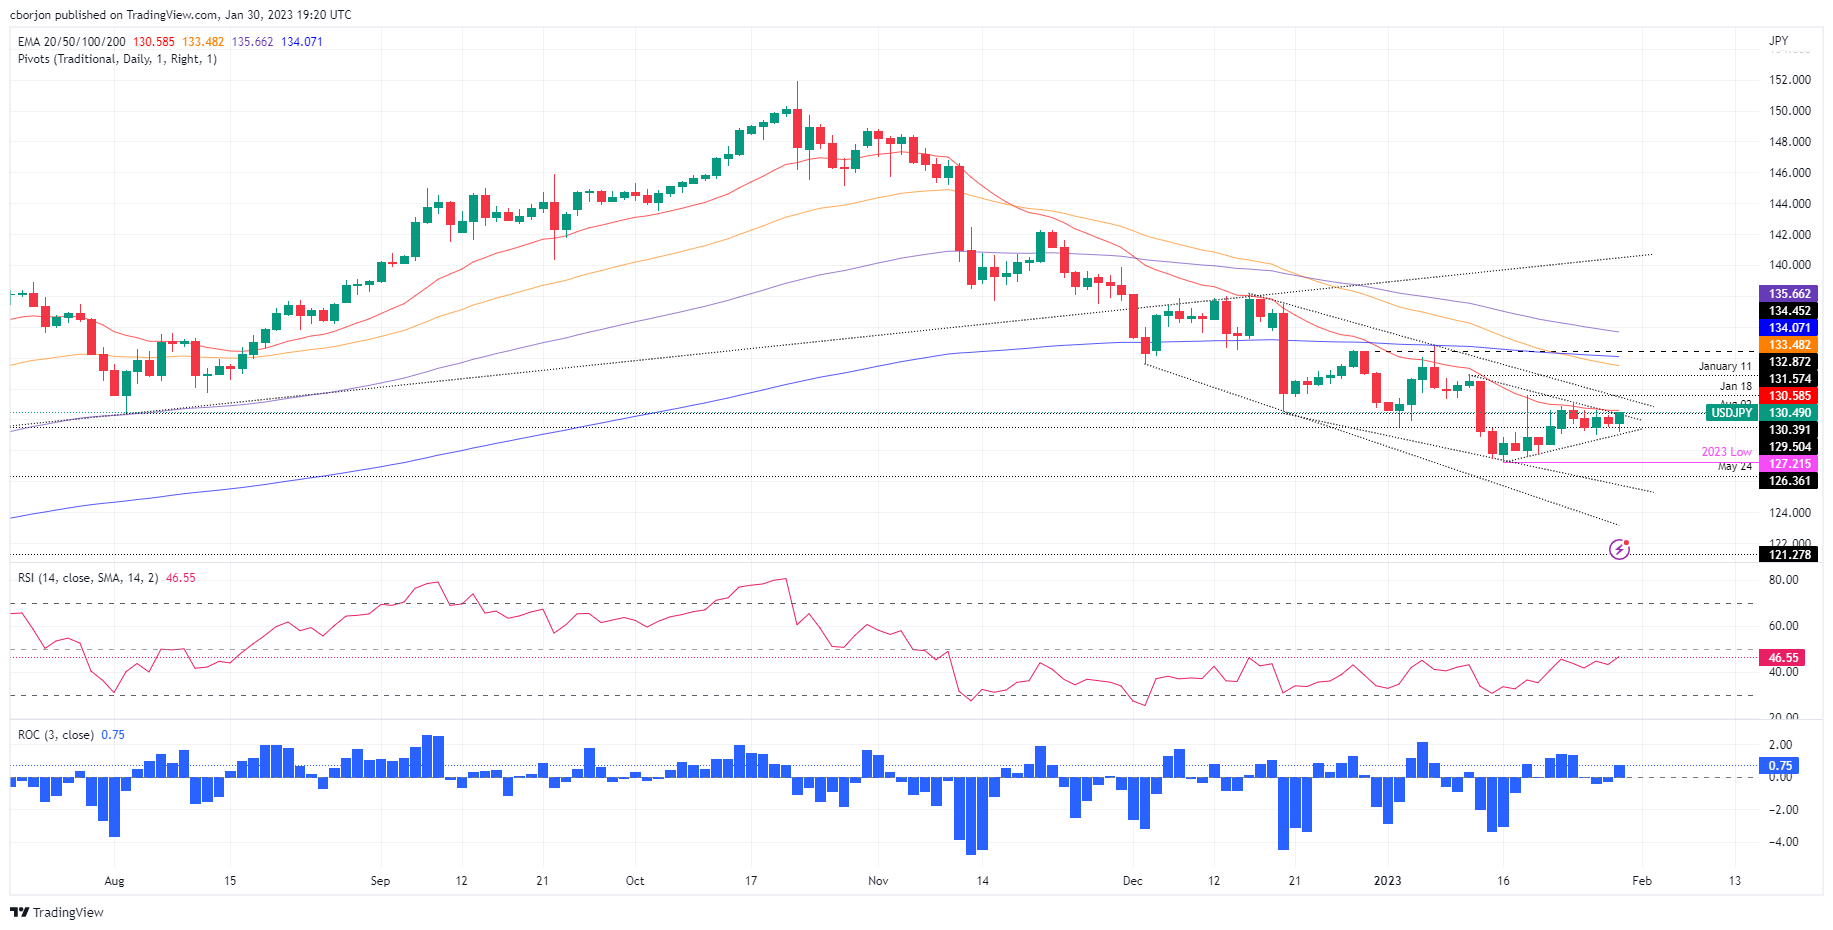
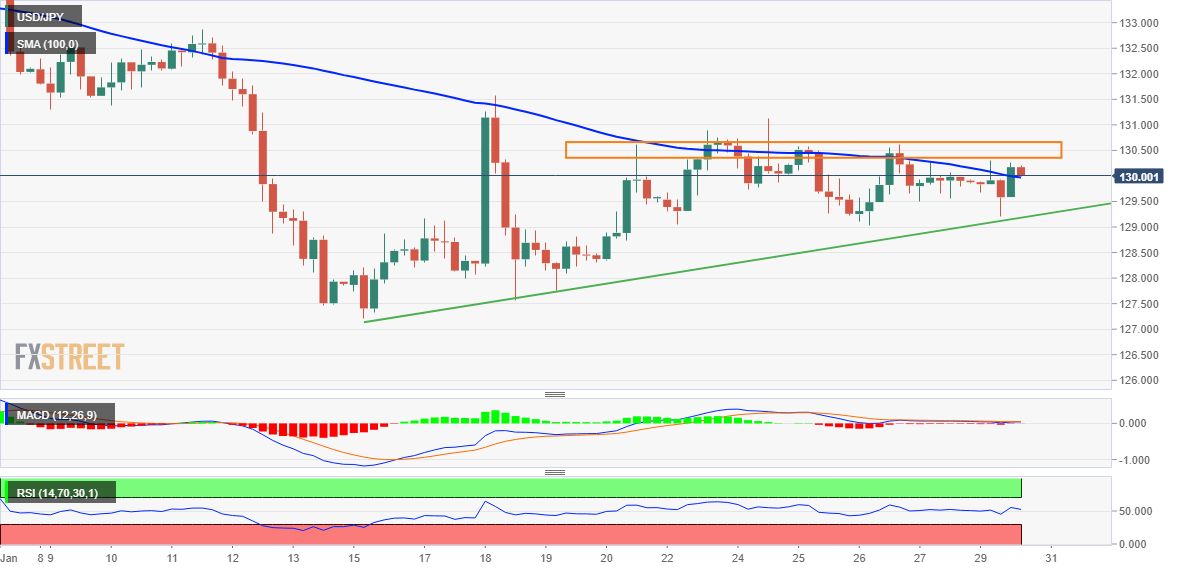
- USD/JPY recovers some ground as traders brace for a busy US economic calendar.
- Buyers are eyeing a test of the 20-day EMA, as the RSI and RoC suggest the USD/JPY could print a leg-up in the near term.
- SUD/JPY Price Analysis: Remains downward biased, but it could aim higher.
USD/JPY erases last Friday’s losses and reaches a new session high at 130.49, though slightly beneath the 20-day Exponential Moving Average (EMA), used as a barometer for short-term bias, which remains above the exchange rate. Therefore, the USD/JPY remains bearish despite trading at 130.49, above its opening price by 0.56%.
USD/JPY Price Analysis: Technical outlook
From a price action point of view, the USD/JPY remains bearish biased, even though it printed new daily highs. However, USD/JPY buyers need to clear the 20-day EMA at 130.57, to open the door for further gains. Traders should be aware the Rate of Change (RoC) depicts the buyer gaining momentum, while the Relative Strength Index (RSI) is about to turn bullish, suggesting that upward pressure is building.
Therefore, the USD/JPY first resistance would be the 131.00 figure. A breach of the latter will expose a one-month-old downslope trendline at around 131.330-40, followed by the January 18 daily high at 131.57, and then January’s 11 swing high
As an alternate scenario, if the USD/JPY tumbles below 130.00. the next support would be the January 30 daily low of 129.19. A breach of the latter will expose the psychological 128.00, followed by the YTD low at 127.21.
USD/JPY Key Technical Levels
- NZD/USD slides in tandem with the Aussie and US stocks into the final hours of Wall Street.
- Investors are nervous ahead of critical events, including the Fed, NFP and NZD about market data.
NZD/USD is melting in the latter part of the US session as US stocks slide ahead of the close in a choppy start to the week ahead of critical events. At the time of writing, NZD/USD is losing 0.13% and has fallen from a high of 0.6508 to a low of 0.6472 having just printed a fresh low for the New York day.
The moves on Wall Street have been led by The tech-focused Nasdaq which is down by more than 1% on Monday as mega-cap growth stocks including Apple, Amazon and Alphabet dropped before earnings reports this week. The antipodeans are high beta currencies that tend to track the performance of global equities, hence the slide in the bird.
Key events ahead
The main focus in markets will be the Federal Reserve and US Nonfarm Payrolls, both of which could be pivotal for the forex space. Equally, there is domestic labour market data on the calendar for the Kiwi. ''We expect another firm labour market print in Q4 though we don't think it is a game-changer to nudge the Reserve Bank of New Zealand towards a 75bps point hike after the Q4 CPI print last week squarely missed the RBNZ's forecast,'' analysts at TD Securities argued. ''However, we see a terminal rate of 5% as necessary to quell the risk of a wage-price spiral as quarterly wages growth rise and set a new record for annual wage growth.''
As for the Fed, the markets are pricing for the Fed's benchmark rate to peak at 4.93% in June, up from 4.33% now, and then for the central bank to cut it to 4.52% by December. However, Fed officials have been pushing back against market calls for a pivot and said that they will need to keep rates in restrictive territory for a period of time in order to bring down inflation.
Meanwhile, analysts at ANZ Bank said in a note today that ''the Kiwi has been doing well but the economic cycle broadly is turning, and US markets have scope to “price out” a lot of cuts, which should help the USD. But let’s get through tomorrow’s NZ labour data.''
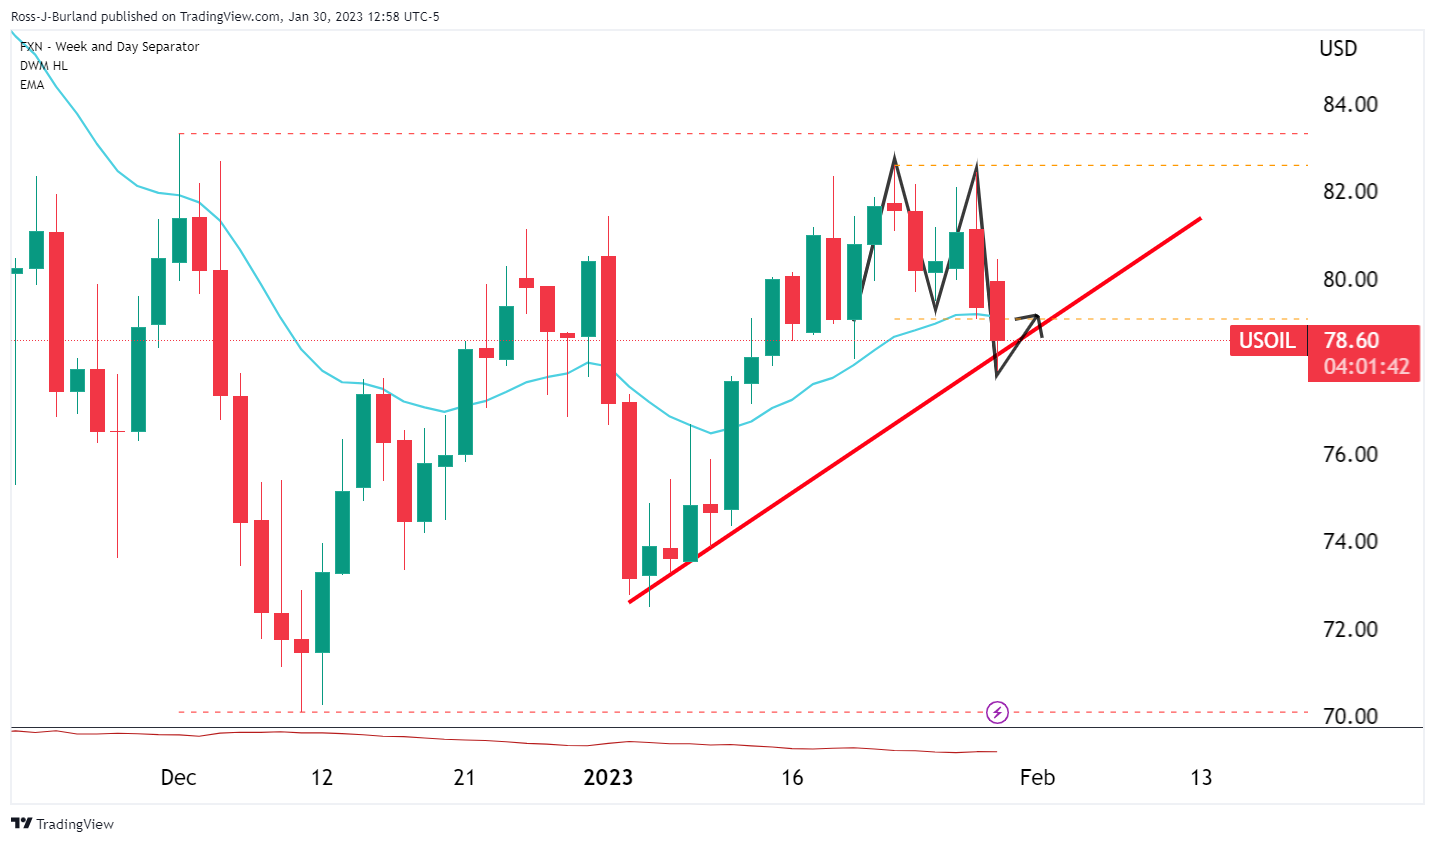
- trapped longs are panicking as bears take control.
- A 38.2% Fibonacci correction could result in further fresh supply.
- A 100% measured target towards $75.00 is eyed for over the course of the coming week:
West Texas Intermediate has dropped by over 1% on the day and is trading around $78.50 at the time of writing after falling from a high of $80.44 and reaching a low of $77.91 so far on the day, ending a bullish start to the year towards month-end and following its fi4rst weekly loss last week for the year so far,
Analysts at ANZ Bank argue that technical factors have been in play, with Brent futures failing to hold above the 100-day moving average. Nevertheless, they said, ''the market remains buoyed by what China’s reopening will mean for demand.''
''Money managers increased their bullish positions on Brent to its highest level in 11 months. Spot prices moved back into a premium with futures, signalling expectations that demand will outstrip supply,'' the analysts added noting that in China, ''travel surged to 90% of pre-pandemic levels over the Spring Holiday. Domestic air travel was also up 80% y/y last week.''
Meanwhile, prices on Monday are lower as investors turned cautious ahead of an expected rise in US interest rates this week. The Federal Reserve is meeting and a hawkish pushback against the notion of the market that a Fed pivot is due is keeping investors sidelined and keen to cash in on positions before the event. The Federal Reserve is expected to result in a 25-basis point rise to US interest rates, keeping recession fears top of mind for investors.
The drop in prices comes despite geopolitical risk in the Middle East rising following a drone attack on an ammunition manufacturing plant facility in the Iranian city of Isfahan. The attack is being blamed on Israel, according to the New York Times.
Elsewhere, there are ongoing concerns that markets will struggle to adjust to European sanctions on oil products. TotalEnergies warned that Europe is still at risk of diesel shortages.
Analysts at TD Securities argued that CTA trend followers are better positioned in petroleum products including heating oil and RBOB gasoline ahead of the EU's import bans on Russian fuels, although recent algo liquidations have still helped to weaken gasoline crack spreads. ''The EU's fuel ban continues to provide uncertainty with respect to fuel availabilities in coming months, but resilient Russian exports are defying expectations for imminent disruptions,'' the analysts explained. ''Nonetheless, additional CTA long acquisitions could be expected above the $2.62/gal range in gasoline, although CTAs are already nearing their effective max length in heating oil.''
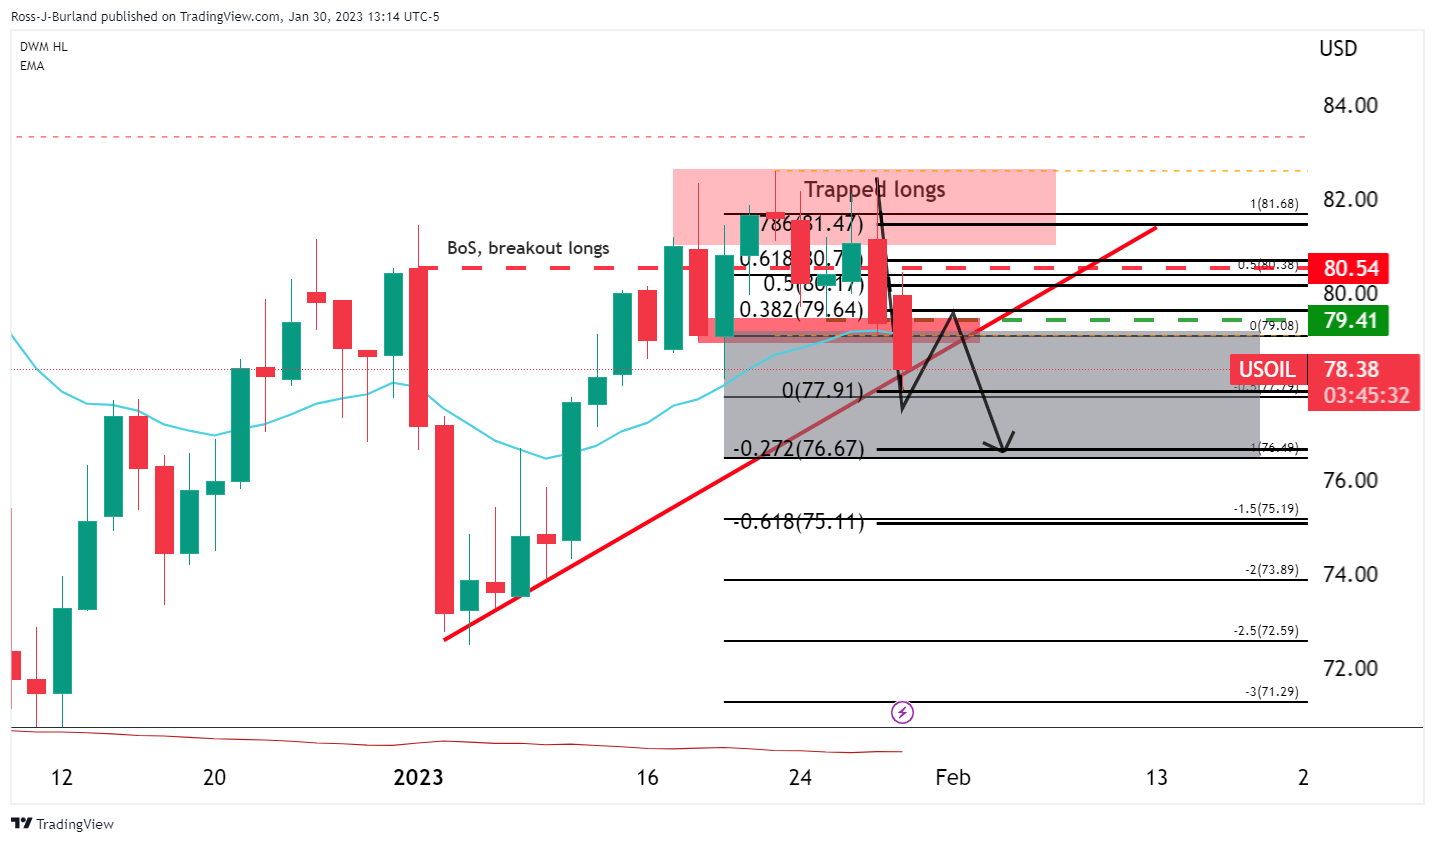
WTI technical analysis
Meanwhile, New York traders were getting short of the trapped volume accumulated around $79.40/50. while led to a sell-off in the opening hours of trade before a short squeeze in the cash open on Wall Street:
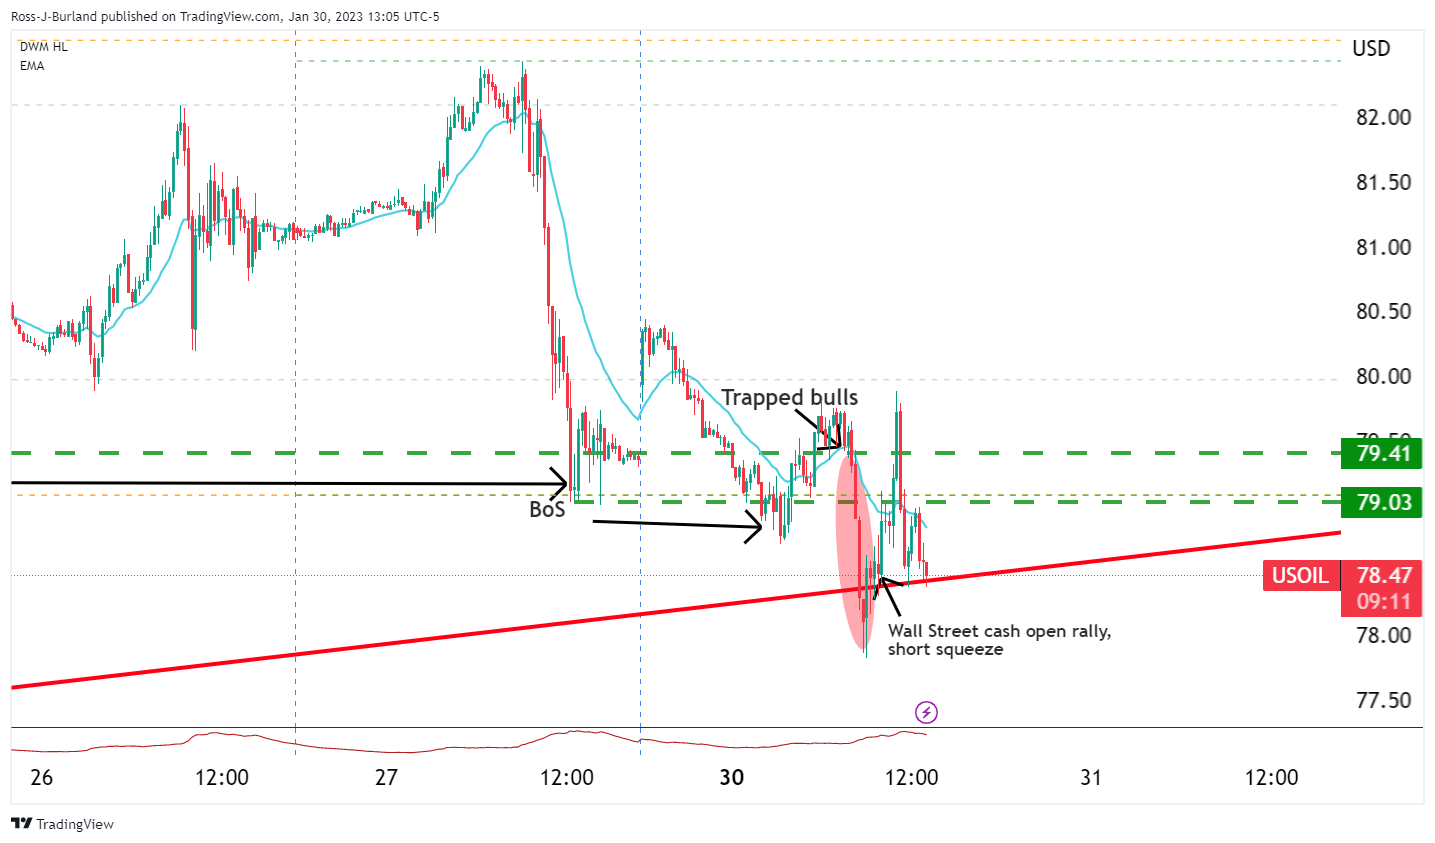
However, with the Fed coming up this week, and considering the daily M-formation and trendline support,m we could be in for some consolidation for the forthcoming sessions:
With that being said, a correction into resistance could entice trapped longs to get out of losing or breakeven positions and subsequently the shorts coming onto the market around 38.2% Fibonacci correction could see a move out of the consolidation below the trapped volume and into a 100% measured target towards $75.00 over the course of the coming week:
- GBP/USD was rejected at 1.2400 for the fifth straight day as traders brace for a busy calendar.
- The US Federal Reserve and Bank of England monetary policy decisions, are looming and would keep investors at bay.
- GBP/USD Price Analysis: Sideways, trapped within the 1.2340-1.2430 range.
GBP/USD losses ground in the New York session, ahead of a busy week in the global economic docket, with major central banks hosting monetary policy decisions. The US Federal Reserve (Fed) is expected to raise rates by 25 bps, while the Bank of England (BoE) would likely lift rates by 50 bps, with analysts estimating that after February’s decision, the BoE would pause. At the time of writing, the GBP/USD is trading at 1.2367.
GBP/USD Price Analysis: Technical outlook
Consolidation is the game’s name in the case of the GBP/USD failing to break above/below the top/bottom of the 1.2430/1.2344. Even though it’s sliding to a fresh day’s low at 1.2367, it would keep range-trading in the previously mentioned area. However, the GBP/USD is closing into a 13-day upslope support trendline, which, once cleared, the GBP/USD could tumble to the 1.2300 figure, followed by the 20-day Exponential Moving Average (EMA) at 1.2277.
As an alternate scenario, the GBP/USD’s reclaiming 1.2400, then the GBP/USD could rally towards the 1.2500 area, but on its way north, it would need to face the December 14 high of 1.2446.
Oscillators like the Relative Strength Index (RSI) and the Rate of Change (RoC) suggest further downside is expected.
GBP/USD Key Technical Levels
- US Dollar up modestly amid higher US yields ahead of Fed and key data.
- Equity and crude oil prices trim losses during the American session.
- USD/CAD holds above 1.3300, risks remain tilted to the downside.
The USD/CAD peaked during Monday’s American session at 1.3357, the highest level since Thursday. It is hovering around 1.3350, slightly away from the critical support area of 1.3300.
The January low around 1.3300 is the key level to the downside: a break lower could open the doors to an extension toward to 1.3220 (November low) and the 200-day Simple Moving Average (SMA) today at 1.3204. On the upside, a consolidation above 1.3360 would set the attention on 1.3400 and the 20-day SMA at 1.3420.
The US Dollar is rising on Monday amid higher US yields and risk aversion. The 10-year Treasury yield stands at 3.54% and the 2-year at 4.26%, the highest since January 12. The Dow Jones is falling by 0.39% and the Nasdaq slides by 1.48%.
Price action remain limited on Monday ahead of busy days. On Tuesday, Canada will report November GDP data, expected at 0%. Analysts at TD Securities look for a flat print on industry-level GDP with a muted performance across both goods and services “with new flash estimates expected to show a modest expansion in December.” They point out the “ultra sensitivity to data releases is on hold” with the Bank of Canada moving towards a pause. “We expect cuts to start in January and expect the data to deteriorate in the coming months.”
In the US will be a busy week, with the FOMC meeting on Wednesday and the Non-farm payrolls report on Friday. The Federal Reserve is expected to raise interest rates by 25 basis points. Fed’s outlook will be critical and could trigger volatility across the FX board.
Technical levels
- The AUD/USD falls below the 0.7100 psychological level amidst the lack of fresh impetus.
- The US Federal Reserve’s monetary policy decision keeps traders at bay, dampening their mood.
- Later, Australian Retail Sales are eyed by traders, while US Chicago PMI and CB Consumer Confidence would update the US economy’s status.
The AUD/USD retreats after hitting a daily high at 0.7120, as the US Dollar (USD) recovers some ground against most G8 currencies, underpinned by high US Treasury bond yields and a sour sentiment, as shown by US equities sliding. At the time of writing, the AUD/USD is trading at 0.7076.
US economic data begins to support the Fed’s soft landing
A risk-off impulse keeps investors sidelined ahead of Wednesday’s US Federal Reserve (Fed) monetary decision. The AUD/USD continues to drop, eyeing a January 25 daily low test at 0.7032, which, once conquered, could put into play the 0.7000 mark. Last week’s US economic data, with US Gross Domestic Product (GDP) for Q4 exceeding estimates but lower than Q3’s data, justified a group of Fed officials backing lower-sized rate increases.
In addition, a Fed inflation gauge known as the core Personal Consumption Expenditure (PCE) dropped from 4.7% in November to 4.4% in last month’s annually based. Also, US consumer sentiment improved, as a University of Michigan (UoM) poll reported, while inflation expectations edged lower.
That said, the US Federal Reserve (Fed) is expected to raise rates by a quarter percentage point (0.25%) on Wednesday, ending the era of 75 plus hikes, which lifted the Federal Funds rate (FFR) to the 4.25-4.50% range.
The US Dollar Index (DXU), which measures the buck’s value against a basket of currencies, continued to gain ground and reclaims the 102.000 figure, up 0.15% at 102.079. in the meantime, the US 10-year benchmark note rate extends its gains, up by four basis points (bps) at 3.546%.
What to watch?
The Australian economic docket will feature housing data and the last update of Retail Sales, which are expected to drop to -0.3% MoM. The US calendar will feature the Employment Cost Index (ECI), housing data, the Chicago PMI, and the CB Consumer Confidence Tuesday.
AUD/USD Key Technical Levels
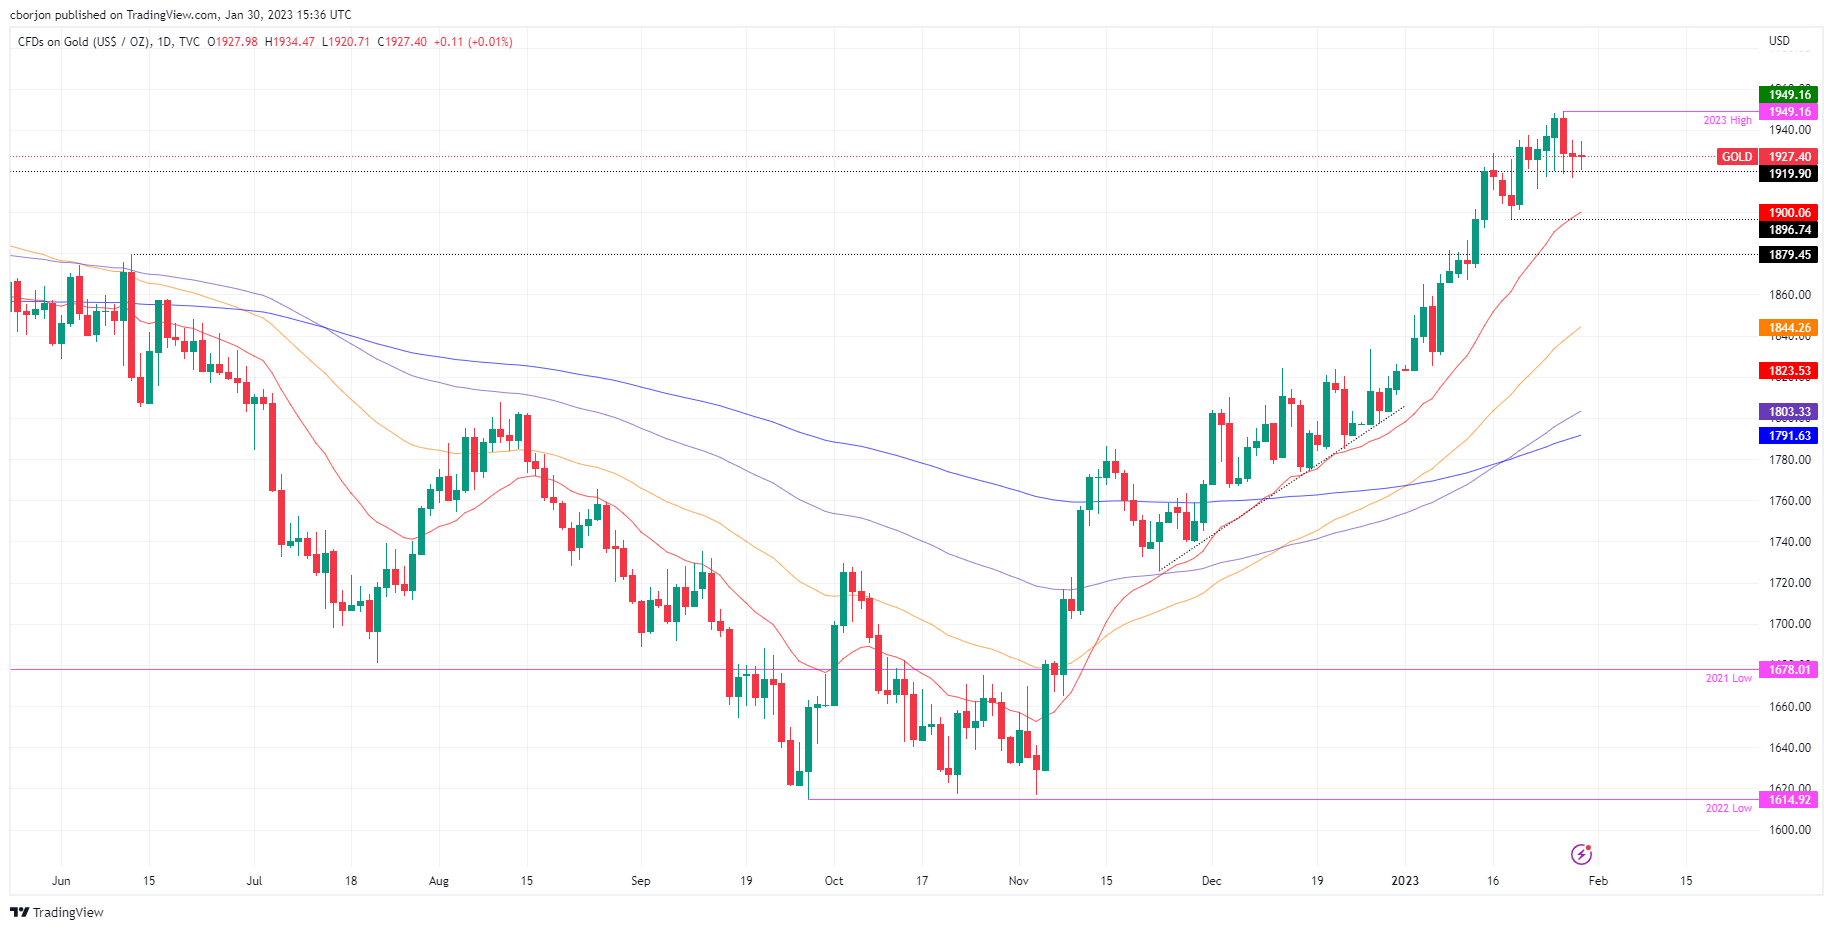
- Gold is subdued, though barely above its opening price, ahead of the Federal Reserve meeting.
- United States last week’s data justifies the Fed’s case to slow the size of interest rate increases.
- Gold Price Forecast: Choppy trading, still mostly sideways with traders sidelined ahead of the Fed’s decision.
Gold price trades mostly sideways due to investors preparing for the US Federal Reserve Open Market Committee (FOMC) meeting, which will begin on Tuesday. Most analysts estimate the US Federal Reserve (Fed) would increase rates by 25 bps, though they will be looking for cues about future meetings. Therefore, the XAU/USD exchanges hands at $1,928.45 a troy ounce at the time of writing.
US Q4 GDP supports Fed’s decision to go 25 bps
Wall Street opened mixed ahead of an important week for the economy of the United States (US). Last week’s data, led by the Advanced Gross Domestic Product (GDP) release for Q4, stood at 2.9%, above estimates of 2.6% QoQ, portraying a strong economy. Nevertheless, it decelerated compared to Q3’s 3.2%, further confirmed by data from the US Department of Commerce (DoC). That said, financial analysts have priced in a 25 bps rate increase to the US Federal Funds rate (FFR).
Fed’s inflation measure, core Personal Consumer Expenditure, stumbles for four consecutive months
Another reason that justifies lower-size moves is inflation. The Fed’s preferred inflation gauge, the US Core Personal Consumption Expenditures (PCE), came at 4.4% YoY, aligned with estimates but lower than November’s 4.7%. Inflation has fallen for four straight months, supporting some Fed officials expressing the need to lower the pace of rate hikes but emphasizing that no cuts are foreseen for 2023.
The University of Michigan’s Consumer Sentiment improved, and inflation expectations fell
Additionally, inflation expectations reported by a survey of the University of Michigan (UoM), portrayed American consumers estimated elevated prices would fall. Inflation in one year is expected at 3.9%, while for a 5-year horizon, it would fall from 3% to 2.9%. Consumer Sentiment improved as well, from 59.7 to 64.9 in January.
Given the backdrop, a Fed’s pause on its tightening cycle could bolster demand for Gold. Furthermore, if US Treasury bond yields commence edging lower, that would undermine the Greenback and boost XAU/USD, which could rally towards the $2,000 mark.
At the time of typing, US Treasury bond yields rise three basis points (bps), and edge up to 3.535%, while the Greenback is almost unchanged. The US Dollar Index (DXY), which tracks the buck’s value against a basket of peers, is up 0.01%, at 101.930.
Gold Price Analysis: Technical outlook
XAU/USD’s price action remains subdued, influenced by fundamental reasons. After peaking at $1,949.16, Gold slumped towards $1,916.72 last Friday, and prices remain trapped within the $1,920-35 range. In addition, oscillators like the Relative Strength Index (RSI) and the Rate of Change (RoC) are slightly skewed to the downside, but the RSI’s still in bullish territory.
If the XAU/USD extends its gains above the top of the range, the next stop would be the YTD high at $1,949.16, followed by the $2,000 psychological level. On the other hand, the XAU/USD breaking support would send the yellow metal slumping towards $1,900, followed by the 20-day Exponential Moving Average (EMA) at $1,899.75, and then January’s 18 low of $1,896.74
- Euro gains momentum following Spain’s inflation data, ahead of ECB.
- EZ bond yields rise, German 10-year climbs to 2.32%, the highest since January 6.
- EUR/GBP challenges 0.8800 after finding support at 0.8755.
The EUR/GBP is rising on Monday after falling for three consecutive days. The euro is rebounding from weekly lows near 0.8755 and is testing the 0.8800 area, supported by the latest round of Eurozone economic data and ahead of monetary policy decisions.
Busy week
Data released on Monday showed Inflation in Spain surprised to the upside. The Harmonised Consumer Price Index in Spain rose to 5.8% in January from 5.5% in December and above the market consensus of 4.8%. It was the first acceleration since July supporting expectations of a hawkish European Central Bank (ECB). More Euro Zone inflation data is due on Tuesday.
In Germany, the economy contracted 0.4% during the fourth quarter, against expectations of a flat reading, according to preliminary data. On the positive side, Consumer Confidence in the Eurozone improved to -20.9 in January, while the Economic Sentiment also ticked higher to 99.9.
After the numbers, Eurozone government bond yields rose, supporting the Euro across the board. The German 10-year yield rose to 2.32%, the highest since January 6.
On Thursday, the ECB will have its monetary policy meeting. A 50 basis points rate hike is priced in. The statement and clues about the future path will be the critical factors of the meeting.
In the UK, UK Prime minister Rishi Sunak said he will not raise taxes in order to fund pay raises for Health Service workers. During the weekend, Sunak fired Conservative Party chairman Nadhim Zahawi over a tax row.
The Bank of England is expected to raise its key interest rate by 50 basis points on Thursday, although many analysts expected a smaller increase. There is a division at the Monetary Policy Committee that will likely continue this week.
The EUR/GBP cross will likely have a volatile week, particularly on Thursday, the central bank’s day. Ahead of those critical events, the cross is moving sideways, testing the 20-day Simple Moving Average and the 0.8800 area. On the upside, the immediate strong resistance is seen around 0.8860. On the flip side, a close below 0.8730 should open the doors to more losses.
Technical levels
- EUR/USD advances to 2-day highs near 1.0915.
- Flash German GDP figures disappointed in Q4.
- EMU Consumer Confidence, Economic Sentiment improved in January.
The optimism around the single currency remains well and sound in the European afternoon, with EUR/USD posting decent gains near the 1.0900 hurdle.
EUR/USD: Daily gains capped near 1.0915
EUR/USD remains firm near the 1.0900 neighbourhood on the back of the small retracement in the dollar and inconclusive risk appetite trends at the beginning of the week.
So far, persistent cautiousness dominates the mood among investors ahead of key monetary policy meetings by the Fed and the ECB on Wednesday and Thursday, respectively.
Earlier in the session, the German economy is seen contracting 0.2% QoQ in Q4 and expanding 1.1% over the last twelve months, as per preliminary GDP readings. In addition, the final Consumer Confidence in the euro area improved to -20.9in January, while the Economic Sentiment also ticked higher to 99.9 in the same period.
Later in the NA session, the Dallas Fed Manufacturing Index will be the sole release on Monday.
What to look for around EUR
The sharp yearly rally in EUR/USD appears to have met an initial and decent barrier around the 1.0930 for the time being.
In the meantime, price action around the European currency should continue to closely follow dollar dynamics, as well as the potential next steps from the ECB and the Federal Reserve at their upcoming gatherings in the next week.
Back to the euro area, recession concerns now appear to have dwindled, which at the same time remain an important driver sustaining the ongoing recovery in the single currency as well as the hawkish narrative from the ECB.
Key events in the euro area this week: Germany Flash Q4 GDP Growth Rate, EMU Final Consumer Confidence, Economic Sentiment (Monday) – Germany Retail Sales/Unemployment Rate/Flash Inflation Rate, EMU Flash Q4 GDP Growth Rate (Tuesday) – Germany, EMU Final Manufacturing PMI, EMU Flash Inflation Rate/Unemployment Rate (Wednesday) – Germany Balance of Trade, ECB Interest Rate Decision, ECB Lagarde (Thursday) - Germany, EMU Final Services PMI (Friday).
Eminent issues on the back boiler: Continuation of the ECB hiking cycle amidst dwindling bets for a recession in the region and still elevated inflation. Impact of the Russia-Ukraine war on the growth prospects and inflation outlook in the region. Risks of inflation becoming entrenched.
EUR/USD levels to watch
So far, the pair is gaining 0.29% at 1.0896 and faces the next resistance at 1.0929 (2023 high January 26) followed by 1.0936 (weekly high April 21 2022) and finally 1.1000 (round level). On the other hand, the breakdown of 1.0766 (weekly low January 17) would target 1.0608 (55-day SMA) en route to 1.0481 (monthly low January 6).
- USD/JPY gains some positive traction, though remains confined in a familiar trading range.
- The mixed fundamental backdrop is seen holding back traders from placing aggressive bets.
- A convincing break below ascending trend-line support will set the stage for deeper losses.
The USD/JPY pair attracts some dip-buying near the 129.20 region on Monday and climbs to a fresh daily top heading into the North American session. Spot prices, for now, seem to have stabilized above the 130.00 psychological mark, though remain well within a familiar trading range held over the past one-and-half week or so.
A goodish pickup in the US Treasury bond yields widens the US-Japan rate differential, which, in turn, is seen weighing on the Japanese Yen (JPY) and lending support to the USD/JPY pair. That said, a weaker risk tone, along with speculation that high inflation may invite a more hawkish stance from the Bank of Japan later this year, limit losses for the JPY. Apart from this, the underlying bearish sentiment surrounding the US Dollar keeps a lid on any meaningful upside for the major.
From a technical perspective, the recent recovery from the 127.20 area, or a multi-month low touched on January 16, has been along upward-sloping trend-line support. The USD/JPY pair, however, seem to struggle to capitalize on the move beyond the 100-period SMA on the 4-hour chart. This is followed by a stiff hurdle near the 130.60-130.65 heavy supply zone, which should now act as a key pivotal point. A sustained strength beyond should pave the way for some meaningful appreciating move.
Given that oscillators on hourly charts have again started gaining positive traction, the USD/JPY pair might then aim to reclaim the 131.00 round-figure mark. The momentum could get extended further towards the post-BoJ swing high, around the 131.55-131.60 area, en route to the 132.00 mark and the next hurdle near the 132.40-132.50 region.
On the flip side, the aforementioned ascending trend-line support, currently around the 129.15 area, might continue to protect the immediate downside. Some follow-through selling below the 129.00 mark will be seen as a fresh trigger for bearish traders and make the USD/JPY pair vulnerable. The subsequent slide could drag spot prices to the 128.00 round figure en route to the multi-month low, around the 127.20 region.
USD/JPY 4-hour chart
Key levels to watch
Commerzbank's Chief Economist, Dr Jörg Krämer, offers a brief analysis of the Preliminary German GDP, which showed that the Eurozone's largest economy contracted by 0.2% during the fourth quarter. This was below consensus estimates for a flat reading and the 0.4% growth recorded in the previous quarter.
Key Quotes:
“Contrary to guidance by the Federal Statistical Office, the Q4 German GDP declined somewhat on Q3 (-0.2%). This was mainly due to private consumption. Consumers are not immune to the erosion of their purchasing power by record high inflation. Another argument for an – albeit mild – recession is that the central banks in many countries had to massively raise their interest rates because of inflation. In addition, German companies have probably already worked off a good part of the high order backlog created during Corona. We still expect German GDP to shrink by 0.5%.”
- Gold price oscillates in a narrow range and is influenced by a combination of diverging forces.
- Bets for smaller rate hikes by the Federal Reserve undermine the US Dollar and lend support.
- Looming recession risks weigh on investors’ sentiment and also contribute to limiting losses.
- Rising US Treasury bond yields act as a headwind ahead of this week’s central bank meetings.
Gold price kicks off the new week on a subdued note and oscillates in a narrow trading band through the mid-European session. Currently placed around the $1,925 region, the XAU/USD remains confined within Friday's trading range as investors await this week's key central bank event risks before placing fresh directional bets.
Weaker US Dollar continues to lend support to Gold price
The Federal Reserve (Fed) will announce its decision at the end of a two-day monetary policy meeting on Wednesday. The markets have been pricing in a greater chance of a 25 basis points (bps) rate hike amid signs of easing inflationary pressures in the United States (US). The bets were lifted by the release of the US Core Personal Consumption Expenditures (PCE) Price Index, which decelerated to the 4.4% YoY rate in December from the 4.7% previous. This, in turn, keeps the US Dollar (USD) bulls on the defensive near a multi-month low and lends some support to the Gold price.
Pickup in US Treasury bond yields acts as headwind for Gold price
That said, the US fourth quarter Gross Domestic Product (GDP) print released last week pointed to a resilient economy, which could allow the Fed to stick to its hawkish stance for longer. This triggers a fresh leg up in the US Treasury bond yields and keeps a lid on the non-yielding Gold price. Hence, investors will look for clues about the Fed's future rate hikes. Apart from this, the focus will be on the European Central Bank (ECB) and the Bank of England (BoE) policy meetings on Thursday. This, in turn, will play a key role in determining the near-term trajectory for the XAU/USD.
Weaker risk tone contributes to limiting losses for Gold price
In the meantime, the prevalent risk-off environment - as depicted by a generally weaker tone around the equity markets - should act as a tailwind for the safe-haven Gold price. The worst yet COVID-19 outbreak in China raised uncertainty over a strong economic recovery and tempers investors' appetite for riskier assets. This, along with the protracted Russia-Ukraine war, has been fueling recession fears and taking its toll on the global risk sentiment. Hence, any subsequent dip in Gold price could be seen as a buying opportunity and is more likely to remain limited, at least for now.
Gold price technical outlook
From a technical perspective, Friday's swing low, around the $1,917-$1,916 area, now seems to protect the immediate downside. Any further decline is likely to attract fresh buyers near the $1,900 round figure, which should act as a pivotal point. A convincing break below might shift the near-term bias in favour of bearish traders and pave the way for a meaningful corrective pullback.
On the flip side, immediate strong resistance is pegged near the $1,949 area, or a multi-month top touched last Thursday. Some follow-through buying will be seen as a fresh trigger for bulls and lift the Gold price to the $1,969-$1,970 region. The momentum could get extended further, allowing the XAU/USD bulls to surpass an intermediate hurdle near the $1,980 zone and reclaim the $2,000 psychological mark for the first time since March 2022.
Key levels to watch
- EUR/USD regains the smile after two daily pullbacks in a row.
- Another test of the 2023 high near 1.0930 appears likely.
EUR/USD picks up upside traction and reclaims the area beyond 1.0900 the figure on Monday.
Bets for further advance are seen rising while above the 2-month support line around the 1.0700 mark.
Indeed, the continuation of the uptrend now needs to rapidly clear the 2023 high at 1.0929 (January 26) to allow for a test of the weekly top at 1.0936 (April 21 2022). A sustainable break above this level could pave the way for a challenge of the key barrier at 1.1000 sooner rather than later.
In the longer run, the constructive view remains unchanged while above the 200-day SMA, today at 1.0310.
EUR/USD daily chart
Senior Economist at UOB Group Alvin Liew reviews the latest US GDP figures during the October-December period.
Key Takeaways
“The advance estimate of the 4Q 2022 GDP surprised on the upside with a 2.9% q/q SAAR expansion (versus Bloomberg est +2.6%), from an unchanged 3.2% in 3Q. Compared to one year ago, the US GDP grew by +1.0% y/y in 4Q, easing from 1.9% in 3Q. For the full year, US GDP grew by 2.1% in 2022, from 5.9% in 2021.”
“The 2.9% expansion in 4Q was due to the volatile private inventories which contributed to half of the gain while government spending rose the fastest pace since 1Q 2021. While private consumption expenditure (PCE) rose in 4Q, it came in below expectations and together with the disappointment from the inflation adjusted sales to private domestic buyers, raised concerns about US consumer, under the weight of an elevated inflation environment. Non-residential fixed investment (business spending) also rose at a much slower pace in 4Q while net exports contributed mainly due to weak imports, which again pointed to concerns about US domestic demand.”
“US GDP Outlook - For 2023, we continue to expect the US economy to fall into a shallow recession due to the combination of elevated inflation, aggressive Fed rate hikes and global growth slowdown with a European recession. We keep our projection for US GDP to contract by 0.5% in 2023. The US labor market remains incredibly resilient and we do not expect the US to fall into a deeper recession unless we get a more protracted and sharper Fed tightening cycle.”
- The index comes under pressure and breaches 102.00 on Monday.
- Bouts of weakness could retest the 101.50 region near term.
DXY leaves behind two consecutive daily advances and returns to the sub-102.00 region at the beginning of the week.
In case sellers regain the upper hand, another test of the YTD low at 101.50 could start gathering momentum prior to the May 2022 low around 101.30 (May 30). Further south comes the psychological 100.00 level.
In the longer run, while below the 200-day SMA at 106.47, the outlook for the index remains negative.
DXY daily chart
Global Strategy Team at TD Securities (TDS) sounds optimistic and expects Australian Retail Sales to rise by 0.5% in December. The data is due for release during the Asian session on Tuesday.
Key Quotes:
“After the stunning rebound in November, we expect retail sales to continue its outperformance. We project sales to rise by 0.5% m/m in December (Nov: +1.4%), contrary to consensus which expect a 0.3% decline. Consumers may feel the urge to spend and splash the cash and credit card after spending the last three straight COVID Christmases under lock and key. However, we don't expect consumers to keep up this spending spree as higher interest rates and inflation will shrink household real incomes soon. More importantly, the Q4 CPI affirms another 25bps hike from the RBA next week though a stronger retail print may give the Bank more room to take the terminal rate higher.”
The continuation of the downtrend looks likely in USD/IDR in the short term, comments Markets Strategist at UOB Group Quek Ser Leang.
Key Quotes
“USD/IDR dropped sharply and rapidly over the last couple of weeks. While further USD/IDR weakness is not ruled out, any further decline is unlikely to challenge the major support at 14,770 this week.”
“On a shorter-term note, 14,850 is already quite a strong support level. Resistance is at 15,100, followed by 15,200.”
- EUR/JPY starts the week with strong gains well north of 141.00
- Extra choppiness remains on the cards for the time being.
EUR/JPY extends the erratic performance for yet another session on Monday, this time advancing sharply beyond the 141.00 barrier.
Extra consolidation should not be ruled out in the very near term. In case the downside accelerates, the next support of note emerges at the 200-day SMA, today at 140.84. A sustainable drop below the latter exposes extra weakness to, initially, the 138.00 neighbourhood.
The constructive outlook for EUR/JPY is seen unchanged above the 200-day SMA for the time being.
EUR/JPY daily chart
According to Markets Strategist at UOB Group Quek Ser Leang, USD/MYR faces a solid support around 4.20 for the time being.
Key Quotes
“USD/MYR dropped to a fresh 9-1/2month low of 4.2200 last week before closing lower by 0.98% (Friday’s close of 4.2410).”
“Further USD/MYR weakness is not ruled out but in view of the deeply oversold conditions, any decline is unlikely to break the support at 4.2000 (4.2200 is likely to offer strong support already). Resistance is at 4.2650.”
FX option expiries for January 30 NY cut at 10:00 Eastern Time, via DTCC, can be found below.
- USD/JPY: USD amounts
- 130.00 435m
- AUD/USD: AUD amounts
- 0.7050 419m
Reuters notes: "A programming glitch means Refinitiv SDRV is only showing DTCC trades done before 03 Dec 2022. Specialists are working on a fix and apologise for the inconvenience."
- Silver struggles to capitalize on a modest uptick and fails near the $23.80 support breakpoint.
- The mixed technical setup warrants some caution before placing aggressive directional bets.
- A sustained move beyond the $24.50 area is needed to negate any near-term negative outlook.
Silver builds on Friday's modest bounce from the $23.30 area and gains some positive traction on the first day of a new week. The white metal, however, struggles to capitalize on the strength and remains capped near the $23.70-$23.80 confluence support breakpoint, comprising the 200-hour SMA and the lower end of a short-term ascending channel.
From a technical perspective, last week's break below the aforementioned confluence support suggests that the near-term bias might have already shifted in favour of bearish traders. That said, oscillators on daily/hourly charts - though have been losing momentum - are yet to confirm the negative outlook. This, in turn, warrants some caution before positioning for any further depreciating move.
In the meantime, Friday's swing low, around the $23.30 region, now seems to act as immediate support. A convincing break below will make the XAG/USD vulnerable to weaken below the $23.00 mark and test the next relevant support near the $22.75 area. The downward trajectory could eventually drag the white metal towards the $22.20-$22.15 intermediate support en route to the $22.00 round figure.
On the flip side, momentum beyond the $23.70-$23.80 support-turned-resistance, might confront hurdle near the $24.00 mark. This is followed by last week's peak, around the $24.30 region, and the $24.50-$24.55 supply zone, or a multi-month peak touched on January 3. A sustained above should allow the XAG/USD to aim back to reclaim the $25.00 psychological mark for the first time since April 2022.
Silver 1-hour chart
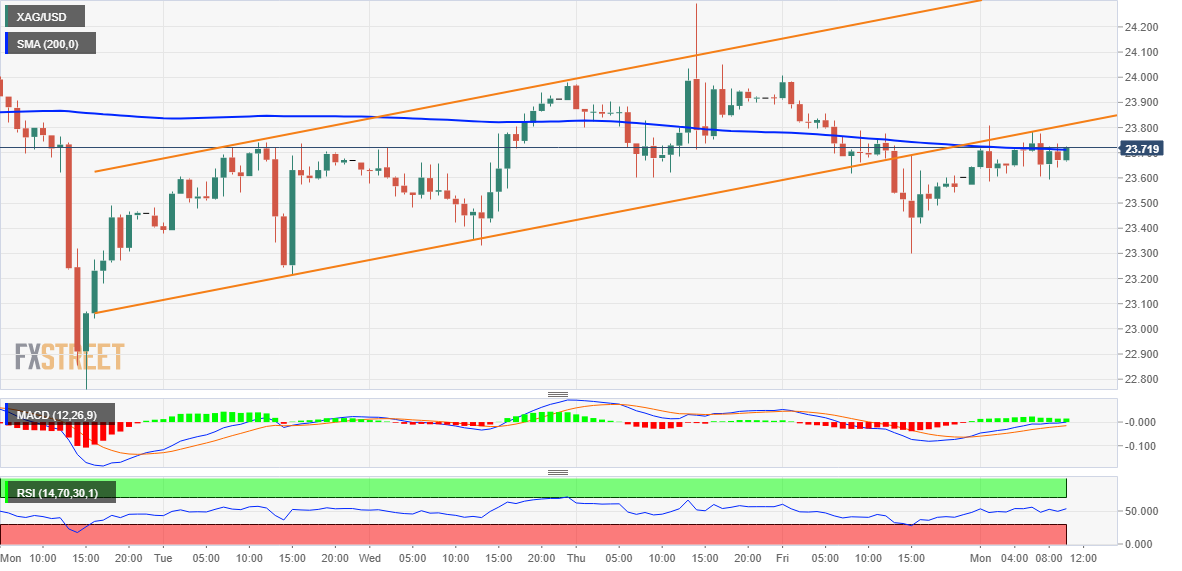
Key levels to watch
- Economic Sentiment Indicator improved at a stronger pace than expected in Eurozone.
- EUR/USD gained traction after the data and climbed above 1.0900.
The data published by the European Commission revealed on Monday that the Economic Sentiment Indicator in the Euro area and the EU improved to 99.9 and 98, respectively.
Further details of the publication showed that the Industrial Confidence in the Euro area rose to 1.3 from -0.6 in December, the Services Sentiment advanced to 10.7 from 7.7. Finally, the Consumer Confidence Index came in at -20.9, matching the flash estimate.
Market reaction
EUR/USD edged higher with the initial reaction and was last seen trading in positive territory above 1.0900.
Markets Strategist at UOB Group Quek Ser Leang suggests USD/THB could navigate within the 32.55-33.05 range in the next few weeks.
Key Quotes
“After dropping to a low of 32.57 last Monday (23 Jan), USD/THB traded sideways for the rest of the week. The combination of waning downward momentum and oversold conditions suggests USD/THB has moved into a consolidation phase.”
“In other words, USD/THB is expected to trade sideways, likely between 32.60 and 33.05. Looking ahead, if USD/THB breaks and holds below 32.55, it could signal a decline to 32.35.”
- USD/CAD stages a modest recovery from over a two-month low touched earlier this Monday.
- A softer tone around crude oil prices undermines the Loonie and acts as a tailwind for the pair.
- Subdued USD price action holds back bulls from placing aggressive bets and caps the upside.
The USD/CAD pair attracts some buyers near the 1.3300 mark and stages a goodish intraday bounce from over a two-month low touched earlier this Monday. The pair sticks to the recovery gains through the first half of the European session and is currently placed near the top end of the daily range, just below mid-1.3300s.
Crude oil prices remain depressed for the second straight day, which, in turn, is seen undermining the commodity-linked Loonie and acting as a tailwind for the USD/CAD pair. An indication of a rise in crude exports from Russia's Baltic ports in early February, to a larger extent, offsets the optimism over a demand recovery in China. Adding to this, expectations that OPEC+ will likely keep output unchanged during a meeting this week weighs on the black liquid.
The upside for the USD/CAD pair, meanwhile, seems capped amid the underlying bearish sentiment around the US Dollar. The prospects for a less aggressive policy tightening by the Fed keep the USD bulls on the defensive near a nine-month low touched last week. Traders, however, seem reluctant and prefer to move to the sidelines ahead of the highly-anticipated FOMC monetary policy decision, scheduled to be announced at the end of a two-day meeting on Wednesday.
In the absence of any relevant market-moving economic releases, either from the US or Canada on Monday, the aforementioned fundamental backdrop warrants caution before placing directional bets. Nevertheless, the USD/CAD pair, for now, manages to hold above the 1.3300 round-figure mark and remains at the mercy of the USD/oil price dynamics. The said handle could act as a pivotal point, which if broken decisively should pave the way for a further near-term depreciating move.
Technical levels to watch
- German economic activity contracted in the last quarter of the year.
- EUR/USD clings to modest daily gains, trades below 1.0900.
The preliminary data published by Germany's Destatis revealed on Monday that the German economy contracted by 0.2% on a quarterly basis in the second quarter. At an annualized rate, the Gross Domestic Product grew 1.1%, down from 1.3% recorded in the third quarter, and missed the market expectation of 1.3%.
"After the German economy managed to perform well despite difficult conditions in the first three quarters, economic performance slightly decreased in the fourth quarter of 2022", Destatis noted in its publication. "Especially the price, seasonally and calendar adjusted private consumption expenditure, which had supported the German economy in the first three quarters, was lower than in the previous quarter."
Market reaction
EUR/USD showed no immediate reaction and was last seen posting modest daily gains on the day at around 1.0880.
Another probable visit to the 6.6985 level still remains in the pipeline in USD/CNH, comment UOB Group’s Markets Strategist Quek Ser Leang and Senior FX Strategist Peter Chia.
Key Quotes
24-hour view: “We expected USD to ‘weaken further’ last Friday. However, after dipping to a low of 6.7226, USD rebounded strongly to 6.7720 before pulling back to close at 6.7555. The price movements are likely part of a broad consolidation range and USD is expected to trade between 6.7300 and 6.7700 today.”
Next 1-3 weeks: “Last Friday (27 Jan, spot at 6.7310), we highlighted that downward momentum is building quickly and we expect USD to weaken toward the month-to-date low near 6.6985. While there is no change in our view for now, the rebound to a high of 6.7720 has dented the downward momentum. Overall, only a breach of 6.7760 (‘strong resistance’ level) would indicate that the build-up in downward momentum has faded.”
- GBP/USD struggles to gain any meaningful traction and oscillates in a narrow band on Monday.
- Traders now seem reluctant to place fresh bets ahead of this week’s key central bank event risks.
- Bets for smaller Fed rate hikes continue to undermine the USD and lend some support to the pair.
The GBP/USD pair kicks off the new week on a subdued note and seesaws between tepid gains/minor losses through the early European session. The pair remains confined in a multi-day-old trading range and is currently placed just below the 1.2400 round-figure mark.
Traders now seem to have moved to the sidelines ahead of this week's central bank event risks, which, in turn, fails to provide any meaningful impetus to the GB/USD pair. The Federal Reserve is scheduled to announce its decision at the end of a two-day policy meeting on Wednesday. This will be followed by the latest monetary policy update by the Bank of England (BoE) on Thursday and will help determine the next leg of a directional move for the major.
In the meantime, speculations that elevated consumer inflation will force the Bank of England (BoE) to continue lifting rates offer some support to the British Pound. This, along with the underlying bearish sentiment surrounding the US Dollar, acts as a tailwind for the GBP/USD pair. In fact, the USD Index, which tracks the Greenback against a basket of currencies, languishes near a nine-month low amid bets for smaller rate hikes by the Fed.
Investors now seem convinced that the US central bank will soften its hawkish stance amid signs of easing inflationary pressures. The expectations were reaffirmed by Friday's release of the Fed's preferred inflation gauge - the Core PCE Price Index from the US, which fell to the 4.4% YoY rate in December from 4.7% previous. Other US macro data released recently, however, backed the case for the Fed to maintain its hawkish stance for longer.
Hence, investors will look for cues about the Fed's future rate hikes, which will play a key role in influencing the USD price dynamics and provide a fresh directional impetus to the GBP/USD pair. Heading into the key event risk, spot prices seem more likely to prolong the consolidative price move in the absence of any relevant market-moving economic releases, either from the UK or the US on Monday.
Technical levels to watch
- EUR/USD picks up pace and retargets the 1.0900 barrier.
- Advanced German Q4 GDP Growth Rate next on tap.
- US Dallas Fed index, short-term auctions come later in the NA session.
The European currency starts the new trading week on the positive foot and lifts EUR/USD back to the vicinity of the key barrier at 1.0900 the figure on Monday.
EUR/USD remains focused on the FOMC, ECB events
EUR/USD reclaims ground lost and manages to regain the smile after two consecutive daily pullbacks, shifting its focus at the same time to the 1.0900 neighbourhood amidst the broad-based cautious stance ahead key events later in the week.
Indeed, the FOMC meets on Wednesday and a 25 bps rate hike is largely anticipated, while the ECB is predicted to raise its policy rate by half percentage point on Thursday.
Investors’ attention, in the meantime, should remain on the potential future moves by these two major central banks, where the sentiment among investors remain at the mercy of hawkish messages from the Fed/ECB policy makers, the likelihood of Fed’s pivot, improved growth prospects in the euro region and the resilience of the US economy.
In the domestic calendar, Germany’s advancedQ4 GDP Growth Rate is next on tap seconded by final Consumer Confidence and Economic Sentiment in the broader Euroland. In the US, the Dallas Fed Manufacturing Index will be the sole release on Monday.
What to look for around EUR
The sharp yearly rally in EUR/USD appears to have met an initial and decent barrier around the 1.0930 for the time being.
In the meantime, price action around the European currency should continue to closely follow dollar dynamics, as well as the potential next steps from the ECB and the Federal Reserve at their upcoming gatherings in the next week.
Back to the euro area, recession concerns now appear to have dwindled, which at the same time remain an important driver sustaining the ongoing recovery in the single currency as well as the hawkish narrative from the ECB.
Key events in the euro area this week: Germany Flash Q4 GDP Growth Rate, EMU Final Consumer Confidence, Economic Sentiment (Monday) – Germany Retail Sales/Unemployment Rate/Flash Inflation Rate, EMU Flash Q4 GDP Growth Rate (Tuesday) – Germany, EMU Final Manufacturing PMI, EMU Flash Inflation Rate/Unemployment Rate (Wednesday) – Germany Balance of Trade, ECB Interest Rate Decision, ECB Lagarde (Thursday) - Germany, EMU Final Services PMI (Friday).
Eminent issues on the back boiler: Continuation of the ECB hiking cycle amidst dwindling bets for a recession in the region and still elevated inflation. Impact of the Russia-Ukraine war on the growth prospects and inflation outlook in the region. Risks of inflation becoming entrenched.
EUR/USD levels to watch
So far, the pair is gaining 0.17% at 1.0884 and faces the next resistance at 1.0929 (2023 high January 26) followed by 1.0936 (weekly high April 21 2022) and finally 1.1000 (round level). On the other hand, the breakdown of 1.0766 (weekly low January 17) would target 1.0608 (55-day SMA) en route to 1.0481 (monthly low January 6).
USD/JPY is now expected to embark on a consolidative phase in the next weeks, likely within the 128.00-130.80 range.
Key Quotes
24-hour view: “We highlighted last Friday that USD ‘appears to have moved into a consolidation phase and it is likely to trade between 129.10 and 130.55’. Our view for consolidation was not wrong even though USD traded within a narrower range than expected (129.45/130.27). We continue to expect USD to consolidate, likely within a range of 129.35/130.30.”
Next 1-3 weeks: “There is not much to add to our latest update from last Thursday (26 Jan, spot at 129.25). As highlighted, the current movement in USD is likely part of a consolidation phase and we expect USD to trade within a range of 128.00/130.80 for now.”
Open interest in natural gas futures markets increased for the fourth consecutive session on Friday, this time by around 9.7K contracts according to preliminary readings from CME Group. Volume, instead, reversed two daily builds in a row and went down by around 233.2K contracts.
Natural Gas: Next on the downside comes $2.45
Prices of the natural gas remained well on the defensive on Friday. The move was on the back of rising open interest, which should keep the downtrend well in place for the time being. Against that, the next support of note for the commodity comes at the April 2021 lows near $2.45 per MMBtu.
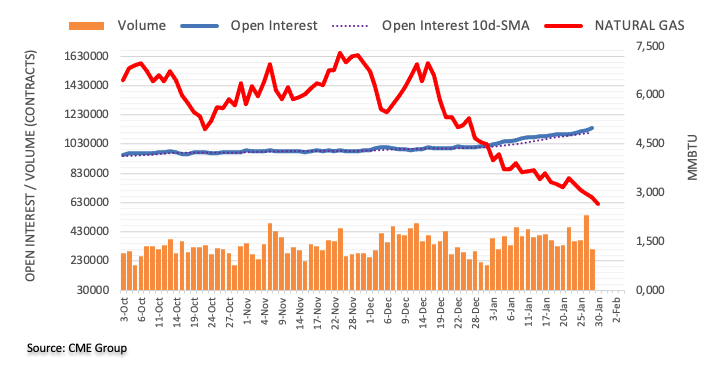
- AUD/USD comes under some selling pressure on Monday and hits a fresh daily low in the last hour.
- A weaker tone around the equity markets is seen exerting pressure on the risk-sensitive Aussie.
- Bets for smaller Fed rate hikes keep the USD depressed and should help limit losses for the major.
The AUD/USD pair attracts some sellers following an early uptick to the 0.7120 area on Monday and remains on the defensive through the early European session on Monday. Spot prices drop to a three-day low, around the 0.7075 region in the last hour, though any meaningful downside still seems elusive.
A softer risk tone - as depicted by a weaker trading sentiment around the equity markets - is seen as a key factor driving flows away from the risk-sensitive Aussie. Despite China's move to scale back its strict zero-COVID policy in December, the worst yet COVID-19 outbreak in the country has been fueling uncertainty about a strong economic recovery. This, in turn, tempers investors' appetite for riskier assets and keeps a lid on any optimism in the markets.
The downside for the AUD/USD pair, meanwhile, is likely to remain cushioned, at least for now, amid subdued US Dollar price action. In fact, the USD Index, which tracks the Greenback against a basket of currencies, languishes near a nine-month low amid firming expectations for a less aggressive policy tightening by the Fed. The markets seem convinced that the US central bank will soften its hawkish stance and expect a smaller 25 bps rate hike on Wednesday.
The bets were lifted by Friday's release of the US Personal Consumption Expenditures (PCE) data, which showed that the Core PCE Price Index fell to the 4.4% YoY rate in December from the 4.7% previous. That said, other US macro data released recently pointed to a resilient economy and backed the case for the Fed to maintain its hawkish stance for longer. Hence, the focus will remain on the outcome of a two-day FOMC meeting, which might provide cues on future rate hikes.
Heading into the key central bank event risk, traders might refrain from placing aggressive bets and prefer to move to the sidelines. Apart from this, rising odds for an additional rate hike by the Reserve Bank of Australia (RBA) in February could underpin the Australian dollar and help limit any meaningful corrective pullback for the AUD/USD pair. This makes it prudent to wait for strong follow-through selling before confirming that spot prices have topped out.
Technical levels to watch
According to UOB Group’s Markets Strategist Quek Ser Leang and Senior FX Strategist Peter Chia, AUD/USD could see its upside momentum mitigated on a breach of 0.7040.
Key Quotes
24-hour view: “We highlighted last Friday that ‘upward pressure has eased and AUD is unlikely to advance much further’ and we expected AUD to ‘trade in a range between 0.7085 and 0.7145’. Our view for range-trading was not wrong even though AUD traded within a narrower range than expected (0.7083/0.7130). Momentum indicators are mostly flat and AUD could continue to trade in a range, likely between 0.7075 and 0.7125.”
Next 1-3 weeks: “Our most recent narrative was from last Thursday (26 Jan, spot at 0.7100) where we highlighted that ‘the improved upward momentum suggests AUD is likely to advance further’. However, AUD has not been able to make much headway on the upside as it traded in a relatively quiet manner the past couple of days. Upward momentum is beginning to ease but only a breach of 0.7040 (no change in ‘strong support’ level) would indicate that AUD is advancing further.”
Considering advanced prints from CME Group for crude oil futures markets, open interest extended the uptrend on Friday, now by around 20.3K contracts. In the same line, volume rose for the second consecutive day, this time by around 146.4K contracts.
WTI: Initial support comes at the $78.00 region
Friday’s decline in prices of the WTI came amidst increasing open interest and volume, and this is supportive of the continuation of the corrective retracement in the very near term at least. That said, there is an initial support at the weekly low at $78.18 (January 19).
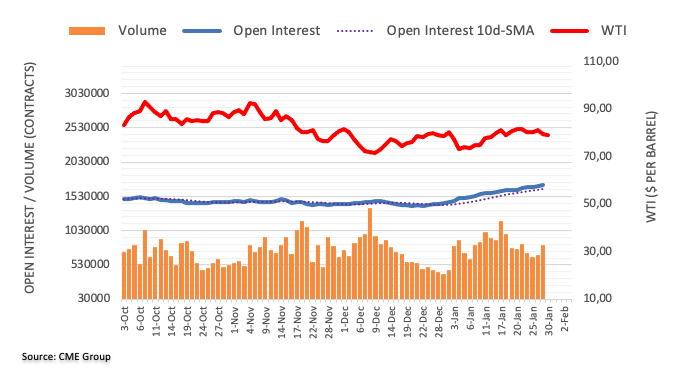
Here is what you need to know on Monday, January 30:
Markets stay relatively quiet early Monday as investors move to the sidelines to gear up for critical central bank policy announcements later in the week. Following the modest recovery witnessed in the second half of the previous week, the US Dollar Index continues to fluctuate in a tight channel at around 102.00. The benchmark 10-year US Treasury bond yield holds steady near 3.5% and US stock index futures trade modestly lower on the day. Business and consumer sentiment data from the Eurozone and German Gross Domestic (GDP) figures will be looked upon for fresh impetus later in the session. The US economic docket will feature the Federal Reserve Bank of Dallas' Texas Manufacturing Survey.
The data published by the US Bureau of Economic Analysis revealed on Friday that the annual Core Personal Consumption Expenditures (PCE) Price Index declined to 4.4% in December from 4.7% in November. This reading came in line with the market expectation and failed to trigger a significant market reaction.
Meanwhile, the Shanghai Composite Index opened modestly higher following a long break and was last seen clinging to small daily gains. On a negative note, Hong Kong's Hang Seng Index is down more than 2% on a daily basis. China’s Center for Disease Control and Prevention (CDC) recently noted that the current wave of COVID-19 infections was nearing an end and added that there was no significant rebound in cases during the Lunar New Year holiday.
EUR/USD closed the previous week virtually unchanged slightly below 1.0900. Although the pair edged slightly higher in the early trading hours of the Asian session, it is having a difficult time gathering directional momentum. German economy is forecast to post an annualized growth of 1.1% in the fourth quarter.
GBP/USD struggled to make a decisive move in either direction ahead of the weekend and ended the week flat below 1.2400. In the early European session, the pair extends its sideways grind. While speaking on Friday, UK Chancellor of the Exchequer, Jeremy Hunt, said that the best tax cut would be a "cut in inflation."
USD/JPY fell sharply toward 129.00 during the Asian trading hours on Monday before recovering to the 129.50 area. Reuters reported earlier that a panel of academics and business executives urged the Bank of Japan (BoJ) to make its 2% inflation target a long-term goal. The proposal reportedly also included the need to have interest rates rise more in line with economic fundamentals and normalize Japan's bond market function. In the meantime, “I believe it's possible to achieve 2% inflation target, accompanied by wage growth, by continuing current easy policy,” BoJ Governor Haruhiko Kuroda reiterated earlier in the day.
Gold price staged a downward correction and erased its weekly gains in the second half of the week. At the time of press, XAU/USD was posting small daily gains at around $1,930.
Following a three-day consolidation phase, Bitcoin gained traction and advanced toward $24,000 on Sunday. As of writing, BTC/USD was moving sideways near $23,700. Ethereum rose nearly 5% on Sunday and ended up posting small weekly gains. ETH/USD seems to have gone under modest bearish pressure early Monday and was last seen losing nearly 1% on the day at $1,630.
- The index treads water near the 102.00 region on Monday.
- Markets’ attention remains on the upcoming FOMC event.
- The Fed is expected to hike by 25 bps on Wednesday.
The greenback, in terms of the USD Index (DXY), exchanges gains with losses in the 102.00 neighbourhood at the beginning of the week.
USD Index remains consolidative ahead of FOMC
The index looks to add to the recovery emerged in the second half of last week and flirts once again with the 102.00 barrier amidst vacillating risk appetite trends and steady cautiousness ahead of the upcoming FOMC gathering (February 1).
On the latter, investors have already priced in a 25 bps rate raise, although expectations around the next steps when it comes to the rate path as well as a potential emergence of a pivot in the monetary stance are expected to keep driving the sentiment in the next couple of sessions.
In the US data space, the Dallas Fed Manufacturing Index and short-term bill auctions will be the only events later in the NA session.
What to look for around USD
The dollar remains side-lined around the 102.00 zone against the backdrop of persistent prudence ahead of the upcoming FOMC gathering.
The idea of a probable pivot in the Fed’s policy continues to hover around the greenback and keeps the price action around the DXY somewhat subdued. This view, however, also comes in contrast to the hawkish message from the latest FOMC Minutes and recent comments from rate setters, all pointing to the need to advance to a more restrictive stance and stay there for longer, at the time when rates are seen climbing above the 5.0% mark.
On the latter, the tight labour market and the resilience of the economy are also seen supportive of the firm message from the Federal Reserve and the continuation of its hiking cycle.
Key events in the US this week: FHFA House Price Index, CB Consumer Confidence (Tuesday) – MBA Mortgage Applications, ADP Employment Change, Final Manufacturing PMI, ISM Manufacturing, Construction Spending, FOMC Interest Rate Decision (Wednesday) – Initial Jobless Claims, Factory Orders (Thursday) – Nonfarm Payrolls, Unemployment Rate, Final Services PMI ISM Non-Manufacturing (Friday).
Eminent issues on the back boiler: Rising conviction of a soft landing of the US economy. Prospects for extra rate hikes by the Federal Reserve vs. speculation of a recession in the next months. Fed’s pivot. Geopolitical effervescence vs. Russia and China. US-China trade conflict.
USD Index relevant levels
Now, the index is up 0.02% at 101.93 and the immediate hurdle comes at the weekly high at 102.89 (January 18) followed by 105.63 (monthly high January 6) and then 106.47 (200-day SMA). On the flip side, the breach of 101.50 (2023 low January 26) would open the door to 101.29 (monthly low May 30 2022) and finally 100.00 (psychological level).
- USD/JPY struggles to gain any meaningful traction and seesaws between tepid gains/minor losses.
- A softer risk tone benefits the safe-haven JPY and exerts pressure amid a modest USD weakness.
- Dovish-sounding comments by the BoJ Governor help limit any meaningful downside for the pair.
The USD/JPY pair attracts some intraday sellers near the 130.30 area on Monday and retreats over 100 pips from the daily peak. Spot prices, however, remain well within a one-week-old trading range and now seem to have stabilized above the mid-129.00s during the early European session.
The Japanese Yen (JPY) continues to draw support from fresh speculation that high inflation may invite a more hawkish stance from the Bank of Japan later this year. Apart from this, a generally weaker tone around the equity markets further underpins the safe-haven JPY. This, along with the underlying bearish sentiment surrounding the US Dollar, exerts some downward pressure on the USD/JPY pair and contributes to the intraday slide.
In fact, the USD Index, which tracks the greenback against a basket of currencies, languishes near a multi-month low amid firming expectations for a less aggressive policy tightening by the Fed. The markets seem convinced that the US central bank will soften its hawkish stance and deliver a smaller 25 bps rate hike at the end of a two-day meeting on Wednesday. This keeps the US Treasury bond yields depressed and weighs on the USD.
Heading into the key central bank event risk, traders seem reluctant to place aggressive bearish bets around the USD/JPY pair. Apart from this, comments by BoJ Governor Kuroda Haruhiko, saying that the central bank must continue the easy policy and maintain the 2% inflation target, cap the upside for the JPY. This further warrants some caution before positioning for any meaningful downside for the major, at least for the time being.
Technical levels to watch
- Gold price retreats from intraday high while paring the first daily gains in three.
- Cautious mood ahead of key data/events challenge XAU/USD traders.
- Softer yields probe US Dollar rebound and Gold bears.
- Multiple technical indicators highlight $1,917-18 as the key support confluence.
Gold price (XAU/USD) stays defensive around $1,930, printing mild gains heading into Monday’s European session, as traders begin the key week comprising the Federal Reserve’s (Fed) monetary policy and the US employment data for January. Adding strength to the cautious optimism of the XAU/USD traders could be China’s return from one-week-long holidays, as well as hopes of a dovish hike from the Fed and downbeat Nonfarm Payrolls (NFP).
It’s worth noting that a slower start to the key week comprising a heavy load of economics also seems to underpin the corrective bounce of the Gold prices from a short-term key support confluence. That said, the metal’s short-term moves depend upon how well the Fed manages to push back the dovish bias despite confirming the nearness to the policy pivot.
Also read: Gold Price Forecast: XAU/USD shows resilience below 200-hour SMA, bulls have the upper hand
Gold Price: Key levels to watch
The Technical Confluence Detector shows that the Gold price grinds higher past $1,918-17 support confluence, comprising the previous daily low, Pivot Point One Month R3 and Pivot Point One-day S1.
Ahead of that, the Fibonacci 61.8% on one-week joins 10-DMA to offer immediate support to the XAU/USD around $1,927.
That said, the $1,900 round figure appears the likely target for the Gold bears once they manage to conquer the $1,917 support.
On the contrary, Pivot Point one-day R1, Fibonacci 38.2% on one-week and previous daily high challenges short-term Gold buyers around $1,937.
In a case where XAU/USD remains firmer past $1,937, Pivot Point one week R1 and Fibonacci 161.8% on one day could challenge the Gold buyers around $1,950 level.
Here is how it looks on the tool
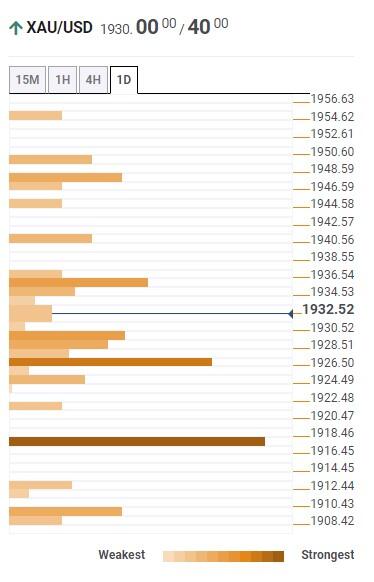
About Technical Confluences Detector
The TCD (Technical Confluences Detector) is a tool to locate and point out those price levels where there is a congestion of indicators, moving averages, Fibonacci levels, Pivot Points, etc. If you are a short-term trader, you will find entry points for counter-trend strategies and hunt a few points at a time. If you are a medium-to-long-term trader, this tool will allow you to know in advance the price levels where a medium-to-long-term trend may stop and rest, where to unwind positions, or where to increase your position size.
In the opinion of UOB Group’s Markets Strategist Quek Ser Leang and Senior FX Strategist Peter Chia, further strength in GBP/USD could be running out of steam.
Key Quotes
24-hour view: “We highlighted last Friday that ‘while upward momentum has waned, there is room for GBP to test 1.2450 first before the risk of a more sustained pullback increases’. However, GBP did not test 1.2450 as it traded between 1.2346 and 1.2419 before closing modestly lower at 1.2400 (-0.01%). The price actions appear to be part of a consolidation phase and GBP is likely to trade sideways today, expected to be between 1.2350 and 1.2425.”
Next 1-3 weeks: “Last Thursday (26 Jan, spot at 1.2400), we highlighted that GBP is likely to edge above 1.2450 but as upward momentum is not strong, it remains to be seen if GBP can break 1.2500. GBP has not been able to make much headway on the upside. Upward momentum has waned but as long as 1.2315 (‘strong support’ level previously at 1.2300) is not breached, there is still a slim chance for GBP to break above 1.2450.”
CME Group’s flash data for gold futures markets noted traders scaled back their open interest positions for the second session in a row on Friday, this time by around 11.4K contracts. Volume followed suit and shrank by around 58.8K contracts.
Gold: Another visit to $1950 appears on the cards
Gold prices added to Thursday’s losses on Friday, although the daily pullback was on the back of diminishing open interest and volume, exposing a near-term rebound to, initially, the YTD highs around $1950 per ounce troy.
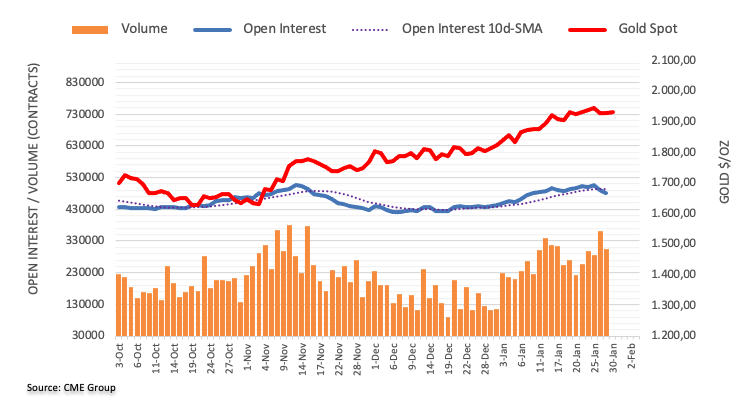
UOB Group’s Markets Strategist Quek Ser Leang and Senior FX Strategist Peter Chia suggest EUR/USD could now trade between 1.0800 and 1.0930 in the next few weeks.
Key Quotes
24-hout view: “We expected EUR to ‘consolidate between 1.0855 and 1.0925’ last Friday. However, EUR dropped to 1.0835 before rebounding to close at 1.0867 (-0.20%). Despite the decline, downward momentum has barely improved and EUR is unlikely to weaken further. Today, EUR is more likely to trade sideways, expected to be within a range of 1.0840/1.0900.”
Next 1-3 weeks: “Our latest narrative was from last Thursday (26 Jan, spot at 1.0920) when we highlighted that while upward momentum has not improved much, EUR appears poised to head higher toward 1.1000. On Friday, EUR dropped below our ‘strong support’ level of 1.0840. The breach of the ‘strong support’ indicates the mild upward pressure has eased. EUR appears to have entered a consolidation phase and it is likely to trade between 1.0800 and 1.0930 for the time being.”
- WTI takes offers to refresh intraday low, extends Friday’s loss.
- Failure to cross previous support line, downbeat oscillators keep Oil bears hopeful.
- Key SMAs restrict immediate downside as RSI approaches oversold territory.
WTI crude oil remains on the back foot for the second consecutive day after reversing from a one-week high the previous day, down 0.30% intraday near $79.30 heading into Monday’s European session.
In doing so, the black gold pokes the 100-bar Simple Moving Average (SMA), around $79.20 by the press time.
The energy benchmark’s weakness could be linked to the quote’s early Asian session failure to cross the support-turned-resistance from January 12. Adding strength to the bearish bias could be the downbeat MACD signals, as well as descending RSI (14) line.
It’s worth noting, however, that the downside break of the 100-SMA level of $79.20 may have a tough time in pleasing the Oil bears as the $79.00 threshold and the 200-SMA, close to $78.15, could challenge the quote’s further downside.
In a case where the WTI drops below $78.15, a slump toward the early-month swing high near $76.90 can’t be ruled out.
Alternatively, recovery moves need to cross the previous support line surrounding $80.60 to convince Oil buyers.
Even so, multiple tops around $82.65-70 appear the key hurdle for the WTI bulls to cross to convince markets.
Overall, WTI crude oil is likely to decline further but the downside room appears limited.
WTI: Four-hour chart
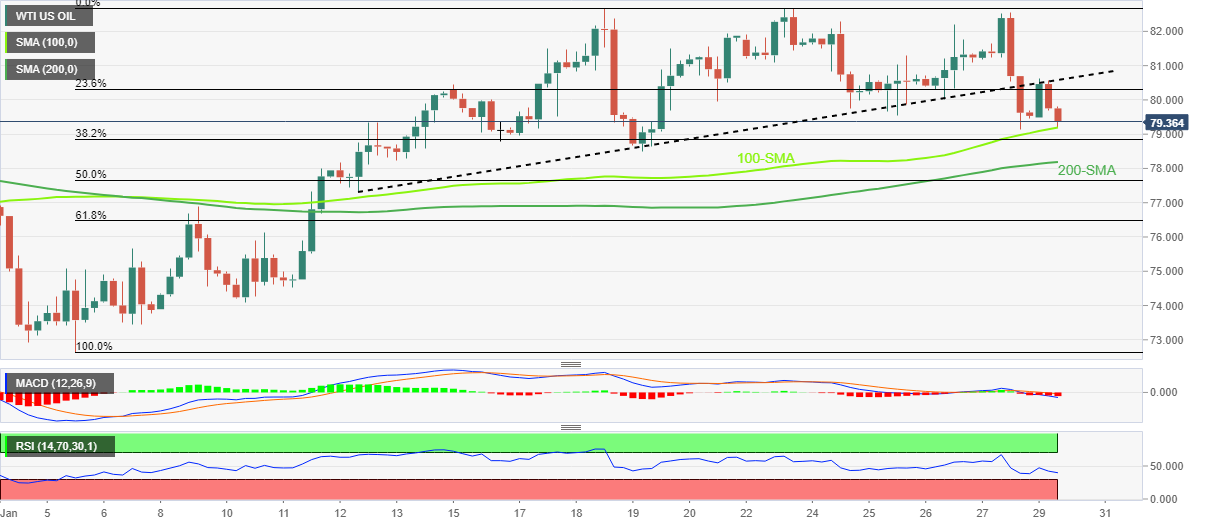
Trend: Limited downside expected
- NZD/USD is facing hurdles in shifting its auction above 0.6500 amid a recovery in the USD Index.
- Softening consumer spending has bolstered the expectations of a smaller interest rate hike by the Fed.
- This week, the release of the NZ Employment data will be of utmost importance.
The NZD/USD pair is failing in keeping its auction above the psychological resistance of 0.6500 in the early European session. The Kiwi asset is facing pressure as the US Dollar index (DXY) has shown a perpendicular recovery move after a sheer decline to near 101.40. The recovery move in the USD Index is quite strong and is showing signs of vertical decline in the risk appetite of the market participants.
S&P500 futures are continuously adding more losses as investors have underpinned the risk-aversion theme amid soaring volatility ahead of the interest rate decision by the Federal Reserve (Fed). While the alpha generated by the US government bonds has trimmed as investors are seeing a lower terminal rate than previously anticipated. The 10-year US Treasury yields have dropped to near 3.50%.
Softening consumer spending and Personal Consumption Expenditure (PCE) Price Index have bolstered the expectations of a smaller interest rate hike by the Fed. It is worth noting that Fed chair Jerome Powell has already trimmed the scale of interest rate hikes in its December monetary policy meeting to 50 basis points (bps) after announcing four consecutive 75 bps rate hikes. The Fed is expected to trim the scale of the interest rate hike further by 25 bps.
On the New Zealand front, investors are awaiting the release of the Employment data, which is due on Wednesday. The Employment Change (Q4) is expected to drop to 0.7% from the former release of 1.3%. While the Unemployment Rate is seen unchanged at 3.3%. The New Zealand economy is failing to generate significant employment opportunities amid higher interest rates by the Reserve Bank of New Zealand (RBNZ).
- USD/CAD keeps bounce off 2.5-month low while snapping two-day downtrend.
- Shift in market sentiment exerts downside pressure on Oil price, favors US Dollar.
- China-linked headlines entertain traders amid a light calendar.
- Fed’s dovish hike, softer NFP appears necessary for bears to keep the reins.
USD/CAD picks up bids to refresh intraday high around 1.3325 during the first positive day in three heading into Monday’s European session. In doing so, the Loonie pair takes clues from the downbeat Oil prices, Canada’s main export, as well as a rebound in the US Dollar amid the market’s cautious optimism.
That said, WTI crude oil takes offers to refresh intraday low near $79.50 as early Asian session optimism, mainly led by China’s return from the one-week-long Lunar New Year (LNY) holidays, fades amid mixed concerns.
Also challenging the Oil price could be the US Dollar Index (DXY) rebound from the intraday low while ignoring the US Treasury bond yields. That said, the DXY prints a three-day uptrend near 102.00 but the US 10-year Treasury bond yields retreat from daily tops to 3.50% after the Japanese panel teases hawkish moves of the Bank of Japan (BOJ).
Elsewhere, Bloomberg poured cold water on the face of expectations that the holiday season propelled China activities. The analysis stated a few signs of improvement in the Chinese economy despite its second month without Covid Zero curbs. The research, however, marks the Lunar New Year (LNY) holiday season as marking a lid on some activities.
Against this backdrop, the US Treasury bond yields retreat from the intraday top but the stock futures print mild losses. Furthermore, the Asia-Pacific shares grind higher and the US Dollar Index (DXY) defends a two-day recovery.
Looking forward, risk catalysts are likely to determine short-term market moves ahead of Wednesday’s Federal Open Market Committee (FOMC) and Friday’s US jobs report for January. It’s worth noting that headlines surrounding China are an extra burden on the USD/CAD watchers to determine near-term moves.
Technical analysis
A four-day-old bearish triangle restricts USD/CAD moves between 1.3290 and 1.3330.
- GBP/USD has printed a fresh day's high above 1.2400 amid sheer volatility in the USD Index.
- The Federal Reserve might pause hiking interest rates after pushing them into a 4.75-5.00% range.
- A continuation of bigger interest rate hikes is expected from the BoE as the UK inflation is still in the double-digit figure.
- GBP/USD is on the verge of delivering a volatility contraction despite the souring market mood.
The GBP/USD pair has refreshed its day’s high at 1.2405 in the early European session. The Cable has picked up strength as the US Dollar Index (DXY) has turned extremely volatile amid chatters over the interest rate decision by the Federal Reserve (Fed) and the Bank of England (BoE) this week. The USD Index has displayed a wild gyration in a 101.40-101.57 range and is demonstrating a downside bias as investors are punishing the safe-haven asset amid rising bets for a smaller interest rate hike by the Federal Reserve ahead.
S&P500 futures have extended their losses as consumer spending has fallen 0.2% in December, as reported by the United States Commerce Department. A decline in consumer spending is indicating weaker earnings projections for the US equities, which has turned investors risk-averse. The demand for US government bonds is escalating on expectations of lower terminal rate projections for CY2023 than previously anticipated.
Federal Reserve looks for a smaller interest rate hike as inflation softens
The United States Consumer Price Index (CPI) is declining significantly as higher interest rates by the Federal Reserve (Fed) have trimmed retail demand. The decline in the Federal Reserve’s most preferred inflation tool Personal Consumption Expenditure (PCE) Price Index to 4.4%, in line with expectations. The PCE Price Index data was already expected lower as Producer Price Index (PPI) for December has already been trimmed and consumer spending has also tumbled.
Declining inflation projections have bolstered the expectations of a smaller interest rate hike announcement by Federal Reserve chair Jerome Powell. Analysts at Rabobank point out that it has become increasingly likely that the Fed will slow down its hiking cycle to 25 bps. For the interest rate guidance “We continue to think that based on the fading momentum of inflation, the Federal Open Market Committee (FOMC) is likely to stop at a 4.75-5.00% target range and pause for the remainder of the year.”
US ADP Employment and ISM PMI in focus
Before the release of the first monetary policy of CY2023 by the Federal Reserve, investors will also keep the United States Automatic Data Processing (ADP) Employment data and ISM Manufacturing PMI on the radar, which will release on Wednesday. Higher interest rates by the Federal Reserve to tame soaring inflation has brought a stagnancy in the operations of various firms, which has forced them to scale down their recruitment process.
First and foremost, investors are awaiting the release of the US ADP Employment, which is seen lower at 86K, significantly lower than the former release of 235K. A decline in consumer spending and higher interest payment obligations have forced firms to avoid borrowing.
Apart from that, the US ISM Manufacturing PMI is seen lower at 48.2 vs. the former release of 48.4 as firms are not operating at their full capacity due to weaker demand.
Bank of England to announce a 50 bps rate hike to contain red-hot inflation
The Bank of England is worried about its double-digit inflation despite being the early adopter of hawkish monetary policy after the pandemic period. The rising labor cost index and food prices have offset the impact of softened energy prices in the United Kingdom. Bank of England Governor Andrew Bailey has already increased interest rates to 3.50% and the United Kingdom’s double-digit inflation is likely to call for a continuation of a higher interest rate hike. According to a poll from Reuters, Investors are mostly betting on another half percentage-point increase to 4.0% and that Bank Rate will peak at 4.5% soon.
GBP/USD technical outlook
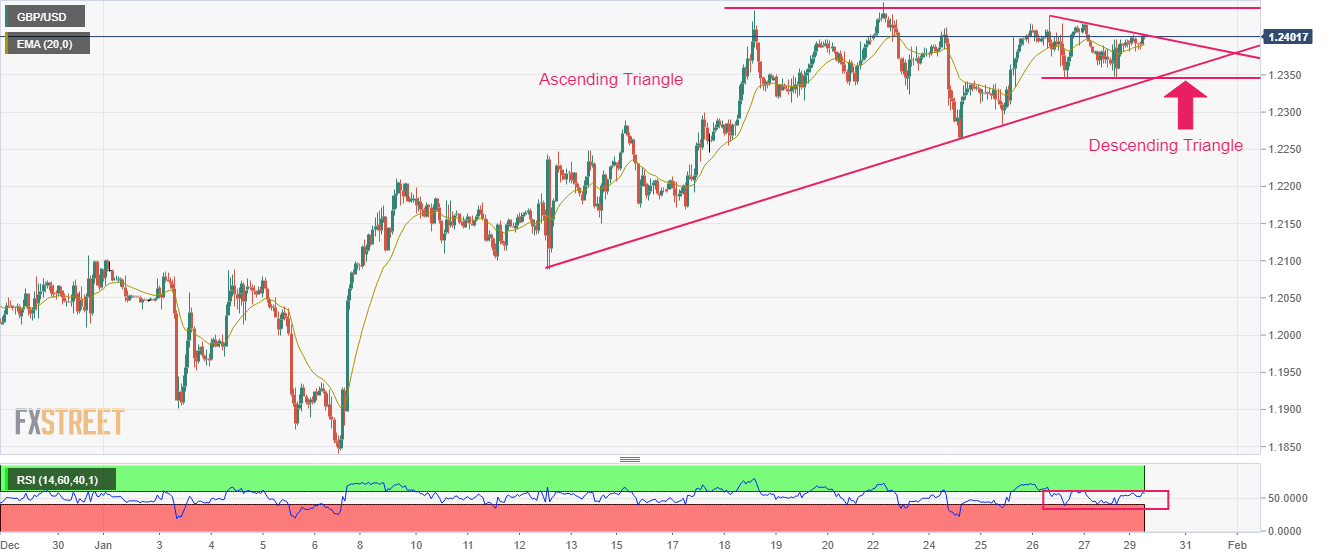
GBP/USD is auctioning in an Ascending Triangle chart pattern on an hourly chart that indicates a sheer squeeze in volatility. The upward-sloping trendline of the aforementioned chart is placed from January 12 low at 1.2089 while the horizontal resistance is plotted from January 18 high around 1.2436. Inside the broader Ascending Triangle, the Cable is also forming a Descending Triangle, which indicates massive volatility contraction. The Pound Sterling is near the downward-sloping trendline of the Descending Triangle and is expected to deliver a breakout sooner.
The asset has climbed above the 20-period Exponential Moving Average (EMA) at 1.2392, which conveys a bullish short-term bias.
Meanwhile, the Relative Strength Index (RSI) (14) is attempting to shift into the bullish range of 60.00-80.00, which will trigger the bullish momentum ahead.
Bloomberg came out with analysis suggesting few signs of improvement in Chinese economy despite its second month without Covid Zero curbs. The research, however, marks the Lunar New Year (LNY) holiday season as marking a lid on some activities.
Bloomberg’s aggregate index of eight early indicators showed a slight uptick in activity in January, versus a contraction in December, reported Bloomberg.
Key findings
Early signs showed a rise in activity as more than 300 million trips were made during the holiday, nearly 90% of pre-pandemic levels, according to the Ministry of Culture and Tourism.
Box office figures topped the last year’s holiday season while restaurant revenue rallied around 25% during the festival period from a year ago.
Other indicators weren’t as positive, either as business activity slowed during the Lunar New Year season or as the global economy continued to struggle.
Confidence among small businesses was better in January than in December, with real estate, transport, accommodation and catering activity seeing a sharp rebound, according to Standard Chartered Plc.
Bloomberg Economics generates the overall activity reading by aggregating a three-month weighted average of the monthly changes of eight indicators, which are based on business surveys or market prices.
AUD/USD pares intraday gains
The news seems to weigh on the market sentiment and exerts downside pressure on the AUD/USD prices holding lower grounds near intraday bottom near 0.7085 by the press time.
Also read: AUD/USD Price Analysis: Refreshes day’s low below 0.7100 amid risk-off mood
- USD/INR picks up bids to extend the previous week’s rebound from 2.5-month low.
- RBI likely to announce 0.25% rate hike in February before ending tightening cycle.
- Fears of Adani stocks rout, firmer Oil price also weigh on Indian Rupee.
- Indian budget likely to emphasize deficit reduction, hopes of Fed’s dovish hike caps USD/INR upside.
USD/INR portrays a three-day uptrend around 81.70 as traders brace for the key data/events from India and the US during early Monday. Also likely to have underpinned the Indian Rupee (INR) pair’s run-up could be the pessimism surrounding the nation’s equities due to a company-specific move and fears of a downbeat budget for the Fiscal Year 2023-24 (FY).
Indian equities slumped to a three-month low after Adani group shares drowned the markets after the Hindenburg Research report triggered a $48 billion rout in shares of the top-tier Indian enterprise. Not only the equity rout but the likely exodus of foreign funds due to the Adani-led slump also weighs on the Indian Rupee (INR). Further, recently firmer prices of Crude Oil, mildly offered near $79.50 by the press time, also favors the USD/INR buyers.
On the contrary, mixed US data and cautious mood ahead of the Federal Reserve’s (Fed) monetary policy meeting decision probe the USD/INR bulls. During the last week, the Fed’s preferred gauge of inflation, namely the Core Personal Consumption Expenditures (PCE) Price Index, matched 4.4% YoY market forecast versus 4.7% prior while the monthly figure rose to 0.3% versus 0.2% expected and previous readings. Ahead of that, the US Bureau of Economic Analysis' (BEA) first estimate of the US fourth quarter (Q4) Gross Domestic Product marked an annualized growth rate of 2.9% versus 2.6% expected and 3.2% prior. On the same line, the Durable Goods Orders jumped 5.6% in December versus the 2.5% market forecast and -1.7% upwardly revised prior.
On a different page, China’s return from the one-week-long Lunar New Year (LNY) holidays bring some good news as the nation’s Center for Disease Control and Prevention (CDC) signaled the end of the Covid wave. On the same line could be the could jump in the Chinese festive demand, of around 12.2% versus the year ago, as well as readiness to bolster economic growth via lending tools, spending and higher imports.
Amid these plays, the US Treasury bond yields grind higher but the stock futures print mild losses. Furthermore, the Asia-Pacific shares grind higher but the US Dollar Index (DXY) struggles to extend a two-day recovery while India’s NSE 50 drops near 0.20% intraday at the latest.
Moving on, Wednesday becomes the key day for the USD/INR pair traders as Indian Finance Minister Nirmala Sitharaman will unveil the details of India’s Union Budget for the Fiscal Year 2023-24. Ahead of the release, Reuters said, “The Indian government will present a budget on February 1 that will likely put deficit reduction ahead of vote-winning spending, even as Prime Minister Narendra Modi looks towards seeking a rare third term of office in 2024.”
Additionally, the Reserve Bank of India is expected to raise its main interest rate by a modest 25 basis points to 6.50% at its meeting one week after New Delhi's budget, before leaving it at that level for the rest of the year, a Reuters poll of economists found. The same could keep the USD/INR buyers hopeful as policy pivot appears closer.
Moving on, USD/INR pair may witness further upside should the Indian budget updates disappoint the markets, which is more likely. However, the expected dovish hike from the Fed and likely weakness in the US Nonfarm Payrolls (NFP) may restrict the pair’s upside moves.
Technical analysis
The USD/INR pair’s successful trading beyond the 10-DMA, around 81.45 by the press time, keeps the buyers hopeful. However, the 100-DMA, close to 81.85 at the latest, holds the key to the bull’s dominance.
- AUD/USD has refreshed its day’s low at 0.7083 as volatility soars amid the risk-off mood.
- The 50-EMA that was providing support to the Australian Dollar is now providing a cushion to the US Dollar.
- The formation of a Wyckoff Inventory Distribution indicates a bearish reversal.
The AUD/USD pair has refreshed its day’s low at 0.7083 as investors have turned risk-averse amid the interest rate decision by the Federal Reserve (Fed) this week. The US Dollar Index (DXY) has displayed a wild gyration in a 101.40-101.57 range as the volatility is accelerating dramatically.
S&P500 futures have surrendered their entire gains recorded on Friday and is expected to remain on tenterhooks amid a risk-off mood. The 10-year US Treasury yields have dropped below 3.51%.
AUD/USD is demonstrating Wyckoff’s inventory distribution on an hourly scale, which indicates an inventory shift from the institutional investors to the retail participants. The Aussie asset has also witnessed an Upthrust formation that indicates the presence of responsive sellers.
The 50-period Exponential Moving Average (EMA) at 0.7100, which was providing support to the Australian Dollar is now providing cushion to the US Dollar.
While the Relative Strength Index (RSI) (14) is oscillating in a 40.00-60.00 range, which indicates that investors are awaiting a fresh trigger for a power-pack action.
Should the asset break below January 25 low at 0.7062, US Dollar bulls will drag the asset toward the psychological support at 0.7000 followed by January 17 low at 0.6948.
On the contrary, a break above August 11 high at 0.7137 will send the major toward the round-level resistance at 0.7200. A breach of the latter will expose the asset to June 3 high at 0.7283.
On the contrary, a downside move below December 29 low at 0.6710 will drag the major further toward December 22 low at 0.6650 followed by November 21 low at 0.6585.
AUD/USD hourly chart
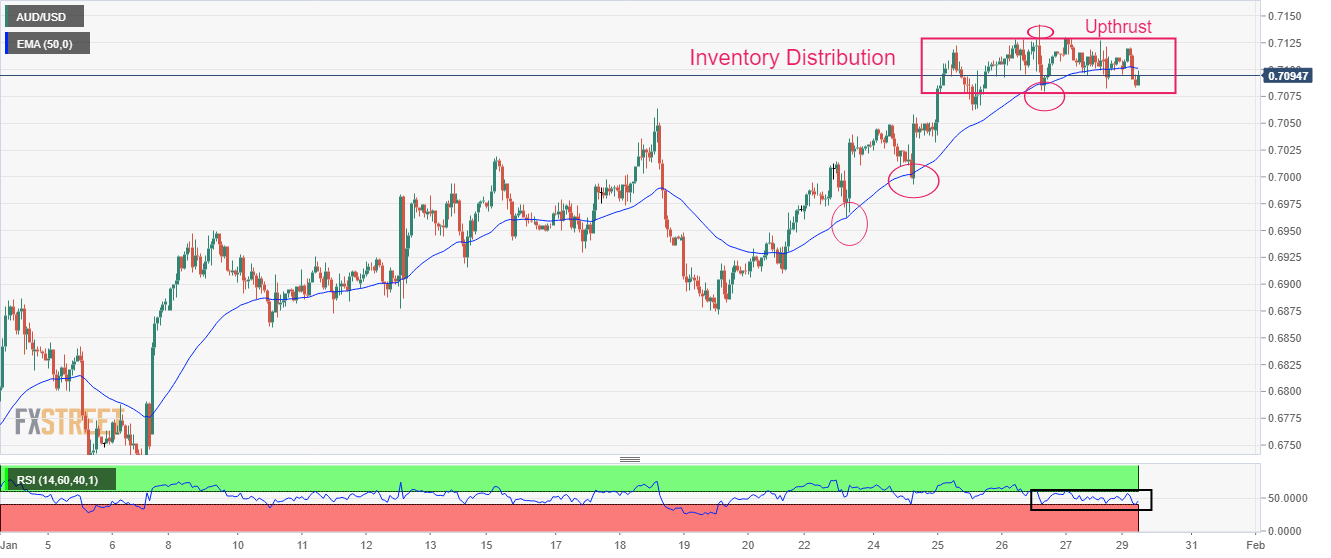
USD/JPY dropped nearly 70 pips on Reuters’ news saying, “a panel of academics and business executives on Monday urged the Bank of Japan to make its 2% inflation target a long-term goal, instead of one that must be met as soon as possible, in light of the rising cost of prolonged monetary easing.”
The news also mentioned that the proposal also included the need to have interest rates rise more in line with economic fundamentals, and normalize Japan's bond market function.
It’s worth noting that the panel includes members such as Yuri Okina, who is considered among the candidates to become the next BOJ deputy governor, per Reuters.
USD/JPY drops back below 130.00
Following the news, the USD/JPY pair dropped 70 pips to 129.20 before licking its wounds near 129.55 by the press time.
Also read: USD/JPY Price Analysis: Bulls attack 130.40 resistance confluence
Early Monday morning in Europe, S&P Global Ratings reaffirmed Australia’s AAA/A-1+rating while keeping the outlook stable.
Developing story…
- Gold price bounces off intraday low but stays directionless after closely missing the bear’s entry in the week.
- China’s return boosts Asia-Pacific shares, S&P 500 Futures bear the burden of firmer yields.
- XAU/USD bulls appear running out of steam even as Fed’s dovish hike, downbeat expectations from US NFP probe bears.
Gold price (XAU/USD) aptly portrays the market’s cautious mood ahead of top-tier data/events during early Monday.
The metal rose in the last six weeks before losing the upside momentum at the latest. The reason for the quote’s recent sluggish moves could be linked to the market’s indecision as major central bank events and the US jobs report occupy the weekly economic calendar.
It’s worth noting that China’s return from the one-week-long Lunar New Year (LNY) holidays bring some good news as the nation’s Center for Disease Control and Prevention (CDC) signaled the end of the Covid wave. On the same line could be the could jump in the Chinese festive demand, of around 12.2% versus the year ago, as well as readiness to bolster economic growth via lending tools, spending and higher imports.
Elsewhere, mixed concerns surrounding the US inflation and growth challenge the Federal Reserve (Fed) in defending its hawkish policy, which in turn keeps the Gold buyers hopeful. Furthermore, the European Central Bank’s (ECB) comparatively more hawkish stand probes the US Dollar’s latest rebound and hence exerts downside pressure on the XAU/USD.
Amid these plays, the US Treasury bond yields grind higher but the stock futures print mild losses. Furthermore, the Asia-Pacific shares grind higher but the US Dollar Index (DXY) struggles to extend a two-day recovery.
Looking forward, January’s official PMIs from China, up for publishing on Tuesday, could offer immediate directions to Gold price ahead of Wednesday’s Fed meeting and Friday’s US jobs report. Overall, the Fed’s inability to convince hawks could weigh on the pair.
Gold price technical analysis
Gold price fades the previous day’s bounce off a one-month-old ascending support line, taking rounds to the 50-Simple Moving Average (SMA) level surrounding $1,928 by the press time.
Although the receding bearish bias of the MACD and multiple bounces off the aforementioned support line defends the XAU/USD buyers. Steady RSI (14) and recently sluggish momentum teases Gold sellers of late.
That said, a clear downside break of the stated support line, close to $1,920 by the press time, appears necessary for the Gold sellers to take entry.
Following that, the $1,900 threshold and the January 18 swing low near $1,896 could lure the XAU/USD bears.
Alternatively, Gold buyers need to cross the one-week-old horizontal hurdle of around $1,945 to retake control.
Gold price: Four-hour chart
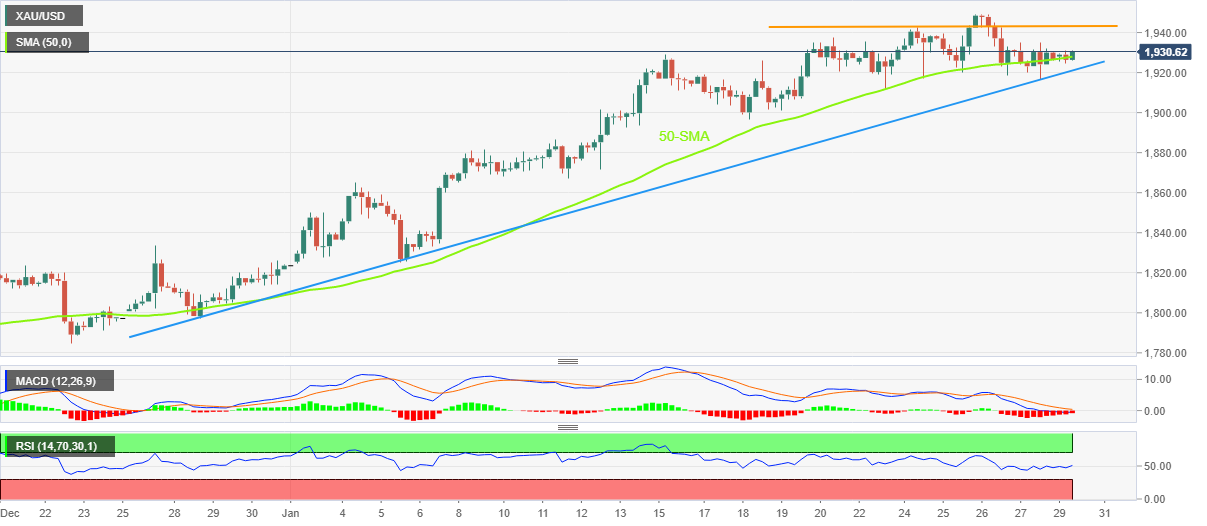
Trend: Further weakness expected
- Chinese stocks are accelerating after the Lunar New Year holidays as optimism about economic recovery deepens.
- BOJ Kuroda is confident about keeping the 2% inflation target due to rising wages.
- The oil price has resumed its downside journey as Russia has increased the oil supply.
Markets in the Asian domain are showing an expression of strength despite cautious market sentiment. Chinese stocks are showing resilience after the Lunar New Year holidays while Japanese equities are displaying marginal gains. S&P500 futures have surrendered their entire gains recorded on Friday as investors have turned risk-averse amid Federal Reserve (Fed)’s policy-inspired volatility, which is scheduled this week.
At the press time, Japan’s Nikkei225 added 0.20%, China A50 soared 1.60%, Hang Seng tumbled 1.06%, and KOSPI plunged 1.24%.
The US Dollar Index is struggling to extend gains after recovery from 101.50 despite the risk-off market mood. The upside in the USD Index is capped around 101.80 from the last week as Fed chair Jerome Powell is set to hike interest rates with a smaller rate. Inflationary pressures in the United States have trimmed significantly, which has provided some room for the Fed to announce a modest rate hike.
Chinese stocks have soared dramatically amid optimism boosted by commentary from China's cabinet that said on Saturday “It would promote a consumption recovery as the major driver of the economy and boost imports”, state broadcaster CCTV reported per Reuters. The news highlights the cooling of global demand and recession concerns behind the readiness of China policymakers to act.
Meanwhile, Japanese indices are collecting strength as Bank of Japan (BoJ) Governor Haruhiko Kuroda is expecting that the economy can achieve a 2% inflation target through rising wages. The continuation of easy monetary policy creates a condition that allows firms to hike wages. This might result in a bumper demand from individuals, which would keep inflation nearby the desired targets.
On the oil front oil price has resumed its downside journey after a pullback move. Downside bias in the oil price emerged after Reuters reported that Russia’s oil loadings from its Baltic ports were set to rise by 50% in January from December levels in order to address the strong demand coming from Asia. Russian oil supply is accelerating despite the sanctions by the Western cartel.
- EUR/USD pauses two-day downtrend but struggles to extend intraday gains.
- Markets sentiment remains divided as firmer yields probe stock futures while Asian equities cheer China’s return.
- Hawkish concerns from ECB contrast with hopes of Fed’s dovish hike to tease buyers.
- Germany’s preliminary Q4 GDP could direct intraday traders amid a light calendar in the US.
EUR/USD treads water around 1.0870-60 as markets remain on a dicey floor ahead of the key central bank meetings and data. Adding strength to the market’s indecision could be the return of China and fears of a softer growth number from Germany.
That said, the US Dollar Index (DXY) picks up bids to defend the 102.00 round figure as the US 10-year Treasury yields remain firmer around 3.51% after snapping a two-week downtrend.
It’s worth noting, however, that the mixed US data and receding hawkish bias from the Fed, contrasts with the hopes of stronger rate hikes from the European Central Bank (ECB), keeps the EUR/USD buyers hopeful.
Additionally underpinning the EUR/USD upside are the mixed US data and the cautious optimism in the market as China returns to trading after one full week of the Lunar New Year holidays.
Talking about the data, the Federal Reserve's preferred gauge of inflation, namely the Core Personal Consumption Expenditures (PCE) Price Index, matched 4.4% YoY market forecast versus 4.7% prior while the monthly figure rose to 0.3% versus 0.2% expected and previous readings. Ahead of that, the US Bureau of Economic Analysis' (BEA) first estimate of the US fourth quarter (Q4) Gross Domestic Product marked an annualized growth rate of 2.9% versus 2.6% expected and 3.2% prior. On the same line, the Durable Goods Orders jumped 5.6% in December versus the 2.5% market forecast and -1.7% upwardly revised prior.
While portraying the mood, the US Treasury bond yields grind higher but the stock futures print mild losses and challenge the EUR/USD traders. As a result, the first readings of Germany’s fourth quarter (Q4) Gross Domestic Product (GDP), expected to the east to 0.0% versus 0.4% prior, will be important to watch for immediate directions as downbeat German data allows the EUR/USD bears to extend two-day downtrend.
However, major attention will be given to how well the Fed can push back the dovish concerns, as well as the ECB’s ability to please the hawks.
Technical analysis
Despite the latest pause in a two-day downtrend, the EUR/USD buyers need to cross the descending resistance line from Thursday, close to 1.0880 at the latest, to retake control.
Also read: EUR/USD Price Analysis: Fades bounce off fortnight-old support line below 1.0900
“I believe it's possible to achieve 2% inflation target, accompanied by wage growth, by continuing current easy policy,” said Bank of Japan (BoJ) Governor Haruhiko Kurda early on Monday.
More to come
- USD/JPY grinds higher around intraday top after two-week rebound from multi-month low.
- Convergence of 21-DMA, downward-sloping trend line from late November guards immediate upside.
- Bullish MACD signals, firmer RSI (14) adds strength to the bullish bias.
- Bears need validation from fortnight-old ascending trend line to retake control.
USD/JPY prints mild gains as buyers muster the courage to overcome the key 130.40 resistance confluence during early Monday morning, close to 130.10 by the press time.
In doing so, the Yen pair defends the two-week rebound from the lowest levels since May 2022 while staying above a fortnight-old ascending trend line.
Additionally favoring the USD/JPY buyers are the bullish MACD signals and the firmer RSI (14), not overbought.
However, a convergence of the 21-DMA and a two-month-long downward-sloping resistance line, around 130.40, appears a tough nut to crack for the pair buyers.
Following that, a run-up towards refreshing the monthly high near 134.80 can’t be ruled out.
During the anticipated rise past 130.40, the 131.00 round figure and January 18 high near 131.60 might probe the USD/JPY bulls.
On the contrary, a downside break of the aforementioned nearby support line, close to 129.40, could recall the USD/JPY bears targeting the monthly low of 127.20.
In a case where the USD/JPY sellers keep the reins past 127.20, the May 2022 low near 126.35 will be in focus.
Overall, USD/JPY bears appear to run out of steam but the buyers need validation from 130.40.
USD/JPY: Daily chart
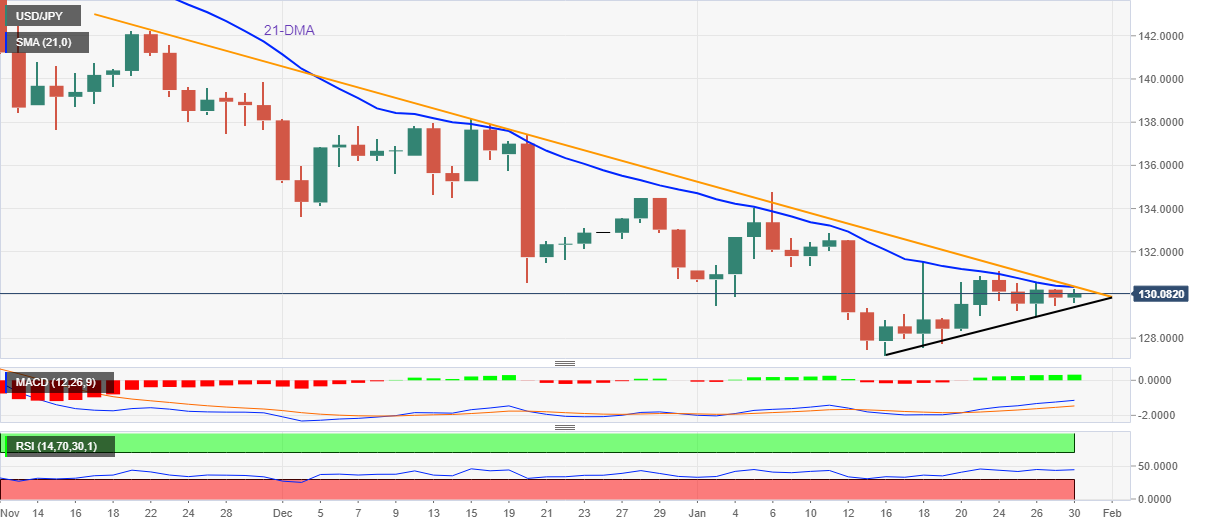
Trend: Further upside expected
| Raw materials | Closed | Change, % |
|---|---|---|
| Silver | 23.551 | -1.46 |
| Gold | 1927.55 | -0.08 |
| Palladium | 1620.29 | -2.6 |
As per the latest weekly update from China’s Center for Disease Control and Prevention (CDC), reported by Reuters, “China's current wave of COVID-19 infections is nearing an end, and there was no significant rebound in cases during the Lunar New Year holiday.”
The news also quotes an anonymous CDC official as saying, “The number of severe COVID cases and deaths was also trending downward.”
Also read: China Cabinet aims to boost consumption and imports
Market reaction
The news should have underpinned the AUD/USD upside due to the likely positive impact on the market sentiment amid China-linked optimism. However, the Aussie pair prints mild losses around 0.7100 by the press time.
Also read: USD/CNH prints mild losses around 6.7400 on China-linked concerns ahead of PMIs, Fed and US NFP
- Silver price fades the previous week’s bounce off 50-DMA, stays depressed around intraday low.
- Bearish Doji, downbeat MACD signals keep silver sellers hopeful.
- XAG/USD moves remain sidelined inside five-week-old horizontal region.
Silver price (XAG/USD) holds lower ground near $23.60 as the metal traders brace for a busy week during early Monday. In doing so, the bright metal remains inside a five-week-old horizontal trading region between $24.40 and $23.10.
It’s worth noting, however, that Thursday’s bearish Doji candlestick joins bearish MACD signals to weigh on the Silver prices.
Even so, the 50-DMA and the stated horizontal region’s support, respectively near $23.25 and $23.10, restrict short-term XAG/USD downside.
In a case where the Silver price remains weaker past $23.10, and also breaks the $23.00 round figure, the 50% and 61.8% Fibonacci retracement level of the commodity’s November 2022 to early January 2023 upside, close to $22.55 and $22.10 in that order, will be important challenges for the XAG/USD bears to tackle.
Alternatively, the $24.00 round figure could test the immediate upside of the XAG/USD ahead of directing the Silver buyers towards the stated trading range’s upper boundary, close to $24.40.
Following that, the monthly high surrounding $24.55 could act as an extra filter towards the north ahead of fueling the XAG/USD towards the April 2022 top near $26.25.
Overall, the Silver price remains bearish unless crossing $24.40. However, the downside room appears limited.
Silver price: Daily chart
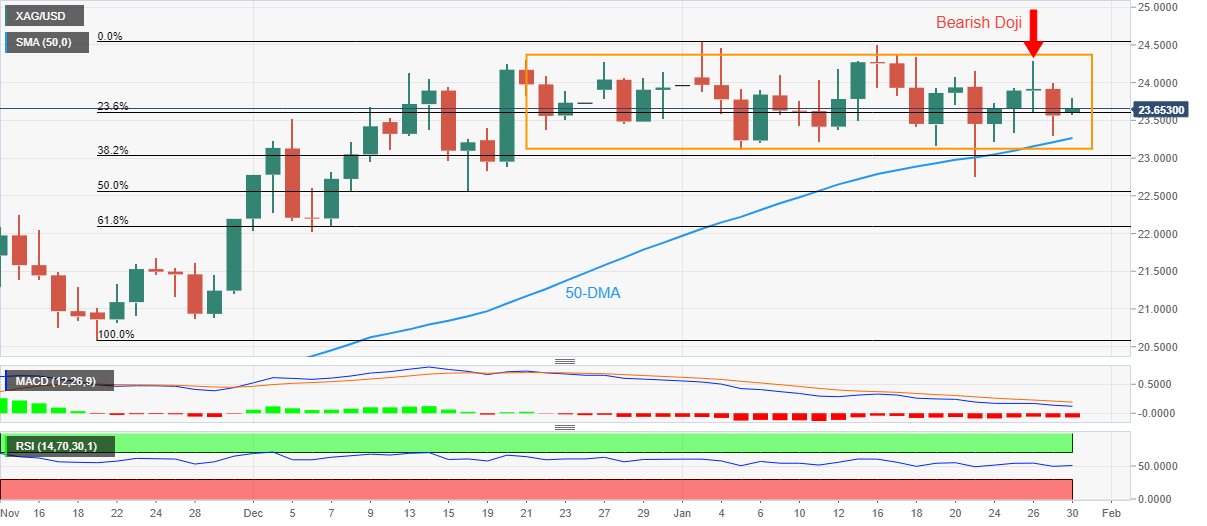
Trend: Further weakness expected
- NZD/USD bears are moving in on the Bulls' party.
- Key data this week could be used as the catalyst.
NZD/USD ended in New York little changed, but there are prospects of a move lower this week with a number of key events that stack up with the price faltering on the bid as the following technical analysis will illustrate. Meanwhile, the NZ labour market data and the Fed decision will be key and could be the icing on the came for the bears that are gate-crashing the bull's party.
''The consensus seems to be that labour market data won’t do much to alter RBNZ thinking now that CPI data is in hand, but we wouldn’t dismiss it so quickly given wage/price spiral risks,'' analysts at ANZ Bank explained.
NZD/USD H1 chart
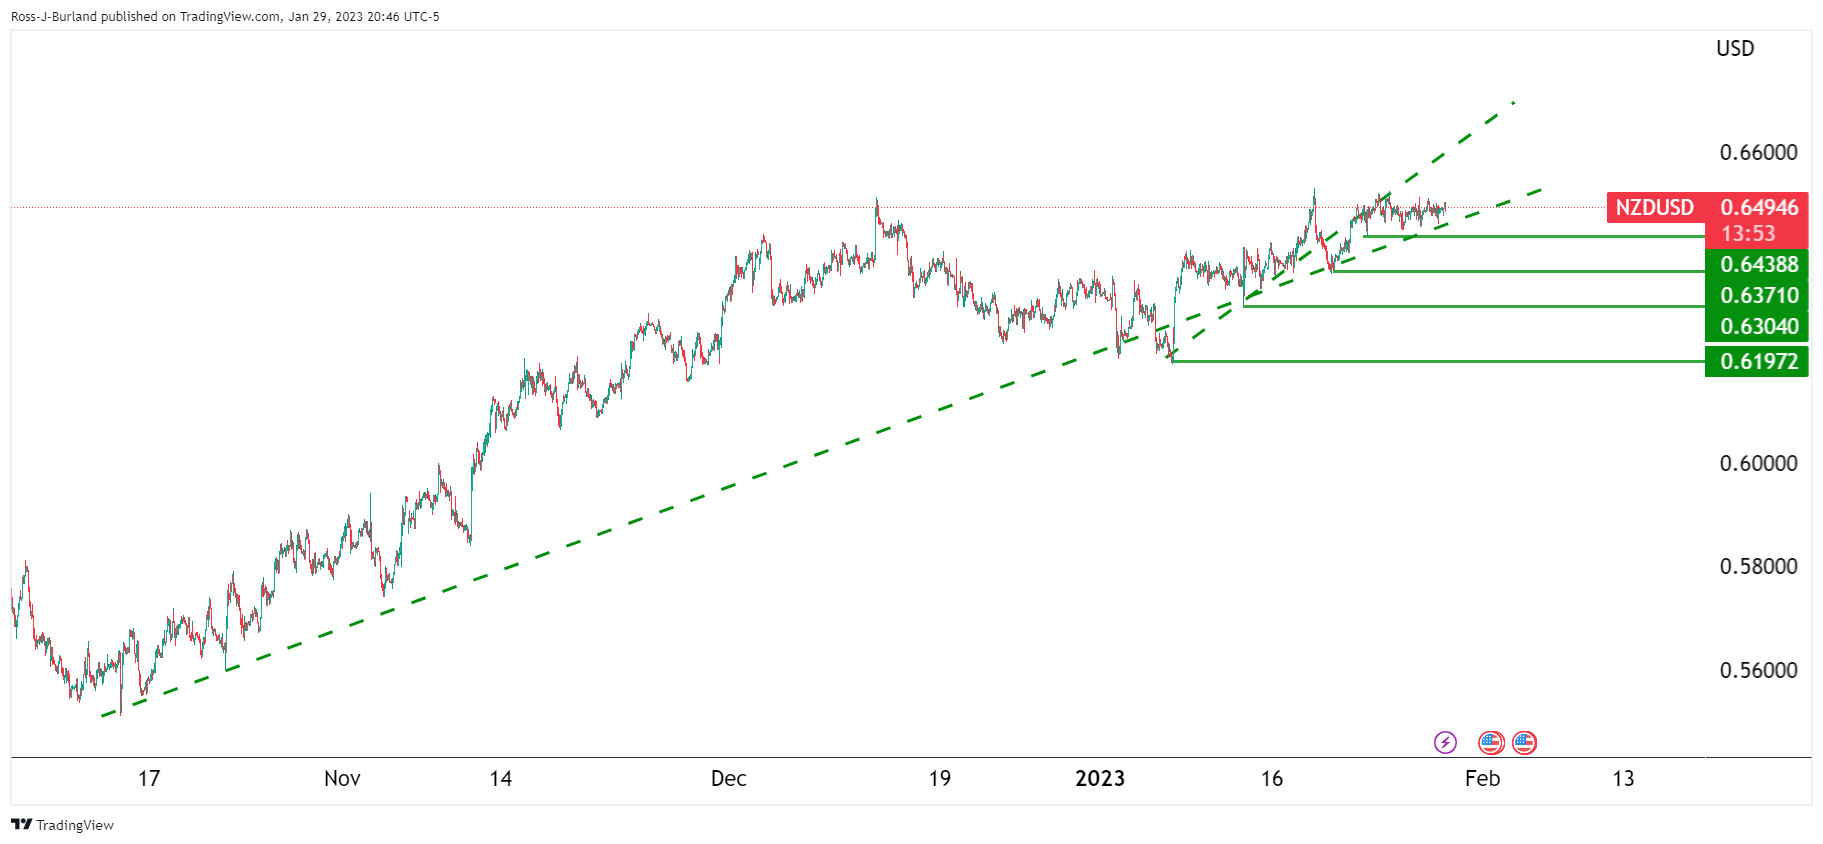
The Kiwi is making tracks to the upside but the accent has started to decelerate.
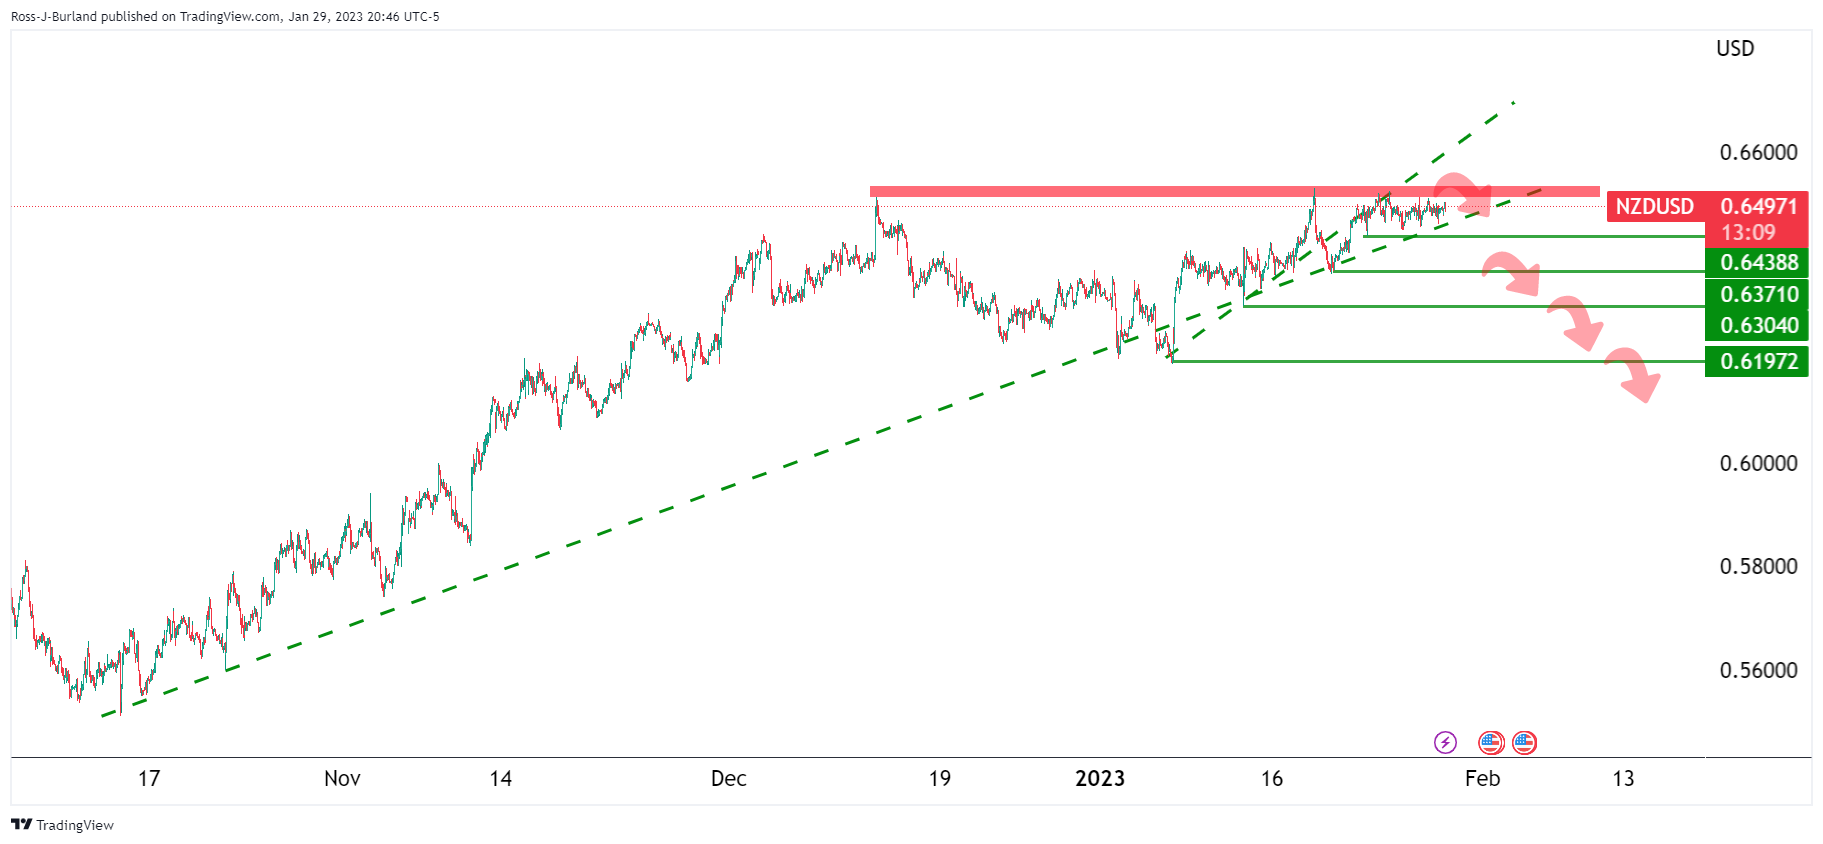
The waterfall sell-off could look something like the above if the bears really went to town this week.
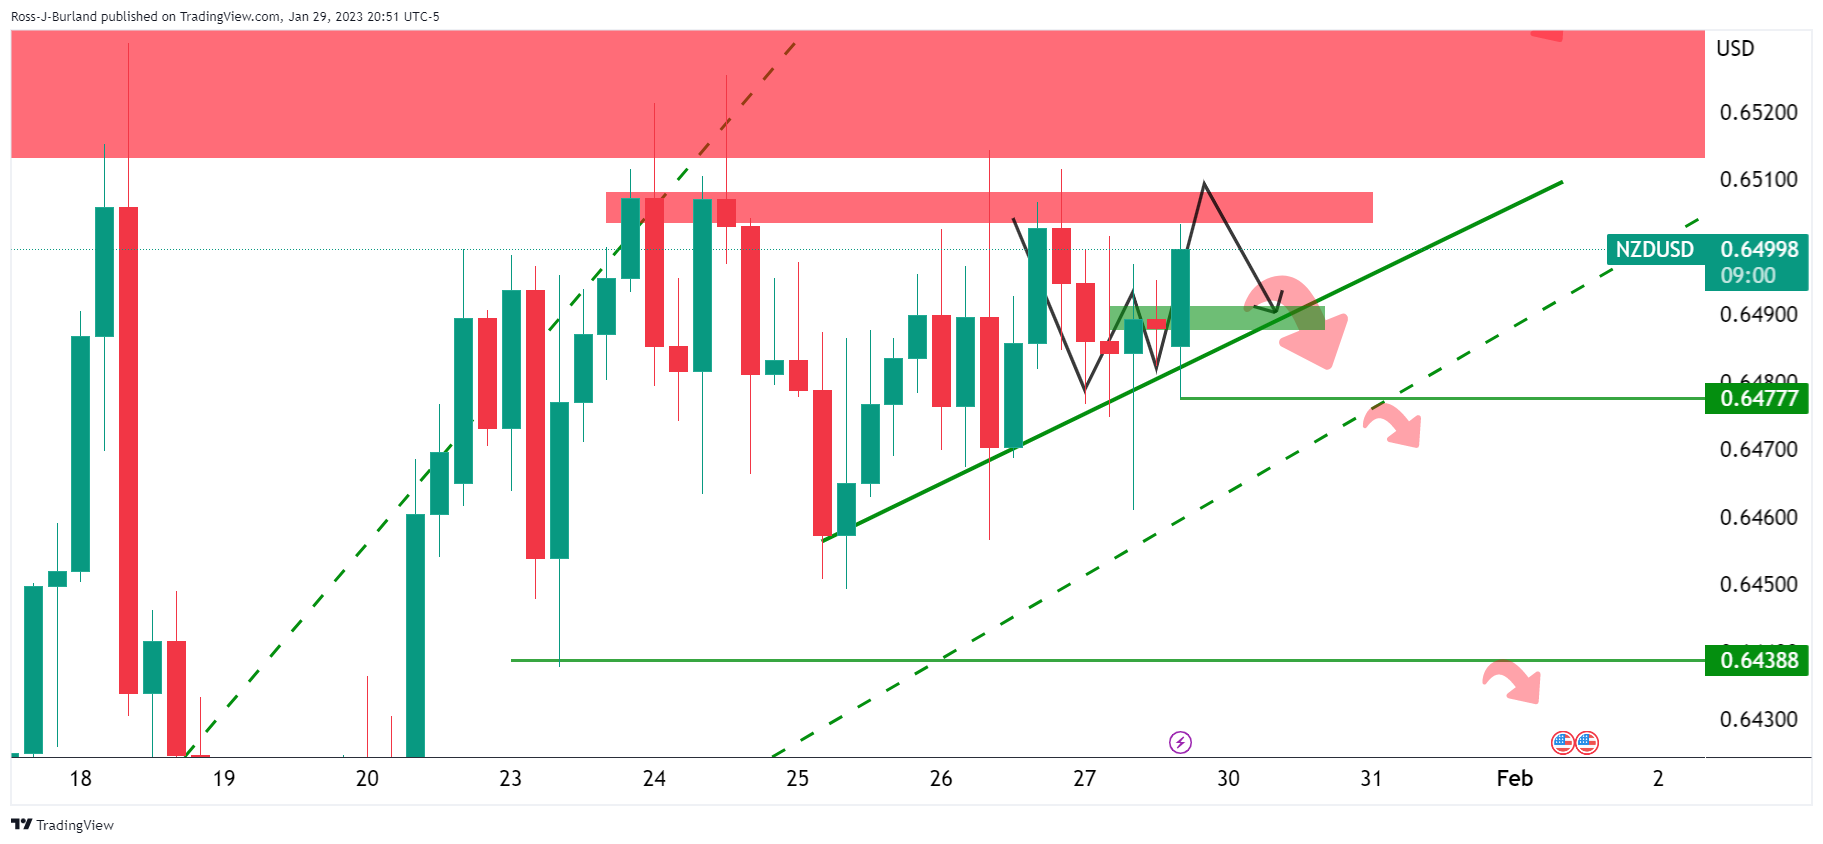
The W-formation means that the price is more probable to meet resistance and fall back into test support. A break of the micro trendline could lead to a move lower for the day ahead with 0.6470s critical.
- EUR/GBP has extended its recovery above 0.8770 ahead of German GDP data.
- UK FM Jeremy Hunt has promised to halve the double-digit inflation figure ahead.
- The ECB is expected to continue hiking interest rates by 50 bps ahead to tame stubborn inflation.
The EUR/GBP pair has demonstrated a responsive buying action after dropping to near 0.8760 in the Tokyo session. The cross has extended its gains above 0.8770 ahead of the preliminary German Gross Domestic Product (GDP) (Q4) release on Monday. Higher interest rates by the European Central Bank (ECB) have already impacted the scale of economic activities in Eurozone. Apart from that supply chain disruptions have been a major issue for firms.
As per the consensus, the German GDP is seen stagnant against a marginal expansion of 0.4% on a quarterly basis. The labor market in Eurozone has remained tight and the economy has also shown resilience after easing energy prices. Therefore, the street is expecting a shallow recession, not a deeper one as expected earlier, in the shared continent.
The mega event that will trigger volatility for the Euro will be the interest rate decision by the European Central Bank (ECB). Last week, ECB Governing Council member Gabriel Makhlouf cited "We need to continue to increase rates at our meeting next week – by taking a similar step to our December decisions," He further added "Our future policy decisions need to continue to be data-dependent given the prevailing uncertainty," as reported by Reuters.
Meanwhile, the Pound Sterling is reacting negatively to the commentary from United Kingdom Finance Minister Jeremy Hunt. The UK FM stated on Friday that the “best tax cut right now is a cut in inflation.” On paper, the UK economy is still operating with double-digit figure inflation and showing no signs of deceleration amid rising food prices and the labor cost index.
On the Brexit front, UK and European Union negotiators are nearing a provisional agreement on post-Brexit arrangements for Northern Ireland, putting them in touching distance of a final settlement after years of often fraught talks, as reported by Bloomberg. The two sides are dealing with intensive negotiations for weeks and delegates are close to finding solutions at a technical level covering most pending issues including customs, state aid, and sanitary checks on agri-food goods, Bloomberg added.
- USD/CNH struggles around intraday low as China returns after one-week-long LNY holiday.
- Upbeat festive spending, chatters over more efforts to boost consumption, imports keep CNH buyers hopeful.
- Pre-Fed anxiety, PBOC hints challenge USD/CNH bears amid full markets.
USD/CNH remains pressured around the intraday low near 6.7400 while fading fades the previous day’s corrective bounce off a two-week low during Monday’s Asian session. In doing so, the offshore Chinese Yuan (CNH) pair justifies the hawkish concerns surrounding the dragon nation ahead of the key data/events.
Among them, talks of increased spending in China during the festive season and readiness for further measures to boost growth and imports seem to have gained major attention. China's cabinet said on Saturday it would promote a consumption recovery as the major driver of the economy and boost imports, state broadcaster CCTV reported per Reuters. The news highlights the cooling of global demand and recession concerns behind the readiness of China policymakers to act. Further, the Chinese tax authority mentioned that the week-long Lunar New Year holiday that ended on Friday propelled consumption by 12.2% from the same period last year.
Further, the People’s Bank of China’s (PBOC) readiness to introduce more tools to boost lending and growth probe the pair sellers.
Additionally, the dragon nation’s return from a one-week-long Lunar New Year (LNY) also boosts the market’s optimism in China. It should be noted that Shanghai Composite Index is up 1.3% while CSI 300 prints the bull markets’ signal after posting the 20% recovery from the lows printed in October 2022.
On the other hand, the hopes of the Federal Reserve’s (Fed) dovish hike after the last week’s mixed data seem to weigh on the USD/CNH prices.
That said, the Federal Reserve's preferred gauge of inflation, namely the Core Personal Consumption Expenditures (PCE) Price Index, matched 4.4% YoY market forecast versus 4.7% prior while the monthly figure rose to 0.3% versus 0.2% expected and previous readings. Ahead of that, the US Bureau of Economic Analysis' (BEA) first estimate of the US fourth quarter (Q4) Gross Domestic Product marked an annualized growth rate of 2.9% versus 2.6% expected and 3.2% prior. On the same line, the Durable Goods Orders jumped 5.6% in December versus the 2.5% market forecast and -1.7% upwardly revised prior.
Against this backdrop, the US 10-year Treasury yields remain lackluster near 3.51% after snapping a two-week downtrend whereas the S&P 500 Futures print mild losses.
Moving on, USD/CNH traders will pay close attention to January’s official PMIs, up for publishing on Tuesday, for immediate directions ahead of Wednesday’s Fed meeting and Friday’s US jobs report. Overall, the Fed’s inability to convince hawks could weigh on the pair.
Technical analysis
Failure to cross a two-month-old descending resistance line, around 6.7580 by the press time, directs USD/CNH towards a two-week-old support line near 6.7250.
- Gold price has sensed selling interest around $1,930.00 as a risk-off profile has emerged.
- Rising yields on US Treasuries have provided a cushion to the US Dollar Index.
- US firms are hoping for a bleak economic outlook amid rising interest rates by the Fed.
Gold price (XAU/USD) has sensed barricades while attempting to cross the critical resistance of $1,930.00 in the Asian session. The precious metal has witnessed selling interest as investors are turning risk averse in the interest rate policy week. The Federal Reserve (Fed) is set to announce its first interest rate decision of CY2023 on Wednesday.
S&P500 futures are showing some losses in the Asian session, portraying an expression of escalating caution in the market sentiment. The US Dollar Index (DXY) has recovered sharply after a correction to near 101.50. A recovery in the USD index is supported by rising returns on US Treasury bonds. The 10-year US Treasury yields have climbed to near 3.53%.
In addition to the Fed’s monetary policy, investors will keep an eye on the United States Automatic Data Processing (ADP) Employment data, which is expected to drop vigorously to 86K vs. the former release of 235K. Rising interest rates by Fed chair Jerome Powell to tame the Consumer Price Index (CPI) has trimmed the overall demand, which has squeezed labor demand by firms amid a bleak economic outlook.
Gold technical analysis
Gold price is juggling in a small range bounded consolidation on an hourly scale that indicates volatility contraction. The 50-period Exponential Moving Average (EMA) at $1,930.00 has been acting as a major barricade for the Gold bulls. The demand zone placed in a $1,917-1,920 range will be a key support for the asset ahead.
The Relative Strength Index (RSI) (14) is oscillating in a 40.00-60.00 range, which indicates that investors are awaiting a fresh trigger for a power-pack action.
Gold hourly chart
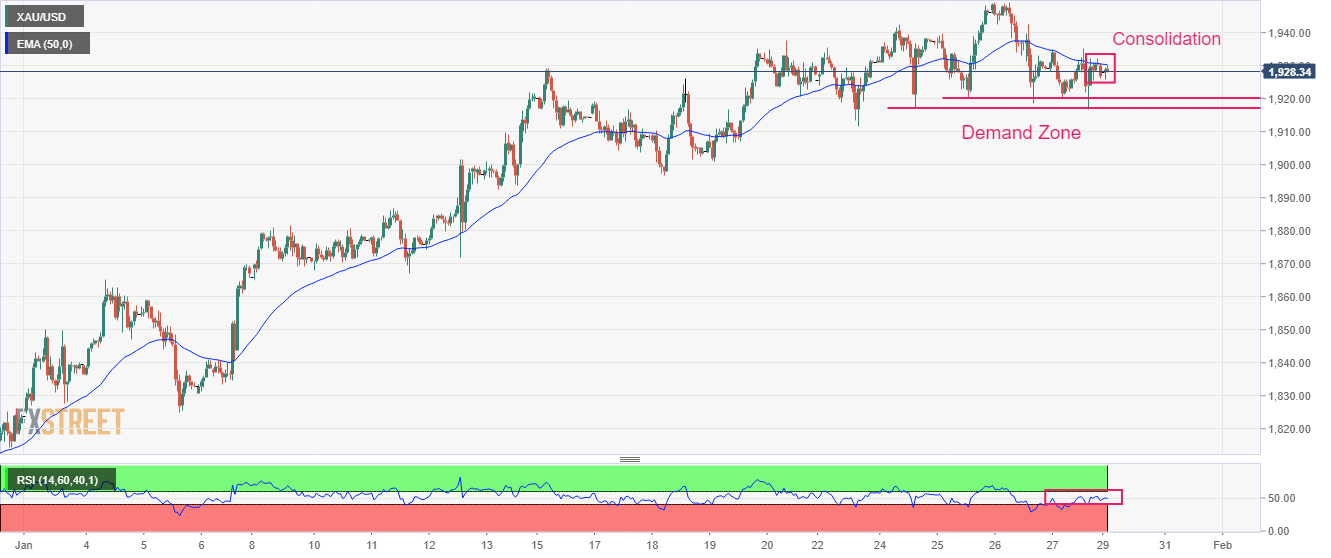
- USD/CAD picks up bids to pare intraday losses after six-week downtrend.
- Bearish triangle, downbeat RSI (14) conditions challenge buyers.
- Late 2022 low could lure bears past 1.3290 immediate support.
- 200-HMA, weekly resistance line adds to the upside filters.
USD/CAD bounces off intraday low to 1.3310 as bears take a breather following the six-week south-run during Monday’s Asian session.
Even so, the Loonie pair remains inside a bearish triangle formation established since Wednesday. Adding strength to the bearish bias is the downbeat RSI (14) line.
As a result, the quote’s corrective bounce is less likely to overcome the immediate hurdle, namely the resistance line of the stated triangle near 1.3325.
Even if the USD/CAD buyers manage to cross the 1.3325 hurdle, the previous support line from January 13 and the 200-Hour Moving Average (HMA), respectively near 1.3360 and 1.3395, could challenge the upside momentum.
It’s worth observing that a one-week-old downward-sloping resistance line near 1.3430 acts as the last defense of the USD/CAD bears, a break of which could propel the quote towards the January 19 swing high near 1.3520.
Alternatively, a downside break of the stated triangle, close to 1.3290 by the press time, could direct USD/CAD sellers towards the November 2022 low surrounding 1.3225 ahead of challenging the 1.3200 round figure.
Overall, the USD/CAD bears are likely to keep the reins unless the price stays successfully beyond 1.3520.
USD/CAD: Hourly chart
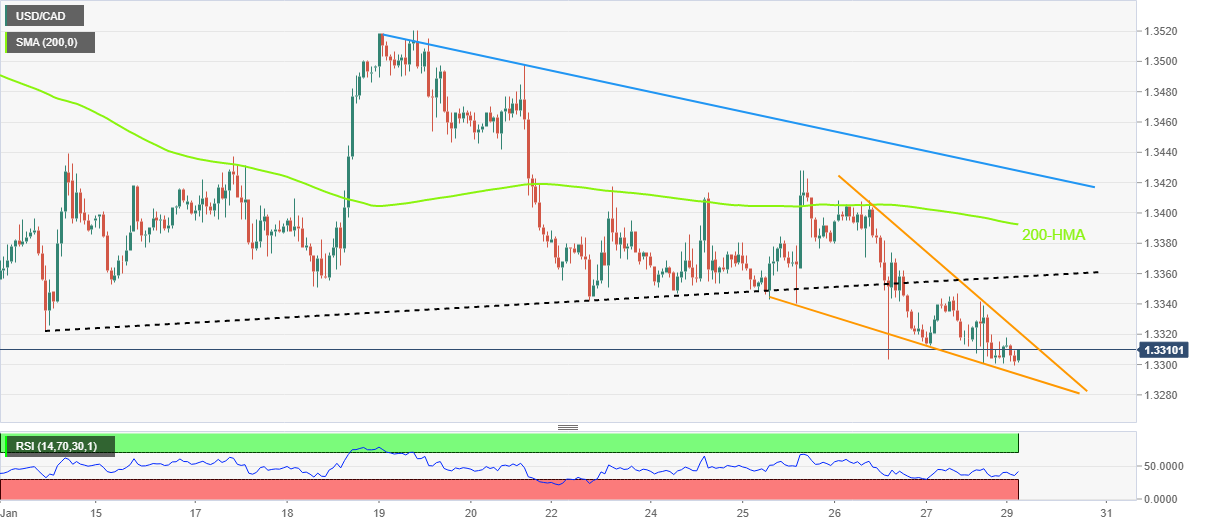
Trend: Bearish
In recent trade today, the People’s Bank of China (PBOC) set the yuan (CNY) at 6.7626 vs. the last close of 6.7955.
About the fix
China maintains strict control of the yuan’s rate on the mainland.
The onshore yuan (CNY) differs from the offshore one (CNH) in trading restrictions, this last one is not as tightly controlled.
Each morning, the People’s Bank of China (PBOC) sets a so-called daily midpoint fix, based on the yuan’s previous day's closing level and quotations taken from the inter-bank dealer.
- GBP/USD bears are lined up ahead of the Fed and the BoE.
- The data has not been kind to the pound and there could be more to come this week.
GBP/USD dropped on Friday due to the fears that the United Kingdom economy's slowdown may prompt the BoE that meets this week to slow down on its rate hike cycle sooner than originally thought. At the time of writing, GBP/USD is trading at 1.2390 and has travelled between a low of 1.2372 and 1.2404 so far.
The US Dollar is thinly spread in the open and not making a dominant impact on forex with the likes of the Aussie rallying yet the British Pound on the back foot. The week ahead will be busy with bot the BoE and Federal Reserve. For the BoE, it is expected to hike rates by 50 bp. ''However, nearly a third of the analysts polled by Bloomberg see a smaller 25 bp move''
''Indeed, WIRP suggests only 55% odds of a 50 bp hike, down from 85% at the start of last week, while odds of a 25 bp hike March 23 are no longer fully priced in,'' analysts at Brown Brothers Harriman said. ''After that, odds of a final 25 bp hike in June or August top out near 60% would see the bank rate peak near 4.5%. Recall that for the 50 bp hike at the last meeting on December 15, the 6-3 vote was surprising in that Dhingra and Tenreyro voted to keep rates steady and Mann voted for a larger 75 bp move. Updated macro forecasts will be released this week.''
As for the data, again, a thorn in the side for the Pound, the analysts said that December consumer credit will be reported Tuesday as well as the final January manufacturing PMI followed by final services and composite PMIs as the last data for the week. ''The data are likely to continue worsening as the full weight of monetary and fiscal tightening has yet to be felt.''
- GBP/JPY defends two-week uptrend despite retreating from intraday high.
- US Treasury bond yields recover amid market’s anxiety ahead of this week’s bumper data/events.
- UK Chancellor Hunt resists tax cuts until public finances improve.
- BoJ versus BoE concerns could play a major role in directing short-term moves.
GBP/JPY prints mild gains around 161.00 as it portrays the market’s cautious mood at the start of the key week comprising multiple monetary policy meetings and crucial data. Even so, the cross-currency pair manages to defend the two-week recovery amid upbeat US Treasury bond yields, as well as hawkish hopes from the Bank of England (BoE).
US 10-year Treasury yields remain lackluster near 3.51%, mildly bid by the press time, after snapping a two-week downtrend by the end of Friday. That said, concerns surrounding the BoE’s 0.50% rate hike to tame upbeat inflation appear to keep the GBP/JPY buyers hopeful.
It’s worth noting that the talks surrounding UK’s hesitance from tax cuts also seem to underpin the pair’s upside momentum. Reuters quotes British finance minister Jeremy Hunt as saying on Friday that he aims to prioritize tax cuts for businesses once there is room in the public finances to do so.
On the flip side, the Bank of Japan’s (BoJ) repeated attempts to defend the Yield Curve Control (YCC), amid recently firmer inflation data from Tokyo, keep GBP/JPY sellers hopeful. On the same line could be the comparatively firmer fundamentals surrounding Japan than that of the UK.
Looking forward, GBP/JPY prices may witness a short-term rebound amid cautious optimism in the market, as well as receding fears of the UK’s workers’ strikes. However, major attention will be given to the BoE’s rate hike and attempts to tame inflation without harming productivity.
Technical analysis
Although the 21-DMA puts a floor under the GBP/JPY prices near 159.50, a one-month-old descending resistance line surrounding 161.65 holds the key for buyer’s entry.
- AUD/USD has scaled to near 0.7115 after a recovery move despite solidifying cautionary market mood.
- The Fed might hike interest rates by 25 bps and keep them steady at 4.75-5.00% for the remaining year.
- Australian monthly Retail Sales are expected to display de-growth by 0.3%.
The AUD/USD pair has accelerated to near 0.7115 after rebounding from below 0.7095 in the Asian session. The Aussie asset is scaling firmly higher despite the expression of caution in the market sentiment.
S&P500 futures are showing selling pressure in the Asian session as investors are dubious about whether to ditch United States equities due to softening demand or add them amid expectations of a further slowdown in the inflation projections. The US Dollar Index (DXY) is hovering around 101.50 after a downside move and is expected to remain on the tenterhooks as investors will keep an eye on chatters ahead of the interest rate decision by the Federal Reserve (Fed).
Meanwhile, the 10-year US Treasury yields have climbed to near 3.52% as Fed chair Jerome Powell is set to hike interest rates further.
Analysts at Rabobank point out that it has become increasingly likely that the Fed will slow down its hiking cycle to 25 bps. For the interest rate guidance “We continue to think that based on the fading momentum of inflation, the Federal Open Market Committee (FOMC) is likely to stop at a 4.75-5.00% target range and pause for the remainder of the year.”
Easing supply chain disruptions and a decline in the overall demand have softened inflation projections and it seems that the worst is behind us, however, the labor cost index and tight labor market are still a major concern for Fed policymakers.
On the Aussie front, investors are awaiting the release of the monthly Australian Retail Sales data for fresh cues. Tuesday’s monthly retail sales indicate a de-growth of 0.3% vs. the former expansion of 1.4%. Declining retail demand might have some impact on the red-hot Australian inflation, which has reached 7.8%, as reported last week, in the fourth quarter of CY2022. The Reserve Bank of Australia (RBA) is expected to continue hiking interest rates further to tame soaring inflation.
- EUR/USD seesaws around intraday high after snapping two-day downtrend.
- Descending resistance line from Thursday, 50-HMA restrict immediate upside.
- MACD, RSI conditions back the latest recovery moves from two-week-long ascending trend line.
EUR/USD struggles to extend the bounce off a two-week-long support line as it makes rounds to 1.0870 during early Monday. In doing so, the major currency pair also fades the upside momentum after the first positive day in three.
That said, the quote’s recovery from an upward-sloping trend line from January 12 takes clues from the RSI (14) rebound from the oversold territory, near the 50.00 mark in the press time. Adding strength to the upside momentum are the bullish MACD signals.
However, a descending resistance line from Thursday, close to 1.0880 at the latest, guards the quote’s nearby upside.
Following that, the 50-Hour Moving Average (HMA) level surrounding 1.0885 and 1.0900 could probe the EUR/USD buyers before directing them to the monthly high of 1.0930 marked in the last week.
It should be noted that the EUR/USD pair’s successful run-up beyond 1.0930 enables it to challenge the 1.1000 psychological magnet.
Meanwhile, a downside break of the aforementioned fortnight-old support line, close to 1.0840 by the press time, becomes necessary for the EUR/USD bears to retake control.
In a case where the EUR/USD prices remain weak past 1.0840, lows marked during January 18 and 12, respectively near 1.0765 and 1.0730, will be crucial to watch.
EUR/USD: Hourly chart
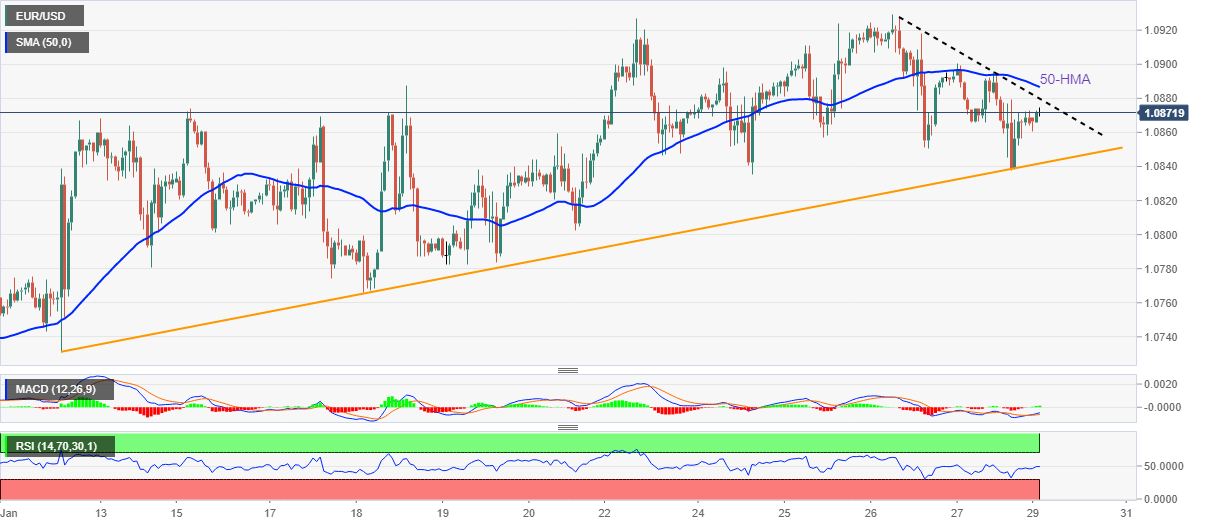
Trend: Limited upside expected
| Index | Change, points | Closed | Change, % |
|---|---|---|---|
| NIKKEI 225 | 19.81 | 27382.56 | 0.07 |
| Hang Seng | 122.12 | 22688.9 | 0.54 |
| KOSPI | 15.37 | 2484.02 | 0.62 |
| ASX 200 | 25.5 | 7493.8 | 0.34 |
| FTSE 100 | 4.1 | 7765.2 | 0.05 |
| DAX | 17.18 | 15150.03 | 0.11 |
| CAC 40 | 1.22 | 7097.21 | 0.02 |
| Dow Jones | 28.67 | 33978.08 | 0.08 |
| S&P 500 | 10.13 | 4070.56 | 0.25 |
| NASDAQ Composite | 109.3 | 11621.71 | 0.95 |
- The Euro bulls are showing strength ahead of the German GDP data release.
- A recovery move above the 20-EMA indicates the short-term trend is bullish.
- The RSI (14) is still in the 40.00-60.00 range, showing the absence of a potential trigger.
The EUR/JPY pair sensed a significant buying interest after dropping to near the four-day low around 140.80 in the early Asian session. The cross has picked demand ahead of the release of the preliminary German Gross Domestic Product (GDP) (Q4) data, which will release on Monday. The economic data is seen at 0% lower than the prior figure of 0.4% on a quarterly basis.
This week, the event that will keep the asset volatile is the interest rate decision by the European Central Bank (ECB), which will release on Thursday. Considering Eurozone’s roaring inflation, European Central Bank (ECB) President Christine Lagarde will push the interest rates higher by 50 basis points (bps) to 2.50%.
EUR/JPY is displaying rangebound action broadly in a Descending Triangle chart pattern on an hourly scale. The downward-sloping trendline of the above-mentioned chart pattern is plotted from January 25 high at 142.29 while the horizontal support is placed from January 25 low around 140.76. On a broader basis, the south side trendline from January 11 high at 142.61 will act as a major barricade for the Euro bulls.
The recovery move from the horizontal support of the chart pattern has pushed the cross above the 20-period Exponential Moving Average (EMA) at 141.22, which indicates that the short-term trend is turning bullish.
While the Relative Strength Index (RSI) (14) is still oscillating in a 40.00-60.00 range, which indicates a consolidation ahead.
For an upside move, the cross needs to surpass January 25 high at 142.29, which will drive the asset toward January 11 high at 142.61 followed by October 24 low at 143.72.
On the flip side, a break below January 25 low around 140.76 will be a breakdown of the chart pattern, which will drag the asset towards January 5 low at 140.14. A slippage below the same will expose the cross for more downside toward January 17 high at 139.62.
EUR/JPY hourly chart
-638106349764496458.png)
- DXY bulls eye102.50 that guard 103.00 and a 38.2% Fibonacci retracement of the weekly bearish impulse.
- The Federal Reserve and US Nonfarm Payrolls will be this week's highlight.
The US Dollar has made some modest gains in the build-up to the Federal Reserve this week and is starting out on the front foot on Monday and this was despite the data that showed falling US Consumer Spending and cooling inflation. The Commerce Department reported the Federal Reserve's preferred gauge for inflation, the Personal Consumption Expenditures (PCE) price index, rose 0.1% last month after a similar rise in November.
The market remains of the mind that the Federal Reserve will pivot in H2 and only hike one more time following this week's 0.25% rate hike before stopping. The current target range is 4.25% to 4.5%. ''However, the hard part for the Fed will be convincing the markets that they are wrong about its perceived pivot,'' analysts at Brown Brothers Harriman argued, adding:
''The Fed will leave the door wide open for further rate hikes and Chair Powell will stress that the Fed is prepared to continue hiking rates beyond 5% and keep them there until 2024, as the December Dot Plots showed. As things stand, the Fed is seen starting an easing cycle in H2 and we view that as highly unlikely. New Dot Plots and macro forecasts won’t come until the March 21-22 meeting. We will send out a more detailed FOMC Preview Monday morning.''
As for the US Nonfarm Payrolls, while it is expected to have continued to rise in January, the 175,000 increase in payrolls expected would be the smallest gain since a drop in December 2020. ''The labour market remains tight and layoffs are still very low. But the number of job openings has been edging lower and we look for a tick up in the unemployment rate to 3.6% from 3.5% in December,'' analysts at RBC Economics argued.
Meanwhile, from a technical perspective, the US dollar has been drifting sideways within the range of between 101.50 and 102.20, Friday's high, or 102.40 as per last week's highs as the following technical analysis illustrates:
US dollar technical analysis
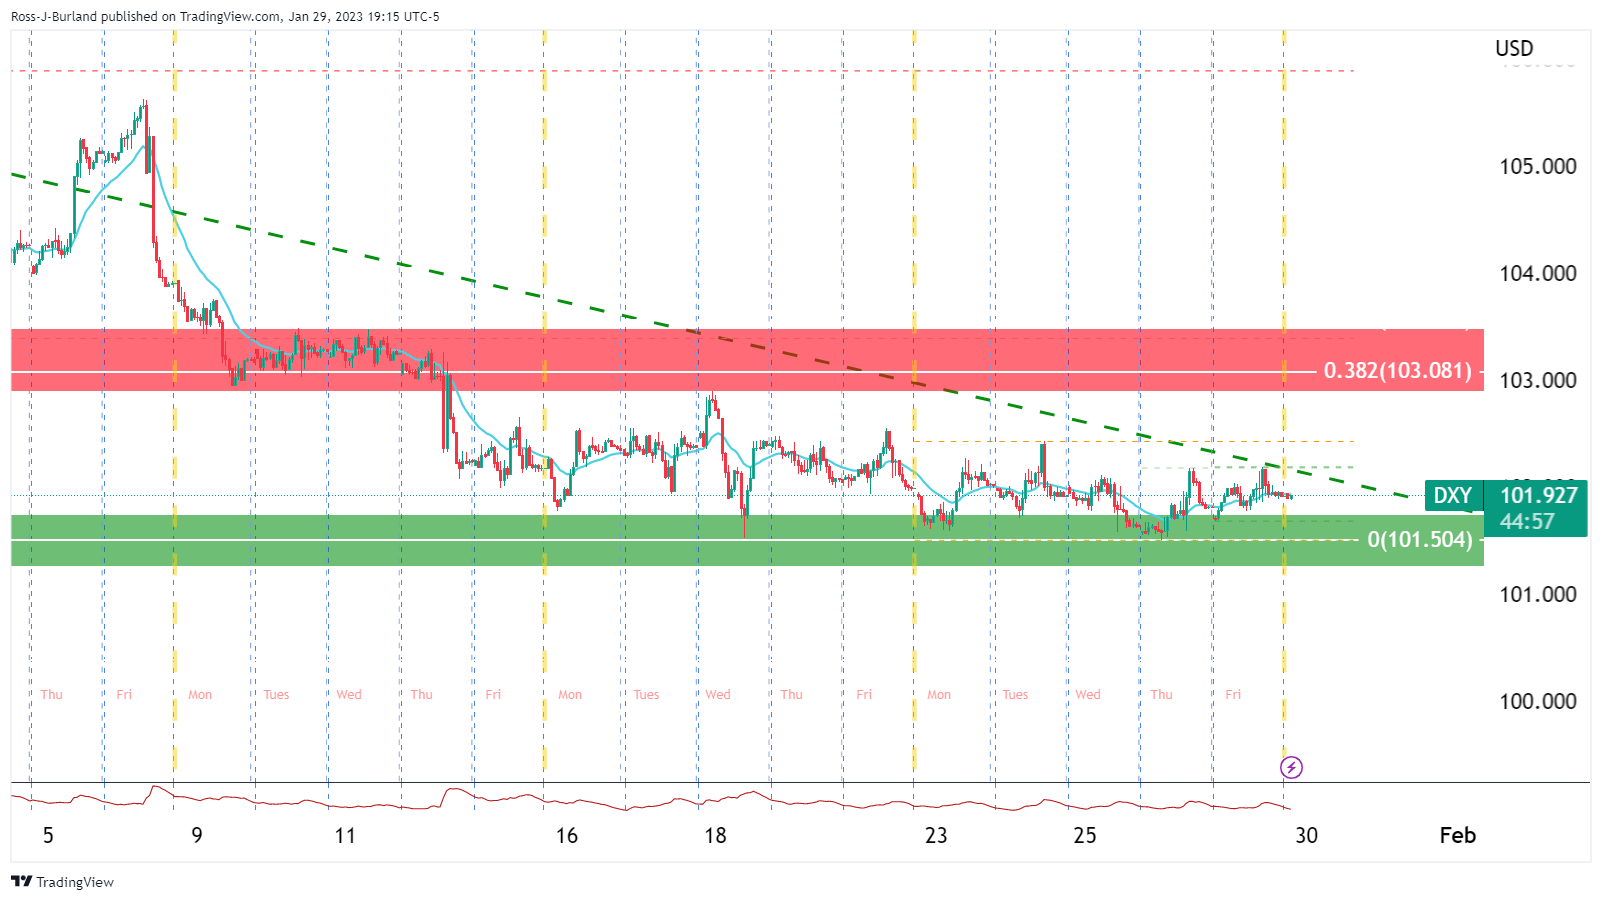
A break of the trendline would be a significant development for the week ahead with 102.50 eyed that guard 103.00 and a 38.2% Fibonacci retracement of the weekly bearish impulse:
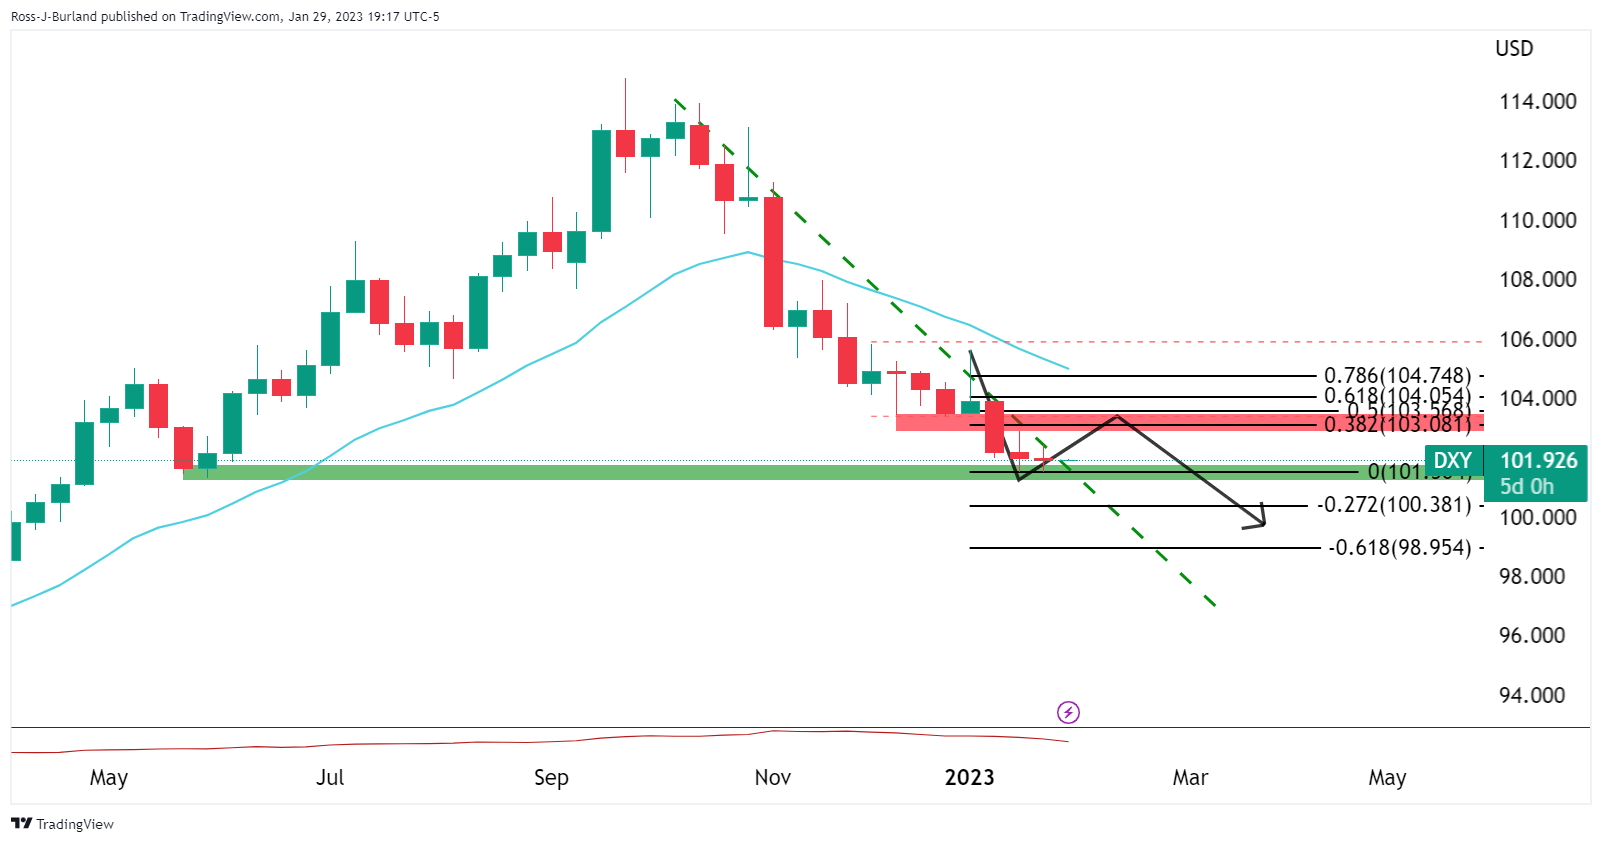
| Pare | Closed | Change, % |
|---|---|---|
| AUDUSD | 0.71074 | 0.03 |
| EURJPY | 141.133 | -0.44 |
| EURUSD | 1.08659 | -0.21 |
| GBPJPY | 160.899 | -0.34 |
| GBPUSD | 1.23877 | -0.07 |
| NZDUSD | 0.64905 | 0.08 |
| USDCAD | 1.33083 | -0.1 |
| USDCHF | 0.92116 | 0.29 |
| USDJPY | 129.884 | -0.26 |
- USD/JPY struggles to extend two-week uptrend, bounces off intraday low of late.
- BoJ’s sustained defense of YCC contrasts with talks surrounding Fed’s pivot to keep bears hopeful.
- Rebound in yields, US Dollar challenge Yen pair sellers amid light calendar.
- China’s return from holidays, US employment numbers also eyed for clear directions.
USD/JPY remains on the back foot around 129.90, despite recently bouncing off the intraday low, as the traders in Tokyo begin the key week with mixed feelings. In doing so, the Yen pair challenges the previous two-week uptrend amid sluggish yields, cautious optimism in the market.
That said, China’s return from the Lunar New Year (LNY) holidays brought the good news of higher festive spending and the dragon nation’s readiness to boost consumption. On the same line could be the hopes of the Federal Reserve’s (Fed) dovish hike after the last week’s mixed data.
On Friday, the Federal Reserve's preferred gauge of inflation, namely the Core Personal Consumption Expenditures (PCE) Price Index, matched 4.4% YoY market forecast versus 4.7% prior while the monthly figure rose to 0.3% versus 0.2% expected and previous readings. Ahead of that, the US Bureau of Economic Analysis' (BEA) first estimate of the US fourth quarter (Q4) Gross Domestic Product marked an annualized growth rate of 2.9% versus 2.6% expected and 3.2% prior. On the same line, the Durable Goods Orders jumped 5.6% in December versus the 2.5% market forecast and -1.7% upwardly revised prior.
Alternatively, the Bank of Japan’s (BoJ) repeated attempts to defend the Yield Curve Control (YCC), amid recently firmer inflation data from Tokyo, exert downside pressure on the USD/JPY prices.
Against this backdrop, the US 10-year Treasury yields remain lackluster near 3.51% after snapping a two-week downtrend whereas the S&P 500 Futures print mild losses.
Looking forward, a light calendar may restrict immediate USD/JPY moves but China’s return from holidays could entertain momentum traders. It’s worth observing that the latest market favor for the US Dollar and the Treasury bond yields may help the Yen pair in extending the previous two-week uptrend.
Above all, this week’s Federal Reserve (Fed) decision and the US employment data for January will be crucial for the market players to watch for clear directions.
Technical analysis
Although the 21-DMA and a two-week-old ascending support line restrict short-term USD/JPY moves between 130.30 and 129.30 in that order, bullish MACD signals and recently firmer RSI (14) suggests that the buyers are flexing muscles for entry.


© 2000-2026. Bản quyền Teletrade.
Trang web này được quản lý bởi Teletrade D.J. LLC 2351 LLC 2022 (Euro House, Richmond Hill Road, Kingstown, VC0100, St. Vincent and the Grenadines).
Thông tin trên trang web không phải là cơ sở để đưa ra quyết định đầu tư và chỉ được cung cấp cho mục đích làm quen.
Giao dịch trên thị trường tài chính (đặc biệt là giao dịch sử dụng các công cụ biên) mở ra những cơ hội lớn và tạo điều kiện cho các nhà đầu tư sẵn sàng mạo hiểm để thu lợi nhuận, tuy nhiên nó mang trong mình nguy cơ rủi ro khá cao. Chính vì vậy trước khi tiến hành giao dịch cần phải xem xét mọi mặt vấn đề chấp nhận tiến hành giao dịch cụ thể xét theo quan điểm của nguồn lực tài chính sẵn có và mức độ am hiểu thị trường tài chính.
Sử dụng thông tin: sử dụng toàn bộ hay riêng biệt các dữ liệu trên trang web của công ty TeleTrade như một nguồn cung cấp thông tin nhất định. Việc sử dụng tư liệu từ trang web cần kèm theo liên kết đến trang teletrade.vn. Việc tự động thu thập số liệu cũng như thông tin từ trang web TeleTrade đều không được phép.
Xin vui lòng liên hệ với pr@teletrade.global nếu có câu hỏi.
ngân hàng