- Phân tích
- Tin tức và các công cụ
- Tin tức thị trường
Tin tức thì trường
- USD/JPY takes offers to refresh intraday low, fades bounce off weekly bottom.
- Firmer prints of Tokyo CPI for January renews hawkish concerns over BoJ and weigh on Yen prices.
- Mixed concerns surrounding Fed’s next move, hopes of BoJ’s hawkish turn also please USD/JPY bears.
- Fed’s preferred inflation gauge eyed for clear directions ahead of next week’s FOMC.
USD/JPY renews its intraday low to 129.75 as Japan inflation data renews hawkish bias over the Bank of Japan (BoJ) during early Friday. It’s worth noting that the US Dollar’s lack of ability to extend the previous day’s rebound, as well as the cautious mood ahead of the key inflation precursor tracked by the Federal Reserve (Fed), also weigh on the Yen pair.
That said, Tokyo Consumer Price Index (CPI) matches 4.4% YoY forecasts for January, versus 4.0% prior. Not only the headline inflation data but the core measures like Tokyo CPI excluding fresh food and Tokyo CPI excluding Food and Energy also rose during the stated month. As a result, chatter over the BoJ’s exit from the ultra-easy monetary policy gained momentum.
Other than Japan inflation data, the Bank of Japan's (BoJ) Summary of Opinions, published on Thursday, also underpins the bearish bias of the USD/JPY pair as policymakers are divided over the exit of the ultra-easy monetary policy considering the increasing inflation. “The divergence in views highlights the challenge policymakers face in determining whether the recent cost-driven rise in inflation will shift to one backed by robust demand and higher wages - a prerequisite for raising ultra-low interest rates,” said Reuters.
Furthermore, the US Dollar’s struggle to extend the data-backed run-up also pleases the USD/JPY buyers. That said, the US Dollar Index (DXY) marked the first daily positive in three while bouncing off the lowest levels since May 31, 2022, poked earlier on Thursday, close to 101.80 by the press time.
On Thursday, the US Bureau of Economic Analysis’ (BEA) first estimate of the US fourth quarter (Q4) Gross Domestic Product marked an annualized growth rate of 2.9% versus 2.6% expected and 3.2% prior. On the same line, the Durable Goods Orders jumped 5.6% in December versus 2.5% market forecast and -1.7% upwardly revised prior. It should be noted, however, that the growth of Personal Consumption Expenditures Prices weakened to 3.2% QoQ in Q4 compared to 4.3% marked forecast and prior readings. Further, Core Personal Consumption Expenditures eased to 3.9% QoQ for Q4 from 4.7% previous readings, versus 5.3% expected.
Amid these plays, the US 10-year Treasury yields not only snapped a two-day downtrend but also posted the biggest daily gains in a week while rising to 3.50%. It’s worth noting that the key US equity benchmarks on Wall Street also managed to rise despite mixed earnings reports and firmer yields.
Looking forward, the Fed’s preferred inflation gauge, namely Core Personal Consumption Expenditures (PCE) - Price Index for December, expected to remain unchanged at 0.2% MoM, will be crucial for the clear directions ahead of the next week’s Federal Open Market Committee (FOMC) meeting.
Technical analysis
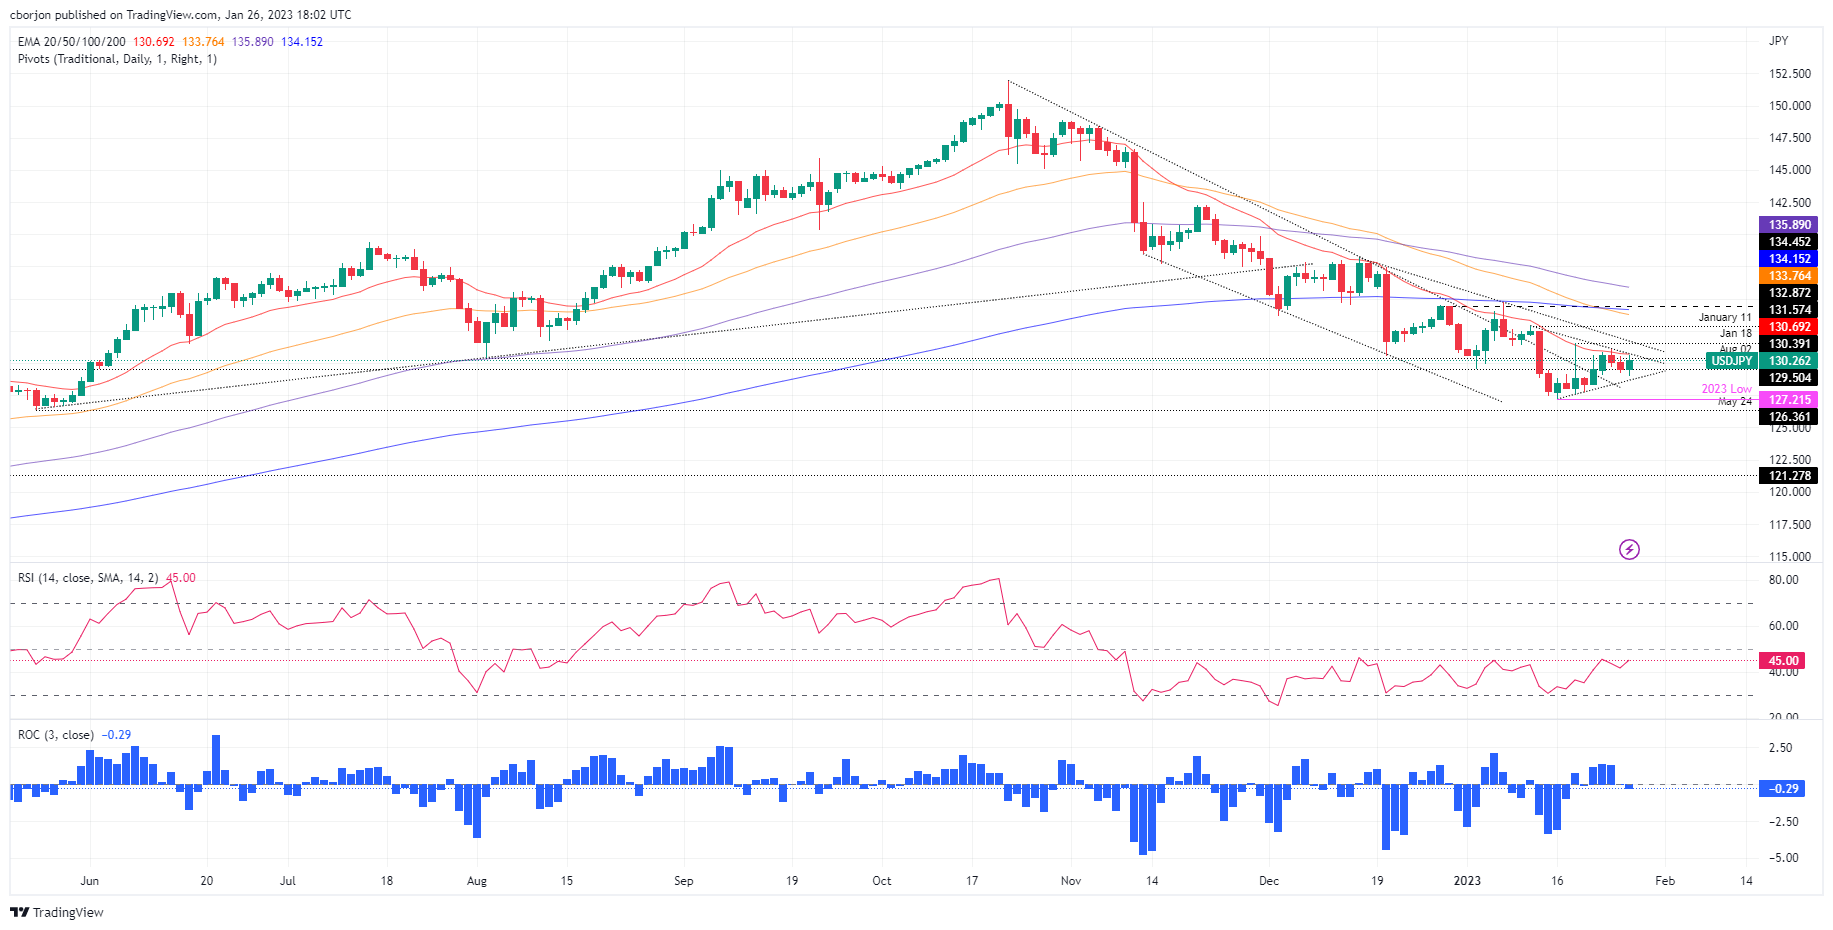
The 21-DMA surrounding 130.00 keeps pushing USD/JPY down even as a fortnight-old support line, close to 128.80 at the latest, puts a floor under the prices for a short term.
- USD/CHF is struggling to surpass the 0.9200 resistance despite a decline in investors’ risk appetite.
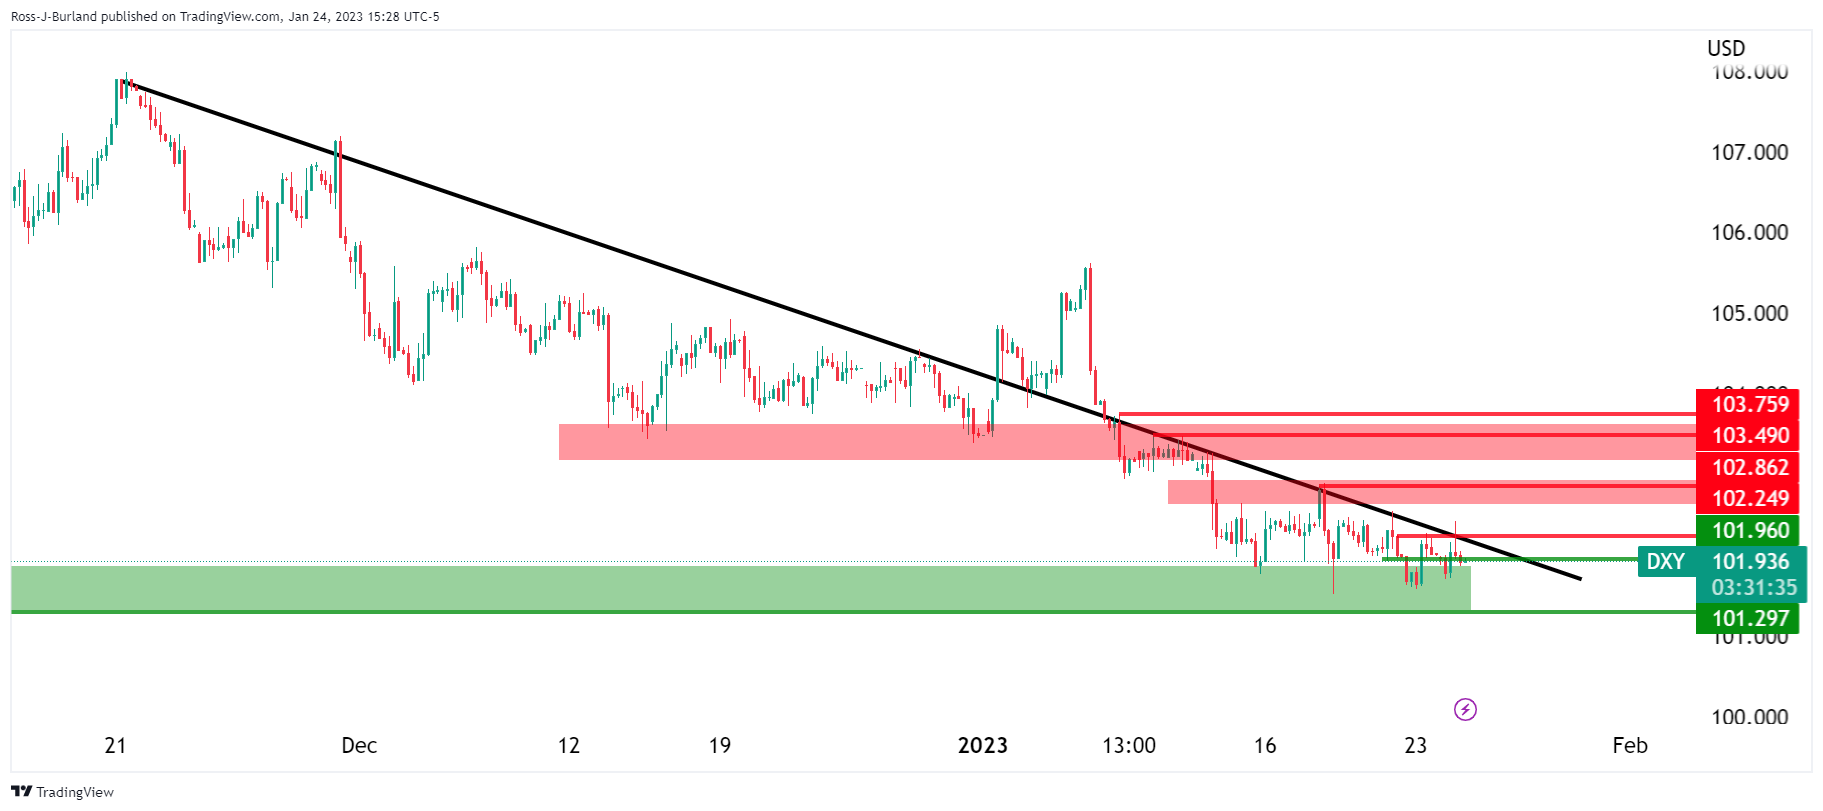
- The USD Index is expected to stay offered in a 101.30-102.00 range ahead of the Fed’s policy.
- Swiss Real Retail Sales are expected to expand by 2.6% vs. -1.3% recorded earlier.
The USD/CHF pair is sensing hurdles in scaling above the immediate resistance of 0.9200 in the early Asian session. The Swiss Franc asset is attempting to build a base around 0.9200 for a subtle rebound as investors are getting anxious ahead of the release of the United States Personal Consumption Expenditure (PCE) Price Index data.
The risk appetite of the market participants has trimmed as the S&P500 futures are displaying some losses in early Asia. Optimism built from the strength shown by the 500-US stock basket on Thursday is fading now. The US Dollar Index (DXY) might look for a recovery move after dropping to near 101.40. Meanwhile, the 10-year US Treasury yields have climbed above 3.50% as investors are shifting their focus broadly towards the interest rate decision by the Federal Reserve (Fed), which is scheduled for next week.
On Friday, investors might witness a power-pack action after the release of the Fed’s preferred inflation tool. The monthly core PCE price index (Dec) is seen as unchanged at 0.2%. Apart from that Michigan Consumer Sentiment Index will remain in focus, which is also seen steady at 64.6.
Next week, the event of the monetary policy announcement by Fed chair Jerome Powell will keep the USD index in traction. In the opinion of economists at ING, US Dollar could go into next week's Fed meeting on the offered side.” They further added that “We are not sure that DXY is ready to break below support at 101.30 just yet. And we see next week's FOMC meeting as an upside risk to the Dollar. But for the time being, expect DXY to stay offered in a 101.30-102.00 range.”
On the Swiss Franc front, investors will focus on next week’s Real Retail Sales data. As per the consensus, the economic data is seen at 2.6% vs. a contraction of 1.3% reported earlier. An upbeat retail demand could trigger inflation projections. The Swiss National Bank (SNB) is still looking for a strong footing for economic recovery.
The Tokyo Consumer Price Index that is released by the Statistics Bureau has fallen in as follows:
- Japan Tokyo CPI (YoY) Jan: 4.4% (est 4.0%; prevR 3.9%).
- Tokyo CPI Ex-Fresh Food (YoY) Jan: 4.3% (est 4.2%; prevR 3.9%).
- Tokyo CPI Ex-Fresh Food, Energy (YoY) Jan: 3.0% (est 2.9%; prev 2.7%).
USD/JPY update
The markets are paying closer attention to such data as the sentiment for a reversal in the Bank of Japan’s (BoJ) monetary policy would be such a ground-breaking event that it would have a big impact on the Yen and forex in general.
USD/JPY has dropped 30 pips on the data.
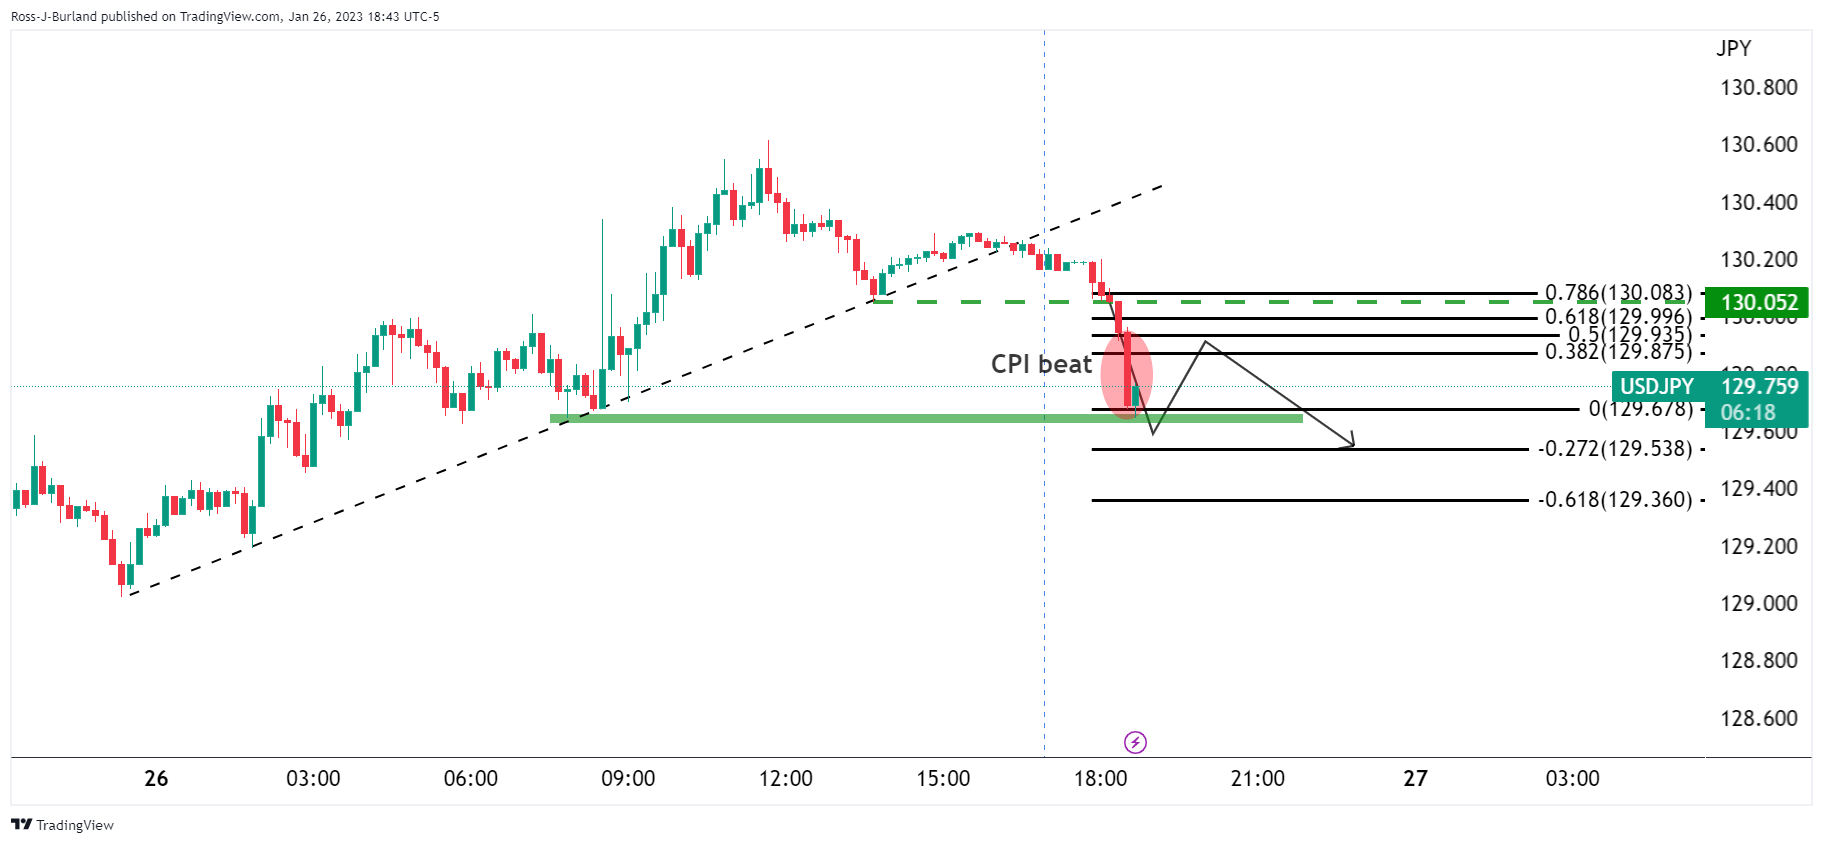
There are prospects of a bounce but the data does underpin the bullish yen sentiment for longer. We have more red news on the calendar later today in the US session, so there could be a quiet before the storm in markets ahead of the Core Person Income Expenediture data.
About Tokyo CPI
The Tokyo Consumer Price Index is released by the Statistics Bureau and it's a measure of price movements obtained by comparison of the retail prices of a representative shopping basket of goods and services. The index captures inflation in Tokyo. CPI is the most significant way to measure changes in purchasing trends. The purchase power of JPY is dragged down by inflation. Generally a high reading is seen as positive.
- AUD/USD bulls retreat from seven-month high while probing five-day uptrend.
- Rising wedge bearish chart pattern, looming bear cross on MACD tease sellers.
- 100-SMA, six-week-old horizontal support add to the downside filters.
- Further upside could aim for June 2022 peak.
AUD/USD struggles for clear directions around the highest levels since June, marked the previous day, as it stays defensive near 0.7115 amid early Friday morning in Asia. In doing so, the Aussie pair also challenges the previous five-day winning streak and teases sellers by forming a rising wedge bearish chart pattern on the four-hour play.
Not only the rising wedge but the impending bear cross on the MACD also favors the odds of a pullback by the Aussie pair.
That said, the stated bearish pattern’s lower line, close to 0.7085 by the press time, appears the key as a break of which could confirm the rising wedge breakdown that theoretically suggests the downturn towards the 0.6800 mark.
However, the 100-SMA and multiple levels marked since mid-December 2022, respectively near 0.6950 and 0.6890, could challenge the further downside.
Meanwhile, recovery moves need to refresh the latest multi-month high, marked on Thursday around 0.7140, as well as the stated wedge’s top surrounding 0.7145, to recall the AUD/USD buyers.
Following that, a run-up toward the June 2022 high near 0.7285 can’t be ruled out.
Overall, AUD/USD buyers appear running out of steam but the bears have a bumpy road to track.
AUD/USD: Four-hour chart
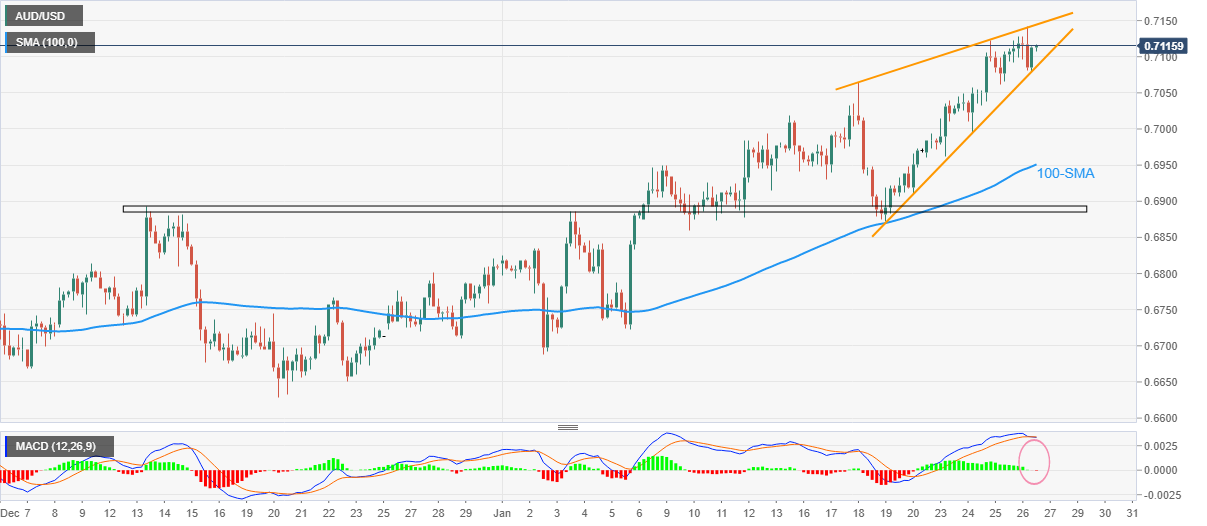
Trend: Pullback expected
- USD/CAD surrendered 1.3400, as buyers could not break the confluence of the 20 and 100-day EMAs.
- USD/CAD Price Analysis: Upward biased, but once it falls below 1.3225, a move towards 1.3000 is on the cards
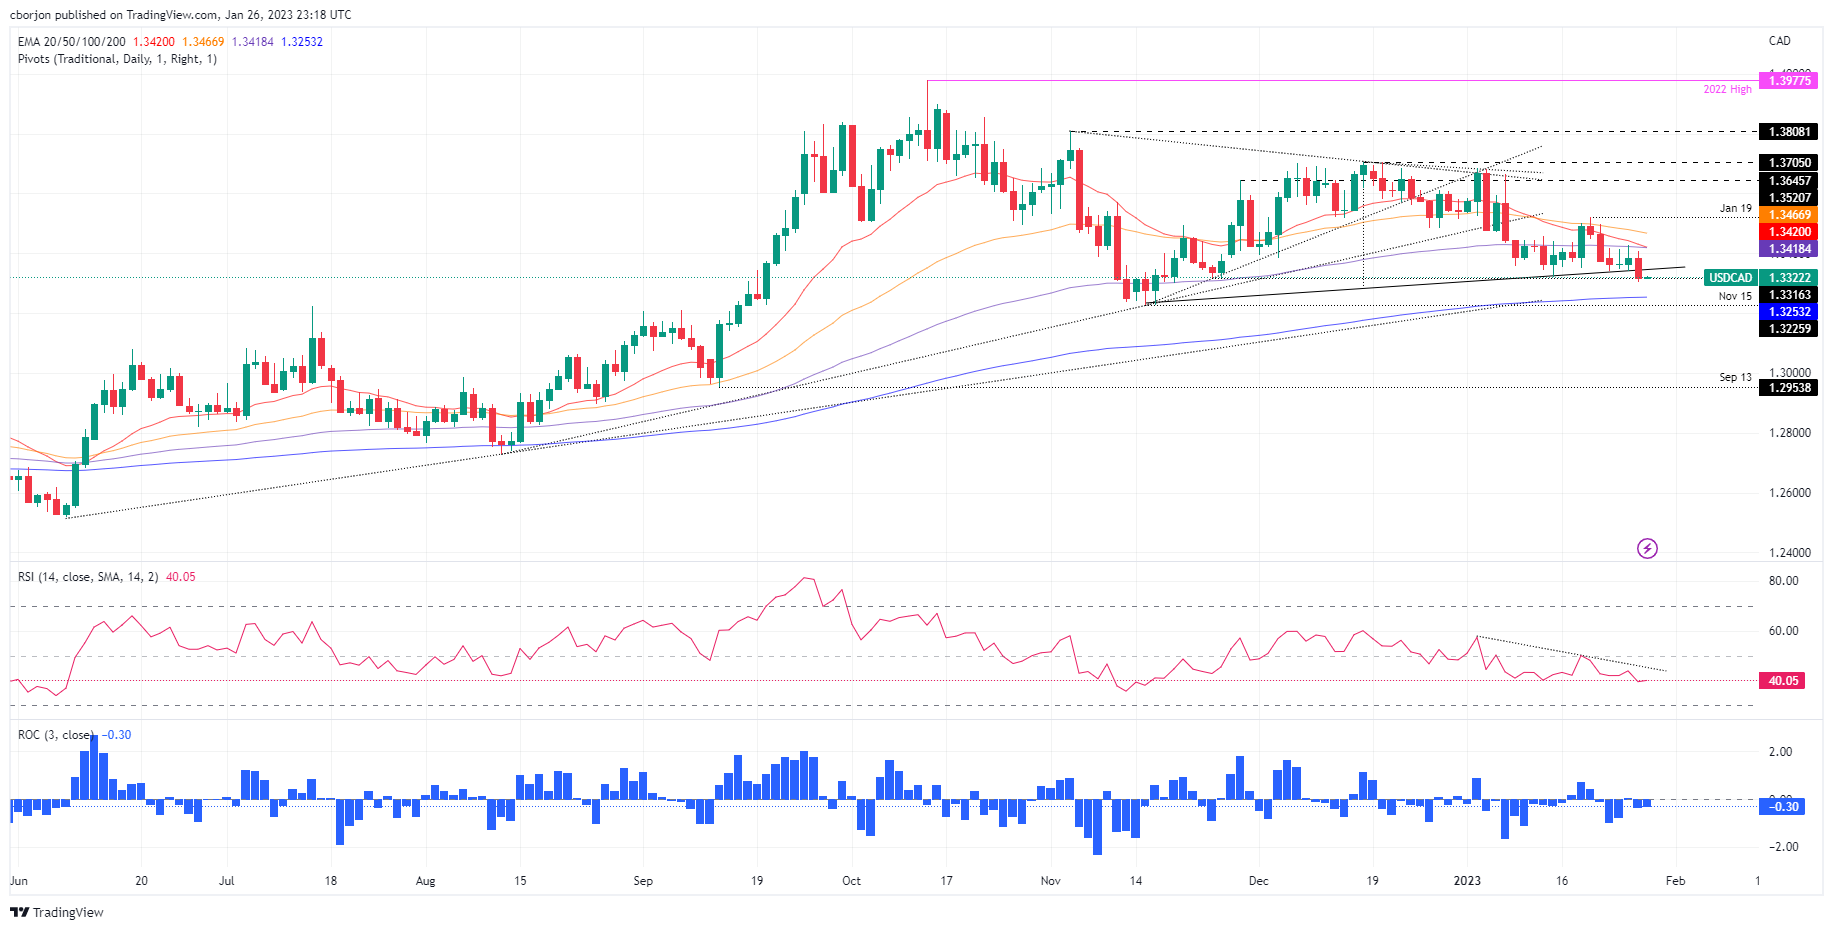
The USD/CAD extended its losses on Thursday after hitting a daily high of 1.3407, though as the Asian session begins, it’s almost unchanged. Additionally, the 20-day Exponential Moving Average (EMA) is crossing below the 100-day EMA, a bearish signal, suggesting further downside pressure lies ahead. At the time of writing, the USD/CAD is trading at 1.3323.
USD/CAD Price Analysis: Technical outlook
From a daily chart perspective, the Loonie (CAD) had continued to strengthen against the US Dollar (USD), as the USD/CAD failed to clear solid resistance in the form of the 100-day EMA at 1.3418 and the 20-day EMA at 1.3420. Nevertheless, the USD/CAD bias is bullish as long as the exchange rates hold above the 200-day EMA, which is meandering around 1.3253.
USD/CAD traders should be aware of a break of a support trendline drawn from the lows of November, which could pave the way for further losses. Oscillators-wise, the Relative Strength Index (RSI) continued its bearish path, while the Rate of Change (RoC) indicates consolidation lying ahead as volatility remains low.
The USD/CAD key support levels would be the 1.3300 figure. A break below, and the USD/CAD could test the 200-day EMA at 1.3253. Once cleared, the pair’s next demand area will be the November 15 low at 1.3225, followed by 1.3200.
As an alternate scenario, if the USD/CAD edges up, its first supply area would be the upslope support trendline broken on Thursday at around 1.3330/40. Once reclaimed, the confluence of the 20/100-day EMAs around 1.3418/20 would be next, and then the January 19 high at 1.3520.
USD/CAD Key Technical Levels
- EUR/USD is looking to extend its recovery move to near 1.0900 after a minor correction.
- Further interest rate hikes by the Fed might slow down the US economy further.
- German GDP might display a de-growth of 1.1% from an expansion of 0.4% reported earlier.
The EUR/USD pair has corrected marginally to near 1.0887 in the early Tokyo session after a sheer recovery move from 1.0855. The major currency pair is looking to extend gains further to near the round-level resistance of 1.0900 amid the higher risk appetite of the market participants. The US Dollar Index (DXY) corrected dramatically to near 101.40 after failing to extend recovery above 101.80.
Better-than-projected release of the United States Gross Domestic Product (GDP) and stronger forward demand for Durable Goods provided strength to S&P500. The USD Index also get attention after upbeat GDP data for Q4CY2022 but further growth prospects still sound vulnerable.
Analysts at Wells Fargo have warned that while the economy came into the fourth quarter with solid momentum, it ended the quarter with a distinct loss of momentum. They have forecasted that real GDP will be more or less flat in Q1-2023 on a sequential basis as the Federal Open Market Committee (FOMC) to raise rates by a combined amount of 75 basis points (bps) at the next three policy meetings—will exert further headwinds on the economy.
Meanwhile, the Euro is likely to dance to the tunes of the preliminary German GDP (Dec) data, which is scheduled for Monday. On a quarterly basis, the economic data might display de-growth by 1.1% from the prior release of 0.4%. This might impact the Euro ahead. Apart from that, investors will keenly focus on the headlines related to the interest rate decision by the European Central Bank (ECB), which is scheduled for next week.
About Eurozone inflation projections, Germany's Economy Minister Robert Habeck cited “Inflation is still higher at the beginning of 2023, further containment then in the course of the year”. “Then in 2024 inflation will be lower than in 2023, with higher growth.”
After initially suggesting a fall in the UK Inflation, British Treasury Secretary Jeremy Hunt will say on Friday that he will tackle the country's weak productivity growth, including by using post-Brexit finance reforms to drive more investment into the economy, per the UK Treasury as reported by Reuters.
The update also states that UK Chancellor Hunt will say in a speech on Friday, "We should not shy away from the biggest challenge we face which is our poor productivity."
Hunt would confirm in the speech that reforms to the European Union's Solvency II rules will be implemented in the coming months, allowing insurers to invest more in the economy, the ministry said, per Reuters.
GBP/USD retreats
GBP/USD was last seen declining to 1.2398, down 0.13% intraday, even after the upbeat news.
Also read: GBP/USD stabilizes above 1.2400 as USD index extends correction, US PCE in focus
- Gold price slips from bull’s radar after a three-day uptrend, sidelined of late.
- XAU/USD retreats as US Dollar bounced off an eight-month low after the United States Gross Domestic Product.
- Upbeat performance of US Treasury bond yields also weighed on Gold prices.
- Federal Reserve’s preferred inflation precursor eyed for clear directions on Gold price.
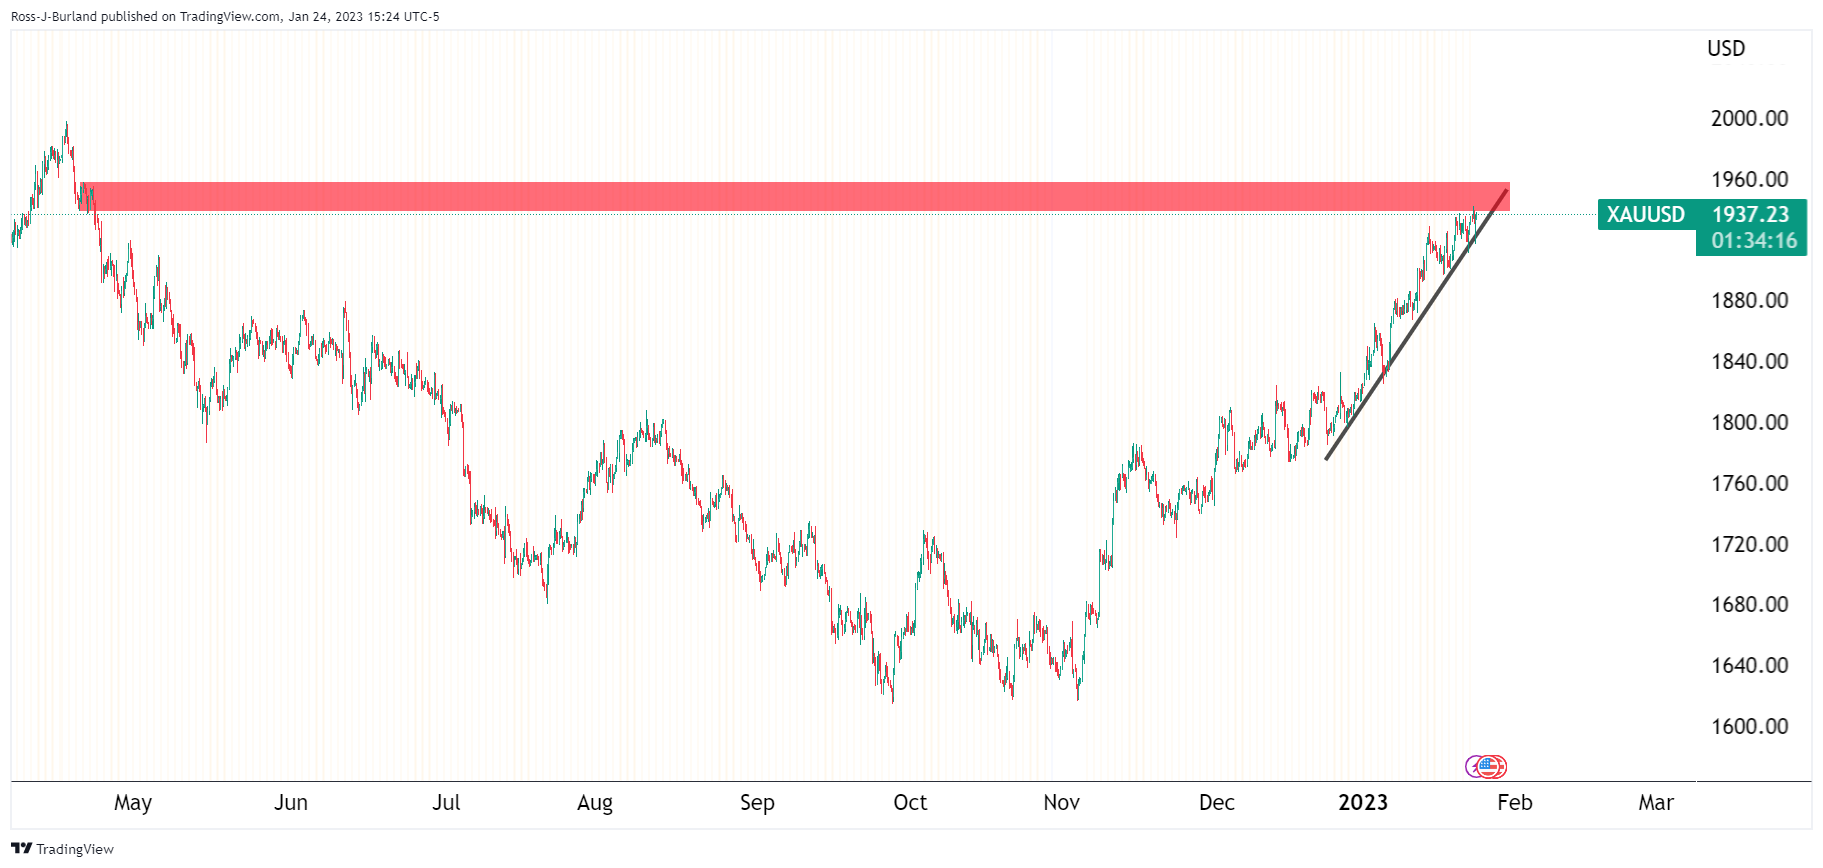
Gold price (XAU/USD) pushes back the bulls at the nine-month high, after rising for the last three consecutive days, even as it seesaws around $1,930 during the early hours of Friday’s Asian session. That said, the metal’s latest pullback could be linked to the rebound in the United States Treasury bond yields and the US Dollar after the key data, including the fourth quarter (Q4) Gross Domestic Product (GDP). However, the cautious mood ahead of the Federal Reserve’s preferred inflation gauge, namely the Core Personal Consumption Expenditures - Price Index for December, seems to probe the Gold sellers of late, especially ahead of the next week’s Federal Open Market Committee (FOMC) meeting.
United States data weighs on Gold
A slew of the United States key data was released on Thursday and allowed the market to alter its previous bias towards the Federal Reserve, which in turn triggered a corrective bounce of the US Dollar and weighed on the Gold price after three consecutive days of run-up.
On Thursday, the US Bureau of Economic Analysis' (BEA) first estimate of the US fourth quarter (Q4) Gross Domestic Product marked an annualized growth rate of 2.9% versus 2.6% expected and 3.2% prior.
On the same line, the Durable Goods Orders jumped 5.6% in December versus 2.5% market forecast and -1.7% upwardly revised prior.
It should be noted, however, that the growth of Personal Consumption Expenditures Prices weakened to 3.2% QoQ in Q4 compared to 4.3% marked forecast and prior readings. Further, Core Personal Consumption Expenditures eased to 3.9% QoQ for the Q4 from 4.7% previous readings, versus 5.3% expected.
Following the mostly upbeat data, talks are loud that the Federal Reserve will have a chance to defend its hawkish moves, especially the interest rate hikes, which in turn propelled the US Dollar and weighed on the XAU/USD.
That said, the US Dollar Index (DXY) marked the first daily positive in three while bouncing off the lowest levels since May 31, 2022, pokes earlier on Thursday.
US Treasury yields probe XAU/USD bulls despite upbeat equities
Not only does the US Dollar manages to cheer the aforementioned key data from the world’s largest economy but the US Treasury bond yields also recovered and exerted downside pressure on the XAU/USD price. That said, the hawkish hopes from the European Central Bank (ECB), as well as the Federal Reserve (Fed), in contrast with the fresh fears of global economic slowdown, as per the fresh survey of Reuters, seem to be the underlying reason for the latest selling of Gold and bonds.
Federal Reserve’s preferred inflation gauge eyed
Having witnessed upbeat data from the United States, Gold traders will pay attention to the monthly readings of the Core Personal Consumption Expenditures - Price Index for December, expected to remain unchanged at 0.2% MoM, for aptly forecasting the next week’s Federal Reserve moves. Should the inflation precursor eases before the next week’s Fed meeting, the Gold bears will have more reasons to extend the latest pullback.
Gold price: Technical analysis
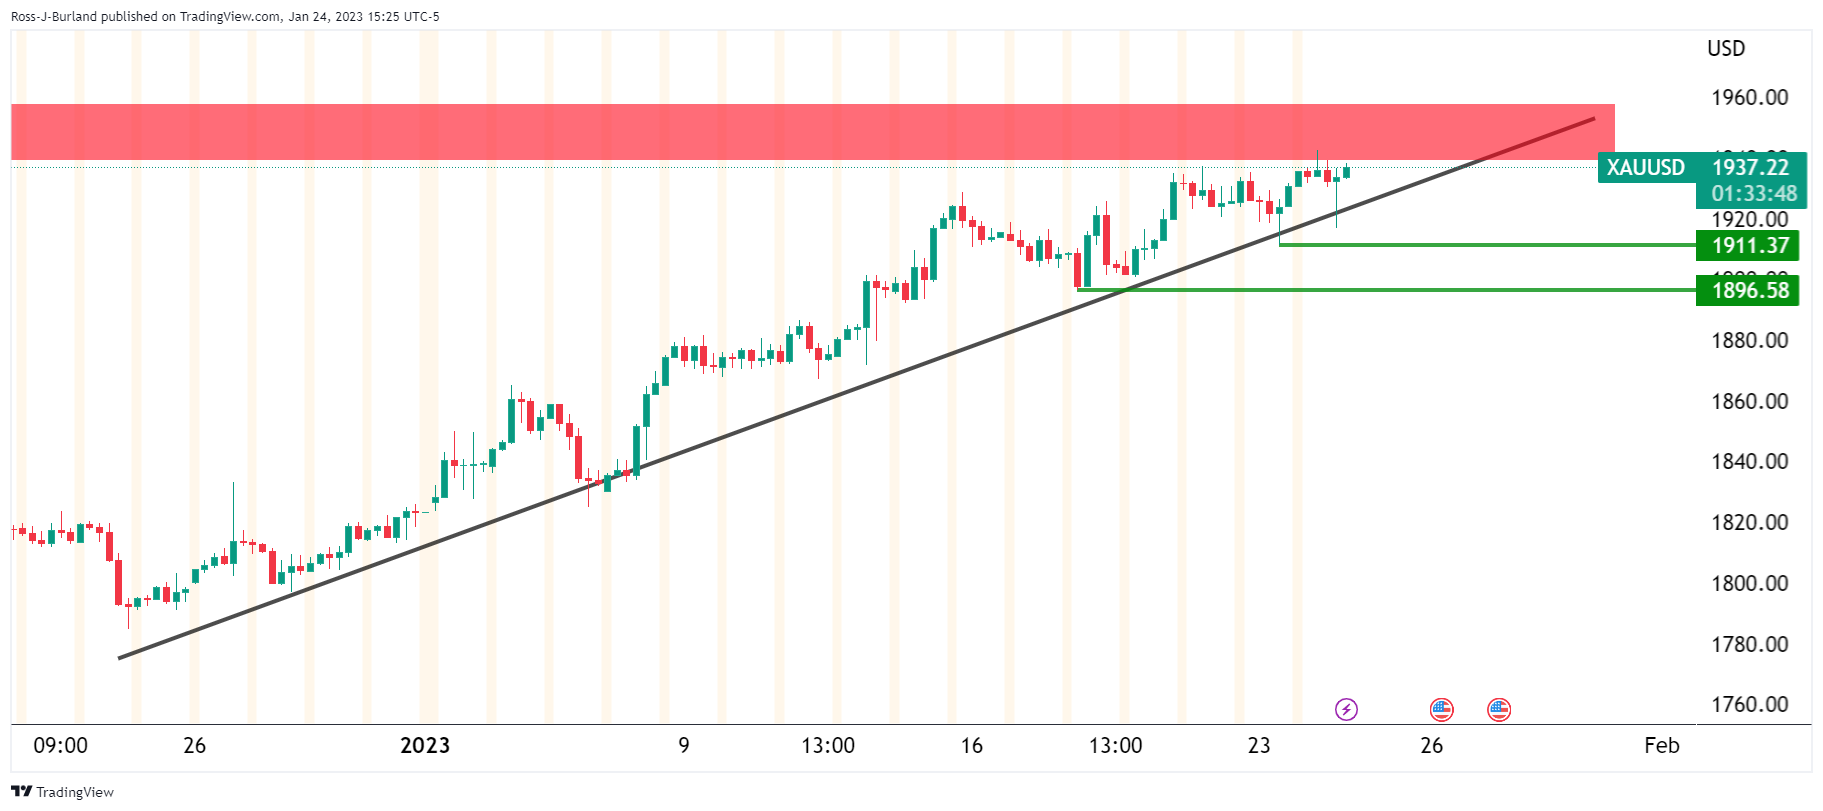
Gold price retreats from a fortnight-old ascending resistance line while stabilizing after the first negative daily closing in four. Even so, the XAU/USD bounces off the 50-bar Simple Moving Average (SMA), around $1,924 by the press time.
The corrective bounce, however, appears ephemeral as the Relative Strength Index (RSI) line, placed at 14, as well as the Moving Average Convergence and Divergence (MACD) indicator, flash mixed signals.
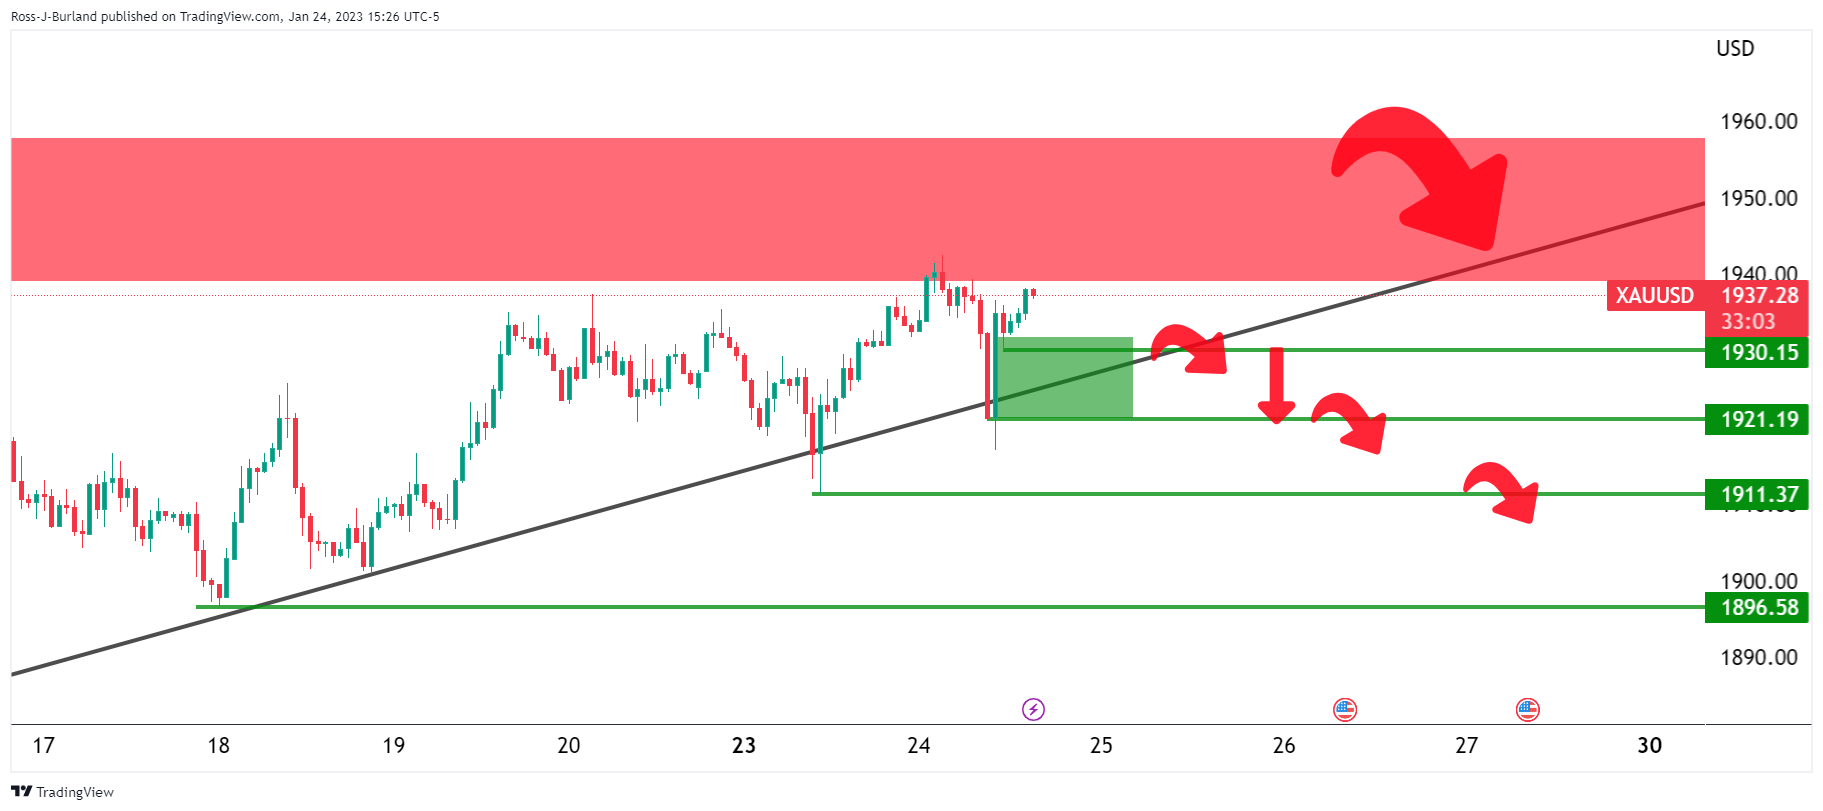
As a result, the Gold price remains on the bear’s radar and can break the immediate support near $1,924, which in turn highlights the one-month-old support line, around $1,907 by the press time.
It’s worth noting that the XAU/USD weakness past $1,907 will need validation from the $1,900 threshold, a break of which could quickly push the quote toward the early January swing high near $1,865.
On the flip side, the aforementioned ascending resistance line, close to $1,951 at the latest, restricts the immediate upside of the Gold price.
In a case where the XAU/USD remains firmer past $1,951, the late March 2022 peak surrounding $1,966 and March 2022 high near $1,998 could probe the upside ahead of highlighting the $2,000 round figure for the metal buyers.
To sum up, Gold price appears to have left the door open for the bears but the road to the south appears long and bumpy.
Gold price: Four-hour chart
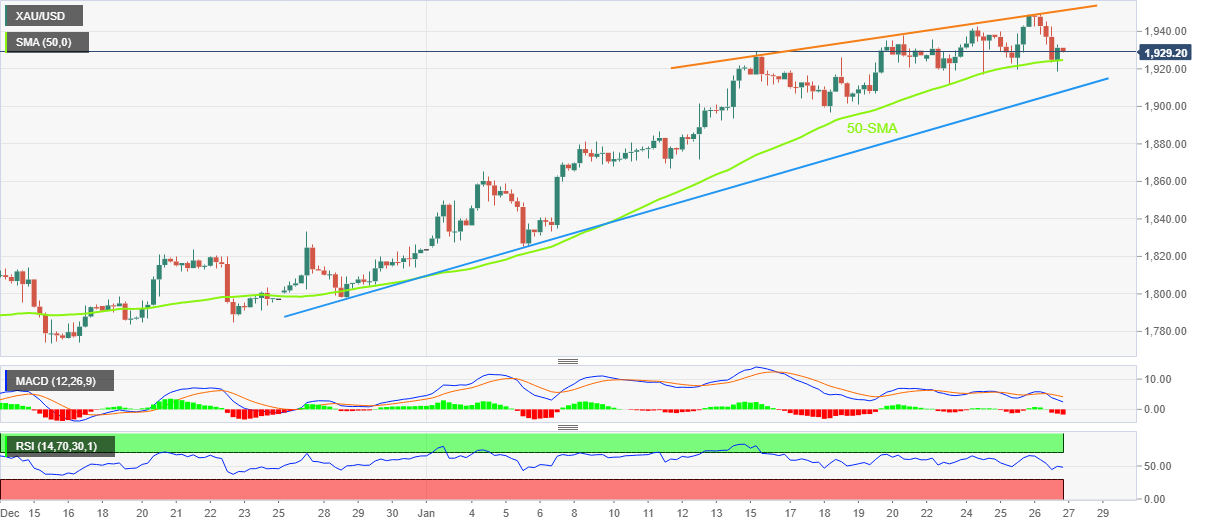
Trend: Pullback expected
- A volatility contraction continues in NZD/USD ahead of the US PCE Price Index data.
- The Kiwi asset is displaying topsy-turvy moves in an Ascending Triangle formation.
- The USD Index failed to capitalize on upbeat US economic data as the odds of Fed's smaller rate hike are still solid.
The struggle of the NZD/USD pair to shift its business above the psychological resistance of 0.6500 continues as the US Dollar Index (DXY) has confidently defended itself from refreshing its seven-month low after the release of the upbeat United States economic data. The Kiwi asset is back inside the woods and is expected to display back-and-forth action till the release of the US Personal Consumption Expenditure (PCE) Price Index (Dec) data.
Meanwhile, the risk profile is favorable as S&P500 ended with significant gains. The US Dollar Index trimmed to 101.40 after a responsive buying action as the odds of a small interest rate hike by the Federal Reserve (Fed) are extremely solid.
On an hourly scale, NZD/USD is displaying topsy-turvy action in an Ascending Triangle chart pattern that indicates volatility contraction. The New Zealand Dollar sensed demand after dropping to near the upward-sloping trendline plotted from January 19 low at 0.6365 while the horizontal resistance is placed from January 18 high at 0.6531.
The 20-EMA at 0.6483 is overlapping the Kiwi asset, which indicates consolidation ahead.
Also, the Relative Strength Index (RSI) (14) is oscillating in a 40.00-60.00 range, which indicates an absence of a potential trigger for a decisive move.
For an upside move, the asset needs to surpass Wednesday’s high at 0.6530, which will drive the asset toward June 3 high at 0.6576. A breach of the latter will expose the asset to the round-level resistance at 0.6600.
On the flip side, a breakdown below January 16 high at 0.6426 will drag the Kiwi asset toward January 17 low at 0.6366 followed by January 12 low around 0.6300.
NZD/USD hourly chart
-638103692935777428.png)
- GBP/USD is steadily oscillating above 1.2400 after a recovery move as USD Index has corrected to near 101.40.
- Upbeat US GDP and forward demand for Durable Goods have trimmed recession fears.
- UK FM Jeremy Hunt cited that tough decision taken by the administration in the autumn budget created a base for declining inflation.
The GBP/USD pair has shifted its auction profile above 1.2400 in the early Asian session after a recovery move from below 1.2350 on Thursday. The Cable has witnessed a decent buying interest as the US Dollar Index (DXY) has extended its correction to near 101.40.
Half of the gains recorded by the USD Index on Thursday after the release of the upbeat United States Gross Domestic Product (GDP) and Durable Goods Orders data were surrendered amid overall optimism in the market. S&P500 settled Thursday’s trading session with significant gains as upbeat GDP data trims recession fears dramatically. Also, upbeat economic data trimmed demand for US government bonds, which led to a recovery in the 10-year US Treasury yields to above 3.50%.
The US GDP for the fourth quarter of CY2022 landed at 2.9% higher than the expectations of 2.6% but lower than the former release of 3.2%. While Durable Goods Orders jumped to 5.6% against the expectations of 2.5% and the prior release of -1.7%. Upbeat forward demand for Durable Goods could accelerate core inflation projections, which could force the Federal Reserve (Fed) to drop the idea of 25 basis points (bps) interest rate hike in February and continue to hike interest rates by 50 bps as announced in December’s monetary policy meeting.
For further guidance, investors will keep an eye on the release of the Fed’s preferred inflation tool. The monthly core Personal Consumption Expenditure (PCE) Price Index (Dec) is expected to escalate to 0.3% from the former release of 0.2%.
On the Pound Sterling front, the United Kingdom office is preparing for a budget to be announced on March 15. Sunak’s Office said "The Prime Minister and Finance Minister Jeremy Hunt emphasized that the rate of inflation is only predicted to fall because of the tough decisions the Government had taken at the autumn statement to stabilize the economy,” reported Reuters.
Here is what you need to know for Friday 27 January:
There was something for both the bulls and bears on Thursday following a slew of data in the US that was generally solid although continues to point to a decelerating growth outlook with slowing inflation, prompting traders to continue to bet on a dovish Federal Reserve when it meets on its interest rate decision next week, February 1.
Gross Domestic Product increased at a faster-than-expected 2.9% annual rate in the fourth quarter of last year as consumers boosted spending on goods, the US Commerce Department said.
Inflation data also gave rise to prospects of dovish Fed with Personal Consumption Expenditures growth slowed to 2.1% year over year from 2.3% in the prior quarter while the GDP price index decelerated to 3.5%. There will be more data on Friday with Core PCE, the Fed's preferred inflation measure whereby prices likely accelerated to a 0.3% MoM pace in December, although analysts at TD Securities argued that a 0.4% gain can't be discarded. The YoY rate likely slowed to 4.5%, they said, suggesting prices continue to moderate but remain sticky at high levels.
The US Dollar index, DXY, rose 0.246% to 102.18 the high from a low of 101.504 while futures are pricing a 94.7% probability of a 25 basis points hike next Wednesday and see the Fed's overnight rate at 4.45% by next December. This is lower than the 5.1% rate Fed officials have projected into next year on market expectations of a rate cut. US Treasury yields also rose with the yield on 10-year Treasury notes rising to 3.52%
GBP/USD which has lost 0.1% in value so far this week in its first weekly decline since the week ending December 23 gave two-way business in the US session. Initially, the bears took out the Lonodon lows but the price rallied in and around the US data after an initial knee-jerk drop. The bears finally took back control from around the highs of the day and the price dropped 50 pips before rallying back into the day. It travelled between 1.2344 and 1.2430. EUR/USD ranged between 1.0850 and 1.0929 in a similar fashion. USD/CAD dropped from 1.3407 and kept falling throughout the day as commodities faired well in a soft US dollar environment, scoring a low of 1.3303. USD/JPY rallied from 129.02 to 130.61 ahead of Japan Consumer Price Index in Asia on Friday. Commodity markets continued to be driven by optimism over the return of Chinese demand and a persistently weaker US Dollar. Oil retained its firmer tone, with WTI up 1.1% to $81.2/bbl. Gold fell 0.8% to $1,930.8/oz. Bitcoin was stable ahead of the US data near $23,200 following yesterday’s volatility, dropping a few hundred US Dollars after the numbers came out before reversing back above $23,000.
Reuters reported that British finance minister Jeremy Hunt said it will be necessary to maintain the disciplined approach of his November budget to help reduce inflation, Prime Minister Rishi Sunak's office said following a Cabinet meeting on Thursday.
The article states that Hunt announced a string of tax increases and tighter public spending in a budget plan in November. He is due to present a budget on March 15.
"The Prime Minister and (Hunt) emphasised that the rate of inflation is only predicted to fall because of the tough decisions the Government had taken at the autumn statement to stabilise the economy," Sunak's office said.
GBP/USD update
It has been a volatile day on Wall Street and offered two-way business:
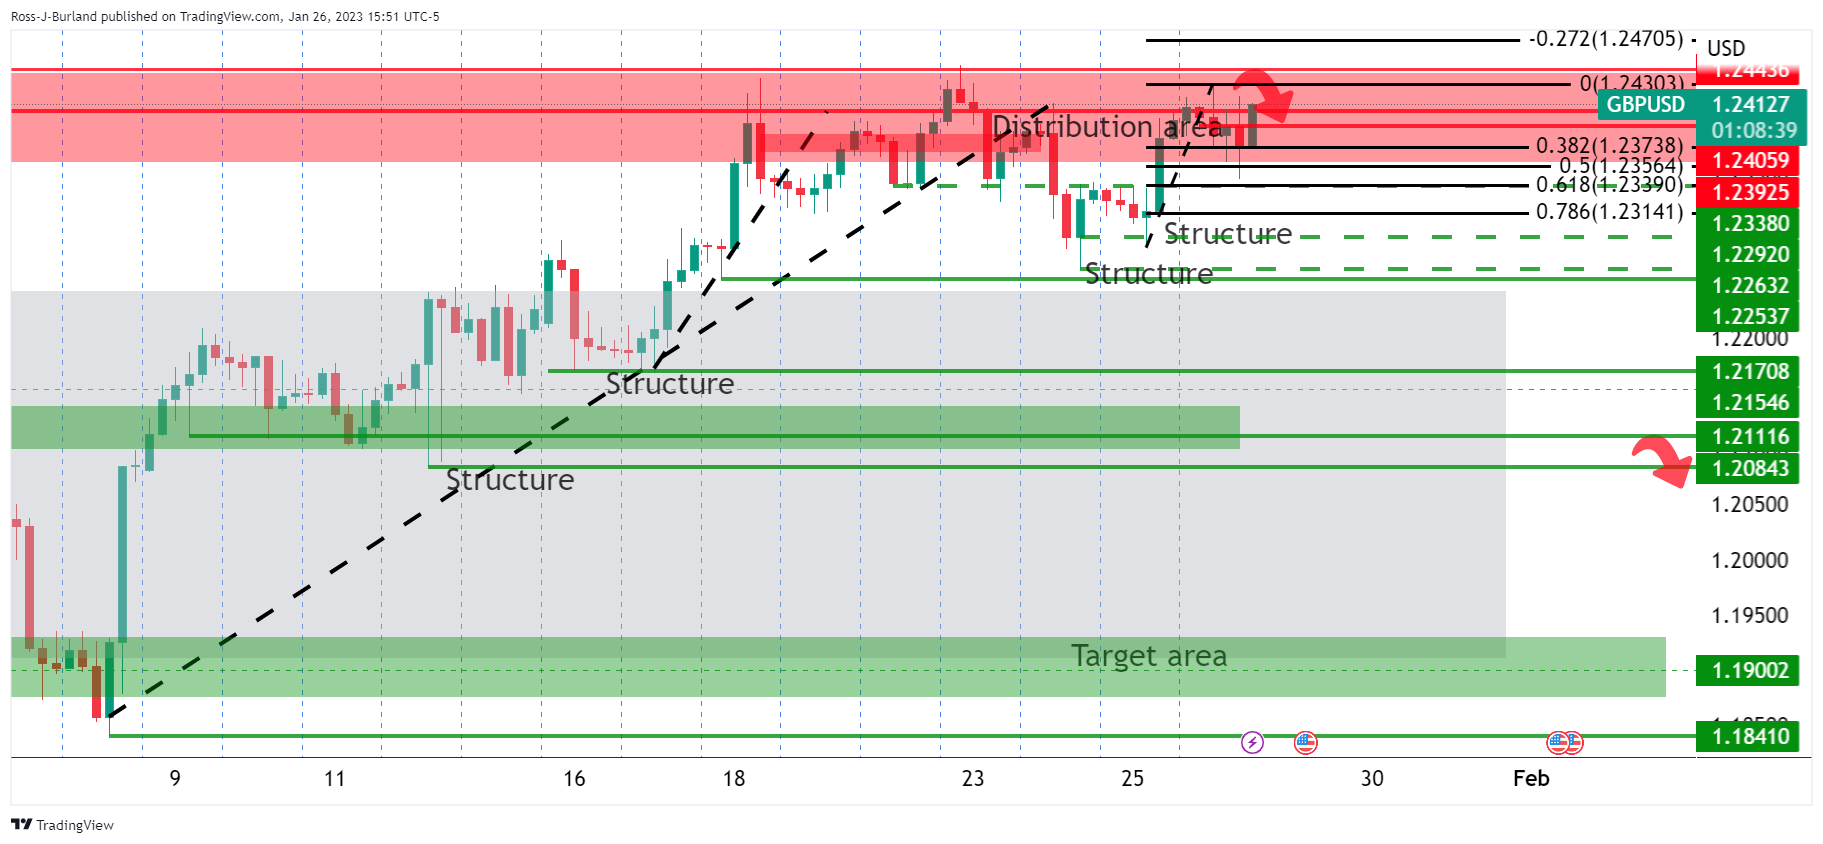
The day started out with the London session breaking structure to the downside while the price went on to rally into the locked-in highs in the New York session in and around the red news on the calendar before the inevitable blow-off into in-the-money longs from earlier in the week.
The price has now completed the move into the 4-hour W-formation's neckline and is moving higher towards a bullish extension, potentially on the hunt for more liquidity before another attempt at the downside as per the daily chart:
1.2450 is eyed as equal highs that could be swept before bears engage again.
- AUD/USD continues to gain ground, advancing 0.17% on Thursday.
- Upbeat US data, with GDP exceeding estimates and unemployment claims edging lower, justify further tightening by the Federal Reserve.
- AUD/USD Price Analysis: it might pull back before resuming its uptrend, eyeing 0.7200.
The Australian Dollar (AUD) is still gaining some ground against the US Dollar on Thursday but retreats after hitting a new 7-month high at 0.7142. Some of the earlier AUD/USD gains were erased on upbeat economic data from the United States (US). Therefore, the AUD/USD is trading at 0.7109, slightly above the opening price.
AUD/USD retreated as US data boosted the US Dollar
US economic data, particularly growth, has been the main driver of Thursday’s session, surpassing expectations of 2.6% QoQ, as the Gross Domestic Product (GDP) rose 2.9% in Q4, as the Department of Commerce reported. That, alongside Q3’s expanding 3.2%, bolstered the US Dollar (USD), which has been treading water on the week. For 2022, the economy grew by 2.1%, lower than in 2021, 5.9% YoY.
In other data also revealed by the US Commerce Department, Durable Good Orders for December grew 5.6% MoM, recovering from November’s -2.1% contraction. However, the report was mixed as core Durable Goods dropped -0.2% MoM. Higher interest rates, attributed to the US Federal Reserve (Fed) lifting rates by 425 bps since March 0f 2022, are weighing on demand for goods, usually bought on credit.
Elsewhere, the jobs market continues to show resilience, as the US Department of Labor reported that Initial Jobless Claims for the week ending January 21 fell to 186K, below estimates of 205K.
Given the backdrop, the AUD/USD retreated once headlines crossed newswires after hitting a daily high and failed to hold to the R1 daily pivot point at 0.7139. So the AUD/USD pair lost traction and dived, but the daily pivot point capped its fall at 0.7085. In the meantime, the US Dollar Index (DXY), which tracks the greenback’s value against a basket of six peers, is erasing Wednesday’s losses and rising 0.19%, up at 101.829, a headwind for the AUD/USD.
On the Australian side, a hotter-than-expected inflation report for December keeps investors assessing the next move for the Reserve Bank of Australia (RBA). Sources cited by Reuters said, “Today’s report should quickly eradicate hopes of an RBA pause in February.” Therefore the Australian Dollar (AUD ) might continue to hold its ground as higher interest rates are coming, while China’s reopening will augment commodities demand.
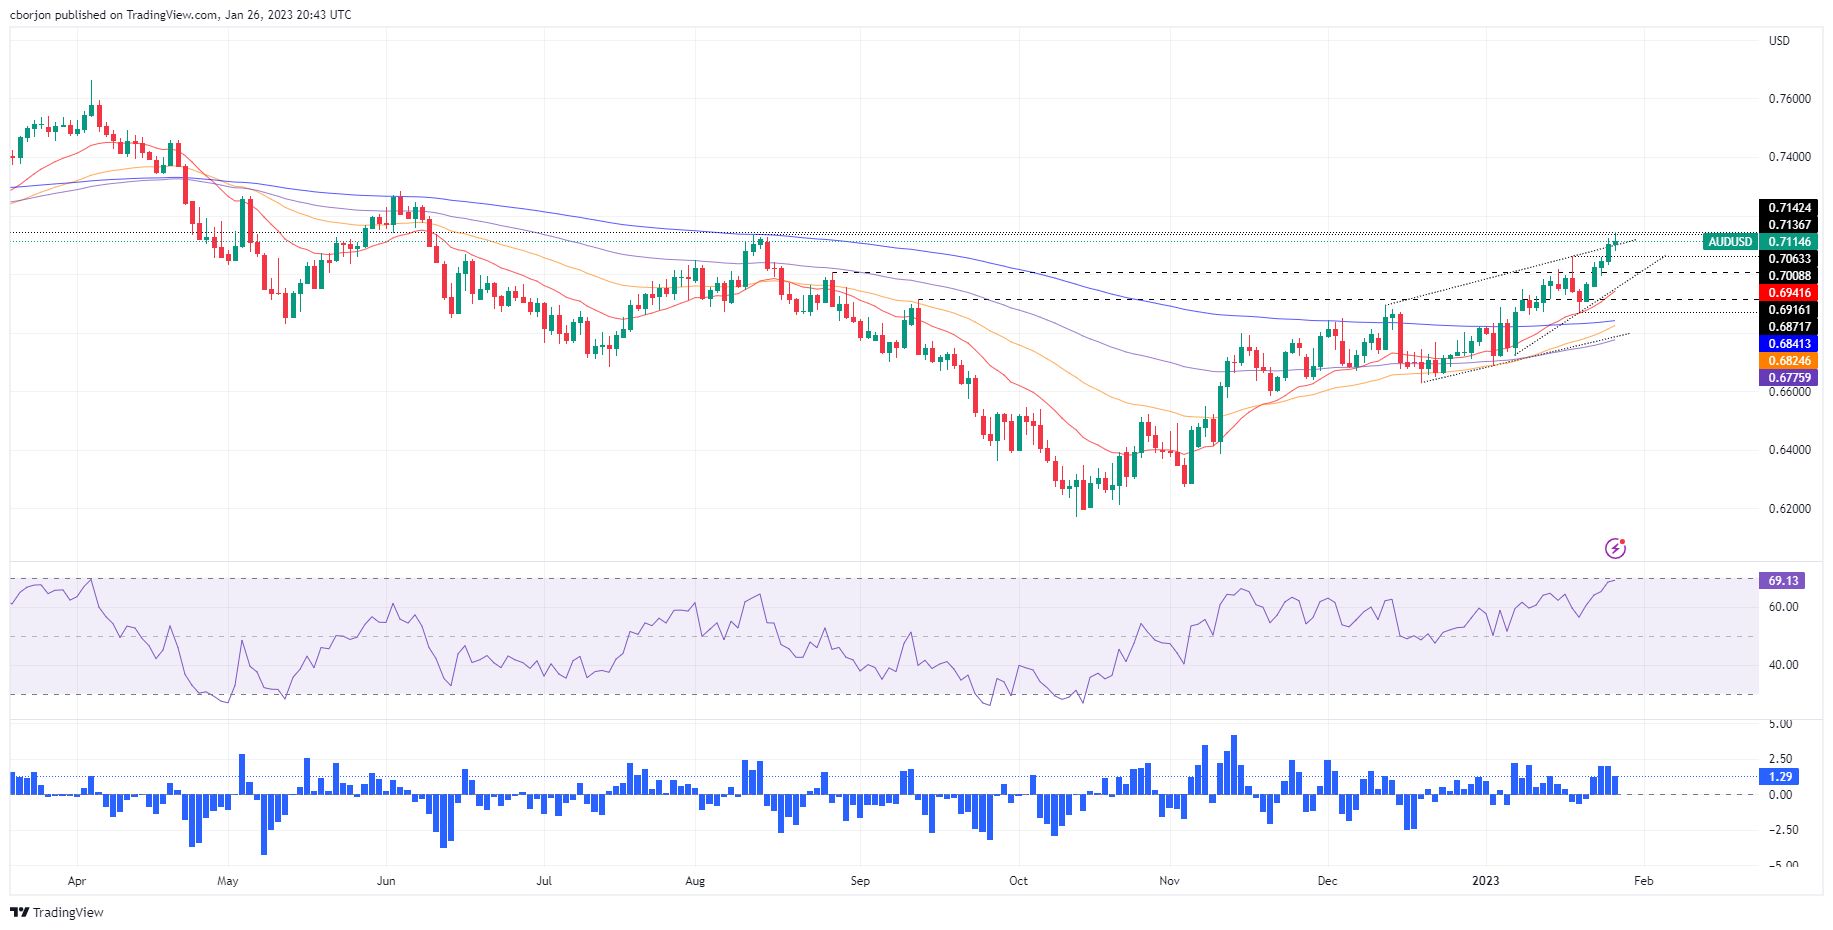
AUD/USD Technical Analysis
Therefore, the AUD/USD might continue its uptrend, albeit trimming some of its gains. Achieving a daily close above 0.7100 exacerbated an upward move towards a fresh 7-month high, keeping bulls hopeful of testing the 0.7200 mark. However, on its way north, the AUD/USD needs to clear 0.7142, followed by 0.7150, and then the 0.7200 psychological figure.
- EUR/USD hourly chart is seeing the price wedged into the coil along the trendline support.
- The trendline will be vulnerable if the US data on Friday rhymes with Thursday's, exposing the 1.08 the figure to the downside.
EUR/USD is running higher in the latter part of the US session following a blow-off to the downside on the back of some generally solid US data on Thursday. The US Dollar has benefitted and has been teasing in markets today, testing key trendline resistance in the 102s:
The pull back into the neckline of the W-formation is giving rise to a bid in the euro:
EUR/USD daily charts
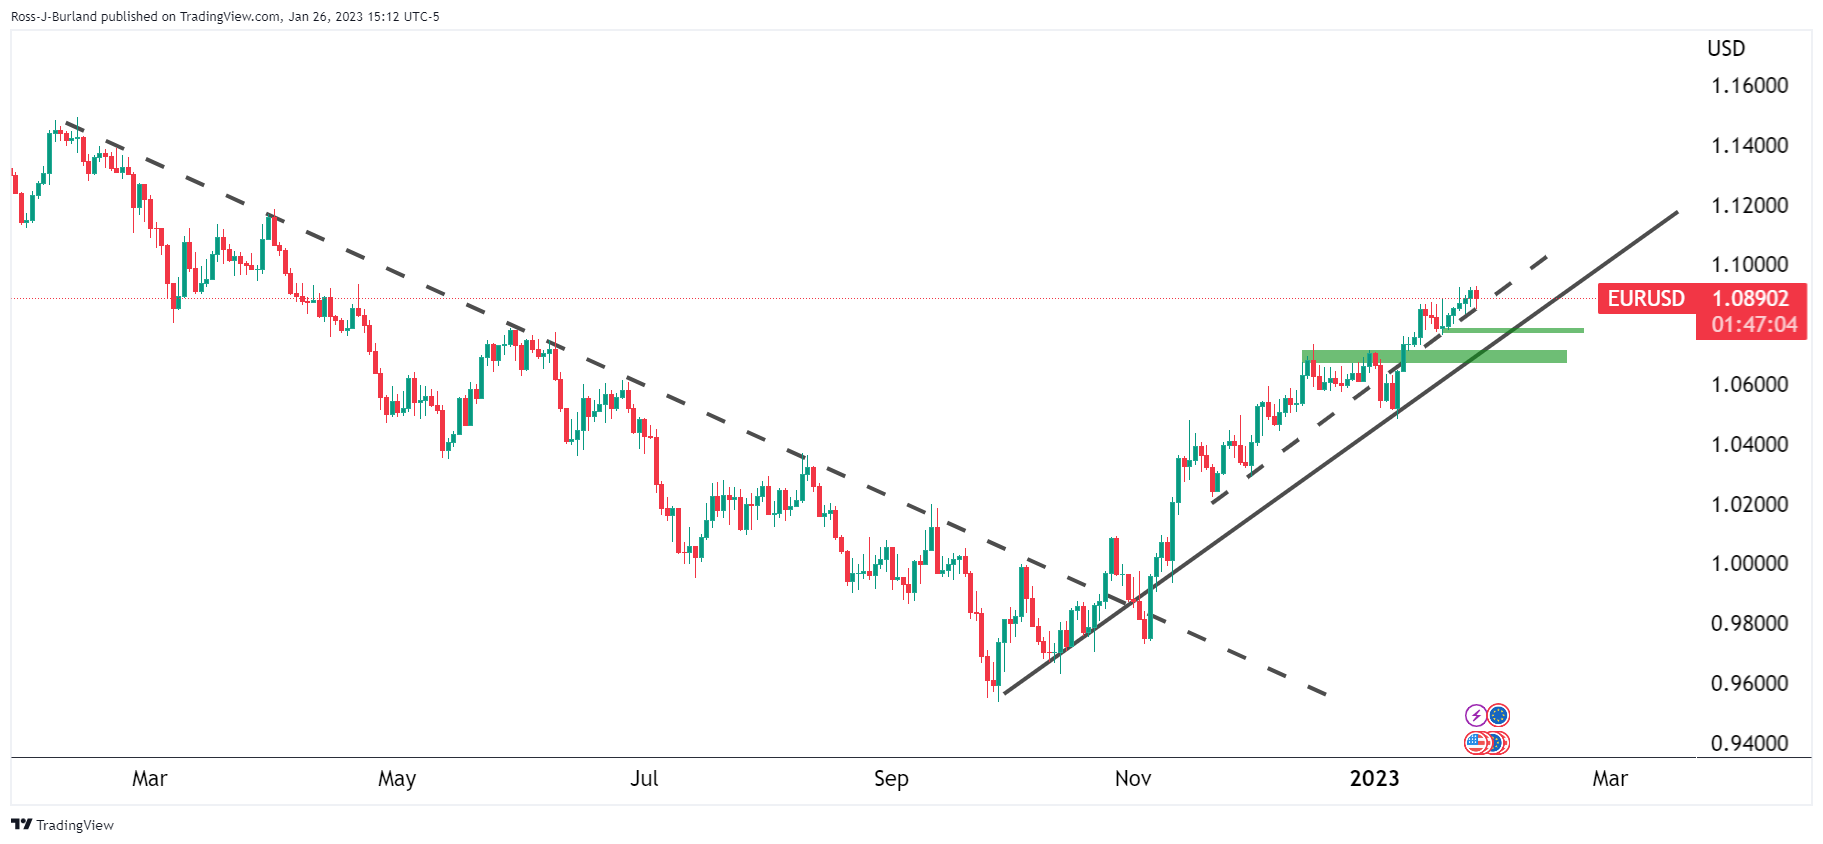
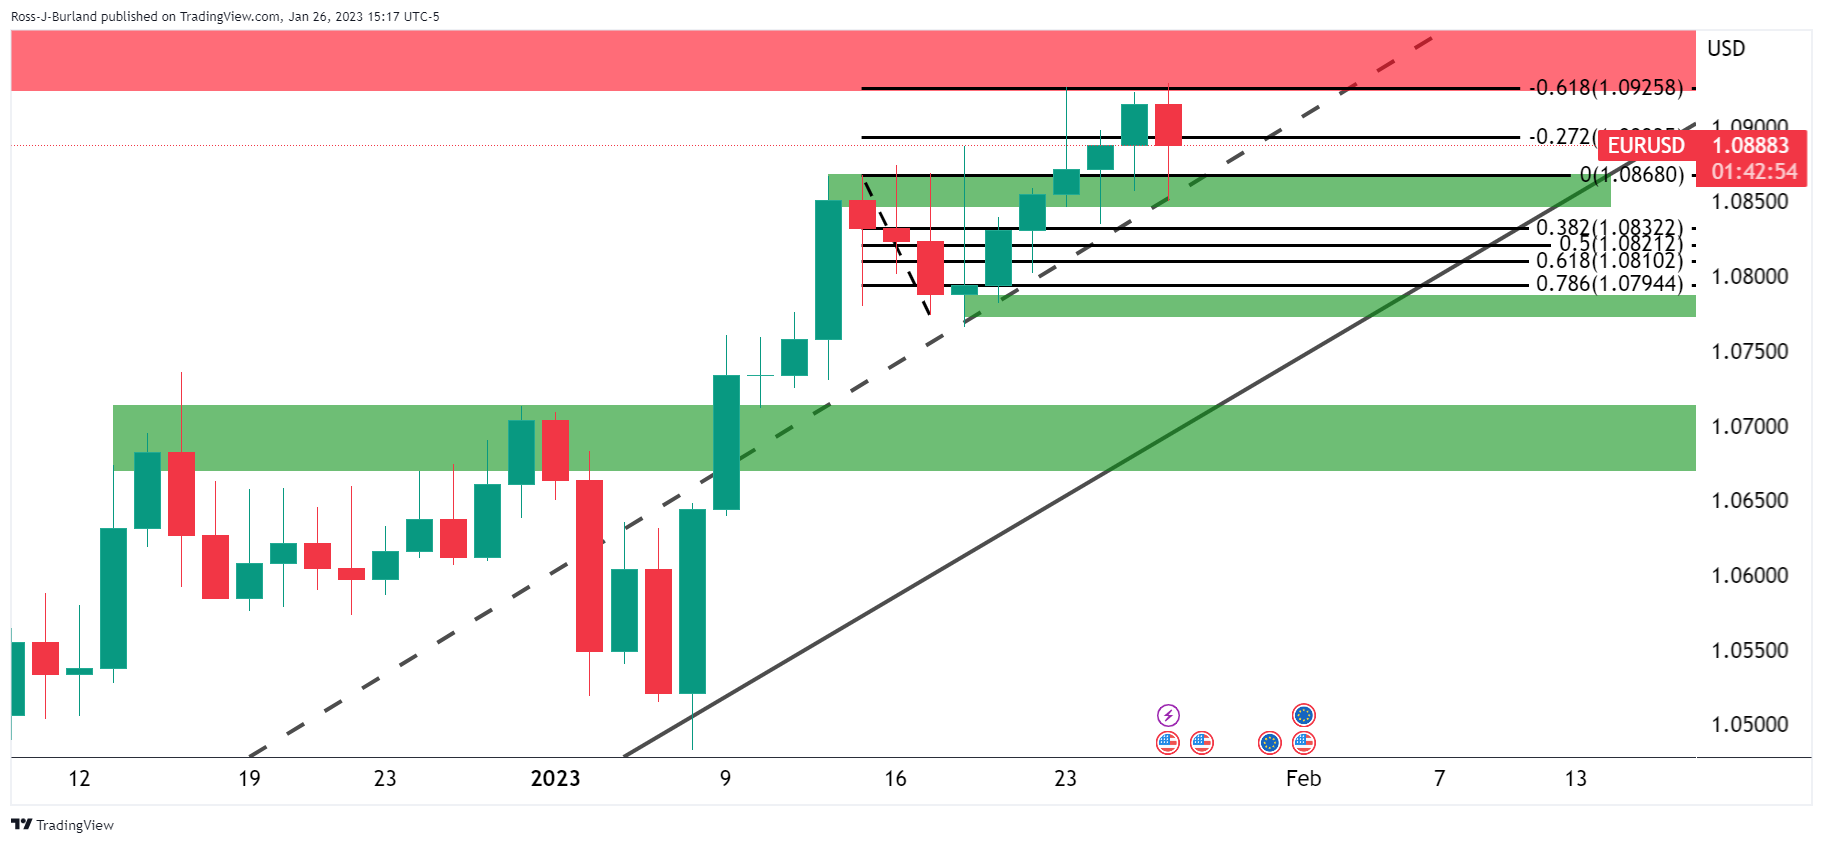
EUR/USD H4 chart
On the 4-hour chart, we have the bulls targeting the 1.0920s and equal highs, moving in hard to the M-formation's neckline. Nevertheless, we are up high on the charts and the price is coiling, which means a breakout could be imminent. With that being said, this could be could before the Federal Reserve but we are guaranteed some price action over the red news on Friday on the US calendar:
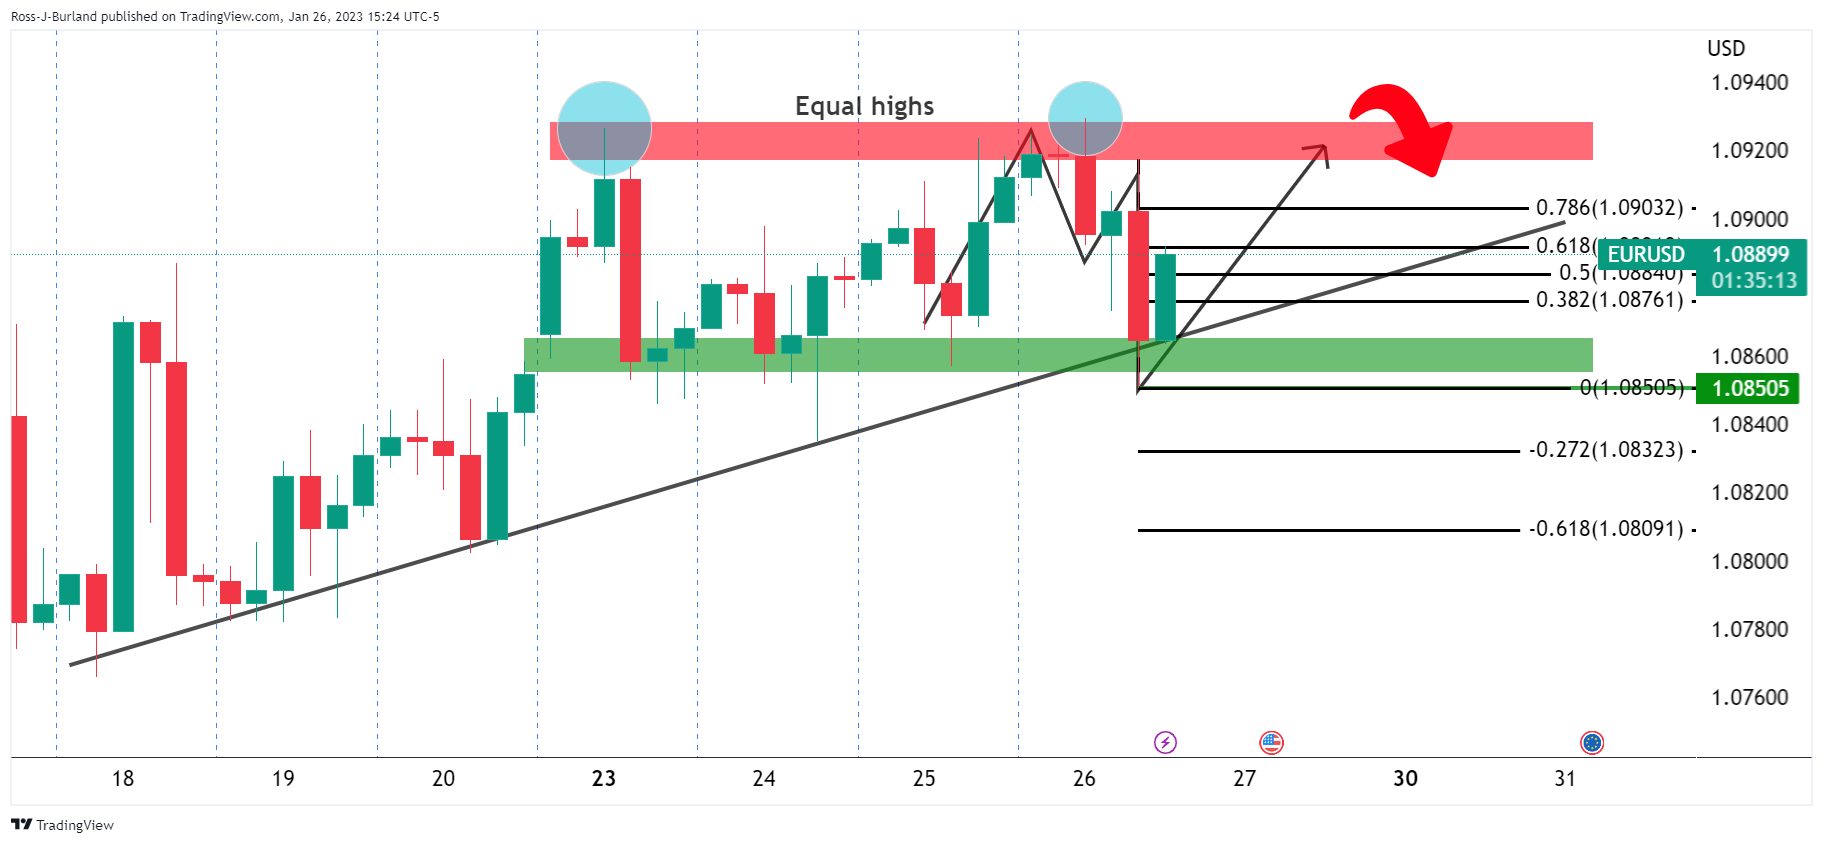
EUR/USD H1 chart
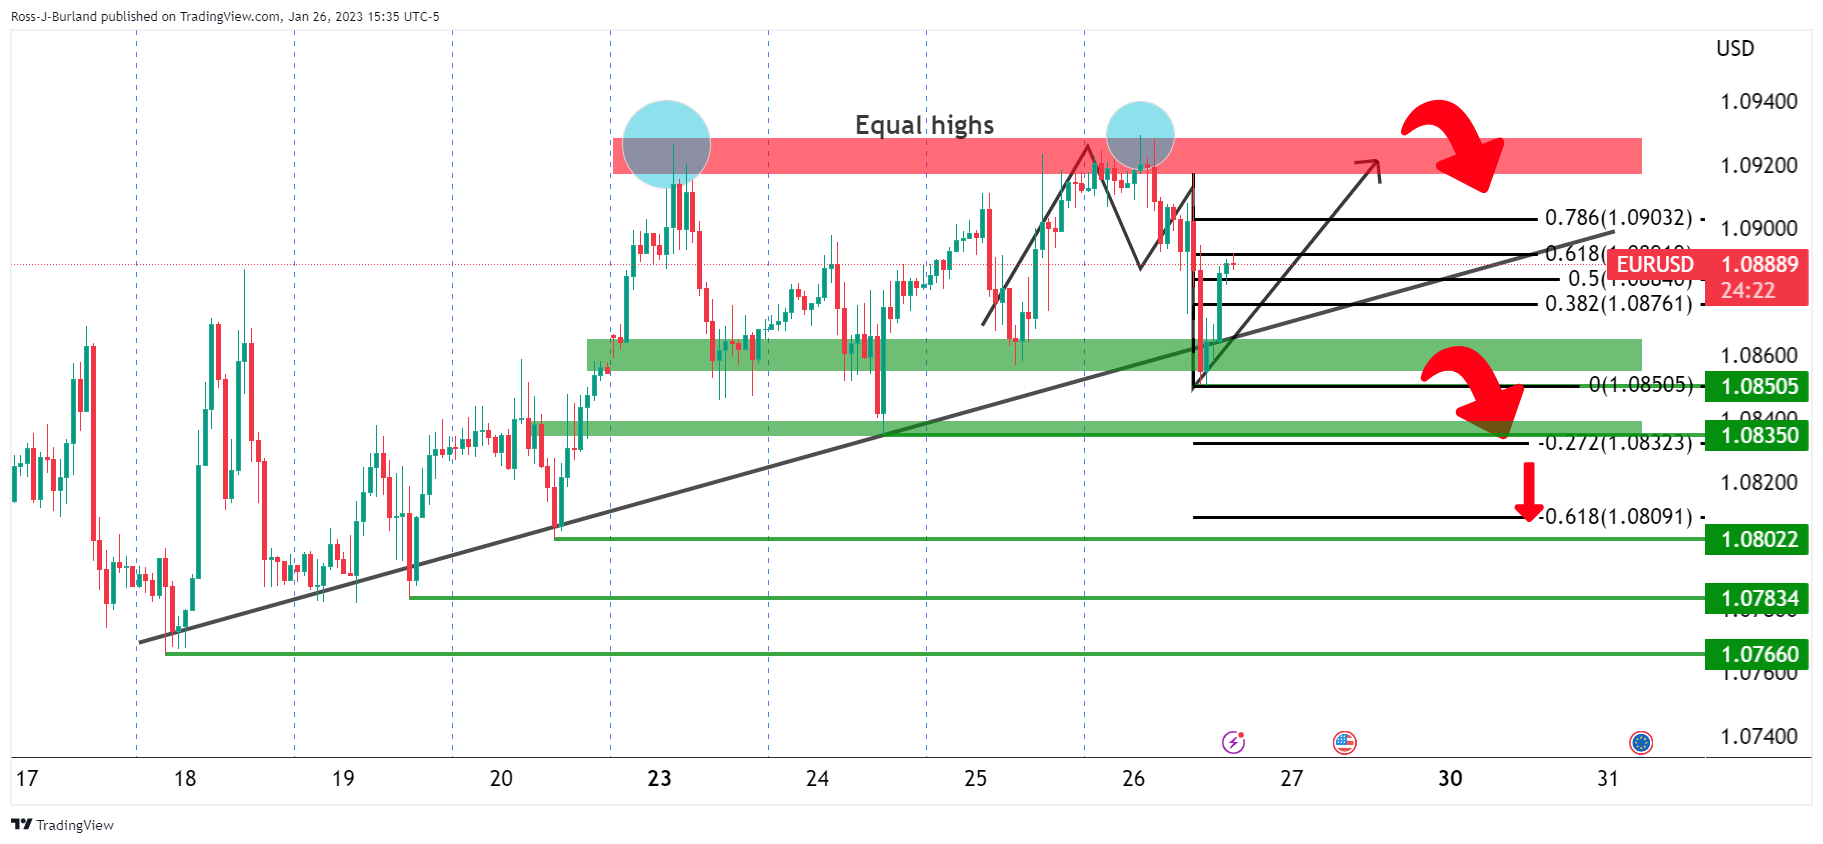
The hourly chart is seeing the price wedged into the coil along the trendline support that will be vulnerable if the data on Friday rhymes with Thursday's, exposing the 1.08 the figure to the downside.
- CAD/JPY bulls are moving in but there are downside prospects.
- The day ahead has red news in both Asian and the US.
CAD/JPY is on the watchlist for the rest of the week as the price moves out of an important trendline on both the longer-term and shorter-term charts. The following outlines the scenarios for the rest of the week and next:
CAD/JPY daily chart
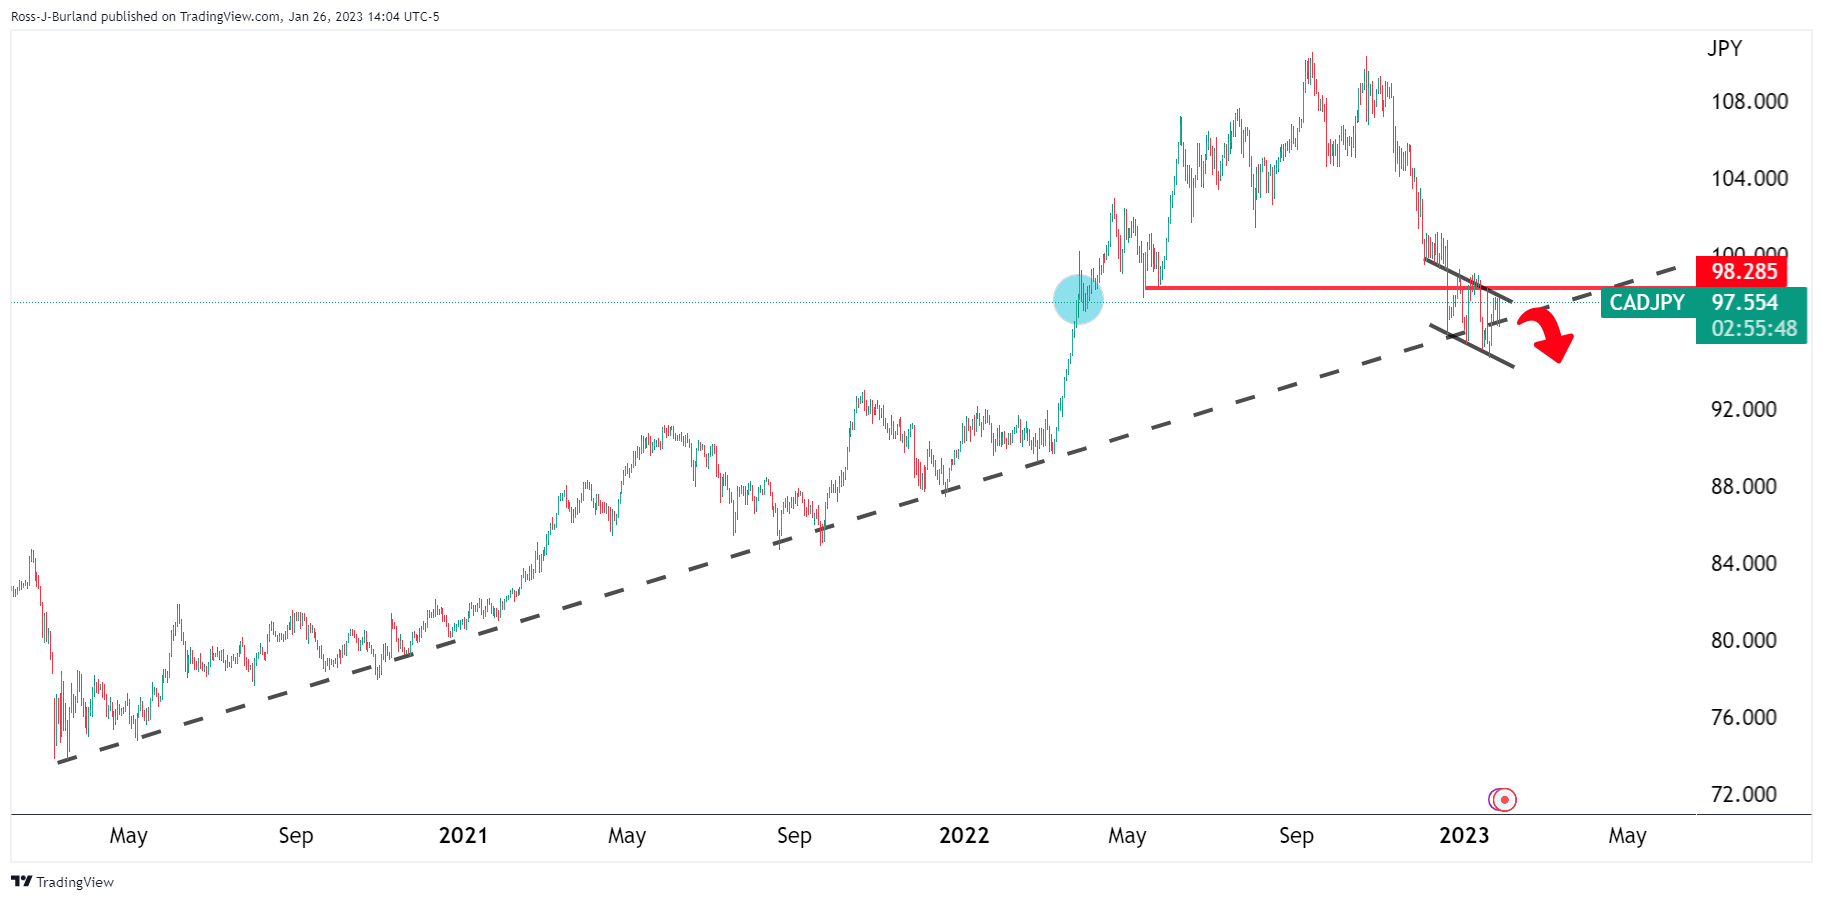
Bears are on the prowl on the break of stricture and the price is coiled below it as illustrated above. A breakout could be imminent:
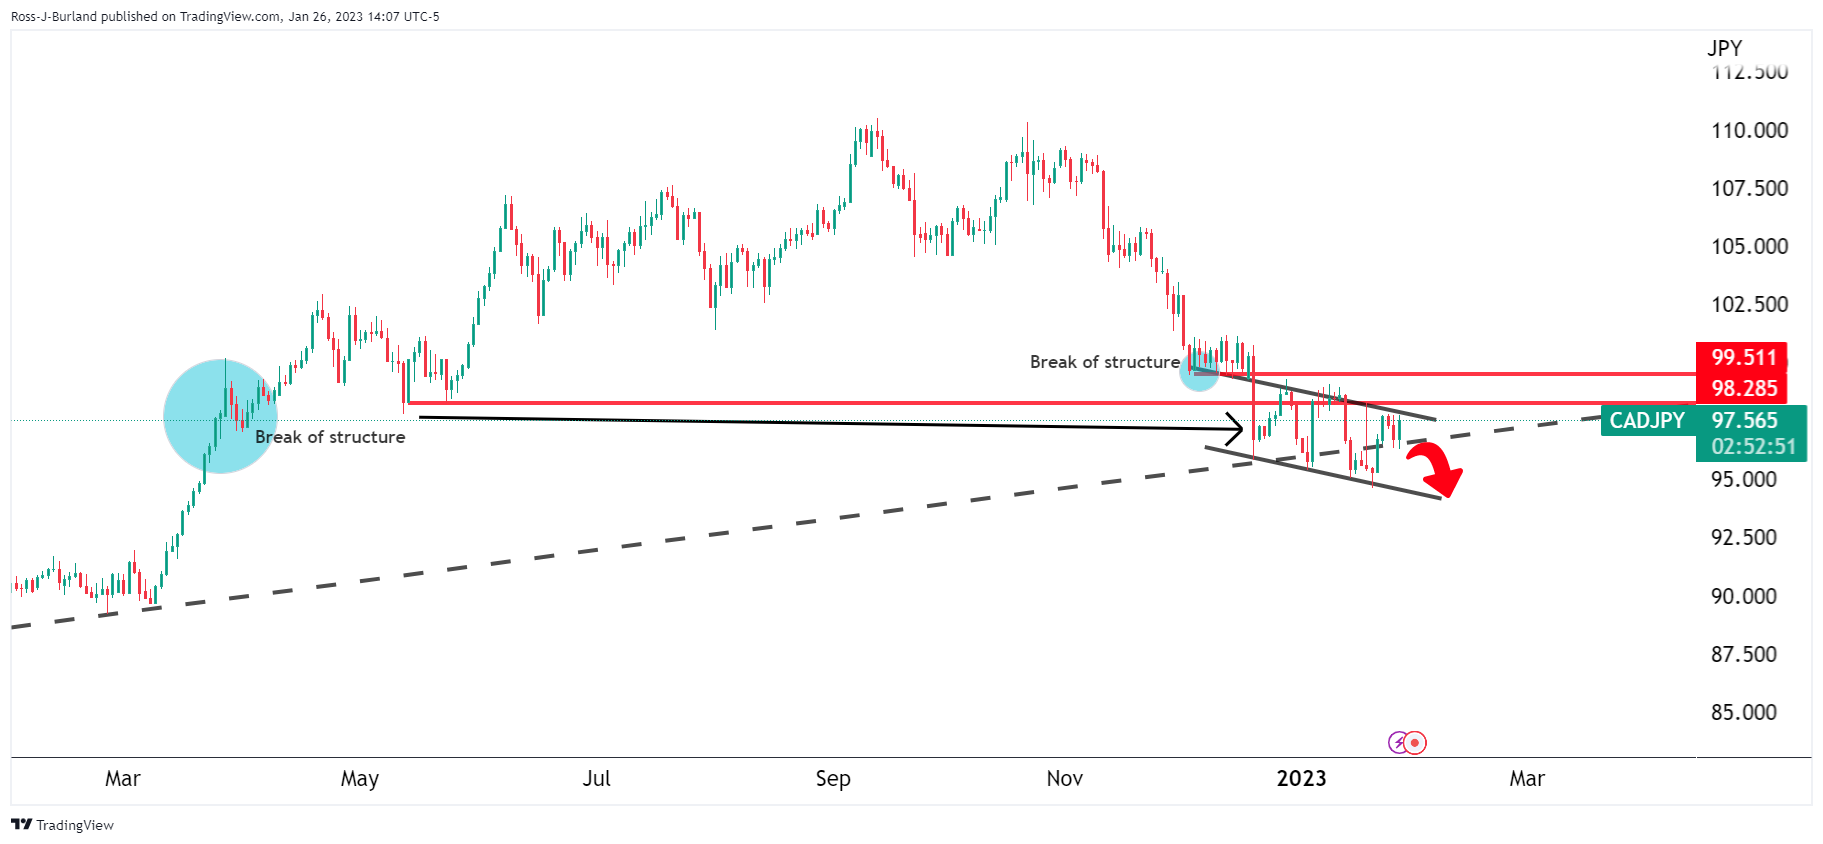
The price has been chipping away at the now-broken trendline. The downside target at the extreme is located near 91.70 while the upside targets are the 99.70s and 101.10s:
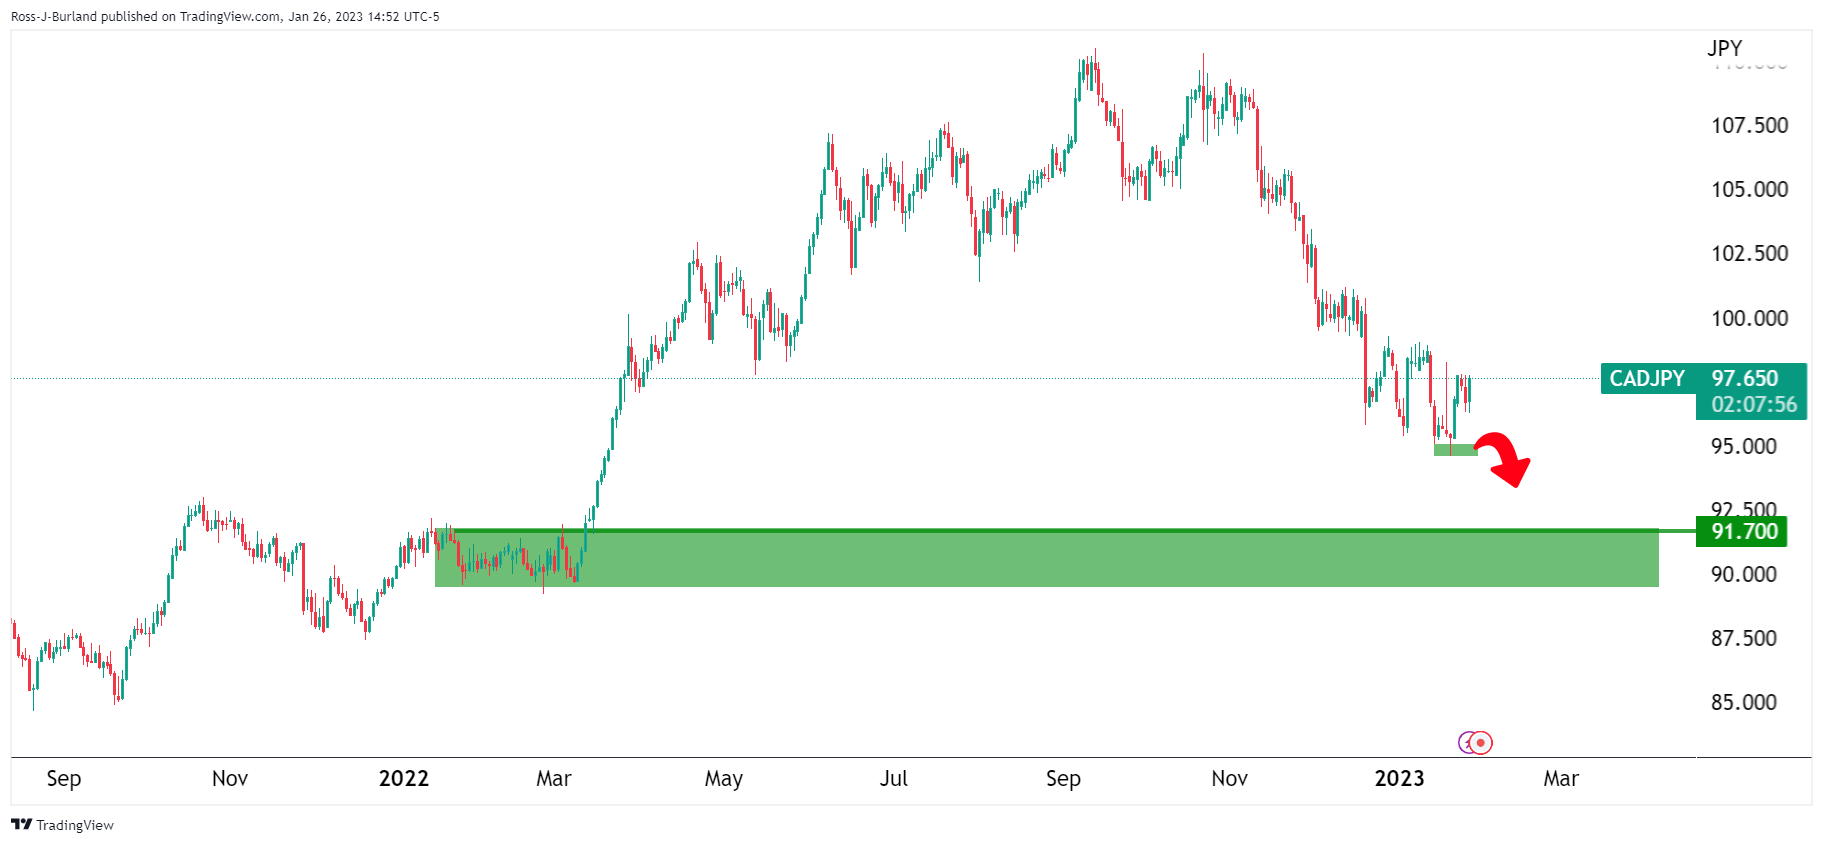
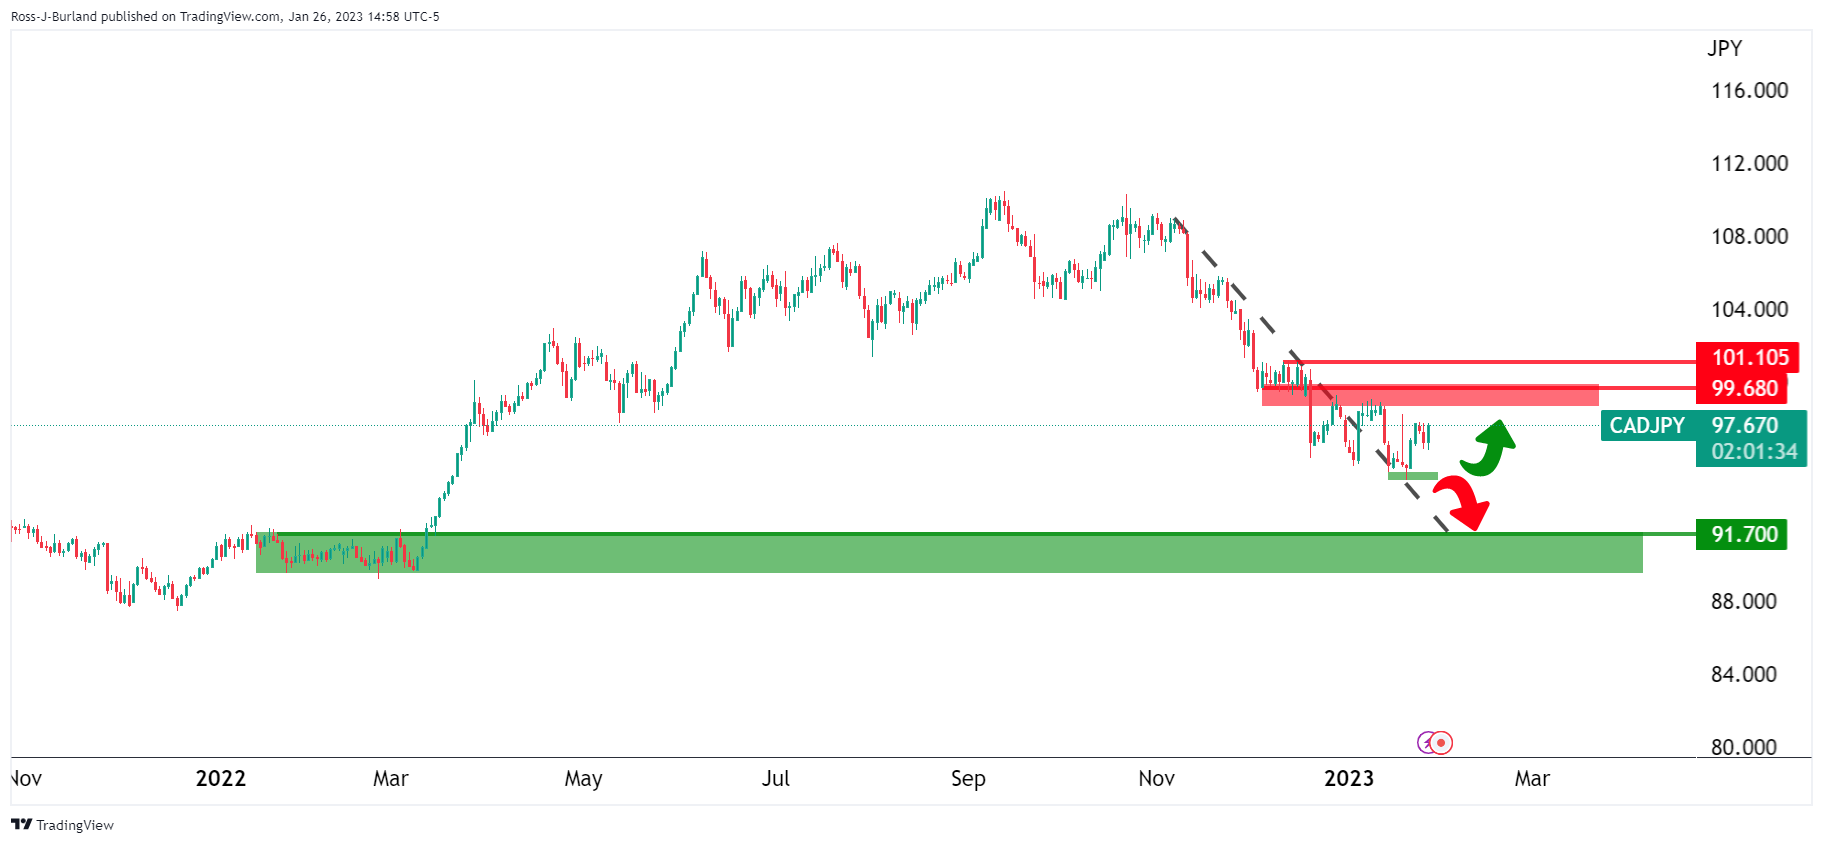
Meanwhile, the channel is compelling and the downside is favourable for the nearer term despite being on the backside of the recent bearish trend:
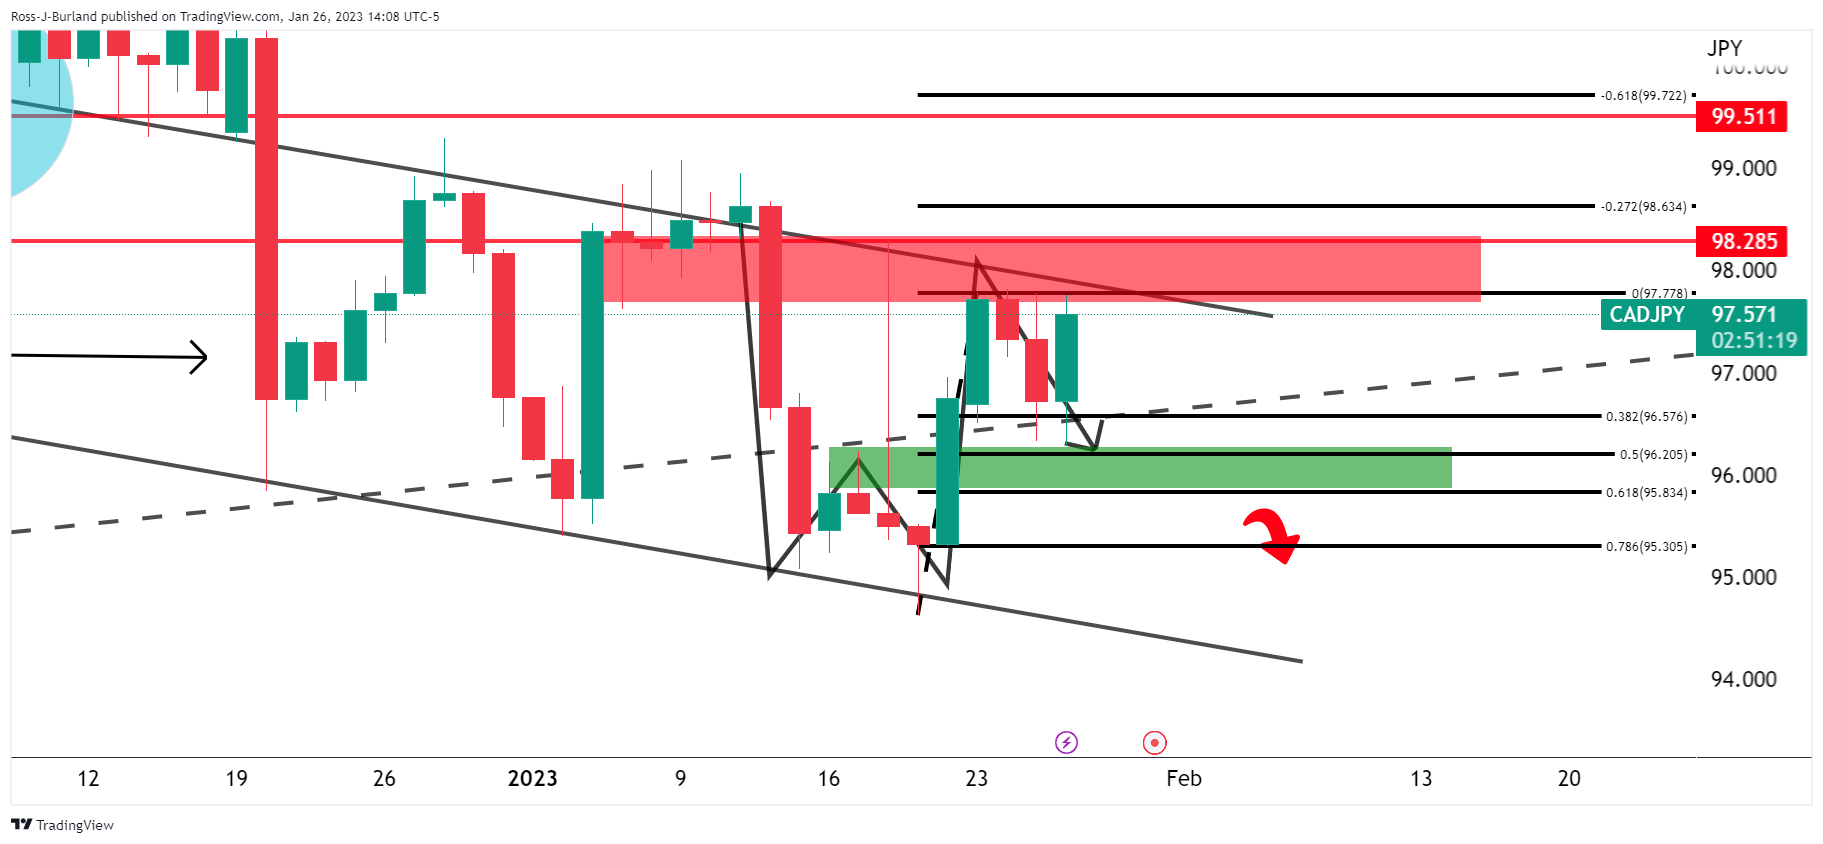
The Daily W-formation sees support near 96.00 within the descending channel for a downside target that guards prospects of a move lower towards the bottom of the channel.
CAD/JPY H1 and H4 charts
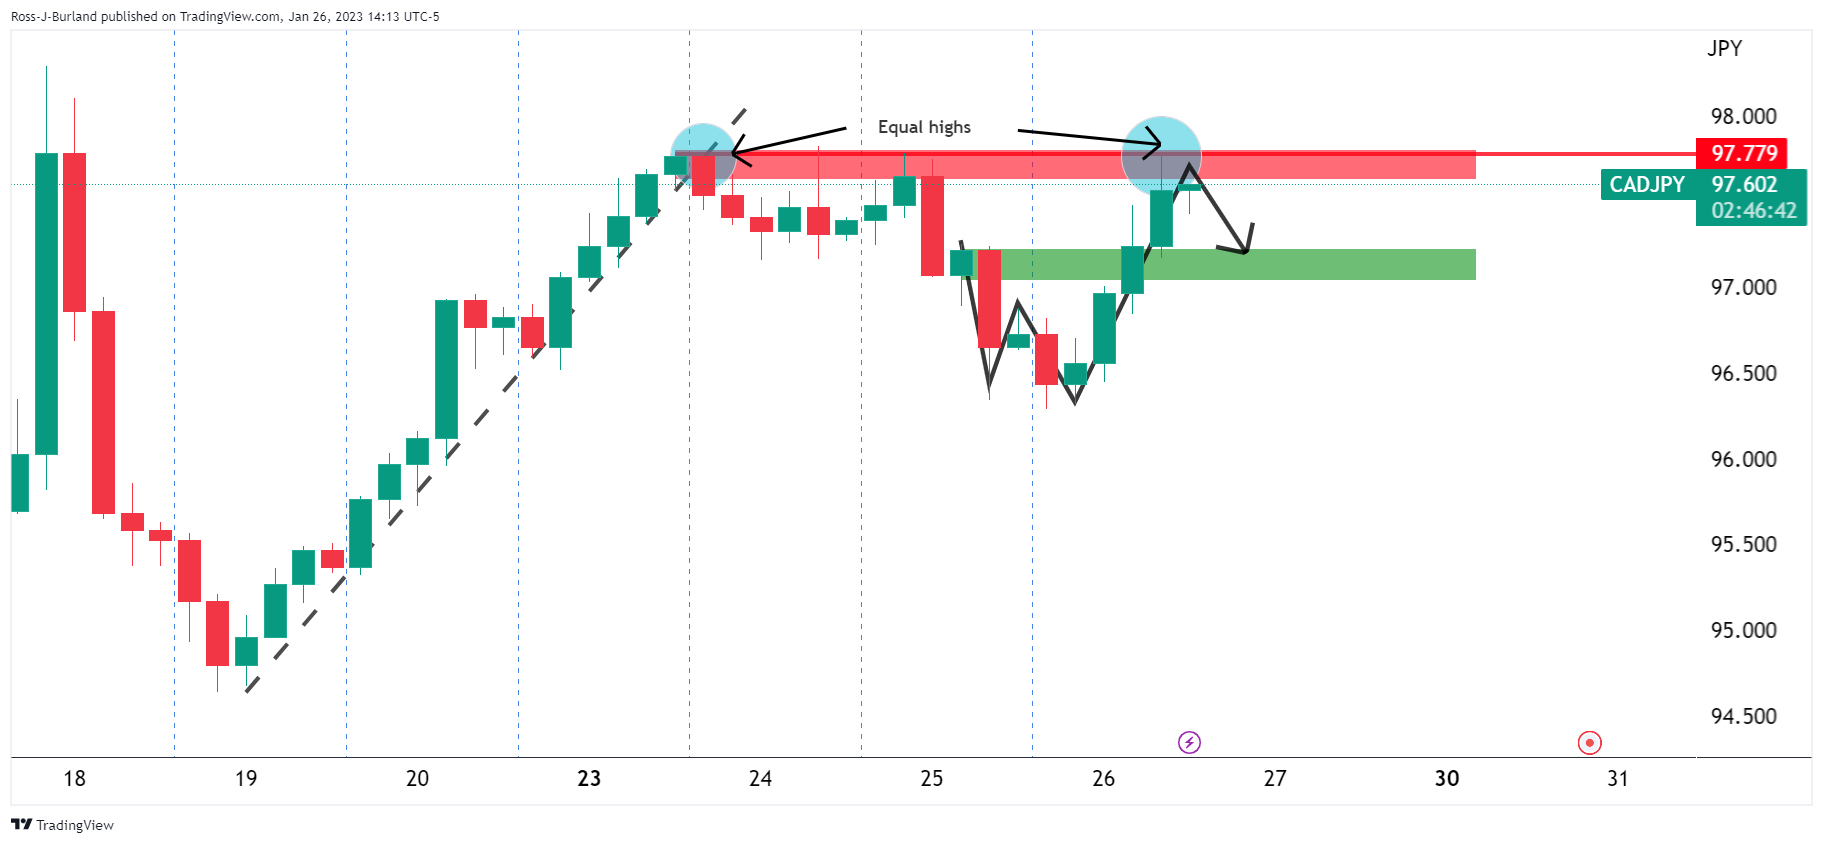
The 4-hour chart is forming a W-formation which is a reversion pattern. However, we have equal highs for which the price could penetrate prior to a bearish 4-hour close. Nonetheless, the downside bias is favoured into the low 97's.
Looking at the hourly chart, the following outlines a potential schematic for the rest of the week as we head into the US red news calendar event on Friday morning:
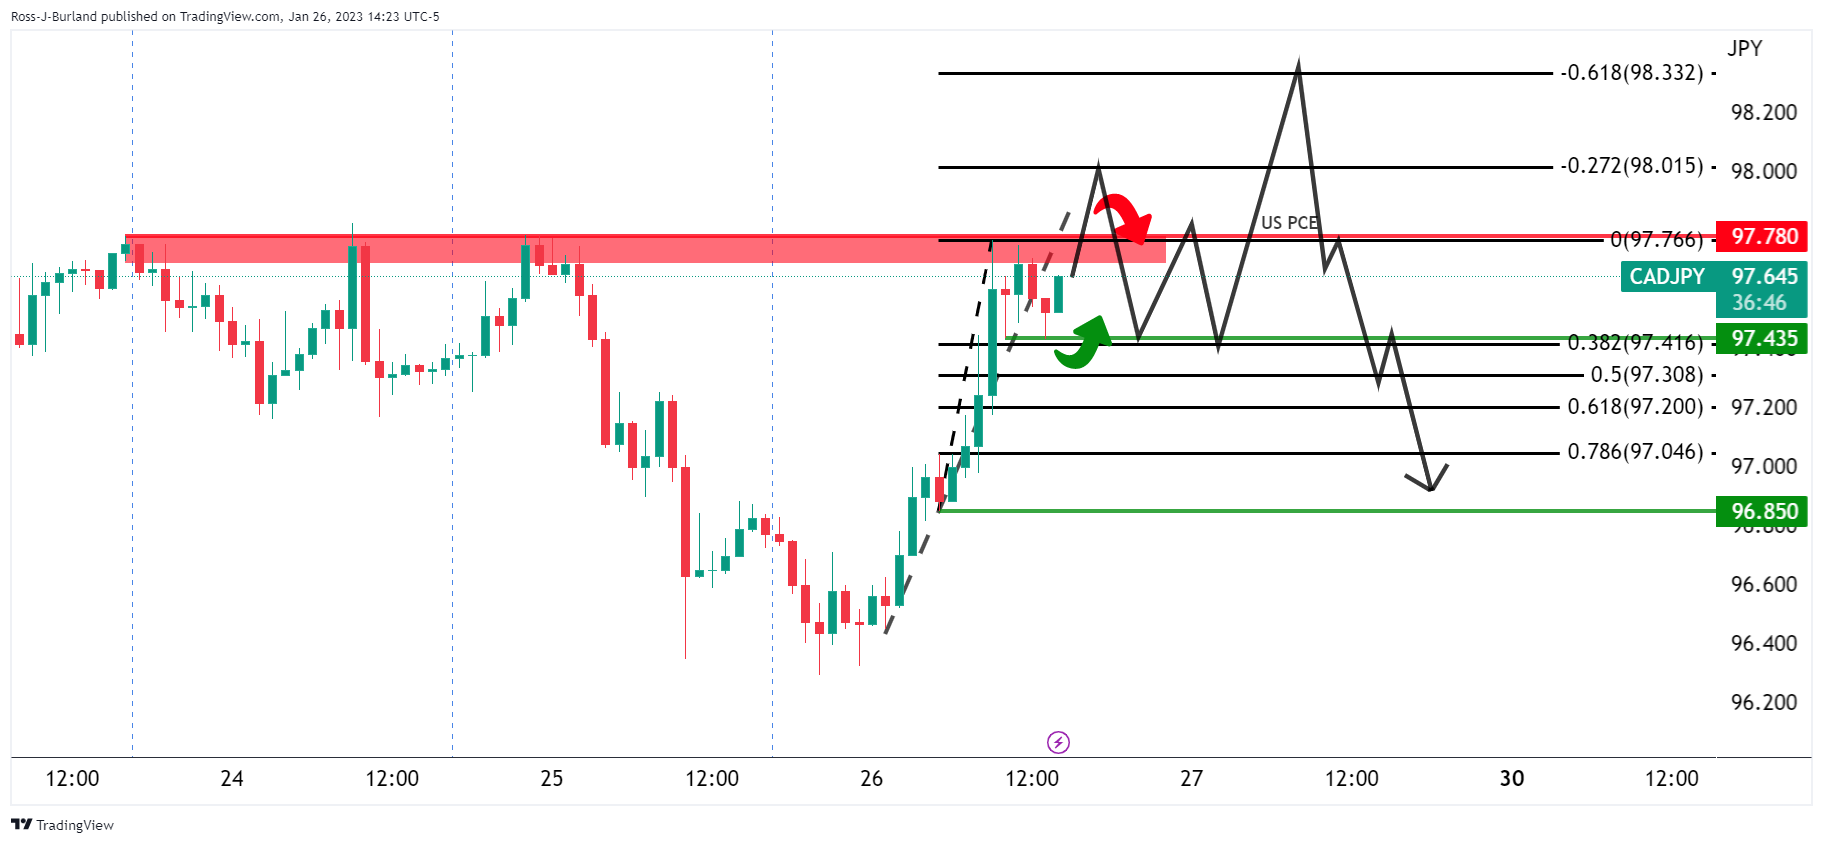
The thesis is that while the outlook is bearish, the price discovery will be a theme between now and the data on Friday which also includes Japan's Consumer Price Index. The pump up from the low 96's may still be in process and the Asian session will lay out the foundations for the London and US session to base from.
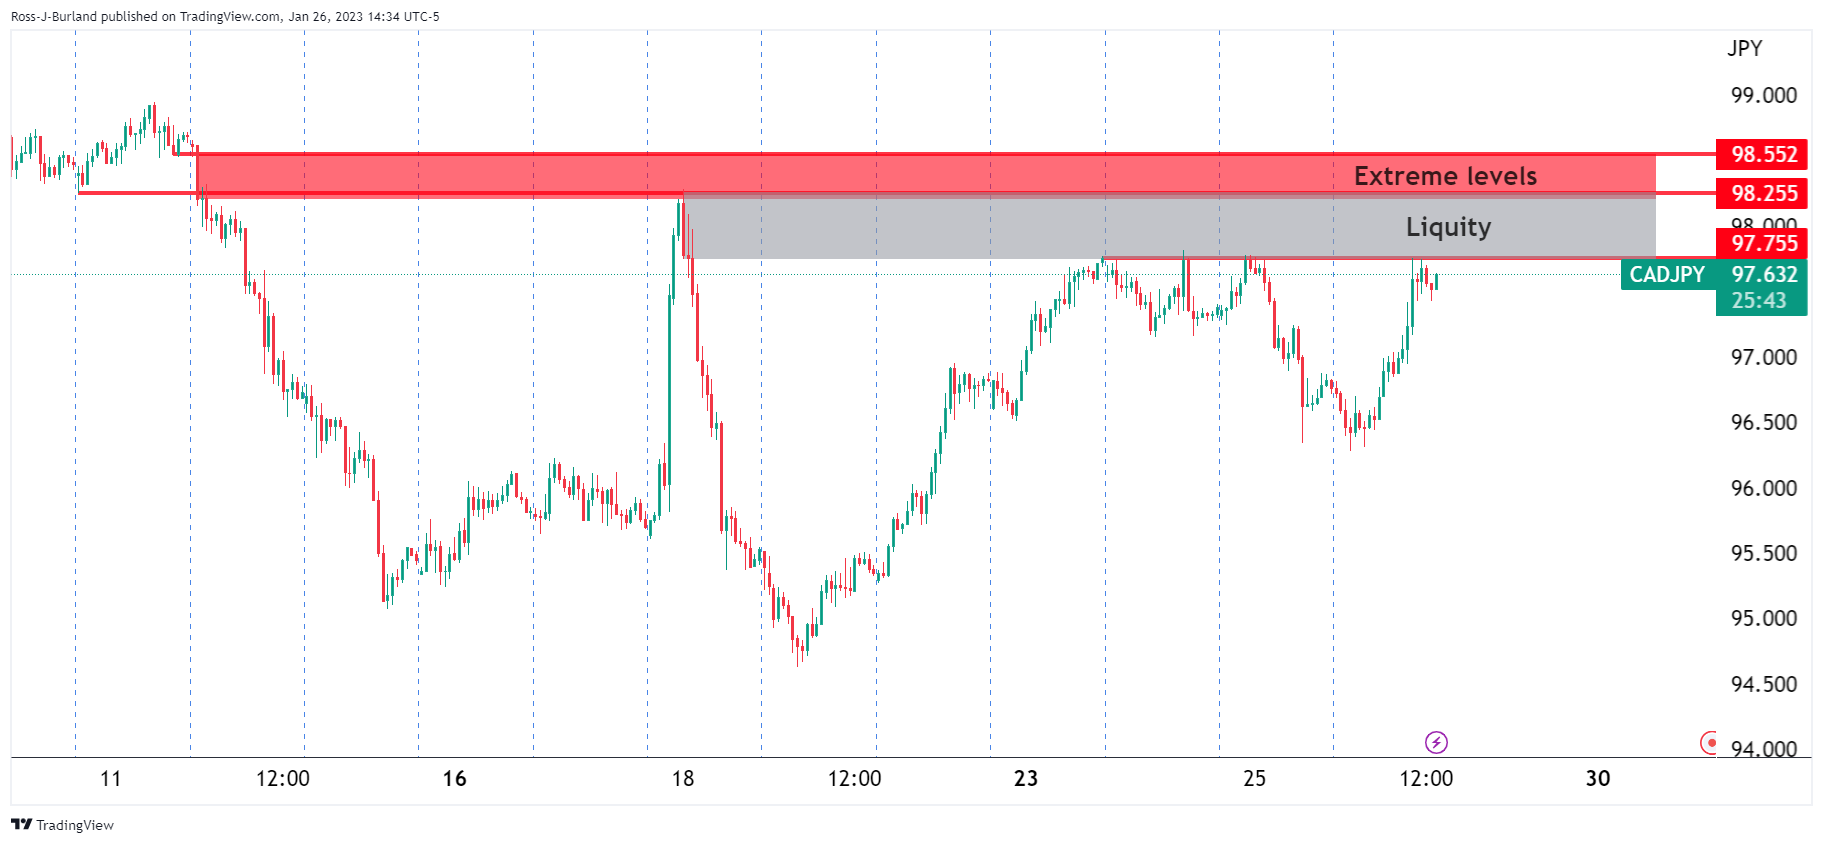
In terms of liquidity, the following illustrates where stops are likely placed:
- USD/CHF remains downward biased, albeit registering gains of 0.26% on Thursday.
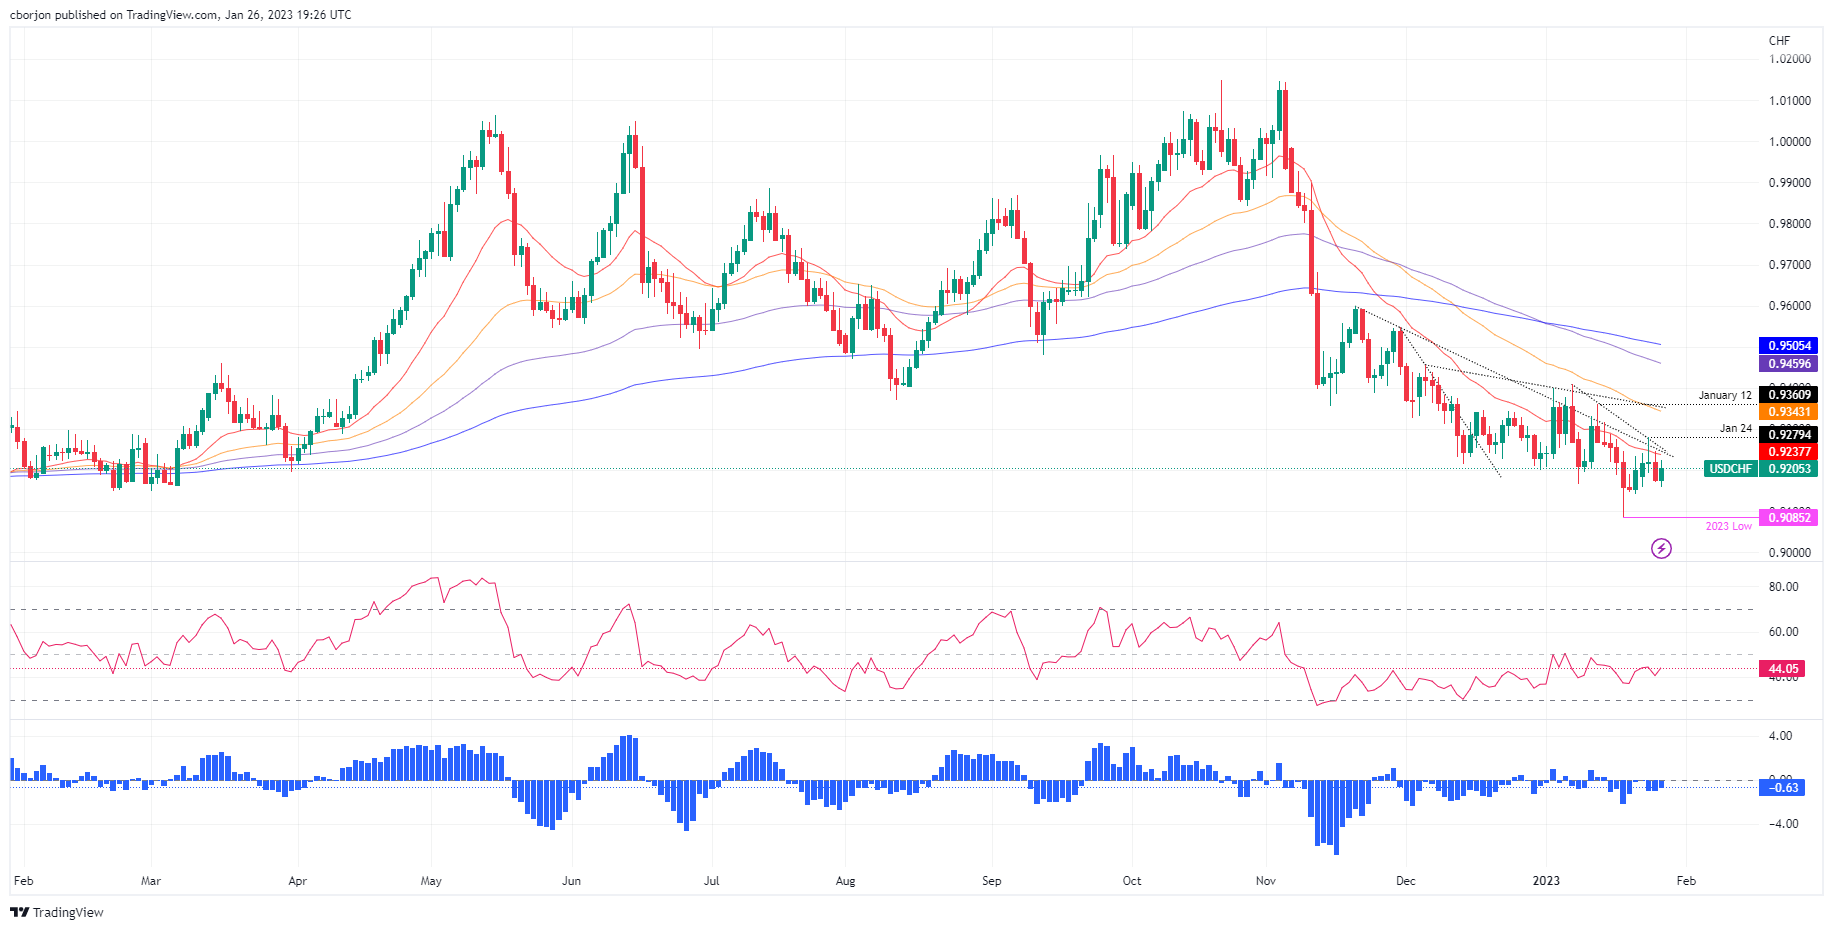
- The USD/CHF pair’s failure to crack the 20-day EMA would keep exposing the pair to sellers.
- USD/CHF Price Analysis: The downtrend is still intact, but the major appears to be bottoming.
USD/CHF trims some of its Wednesday losses but is falling short of testing the 20-day Exponential Moving AVergae (EMA) at 0.9237, leaving the USD/CHF pair adrift to selling pressure. After hitting a daily high of 0.9225, it has retreated to its current spot price. At the time of writing, the USD/CHF is trading at 0.9200.
USD/CHF Price Analysis: Technical outlook
Even though the USD/CHF pair is registering a green day, the pair’s bias remains bearish. As long as buyers reclaim the January 24 daily high of 0.9360, then the USD/CHF might shift to neutral-downwards and would have a shot of testing the 50-day EMA 0.9343, ahead of the January 12 high of 0.9360. The next resistance would be the psychological 0.9400 level.
Given the backdrop, oscillators had failed to support the bullish thesis and remained in negative territory. Except for the Relative Strength Index (RSI), which sits at bearish territory but approaches the 50 mid-line. Once the RSI turns bullish, that could bolster the prospects for higher USD/CHF exchange rates.
As an alternate scenario, the USD/CHF first support would be the 0.9200 mark. Once cleared, the next demand zone to be tested would be today’s low of 0.9158. A breach of the latter and the USD/CHF could dive toward the YTD low of 0.9085.
USD/CHF Key Technical Levels
- Gold price is now looking over the abyss with a break of $1,900 eyed.
- The Gold price bears moved in on the strong United States of America data on Thursday.
- The Federal Reserve sentiment is now mixed, supporting the US dollar and US Treasury yields higher.
Gold price dropped to a low of $1,918.69 on Thursday due to a stronger US Dollar on generally solid United States of America economic data on the day that may prompt the Federal Reserve, Fed, to keep interest rates higher for longer. The market was wrong-footed in anticipation of ongoing disinflationary numbers and this has led to a move up to a critical technical level in the US Dollar in the set-up for the next bout of important data from the US economy.
The rally in the US Dollar comes after the United States of America reported its fourth-quarter Gross Domestic Product as rising by 2.9%, more than the consensus estimate for a 2.8% rise. Initial jobless claims also fell more than expected, signalling a tight labour market. The combined data has led to the belief that the Federal Open Market Committee will turn back to dovish when it meets next week and ease off the interest-rate hike.
Gold price focus
The focus will now then turn to the Personal Consumption Expenditure data on Friday before we head into the Federal Reserve meeting week. Ahead of this data, WIRP suggests a Federal Reserve interest rate hike of 25 bp on February 1 is fully priced in, with less than 5% odds of a larger 50 bp move. Another 25 bp hike on March 22 was about 80% priced in, while one last 25 bp hike in Q2 is only 35% priced in. Nevertheless, those odds are likely a touch lower and for that, the IUS Dollar index was last seen up 0.40 points to 102.00 from a low of 101.504. US Treasury Bond yields were also on the rise, increasing the opportunity cost of owning gold. The US 10-year note was last seen paying 3.52% at the highest of the day.
Gold price and US Dollar technical analysis
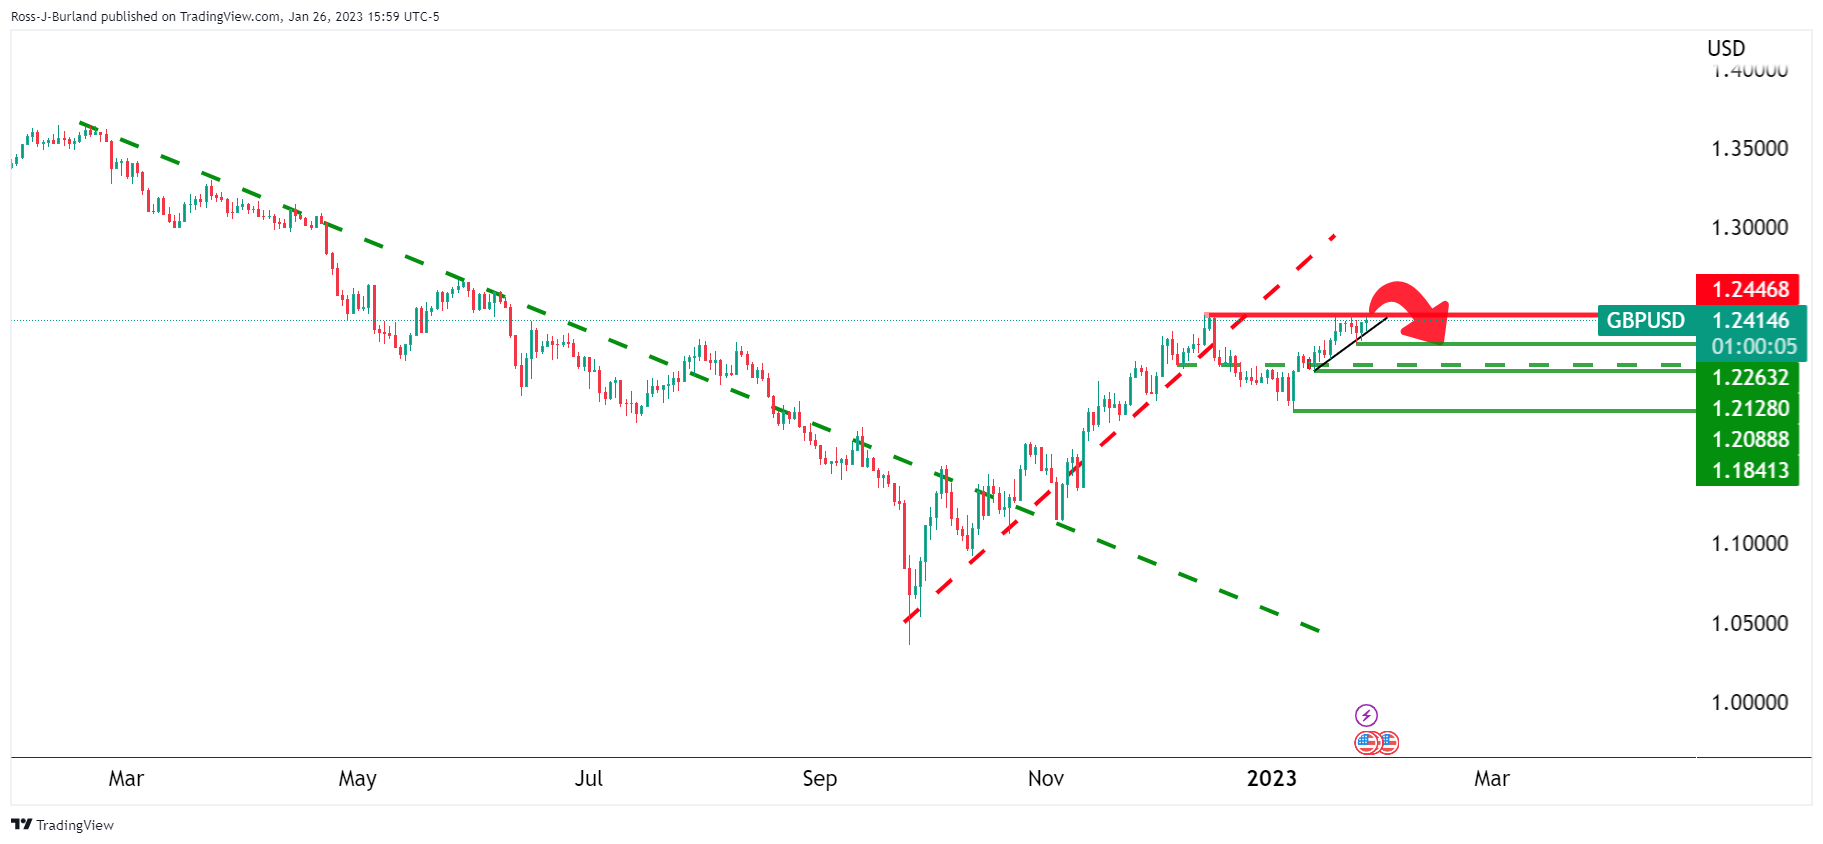
In the prior analysis, it was argued that the Gold price was on track for a crash should the US Dollar burst to life given the placement of the price in the market structure at the time.
The US Dollar had been testing the daily trendline resistance as follows:
It was stated that if this were to break then the Gold price will likely be headed lower with the news scheduled for Thursday and now Friday as the catalysts
US Dollar, DXY, update
The US Dollar bulls have managed to eat into the trendline and this leaves the outlook for Gold price bearish. However, the US Dollar bears are attempting to correct within the W-formation, so there are prospects of a meanwhile recovery in the Gol price ahead of Fridsay's key data.
Meanwhile, the Gold price was in a technically bullish trend as follows:
But in the prior analysis, it was stated that the bullish trendline for the Gold price was vulnerable:
A break of Gold price structures was eyed for the days ahead so long as resistance held:
A sell-off and capitulation of the Gold price would leave prospects of a test towards $1,900.
Gold price update
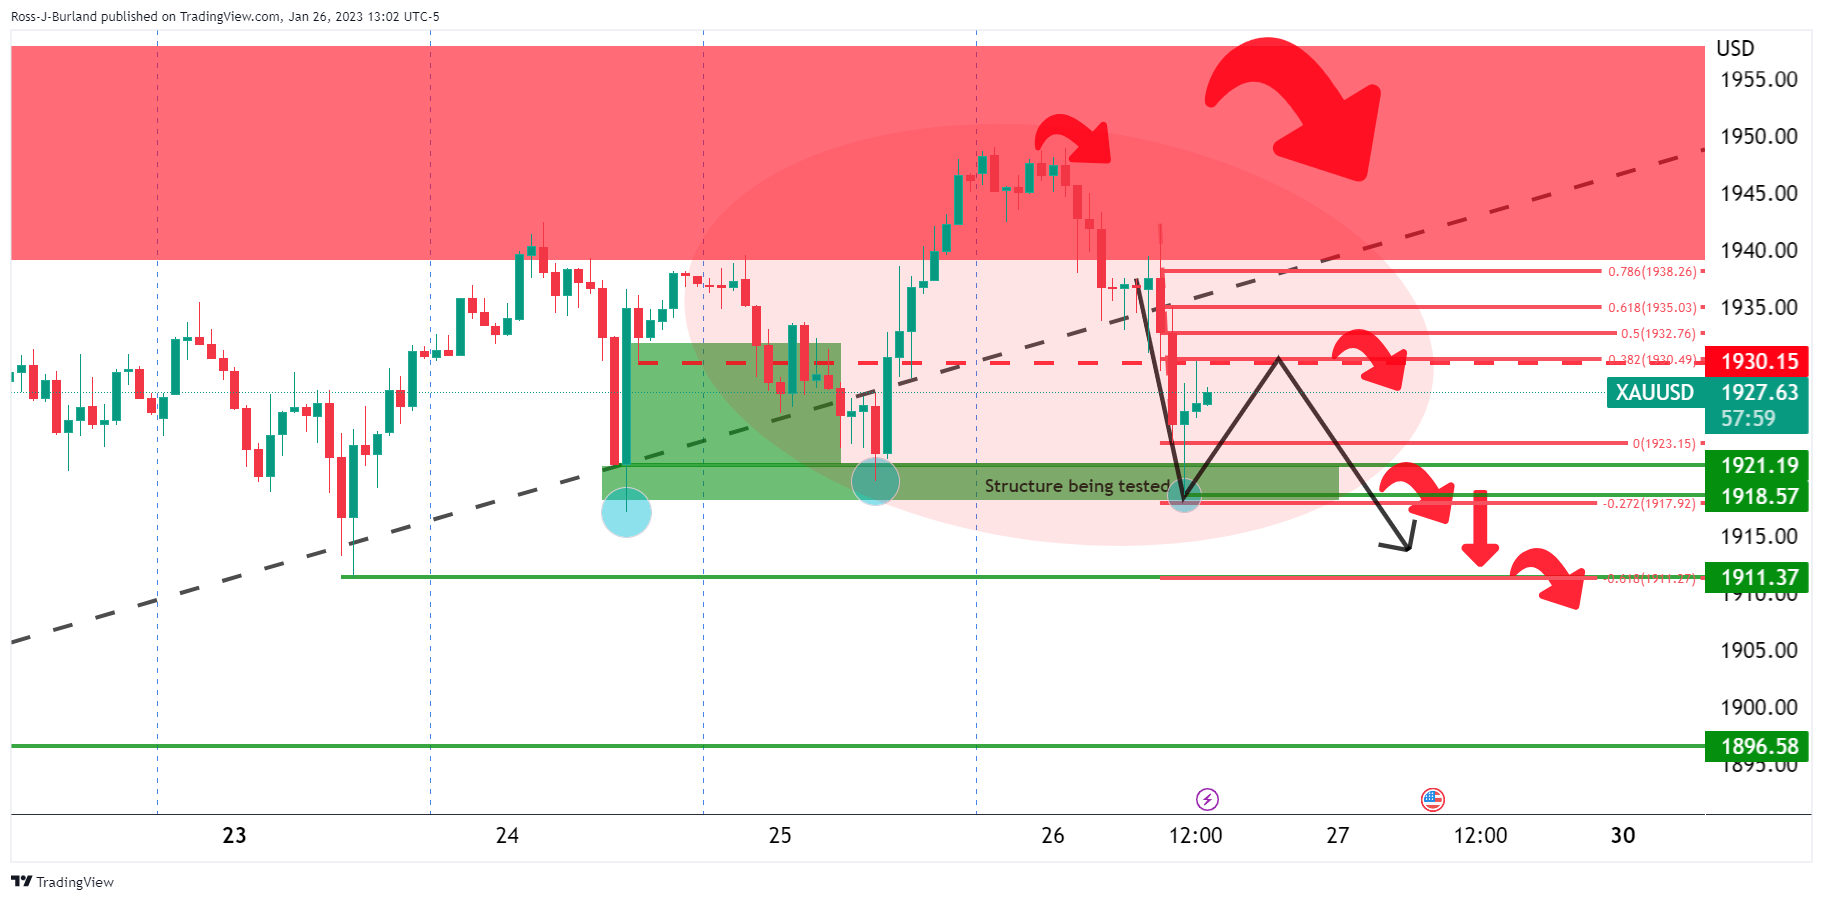
The bears have broken the trendline after the move into the highs and have subsequently moved in on the horizontal structure that guards a move lower to test bullish commitments above $1,900.
- USD/JPY remains sideways, trapped within the 129.00/131.00 range.
- Buyers are unable to conquer the 20-day Exponential Moving Average, and keep the USD/JPY pair range-bound.
- USD/JPY Price Analysis: Remains exposed to selling pressure, as its bias is still downwards.
The USD/JPY bounces from weekly lows reached early Thursday at 129.02 and reclaimed the 130.00 psychological level, eyeing a test of the 20-day Exponential Moving Average (EMA) at 130.70. Nevertheless, the USD/JPY fell short and hit a daily high at 130.61, settling around current exchange rates. At the time of writing, the USD/JPY is trading at 130.34.
USD/JPY Price Analysis: Technical outlook
Although USD/JPY buyers are staging a comeback late in the week, they have been unable to crack the 20-day EMA, which exposes the pair to selling pressure. Traders should be aware that long term, the USD/JPY remains downward biased, and it can shift to neutral if buyers reclaim the January 11 high of 131.57.
Failure to crack the 20-day EMA paves the way for a bearish continuation. Therefore, the USD/JPY first support would be the psychological 130.00 figure, followed by a test of this week’s low of 129.02. A breach of the latter and the USD/JPY might fall toward the year-to-date (YTD) low of 127.21, hit on January 16.
USD/JPY Key Technical Levels
Data released on Thursday showed the US economy grew at a 2.9% annualized rate during the fourth quarter, above the 2.6% of market consensus. Analysts at Wells Fargo point out the outturn represents the second consecutive quarter of above-trend GDP growth. However, they warn that while the economy came into the fourth quarter with solid momentum, it ended the quarter with a distinct loss of momentum.
Underlying components of the Q4 GDP data were not quite as impressive
“The outturn was a bit stronger than the consensus expectation of 2.6% growth, and it represents only a modest downshift from the 3.2% growth rate that was registered in the third quarter. To put the GDP growth rates of the last two quarters of 2022 into perspective, consider that U.S. real GDP growth averaged 2.3% per annum during the economic expansion of 2010-2019. In short, the U.S. economy grew at an above-trend rate in the second half of last year.”
“This loss of momentum at the end of the fourth quarter means that the solid growth rates that the U.S. economy posted in the second half of 2022 likely will not be repeated in the first quarter. Indeed, we currently forecast that real GDP will be more or less flat in Q1-2023 on a sequential basis.”
“Strength in the labor market is a sound fundamental for the outlook for consumer spending, at least in the near term. But further monetary tightening by the Federal Reserve—we look for the FOMC to raise rates by a combined amount of 75 bps at the next three policy meetings—will exert further headwinds on the economy.”
“We forecast the economy will slip into a modest recession around mid-year.”
- GBP/USD trims some of Wednesday’s gains after treading above 1.2400,
- United States economic data bolstered the US Dollar, a headwind for the Pound Sterling.
- Retail Sales in the UK were dismal while Brexit negotiations improved, according to McGrath, Irish PM.
GBP/USD dipped as the release of US economic data bolstered the US Dollar (USD), which is staging a comeback after being battered throughout the week. Furthermore, dismal retail sales reported in the United Kingdom (UK) were another reason to dump the Pound Sterling (GBP). At the time of writing, the GBP/USD exchanges hands at 1.2362, down by 0.25%.
US data boosted the US Dollar
Growth remains the reason driving the financial markets. In the fourth quarter, the United States (US) economy grew by 2.9% QoQ, while Q3 printed a 3.2% jump, as the US Department of Commerce reported. For 2022, the economy expanded by 2.1%, lower than in 2021, 5.9% YoY.
At the same time, Durable Good Orders for December rose 5.6% MoM, recovering from November’s -2.1% contraction. Elsewhere, US Department of Labor data showed the labor market resilience. Initial Jobless Claims for the week ending January 21 fell to 186K, below estimates of 205K.
Hence, the US Dollar Index (DXY), a gauge that tracks the buck’s value against a basket of peers, is erasing Wednesday’s losses and rising 0.44%, up at 102.097, a headwind for the GBP/USD.
Earlier, UK retail sales reported by the Confederation of British Industry (CBI) edge slumped over the last month at the fastest rate since April 2022, reaffirming the weak state of the UK economy. Data showed sales plunging to -23 from 11in December’s report.“Retailers began the new year with a return to falling sales volumes, as the sector continues to face the twin headwinds of rising costs and squeezed household incomes,” CBI Martin Sartorius said.
Aside from this, Brexit news crossed wires and might positively impact the Pound Sterling. Irish Finance Minister Michael McGrath commented that Ireland and the UK have a shared determination to secure an agreement after meeting with Chancellor of the Exchequer Jeremy Hunt on Thursday. McGrath added that negotiations around Northern Ireland reached a new level and that there’s a good atmosphere, even though there are still some issues to be resolved.
What to watch?
On Friday, the US economic docket will feature the US Federal Reserve preferred gauge for inflation, the Core Personal Consumption Expenditures (PCE), with the monthly reading estimated at 0.3%, while annually based is foreseen at 4.4%. Headline PCE data is expected at 0.1% Mom and 5.5% YoY.
GBP/USD Key Technical Levels
- US Dollar gains momentum during the American session as US yields move higher.
- Markets wobble after US economic data, ahead of central banks meetings next week.
- AUD/USD drops after a four-day positive streak.
The AUD/USD dropped from the highest level since June during the American session after the US Dollar gained momentum. The pair peaked at 0.7141 and then retreated more than 50 pips. It is hovering around 0.7080, near the daily lows.
The Aussie is headed toward the first daily loss versus the US Dollar after rising for four consecutive days. The trend remains bullish but if the current correction deepens, it could turn into a reversal. The next support is seen at 0.7060 (Jan 25 low) followed by 0.7025. On the upside, a consolidation above 0.7120 would keep the doors open to more gains.
Markets digest new information
Despite the upbeat economic numbers released on Thursday, the outlook is not clear, with mixed signs and higher interest rates. “Monthly data indicate that while the economy came into the fourth quarter with solid momentum, it ended the quarter with a distinct loss of momentum. Growth likely will be weak, at least relative to the last two quarters of 2022, in Q1-2023”, said analysts at Wells Fargo.
US yields ended up moving higher after the economic reports while US equities moved off highs, favoring the US Dollar. The DXY is up for the day above 102.00 after reaching earlier the lowest level since May. The downtrend for the greenback remains in place but it does not look as strong as two weeks ago.
Next week, the Federal Reserve will announce its decision on monetary policy and a 25 basis points rate hike is expected. Market participants do not see this as the last hike.
On Friday, Australia will report the Producer Price Index for the third quarter. The following policy meeting of the Reserve Bank of Australia is February 7. Market participants see a 25 basis points rate hike.
Technical levels
AUD/USD has surged higher over the past few sessions. Economists at Credit Suisse stick with their bullish bias and look for further gains.
Short and medium-term momentum still rising
“Medium-term moving averages are close to seeing a bullish cross higher and short-term MACD momentum is very strong, whilst the market is also threatening to break key resistance at 0.7138. A close above here would open up a move to our core objective at 0.7284/7306 next.”
“Near-term support moves to 0.7061, below which would suggest a retest of the breakout point at 0.6904/6854. However, only a stable close below the 200DMA at 0.6811 would speak in favor of a more neutral and choppy trading environment, with next support below seen at the 55DMA at 0.6798.”
The Fed’s preferred inflation gauge, the Core Personal Consumption Expenditure (Core PCE), will be published on Friday, January 27 at 13:30 GMT and as we get closer to the release time, here are the forecasts of economists and researchers of seven major banks.
Markets expect the core PCE inflation, which excludes volatile food and energy prices, to rise 0.3% on a monthly basis and forecast the annual rate to decline to 4.4% from 4.7% in November. If so, it would be the lowest since October 2021 but still more than double the Fed’s 2% target.
ING
“We expect the Fed’s favoured measure of inflation to show a relatively benign 0.2% MoM reading, which would confirm the easing trend in price pressures.”
TDS
“Core PCE prices likely accelerated to a 0.3% MoM pace in Dec, though a 0.4% gain can't be discarded. The YoY rate likely slowed to 4.5%, suggesting prices continue to moderate but remain sticky at high levels.”
NBF
“Still in December, the annual core PCE deflator may have moved down from 4.7% to a 14-month low of 4.4%.”
Deutsche Bank
“We don't expect the same declines as recently seen in CPI as some of the stronger components in PPI last week are better correlated to PCE components. We expect a +0.4% monthly gain.”
Citibank
“Even throughout the last quarter of softer core CPI prints, we still expect core PCE to rise at a 4.0% annualized pace, still twice the Fed’s 2% target.”
CIBC
“Core PCE inflation, the Fed’s preferred measure of prices, likely eased to 4.4% YoY.”
Wells Fargo
“Our expectation for the PCE deflator is to remain unchanged.”
- Gold price drops more than 0.60% due to profit-taking and upbeat US economic data.
- US Gross Domestic Product for Q4 beat estimates, while unemployment claims fell.
- Durable Good Orders jumped while new orders shrank.
Gold price retreats after hitting a nine-month high of $1949.16 and dips beneath the $1940 mark, following the release of the Gross Domestic Product (GDP) preliminary reading in the United States (US), amongst other data. Therefore, the XAU/USD is trading at 1933.40, below the opening price by 0.49%.
Q4’s Gross Domestic Product in the United States exceeded estimates
US equity futures rose on the release of Q4’s GDP, while Gold extended its losses. The US economy grew at a solid 2.9% QoQ, above estimates of 2.6%, while for Q3, it rose 3.2%, in data revealed by the US Commerce Department. Meanwhile, for the entire year of 2022, the US economy expanded by 2.1%, less than the 5.9% registered in 2021. The report highlighted that consumer spending was the main driver of economic growth at the start of Q4. Spending remains underpinned by a robust labor market and excess savings.
US unemployment claims dived, while Durable Good Orders rose
At the same time, the US Department of Labor (DoL) reported that Initial Jobless Claims for the week ending on January 21 dropped 6K to a seasonally adjusted 186K, below the estimates of 205 K. In other data, Durable Good Orders rebounded from a -2.1% contraction in November to 5.6% in December, as data for the US Commerce Department showed. However, core New Orders contracted by -0.1% MoM, aligned with the consensus, as the US economy feels the pain of 425 basis points (bps) of tightening by the US Federal Reserve (Fed).
Gold traders brace for Fed’s inflation gauge on Friday
Friday, the US economic docket will feature the US Federal Reserve preferred gauge for inflation, the Core Personal Consumption Expenditures (PCE), with the monthly reading estimated at 0.3%, while annually based is foreseen at 4.4%. Headline PCE data is expected at 0.1% Mom and 5.5% YoY.
Gold Technical Analysis
The XAU/USD daily chart remains upward biased, although an ongoing correction might push prices towards the $1900 psychological level or to the January 18 daily low of $1896.74. Below that support, the 20-day Exponential Moving Average (EMA) rests at $1894.44, which, once cleared, could send XAU/USD diving toward the January 11 pivot low of $1867.22. As an alternate scenario, if XAU/USD reclaims $1950, a move toward the psychological $2000 level is on the cards.
- US economic data includes more positive than negative surprises.
- Dollar moves up, then down and then rebounds.
- USD/CAD back at the previous range after falling to 1.3300.
The USD/CAD rebounded sharply during the last minutes, trimmed losses and rose back above the key area of 1.3350. The US Dollar is volatile on Thursday following US economic reports and ahead of next week’s FOMC meeting.
Down for the day but…
Economic data from the US came in mostly above expectations. The economy grew at a 2.9% annual rate during the fourth quarter, above the 2.6% of market consensus. Price indicators of the GDP report showed a larger-than-expected slowdown. Initial Jobless Claims dropped to the lowest level since April 2022. The Chicago Fed National Activity Index rose in December to -0.49 from -0.51. Durable Goods Orders rebounded 5.6% in December against market consensus of 2.5%.
The numbers strengthened the US Dollar that hit fresh daily highs across the board. It also helped market sentiment and crude oil prices. The greenback reversed as Wall Street opened higher. During the last hours, the US dollar has recovered most of the lost ground as US yields moved higher and as optimism fades.
A volatile sentiment prevails with keeps the USD/CAD undecided. The pair fell to 1.3301, hitting the lowest since mid-November and then rose back to the 1.3355 zone. If it consolidates well below 1.3350 a new test of 1.3300 seems likely, while if it holds above, the pair could continue to move in the 1.3350/1.3450 range.
On Wednesday, the Bank of Canada raised interest rates by 25 basis points as expected and signalled it will pause the tightening cycle. Next week will be the FOMC meeting. The Fed is seen raising rates by 25 basis points. Attention would be on the clues about the future path.
Technical levels
Economists at Credit Suisse reaffirm their bullish stance on the Mexican Peso but also highlight that the strong CPI surprise is likely to lead to further two-way uncertainty around Banxico policy, and, therefore, warrants attention.
Hot CPI data surprise creates new two-way risks on growth and Banxico policy
“We remain constructive MXN, we hold on to our 18.50 USD/MXN target for Q1, and still favour fading rallies to the top of our range around 20.00.”
“The strong CPI surprise, however, creates two-way risks around Banxico policy expectations, especially with rising uncertainty around the near-term growth outlook and a new Banxico board member in place. These risks are well accounted for in risk premium terms, and do not change our MXN stance, but need nevertheless to be monitored carefully in the coming weeks.”
In the fourth quarter of 2022, the US economy grew by 2.9% after 3.2% in the third quarter. Nevertheless, economists at Commerzbank continue to expect a recession this year.
Last decent growth rate for a while?
“The US economy grew strongly by 2.9% in the final quarter of 2022. However, this is likely to be the last strong quarter for a while, especially as the details are already not quite so encouraging.”
“We still expect the economy to slide into recession due to the Fed's massive rate hikes.”
- The index trades with decent gains although still below 102.00.
- Flash US Q4 GDP surpassed expectations at 2.9% QoQ.
- New Home Sales expanded 2.3% MoM in December.
The USD Index (DXY), which tracks the greenback vs. a bundle of its main competitors, picks up extra pace following firm prints from the US docket on Thursday.
USD Index now retargets the 102.00 barrier
The index manages well to keep the earlier bounce from the 101.50 region alive, as better-than-expected results from key data releases lent further support to the buck.
In fact, according to preliminary readings, the US economy is seen expanding at an annualized 2.9% in Q4, while Durable Goods Orders increased at a monthly 5.6%, both prints coming in above previous estimates.
Additional results saw Initial Claims rise 186K in the week to January 21, the trade deficit widen to $90.3B and New Home Sales expand 2.3%, or 0.616M units, in December.
What to look for around USD
The index reverses part of the ongoing leg lower and extends the bounce off multi-month lows near 101.50 to the proximity of the 102.00 barrier on Thursday.
The idea of a probable pivot in the Fed’s policy continues to weigh on the greenback and keeps the price action around the DXY subdued. This view, however, also comes in contrast to the hawkish message from the latest FOMC Minutes and recent comments from rate setters, all pointing to the need to advance to a more restrictive stance and stay there for longer, at the time when rates are seen climbing above the 5.0% mark.
On the latter, the tight labour market and the resilience of the economy are also seen supportive of the firm message from the Federal Reserve and the continuation of its hiking cycle.
Key events in the US this week: Durable Goods Orders, Advanced Q4 GDP Growth Rate, Chicago Fed National Activity Index, Initial Jobless Claims, New Home Sales (Thursday) – PCE, Core PCE, Personal Income, Personal Spending, Pending Home Sales, Final Michigan Consumer Sentiment (Friday).
Eminent issues on the back boiler: Rising conviction of a soft landing of the US economy. Prospects for extra rate hikes by the Federal Reserve vs. speculation of a recession in the next months. Fed’s pivot. Geopolitical effervescence vs. Russia and China. US-China trade conflict.
USD Index relevant levels
Now, the index advances 0.30% at 101.94 and the breakout of the weekly high at 102.89 (January 18) would pave the way for a test of 105.63 (monthly high January 6) and then 106.46 (200-day SMA). On the downside, the next support appears at 101.50 (2023 low January 26) seconded by 101.29 (monthly low May 30 2022) and finally 100.00 (psychological level).
S&P 500 is at a key inflection point, which is seen as key as to whether a bear market remains in place, economists at Credit Suisse report.
Closing break above 4101 to suggest that core trend has shifted sideways
“S&P 500 is back above its 200-Day Moving Average, but with further key resistances still seen intact for now at the downtrend from the beginning of 2022, currently seen at 4047, with the key December ‘reversal week’ high at 4101. We remain of the view that a bear market can remain in place while beneath here.”
“A close above 4101 would be seen to turn the core trend neutral and open the door to strength back to 4147/55, then 4300/4325.”
EUR/USD remains in a short-term consolidation phase. Economists at Credit Suisse look for an eventual break higher post this pause.
Key near-term support seen at 1.0776/67
“EUR/USD is still stalling below key resistance at 1.0918/44 and we stay biased towards a consolidation phase below this level. However, post this pause, we believe a breakout above here is now likely, with the next resistance seen at 1.1185.”
“Support is seen at 1.0836 initially, with a break below the low of last week and 21-day exponential average at 1.0776/67 needed to mark a near-term top and more decisive rejection, with support then seen next at 1.0736/25.”
The Loonie eased following the Bank of Canada meeting. Economists at Commerzbank do not expect the CAD to see gains ahead.
Inflation data to be decisive for the further CAD outlook
“Inflation data is likely to be decisive for the further CAD outlook. If it contradicts the impression of a significant fall in inflation this might fuel renewed rate hike expectations which would benefit the Loonie.”
“The US data and market expectations on the US central bank clearly also constitute an important driver for USD/CAD though. We confirm our outlook and see limited potential for a CAD recovery medium-term.”
Economist at UOB Group Enrico Tanuwidjaja assesses the lates interest rate decision by the Bank of Thailand (BoT).
Key Takeaways
“The Bank of Thailand (BoT) voted unanimously to raise the policy rate by 25bps to 1.50%. This is its fourth hike in the current cycle and the first for 2023.”
“BoT deemed that risks of demand-side inflationary pressures amidst strong recovery of the Thai economy warrants close monitoring and specifically mentioned that the policy rate should be normalized to the level that is consistent with long-term sustainable growth. However, BoT further mentioned that in so doing, a gradual and measured path remain preferred course.”
“Based on today’s MPC decision, we keep our view for one final 25bps rate hike in Mar to 1.75% and for BoT to hold at that level for the remainder of this year to anchor inflation expectations and arrest possible runaway inflation risks without undermining growth recovery trajectory.”
- Durable Goods Orders in the US grew at a stronger pace than expected in December.
- The US Dollar Index stays below 102.00 despite upbeat data.
Durable Goods Orders in the US increased by 5.6%, or $15.3 billion, in December to $286.9 billion, the US Census Bureau announced on Thursday. This reading followed November's contraction of 1.7% and came in better than the market expectation for an increase of 2.5%.
"Excluding defense, new orders increased 6.3%," the publication further read. "Transportation equipment, also up four of the last five months, drove the increase, $15.5 billion or 16.7% to $108.1 billion."
Market reaction
The US Dollar Index is having a difficult time capitalizing on the robust data releases. As of writing, the US Dollar Index was virtually unchanged on the day at 101.68.
- Initial Jobless Claims in the US decreased by 6,000 in the week ending January 21.
- US Dollar Index stays slightly below 102.00 after the data.
There were 186,000 initial jobless claims in the week ending January 21, the weekly data published by the US Department of Labor (DOL) showed on Thursday. This print followed the previous week's print of 192,000 (revised from 190,000) and came in better than the market expectation of 205,000.
Further details of the publication revealed that the advance seasonally adjusted insured unemployment rate was 1.2% and the 4-week moving average was 197,500, a decrease of 9,250 from the previous week's revised average.
"The advance number for seasonally adjusted insured unemployment during the week ending January 14 was 1,675,000, an increase of 20,000 from the previous week's revised level," the DOL noted.
Market reaction
The US Dollar Index struggles to gain traction despite the upbeat data and was last seen posting small daily gains at 101.75.
- USD/JPY hits a fresh daily high in the last hour, albeit lacks bullish conviction.
- The mostly upbeat US macro releases boost the USD and provide a modest lift.
- Bets for smaller Fed rate hikes continue to weigh on the buck and cap the upside.
The USD/JPY pair catches fresh bids during the early North American session and climbs to a fresh daily high, around the 130.30-130.35 region in reaction to the mostly upbeat US macro data. The momentum quickly runs out of steam and drags spot prices back to the 130.00 psychological mark in the last hour.
The intraday US Dollar recovery from the vicinity of an eight-month low picks up pace after the Advance US GDP report showed that the economy expanded by 2.9% annualized pace in the fourth quarter. This was below the 3.2% growth recorded in the previous quarter, though was better than consensus estimates for a reading of 2.6%. Adding to this, the headline Durable Goods Orders smashed expectations and rose 5.6% in December, providing a modest lift to the greenback and pushing the USD/JPY pair higher.
The data, however, did little to push back against market expectations for a less aggressive policy tightening by the Fed. In fact, the markets are still pricing in a smaller 25 bps Fed rate hike move in February, which is evident from a rather muted reaction in the markets. This, in turn, is holding back the USD bulls from placing aggressive bets. Apart from this, fresh speculation that high inflation may invite a more hawkish stance from the Bank of Japan (BoJ) cap gains for the USD/JPY pair.
Even from a technical perspective, spot prices face rejection near a two-week-old descending trend-line resistance. The said barrier is currently pegged ahead of the mid-130.00s and should act as a pivotal point, which if cleared decisively should pace the way for additional gains. Traders, however, might prefer to wait on the sidelines ahead of next week's central bank event risk - the outcome of the highly-anticipated two-day FOMC policy meeting, scheduled to be announced next Wednesday.
Technical levels to watch
- USD/CHF gains some positive traction on Thursday amid a modest pickup in the USD demand.
- Rebounding US bond yields underpins the buck amid some repositioning ahead of the US data.
- Bets for smaller rate hikes by the Fed keep a lid on the USD and act as a headwind for the pair.
The USD/CHF pair attracts some buying in the vicinity of the weekly low, around the 0.9160 region on Thursday and recovers a part of the previous day's modest losses. The pair sticks to its modest gains heading into the North American session and is currently placed just below the 0.9200 mark.
In the meantime, an intraday pickup in the US Treasury bond yields assists the US Dollar to recover a bit from an eight-month low, which, in turn, lends some support to the USD/CHF pair. The USD uptick could further be attributed to some repositioning trade ahead of important US macro releases - the Preliminary (first estimate) fourth-quarter GDP print, Durable Goods Orders and New Home Sales data.
That said, rising bets for a smaller 25 bps interest rate hike by the Federal Reserve in February keep a lid on any meaningful upside for the US bond yields. This might hold back the USD bulls from placing aggressive bets. Furthermore, concerns about a deeper global economic downturn underpin the Swiss Franc's (CHF) relative safe-haven status and also contribute to capping gains for the USD/CHF pair.
Nevertheless, spot prices remain well within the striking distance of the lowest level since November 2021 touched last week. Moreover, the lack of any buying interest suggests that the near-term bearish trend witnessed since early November 2022 might still be far from being over. This makes it prudent to wait for strong follow-through buying before confirming that the USD/CHF pair has formed a bottom.
Technical levels to watch
Senior Economist at UOB Group Alvin Liew reviews the recently published CPI results in Singapore.
Key Takeaways
“Headline and core CPI inflation further converged in Dec (2022). Headline CPI rose by 0.2% m/m NSA in Dec (markedly slower from Nov’s +1.0% m/m jump). That sequential pace of increase translated into 6.5% y/y for headline CPI inflation in Dec (down from 6.7% in Nov), lowest print in 7 months (May 2022: 5.6%). But core inflation (which excludes accommodation and private road transport) continued to rise sequentially and at a faster pace of 0.6% m/m NSA (from +0.2% m/m in Nov), resulting in core inflation staying sticky at 5.1% y/y in Dec (same as Nov).”
“The sources of core inflationary pressures were again broad-based but two sources stood out: food and services rose further in Dec. The other notable component that added to core inflation was health care. The retail & other goods and electricity & gas inflation stayed positive but slowed. As for the headline CPI inflation, other than upside to the core CPI, the accommodation costs increase stayed elevated, while private transport costs saw yet another further moderation, which explains why the headline CPI eased, but not core.”
“Inflation Outlook – The MAS projected core inflation “to stay elevated in the first half of this year before slowing more discernibly in H2 2023 as the current tightness in the domestic labour market eases and global inflation moderates.” It also kept its 2023 forecasts unchanged from the Oct 2022 Monetary Policy Statement. We also maintain our current set of forecasts, for headline inflation to average 5.0% and core inflation to average 4.0% in 2023 (from 6.1% and 4.1% respectively in 2022). Excluding the 2023 GST impact, we expect headline inflation to average 4.0% and core inflation average 3.0% in 2023.”
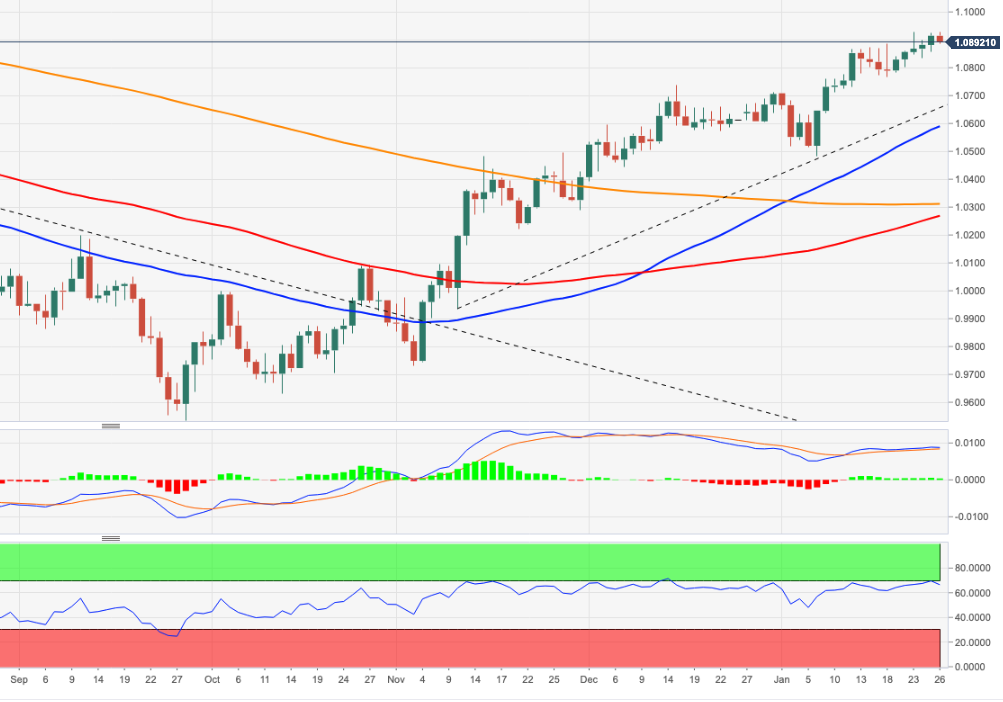
- EUR/USD faces some corrective decline above 1.0900.
- Next target of note on the upside emerges at the 1.1000 barrier.
EUR/USD deflates a tad after printing a new 2023 peak near 1.0930 on Thursday.
The continuation of the uptrend now needs to rapidly clear the 2023 high at 1.0929 (January 26) to allow for a test of the weekly top at 1.0936 (April 21 2022).
A sustainable break above this level could pave the way for a challenge of the key barrier at 1.1000 the figure sooner rather than later.
In the meantime, while above the short-term support line around 1.0675, extra gains should remain in store for the pair.
In the longer run, the constructive view remains unchanged while above the 200-day SMA, today at 1.0309.
EUR/USD daily chart
The US Dollar is trading mixed ahead of Gross Domestic Product (GDP), Core PCE data. In the view of economists at Scotiabank, the USD outlook remains negative.
GDP, PCE data awaited
“The USD outlook remains negative and losses risk accumulating as investors move to price in peak inflation/peak Fed.”
“US Q4 GDP is expected to slow to 2.6% (SAAR), from Q3’s 3.2% clip but GDP tracking data suggests growth momentum is (so far) holding up relatively well around the same pace seen in the last quarter and GDP might surprise on the upside.”
“Core PCE is expected to slow to 3.9% (from 4.7%) which should support expectations for the Fed to slow the pace of tightening and weigh on the USD.”
See – US GDP Preview: Forecasts from ten major banks, firm growth
Senior Economist Julia Goh and Economist Loke Siew Ting at UOB Group comment on the latest inflation figures release in Malaysia.
Key Takeaways
“Headline inflation eased to a six-month low of 3.8% y/y in Dec (from 4.0% in Nov), in line with our estimate (3.8%) and Bloomberg consensus (3.9%). This brought the full-year inflation rate to an average of 3.3% (2021: 2.5%), coming in a tad lower than our estimate (3.5%) but matching official forecast (3.3%). Dec’s inflation was primarily pulled down by slower food, transport, recreation services & culture, and personal care price inflation amid year-ago high base effects. This helped to offset the persistent rise in restaurants & hotels price inflation and an uptick in housing, utilities & other fuels price inflation.”
“In the absence of domestic policy changes for price-administered items particularly fuels and utilities, we expect headline inflation to continue its downward trend towards year-end. This will result in an average inflation rate of 2.8% for the entire year of 2023 (MOF est: 2.8%-3.3%). Volatile global commodity and non-commodity prices, domestic policy changes, the persistence of post-pandemic demand, and currency movement are key wildcards for our inflation outlook.”
“Although Bank Negara Malaysia (BNM) unexpectedly took a prudent pause on its interest rate hike … the central bank guided that they are not done with the interest rate hikes yet and future rate move remains data dependent. In our view, recent global developments and country-specific factors suggest rising challenges for BNM to hike further in the near term. Hence, we have dialed down our expectation to just one more 25bps hike to bring the Overnight Policy Rate (OPR) back to pre-pandemic level of 3.00% by mid-2023, before taking a long pause for the rest of the year.”
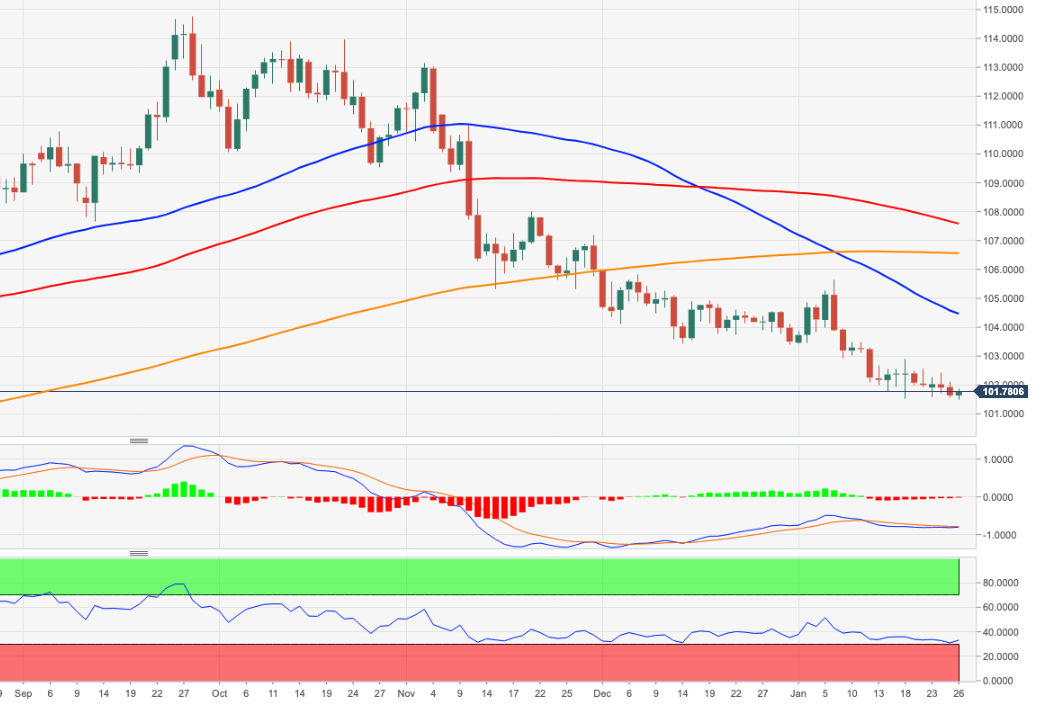
- The index rebounds after dropping to multi-month lows at 101.50.
- The dollar’s negative outlook remains unchanged below 106.50.
DXY manages to regain some composure and bounces off earlier 8-month lows in the mid-101.00s on Thursday.
Despite the rebound, the index remains well under pressure and a sustainable breach of the 101.50 level should accelerate losses to, initially, the May 2022 low around 101.30 (May 30) prior to the psychological 100.00 yardstick.
On the upside, the so far weekly high at 102.89 (January 18) is expected to offer minor resistance.
In the meantime, while below the 200-day SMA at 106.47, the index is expected to risk extra losses.
DXY daily chart
- GBP/USD remains confined in a narrow trading band heading into the North American session.
- A combination of factors helps revive the USD demand and acts as a headwind for the major.
- The downside seems limited as traders prefer to wait for the release of the US Q4 GDP report.
The GBP/USD pair continues with its struggle to gain any meaningful traction and extends its rangebound price action heaving into the North American session. The pair is currently placed just below the 1.2400 mark, awaiting a fresh catalyst before the next leg of a directional move.
Traders now seem to have moved to the sidelines and look to the first estimate of the fourth quarter US GDP report for a fresh impetus. In the meantime, an intraday pickup in the US Treasury bond yields and a softer risk tone assist the safe-haven US Dollar to stage a modest recovery from an eight-month low. This, in turn, acts as a headwind for the GBP/USD pair, though the downside seems cushioned, at least for the time being.
Rising bets for a smaller 25 bps Fed rate hike move in February should keep a lid on any meaningful upside for the US bond yields and hold back the USD bulls from placing aggressive bets. Furthermore, speculations that elevated consumer inflation will force the Bank of England (BoE) to continue lifting rates should offer some support to the British Pound. This supports prospects for some meaningful upside for the GBP/USD pair.
Traders, however, seem reluctant ahead of the key US macro releases - the Advance Q4 GDP print, Durable Goods Orders and New Home Sales data. The focus will then shift to the US Core PCE Price Index, due on Friday, which will play a key role in influencing the Fed's rate-hike path. This, in turn, will drive the USD demand and determine the near-term trajectory for the GBP/USD pair ahead of next week's crucial central bank event risks.
Technical levels to watch
The Dollar languishes before US Gross Domestic Product (GDP) for the first quarter. The greenback could challenge 2023 lows on disappointing figures, economists at Société Générale report.
Current set-up in is to sell dips in bonds and rallies in the Dollar
“The current set-up in bonds and FX is to sell dips in bonds (lower yields) and rallies in the Dollar. Barring much stronger outcomes for GDP and PCE inflation, investors are unlikely to change tactics today.”
“The asymmetric reaction function means that investors won’t hesitate to respond if the data underwhelms, potentially resulting in new 2023 lows for the Dollar.”
“The 10y UST backed away from last week’s low of 3.319%. Resistance is situated around 3.58%.”
See – US GDP Preview: Forecasts from ten major banks, firm growth
UOB Group’s Senior Economist Julia Goh and Economist Loke Siew Ting assess the latest BNM event, where the central bank kept the monetary conditions unchanged.
Key Takeaways
“In its first Monetary Policy Committee (MPC) meeting of the year, Bank Negara Malaysia (BNM) decided to take a prudent pause on its rate hike cycle, leaving the Overnight Policy Rate (OPR) unchanged at 2.75%. The decision defied market consensus with 17 out of 18 economists/analysts (including us) polled by Bloomberg projected a 25bps hike while the remaining one forecast a pause.”
“BNM judged that a halt to its interest rate hikes is necessary to allow the Monetary Policy Committee (MPC) to assess the impact of the cumulative four back-to-back rate increases last year given the lag effects of monetary policy on the economy. It expects domestic economic growth to moderate this year after an expected strong performance in 2022, in light of a weaker global growth outlook, higher risk aversion in global financial markets amid ongoing monetary policy tightening in major economies, and lingering geopolitical conflicts. Barring any changes to domestic policy on subsidies and price controls as well as global commodity price shocks, the central bank thinks that headline and core inflation will soften somewhat over the course of 2023.”
“There are material changes in the latest monetary policy statement, which we infer that BNM is nearing the end of its interest rate hike cycle. The central bank dropped the line about “the MPC is not on any pre-set course” and “any adjustments to the monetary policy settings going forward would be done in a measured and gradual manner”. In fact, it guided that further monetary policy normalization would be subject to the evolving conditions and their implications to the domestic inflation and growth outlook. This alongside our in-house view on global growth and monetary policy as well as country-specific factors, we now expect BNM to dial down the rate hikes to +25bps to 3.00% by mid-2023. The MPC will next meet on 8-9 Mar.”
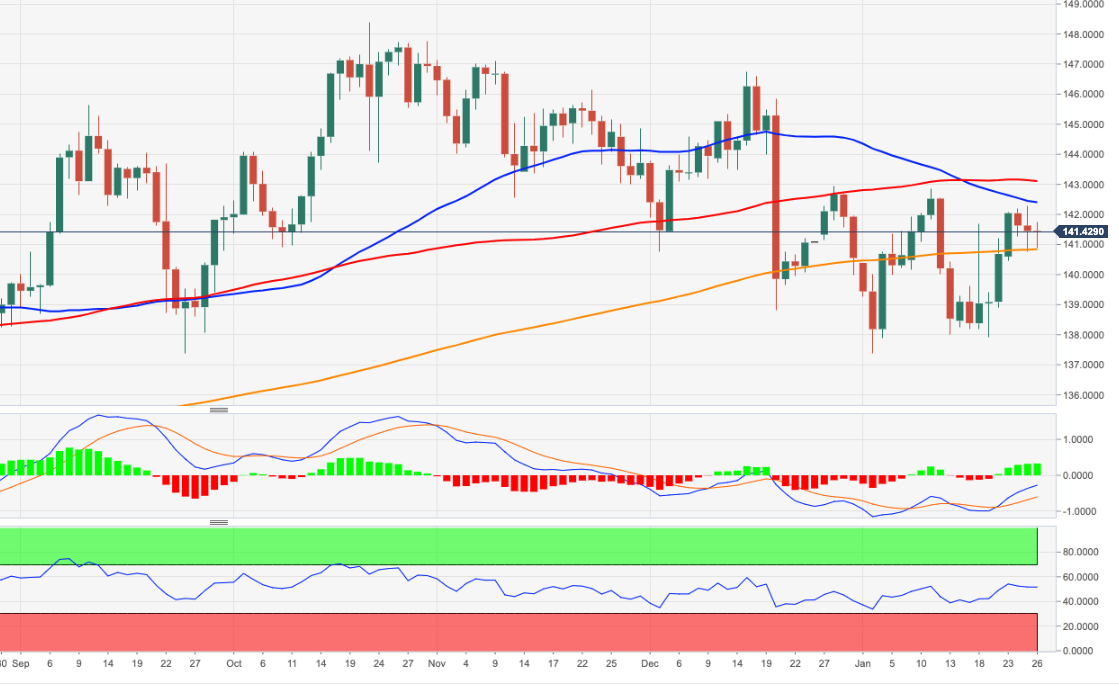
- EUR/JPY regains the 141.00 barrier following a drop to 140.90/85.
- The loss of the key 200-day SMA should expose extra losses.
EUR/JPY now treads water in the 141.40 region after bottoming out in weekly lows near 140.80 earlier in the session on Thursday.
In case the downside accelerates, the next support of note emerges at the 200-day SMA, today at 140.80. A sustainable drop below the latter exposes extra weakness to, initially, the 138.00 neighbourhood.
The constructive outlook for EUR/JPY is seen unchanged above the 200-day SMA for the time being.
EUR/JPY daily chart
- USD/CAD surrenders modest intraday gains and slides back below the 1.3400 mark.
- An uptick in oil prices underpins the Loonie and acts as a headwind for the major.
- A modest USD strength should limit the downside ahead of the US Q4 GDP report.
The USD/CAD pair struggles to capitalize on its modest intraday gains and retreats to the lower end of the daily range, below the 1.3400 mark heading into the North American session.
As investors look past the Bank of Canada's dovish decision on Wednesday, a modest uptick in crude oil prices underpins the commodity-linked Loonie and acts as a headwind for the USD/CAD pair. Hopes for a strong fuel demand recovery in the world's top oil importer China, along with the lower-than-expected rise in US crude inventories, lend some support to the black liquid. That said, worries about a deeper global economic downturn keep a lid on oil prices.
Apart from this, a modest US Dollar strength should limit any meaningful downside for the USD/CAD pair, at least for the time being. Looming recession risks continue to weigh on investors' sentiment, which is evident from a generally softer tone around the equity markets. Furthermore, an intraday pickup in the US Treasury bond yields assists the safe-haven greenback to recover from an eight-month low amid some repositioning trade ahead of the US Q4 GDP print.
That said, firming expectations for a less aggressive policy tightening by the Fed should cap the US bond yields and hold back the USD bulls on the defensive. In fact, the CME's FedWatch Tool points to over a 90% probability for a 25 bps rate hike at the upcoming FOMC meeting next week. This, in turn, warrants some caution before placing aggressive bullish bets around the USD/CAD pair and positioning for an extension of the overnight bounce from a nearly two-week low.
The focus, meanwhile, remains glued to the release of the Preliminary (first estimate) US Q4 GDP print. Thursday's US economic docket also features Durable Goods Orders and New Home Sales data. This, along with the US bond yields and the broader risk sentiment, will drive the USD demand and provide some impetus to the USD/CAD pair. Apart from this, traders will take cues from oil price dynamics to grab short-term opportunities around the major.
Technical levels to watch
EUR/USD closed above 1.09 yesterday, the first daily close above that point since April last year. Economists at Scotiabank look for firm support on dips and stay bullish.
Bull trend intact
“The EUR is liable to remain well-supported into next week’s ECB meeting where a 50 bps hike and more strong messaging on the rate outlook seems likely, given President Lagarde has stressed that she intends to ‘stay the course’.”
“Scope for EUR losses looks limited and charts point to firm support developing just below the figure area (1.0865/70).”
“The bull trend may pause in the short run but still has solid underpinnings. The bull target remains 1.1000/50.”
Economists at Credit Suisse see scope for a pause in the US Dollar Index around key technical levels. However post this pause, there is scope for a deeper short-term selloff in the USD.
DXY decline is showing signs of stalling
“The DXY decline is now showing signs of tiring around key support at 101.99/30 – the 50% retracement of the 2021/2022 uptrend and May 2022 low. We continue to look for this to hold for now and for a consolidation recovery phase to emerge.”
“Bigger picture, whilst our original scenario going into the start of this year was to look for a floor above 101.30, we now believe this will be only a temporary floor (if indeed even seen), ahead of further weakness to 99.82/37, then the 50% retracement at 98.98.”
“Above 102.90 is needed to add weight to the potential for a pause, with resistance then seen next at 103.49, before the 55-day average, now at 104.95, which we look to be tough resistance.”
Today sees the South African Reserve Bank meeting to set interest rates. A 50 bps hike should help the Rand, in the view of economists at ING.
Softer USD environment and China’s reopening story to remain a bullish cocktail for ZAR
“The majority of forecasters are looking for a 50 bps hike to 7.50%, though a few are looking for a 25 bps hike.”
“The Rand has been underperforming this year and one would have expected the huge reversal in USD/CNY to be dragging USD/ZAR much below 17.00. That has not happened, perhaps because of the weak domestic demand outlook in South Africa amid ongoing challenges in energy supply.”
“Yet a softer Dollar environment and the China reopening story should remain a bullish cocktail for the Rand and a hawkish SARB statement today could be enough to push USD/ZAR back to the 16.90 area.”
“Medium-term, we are becoming a little more bullish on the Rand.”
The US Dollar struggles to stay resilient ahead of the US Gross Domestic Product (GDP) data. The greenback could remain under pressure on signals of a cooling of the US economy, economists at Commerzbank report.
Positive review, shaky outlook
“A rate hike by ‘only’ 25 bps at the next Fed meeting is now increasingly likely following numerous comments of Fed officials along these lines. A surprise to the upside in today’s US growth data for Q4 expected by our economists is unlikely to change that, in particular as GDP data always constitutes a backward glance.”
“Leading indicators on the other hand signal a cooling of the US economy. If today's more current data on the labour market (initial jobless claims), order intake or the housing market confirm that the tightening of monetary policy is increasingly having an impact on the real economy, things will remain tough for the Dollar.”
See US GDP Preview: Forecasts from ten major banks, firm growth
AUD/USD gained traction after inflation data from Australia showed the strongest level in 33 years. Economists at UBS expect the Aussie to remain on a solid foot.
RBA will continue to tighten policy at its next meeting
“We expect the Aussie to be supported by China’s reopening, Australia’s relatively strong economic growth, and a central bank that is likely to keep the reins tight when the Fed starts to ease monetary condition.”
“The latest consumer price inflation data hit its strongest level in 33 years, reigniting speculation that the Reserve Bank of Australia will continue to tighten policy at its next meeting.”
The South African central bankers are getting together for their first monetary policy meeting in 2023 today. A hawkish SARB is unlikely to lift the Rand, according to economists at Commerzbank.
The Rand is under pressure due to domestic risks
“Usually the Rand is able to benefit from a hawkish SARB, above all in a less risk-averse environment which entails reduced USD strength. However, the Rand is under pressure due to domestic risks, as the bumpy start into 2023 demonstrates, above all the governing ANC’s demands for an extended SARB mandate as well as the energy crisis caused by massive power outages.”
“The joint military exercises with the Chinese and Russian army planned for mid-February are also likely to cause exasperation amongst ZAR-investors.”
“Everything all told possible ZAR gains as the result of a surprisingly hawkish SARB are therefore likely to be limited.”
- AUD/USD retreats a few pips from a fresh multi-month top touched earlier this Thursday.
- A combination of factors helps revive the USD demand and exerts pressure on the major.
- The downside remains cushioned as traders keenly await the Advance US Q4 GDP print.
- US GDP Report Preview
The AUD/USD pair struggles to capitalize on its modest intraday gains and retreats a few pips from the highest level August 11 touched earlier this Thursday. Spot prices, however, manage to hold just above the 0.7100 mark through the first half of the European session and remain at the mercy of the US Dollar price dynamics.
In fact, the USD Index, which tracks the greenback against a basket of currencies, gains some positive traction and recovers from an eight-month low, which, in turn, caps the upside for the AUD/USD pair. A modest uptick in the US Treasury bond yields is seen lending some support to the greenback. Apart from this, a softer tone around the equity markets - amid worries about a deeper global economic downturn - benefits the safe-haven buck and acts as a headwind for the risk-sensitive Aussie.
The intraday USD uptick could also be attributed to some repositioning trade ahead of the Advance US Q4 GDP print, due for release later during the early North American session. That said, the prospects for a less aggressive policy tightening by the Fed should cap the buck. Furthermore, bets for an additional rate hike by the Reserve Bank of Australia (RBA) in February, bolstered by the stronger domestic CPI report on Wednesday, might continue to lend some support to the AUD/USD pair.
The aforementioned fundamental backdrop favours bullish traders and supports prospects for an extension of the recent move-up witnessed over the past month or so. Market participants, however, seem reluctant and prefer to wait on the sidelines ahead of Thursday's important US macro releases - Q4 GDP print, Durable Goods Orders and New Home Sales data. The focus will then shift to the US Core PCE Price Index on Friday, which will influence the Fed's interest rate strategy.
Technical levels to watch
USD/CNH is predicted to keep the trade within 6.7400-6.8000 in the next few weeks comment UOB Group’s Economist Lee Sue Ann and Markets Strategist Quek Ser Leang.
Key Quotes
24-hour view: “USD traded between 6.7574 and 6.7889 before closing at 6.7678 (-0.31%). The underlying tone has weakened somewhat and USD is likely to edge lower to 6.7550. The major support is at 6.7400 is unlikely to come under threat. Resistance is at 6.7780, followed by 6.7890.”
Next 1-3 weeks: “Our latest narrative was from 18 Jan (spot at 6.7755) where USD “has entered a consolidation phase and will likely trade between 6.7205 and 6.8550 for the time being”. Our view for consolidation is not wrong even though USD traded within a narrower range than expected. We continue to expect USD to consolidate but the decreased volatility suggests it is likely to trade within a narrower range of 6.7400/6.8000.”
EUR/USD is at the highs of the year above 1.09. But in the view of economists at ING, the pair is unlikely to trade above the 1.10 level.
EUR/USD will stay bid
“Investors may struggle to push EUR/USD through the 1.0950/1000 area ahead of next week's FOMC/ECB risk events – though it looks like EUR/USD will stay bid.”
“One note of caution to the EUR/USD really, however, is that the EUR/USD risk reversal – the price investors pay for a euro call over a similar euro put option – is no longer shifting away from euro puts and in favour of euro calls. Perhaps this is a function of where the EUR/USD spot is. Yet this could suggest that investors and corporates see 1.10 as the top of a multi-month trading range.”
- Gold price pulls away from a fresh multi-month top amid a modest US Dollar strength.
- Bets for smaller rate hikes by Federal Reserve, recession fears should help limit losses.
- Traders now look to the Advance GDP report from the United States for some impetus.
Gold price retreats from the vicinity of the $1,950 level or the highest level since April 2022 touched this Thursday and extends its descent through the first half of the European session. The XAU/USD drops to a fresh daily low, around the $1,935 area in the last hour, and for now, seems to have snapped a three-day winning streak.
Modest US Dollar strength weighs on Gold price
The US Dollar (USD) gains some positive traction and moves away from an eight-month low ahead of the preliminary fourth-quarter Gross Domestic Product (GDP) report from the United States (US). This turns out to be a key factor prompting traders to lighten their bullish bets around the US Dollar-denominated Gold price. The intraday USD uptick, however, is more likely to remain limited amid the prospects for a less aggressive policy tightening by the Federal Reserve (Fed).
Bets for smaller rate hikes by Federal Reserve to lend support
In fact, the markets seem convinced that the US central bank will soften its hawkish stance amid signs of easing inflationary pressures. Furthermore, the CME's FedWatch Tool points to over a 90% probability for a smaller 25 bps rate hike at the next Federal Open Market Committee (FOMC) meeting that concludes on February 1. This keeps a lid on the US Treasury bond yields, which, in turn, might hold back the USD bulls from placing fresh bets and lend support to Gold price.
Recession fears should limit losses for Gold price
Apart from this, the prevalent cautious mood might also contribute to limiting the downside for the safe-haven XAU/USD, for the time being. Concerns about a deeper global economic downturn continue to weigh on investors' sentiment, which is evident from a generally softer tone around the equity markets. Traders also seem reluctant and might prefer to wait on the sidelines ahead of Thursday's key US macro data - Q4 GDP print, Durable Goods Orders and New Home Sales data.
Focus remains on key macro data from United States
Market participants this week will also confront the release of the Personal Consumption Expenditures (PCE) Price Index - the Fed's preferred inflation gauge on Friday. The incoming data should play a key role in influencing the US central bank's interest rate strategy, which, in turn, will drive the USD demand and provide some meaningful impetus to Gold price. The focus, however, will remain glued to the outcome of a two-day FOMC meeting, scheduled to be announced next Wednesday.
Gold price technical outlook
From a technical perspective, the bias remains tilted in favour of bullish traders and any subsequent slide is more likely to find decent support near the $1,920 resistance breakpoint. This is followed by the $1,911-$1,910 support zone ahead of the $1,900 round figure. The latter should act as a pivotal point, which if broken decisively might shift the near-term bias in favour of bearish traders and pave the way for a deeper corrective pullback.
On the flip side, the multi-month peak, around the $1,949 area touched earlier this Thursday, now becomes an immediate hurdle, above which Gold price could climb to the $1,969-$1,970 region. The momentum could get extended further, allowing bulls to surpass an intermediate resistance near the $1,980 zone and reclaim the $2,000 psychological mark for the first time since March 2022.
Key levels to watch
GBP/USD may hold below 1.2447 for now still, but analysts at Credit Suisse look for an eventual break higher.
Break below the 1.1841 January low would mark a decisive reversal lower
“GBP/USD has retested and been capped at the 1.2445/47 highs of December. With the sell-off in the USD itself expected to stall for now as already, we see scope for further consolidation beneath here.”
“Big picture, we look for an eventual break above 1.2447 to target the May high and 61.8% retracement of the 2021/2022 fall at 1.2668/1.2758.”
“Support is seen at 1.2169 initially, then the 55-Day Moving Average, currently at 1.2094 which we look to try and hold.”
“Only below the 1.1841 January low would be seen to mark a decisive reversal lower and the completion of a bearish ‘double top’.”
- EUR/USD deflates a tad after hitting a new yearly high near 1.0930.
- Consumer Confidence in Italy disappointed expectations in January.
- US advanced Q4 GDP, Durable Goods Orders next of note in the NA session.
The European currency now gives aways some gains after motivating EUR/USD to climb to fresh 2023 peaks near 1.0930 earlier in the session on Thursday.
EUR/USD looks to US docket, risk trend
Despite the current knee-jerk, the yearly rally in EUR/USD remains well in place and looks to extend further the recent breakout of the 1.0900 barrier, always on the back of persistent cautiousness among investors ahead of the upcoming FOMC and ECB interest rate decisions.
Other than the intense weakness hurting the greenback, hawkish comments from ECB’s rate-setters and so far sustained improvement in some key fundamentals in the region have been also lending legs to the pair’s strong upside momentum.
In the domestic calendar, Consumer Confidence in Italy eased against consensus to 100.9 in January, while Business Confidence improved to 102.7 in the same period.
Across the pond, the flash Q4 GDP Growth Rate will take centre stage seconded by Durable Goods Orders, Initial Claims, New Home Sales, Trade Balance and the Chicago Fed National Activity Index.
What to look for around EUR
EUR/USD extends further the upside momentum and clinches fresh YTD tops near 1.0930 on Thursday.
In the meantime, price action around the European currency should continue to closely follow dollar dynamics, as well as the potential next steps from the ECB and the Federal Reserve at their upcoming gatherings in the next week.
Back to the euro area, recession concerns now appear to have dwindled, which at the same time remain an important driver sustaining the ongoing recovery in the single currency as well as the hawkish narrative from the ECB.
Key events in the euro area this week: Italy Consumer/Business Confidence (Thursday) – France Consumer Confidence, ECB Lagarde (Friday).
Eminent issues on the back boiler: Continuation of the ECB hiking cycle amidst dwindling bets for a recession in the region and still elevated inflation. Impact of the war in Ukraine and the protracted energy crisis on the bloc’s growth prospects and inflation outlook. Risks of inflation becoming entrenched.
EUR/USD levels to watch
So far, the pair is retreating 0.10% at 1.0901 and the breakdown of 1.0766 (weekly low January 17) would target 1.0589 (55-day SMA) en route to 1.0481 (monthly low January 6). On the other hand, the next up barrier is seen at 1.0929 (2023 high January 26) followed by 1.0936 (weekly high April 21 2022) and finally 1.1000 (round level).
Trade-weighted measures of the Dollar continue to edge lower. Dollar can stay offered, in the opinion of economists at ING.
FOMC meeting seen as an upside risk to the Dollar
“Notable yesterday was the dollar selling off after the Bank of Canada said it was ready to pause/end its tightening cycle. Some in the market could be thinking the Fed is of a similar mindset. At the margin that suggests the Dollar could go into next week's Fed meeting on the offered side.”
“We are not sure that DXY is ready to break below support at 101.30 just yet. And we see next week's FOMC meeting as an upside risk to the Dollar. But for the time being, expect DXY to stay offered in a 101.30-102.00 range.”
- USD/JPY reverses an intraday dip to a fresh weekly low, albeit lacks follow-through.
- A mildly positive tone undermines the safe-haven JPY and lends support to the pair.
- Bets for smaller Fed rate hikes keep the USD bulls on the defensive and cap gains.
- Traders also seem reluctant to place aggressive bets ahead of the US Q4 GDP print.
The USD/JPY pair finds some support near the 129.00 round-figure mark and recovers around 70-80 pips from the weekly low touched earlier this Thursday. Spot prices refreshe daily peak during the early part of the European session, albeit seem to struggle to capitalize on the move and remain below the 130.00 psychological mark.
A combination of factors undermines the Japanese Yen (JPY), which, in turn, offers some support to the USD/JPY pair. The Bank of Japan (BoJ), in its Summary of Opinions published this Thursday, said that it wants to maintain the current monetary policy settings, including the Yield Curve Control (YCC). This, along with a mildly positive tone around the equity markets, drives some flows away from the safe-haven JPY.
Meanwhile, fresh speculation that high inflation may invite a more hawkish stance from the BoJ later this year helps limit losses for the JPY. The US Dollar, on the other hand, languishes near an eight-month low amid the prospects for a less aggressive policy tightening by the Fed and rising bets for a smaller 25 bps rate hike in February. This, in turn, acts as a headwind for the USD/JPY pair and caps the upside.
Traders also seem reluctant and prefer to wait on the sidelines ahead of the Advance US Q4 GDP print, due later during the early North American session. Thursday's US economic docket also features Durable Goods Orders and New Home Sales data, which might influence the USD price dynamics. Apart from this, the broader market risk sentiment will be looked upon for short-term trading opportunities around the USD/JPY pair.
Technical levels to watch
Japanese Prime Minister (PM) Fumio Kishida reiterated in a statement on Thursday, “specific monetary policy tools are up to the BoJ (Bank of Japan) to decide.”
Additional quotes
“Expect BOJ to continue conducting appropriate policy in cooperation with the government.”
“No comment on whether to review joint statement between government and BoJ.”
Market reaction
USD/JPY is off the highs, currently trading at 129.77, up 0.15% on the day. Investors are resorting to repositioning ahead of the US GDP release.
EUR/USD benefited from the broad US Dollar weakness and climbed above 1.0900. For now, the lower end in EUR/USD remains unattractive, in the view of economists at Commerzbank.
USD outlook hangs by a thread
“As long as everything continues to point towards a recession, the market is unlikely to rethink its expectation of the Fed lowering interest rates again in the second half of the year, which constitutes the basis of the current Dollar weakness. For now, the lower end in EUR/USD remains unattractive.”
“It will simply still take a little while until it becomes clear whether the economy just about cools sufficiently to control the upside risks for inflation, as the Fed seems to expect, or strong enough for the Fed to have to consider renewed rate cuts to deliver on its target of full employment as the market is pricing in. That makes real economic data more significant; as a result, the USD outlook hangs by a thread.”
Further consolidation in USD/JPY, likely within the 128.00-130.80 range now appears likely in the near term, according to UOB Group’s Economist Lee Sue Ann and Markets Strategist Quek Ser Leang.
Key Quotes
24-hour view: “After rising to a high of 130.58, USD pulled back sharply and closed at 129.59 (-0.43%). The pullback has room to extend but is unlikely to break the support at 128.00 (there is another support at 128.50). Resistance is at 129.75, followed by 130.10.”
Next 1-3 weeks: “Sharp pullback in USD/JPY is likely to extend to the 55-week exponential moving average near 131.40. (dated 02 Dec 2022, 136.50).”
Germany's Economy Minister Robert Habeck said on Thursday that “the negative trend in inflation has been broken.”
Additional comments
“Inflation still higher at the beginning of 2023, further containment then in the course of the year.”
“Then in 2024 inflation will be lower than in 2023, with higher growth.”
Market reaction
EUR/USD is little changed on the above comments, keeping its range around 1.0915, modestly flat on the day.
Considering advanced figures from CME Group for natural gas futures markets, open interest went up for the second consecutive day on Wednesday, now by around 16.3K contracts. Volume followed suit and rose by around 2.7K contracts, partially reversing the previous daily drop.
Natural Gas targets $3.00 and below
Prices of natural gas dropped further on Wednesday and are expected to put the $3.00 mark per MMBtu to the test sooner rather than later. The uptick in open interest and volume is supportive of that view and exposes a drop to the March 2021 lows near $2.40.
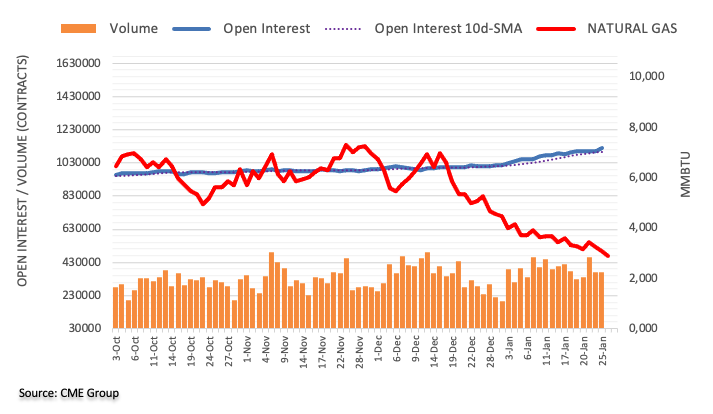
- NZD/USD regains some positive traction amid the prevalent USD selling bias.
- Bets for smaller rate hikes by the Fed continue to weigh on the greenback.
- Traders now look forward to the Advance US Q4 GDP print for some impetus.
The NZD/USD pair attracts some dip-buying in the vicinity of mid-0.6400s on Thursday and climbs to a fresh daily high during the early European session. The pair is currently placed just below the 0.6500 psychological mark, though the intraday uptick lacks bullish conviction.
The US Dollar remains depressed near an eight-month low amid firming expectations for a less aggressive policy tightening by the Fed, which, in turn, is seen lending support to the NZD/USD pair. In fact, the markets seem convinced that the US central bank will soften its hawkish stance and have been pricing in a greater chance of a smaller 25 bps rate hike in February. This, along with a generally positive tone around the equity markets, undermines the safe-haven greenback and benefits the risk-sensitive Kiwi.
The upside for the NZD/USD pair, however, seems limited amid speculations that the Reserve Bank of New Zealand (RBNZ) will slow the pace of its monetary tightening. In fact, investors trimmed their bets for jumbo rate hikes after data released on Wednesday showed that the annual inflation rate in New Zealand fell short of the RBNZ's 7.5% forecast and held steady at 7.2%. Traders also seem reluctant and prefer to move to wait for the Advance US Q4 GDP print, due later during the early North American session.
Thursday's US economic docket also features the release of Durable Goods Orders and New Home Sales data. Apart from this, the broader risk sentiment might influence the USD price dynamics. The focus will then shift to the US Core PCE Price Index on Friday. This will play a key role in influencing the Fed's rate-hike strategy and provide some meaningful impetus to the NZD/USD pair heading into next week's key central bank event risk - the highly-anticipated FOMC decision on Wednesday.
Technical levels to watch
In the opinion of UOB Group’s Economist Lee Sue Ann and Markets Strategist Quek Ser Leang, NZD/USD is expected to navigate between 0.6400 and 0.6535 range in the next few weeks.
Key Quotes
24-hour view: “NZD rose to a high of 0.6525 before easing off to close lower by 0.43% (0.6480). Upward pressure has eased and NZD appears to have entered a consolidation phase. In other words, NZD is likely to trade in a range today, expected to be between 0.6440 and 0.6510.”
Next 1-3 weeks: “We view the current movement in NZD as part of a consolidation phase and NZD is likely to trade between 0.6400 and 0.6535 for the time being.”
Sterling has been holding its own against the Euro and the Dollar. Economists at ING stick to their EUR/GBP and GBP/USD forecasts for the first quarter at 0.89 and 1.20, respectively.
Bumpy ride
“There is probably substantial short Sterling positioning on the crosses in expectation of the turn in the BoE cycle. This makes for a bumpy ride. But overall we are happy with our end 1Q23 forecast for EUR/GBP at 0.89, which will probably leave Cable trading towards the lower end of a 1.20-1.24 range.”
“Look out for UK January CBI retail sales figures today – likely to confirm a downtrend on the back of weak consumer confidence and squeezed real incomes. Cable to trade well within a 1.2350-1.2450 range.”
Open interest in crude oil futures markets increased for the fourth session in a row on Wednesday, this time by around 6.3K contracts according to preliminary readings from CME Group. On the other hand, volume shrank for the second straight session, now by around 51.8K contracts.
WTI looks consolidative around $80.00
Prices of the WTI charted an inconclusive session on Wednesday, closing with humble gains around the $80.00 mark per barrel. The move was amidst rising open interest and shrinking volume, which could lead to further consolidation in the very near term near the $80.00 region.
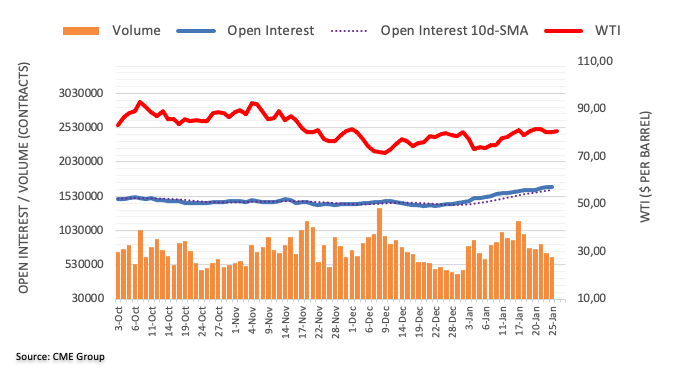
USD/CAD is moving up and down in a narrow channel at around 1.3390. Economists at TD Securities expect the pair to test the 1.3500/20 zone in the short-term.
CAD is likely to lag on most crosses
“Currently, the CAD is displaying a lot of sensitivity to data surprises, risk sentiment and broad USD dynamics. This is likely to persist for some time. We would pay particular attention to Jan/Feb data as that is likely to motivate asymmetries in curve pricing around the BoC later this year.”
“For now, we think CAD is likely to lag on most crosses.”
“With disappointing earnings guidance, there may be room for risk to extend lower. That leaves USD/CAD at risk of a test into 1.3500/25 near-term, where we see a lot of technical significance.”
Further upside could motivate GBP/USD to challenge the key barrier at 1.2500 in the short term suggest UOB Group’s Economist Lee Sue Ann and Markets Strategist Quek Ser Leang.
Key Quotes
24-hour view: “While GBP closed higher by 0.49% (NY close of 1.2401), upward momentum has not improved much. The bias is still on the upside but a sustained advance above 1.2445 is unlikely. On the downside, a breach of 1.2355 (minor support is at 1.2375) would indicate that the current mild upward pressure has eased.”
Next 1-3 weeks: “Our most recent narrative was from 18 Jan (spot at 1.2280) where we indicated that while upward momentum has not improved much, GBP is likely to edge higher to 1.2390. While GBP subsequently rose, upward momentum is still not strong. However, as long as 1.2300 (‘strong support’ level) is not breached, GBP is likely to edge above 1.2450. That said, it remains to be seen if GBP can break 1.2500. Overall, only a breach of 1.2300 would indicate that the current mild upward pressure has eased.”
The end of the Fed and ECB rate hike cycle is in sight. Economists at Commerzbank expect the Fed to switch to rate cuts soon thereafter, while the ECB will leave its interest rate level unchanged. This will benefit the Euro.
Lower EUR/USD levels are not to be expected again until 2024
“We expect first rate cuts for the Fed in H2/2023 (and more in 2024), but none for the ECB. This should weigh on the Dollar and boost EUR/USD.”
“Lower energy prices also argue for higher EUR/USD levels. On the one hand, the terms-of-trade effect no longer supports the Dollar. On the other hand, an energy crisis in Europe has probably been averted and the recession in the euro area is likely to turn out less severe than had been expected in the meantime. This, too, is supporting the Euro.”
“Lower EUR/USD levels are not to be expected again until 2024, when the recessions in Europe and the US are over, when it becomes clear that inflation will not return to anywhere near the central bank targets and when, accordingly, the central banks have to tighten their monetary policies again. Then the Fed, as a more aggressive central bank, should make the Dollar look more attractive again.”
- USD/CAD gains some positive traction for the second straight day, though lacks follow-through.
- The BoC’s pivot on Wednesday continues to undermine the Loonie and lends support to the pair.
- Bets for smaller Fed rate hikes keep the USD bulls on the defensive and might cap the upside.
- Investors might also prefer to move to the sidelines and wait for the release of the US Q4 GDP.
The USD/CAD pair attracts some buying for the second straight day on Thursday and sticks to its modest intraday gains through the early European session. Currently placed around the 1.3400 mark, the pair is now looking to build on the overnight bounce from the 1.3340 area, or a nearly two-week low.
The Canadian Dollar is undermined by the Bank of Canada's pivot on Wednesday, saying that it was time to pause the rate-hiking cycle, which, in turn, is seen lending support to the USD/CAD pair. Meanwhile, subdued action around crude oil prices fails to benefit the commodity-linked Loonie. That said, the underlying bearish sentiment surrounding the US Dollar could act as a headwind for the major, at least for the time being.
Firming expectations that the Federal Reserve will soften its hawkish stance keep the USD bulls on the defensive near an eight-month low. In fact, the CME's FedWatch Tool points to over a 90% probability for a smaller 25 bps rate hike at the next FOMC meeting that concludes on February 1. This will mark a further moderation in the pace of the rate-hike cycle, which is seen weighing on the US Treasury bond yields and the buck.
That said, concerns about a deeper global economic downturn help limit the downside for the safe-haven greenback. Traders also seem reluctant from placing directional bets and prefer to wait for the release of the Advance US Q4 GDP later during the early North American session. Thursday's US economic docket also features Durable Goods Orders and New Home Sales data, which might drive the USD and provide some impetus to the USD/CAD pair.
Traders this week will also confront the release of the US Core PCE Price Index on Friday, which will play a key role in influencing the Fed's rate strategy. The key focus, however, will remain glued to the outcome of a two-day FOMC monetary policy meeting, due to be announced next Wednesday.
Technical levels to watch
- The index drops to the 101.50 level, or new 8-month low.
- US yields attempt a tepid rebound on Thursday.
- Flash Q4 GDP, weekly Claims, Durable Goods Orders next on tap.
The greenback regains the 101.60/70 band after bottoming out in fresh 8-month lows around 101.50 when gauged by the USD Index (DXY) on Thursday.
USD Index now focuses on key data releases
The index appears to have regained downside traction and keeps well and sound the gradual multi-session decline well south of the 102.00 mark on Thursday.
The increasing pessimism around the dollar has been exacerbated by rising speculation of a potential pivot in the Fed’s policy, a view that has been openly confronted by the unabated hawkish narrative from Fed-speakers in past sessions.
So far, investors have already priced in a 25 bps rate hike at the FOMC event on February 1, although the attention is expected to be on Powell’s press conference afterwards, where the potential next steps of the Fed should take centre stage.
Busy day in the US calendar, as flash Q4 GDP figures are due seconded by Durable Goods Orders, the Chicago Fed National Activity Index, Initial Claims, Goods Trade Balance and New Home Sales.
What to look for around USD
The dollar’s price action remains depressed and drags the index to new 8-month lows in the mid-101.00s.
The idea of a probable pivot in the Fed’s policy continues to weigh on the greenback and keeps the price action around the DXY subdued. This view, however, also comes in contrast to the hawkish message from the latest FOMC Minutes and recent comments from rate setters, all pointing to the need to advance to a more restrictive stance and stay there for longer, at the time when rates are seen climbing above the 5.0% mark.
On the latter, the tight labour market and the resilience of the economy are also seen supportive of the firm message from the Federal Reserve and the continuation of its hiking cycle
Key events in the US this week: Durable Goods Orders, Advanced Q4 GDP Growth Rate, Chicago Fed National Activity Index, Initial Jobless Claims, New Home Sales (Thursday) – PCE, Core PCE, Personal Income, Personal Spending, Pending Home Sales, Final Michigan Consumer Sentiment (Friday).
Eminent issues on the back boiler: Rising conviction of a soft landing of the US economy. Prospects for extra rate hikes by the Federal Reserve vs. speculation of a recession in the next months. Fed’s pivot. Geopolitical effervescence vs. Russia and China. US-China trade conflict.
USD Index relevant levels
Now, the index retreats 0.01% at 101.63 and faces the next support at 101.50 (2023 low January 26) seconded by 101.29 (monthly low May 30 2022) and finally 100.00 (psychological level). On the upside, a breakout of the weekly high at 102.89 (January 18) would pave the way for a test of 105.63 (monthly high January 6) and then 106.46 (200-day SMA).
Gold price bulls take a breather just below $1,950 after the ongoing upsurge. XAU/USD eyes critical US events for the next move, FXStreet’s Dhwani Mehta reports.
United States Gross Domestic Product data to affect risk trends
“Should the key US US GDP disappoint, implying signs of slowing down in the American economy, the USD could stage a solid recovery. As a result, Gold could extend its corrective downside to test the wedge support at $1,937. Further south, Gold is expected to challenge the previous day’s low at $1,920, below which a test of the $1,900 mark will be inevitable. Gold sellers, however, need a daily closing below the lower boundary of the rising wedge formation, now at $1,933, to confirm a downside break.”
“If the US growth figures dismiss recession fears, which could fuel a risk rally on global markets and down the demand for the safe-haven USD. In such a scenario, Gold could see a fresh rally above the $1,950 psychological level. The next upside target for Gold bulls is envisioned around April 20 2022 highs near $1,958. A sustained move above the latter will bring the last April high of $1,998 back into the picture.”
See – US GDP Preview: Forecasts from ten major banks, firm growth
CME Group’s flash data for gold futures markets noted open interest resumed the uptrend and went up by around 11.7K contracts on Wednesday, reversing at the same time the previous drop. Volume, instead, left behind two consecutive daily builds and shrank by more than 13K contracts.
Gold already flirts with $1950
Prices of the ounce troy of gold rose for the third straight session on Wednesday and tested the $1950 region for the first time since late April 2022. The uptick was on the back of rising open interest and is supportive of the continuation of the rally in the very near term.
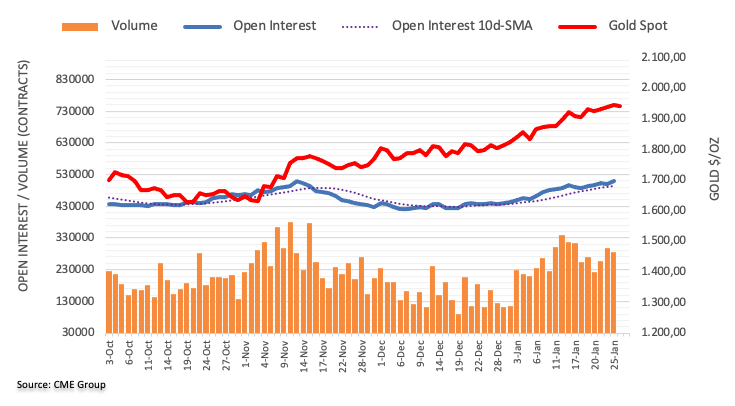
UOB Group’s Economist Lee Sue Ann and Markets Strategist Quek Ser Leang note EUR/USD could have embarked on a gradual move to the 1.1000 area.
Key Quotes
24-hour view: “EUR edged to a high of 1.0923 yesterday before closing at 1.0915 (+0.28%). Upward momentum has improved a tad and EUR is likely to continue to edge higher, possibly above 1.0950. The next resistance at 1.1000 is unlikely to come under threat today. Support is at 1.0900, followed by 1.0880."
Next 1-3 weeks: “While upward momentum has not improved much, EUR appears poised to head higher toward 1.1000. In view of the current lackluster momentum, any advance is likely to be slow and grinding. The current mild upward pressure is intact as long as EUR stays above 1.0840.”
- GBP/USD oscillates in a narrow trading band through the early European session on Thursday.
- Bets for smaller Fed rate hikes keep the USD bulls on the defensive and lend some support.
- Traders prefer to wait for the release of the Advance Q4 GDP before placing aggressive bets.
The GBP/USD pair struggles to capitalize on the previous day's positive move and oscillates in a narrow trading band through the early European session on Thursday. Spot prices, however, manage to hold above the 1.2400 mark and remain well within the striking distance of the highest level since June 2022 set earlier this week.
The underlying bearish sentiment surrounding the US Dollar turns out to be a key factor that continues to act as a tailwind for the GBP/USD pair. In fact, the USD Index, which tracks the greenback against a basket of currencies, languishes near an eight-month low amid firming expectations for a less aggressive policy tightening by the Fed. The markets now seem convinced that the US central bank will soften its hawkish stance and have been pricing in a smaller 25 bps rate hike in February. This keeps a lid on the recent move up in the US Treasury bond yields and is seen undermining the greenback.
The British Pound, on the other hand, draws support from speculations that elevated consumer inflation will maintain pressure on the Bank of England (BoE) to continue raising interest rates. This, in turn, favours the GBP/USD bulls and supports prospects for a further near-term appreciating move. Traders, however, seem reluctant and prefer to move to the sidelines ahead of the Advance US Q4 GDP print, due later during the early North American session. This will be followed by the release of the US Core PCE Price Index on Friday, which will play a key role in influencing the Fed's rate strategy.
The focus will then shift to next week's key central bank event risks - the outcome of a two-day FOMC policy meeting on Wednesday and the BoE decision on Thursday. This will help determine the next leg of a directional move for the GBP/USD pair. In the meantime, the USD price dynamics might provide some impetus in the absence of any relevant market-moving economic releases from the UK. Nevertheless, the fundamental backdrop seems tilted firmly in favour of bullish traders, suggesting that any meaningful pullback is more likely to get bought into and remain limited, at least for the time being.
Technical levels to watch
The US Bureau of Economic Analysis will release its first estimate of the fourth-quarter Gross Domestic Product (GDP) on Thursday, January 26 at 13:30 GMT as we get closer to the release time, here are forecasts from economists and researchers of ten major banks regarding the upcoming growth data.
Economists expect the United States to report an annualized growth rate of 2.8% in the last quarter of 2022, slower than the 3.2% clip recorded in the three months ending in September.
Danske Bank
“We look 2.8% QoQ AR in the Q4 22 GDP figures.”
ING
“The fourth quarter GDP report is expected to show that the economy expanded at a rate in excess of 2% annualised. Consumer spending should be an important driver given the strong performance in October, but aside from that, the growth will largely be focused on net trade and inventory building. This is not ‘good’ growth. Imports are falling because of the deteriorating domestic growth story while inventories are increasing, partly because of improved supply chains, but also because demand is not as strong as many businesses expected. The GDP growth figures over the next few quarters will be much weaker.”
TDS
“We look for GDP growth to have stayed strong in Q4, posting another above-trend gain (3.4%). Growth was likely supported by firm showings from the consumer and inventories.”
RBC Economics
“Q4 US GDP growth likely slowed in Q3 (we expect a 2.0% annualized increase) due to a wider net trade deficit and weak residential investment offsetting stronger consumer spending growth.”
SocGen
“Real GDP is likely to come to 2.6%. Many economists predict even faster growth. We expect real consumption of 2.6%, which serves as the base of our economic-wide prediction. Business investment grew faster, but a widening deficit should exert a drag. If we are correct, real GDP was 0.8% 4Q/4Q, which is faster than the FOMC projected just last December (+0.5% projected as part of the summary of economic projections) and much faster than the 0.2% growth projected by the FOMC last September.”
NBF
“Growth likely lost some momentum in the quarter, hampered by sinking residential investment and a sharp decline in real exports. Household spending, on the other hand, should have remained quite strong, lifting the headline growth figure. Positive contributions are also expected from non-residential investment, government spending and inventories. Our call is for a 2.0% annualized expansion.”
Deutsche Bank
“We'll see how growth was faring going into this year with Q4 US GDP on Thursday. Our economists expect +3.2% annualised (consensus +2.7%). Interestingly they expect +1.8% for Q1 with H2 being where the US recession hits. Consensus on Bloomberg is around 0% for Q1 so that's a potential battleground once actual hard data comes through.”
Citibank
“We expect a 2.5% annualized increase in real GDP by expenditure in Q4, another quarter of above-potential GDP growth despite much higher interest rates weighing on sectors like housing.”
CIBC
“Although momentum tailed off over the quarter, our forecast for an impressive 2.9% annualized advance in Q4 GDP is driven by a strong showing from consumers, reflecting expected increases in both goods and services consumption. We’re in line with the consensus forecast and market reaction should therefore be limited.”
Wells Fargo
“We estimate that real GDP rose 2.8% on a quarterly annualized basis during that period. While a mild recession beginning in Q3-2023 remains our base case forecast, economic growth appears to have ended 2022 on a positive note.”
- Silver takes offers to renew intraday low as US Dollar licks its wound ahead of the key data.
- Sluggish markets, China-inspired optimism put a floor under XAG/USD prices.
- Firmer prints of US Q4 GDP could renew hawkish Fed bets and extend latest pullback.
Silver price (XAG/USD) renews intraday low near $23.75 as it adds to the weekly gains ahead of Thursday’s European session. In doing so, the bright metal drops for the first time in three days as traders stay cautious ahead of the key US data comprising the first readings of the US fourth quarter (Q4) Gross Domestic Product (GDP).
It should be noted that the latest Reuters poll challenging the market optimism toward growth conditions seems to weigh on the XAG/USD price. “Global economic growth is forecast to barely clear 2% this year, according to a Reuters poll of economists who said the greater risk was a further downgrade to their view, at odds with widespread optimism in markets since the start of the year.
Additionally, the downbeat performance of US equities in the last few days and anxiety ahead of the top-tier data, as well as hopes of more rate hikes, also challenge the sentiment and please the Silver buyers.
Alternatively, the softer US Treasury yields and downbeat expectations from the scheduled US data keep the US Dollar on bear’s radar, which in turn put a floor under the Silver prices. It’s worth mentioning that the receding market bets on the Fed’s hawkish move and chatters surrounding the policy pivot also seem to favor the XAG/USD buyers.
On the same line could be optimism in Hong Kong as the nation’s equity benchmark Hang Seng leads the Asia-Pacific gainers with above 2.0% gains by the press time even if markets in Australia, India and China are closed. The reason for the upbeat sentiment could be linked to the market chatters suggesting strong holiday spending in China, the world’s biggest commodity user.
Looking forward, the US Q4 GDP is expected to ease and personal spending might also recede during the Q4, which in turn allows the Fed policymakers to go soft on their rate hike trajectory. The same could direct market players away from the US Dollar and may underpin the XAG/USD upside.
Technical analysis
Silver price takes a U-turn from the downward-sloping resistance line from January 16, close to $24.00 by the press time, as it drops back towards the 50-DMA support of $23.15.
- US GDP is forecast to grow at an annual rate of 2.6% in Q4.
- The US Dollar value will probably continue to be determined by risk perception.
- After data released by US Bureau of Economic Analysis, markets will pay close attention to Q4 earnings reports.
The Gross Domestic Product (GDP) report for the fourth quarter, as released by the Bureau of Economic Analysis (BEA) on January 26th, will show an expansion of the US economy at an annualized rate of 2.6%, as per market expectations, after the 3.2% expansion recorded in the third quarter's GDP report.
The US Dollar (USD) has been weakening against its major rivals following the Nonfarm Payrolls data for December and the GDP report could trigger the next directional move on the US Dollar.
US GDP forecast: Economic projections
Thursday's US economic docket highlights the release of the preliminary GDP print for the fourth quarter, scheduled at 13:30 GMT. The first estimate is expected to show that the world's largest economy expanded by 2.6% annualized pace during the October-December period.
Yohay Elam, FXStreet Senior Analyst believes US Gross Domestic Product data will come out better than expected: “Economists expect the first release of output figures for the latter quarter of 2022 to show an annualized expansion of 2.6%, slower than the 3.2% clip recorded in the three months ending in September. There are three reasons to expect a better outcome – Atlanta Federal Reserve estimates presenting a rosier picture, falling inflation and the Chinese re-opening effect.”
When is GDP print released and how can it affect EUR/USD?
The GDP report is scheduled for release at 13:30 GMT on Thursday. With the US Dollar plummeting to over a seven-month low in the wake of a dovish pivot by the Federal Reserve (Fed), the EUR/USD pair is supported and holding slightly above the 1.0900 psychological mark. Weaker US data details could trigger a fresh leg down in the USD and provide an additional boost to the major pair.
Ahead of the key release, the US Dollar comes under some renewed selling pressure amid retreating US Treasury bond yields and assists the EUR/USD pair to regain some positive traction on Thursday. That said, the uninspiring performance of the US equity futures lends some support to the safe-haven USD and keeps a lid on any meaningful upside for the major.
Meanwhile, the backwards-looking data might do little to influence market expectations about the Fed's next policy move or provide any meaningful impetus to the Greenback. That said, an upward surprise of the US GDP print could revive bets for a prolonged policy tightening by the Fed and prompt some near-term short-covering around the USD.
Conversely, a weaker-than-expected reading should be enough to reaffirm bets that the US central bank will pivot to somewhat a less hawkish stance. This could be enough to exert additional downward pressure on the US Dollar and allow the EUR/USD pair to push woard the 1.1000 level.
Eren Sengezer, Senior Analyst at FXStreet, draws this key targets for the EUR/USD bulls: "On the upside, 1.0930 (multi-month high set on January 23) aligns as interim resistance. Once EUR/USD rises above that level and starts using it as support, it could push higher to 1.0980 (former support, static level) and target the all-important 1.1000 psychological level."
Eren also outlines important levels to trade the EUR/USD pair on a bearish scenario: “The pair continues to trade within an ascending regression channel coming from early January. The bottom of that channel forms key support at 1.0880, which is also reinforced by the 20-period Simple Moving Average (SMA). If that support fails, the pair could extend its slide toward 1.0850 (50-period SMA) and 1.0800 psychological level.
Related content
- US Dollar Index licks its wounds near 102.00 as DXY traders brace for US GDP, Fed
- US Gross Domestic Product Preview: Three reasons to expect a US Dollar-boosting outcome
- EUR/USD Forecast: Euro bulls refuse to give up
About US Gross Domestic Product
The Gross Domestic Product Annualized, released by the US Bureau of Economic Analysis, shows the monetary value of all the goods, services and structures produced within the United States in a quarter. GDP Annualized is a gross measure of market activity because it indicates the pace at which a country's economy is growing or decreasing. Generally speaking, a high reading or a better than expected number is seen as positive for equities, while a low reading is negative.
Here is what you need to know on Thursday, January 26:
The US Dollar struggles to stay resilient against its rivals early Thursday with the US Dollar Index staying in negative territory below 102.00 following Wednesday's slide. The European economic docket will not feature any high-tier data releases and the risk perception is likely to drive the market action in the first half of the day. In the early American session, December Durable Goods Orders, weekly Initial Jobless Claims and December New Home Sales data from the US will be looked upon for fresh impetus. More importantly, the US Bureau of Economic Analysis will release its first estimate of the Gross Domestic Product (GDP) growth for the first quarter.
Market expectation points to an annualized economic expansion of 2.6% in the fourth quarter following the 3.2% growth recorded in the third quarter.
US Gross Domestic Product Preview: Three reasons to expect a US Dollar-boosting outcome.
On Wednesday, the Bank of Canada (BOC) announced that it hiked its policy rate by 25 basis points to 4.5% as expected. In its policy statement, the BOC noted that it is likely to hold the rate at this level while assessing the impact of cumulative rate hikes. Commenting on the policy outlook, "this is a conditional pause, dependent on the economy developing broadly in line with forecasts." BOC Governor Tiff Macklem explained. "If we need to do more to get inflation to the 2% target, we will; if upside risks materialise we are prepared to raise rates further." After climbing to a multiday high of 1.3430 with the initial reaction, USD/CAD lost its traction and closed the day slightly below 1.3400. At the time of press, the pair was moving up and down in a narrow channel at around 1.3390.
The BOC's 'conditional pause' in policy tightening forced the benchmark 10-year US Treasury bond yield to stay below 3.5% and didn't allow the US Dollar to gather strength against its major rivals. Meanwhile, Wall Street's main indexes closed the day little changed after having opened deep in the red. In the European morning, US stock index futures trade modestly higher on the day.
EUR/USD benefited from the broad US Dollar weakness and climbed above 1.0900 before going into a consolidation phase early Thursday. It's worth noting that the European Central Bank's (ECB) quiet period starts today and policymakers are unlikely to deliver any comments on the policy outlook ahead of next week's meeting.
GBP/USD snapped a two-day losing streak on Wednesday. The pair was last seen trading modestly higher on the day a few pips above 1.2400.
USD/JPY came under modest bearish pressure and declined below 130.00. The pair continues to edge lower toward 129.00 early Thursday. During the Asian trading hours, the Bank of Japan's (BOJ) Summary of Opinions revealed that policymakers agreed that the BOJ must keep yields from rising across the curve while being mindful of bond market function.
Gold price took advantage of falling US T-bond yields last Wednesday and registered gains for the third straight day. XAU/USD continued to push higher in the Asian session and came within a touching distance of $1,950 before retreating slightly.
Following Tuesday's downward correction, Bitcoin gathered bullish momentum and rose toward $24,000 on Wednesday before erasing a portion of its daily gains in the late American session. As of writing, BTC/USD was trading flat slightly above $23,000. Ethereum rose nearly 4% on Wednesday and retraced the majority of Tuesday's decline. ETH/USD was last seen moving sideways at around $1,600.
- GBP/JPY bounces off intraday low but stays negative on a day.
- BoJ Summary of Opinions suggest policymakers are divided considering higher inflation.
- UK Business Confidence gauge slumps to the lowest levels since 2009.
- Sluggish markets restrict immediate moves, Tokyo inflation eyed.
GBP/JPY picks up bids to extend the latest rebound from the intraday low past 160.00 heading into Thursday’s London open. Even so, the cross-currency pair remains bearish on a day around 160.45 at the latest.
The opening of the European and British markets seemed to have allowed the GBP/JPY pair traders to consolidate the daily losses amid sluggish market conditions ahead of the key US data concerning growth and spending.
Elsewhere, the Bank of Japan's (BoJ) Summary of Opinions underpins the bearish bias of the GBP/JPY pair as policymakers are divided over the exit of the ultra-easy monetary policy considering the increasing inflation. “The divergence in views highlights the challenge policymakers face in determining whether the recent cost-driven rise in inflation will shift to one backed by robust demand and higher wages - a prerequisite for raising ultra-low interest rates,” said Reuters.
On the other hand, fears of economic slowdown in the UK escalate amid downbeat prints of the British business sentiment index shared by Bloomberg. The Institute of Chartered Accountants in England and Wales said Thursday that its latest monitor of business sentiment dropped to an index reading of -23.4, the weakest since 2009. The last survey, published in November, stood at -16.9. Bloomberg also mentioned that the Federation of Small Businesses’ confidence index dropped to -46 points in the final quarter of 2022 from -36 in the third quarter. With this, the sentiment gauge dropped to the lowest level since 2014.
It should be noted that the anxiety ahead of the next week’s bumper calendar comprising multiple key central bank meetings and Friday’s Tokyo Consumer Price Index (CPI) for January, expected 4.4% versus 4.0% prior, also weigh on the GBP/JPY prices. Furthermore, the downbeat performance of the Treasury bond yields adds to the bearish catalysts’ list for the quote.
Technical analysis
Although a two-week-old support line puts a floor under the GBP/JPY prices near 160.00, the recovery remains elusive unless the quote provides a daily closing beyond the 200-Exponential Moving Average (EMA), around 162.20 by the press time.
- Gold price is struggling to test the $1,950.00 resistance as anxiety soars ahead of the US GDP.
- The USD Index is building a cushion around 101.10 but could deliver a breakdown amid a risk-on mood.
- Rising odds of a smaller interest rate hike by the Fed are weighing down US yields.
Gold price (XAU/USD) has sensed selling pressure while attempting to kiss the critical resistance of $1,950.00. The precious metal is not getting the desired strength required to hit the $1,950.00 hurdle as investors are getting anxious ahead of the release of the United States Gross Domestic Product (GDP) and other critical economic data.
The US Dollar Index (DXY) is constantly grueling to build a cushion around 101.20 despite the upbeat market mood. S&P500 futures are displaying moderate gains, conveying the expression of the solid risk appetite of the market participants. The 10-year US Treasury yields have dropped to near 3.44%.
The street is continuously discussing the chances of a US recession in CY2023 as the Federal Reserve (Fed) has already tightened monetary policy significantly. The release of the US GDP data will provide more clarity about the scales of economic activities in the fourth quarter of CY2022. As per the projections, the US GDP is expected to contract to 2.6% from the former release of 3.2%. More-than-expected contraction in economic activities might bolster the case of a smaller interest rate hike by the Fed.
Gold technical analysis
Gold price is forming a Bullish Flag chart pattern on an hourly scale, which indicates a continuation of the bullish momentum after the breakout of a consolidation. Usually, the consolidation phase of the chart pattern serves as an inventory adjustment in which those participants initiate longs, which prefer to enter an auction after the establishment of a bullish bias.
Advancing 20-and 50-period Exponential Moving Averages (EMAs) at $1,942.46 and $1,937.35 respectively add to the upside filters.
The Relative Strength Index (RSI) (14) is oscillating in a bullish range of 60.00-80.00, which indicates more upside ahead.
Gold hourly chart
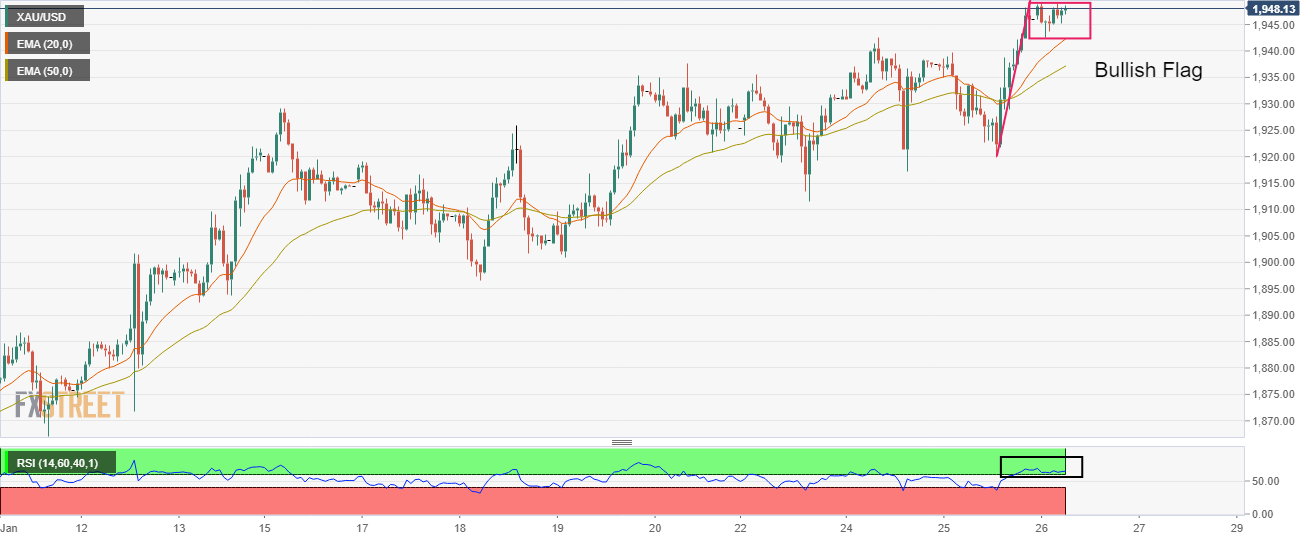
FX option expiries for Jan 26 NY cut at 10:00 Eastern Time, via DTCC, can be found below.
- USD/JPY: USD amounts
- 130.00 575m
- USD/CHF: USD amounts
- 0.9795 590m
- WTI braces for first weekly loss in three on breaking 50-SMA, fortnight-long trend line.
- U-turn from two-month-old resistance, bearish MACD signals also keeps sellers hopeful.
- Ascending trend line from early January challenges immediate downside.
WTI crude oil remains on the back foot as it braces for the first weekly loss, after a fortnight of an uptrend, amid early Thursday in Europe.
The black gold’s latest weakness could be linked to its failure to cross the horizontal resistance area comprising multiple hurdles marked since early December 2022. Also, a clear downside break of the two-week-old ascending trend line and the 50-SMA joins the bearish MACD signals to bolster the downside bias.
However, an upward-sloping support line from January 06, close to $79.80 by the press time, restricts the nearby downside of the black gold.
Following that, the previous weekly low near $78.50 could act as an additional downside filter, a break of which may recall the Oil bears targeting the $70.00 round figure. During the fall, the monthly low and December’s bottom could probe the sellers around $72.60 and $70.25 in that order.
Alternatively, 50-SMA restricts WTI’s immediate upside near $80.70 ahead of the support-turned-resistance line from mid-January, close to $81.70 at the latest.
It’s worth noting, however, that the WTI bulls need to offer a successful break of the two-month-old horizontal hurdle surrounding $82.80, to retake control.
WTI: Four-hour chart
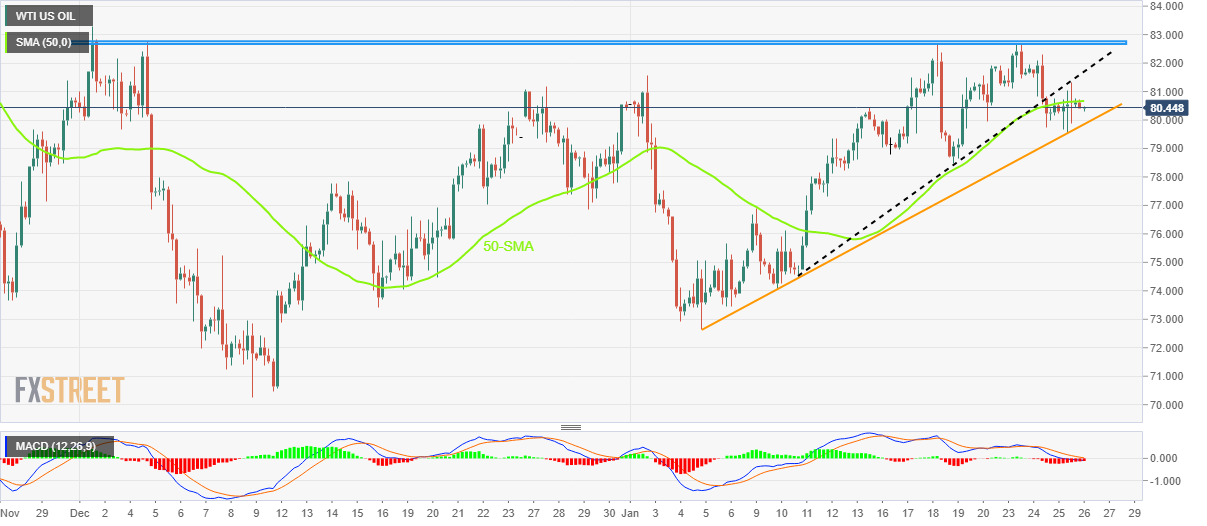
Trend: Further downside expected
- NZD/USD is displaying back-and-forth action ahead of US GDP data.
- The USD Index is aiming to build a cushion around 101.20 despite the risk-on market mood.
- The Ascending Triangle formation is indicating a squeeze in volatility.
The NZD/USD pair is continuously facing hurdles in recapturing the psychological resistance of 0.6500 in the early European session. The Kiwi asset is expected to remain on the tenterhooks as investors are awaiting the release of the United States Gross Domestic Product (GDP) data.
The US Dollar Index (DXY) is aiming to build a cushion around 101.20 as anxiety among investors is escalating regarding the US GDP, core Personal Consumption Expenditure (PCE), and Durable Goods Orders data. Meanwhile, positive market sentiment is solidifying further as the S&P500 futures have extended their morning gains.
NZD/USD is displaying topsy-turvy action in an Ascending Triangle chart pattern that indicates volatility contraction on an hourly chart. The New Zealand Dollar has sensed demand after dropping to near the upward-sloping trendline plotted from January 19 low at 0.6365 while the horizontal resistance is placed from January 18 high at 0.6531.
The 20-EMA at 0.6483 is overlapping the Kiwi asset, which indicates consolidation ahead.
Also, the Relative Strength Index (RSI) (14) is oscillating in a 40.00-60.00 range, which indicates an absence of a potential trigger for a decisive move.
For an upside move, the asset needs to surpass Wednesday’s high at 0.6530, which will drive the asset toward June 3 high at 0.6576. A breach of the latter will expose the asset to the round-level resistance at 0.6600.
On the flip side, a breakdown below January 16 high at 0.6426 will drag the Kiwi asset toward January 17 low at 0.6366 followed by January 12 low around 0.6300.
NZD/USD hourly chart
-638103080999352405.png)
- AUD/USD seesaws around five-month high, up for the fifth consecutive day.
- Hong Kong’s upbeat return after five-day holidays, Tesla earnings underpin favor firmer sentiment.
- Strong Aussie inflation renewed talks of RBA’s 0.25% rate hike versus previous chatters of policy pivot.
- US Q4 GDP, PCE Price data will be crucial for clear directions ahead of next week’s FOMC.
AUD/USD clings to mild gains above 0.7100 as bulls take a breather after refreshing the five-month high during early Thursday in Europe.
That said, the Aussie pair traders cheer Hong Kong’s resumption of trading after five days, as well as hawkish hopes of the Reserve Bank of Australia (RBA) after the previous day’s strong Aussie inflation data. However, a cautious mood ahead of the first readings of the US fourth quarter (Q4) Gross Domestic Product (GDP) seems to challenge the quote’s upside. Additionally probing the AUD/USD buyers is the Australia Day holiday.
Hong Kong’s equity benchmark Hang Seng leads the Asia-Pacific gainers with above 2.0% gains by the press time even if markets in Australia, India and China are closed. The reason for the upbeat sentiment could be linked to the market chatters suggesting strong holiday spending in China.
Elsewhere, the reversal in the previous talks of the RBA’s policy pivot, especially after the upbeat Aussie Q4 and monthly Consumer Price Index (CPI) data, also underpins the AUD/USD pair’s upside moves. As per the latest market chatters, the odds favoring the RBA’s 0.25% hike are back on the table after a brief absence.
It should be noted that the upbeat performance of Tesla jostles with Microsoft’s risk-negative headlines to offer a mixed move to the S&P 500 Futures and challenge the risk-barometer AUD/USD pair. However, the downbeat US Treasury bond yields and the broad US dollar weakness ahead of the key data keep the buyers hopeful.
Looking forward, the US Q4 GDP and Personal Consumption Expenditure (PCE) Price data will be important for the immediate direction. Also crucial will be the US Durable Goods Orders and trade data for December. That said, the downbeat expectations from the scheduled US data keep the pair buyers in the driver’s seat but a positive surprise could trigger a notable reaction ahead of the next week’s Federal Open Market Committee (FOMC) meeting.
Also read: US Gross Domestic Product Preview: Three reasons to expect a US Dollar-boosting outcome
Technical analysis
Higher highs on RSI (14) contrast with the lower high on AUD/USD prices and challenge the current bullish trend. As a result, multiple highs marked since June 2022, near 0.7140 will be the key to watch.
Also read: AUD/USD Price Analysis: Steadies around 0.7100 amid hidden bearish RSI divergence
Goldman Sachs Chief Economist Jan Hatzius said in a latest note on Thursday, “we don’t expect a recession”, citing “a 35% chance of a recession.”
Additional quotes
“Our baseline is a soft-landing.”
“Do not see the economy losing jobs on a monthly basis at all this year.”
“Monthly payroll growth could slip below 100,000.”
“Expect inflation to 2% to 3% range by late this year or 2024.”
“I think inflation has pretty clearly peaked.”
“If there were any doubt about the US government’s ability or willingness to make interest and principal payments on time, that could have very, very adverse consequences.”
“That is the worry: That you get turmoil in financial markets, a big tightening in financial conditions and that adds to downward pressure on economic activity.”
“That is certainly the worry. It’s not our expectation. ... We think ultimately a solution will be found.”
“These solutions are often found at the very last moment.”
- EUR/USD is witnessing a volatility contraction as investors await US GDP for fresh cues.
- The odds of a smaller interest rate hike by the Federal Reserve might get strengthened on a downbeat US GDP.
- European Central Bank is needed to continue hiking interest rates to tackle wage growth.
- EUR/USD is expected to shift into a new territory above 1.0930 amid favoring technical indicators.
EUR/USD is showing signs of volatility contraction after attaining stability above the critical resistance of 1.0900 in the early European session. The major currency pair is expected to extend its upside journey above a nine-month high at 1.0926 as the US Dollar Index (DXY) is demonstrating a subdued performance ahead of the release of the United States Gross Domestic Product (GDP) data.
The USD Index is struggling to sustain above the immediate cushion of 101.20. A breakdown of the same will result in a fresh downside in the asset. The expression of a decent downtrend in the United States Consumer Price Index (CPI) for the past few months has weakened the US Dollar dramatically. Analysts at Wells Fargo warned that the greenback has already embarked on a prolonged period of depreciation that could last into 2024. They further added that relative economic growth performance and monetary policy outlook have turned less supportive of the US dollar.
S&P500 futures are holding their morning gains, portraying a risk-on market mood. The 500-US stock basket is fighting with full efforts against uncertainty about the release of corporate earnings. Meanwhile, the improved risk appetite of the market participants is weighing on the yields generated by the US government bonds. The 10-year US Treasury yields have dropped below 3.44%.
Rising bets for smaller Fed’s rate hike weigh on US yields
A decline in retail demand, squeezing demand for fresh talent, and lower power in favor of producers for the pricing of goods and services have bolstered the expectations of a further decline in inflation projections. The context is to support the Federal Reserve to decelerate the pace of hiking interest rates. The odds for a smaller interest rate hike by the Federal Reserve are soaring. As per the CME FedWatch tool, the chances of a 25 basis point (bps) interest rate hike by the Federal Reserve have soared more than 97%.
US recession fears might trigger if GDP contracts
Investors are aware of the fact that extreme policy tightening measures taken by Federal Reserve chair Jerome Powell and his teammates have restricted firms to bank upon borrowings. Rising interest obligations have resulted in lower operating margins for firms. Also, weaker demand projections have forced the firms to avoid operating at full capacity. Investors will get more clarity about the scale of economic activities after the release of the US GDP data. Considering the fact that Fed chair Jerome Powell has tightened the monetary policy on an extreme note in CY2022, the street is expecting a contraction in the scale of economic activities. As per the projections, the economic data is seen at 2.6% lower than the former release of 3.2%. The release of the lower-than-anticipated GDP numbers for the fourth quarter of CY2022 will escalate recession fears.
Apart from that, the catalyst that will impact the US Dollar Index (DXY) is the preliminary Core Personal Consumption Expenditure (PCE) for the fourth quarter of CY2022. The economic data is expected to escalate to 5.3% from the prior release of 4.7%. Also, the Durable Goods Orders data will be keenly watched, which is seen at 2.5% vs. -2.1% in the prior release.
Bets accelerate for hawkish ECB policy
There is no denying the fact that inflationary pressures are softening in Eurozone as supply chain bottlenecks are easing. However, the economy is still facing wage growth as a roadblock in their agenda of achieving price stability. The European Central Bank (ECB) has already pushed its interest rates to 2.5% to tame stubborn inflation. But European Central Bank policymakers are still not satisfied with the scale of the interest rate and are reiterating more interest rate hikes ahead.
ECB Governing Council member Gabriel Makhlouf said on Wednesday "We need to continue to increase rates at our meeting next week – by taking a similar step to our December decisions," as reported by Reuters. He further added that they need to increase rates again at the March meeting.
EUR/USD technical outlook
-638103056329101523.png)
EUR/USD is auctioning in a Rectangle formation on a four-hour scale, which indicates a sheer contraction in volatility. The major currency pair might display wider ticks and heavy volume after the explosion of the squeezed volatility. The 20-period Exponential Moving Average (EMA) at 1.0887 is constantly providing support to the Euro. Also, advancing 50-EMA at 1.0850 adds to the upside filters.
Upside momentum is still active as the Relative Strength Index (RSI) (14) has not surrendered oscillation in the bullish range of 60.00-80.00.
- GBP/USD portrays a bullish chart pattern amid sluggish markets ahead of top-tier US data.
- Sustained break of 1.2410 confirms bullish pennant suggesting further upside toward 1.2550.
- May 2022 peak appears a tough nut to crack for Cable buyers.
- 200-SMA, weekly resistance-turned-support highlights 1.2365 as short-term key support.
GBP/USD buyers struggle to extend the previous day’s gains around 1.2400 heading into Thursday’s London open. Even so, the quote portrays a bullish chart pattern, namely pennant, as it awaits fresh signals to keep the four-week uptrend intact.
That said, the Cable pair’s latest inaction could be linked to the market’s cautious mood ahead of the first readings of the US fourth quarter (Q4) Gross Domestic Product (GDP), expected to print annualized growth of 2.6% versus 3.2% prior. Also important to watch will be the US Durable Goods Orders for December and the Q4 Personal Consumption Expenditure (PCE) data.
Also read: US Gross Domestic Product Preview: Three reasons to expect a US Dollar-boosting outcome
It should be noted that the steady RSI (14) and the receding bearish bias of the MACD add strength to the optimism surrounding the GBP/USD price upside. Additionally keeping the pair buyers hopeful is the successful upside break of the weekly resistance line, now support, as well as the 200-Simple Moving Average (SMA).
However, a clear upside break of the 1.2410 hurdle becomes necessary for the GBP/USD bulls to keep the reins. Following that, the theoretical target surrounding 1.2550 could lure the Cable buyers. Though, the May 2022 high near 1.2665 could challenge the quote’s further upside.
On the contrary, pullback moves remain elusive until the Cable remains above the stated pennant’s lower line, close to 1.2390 by the press time.
Even if the GBP/USD price breaks the 1.2390 support, the previous resistance line and 200-SMA could challenge the bears around 1.2360.
GBP/USD: 30-minute chart
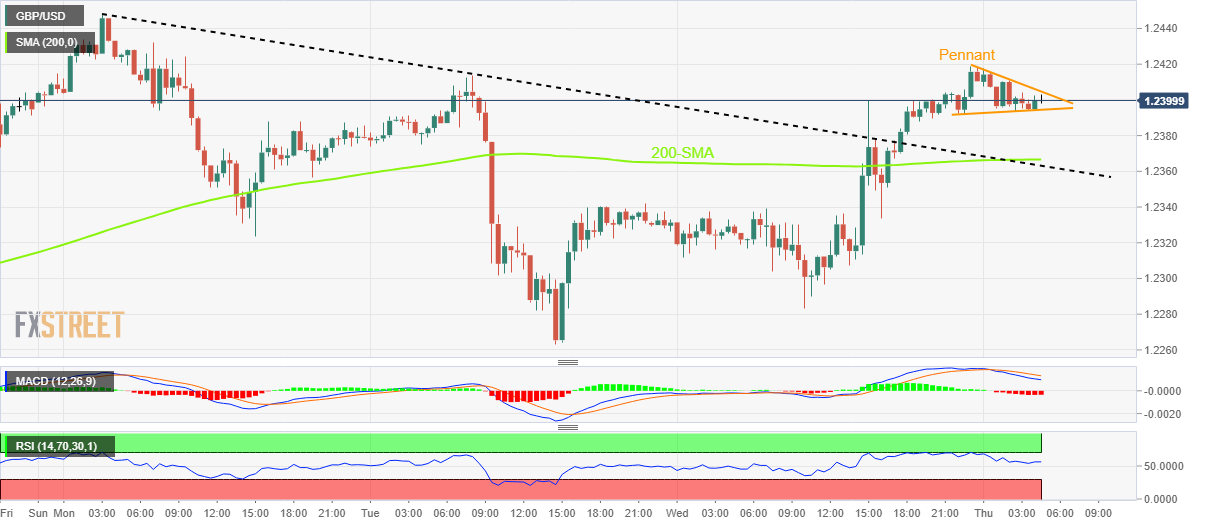
Trend: Further upside expected
- USD/INR pares recent losses amid holiday in India, cautious mood ahead of key US data.
- Mixed sentiment restricts market moves as traders await US Q4 GDP, PCE Price data.
- Odds favoring higher foreign fund inflow and softer Oil price favor INR buyers.
- Concerns surrounding Fed’s pivot keep US Dollar on a dicey floor.
USD/INR retreats to 81.45 while paring the intraday gains during early Thursday. The Indian Rupee (INR) pair initially reacted to the US Dollar’s corrective bounce ahead of the key data but price-positive signals for the INR joined Indian holidays to recall the bears.
That said, the US Dollar Index (DXY) bears take a breather around an eight-month low as traders await the first readings of the US fourth quarter (Q4) Gross Domestic Product (GDP), expected to print annualized growth of 2.6% versus 3.2% prior. Also important are the US Durable Goods Orders for December and the Q4 Personal Consumption Expenditure (PCE) Price data.
It’s worth noting that the downbeat US Treasury yields and hawkish bets on the European Central Bank (ECB), versus the recently increasing odds favoring the Fed’s policy pivot, seem to exert downside pressure on the DXY. “Traders broadly expect the Fed to increase rates by 25 basis points (bps) next Wednesday, a step down from a 50 bps increase in December,” said Reuters.
Elsewhere, the expected jump in the Indian foreign fund inflow due to the Adani Enterprise offerings joins the recently easing WTI crude oil prices to weigh on the USD/INR prices. That said, the WTI crude oil drops nearly half a percent to $80.30 by the press time.
On the other hand, the hopes of more public sector demands and importers’ moves, as well as the Reserve Bank of India’s (RBI) actions, could weigh on the INR.
Given the Republic Day holiday in India, USD/INR is likely to witness a more sluggish day ahead, in addition to the pre-data anxiety. That said, the downbeat expectations from the scheduled US data keep the pair sellers hopeful but a positive surprise could trigger a notable reaction ahead of the next week’s Federal Open Market Committee (FOMC) meeting.
Also read: US Gross Domestic Product Preview: Three reasons to expect a US Dollar-boosting outcome
Technical analysis
A two-week-old bearish channel restricts USD/INR moves between 80.80 and 81.75 at the latest.
Japan’s top currency diplomat Masato Kanda warned on Thursday, sharp one-sided currency moves cannot be tolerated.
Key comments
"Sharp, one-sided moves as seen last year are not desirable or cannot be tolerated from the viewpoints of the people's livelihood and corporate activity.”
"There's no change to this thinking from now on as well," when asked whether sharp yen rises warrant action.
"Generally speaking, the BoJ targets price stability, while we aim for currency stability.”
"We are communicating firmly with the BoJ as well as other central banks. But policy itself is independent.”
Market reaction
The Japanese yen is finding some support from the above comments, with USD/JPY reversing toward 129.00 again. The pair is losing 0.31% on the day to trade at 129.18, as of writing.
- Asian stocks are expected to remain cautionary as global growth has encountered a downward revision.
- Global markets are likely to remain on tenterhooks ahead of the US GDP release.
- Oil price has dropped below $80.50 as the US recession fears are still solid.
Markets in the Asian domain are showing signs of caution amid the release of corporate earnings worldwide and ahead of the United States Gross Domestic Product (GDP) data. The US Dollar Index (DXY) is gauging a cushion around seven-month low at 101.10, however, the downside bias is extremely solid. S&P500 futures are displaying modest gains recorded in early Asia after settling Wednesday’s trading session on a flat note. The risk profile is positive, however, anxiety among investors will remain high ahead of the US GDP and other economic data.
At the press time, Japan’s Nikkei225 eased 0.20%, KOSPI gained 0.70%, Hang Seng soared 1.75%, Chinese markets are closed on account of the Lunar New Year while Indian markets are closed due to Republic Day.
A poll conducted by Reuters on global growth indicates that the global economy will grow by 2.1% in 2023; 2.8% in 2024 vs. 2.3% and 3.0%, respectively, in an October poll. Reuters stated that 'Falling energy prices, a slowdown in inflation in most economies from multi-decade highs, an unexpectedly resilient euro zone economy and China's economic reopening have led traders to speculate the downturn will be milder.''
Japanese equities are facing caution despite the Bank of Japan (BoJ) Governor Haruhiko Kuroda favored of a continuation of expansionary monetary policy. BoJ Kuroda has confirmed that the central bank “will resolutely keep the monetary environment easy.” He added that “the BoJ aims to regain market functionality by tweaking yield curve control operations while maintaining an easy monetary environment.
On the oil front, oil prices have surrendered the $80.50 support as the US recession is still in the picture despite rising bets for a smaller interest rate hike by the Federal Reserve (Fed). The Fed could not achieve price stability without entering into recession as retail demand needed to get squeezed and producers would be needed to drop output prices to maintain the harmony.
- USD/CAD is aiming to shift its auction above 1.3400 as the BoC has reached the terminal rate for now.
- The rising probability of a smaller interest rate hike by the Fed is weighing on US yields.
- Oil price is losing foot above $80.50 as oil demand sees short-term pain due to China’s Lunar New Year holidays.
The USD/CAD pair has corrected marginally after a recovery move from 1.3380 in the Asian session. The Loonie asset is looking to shift its business above 1.3400 despite a recovery attempt from the US Dollar Index (DXY). The recovery attempt in the USD Index seems less confident amid the risk-on market mood.
S&P500 futures are showing marginal gains in early Asia after settling almost flat on Wednesday. The 500-stock basket has turned volatile as corporate are demonstrating their quarterly performance through earnings displays. The USD Index is putting efforts in building a cushion around a seven-month low at 101.10 ahead of the United States Gross Domestic Product (GDP) (Q4) and other economic data, which will release on Thursday.
The rising probability of a smaller interest rate hike by the Federal Reserve (Fed) for its February meeting is weighing on the US Treasury yields. The alpha generated by the 10-year US Treasury bonds has dropped to 3.44%.
The street is expecting a contraction in the scale of economic activities in the fourth quarter to 2.6% from the former release of 3.2% as Fed chair Jerome Powell has burnt their hands by triggering recession fears in his fight against stubborn inflation. The release of the Durable Goods Orders (Dec) will provide cues about the forward demand, which is expected to jump to 2.5% vs. the prior release of -2.1%.
Meanwhile, the Canadian Dollar is expected to face the heat as Bank of Canada (BoC) Governor Tiff Macklem has paused further policy tightening after pushing the interest rates by 25 basis points (bps) to 4.5%. The BoC will keep interest rates steady at 4.5% for the rest of the year and will assess the impact of yet terminal rate ahead.
On the oil front, oil price is struggling to sustain above 80.50 as celebrations in China due to the Lunar New Year festival has resulted in a pause in economic activities and henceforth a short-term pain in the oil demand. It is worth noting that Canada is a leading exporter of oil to the United States and lower oil prices might impact the Canadian Dollar.
- Gold buyers struggle around multi-month high, snaps three-day uptrend, but stays comfortable beyond $1,920 support confluence.
- Pre-data anxiety joins fading hawkish bias on Fed to probe XAU/USD bulls.
- Firmer prints of US Q4 GDP, Core PCE could renew bullish bets on FOMC and extend latest pullback.
Gold price (XAU/USD) retreats from a nine-month high as bulls await the key US data/events for further directions while aiming for the fresh multi-month peak surrounding the mid-$1,900s. In addition to the cautious mood ahead of the key US growth and inflation data, a light calendar and contrasting plays between the Federal Reserve (Fed) and the European Central Bank (ECB) officials also seem to weigh on the Gold price of late.
That said, holidays in China and Fed’s blackout join the ECB’s one-week silence period starting from Thursday to restrict immediate XAU/USD moves.
Also read: Gold Price Forecast: XAU/USD bulls approach $1,967 ahead of United States Gross Domestic Product
Gold Price: Key levels to watch
The Technical Confluence Detector shows that the Gold price grinds higher past the $1,920 support confluence including the previous lows on one-day and one-week.
Also putting floor under the Gold price could be the convergence of Fibonacci 38.2% on one-week, 200-Hourly Moving Average (HMA) and the 10-DMA, close to $1,917.
It’s worth noting that Fibonacci 38.2% on one-day and previous weekly top offers immediate support to the Gold price near $1,940. Additionally, a joint of the 5-DMA and 10-SMA on four-hour could test the XAU/USD bears around $1,935.
Meanwhile, previous daily high and four-hour peak probes Gold buyers near $1,950.
However, major attention is given to the $1,963-66 area comprising Pivot Point one-wee R2 and tops marked during late March 2022.
Should the Gold buyers keep the reins past $1,966, the odds of witnessing the $2,000 on the chart can’t be ruled out.
Here is how it looks on the tool
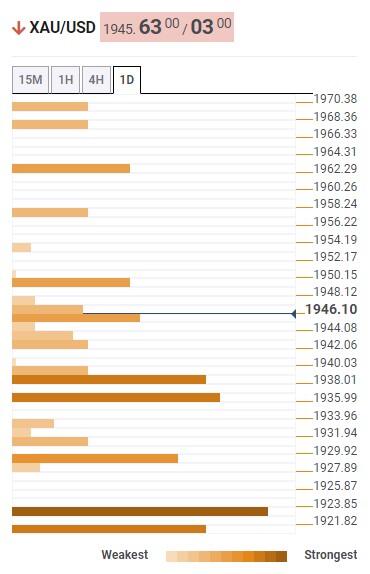
About Technical Confluences Detector
The TCD (Technical Confluences Detector) is a tool to locate and point out those price levels where there is a congestion of indicators, moving averages, Fibonacci levels, Pivot Points, etc. If you are a short-term trader, you will find entry points for counter-trend strategies and hunt a few points at a time. If you are a medium-to-long-term trader, this tool will allow you to know in advance the price levels where a medium-to-long-term trend may stop and rest, where to unwind positions, or where to increase your position size.
- USD/JPY holds lower ground as bears keep the reins for the third consecutive day.
- One-week-old symmetrical triangle restricts immediate moves.
- Downbeat RSI, bearish MACD signals favor sellers to refresh multi-month low.
- Buyers need validation from six-week-old descending trend line to retake control.
USD/JPY licks its wounds around 129.40 as it seesaws near an intraday low during early Thursday. In doing so, the Yen pair consolidates the latest losses as a two-day losing streak.
Even so, the quote prints mild losses while staying inside a one-week-old symmetrical triangle, between 128.50 and 131.00 by the press time.
That said, the bearish MACD signals join the downward-sloping RSI (14) line to keep USD/JPY sellers hopeful. Also challenging the Yen pair buyers could be a descending resistance line from mid-December 2022, close to 131.80.
It should be noted that the 50% Fibonacci retracement level of the pair’s December 15 to January 16 downtrend, near 132.70, precedes the one-month-long horizontal resistance area around 134.50-75 to challenge the pair’s further upside.
On the flip side, a clear break of the stated triangle’s support, close to 128.50, becomes necessary for the USD/JPY seller’s conviction.
Following that, the monthly low surrounding 127.20, also the lowest level in eight months, could probe the Yen pair bears before directing them to the 61.8% Fibonacci Expansion (FE) of the quote’s moves between December 20 and January 18, around 125.20.
Overall, USD/JPY is funneling down towards a breakout point and hints at volatility expansion moving forward.
USD/JPY: Four-hour chart
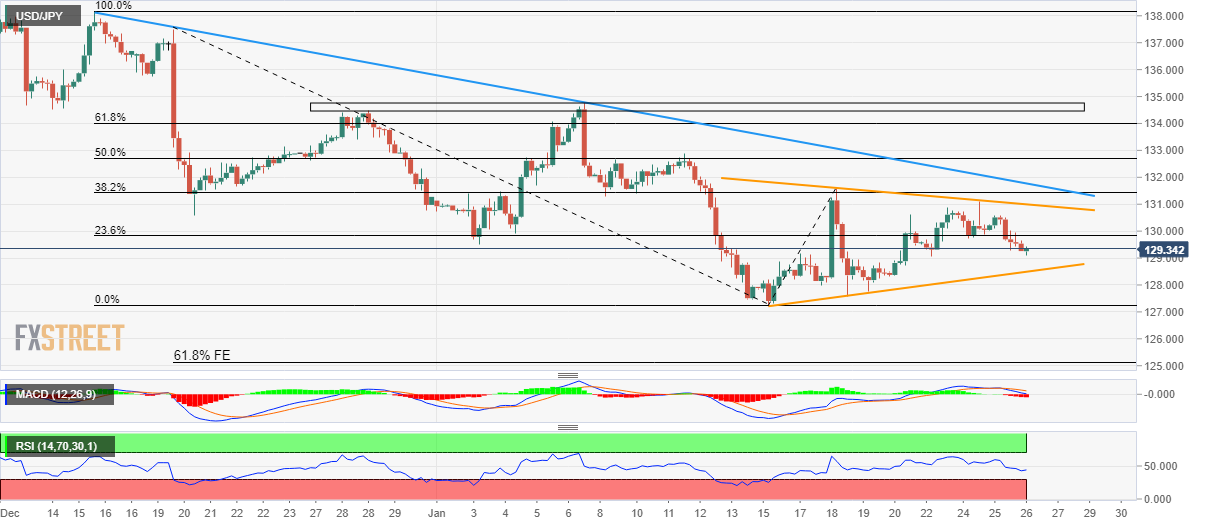
Trend: Further downside expected
| Raw materials | Closed | Change, % |
|---|---|---|
| Silver | 23.905 | 1.07 |
| Gold | 1946.33 | 0.46 |
| Palladium | 1697.72 | -2.53 |
- Market sentiment remains dicey ahead of the key data/events.
- S&P 500 Futures stay mildly bid around monthly high, US Treasury bond yields hold lower ground.
- ECB versus Fed drama, lack of clarity from earnings report and a light calendar trouble traders of late.
- US Q4 GDP, PCE Price Index will be crucial for directions ahead of next week’s FOMC.
Risk profile remains lackluster during early Thursday as market players the key US data to confirm recent dovish bias on the Federal Reserve (Fed).
Adding strength to the market’s inaction could be the lack of major data/events, as well as the European Central Bank (ECB) policymakers’ one-week silence ahead of the next Thursday’s monetary policy meeting. Furthermore, the Lunar New Year (LNY) holidays in China and an off in Australia also challenge the momentum traders.
While portraying the mood, the S&P 500 Futures grind near 4,035, staying mildly bid near the monthly high marked on Monday. That said, the US 10-year Treasury bond yields remain pressured during the fourth weekly downtrend in a row, around 3.44% by the press time. It’s worth observing that the two-year US Treasury bond coupons also print a four-week south-run but are comparatively more sluggish near 4.13% at the latest.
On Wednesday, Tesla bears market forecasts but Microsoft’s downbeat outlook probed equity buyers on Wall Street.
Elsewhere, receding hawkish bets on the Fed’s 0.50% rate hike in the next week’s Federal Open Market Committee (FOMC) weighs on the US Treasury bond yields, as well as the US Dollar. “Traders broadly expect the Fed to increase rates by 25 basis points (bps) next Wednesday, a step down from a 50 bps increase in December,” said Reuters.
Other than the dovish Fed concerns, the hawkish comments from the European Central Bank (ECB), as well as the upbeat German data also weighed on the US Dollar. On Wednesday, Germany’s IFO Business Climate Index matched 90.2 forecasts for January versus 88.6 prior but the Current Assessment eased from 94.4 to 94.1, versus 95.0 expected. Further, the IFO Expectations for the said month also came in higher-than-consensus 85.0 while rising to 86.4, compared to 83.2 in previous readings.
That said, ECB Governing Council member Gabriel Makhlouf became the last policymaker from the bloc’s central bank to fire the hawkish shot, suggesting a 50 bps rate hike, ahead of the one-week blackout pre-ECB. "We need to continue to increase rates at our meeting next week – by taking a similar step to our December decisions," said ECB’s Makhlouf. Makhlouf further added that they need to increase rates again at the March meeting.
Recently, the Bank of Japan's (BOJ) Summary of Opinions defends easy money policy but failed to entertain traders amid cautious mood ahead of the all-important Advance US Q4 GDP, expected to print annualized growth of 2.6% versus 3.2% prior. Also important to watch will be the US Durable Goods Orders for December and the Q4 Personal Consumption Expenditure (PCE) data as Fed hawks may cheer hints of more inflation and sustained growth.
Also read: US Gross Domestic Product Preview: Three reasons to expect a US Dollar-boosting outcome
- AUD/USD bulls are on track for meeting the cycle highs.
- Bears will be seeking to guard 0.7120/50, as we head into the NY session's key data.
AUD/USD is flat near 0.7100 in a quiet Asian start to Thursday following a more eventful Wednesday where local data made for heightened volatility with the pair rallying within a 160 pip range from a low of 0.7082 to a high of 0.7108. Nevertheless, the market has piped down as we await yet more critical data for the day ahead from the US economic calendar.
US data is key for the day ahead
Following yesterday's inflation data that came in hotter than expected for the Australian economy, traders will be rolling up their sleeves as a slew of US numbers will hit the screens at the start of the day. The US Commerce Department is set to release its initial advance fourth-quarter Gross Domestic Product estimates at the same time that the nation's Core PCE prices will be due.
Analysts at TD Securities said that the data will likely show growth accelerating to a 0.3% MoM pace in December, though a 0.4% gain can't be discarded. ''The yoY rate likely slowed to 4.5%, suggesting prices continue to moderate but remain sticky at high levels,'' the analysts argued. In regards to the growth data, the analyst said, ''we also look for Gross Domestic Product growth to have stayed strong in Q4, posting another above-trend gain. Growth was likely supported by firm showings from the consumer and inventories.''
Ahead of this data, WIRP suggests a Federal Reserve interest rate hike of 25 bp on February 1 is fully priced in, with less than 5% odds of a larger 50 bp move. Another 25 bp hike on March 22 is about 80% priced in, while one last 25 bp hike in Q2 is only 35% priced in. The sentiment has been a weight for the greenback, helping to support AUD/USD as it climbed towards fresh cycle highs made on the back of yesterday's CPI data.
The December CPI inflation number rose 8.4% YoY dragging the Q4 headline CPI inflation rate up to 7.8% YoY from 7.3% YoY the previous quarter. ''AUD/USD has subsequently regained the position of best-performing G10 currency in the year to date, just days after a softer than expected Australian labour report knocked it from the podium,'' analysts at Rabobank said.
''We continue to expect the AUD to perform well this year relative to a basket of G10 currencies. That said, we look for a dip in the value of AUD/USD around the middle of the year,'' the analysts said. ''This is linked with our expectation that the market will price out expectations of a Fed rate cut before the end of 2023.''
AUD/USD technical analysis
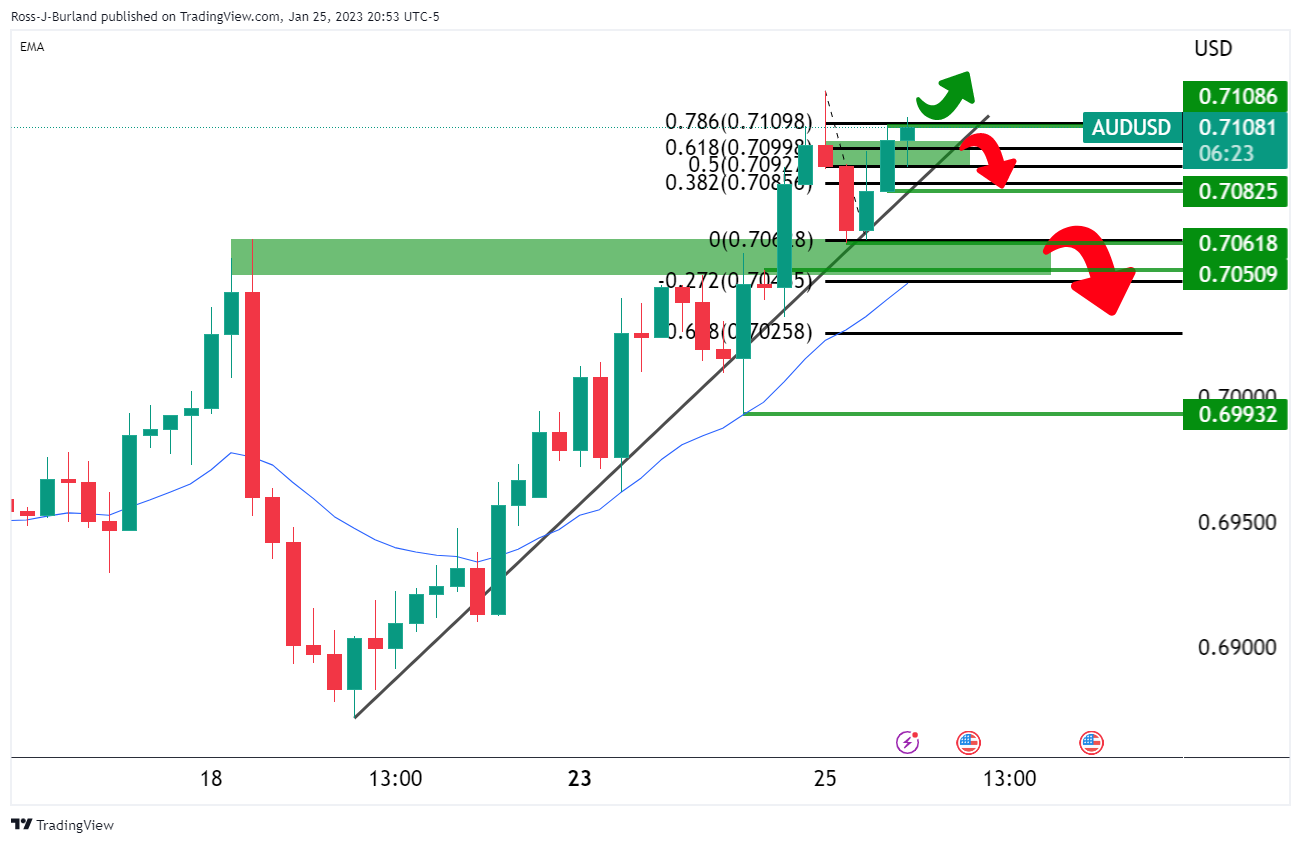
The bulls are on track for meeting the cycle highs as per the 4-hour chart above, showing that the pair is climbing trendline support. However, should the bears move in to guard 0.7120/50, this dynamic support will start to look vulnerable and may encourage the bulls to capitulate as we head into the NY session's key data. If the trendline were to give out, in a sign of deceleration of the bullish cycle, then the bears will be looking for a break of 0.7080 and then 0.7060/50 to lock in the highs and tilt the bias in their favour for a significant rotation to the downside for the month end and into the Federal Reserve next week.
- EUR/USD struggles after six-day uptrend, seesaws near nine-month high.
- Overbought RSI conditions join six-week-old resistance line to challenge further upside.
- Bears need validation from the 10-DMA to retake control.
EUR/USD bounces off intraday low to around 1.0920 as it consolidates weekly gains, the third one in a row, ahead of the US fourth quarter (Q4) Gross Domestic Product (GDP) on Thursday.
The major currency pair justifies the overbought RSI (14) as it prints the first daily loss in seven days.
Not only the Relative Strength Index (RSI) conditions but the ascending trend line from mid-December, near 1.0940 by the press time, also challenges the EUR/USD buyers.
With this, the pair is likely to decline towards the 10-DMA support, close to 1.0850 at the latest. However, any further downside needs to conquer the previous monthly low surrounding 1.0735 to welcome the EUR/USD bears.
Following that, a downward trajectory towards the monthly low near 1.0485 can’t be ruled out.
Meanwhile, an upside break of the aforementioned six-week-long resistance line, around 1.0940, could quickly propel EUR/USD towards the 1.1000 round figure.
Even so, another ascending trend line resistance, from November 15, 2022, could challenge the EUR/USD buyers afterward around 1.1090. It’s worth mentioning that the top marked during late March of the last year, near 1.1185, could jump on the bull’s radar past 1.1090.
To sum up, EUR/USD bulls are likely to take a breather as traders braces for the key data/events. However, the bears are far from the entry.
EUR/USD: Daily chart
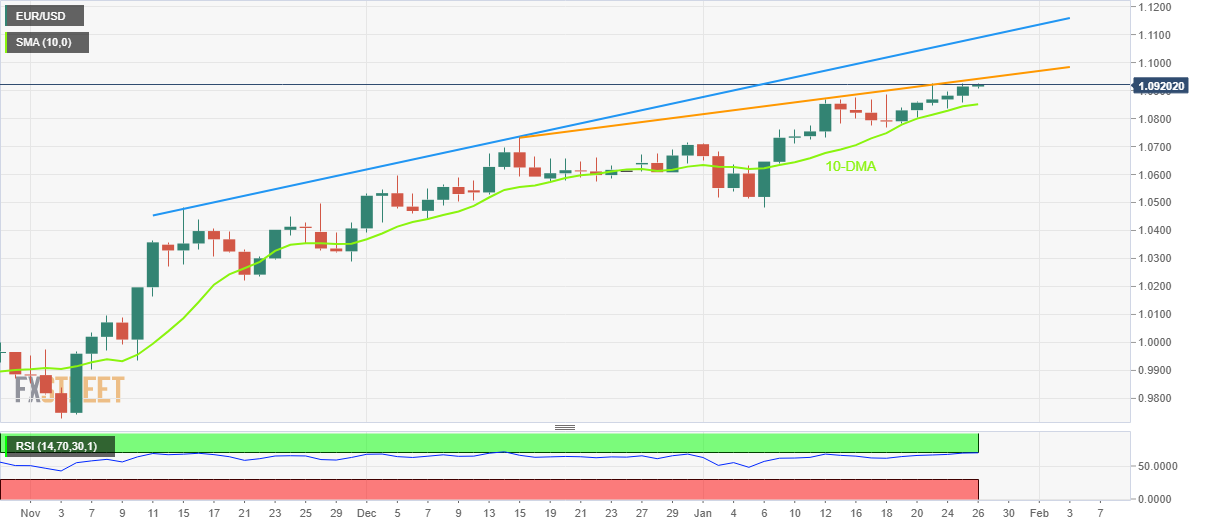
Trend: Limited upside expected
- GBP/USD is looking to shift its auction above 1.2400 for a fresh upside, supported by the risk-on impulse.
- The US economic data will be on the radar for further guidance.
- A lower UK PPI might trim inflation projections and will delight the BoE.
The GBP/USD pair is aiming to shift its auction profile above the critical resistance of 1.2410 in the Tokyo session. The cable is struggling to extend its recovery, however, the upside bias is solid as investors have underpinned the risk aversion theme. Market sentiment is highly positive as the S&P500 futures are displaying moderate gains in Asia.
S&P500 futures are not losing their foot despite mixed corporate earnings. Soaring expectations of a smaller interest rate hike by the Federal Reserve (Fed) in its upcoming monetary policy meeting, scheduled for February is offsetting the uncertainty about mixed earnings. Also, the higher risk appetite of the market participants has improved demand for US government bonds. The 10-year US treasury yields have dropped to 3.44%.
The US Dollar Index (DXY) is hovering around a seven-month at 101.10 and is expected to remain on the tenterhooks as investors await the United States Gross Domestic Product (GDP) (Q4) data for further cues. Considering the fact that Fed chair Jerome Powell has tightened the monetary policy on an extreme note in CY2022, the street is expecting a contraction in the scale of economic activities. As per the projections, the economic data is seen at 2.6% lower than the former release of 3.2%.
Apart from that, the catalyst that will impact the US Dollar Index (DXY) is the preliminary Core Personal Consumption Expenditure (PCE) for the fourth quarter of CY2022. The economic data is expected to escalate to 5.3% from the prior release of 4.7%. Also, the Durable Goods Orders data will be keenly watched, which is seen at 2.5% vs. -2.1% in the prior release.
On the United Kingdom front, a sheer decline in core Producer Price Index (PPI) Output data has trimmed inflation projections. Producers have increased prices of goods and services at factory gates by 12.4% lower than the consensus of 13.9% and the prior figure of 13.0%. This is going to delight the Bank of England (BoE), which is putting blood and sweat in compressing the roaring inflation.
As the USD/JPY pair fades recovery from an eight-month high, analysts at global investment banks like Goldman Sachs unveiled forecasts suggesting limited Yen appreciation in the short-term. In doing so, the quote also justifies the apparent US growth and no imminent exit from the Bank of Japan’s (BoJ) imminent exit from the Yield Curve Control (YCC) policy. That said, the US banker revised down its three-month and six-month price forecasts.
With this in mind, the GS stated, “While the BOJ's apparent flexibility on the current policy stance has shifted the balance of risks in favor of further Yen strength, the combination of no imminent exit from YCC and our more constructive view on US growth for 2023 relative to consensus fears of a recession should allow the Dollar to hold its ground against the Yen in the near-term.”
“Taken together, we see less scope for Yen depreciation in the short-term and have pulled forward the timing of appreciation,” adds Goldman.
The bank revises down three-month, six-month and 12-month forecasts to 132, 125 and 125 versus 136, 136 and 126 in that order.
Also read: USD/JPY declines towards 129.00 as USD Index looks to crack further ahead of US GDP
- AUD/JPY retreats from six-week high, stays pressured near intraday low of late.
- 50-SMA pierces off 200-SMA from below to suggest further upside via golden cross.
- Weekly support line guards immediate downside, bulls may aim for monthly ascending trend line.
AUD/JPY takes offers to pare the biggest weekly gains since mid-October around 91.85 during the mid-Asian session on Thursday. In doing so, the cross-currency pair takes a U-turn from the 1.5-month high, marked the previous day, while holding lower grounds near intraday bottom.
The quote’s latest pullback could be linked to its ability to cross an upward-sloping resistance line from the late December, around 92.80. Adding strength to the bearish bias are the red signals from the MACD indicator.
However, a one-week-old ascending trend and the golden cross between the 50-SMA and the 200-SMA challenge the AUD/JPY sellers. That said, the golden cross is a bullish moving average (MA) crossover where the short-term MA crosses the longer-term ones from below and hints.
As a result, the pair buyers before hopeful unless the quote stays beyond the immediate support line, close to 91.50 by the press time.
Following that, a convergence of the stated SMAs near 93.38 appears the key challenge for the AUD/JPY bears before targeting the monthly low of 87.41.
On the flip side, the aforementioned resistance line from December 28, close to 92.80 at the latest, restricts immediate upside of the pair. Adding strength to the stated hurdle is the monthly high.
In a case where the AUD/JPY pair rises past 92.80, the mid-December high near 93.35 and the last monthly peak of 93.81 could lure the bulls.
AUD/JPY: Four-hour chart
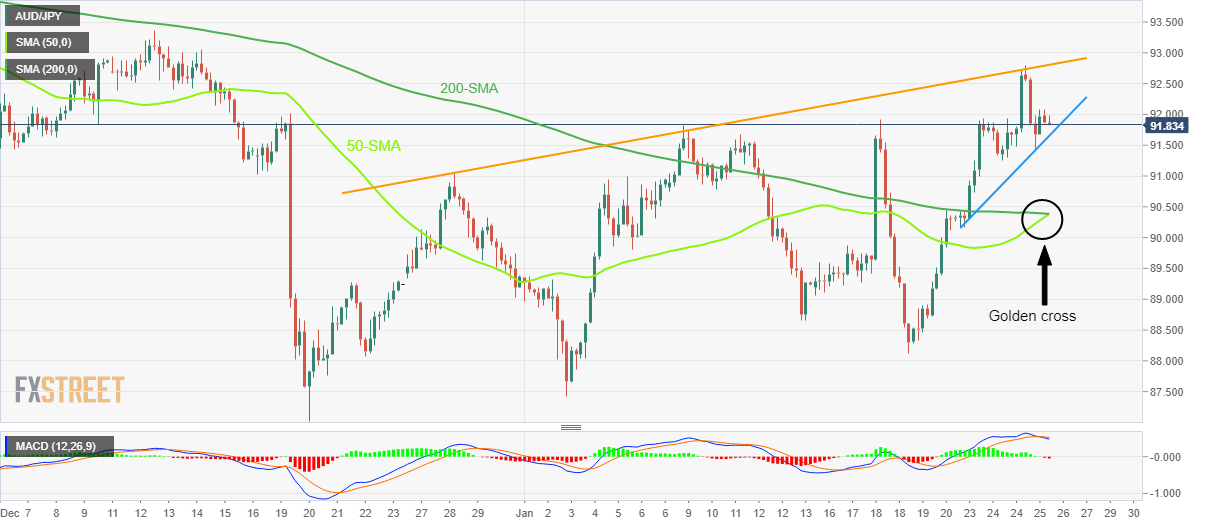
Trend: Further upside expected
- Silver price is struggling to extend gains further, however, the upside looks likely.
- The asset is on the edge of delivering a breakout of the Descending Triangle chart pattern.
- Early gains in the S&P500 futures indicate that the risk profile is positive.
Silver price (XAG/USD) has witnessed a minor correction in its journey toward the round-level resistance of 24.00 in the Asian session. The white metal has broadly displayed a perpendicular upside move, therefore, the corrective move could be healthy for the Silver bulls.
The US Dollar Index (DXY) witnessed a sell-off on Wednesday after facing barricades around 102.00 and dropped to near a seven-month low at 101.10 as an appeal for the safe-haven assets squeezed ahead of the release of the United States Gross Domestic Product (GDP) data. Investors’ risk appetite is improving further as S&P500 futures are showing gains in the early Asian session.
Silver price is auctioning near the edge of the downward-sloping trendline of the Descending Triangle chart pattern on an hourly scale. The downward-sloping trendline of the chart pattern is plotted from January 16 high at $24.50 while the horizontal support is placed from January 11 low at $23.22.
Advancing 10-and 20-period Exponential Moving Averages (EMAs) at $23.83 and $23.75 respectively, indicate that the white metal bulls have a lot of strength.
The Relative Strength Index (RSI) (14) is oscillating in the bullish range of 60.00-80.00, which indicates that the bullish momentum is active.
A decisive move above January 20 high at $24.08 will result in a breakout of the Descending Triangle, which will drive the asset towards January 18 high at $24.35 followed by January 16 high at $24.50.
On the flip side, a break below January 24 high at $23.74 will drag the asset toward Wednesday’s low at $23.33. A slippage below the latter will further drag the Silver price toward January 23 low at $22.76.
Silver hourly chart
-638102910491428140.png)
In a poll conducted by Reuters, states that the global economy will grow by 2.1% in 2023; 2.8% in 2024 vs 2.3% and 3.0%, respectively, in an October poll.
The poll states that global economic growth is forecast to barely clear 2% this year, according to a Reuters poll of economists who said the greater risk was a further downgrade to their view, at odds with widespread optimism in markets since the start of the year.
key notes
''Falling energy prices, a slowdown in inflation in most economies from multi-decade highs, an unexpectedly resilient euro zone economy and China's economic reopening have led traders to speculate the downturn will be milder,'' Reuters reported.
''That has driven MSCI's all-country world index of shares .up nearly 20% from October lows, hitting a five-month closing high on Tuesday, despite the greater risk that central banks will keep interest rates higher for longer rather than cut them.''
''But economists as a whole were much less upbeat, paring back growth forecasts for this year and next from 2.3% and 3.0%, respectively, in an October 2022 poll to 2.1% and 2.8%, respectively.''
The report quoted analysts at Rabobank:
"The market continues to price for a dream scenario of inflation having peaked, then coming down sharply, but not overshooting to the downside.''
"However ... the range of scenarios ahead is truly broad, and yet the market seems to have settled for a happy median that seems the least likely to transpire."
| Index | Change, points | Closed | Change, % |
|---|---|---|---|
| NIKKEI 225 | 95.82 | 27395.01 | 0.35 |
| KOSPI | 33.31 | 2428.57 | 1.39 |
| ASX 200 | -22.1 | 7468.3 | -0.3 |
| FTSE 100 | -12.53 | 7744.87 | -0.16 |
| DAX | -11.47 | 15081.64 | -0.08 |
| CAC 40 | -6.6 | 7043.88 | -0.09 |
| Dow Jones | 9.88 | 33743.84 | 0.03 |
| S&P 500 | -0.73 | 4016.22 | -0.02 |
| NASDAQ Composite | -20.91 | 11313.36 | -0.18 |
- USD/JPY is expected to scale down to 129.00 amid an upbeat risk profile.
- Vanished chances of a 50 bps interest rate hike by the Fed have heavily weighed on US yields.
- BoJ's Summary of Opinions conveys that the price index is accelerating for both goods and services.
The USD/JPY pair is hovering near the crucial support of 129.26 in the early Asian session. The asset is expected to surrender the aforementioned support and will decline towards the 129.00 cushion amid volatility in the US Dollar Index (DXY). The USD Index is auctioning around a seven-month low at 101.10 and might slip further amid the risk-on market mood.
A recovery in the S&P500 futures after investors shrugged off uncertainty over the ongoing earnings season improved the risk appetite of the market participants. Meanwhile, economists at UBS have doubts that the rally in the 500-US stock basket will prove durable. They further added that “We don't see much scope for markets to rally in the near term, especially given our outlook for continued pressure on corporate profit growth.”
Vanished chances of a 50 basis point (bps) interest rate hike by the Federal Reserve (Fed) in its February monetary policy meeting has heavily weighed on US Treasury yields. The return generated by 10-year US Treasury bonds has dropped sharply to near 3.44%. Also, the demand for US government bonds is accelerating ahead of the release of the United States Gross Domestic Product (GDP) data.
Investors are expecting shrinkage in the scale of economic activities to 2.6% vs. the former release of 3.2% in the third quarter of CY2022. This could be the consequence of extreme policy tightening by the Fed, which restricted firms from borrowing.
On the Japanese Yen front, Bank of Japan (BoJ) Governor Haruhiko Kuroda has confirmed that the central bank “will resolutely keep the monetary environment easy.” Kuroda added that “the BoJ aims to regain market functionality by tweaking yield curve control operations while maintaining an easy monetary environment.
Meanwhile, the release of the BoJ Summary of Opinions might bring an action to USD/JPY ahead. The minutes from BoJ's Summary of Opinions indicate that the price index is accelerating for both goods and services. It will take time for Japan to achieve sustained wage growth for that the BoJ must support the economy with macro policy.
- Gold price takes the bids to renew nine-month high, up for the fourth consecutive day.
- US Dollar weakness underpins XAU/USD upside amid cautious mood ahead of the key United States Gross Domestic Product.
- Dovish bias surrounding the Fed contrasts with the hawkish outlook over ECB to weigh on USD and favor Gold buyers.
- Convergence of six-week-old ascending trend line, March 2022 peak could test XAU/USD bulls.
Gold price (XAU/USD) holds onto the bullish bias for the fourth consecutive day as it rises to the fresh high since April 2022 to near $1,950 during early Thursday. In doing so, the precious metal cheers the broad-based US Dollar weakness ahead of the first readings of the United States' fourth quarter (Q4) Gross Domestic Product (GDP). It’s worth noting that the contrasting play between the hawkish concerns surrounding the European Central Bank (ECB) and the dovish bias over the US Federal Reserve (Fed) adds strength to the XAU/USD upside, via the softer USD.
US Dollar weakness propels Gold price
US Dollar Index (DXY) remains on the back foot, bracing for the third weekly fall, as sellers attack the six-month low marked the last week around 101.30, close to 101.55 by the press time. Given the inverse relationship between the US Dollar and the Gold price, the yellow metal benefits from the lackluster USD.
It’s worth noting that hopes of a dovish Federal Open Market Committee (FOMC) grew stronger amid the Federal Reserve (Fed) policymakers’ two-week blackout and weigh on the US Dollar, which in turn propelled XAU/USD. The reason could be linked to the previously downbeat US data surrounding wages for December and activities for January. “Traders broadly expect the Fed to increase rates by 25 basis points (bps) next Wednesday, a step down from a 50 bps increase in December,” said Reuters.
European Central Bank clues also play their role to fuel XAU/USD
Apart from the dovish Fed concerns, the hawkish comments from the European Central Bank (ECB), as well as the upbeat data from the bloc also weigh on the US Dollar and favor the Gold buyers. On Wednesday, Germany’s IFO Business Climate Index matched 90.2 forecasts for January versus 88.6 prior but the Current Assessment eased from 94.4 to 94.1, versus 95.0 expected. Further, the IFO Expectations for the said month also came in higher-than-consensus 85.0 while rising to 86.4, compared to 83.2 previous readings.
That said, ECB Governing Council member Gabriel Makhlouf became the last policymaker from the bloc’s central bank to fire the hawkish shot, suggesting a 50 bps rate hike, ahead of the one-week blackout pre-ECB. "We need to continue to increase rates at our meeting next week – by taking a similar step to our December decisions," said ECB’s Makhlouf. Makhlouf further added that they need to increase rates again at the March meeting.
United States Gross Domestic Product is the key
Although the US Dollar weakness propels the Gold price, the XAU/USD bear’s further dominance depends upon the first readings of the US fourth quarter (Q4) Gross Domestic Product (GDP), expected to print annualized growth of 2.6% versus 3.2% prior. Also important to watch will be the US Durable Goods Orders for December and the Q4 Personal Consumption Expenditure (PCE) data. Should the scheduled data print upbeat outcomes, the Gold traders may get a reason to pare the latest gains.
Also read: US Gross Domestic Product Preview: Three reasons to expect a US Dollar-boosting outcome
Gold price technical analysis
Gold price justifies the previous day’s upside break of a fortnight-old ascending resistance line to refresh the multiday high. Adding strength to the bullish bias could be the metal’s sustained trading beyond the 10-Day Moving Average (DMA), as well as the bullish signals from the Moving Average Convergence and Divergence (MACD) indicator.
It should be noted, however, that the overbought conditions of the Relative Strength Index (RSI) line, placed at 14, appears to challenge the XAU/USD bulls. On the same line could be a convergence of the March 2022 peak and an upward-sloping trend line from December 13, 2022, close to $1,967.
In a case where the Gold buyers cross the $1,967 hurdle, a run-up toward April 2022 high near $1,999 can’t be ruled out.
Alternatively, the immediate resistance-turned-support line, close to $1,943, restricts the nearby downside of the Gold price ahead of the 10-DMA level of $1,927.
Following that, the $1,900 round figure will precede the previous weekly low near $1,896 to act as the last defense of the XAU/USD buyers.
Overall, Gold remains bullish but the upside room appears limited.
Gold price: Daily chart
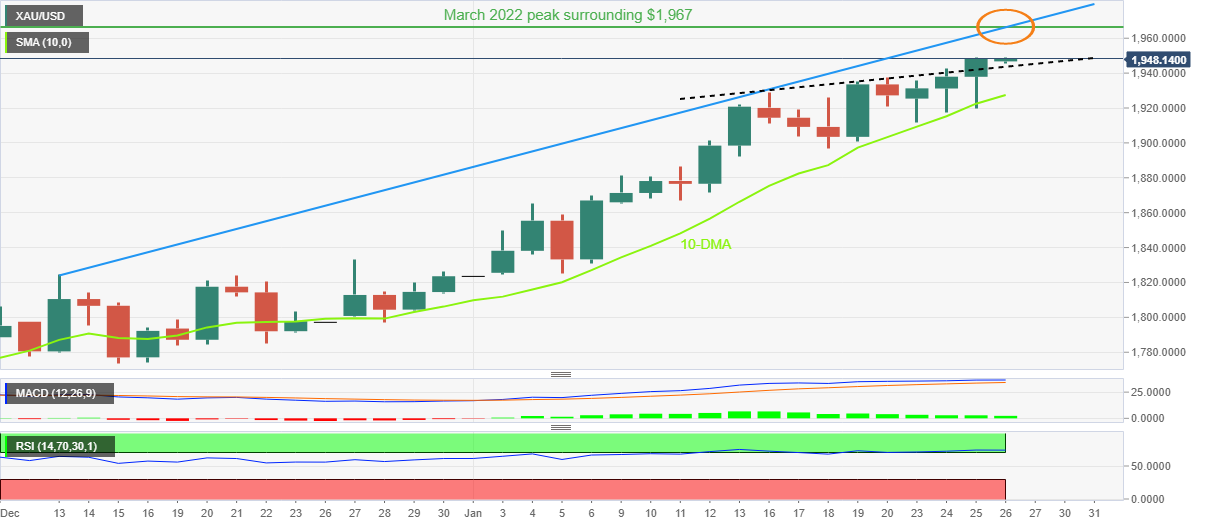
Trend: Limited upside expected
| Pare | Closed | Change, % |
|---|---|---|
| AUDUSD | 0.71056 | 1 |
| EURJPY | 141.441 | -0.18 |
| EURUSD | 1.09157 | 0.27 |
| GBPJPY | 160.698 | 0.16 |
| GBPUSD | 1.24022 | 0.62 |
| NZDUSD | 0.64809 | -0.09 |
| USDCAD | 1.3388 | 0.2 |
| USDCHF | 0.91774 | -0.49 |
| USDJPY | 129.573 | -0.45 |
The Bank of Japan's Summary of Opinions is coming out in stages.
Key points
It will take time for Japan to achieve sustained wage growth, must support the economy with macro policy.
Focusing on service prices as demand-pull inflation must be achieved for Bank of Jaopan's price target to be met.
Price rises accelerating not just for goods but for services.
Public's norm on prices may be changing due to big, external shock.
Appropriate to maintain current monetary easing, including YCC.
Crucial to generate positive economic, price cycle in order to achieve BoJ's price target
BoJ must keep yields from rising across curve while being mindful of bond market function.
Must spend more time to gauge impact of December decision on bond market function.
Must communicate to markets achievement of price target will take some time.
Expansion of BoJ's market operation tool will help create stable shape of yield curve.
When time for exiting ultra-loose policy comes, boj must check whether market players are prepared for the move.
BoJ must conduct a review of its policy at some point, but appropriate to maintain easy monetary policy for now.
Japan's consumer inflation is likely to slow pace of increase toward latter half of next fiscal year.
Cost-push pressure on prices are starting to ease.
Still see some distance in achieving the BoJs price target.
USD/JPY update
There has been no effect on the Yen but the price action was volatile on Wednesday with the bulls now back under pressure again towards 129.00:
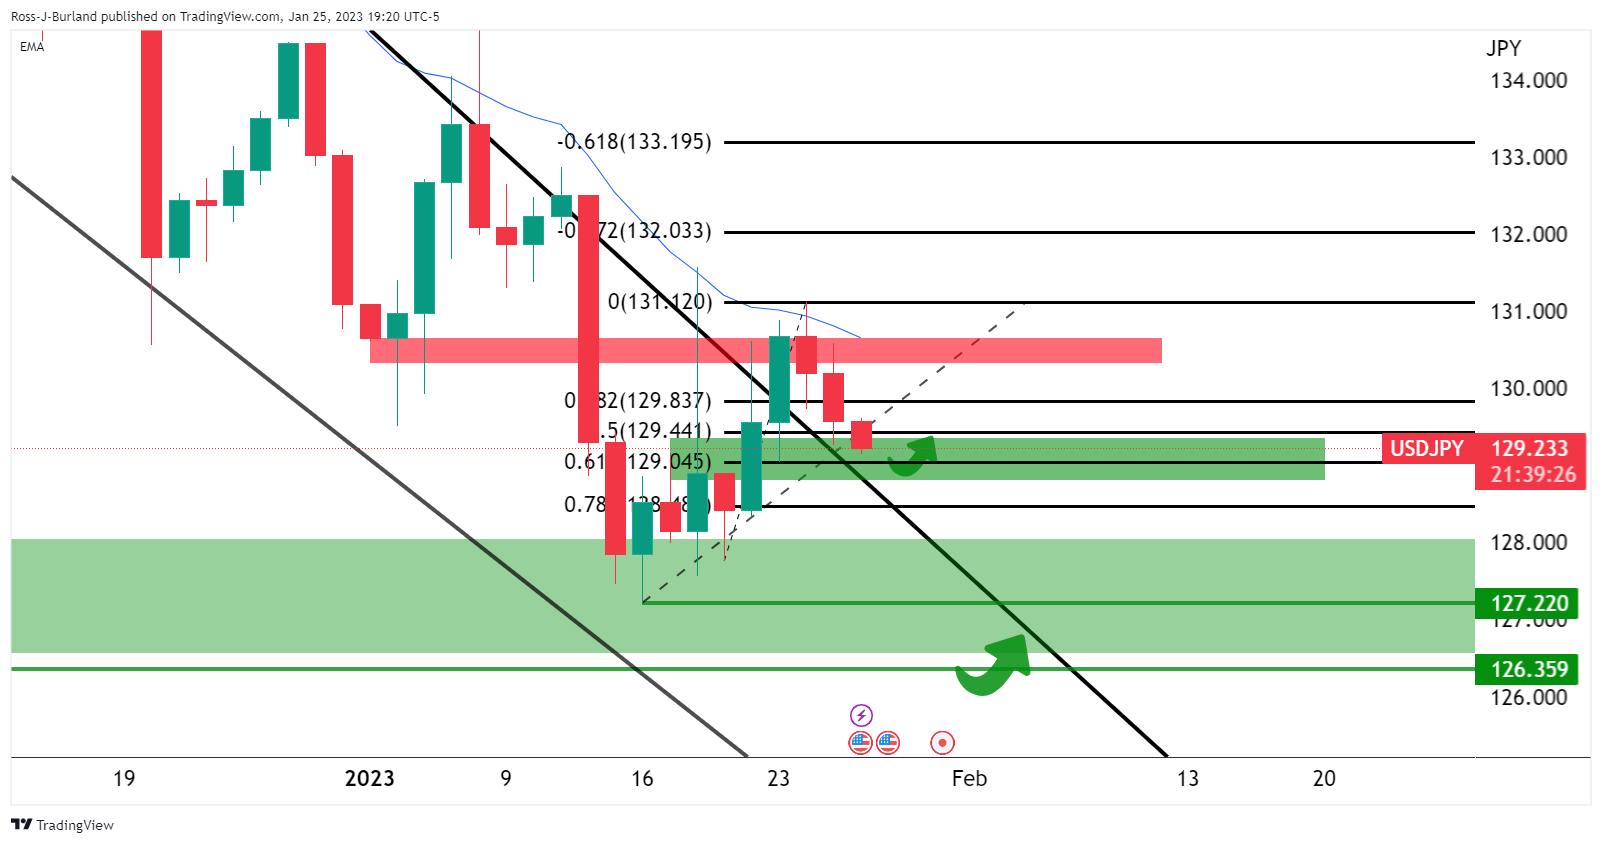
If the bulls commit near 129.00, the has a confluence with the 129.00 figure, then there could be prosp3ects of a move back to test 130.00 before the week is out.
About the Bank of Japan's Summary of Opinions
This report includes the BOJ's projection for inflation and economic growth. It is scheduled 8 times per year, about 10 days after the Monetary Policy Statement is released.


© 2000-2026. Bản quyền Teletrade.
Trang web này được quản lý bởi Teletrade D.J. LLC 2351 LLC 2022 (Euro House, Richmond Hill Road, Kingstown, VC0100, St. Vincent and the Grenadines).
Thông tin trên trang web không phải là cơ sở để đưa ra quyết định đầu tư và chỉ được cung cấp cho mục đích làm quen.
Giao dịch trên thị trường tài chính (đặc biệt là giao dịch sử dụng các công cụ biên) mở ra những cơ hội lớn và tạo điều kiện cho các nhà đầu tư sẵn sàng mạo hiểm để thu lợi nhuận, tuy nhiên nó mang trong mình nguy cơ rủi ro khá cao. Chính vì vậy trước khi tiến hành giao dịch cần phải xem xét mọi mặt vấn đề chấp nhận tiến hành giao dịch cụ thể xét theo quan điểm của nguồn lực tài chính sẵn có và mức độ am hiểu thị trường tài chính.
Sử dụng thông tin: sử dụng toàn bộ hay riêng biệt các dữ liệu trên trang web của công ty TeleTrade như một nguồn cung cấp thông tin nhất định. Việc sử dụng tư liệu từ trang web cần kèm theo liên kết đến trang teletrade.vn. Việc tự động thu thập số liệu cũng như thông tin từ trang web TeleTrade đều không được phép.
Xin vui lòng liên hệ với pr@teletrade.global nếu có câu hỏi.
ngân hàng