- Phân tích
- Tin tức và các công cụ
- Tin tức thị trường
Tin tức thì trường
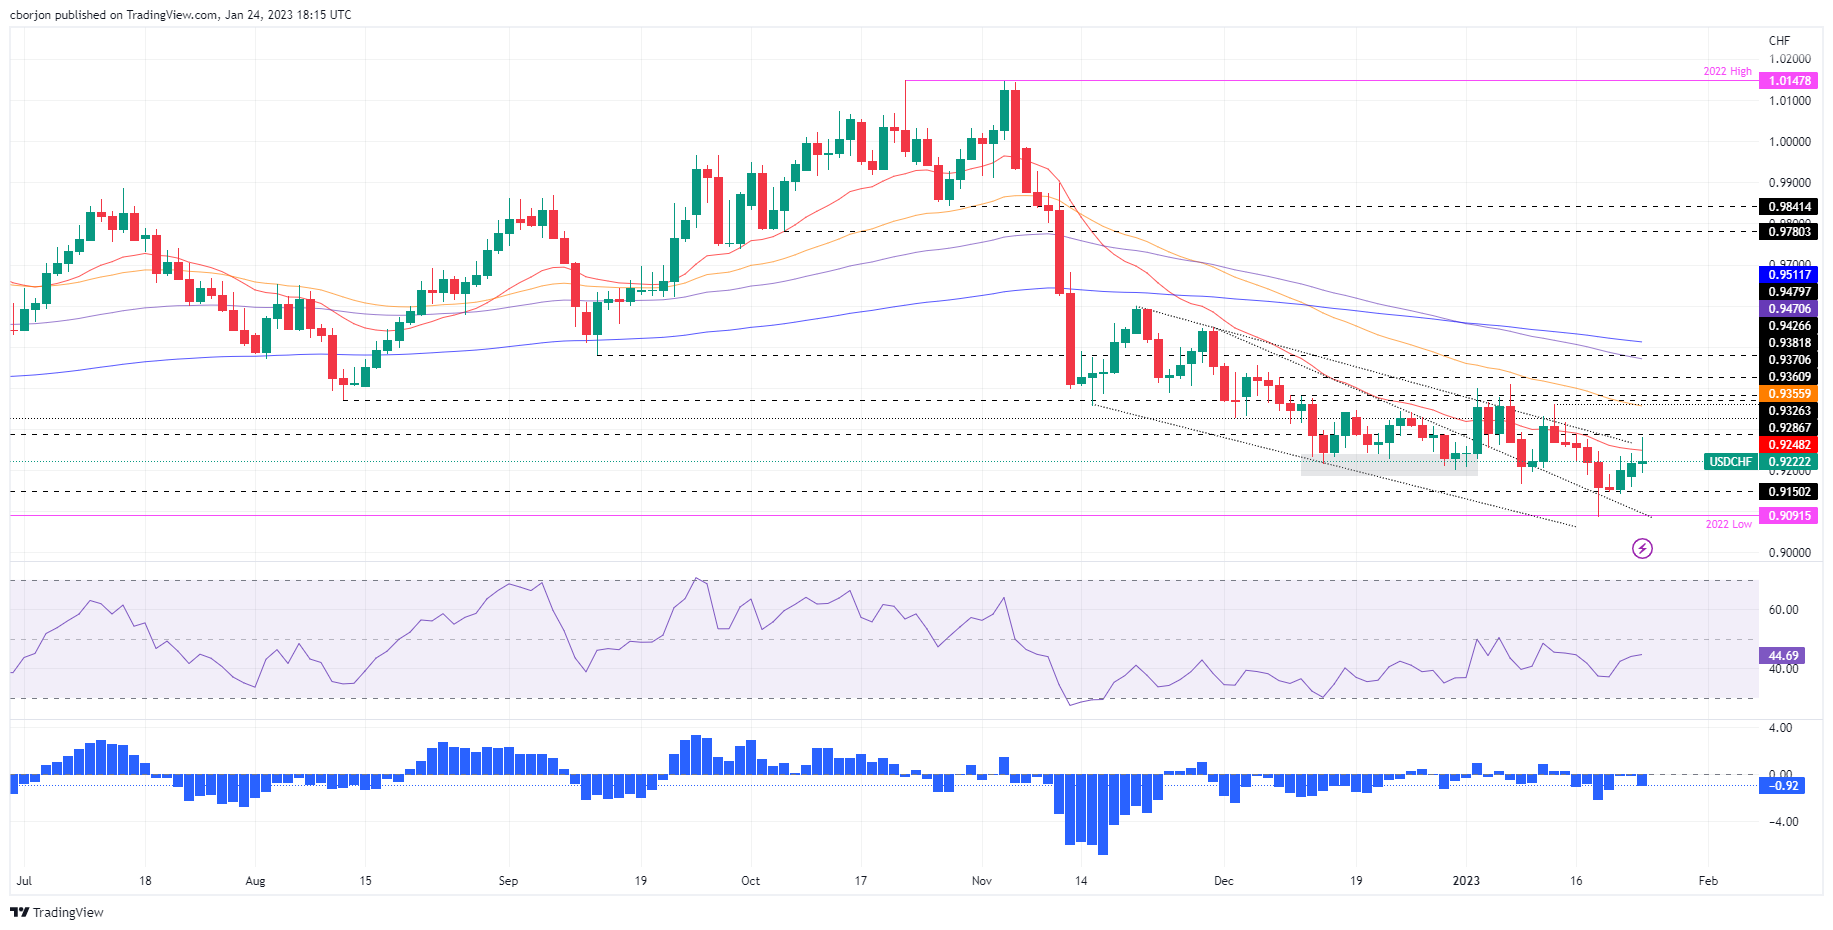
- USD/CHF has picked demand after dropping below 0.9220 as volatility might trigger ahead of US GDP data.
- Tuesday’s upbeat preliminary US S&P PMI data failed to infuse confidence in the USD Index.
- Accelerating interest rates by the Fed is dampening firms’ production activities.
The USD/CHF pair has sensed buying interest after dropping below the critical support of 0.9220 in the early Asian session. The Swiss franc asset is gaining traction as investors are shifting their focus toward the release of the United States Gross Domestic Product (GDP) data, which is scheduled for Thursday.
S&P500 futures are displaying losses after Tuesday’s choppy trade, portraying a caution for the risk-sensitive assets. A decline in the risk appetite of the market participants has improved the appeal for safe-haven assets. The US Dollar Index (DXY) is building a cushion around 101.50 after a sell-off. The 10-year US Treasury yields are still hovering above 3.45%.
Tuesday’s upbeat preliminary United States S&P PMI data failed to infuse confidence in the USD Index for continuing its upside momentum. Manufacturing PMI landed at 46.8, higher than the expectations of 46.1 and the former release of 46.2. Also, the Services PMI remained upbeat and scaled higher to 46.6 against the consensus of 44.5 and the prior release of 44.7.
For further guidance, US GDP data will better guide USD/CHF for further action. As per the projections, a contraction is expected in preliminary GDP for the fourth quarter of CY2022 to 2.8% from 3.2% reported earlier. This could be the outcome of accelerating interest rates by the Federal Reserve (Fed), which has forced firms to dodge borrowings at a higher cost to avoid higher interest obligations.
On the Swiss Franc front, investors are awaiting the release of the ZEW Survey- Expectations (Jan), which will release on Wednesday. The economic data that display present business conditions and employment conditions is expected to trim to -47.6 from the former release of -42.8. A weaker-than-projected qualitative data could impact the Swiss Franc ahead.
Overview
The fourth quarter (Q4) release of the Australian Consumer Price Index (CPI), as well as the monthly CPI for December, scheduled for publishing on early Wednesday, appears the crucial data for the AUD/USD pair traders. The reason could be linked to the Reserve Bank of Australia’s (RBA) recent hesitance in defending the hawkish monetary policy, not to forget the downbeat Aussie pair’s trading near the multi-day high.
Not only the headline CPI Q4 and the monthly inflation numbers but the RBA Trimmed Mean CPI for Q4 also appears crucial to watch for the AUD/USD pair traders.
Forecasts suggest that the headline CPI is expected to ease to 1.6% QoQ versus 1.8% prior but the monthly CPI could rise to 7.7% YoY from 7.3% previous readings. Further details signal that the RBA Trimmed Mean CPI may inch up to 1.9% from 1.8%.
Ahead of the release, Analysts at the ANZ said,
The trimmed mean, non-tradables and services inflation are the key measures to watch. We expect all of these measures to have lifted strongly in Q4, and for trimmed mean inflation to rise to 6.7% y/y, exceeding the RBA’s forecast of 6.5% y/y.
On the same line, Westpac stated
We see Australia’s Q4 CPI. Robust gains in food prices, rising fuel prices and a bounce in holiday travel prices are all expected to continue pushing headline inflation higher, albeit at a slower pace than observed in the September quarter. Hence, Westpac anticipates a 1.5% and 1.6% lift for the headline and trimmed mean CPI measures respectively (market f/c: 1.6% and 1.5% respectively). The annual inflation rates we expect of 7.4% headline and 6.6% trimmed mean should be the cycle peak.
How could AUD/USD react to the news?
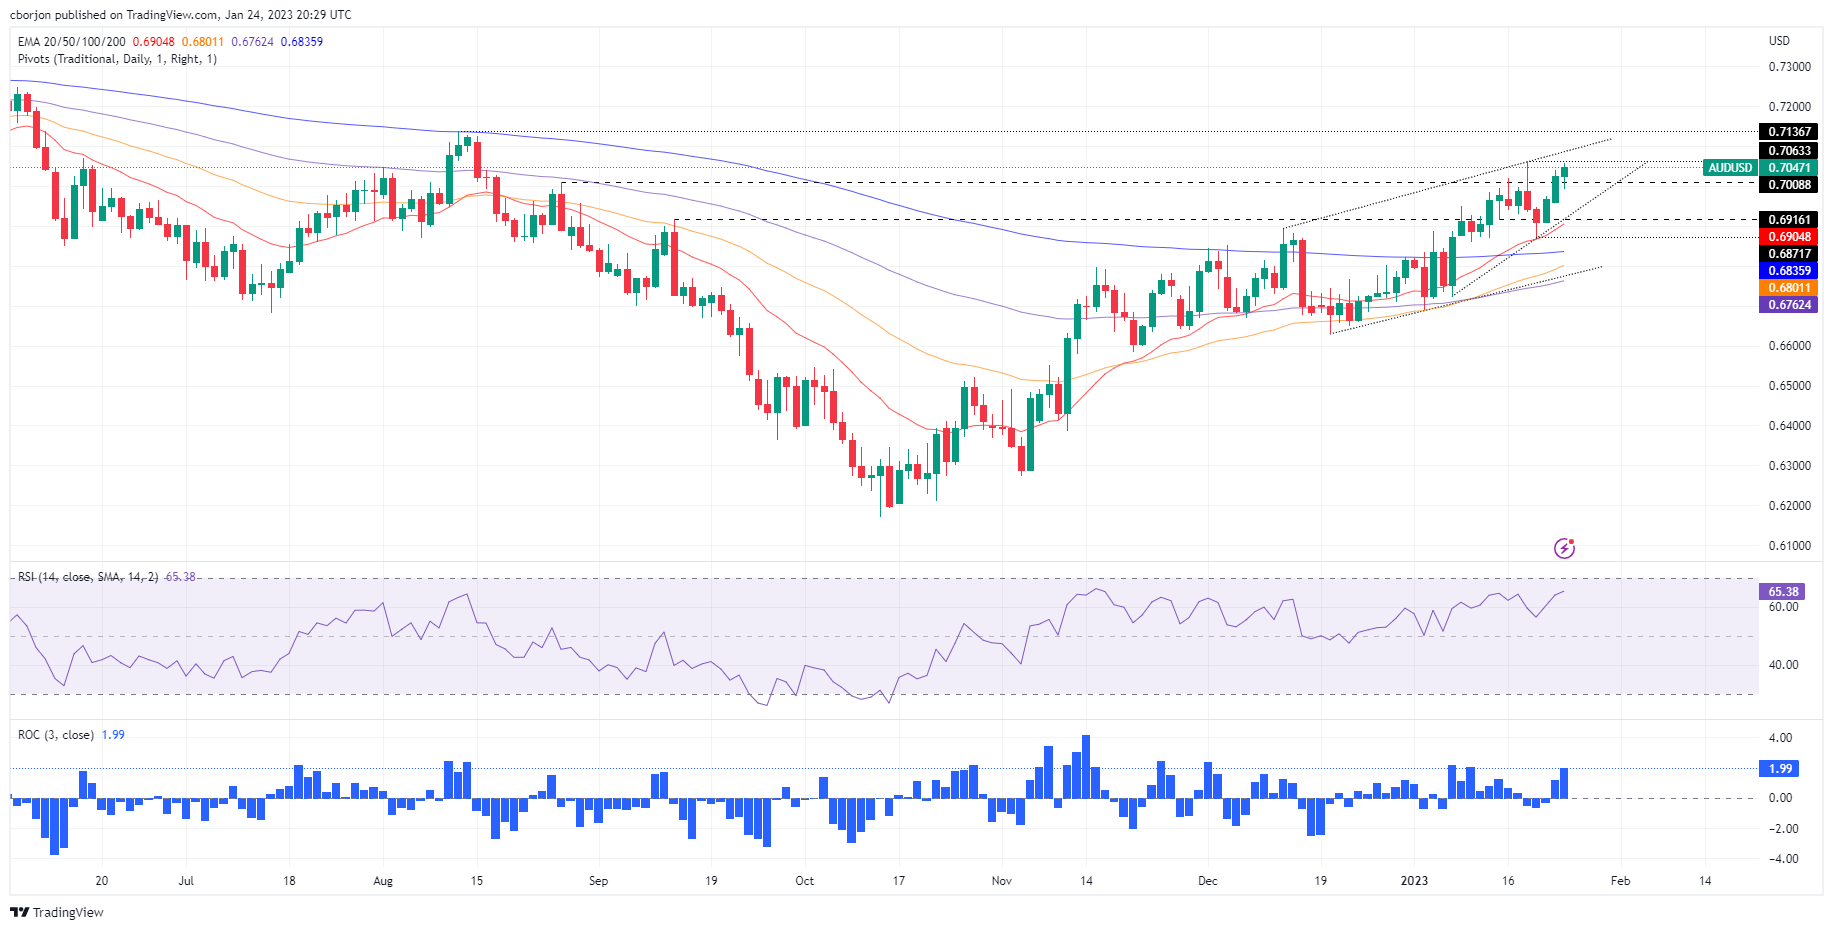
AUD/USD renews its intraday low near 0.7030 as it pares for the key data amid mixed sentiment during early Wednesday. In doing so, the Aussie pair also takes clues from the downbeat US stock futures and the Treasury bond yields to print mild losses.
That said, the Aussie pair is likely to witness profit booking should the Aussie inflation data disappoint as the RBA appears running out of steam to defend the hawkish interest rate moves. It should be noted that the RBA Trimmed Mean CPI will gain major attention and hence any minor change in the headline CPI data may not affect the AUD/USD to a much extent.
Technically, the 200-week Simple Moving Average (SMA) near 0.7070 appears the key hurdle for the AUD/USD buyers to watch in case of the pair’s further upside. Until then, the firmer RSI and looming bull cross on the daily chart, a condition when 50-DMA crosses the 200-DMA from below, can keep the buyers hopeful.
Key notes
AUD/USD Price Analysis: On the verge to test a five-month high around 0.7060 ahead of Australian CPI
AUD/USD buoyed by risk-appetite improvement climb above 0.7040s ahead of Aussie CPI
About Aussie Consumer Price Index
The quarterly Consumer Price Index (CPI) published by the Australian Bureau of Statistics (ABS) has a significant impact on the market and the AUD valuation. The gauge is closely watched by the Reserve Bank of Australia (RBA), in order to achieve its inflation mandate, which has major monetary policy implications. Rising consumer prices tend to be AUD bullish, as the RBA could hike interest rates to maintain its inflation target. The data is released nearly 25 days after the quarter ends.
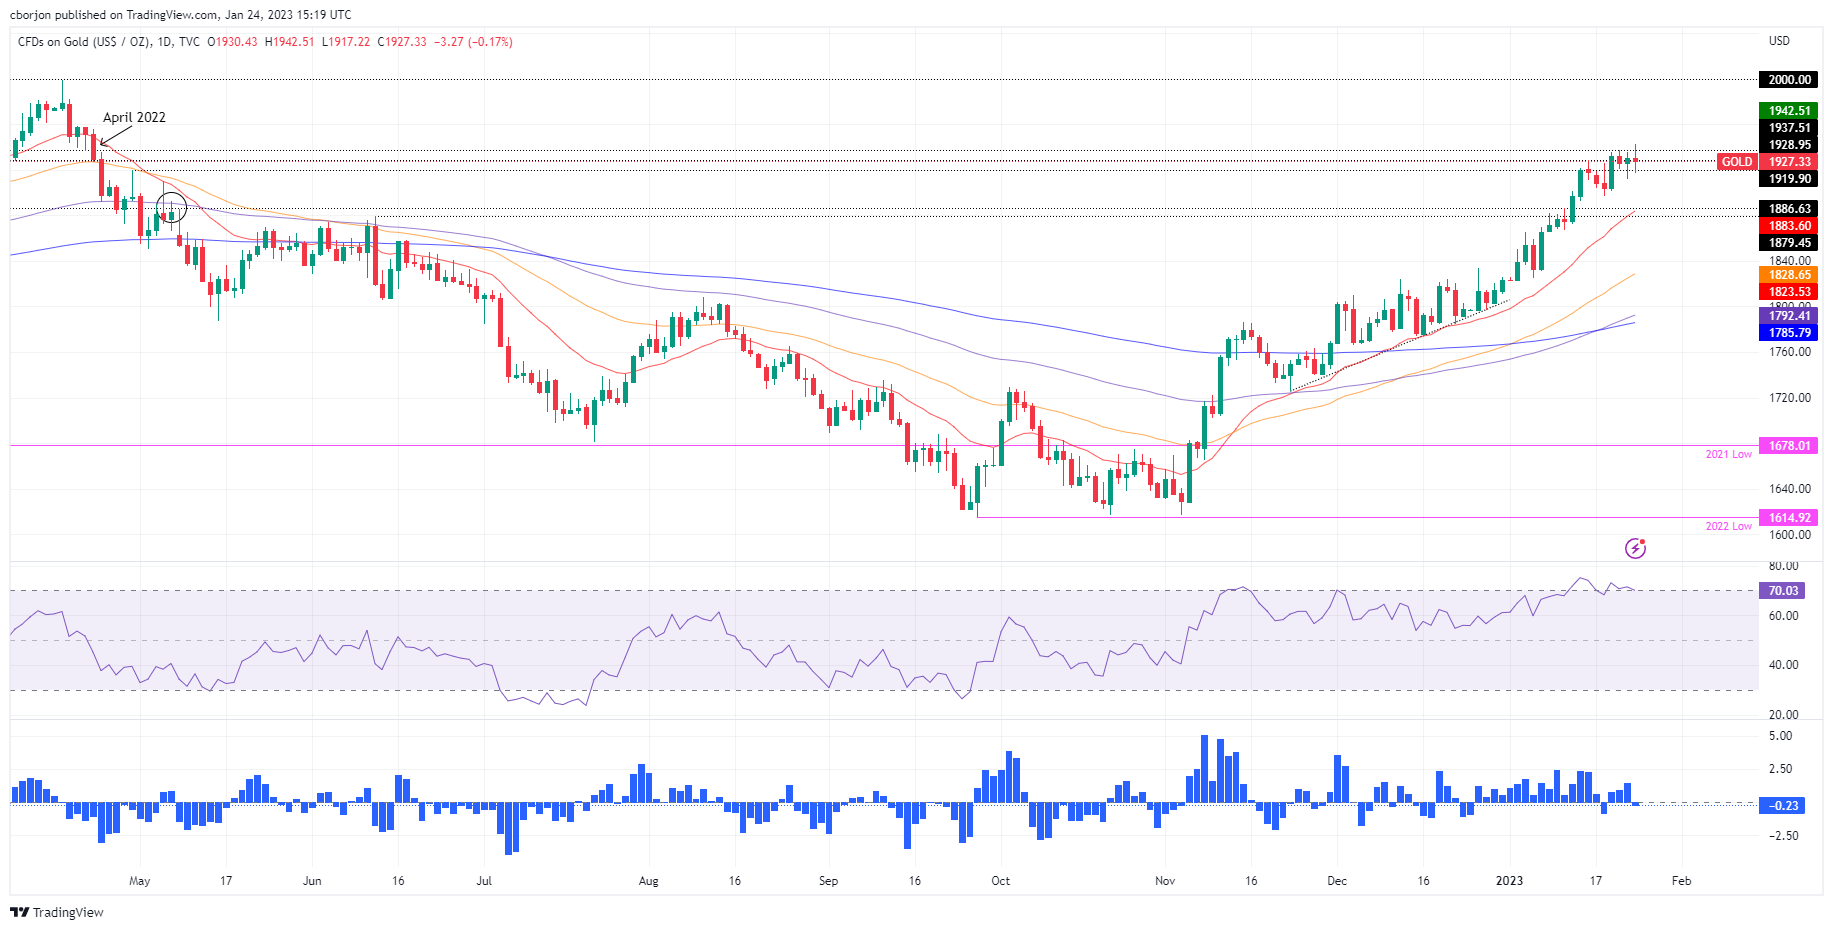
- Gold Price remains mildly bid, mostly sidelined, during the sixth consecutive week of uptrend.
- Market’s cautious mood ahead of the next week’s Federal Reserve (Fed) meeting probes Gold buyers.
- United States Purchasing Managers Index for January failed to recall US Dollar buyers, allowing XAU/USD to remain firmer.
- US GDP could offer the last key signal ahead of Fed to Gold traders.
Gold price (XAU/USD) seesaws around $1,938 as bulls take a breather inside a bearish chart pattern during early Wednesday. In doing so, the bright metal depicts the market’s mixed feelings amid downbeat data from the United States, as well as the cautious mood ahead of the next week’s Federal Reserve (Fed) meeting. Even so, the US Dollar weakness and optimism surrounding Europe, as well as China, appears to favor the XAU/USD bulls.
Lack of clarity in the market probes Gold buyers
Although the Gold buyers keep the reins for the sixth consecutive week, the mixed signals from global markets and the Federal Reserve’s (Fed) silence period ahead of next week’s Federal Open Market Committee (FOMC) seem to restrict the XAU/USD moves. Also challenging the Gold traders could be the one-week-long holidays in China due to the Lunar New Year (LNY) celebrations. It’s worth noting that the European Central Bank (ECB) officials also sneak into the pre-monetary policy blackout starting today and adds barriers to the Gold price moves. While portraying the sentiment, the US 10-year Treasury yields dropped five basis points (bps) to 3.455% but Wall Street closed mixed.
Downbeat US Dollar favors XAU/USD bulls
Despite the mixed sentiment, the US Dollar weakness favors the Gold buyers due to the inverse relationship between the XAU/USD and the greenback. It’s worth noting that the US Dollar Index (DXY) remains indecisive near 101.90 after printing a two-week downtrend in the last. In doing so, the greenback’s gauge versus the six major currencies takes clues from the market’s bearish bias for the next week’s Fed meeting, as well as highlights the downbeat US data.
That said, preliminary readings of the US S&P Global Manufacturing PMI for January rose past 46.2 market forecast and 46.1 market expectations with 46.8 figure while the Services PMI followed the suit with the 46.6 figure for the said month, versus 44.5 forecast and 44.7 prior. That said, the S&P Global Composite PMI for January increased to 46.6 from 45.0 prior and the 44.7 consensus, marking the seventh consecutive read below 50.
Following the US data, the US Dollar Index (DXY) managed to rise for a brief time before closing in the red. The reason could be linked to the comments from Chief Business Economist at S&P Global Chris Williamson who said, “The US economy has started 2023 on a disappointingly soft note, with business activity contracting sharply again in January."
Considering the downbeat US data, markets widely anticipate a 0.25% Fed rate hike and the policy pivot in the next week. As a result, the Gold buyers appear pricing in the expected outcome.
Europe, China-linked optimism also strengthens Gold price
Even if China is off the market for the Lunar New Year celebrations, the positive vibes emanating from the reopening of the world’s largest commodity user keep Gold buyers hopeful. Also underpinning the XAU/USD upside could be the expectations of strong festive demand. It’s worth noting that the recent challenges to the US-China ties due to the alleged Chinese connection to the Russian war seem to probe the optimism.
Elsewhere, the latest activity data from Europe appear to help the traders optimistic about the old continent. That said, Eurozone S&P Global Manufacturing PMI crossed the 48.5 market forecasts and 47.8 previous readouts with 48.8 figure for January. Further, the Services PMI also impressed Euro bulls with 50.7 mark versus 50.2 expected 49.8 prior. With this, the Composite PMI for the bloc increased to 50.2 from 49.3 previous readings and 49.8 market forecasts. Following the data releases, Chris Williamson, Chief Business Economist at S&P Global said, “A steadying of the Eurozone economy at the start of the years adds to evidence that the region might escape recession.”
US Gross Domestic Product is the key
While the United States Durable Goods Orders and the second-tier employment data could also entertain the Gold buyers, major attention will be given to the first readings of the US Gross Domestic Product (GDP) for the fourth quarter (Q4). The reason appears logical due to the next week’s Federal Reserve (Fed) meeting, as well as the talks of the US recession. Forecasts suggest the world’s biggest economy eases with 2.8% annualized growth.
Also read: US Gross Domestic Product Preview: Three reasons to expect a US Dollar-boosting outcome
Gold price technical analysis
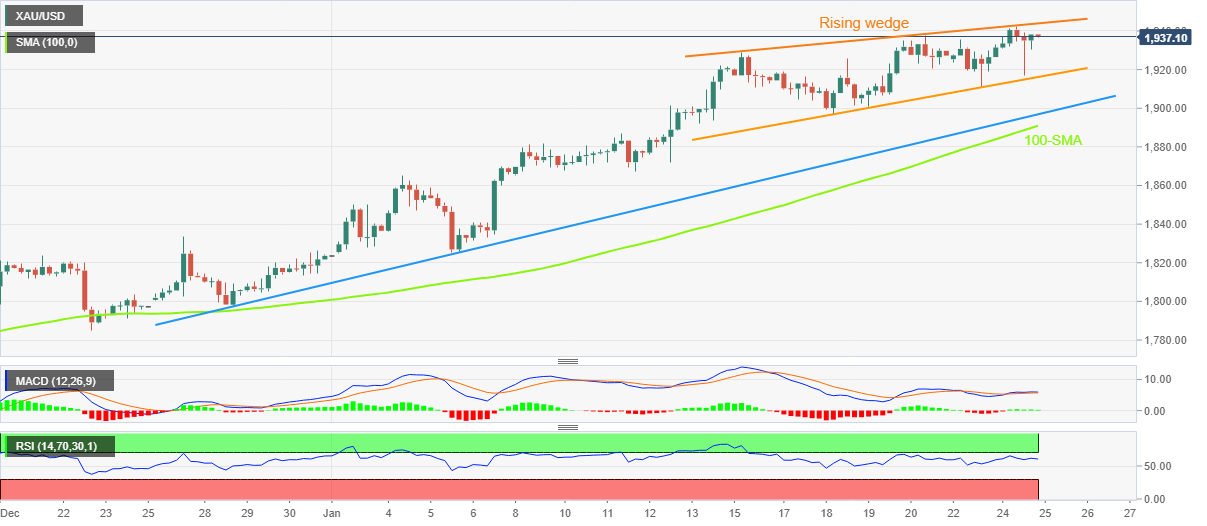
Despite the mildly bid performance of late, the Gold price stays inside a one-week-old rising wedge bearish chart pattern. The bearish bias also gains support from the Relative Strength Index (RSI) line, placed at 14, as well as the mixed signals from the Moving Average Convergence and Divergence (MACD) indicator.
As a result, the XAU/USD is likely to grind higher unless staying between $1,944 and $1,916 levels. However, the oscillators, namely the RSI and MACD, tease the bears and hence a downside break of $1,916 could gain more response than the otherwise conditions.
In that case, a one-month-old ascending trend line and the 100-Simple Moving Average (SMA), respectively near $1,896 and $1,890, will be crucial to watch before expecting the Gold price downside toward the theoretical target of $1,870.
On the flip side, a successful break of $1,944 will defy the bearish chart pattern and could propel the XAU/USD toward March 2022 peak surrounding $1,966.
Should the Gold buyers keep the reins past $1,966, the odds of witnessing the $2,000 on the chart can’t be ruled out.
Gold price: Four-hour chart
Trend: Further weakness expected
- EUR/JPY forms a hanging man as it fails to conquer the 100-day EMA, suggesting further downside is expected.
- EUR/JPY Price Analysis: The pair would be bearish below 141.00; otherwise, it could challenge 142.00.
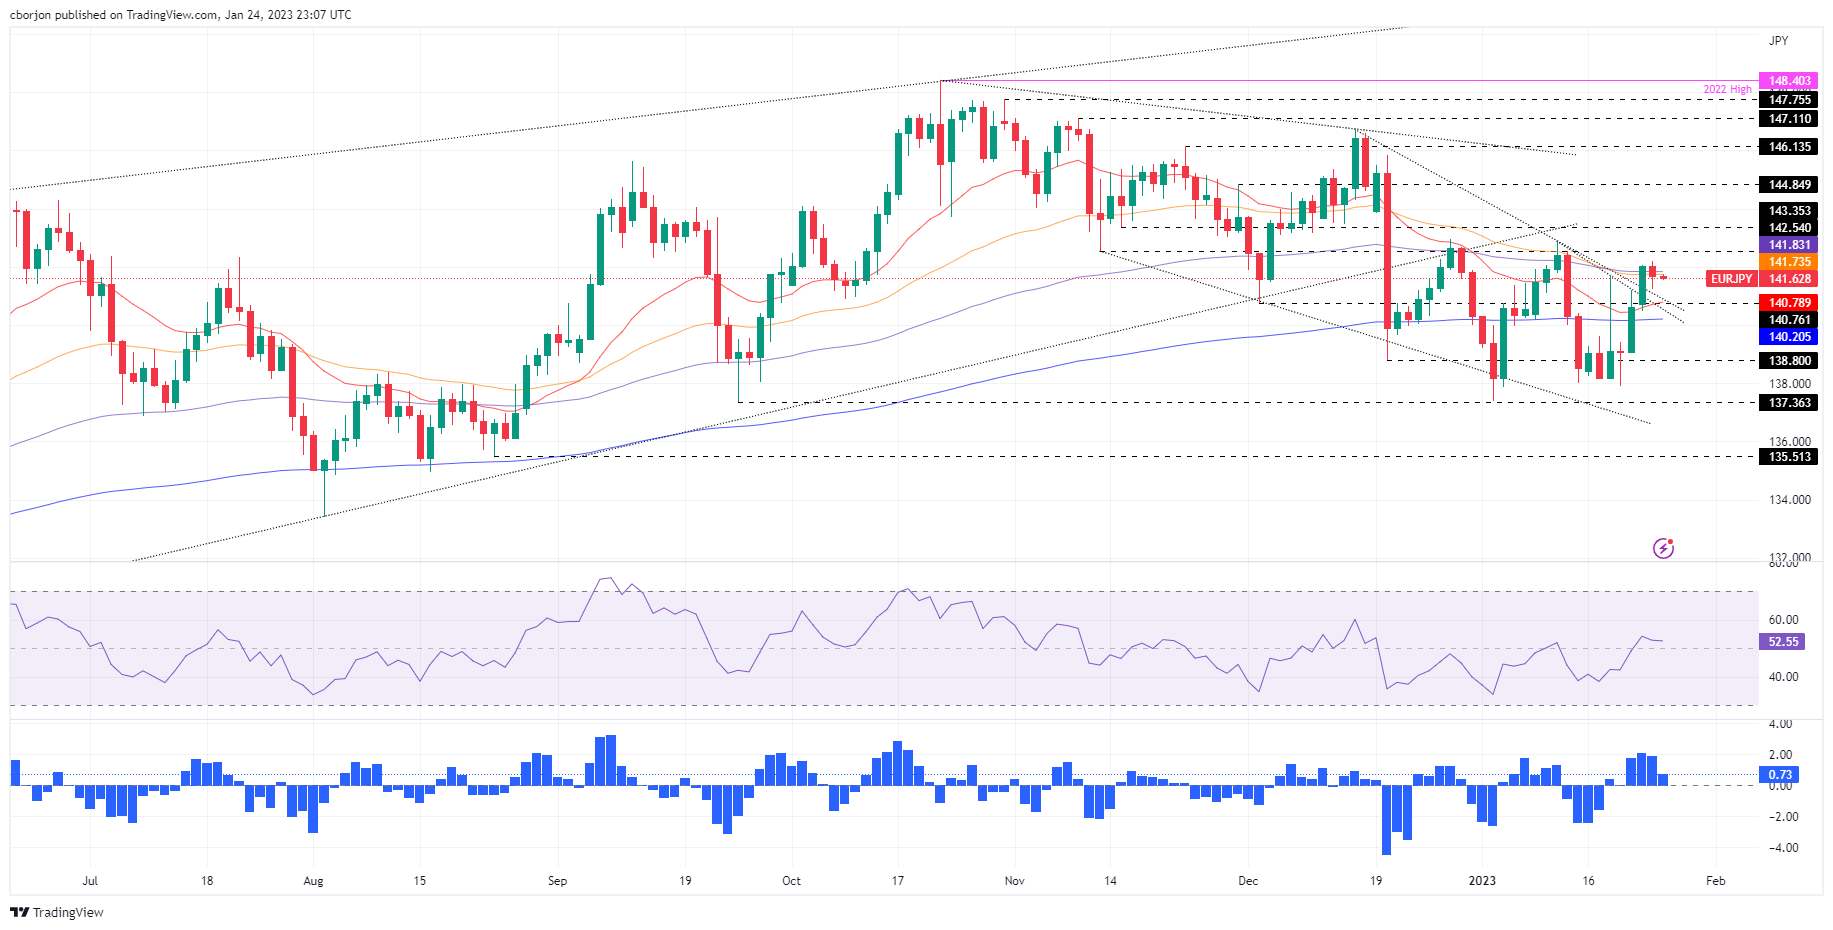
EUR/JPY snapped two days of consecutive gains and retraced some of its gains as the EUR/JPY clashed with the 100-day Exponential Moving Average (EMA) at 141.83 but could not crack it. Therefore, the cross dived beneath the latter, with Tuesday’s session closing at 141.65. As the Asian session begins, the EUR/JPY is trading at 141.62, registering minuscule losses of 0.04%.
EUR/JPY Price Analysis: Technical outlook
The EUR/JPY remains sideways, even though the pair reached a two-week high at 142.20. Although the EUR/JPY recovered 2% since last Friday, Tuesday’s price action formed a hanging man, suggesting the exchange rates would aim lower. Nevertheless, the EUR/JPY would face a confluence of support areas, like two previous downslope resistance trendlines, around 141.00. Once those trendlines are broken, the next zone of demand tested would be the 20-day EMA at 140.79, ahead of the 200-day EMA at 140.20
However, if buyers can hold above 141.00, a retest to the 100-day EMA at 141.73 is on the cards. A decisive break would expose the 142.00 psychological figure, followed by the January 11 high at 142.85.
EUR/JPY Key Technical Levels
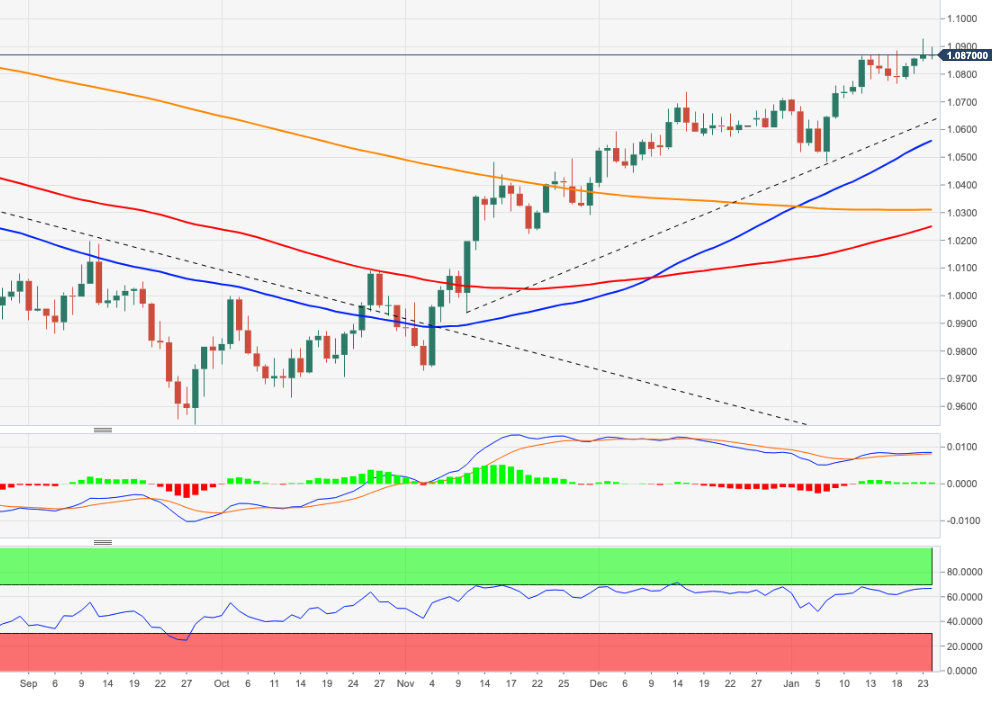
- EUR/USD is eyeing to recapture the 1.0900 resistance as ECB might not pause policy tightening beyond summer.
- The Euro is delighted with bullish bets for CY2023 as the ECB will continue to raise interest rates further.
- According to the consensus, investors should brace for a contraction in the US GDP for the fourth quarter of CY2022.
The EUR/USD pair is aiming for a recovery extension to near the critical resistance of 1.0900 as the odds of hawkish European Central Bank (ECB) bets are soaring dramatically. The major currency pair is looking to extend its upside journey further as the expectations of the continuation of policy tightening by the ECB beyond summer have strengthened.
Earlier, ECB President Christine Lagarde and other policymakers were stating that the central bank will reach an interest rate peak by the end of summer at 3.25%.
ECB policymaker Gediminas Simkus said on Tuesday that the ECB should continue with 50 basis points (bps) rate hikes amid growing wage pressures, as reported by Bloomberg. Simkus further added that reaching the peak policy rate before summer 'may be unlikely' and noted that the strong core Consumer Price Index (CPI) shows that their battle against inflation is not over yet.
Meanwhile, the street has started delivering bullish projections for the Euro for CY2023 considering the fact the ECB will continue to raise interest rates further. According to economists at CIBC Capital Markets, “The improved macro backdrop comes as the ECB now details that ‘rates will still have to rise significantly at a steady pace to reach levels that are sufficiently restrictive to ensure a timely return of inflation to the 2% medium-term target.’’
The market mood seems neutral as S&P500 remained choppy in Tuesday’s trade ahead of the United States Gross Domestic Product (GDP) data. However, weakness in the 10-year US Treasury yields to near 3.45% and in the US Dollar Index (DXY) to 101.50 support indicate that the risk-perceived currencies could remain in a positive trajectory ahead.
According to the consensus, the annualized GDP is seen lower at 2.8% vs. the prior release of 3.2%. An expression of a contraction in overall economic activities might accelerate recession fears in the United States.
- AUD/USD is aiming to print a fresh five-month high above 0.7060 ahead of Australian inflation.
- The USD Index has found an intermediate cushion around 101.50, however, the downside bias is still solid.
- A bullish momentum will be triggered after a jump by the RSI (14) into the bullish range of 60.00-80.00.
The AUD/USD pair is juggling in a narrow range above the crucial support of 0.7040 in the early Asian session. The Aussie asset is on the verge of hitting a five-month high at 0.7060 ahead of the release of the Australian Consumer Price Index (CPI) data. The consensus claims an escalation in the annual inflation to 7.5% from the prior release of 7.3%. While monthly inflation is seen sharply higher at 7.7% from the former release of 7.3%.
Investors’ risk appetite has improved again as S&P500 futures have recovered their marginal losses witnessed on Tuesday. The US Dollar Index (DXY) has found an intermediate cushion around 101.50, however, the downside bias is still solid.
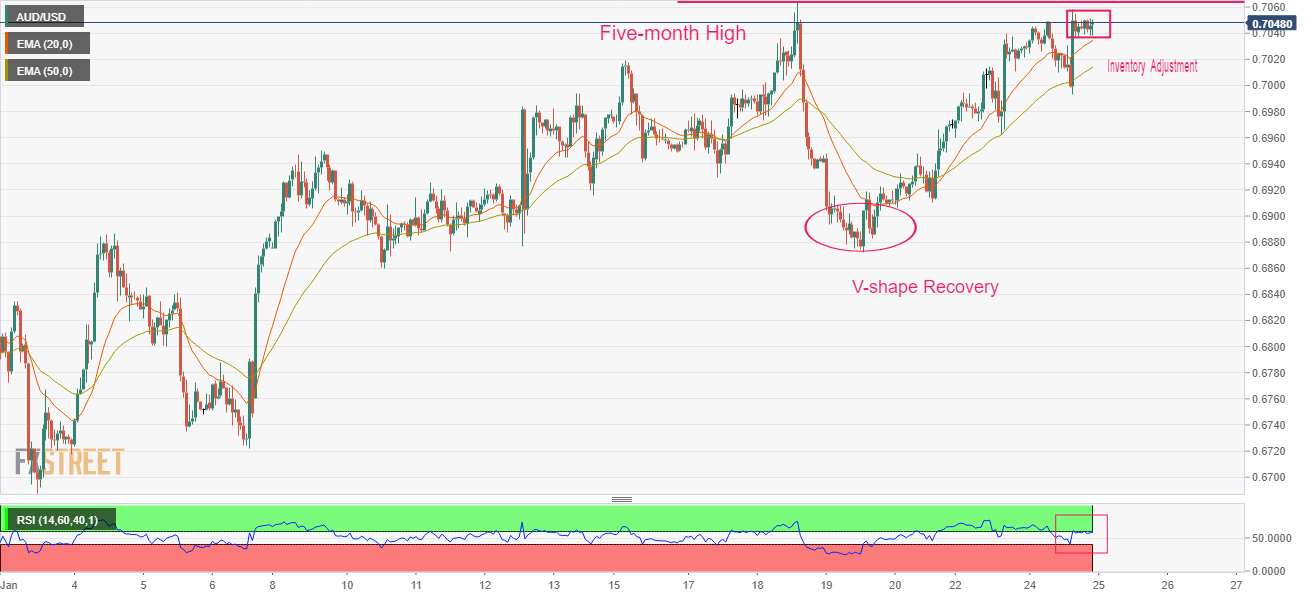
AUD/USD is marching towards the five-month high plotted from January 18 high at 0.7064 on an hourly scale. The Aussie asset displayed a V-shape recovery from January 19 low around 0.6875, which provides confidence that bullish momentum is present in the current trend.
Upward-sloping 20-and 50-period Exponential Moving Averages (EMAs) at 0.7035 and 0.7014 respectively, add to the upside filters.
What is interesting in the current scenario is the inventory adjustment phase below the critical resistance of 0.7060. This seems to be an inventory accumulation in a bullish trend, which favors the continuation of the upside journey after the conclusion.
Also, the Relative Strength Index (RSI) (14) is looking to shift into the bullish range of 60.00-80.00, which will trigger the bullish momentum.
For more upside, the Aussie asset needs to surpass the five-month high around 0.7060 decisively, which will drive the major towards August 11 high at 0.7137. A breach of the latter will expose the asset to the round-level resistance at 0.7200.
On the contrary, a downside move below December 29 low at 0.6710 will drag the major further toward December 22 low at 0.6650 followed by November 21 low at 0.6585.
AUD/USD hourly chart
- USD/CAD holds lower ground on the Bank of Canada interest rate announcement day.
- Sluggish MACD, sideways performance near 38.2% Fibonacci retracement challenge bears.
- Convergence of 200-day EMA, support line from early June portrays strong support.
- Buyers need to cross descending resistance line from mid-October 2022.
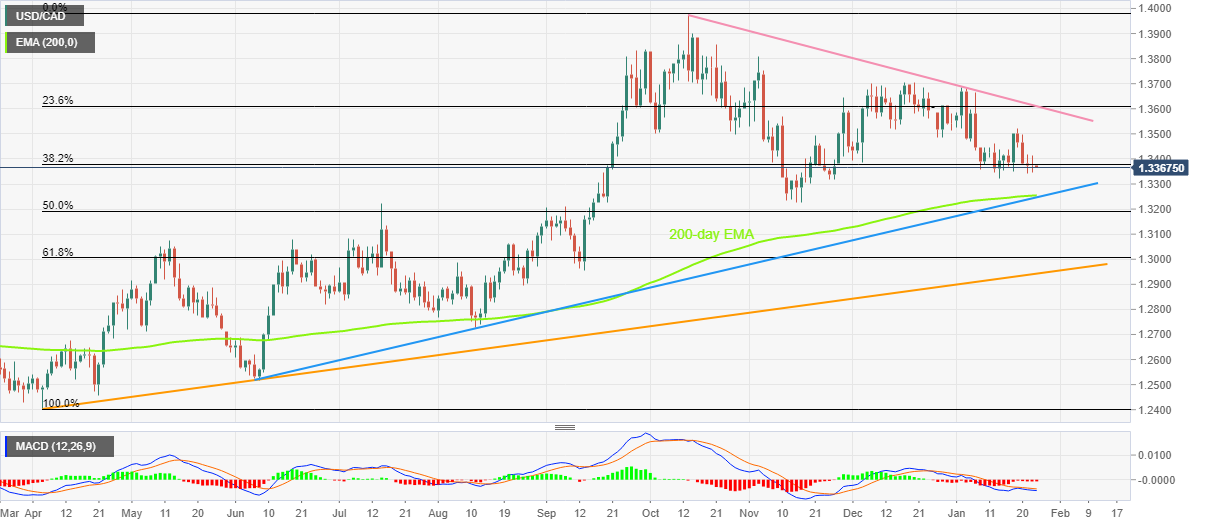
USD/CAD portrays the typical pre-event anxiety as it makes rounds to 1.3370-60 during early Wednesday in Asia. In doing so, the Loonie seesaws near the 38.2% Fibonacci retracement level of the Loonie pair’s April-October upside amid the sluggish MACD signals.
It’s worth noting, however, that the USD/CAD pair appears clubbed between the 1.3250 support confluence and the descending resistance line from October 2022 near 1.3610. That said, the 200-day Exponential Moving Average (EMA) joins ascending trend line from June to highlight the 1.3250 as the short-term key support level.
Given the Bank of Canada’s (BoC) 0.25% rate hike already priced-in, the USD/CAD bears need either hawkish remarks from the BoC statement or the higher rate increase to extend its downturn.
Also read: Bank of Canada Preview: The final one, with a pause ahead?
In that case, the 1.3250 support confluence will gain the market’s attention, a break of which could direct the USD/CAD bears towards the 50% and 61.8% Fibonacci retracement levels, respectively near 1.3190 and the 1.3000 psychological magnet.
Alternatively, the previous weekly high of 1.3520 could gain the USD/CAD buyer’s attention in case of the pair’s recovery post-BoC.
Even so, a convergence of the multi-day-old resistance line and the 23.6% Fibonacci retracement level could challenge the Loonie pair’s further upside near 1.3610.
USD/CAD: Daily chart
Trend: Further downside expected
- Silver recovered some bright on Tuesday and gained 0.90% after plummeting more than 1% on Monday.
- XAG/USD Price Analysis: Rally capped at the 20-day EMA.
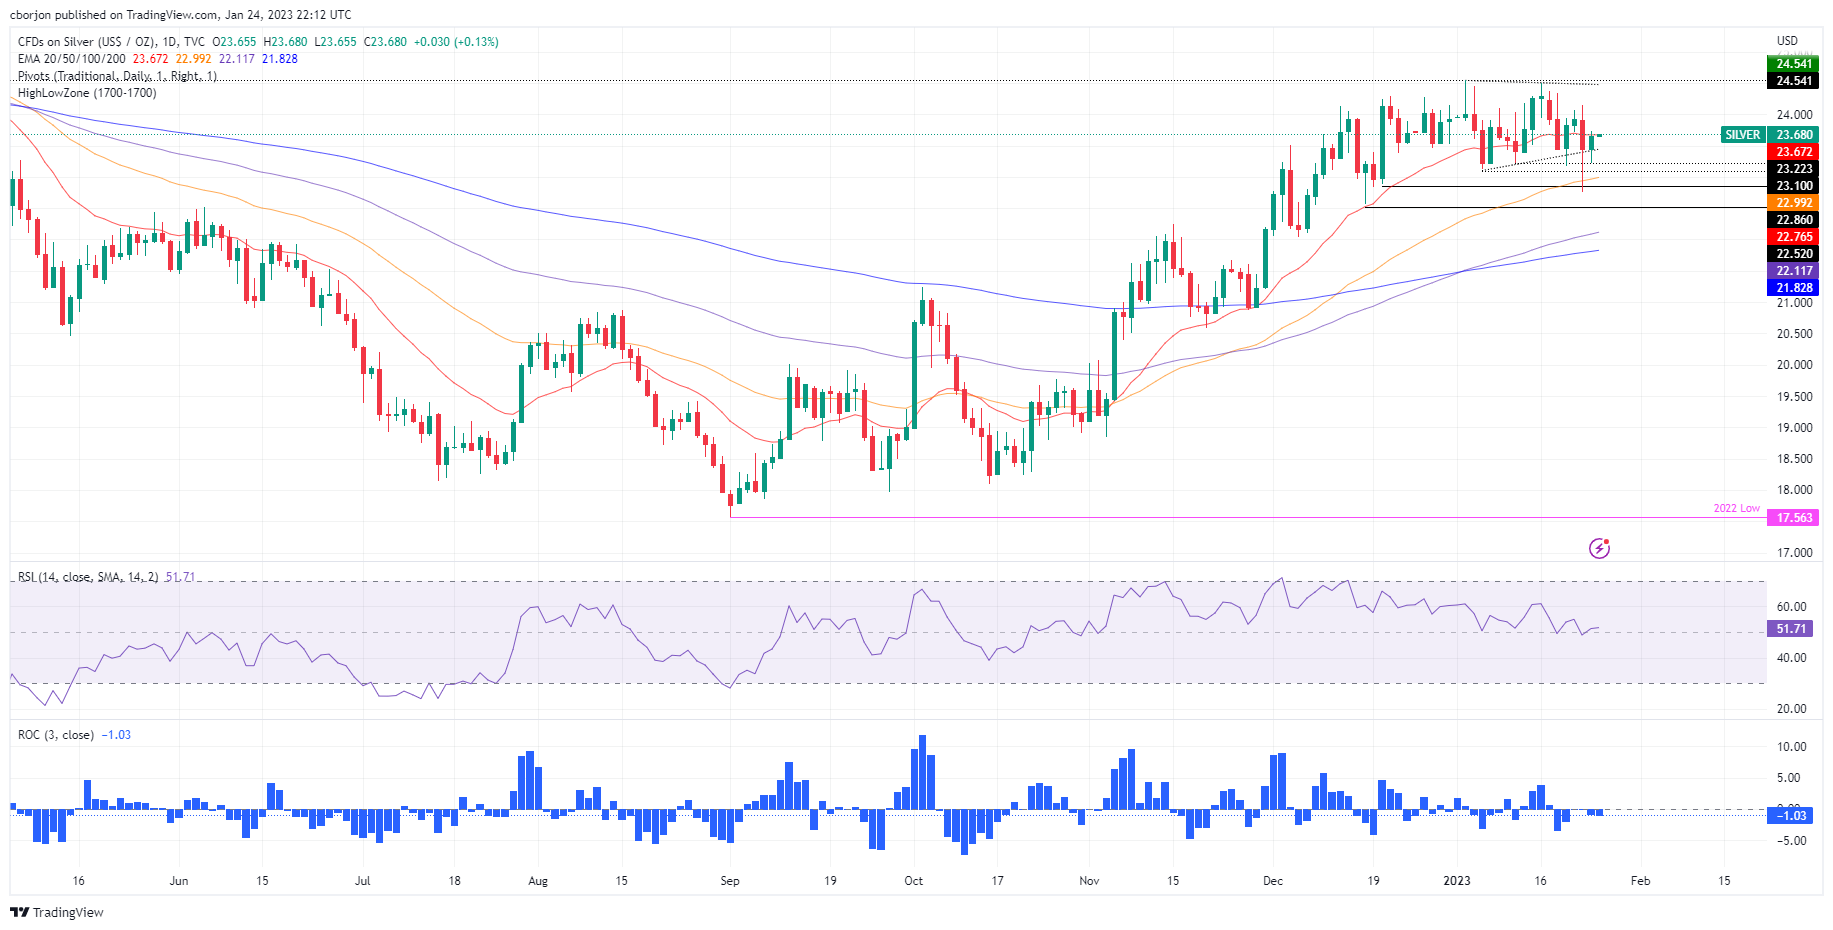
Silver price recovers some ground and is back above Monday’s daily close, still struggling to break the 20-day Exponential Moving Average (EMA) at $23.67 a troy ounce. However, it trimmed some losses after nosediving sharply underneath the 50-day EMA and reaching a 5-day low of $22.76. The XAG/USD is trading at 23.64, up by 0.85%, as of typing.
Silver Price Analysis: Technical outlook
After visiting the 50-day EMA, XAG/USD resumed its uptrend, though it encountered solid resistance in the form of the 20-day EMA at 23.67. Nevertheless, bulls could remain hopeful that XAG/USD could continue to rise further as it reclaimed a three-week upslope support trendline around $23.40s.
Looking ahead, if Silver’s prices break above the 20-day EMA, that could open the door for further upside, exposing crucial resistance levels. Firstly, the psychological $24.00 a troy ounce, followed by the YTD high of $24.54. A breach of the latter and the $25.00 figure is up for grabs.
Otherwise, the XAG/USD first support would be $23.40. Once cleared, sellers would likely mount and drag prices to the 50-day EMA at $22.99. A decisive break could send the XAG/USD sliding toward December’s 16 daily low at $22.56.
Silver Key Technical Levels
- GBP/USD is looking to surpass 1.2350 after a recovery move amid a risk-on market mood.
- The USD Index has been weighed down by weaker US yields as the odds of a slowdown in the Fed’s policy tightening are solid.
- This week, the release of the US GDP data will be of utmost importance.
The GBP/USD pair is looking to extend its recovery move above the immediate resistance of 1.2340 in the early Tokyo session. The Cable delivered a V-shape recovery on Tuesday after S&P reported better-than-projected preliminary United States PMI data (Jan). It seems that the street was expecting an upbeat performance and therefore supporting the US Dollar Index (DXY) earlier. But later on, dumped the USD Index as a ‘Buy on rumor and sell on news’ indicator was triggered.
S&P500 futures remained choppy on Tuesday and settled with a marginal loss. However, the 500-US stock basket futures have recovered their marginal loss now and portraying a recovery in the risk appetite theme. The return generated by the 10-year US government bonds slipped sharply to 3.45% as the odds of a slowdown in the pace of policy monetary policy tightening are extremely solid.
United States Manufacturing PMI landed at 46.8, higher than the expectations of 46.1 and the former release of 46.2. Also, the Services PMI remained upbeat and scaled higher to 46.6 against the consensus of 44.5 and the prior release of 44.7. The release of the better-than-anticipated US PMI has trimmed recession fears for a while.
For further guidance, investors will focus on the release of the preliminary US Gross Domestic Product (GDP), which is scheduled for Thursday. As per the projections, the annualized GDP is seen lower at 2.8% vs. the prior release of 3.2%. An expression of a contraction in overall economic activities might accelerate recession fears again on a broader basis.
On the United Kingdom front, investors are awaiting the release of the Producer Price Index (PPI) (Dec) data. As per the consensus, the core PPI output is seen higher at 13.9% vs. the former release of 13.3%. Shortage of labor and rising wages for addressing the former could be the reason behind rising prices of goods and services at factory gates.
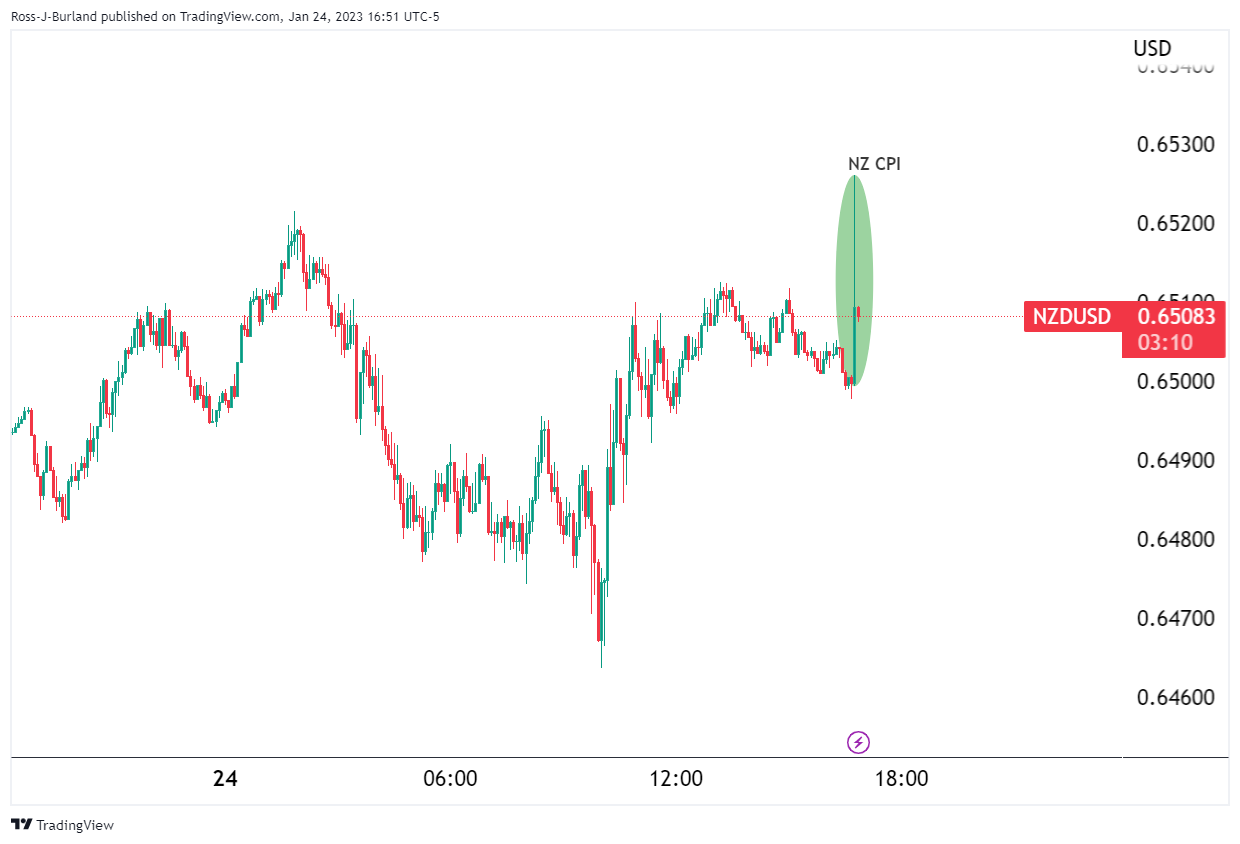
- NZD/USD pops 25 bps on upbeat New Zealand Q4 Consumer Price Index.
- NZ CPI came in 7.2% YoY, 1.2% QoQ versus 7.1% and 1.3% expected respectively.
- US PMIs failed to impress US Dollar for long as Composite PMI marked seven-month downtrend.
NZD/USD begins Wednesday’s trading on a firmer footing on upbeat New Zealand (NZ) inflation data, initially poping up to 0.6525 before retreating to 0.6500 by the press time. Adding strength to the Kiwi pair’s run-up could be the US Dollar’s failure to keep the late Tuesday’s gains amid dovish bias for the Federal Reserve’s next move.
NZ Consumer Price Index (CPI) for the fourth quarter (Q4) rose past 7.1% YoY market forecast to reprint the 7.2% figures while the QoQ data suggests a 1.4% number against 1.3% expected and 2.2% prior. It’s worth noting that the Reserve Bank of New Zealand (RBNZ) anticipated 7.5% yearly inflation in its November meeting.
Also read:
On the other hand, preliminary readings of the US S&P Global Manufacturing PMI for January rose past 46.2 market forecast and 46.1 market expectations with 46.8 figure while the Services PMI followed the suit with the 46.6 figure for the said month, versus 44.5 forecast and 44.7 prior. That said, the S&P Global Composite PMI for January increased to 46.6 from 45.0 prior and the 44.7 consensus, marking the seventh consecutive read below 50.
Following the US data, the US Dollar Index (DXY) managed rise for a brief time before closing in the red. The reason could be linked to the comments from Chief Business Economist at S&P Global Chris Williamson who said, “The US economy has started 2023 on a disappointingly soft note, with business activity contracting sharply again in January."
That said, receding odds of the Federal Reserve's (Fed) hawkish play in the next week’s monetary policy meeting, mainly due to the recently downbeat US data seemed to have weighed on the US Treasury bond yields, as well as the US Dollar. It should be noted that the mixed earnings report and sentiment portrayed Wall Street’s mixed close on Tuesday.
Having witnessed the initial reaction to New Zealand inflation data, which is not much alarming, the NZD/USD pair traders may wait for Australia’s CPI and NZ Credit Card Spending data for December for immediate directions.
Technical analysis
A six-week-old ascending resistance line near 0.6535 restricts immediate NZD/USD upside amid nearly overbought RSI conditions.
The Consumer Price Index released by the Statistics New Zealand is out as follows:
- New Zealand Q4 inflation 1.4% QoQ (expected 1.3%) 7.2% YoY (expected 7.1%)
New Zealand's consumer price index (CPI) rose 1.4% in the fourth quarter on the prior quarter, above analysts' forecasts. This compares with a 2.2% rise in the previous quarter. Annual inflation remained stable at 7.2%. Economists polled by Reuters had forecast a 1.3% rise for the quarter, with an annual rise of 7.1%.
NZD/USD rallied to test the 0.6520s.
About NZ CPI
With the Reserve Bank of New Zealand's (RBNZ) inflation target being around the midpoint of 2%, Statistics New Zealand’s quarterly Consumer Price Index (CPI) publication is of high significance. The trend in consumer prices tends to influence RBNZ’s interest rates decision, which in turn, heavily impacts the NZD valuation. Acceleration in inflation could lead to faster tightening of the rates by the RBNZ and vice-versa. Actual figures beating forecasts render NZD bullish.
Here is what you need to know for January 25:
The US Dollar edged lower against the euro and was vulnerable across the board despite solid US manufacturing data that gave some life to otherwise consolidative markets ahead of key events for the days ahead. The markets are in anticipation of inflation data from the antep[iodeans and the US on Thursday as well as growth updates for the US economy.
Firstly, eurozone business activity made a surprise return to modest growth in January, which helped to boost the Single currency. EUR/USD was 0.09 % higher at $ 1.0881, just shy of the 9-month high of $ 1.0927 touched on Monday backed by survey data supporting the view that the eurozone economy was fairing well despite intense price pressures. At the start of the week, the euro was bid on the back of European Central Bank (ECB) officials suggesting that the ECB is set to raise interest rates by 50 basis points in both February and March and will continue to raise rates in the months after.
The US Dollar rose to a near 1-week high against the yen, before giving up those gains but staying above its weakest since May which it visited ahead of a Bank of Japan policy review. However, the BoJ left policy unchanged enabling a move higher in USD/JPY that touched 131.11 on the day.
GBP/USD was one of the worst-performing pairs and dropped by 0.34 % on the day to 1.2263 after a survey showed British private-sector economic activity fell at its fastest rate in two years in January.
USD/CAD was ending near flat on the day after travelling between a low of 1.3346 and a high of 1.3413 so far while US stocks have been volatile making for choppy trading conditions in the forex space on Tuesday.
Meanwhile, the US 10-year yield was 4bp lower at 3.47% and WTI was down 1.8% at USD80.15/bbl. Gold dropped 0.3% to $1,933.3/oz. Bitcoin was little changed on the day at $22,973, steadying after having jumped by about a third in value since early January.
For the day ahead, Aussie and New Zealand inflation data will be key.
- EUR/USD bullish rally has faded and a topping pattern is in play.
- There is a bearish bias while EUR/USD remains below 1.0950.
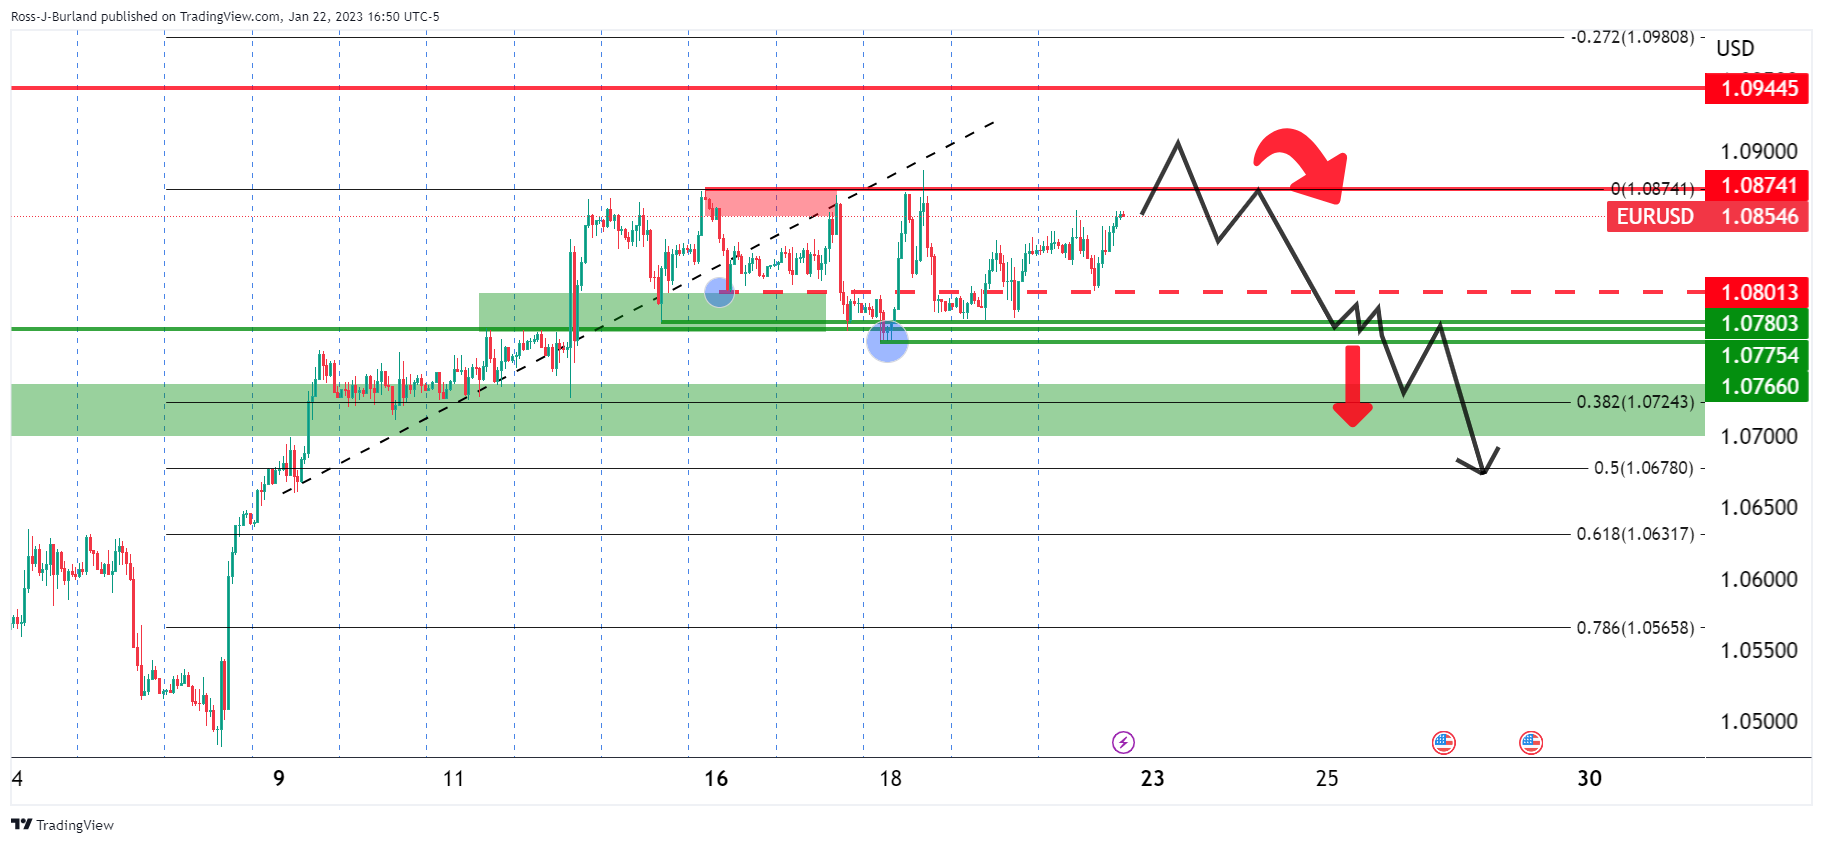
As per the pre-open analysis at the start of this week, when there were reports by Reuters that the European Central Bank (ECB) officials were suggesting that the ECB is set to raise interest rates by 50 basis points in both February and March and will continue to raise rates in the months after, the euro has stuck tot he forecasted schematic as follows:
EUR/USD prior analysis
(Bearish schematic could be playing out)
It was stated that the Euro was in the barroom brawl, chopping around support and resistance. The analysis argued that if the bulls commit, then the 1.0870/90s and potentially the 1.09 psychological level could be attractive to the bears who are in anticipation of a premium for the opening sessions of the week.
EUR/USD update
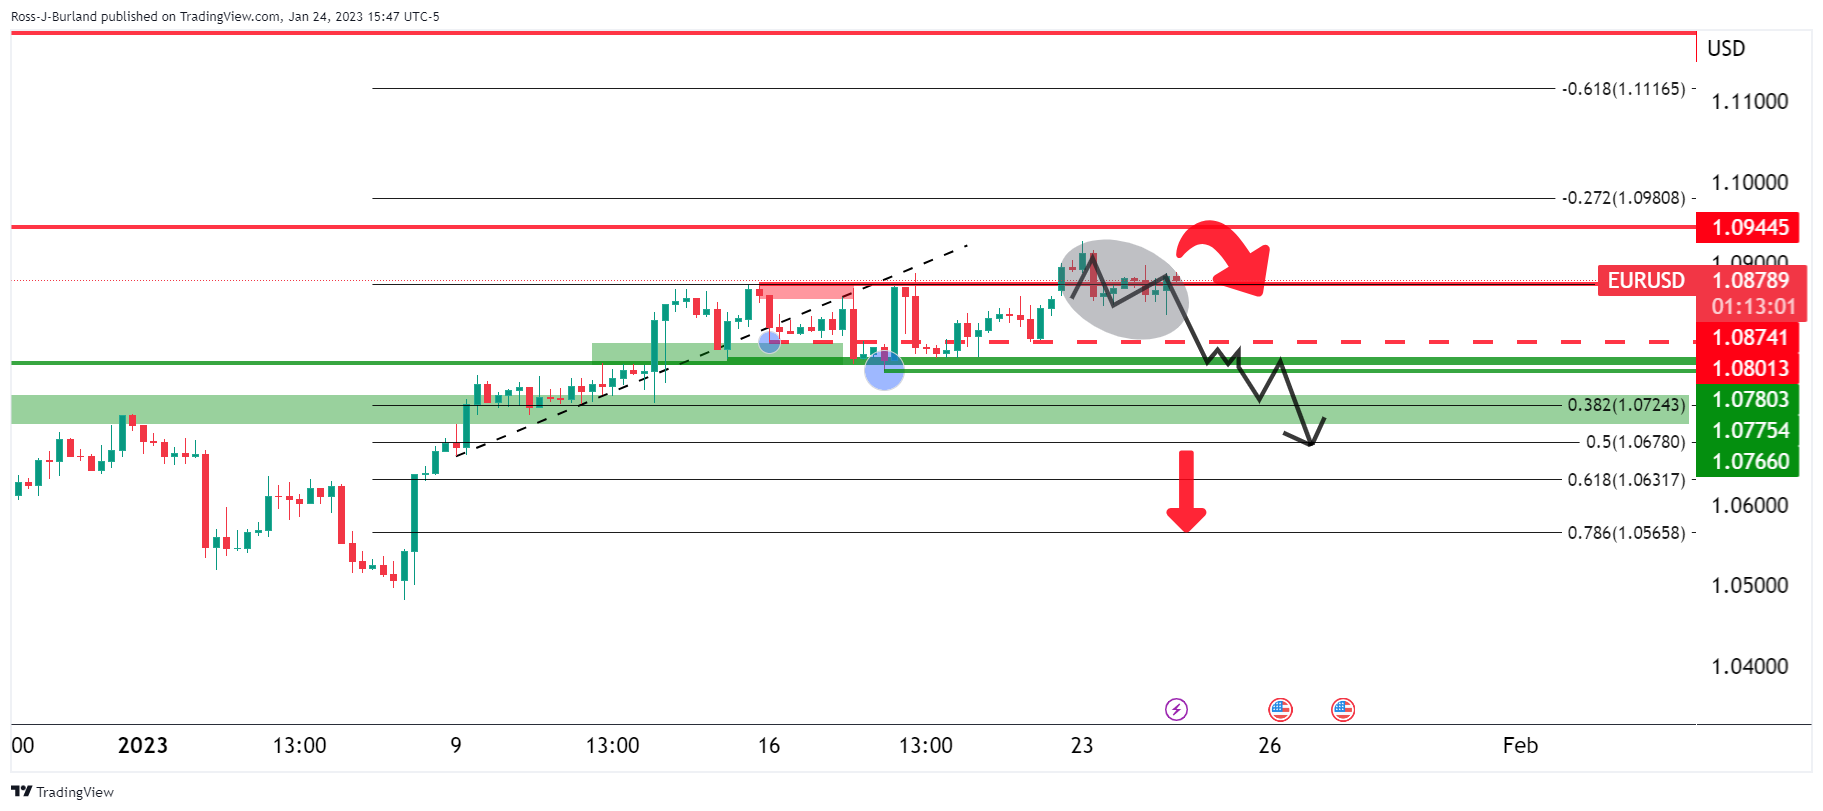
The bullish rally has faded. There is still plenty to go, however, until critical US calendar events and the US dollar remains capped at resistance. Therefore, there are no dramatic moves expected over the course of the day ahead Nevertheless, a topping pattern is in play in EUR/USD and that leaves the bias to the downside while below 1.0950.
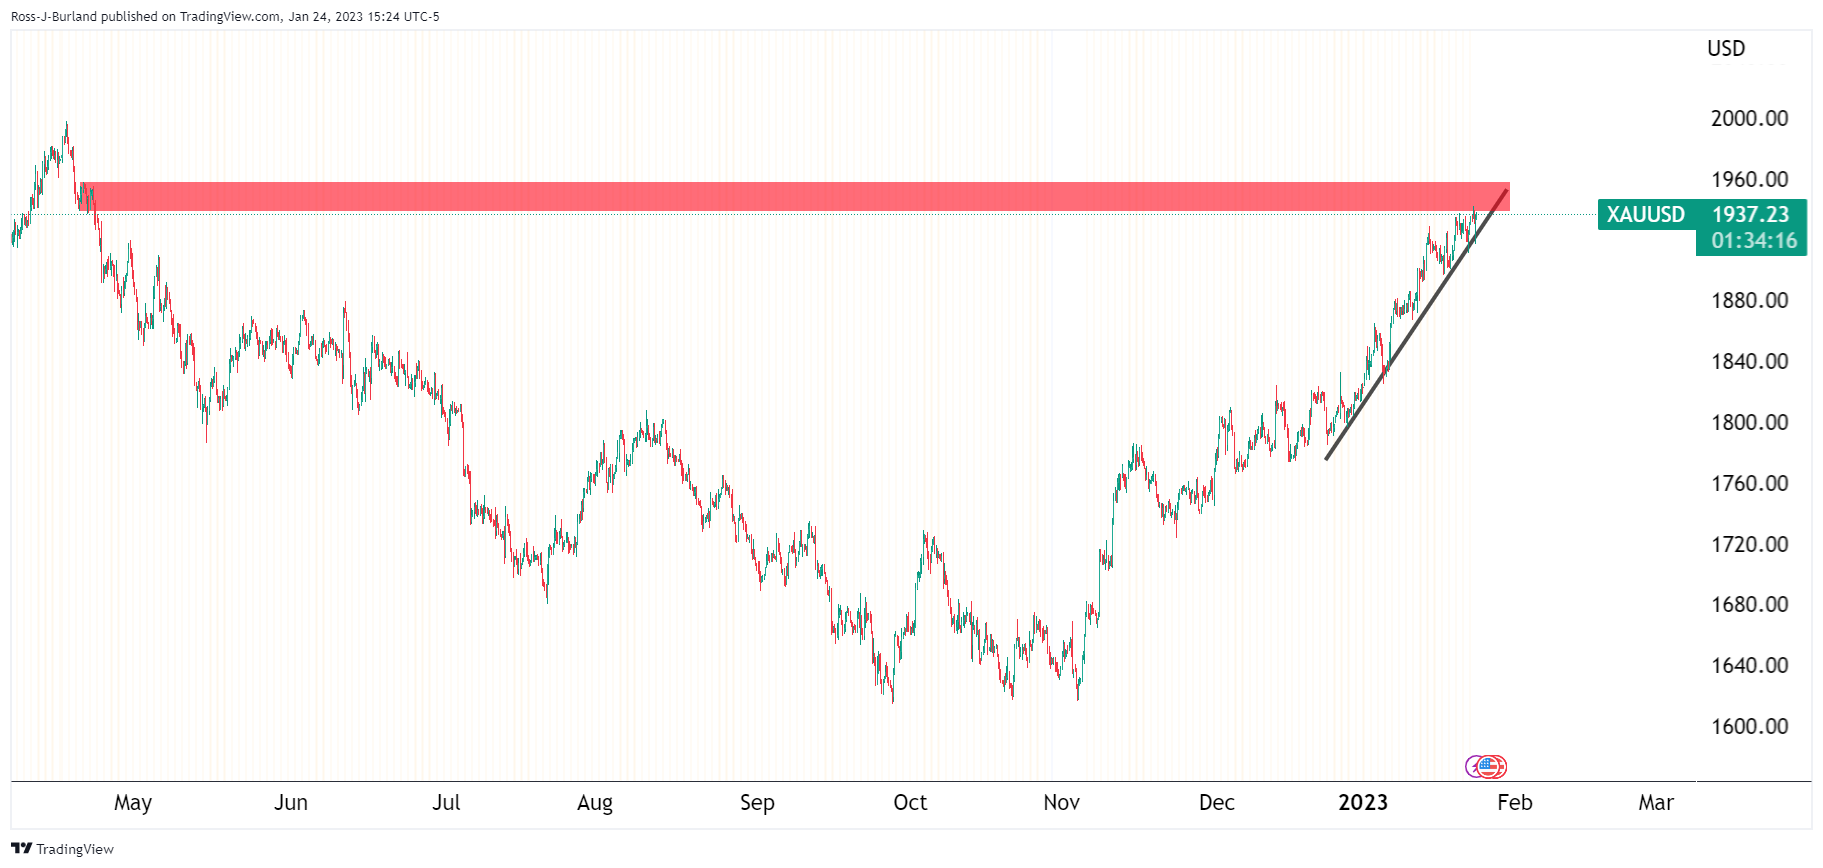
- Gold price is running into a critical resistance area on the charts.
- A sell-off in Gold price and capitulation of the bulls could lead to a significant run towards $1,900.
The Gold price is making progress on the day into the final push on Wall Street and rallied from a low of $1,917.22 to a high of $1,942 on the day so far.
Gold price rose to the highest in nine months as the US Dollar and bond yields came under pressure following the start of the week's 1% drop in leading economic indicators in December which solidified the dovish sentiment surrounding the Federal Reserve, Fed, that is now expected to announce another interest-rate hike when its policy committee meets next week.
The US Dollar was weakening, making the metal more affordable for international buyers while the Fed officials are out on the blackout week ahead of the highly anticipated Fed interest rate decision. the Gold price flourished with investors now awaiting US economic data due this week that could impact the Federal Reserve's policy path.
Federal Reserve is eyed, sentiment mixed
Investors are banking on the Federal Reserve raising rates by 25 basis points (bps) at the January 31 - February 1 policy meeting, after slowing its pace to 50 bps in December, following four straight 75-bp hikes. Meanwhile, the Gold price tends to benefit due to lower interest rates that otherwise decrease the opportunity cost of holding the non-yielding asset.
The most hawkish of comments came from St. Louis Federal Reserve's President James Bullard who said US interest rates have to rise further to ensure that inflationary pressures recede.
''We’re almost into a zone that we could call restrictive - we’re not quite there yet,” Bullard said Wednesday in an online Wall Street Journal interview. Officials want to ensure inflation will come down on a steady path to the 2% target. “We don’t want to waver on that,” he said.
“Policy has to stay on the tighter side during 2023” as the disinflationary process unfolds, Bullard added.
Bullard has pencilled in a forecast for a rate range of 5.25% to 5.5% by the end of this year.
However, economic reports, such as Producer Price Index and Retail Sales have recently shown disinflationary tendencies, reinforcing expectations that the Fed will continue to reduce its tightening pace in upcoming meetings.
With that being said, analysts at ANZ Bank recently wrote a note, entitled, ''Fed tightening not done yet.''
''So far in early 2023, US data releases have indicated a mild easing in inflationary pressures and softer demand. This indicates the Fed’s aggressive tightening last year is starting to take effect,'' the analysts explained. ''Weakness in housing is evident (existing home sales fell 17.8% last year), manufacturing activity has faltered and Retail Sales are returning to trend.''
Meanwhile, analysts at Brown Brothers Harriman have also of the opinion that the market is underestimating the potential for a higher for longer Federal Reserve. ''Core Personal Consumption Expenditures, PCE, has largely been in a 4.5-5.5% range since November 2021,'' they said. ''We think the Fed needs to see further improvement before even contemplating any sort of pivot.''
EUR/USD and Europen Central Bank sentiment in the mix
Meanwhile, the Euro has been a little cheerier of late, also pressuring the US dollar and helping to support risk appetite and a bid into the Gold price. European Central policymaker, Peter Kazimir, said on Monday that inflation easing was good news but added that it was not a reason to slow the pace of interest rate hikes, as reported by Reuters.
Governing Council member and Governor of Austria's central bank Olli Rehn made some comments on the European Central Banks' interest rates policy during their appearances over the weekend also as did ECB governing council member Klaas Knot on Sunday, advocating steep rate hikes. "Expect us to raise rates by 0.5% in February and March and expect us to not be done by then and that more steps will follow in May and June," Knot said.
Analysts at TD Securities argued that the gold price could struggle to firm further in the absence of the single-largest buyer of gold over the past months. On the downside, a break below the $1,900/oz range is required to spark trend-follower liquidations.
Gold technical analysis
The Gold price is on track for a crash should the US dollar bust to life given the placement of the price in the market structure. The US Dollar has been testing the daily trendline resistance as follows:
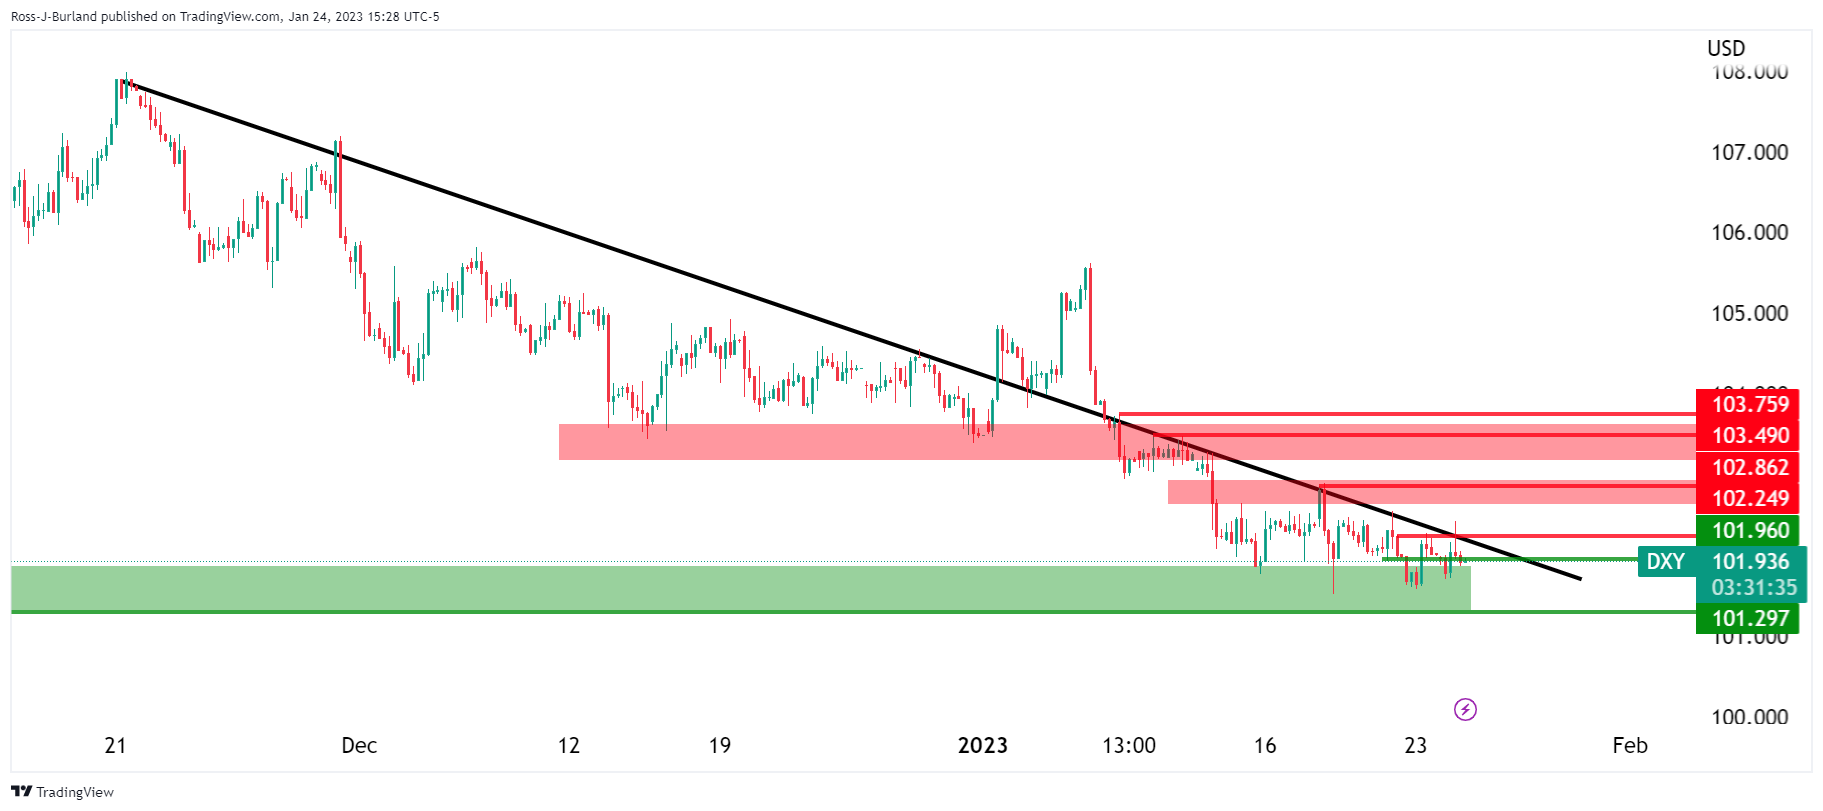
If this were to break then the Gold price will likely be headed lower, but there is red news scheduled for Thursday so any moves prior to that might be limited and a distribution schematic and higher highs could be more likely in the lead up:
Bullish trendline for Gold price is vulnerable.
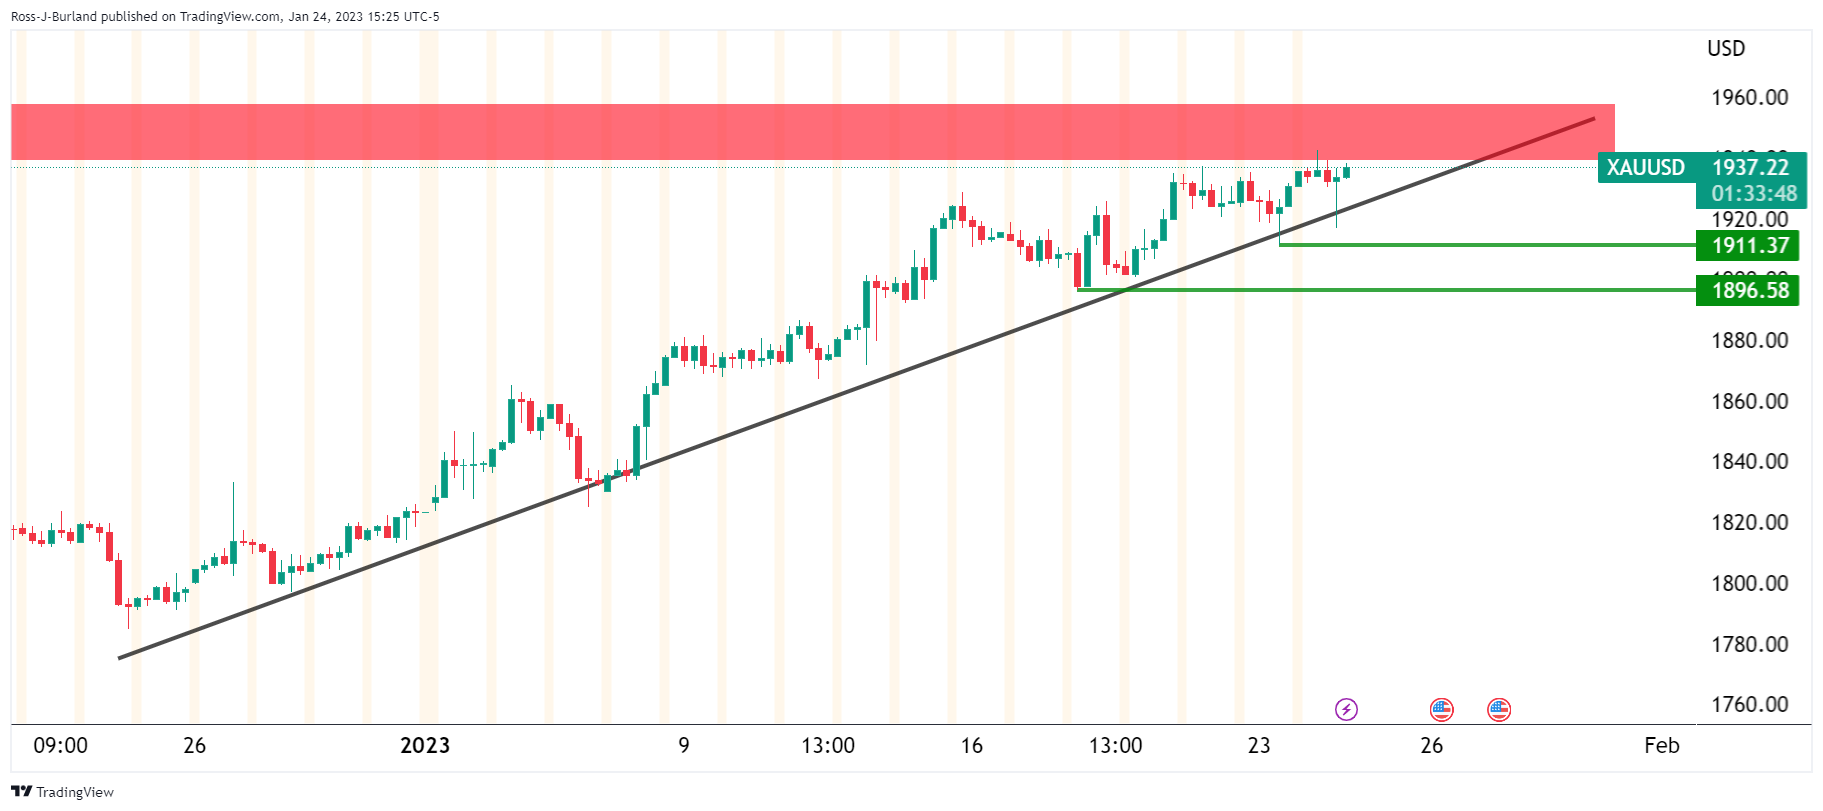
A break of Gold price structures is eyed for the days ahead so long as resistance holds.
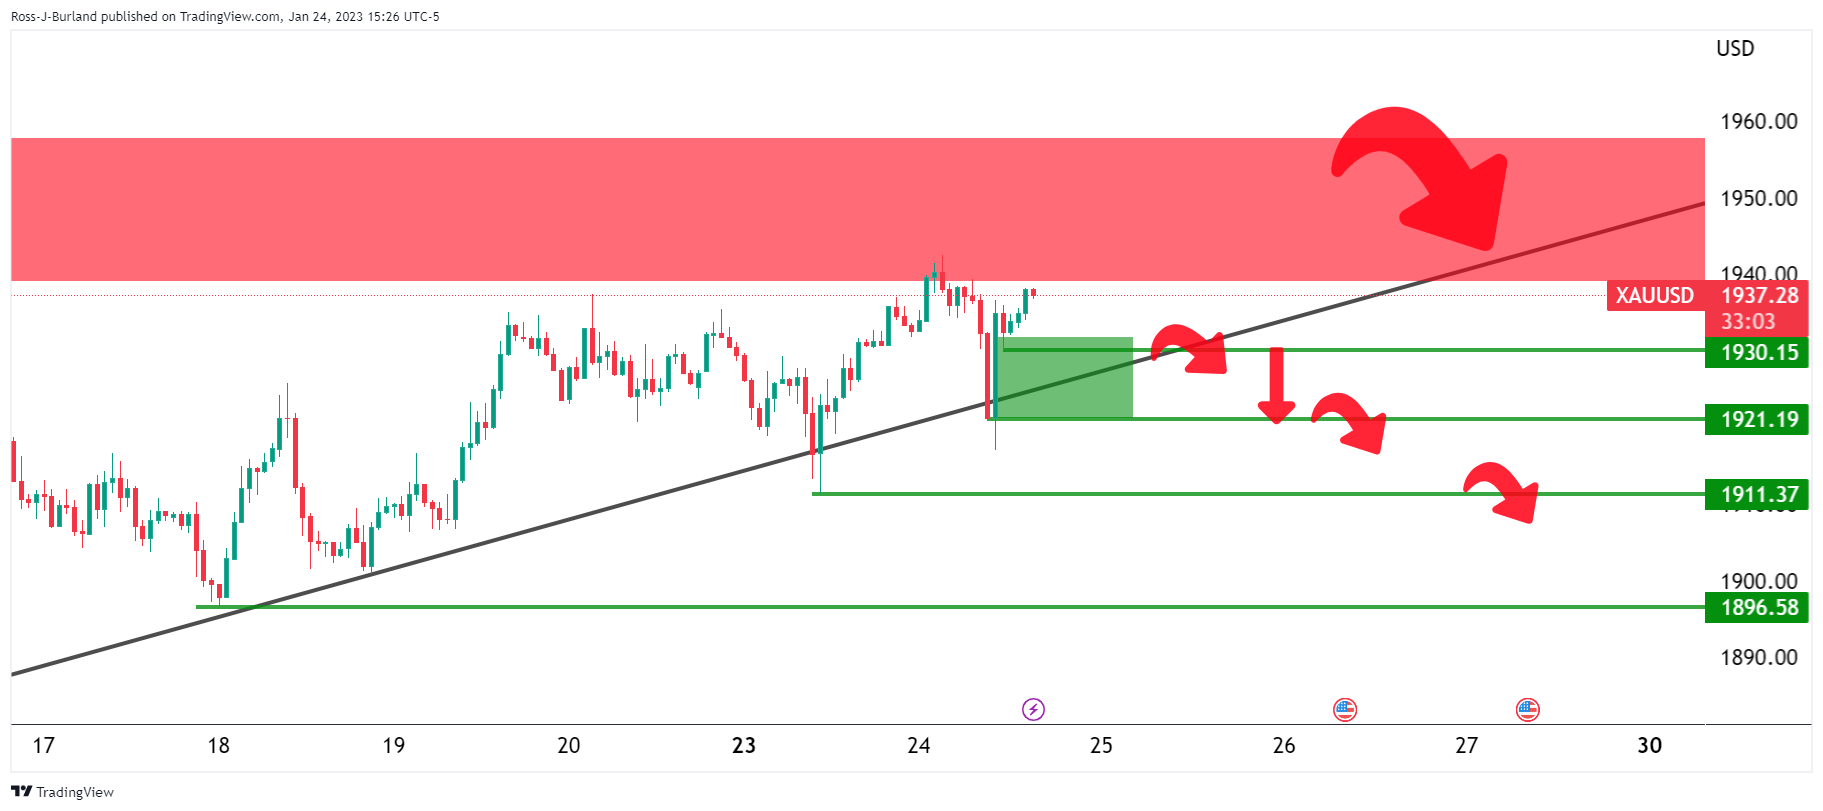
A sell-off and capitulation of the Gold price bulls could lead to a significant run towards $1,900.
- AUD/USD prolonged its rally to three straight days, though Wednesday’s Aussie inflation data could rock the boat.
- US S&P Global PMIs remained in contractionary territory but came better than expected.
- AUD/USD Price Analysis: To extend its uptrend once it reclaims 0.7070.
The AUD/USD remains firm late in the New York session, albeit a mixed market mood keeps traders bracing for safe-haven assets. The US Dollar (USD) has recovered some ground late in the session, putting a lid on the AUD/USD steadily advance. At the time of writing, the AUD/USD is trading at 0.7045.
AUD/USD climbs sharply ahead of Australia's inflation data
Wall Street remains mixed, as shown by the Dow Jones Industrial, remaining firm, while the S&P 500 and the Nasdaq fluctuate. The US economic calendar featured a business activity report issued by S&P Global. US December’s PMIs improved, with the Services PMI jumping to 46.6 vs. 44.7 expected, while Manufacturing PMI advanced to 46.8 vs. estimates of 46.2.
The S&P Global Composite, which measures both indices, climbed 46.6, higher than the foreseen 45 figure. It should be said that even though business activity continues to deteriorate in the US economy, the downward trend moderated some.
On the Australian side, the docket will feature inflation data. According to Reuters, expectations for the Consumer Price Index (CPI) for Q$ are 1.6%, while on an annual basis, it meanders at 7.5%. Analysts at TD Securities noted that “the trimmed measure that will draw more attention. TD is at 1.6% q/q vs. the RBA, and consensus at 1.5% q/q. Our forecast pegs annually trimmed to hit the highest levels since 1990 at 6.6% vs. the RBA and consensus at 6.5%, above the prior 6.1% y/y print. We expect annual trimmed between 6.1% and 6.5% to lock in a 25bps hike next month.”
AUD/USD Technical Analysis
The AUD/USD daily chart portrays the pair as upward biased. The pair managed to record gains in three consecutive days, though it had struggled to surpass the January 18 daily high of 0.7063. Nevertheless, the AUD/USD bias remains upward for some reasons: the 20-day Exponential Moving Average (EMA) crossed above the 200-day EMA, while the 50 and 100-day EMAs are closing by. In addition, the Relative Strength Index (RSI) remains in bullish territory. Therefore, the AUD/USD first resistance would be the 0.7063 YTD high, followed by the 0.7100 figure. Break above will expose the August 11 swing high of 0.7136.
- USD/JPY bulls are attempting to break higher ahead of key events.
- The bears are committing to critical resistance so far.
USD/JPY is attempting to break out of a medium-term downtrend with prospects of a move up for the week ahead as we move into key events on the US calendar. The Yen traders had been wrong-footed by the Bank of Japan's surprise policy tweak last month and the recent hold on policy has left the pair able to trend up to test the daily trendline resistance as the following technical analysis will illustrate:
USD/JPY daily chart
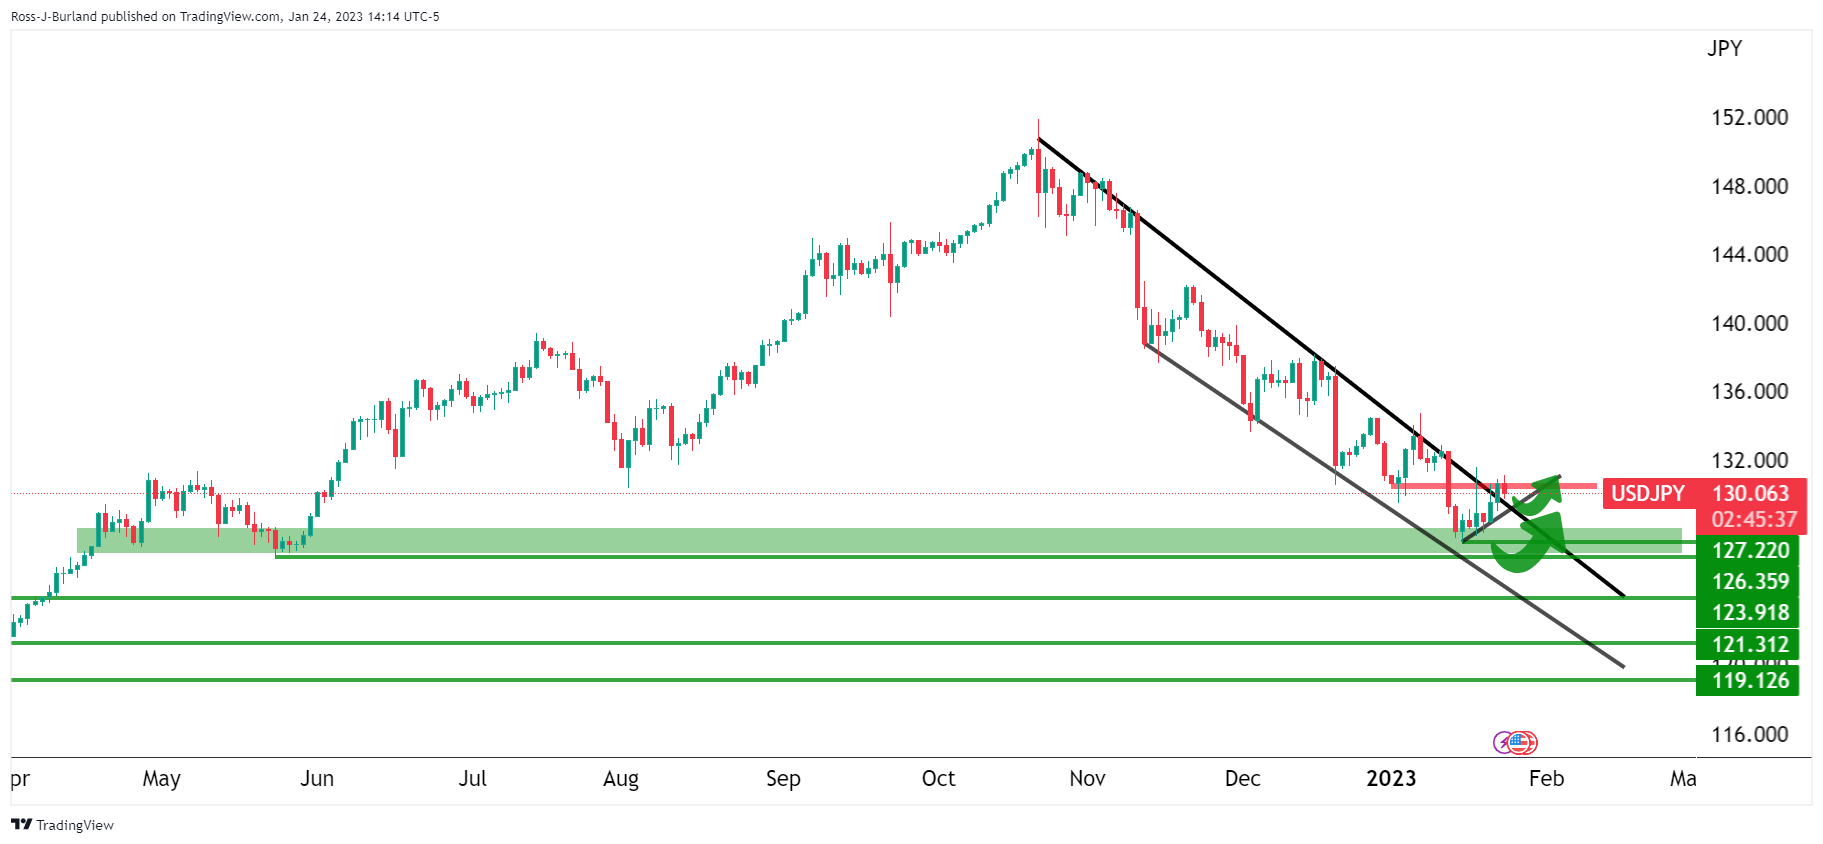
The bulls have been moving in since the end of last week and we are on the verge of a breakout. However, there is still plenty of work to do from the bulls as we head over to key events 9n the calendar as the following analysis on the 4-hour chart shows:
USD/JPY H4 chart

The price action is building a bullish case but the resistance is key. At this moment in time, there is a lack of commitment form the bulls at the trendline resistance and the tests are feeble. Failures open risks fo a pull back as we head over to the US calendar events on Thursday.
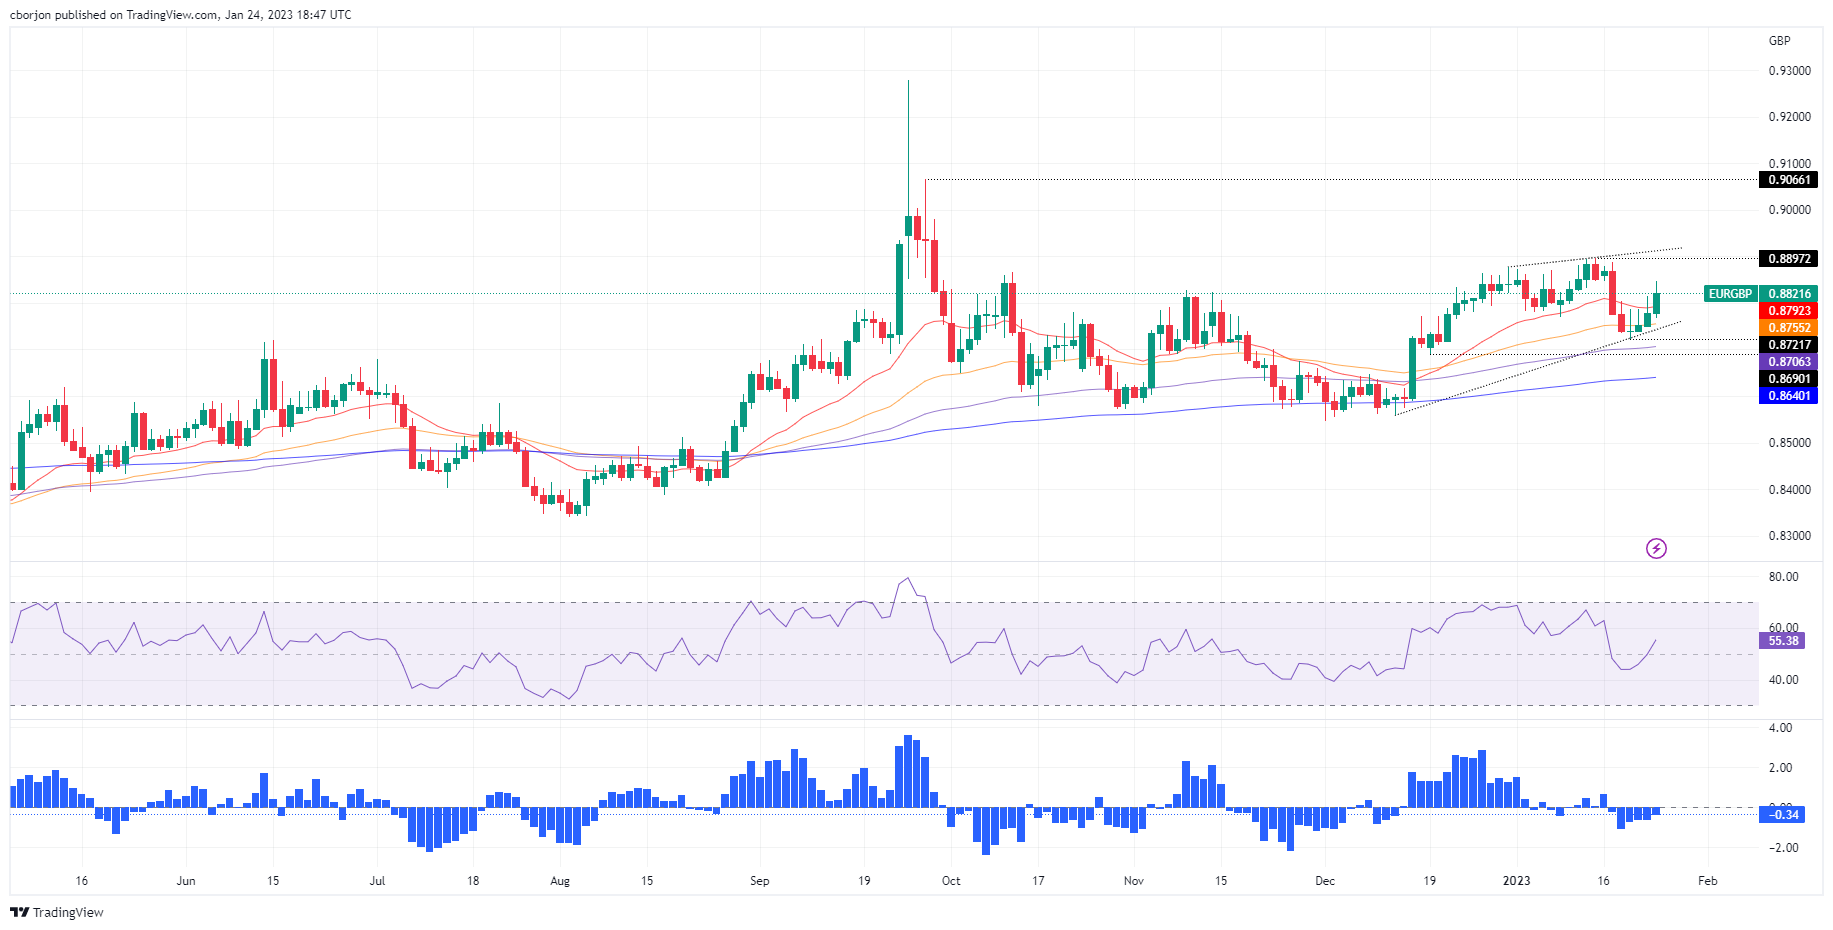
- EUR/GBP finds acceptance above the 20/50-day EMAs and 0.8800.
- The January 13 daily high at 0.8897 will be the bull’s next target if the EUR/GBP achieves a daily close above 0.8800.
The EUR/GBP hit a five-day new high at 0.8846, as positive Eurozone data outweighed bad UK PMIs, which reignited recessionary fears amongst Britons. Therefore, the EUR/GBP exchanges hands at 0.8823, above its opening price by more than 0.50%.
EUR/GBP Price Analysis: Technical outlook
After bottoming around 0.8721 last Thursday, the EUR/GBP achieved three straight days finishing with gains. In addition, the EUR/GBP climbed above the 50 and 20-day Exponential Moving Averages (EMAs), each at 0.8755 and 0.8792, respectively, opening the door for further upside.
Looking ahead, the EUR/GBP might hold its reins above 0.8800. Once achieved, the EUR/GBP might challenge the January 13 daily high of 0.8897, ahead of the 0.8900 mark. A breach of the latter will send the pair rallying to the September 28 swing high of 0.9066.
As an alternate scenario, the EUR/GBP first support would be the 0.8800 figure. Once broken, the 20-day EMA at 0.8792 would be tested and might allow a bearish continuation towards the 50-day EMA at 0.8755, ahead of a one-month-old upslope support trendline at 0.8740.
EUR/GBP Key Technical Levels
- USD/CHF rises but clashes with the 20-day EMA and retreats some of its gains.
- The USD/CHF failure to crack 0.9300 exacerbated a pullback towards 0.9220s.
The USD/CHF climbs slightly after hitting a daily low of 0.9192 and reclaims the 0.9200 figure in the mid-North American session. Nevertheless, the USD/CHF surrendered some of its earlier gains once it failed to stay above the 20-day Exponential Moving Average (EMA). At the time of writing, the USD/CHF is trading at 0.9228.
USD/CHF Price Analisis: Technical outlook
The daily chart shows that the USD/CHF remains neutral to downward biased. It was further cemented by the USD/CHF pair, which after reaching a daily high of 0.9297, it was unable to stay above the 20-day EMA at 0.9248. The USD/CHF retreated further but persisted in positive territory.
If the USD/CHF registers a daily close around Tuesday’s open, that will form a doji, which could exacerbate a resumption of the downtrend, posing a threat to the YTD low of 0.9091. Nevertheless, on its way south, the USD/CHF would find some hurdles, like the 0.9150 February 21 daily low, followed by the 0.9100 mark, and then the YTD low.
As an alternate scenario, the USD/CHF first resistance would be the 20-day EMA at 0.9248, followed by 0.9300. A breach of the latter will expose the 50-day EMA at 0.9356, followed by 0.9400.
USD/CHF Key Technical Levels
- USD/CAD all depends on the BoC this week and the build-up to the Fed next week.
- USD/CAD is flat on the day following stock market volatility.
USD/CAD is flat on the day after travelling between a low of 1.3346 and a high of 1.3413 so far while US stocks have been volatile making for choppy trading conditions in the forex space on Tuesday.
Stocks took a breather after a two-day rally, with earnings from major companies starting to roll in. Market participants also digested economic data on manufacturing which led to volatility while the New York Stock Exchange saw an unusual number of halts at the open.
Meanwhile, we have important events coming up in the forex commodities complex in NZ and Aussie CPI ahead of critical US economic data later in the week. The main focus is on the Bank of Canada, Wednesday, and the Federal Reserve at the start of next week.
There are a lack of catalysts outside of teeth data with the Fed officials out on the blackout week ahead of the highly anticipated Fed interest rate decision. The market is running on Fed-official-fumes following the speakers that commented on their outlooks for monetary policy in the build-up to next month's Fed meeting.
The most hawkish of comments came from St. Louis Federal Reserve's President James Bullard who said US interest rates have to rise further to ensure that inflationary pressures recede.
''We’re almost into a zone that we could call restrictive - we’re not quite there yet,” Bullard said Wednesday in an online Wall Street Journal interview. Officials want to ensure inflation will come down on a steady path to the 2% target. “We don’t want to waver on that,” he said.
“Policy has to stay on the tighter side during 2023” as the disinflationary process unfolds, Bullard added.
Bullard has pencilled in a forecast for a rate range of 5.25% to 5.5% by the end of this year.
However, there have been bearish tendencies in the US data of late for the US Dollar which has remained under pressure for the best part of the last couple of weeks. Economic reports, such as Producer Price Index and Retail Sales have shown disinflationary tendencies, reinforcing expectations that the Fed will continue to reduce its tightening pace in upcoming meetings.
However, analysts at ANZ Bank recently wrote a note, entitled, ''Fed tightening not done yet.''
''So far in early 2023, US data releases have indicated a mild easing in inflationary pressures and softer demand. This indicates the Fed’s aggressive tightening last year is starting to take effect,'' the analysts explained. ''Weakness in housing is evident (existing home sales fell 17.8% last year), manufacturing activity has faltered and Retail Sales are returning to trend.''
''This is exactly what the Fed wants as it tries to steer inflation sustainably back to target. But it is early days, and the Fed will not declare victory on inflation yet,'' the analysts reminded its readership.
''However, the Federal Open Market Committee is entering a more nuanced phase of the tightening cycle. The lagged effects of last year’s policy tightening still have further to bite, and so far, there is no widespread evidence that the labour market is weakening significantly''
''High visibility layoffs at some major tech and financial firms are grabbing the headlines, but the layoffs are global and US initial claims data are not indicating that labour demand is weakening. We think the Fed will continue to emphasise the tightness of the labour market in its deliberations and err towards further tightening. We expect a 25bp rate hike at the next meeting and guidance that rates will need to rise further.''
Meanwhile, as for the Bank of Canada, money markets see a roughly 70% chance that the Bank of Canada will raise its benchmark interest rate by 25 basis points to a 15-year high of 4.50% at a policy announcement on Wednesday, Reuters reported.
Analysts at TD Securities look for the BoC to hike by 25bp in January. ''We expect this will be the last hike this cycle, though the forward-looking component will not preclude future hikes.''
For the CAD. the analysts argue that the currency may not receive much directional bias from this meeting with markets focused on the other side of this interest rate cycle. ''CAD may be more sensitive to any dovish elements should the BOC emphasize elements from the BOS. CAD's correlation with risk is high so that may take on added importance.''
- GBP/USD reached its daily low after the release of US S&P Global PMIs.
- Business activity in the UK reignited recession fears and weakened the GBP.
- The market expects the Bank of England to hike rates by 50 bps on February 2 – RTRS Poll.
GBP/USD surrenders 1.2400 and drops towards the 1.2310 regions amid a mixed mood trading session, as US equities fluctuate between gainers/losers. Nevertheless, the American Dollar (USD) is losing traction and edging lower, capping the GBP/USD’s fall. At the time of writing, the GBP/USD is trading at 1.2320 after hitting a high of 1.2413.
GBP/USD fell as low as 1.2260s on better-than-expected US PMIs and weak UK data
Wall Street portrays a mixed picture, but it’s a matter of time before it turns positive. S&P Global reported that December’s PMIs for the United States (US) improved, with the Services PMI coming at 46.6 vs. 44.7 expected, while Manufacturing rose by 46.8 vs. estimates of 46.2. The S&P Global Composite, which measures both indices, increased by 46.6, higher than the foreseen 45 figure. Although business activity continues to show deterioration in the US economy, the downward trend moderated some.
Across the pond, UK’s business activity disappointed investors, with business activity falling at its fastest rate in two years, according to an S&P Global/CIPS Survey. “Weaker-than-expected PMI numbers in January underscore the risk of the UK slipping into recession,” S&P Global’s Chief Business Economist, Chris Williamson, said.
In the meantime, a Reuters Poll showed that 29 of 42 economists estimate the Bank of England to raise the Bank’s rate by 50 bps to 4% on February 2, while 13 estimated a 25 bps hike. In addition, the economists expect a peak rate of 4.25%.
Also read: Reuters Poll: Bank of England to lift bank rate by 50 bps to 4.00% on February 2
GBP/USD Technical Analysis
Technically, the GBP/USD daily chart suggests the pair is consolidating around 1.2400, unable to aim higher and test the 1.2500 mark. Also, in the last couple of days, successive lower lows have opened the door for further losses. Of note, the GBP/USD appears to be forming a double top. However, the GBP/USD would need to fall below the January 6 daily low of 1.1841 to confirm its validity.
GBP/USD Key support levels are the 1.2300 figure, the 20-day EMA at 1.2222 and 1.2100. On the flip side, the GBP/USD key resistance levels are 1.2400, followed by the YTD high of 1.2454 and the 1.2500 mark.
- USD/JPY back into negative territory after a spike following US data.
- US PMI S&P Global recovers in January, still below 50.
- US Dollar weakens during the American session amid risk appetite.
The USD/JPY spiked to 131.21, following the release of US economic data but then pulled back toward 130.00 as stocks turned positive on Wall Street. The improvement in risk sentiment weighed on the US dollar.
Data released on Tuesday showed the PMI S&P Global Manufacturing rose in January according to preliminary numbers from 46.2 to 46.8, above the 46.1 of market consensus. The Service index climbed from 44.7 to 46.6, surpassing expectations of 44.5. Immediately after the release, the US dollar peaked but only to retreat later.
In Wall Street, after a negative opening main indexes are flat. Risk appetite and a retreat in US yields pushed USD/JPY to the downside. The pair is testing levels under 130.00, looking at the daily low it hit on Asian hours at 129.72.
Again, the 20-day Simple Moving Average, currently at 130.90, capped the upside. The main trend is bearish although in the short term, the Dollar is correcting higher. It continues to be unable to hold above 131.00. If it manages to do so, a deeper recovery seems likely.
Technical levels
European Central Bank (ECB) policymaker Gediminas Simkus said on Tuesday that the ECB should continue with 50 basis points (bps) rate hikes amid growing wage pressures, as reported by Bloomberg.
Simkus further added that reaching the peak policy rate before summer 'may be unlikely' and noted that strong core inflation shows that their battle against inflation is not over yet.
Market reaction
EUR/USD edged slightly higher with the initial reaction to these comments and was last seen posting small daily gains at 1.0875.
An improving macro backdrop and continued policy tightening from the ECB portend Euro strength in 2023, according to economists at CIBC Capital Markets.
ECB is looking at adjusting policy in 50 bps clips
“The improved macro backdrop comes as the ECB now details that ‘rates will still have to rise significantly at a steady pace to reach levels that are sufficiently restrictive to ensure a timely return of inflation to the 2% medium-term target.’ Breaking down the language suggests that the bank is looking at adjusting policy in 50 bps clips, at least across Q1.”
“Overall, we would be wary of EUR gains proving potentially over-extended, albeit we would expect any correction to be short-lived.”
AUD/USD broke decisively above 0.7000 yesterday. Australian Consumer Price Index data for the fourth quarter could fuel the rally if figures come out sticky, economists at ING.
AUD/NZD may retest the recent 1.0950 highs soon
“Tonight’s fourth-quarter CPI data in Australia will be key, as evidence of sticky inflation may force a hawkish repricing across the AUD curve (which currently embeds 40 bps of extra Reserve Bank of Australia tightening) and add steam to the AUD/USD rally.”
“CPI figures are released also in New Zealand and we see a larger risk they could show a deceleration in price pressures compared to Australia. AUD/NZD may retest the recent 1.0950 highs soon as the NZD curve has more room for a dovish repricing.”
See:
- Australian CPI Preview: Forecasts from seven major banks, sticky inflation figures
- NZ CPI Preview: Forecasts from four major banks, past the peak, but still red-hot
The European Central Bank should not pre-commit to any specific policy move beyond February, European Central Bank (ECB) executive board member Fabio Panetta told German newspaper Handelsblatt on Tuesday, as reported by Reuters.
Panetta argued that they can bring inflation down with well-calibrated and non-mechanical rate hikes and noted that he is "anxiously optimistic" about inflation after recent good readings.
Market reaction
EUR/USD managed to rebound from daily lows after these comments and was last seen trading at 1.0855, where it was down 0.1% on a daily basis.
- Gold price tumbled 0.50% on Tuesday after the release of US PMI data.
- US S&P Global PMIs remained in contractionary territory but appeared to bottom out.
- The US Federal Reserve is expected to raise rates by 25 bps, as CME FedWatch Tool shows.
- Gold Price Analysis: On a pullback before resuming its uptrend.
Gold price struggles to continue its rally after hitting a new 9-month high at $1,942.51, retreats to the $1,930s area, as Wall Street prepares to open on a lower note. Factors like a risk-off impulse, and the greenback erasing earlier losses, weighs on the XAU/USD. Therefore, the XAU/USD exchanges hands at $1,928.39.
Risk aversion is underpinning the US Dollar
The US cash equity market is poised for a lower open. The XAU/USD main driver so far in the day has been the American Dollar (USD), which, according to the US Dollar Index (DXY), which tracks the buck’s value vs. a basket of six currencies, is bottoming around 102.000, and so far is up 0.13%, at 102.150. Contrarily, US Treasury bond yields, namely the 10-year benchmark note rate, which usually influences Gold’s price, are unchanged at 3.532%.
US S&P Global PMIs were better than expected, weighing on Gold’s price
The US economic docket featured January’s PMIs, revealed by S&P Global, with the Services PMI coming at 46.6 vs. 44.7 expected, while Manufacturing rose by 46.8 vs. estimates of 46.2. The S&P Global Composite, which measures both indices, increased by 46.6, higher than the foreseen 45 figure. Even though US business activity remains in contractionary territory, the downward trend moderated.
“The worry is that, not only has the survey indicated a downturn in economic activity at the start of the year, but the rate of input cost inflation has accelerated into the new year, linked in part to upward wage pressures, which could encourage a further aggressive tightening of Fed policy despite rising recession risks,” Chris Williamson, a chief business economist at S&P Global Market Intelligence, said in a statement.
After the release of US data, the XAU/USD continues to extend its losses towards the $1,920 region.
US Federal Reserve to raise rates by 25 bps on next weeks
Aside from this, the US Federal Reserve (Fed) would feature its first monetary policy meeting from January 31 – February 1, in which the US Central Bank is estimated to hike rates by 25 bps, which would lift the Federal Funds rate (FFR) at the 4.50% - 4.75% range. The CME FedWatch Tool, odds for a 25 bps hike are 96.6%, with eight days ahead. For the March meeting, traders expect the Fed to raise rates to the 4.75% - 5.00% range. The slowdown in interest rate increases was spurred by inflation tempering in December, after the core Consumer Price Index (CPI) edged towards 5.7%, after peaking in September of 2022 at 6.6%.
Gold Technical Analysis
From a technical perspective, the XAU/USD daily chart suggests that the yellow metal uptrend remains unchanged. The ongoing pullback toward the $1,920 area could be a respite for XAU’s bulls after the Relative Strength Index (RSI) reached overbought conditions. Once the RSI exits from the oversold area, that would be the reason to resume the uptrend. Therefore, the XAU/USD first resistance would be $1,950, followed by the $2,000 mark. As an alternate scenario, if Gold struggles, its next support would be $1,900, followed by the 20-day Exponential Moving Average (EMA) at $1,883.75.
- USD/MXN with a bullish intraday bias, bearish in the long term.
- Correction from levels above 19.00, finds support at the 18.80 zone.
- US Dollar mixt on Tuesdays gains momentum after US data.
The USD/MXN is rising on Tuesday, after a two-day correction of the rally from multi-year lows near 18.55 (January 18) to 19.11 (January 19). The decline found support around the 18.80 zone and bounced toward 18.90.
The pair is trading at daily highs at 18.88 following the release of the US S&P Global PMI report that came in above expectations boosting the US Dollar across the board amid higher Treasury bond yields. At the same time, Emerging Market currencies, like the Mexican Peso lost further strength on the back of a deterioration in market sentiment and lower commodity prices.
The Mexican Peso needs to break and hold below 18.80, in order to regain strength. The next support stands at 18.65 followed by the recent bottom near 18.55.
The daily chart shows the main trend is bearish but technical indicators are modestly biased to the upside in the short term, suggesting some consolidation ahead that could be between 18.80 and 19.00, or with a higher limit at 19.11, a horizontal level and the 20-day Simple Moving Average. A break above would strengthen the US Dollar.
USD/MXN daily chart
-638101697011234253.png)
Economists at CIBC Capital Markets see the Canadian Dollar stuck in neutral in Q1 as markets are almost fully priced for BoC and Fed action, before gaining ground over the rest of 2023 as the USD falls out of favour.
USD/CAD to reach 1.28 in 2024
“With markets almost fully priced for both the Bank of Canada and Federal Reserve over the rest of Q1, expect the Loonie to be stuck in neutral in the near term, with USD/CAD likely ending the quarter at 1.34.”
“We expect USD/CAD to end the year at 1.31.”
“With global growth likely to receive a lift as central banks outside of North America start to normalize policy rates, and higher commodity prices benefitting Canada’s export sector, look for USD/CAD to reach 1.28 in 2024.”
- S&P Global Manufacturing and Services PMIs rose modestly in early January.
- US Dollar Index holds in positive territory above 102.00.
The business activity in the US private sector continued to contract in early January, albeit at a softer pace than in December. S&P Global Manufacturing PMI edged higher to 46.8 from 46.2 and Services PMI recovered to 46.6 from 44.7. Finally, the Composite PMI came in at 46.6, compared to 45 in December. All these figures came in slightly better than the market expectations.
Commenting on the data, "the US economy has started 2023 on a disappointingly soft note, with business activity contracting sharply again in January," noted Chris Williamson, Chief Business Economist at S&P Global Market Intelligence.
"Although moderating compared to December, the rate of decline is among the steepest seen since the global financial crisis, reflecting falling activity across both manufacturing and services," Williamson added.
Regarding input price pressures, Williamson explained that the rate of input cost inflation has accelerated into the new year, linked in part to upward wage pressures.
Market reaction
With the initial reaction, the US Dollar gathered strength against its rivals and the US Dollar Index was last seen rising 0.25% on the day at 102.25.
- EUR/USD’s upside appears capped around 1.0900.
- EMU, Germany flash PMIs came on a mixed note.
- US advanced PMIs also due later in the NA session.
EUR/USD appears to have met some decent resistance in the proximity of the 1.0900 hurdle so far on Tuesday.
EUR/USD: Rally shows signs of exhaustion
EUR/USD seems to struggle to extend the January’s rally further north of the 1.0900 mark amidst vacillating risk appetite trends and the consolidative theme surrounding the greenback.
Indeed, market participants appear prudent ahead of the upcoming FOMC event and the ECB gathering, both due next week and with bets favouring a 25 bps and 50 bps rate hike, respectively.
In the domestic calendar, Consumer Confidence in Germany tracked by GfK improved to -33.9 for the month of February. Additionally, the flash prints for the Manufacturing and Services PMIs in the euro area came at 48.8 and 50.7, respectively, while the same gauges for Germany came at 47 and 50.4, respectively.
In the US, the Manufacturing PMI is expected at 46.8 and the Services PMI at 46.6 in January.
What to look for around EUR
EUR/USD comes under pressure soon after failing to break above the key 1.0900 mark on Tuesday.
Price action around the European currency should continue to closely follow dollar dynamics, as well as the impact of the energy crisis on the euro bloc and the Fed-ECB divergence.
Back to the euro area, the increasing speculation of a potential recession in the bloc emerges as an important domestic headwind facing the euro in the short-term horizon.
Key events in the euro area this week: Germany GfK Consumer Confidence, France Business Confidence, ECB Lagarde, EMU/France/Germany Advanced Manufacturing/Services PMIs (Tuesday) – Germany Ifo Business Climate (Wednesday) – Italy Business Confidence (Thursday) – France Consumer Confidence, ECB Lagarde (Friday).
Eminent issues on the back boiler: Continuation of the ECB hiking cycle amidst dwindling bets for a recession in the region and still elevated inflation. Impact of the war in Ukraine and the protracted energy crisis on the bloc’s growth prospects and inflation outlook. Risks of inflation becoming entrenched.
EUR/USD levels to watch
So far, the pair is losing 0.05% at 1.0862 and the breakdown of 1.0766 (weekly low January 17) would target 1.0560 (55-day SMA) en route to 1.0481 (monthly low January 6). On the other hand, the next up barrier emerges at 1.0926 (2023 high January 23) followed by 1.0936 (weekly high April 21 2022) and finally 1.1000 (round level).
Gold price touched a nine-month high on Tuesday. The yellow metal needs to surpass the $1,970 region to firm further, strategists at TD Securities report.
Break below $1,900 to spark trend follower liquidations
“The bar is low for price action to catalyze yet another CTA buying program in Gold. However, algo trading flows are expected to remain limited with substantial purchases only likely above the $1,970 range. Still, Gold prices could struggle to firm further in the absence of the single-largest buyer of Gold over the past months.”
“On the downside, a break below the $1,900 range is required to spark trend follower liquidations.”
Australian Q4 Consumer Price Index (CPI) data could be the deciding factor for RBA's February meeting. Economists at Commerzbank believe that an upside surprise could lift the Aussie.
Rate cycle in Australia almost over?
“Consumer prices are likely to increase the expectation of a rate step next week, if they are in line with expectations, thus supporting AUD a little. If the data surprises to the upside, the AUD is likely to jump higher due to the adjustment of rate expectations.”
“it will be more interesting for AUD how the RBA positions itself for the coming months as of 1st February – i.e. whether an imminent end of the rate cycle is in view or not. If that is the case the market is likely to lower its expectations for the peak of the key rate, which would put pressure on AUD.”
See – Australian CPI Preview: Forecasts from seven major banks, sticky inflation figures
With the Fed set to undershoot market expectations for the peak fed funds rate, and attention turning to policy tightening in other advanced economies, economists at CIBC Capital Markets look for the USD to weaken in 2023.
USD to fall out of favour over 2023
“We see some modest upside in the USD from potential data surprises that might tilt market pricing for Fed rate hikes at the margin. However, we’d look past that as the upcoming ‘step down’ to 25 bps hikes has been telegraphed by the market for now.”
“The USD should continue to come under pressure in the quarters ahead as the protracted showdown over the debt ceiling leads to an increased premium on USD valuation.”
“When layered with a much better backdrop outside of North America, this year is shaping up to be a difficult one for USD bulls.”
US PMI Overview
S&P Global will release the flash version of the US Manufacturing and Services PMIs at 14:45 GMT this Tuesday. The gauge for manufacturing is expected to remain in contraction territory for the fourth straight month and come in at 46.1 for January, slightly lower than the 46.2 in the previous month. The Services PMI, meanwhile, is also anticipated to deteriorate further to 44.5 for the current month, marking the sixth successive month of contraction. Furthermore, the composite PMI is expected to show a contraction in the overall business activity and edge down to 44.7 from 45.0 previously.
How Could it Affect EUR/USD?
Ahead of the key release, a fresh leg down in the equity markets assists the safe-haven US dollar to stage a modest recovery from a nine-month low touched earlier this Tuesday. A stronger US PMI print could lend additional support to the greenback, though expectations for a less aggressive policy tightening by the Fed should cap gains.
Conversely, weaker US macro data will reaffirm market bets for a smaller 25 bps Fed rate hike in February and prompt fresh selling around the buck. Apart from this, the recent hawkish rhetoric from ECB officials, signalling additional jumbo rate hikes in the coming months, might continue to underpin the shared currency. This, in turn, suggests that the path of least resistance for the EUR/USD pair is to the upside.
Eren Sengezer, European Session Lead Analyst at FXStreet, offers a brief technical outlook for the major and writes: “Despite the latest pullback, EUR/USD continues to trade within the ascending regression channel coming from early January. Additionally, the Relative Strength Index (RSI) indicator on the four-hour chart holds above 50. Both of these technical developments suggest that the pair's current action could be considered as a technical correction.”
Eren also outlines important technical levels to trade the EUR/USD pair: “On the downside, 1.0850 (lower limit of the ascending channel, 20-period Simple Moving Average (SMA)) aligns as immediate support. If EUR/USD falls below that level and starts using it as resistance, sellers could show interest and trigger an extended slide toward 1.0830 (50-period SMA) and 1.0800 (psychological level). ”
“In order to gather bullish momentum, EUR/USD needs to rise above 1.0900 (psychological level, mid-point of the ascending channel) and stabilize there. In that scenario, additional gains toward 1.0930 (upper-limit of the ascending channel) and 1.0980 (former support, static level) could be witnessed.” Eren adds further.
Key Notes
• EUR/USD Forecast: Euro needs to stabilize above 1.0900 to reach new multi-month tops
• EUR/USD: Gains through low 1.09s to revive bull move for a push on to 1.1000/50 – Scotiabank
• EUR/USD Price Analysis: Upside bias unchanged above 1.0650
About the US Manufacturing PMI
The Manufacturing Purchasing Managers Index (PMI) released by S&P Global captures business conditions in the manufacturing sector. As the manufacturing sector dominates a large part of total GDP, the manufacturing PMI is an important indicator of business conditions and the overall economic condition in the United States. Readings above 50 imply the economy is expanding, making investors understood it as a bullish for the USD, whereas a result below 50 points for an economic contraction, and weighs negatively on the currency.
About the US ISM Services PMI
The Services Purchasing Managers Index (PMI) released by S&P Global captures business conditions in the services sector. As the services sector dominates a large part of total GDP, the services PMI is an important indicator of the overall economic condition in US. A result above 50 signals is bullish for the USD, whereas a result below 50 is seen as bearish.
- The index now adds to Monday’s uptick above the 102.00 mark.
- Risk appetite trends remain inconclusive so far on Tuesday.
- Preliminary PMIs, Richmond Fed Index next on tap.
Alternating risk appetite trends keep the price action volatile around the greenback and now motivates the USD Index (DXY) to advance further north of the 102.00 yardstick.
USD Index appears bid pre-PMIs
The index remains side-lined around the 102.00 zone against the backdrop of the equally inconclusive sentiment in the risk complex on turnaround Tuesday.
Indeed, investors’ expectations surrounding the next FOMC event on February 1 also appear unchanged and keep favouring a 25 bps interest rate hike, while speculation around a Fed’s pivot and the likelihood of a soft landing of the economy continue to run high among traders.
Later in the US calendar, all the attention will be on the preliminary prints of the Manufacturing and Services PMIs for the current month seconded by the Richmond Fed Manufacturing Index.
What to look for around USD
The dollar’s price action remains subdued in the lower end of the recent range around the 102.00 region so far this week.
The idea of a probable pivot in the Fed’s policy continues to weigh on the greenback and keeps the price action around the DXY depressed. This view, however, also comes in contrast to the hawkish message from the latest FOMC Minutes and recent comments from rate setters, all pointing to the need to advance to a more restrictive stance and stay there for longer, at the time when rates are seen climbing above the 5.0% mark.
On the latter, the tight labour market and the resilience of the economy are also seen supportive of the firm message from the Federal Reserve and the continuation of its hiking cycle.
Key events in the US this week: Flash Manufacturing/Services PMIs (Tuesday) – MBA Mortgage Applications (Wednesday) – Durable Goods Orders, Advanced Q4 GDP Growth Rate, Chicago Fed National Activity Index, Initial Jobless Claims, New Home Sales (Thursday) – PCE, Core PCE, Personal Income, Personal Spending, Pending Home Sales, Final Michigan Consumer Sentiment (Friday).
Eminent issues on the back boiler: Rising conviction of a soft landing of the US economy. Prospects for extra rate hikes by the Federal Reserve vs. speculation of a recession in the next months. Fed’s pivot. Geopolitical effervescence vs. Russia and China. US-China trade conflict.
USD Index relevant levels
Now, the index gains 0.02% at 102.04 and a breakout of the weekly high at 102.89 (January 18) would pave the way for a test of 105.63 (monthly high January 6) and then 106.45 (200-day SMA). On the flip side, the next support emerges at 101.52 (2023 low January 18) seconded by 101.29 (monthly low May 30 2022) and finally 100.00 (psychological level).
Economists at ING expect the USD/CAD to enter a sustainable downside path in the second half of the year. However, the pair could test 1.30 in the coming weeks.
CAD may lag other commodity currencies such as AUD and NZD
“A BoC-Fed rate gap of -50 bps (if the Fed hikes to 5.0%) does limit the downside potential of USD/CAD. However, there is a chance that the Fed cuts rates more aggressively in the second half of the year, and that is when USD/CAD could stabilise on a more solid downward path. Until then, it is possible that CAD may lag other commodity currencies such as AUD and NZD as it can only partly benefit from China’s improved growth story and suffers from domestic and US negative growth re-rating.”
“A test of 1.3000 in the coming weeks is surely possible in USD/CAD, but would likely be due to either more idiosyncratic USD weakness or rising oil prices.”
29 of 42 economists that took part in a recently conducted Reuters poll said that they expect the Bank of England to raise the policy rate by 50 basis points (bps) to 4% on February 2. 13 economists said they were looking for a smaller, 25 bps, hike.
"Median forecasts in the poll showed the Bank would then add 25 basis points in March, giving a peak rate of 4.25%," Reuters wrote.
Market reaction
This headline doesn't seem to be providing a boost to the Pound Sterling. As of writing, GBP/USD was down 0.7% on the day, trading at around 1.2290.
- NZD/USD attracts some intraday sellers amid a modest bounce from a multi-month low.
- Recession fears take a toll on the risk sentiment and benefit the safe-haven greenback.
- Bets for smaller Fed rate hikes drag the US bond yields lower and cap gains for the USD.
- Traders eye US PMIs for some impetus ahead of NZ quarterly CPI report on Wednesday.
The NZD/USD pair continues with its struggle to find acceptance above the 0.6500 psychological mark and retreats over 50 pips from a multi-day high touched earlier this Tuesday. Spot prices return to the lower end of the daily range, around the 0.6480-0.6475 region, heading into the North American session, though any meaningful decline seems elusive.
Worries about a deeper global economic downturn keep a lid on any optimism in the markets, which is evident from a fresh leg down in the equity markets. This, in turn, assists the safe-haven US Dollar to stage a modest recovery from a nine-month low and drives some flows away from the risk-sensitive Kiwi. That said, the prospects for a less aggressive policy tightening by the Fed might cap the upside for the greenback and lend support to the NZD/USD pair.
Investors seem convinced that the US central bank will soften its hawkish stance amid signs of easing inflationary pressures. In fact, the markets have been pricing in a smaller 25 bps rate hike move at the end of the upcoming policy meeting next week. This, in turn, exerts some downward pressure on the US Treasury bond yields and might continue to weigh on the buck. Traders also seem reluctant to place aggressive bets ahead of this week's important macroeconomic data.
The quarterly consumer inflation report from New Zealand is scheduled for release during the early Asian session on Wednesday. This will be followed by the Advance Q4 GDP print and the Core PCE Price Index from the US on Thursday and Friday, respectively. The key focus, however, will remain on the highly-anticipated FOMC monetary policy decision. This will play a key role in driving the USD in the near term and help determine the near-term trajectory for the NZD/USD pair.
In the meantime, traders on Tuesday will take cues from the US economic docket, featuring the flash PMI prints and the Richmond Manufacturing Index. Apart from this, the US bond yields and the broader risk sentiment, will influence the USD price dynamics and provide some meaningful impetus to the NZD/USD pair. Nevertheless, the fundamental backdrop still seems tilted in favour of bullish traders, suggesting that any meaningful pullback might be seen as a buying opportunity.
Technical levels to watch
EUR/USD keeps its range below the 1.09 level. A move above here will revive bullish momentum, economists at Scotiabank report.
Firm support on modest dips to the low/mid-1.08s
“EUR/USD is holding a solid-looking bull trend on the daily chart and is backed by supportive trend strength oscillators across the short, medium and longer-term DMIs. This should mean limited scope for counter-trend EUR losses and firm support on modest dips to the low/mid-1.08s. It should also mean steady progress higher in spot – which has been less obvious over the past few sessions.”
“Gains through the low 1.09s will revive the bull move for a push on to 1.1000/50.”
- EUR/USD alternates gains with losses below the 1.0900 mark.
- The 2-month support line near 1.0650 holds the downside so far.
EUR/USD’s daily advance falters just ahead of the key 1.0900 barrier on turnaround Tuesday.
The continuation of the uptrend now needs to rapidly clear the 2023 high at 1.0926 (January 23) to allow for a test of the weekly top at 1.0936 (April 21 2022). A sustainable break above this level could pave the way for a challenge of the key barrier at 1.1000 the figure in the not-so-distant future
In the meantime, while above the short-term support line near 1.0650, extra gains should remain in store for the pair.
In the longer run, the constructive view remains unchanged while above the 200-day SMA, today at 1.0308.
EUR/USD daily chart
GBP/USD drops to 1.23. The pair could extend its fall to the 1.22 level, economists at Scotiabank report.
Fiscal policy remains a potential weakness in the GBP outlook
“Intraday weakness in the GBP below support at 1.2315 leaves the Pound exposed to more weakness – unless it can quickly stabilize and strengthen.”
“After two tests of 1.2430/35 over the past week, a sustained break under 1.2315 triggers a mini-double top on the intraday chart which would imply more GBP losses to 1.22 over the next week or so.”
“Fiscal policy – and foreign investor participation in the UK Gilts market – remains a potential weakness in the GBP outlook.”
- USD/CAD remains under some selling pressure for the fourth straight day on Tuesday.
- Bullish crude oil prices underpin the Loonie and act as a headwind amid a weaker USD.
- Traders now eye the US macro data for some impetus ahead of the BoC on Wednesday.
The USD/CAD pair edges lower for the fourth successive day on Tuesday and remains depressed through the mid-European session. The pair is currently placed around mid-1.3300s, just a few pips above a one-week low touched on Monday and seems vulnerable to slide further.
Despite a softer risk tone, the safe-haven US Dollar struggles to capitalize on its modest intraday recovery from a nine-month low and acts as a headwind for the USD/CAD pair. Growing acceptance that the Fed will soften its hawkish stance amid signs of easing inflationary pressure turns out to be a key factor that continues to weigh on the greenback.
In fact, the markets have been pricing in a greater chance of a smaller 25 bps Fed rate hike move in February. This, along with softer US Treasury bond yields, keeps the USD bulls on the defensive. Apart from this, the recent rally in crude oil prices to over a one-month top underpins the commodity-linked Loonie and exerts pressure on the USD/CAD pair.
The aforementioned fundamental backdrop favours bearish traders and supports prospects for an extension of the USD/CAD pair's recent downward trajectory. Even from a technical perspective, last week's failure to find acceptance above the 100-day SMA validates the negative outlook and suggests that the path of least resistance for spot prices is to the downside.
Traders, however, seem reluctant to place aggressive bets and prefer to move to the sidelines ahead of this week's key central bank event/data risk. The Bank of Canada is scheduled to announce its policy decision on Wednesday. This will be followed by the Advance Q4 GDP print and the Core PCE Price Index from the US on Thursday and Friday, respectively.
Hence, it will be prudent to wait for some follow-through selling below the monthly low, around the 1.3320 area, before placing fresh bearish bets. Traders now look to the US macro data - the flash PMI prints and the Richmond Manufacturing Index, which might influence the USD. This, along with oil price dynamics should provide some impetus to the USD/CAD pair.
Technical levels to watch
BoJ tightening and interest rate spread compression favour JPY strength ahead, in the view of economists at CIBC Capital Markets.
Spread differentials to continue to move in favour of the JPY
“We expect the BoJ to tighten policy, potentially including an exit from negative rates into H2.”
“We expect spread differentials to continue to move in favour of the JPY. Indeed as Japan is the largest foreign holder of UST, should long-end spreads continue to compress, we should expect a reduction in Japanese appetite for higher-yielding overseas assets, this points towards a stronger JPY.”
The Joint Ministerial Monitoring Committee (JMMC) of the Organization of the Petroleum Exporting Countries (OPEC) and allies led by Russia, known collectively as OPEC+, is unlikely to recommend any changes to oil output policy, Reuters reported citing five OPEC+ sources.
OPEC+ is scheduled to meet next week, on February 1.
Market reaction
Crude oil prices edged slightly higher on this headline. As of writing, the barrel of West Texas Intermediate (WTI) was trading at $81.85, where it was up 0.3% on a daily basis.
Australian Consumer Price Index (CPI) figures are due on Wednesday, January 25 at 00:30 GMT and as we get closer to the release time, here are forecasts from economists and researchers of seven major banks regarding the upcoming inflation data.
Headline inflation is expected at 7.5% year-on-year in Q4 vs. 7.3% in Q3, while trimmed mean is expected at 6.5% YoY vs. 6.1% in Q3. For December alone, headline is expected at 7.7% YoY vs. 7.3% in November.
ANZ
“We have lifted our Q4 trimmed mean CPI inflation forecast to 1.7% QoQ. This would see the annual rate reach 6.7%, exceeding the RBA’s forecast of 6.5% YoY. We forecast non-tradable and services inflation will both print at 1.9% QoQ, annualising at almost 8%. Accordingly, we see the risks to our terminal cash rate pick of 3.85% as weighted to the upside. We maintain our headline CPI inflation forecast at 1.8% QoQ. This would see the annual rate lift to 7.7%, below the RBA’s 8.0% YoY pick. But we think it would take a downside surprise in trimmed mean CPI relative to the RBA’s 6.5% YoY forecast for it to consider a pause in cash rate hikes in the next few months.”
ING
“Australian retail gasoline prices were down more than 8% MoM in December. Feeding this figure through to the transport component, we could see a smaller increase in the aggregate monthly price level of 0.2% MoM in December, down from an increase of 0.8% MoM in November. This should bring the December inflation rate down to 6.9% YoY, and the fourth quarter inflation rate down to 7.0%.”
Westpac
“We forecast a 1.5% rise in the December quarter boosting the annual pace 0.1ppt to 7.4% which is our forecast peak in the annual pace of inflation for the current cycle. We are forecasting the annual pace of headline inflation to ease back to 3.7%yr by end-2023. The Trimmed Mean is forecast to lift 1.6% in December, a moderation from the 1.8% gain in September which we are forecasting to be the largest quarterly rise this cycle. The annual pace for the Trimmed Mean is set to lift to 6.6%yr, from 6.1%yr in September, which again is our forecast peak in core inflation. We are forecasting core inflation to moderate to 3.4%yr by end 2023.”
NAB
“CPI inflation is expected to have peaked in Q4 2022. Lower-than-expected fuel prices and lower-than-feared fruit and vegetable prices despite recent floods mean we now expect 1.6% QoQ and a peak of 7.5% YoY. Despite that, we expect the detail to provide little comfort about the inflation backdrop with strong services inflation likely. For trimmed mean we forecast 1.6% QoQ and 6.6% YoY. While our forecast print is lower than Q3’s 1.8%, on our numbers this is almost entirely due to slowing new dwelling construction cost rises. We expect market services and labour-market sensitive inflation to remain uncomfortably strong amid elevated labour cost growth and strong demand.”
TDS
“We put annual inflation at 7.5%, some distance from the 8% RBA forecast. While lower headline inflation is positive, it's the trimmed measure that will draw more attention. TD is at 1.6% QoQ (6.6% YoY). A trimmed print between 6.1% and 6.5% locks in a 25 bps Feb hike.”
SocGen
“Both headline and core (i.e., trimmed mean) inflation are likely to have risen further in December, which would also lead to an increase in quarterly inflation during 4Q22. The rise in electricity prices that is reflected in CPI only on a quarterly basis (March, June, September and December) will boost the headline inflation figure in December, despite the reduction of automotive fuel inflation (led by the decline in crude oil prices) and housing inflation (driven by housing market weakness that is weighing on new dwelling purchase prices). Trimmed mean inflation will also likely rise a bit in December, reflecting the broad-based inflation pressures seen in the Australian economy. If our forecasts for the December inflation figures are correct, it means that the quarterly inflation in 4Q is higher than 3Q, both in terms of headline and trimmed mean inflation. If it is confirmed that inflation continued to increase until the end of 2022, it will support further tightening measures by the RBA, which argues that inflation has yet to peak in Australia (while the peak of headline inflation has already been confirmed in quite few countries, including the US).”
Citibank
“Australia’s inflation is set to accelerate in Q4 with Citi analysts also upwardly revising their estimate of underlying inflation to 1.5% (previous 1.4%). This is because inflation is more broad-based, particularly across the services sector. On a yearly basis, headline inflation is expected to accelerate to 7.7% in Q4, and underlying inflation to 6.1%. These are still comfortably within the RBA’s previous forecasts of 8% and 6.5%, respectively but risks to the Q4 CPI report remain to the upside due to a tight labor market with wages growth accelerating.”
- The index extends the side-lined trading around 102.00.
- The resumption of the downside could retest the 101.30 region.
DXY trades within a consolidative phase around the 102.00 neighbourhood for yet another session on Tuesday.
Further range bound should not be ruled out for the time being. In case bears regain the upper hand, the index could then slip further back and revisit the so far 2023 low at 101.52 (January 18) ahead of the May 2022 low around 101.30 (May 30), all before the psychological 100.00 yardstick.
In the meantime, while below the 200-day SMA at 106.45 the outlook for the index should remain tilted to the negative side.
DXY daily chart
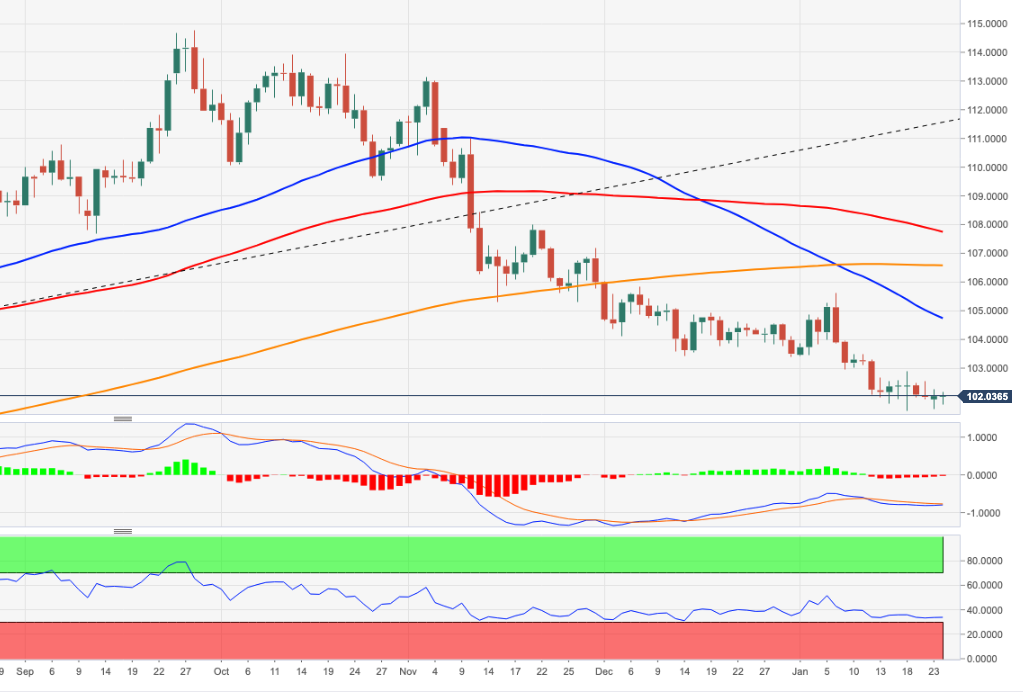
EUR/USD did not react to the PMIs and is rangebound after retreating from the high of 1.0927 yesterday. In the view of economists at Société Générale, the pair has travelled a considerable distance.
More risk hangs on ECB pricing than on the Fed
“Manufacturing PMI for France and services for Germany rose in January to the highest level since June. The stagnation of manufacturing in Germany reins in optimism for a further improvement in IFO current conditions tomorrow but may not halt a fourth successive rise in expectations.”
“There’s currently around 93 bps discounted over the next two ECB meetings, compared with 46 bps for the FOMC. We’d argue that more risk hangs on ECB pricing than on the Fed.”
“We’re not looking for excuses to take profits in EUR/USD but it’s another way of arguing that, portfolio flows aside, EUR/USD has travelled a considerable distance.”
In an interview with French magazine L'Express, European Central Bank (ECB) policymaker Joachim Nagel argued the ECB needs to continue to tighten the monetary policy, as reported by Reuters.
"We have to continue tightening monetary policy to dampen price pressures and keep inflation expectations anchored at our inflation target," Nagel explained and added that their job of reining inflation is not done yet.
Market reaction
These comments failed to provide a boost to the Euro. As of writing, the EUR/USD pair was trading at 1.0855, where it was down 0.12% on a daily basis.
GBP/USD is at a crossroads after having returned to 1.2400. Cross above 1.2450 can lead to an extended up-move, economists at Société Générale report.
Defending 1.2130 crucial for continuation in bounce
“The 1.24 area proved too lofty in December and profit-taking ensued. Will this time be different? The main downside risks stem from a rebound in US bond yields and broader risk aversion.”
“Daily MACD is in positive territory, however, it is at a lower level as compared to the previous one denoting receding upside momentum.”
“The pair has to establish itself beyond 1.2450/1.2500 to affirm next leg of uptrend. If this break materializes, the up move could extend towards 1.2600 and 1.2750, the 61.8% retracement from 2021.”
“Defending the 50 DMA at 1.2130 would be crucial for continuation in bounce.”
- GBP/USD drifts into negative territory for the second successive day on Tuesday.
- The USD attracts haven flows amid looming recession risks and exerts pressure.
- Expectations that the BoE will continue raising rates should limit deeper losses.
The GBP/USD pair attracts some sellers following an early uptick to the 1.2415 area and turns lower for the second successive day on Tuesday. Spot prices retreat further from the highest level since June 2022 touched on Monday and drop to the 1.2300 round-figure mark, or a four-day low during the first half of the European session.
The US Dollar stages a modest recovery from a nine-month low and turns out to be a key factor exerting some downward pressure on the GBP/USD pair. The market sentiment remains fragile amid worries about the economic headwinds stemming from the worst yet COVID-19 outbreak in China. Furthermore, the protracted Russia-Ukraine war has been fueling recession fears. This, in turn, tempers investors' appetite for riskier assets and drives some haven flows towards traditional safe-haven assets, including the buck.
The British Pound, on the other hand, is pressured by weaker PMI prints, which showed that business activity in both manufacturing and services sectors contracted in January. However, speculations that elevated consumer inflation will maintain pressure on the Bank of England (BoE) to continue raising interest rates could lend some support to the Sterling. Apart from this, rising bets for a smaller 25 bps Fed rate hike in February might cap the USD and help limit deeper losses for the GBP/USD pair.
Hence, it will be prudent to wait for strong follow-through selling before confirming that spot prices have topped out in the near term and positioning for any meaningful corrective decline. Traders now look forward to the US economic docket, featuring the release of the flash PMI prints and the Richmond Manufacturing Index. This, along with the US bond yields and the broader risk sentiment, will influence the USD price dynamics and produce short-term trading opportunities around the GBP/USD pair.
Technical levels to watch
Hungary’s National Bank will meet for its monthly rate decision today. A no change in base rate should support the Forint and drag EUR/HUF down to 390, economists at ING report.
Hungary's central bank tests market sensitivity on an upcoming rate cut
“The market is seeing signs of speculation of a too-early interest rate cut. If the NBH resists the temptation and confirms the hawkish tone, we expect the current speculation to cool down and the Forint could get back on track.”
“Yesterday's reaction to Fitch's downgrade of the rating outlook to negative could slightly clear long positioning and clear the way for further Forint appreciation. In that case, we expect that the Forint could test 390 EUR/HUF soon. Otherwise, the current positioning favours a rather asymmetric reaction negatively towards EUR/HUF 400.”
Economists at UBS update their forecast for the likes of the Swiss Franc, the British Pound and the Australian Dollar.
Weak growth outlook and still-high inflation to weigh on Sterling
“We move the Swiss Franc down to Neutral after strong gains versus the US Dollar. Nevertheless, we believe the Swiss National Bank is committed to preserving Franc's strength to limit imported inflation, and that the currency will be supported by safe-haven flows.”
“In the UK, the weak growth outlook and still-high inflation are likely to weigh on Sterling, and we maintain our Least Preferred view.”
“We like the Australian Dollar, which should be supported by China’s reopening, relatively strong domestic economic growth, and a central bank that is likely to keep the reins tight when the Federal Reserve is starting to ease monetary conditions.”
- Gold price touches a nine-month top on Tuesday amid renewed US Dollar selling.
- Bets for smaller rate hikes by Federal Reserve continue to weigh on the greenback.
- Recession fears further benefit the safe-haven XAU/USD and favour bullish traders.
Gold price builds on the previous day's modest uptick and gains some follow-through traction for the second successive day on Tuesday. The momentum pushes the XAU/USD to its highest level since April 22, around the $1,942-$1,943 region during the early European session, though lacks follow-through.
Weaker US Dollar benefits Gold price
The US Dollar (USD) meets with a fresh supply and hits a new nine-month low amid firming expectations for a less aggressive policy tightening by the Federal Reserve (Fed). Investors now seem convinced that the Fed will soften its hawkish stance amid signs of easing inflationary pressures in the United States (US). In fact, the markets have been pricing in a smaller 25 bps rate hike at the upcoming Federal Open Market Committee (FOMC) policy meeting next week. This leads to a modest downtick in the US Treasury bond yields and continues to weigh on the greenback, which, in turn, is seen benefitting the US Dollar-denominated Gold price.
Recession fears further underpin safe-haven Gold price
Apart from this, the cautious mood is seen as another factor acting as a tailwind for the safe-haven XAU/USD. The market sentiment remains fragile amid growing worries about headwinds stemming from the worst yet COVID-19 outbreak in China. Furthermore, the protracted Russia-Ukraine war has been fueling worries about a deeper global economic downturn. This, in turn, tempers investors' appetite for riskier assets and drives some haven flows towards traditional safe-haven assets, including Gold price. The upside, however, remains limited as traders seem reluctant ahead of the key event/central bank event risks from the United States.
Traders await this week’s key macro data from United States
Investors prefer to move to the sidelines and look to the first estimate of the fourth-quarter US GDP growth, due on Thursday. Any signs of a weaker US economy will be taken as a reason for the Fed to slow the pace of its rate-hiking cycle, which should benefit the non-yielding Gold price. Apart from this, this week's release of the US Personal Consumption Expenditures (PCE) Price Index on Friday will influence the Fed's interest rate strategy and provide some meaningful impetus to the XAU/USD. The focus, however, will remain glued to the highly-anticipated FOMC monetary policy decision, scheduled to be announced next Wednesday.
In the meantime, the US macro data - the flash PMI prints and the Richmond Manufacturing Index - could produce short-term opportunities later during the early North American session this Tuesday. Apart from this, traders will take cues from the US bond yields, which, along with the USD price dynamics and the broader market risk sentiment, could drive Gold price. Nevertheless, the fundamental backdrop seems tilted in favour of bullish traders and supports prospects for an extension of a nearly three-month-old bullish trajectory.
Gold price technical outlook
From a technical perspective, the emergence of some dip-buying on Monday and a sustained strength above the $1,920 level add credence to the positive outlook for Gold price. That said, Relative Strength Index (RSI 14) on the daily chart is flashing overbought conditions and makes it prudent to wait for some near-term consolidation before positioning for further gains. That said, some follow-through buying beyond the daily peak, around the $1,942-$1,943 area, might still lift the XAU/USD to the next relevant hurdle near the $1,969-$1,970 region. This is followed by the $1,980 barrier, above which bulls could aim to reclaim the $2,000 psychological mark for the first time since March 2022.
On the flip side, the $1,920 horizontal resistance breakpoint might now protect the immediate downside for Gold price. Any subsequent decline might continue to attract some buyers near the $1,911-$1,910 area and remain limited near the $1,900 round figure. The latter should act as a pivotal point, which if broken decisively might shift the near-term bias in favour of bearish traders and pave the way for a deeper corrective pullback.
Key levels to watch
- EUR/JPY sees its rebound halted after another test of 142.00.
- Extra gains now shift the focus to the 143.00 zone.
EUR/JPY surrenders part of the recent 2-day strong advance and returns to the negative territory on Tuesday.
A sustainable breakout of the 200-day SMA, today at 140.77, should shift the outlook to a more constructive one and open the door to a probable visit to the key resistance area near 143.00 in the short-term horizon (high December 28, January 11).
On the downside, the 138.00 region still emerges as a decent contention area for the time being.
EUR/JPY daily chart
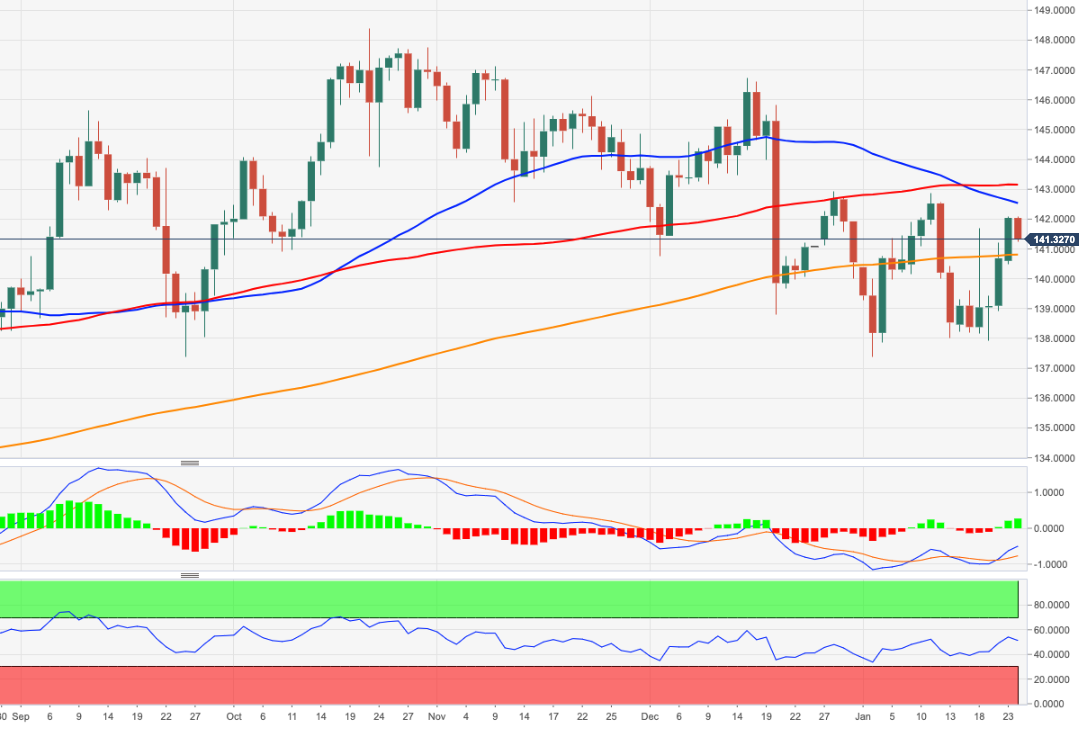
Economists at Bank of America Global Research look to sell USD/JPY on rallies. At the same time, they expect more upside potential for the British Pound in the near term.
Improving chances for a compromise with the EU on outstanding Brexit issues
“We would sell USD/JPY rallies, as we believe the BoJ unconventional policies are not sustainable, and our inflation forecast in Japan for 2023 is well above the market consensus – 3% vs. 1.9%.”
“We see more upside potential for GBP in the short term, on improving chances for a compromise with the EU on the outstanding Brexit issues, particularly those related to the Northern Ireland protocol. However, we remain concerned about the GBP outlook beyond such a deal, as the UK is already in the stagflation scenario that we see as a risk for the rest of the world later this year.”
- UK Manufacturing PMI improves to 46.7 in January, a positive surprise.
- Services PMI in the UK comes in at 48.0 in January, a big miss.
- GBP/USD drops toward 1.2300 on mixed UK PMIs.
The seasonally adjusted S&P Global/CIPS UK Manufacturing Purchasing Managers’ Index (PMI) unexpectedly improved to 46.7 in January versus 45.0 expected and 45.3, December’s final reading.
Meanwhile, the Preliminary UK Services Business Activity Index for January arrived at 48.0 when compared to December’s final print of 49.9 and 49.9 expected.
Chris Williamson, Chief Business Economist at S&P Global, commented on the survey
“Weaker than expected PMI numbers in January underscore the risk of the UK slipping into recession. Industrial disputes, staff shortages, export losses, the rising cost of living and higher interest rates all meant the rate of economic decline gathered pace again at the start of the year. Jobs also continued to be lost as firms tightened their belts in the face of these headwinds, though many other firms reported being.”
FX implications
Downbeat UK Services PMI served has a negative impact on the GBP/USD pair. The spot is losing 0.21% on the day to trade at daily lows near 1.2345.
Statistics New Zealand will release Q4 Consumer Price Index (CPI) inflation data on Tuesday, January 24 at 21:45 GMT and as we get closer to the release time, here are forecasts from economists and researchers of four major banks regarding the upcoming inflation data.
Economists expect the CPI to have eased a tick from 7.2% year-on-year to 7.1%. Meanwhile, the quarter-on-quarter pace may have moderated to 1.3% from 2.2%.
ANZ
“We anticipate annual CPI inflation was flat at 7.2% in Q4 2022, a touch below the RBNZ’s November MPS forecast of 7.5%. Lower petrol prices and moderating global inflation pressures mean we expect tradables (ie imported) inflation eased to 7.4% YoY (8.1% in Q3). However, with labour shortages remaining acute and the resurgence of international tourism injecting fresh demand into our supply-constrained economy, we expect non-tradables inflation rose to 6.9% YoY (RBNZ: 7.0%), versus 6.6% in Q3. Core inflation measures may also print higher again in Q4.”
Westpac
“We estimate that New Zealand consumer prices rose by 1.1% in the December quarter. That would see annual inflation slipping to 6.9%, down from 7.2% last quarter. Even so, that would still leave us with a picture of consumer prices that are continuing to charge higher, with annual inflation remaining close to multi-decade highs. Our forecast is lower than RBNZ’s last published projection. A result in line with our forecast, while still high, would reduce the case for another jumbo-sized OCR hike next month.”
TDS
“We forecast Q4 NZ Inflation to lift 1.3% QoQ. In annual terms, we are in line with consensus at 7.1%, well below the RBNZ's Nov'22 MPS 7.5% forecast. It appears NZ inflation peaked in Q2 at 7.3%. A number at or below our forecasts should strongly support the RBNZ hiking 50 bps at next month's meeting.”
Citibank
“Citi analysts’ NZ Q4 2022 CPI forecast of 0.9% represents a substantial slowing from the average of 1.9% for all preceding quarters last year and is also considerably below RBNZ’s 1.7% forecast in November. This means total CPI inflation has probably peaked and would provide RBNZ with an opportunity to cool its jets. RBNZ Governor Orr will update the market on OCR guidance is February 22. We remain comfortable with their +50 bps OCR increase for February followed by a final +25 bps increase in April for a peak rate of 5.00%.”
- AUD/USD fails to preserve its modest intraday gains and retreats from the mid-0.7000s.
- Looming recession risks weigh on investors’ sentiment and cap the risk-sensitive Aussie.
- Bets for smaller Fed rate hikes weigh on the USD and should help limit losses for the pair.
- Traders now look to the US economic data for some impetus ahead of the Australian CPI.
The AUD/USD pair struggles to capitalize on its modest intraday gains and retreats a few pips from the daily peak, around the mid-0.7000s touched during the early European session. Spot prices, however, manage to hold above the 0.7000 psychological mark and seem poised to prolong the recent appreciating move witnessed over the past three months or so.
A softer risk tone - amid looming global recession risks - assists the safe-haven US Dollar to trim a part of its intraday losses and acts as a headwind for the AUD/USD pair. That said, any meaningful USD recovery remains elusive amid growing acceptance that the Fed will soften its hawkish stance. In fact, the markets have been pricing in a greater chance of a smaller 25 bps Fed rate hike move in February, which keeps the US Treasury bond yields depressed and should cap the greenback.
Furthermore, rising odds for an additional rate hike by the Reserve Bank of Australia (RBA) in February might continue to lend support to the Aussie and limit the downside for the AUD/USD pair. The bets were lifted by the Australian consumer inflation figures released earlier this month, which showed that the headline CPI re-accelerated to the 7.3% YoY rate - a 32-year-high - in November. Hence, the market focus will remain glued to the fourth-quarter Australian CPI report, due on Wednesday.
In the meantime, traders will take cues from the US economic docket - featuring the release of the flash PMI prints and the Richmond Manufacturing Index. This, along with the US bond yields and the broader risk sentiment, will influence the USD price dynamics and provide some impetus to the AUD/USD pair. Nevertheless, the fundamental backdrop remains tilted firming in favour of bullish traders, suggesting that any pullback might still be seen as a buying opportunity and remain limited.
Technical levels to watch
- Eurozone Manufacturing PMI arrives at 48.8 in January vs. 48.5 expected.
- Bloc’s Services PMI rises to 50.7 in January vs. 50.2 expected.
- EUR/USD defends mild gains near 1.0870 on the upbeat Eurozone PMIs.
The Eurozone manufacturing sector downturn eased further in January, the latest manufacturing activity survey from S&P Global research showed on Tuesday.
The Eurozone Manufacturing purchasing managers index (PMI) arrived at 48.8 in January vs. 48.5 expectations and 47.8 last. The index reached a five-month top.
The bloc’s Services PMI stood at 50.7 in January vs. 50.2 expected and December’s 49.8, hitting a six-month high.
The S&P Global Eurozone PMI Composite climbed sharply to 50.2 in January vs. 49.8 estimated and 49.3 previous. The gauge recorded a new seven-month high.
Comments from Chris Williamson, Chief Business Economist at S&P Global
“A steadying of the eurozone economy at the start of the years adds to evidence that the region might escape recession. The survey suggests that a nadir was reached back in October since when fears over the energy market in particular have been alleviated by falling prices, helped by the warmer than usual weather and generous government assistance.”
“At the same time, supply chain stress has eased, benefitting producers most notably in Germany, and more recently the reopening of the Chinese economy has helped to restore confidence in the broader global economic outlook for 2023, propelling business optimism sharply higher.”
FX implications
EUR/USD keeps its range below the 1.0900 level, with the downside cushioned by the upbeat euro area PMIs. The spot is adding 0.08% on the day.
The price of a barrel of Brent Oil has recovered from the setback at the beginning of the year. Economists at Commerzbank expect to see prices of $100 in the second half of the year.
Oil market will gradually tighten again
“In the short term, the market is still likely to be oversupplied. But the market will tighten. This is because the rise in demand over the course of the year coincides with an almost stagnant supply.”
“The market, which is initially still oversupplied, will probably shift back into deficit from the middle of the year. In view of this and very low inventories, the price of a barrel of Brent is likely to climb back to $100 in the second half of 2023.”
- German Manufacturing PMI arrives at 47.0 in January vs. 47.9 expected.
- Services PMI in Germany jumps to 50.4 in January vs. 49.7 expected.
- EUR/USD erases gains near 1.0870 on mixed German PMIs.
The German manufacturing sector contraction moderated in January even as inflation continues to slow, the preliminary manufacturing activity report from S&P Global/BME research showed this Tuesday.
The Manufacturing PMI in Eurozone’s economic powerhouse came in at 47.0 this month vs. 47.9 expected and 47.1 prior. The index dropped to two-month lows.
Meanwhile, Services PMI jumped from 49.2 in December to 50.4 in January as against the 49.7 estimated. The PMI hit the highest level in seven months.
The S&P Global/BME Preliminary Germany Composite Output Index arrived at 49.7 in January vs. 49.6 expected and December’s 49.0. The gauge reached a seven-month top.
Key comments from Phil Smith, Economics Associate Director at S&P Global
“January’s flash PMI, which at 49.7 showed business activity in Germany on a more stable footing at the start of the year and was broadly in line with market consensus, lends support to the notion that a recession in the eurozone’s largest economy is by no means a foregone conclusion.“
“There was even a return to growth in services activity after six straight months of decline, although the increase was only marginal and achieved on somewhat shaky foundations as inflows new business remained in decline.”
FX implications
EUR/USD is erasing gains to trade near 1.0868 on the dismal German data.
The US Dollar remained moderately offered. In the view of economists at ING, today's PMI numbers should help limit downside exposure for the Dollar.
PMIs lead the way
“Preliminary PMIs will be released across developed markets today, and despite the surveys not being as highly regarded as the ISM in the US, that elevated sensitivity to data likely makes today’s releases a risk event for the Dollar.”
“Some improvement in the market’s sentiment around the health of the service sector in the US should help limit downside exposure for the Dollar. In that case, DXY may hold around 102.00 today unless PMIs in Europe surprise to the upside.”
See – EU PMI Preview: Forecast from three major banks, rising from the ashes
- USD/JPY meets with a fresh supply on Wednesday amid broad-based USD weakness.
- Bets for smaller Fed rate hikes, softer US bond yields weigh heavily on the greenback.
- Recession fears benefit the safe-haven JPY and also contribute to the intraday decline.
The USD/JPY pair comes under some selling pressure on Tuesday and reverses a major part of the previous day's positive move, snapping a two-day winning streak. Spot prices remain on the defensive through the early European session and slip below the 130.00 psychological mark in the last hour.
The US Dollar struggles to capitalize on the overnight gains and meets with a fresh supply, which, in turn, is seen dragging the USD/JPY pair lower. The markets now seem convinced that the Federal Reserve will soften its hawkish stance amid signs of easing inflationary pressures and have been pricing in a smaller 25 bps rate hike in February. This keeps a lid on the recent recovery in the US Treasury bond yields and continues to act as a headwind for the greenback.
The Japanese Yen (JPY), on the other hand, draws support from fresh speculation that high inflation may invite a more hawkish stance from the Bank of Japan (BoJ) later this year. The bets were lifted after the latest CPI report from Japan showed that consumer inflation rose to a 41-year high level of 4% in December. Apart from this, the cautious mood - amid worries about a deeper global economic downturn - benefits the safe-haven JPY and exerts pressure on the USD/JPY pair.
The downside, meanwhile, seems cushioned, at least for the time being, as traders might prefer to move to the sidelines ahead of the highly-anticipated FOMC meeting next week. In the meantime, traders will take cues from the US economic docket - featuring the release of the flash PMI prints and the Richmond Manufacturing Index. This, along with the US bond yields, will influence the USD. Apart from this, the broader risk sentiment should provide some impetus to the USD/JPY pair.
Technical levels to watch
Economists at ING see limited GBP upside room against the Euro.
PMIs may look a bit grimmer in the UK compared to the Eurozone
“PMIs may look a bit grimmer in the UK compared to the Eurozone today, which could hinder the modest rebound in EUR/GBP seen over the past two trading sessions. The pair may struggle to climb above 0.8830-0.8850 for now.”
“Still, the Pound should be able to count on a generalised alignment in market expectations around a 50 bps hike by the Bank of England next week (45 bps priced in at the moment), which suggests a smaller scope for a correction.”
See – EU PMI Preview: Forecast from three major banks, rising from the ashes
The Euro remains supported by ECB officials fighting speculation of a 25 bps hike. S&P Global Manufacturing and Services PMI surveys will likely be a reality check for the strength of the shared currency, economists at ING report.
Reality check
“Given that part of the recent EUR strength has relied on a re-rating of growth expectations in the Eurozone thanks to lower energy prices, today’s PMIs will likely be a reality check on the sustainability of this driver for the common currency.”
“It will now take quite a good deal of positive news to push another big idiosyncratic Euro rally. It seems more likely that EUR/USD could test 1.1000 on the back of rising market risk appetite weighing on the safe-haven Dollar if anything.”
“At the same time, the effective pushback by ECB officials against speculation around 25 bps hikes is likely limiting downside risks for the pair.”
See – EU PMI Preview: Forecast from three major banks, rising from the ashes
EUR/USD is stretching higher toward 1.0900. Short-term, we might see the 1.10 mark, in the view of Antje Praefcke, FX Analyst at Commerzbank.
Move might go further
“It is quite possible that the divergence between the Euro and the Dollar will widen even more during this week, although the EUR/USD move has already gone a long way. Whether that is really justified to this extent medium to long-term is another matter. However, under these circumstances, not many market participants will want to resist rising EUR/USD levels.”
“If from a market perspective, we see more arguments supporting a strong ECB and a less aggressive Fed, EUR/USD might want to test the 1.10 mark short-term.”
- EUR/USD remains bid and close to the 1.0900 hurdle.
- ECB Lagarde, af Jochnick speak later in the session.
- Markets’ attention will be on the release of flash PMIs.
Bulls remain in control of the sentiment around the European currency and motivates EUR/USD to flirt once again with the 1.0900 neighbourhood on Tuesday.
EUR/USD looks at data, risk trends
Following Monday’s marginal gains, EUR/USD picks up extra pace and extends further the march north to the proximity of the 1.0900 mark on turnaround Tuesday. So far, the pair navigates the third consecutive week with gains after shedding ground at the very beginning of the new year.
In the meantime, hawkish ECB-speak as of late helped maintaining the bullish price action in the pair, which gained more than 4 cents since monthly lows near 1.0480 recorded on January 6.
In the domestic calendar, Consumer Confidence in Germany tracked by GfK improved to -33.9 for the month of February. Later in the European morning, the advanced prints for the Manufacturing and Services PMIs in the euro area and the US economy will be in the limelight. In addition, Chair Lagarde and Board member af Jochnick are also due to speak.
What to look for around EUR
EUR/USD flirts once again with the 1.0900 neighbourhood following Monday’s climb to new 9-month peaks.
Price action around the European currency should continue to closely follow dollar dynamics, as well as the impact of the energy crisis on the euro bloc and the Fed-ECB divergence.
Back to the euro area, the increasing speculation of a potential recession in the bloc emerges as an important domestic headwind facing the euro in the short-term horizon.
Key events in the euro area this week: Germany GfK Consumer Confidence, France Business Confidence, ECB Lagarde, EMU/France/Germany Advanced Manufacturing/Services PMIs (Tuesday) – Germany Ifo Business Climate (Wednesday) – Italy Business Confidence (Thursday) – France Consumer Confidence, ECB Lagarde (Friday).
Eminent issues on the back boiler: Continuation of the ECB hiking cycle amidst dwindling bets for a recession in the region and still elevated inflation. Impact of the war in Ukraine and the protracted energy crisis on the bloc’s growth prospects and inflation outlook. Risks of inflation becoming entrenched.
EUR/USD levels to watch
So far, the pair is gaining 0.26% at 1.0896 and faces the next up barrier at 1.0926 (2023 high January 23) followed by 1.0936 (weekly high April 21 2022) and finally 1.1000 (round level). On the flip side, the breakdown of 1.0766 (weekly low January 17) would target 1.0560 (55-day SMA) en route to 1.0481 (monthly low January 6).
- USD/CHF snaps a two-day winning streak amid the emergence of fresh selling around the USD.
- Bets for a smaller Fed rate hike in February turn out to be a key factor weighing on the buck.
- A positive risk tone undermines the safe-haven CHF and might help limit losses for the major.
The USD/CHF pair edges lower on Tuesday and for now, seems to have stalled the recent recovery from sub-0.9100 levels, or its lowest level since November 2021 touched last week. The pair remains on the defensive through the early European session and is currently placed near the daily low, around the 0.9200 round-figure mark.
The US Dollar comes under some renewed selling pressure amid the prospects for a less aggressive policy tightening by the Fed and turns out to be a key factor acting as a headwind for the USD/CHF pair. In fact, investors seem convinced that the US central bank will soften its hawkish stance amid signs of easing inflationary pressures. Moreover, the current market pricing indicates a greater chance of a smaller 25 bps Fed rate hike move in February, which keeps a lid on the recent move up in the US Treasury bond yields and weighs on the USD.
The downside for the USD/CHF pair, meanwhile, remains cushioned, at least for the time being, amid a generally positive risk tone, which tends to undermine demand for the safe-haven Swiss franc (CHF). Nevertheless, the fundamental backdrop seems tilted firmly in favour of bearish traders and supports prospects for an extension of the recent downward trajectory witnessed since early November 2022. Hence, any intraday positive move is more likely to attract fresh sellers at higher levels and runs the risk of fizzling out rather quickly.
Market participants now look forward to the US economic docket, featuring the release of flash PMI prints and the Richmond Manufacturing Index. This, along with the US bond yields, will influence the USD price dynamics and provide some impetus to the USD/CHF pair. Apart from this, the broader risk sentiment might contribute to producing short-term opportunities. Traders, however, might refrain from placing aggressive bets and prefer to move to the sidelines as the focus remains glued to the FOMC monetary policy meeting, scheduled next week.
Technical levels to watch
Here is what you need to know on Tuesday, January 24:
The US Dollar is having a difficult time shaking off the bearish pressure early Tuesday and the US Dollar Index stays in negative territory below 102.00. On Monday, the benchmark 10-year US Treasury bond yield recovered above 3.5% and helped the US Dollar stay resilient against its rivals despite the risk-positive market environment. US stock index futures trade flat in the early European morning as investors await S&P Global Manufacturing and Services PMI surveys for the Euro area, Germany, the UK and the US. The Richmond Fed Manufacturing Index for January will also be featured in the US economic docket later in the day and a 2-year US Treasury note auction will take place at around 1800 GMT.
With the Fed staying in the blackout period, Wall Street's main indexes registered strong gains on Monday as market participants remain optimistic about a policy pivot. According to the CME Group FedWatch Tool, markets are pricing a 62% probability that the Fed will stay on hold after raising the policy rate by 25 basis points in February and March.
After rallying to a fresh multi-month high above 1.0900 during the Asian trading hours on Monday, EUR/USD erased its gains in the second half of the day and closed virtually unchanged. Early Tuesday, the pair is stretching higher toward 1.0900. Mixed comments from European Central Bank officials on the policy outlook seem to be limiting the Euro's potential gains for the time being. While speaking at a conference on Monday, "we have made it clear that ECB interest rates will still have to rise significantly at a steady pace to reach levels that are sufficiently restrictive, and stay at those levels for as long as necessary," ECB President Christine Lagarde said.
GBP/USD registered small losses on Monday as the Pound Sterling struggled to outperform the US Dollar amid political jitters in the UK. Early Tuesday, the pair clings to modest daily gains at around 1.2400.
The data from Australia showed earlier in the day that the S&P Global Manufacturing and Services PMIs both arrived slightly below in January's flash estimate. Additionally, National Australia Bank's Business Conditions Index declined to 12 in December from 20, missing the market expectation of 19 by a wide margin. Despite the uninspiring data releases, AUD/USD trades in positive territory near 0.7050 and stays within a touching distance of the multi-month high it set at 0.7064 earlier in the month. In the early Asian session on Wednesday, Consumer Price Index data for the fourth quarter will be watched closely by investors.
USD/JPY gained nearly 100 pips on Monday but seems to have lost its bullish momentum on Tuesday. The pair was last seen losing more than 0.5% on the day at 129.85.
Gold price struggled to gather bullish momentum on Monday amid recovering US T-bond yields and closed the day flat. With the US Dollar staying under modest selling pressure and US yields holding relatively steady early Tuesday, XAU/USD regained its traction and was last seen trading at its highest level since mid-April at $1,940.
Bitcoin posted small gains on Monday and continued to stretch higher early Tuesday. At the time of press, BTC/USD was up nearly 1% on the day at $23,100. Ethereum continues to fluctuate in a tight range slightly above $1,600 after having struggled to make a decisive move in either direction on Monday.
ING’s baseline scenario is moderately bearish for EUR/SEK, and expect to see sub-10.50 levels by 3Q23 before a 4Q rebound.
SEK should benefit from the improvement in Eurozone's growth picture
“We are moderately bearish on EUR/SEK in 2023 given the projected improvement in the Eurozone’s economic outlook and in risk sentiment.”
“We expect EUR/SEK to trend lower and move sustainably below 11.00 by the end of the first quarter as the Riksbank hikes by 50 bps and signals more tightening, while European sentiment improves. Then, we expect EUR/SEK to test the 10.00/10.50 trading range in the third quarter, when Fed rate cuts could give high-beta currencies like SEK an advantage over the EUR, and the beneficial effects for the Krona of an improved European economic outlook emerge.”
“SEK could experience some weakness towards the end of the year – i.e. EUR/SEK moving back above 10.50 – as colder weather could bring higher energy prices and a deterioration in risk sentiment.”
“It's important to note that this profile embeds our view for a rather strong EUR in 2023. We expect to see larger SEK gains against the Dollar.”
Open interest in natural gas futures markets shrank by around 2.1K contracts on Monday after two daily builds in a row, according to preliminary readings from CME Group. Volume, instead, rose by around 121.3K contracts and reversed two consecutive daily pullbacks.
Natural Gas: Immediately to the downside comes $3.00
Natural gas prices advanced marginally on Monday amidst a broader lack of direction and diminishing open interest. That said, further recovery appears not favoured in the very near term at least and shifts the focus to the key $3.00 mark per MMBtu.
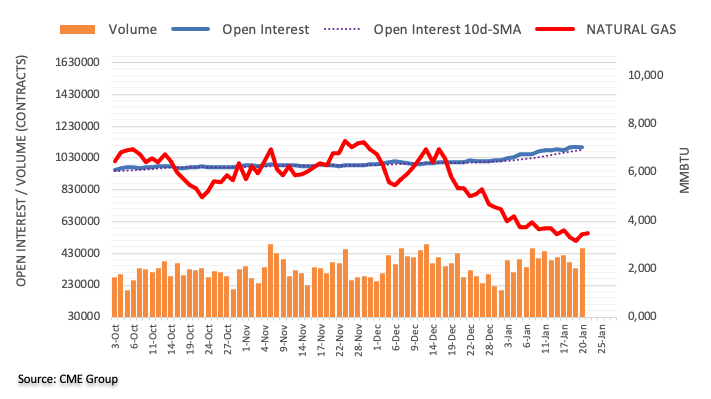
CME Group’s flash data for crude oil futures markets noted traders added around 26.7K contracts to their open interest positions at the beginning of the week, extending the upside for the second session in a row. In the same direction, volume reversed three straight daily drops and went up by nearly 70K contracts.
WTI: Upside momentum seen struggling above $80.00
Prices of the WTI started the week in an inconclusive tone around the 81.00 mark. Monday’s price action was accompanied by increasing open interest and volume, exposing further indecision in the very near term. In the meantime, it seems the 100-day SMA around the $82.00 mark continues to limit the upside bias in the commodity.
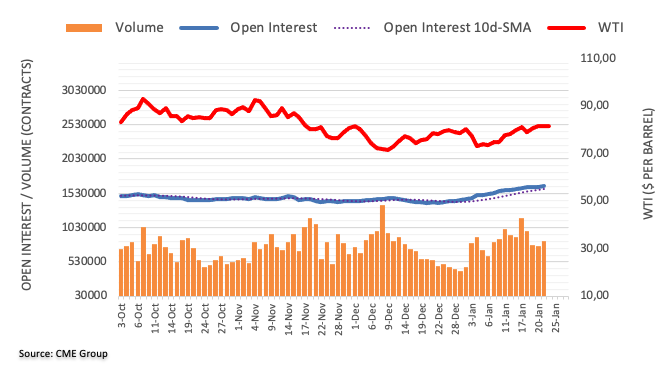
- Gold price renews nine-month high while staying comfortably beyond $1,917 support confluence.
- US Dollar weakness, mixed sentiment allows XAU/USD bulls to keep the reins amid China’s off, Fed blackout.
- First readings of January’s PMI will direct intraday moves but US Q4 GDP will be more important to guidance.
Gold price (XAU/USD) refreshes a nine-month high as it picks up bids to $1,940 during the initial hour of Tuesday’s European session. In doing so, the bright metal cheers broad US Dollar weakness, as well as hopes of more demand from China, ahead of the monthly activity data. It’s worth noting that the cautious mood ahead of the key preliminary activity data from the US, Eurozone and the UK seemed to have put a floor under the Gold price of around $1,917.
Also read: Gold Price Forecast: XAU/USD eyes $1,942 and global PMIs for further upside
Gold Price: Key levels to watch
The Technical Confluence Detector shows that the Gold price grinds higher past the $1,917 support confluence including the Pivot Point one-day S1 and Pivot Point one-month R3.
That said, a convergence of the Fibonacci 23.6% on one-week, 50-HMA and the middle band of the Bollinger on the hourly play, around $1,930, appears immediate support for the Gold traders to watch.
It should be noted that a downside break of the $1,917 support confluence opens the door for Gold’s south-run towards the $1,900 threshold.
Alternatively, Pivot Point one-week R1 close to $1,945 appears the nearby hurdle for the XAU/USD bulls to aim for.
Following that, there prevails an empty road for the buyers to ride ahead of the April 2022 peak surrounding $1,966.
Here is how it looks on the tool
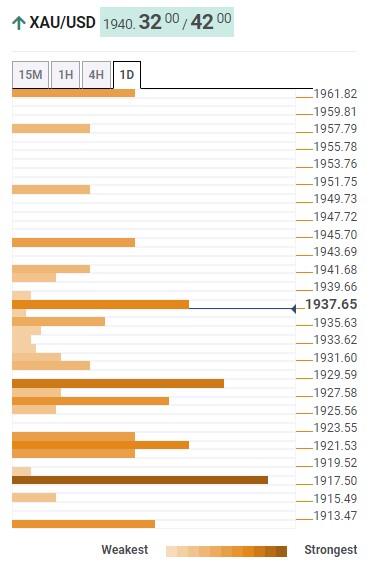
About Technical Confluences Detector
The TCD (Technical Confluences Detector) is a tool to locate and point out those price levels where there is a congestion of indicators, moving averages, Fibonacci levels, Pivot Points, etc. If you are a short-term trader, you will find entry points for counter-trend strategies and hunt a few points at a time. If you are a medium-to-long-term trader, this tool will allow you to know in advance the price levels where a medium-to-long-term trend may stop and rest, where to unwind positions, or where to increase your position size.
- GBP/JPY retreats from a nearly four-week high touched on Monday, though lacks follow-through.
- A combination of factors revives demand for the safe-haven JPY and exerts pressure on the cross.
- Expectations that elevated UK CPI might force the BoE to continue raising rates helps limit losses.
The GBP/JPY cross comes under some selling pressure on Tuesday and erodes a part of the overnight gains to a nearly four-week high. The cross remains depressed around the 161.25-161.30 area through the early European session and for now, seems to have snapped a six-day winning streak.
A combination of factors assists the Japanese Yen to regain some positive traction and stall its recent corrective decline, which, in turn, is seen weighing on the GBP/JPY cross. Despite the Bank of Japan's decision last week to leave its policy settings unchanged, investors seem convinced that a shirt in stance is inevitable amid stubbornly high inflation. The bets were lifted after the latest CPI report from Japan showed that consumer inflation rose to a 41-year high level of 4% in December. Apart from this, worries about a deeper global economic downturn further underpin the JPY's relative safe-haven status against its British counterpart.
The downside for the GBP/JPY cross, meanwhile, seems limited amid speculations that elevated consumer inflation will maintain pressure on the Bank of England (BoE) to continue raising interest rates. In fact, the UK Office for National Statistics reported last week that the core CPI in the UK stayed at 6.3% in December or more than three times the BoE's 2% target. Furthermore, the emergence of fresh selling around the US Dollar benefits the British Pound, which might hold back traders from placing aggressive bearish bets. This, in turn, warrants some caution before positioning for an extension of the intraday depreciating move.
Market participants now look forward to the release of the flash UK PMI prints for January for some impetus. Apart from this, the broader risk sentiment will influence the safe-haven JPY and contribute to producing short-term trading opportunities around the GBP/JPY cross. Bulls, meanwhile, are likely to wait for some follow-through buying beyond the 161.75-161.80 area, above which spot prices could aim to test the late December swing high, around the 162.30-162.35 region. The momentum could get extended further towards the 163.00 mark en route to the 100-day SMA, which coincides with the 164.00 horizontal support breakpoint near the 164.00 level.
Technical levels to watch
Gold price is consolidating the latest uptick to near nine-month highs. XAU/USD eyes $1,942 and global PMIs for further upside, FXStreet’s Dhwani Mehta reports.
Eurozone, United States PMI data in focus
“The focus is now shifting back to preliminary S&P Global Manufacturing and Services Purchasing Manager’s Index from the Eurozone and the US. Should the PMI reports across the euro area and from the US hint at increasing odds of a global recession, investors could scurry into the safe-haven USD, triggering a sharp retracement in XAU/USD from higher levels.”
“Gold bulls continue to yearn for acceptance above the upper boundary of a rising wedge formation, now aligned at $1,942. A fresh upswing toward the $1.950 psychological level cannot be ruled out on a daily candlestick closing above the latter.”
“The lower boundary of the wedge, now at $1,923, holds the key for Gold optimists. A sustained downside break could fuel a fresh downswing toward January 18 low at $1,897. But the previous day’s low at $1,911 and the $1,900 round figure could offer some brief reprieve to Gold buyers.”
See – EU PMI Preview: Forecast from three major banks, rising from the ashes
Considering advanced prints from CME Group for gold futures markets, open interest went up for the third session in a row on Monday, this time by around 6.2K contracts. Volume followed suit and rose by around 34.2K contracts, keeping the erratic activity well in place for yet another session.
Gold: Immediate to the upside comes $2000
Gold prices started the week in a positive fashion amidst rising open interest and volume. Against that, the likelihood of further gains remains well in place and with the next hurdle of relevance at the key $2000 mark per ounce troy.
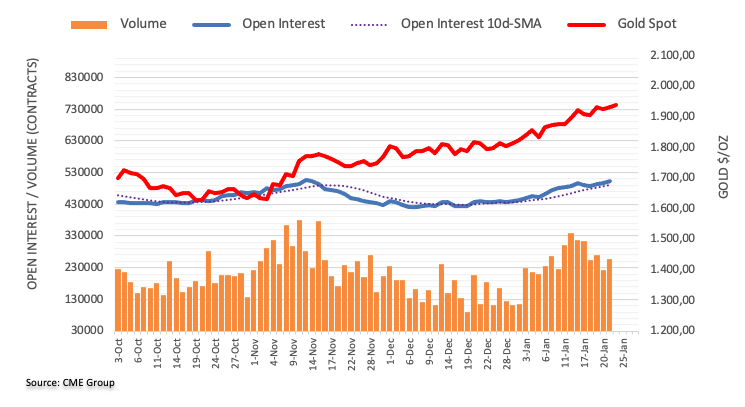
FX option expiries for Jan 24 NY cut at 10:00 Eastern Time, via DTCC, can be found below.
- USD/JPY: USD amounts
- 131.00 520m
- AUD/USD: AUD amounts
- 0.7000 500m
- USD/CAD: USD amounts
- 1.3450 500m
- EUR/USD remains on the front foot near nine-month high.
- Hawkish comments from European Central Bank officials contrast with dovish bias surrounding the Federal Reserve to favor Euro buyers.
- Upbeat Eurozone Consumer Confidence adds strength to the EUR/USD bulish bias.
- Preliminary readings of German, Eurozone and the US PMIs for January, speech from ECB’s Lagarde will be important for intraday.
EUR/USD grinds near an intraday high surrounding 1.0880 as the pair buyers stay in the driver’s seat for the fourth consecutive day heading into Tuesday’s European session.
In doing so, the Euro pair cheers hawkish comments from the European Central Bank (ECB) officials, as well as bearish bias surrounding the Federal Reserve (Fed) ahead of the next week’s Federal Open Market Committee (FOMC) meeting. It should be noted, however, that the technical details join the cautious mood ahead of the key data/events, as well as news challenging the sentiment and probing the US Dollar bears, to probe the pair buyers of late.
European Central Bank hawks propel EUR/USD
On Monday, European Central Bank (ECB) President Christine Lagarde reiterated his support for the higher rate and Governing Council member Ignazio Visco backed the same. However, major attention was given to ECB Governing Council Member Peter Kazimir who said, “I am convinced that we need to deliver two more hikes by 50 basis points (bps)." The idea of a 50 bps rate hike was something that many policymakers have refrained from in recent days and has bolstered the EUR/USD strength.
On the other hand, chatters surrounding the Federal Reserve’s (Fed) 25 bps rate lift in February and policy pivot seemed to have weighed on the US Dollar amid the pre-FOMC blackout period, which in turn favor the EUR/USD buyers.
Contrasting data from Eurozone, United States underpin Euro upside
Not only the hawkish ECB talks versus the easing bias surrounding the Fed but upbeat prints of Eurozone Consumer Confidence for January, -20.5 versus -22.5 expected and -22.2 prior, also contrasts with the downbeat United States data to fuel the EUR/USD pairs’ upside. That said, US Conference Board’s Leading Index for December, to -1.0% versus -0.7% expected and -1.1% prior, added weakness to the US Dollar.
US Inflation expectations, Sino-American chatters probe EUR/USD bulls
While aforementioned catalysts are active in pleasing the EUR/USD pair buyers, an increase in the US inflation expectations, as per the 10-year and 5-year breakeven inflation rates from the St. Louis Federal Reserve (FRED) data, join the US-China tussles to challenge the upside. That said, the inflation precursors for the 10-year and 5-year tenures rise for the third consecutive day to 2.28% each and justify the pre-blackout hawkish Fed comments. Additionally, the struggles between the US and China surrounding the Beijing-based companies’ ties to the Russian war effort join the fears of economic recession to weigh on the market sentiment and poke the EUR/USD bulls.
PMIs, ECB’s Lagarde in focus
Looking forward, the preliminary prints of the monthly activity data from the S&P Global surveys for Germany, the Eurozone and the US will be crucial for the EUR/USD pair traders to watch for immediate directions. However, major attention will be given to ECB President Christine Lagarde’s speech amid hawkish bias for the regional central bank. Considering the upbeat forecasts for the data from Germany and the Eurozone versus the consensus favoring softer US data, as well as hopes of ECB’s aggression on rate hikes, the EUR/USD buyers are likely to keep the reins.
EUR/USD technical analysis
Despite failing to cross the six-week-old resistance line the previous day, EUR/USD resumes run-up to challenge the stated key hurdle surrounding 1.0920 as bulls keep the reins above the 10-DMA, close to 1.0825 at the latest.
Also keeping the EUR/USD buyers hopeful are the bullish signals from the Moving Average Convergence and Divergence (MACD) indicator. However, the nearly overbought Relative Strength Index (RSI) line, placed at 14, probe the upside bias.
In addition to the 1.0920 hurdle, the EUR/USD bulls will also need validation from the recent multi-day top of near 1.0930, as well as April 2022 high near 1.0936, to keep the reins.
Alternatively, a downside break of the 10-DMA support of 1.0825 could drag the Euro bears towards the resistance-turned-support line from mid-December, near 1.0650.
That said, the previous weekly low and the December 2022 peak, respectively near 1.0765 and 1.0735, could also as the downside filters for the EUR/USD pair.
Overall, EUR/USD is likely to remain on the bull’s radar even if the upside room appears limited.
EUR/USD: Daily chart
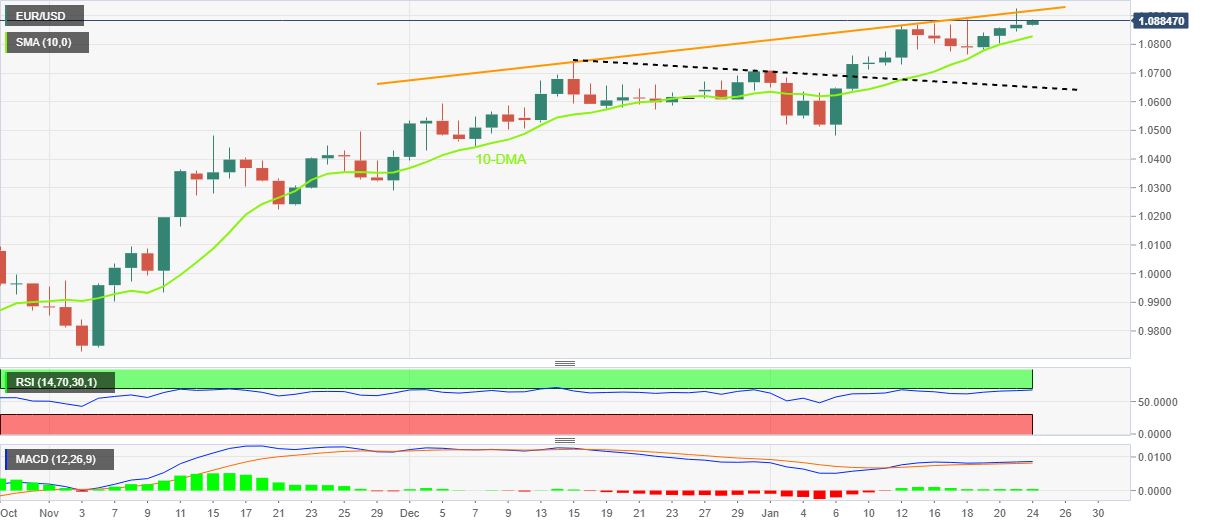
Trend: Limited upside expected
- The index kept the consolidation well in place near 102.00.
- The resumption of the risk-on mood weighs on the dollar.
- Flash Manufacturing/Services PMIs come next in the US docket.
The greenback maintains the consolidative phase well in place for yet another session around the 102.00 neighbourhood when gauged by the USD Index (DXY) on turnaround Tuesday.
USD Index now looks at upcoming data
The index extends the erratic performance on Tuesday, always around the 102.00 neighbourhood and close to the area of multi-month lows.
There are no changes to the macro scenario around the greenback, where the debate between markets’ expectations of a pivot in the Fed’s policy continue to face the hawkish narrative from Fed’s policy makers, all ahead of the FOMC event on February 1.
On the latter, a 25 bps interest rate hike remains fully priced in according to CME Group’s FedWatch Tool.
In the US data space, advanced Manufacturing and Services PMIs for the first month of the year will take centre stage later in the session.
What to look for around USD
The dollar’s price action remains subdued in the lower end of the recent range around the 102.00 region so far this week.
The idea of a probable pivot in the Fed’s policy continues to weigh on the greenback and keeps the price action around the DXY depressed. This view, however, also comes in contrast to the hawkish message from the latest FOMC Minutes and recent comments from rate setters, all pointing to the need to advance to a more restrictive stance and stay there for longer, at the time when rates are seen climbing above the 5.0% mark.
On the latter, the tight labour market and the resilience of the economy are also seen supportive of the firm message from the Federal Reserve and the continuation of its hiking cycle.
Key events in the US this week: Flash Manufacturing/Services PMIs (Tuesday) – MBA Mortgage Applications (Wednesday) – Durable Goods Orders, Advanced Q4 GDP Growth Rate, Chicago Fed National Activity Index, Initial Jobless Claims, New Home Sales (Thursday) – PCE, Core PCE, Personal Income, Personal Spending, Pending Home Sales, Final Michigan Consumer Sentiment (Friday).
Eminent issues on the back boiler: Rising conviction of a soft landing of the US economy. Prospects for extra rate hikes by the Federal Reserve vs. speculation of a recession in the next months. Fed’s pivot. Geopolitical effervescence vs. Russia and China. US-China trade conflict.
USD Index relevant levels
Now, the index retreats 0.12% at 101.89 and faces the next support at 101.52 (2023 low January 18) seconded by 101.29 (monthly low May 30 2022) and finally 100.00 (psychological level). On the downside, a breakout of the weekly high at 102.89 (January 18) would pave the way for a test of 105.63 (monthly high January 6) and then 106.45 (200-day SMA).
- NZD/USD has overstepped the 0.6500 resistance amid a cheerful market mood.
- The New Zealand Dollar is driving the Kiwi asset towards the upper portion of the Rising Channel.
- An oscillation in the bullish range by the RSI (14) indicates more upside ahead.
The NZD/USD pair surpassed the psychological resistance of 0.6500 in the early European session. The kiwi asset has picked strength as the US Dollar Index (DXY) has witnessed immense pressure after failing to recapture Monday’s high at 101.87. The USD Index has refreshed its day’s low at 101.47, portraying a risk appetite theme in the market.
The S&P500 futures have managed to recover their morning losses and have turned positive. Meanwhile, the 10-year US Treasury yields are struggling at around 3.52%.
NZD/USD is marching towards the upper portion of the Rising Channel chart pattern placed on a two-hour scale. The upper portion of the Rising Channel is placed from December 28 high at 0.6356 while the lower portion of the chart pattern is plotted from January 6 low at 0.6190.
The 20-period Exponential Moving Average (EMA) at 0.6464 is acting as a major support for the New Zealand bulls.
Meanwhile, the Relative Strength Index (RSI) (14) is oscillating in a bullish range of 60.00-80.00, which indicates that the upside momentum is firmer.
For an upside move, the asset needs to surpass Wednesday’s high at 0.6530, which will drive the asset toward June 3 high at 0.6576. A breach of the latter will expose the asset to the round-level resistance at 0.6600.
On the flip side, a breakdown below January 16 high at 0.6426 will drag the Kiwi asset toward January 17 low at 0.6366 followed by January 12 low around 0.6300.
NZD/USD two-hour chart
-638101375316313366.png)
- WTI oscillates in a limited territory around $81.50 amid the absence of a potential trigger.
- The upside in the oil price is capped amid rising worries about the US recession.
- While better prospects for the Chinese economy after the lifting of pandemic controls are supporting the oil price.
West Texas Intermediate (WTI), futures on NYMEX, is displaying back-and-forth moves in a narrow range around $81.50 in the early European session. The oil price is struggling to find direction as the upside is capped due to escalating recession worries in the United States while the downside is restricted amid optimism over economic recovery in China.
The Chinese economy has lifted pandemic controls and the street is expecting a sheer recovery in the oil demand in CY2023. Optimism for China’s recovery is supporting firmer bets for price extensions in oil and other commodities. Chinese administration and the People’s Bank of China (PBoC) are expected to favor fiscal stimulus and expansionary monetary policy to spurt the scale of economic activities.
Meanwhile, rising worries about the US recession are capping the upside of the oil price. Economic activities in the United States have shrunk dramatically as the Federal Reserve (Fed) has hiked interest rates at a sheer pace. Fed chair Jerome Powell and other policymakers have been advocating the consistency of higher interest rates at peak for a longer period to contain the sticky inflation. This might restrict firms from borrowing funds to avoid higher interest obligations.
On the supply front, fresh headlines that the United States administration is considering the cancellation of the planned sale of oil from its Strategic Petroleum Reserve (SPR) in CY2023 are supporting oil bulls. US President Joe Biden is looking to refill the oil reserve as one was eased firmly to tame soaring oil prices in CY2022 as reported by Energy Intelligence.
- USD/CAD fades bounce off intraday low during four-day downtrend.
- Oil price struggles to defend gains amid mixed concerns.
- Hawkish hopes of Bank of Canada, talks surrounding Fed policy pivot keep sellers hopeful.
- Preliminary readings of US S&P Global PMIs for January will be crucial ahead of BoC interest rate decision.
USD/CAD slides to 1.3350 as bears keep the reins for the fourth consecutive day heading into Tuesday’s European session.
In doing so, the Loonie pair cheers the broad US Dollar weakness, as well as a slow grind to the north in prices of Canada’s key export item, namely WTI crude oil, ahead of monthly activity data from the US. It’s worth noting that Wednesday’s Bank of Canada (BoC) monetary policy decision will be eyed closely by the pair traders amid talks surrounding a policy pivot.
That said, WTI crude oil pares intraday gains near $81.70 after a softer start to the week. Even so, black gold remains around the seven-week high amid hopes of China-linked demand. It should be observed that the latest talks surrounding the US readiness to use Special Petroleum Reserves (SPR) in the need weigh on the quote.
Elsewhere, the struggles between the US and China surrounding the Beijing-based companies’ ties to the Russian war effort join the fears of economic recession to weigh on the market sentiment and probe USD/CAD bears. Though, mixed figures of the Canadian housing data published the previous day joined the downbeat US Conference Board’s Leading Index and put a floor under the prices.
On a broader front, the absence of Fed policymakers’ talks ahead of the February meeting and the Lunar New Year holidays in China restricts the market moves, as well as limit USD/CAD pair’s momentum.
Amid these plays, the S&P 500 Futures resist following Wall Street’s gains while retreating from the six-week high marked the previous day, making rounds to 4,030-35 at the latest. On the same line, the US 10-year and two-year Treasury bond yields snap three-day recovery moves by struggling around 3.51% and 4.21% by the press time.
To break the monotony, USD/CAD traders may take clues from the first readings of January’s S&P Global PMIs and the fourth-quarter (Q4) Gross Domestic Product (GDP). However, major attention will be given to Wednesday’s BoC where the Canadian central bank is up for 0.25% rate hike. More importantly, hints for further rate hikes will be closely observed to determine further downside bias for the Loonie pair.
Technical analysis
Having failed to cross the 100-DMA, around 1.3515 by the press time, the USD/CAD bears poke a 10-week-old support line, near 1.3340 at the latest, to confirm further downside of the Loonie pair.
- GBP/USD clings to mild gains after reversing from 7.5-month high the previous day.
- UKICE reports no likely change to Brexit terms despite UK’s latest hardships.
- Concerns surrounding UK’s tax cuts in upcoming budget, tax probe on Conservative leader also probe Cable buyers.
- Preliminary readings of UK/US PMIs for January, BOE’s Pham eyed for fresh impulse.
GBP/USD grinds near 1.2380-85 as bulls flex muscles ahead of the key UK activity data heading into Tuesday’s London open. Even so, looming concerns over the Brexit and the UK tax, as well as sluggish markets, challenge the Cable pair buyers as of late.
That said, a report from the academic body UK In a Changing Europe (UKICE) unveiled on Tuesday that despite a significant economic hit to Britain from leaving the bloc and falling support for Brexit among the British public, major changes in the UK-EU relationship were unlikely. The news shared by Reuters also signaled no efforts by either the European Union (EU) of the UK to reassess the Trade and Cooperation Agreement (TCA) signed in December 2020, which in turn hints at further deadlock in the key issue and challenges for the GBP/USD pair.
On the other hand, the UK Prime Minister Rishi Sunak needed to push independent ethics adviser to a tax case involving Chairman of Conservative Party as Nadhim Zahawi was marked irregular in filings. Additionally, the chatters surrounding the Britain’s readiness to propose carbon border tax as part of steel industry aid package, per the Financial Times (FT), also seem to challenge the GBP/USD buyers. Furthermore, the mixed plays of Conservative push for tax cuts and the British support in contrast also highlight taxes as the key challenge for the UK government of late.
Elsewhere, the US Dollar Index remains sluggish amid an absence of Fed talks and China holidays. On the same line could be the recent struggles between the US and China surrounding the US confrontation with China over companies’ ties to the Russian war effort and the US debt ceiling in the Senate seemed to have probed the GBP/USD pair’s upside momentum.
Against this backdrop, the S&P 500 Futures resist following Wall Street’s gains while retreating from the six-week high marked the previous day, making rounds to 4,030-35 at the latest. On the same line, the US 10-year and two-year Treasury bond yields snap three-day recovery moves by struggling around 3.51% and 4.21% by the press time.
Moving on, GBP/USD may witness a pullback amid a cautious mood ahead of the first readings of January’s S&P Global PMIs and the fourth-quarter (Q4) Gross Domestic Product (GDP) for the US. Also important will be a speech from Bank of England (BOE) member Caroline D. Pham.
Technical analysis
Although multiple hurdles around the 1.2450 challenge the GBP/USD bulls, the bearish bias remains off the table unless the quote stays beyond an upward-sloping support line from October 12, 2022, close to 1.2015 by the press time.
- AUD/USD is struggling to extend gains above the immediate resistance of 0.7040.
- Reserve Bank of Australia might continue its restrictive monetary policy despite a contraction in economic activities.
- Federal Reserve is highly likely to decelerate the pace of policy tightening to 25 bps amid softening inflation.
- AUD/USD is expected to continue its upside momentum broadly as momentum oscillators are supporting the Australian Dollar.
AUD/USD has sensed selling interest while attempting to surpass the immediate resistance of 0.7040 in the Asian session. The Aussie asset is witnessing heat after the release of the downbeat preliminary Australian S&P PMI (Jan) data in early Tokyo. Also, a recovery in the US Dollar Index (DXY) has triggered volatility in the Aussie asset.
The US Dollar Index has recovered after dropping to near 101.50. The USD Index has refreshed its day’s high at 101.61 as investors are supporting the safe-haven assets again amid a decline in the demand for US government bonds. The 10-year US Treasury yields have recaptured the critical resistance of 3.52%. Meanwhile, the S&P500 futures are aiming to recover their morning losses. The 500-US stock basket futures witnessed significant buying interest on Monday amid rising chances of further deceleration in the pace of policy tightening by the Federal Reserve (Fed).
Australian Manufacturing PMI trims straight for seven month
According to the preliminary S&P PMI (Jan), Australian Manufacturing PMI has trimmed consecutively for the seven-month to 49.8 while the street was expecting an expansion to 50.3. Also, the Services PMI has dropped vigorously to 48.3 from the consensus of 49.7. Rising interest rates by the Reserve Bank of Australia (RBA) in its fight against stubborn inflation are leading to a contraction in economic activities. The absence of easy money for firms to execute investment and expansion plans along with bleak economic demand has trimmed the scale of economic activities.
Australian economic activities could recover ahead as China is on the path of recovery now after dismantling Covid-inspired lockdown curbs. According to a note from JPMorgan, Australia’s economy could be no small beneficiary of an end to China’s zero-Covid policy over the next two years. Also, China’s reopening could boost Australia’s economy by 1%.
Investors await Australian Inflation for further guidance
This week, investors will keenly focus on the release of the Australian Consumer Price Index (CPI) data for the fourth quarter of CY2022, which is scheduled for Wednesday. According to the estimates, the annual CPI is expected to escalate further to 7.5% from the prior release of 7.3%. While monthly inflation is seen sharply higher at 7.7% from the former release of 7.3%.
A release of the unchanged or higher-than-anticipated Australian inflation data might force the Reserve Bank of Australian Governor Philip Lowe to hike its Official Cash Rate (OCR) further. It is worth noting that the Reserve Bank of Australia is continuously hiking the interest rates to trim inflation, however, the energy prices are continuously ruining the whole plan.
Australian Treasurer Jim Chalmers cited that the worst part of the country's inflation crisis was over. He believes "The Australian economy will begin to soften a bit this year and that is the inevitable likely consequence of higher interest rates and a slowing global economy.”
Federal Reserve to trim the pace of restrictive policy further
Multiple catalysts belonging to the United States are conveying that inflation is softening further. Firms have been forced to release fewer employment opportunities due to the lower Producer Price Index (PPI) amid bleak economic projections. Also, US Treasury Secretary Janet Yellen cited on Monday that overall, she has a “good feeling that inflation is coming down.” This has further accelerated the odds of 25 basis points (bps) interest rate hike by the Federal Reserve (Fed) in its February monetary policy meeting.
According to the CME FedWatch tool, the odds of a 50 bps interest rate hike have vanished significantly. More than 98% chances are favoring a 25 bps interest rate hike by Federal Reserve chair Jerome Powell. It is worth noting that the Federal Reserve has already trimmed the scale of hiking interest rates after four consecutive 75 bps interest rate hikes to 50 bps in its December monetary policy meeting.
AUD/USD technical outlook
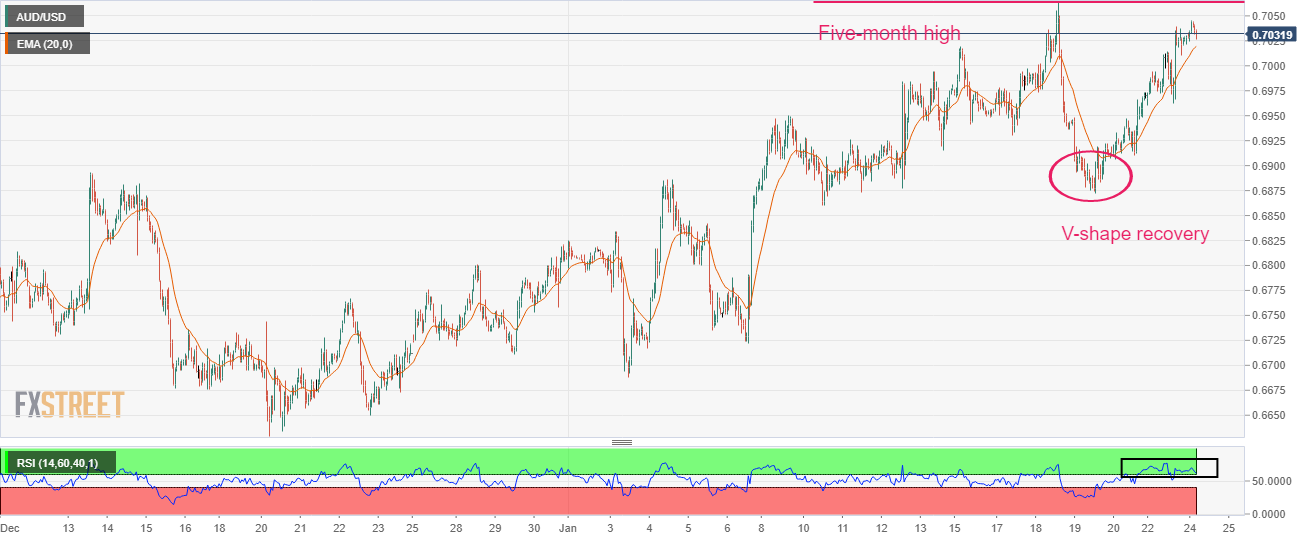
AUD/USD is marching towards the five-month high plotted from January 18 high at 0.7064 on an hourly scale. The Aussie asset displayed a V-shape recovery from January 19 low around 0.6875, which provides confidence that bullish momentum is present in the current trend. The 20-period Exponential Moving Average (EMA) around 0.7020 is constantly providing cushion to the Australian Dollar.
Also, the Relative Strength Index (RSI) (14) is oscillating in a bullish range of 60.00-80.00, which indicates that the upside momentum is solid.
- USD/INR remains firmer for the second consecutive day, grinds near intraday top.
- Successful break of three-week-old descending trend line, upbeat oscillators suggest upside break of 100-DMA.
- Previous support line from early August 2022 acts as the last defense of USD/INR bears.
USD/INR holds onto the week-start breakout of the previously key resistance line as bulls flirt with the 81.65 level during an initial hour of the Indian trading session on Tuesday. Even so, the 100-DMA challenges the immediate upside moves near 81.80.
It’s worth noting, however, that the receding bearish bias of the USD/INR and the upbeat RSI (14) suggest further upside of the pair.
Hence, the quote is likely to overcome the immediate barrier to the north near 81.80. Following that, the 82.00 round figure will be the focus of the USD/INR buyers.
In a case where USD/INR remains firmer past 82.00, the support-turned-resistance line from early August, near 82.10 at the latest, will be crucial to watch as a sustained break of which might give control to the bulls.
On the flip side, the immediate support line from January 06, the previous resistance near 81.40, puts a floor under the USD/INR declines.
Should the quote remains weak past 81.40, the 81.00 round figure and the monthly low marked on Monday close to 80.90 may entertain the USD/INR bears.
If at all the Indian Rupee (INR) pair refreshes it's monthly low, November’s trough surrounding 80.35 should be in the spotlight.
USD/INR: Daily chart
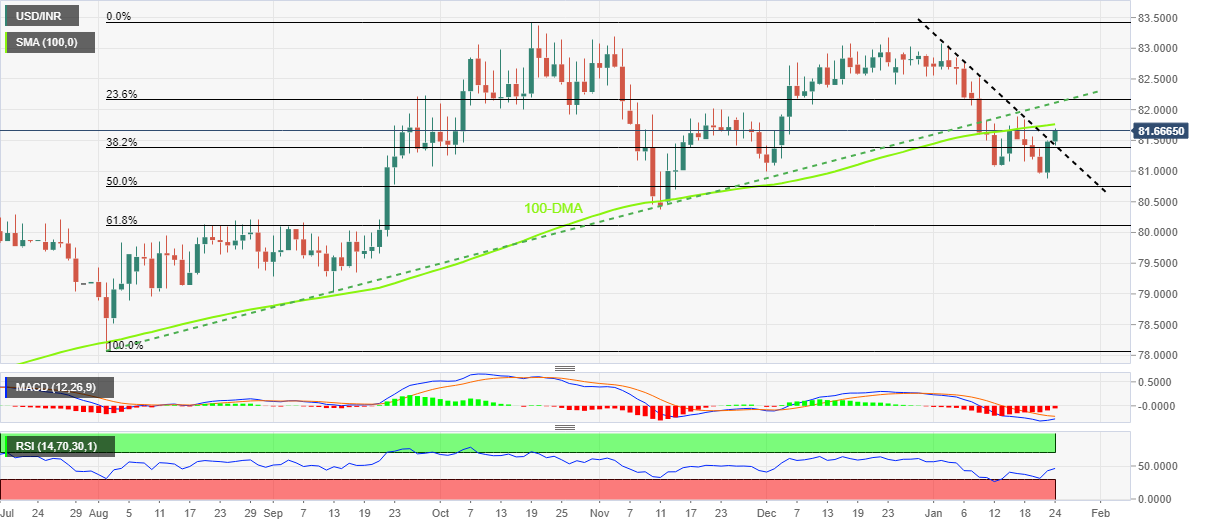
Trend: Further upside expected
- Gold price retreats from intraday high as bulls seek fresh clues to keep the reins.
- Challenges to US-China ties, mixed PMIs from Asia-Pacific majors probe XAU/USD bulls.
- China holidays, Fed blackout restrict momentum as Gold traders await US preliminary PMIs.
Gold price (XAU/USD) slides from the intraday high to $1,932 during early Tuesday morning in Europe. In doing so, the bullion price reacts to the latest challenges to sentiment amid an inactive market performance due to the lack of major data/events, as well as the absence of China traders and the Fed talks.
That said, the headlines suggesting the US confrontation with China over companies’ ties to the Russian war effort seemed to have probed the risk appetite at the latest. On the same line could be the talks surrounding the US debt ceiling in the Senate.
On the same line, an increase in the US inflation expectations, as per the 10-year and 5-year breakeven inflation rates from the St. Louis Federal Reserve (FRED) data, rise for the third consecutive day to 2.28% each and justify the pre-blackout hawkish Fed comments and challenge the sentiment.
Alternatively, softer prints of the US Conference Board’s Leading Index for December joined the lines of previous downbeat data from the US and signaled to ease inflation fears in the world’s largest economy, which in turn suggests less need for the Fed to be hawkish in February. It’s worth noting that the market players do expect a softer Fed rate hike in February and policy pivot afterward, which in turn weigh on the US Dollar.
It’s worth mentioning that the first readings of January’s activity data from Japan, Australia and New Zealand came in mixed, mostly positive, which in turn pushed back the looming recession fears but failed to inspire Gold buyers.
Amid these plays, the S&P 500 Futures resist following Wall Street’s gains while retreating from the six-week high marked the previous day, making rounds to 4,030-35 at the latest. On the same line, the US 10-year and two-year Treasury bond yields snap three-day recovery moves by struggling around 3.51% and 4.21% by the press time.
Looking forward, the Gold price may witness a pullback amid a cautious mood ahead of the first readings of January’s S&P Global PMIs and the fourth-quarter (Q4) Gross Domestic Product (GDP).
Gold price technical analysis
Gold price eases from the weekly bullish triangle’s top line as the yellow metal pares intraday gains around $1,940. The pullback moves also gain support from the RSI (14) retreat and the easing bullish bias of the MACD.
As a result, the XAU/USD price is likely to decline towards the $1,920 support confluence including the 100-Hour Moving Average (HMA), the stated triangle’s support line and the previous resistance line from January.
It’s worth noting, however, that the Gold price weakness past $1,920 won’t hesitate to break the $1,900 threshold while highlighting the monthly low surrounding $1,825 as the next stop for the XAU/USD bears.
Alternatively, an upside clearance of the $1,940 hurdle could quickly propel the Gold price towards the 61.8% Fibonacci Expansion (FE) of the metal’s moves between January 12 and 23, near $1,952.
Following that, March 2022 peak surrounding $1,966 will be the focus of the XAU/USD bulls.
Overall, Gold price is likely to pare intraday gains but the bullish trend remains intact, at least in the short term, unless breaking the $1,920 level.
Gold price: Hourly chart
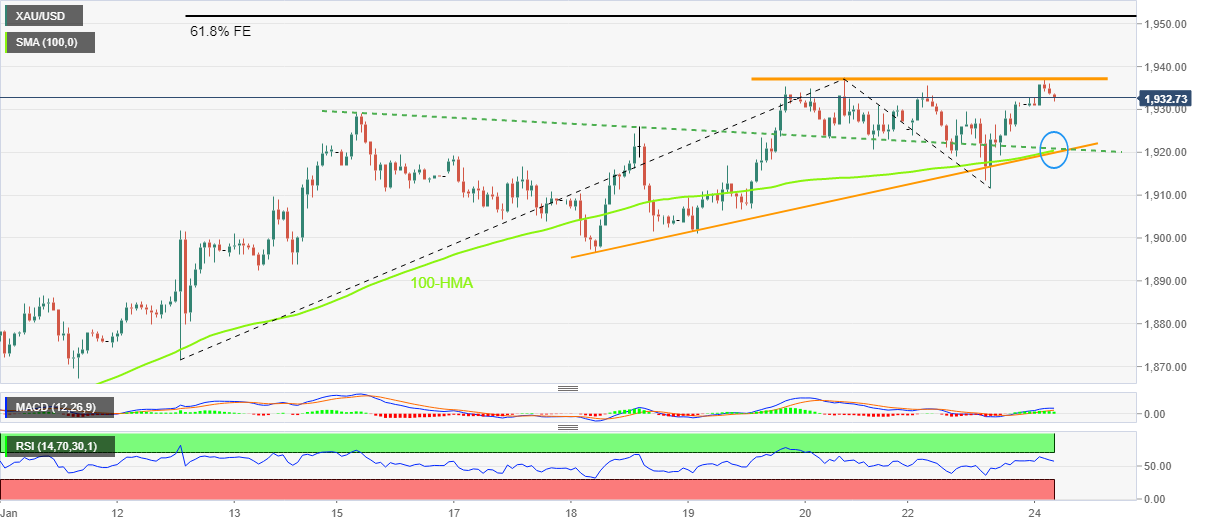
Trend: Pullback expected
- A recovery in investors’ risk appetite has led to a correction in USD/JPY.
- The volatility is contracting amid an Ascending Triangle formation.
- The 21-EMA is continuously providing support to the US Dollar.
The USD/JPY pair has corrected gradually to near 130.15 after printing a fresh three-day high at 130.89 on Monday. The asset has corrected due to a recovery in investors' risk-taking capacity. The risk-appetite theme has gained traction as the S&P500 futures have recovered losses recorded in early Asia. The major has remained volatile amid chatters over Bank of Japan (BOJ) Governor Haruhiko Kuroda’s successor.
The US Dollar Index (DXY) has slipped to near 101.50 after surrendering the critical support of 101.60. Losing traction for safe-haven assets has faded the risk aversion theme.
USD/JPY is demonstrating signs of volatility contraction amid the formation of the Ascending Triangle chart pattern on an hourly scale. The major is near the upward-sloping trendline of the chart pattern plotted from January 19 low at 127.76. While the horizontal resistance is placed from January 18 high around 131.58.
The 21-period Exponential Moving Average (EMA) at 130.35 is providing support to the US Dollar.
Meanwhile, the Relative Strength Index (RSI) (14) has slipped into the 40.00-60.00 range, portraying a loss in the upside momentum.
Should the asset break below Monday’s low around 129.00, Japanese Yen bulls will drag the asset towards January 19 low at 127.76 followed by January 16 low at 127.22.
On the contrary, a breakout of the chart pattern after exploding January 18 high around 131.58 will drive the asset towards January 9 high at 132.65. A break above the latter will expose the asset for more upside towards January 5 high around 134.00.
USD/JPY hourly chart
-638101292516452381.png)
- EUR/USD is eyeing a re-test of 1.0900 amid the risk-on market mood.
- Investors' risk-taking capacity is improving again as the Fed might trim the policy tightening pace further.
- The ECB looks all set to hike interest rates further by 50 bps to 3.25%.
The EUR/USD pair is aiming to extend its journey toward the round-level resistance of 1.0900 in the Asian session. The asset has picked strength as the risk-on impulse is gaining traction again. The demand for the major currency pair is escalating maid divergence policy stances for the Federal Reserve (Fed) and European Central Bank (ECB) interest rate hike projections.
Meanwhile, investors’ risk appetite is improving again as the S&P500 futures have recovered their morning losses. The US Dollar Index (DXY) has eased further to near 101.50 amid rising chances of a 25 basis points (bps) interest rate hike by the Fed in its upcoming meeting in February. Also, the 10-year US Treasury yields have dropped to near 3.51%.
Subdued retail demand, declining employment at a healthy pace, a fall in the scale of economic activities, and firms offering products at lower prices at factory gates are impacting the economic prospects in the United States but are strengthening the Fed in its combat against higher inflation. This is resulting in rising expectations that the Federal Reserve (Fed) might trim the extent of the interest rate hike again.
Fed chair Jerome Powell has already trimmed the interest rate hike extent to 50 basis points (bps) in its December monetary policy meeting after four consecutive 75 bps rate hikes. The Fed is expected to hike interest rates by 25 bps ahead.
On the Eurozone front, ECB President Christine Lagarde and his teammates are favoring the continuation of higher interest rate hikes to soften inflationary pressures significantly.
ECB policymaker Peter Kazimir cited on Monday that inflation easing was good news but added that it was not a reason to slow the pace of interest rate hikes, as reported by Reuters. He further added, "I am convinced that we need to deliver two more hikes by 50 basis points (bps).”
The latest Reuters poll of economists claims the European Central Bank (ECB) hiking rates by another 50 bps at its February monetary policy meeting while the policy rate is expected to reach 3.25% by mid-year.
- USD/CHF prints mild losses during the first daily fall in three.
- Mixed sentiment, pre-data anxiety joins China-linked optimism to weigh on USD/CHF prices.
- US inflation expectations, hawkish central banks keep the buyers hopeful.
- Off in China, Fed’s blackout restrict immediate moves but US PMIs, Q4 GDP are more important for clear directions.
USD/CHF sellers return to the table, after a two-day absence, in early Tuesday. That said, the Swiss currency (CHF) pair’s latest weakness could be linked to the market’s consolidation amid a cautious mood ahead of the key data/events from Switzerland and the US. Also keeping the sellers hopeful could be the broad US Dollar weakness amid cautious optimism and sluggish performance.
That said, China’s Lunar New Year holidays join the pre-Federal Open Market Committee (FOMC) blackout period for the Fed policymakers to restrict the market’s immediate moves. Even so, the US Dollar fades from the previous day’s corrective bounce as softer US data on Monday backed dovish bias from the US central bank.
On Monday, softer prints of the US Conference Board’s Leading Index for December joined the lines of previous downbeat data from the US and signaled to ease inflation fears in the world’s largest economy, which in turn suggests less need for the Fed to be hawkish in February. It’s worth noting that the market players do expect a softer Fed rate hike in February and policy pivot afterward, which in turn weigh on the US Dollar.
Alternatively, the US inflation expectations, as per the 10-year and 5-year breakeven inflation rates from the St. Louis Federal Reserve (FRED) data, rise for the third consecutive day to 2.28% each and justify the pre-blackout hawkish Fed comments and challenge the sentiment.
Furthermore, news that the US confronts China over companies’ ties to the Russian war effort, shared by Bloomberg, joins the talks surrounding the US debt ceiling in the Senate to probe the market optimists.
Amid these plays, the S&P 500 Futures resist following Wall Street’s gains while retreating from the six-week high marked the previous day, making rounds to 4,030-35 at the latest. On the same line, the US 10-year and two-year Treasury bond yields snap three-day recovery moves by struggling around 3.51% and 4.21% by the press time.
Given the USD/CHF pair’s consolidation amid mixed clues, the upcoming Swiss trade numbers for December and the first readings of January’s S&P Global PMIs for the US will be important for intraday traders. However, major attention will be given to the US fourth-quarter (Q4) Gross Domestic Product (GDP) will be the key amid recession woes. Should the US data keep coming softer, the US Dollar could refresh the multi-month low marked earlier in January, which in turn will weigh on the USD/CHF prices.
Technical analysis
A 12-day-old bearish channel restricts USD/CHF moves between 0.9035 and 0.9270.
| Raw materials | Closed | Change, % |
|---|---|---|
| Silver | 23.455 | -2.01 |
| Gold | 1931.49 | 0.37 |
| Palladium | 1706.26 | -1.38 |
- Silver price renews intraday high to reverse the previous day’s slump to five-week low.
- 200-SMA, bearish chart formation keeps XAG/USD bears hopeful.
- Monthly high acts as the last defense of Silver bears.
Silver price (XAG/USD) picks up bids to refresh intraday high near $23.55 as it bounces off the five-week low marked the previous day. In doing so, the bright metal recovers from the support line of a one-week-long descending trend channel.
As the XAG/USD recovery takes clues from the RSI (14) rebound from the overbought territory, the latest run-up is likely to poke the immediate hurdle, namely the 200-SMA level surrounding $23.65.
However, the quote’s further upside will need validation from the top line of the stated channel, close to $24.10 at the latest.
Even so, the monthly high near $24.55, also the highest level since late April 2022, could challenge the Silver buyers, a break of which won’t hesitate to direct the commodity price towards the April 2022 high near $26.25.
On the contrary, the 61.8% Fibonacci retracement level of the XAG/USD’s upside from December 16 to January 03, around $23.30, restricts immediate declines of the metal.
Following that, the aforementioned bearish chart formation’s support line, near $23.00 by the press time, will be crucial to watch for a corrective bounce.
In a case where the Silver price fails to rebound from $23.00, a slump toward the mid-2022 peak surrounding $22.50 can’t be ruled out.
Silver price: Four-hour chart
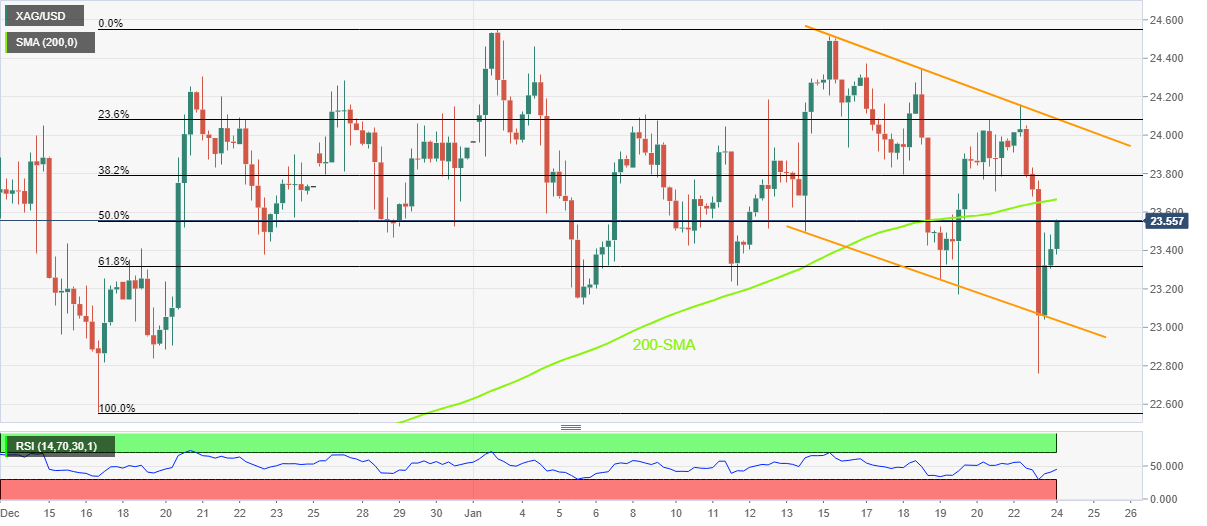
Trend: Limited recovery expected
- AUD/JPY bears have started to take on the supporting trendlines.
- The AUD/JPY price imbalance is vulnerable and guards potentially all the way to 91.00 the figure.
The forex space is registering fresh highs and lows all over the board and AUD/JPY is no exception. This leaves the outlook compelling for the week ahead as we had over to the second day of trade starting in Asia.
The bulls have been in charge for the best part of the end of last week with a strong rally from a low of around 88.00 to meet the upper end of the 91 area. The question now is whether the bears will be given an opportunity as the price starts to consolidate here following some recent deceleration on the bid:
AUD/JPY price analysis
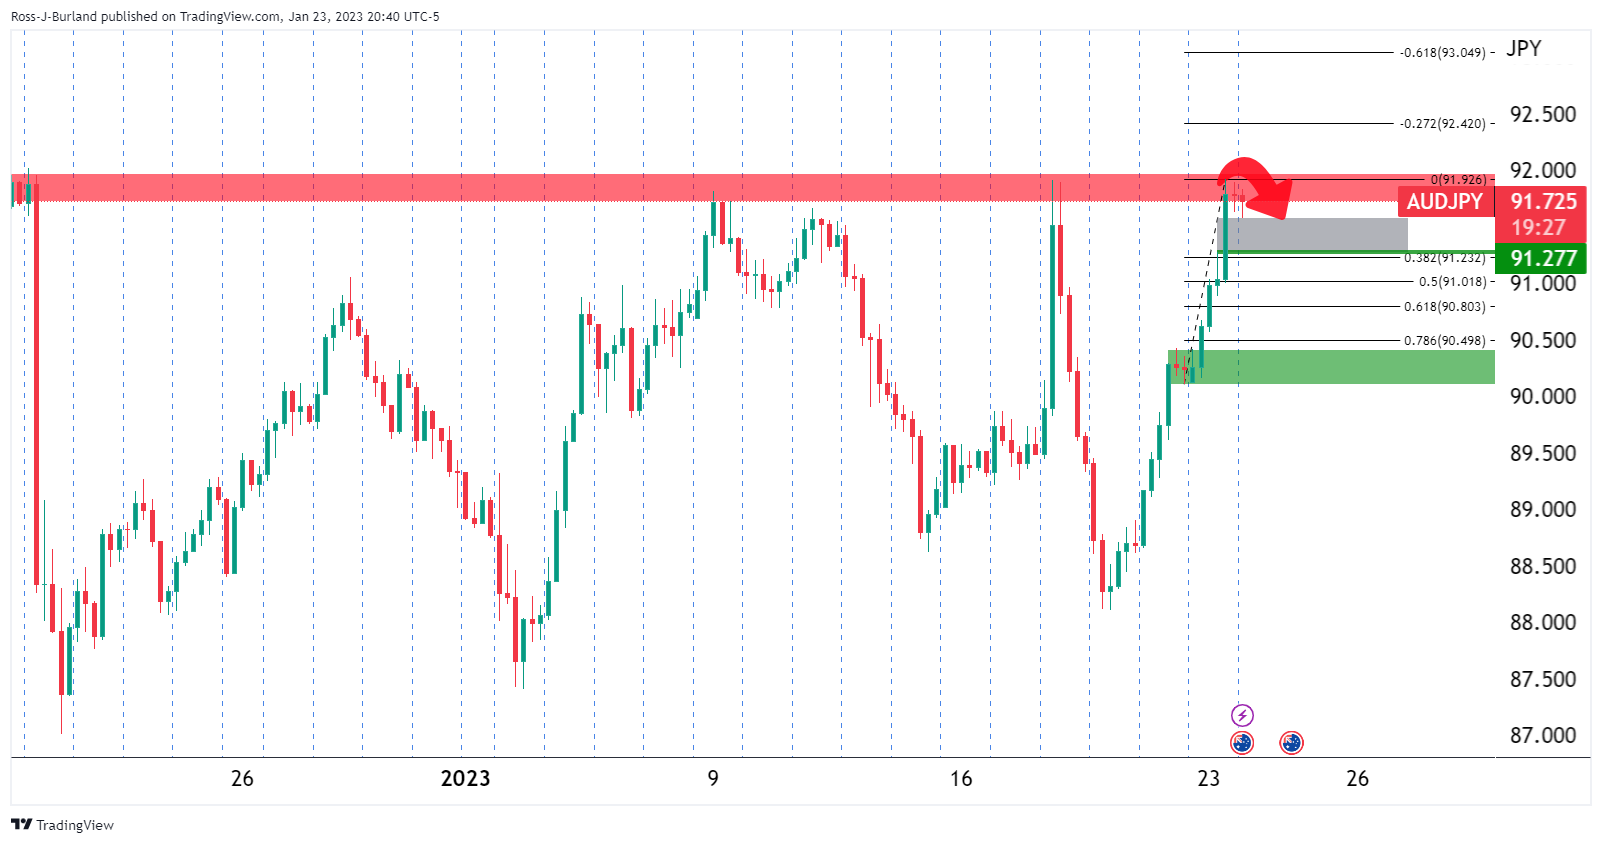
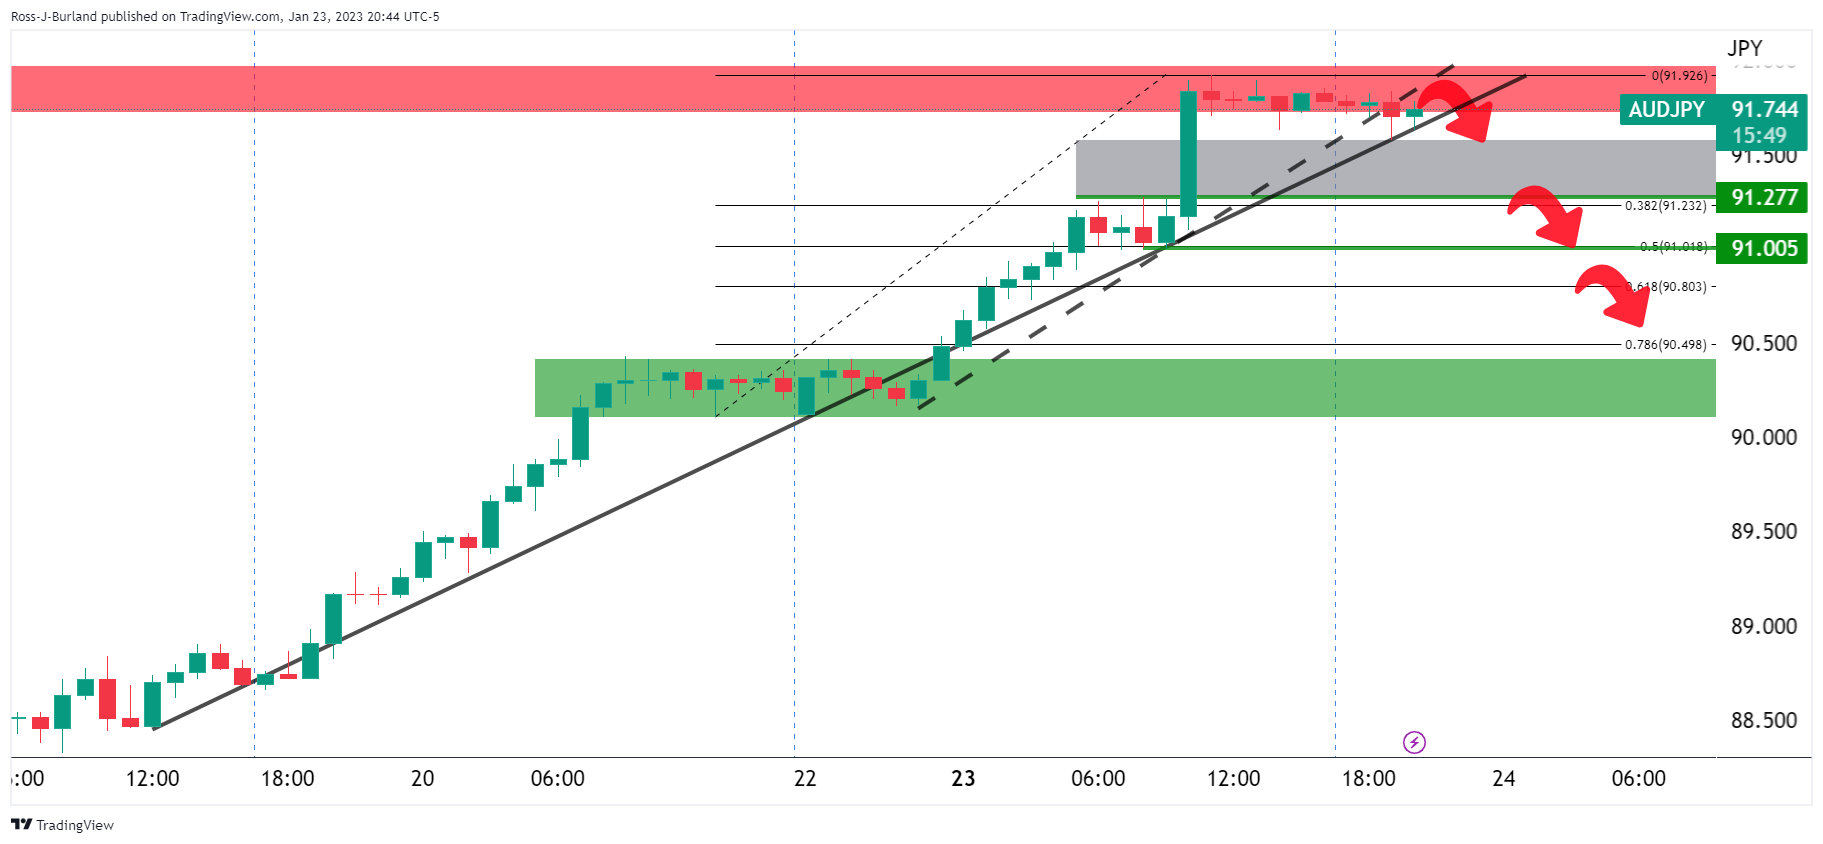
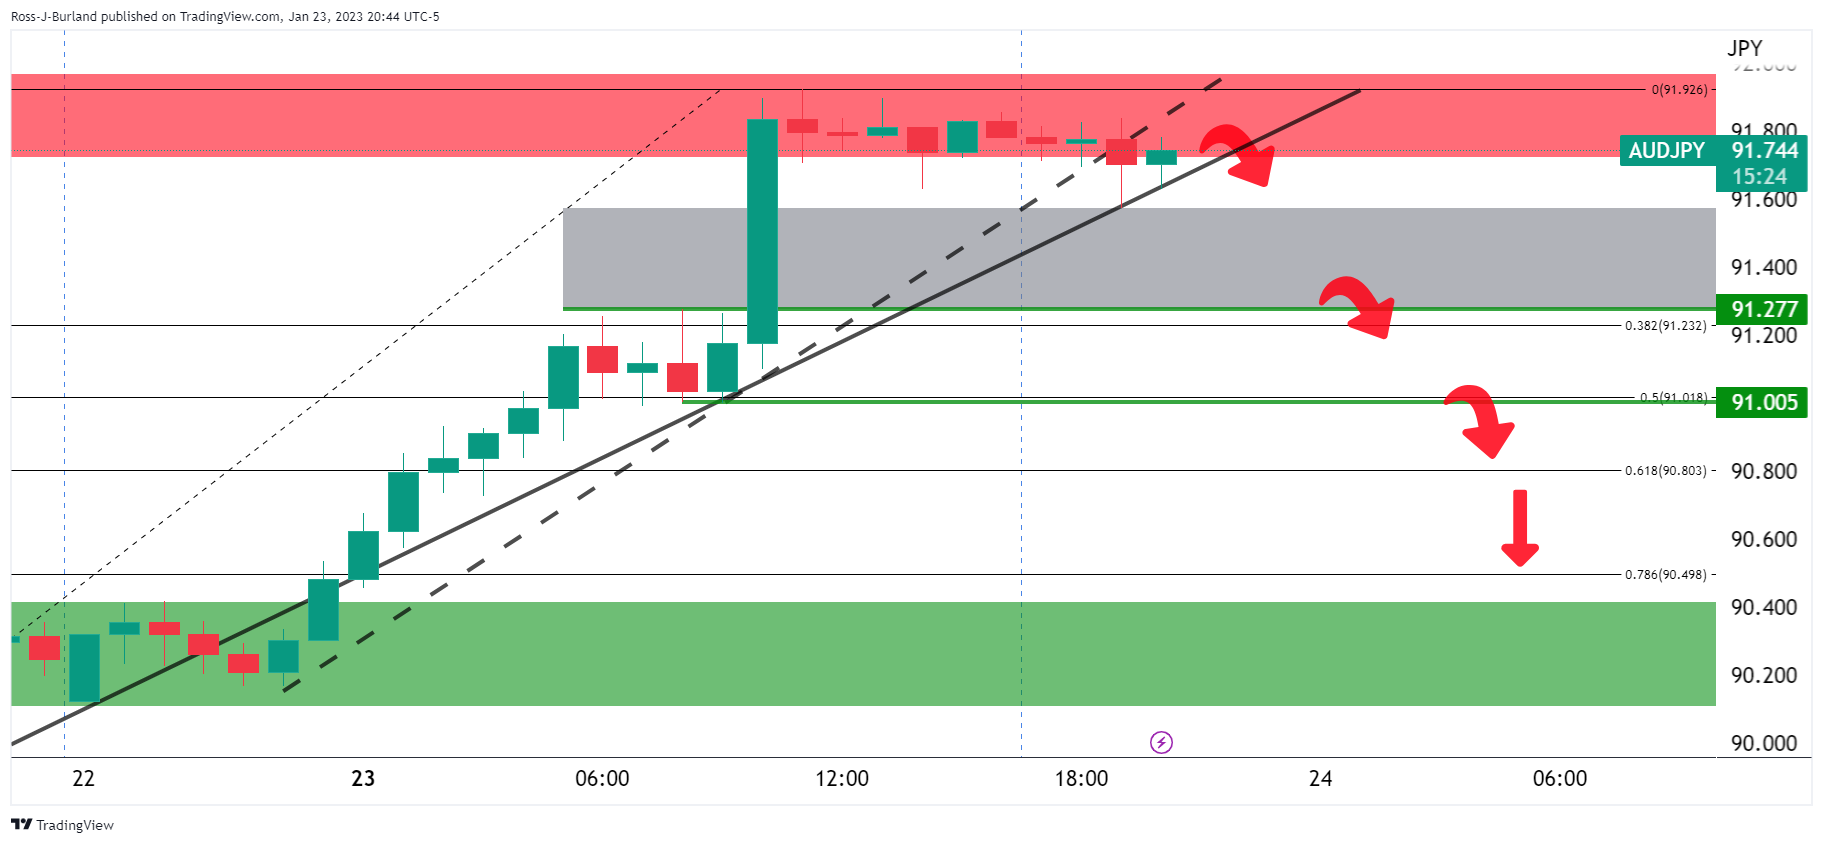
The bears have started to take on the supporting trendlines and a break there will open risks of a move into the price imbalance below and potentially all the way to the 91.27s and the 91.00 figure.
- Market sentiment remains unclear amid China LNY holidays, Fed blackout.
- Mixed data from Australia, New Zealand and Japan fail to offer clear directions.
- US two-year, 10-year Treasury bond yields struggle to defend three-day uptrend.
- S&P 500 Futures retreat from multi-day high, fails to track Wall Street.
Tuesday appears to be another lackluster day for the markets as mixed statistics join China’s absence from the markets, as well as the Fed blackout, to challenge the momentum traders during early Tuesday.
While portraying the mood, the S&P 500 Futures resist following Wall Street’s gains while retreating from the six-week high marked the previous day, making rounds to 4,030-35 at the latest. On the same line, the US 10-year and two-year Treasury bond yields snap three-day recovery moves by struggling around 3.51% and 4.21% by the press time. Furthermore, prices of Gold and Oil print mild gains while the US Dollar Index (DXY) retreat.
That said, the first readings of January’s activity data from Japan, Australia and New Zealand came in mixed, mostly positive, which in turn pushed back the looming recession fears.
However, the US inflation expectations as per the 10-year and 5-year breakeven inflation rates from the St. Louis Federal Reserve (FRED) data rise for the third consecutive day, to 2.28% each, which in turn justify the pre-blackout hawkish Fed comments and challenge the sentiment.
Furthermore, news that the US confronts China over companies’ ties to the Russian war effort, shared by Bloomberg, joins the talks surrounding the US debt ceiling in the Senate to probe the market optimists.
Moving on, the talks of a 50 bps rate hike from the European Central Bank (ECB) and the hawkish concerns surrounding the Bank of Japan (BoJ) also weigh on the risk appetite.
Alternatively, receding woes of the impending economic slowdown and China-linked optimism in the market keep the traders positive. Additionally favoring the sentiment could be the dovish bias surrounding the US Federal Reserve (Fed), as well as the softer US data of late.
It’s worth noting that the cautious mood ahead of the first readings of January’s S&P Global PMIs and the fourth-quarter (Q4) Gross Domestic Product (GDP) for the US seems to challenge the momentum traders amid China Lunar New Year (LNY) holidays and the Fed silence.
Also read: Forex Today: US Dollar pinned around seven-month lows
- The Loonie asset has turned sideways as investors await BoC’s interest rate policy for fresh cues.
- Downward-sloping 20-and 50-EMAs indicate more weakness ahead.
- A bearish momentum will get triggered if RSI (14) drops into the bearish range of 20.00-40.00.
The USD/CAD pair is oscillating in a narrow range of 1.3362-1.3374 in the Asian session as investors are awaiting the announcement of the interest rate decision by the Bank of Canada (BoC) for fresh cues. The risk profile is demonstrating mixed signals, which might trigger volatility ahead.
S&P500 futures are showing losses in early Asia, failing to extend Monday’s bullish move further. The US Dollar Index (DXY) has extended its losses below 101.55 ahead of United States S&P PMI data. Meanwhile, the 10-year US Treasury yields have dropped to near 3.51%.
USD/CAD has dropped sharply to near the demand zone placed in a range of 1.3324-1.3359 on an hourly scale. The Lonnie asset witnessed a massive sell-off after surrendering the support of 1.3442. Downward-sloping 20-and 50-period Exponential Moving Averages (EMAs) at 1.3376 and 1.3397 respectively, add to the downside filters.
Meanwhile, the Relative Strength Index (RSI) (14) is oscillating in a 40.00-60.00 range. A breakdown of the RSI (14) into the bearish range of 20.00-40.00 will trigger the downside momentum.
Going forward, the Loonie asset will witness weakness if it drops below January 13 low at 1.3322. This will expose the asset for further weakness towards November 18 low at 1.3300 and November 15 low at 1.3226.
Alternatively, a break above January 12 high at 1.3461 will drive the asset towards the psychological resistance at 1.3500 followed by January 6 low at 1.3540.
USD/CAD hourly chart
-638101209777538373.png)
US inflation expectations as per the 10-year and 5-year breakeven inflation rates from the St. Louis Federal Reserve (FRED) data struggle to defend the US Dollar buyers as the greenback remains pressured despite early signals of high inflation justify the hawkish Fedspeak.
That said, the 10-year inflation expectations per the aforementioned approach refreshed the monthly high to 2.28% on Monday, up for the third consecutive day. On the same line, the five-year counterpart also rose for the third day in a row while posting the 2.28% figure as well.
It’s worth noting that the Fed policymakers have supported the higher rates during their last speeches ahead of the pre-Federal Open Market Committee (FOMC) blackout period. However, markets brace for a softer Fed rate increase in February and an eventual policy pivot afterward.
Amid these plays, the US Treasury bond yields retreat while the S&P 500 Futures struggle for clear directions amid holidays in China and a cautious mood ahead of the first readings of January’s S&P Global PMIs for the US.
Also read: US Dollar Index struggles to defend 102.00 ahead of US PMI, GDP data
- Gold price has continued to travel to the upside towards the prior highs.
- The break of the Gold price's structure does however signify that the Gold price is vulnerable to the downside.
Gold price was volatile at the start of the week following a break of a test of a major trendline and horizontal support. In Asia, the bulls are extending the surge from the latter part of Monday's bullish correction and are taking up the $1,932s. At the time of writing, Gold price is trading at $1,932.10 and flat for the day so far. However, Gold price rallied from a low of $1,911 and into the peak formation set the prior week.
There were a number of contributing factors to the volatility at the start of the week, namely due to the sentiment with regard to the European Central, ECB, Bank and Federal Reserve, Fed. ECB Governing Council hawks have been calling for a 50bp rate hike. This has seen the Euro reach as high as $1.0927 vs. the dwindling US Dollar that enabled the Gold price to recover within choppy conditions. Additionally, there were lingering concerns about a recession in the United States and prospects of a less aggressive Federal Reserve.
Gold price supported by European Central Bank sentiment
European Central policymaker, Peter Kazimir, said on Monday that inflation easing was good news but added that it was not a reason to slow the pace of interest rate hikes, as reported by Reuters. Governing Council member Ignazio Visco also said on Monday that Italy can deal with the impact of a 'gradual but necessary' rate of monetary policy tightening. Governing Council member and Governor of Austria's central bank Olli Rehn made some comments on the European Central Banks' interest rates policy during their appearances over the weekend also as did ECB governing council member Klaas Knot on Sunday, advocating steep rate hikes. "Expect us to raise rates by 0.5% in February and March and expect us to not be done by then and that more steps will follow in May and June," Knot said.
Federal Reserve outlook and Gold price implications
An already downtrodden US Dollar took the brunt and the Gold price flourished with investors now awaiting US economic data due this week that could impact the Federal Reserve's policy path. Traders are mostly pricing in that the Federal Reserve will raise rates by 25 basis points (bps) at the January 31 - February 1 policy meeting, after slowing its pace to 50 bps in December, following four straight 75-bp hikes. Meanwhile, the Gold price tends to benefit due to lower interest rates that otherwise decrease the opportunity cost of holding the non-yielding asset.
Gold technical analysis
Gold price cleared out some of the long positions that had been building over the last couple of days and took on the trendline support as follows:
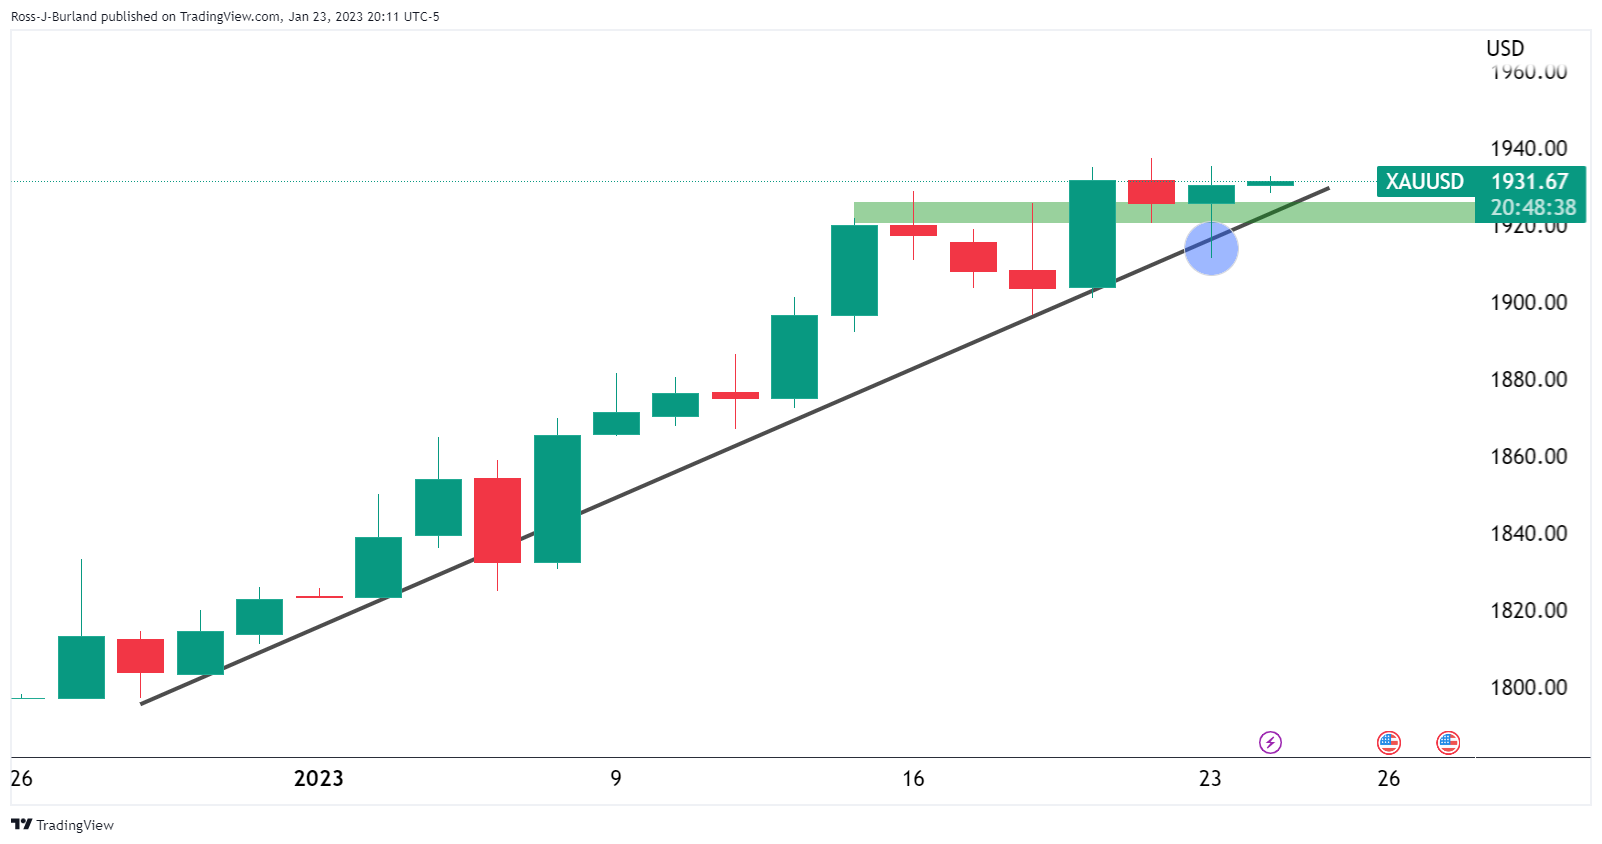
The breaks of the structure were not particularly significant given how quickly the bulls moved back in and how far the Gold price has continued to travel to the upside towards the prior highs. Nevertheless, there was two-way price action in Gold price for traders. Moreover, the break of the Gold price's structure does however signify that the Gold price is vulnerable and developments for the week ahead will be critical:
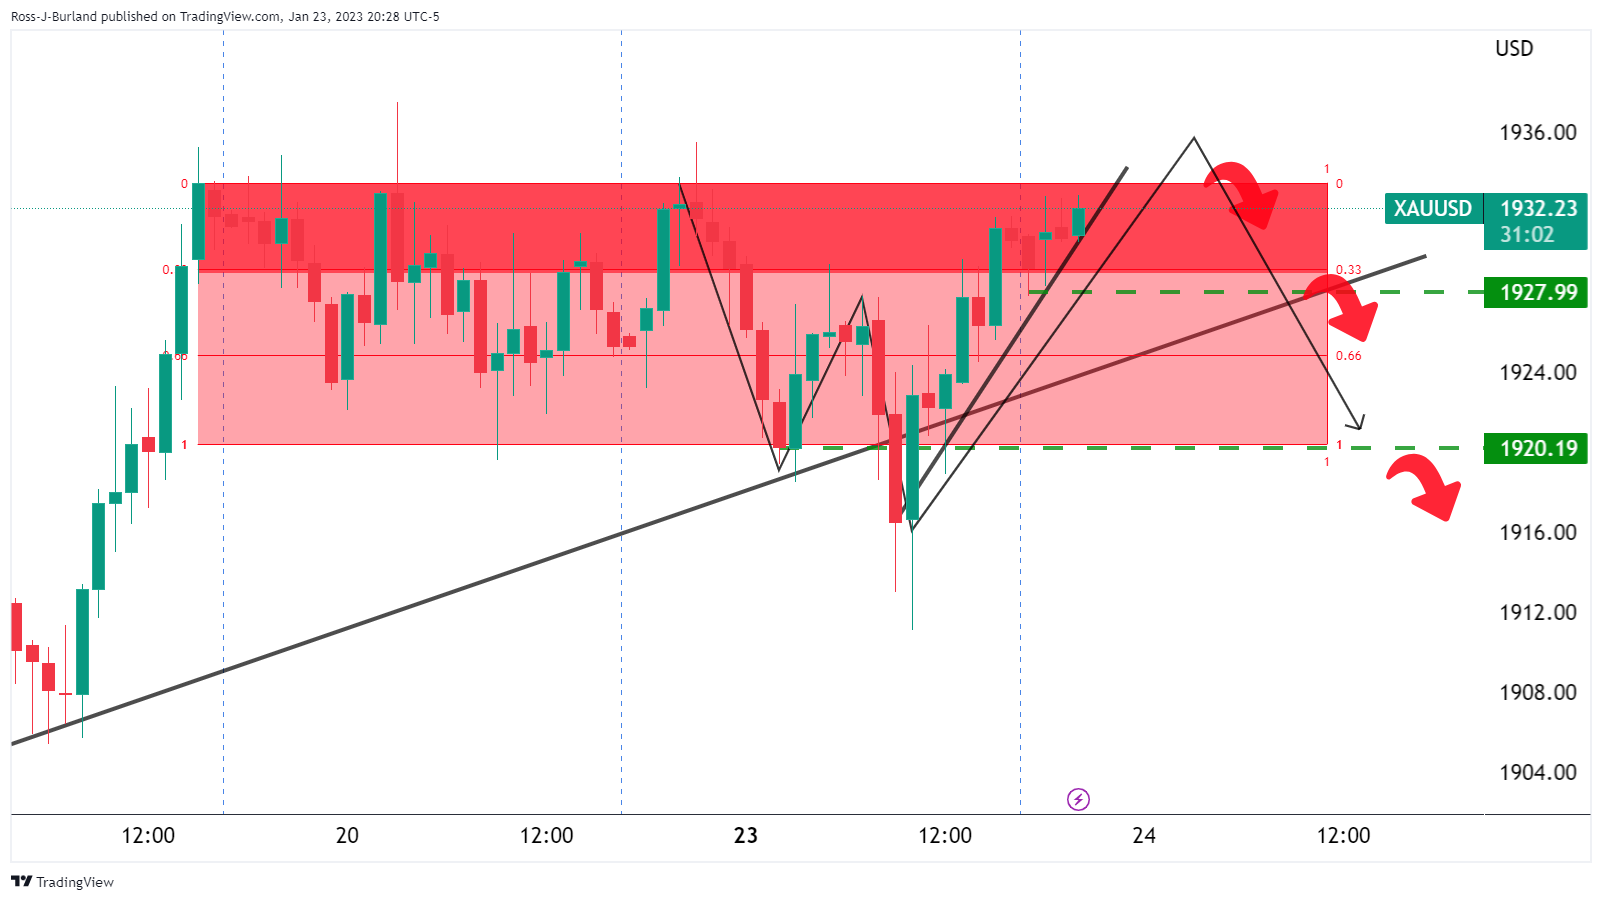
- AUD/USD picks up bids to renew intraday high during three-day uptrend.
- Convergence of one-week-old bullish channel’s top line, ascending trend line from December 01 challenge buyers.
- Nearly overbought RSI restricts further upside of the Aussie pair.
- Bears remain off the table unless witnessing clear downside break of 100-SMA.
AUD/USD bulls keep the reins for the third consecutive day around 0.7030-35 during early Tuesday. In doing so, the Aussie pair stays inside a one-week-long ascending trend channel while justifying a firmer RSI (14).
It should be noted, however, that a seven-week-old upward-sloping resistance line joins the stated bullish channel’s top line near 0.7050-55 to pose a serious threat to the current advances.
Adding strength to the fears of the AUD/USD bulls is the RSI (14) line that approaches the overbought territory and suggests a pullback.
In a case where the Aussie buyers manage to cross the 0.7055 resistance confluence, the previous weekly high near 0.7065 may act as the last defense of the bears before directing the quote towards the August 2022 peak surrounding 0.7140.
Alternatively, pullback moves may initially aim for the 0.7000 psychological magnet and remain less harmful to the bullish trend unless breaking the short-term rising channel’s support line, close to 0.6970 at the latest.
Following that, the 100-SMA and the previous monthly high could challenge the AUD/USD pair sellers around 0.6900 and 0.6890 in that order before giving them control.
AUD/USD: Four-hour chart
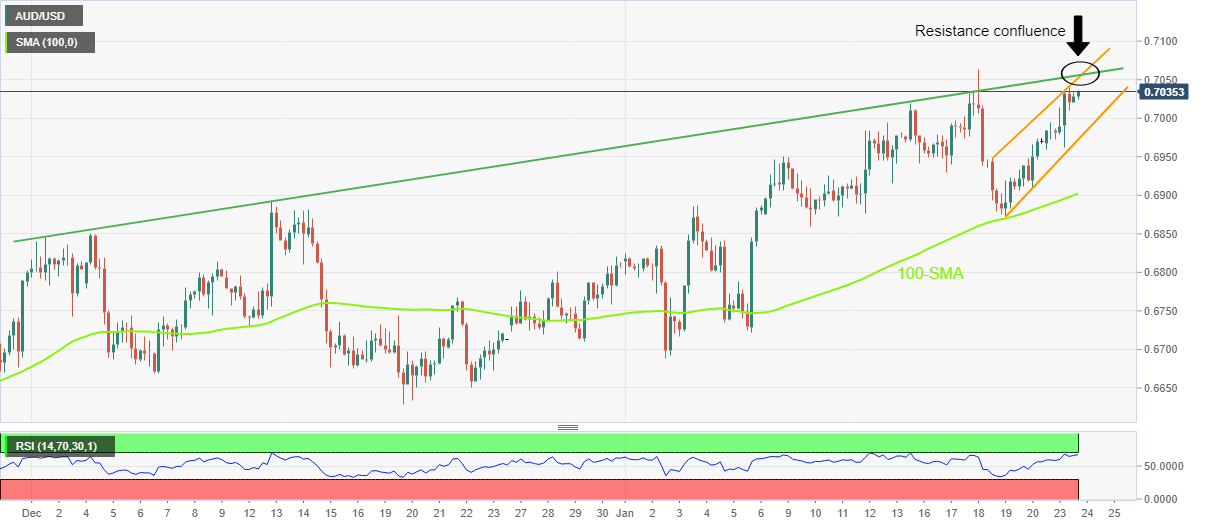
Trend: Limited upside expected
- GBP/USD is showing a lackluster performance as investors await US/UK PMIs for fresh cues.
- The Fed might decelerate its interest rate hike pace again to 25 bps in its February policy meeting.
- UK’s Manufacturing PMI might trim to 45.0 while Services PMI to remain steady at 49.9.
The GBP/USD pair is displaying topsy-turvy moves around 1.2380 as investors are awaiting the release of the S&P PMI number for the United States and the United Kingdom for fresh impetus. The Cable is demonstrating signs of volatility contraction as market sentiment has been caught by caution.
S&P500 futures are showing marginal losses after a bullish Monday, portraying a caution in getting gung-ho over risk-sensitive assets. Meanwhile, the return generated by the US government bonds has trimmed marginally as the odds of deceleration in the pace of hiking interest rates by the Federal Reserve (Fed) in its February monetary policy meeting are escalating further. The 10-year US Treasury yields have slipped to near 3.51%.
The US Dollar Index (DXY) recovered firmly on Monday after dropping to near a seven-month low around 101.20, however, the upside move got restricted above 101.80.
Inflation in the United States is declining and has been confirmed by various catalysts. Retail demand is subdued, employment is not generating at a healthy pace, the scale of economic activities is falling, and firms are offering products at lower prices at factory gates. This is resulting in rising expectations that the Federal Reserve (Fed) might trim the extent of the interest rate hike again.
Fed chair Jerome Powell has already trimmed the interest rate hike extent to 50 basis points (bps) in its December monetary policy meeting after four consecutive 75 bps rate hikes. The Fed is expected to hike interest rates by 25 bps ahead. As per the CME FedWatch tool, the chances of a 25 bps interest rate hike stand more than 98%.
But before that, investors’ focus will remain on the release of Tuesday’s United States S&P PMI data. The Manufacturing PMI is seen lower at 46.1 from the former release of 46.2 while the Services PMI might contract to 44.5 vs. the prior figure of 44.7.
On the United States front, preliminary Manufacturing PMI (Jan) is seen contracting to 45.0 against the prior release of 45.3. The Services PMI is seen steady at 49.9. Apart from that, UK’s Producer Price Index (PPI) data will remain in focus, which is scheduled for Wednesday.
- USD/JPY takes offers to refresh intraday low, prints the first daily loss in three.
- Japan’s Jibun Bank Manufacturing PMI stays intact, Services PMI improved in January.
- Chatters over easing Covid-led restrictions on Japan, mixed sentiment exert downside pressure on Yen pair.
- US PMIs, risk catalysts are the key ahead of US Q4 GDP.
USD/JPY slides towards 130.00 during the initial hour of Tokyo opening on Tuesday. In doing so, the Yen pair justifies slightly positive activity data from Japan, as well as optimism surrounding the Covid conditions in the Asian major, not to forget the recent weakness in the US Treasury bond yields.
That said, Japan’s Jibun Bank Manufacturing PMI for Japan remained unchanged at 48.9 while matching the market forecasts. It’s worth noting, however, that the Services counterpart improved to 52.4 versus 51.4 expected and 51.1 prior. On the other hand, softer prints of the US Conference Board’s Leading Index for December, to -1.0% versus -0.7% expected and -1. 1% prior, added weakness to the US Dollar.
Elsewhere, hawkish concerns surrounding the Bank of Japan’s (BOJ) next move and the cautious optimism in the market, mainly due to the easing COVID-19 woes in China, seemed to have exerted downside pressure on the USD/JPY prices. It should be observed that Japanese media Mainichi quotes Japan Prime Minister Fumio Kishida while stating the national leader’s plans to downgrade the legal status of COVID-19 this spring to a Class 5 disease.
On a different page, an absence of Chinese players due to the Lunar New Year Holidays and receding fears of the strong recession in 2023 also seemed to have improved the market’s mood and favored the USD/JPY bears. Furthermore, the hawkish comments from the European Central Bank (ECB) officials also weighed on the US Dollar and favored the Yen pair sellers.
Amid these plays, the US 10-year and two-year Treasury bond yields snap three-day recovery moves with mild losses near 3.51% and 4.21% by the press time. That said, the S&P 500 Futures also resist following Wall Street’s gains and favor the USD/JPY bears.
Moving on, the first readings of January’s S&P Global PMIs for the US will offer intraday directions while the US four-quarter (Q4) Gross Domestic Product (GDP) will be crucial for the week for clear directions. Given the softer forecasts surrounding the US data and the recession talks, the downbeat actual outcome could allow the USD/JPY bears to keep the reins.
Technical analysis
USD/JPY portrays another failure to cross the 21-DMA hurdle, around 131.00 by the press time, which in turn joined bearish MACD signals to keep sellers hopeful.
- EUR/USD picks up bids to reverse pullback from nine-month high, bounces off 21-EMA.
- Impending bear cross on MACD, RSI divergence tease sellers.
- Ascending trend line from mid-December appears a tough nut to crack for bulls.
EUR/USD resumes run-up towards the short-term key hurdle as it rises to 1.0875 during early Tuesday, following a retreat from the nine-month high amid late trading hours of the previous day. In doing so, the major currency pair bounces off the 21-Exponential Moving Average (EMA), around 1.0850 by the press time.
However, an upward-sloping resistance line from December 15, 2022, close to 1.0920 at the latest, challenges the EUR/USD pair’s immediate upside.
In addition to the immediate resistance line, the looming bear cross on the MACD and the bearish RSI divergence, a condition where the higher high in price doesn’t accompany the higher high in the indicator, also challenge the EUR/USD buyers.
It should be noted that the April 2022 peak surrounding 1.0940 acts as an additional upside hurdle, other than the 1.0920, to challenge the pair buyers before directing them towards the 1.1000 round figure.
Alternatively, the 21-EMA and the 50-EMA restrict immediate EUR/USD downside near 1.0850 and 1.0820 respectively.
Following that, the late December 2022 high near 1.0715 and the 1.0700 could please the pair sellers.
In a case where the EUR/USD pair remains bearish past 1.0700, an ascending support line from November 21, close to 1.0665 at the latest, will act as the last defense of the buyers.
EUR/USD: Four-hour chart
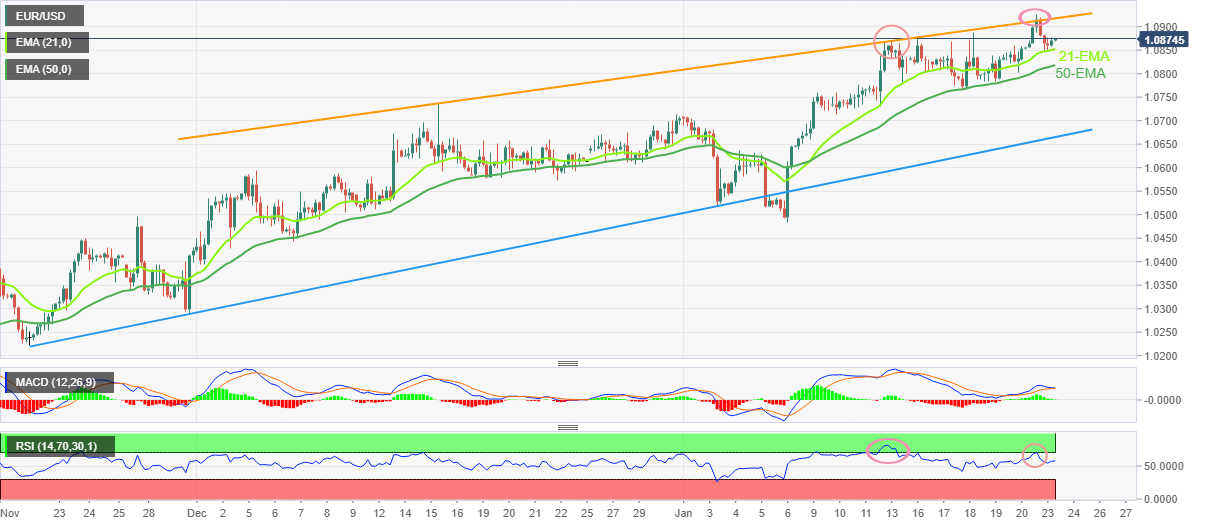
Trend: Limited upside expected
| Index | Change, points | Closed | Change, % |
|---|---|---|---|
| NIKKEI 225 | 352.51 | 26906.04 | 1.33 |
| ASX 200 | 5.1 | 7457.3 | 0.07 |
| FTSE 100 | 14.07 | 7784.67 | 0.18 |
| DAX | 69.39 | 15102.95 | 0.46 |
| CAC 40 | 36.03 | 7032.02 | 0.52 |
| Dow Jones | 254.07 | 33629.56 | 0.76 |
| S&P 500 | 47.2 | 4019.81 | 1.19 |
| NASDAQ Composite | 223.98 | 11364.41 | 2.01 |
- EUR/GBP is oscillating in a narrow range of around 0.8780, however, the upside looks solid amid hawkish ECB bets.
- The odds for a 50 bps interest rate hike by the ECB are soaring dramatically.
- UK’s labor shortage could propel the PPI figures ahead.
The EUR/GBP pair is displaying back-and-forth moves around 0.8700 in the Asian session. The cross corrected firmly in Monday’s New York session after printing a fresh four-day high around 0.8815. The asset is expected to resume its upside journey amid rising hawkish bets for the interest rate decision by the European Central Bank (ECB).
Despite falling energy prices in the shared currency region, ECB policymakers are still not convinced that the Eurozone inflation will trim further meaningfully. Therefore, ECB policymakers are reiterating their hawkish stance on the interest rates for the upcoming monetary policy, scheduled for next week.
ECB policymaker Peter Kazimir cited on Monday that inflation easing was good news but added that it was not a reason to slow the pace of interest rate hikes, as reported by Reuters. He further added, "I am convinced that we need to deliver two more hikes by 50 basis points (bps).”
Also, ECB President Christine Lagarde supported the hawkish view, reiterating the statement that "We have made it clear that ECB interest rates will still have to rise significantly at a steady pace to reach levels that are sufficiently restrictive.”
The latest Reuters poll of economists claims the European Central Bank (ECB) hiking rates by another 50 bps at its February monetary policy meeting while the policy rate is expected to reach 3.25% by mid-year.
On the United Kingdom front, investors are focusing on the release of Wednesday’s Producer Price Index (PPI) data. UK's inflation rate has declined gradually after recording a fresh 41-year high at 11.1%. Thanks to the falling energy prices that has softens the stubborn inflation. Now investors await the release of the UK PPI numbers for fresh cues.
| Pare | Closed | Change, % |
|---|---|---|
| AUDUSD | 0.7028 | 0.92 |
| EURJPY | 142.069 | 0.97 |
| EURUSD | 1.08713 | 0.07 |
| GBPJPY | 161.766 | 0.78 |
| GBPUSD | 1.23791 | -0.17 |
| NZDUSD | 0.64904 | 0.36 |
| USDCAD | 1.33674 | -0.08 |
| USDCHF | 0.92174 | 0.39 |
| USDJPY | 130.68 | 0.93 |
- US Dollar Index retreats after snapping two-day downtrend.
- Holidays in China, pre-Fed blackout triggered DXY consolidation but softer US data, hawkish ECB commentary challenged bulls.
- First readings of January PMIs, Q4 GDP will be crucial amid US recession chatters.
US Dollar Index (DXY) seesaws near 102.00 as the bulls struggle to defend the first daily gains in three, marked the previous day, during early Tuesday’s inactive trading.
The greenback’s gauge versus the six major currencies cheered the market’s consolidation the previous day before the hawkish comments from the European Central Bank (ECB) officials joined the softer US data to recall the DXY sellers. Adding strength to the US Dollar Index pullback could be the cautious mood ahead of today’s key data, namely the first readings of January’s S&P Global Purchasing Managers Index (PMI).
The one-week-long Lunar New Year (LNY) holidays in China joined the receding fears of the US recession to underpin the US Dollar Index rebound the previous day. On the same line could be the upbeat performance of the US 10-year and two-year Treasury bond yields.
Alternatively, the US Conference Board’s Leading Index for December came in as -1.0% versus -0.7% expected and -1. 1% prior. The softer start to the key data week comprising the PMIs and four-quarter (Q4) Gross Domestic Product (GDP) probed the DXY buyers.
On the other hand, ECB President Christine Lagarde’s comments suggesting further rate hikes to tame inflation were the latest to favor the DXY sellers. However, major attention was given to ECB Governing Council Member Peter Kazimir who said, “I am convinced that we need to deliver two more hikes by 50 basis points." The idea of a 50 bps rate hike was something that many policymakers have refrained from in recent days.
It should be observed that the talks of easing the Covid-led activity restrictions in Japan from May 2022 also appeared to have recently favored the market sentiment and weighed on the DXY.
Looking forward, the first readings of January’s S&P Global PMIs for the US will offer intraday directions while the US Q4 GDP will be crucial for the week for clear guidance. It’s worth noting that the forecasts surrounding the key data appear slightly weak and hence actual outcome will be eyed closely for better understanding amid the economic slowdown fears.
Technical analysis
The DXY bears keep the reins unless crossing a six-week-old support-turned-resistance line near 103.30.
- EUR/JPY bulls hand over control to the bears at the start of the day.
- Capped below 142.00, there are prospects of a break of key structure.
EUR/JPY bulls have failed to take advantage of the European Central Bank sentiment at the turn of the day with bears moving in for the kill from below the 142.00 resistance level. This is a major resistance zone and should the bulls fail to regain control, then there are prospects of a significant move to the downside for the rest of the week.
EUR/JPY H1 chart analysis
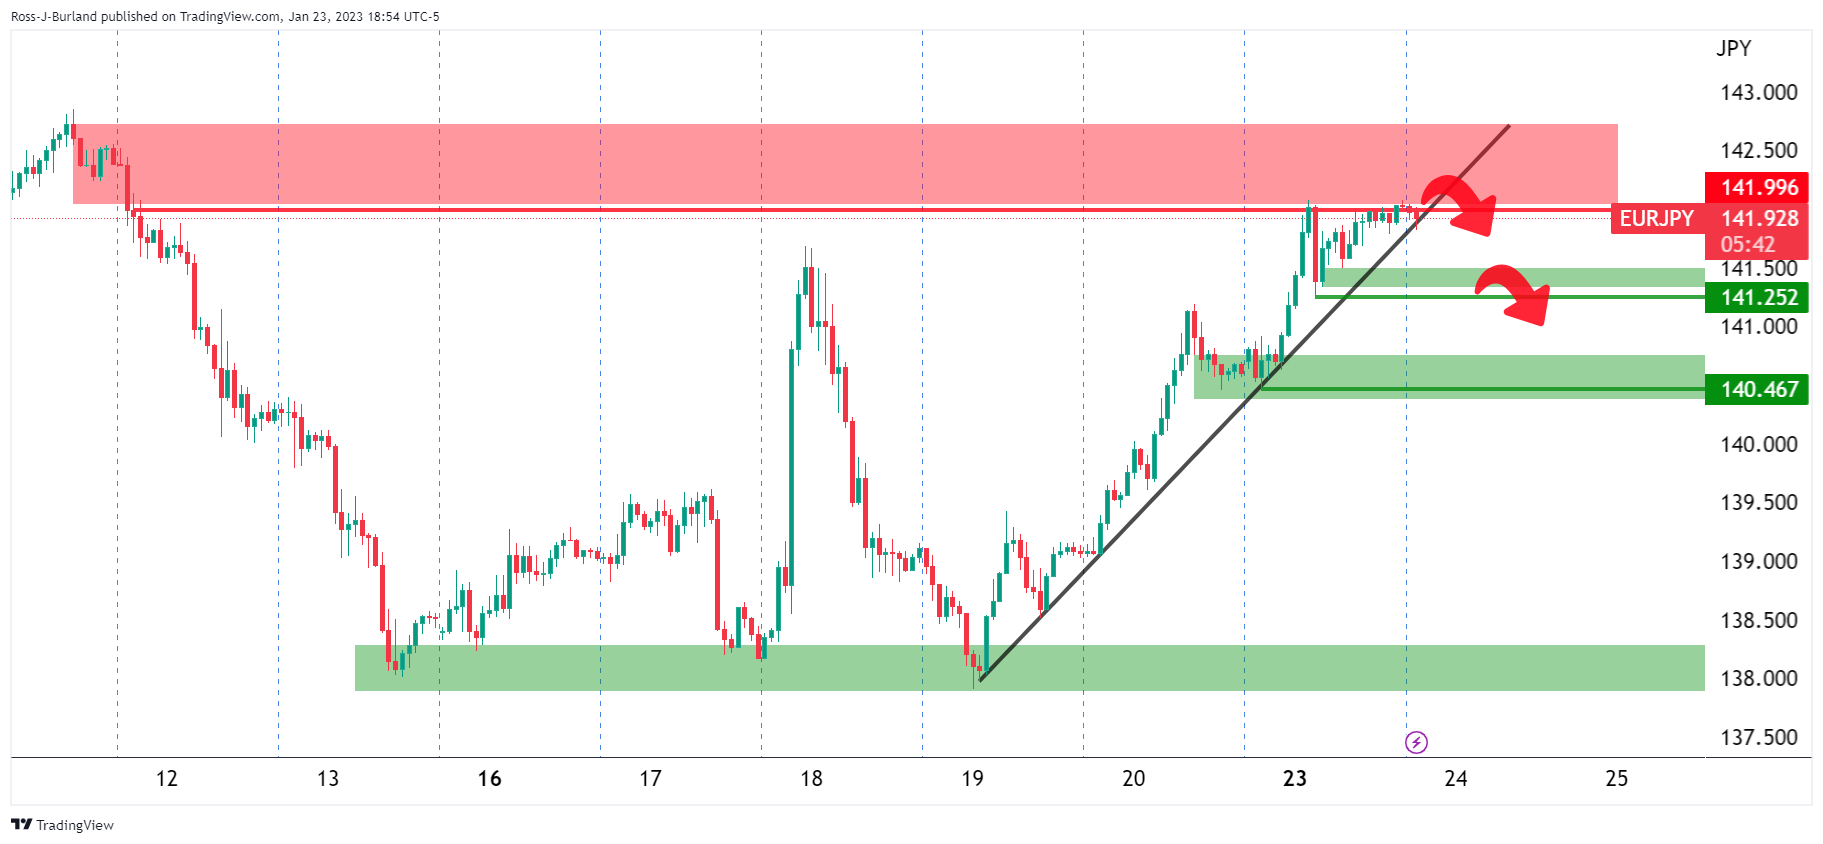
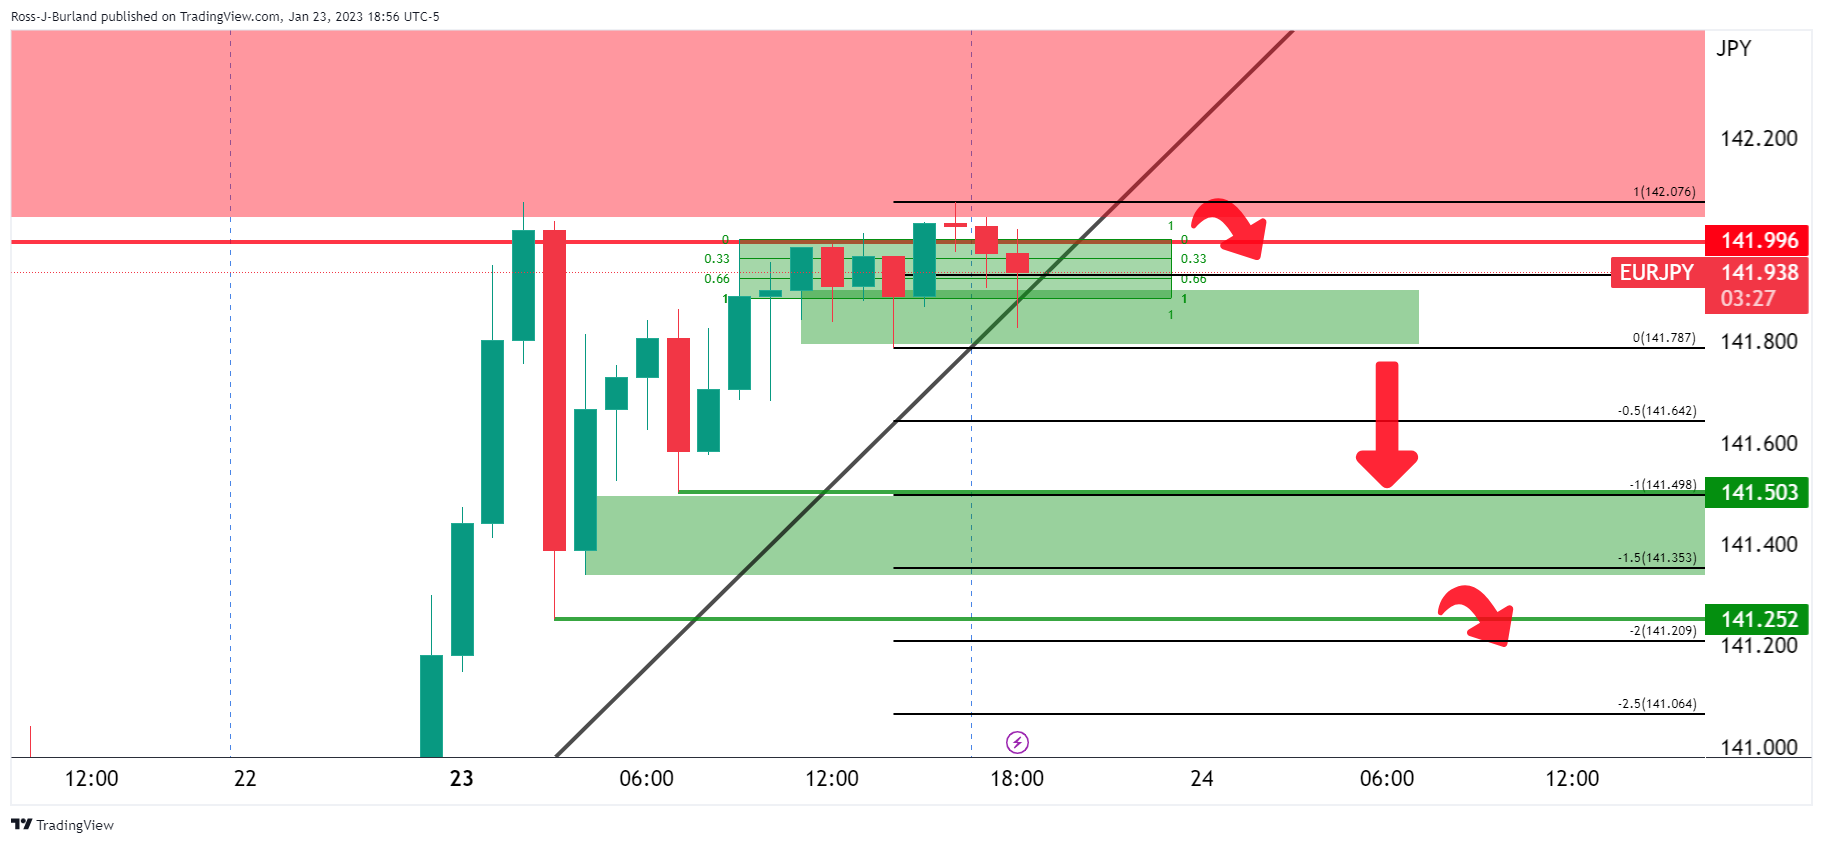
As per the charts above, the hourly time frame shows that the price is decelerating on the bid and testing critical trendline support. If this were to break, then the bear will be on the lookout for a structure to lean against t to target the 141.50 level to the downside. Measuring the current consolidation channel's range, a measured move of 100% of the range meets the target and also defends the way to the 141.20s.
On the other hand, if the bulls commit, then there will be prospects of a run to test 142.20 and then 142.50:
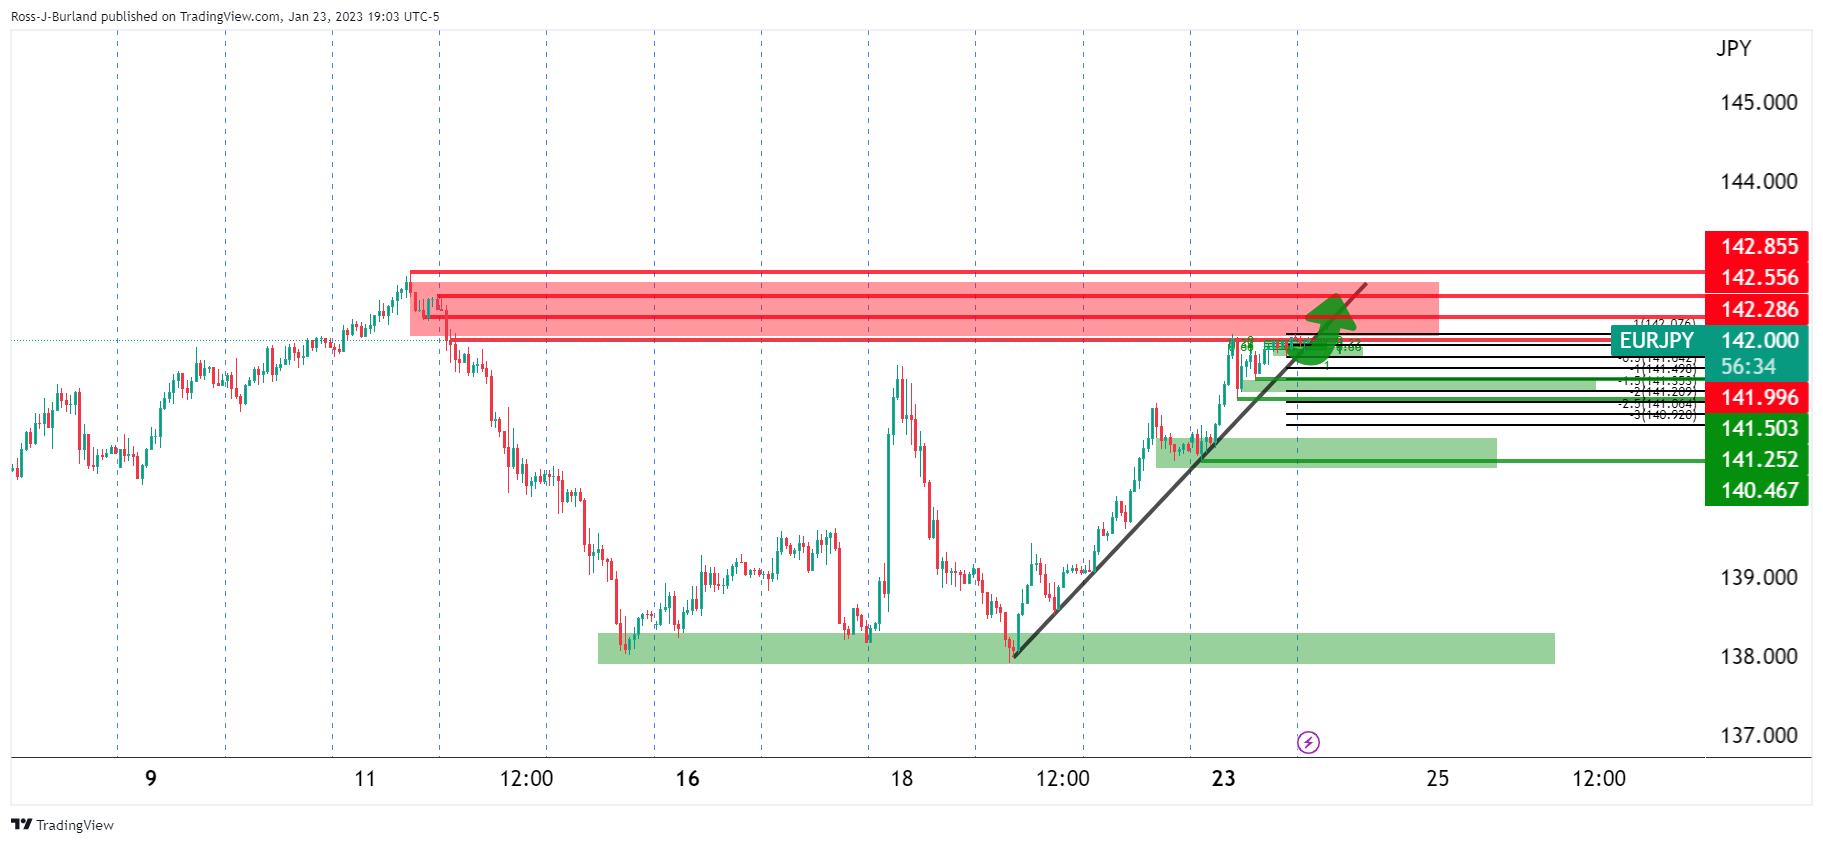


© 2000-2026. Bản quyền Teletrade.
Trang web này được quản lý bởi Teletrade D.J. LLC 2351 LLC 2022 (Euro House, Richmond Hill Road, Kingstown, VC0100, St. Vincent and the Grenadines).
Thông tin trên trang web không phải là cơ sở để đưa ra quyết định đầu tư và chỉ được cung cấp cho mục đích làm quen.
Giao dịch trên thị trường tài chính (đặc biệt là giao dịch sử dụng các công cụ biên) mở ra những cơ hội lớn và tạo điều kiện cho các nhà đầu tư sẵn sàng mạo hiểm để thu lợi nhuận, tuy nhiên nó mang trong mình nguy cơ rủi ro khá cao. Chính vì vậy trước khi tiến hành giao dịch cần phải xem xét mọi mặt vấn đề chấp nhận tiến hành giao dịch cụ thể xét theo quan điểm của nguồn lực tài chính sẵn có và mức độ am hiểu thị trường tài chính.
Sử dụng thông tin: sử dụng toàn bộ hay riêng biệt các dữ liệu trên trang web của công ty TeleTrade như một nguồn cung cấp thông tin nhất định. Việc sử dụng tư liệu từ trang web cần kèm theo liên kết đến trang teletrade.vn. Việc tự động thu thập số liệu cũng như thông tin từ trang web TeleTrade đều không được phép.
Xin vui lòng liên hệ với pr@teletrade.global nếu có câu hỏi.
ngân hàng