- Phân tích
- Tin tức và các công cụ
- Tin tức thị trường
Tin tức thì trường
- WTI rallies in the open in thin liquidity and bulls eye the 82.50s.
- OPEC is the driver as speculation mounts for a production cut this week.
A price of a barrel of oil has rallied in the open of the week while markets price in OPEC risk against a poor economic backdrop and rising supply side issues.
The OPEC+ alliance is due to meet on 5 October to review its production agreement and there is talk of a 1m barrel cut to output per day. The group has already signaled that it is willing to intervene to support prices. ''This comes as oil prices come under pressure amid concerns of weaker demand,'' analysts at ANZ Bank explained.
''We suspect it will be moved to counteract the excessive bearishness in the market by announcing a cut to production. Anything less than 500kb/d would be shrugged off by the market. Therefore, we see a significant chance of a cut as large as 1mb/d.''
The spike in prices comes despite Friday’s news that China has issued new crude oil import and export quotas as it seeks to revive its economy. The giant consumer has issued at least 2.89 million tonnes of crude oil import quotas to non-state refiners in the third round of allotments for 2022. NASDAQ reported the new allowances bring China's total non-state import quotas to 164.61 million tonnes this year, comparing to 162.25 million tonnes during the same period in 2021.
Most importantly, however as argued by analysts at TD Securities, ''OECD inventories continue to decline at a fast pace, and the end of US SPR releases this November will exacerbate implications for prices. An OPEC+ likely production cut in the range of 500k-1m bpd at next week's Oct 5th meeting could suggest that, barring a very hard landing, the bottom is in for crude prices.''
WTI technical analysis
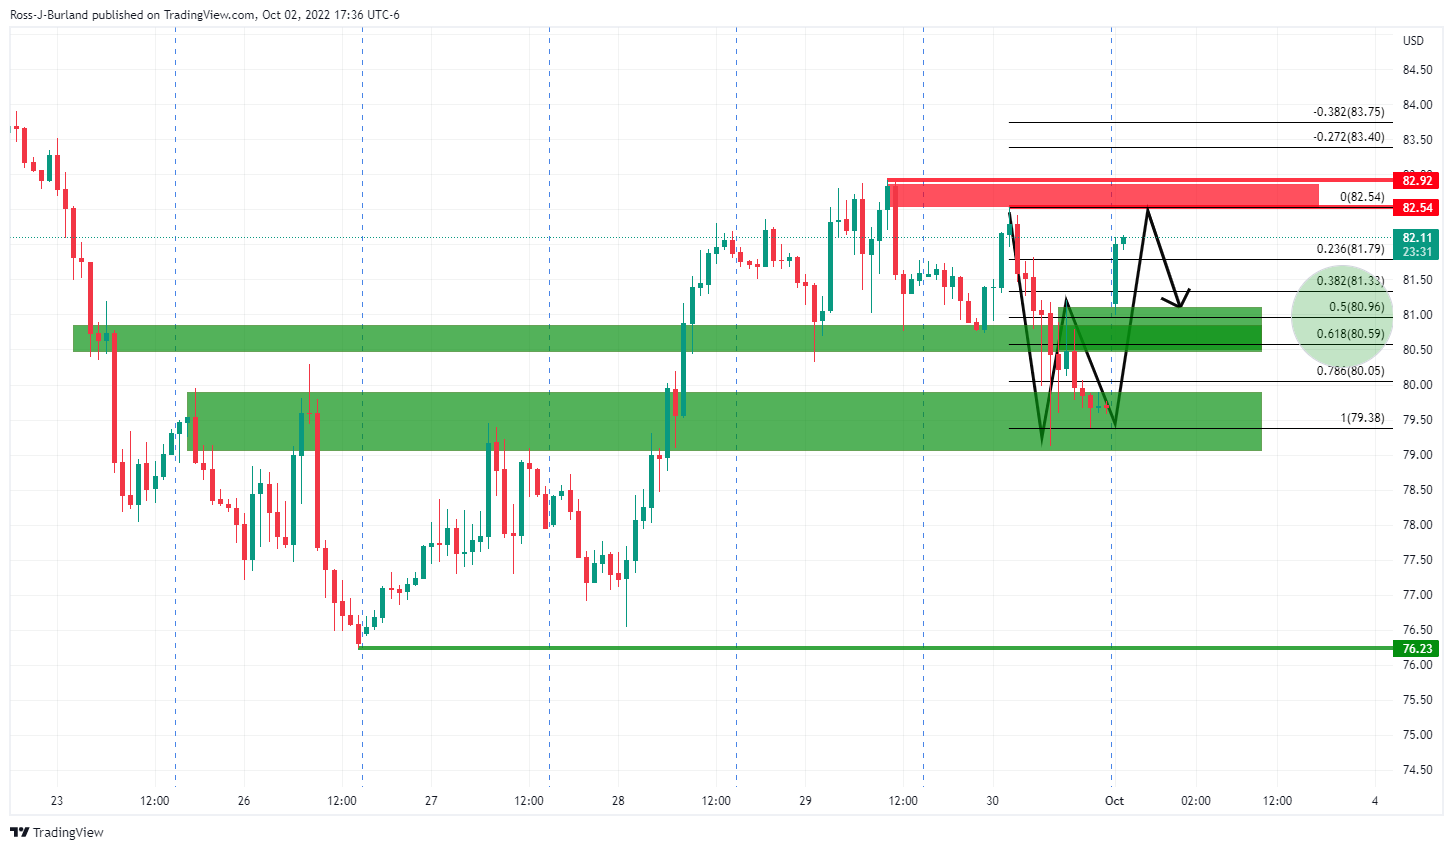
The gap can be considered as a candle that goes to making a W-formation. This is a reversion pattern and speculators may be inclined to look to lower time frames for bearish structure for the day ahead that could be leaned against while seeking a setup to go short while the price remains below resistance:

With that being said, while the support structure remains intact, as per the 1-min chart above, the bias remains to the upside.
- NZD/USD has picked bids from around 0.5600 on soaring hawkish RBNZ bets.
- The RBNZ is expected to escalate its OCR 50 bps consecutively for the fifth time.
- The gloomy outlook for US ISM PMI data is weakening the DXY.
The NZD/USD pair has rebounded firmly after picking bids around 0.5600 in the Tokyo session. Last week, the asset witnessed a steep decline after failing to cross the critical hurdle of 0.5750. The kiwi bulls witnessed an intense sell-off despite a decline in the monthly Consumer Price Index (CPI) data. The monthly inflation data declined to 6.8% from the prior release of 7%.
Also, the downbeat Caixin Manufacturing PMI data kept the antipodean on the tenterhooks. The economic data has landed at 48.1, lower than the expectations and the prior release of 49.5. It is worth noting that New Zealand is a leading trading partner of China and a weaker-than-projected Caixin Manufacturing PMI data carries a significant impact on NZ exports.
This week, investors’ focus will be on the interest rate decision by the Reserve Bank of New Zealand (RBNZ). Reuters poll on RBNZ rate hike forecast claims a fifth consecutive rate hike by 50 basis points (bps). A fifth half-a-percent rate hike by the RBNZ Governor Adrian Orr will push the Official Cash Rate (OCR) to 3.5%. It would be worth watching whether an OCR above 3% is sufficient to anchor the galloping inflation.
Meanwhile, the US dollar index (DXY) is expected to drop below the immediate cushion of 112.00. The DXY is likely to witness a sheer decline ahead of US ISM Manufacturing PMI data. The continuation of ‘the hawkish’ stance on interest rates by the Federal Reserve (Fed) has shrunk the extent of manufacturing activities. Firms have postponed their expansion plans due to higher interest rates and bleak demand growth.
As per the projections, the US ISM Manufacturing data will decline to 52.3 vs. the former release of 52.8. Also, the US ISM New Orders Index data, which is an indicator that reflects forward demand is expected to drop significantly to 49.6 against the prior reading of 51.3.
- GBP/USD is expected to smash 1.1200 as the DXY is displaying a subdued performance.
- Weaker consensus for US ISM Manufacturing PMI would keep the DXY on the back foot.
- The UK economy reported upbeat GDP data despite various headwinds.
The GBP/USD pair is struggling to smash the immediate hurdle of 1.1200 in the early Tokyo session. The cable has displayed a modest upside move after the termination of the corrective move to near 1.1022. The major is expected to continue its lackluster performance in the 1.1100-1.1170 range and will later display a bullish imbalanced move.
On Friday, the pound bulls didn’t respond in expectation to the upbeat UK Gross Domestic Product (GDP) data. The UK National Statistics reported that the economic activities in the UK economy have grown by 0.2% against the expectation of a decline of 0.1% on a quarterly basis. Also, the annual data has improved dramatically to 4.4% vs. the projections and the prior release of 2.9%.
There is no denying the fact that the deepening energy crisis has hurt the sentiment of UK households. Apart from that, galloping price pressures, weak economic fundamentals, and the inability to generate decent employment opportunities have created chaos for the Bank of England (BOE) policymakers. Despite the several headwinds the pound region has managed to display an uptick in the GDP data.
Meanwhile, the ongoing bond-buying program by the BOE to bring stability to the financial markets is offsetting the impact of hawkish monetary policy to a certain point.
The US dollar index (DXY) is expected to drop below the immediate support of 112.00 on lower consensus for the US ISM Manufacturing PMI data.
According to the estimates, the US ISM Manufacturing data will release at 52.3 vs. the former release of 52.8. Accelerating interest rates by the Federal Reserve (Fed) to bring price stability to the economy has forced the corporate to withdraw their expansion and investment plans. Adding to that, the US ISM New Orders Index PMI data will trim sharply to 49.6 vs. the prior release of 51.3.
- Gold price is advancing towards $1,680.00 as US ISM Manufacturing data carries subdued expectations.
- A decline in US ISM New Orders Index data indicates sluggish demand ahead.
- Subdued forward demand could be the outcome of lower households’ purchasing power.
Gold price (XAU/USD) has given an upside break of the minor consolidation, in early Asia, formed in a $1,660.20-1,663.32. The precious metal is marching towards the critical hurdle of $1,680.00 as the market participants are expecting a decline in the US ISM Manufacturing PMI data, which will release on Monday.
As per the preliminary estimates, the US ISM Manufacturing data will release at 52.3 vs. the former release of 52.8. Accelerating interest rates by the Federal Reserve (Fed) to bring price stability to the economy has forced the corporate to withdraw their expansion and investment plans. This is resulting in a decline in manufacturing activities in the US economy.
What is more haunting for the US dollar index (DXY) is a significant decline in the consensus for ISM Manufacturing New Orders Index data. The economic data is seen at 49.6 vs. the prior release of 51.3. The economic indicator determines future demand by firms to cater to retail demand. A decline in New Orders Index data indicates sluggish demand ahead, which could be the result of a vigorous decline in the purchasing power of households due to mounting price pressures.
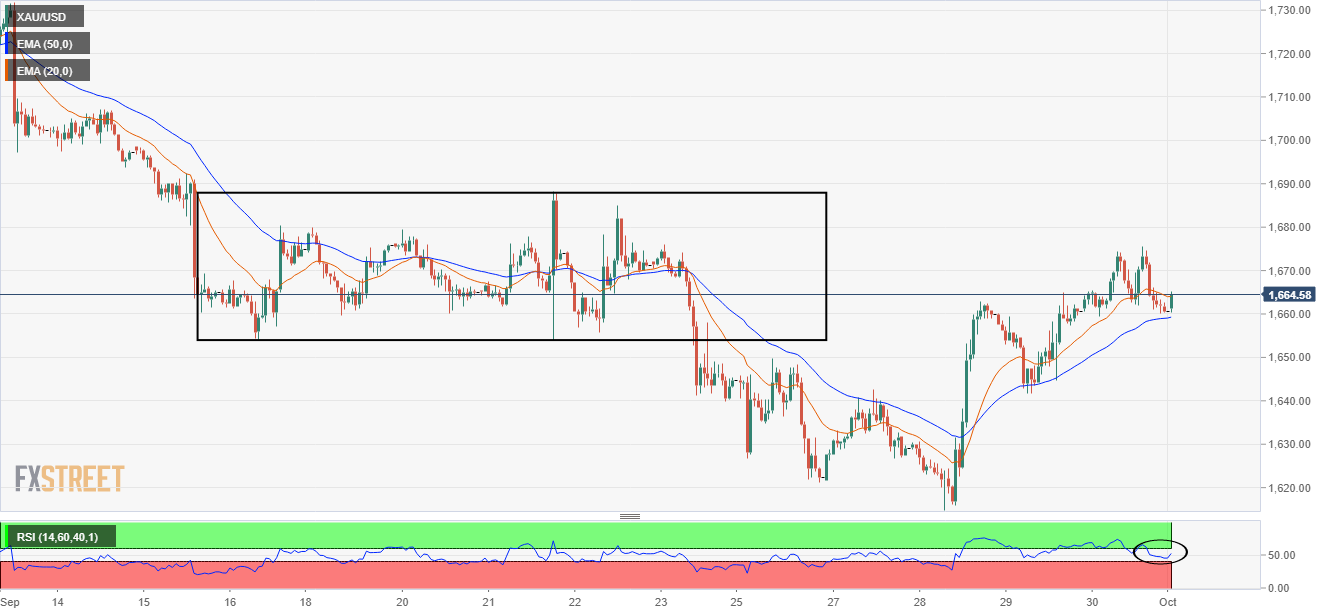
Gold technical analysis
Gold prices have entered the prior balanced area, which is placed in a range of $1,653.30-1,688.43 on an hourly scale. The balanced area indicates the highest auction region where most of the trading activity took place.
A bull cross, represented by the 20-and 50-period Exponential Moving Averages (EMAs) at $1,635.03 adds to the upside filters.
While the Relative Strength Index (RSI) (14) will display a bullish momentum if it will overstep 60.00 decisively.
Gold hourly chart
- EUR/USD turns sideways around 0.9800 as the focus has shifted to the US NFP data.
- As expected, the DXY didn’t respond well to the higher-than-expected US core PCE data.
- German markets are closed on account of the Day of German Unity.
The EUR/USD pair is displaying back-and-forth moves around 0.9800 in the early Tokyo session. The asset has turned sideways in a 0.9780-0.9815 range as the currency domain is developing itself ahead of the US employment data. For a while, the shared currency bulls are expected to drive the asset higher as it has concluded the corrective move below 0.9750 after hitting a high of 0.9850.
On Friday, the US dollar index (DXY) displayed a lackluster performance despite a higher-than-expected core Personal Consumption Expenditure (PCE) Price Index, Federal Reserve (Fed) preferred inflation tool to gauge inflation. The economic data landed at 4.9%, higher than the expectations and the prior release of 4.7%.
The impact was expected lower as the market participants have already displayed their response toward the more-than-predicted release of the headline Consumer Price Index (CPI) and core CPI for September. In response to that, the Fed also hiked the interest rate by 75 basis points (bps) for the third consecutive time.
Going forward, the US employment data will hog the limelight. As per the consensus, the US Nonfarm Payrolls (NFP) will land at 250k vs. the prior release of 315k. While the Unemployment Rate will remain steady at 3.7%.
On the Eurozone front, the Eurozone Retail Sales data will be of utmost importance. The economic data is expected to decline by 1.7% against a decline of 0.9% reported earlier. In times, when the inflation rate is mounting firmly, a decline in Retail Sales is a cause of worry. Meanwhile, investors should be aware that German markets are closed on Monday on account of the Day of German Unity.
- The focus will be on the RBA as a meanwhile distraction this week for the pair.
- AUD/USD bears took out key monthly support in September.
AUD/USD corrected from a key area on the charts on Friday with a test back through 0.64 the figure hardly left a mark on the downtrend that remains the bias for the start of the week and ahead of the Reserve Bank of Australia.
In the RBA Sep minutes, the Board judged that it may be appropriate 'at some point' to scale back to 25bps hikes, but we think it is too soon for that. Data on balance is still strong, which suggests the economy is holding up well, as analysts at TD Securities noted.
''Thus, this affords room for the RBA to front-load hikes further as the Governor notes the current cash rate is "still probably on the low side".''
Meanwhile, the focus is firmly on the greenback, and prospects of more upside to follow as we move into a new quarter, as per the following analysis:
-
US dollar Price Analysis: Bullish prospects for the start of the week
Meanwhile, domestically, going forward Australian growth is set to slow, analysts at Rabobank argued.
''The central bank forecasts growth at 3¼ per cent over 2022, underpinned by growth in consumption and a recovery in investment and service exports. Growth is then expected to slow to around 1¾ per cent over both 2023 and 2024. This outlook compares favorably with the Eurozone, UK and the US all of which are at risk of recession next year.''
'' We had anticipated a pullback to AUD/USD0.69 on the back of dollar strength. We continue to see scope for AUD/USD to clamber back to 0.71 on a 6-month view.''
AUD/USD technical analysis
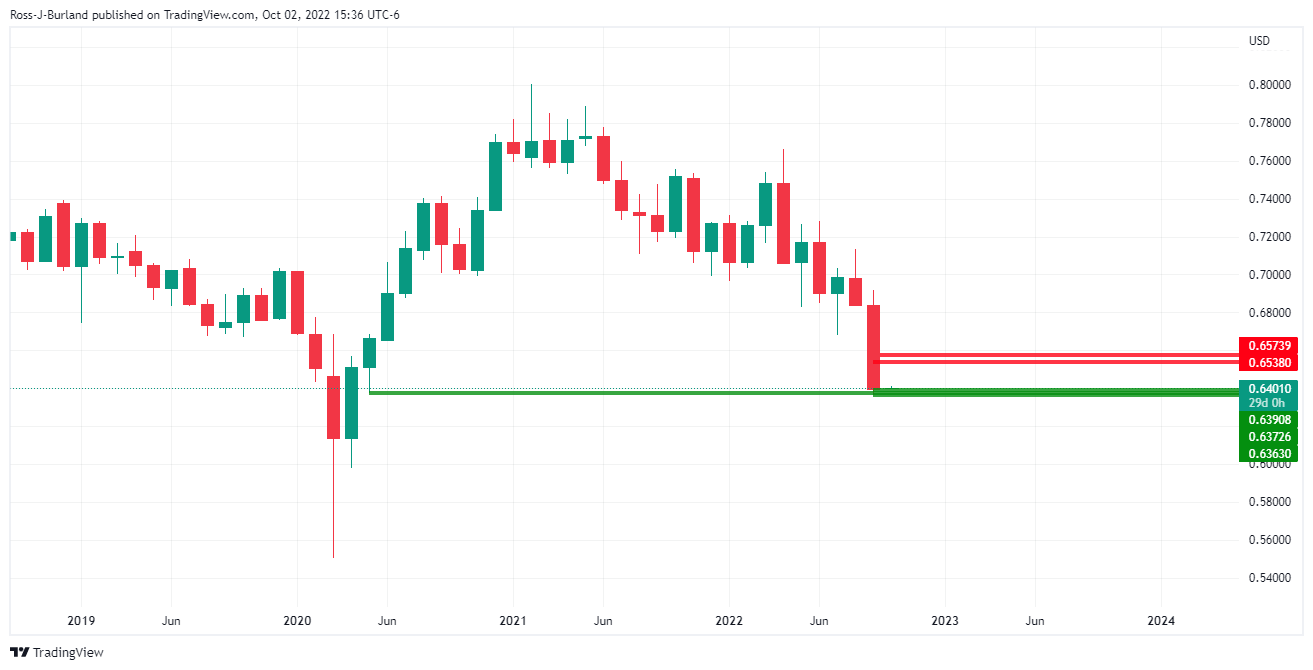
Bears took the reigns again last month and broke a key structure as illustrated on the above chart, leaving the focus on the downside. However, breakout traders could come under heat on any corrections for the days/weeks ahead.
AUD/USD daily chart
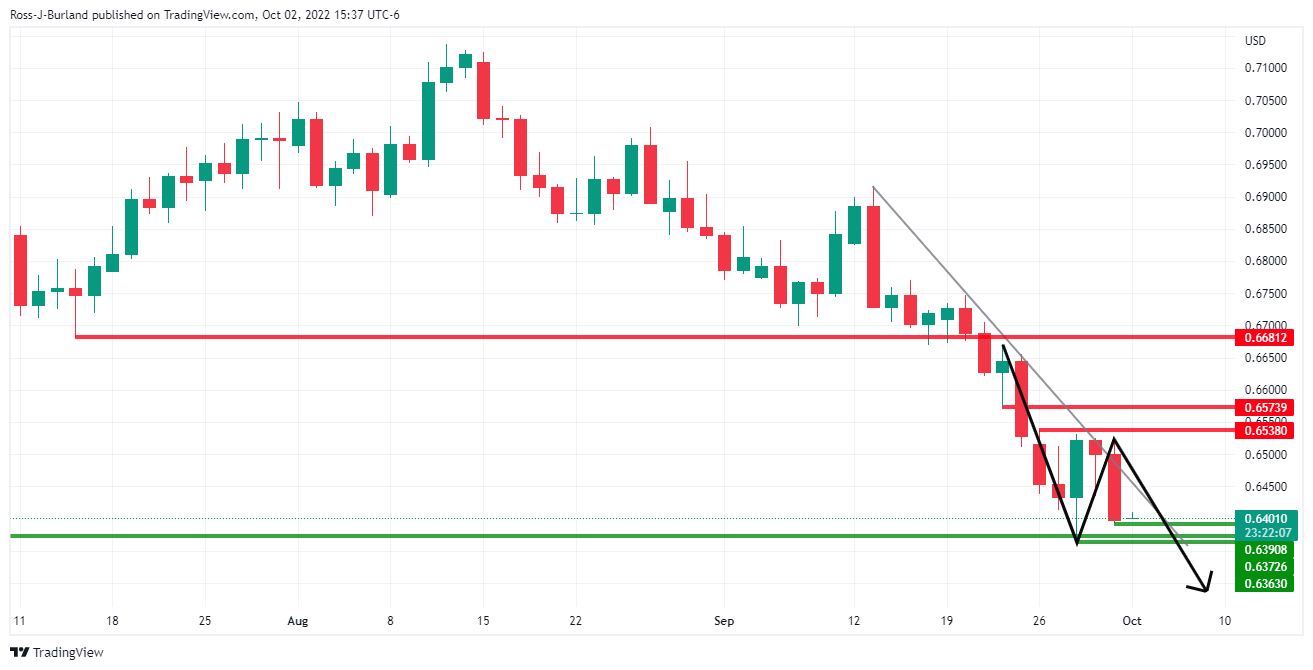
The daily chart, however remains bearish while below the trendline resistance.
The US dollar has been in demand for months due to worries over growth in China, the Eurozone, and various other economies while investor confidence have been undermined even more so in the past couple of weeks.
''In our view the USD is set to remain firm until the Fed are content that US inflation is falling and that inflation expectations are well anchored. That is likely to be some months away. We remain USD bulls. We are targeting EUR/USD0.9500 but see risk of break below this level.''
Meanwhile, the open looks set to be a bullish play for the greenback, so long as the 11.40-112.00 area holds as the following hourly chart illustrates:
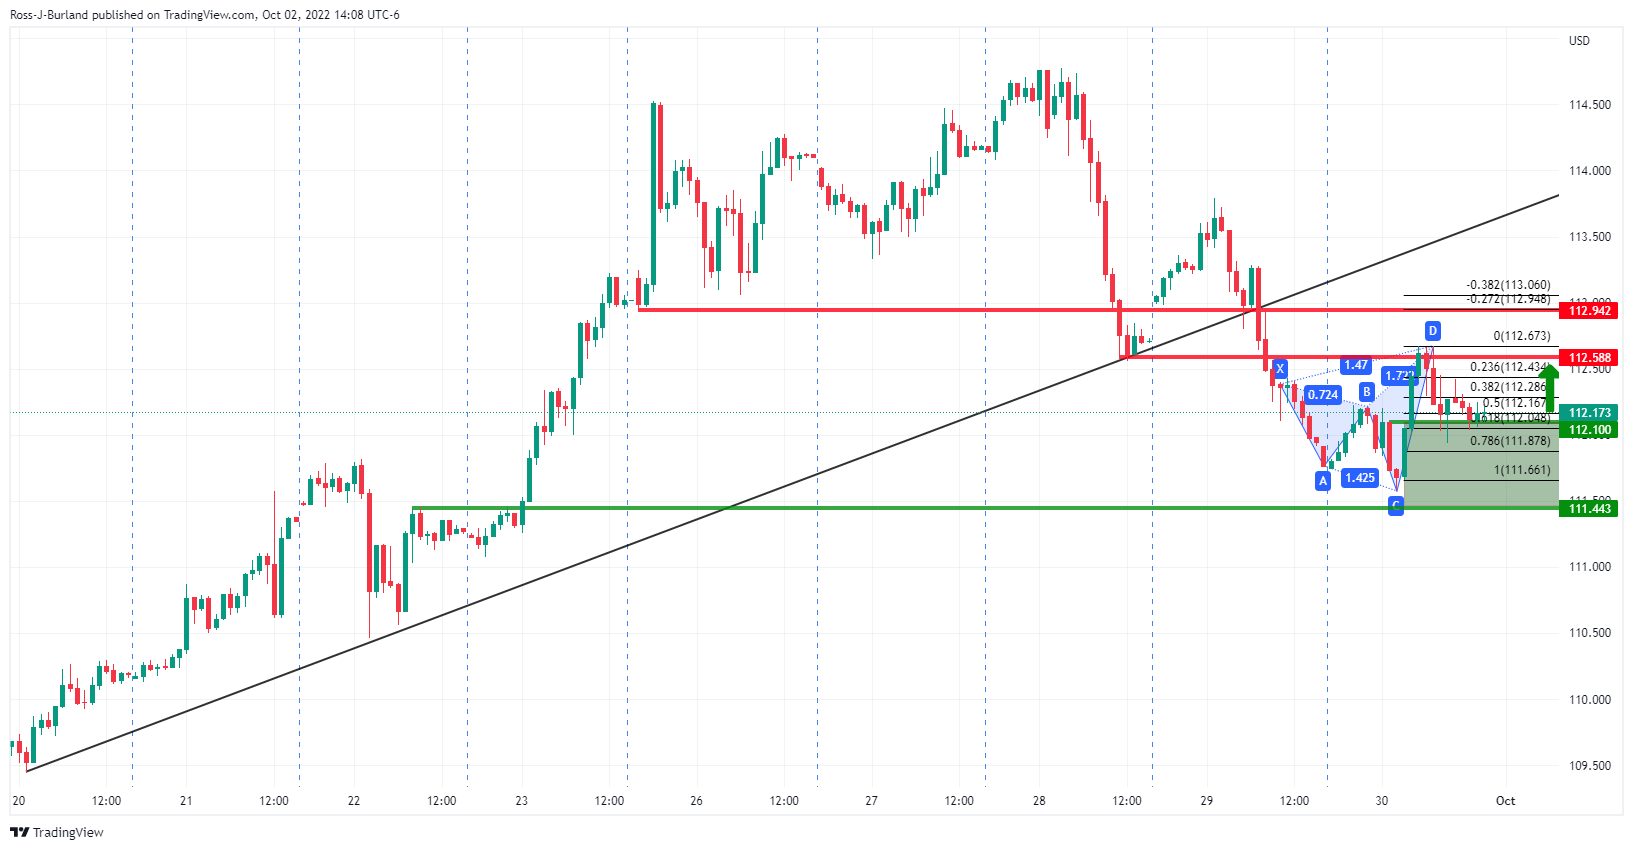
DXY H1 chart
The harmonic pattern played out with the bears moving in at a key resistance structure to push the price all the way into the neckline of the formation in a significant retracement towards the 78.6% Fibonacci level. For the open, bulls will be in anticipation of a move towards the prior resistance near 112.70. This puts the focus on the downside for corresponding pairs such a cable:
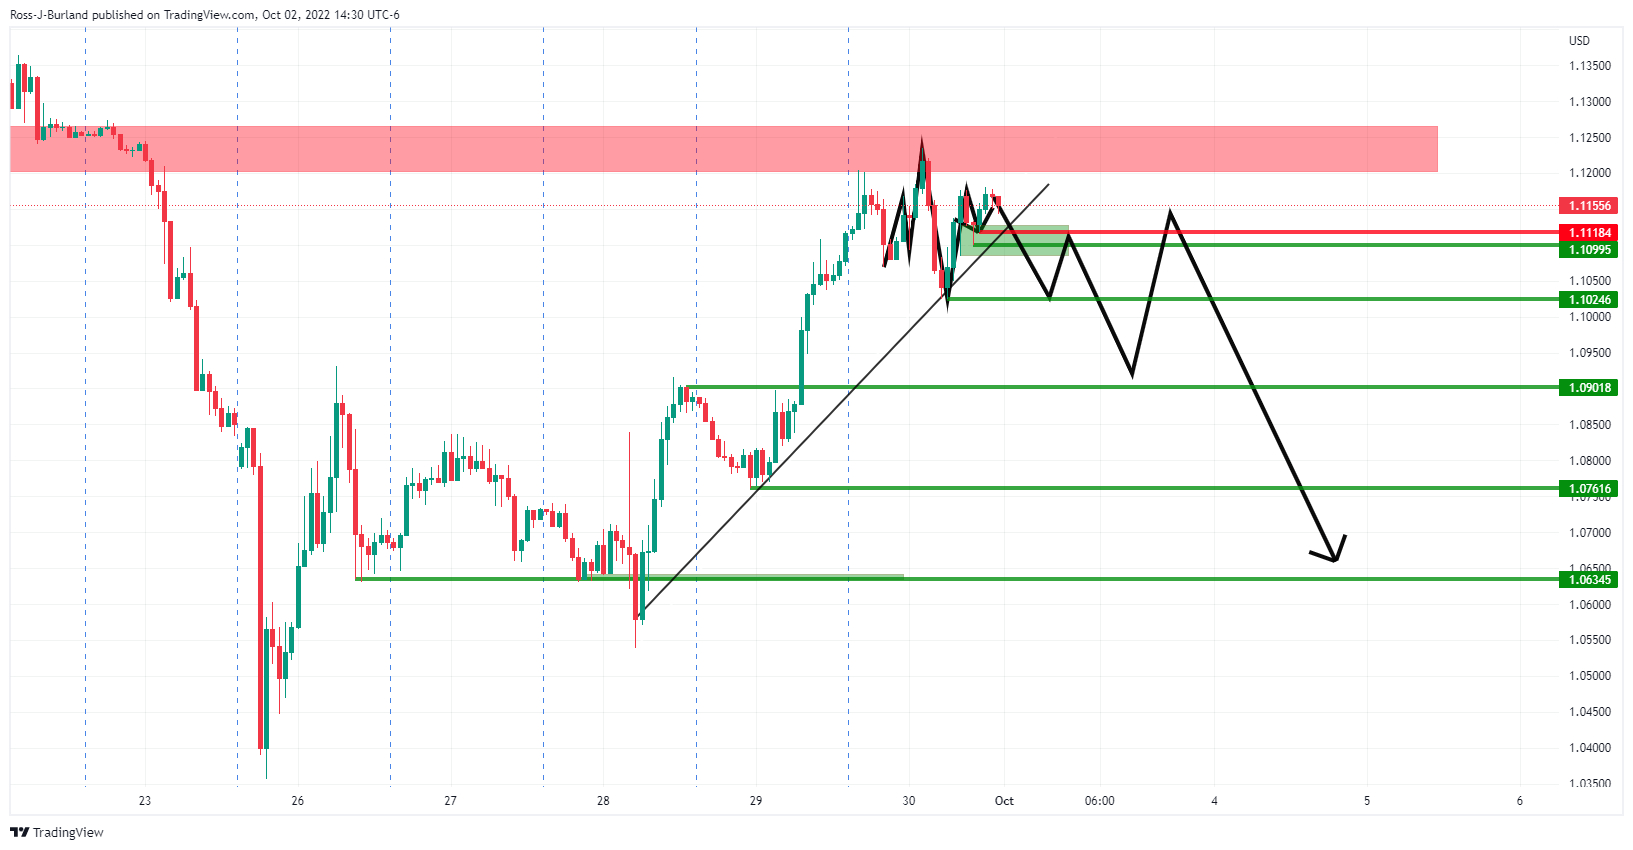
(GBP/USD H1 chart)


© 2000-2026. Bản quyền Teletrade.
Trang web này được quản lý bởi Teletrade D.J. LLC 2351 LLC 2022 (Euro House, Richmond Hill Road, Kingstown, VC0100, St. Vincent and the Grenadines).
Thông tin trên trang web không phải là cơ sở để đưa ra quyết định đầu tư và chỉ được cung cấp cho mục đích làm quen.
Giao dịch trên thị trường tài chính (đặc biệt là giao dịch sử dụng các công cụ biên) mở ra những cơ hội lớn và tạo điều kiện cho các nhà đầu tư sẵn sàng mạo hiểm để thu lợi nhuận, tuy nhiên nó mang trong mình nguy cơ rủi ro khá cao. Chính vì vậy trước khi tiến hành giao dịch cần phải xem xét mọi mặt vấn đề chấp nhận tiến hành giao dịch cụ thể xét theo quan điểm của nguồn lực tài chính sẵn có và mức độ am hiểu thị trường tài chính.
Sử dụng thông tin: sử dụng toàn bộ hay riêng biệt các dữ liệu trên trang web của công ty TeleTrade như một nguồn cung cấp thông tin nhất định. Việc sử dụng tư liệu từ trang web cần kèm theo liên kết đến trang teletrade.vn. Việc tự động thu thập số liệu cũng như thông tin từ trang web TeleTrade đều không được phép.
Xin vui lòng liên hệ với pr@teletrade.global nếu có câu hỏi.
ngân hàng