- Phân tích
- Tin tức và các công cụ
- Tin tức thị trường
Tin tức thì trường
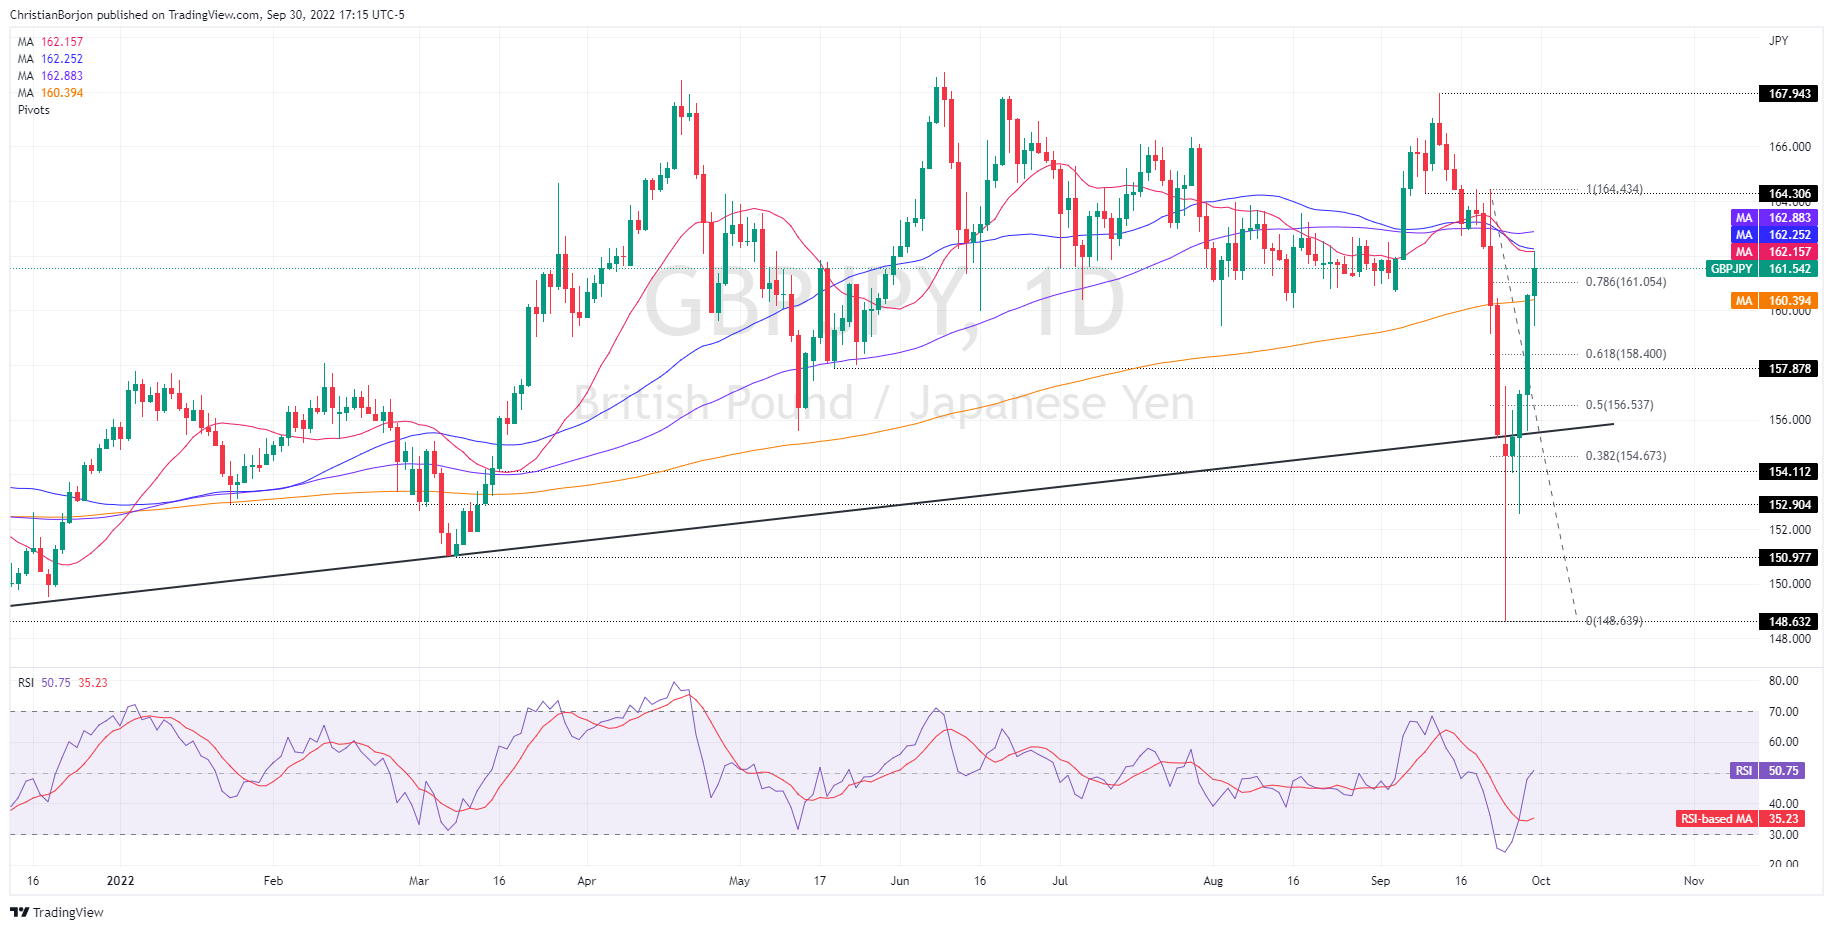
- GBP/JPY registered hefty gains of 3.96% during the week.
- Long-term, the GBP/JPY is neutral upwards, though if it clears 162.57, that could open the door for further gains.
- Per the daily chart, if the GBP/JPY clears 162.25, the pair can rally towards 164.00.
The GBP/JPY advanced for the fourth straight day and reclaimed the 200-day EMA after hitting a daily low at around 159.43, though buyers stepped, sending the cross-currency pair towards its daily high of 162.17. At the time of writing, the GBP/JPY is trading at 161.54, above its opening price by 0.62%.
GBP/JPY Price Analysis: Technical outlook
From a weekly chart perspective, the GBP/JPY is neutral-to-upward biased after a volatile trading week that witnessed the pound sliding towards a YTD low of 148.63 before recovering close to 1200 pips. GBP/JPY traders should be aware of oscillators shifting to positive territory. Therefore, a re-test of the 20-week EMA, around 162.57, is on the cards.
The GBP/JPY daily chart shows that Friday’s rally was capped at a “packed” supply zone, with the 20, and the 50-day EMAs hoovering around 162.15-162.25, ahead of the 100-day EMA at 162.88. Worth noting that, albeit solid resistance lie above, the GBP/JPY pierced the 78.6% Fibonacci retracement at 161.05, opening the door for further upside.
Therefore, the GBP/JPY first resistance would be the 162.00 figure. Once cleared it would expose the aforementioned 162.15-162.25 area, followed by the 100-day EMA at 162.88 ahead of the 163.00 mark. A breach of the latter will expose the September 22 daily high at 164.43.
GBP/JPY Key Technical Levels
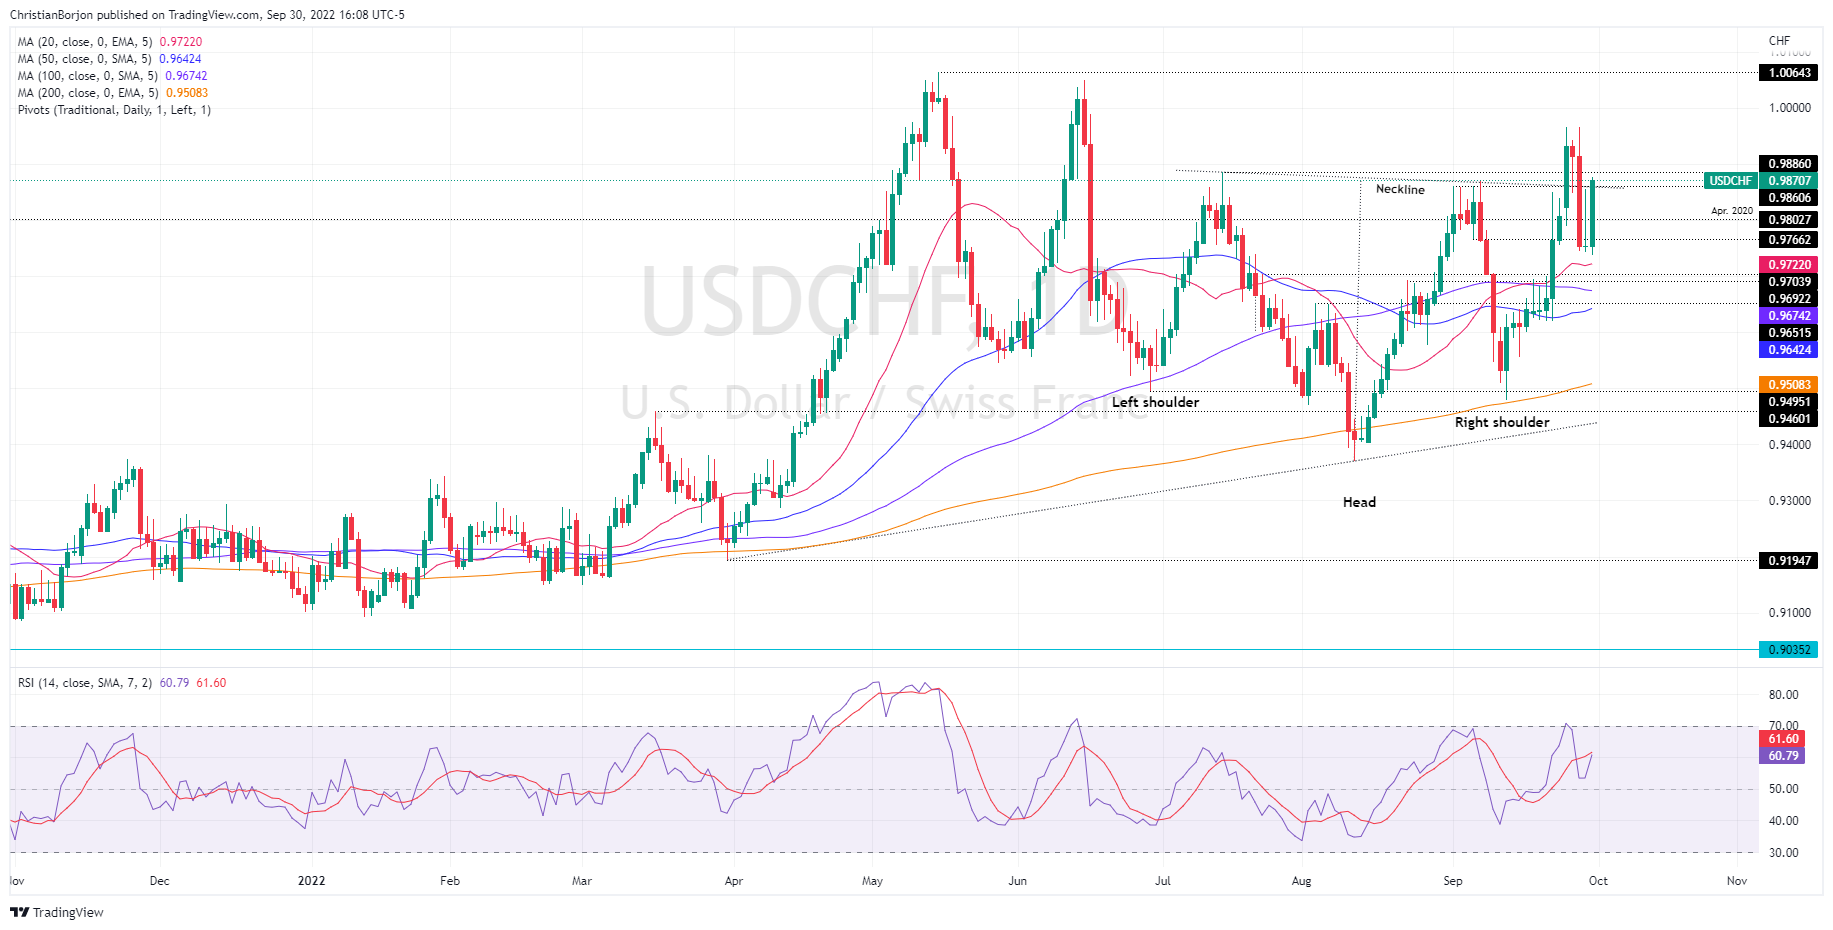
- USD/CHF prepares to finish the week with decent gains of 0.65%.
- The weekly chart depicts the pair as neutral-to-upward biased, further extending the uptrend but unable to crack 0.9900.
- The USD/CHF daily chart portrays the major as upward biased, and once it clears the 0.9886 mares, the 0.9900 figure would be next.
The USD/CHF finished the week with substantial gains on Friday, up by 1.20% in the day, due to Federal Reserve officials crossing newswires, reiterating that the Fed would not pivot in the near term and will keep rates elevated to temper inflation. At the time of writing, the USD/CHF is trading at 0.9870.
USD/CHF Price Analysis: Technical outlook
The USD/CHF weekly chart shows the majors closing just below the July 11 week high of 0.9886, keeping the neutral-to-upward bias unchanged. Traders should be aware that, albeit closing below the aforementioned July 11 high, the USD/CHF extended the successive series of higher highs/lows, opening the door for further gains. If the USD/CHF clears 0.9886, the 0.9900 figure is the next supply zone, followed by the parity.
When reviewing the USD/CHF daily chart, the bias is also upward biased, and price action escalating above the “neckline” of an inverted head-and-shoulders chart pattern could pave the way for further gains. Oscillators are in positive territory, with the RSi at 60.79 about to cross above its 7-day RSI SMA, which would mean that buyers are gathering momentum, opening the door for further gains.
Therefore, the USD/CHF first resistance would be the 0.9900 figure. Break above will expose the September 28 high at 0.9965, followed by parity, and then the YTD high at 1.0064.
USD/CHF Key Technical Levels
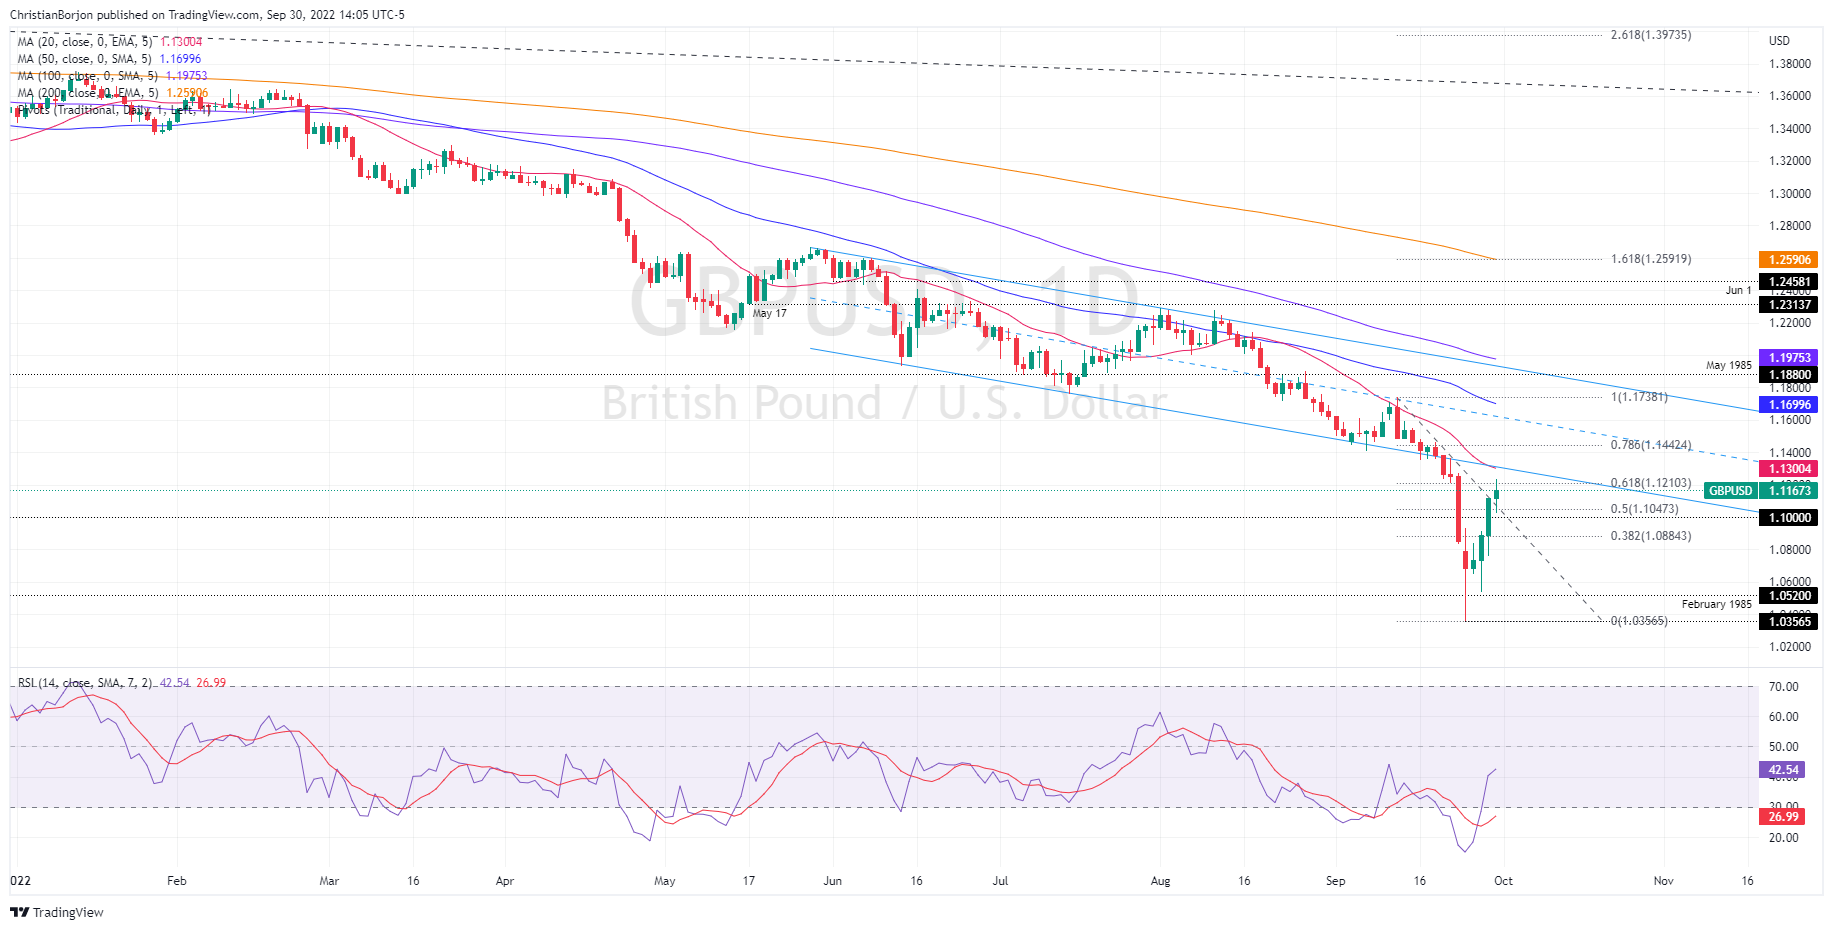
- GBP/USD is set to finish the week with gains close to 3%, despite the UK’s bond crisis.
- US PCE figures increased the likelihood of the Fed going 75 bps as Fed officials reinforced their hawkish rhetoric.
- The GBP/USD remains downward biased, and once it clears 1.1050, it could fall towards the 1.0800 mark.
The GBP/USD is recovering from earlier losses as the North American session progresses, even though the market sentiment shifted sour as Fed officials reinforced their “hawkish” message of keeping interest rates higher for longer. Therefore, the GBP/USD is trading at 1.1168, gaining 0.46%, after reaching a daily low of 1.1024.
US equities are trading in the red. On Friday, a slew of Fed officials led by the Fed’s Vice-Chair Lael Brainard crossed the news wires after critical US economic data was released.
The US Department of Commerce revealed that the Federal Reserve preferred inflation measure, the PCE, rose by 0.3% MoM in August, above estimates of 0.1%, while the annual reading decelerated from 6.3% to 6.2%. In the meantime, the so-called Core PCE, which strips volatile items like food and energy, exceeded estimates at 0.6% MoM, while the YoY rose by 4.9%, also above forecasts.
During the day, US central bank policymakers reiterated the need for higher interest rates and emphasized that it would remain more elevated as long as inflation remains above its 2% goal. The Fed’s Vice Chair, Lael Brainard, echoed the aforementioned and reiterated that “it would be premature to pivot” as it’s too soon to declare victory on inflation. Later her colleague Mary Daly of the San Francisco Fed continued with the same “hawkish” rhetoric while adding that the Fed is “resolute” in tackling inflation.
In the meantime, Richmond’s Fed President Thomas Barkin said that he’s “comfortable” with the pace of rates, adding that it’s uncertain how much the Fed will have to do to lower demand to reach its inflation target.
On the Uk side, the British pound has recovered from reaching 1.0300 levels on a YTD low last Friday, courtesy of new Primer Minister Liz Truss’ tax-cutting plans to stimulate the economy. That triggered one of the most volatile sessions, sending the GBP/USD tumbling from daily highs of 1.0900 to 37-year lows of 1.0356.
According to a Reuters poll, ”Nineteen of the 36 economists surveyed said the Bank would add 75 basis points in November while 13 said it would go for a super-sized 100 bps lift. Only three said it would add 50 bps as it did in its last two meetings while one opted for a mega 125 bps increase.”
GBP/USD Technical Analysis
The GBP/USD fluctuates around the 61.8% Fibonacci retracement, but some 40 pips shy, at 1.1170s, after piercing the 1.1200 figure in the overnight session. Nevertheless, sellers stepped in around the aforementioned 1.1203 daily high and sent the Sterling sliding, towards its daily low, before recovering some ground. It should be noted that the GBP/USD remains downward biased, and unless the exchange rate surpasses the 1.1740 area to shift to a neutral stance, risks are skewed to the downside.
Therefore, the GBP/USD first support would be the 50% Fibonacci retracement at 1.1047, followed by the 38.2% Fibonacci retracement at 1.0884, and then the 1.0800 mark.
GBP/USD Key Technical Levels
- EUR/USD trips down ahead of the end of the week, month and Q3.
- US Fed officials continued with their “restrictive policy” rhetoric, agreeing that further hikes are coming.
- US Core PCE surpassed analysts’ expectations, paving the way for another 75 bps Fed hike.
- EU’s inflation jumped above the 10% threshold, and money market futures expect another 0.75% increase.
The EUR/USD retraces from daily highs of around 0.9853 due to Fed officials expressing the necessity of higher rates for longer, as the US central bank battles elevated inflationary pressures above the 6% threshold, as shown by the Fed’s preferred gauge of inflation, on Friday. At the time of writing, the EUR/USD is trading at 0.9788, below its opening price by 0.29%.
A bunch of Fed policymakers crossing news wires, led by Vice-Chair Lael Brainard, expressed that the Fed needs to keep interest rates higher-for-longer, so the bank can attain its goal. She added that the Fed would not pull back prematurely while echoing other colleagues’ expression of not knowing where rates would peak. Later in the same tone, San Francisco’s Mary Daly commented that further hikes were coming and that the Fed is “resolute” in taming inflation.
At the time of typing, Richmond’s Fed President Thomas Barkin said that he’s “comfortable” with the pace of rates, adding that it’s uncertain how much the Fed will have to do to lower demand to reach its inflation target.
Aside from this, the US Commerce Department revealed that the US Federal Reserve’s favorite measure of inflation, known as the PCE, increased more than estimated in August, at a 0.3% MoM pace, 6.2% YoY, while core PCE, which excludes volatile items, accelerated at a 0.6% MoM, up 4.9% YoY.
Of late, the University of Michigan Consumer Confidence Final reading was 58.6, less than previously reported. In the same report, inflation expectations for one year jumped to 4.7% from 4.6%, while for five years, it decelerated to 2.7% from 2.8% previously.
Given US economic data revealed in the week, even though it’s not outstanding, showed resilience. With Fed policymaker’s hawkish rhetoric, the US central bank might be headed for the fourth-consecutive 75 bps rate hike in November.
Across the pond, the EU reported inflation data surpassing the 10% threshold, headwinds for the economy of the block. Analysts are expecting another large hike by the ECB and coupled with factors like the escalation of the Russia-Ukraine conflict, with Vladimir Putin’s signing of a decree to annex four Ukrainian regions, will exert extra pressure on the euro.
EUR/USD Key Technical Levels
Next week, the Reserve Bank of New Zealand (RBNZ) will have its monetary policy meeting. Analysts at Westpac expect the central bank to hike by 50 basis points next week, and to repeat in NOvember and February meetings.
Key Quotes:
“With inflation risks escalating and domestic activity remaining resilient, another 50 basis point rise in the cash rate is in the bag for next Wednesday’s review.”
“Next week’s decision won’t include a new set of forecasts, so any change in the projected path for the OCR will have to be conveyed verbally. We expect the RBNZ to repeat its recent language that it will continue to tighten monetary policy “at pace”, and may say that the Committee anticipates a higher OCR path than what was projected in the August statement.”
“Markets have priced in some possibility of a 75 basis point increase, in keeping with the supersized moves by other central banks like the US Federal Reserve in recent months. We can’t completely rule that out: with the OCR currently at 3%, our updated forecast implies another 150 basis points to go, and with no time to be complacent about it.”
“We’ve revised up our forecast of how high the Official Cash Rate will need to go in the Reserve Bank’s battle against inflation. We now expect a peak of 4.5%, compared to our previous forecast of 4%.”
Analysts at Danske Bank see the EUR/USD pair moving to the downside over the next months at a more gradual speed. They have a target of 0.95 in a twelve months perspective.
Key Quotes:
“Fundamentally, the US should continue to be a high(er) interest rate market and equities continue to appeal to foreign investors. This means the US is likely to attract capital, which helps the USD.”
“The large negative terms-of-trade shock to Europe vs US, a further cyclical weakening among trading partners, the coordinated tightening of global financial conditions, broadening USD strength and downside risk to the euro area makes us keep our focus on EUR/USD moving still lower (targeting 0.95) – a view not shared by the consensus.”
“The key risk to shift EUR/USD towards 1.15 is seeing global inflation pressures fade and industrial production increase. The upside risk also include a renewed focus on easing Chinese credit policy and a global capex uptick but neither appear to be materialising, at present.”
The Reserve Bank of Australia (RBA) will have its monetary policy meeting next week. Analysts at Wells Fargo look for the central bank to hike by 25 basis points at its October meeting and they expect two more 25 bps hikes in November and December.
Key Quotes:
“We expect the central bank to deliver a 25 bps hike, bringing the Cash Rate to 2.60%. In September, the RBA raised its Cash Rate by 50 bps to 2.35% and signaled that further rate hikes would be needed to bring inflation back to target, repeating that policy is not on a pre-set path. In our view, the announcement had a less hawkish tone than prior announcements. The RBA dropped previous wording that rate hikes were a further step in the normalization of monetary conditions, which could indicate that the central bank believes monetary policy is close to neutral, and any further moves could be seen as moving toward restrictive territory.”
“In another less hawkish comment, the RBA said the path for bringing inflation back to target while keeping the economy on an even keel is "narrow" and "clouded in uncertainty." This cautious tone leads us to believe the RBA will move in smaller magnitude rate hikes going forward. More specifically, after a 25 bps hike at its October meeting, we expect two more 25 bps hikes in November and December, bringing the Cash Rate to 3.10%.”
Next Friday, the key US official employment report is due. Analysts at Wells Fargo look for another solid increase in payrolls of 275K, a forecast above the 250K of market consensus.
Key Quotes:
“The U.S. labor market continues to be one of the strongest parts of the global economy. Nonfarm payrolls rose by 315K last month with industry gains once again widespread. This pace of job growth marks a downshift from the 402K average recorded in the prior three months, but it is nonetheless a robust gain in its own right. For context, nonfarm payrolls increased by an average of 167K per month in the 2010s.”
“The extremely tight labor market is keeping wage growth above what is consistent with the Fed's 2% inflation target. To achieve a soft landing, the Federal Reserve needs labor demand to cool enough that wages decelerate but not so much that the economy is tipped into a nasty recession.”
“In the near term, we look for another solid 275K increase in nonfarm payrolls in next week's employment report. Another sizable increase in labor force participation would be a welcome development for Fed officials as they attempt the high wire act of bringing labor supply and demand into a healthy balance.”
The pound remains a very vulnerable currency according to analysts from Rabobank. They have a 3-6 month target of the GBP/USD pair at 1.04 and they cannot rule out a move to parity dependent on the decisions taken by the UK government.
Key Quotes:
“The ferocity of the market reaction which greeted the Chancellor’s mini-budget on September 23 has triggered a broad range of criticisms. Among them is the accusation that the Chancellor and his advisers naively failed to read market conditions. UK economic fundamentals have been souring for some time and GBP has been performing poorly for a while, not just against the mighty USD but against the beleaguered EUR too.”
“The signals from the budget imply that the UK government has put a low priority on fiscal prudence clearly pushed the market’s patience over the edge. While GBP/USD has scrambled back above the 1.10 level following intervention from the Bank of England, we continue to view the pound as a very vulnerable currency.”
“While the BoE’s fire-fighting policies can hold the market fairly steady for now, without some change in the government’s fiscal position, the pound is on borrowed time. We have a 3-6 month target of GBP/USD1.04 and cannot rule out a move to parity dependent on the direction of UK fiscal policies.”
- Loonie suffers the worst monthly decline since March 2020 versus the US dollar.
- US dollar holds firm on Friday, despite lower US yields.
- USD/CAD remain bullish and overbought.
The USD/CAD is about to end Friday trading around 1.3750/60, with a weekly gain of 175 pips, on the back of risk aversion that boosted the greenback against most currencies.
The rally of the greenback lost momentum on Friday amid an extension of the retreat in US yields and also as stocks stabilized. But ongoing concerns about global growth and geopolitical tensions weigh on market sentiment. With the Federal Reserve well decided to continue tightening, the upside of the dollar continues.
During the last three weeks, USD/CAD rose almost 800 pips. After such a move, the question about how much can it keep rising in the short-term seem normal. These are volatile times and in those circumstances anything can happen.
Even as markets calm down, moves larger than average in USD/CAD are likely next week. Market participants will continue to look particularly at the bond market, stocks and the pound. Next Friday, Canada and the US will release the official employment reports.
From a technical perspective, USD/CAD is moving with a bullish bias. The only bearish sign is the extreme overbought readings. The next strong barrier is the 1.3900 area. During the last days, the pair has been moving sideways between 1.3750 and 1.3600, holding onto most of the recent gains.
Technical levels
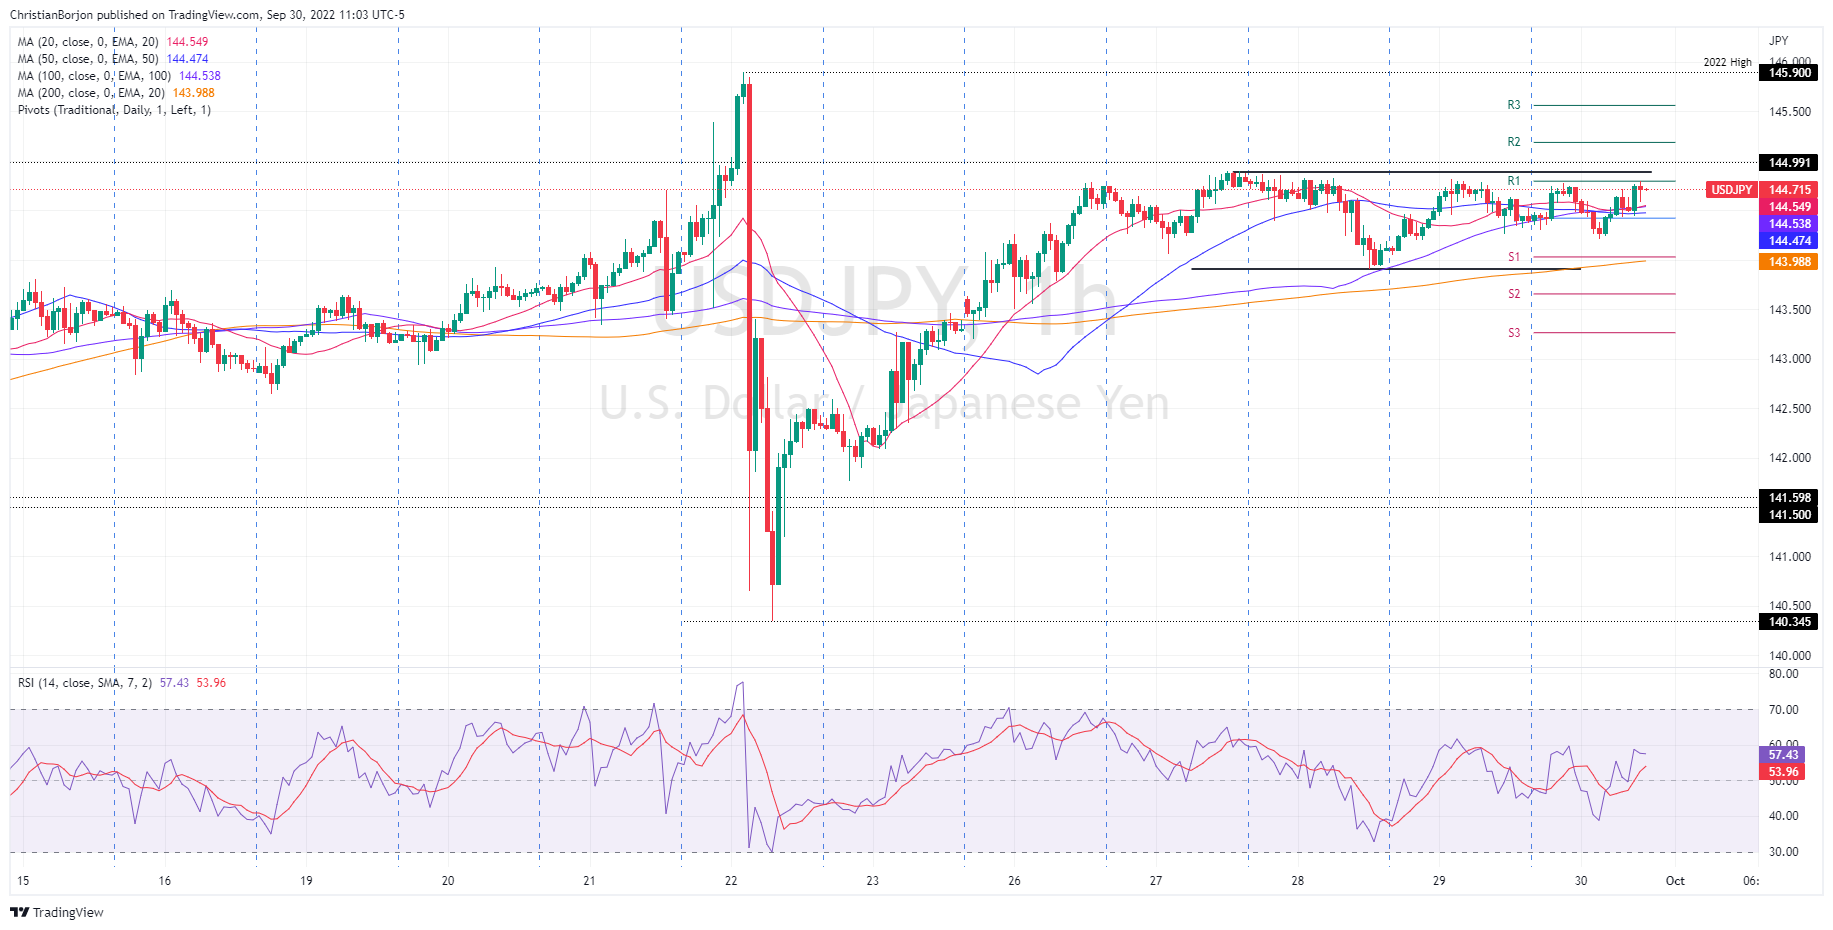
- USD/JPY remains subdued around the 144.40-80 area as traders brace for the weekend.
- The interest rates differential, and central bank monetary policy divergence, are tailwinds for the USD/JPY.
The USD/JPY consolidates in the 144.00-145.00 area following last week’s Bank of Japan (BoJ) intervention, which had kept the major directionless, as traders remain on the sidelines. Despite the solid correlation with the US 10-year T-bond yield, piercing the 4% threshold during the week, the USD/JPY did not attempt to clear the 145.00 figure. At the time of writing, the USD/JPY is trading at 144.70, above its opening price.
USD/JPY Price Analysis: Technical outlook
Given the backdrop that, fundamentally speaking, the interest rates differential between both economies, the central bank divergency with the Bank of Japan’s dovish stance is a tailwind for the USD/JPY.
From a technical analysis perspective, the USD/JPY is range-bound, though it remains upward biased, based on where the daily moving averages (DMAs) are located. During the week, the USD/JPY trading range has been the 143.50-144.90 area, so any breaks below would likely send the major towards the 140.00 figure. Conversely, a re-test of the 145.00 is possible, but with the BoJ vigilance around it, traders are not challenging the central bank.
The USD/JPY one-hour chart depicted a triple-top formation that extended to a multi-top, with the major remaining trendless. On the downside, the confluence of the 20, 50, and 100-EMA at around 144.47/53 are support levels, which, once cleared, will send the USD/JPY towards the S1 daily pivot at 144.02, shy of the 200-EMA. A breach of the latter will expose the S2 pivot at 143.50, followed by the S3 daily pivot point at 143.27.
USD/JPY Key Technical Levels
The pound is about to end the week on a positive mood, after an extreme volatile week. The GBP/USD rebounded almost a thousand pips, rising back above 1.1000. Analysts at MUFG Bank point out that the downside in cable is not over yet and the recent bounce is an opportunity to short again.
Key Quotes:
“The GBP’s recent gains are built on shaky foundations. Risks remain titled to the downside for the cable.”
“Rebounded of course on the back of the intervention by the BoE to bring order to the Gilts market. But the speech by PM Liz Truss yesterday suggests the government will stick to its plans despite the financial market fallout and some opposition voiced by Conservative party backbenchers.”
“The reluctance of the BoE to hike inter-meeting continues to paint a picture of a central bank less enthusiastic for rushing to tighten monetary policy. This likely reflects genuine concerns over growth but if rates are being constrained from going higher due to weak fundamentals and given the close to record current account deficit, the likely channel of adjustment therefore will be GBP. Confidence remains fragile and based on the signs of limited desire for any U-turn, we suspect GBP/USD will begin to decline once more.”
European Central Bank (ECB) must continue to raise rates even though long-term inflation expectations remain anchored, ECB Governing Council member Ignazio Visco said on Friday, as reported by Reuters.
Key takeaways
"Approach to policy tightening will be defined meeting by meeting based on data."
"Euro area mid-term economic prospects important to establish more appropriate final level, proceeding gradually."
"No obvious reason at present to tie our hands with idea of exceptionally high rate increases."
"Rate hikes could have the biggest impact on inflation once economy has already significatly slowed down."
"Significant worsening of economic outlook is cause for concern."
"Impossible to fully offset impact of energy shock on wages, profits."
"Fiscal policy can redistribute impact, but increasing debt would unfairly shift burden on future generations."
Market reaction
These comments don't seem to be having a noticeable impact on the shared currency's performance against its rivals. As of writing, EUR/USD was down 0.2% on the day at 0.9795.
European Central Bank (ECB) Governing Council member Isabel Schnabel said on Friday that further increases in the ECB's key rates will be needed, as reported by Reuters.
"The risks of a wage-price spiral are contained, provided inflation expectations remain anchored," Schnabel further added. ECB policymaker explained that she continues to call for a “robust control” approach to monetary policy amid uncertainty about the persistency of inflation.
Market reaction
EUR/USD largely ignored these comments and was last seen trading at 0.9790, where it was down 0.23% on a daily basis.
- AUD/USD stumbles below 0.6500, set to finish the week at around the mid 0.6400-0.6500 range.
- US Core PCE exceeded estimations, opening the door for further Fed tightening.
- Fed’s Brainard and Daly reiterated that further hikes are expected and commented that the FFR peak is unknown today.
- Strong resistance around the 0.6468-87 area might cap any AUD/USD rallies.
The AUD/USD drops in the North American session as market sentiment improved, portrayed by US equities advancing, amid Fed officials crossing wires reiterating the need for higher rates after the Fed’s gauge of inflation for August surprisingly jumped.
At the time of writing, the AUD/USD is trading at 0.6445 below its opening price by 0.83%, after hitting a daily high of 0.6523 earlier during the European session.
The US Federal Reserve’s favorite measure of inflation, known as the PCE, jumped more than estimated, rising 0.3% MoM on August, 6.2% YoY, while core PCE, which strips volatile items, accelerated at a 0.6% MoM pace, up 4.9% YoY, the US Commerce Department said.
Therefore, given that unemployment claims for the last week edged lower and inflation keeps heading north, it cements the case for further tightening by the Federal Reserve. Meanwhile, money market futures see a 68% chance of the Fed hiking 75 bps at the November meeting, up from 61% before the US inflation report.
Later, the Fed’s Vice-Chair Lael Brainard said that the Fed needs to keep interest rates elevated for quite some time as part of the central bank’s effort to bring inflation towards the 2% goal. Brainard added that It’s too early to declare victory over inflation, said that they (Fed) would note pull back prematurely, and commented that the Federal funds rate (FFR) peak is not clear now.
Echoing her comments, the San Francisco Fed’s Mary Daly said that in inevitable to keep raising rates and emphasized that the Fed is “resolute” in its mission to bring inflation down.
Elsewhere, the University of Michigan Consumer Confidence Final reading came at 58.6, lower than previously reported. However, inflation expectations for one year jumped to 4.7% from 4.6%, while for five years, it decelerated to 2.7% from 2.8% previously.
On the Australian dollar side, China’s PMI was mixed, with the official report remaining in expansionary territory. Contrarily, the Caixin Manufacturing PMI missed expectations, in contractionary territory, blamed on Covid-19 containment measures.
AUD/USD Technical Analysis
The AUD/USD dropped from around weekly highs to around 0.6500, extending its losses, though it is headed to end the week near the mid-part of the weekly range. Nevertheless, it should be noted that the RSI is again pointing south, suggesting that sellers are gathering momentum. Short term, the AUD/USD one-hour scale might cap any rallies around the 0.6468-87 area, busy with the 100, 50, and 20-EMAs confluence around that region, further reinforced by the daily pivot point. Therefore, AUD/USD is bearish biased.
AUD/USD Key Technical Levels
Gold prices remain in a strengthening downtrend, despite the recent respite afforded by the slump in USD. This trend is set to last, in the opinion of strategists at TD Securities.
The pain trade is still to the downside
“The risk of capitulation remains prevalent for the yellow metal moving into October, with strong data continuing to point to a more aggressive Fed rate path ahead.”
While rates markets are increasingly discounting a higher terminal, we find that gold prices aren't pricing in the next stage of the hiking cycle. Historically, gold prices tend to display a systematic and significant underperformance in the latter stage of hiking cycles, as rates enter into restrictive territory.”
“Considering the increase in inflation's persistence this cycle, a restrictive regime may last longer than historical precedents with the Fed likely to keep rates elevated for some time, even as recession risks rise, which argues for a prolonged period of pronounced weakness in precious metals.”
Recent indicators suggest a broad-based sharply deteriorating growth outlook. Therefore, economists at Danske Bank expect the EUR/NOK to edge higher over the next few months before easing back lower in 2023.
Q4 headwinds looming for NOK
“We still think EUR/NOK is heading higher over the coming 3-6M driven by a slowdown in growth, a European recession, volatile asset markets and further spread tightening in the short-end of rates curves.”
“For 2023, we still pencil in a NOK rebound – but timing is tricky. Until we see global central banks signal a shift of policy towards a more dovish direction we prefer to play the weak leg in NOK.”
“We forecast EUR/NOK at 10.60 in 3M and 9.80 in 12M.”
Economists at Wells Fargo expect weakness in the euro to persist. They believe that the EUR/USD could fall as low as 0.91 by the first quarter of the next year.
Confidence surveys are now clearly pointing to contraction
“High and rising inflation should continue to weigh on the consumer, and energy supply disruptions could more directly impact manufacturing activity.”
“Confidence surveys are now clearly pointing to contraction, especially for Germany– the region's largest economy.”
“While the European Central Bank should raise rates further, underwhelming Eurozone growth should see it lag well behind the Fed, another factor that could see the EUR/USD exchange rate reach 0.9100 by Q1-2023.”
- Gold struggles to preserve its intraday gains to a fresh weekly high touched this Friday.
- The prospects for aggressive policy tightening by the Fed continue to act as a headwind.
- The emergence of fresh USD buying exerts additional downward pressure on the metal.
Gold surrenders a major part of its intraday gains to a fresh weekly high touched earlier this Friday and retreats below the $1,665 level during the early North American session.
Despite growing recession fears and geopolitical risk, the safe-haven XAU/USD has been struggling to gain any meaningful traction amid the Federal Reserve’s commitment to getting inflation under control. Investors seem convinced that the US central bank will stick to its aggressive rate hiking cycle and have been pricing in the possibility of another supersized 75 bps rate hike in November. The bets were reaffirmed by Friday's release of the US Personal Consumption Expenditures (PCE) data, which continues to act as a headwind for the non-yielding gold.
Apart from this, resurgent US dollar demand turns out to be another factor exerting additional downward pressure on the dollar-denominated commodity. In fact, the USD Index, which measures the greenback's performance against a basket of currencies, stages a solid recovery from the weekly low and for now, seems to have stalled this week's sharp pullback from a two-decade high. That said, the spill-over effect of the Bank of England's move to calm the markets drags the benchmark 10-year US Treasury note further away from a 12-year high set on Wednesday.
This, in turn, is seen holding back the USD bulls from placing aggressive bets. Apart from this, the prevalent risk-off environment offers some support to gold and should help limit the downside, at least for the time being. Nevertheless, the precious metal remains on track to register the sixth successive month of losses and the biggest quarterly fall since early 2021.
Technical levels to watch
"Additional rate hikes are the right thing to do but how high we will go depends on data," San Francisco Fed President Mary Daly said on Friday, as reported by Reuters.
Additional takeaways
"Our number one priority is to get inflation down."
"We are starting to see the benefits of rate increases with housing market cooling."
"We need to see a lot more relief on inflation."
"Rate increases we have taken and project will bring inflation down."
"The economy is not teetering on recession; it needs to slow."
"The economy is moving from frenetic to something more sustainable."
Market reaction
The greenback preserves its strength after these comments and the US Dollar Index was last seen rising 0.8% on the day at 112.65.
Economists at Danske Bank continue to expect EUR/SEK to move higher in the coming 12 months to 11.20 on the back of rising concerns for global recession and the expectation of a substantial drag on domestic demand and real asset prices.
Weakness in store
“We are negative on the krona as the SEK usually underperforms in a global, in particular European, recession risk-off environment and also since the Riksbank’s tightening of financial conditions will (is intended to) be a substantial drag on domestic demand and real asset prices.”
“We look for weaker SEK in the 6-12M perspective, forecasting 11.20 in 12M.”
- EUR/USD meets some selling pressure following tops near 0.9850.
- Extra weakness could open the door to the 2022 low at 0.9535.
EUR/USD partially fades the strong weekly bounce to multi-day highs near 0.9850 on Friday.
Odds for extra weakness in the European currency remain well in store so far with the immediate target at the 2022 low at 0.9535 (September 28). A deeper drop could challenge the round level at 0.9500 ahead of the weekly low at 0.9411 (June 17 2002).
In the longer run, the pair’s bearish view should remain unaltered while below the 200-day SMA at 1.0653.
EUR/USD daily chart
Federal Reserve Vice Chair Lael Brainard reiterated on Friday that the monetary policy will need to be restrictive for some time to have confidence inflation is moving back to 2%, as reported by Reuters.
Additional takeaways
"Fed is committed to avoiding pulling back prematurely."
"Fed recognizes risks may become more two-sided at some point."
"Proceeding deliberately and in data-dependent manner will let Fed learn how economy and inflation are adjusting to tightening and update its assessment of policy rate needed."
"Uncertainty is currently high, there are range of estimates on peak fed funds rate."
"Policymakers taking risk-management posture to guard against risks of longer-term inflation expectations moving above target."
"Entire real yield curve will soon move into positive territory."
"Will take time for tighter financial conditions to fully impact different sectors and bring inflation down."
"As monetary policy tightens globally, important to consider how cross-border spillovers might impact financial vulnerabilities."
"Risk of additional inflationary shocks cannot be ruled out."
"There is risk that supply disruptions could be prolonged by Ukraine war, China's covid lockdowns or weather disruptions."
"Spillovers of monetary policy surprises between tightly linked advanced economies could be half the size of own-country effect on local currency bond yields."
Market reaction
The US Dollar Index clings to strong daily gains above 112.50 following these comments.
- DXY reverses recent weakness and reclaims 112.00 and above.
- Further upside pressure keeps targeting the YTD high near 114.80.
DXY advances moderately beyond the 112.00 hurdle following two consecutive daily pullbacks at the end of the week.
The index retreated from recent extreme overbought levels and seems to have met some contention around 111.50 so far. The continuation of the ongoing rebound could see the 2022 peak at 114.77 (September 28) revisited.
The prospects for extra gains in the dollar should remain unchanged as long as the index trades above the 7-month support line near 107.20.
In the longer run, DXY is expected to maintain its constructive stance while above the 200-day SMA at 102.45.
DXY daily chart
- GBP/USD retreats over 100 pips from the weekly high touched earlier this Friday.
- The emergence of fresh USD buying turns out to be a key factor exerting pressure.
- The US PCE data does little to provide any impetus, though favours the USD bulls.
The GBP/USD pair retreats sharply from the 1.1235 region, or the weekly high touched this Friday and refreshes the daily low during the early North American session. Spot prices, however, recover a few pips and hold steady just above the 1.1050 area post-US macro data.
The US dollar makes a solid comeback on the last day of the week and stalls its recent sharp corrective decline from a two-decade high. This turns out to be a key factor behind the GBP/USD pair's intraday turnaround. The USD sticks to its intraday gains following the release of stronger-than-expected US Personal Consumption Expenditures (PCE) data.
The US Bureau of Economic Analysis reported that PCE Price Index eased to 6.2% YoY in August from 6.4% in the previous month, missing expectations for a rise to 6.6%. The disappointment from the headline print, however, was offset by the Core PCE Price Index (the Fed's preferred inflation gauge, which rose by 0.6% and to a 4.7% YoY rate during the reported month.
The data all but reaffirmed market bets that the Federal Reserve will stick to a more aggressive rate hiking cycle to curb persistently high inflation. This triggers an intraday recovery in the US Treasury bond yields, which, along with the prevalent risk-off environment, underpins the safe-haven greenback and continues to weigh on the GBP/USD pair.
That said, the lack of any follow-through selling warrants some caution before confirming that the strong recovery from an all-time low touched on Monday has run out of steam. Nevertheless, the GBP/USD pair, for now, seems to have snapped a three-day winning streak, though remains on track to register strong weekly gains.
Technical levels to watch
Inflation in the US, as measured by the Personal Consumption Expenditures (PCE) Price Index, declined to 6.2% on a yearly basis in August from 6.4% in July, the US Bureau of Economic Analysis announced on Friday. This reading came in below the market expectation of 6.6%. On a monthly basis, the PCE Price Index rose 0.3% as expected.
The Core PCE Price Index, the Federal Reserve's preferred gauge of inflation, edged higher to 4.9% on a yearly basis from 4.7% in July, compared to analysts' estimate of 4.7%, and was up 0.6% in August.
Market reaction
The US Dollar Index showed no immediate reaction to these data and was last seen rising 0.65% on the day at 112.50.
Gold price has climbed to $1,670 this morning. A breather could be followed by another correction if the USD appreciation continues after the US labour market report is published, economists at Commerzbank report.
Considerable selling of gold ETFs
“If the Purchasing Managers’ Index remains fairly stable as expected, markets will probably take a breather until the new US labour market data are published on Friday. If the figures cause the US dollar to appreciate further, metals prices are likely to continue falling.”
“ETF investors are continuing to withdraw from gold ETFs, which is exerting additional pressure on the gold price. The majority of speculative financial investors are now betting on a further price slide again.
“In July, when speculators were last positioned net short, a price recovery began shortly afterward. That said, for this to happen the USD would probably have to stop appreciating for the time being, as was the case a good two months ago.”
There is a clear debate still ongoing over whether the European Central Bank (ECB) rate hike should match the September move of 75 bps or be reduced to 50 bps. In the latter case, the euro could come under further downward pressure, economists at MUFG Bank report.
Higher risks of conditions worsening in Europe
“If financial market conditions continue to worsen, there is every chance the ECB could revert back to a 50 bps hike.”
“We certainly see far higher risks of conditions worsening and hence EUR/USD downside momentum will likely return quickly.”
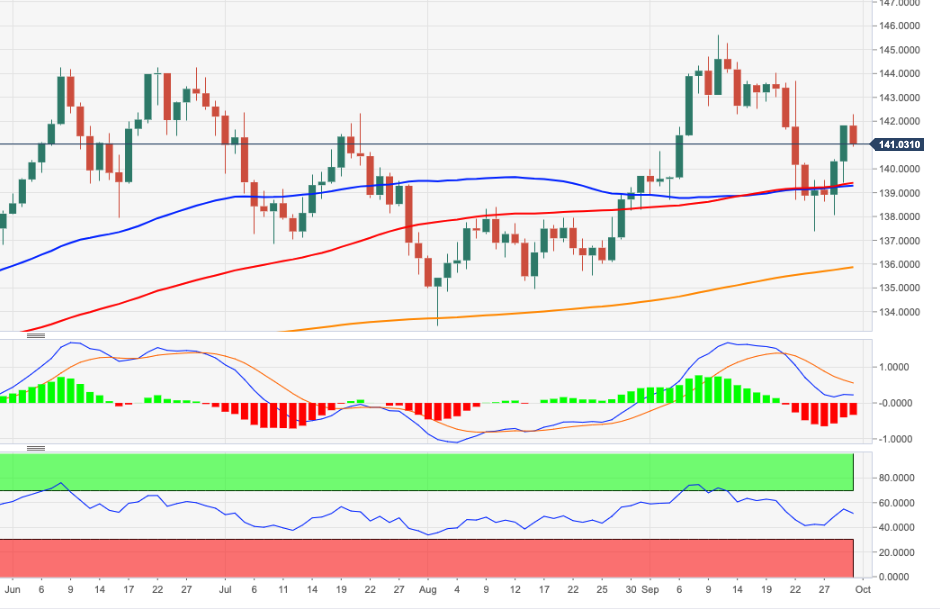
- EUR/JPY comes under some pressure and fades two daily gains in a row.
- There is still room for a potential rebound to the 144.00 region.
EUR/JPY seems to have met decent resistance around daily highs near 142.30 at the end of the week.
The continuation of the bounce off last week’s lows remains on the table in the very near term. That said, the cross could therefore extend the bullish attempt to the weekly top at 144.04 (September 20), which is deemed as the last defense for a move to the 2022 peak at 145.63 (September 12).
In the meantime, while above the key 200-day SMA at 135.84, the constructive outlook for the cross should remain unchanged.
EUR/JPY daily chart
US PCE Price Index Overview
Friday's US economic docket highlights the release of the Personal Consumption Expenditure (PCE) Price Index for August, scheduled later during the early North American session at 12:30 GMT. The gauge is foreseen to rise by 0.3% during the reported month against the 0.1% fall recorded in July. The yearly rate is anticipated to have accelerated to 6.6% in August from 6.3% previous. Meanwhile, the Core PCE Price Index - the Fed's preferred inflation measure - likely edged up to a 4.7% YoY rate in August from the 4.6% in the previous month.
Analysts at Commerzbank offer a brief preview of the report and explain: “Excluding food and energy, the deflator probably increased by 0.4% MoM. This is a bit less than the recently released core CPI rate. This is because rents have a lower weight in the deflator than in the CPI basket (15% vs. 32.6%); rents rose quite strongly in the CPI in August. In addition, medical services have a much higher weighting in the deflator, and here the government health services included in the deflator, in contrast to the CPI, have a dampening effect on prices.”
How Could it Affect EUR/USD?
The markets started pricing in the possibility of another supersized 75 bps Fed rate hike move in November following the release of hotter-than-expected August US consumer inflation figures. A stronger-than-expected PCE report will reaffirm expectations and boost the US dollar. Conversely, a softer print could force the USD to prolong this week's sharp retracement slide from a two-decade high amid a further descent in the US Treasury bond yields. The immediate market reaction, however, is more likely to be short-lived, warranting some caution before placing aggressive directional bets around the EUR/USD pair.
Eren Sengezer, Editor at FXStreet, offers a brief technical overview and outlines important technical levels to trade the EUR/USD pair: “The Relative Strength Index (RSI) indicator on the four-hour chart holds above 50 and the pair continues to trade above the 50-period SMA, confirming the bullish bias. On the upside, 0.9850 (Fibonacci 61.8% retracement of the latest downtrend) aligns as initial resistance. With a four-hour close above that level, the pair could target 0.9900 (psychological level, 100-period SMA) and 0.9950 (200-period SMA).”
“Supports are located at 0.9800 (Fibonacci 50% retracement), 0.9750 (Fibonacci 38.2% retracement, 50-period SMA) and 0.9700 (psychological level, 20-period SMA),” Eren adds further.
Key Notes
• US August PCE Inflation Preview: Will it trigger a dollar correction?
• Core PCE Preview: Forecasts from six major banks, strong price pressures
• EUR/USD Forecast: Quarter-end flows could boost the euro
About the US PCE Price Index
The Personal Spending released by the Bureau of Economic Analysis, Department of Commerce is an indicator that measures the total expenditure by individuals. The level of spending can be used as an indicator of consumer optimism. It is also considered as a measure of economic growth: While Personal spending stimulates inflationary pressures, it could lead to raise interest rates. A high reading is positive (or Bullish) for the USD.
The overheated US economy is gradually cooling off. Economists at ABN Amro expect the fed funds rate upper bound to hit 4.5% by December, but still expect rate cuts in 2023.
Fed funds rate to end 2023 at 3.5%
“The Fed tilted further in a hawkish direction at the September FOMC meeting, with the upper bound of the fed funds rate projected to reach 4.5% by the end of the year. The projections also showed policy staying restrictive throughout the forecast horizon, with no rate cuts seen until 2024, and policy still above neutral even in 2025. Despite this, we continue to think the Fed is likely to modestly cut rates in H2 2023.”
“We expect a steeper rise in unemployment than the FOMC projects, to c.5% by end-2023. Given the lags with which monetary policy affects the economy – the labour market being the last domino to fall – we think the Fed will be confident that the economy is cooling sufficiently by the middle of next year.”
“We continue to expect around 100 bps in rate cuts in H2 2023, although the higher level from which the Fed would be cutting means we are now likely to end 2023 at 3.5% in the upper bound of the fed funds rate, up from our previous 3% expectation.”
- USD/CAD gains traction for the second straight day, though lacks follow-through.
- Subdued crude oil prices undermine the loonie and act as a tailwind for the pair.
- Retreating US bond yields, a positive risk tone weighs on the USD and caps gains.
The USD/CAD pair attracts some dip-buying in the vicinity of the mid-1.3600s and sticks to modest intraday gains through the first half of the European session. The pair maintains its bid tone for the second successive day and is currently trading just above the 1.3700 mark, well within this week's broader trading band.
A combination of factors drags the US dollar to a one-week low, which, in turn, acts as a headwind for the USD/CAD pair. The spill-over effect of the UK central bank's move to calm the markets drags the benchmark 10-year US Treasury note away from a 12-year high touched on Wednesday. Apart from this, a goodish recovery in the global risk sentiment further weighs on the safe-haven greenback.
That said, subdued price action around crude oil prices undermines the commodity-linked loonie and continues to lend some support to the USD/CAD pair, at least for the time being. Worries that a deeper global economic downturn will dent fuel demand offset global supply concerns and fail to assist the black liquid to capitalize on this week's goodish recovery from the lowest level since January 2022.
Furthermore, firming expectations for a more aggressive policy tightening by the Fed should limit the fall in the US bond yields and favours the USD bulls. Investors seem convinced that the US central bank will hike interest rates at a faster pace to curb inflation. Hence, the focus remains on the release of the US Personal Consumption Expenditures (PCE) - the Fed's preferred inflation gauge.
Friday's US economic docket also features the release of the Chicago PMI and the revised Michigan Consumer Sentiment Index. The data, along with the US bond yields and the broader risk sentiment, will influence the USD and provide a fresh impetus to the USD/CAD pair. Traders will further take cues from oil price dynamics to grab short-term opportunities on the last day of the week.
Technical levels to watch
EUR/GBP briefly touched a high around the EUR/GBP 0.9260 level on Monday, September 26 before pulling back below 0.90. Economists at Rabobank forecast the pair at 0.92 by mid-2023.
GBP remains a very vulnerable currency
“The UK is burdened with a record current account deficit/GDP ratio meaning that GBP is vulnerable to a downward adjustment if foreign investors are reluctant to fund the deficit.”
“UK’s fundamentals are currently characterised by high levels of debt and debt issuance, low growth/recession, high inflation and weak productivity. It is hardly an attractive backdrop for investors, which explains why GBP remains a very vulnerable currency.”
“We now see EUR/GBP trending higher to 0.92 by the middle of next year.”
EUR/USD has gone into a consolidation phase above 0.9800. Quarter-end flows could help the pair extend its rebound ahead of the weekend, FXStreet’s Eren Sengezer reports.
0.9850 aligns as initial resistance
“In case the risk rally stays intact, the dollar is likely to continue to lose interest ahead of the weekend. Profit-taking on the last trading day of the third quarter could also help EUR/USD preserve its bullish momentum.”
“On the upside, 0.9850 (Fibonacci 61.8% retracement of the latest downtrend) aligns as initial resistance. With a four-hour close above that level, the pair could target 0.9900 (psychological level, 100-period SMA) and 0.9950 (200-period SMA).”
“Supports are located at 0.9800 (Fibonacci 50% retracement), 0.9750 (Fibonacci 38.2% retracement, 50-period SMA) and 0.9700 (psychological level, 20-period SMA).”
- EUR/GBP cross extends its recent corrective slide from a two-year high for the fourth straight day.
- The BoE’s intervention, an upward revision of the UK GDP underpins sterling and exerts pressure.
- Weaker USD, hotter-than-expected Eurozone CPI offer support to the euro and helps limit losses.
The EUR/GBP cross extends this week's sharp retracement slide from a two-year peak and remains under some selling pressure for the fourth straight day on Friday. The steady downfall remains uninterrupted through the first half of the European session and drags spot prices to mid-0.8700s or a fresh weekly low.
The British pound's relative outperformance comes on the back of the Bank of England's intervention in the UK debt market for the second day on Thursday. This, along with an upward revision of the UK Q2 GDP print, further underpins sterling on Friday and continues exerting downward pressure on the EUR/GBP cross. In fact, the UK Office for National Statistics reported this Friday that the economy expanded by 0.2% during the second quarter against a modest 0.1% contraction estimate, easing recession fears.
That said, a combination of factors assists the EUR/GBP cross to find some support at lower levels. Investors remain worried that the new UK government's historic tax cuts could stretch Britain's finances to their limits. This, in turn, threatens to derail the BoE's efforts to contain inflation and create additional economic headwinds. The shared currency, on the other hand, draws support from the weaker US dollar and hotter-than-expected Eurozone CPI, which, in turn, limits the downside for the cross.
According to the official data released by Eurostat on Friday, inflation in the euro area, as measured by the Harmonised Index of Consumer Prices (HICP), climbed to 10% on a yearly basis in September. This marks a notable rise from 9.1% in August and was also higher than market expectations for a reading of 9.7%. This reaffirms markets bets for another jumbo interest rate hike by the European Central Bank and could lend some support to the EUR/GBP cross, warranting caution for aggressive bearish traders.
Technical levels to watch
Norges Bank just announced that they will raise their NOK selling to 4.3bn from 3.5bn NOK per day. This change points toward an even weaker krone ahead, economists at Nordea report.
Norges Bank steps up the ante
“Norges Bank just announced that they will sell 4.3bn NOK/day in October from 3.5bn today. The higher NOK selling from Norges Bank combined with lower NOK purchases from oil companies and continued uncertainty in financial markets means that the NOK could weaken even further towards year-end, with EUR/NOK up to 11 and USD/NOK around 11.50.”
“For the NOK to fare better than we expect, we need risk sentiment to improve markedly in the coming months, which is unlikely given central bank's fight against inflation.”
FX option expiries for September 30 NY cut at 10:00 Eastern Time, via DTCC, can be found below.
EUR/USD: 0.9690-00 (1.3BLN), 0.9750 (650M), 0.9795-00 (1.65BLN), 0.9850 (644M), 0.9900 (1.1BLN), 0.9930-35 (403M), 0.9950 (256M), 1.0020 (418M)
USD/JPY: 143.00 (509M), 144.00 (675M), 144.95-00 (1.13BLN), 146.00 (361M)
EUR/JPY: 141.00 (300M). USD/CHF: 0.9780 (214M)
EUR/CHF: 0.9500 (306M), 0.9600 (931M), 0.9650 (450M), 0.9700 (361M)
GBP/USD: 1.1050 (518M), 1.1200 (521M), 1.1350 (210M)
EUR/GBP: 0.8800 (530M), 0.8850 (303M), 0.8875 (411M)
AUD/USD: 0.6500 (310M), 0.6575 (325M)
USD/CAD: 1.3500 (515M), 1.3550 (270M), 1.3700 (270M), 1.3725 (250M), 1.3850 (250M)
GBP/USD has gathered further bullish momentum. Pound bulls eye 1.1300 next, FXSTreet’s Eren Sengezer reports.
Buyers retain control of cable’s action
“On the upside, 1.1300 (Fibonacci 61.8% retracement of the latest downtrend, 100-period SMA) aligns as the next target. In case buyers flip that level into support, the pair could continue to push higher toward 1.1400 (static level) and 1.1500 (200-period SMA).”
“First support is located at 1.1130 (Fibonacci 50% retracement) before 1.1100 (psychological level) and 1.1000 (psychological level, 50-period SMA, Fibonacci 38.2% retracement).”
- AUD/USD reverses an intraday dip on Friday and climbs back closer to the weekly high.
- Retreating US bond yields, a positive risk tone undermines the USD and offers support.
- Recession fears, aggressive Fed rate hike bets to limit the USD losses and cap the major.
The AUD/USD pair attracts some dip-buying around the 0.6475 area on Friday and climbs to a fresh daily high during the early European session. The pair is now placed above the 0.6500 psychological mark, though lacks bullish conviction.
A combination of factors drags the US dollar lower for the third successive day and offers some support to the AUD/USD pair. The spill-over effect of the UK central bank's move to calm the markets drags the benchmark 10-year US Treasury not away from a 12-year high touched earlier this week. Apart from this, a goodish recovery in the global risk sentiment weighs on the safe-haven greenback and drives some flows towards the perceived riskier aussie.
Despite the supporting factors, the AUD/USD pair struggles to gain meaningful traction. Mixed business activity data from China adds to worries about a deeper global economic downturn and should keep a lid on any optimism in the markets. Furthermore, hawkish Fed expectations could revive the USD demand and cap the AUD/USD pair, warranting caution before positioning for an extension of this week's bounce from the lowest level since April 2020.
Investors seem convinced that the US central bank will continue to hike interest rates at a faster pace to curb persistently high inflation. Hence, the focus remains glued to the release of the US Personal Consumption Expenditures (PCE) - the Fed's preferred inflation gauge. The data, along with the US bond yields and the broader risk sentiment, will influence the USD and provide a fresh impetus to the AUD/USD pair later during the early North American session.
Friday's US economic docket also features the release of the Chicago PMI and the revised Michigan Consumer Sentiment Index. This could further allow traders to grab short-term opportunities around the AUD/USD pair on the last day of the week.
Technical levels to watch
Inflation in the euro area, as measured by the Harmonised Index of Consumer Prices (HICP), climbed to 10% on a yearly basis in September from 9.1% in August, Eurostat announced on Friday. This reading came in higher than the market expectation of 9.7%.
Developing story...
The European Central Bank (ECB) raised its key policy rates by 75 bps at its September meeting. In their revised base case, economists at ABN Amro see another 75 bps hike in October, followed by a 50 bps step in December.
Risks to the new forecast are balanced
“We now expect the ECB to raise its deposit rate to 2% most likely by end-2022. In our revised base case, we see another 75 bps hike in October, followed by a 50 bps step in December. The policy rate then settles at 2% through 2023.”
“The most likely alternative to this base, is three steps of 50 bps, with the terminal rate being reached in February 2023.”
“We had previously signalled a peak rate of 1.5%. We saw the risks to our previous peak rate call as being skewed to the upside, but we see the risks to our new forecast as being balanced.”
FX Strategists at UOB Group Lee Sue Ann and Quek Ser Leang now see USD/CNH navigating within the 7.0500-7.2200 range in the next few weeks.
Key Quotes
24-hour view: “We stated yesterday that ‘further volatility is not ruled out but USD is likely to trade within a narrower range of 7.1450/7.2250’. Our view was incorrect as USD rose to 7.2144 before staging a sharp and swift sell-off (low has been 7.0890). The sharp and rapid decline appears to be overdone and USD is unlikely to weaken much further. For today, USD is more likely to trade between 7.0800 and 7.1500.”
Next 1-3 weeks: “We have expected USD to strengthen for more than 2 weeks now. After USD surged to 7.2668 and retreated, we indicated yesterday (29 Sep, spot at 7.1800) that the odds of USD rising to 7.3000 have diminished. However, we did not expect the subsequent sharp sell-off as USD plunged to a low of 7.0890. The breach of our ‘strong support’ at 7.1400 indicates that the USD rally from more than 2 weeks ago has topped for now. The current movement is likely the early stages of a consolidation phase. In view of the recent high volatility, USD could trade within a broad range of 7.0500/7.2200 for a period of time.”
- EUR/USD extends the weekly recovery and revisits the 0.9850 region.
- Germany labour market report surprised to the upside in September.
- EMU Flash Inflation Rate next of importance in the euro docket.
The optimism around the European currency remains well in place for another session and this time lifts EUR/USD to fresh tops in the mid-0.9800s on Friday.
EUR/USD focuses on EMU, US data
EUR/USD advances for the third session in a row on Friday and extends further the bounce off the recent 20-year lows in the proximity of 0.9530 (September 28), always against the backdrop of the renewed and strong corrective decline in the dollar.
Indeed, the dollar comes under extra pressure and keeps correcting lower amidst the ongoing technical retracement and intense improvement in the risk complex, which eventually lends extra legs to the pair.
Moving forward, advanced inflation figures in the euro area are expected to take centre stage later in the session. Earlier in the day, the German Unemployment Rate stayted unchanged at 5.5% in September and the Unemployment Change rose by 14K persons in the same period.
Across the pond, the August’s PCE will be in the centre of the debate seconded by Personal Income/Spending along with the final print of the Consumer Sentiment for the current month.
Additionally, FOMC’s T.Barkin, L.Brainard, L.Mester, J.Williams and M.Bowman will speak later in the NA session.
What to look for around EUR
EUR/USD’s upside momentum appears unabated for the time being and already breaks above the key 0.9800 hurdle.
In the meantime, price action around the European currency is expected to closely follow dollar dynamics, geopolitical concerns and the Fed-ECB divergence. The latter has been exacerbated further following the latest rate hike by the Fed and the persevering hawkish message from Powell and the rest of his rate-setters peers.
Furthermore, the increasing speculation of a potential recession in the region - which looks propped up by dwindling sentiment gauges as well as an incipient slowdown in some fundamentals – adds to the sour sentiment around the euro
Key events in the euro area this week: EU Emergency Energy Meeting, EMU Flash Inflation Rate, Germany Unemployment Change/Unemployment Rate (Friday).
Eminent issues on the back boiler: Continuation of the ECB hiking cycle. Italian post-elections developments. Fragmentation risks amidst the ECB’s normalization of its monetary conditions. Impact of the war in Ukraine and the persistent energy crunch on the region’s growth prospects and inflation outlook.
EUR/USD levels to watch
So far, the pair is gaining 0.21% at 0.9836 and a break above 0.9853 (weekly high September 30) would target 1.0050 (weekly high September 20) en route to 1.0197 (monthly high September 12). On the flip side, the next support emerges at 0.9535 (2022 low September 28) ahead of 0.9411 (weekly low June 17 2002) and finally 0.9386 (weekly low June 10 2002).
The greenback came under heavy selling pressure and the US Dollar Index (DXY) corrected more deeply than analysts at ING thought. But any further losses as seen as corrective.
Quarter-end flows and position adjustments
“While the macro risks remain skewed for a stronger dollar, over the short term the dollar does look to be getting caught up with quarter-end re-balancing flows and the de-leveraging of tightly held positions – including long dollars. Our fear is that some disorderly moves in equity markets could prompt a little more of this position adjustment – even though the macro-driven dollar bull trend remains firmly in place.”
“Any further losses should be corrective (outside risk to 110?) and we would still favour 120 later in the year as the Fed tightens conditions still further.”
- GBP/USD gains traction for the fourth successive day and climbs to a one-week high on Friday.
- The BoE’s intervention in the markets, an upward revision of the UK GDP underpins sterling.
- Retreating US bond yields, a positive risk tone weighs on the USD and offers additional support.
The GBP/USD pair reverses an intraday dip to the 1.1070 area and climbs back closer to a one-week high touched earlier this Friday. The pair sticks to its positive bias for the fourth successive day, with bulls now awaiting a sustained move beyond the 1.1200 round-figure mark.
The Bank of England's intervention for the second day on Thursday restores stability in the UK debt market. Furthermore, an upward revision of the UK GDP print underpins the British pound and acts as a tailwind for the GBP/USD pair. The UK Office for National Statistics reported this Friday that the economy expanded by 0.2% during the second quarter against a modest 0.1% contraction estimates and eased recession fears.
The US dollar, on the other hand, languished near the weekly low and turns out to be another factor offering support to the GBP/USD pair. The spill-over effect of the UK central bank's move to calm the markets drags the benchmark 10-year US Treasury not away from a 12-year high touched earlier this week. Apart from this, a goodish recovery in the global risk sentiment is seen weighing on the safe-haven greenback.
With the latest leg up, the GBP/USD pair has now rallied over 850 pips from an all-time low set on Monday. It, however, remains to be seen if bulls can capitalize on the move amid worries that the new UK government's historic tax cuts could stretch Britain's finances to their limits. Furthermore, the fiscal package threatens to derail the BoE's efforts to contain inflation and create additional economic headwinds.
Nevertheless, the GBP/USD pair remains on track to snap a two-week losing streak. Traders now look forward to the US Personal Consumption Expenditures (PCE) - the Fed's preferred inflation gauge. The US economic docket also features the release of the Chicago PMI and the revised Michigan Consumer Sentiment Index, which might influence the USD and provide some impetus to the GBP/USD pair later during the early North American session.
Technical levels to watch
Sustainable gains in USD/JPY need to leave behind the 145.00 yardstick in the next weeks, comment FX Strategists at UOB Group Lee Sue Ann and Quek Ser Leang.
Key Quotes
24-hour view: “We highlighted yesterday that ‘the current price movement is likely part of a consolidation phase’ and we expected USD to ‘trade sideways between 143.70 and 144.70’. Our view of sideway-trading was not wrong even though USD traded within a narrower range than expected (144.04/144.79). Further sideway-trading appears likely, expected to be within a range of 144.00 and 145.00.”
Next 1-3 weeks: “Two days ago (27 Sep, spot at 144.30), we noted that upward momentum is building but USD has to close above 145.00 before a sustained advance is likely. While USD traded in a quiet manner the past couple of days, the underlying tone still appears to be firmed. That said, unless USD breaks above 145.00 within these 1 to 2 days, the build-up in momentum would fizzed out. Overall, only a break of 143.40 (no change in ‘strong support’ level from yesterday) would indicate that the risk of USD closing above 145.00 has subsided.”
Economists at Bank of America Global Research make a round of G10 FX revisions into Q4. The EUR/USD and GBP/USD are now forecast at 0.95 and 1.00 by year-end, respectively.
USD to stay at multi-decade highs for the near and medium-term
“We adjust our G10 FX forecasts, led by shifting lower our EUR/USD profile with a 0.95 target for the end of the year.”
“We now look for GBP/USD to move towards parity at the end of the year.”
“Even though we do not look for a new multi-year secular trend to the upside, the dollar is likely to stay at multi-decade highs for the near and medium-term, as per our forecasts."
- Unemployment Rate in Germany held steady at 5.5% in September.
- EUR/USD trades in positive territory above 0.9800 after the data.
The data published by Destatis showed on Friday that the Unemployment Rate in Germany stayed unchanged at 5.5% in September as expected.
Further details of the report revealed that the Unemployment Change was up 14K in the same period, down from 28K in August and below the market consensus of 20K.
Market reaction
The EUR/USD pair preserves its bullish momentum after these data and was last seen trading at 0.9843, where it was up 0.3% on a daily basis.
- The index reclaims some ground lost around 112.00 on Friday.
- US yields come under pressure and reverse Thursday’s advance.
- US inflation figures tracked by the PCE comes next in the docket.
The USD Index (DXY), which measures the greenback vs. a basket of its main rival currencies, looks to leave behind recent weakness and reclaims the 112.00 neighbourhood at the end of the week.
USD Index now looks to data
Following two consecutive sessions with strong losses, the index now manages to regain some buying interest and flirt with the 112.00 zone on Friday amidst a corrective decline in US yields and some loss of momentum in the risk complex.
Lower US yields across the curve also accompany the daily rebound in the greenback, while the hawkish rhetoric around the ongoing normalization process by the Federal Reserve remain unchanged, although it appears more and more priced in by market participants.
In the US data space, all the attention is expected to be on the inflation figures gauged by the PCE, seconded by Personal Income/Spending and the final Michigan Consumer Sentiment for the month of September.
In addition, Richmond Fed T.Barkin (2024 voter, centrist), Vice Chair L.Brainard (permanent voter, dove), Cleveland Fed L.Mester (voter, hawk), NY Fed J.Williams (permanent voter, centrist) and FOMC M.Bowman (permanent voter, centrist) are all due to speak later in the session.
What to look for around USD
Bears appear in control of the sentiment surrounding the dollar so far this week, dragging the index back below the 112.00 mark, where some contention seems to have emerged.
Propping up the dollar’s underlying positive stance appears the firmer conviction of the Federal Reserve to keep hiking rates until inflation looks well under control regardless of a likely slowdown in the economic activity and some loss of momentum in the labour market.
Looking at the more macro scenario, the greenback also appears bolstered by the Fed’s divergence vs. most of its G10 peers in combination with bouts of geopolitical effervescence and occasional re-emergence of risk aversion.
Key events in the US this week: PCE/Core PCE, Personal Income/Spending. Final Michigan Consumer Sentiment (Friday).
Eminent issues on the back boiler: Hard/soft/softish? landing of the US economy. Prospects for further rate hikes by the Federal Reserve vs. speculation over a recession in the next months. Geopolitical effervescence vs. Russia and China. US-China persistent trade conflict.
USD Index relevant levels
Now, the index is advancing 0.06% at 111.82 and a breakout of 114.76 (2022 high September 28) would expose 115.00 (round level) and then 115.32 (May 2002 high). On the downside, the next contention aligns at 109.35 (weekly low September 20) seconded by 107.68 (monthly low September 13) and finally 107.58 (weekly low August 26).
One week realised GBP/USD volatility is now 34%. Therefore, the GBP/USD could slump to the 1.07/08 area later in the day, economists at ING report.
400 pip ranges now the norm for cable
“Today the focus is on the PM and Chancellor meeting the Office for Budget Responsibility (OBR) to discuss spending plans. While the involvement of the OBR will be welcomed by the markets, the government still has to find a way to balance the books and avoid a very negative assessment from the rating agencies – two of which provide UK sovereign rating outlooks on 21 October.”
“A Conservative party conference this weekend suggests it is far too early for a U-turn on fiscal policy and, combined with a very difficult external environment, sterling should stay vulnerable.”
“4 big figure ranges could easily put cable back at 1.07/1.08 later today!”
- USD/JPY continues with its struggle to gain any meaningful traction on the last day of the week.
- Retreating US bond yields drags the USD to the weekly low and acts as a headwind for the pair.
- The Fed-BoJ policy divergence continues to lend support to the major and favours bullish traders.
The USD/JPY pair prolongs its consolidative price move on Friday and remains confined in a four-day-old trading range through the early European session. The pair is currently placed just below mid-144.00s, down less than 0.10% for the day, and is influenced by a combination of diverging forces.
The US dollar surrenders its modest intraday gains and languishes near the weekly low amid a further pullback in the US Treasury bond yields, which, in turn, acts as a headwind for the USD/JPY pair. The UK debt market seems to have stabilized following the Bank of England's intervention for the second day on Thursday. The spillover effect drags the benchmark 10-year US Treasury note away from a 12-year high set earlier this week and weighs on the greenback.
The Japanese yen, on the other hand, draws support from mostly upbeat macro releases. In fact, official data showed that Industrial Production rose 2.7% in August from the prior month, surpassing estimates. A separate reading revealed that Japanese retail sales grew more than anticipated during the reported month. Furthermore, the unemployment in Japan edged down to 2.5% from the 2.6% previous, matching expectations and underpinning the domestic currency.
That said, a modest recovery in the risk sentiment - as depicted by a turnaround in the US equity futures - acts as a headwind for the safe-haven JPY. This, along with a big divergence in the monetary policy stance adopted by the Bank of Japan (dovish) and other major central banks, including the Federal Reserve, supports prospects for the emergence of fresh buying around the USD/JPY pair. Hence, any downtick could still be seen as a buying opportunity.
Market participants now look forward to the release of the Fed's preferred inflation gauge - the US Personal Consumption Expenditures (PCE). Friday's US economic docket also features the Chicago PMI and revised Michigan Consumer Sentiment Index. This, along with the US bond yields, will influence the USD price dynamics and provide a fresh impetus to the USD/JPY pair.
Technical levels to watch
In the opinion of FX Strategists at UOB Group Lee Sue Ann and Quek Ser Leang, chances for a deeper retracement in AUD/USD appears to be dwndling.
Key Quotes
24-hour view: “We expected AUD to ‘trade between 0.6420 and 0.6540’ yesterday. AUD subsequently traded within a narrower range than expected (0.6436/0.6524). The price actions still appear to be part of a consolidation and we expect AUD to trade within a 0.6440/0.6540 range for today.”
Next 1-3 weeks: “Our update from yesterday (29 Sep, spot at 0.6490) still stands. As highlighted, downward momentum is beginning to wane and this coupled with the strong bounce from the low of 0.6364 suggests the weakness in AUD could stabilize soon. All in, only a break of 0.6555 (no change in ‘strong resistance’ level from yesterday) would indicate AUD is unlikely to weaken further.”
- Gold price grinds higher during four-day uptrend, eyes first weekly gain in three.
- DXY pullback, quarter-end positioning favor XAU/USD buyers despite fears of recession.
- Failure to cross the $1,680 hurdle, backed by upbeat US Core PCE Inflation, could recall gold sellers.
Gold price (XAU/USD) remains on the front foot for the fourth consecutive day while cheering the pullback in the US dollar. That said, the quarter positioning and hopes of stimulus from China, Japan and the UK, are some extra catalysts that could have underpinned the yellow metal corrective bounce off the yearly low, teasing $1,667 by the press time.
However, the firmer yields and fears of global economic slowdown, not to forget the geopolitical woes surrounding Russia and China, keeps XAU/USD buyers on dicey grounds. Furthermore, upbeat US data and hawkish central banks are likely to keep the metal prices down. As a result, today’s US Core Personal Consumption Expenditure (PCE) Price Index for August, expected 4.7% YoY versus 4.6% prior, mostly known as the Fed’s preferred inflation gauge, will be important for clear directions.
Also read: Gold Price Forecast: XAU/USD needs to make it through $1,674-75 hurdle to confirm a bottom
Gold Price: Key levels to watch
The Technical Confluence Detector shows that the gold price approaches short-term key hurdles to the north while staying beyond the $1,660-58 strong support zone, comprising Fibonacci 38.2% on one week and SMA10 on one day.
That said, the $1,671 level comprising the Pivot Point one day R1 and Fibonacci 61.8% on weekly, appears immediate challenge for the XAU/USD buyers.
Following that, multiple levels between $1,678-80 could test the metal buyers. The resistance zone includes the previous yearly bottom, SMA100 on 4H, Pivot Point one week R1 and Pivot Point one month S1.
In a case where the gold price rally beyond $1,680, the bulls can aim for the $1,700 threshold.
On the flip side, a sustained trading below $1,658 becomes necessary to recall the gold sellers.
Failing to do so can quickly fetch the quote to $1,650 support, SMA50 one hour and 23.6% on one week.
If at all the XAU/USD prices remain weak past $1,650, the $1,645 level encompassing Pivot Point one-month S2 could act as the last defense of the buyers.
Here is how it looks on the tool
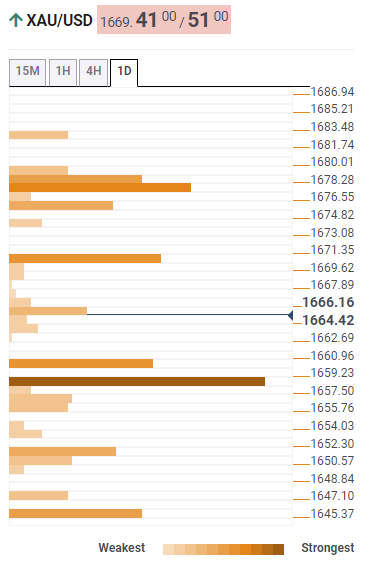
About Technical Confluences Detector
The TCD (Technical Confluences Detector) is a tool to locate and point out those price levels where there is a congestion of indicators, moving averages, Fibonacci levels, Pivot Points, etc. If you are a short-term trader, you will find entry points for counter-trend strategies and hunt a few points at a time. If you are a medium-to-long-term trader, this tool will allow you to know in advance the price levels where a medium-to-long-term trend may stop and rest, where to unwind positions, or where to increase your position size.
EUR/USD has bounced over the last hours. However, economists at ING expect the pair to face stubborn resistance around the 0.9850/70 area and move back lower towards 0.95.
Noisier period for FX
“0.9850/0.9870 may prove intra-day resistance for EUR/USD – but high volatility and tighter liquidity mean that we're in a noisier period for FX.”
“Ultimately, however, we think the pressure remains for EUR/USD to break below 0.95 later in the year.”
- NZD/USD struggles to capitalize on its early modest uptick to a one-week high.
- Recession fears weigh on investors’ sentiment and act as a headwind for the pair.
- The emergence of some USD dip-buying further contributes to capping the upside.
The NZD/USD pair retreats a few pips from the weekly high touched earlier this Friday and is currently placed near the lower end of its daily trading range, just above the 0.5700 mark.
The prevalent risk-off environment - as depicted by a generally weaker tone around the equity markets - turns out to be a key factor acting as a headwind for the risk-sensitive kiwi. Apart from this, the emergence of some US dollar buying caps the NZD/USD pair's modest uptick to the mid-0.5700s.
The prospects for a more aggressive policy tightening by global central banks, along with the risk of a further escalation in the Russia-Ukraine conflict, have been fueling recession fears. Mixed business activity data from China adds to the concerns and tempers investors' appetite for riskier assets.
In fact, the official Chinese PMI released this Friday showed that the country’s manufacturing sector unexpectedly expanded in September. The private survey, however, revealed that the downfall in the manufacturing sector deepened during the reported month amid headwinds from COVID lockdowns.
Apart from the anti-risk flow, elevated US Treasury bond yields help revive the USD demand and further contribute to keeping a lid on the NZD/USD pair. The recent hawkish comments by several FOMC members reinforced expectations that the Fed will hike rates at a faster pace to curb inflation.
This, in turn, lifts the yields on the benchmark 10-year US government bond to inch closer to a 12-year high and favours the USD bulls. The fundamental backdrop warrants some caution before positioning for an extension of the NZD/USD pair's recovery move from its lowest level since March 2020.
Market participants now look to the US Personal Consumption Expenditures (PCE) - the Fed's preferred inflation gauge, due later during the early North American session. The US economic docket also features the release of the Chicago PMI and revised Michigan Consumer Sentiment Index.
This, along with speeches by influential FOMC members and the US bond yields, will drive the USD demand and provide some impetus to the NZD/USD pair. Traders will further take cues from the broader market risk sentiment to grab short-term opportunities on the last day of the week.
Technical levels to watch
Here is what you need to know on Friday, September 30:
The greenback came under heavy selling pressure and the US Dollar Index (DXY) closed the second straight day in negative territory, losing over 2% in that period. Markets stay relatively quiet early Friday as investors await the HICP inflation data from the euro area and the Personal Consumption Expenditures (PCE) Price Index figures from the US. Ahead of the weekend, the University of Michigan (UoM) will release the final version of its Consumer Sentiment Index for September. On the last trading day of the third quarter, position readjustments and profit taking could ramp up the market volatility in the second half of the day.
Earlier in the day, the data from China showed that the NBS Manufacturing PMI recovered slightly above 50 in September and the Non-Manufacturing PMI edged lower to 50.6 from 52.6 in August. The Shanghai Composite Index failed to stage a rebound after these data and closed in negative territory.
Meanwhile, the market mood remains cautious ahead of the above-mentioned data releases. US stock index futures trade mixed and the 10-year US Treasury bond yield fluctuates in a tight range above 3.7%. The DXY stays in positive territory slightly above 112.00.
EUR/USD climbed to a fresh weekly high above 0.9830 early Friday but lost its bullish momentum. The pair was last seen posting small daily losses at around 0.9800. Annual HICP inflation in the euro area is expected to rise to 9.7% in September from 9.1% in August. On Thursday, Germany's Destatis reported that the annual Consumer Price Index jumped to 10% in September, surpassing the market expectation of 9.4%.
GBP/USD continued to gather bullish momentum on Thursday and gained more than 200 pips. The UK's Office for National Statistics announced on Friday that the Gross Domestic Product expanded by 4.4% on a yearly basis in the second quarter, surpassing the market expectation of 2.9% by a wide margin.
USD/JPY extended its sideways grind below 145.00 for the third straight day on Thursday. The pair stays directionless in its weekly range early Friday. The data from Japan revealed that the Consumer Confidence Index declined to 30.8 in September from 32.5 in August but this print failed to trigger a noticeable market reaction.
Gold capitalized on falling US Treasury bond yields and advanced to the $1,670 region in the early European session on Friday.
Bitcoin managed to stage a modest rebound on Thursday but lost its momentum before testing $20,000. Ethereum continues to move up and down in a narrow band at around $1,300 on Friday.
Following the recent market turbulence, strategists at Commerzbank have notably adjusted their projections for sterling. They believe that cable could fall close to parity while EUR/GBP may reach 0.94 by year-end.
Potential for a moderate sterling recovery over the course of 2023
“We expect sterling to remain under depreciation pressure. The Bank of England will probably continue to balk at a more aggressive pace for its rate hikes due to the economic cooling, thus disappointing the market in its rate hike expectations. That will likely put short-term pressure on sterling, and we can imagine significantly higher EUR/GBP levels now.”
“However, we cannot imagine that government and central bank would sit back and just watch a further collapse of sterling. We assume that they will try and regain at least some market confidence. As the situation in connection with the energy crisis is likely to improve next year and as this factor is likely to be priced out, we see potential for a moderate sterling recovery over the course of next year.”
“In the short-term, the projections are subject to high uncertainty as it is difficult to predict what decisions government and BoE will take over the coming weeks.”
 Source: Commerzbank Research
Economists at Commerzbank have adjusted their projections for EUR/USD. The pair is now expected to trade at 0.95 by the end of the year.
EUR/USD to recover towards 1.05 by end-2023
“The downside risks in EUR/USD have risen as a result of the energy crisis and the expected recession. As a result, we have lowered our year-end projections from 0.98 to 0.95.”
“We continue to expect a recovery in EUR/USD next year but from a lower level. The energy crisis is likely to be priced out and the economic outlook for the eurozone is likely to improve. Moreover, we expect that the US central bank will lower its key rate towards year-end 2023 due to the recession of the US economy.”
“We expect levels of 1.05 in EUR/USD towards year-end 2023.”
The US dollar remains at high levels. Economists at Commerzbank expect the greenback to enjoy further gains ahead.
There is no avoiding the dollar
“The dollar is being supported by unshakable confidence in the Fed’s rate hike cycle and the surprisingly robust economic environment. Today’s data on personal spending and above all the labour market report next week are likely to confirm that.”
“If the economy were to cool and the labour market turn though, there would soon be criticism of the Fed’s tight monetary policy and the strong dollar. We have not reached that point yet.”
“In view of the enormous uncertainty about the exact effects of the energy crisis on Europe over the coming months, the lower end in EUR/USD seems much more attractive for now.”
NZD/USD is a tad higher. Economists at ANZ Bank expect the pair to remain at the mercy of external forces until the Reserve Bank of New Zealand (RBNZ) meeting next week.
Nothing local is really driving the kiwi at the moment
“Nothing local is really driving the kiwi at the moment, and instead it’s drifting like a cork in the tide. That’s unlikely to change today either, but next week’s RBNZ MPR may provide a degree of support, especially if the RBNZ remain hawkish, which is appropriate given the inflation backdrop. But until then, the NZD is at the mercy of global forces.”
“The pull-back in the USD DXY looks a bit odd against geopolitical developments in Ukraine, given the strength of US jobless claims (pointing to bumper payrolls next week), hawkish Fedspeak, and the very real cracks in the UK that can’t be papered over.”
“Support 0.4895/0.5470/0.5565 Resistance 0.6160/0.6400.”
- GBP/JPY picks up bids during the four-day uptrend after final prints of UK Q2 GDP.
- UK Q2 GDP improved to 0.2% QoQ, 4.4% YoY, Current Account deficit shrank as well.
- Yields cheer recession woes, hawkish bias of the major central banks.
- Risk catalysts eyed for further directions, bulls need validation from UK headlines, technicals.
GBP/JPY fails to cheer upbeat UK data as it fades the upside momentum, declining to 160.85 on early Friday morning in London. In doing so, the cross-currency pair also ignores firmer US Treasury yields. The reason could be linked to Japan’s stimulus and the market’s cautious mood.
UK’s final reading of the second quarter (Q2) Gross Domestic Product (GDP) GDP improved to 0.2% QoQ versus -0.1% previous forecasts while the YoY figures increased to 4.4% versus 2.9% prior estimations. Further details suggest that the UK’s Q2 Current Account deficit eased to £-33.768B compared to £-43.8B market forecasts and £-43.875B prior (revised from £-51.3B).
It should be observed that the US 10-year Treasury yields remain firmer around 3.80% during the seven-week uptrend despite reversing from the 12-year on Wednesday.
Behind the firmer yields could be the fears surrounding global recession and the hawkish commentary from the key central banks, including the Federal Reserve, the Bank of England (BOE) and the European Central Bank (ECB), despite the recently downbeat economics and supply crunch fears. Additionally, the chatters over China’s inability to tame recession woes and the UK’s fears of more economic pain due to the latest fiscal policies should have favored the US Treasury yields.
Other than the aforementioned catalysts, headlines suggesting more stimulus from Japan, as signaled by Japanese Chief Cabinet Secretary Hirokazu Matsuno earlier in the day, as well as the upbeat Japan data. That said, Japan reported a decline in the Unemployment Rate to 2.5% in August while Industrial Production reversed the previous contraction of 2.0% with 5.1% YoY growth. Further, Retail Trade also improved to 4.1% YoY compared to 2.8% expected and 2.4% prior.
Looking forward, GBP/JPY traders should pay attention to the risk catalysts, namely the updates surrounding economic transition, the central banks’ moves and the ones from Russia, for clear directions. That said, the yields are likely to keep the pair buyers hopeful should the British policymakers manage to convince markets of their capacity to revive the UK economy.
Technical analysis
A daily closing beyond the 200-SMA, around 160.45 by the press time, enables the GBP/JPY pair to poke the 162.10 hurdle comprising a 13-day-old resistance line and the 21-DMA. That said, the receding bearish bias of the MACD and recently firmer RSI (14) also favor buyers.
The euro was able to appreciate during the course of the trading day. In the view of economists at Commerzbank, the recovery is not sustainable.
Doves might sound more cautious again
“Inflation and above all core inflation is likely to remain at high levels thus requiring further aggressive monetary policy tightening. The uncertainty of whether the ECB would be willing to do that is likely to put pressure on the euro over the coming weeks.”
“If the ECB has to retract its comparatively optimistic economic projections as signs of a recession rise, the doves on the board might sound more cautious again.”
“The recovery in EUR/USD seen over the past days is unlikely to be sustainable. We see the risk of the market being disappointed in its expectations of the ECB with this being reflected in falling EUR levels.”
Considering advanced prints from CME Group for natural gas futures markets, open interest rose for the second session in a row on Thursday, this time by around 4.6K contracts. In the opposite direction, volume went down for the second consecutive session, now by around 53.7K contracts.
Natural Gas remains propped up by the 200-day SMA
Natural gas prices traded on the defensive on Thursday amidst a volatile session and against the backdrop of rising open interest. That said, further consolidation still appears on the card, while the downside looks supported by the 200-day SMA near $6.50 per MMBtu.
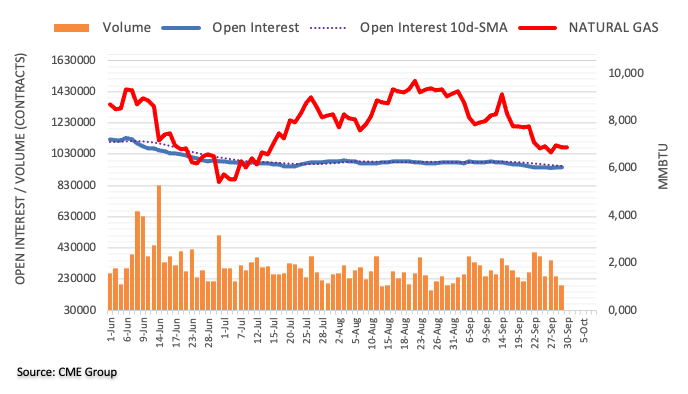
- GBP/USD has not displayed a sheer response to the upbeat UK GDP data.
- The UK economy has delivered a growth rate of 0.2% and 4.4% on a monthly and annual basis.
- The DXY has surrendered the critical support of 112.00 amid improved risk appetite.
The GBP/USD pair has slipped below the immediate support of 1.1150 despite upbeat UK Gross Domestic Product (GDP) data. The UK National Statistics has reported the economic activities in the UK economy have grown by 0.2% against the expectation of a decline of 0.1% on a quarterly basis. Also, the annual data has improved dramatically to 4.4% vs. the projections and the prior release of 2.9%.
The cable is auctioning in a positive trajectory despite a surprise announcement of the bond-purchase program by the Bank of England (BOE). A 13-day bond-buying program has been announced in which the BOE will purchase GBP 5 billion worth of long-dated bonds each day. At times, when the BOE is dedicated to bringing price stability, liquidity infusion could offset the impact of accelerating interest rates to some extent.
The US dollar index (DXY) witnessed a steep fall this week after soaring expectations of a slowdown in the current pace of hiking interest rates sooner. It is worth noting that Fed’s interest rate peak is not far from current interest rates at 3.-3.325% after a scrutiny of the ongoing velocity of hiking interest rates. The Fed is expected to maintain the terminal rate at 4.6% for a longer period as discussed in the reported economic projections till it find a slowdown in the price pressures for several months.
In September, the market reaction towards the higher-than-expected headline Consumer Price Index (CPI) and core CPI, despite falling gasoline prices, was extremely risk-averse. In retaliation to that, the Fed has announced a rate hike by 75 basis points (bps). Therefore, the impact of Friday’s US Personal Consumption Expenditure (PCE) is expected to remain muted. As per the consensus, the core PCE index is seen 10 bps higher at 4.7% than the prior release.
Gold struggles to capitalize on its goodish rebound from more than a two-year low touched earlier this week. XAU/USD needs to make it through $1,674-75 hurdle to confirm a bottom, FXStreet’s Haresh Menghani reports.
Any meaningful pullback might continue to find decent support around $1,645-$1,643
“Gold might accelerate the momentum towards the $1,674-$1,675 supply zone. The latter also marks a confluence hurdle, comprising the 50% Fibo. level and the 100-period SMA on the 4-hour chart. Sustained strength beyond could trigger a short-covering move and allow bulls to aim back to reclaim the $1,700 round-figure mark.”
“Any meaningful pullback might continue to find decent support near the overnight swing low, around the $1,645-$1,643 region, which coincides with the 23.6% Fibo. level. The next relevant support is pegged near the $1,620-$1,615 region, or the YTD low. Some follow-through selling will be seen as a fresh trigger for bearish traders and drag gold towards the $1,600-$1,590 area.”
- USD/CAD has surrendered the immediate support of 1.3700 as the DXY has eased off its intraday gains.
- The impact of US PCE is expected to remain weak as the market has already reacted to standard CPI data.
- Along with the weaker DXY, Canadian dollar is also fragile, which is supporting the asset on a broader basis.
The USD/CAD pair has witnessed a mild correction after hitting a day’s high of around 1.3724 in the early European session. On a broader note, the asset is displaying topsy-turvy moves in a 1.3656-1.3756 range after a pullback move from 1.3600. The asset has not reached much, like the other pairs, to the sheer weakness in the US dollar index (DXY), which indicates that the Canadian dollar is extremely fragile.
Meanwhile, the US dollar index (DXY) has surrendered the critical support of 112.00 and is declining sharply to test the intraday low at 111.73. The DXY is declining despite the higher consensus for the US Personal Consumption Expenditure (PCE) price index data.
As per the estimates, the headline PCE inflation will advance to 6.6% from the prior release of 6.3%, despite a sheer decline in gasoline prices. Also, the core PCE is seen higher at 4.7% vs. the prior release of 4.6%. That could be the case of rising interest rates’ consequences as corporate is passing on the impact of a higher cost of capital to the final consumers.
The impact of PCE data is expected to remain weak as the market participants have already reacted to September’s Consumer Price Index (CPI) data, therefore its impact seems less reactive.
Apart from that, the US Michigan Consumer Sentiment Index (CSI) data will be of utmost importance. The sentiment data is seen as stable at 58.5.
On the loonie front, upbeat monthly Gross Domestic Product (GDP) data has failed to support the loonie bulls. The Canadian economy has grown by 0.1% vs. the de-growth of 0.1%.
UK’s final reading of the second quarter (Q2) Gross Domestic Product (GDP) offered a positive surprise on early Friday.
That said, the Q2 GDP improved to 0.2% QoQ versus -0.1% previous forecasts while the YoY figures increased to 4.4% versus 2.9% prior estimations.
Further details suggest that the UK’s Q2 Current Account deficit eased to £-33.768B compared to £-43.8B market forecasts and £-43.875B prior (revised from £-51.3B).
GBP/USD fails to cheer upbeat data
GBP/USD pares intraday gains after the upbeat UK data. That said, the cable pair drops to 1.1132 by the press time, up 0.13% on a day.
Also read: GBP/USD Price Analysis: Teases sellers above 1.1055 support, US PCE Inflation, UK GDP eyed
CME Group’s flash data for crude oil futures markets noted traders reduced their open interest positions for the fourth consecutive session on Thursday, this time by around 5.5K contracts. Volume followed suit and reversed two straight builds and shrank by around 184.3K contracts.
WTI could retest monthly lows near $76.00
Prices of the barrel of WTI charted and inconclusive session on Thursday. The move was on the back of declining open interest and volume and exposes some lack of direction in the very near term, while the resumption of the previous downtrend should not be ruled out. Against that, another visit to the September low at $76.28 (September 26) remains in the pipeline.
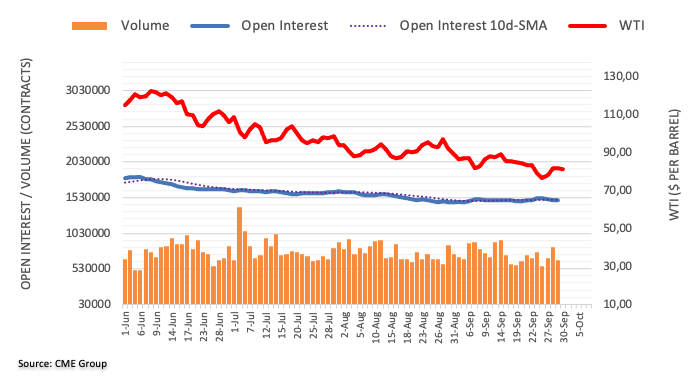
- USD/CHF pauses three-day downtrend near the fortnight-old support line.
- Bearish MACD signals join immediate resistance line to keep sellers hopeful.
- 100-SMA’s clear downside break of 200-SMA could reject short-term bullish bias.
USD/CHF pokes a two-week-old support line on its way to post the first weekly loss in three, pressured near 0.9760 heading into Friday’s European session.
It’s worth noting that the bearish MACD signals and an impending bear cross between the 100-SMA and the 200-SMA favor the pair sellers of late. That said, the bear cross is a moving average crossover that suggests further downside when short-term SMA dips beneath the longer-term moving average.
However, a clear downside break of the aforementioned support line, at 0.9745 by the press time, becomes necessary for the USD/CHF bears to keep the reins. Even so, the convergence of the stated SMAs could test the downside move near 0.9700 before giving control to the sellers.
On the flip side, a downward slopping resistance line from Wednesday, close to 0.9800 by the press time, guards the quote’s immediate recovery.
Following that, the early September peak surrounding 0.9870 could challenge the USD/CHF bulls before directing them to the monthly high of 0.9965.
In a case where the pair buyers stay hopeful past 0.9965, the 1.0000 psychological magnet will be in focus.
USD/CHF: Four-hour chart
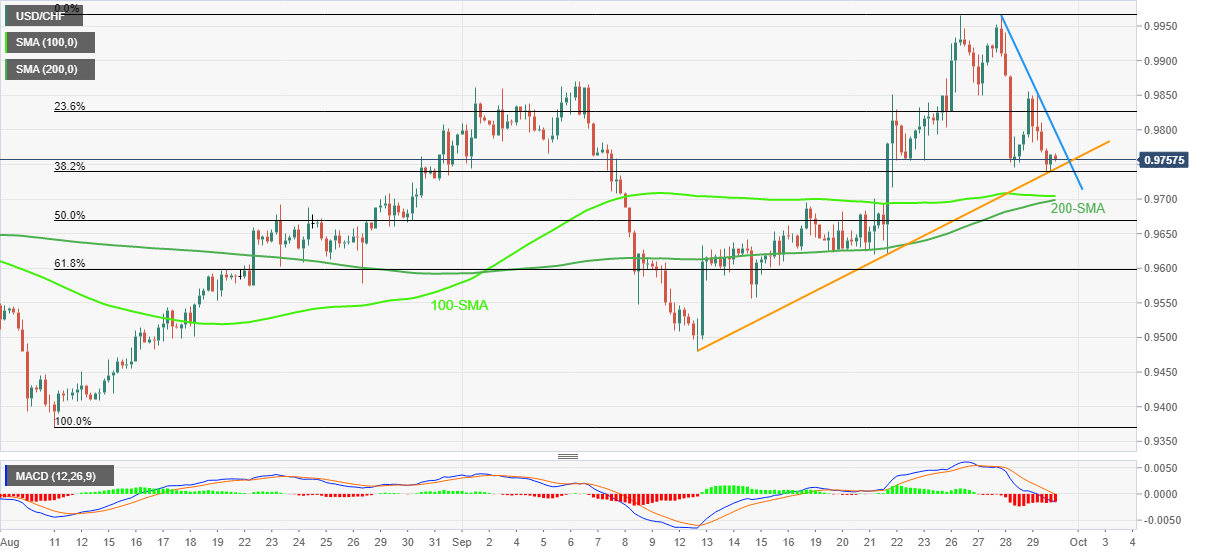
Trend: Further weakness expected
Further upside in GBP/USD looks on the cards, although another visit to 1.1300 seems out of favour for the time being, suggest FX Strategists at UOB Group Lee Sue Ann and Quek Ser Leang.
Key Quotes
24-hour view: “The strong surge in GBP came as a surprise (we were expecting range-trading). GBP closed on a strong note at 1.1119 (+2.13%) and continues to advance in early Asian trade. The rapidly improving upward momentum suggests GBP could continue to rise. That said, conditions are overbought and a break of 1.1300 is unlikely (there is another resistance at 1.1250). On the downside, a breach of 1.1050 (minor support is at 1.1100) would indicate that the current upward pressure has subsided.”
Next 1-3 weeks: “Yesterday (29 Sep, spot at 1.0825), we noted downward momentum has waned and we were of the view that the probability of GBP dropping to 1.0000 has diminished considerably. That said, we did not quite expect the strong surge as GBP soared by 2.13% and closed at 1.1119 in NY. The breach of our ‘strong resistance’ level 1.1000 indicates that the weakness in GBP from more than 2 weeks ago (see annotations in the chart below) has bottomed for now. The current strong rebound has scope to extend but at this stage, the resistance at 1.1300 is unlikely to come under challenge. Overall, only a breach of 1.0800 (‘strong support’ level) would indicate that the rapid build-up in short-term momentum has eased.”
Open interest in gold futures markets resumed the downside and shrank by around 3.2K contracts on Thursday, according to preliminary readings from CME Group. In the same line, volume dropped by around 90.3K contracts, offsetting the previous day’s build.
Gold: Upside looks capped by $1,688
Thursday’s small uptick in prices of the ounce troy of gold was accompanied by shrinking open interest and volume, opening the door to some corrective move in the very near term. In the meantime, the weekly high at $1,688 (September 21) continue to cap the upside for the time being.
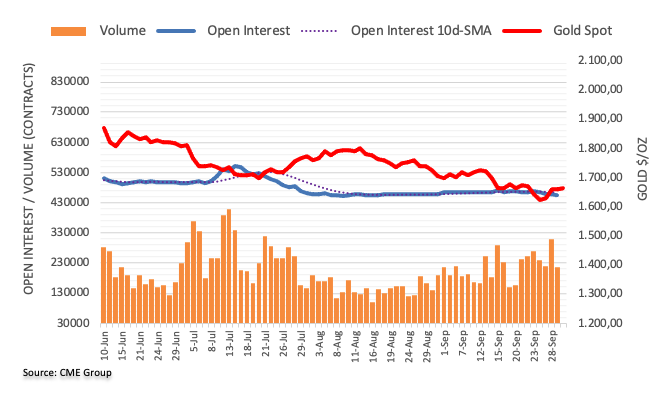
- USD/IDR is advancing towards $15,300 as BI’s hawkish policy has failed to support the Indonesian Rupiah.
- Economists believe that BI’s hawkish policy and modest intervention will settle it around $15,000.
- DXY’s investors are awaiting the release of the US PCE and Michigan CSI data.
The USD/IDR pair is attempting to overstep the critical hurdle of $15,275 in the Tokyo session. The asset is extremely bullish despite the meaningful correction in the US dollar index (DXY), which has already dragged the asset to near 112.00. The major is aiming to hit the ultimate target of $15,300 sooner despite the tailwinds of soaring interest rates by the Bank of Indonesia (BI).
In September’s monetary policy meeting, BI Governor Perry Warjiyo hiked the interest rates by 50 basis points (bps). The focus of the BI is to bring stabilization in the Indonesian Rupiah in the ongoing volatile environment.
Economists at ANZ Bank forecast USD/IDR at 15,000 by the end of the year and expect the policy rate to peak at 5.75% in Q2 2023. A modest intervention in the currency markets by the BI has managed to bring some stability to the Indonesian Rupiah.
Meanwhile, Edi Susianto, head of BI's monetary management department, told that the central bank would prioritize policies, which should support the market mechanism. He further cited that the BI has no need for capital controls, as reported by Reuters.
On the US dollar index (DXY) front, the DXY is likely to remain on the tenterhooks ahead of the release of the US Personal Consumption Expenditure (PCE) data. The economic data is seen higher at 4.7%, 10 bps above the prior release. Apart from that, US Michigan Consumer Sentiment Index (CSI) data will also remain in focus. The sentiment data is expected to remain steady at 58.5.
EUR/USD grinds lower around the intraday bottom of 0.9800 while staying on the way to posting the first weekly gain in three. Even so, the major currency pair prints a four-month downtrend heading into Friday’s European session.
That said, the market’s fears of recession and the central banks’ aggression might have favored the medium-term bears. However, the cautionary mood ahead of the key US/EU inflation data joins the quarter-end positioning to offer the latest gains.
Also read: EUR/USD pares first weekly gain in three around 0.9800 ahead of EU/US inflation data
It should be noted that the one-month risk reversal (RR) on the Euro, a gauge of calls to puts, prints the biggest daily figure in two weeks with the latest daily RR number of 0.165, per the latest data provided by Reuters. However, the weekly figure is still in the red while flashing the second negative print of -0.290 by the press time.
Furthermore, the monthly and quarterly RR numbers are also in favor of the EUR/USD sellers while registering -0.370 and -0.170 levels, per Reuters.
Given the broadly bearish bias of the options market, the EUR/USD prices are likely to fade from the recent corrective bounce off the 20-year low.
FX Strategists at UOB Group Lee Sue Ann and Quek Ser Leang note EUR/USD is now expected to navigate within 0.9630 and 0.9950 in the next few weeks.
Key Quotes
24-hour view: “We expected EUR to ‘trade sideways between 0.9620 and 0.9750’ yesterday. Our view was incorrect as EUR dropped to 0.9634 before surging higher to close at 0.9814 (+0.82%). EUR extended its advance in early Asian trade. The rapidly improving upward momentum is likely to lead to further advance to 0.9880 before a pullback is likely. The next resistance at 0.9950 is unlikely to come into view. On the downside, a breach of 0.9740 (minor support is at 0.9780) would indicate that the current upward pressure has eased.”
Next 1-3 weeks: “We have held a negative EUR view for more than 2 weeks now. After EUR dropped to 0.9530 and rebounded strongly, we indicated yesterday (29 Sep, spot at 0.9705) that ‘there is still a slim chance for EUR to drop to 0.9500’. EUR subsequently soared and took out our ‘strong resistance’ level at 0.9750. The breach of the ‘strong resistance’ level indicates that the USD weakness has stabilized. EUR appears to have moved into a consolidation phase and is likely to trade between 0.9630 and 0.9950 for now.”
- Asia-Pacific shares eye the biggest monthly drop since March 2020.
- Fears of economic slowdown, hawkish central bank weighs on equities.
- Recent data from China, Japan fail to impress traders amid pre-inflation release anxiety in the market.
Asia-Pacific stocks remain pressured heading into the last European trading day of the worst month in 2.5 years. The region’s equities brace for the biggest monthly loss since March 2020 as traders fear grim conditions ahead, mainly due to the fears of higher rates and a lack of economic optimism.
While portraying the mood, the MSCI’s index of Asia-Pacific shares outside Japan drop near 12.5% in a month to print the biggest monthly loss since March 2020, up 0.20% intraday. That said, Japan’s Nikkei dropped 2.15% on a day despite firmer activity data from Japan and stimulus hopes.
Further, equities from China, Australia and New Zealand were in the red as the dragon nation flashed mixed activity data while also raising doubts on the Chinese authorities’ market interventions. Elsewhere, Hong Kong shares were likely heading for their worst quarter since 2001 and Chinese blue-chips might also finish September by recording their biggest quarterly loss since a stock market meltdown in 2015, per Reuters.
It’s worth noting that South Korea’s KOSPI and Indonesia’s IDX Composite print mild losses as India announced less than feared rate hikes.
On a different page, gold prices grind higher while the US Dollar Index (DXY) trace yields to defend buyers, despite bracing for the first weekly loss in three. Additionally, WTI crude oil stays ready to snap a four-week downtrend, retreating of late.
Moving on, the Fed’s preferred inflation gauge, namely the Core Personal Consumption Expenditure (PCE) Price Index for August, expected 4.7% YoY versus 4.6% prior, appears crucial for the market players for short-term directions. Also important will be the Eurozone HICPI and CPI details for September. Above all, risk catalysts will be crucial for near-term directions as firmer inflation data could weigh on the equities and roil the mood.
- AUD/USD has fallen below 0.6500, however, the upside remains favored.
- The RBA is expected to sound mildly hawkish as the optimal terminal rate is not so far.
- US core PCE price index is likely to land 10 bps higher at 4.7%.
The AUD/USD pair has slipped below the psychological support of 0.6500 after failing to test Thursday’s high at 0.6525. The decline in the asset is gradual as the upside bias is intact and amid an overall weakness in the US dollar index (DXY). In the Asian session, the DXY attempted to defend the establishment below 112.00, which resulted in a minor correction in the antipodean.
A lackluster performance is highly expected from the asset as investors are awaiting the announcement of October’s monetary policy decision by the Reserve Bank of Australia (RBA). RBA monetary policy minutes released on September 20 displayed that the policymakers also considered a rate hike of 25 basis points (bps), although an announcement was made for the fourth consecutive 50 bps hike. And, RBA Governor Philip Lowe is expecting the Official Cash Rate (OCR) to top around 3.85%.
Meanwhile, downbeat Caixin Manufacturing PMI data has failed to impact the aussie bulls. The economic data has landed at 48.1, lower than the expectations and the prior release of 49.5.
It is worth noting that Australia is a leading trading partner of China and a weaker-than-projected Caixin Manufacturing PMI data carries a significant impact on Australian exports.
On the US dollar index (DXY) front, the DXY has managed to defend sustainability below 112.00 for the time being. Clouds of pessimism over the US dollar index (DXY) have not faded yet and the pullback move could be terminated, which will resume the downside journey.
In today’s session, investors will focus on the core Personal Consumption Expenditure (PCE) price index data, which is seen higher at 4.7%, 10 bps above the prior release.
- Gold price fades upside momentum during the first positive week in three, grinds higher of late.
- Pre-data anxiety, mixed sentiment test XAU/USD buyers, firmer yields also restricts upside momentum.
- Strong inflation numbers could pare gold’s weekly gains amid hawkish central banks, recession woes.
Gold price (XAU/USD) remains sidelined around the weekly tops, taking rounds to $1,660 during early Friday morning in Europe, as traders await the key data from the Fed’s preferred inflation gauge. Also challenging the metal prices could be the mixed sentiment and risk catalysts, as well as the quarter-end positioning.
That said, the recently printed mixed activity data from China, one of the major gold consumers, act as the immediate catalyst to limit the XAU/USD moves. That said, China’s official NBS Manufacturing PMI rose to 50.1 versus 49.6 expected and 49.4 prior while the Non-Manufacturing PMI declined to 50.6 compared to 52.0 market forecasts and 52.6 prior readings. Further, China's Caixin Manufacturing PMI dropped to 48.1 during the stated month versus 49.5 expected and prior.
On the other hand, news that the dragon nation eased FX restrictions in response to the Fed rate rise, shared by the Financial Times (FT), contrasts the fears of a recession in Beijing to challenge momentum traders.
Elsewhere, hawkish central bankers and fears of recession underpin the Treasury yields but the US dollar struggles to regain upside momentum amid the quarter-end positioning. That said, the US Dollar Index (DXY) remains mildly bid around 112.10 while bracing for the first weekly loss in three. It should be noted that the stock futures and the Asia-Pacific equities also trade mixed as markets await the key US and European inflation numbers.
Additionally, the geopolitical tension between Russia and Ukraine joins the Sino-American tussles and the West versus Moscow problems to challenge the XAU/USD upside. On the contrary, the recent stimulus from the UK and Japan seems to help the risk-takers.
To sum up, the gold price anxiously awaits the US and Eurozone inflation data for clear directions.
Also read: US August PCE Inflation Preview: Will it trigger a dollar correction?
Technical analysis
Gold price retreats from a 12-day-old descending resistance line, attacking the weekly triangle’s bottom near $1,660 by the press time. While the steady RSI and recently sluggish MACD hint at further grinding of the XAU/USD, the 50-SMA level around $1,652 act as an extra filter for the bear’s entry.
Following that, $1,642 and the latest swing low, also the yearly low of $1,614, could challenge the metal sellers.
It should be noted, that the commodity’s weakness past $1,614 will be challenged by the $1,600 threshold and a downward sloping support line from September 16, close to $1,605 at the latest.
Alternatively, an upside clearance of the immediate resistance line near $1,663 must cross the triangle’s upper line, at $1,671 as we write, to convince gold buyers. In that case, a run-up towards $1,688 and the $1,700 becomes imminent.
Gold: Four-hour chart
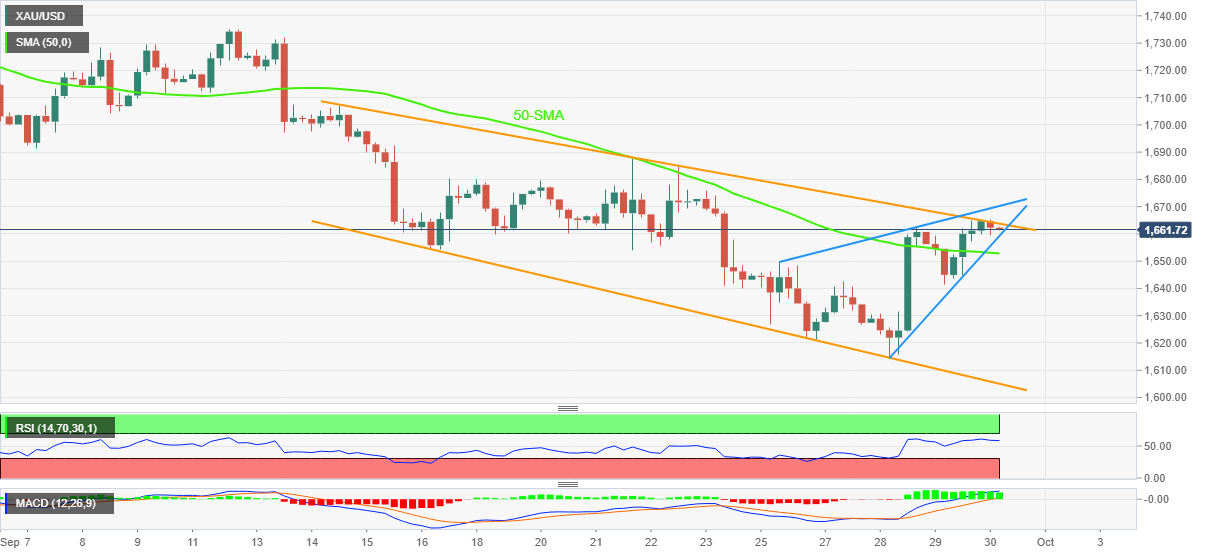
Trend: Limited upside expected
- Bets are turning towards the greenback bulls as the pair has not accelerated in the recent DXY’s correction.
- The 50 and 200-EMAs continue to march north, which adds to the upside filters.
- The RSI (14) is still serving the 40.00-60.00 range that advocates consolidation.
The USD/JPY pair is displaying a slowdown in the upside momentum after reaching around 144.80 in the Tokyo session. Earlier, the asset rebounded firmly after dropping to near 144.30. Broadly, the major is displaying topsy-turvy moves as investors are awaiting a potential trigger for informed action.
On a four-hour scale, the major is auctioning in an inventory adjustment process, which indicates a tad longer consolidation period. It is critical to state that the adjustment process is an accumulation or distribution by institutional investors.
This week, the US dollar index (DXY) witnessed an intense sell-off while risk-perceived currencies were having a ball. However, the USD/JPY pair didn’t display any weakness and remained firmer. It indicates that the yen bulls are extremely fragile against the greenback bulls and even a decent pullback move ahead will deliver an upside break of the inventory adjustment process.
The 50-and 200-Exponential Moving Averages (EMAs) at 144.00 and 141.40 respectively are advancing higher, which signifies that the upside bias is intact.
While, the Relative Strength Index (RSI) (14) is oscillating in a 40.00-60.00 range, which indicates a consolidation ahead.
The greenback bulls could drive the asset higher after overstepping the previous week’s high at 145.90, which will drive the asset towards the August 1998 high at 147.67. A breach of the latter will send the major towards the psychological resistance of 150.00.
For a decisive bearish reversal, the asset is required to drop below the previous week’s low at 140.35. An occurrence of the same will drag the asset towards the August 30 low at 138.05 followed by the August 23 low at 135.81.
USD/JPY four-hour chart
-638001066615339664.png)
- AUD/NZD has picked bids around 1.1330 but seems to remain lackluster ahead of policy meetings.
- Both RBA and the RBNZ will announce their monetary policies next week.
- The RBA is not expected to sound extremely hawkish while the RBNZ will continue its 50 bps hike pattern.
The AUD/NZD pair has recovered sharply after picking bids near 1.1327 in the Tokyo session. The asset is expected to test the downside break of the consolidation formed in a range of 1.1364-1.1412. On a broader note, the cross has corrected sharply after surrendering the round-level cushion of 1.1400. The asset is expected to remain on the sidelines ahead of the interest rate decision by the Reserve Bank of Australia (RBA) and the Reserve Bank of New Zealand (RBNZ).
The monetary policy meeting of the RBA is scheduled for Tuesday and RBA Governor Philip Lowe is not expected to sound extremely hawkish considering their options for the extent of the rate hike considered in the September meeting. As per RBA minutes, the RBA announced a fourth consecutive rate hike of 50 basis points (bps) but also considered the option of 25 bps.
The official Cash Rate (OCR) was pushed to 2.35% in September monetary policy meeting. RBA Governor Philip Lowe is continuously accelerating the OCR to scale down the soaring price pressures. The Australian inflation rate has already increased to 6.1%, reading belongs to the second quarter of CY2022.
Apart from that, the RBA policymakers cited that the OCR is expected to peak around 3.85% and the inflation rate will top around 7%. With the current pace of hiking the OCR by 50 bps, the central bank will reach the desired target by December 2022.
On the kiwi front, a Reuters poll on the RBNZ rate hike forecast, scheduled on Wednesday, claims a fifth consecutive rate hike by 50 basis points (bps). A fifth half-a-percent rate hike by the RBNZ Governor Adrian Orr will push the Official Cash Rate (OCR) to 3.5%. It would be worth watching whether an OCR above 3% is sufficient to anchor the galloping inflation.
Officials from the State Administration of Foreign Exchange (SAFE) privately communicated a relaxation of the informal limits on transaction in China's interbank market to foreign exchange brokers on Wednesday last week due to the Fed's interest rate rise of 0.75 percentage points, the Financial Times reported, citing two people familiar with the matter.
The news also mentioned that the renminbi's sharp fall over the past week started after regulators told traders that they were relaxing the foreign exchange trading limits.
The report, citing one of the people said the move to relax was made because policymakers "believed it was the proper time to let the renminbi depreciate a bit".
Market reaction
The news should have favored the USD/CNH prices to regain upside momentum after two loss-making days. That said, the offshore Chinese yuan (CNH) pair prints 0.26% intraday gains around 7.1150 by the press time.
Also read: USD/CNH Price Analysis: Snaps two-day downtrend around 7.1300 after China PMIs
Japanese Chief Cabinet Secretary Hirokazu Matsuno crossed wires, via Reuters, in early Friday while suggesting more stimulus from the Asian major.
Key quotes
Will consider further support for hard-hit consumers, businesses in view of higher energy, food prices.
Will also consider steps to promote wage hikes.
Japan will continue to engage with the g7 and international community to take strong measures against Russia and to support Ukraine.
Russia's intended annexation cannot be permitted and is illegal under international law.
North Korea may engage in a further provocative manner.
FX reaction
The news struggles to impress market players amid fears of recession and hawkish central bank actions, not to forget the cautious mood ahead of the key EU/US data.
Also read: USD/JPY remains lackluster below 144.50 despite upbeat Japanese data
- GBP/USD struggles to extend two-week-old resistance breakout as 100-EMA tests buyers.
- Pre-data anxiety, nearly overbought RSI (14) challenge immediate upside.
- Sellers need validation from two-day-old support, scheduled data to retake control.
GBP/USD struggles for clear directions around the weekly top after a three-day uptrend as traders await the key statistics from the US and the UK during Friday. That said, the quote currently seesaws between the 100-EMA and the resistance-turned-support line while taking rounds to 1.1120.
It’s worth noting that the nearly overbought RSI conditions join the 100-EMA and the previous resistance line to challenge the pair’s latest moves, as well as the pre-data anxiety.
Also read: GBP/USD pause on the way to 1.1200 ahead of UK GDP, US PCE Inflation
It should be noted, however, that the comparative fundamental challenges for the UK and a seven-week-old resistance line portray the bearish bias for the GBP/USD pair.
Hence, sellers should be on the lookout for entries on a clear downside break of the immediate support line, near 1.1055 by the press time. Following that, an upward sloping support line from Wednesday, near 1.0965, could challenge the pair’s further downside.
Alternatively, an upside clearance of the 100-EMA hurdle, around 1.1195 at the latest, could aim for the downward sloping resistance line from August 10, near 1.1455 now.
If at all the GBP/USD buyers manage to cross the 1.1455 hurdle, the monthly high surrounding 1.1740 will be on their radar.
GBP/USD: Four-hour chart
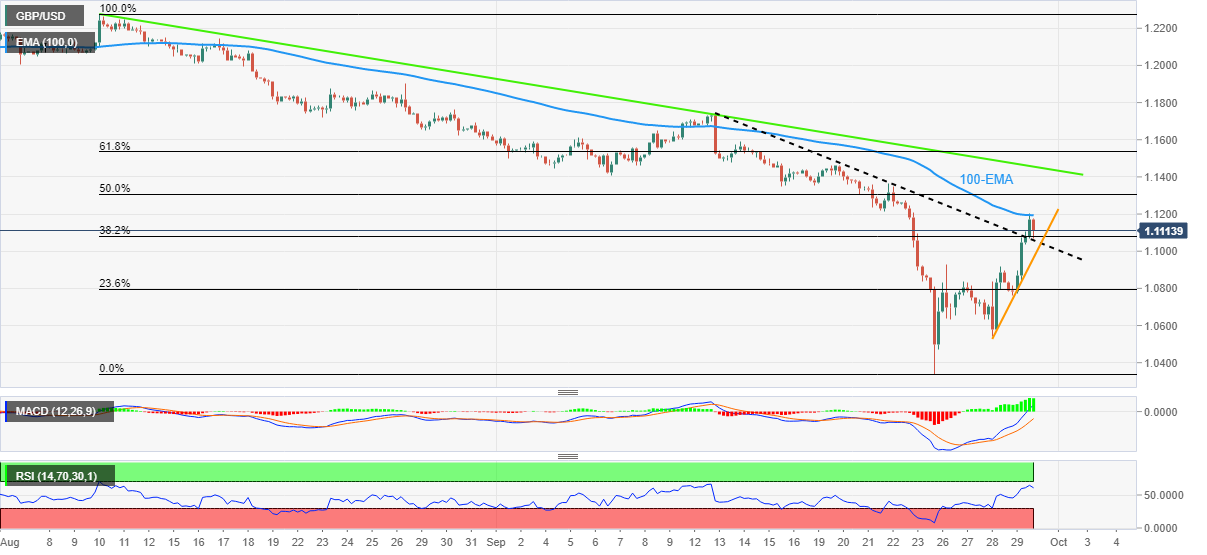
Trend: Pullback expected
- EUR/USD retreats from the short-term key hurdle to snap two-day uptrend.
- Market sentiment remains dicey but yields stay firmer amid fears of recession.
- ECB hawks battle upbeat Fedspeak to defend the recovery despite the energy crisis in the bloc.
- Firmer US inflation gauge may add strength to the pullback moves.
EUR/USD takes offers to renew intraday low around 0.9800 as bulls take a breather after a two-day uptrend around the weekly top. Even so, the major currency pair remains positive on a weekly basis, snapping a two-week downtrend. The quote’s latest weakness could be linked to the cautious sentiment ahead of the key inflation numbers from Eurozone and the US.
Eurozone is up for publishing the preliminary inflation data for September. The CPI and HICP figures become all the more important after Germany refreshed the record high during the previous day and the European Central Bank (ECB) policymakers are ready to inflate the benchmark rates even at the risk of a recession.
Among the key policymakers were Olli Rehn, Mario Centeno and Pablo Hernandez de Cos, who have recently backed the idea of increasing the benchmark rate by 0.75%. “ECB policymakers voiced more support on Thursday for another big interest rate hike as inflation in the euro zone's biggest economy hit double digits, blasting past expectations and heralding another record reading for the bloc as a whole,” said Reuters in this regard.
It should be noted that Germany’s Consumer Price Index (CPI) rose to 10% in September compared to 7.9% in August and the market expectation of 9.4. Additionally, the Harmonised Index of Consumer Prices (HICP) for the nation, the European Central Bank's (ECB) preferred gauge of inflation, jumped to 10.9% during the stated month compared to 8.8% prior and 10% expected. Furthermore, Eurozone Economic Sentiment Indicator (ESI) declined to 93.7 in September versus the market expectation of 95 and 97.3 in August. Also, the Consumer Confidence for the said month matched -28.8 forecasts and prior readings.
On the other hand, the US economic calendar has the Fed’s preferred inflation gauge, namely the Core Personal Consumption Expenditure (PCE) Price Index for August, expected 4.7% YoY versus 4.6% prior.
Also read: US August PCE Inflation Preview: Will it trigger a dollar correction?
It should be that the US Weekly Initial Jobless Claims dropped to 193K for the period ended on September 24, versus the 209K previous (revised from 213K) and the market expectation of 215K, also might have weighed on the DXY. The US Jobless Claims slumped to the lowest levels since April.
While respecting the data, St. Louis Federal Reserve Bank President James Bullard praised the slump in the weekly Initial Jobless Claims and mentioned, "We will push inflation to 2% in a reasonable compact time frame." Elsewhere, Federal Reserve Bank of Cleveland President Loretta Mester said on Thursday that they are not yet at a point where they could start thinking about stopping interest rate hikes, as reported by Reuters. Additionally, San Francisco Fed President Mary Daly said that she expects to raise rates further in coming meetings, and early next year.
Elsewhere, the chatters over China’s inability to tame recession woes and the UK’s fears of more economic pain, as well as the Russia-EU tussles, weigh on the EUR/USD prices and the market’s sentiment.
Amid these plays, US 10-year Treasury yields remain firmer around 3.80% during the seven-week uptrend despite reversing from the 12-year on Wednesday while the S&P 500 Futures fade recovery from the multi-month low.
To sum up, the EUR/USD pair is portraying the typical pre-data caution and can witness further downside if the US inflation figures offer a positive surprise.
Technical analysis
EUR/USD recently eased from the four-month-old support-turned-resistance, as well as the downward sloping resistance line from September 13, amid impending bull cross on the MACD and steady RSI (14). As a result, the buyers stay hopeful but need validation from 0.9830.
On the contrary, the pair’s pullback moves may initially aim for the 10-DMA support near 0.9795 before targeting the 0.9690-75 support area.
| Raw materials | Closed | Change, % |
|---|---|---|
| Silver | 18.815 | -0.34 |
| Gold | 1660.36 | 0.1 |
| Palladium | 2200.03 | 2.47 |
- USD/CNH crosses 200-HMA for the first time in two weeks after mixed China PMI data.
- NBS Manufacturing PMI improved but Non-Manufacturing PMI and Caixin Manufacturing PMI eased in September.
- Immediate bearish channel challenges upside momentum targeting the fresh record high.
- MACD, RSI conditions join the key HMA breakout to favor buyers.
USD/CNH picks up bids to add gains to the first daily positive in three after China’s mixed activity data for September, published early Friday. That said, the quote renews intraday high around 7.1300 by the press time.
China’s official NBS Manufacturing PMI rose to 50.1 versus 49.6 expected and 49.4 prior while the Non-Manufacturing PMI declined to 50.6 compared to 52.0 market forecasts and 52.6 prior readings. Further, China's Caixin Manufacturing PMI dropped to 48.1 during the stated month versus 49.5 expected and prior.
In addition to the unimpressive activity numbers but a clear rebound from the 61.8% Fibonacci retracement of the pair’s September 19-28 advances and the run-up beyond the 200-HMA for the first time in 13 days also lure USD/CNH buyers.
However, a downward sloping trend channel from Wednesday restricts immediate USD/CNH recovery, with its resistance line standing near 7.1630 by the press time.
Should the quote rises past 7.1630, the odds of witnessing a rally towards the recent record high near 7.2660 can’t be ruled out.
Alternatively, pullback moves may initially aim for the 61.8% Fibonacci retracement level, also known as the golden ratio, around 7.0950.
Following that, the stated nearby channel’s support line, close to 7.0650, could challenge the USD/CNH pair’s further weakness.
USD/CNH: Hourly chart
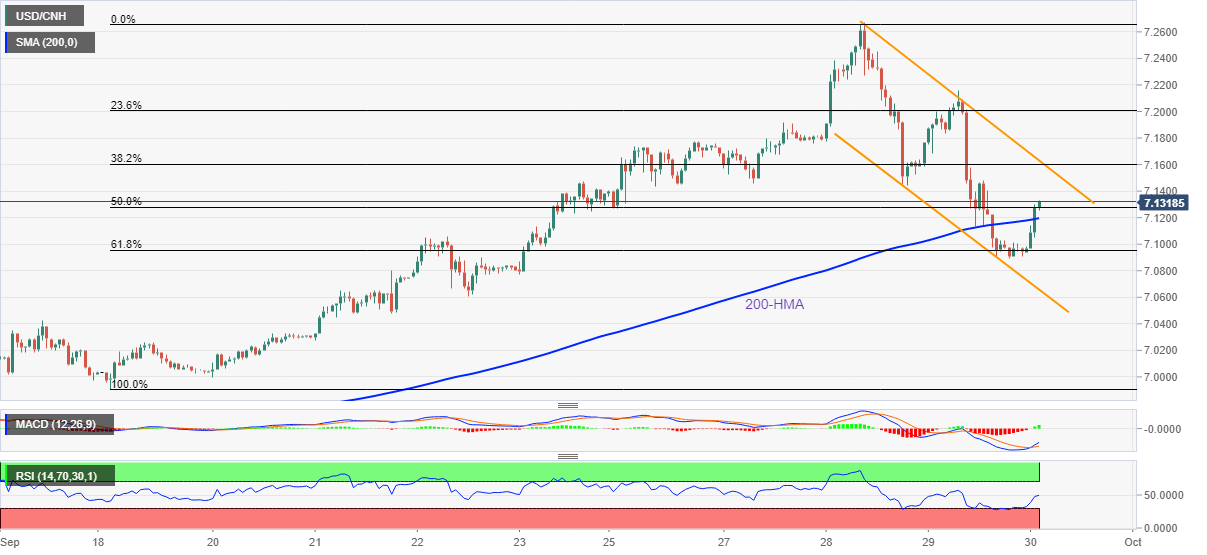
Trend: Further upside expected
- AUD/JPY grinds higher to defend the first weekly gain in three.
- China’s PMIs came in mixed for September, statistics from Japan came in firmer.
- Yields remain firmer amid hawkish central banks, recession woes.
- Risk aversion may challenge the recovery moves amid a cautious session.
AUD/JPY buyers flirt with the 94.00 threshold while snapping a two-week downtrend during Friday’s Asian session. In doing so, the cross-currency pair cheers firmer yields while paying a little heed to the mixed data from Australia’s biggest customer China, as well as firmer economics from Japan.
That said, China’s official NBS Manufacturing PMI rose to 50.1 versus 49.6 expected and 49.4 prior while the Non-Manufacturing PMI declined to 50.6 compared to 52.0 market forecasts and 52.6 prior readings. Further, China's Caixin Manufacturing PMI dropped to 48.1 during the stated month versus 49.5 expected and prior.
On the other hand, Japan reported a decline in the Unemployment Rate to 2.5% in August while Industrial Production reversed the previous contraction of 2.0% with 5.1% YoY growth. Further, Retail Trade also improved to 4.1% YoY compared to 2.8% expected and 2.4% prior.
It’s worth noting that the US 10-year Treasury yields remain firmer around 3.80% during the seven-week uptrend despite reversing from the 12-year on Wednesday. The fears surrounding global recession and the hawkish commentary from the key central banks, including the Federal Reserve, the Bank of England (BOE) and the European Central Bank (ECB), despite the recently downbeat economics and supply crunch fears, propel the bond coupons. Additionally, the chatters over China’s inability to tame recession woes and the UK’s fears of more economic pain due to the latest fiscal policies should have favored the US Treasury yields.
It should be observed that the Bank of Japan’s (BOJ) likely inability to defend the yen despite recent market intervention appears to also favor the AUD/JPY prices. That said, the cautious optimism in the market, portrayed via mildly bid S&P 500 Futures seem to offer additional support to the risk-barometer pair.
Having witnessed the reaction to a slew of data from Australia and Japan, the AUD/JPY traders may remain cautious ahead of the key data, namely Eurozone inflation for September and the Fed’s preferred inflation gauge, the Core Personal Consumption Expenditure (PCE) Price Index for August.
Technical analysis
As the RSI (14) and the MACD both flash bearish signals, AUD/JPY upside appears difficult. Also challenging the bulls is a convergence of the 50-day EMA, the previous support line from May and a three-week-old resistance confluence, near 94.80.
Meanwhile, 50% and 61.8% Fibonacci retracement of the pair’s May-September upside, respectively near 93.00 and 91.60, could challenge the downside moves.
- NZD/USD is aiming to smash the critical hurdle of 0.5800 as Caixin Manufacturing PMI soars.
- China’s surprise purchase of government bonds will also strengthen kiwi exports.
- A fifth consecutive 50 bps rate hike is expected by the RBNZ.
The NZD/USD pair has dropped marginally below 0.5730 in the Tokyo session after facing barricades around 0.5750. The asset is marching towards 0.5800 on upbeat China’s Caixin Manufacturing PMI data. The economic data has landed at 50.1, higher than the expectations and the prior release of 49.5.
It is worth noting that New Zealand is a leading trading partner of China and upbeat Caixin Manufacturing PMI data has a significant impact on NZ's fiscal balance sheet.
Apart from that, the Chinese Finance ministry is planning to issue government bonds worth 2.5 trillion yuan in the fourth quarter, as reported by Reuters. The decision is supposed to safeguard the markets from any further turmoil as the economy is not expected to display a decent growth rate amid zero tolerance for Covid-19 spread and the real estate crisis. It will also support the kiwi export data.
Next week, investors will focus on the interest rate decision by the Reserve Bank of New Zealand (RBNZ). Reuters poll on RBNZ rate hike forecast claims a fifth consecutive rate hike by 50 basis points (bps). A fifth half-a-percent rate hike by the RBNZ Governor Adrian Orr will push the Official Cash Rate (OCR) to 3.5%. It would be worth watching whether an OCR above 3% is sufficient to anchor the galloping inflation.
Meanwhile, the US dollar index (DXY) is expected to decline further as it is facing barricades around 112.00 in the Tokyo session. The DXY has weakened after a consecutive decline in the US growth rate by 0.6%. Going forward, the Michigan Consumer Sentiment Index (CSI) data will be keenly focused. The sentiment data is expected to remain steady at 58.5.
As reported by Reuters, China's factory activity contracted at a sharper pace in September as strict COVID lockdowns disrupted production and dampened sales, a private sector survey showed on Friday.
''Weakening global demand for Chinese goods also weighed heavily on the manufacturing sector, with new export orders shrinking at the fastest pace in four months.
The Caixin/Markit manufacturing purchasing managers' index (PMI) fell more than expected to 48.1 in September from 49.5 in August, below the 50-point which marks separates growth from contraction on a monthly basis.
Analysts in a Reuters poll had expected the reading would be unchanged from August.
Surveyed firms attributed the COVID-19 epidemic as the greatest impact factor, the private survey said.''
AUD/USD is falling towards the lowest levels of the session following the PMIs today, down to a low of 0.6489 at the time of writing.
- AUD/USD stays defensive around yearly low after September’s activity data from the key customer.
- China’s NBS Manufacturing PMI rose more than expected to 50.1, Non-Manufacturing PMI and Caixin Manufacturing PMI eased.
- Market sentiment remains sluggish as traders await important statistics.
- Risk-aversion, likely stronger US inflation can please bears.
AUD/USD remains sidelined around 0.6500 as it pokes the resistance line of a bullish wedge during Friday’s Asian session. Even so, the quote remains on the way to printing the third weekly loss, as well as the biggest monthly downside in three. That said, the Aussie pair recently struggled amid mixed activity data for September from Australia’s biggest customer China.
That said, China’s official NBS Manufacturing PMI rose to 50.1 versus 49.6 expected and 49.4 prior while the Non-Manufacturing PMI declined to 50.6 compared to 52.0 market forecasts and 52.6 prior readings. Further, China's Caixin Manufacturing PMI dropped to 48.1 during the stated month versus 49.5 expected and prior.
Also read: Chinese Manufacturing PMI beats and supports AUD on the margin, services fall
Other than the mixed data at home, fears of global recession and recently softer Aussie inflation data also challenge the AUD/USD buyers. “Investors added another cycle of selling after Fed officials gave no indication about the U.S central bank changing its view on rate hikes, leaving investors skittish about a potential recession in the country,” said Reuters.
On Thursday, the first monthly CPI data from the Australian Bureau of Statistics (ABS) mentioned the headline price pressure eased in August to 6.8% from 7.0% in July.
Earlier in the day, a Reuters poll suggested that the Reserve Bank of Australia (RBA) is likely to hike its interest rate by another 50 basis points in October in its most aggressive tightening cycle since 1990s to curb red-hot inflation.
It should be noted that the softer US inflation expectations might have favored the AUD/USD buyers the previous day. That said, the US inflation expectations, as per the 10-year and 5-year breakeven inflation rates per the St. Louis Federal Reserve (FRED) data, dropped to the lowest levels since early 2021.
Having witnessed the dismal reaction to China PMIs, AUD/USD traders may await the Fed’s preferred inflation gauge, namely the Core Personal Consumption Expenditure (PCE) Price Index for August, expected 4.7% YoY versus 4.6% prior. Should the US inflation gauge print upbeat numbers, the AUD/USD prices may witness further downside.
Technical analysis
Successful trading above 0.6500 could help AUD/USD to pare weekly loss as it will confirm the three-week-old falling wedge bullish chart pattern. Meanwhile, 0.6440 and the latest multi-month low near 0.6365 might return to the seller’s radar in case of a fresh downside. That said, MACD and RSI (14) join the downbeat fundamentals to challenge the bulls.
China's PMIs have arrived as follows:
- China's September official composite PMI 50.9
- China's September official services PMI falls to 50.6 vs 52.6 in August
- China's September official manufacturing PMI at 50.1 (Reuters poll 49.6) vs 49.4 in August
Ongoing COVID-19 risks are set to continue impacting the official services PMI in September.
The Caixin manufacturing PMI is also expected to confirm the broad-spread nature of the slowdown (market forecast: 49.5).
AUD/USD is attempting to move higher on the data but has come under pressure again, balancing at 0.6497.
Why it matters to traders?
The monthly manufacturing PMI is released by China Federation of Logistics and Purchasing (CFLP) on the last day of every month. The official PMI is released before the Caixin Manufacturing PMI, which makes it even more of a leading indicator, highlighting the health of the manufacturing sector, considered as the backbone of the Chinese economy. The data is of high relevance for the financial markets throughout several asset classes, given China’s influence on the global economy.
- EUR/JPY has stabilized above 142.00 on soaring hawkish ECB bets.
- The yen bulls have failed to capitalize on upbeat Japanese economic data.
- Eurozone Consumer Confidence has remained in line with estimates and German Retail Sales may plunge ahead.
The EUR/JPY pair has displayed a juggernaut rally after overstepping the round-level hurdle of 140.00. The asset is moving north vertically and has established above the immediate resistance of 142.00 in the Asian session. The cross has not sensed any selling pressure despite the release of upbeat Japanese economic data.
Japan’s Unemployment Rate has justified the estimates of 2.5% and remained lower than the prior release of 2.6%. While the Jobs/Applicants Ratio improved to 1.32 vs. the forecasts of 1.30 and the former print of 1.29.
Adding to that, the Retail Sales data has improved significantly to 4.1%, higher than the forecast of 2.8% and the prior figure of 2.4%. The retail demand seems upbeat in the Japanese economy, which is a result of the continuous injection of liquidity into the economy by the Bank of Japan (BOJ). The BOJ believes that the economy needs stimulus to revive the growth rate recorded in the pre-pandemic era. Also, Industrial Production has accelerated to 5.1% from a decline of 2% on an annual basis.
Meanwhile, the shared currency bulls are performing well after the hawkish commentary by the European Central Bank (ECB) President Christine Lagarde. The ECB is expected to tighten its policy further as it has come with specified guidance. The ECB will hike its interest rate by 125 basis points (bps) in the coming monetary policy meeting.
On the economic front, the Eurozone Consumer Confidence has remained in line with the estimates and the prior release but is still worse at -28.8. Going forward, the German Retail Sales data will catch the spotlight. The economic data is expected to decline firmly by 5.1% vs. the prior release of a decline of 2.6% on an annual basis.
In recent trade today, the People’s Bank of China (PBOC) set the yuan (CNY) at 7.0998 vs. the previous fix of 7.1107, the prior close of 7.1210, and the estimated 7.0951.
About the fix
China maintains strict control of the yuan’s rate on the mainland.
The onshore yuan (CNY) differs from the offshore one (CNH) in trading restrictions, this last one is not as tightly controlled.
Each morning, the People’s Bank of China (PBOC) sets a so-called daily midpoint fix, based on the yuan’s previous day's closing level and quotations taken from the inter-bank dealer.
- USD/CAD holds onto the previous day’s rebound, picks up bids of late.
- Bullish candlestick formation, recovery from short-term support line favor buyers.
- Weekly resistance line, overbought RSI challenge upside momentum.
- 10-DMA adds to the downside filters before reversing the uptrend.
USD/CAD defends the third consecutive weekly gain at around 1.3685 during Friday’s Asian session. In doing so, the Loonie pair justifies the previous day’s bullish candlestick formation, as well as a rebound from the 13-day-old support line, amid the price-positive MACD signals.
With this, the quote is well-set to challenge the immediate hurdle, namely the weekly resistance line surrounding 1.3740, before aiming for the recently flashed multi-month high near 1.3835.
It’s worth noting that the 1.3800 could act as an extra resistance that could join the overbought RSI (14) to challenge the USD/CAD buyers.
If at all the pair remains firmer past 1.3835, the odds of witnessing a rally towards the 1.4000 psychological magnet can’t be ruled out.
Meanwhile, pullback moves need to provide a daily closing below the stated support line, near 1.3660 by the press time.
Even so, the 10-DMA level around 1.3560 could challenge the USD/CAD bears before giving them control.
Overall, USD/CAD remains on the bull’s radar but the upside momentum appears limited.
USD/CAD: Daily chart
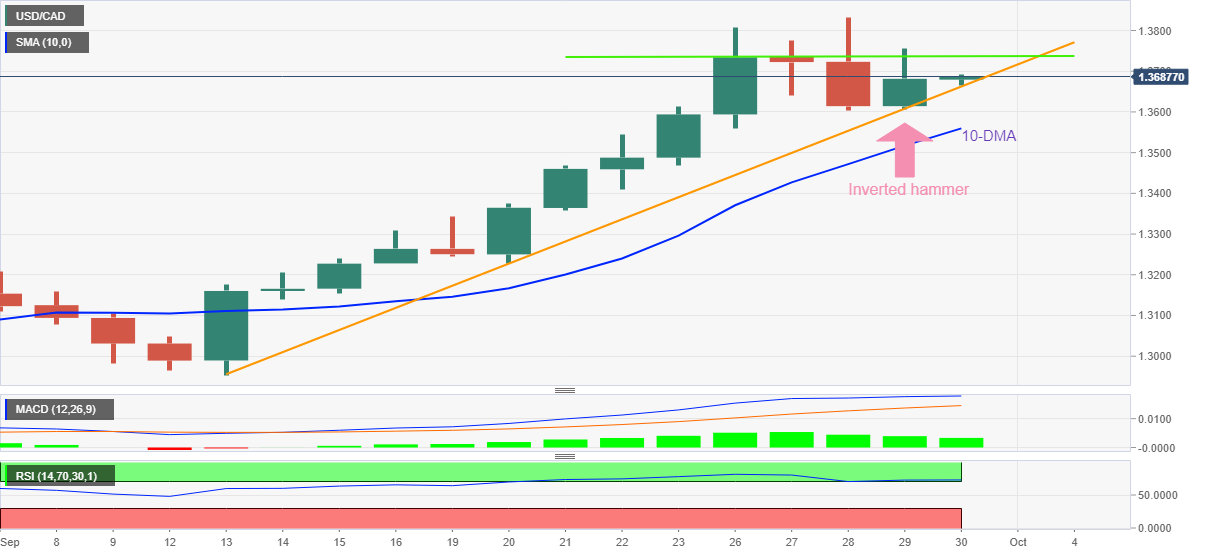
Trend: Further upside expected
- Gold price is accelerating towards $1,680.00 as the DXY has extended its losses.
- A consecutive decline in the US GDP numbers weakened the DXY.
- US core PCE price index is expected to advance by 10 bps to 4.7%.
Gold price (XAU/USD) is aiming to test the critical hurdle of $1,680.00 amid ongoing weakness in the US dollar index (DXY). The precious metal extended its recovery after sustaining above $1,650.00 and is expected to remain in the grip of bulls ahead. The yellow metal concluded its corrective move towards $1,640.00 and got strengthened after the US Gross Domestic Product (GDP) remained in line with the projections.
The US GDP has consecutively declined by 0.6% on an annualized basis. It seems that the consequences of the bigger rate hikes by the Federal Reserve (Fed) have started showing their true colors. Bets were rising over a possible recession situation in the US but got vanished after the commentary from San Francisco Fed chief Mary Daly.
Fed policymaker believes that the central bank is needed to drop focusing on generating more employment to tame the galloping inflation and not a recession, as reported by Reuters.
Going forward, the US core Personal Consumption Expenditure (PCE) price index data will remain in focus. The economic data is expected to improve to 4.7% vs. the prior release of 4.6%. A higher-than-expected figure could propel the DXY to sum up its correction sooner.
Gold technical analysis
Gold prices have entered the prior balanced area, which is placed in a range of $1,653.30-1,692.00 on an hourly scale. The balanced area indicates the highest auction region where most of the trading activity took place.
It is worth noting that the gold prices have crossed the 50-and 200-period Exponential Moving Averages (EMAs) while the EMAs have not displayed a crossover yet. This signals the strength of the upside momentum.
Adding to that, the Relative Strength Index (RSI) (14) has shifted into the bullish range of 60.00-80.00, which illustrates a continuation of upside momentum.
Gold hourly chart
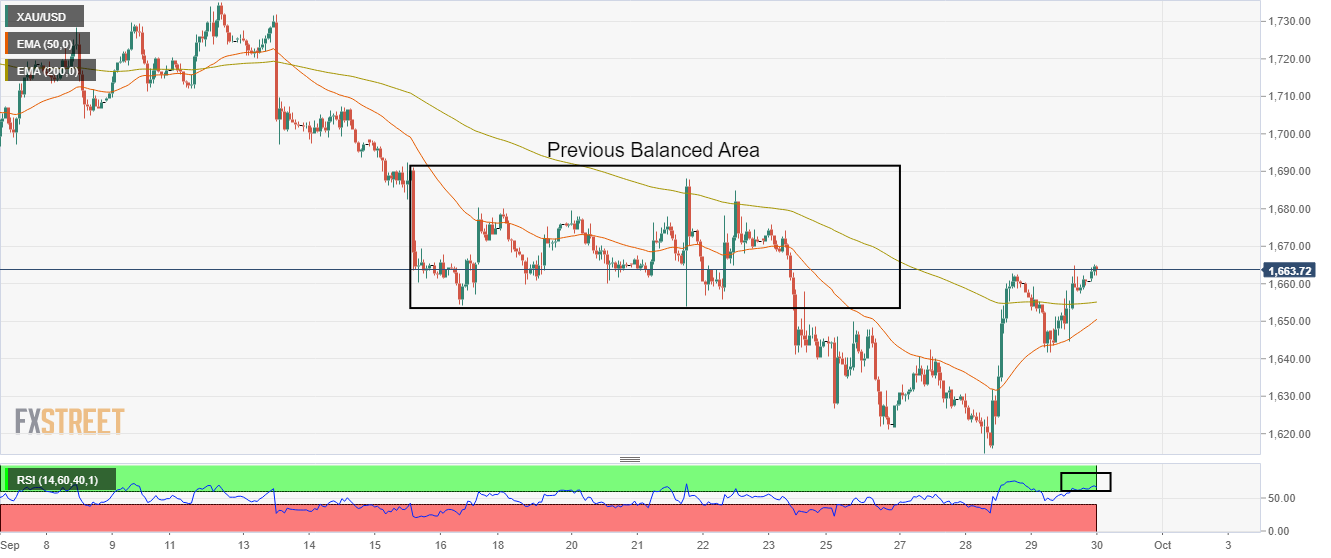
- GBP/USD struggles to extend the first weekly gain in three, grinds higher of late.
- BOE policymakers’ aggression, sync between the UK government and the “Old Lady” favor buyers.
- Downbeat US inflation expectations, quarter-end positioning adds strength to the pair’s rebound.
- UK Q2 GDP may confirm recession woes and probe the bears, US inflation could also weigh on prices.
GBP/USD seesaws around 1.1160-55 as buyers brace for the first weekly gain in three during Friday’s Asian session. In doing so, the cable pair cheers the broad US dollar weakness, as well as mixed concerns surrounding the US dollar ahead of the key data from the UK and the US.
BOE Economist Huw Pill amplified pessimism surrounding Britain as the policymaker said, “It’s hard to avoid the conclusion that fiscal easing announced will prompt a significant and necessary monetary policy response in November.” Recently, UK Trade Secretary Kemi Badenoch stated that the chancellor is `working well' with the Bank of England.
With this, the “Old Lady,” as the BOE is known sometimes, appears set for the strong rate hike cycle, which in turn propels the GBP/USD prices.
On the other hand, US Dollar Index (DXY) remains on the back foot at around 111.90 while snapping a two-week uptrend. In doing so, the greenback’s gauge versus the six major currencies fails to justify the recently hawkish Fedspeak and the broad recession fears amid downbeat inflation expectations. This makes today’s Core Personal Consumption Expenditure (PCE) Price Index for August, expected 4.7% YoY versus 4.6% prior, important for the greenback traders.
Also important to watch will be the final readings of the UK’s second quarter (Q2) Gross Domestic Product (GDP), expected to confirm -0.1% initial forecasts.
Given the upbeat expectations from inflation and fears of economic slowdown in the UK, the GBP/USD could pare the latest gains if the scheduled data matches the forecasts.
Also read: US August PCE Inflation Preview: Will it trigger a dollar correction?
Technical analysis
A clear upside break of a two-week-old resistance line, now support around 1.1035, needs to cross the 100-EMA hurdle surrounding the 1.1200 threshold, to keep GBP/USD buyers hopeful. It’s worth noting that the RSI is approaching the overbought territory and hence the upside potential appears limited.
Reserve Bank of New Zealand (RBNZ) will deliver its fifth half-point interest rate hike on Wednesday and do the same in November in an attempt to stem the tide of rising inflation, the latest Reuters poll of economists predicted.
Key findings
All 24 economists in the Sept. 26-29 Reuters poll forecast the RBNZ would hike its official cash rate by 50 basis points to 3.50% at its Oct. 5 meeting.
Nearly all economists have brought forward rate hike expectations from last month's poll and a majority, 17 of 22, now expected the OCR to reach 4.00% or above by end-2022, 50 basis points higher than August's poll.
Current poll medians showed rates would remain unchanged at 4.00% until end-2023, not far from the RBNZ's projected terminal rate of 4.10%.
But a strong minority of nearly 40% of economists expected rates to be higher than the predicted peak rate.
Inflation was predicted to remain well above the RBNZ's target range of 1-3% until at least end-2023. It was expected to average 6.5% this year and then slip to 3.5% in 2023, higher than the 6.0% and 2.8% predicted in July.
Economists also cautioned the risks to their inflation projection were skewed more towards faster price growth.
Also read: NZD/USD Price Analysis: Bulls eye a run beyond the 'HotW' and eye 0.58 the figure
Australia's central bank will hike interest rates by another half-point on Tuesday and increase borrowing costs further than previously thought in its most aggressive tightening cycle since the 1990s to arrest red hot inflation, a Reuters poll showed.
Meanwhile, a new monthly measure of Australian consumer prices on Thursday showed annual inflation eased slightly in August from July thanks to a steep drop in petrol prices, although inflation excluding volatile items accelerated. The job market has also remained tight with vacancies dipping slightly from all-time highs, adding to the case that the Reserve Bank of Australia will likely lift the official cash rate by another half point to 2.85% at its policy meeting on Tuesday.
AUD/USD has been able to accumulate a bid on a softer US dollar of late, rallying towards the high of the week near 0.6535.
| Index | Change, points | Closed | Change, % |
|---|---|---|---|
| NIKKEI 225 | 248.07 | 26422.05 | 0.95 |
| Hang Seng | -85.01 | 17165.87 | -0.49 |
| KOSPI | 1.64 | 2170.93 | 0.08 |
| ASX 200 | 93 | 6555 | 1.44 |
| FTSE 100 | -123.81 | 6881.59 | -1.77 |
| DAX | -207.73 | 11975.55 | -1.71 |
| CAC 40 | -88.14 | 5676.87 | -1.53 |
| Dow Jones | -458.13 | 29225.61 | -1.54 |
| S&P 500 | -78.57 | 3640.47 | -2.11 |
| NASDAQ Composite | -314.13 | 10737.51 | -2.84 |
- US Dollar Index grinds lower around the weekly bottom.
- US inflation expectations slumped to 18-month low, Q2 GDP confirmed 0.6% contraction.
- Hawkish Fedspeak, recession woes and geopolitical concerns challenge DXY bears.
- Firmer prints of Fed’s preferred inflation gauge could renew upside momentum.
US Dollar Index (DXY) remains on the back foot around 111.90 while bracing for the first weekly loss in three during Friday’s Asian session.
In doing so, the greenback’s gauge versus the six major currencies fails to justify the recently hawkish Fedspeak and the broad recession fears amid downbeat inflation expectations. This makes today’s Core Personal Consumption Expenditure (PCE) Price Index for August, expected 4.7% YoY versus 4.6% prior, important for the greenback traders.
On Thursday, the final readings of the US Q2 Gross Domestic Product (GDP) confirmed the initial forecasts of -0.6%. It should be noted that the US Weekly Initial Jobless Claims, which dropped to 193K for the period ended on September 24, versus the 209K previous (revised from 213K) and the market expectation of 215K, also might have weighed on the DXY. The US Jobless Claims slumped to the lowest levels since April.
Following the data, St. Louis Federal Reserve Bank President James Bullard praised the slump in the weekly Initial Jobless Claims and mentioned, "We will push inflation to 2% in a reasonable compact time frame." Elsewhere, Federal Reserve Bank of Cleveland President Loretta Mester said on Thursday that they are not yet at a point where they could start thinking about stopping interest rate hikes, as reported by Reuters. Additionally, San Francisco Fed President Mary Daly said that she expects to raise rates further in coming meetings, and early next year.
Elsewhere, recession woes amplified as the other key central banks, including the Bank of England (BOE) and the European Central Bank (ECB), also remain aggressive despite the recently downbeat economics and supply crunch fears. Additionally, the chatters over China’s inability to tame recession woes and the UK’s fears of more economic pain due to the latest fiscal policies should have favored the DXY but could not.
The reason could be linked to the downbeat US inflation expectations, as per the 10-year and 5-year breakeven inflation rates per the St. Louis Federal Reserve (FRED) data, which dropped to the lowest levels since early March 2021.
Amid these plays, the Wall Street benchmarks reversed all of the gains made on Wednesday while the Treasury yields recovered. Even so, the S&P 500 Futures print mild gains and weigh on the DXY amid a sluggish session ahead of the key US data.
Also read: US August PCE Inflation Preview: Will it trigger a dollar correction?
Technical analysis
The DXY’s first daily closing below the 10-DMA, around 112.40 by the press time, in two weeks direct the sellers towards the previous resistance line near 111.45.
- USD/JPY is oscillating below 144.50 as yen has failed to capitalize on Japanese data.
- A broader improvement has been witnessed in employment, Retail Sales, and Industrial Production data.
- The improved risk appetite of investors is weakening the DXY.
The USD/JPY pair has not responded as expected despite the release of upbeat Japanese employment, Retail Sales, and Industrial Production data. The asset is displaying back-and-forth moves in a range of 144.30-144.84 in the Tokyo session. The major is displaying any signs of a decisive move and is awaiting a potential trigger.
Japan’s Unemployment Rate has remained in line with the estimates of 2.5% but lower than the prior release of 2.6%. While the Jobs/Applicants Ratio has improved to 1.32 vs. the projections of 1.30 and the former print of 1.29.
Meanwhile, the Retail Sales data has improved significantly to 4.1%, higher than the forecast of 2.8% and the prior figure of 2.4%. The retail demand seems upbeat in the Japanese economy, which is a result of the continuous injection of liquidity into the economy by the Bank of Japan (BOJ). The BOJ believes that the economy needs stimulus to revive the growth rate recorded in the pre-pandemic era. Also, Industrial Production has accelerated to 5.1% from a decline of 2% on an annual basis.
BOJ’s continuation of an ultra-dovish monetary policy is constantly resulting in the depreciation of yen. Now, the recent announcement of an unscheduled bond-buying program has weakened yen further.
Meanwhile, the US dollar index (DXY) is looking to establish below 112.00 amid an improvement in the risk appetite of the market participants. In today’s session, the US Michigan Consumer Sentiment Index (CSI) data will remain in focus. The sentiment data is expected to remain steady at 59.5.
| Pare | Closed | Change, % |
|---|---|---|
| AUDUSD | 0.6498 | -0.33 |
| EURJPY | 141.806 | 1.1 |
| EURUSD | 0.98168 | 0.87 |
| GBPJPY | 160.64 | 2.45 |
| GBPUSD | 1.11208 | 2.21 |
| NZDUSD | 0.57243 | -0.1 |
| USDCAD | 1.36788 | 0.51 |
| USDCHF | 0.97522 | -0 |
| USDJPY | 144.461 | 0.24 |
- EUR/USD grinds higher around the weekly top, pokes key resistance confluence.
- Previous support line from July, three-week-old resistance line constitute immediate hurdle.
- The year 2001 high, descending support line from May challenge bears.
- Looming bull cross on the MACD, steady RSI favor buyers.
EUR/USD jostles with the key 0.9830 resistance confluence as bulls struggle to defend the first weekly gains in three during Friday’s Asian session.
In doing so, the major currency pair battles the four-month-old support-turned-resistance, as well as the downward sloping resistance line from September 13.
It should be noted, however, that the impending bull cross on the MACD and steady RSI (14) favor the buyers.
That said, a clear upside break of the 0.9830 hurdle will propel the EUR/USD prices towards the 50-DMA, around 1.0035 by the press time. Also acting as the upside filters is the 1.0000 parity level and the monthly high near 1.0200.
Meanwhile, the pair’s pullback moves may initially aim for the 10-DMA support near 0.9795 before targeting the 0.9690-75 support area.
Following that, the year 2001 peak and the latest bottom, respectively around 0.9600 and 0.9535, could challenge the bears.
If at all the EUR/USD pair remains weak past 0.9535, the downward sloping support line from May, near 0.9455, will be in focus.
EUR/USD: Daily chart
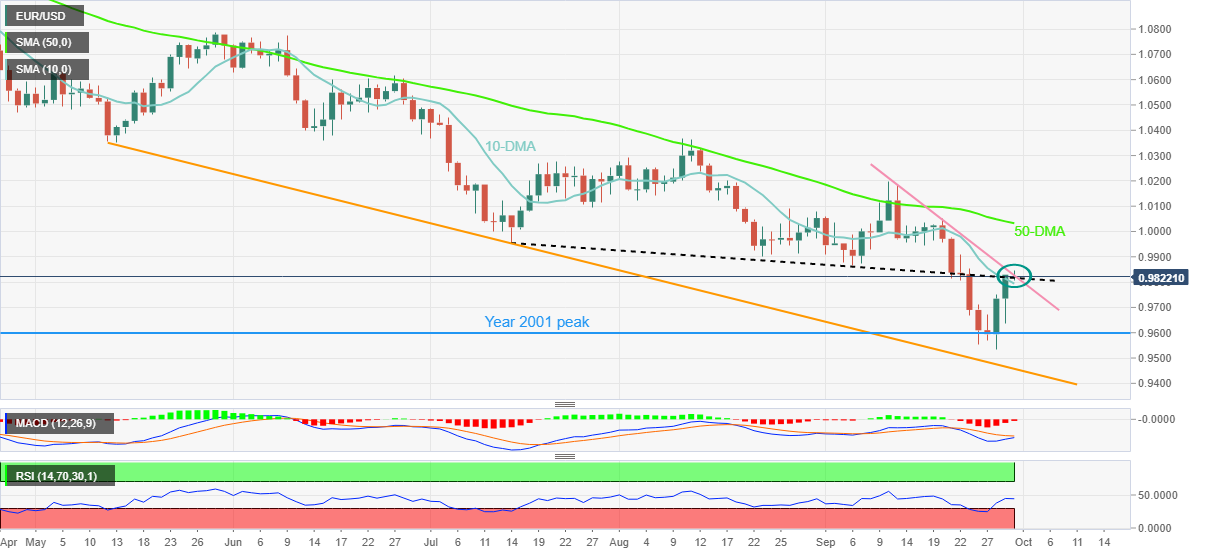
Trend: Further upside expected
- NZD/USD is breaking towards the 'High of the Week' (HotW) around 0.5755.
- The hourly W-formation is a reversion pattern and a peak formation within the head and shoulders on the 4-hour time frame.
- NZD/USD remains bullish while being supported by a rising trendline.
NZD/USD is breaking fresh highs for the week as we approach the Tokyo open. The price has rallied to a session high of 0.5750 so far in a firm push through key technical resistance and the bulls will be liming up for a retest of the structure as support for an optimal entry in order to target higher levels yet. The following is an analysis of the daily and 4-hour charts, concluded on the hourly in order to pinpoint where the opportunities could be for traders in the day ahead.
NZD/USD daily chart
The daily chart has run into the 38.2% Fibonacci resistance which is currently being broken at the time of writing. This leaves prospects of a strong correction towards the next layer of key structure near a 62% ratio as follows:
NZD/USD H4 chart

The bird is breaking through the neckline of an inverse head and shoulders which is bullish in itself. This is on the back of a correction to a 61.8% Fibo adding additional conviction to the upside bias. The bulls can have their sights set on 0.58 the figure/ A break of 0.5830 will open risk to 0.5850.
NZD/USD H1 chart
Drilling down to an hourly perspective, this is where bulls will be looking for a discount:

The W-formation is a reversion pattern and a peak formation within the head and shoulders on the 4-hour time frame, supported by a rising trendline. Should the trendline hold tests near a 50% mean reversion, this could attract a spur of demand from the bulls. However, that depends on the high of the week holding initial tests neat 0.5755. The bias will remain to the upside so long as the 0.5680s structure holds up.


© 2000-2026. Bản quyền Teletrade.
Trang web này được quản lý bởi Teletrade D.J. LLC 2351 LLC 2022 (Euro House, Richmond Hill Road, Kingstown, VC0100, St. Vincent and the Grenadines).
Thông tin trên trang web không phải là cơ sở để đưa ra quyết định đầu tư và chỉ được cung cấp cho mục đích làm quen.
Giao dịch trên thị trường tài chính (đặc biệt là giao dịch sử dụng các công cụ biên) mở ra những cơ hội lớn và tạo điều kiện cho các nhà đầu tư sẵn sàng mạo hiểm để thu lợi nhuận, tuy nhiên nó mang trong mình nguy cơ rủi ro khá cao. Chính vì vậy trước khi tiến hành giao dịch cần phải xem xét mọi mặt vấn đề chấp nhận tiến hành giao dịch cụ thể xét theo quan điểm của nguồn lực tài chính sẵn có và mức độ am hiểu thị trường tài chính.
Sử dụng thông tin: sử dụng toàn bộ hay riêng biệt các dữ liệu trên trang web của công ty TeleTrade như một nguồn cung cấp thông tin nhất định. Việc sử dụng tư liệu từ trang web cần kèm theo liên kết đến trang teletrade.vn. Việc tự động thu thập số liệu cũng như thông tin từ trang web TeleTrade đều không được phép.
Xin vui lòng liên hệ với pr@teletrade.global nếu có câu hỏi.
ngân hàng